Embed Size (px)
Citation preview
DisclaimerThis document is initial draft and still in reviewing phase by these parties:
Badan Nasional Penanggulangan Bencana (BNPB) Australia-Indonesia Facility for Disaster Reduction (AIFDR-
DFAT) Humanitarian OpenStreetMap Team (HOT)
All contents and materials on this document possibly changed without public notice.
License
All contents and materials on this document is licensed as Creative Commons Attribution Australia (CCbyA).
You are free:
- to copy, distribute, display, and perform the work
- to make derivative works
- to make commercial use of the work
You must give the original author credit.
More information about CCbyA License:
http://creativecommons.org/licenses/by/3.0/au/deed.en_GB
Unit 1: OSM Beginner Level | 2

About UsBadan Nasional Penanggulangan Bencana (BNPB)
BNPB is Indonesia’s National Disaster Management Agency. BNPB isa non-departmental ministerial-level government agency, tasked with providing guidance and direction to the efforts of disaster managementthat includes disaster prevention, emergency response, rehabilitation, and reconstruction in a fair and equal. National Disaster Management Agency has the function as a policy maker and formulator and Refugee (IDP) management to act quickly and appropriately and effectively and efficiently; and coordinating the implementation of disaster management activities in a planned, integrated, and comprehensive.
http://bnpb.go.id
Unit 1: OSM Beginner Level | 3

Australia-Indonesia Facility for Disaster Reduction (AIFDR)
The Australia-Indonesia Facility for Disaster Reduction (AIFDR) is a joint initiative between the governments of Australia and Indonesia. We work to strengthen Indonesia's ability to reduce the impact of disasters. The Australian and Indonesian governments at a special ceremony on 15 July 2010 launched the Australia-Indonesia facility. The launch marks an important event in the strong relationship now shared by both countries and their united commitment to better prepare for and respond to natural disasters in Indonesia.
http://aifdr.org
Humanitarian OpenStreetMap Team (HOT)
Unit 1: OSM Beginner Level | 4

Free, collaborative maps are uniquely valuable to humanitarian work, especially in places where base map data is often scarce, out of date, or rapidly changing. OpenStreetMap is a web project to create a free and open map of the entire world, built entirely by volunteers surveying with GPS, digitizing aerial imagery, and collecting and liberating existing public sources of geographic data. The Humanitarian OpenStreetMap Team (HOT) is an initiative to apply the principles and activities of open source and open data sharing towards humanitarian response and economic development.
http://hot.openstreetmap.org
Universitas Gadjah Mada (UGM)
Universitas Gadjah Mada (internationally known as Gadjah Mada University; Abbreviation : UGM) is an Indonesian public ivy league research university located in Yogyakarta, Indonesia. Department of Geodetic Engineering, Faculty of Engineering focuses on education, research, and commmunity services related to geodesy and geomatics engineering, including acquisition, analysis, and uses of detailed and accurate geospatial data and large-scale maps using open source geospatial software for disaster management.
http://ugm.ac.id
Unit 1: OSM Beginner Level | 5

Preface
Every day thousands of people contribute to OpenStreetMap, a project with thelofty goal of mapping the world. Most OSM software is free and open source, andthe data is open for anyone to use. The idea is simple: if you make a map of yourtown and I make a map of mine, we can share those maps on a common platform.With enough people contributing, we can make maps and collect data throughoutthe world.
Collecting Spatial Data using OSM Beginner Level is a step by step guidedesigned to help anyone get started with OSM, no matter what skill level you arestarting from. While it might seem daunting at first, OSM is simple enough thatanyone can get started creating maps, and as your understanding grows you'll findthat you can do more and more interesting things.
This guide makes few assumptions. It assumes you have used a computer before,and that you have an email address. If you don't have an email address, wesuggest you have a friend help you sign up for one. There are many websiteswhere you can get a free email address, such as www.gmail.com ormail.yahoo.com.
The only other assumption is that you've used the internet before. Perhaps you'refamiliar with Facebook or email, and that's certainly enough to get started withOpenStreetMap. If you're already comfortable using a computer and surfing theweb, don't worry – this guide is for you too. No matter your proficiency, we'll takeyou step by step through OSM and you'll be mapping in no time!
We hope it can be useful.
Unit 1: OSM Beginner Level | 6
TABLE OF CONTENT
Disclaimer.........................................................................................................1
License..............................................................................................................1
About Us...........................................................................................................2
Preface..............................................................................................................3
Module 1...........................................................................................................6
Basic Concept of OpenStreetMap Website.........................................................6
Module 2...........................................................................................................8
Working with OSM............................................................................................8
Module 3.........................................................................................................12
Working with JOSM.........................................................................................12
Module 4.........................................................................................................19
Using GPS........................................................................................................19
Module 5.........................................................................................................30
Field Papers.....................................................................................................30
Module 6.........................................................................................................36
Editing OpenStreetMap with JOSM..................................................................36
Module 7.........................................................................................................44
Imagery Offset.................................................................................................44
Module 8.........................................................................................................52
Getting OSM Data............................................................................................52
Unit 1: OSM Beginner Level | 7
Module 1
Basic Concept of OpenStreetMap Website
Learning Objectives
● Understanding the concept and definition of OpenStreetMap● Understanding the definition and objectives of data collection● Understanding the composition of a map● Make a handwriting sketch of an area
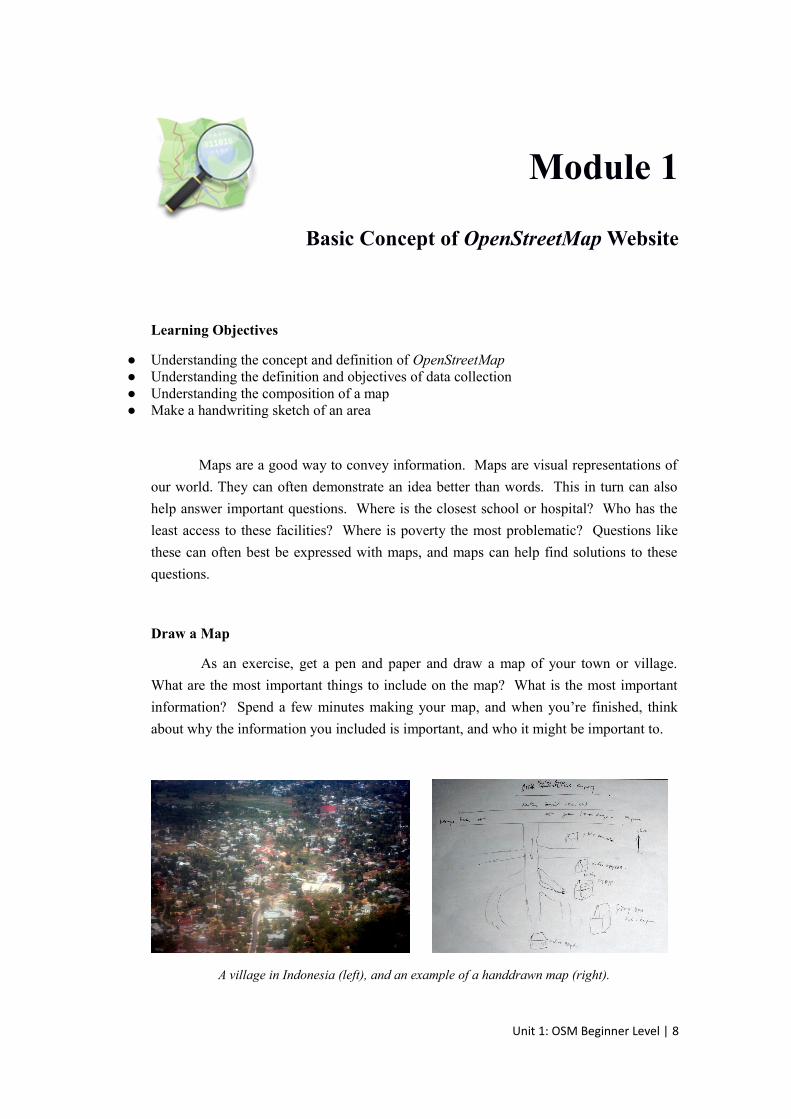
Maps are a good way to convey information. Maps are visual representations of
our world. They can often demonstrate an idea better than words. This in turn can also
help answer important questions. Where is the closest school or hospital? Who has the
least access to these facilities? Where is poverty the most problematic? Questions like
these can often best be expressed with maps, and maps can help find solutions to these
questions.
Draw a Map
As an exercise, get a pen and paper and draw a map of your town or village.
What are the most important things to include on the map? What is the most important
information? Spend a few minutes making your map, and when you’re finished, think
about why the information you included is important, and who it might be important to.
A village in Indonesia (left), and an example of a handdrawn map (right).
Unit 1: OSM Beginner Level | 8
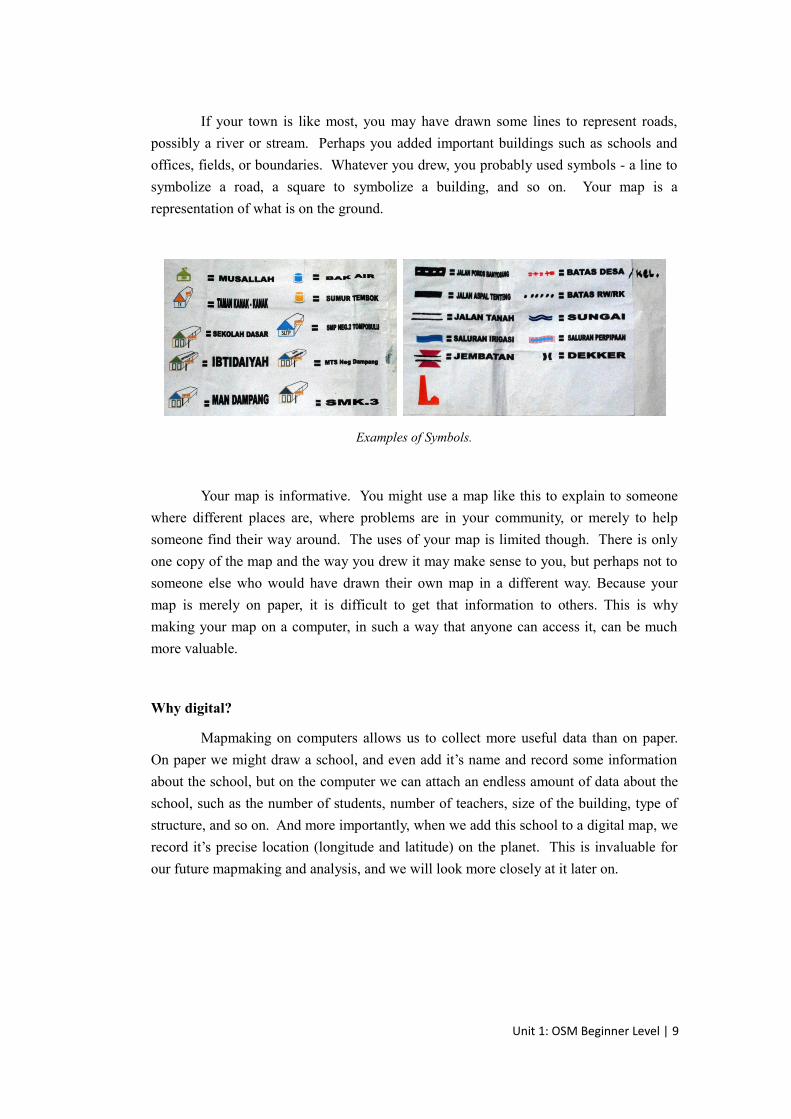
If your town is like most, you may have drawn some lines to represent roads,
possibly a river or stream. Perhaps you added important buildings such as schools and
offices, fields, or boundaries. Whatever you drew, you probably used symbols - a line to
symbolize a road, a square to symbolize a building, and so on. Your map is a
representation of what is on the ground.
Examples of Symbols.
Your map is informative. You might use a map like this to explain to someone
where different places are, where problems are in your community, or merely to help
someone find their way around. The uses of your map is limited though. There is only
one copy of the map and the way you drew it may make sense to you, but perhaps not to
someone else who would have drawn their own map in a different way. Because your
map is merely on paper, it is difficult to get that information to others. This is why
making your map on a computer, in such a way that anyone can access it, can be much
more valuable.
Why digital?
Mapmaking on computers allows us to collect more useful data than on paper.
On paper we might draw a school, and even add it’s name and record some information
about the school, but on the computer we can attach an endless amount of data about the
school, such as the number of students, number of teachers, size of the building, type of
structure, and so on. And more importantly, when we add this school to a digital map, we
record it’s precise location (longitude and latitude) on the planet. This is invaluable for
our future mapmaking and analysis, and we will look more closely at it later on.
Unit 1: OSM Beginner Level | 9
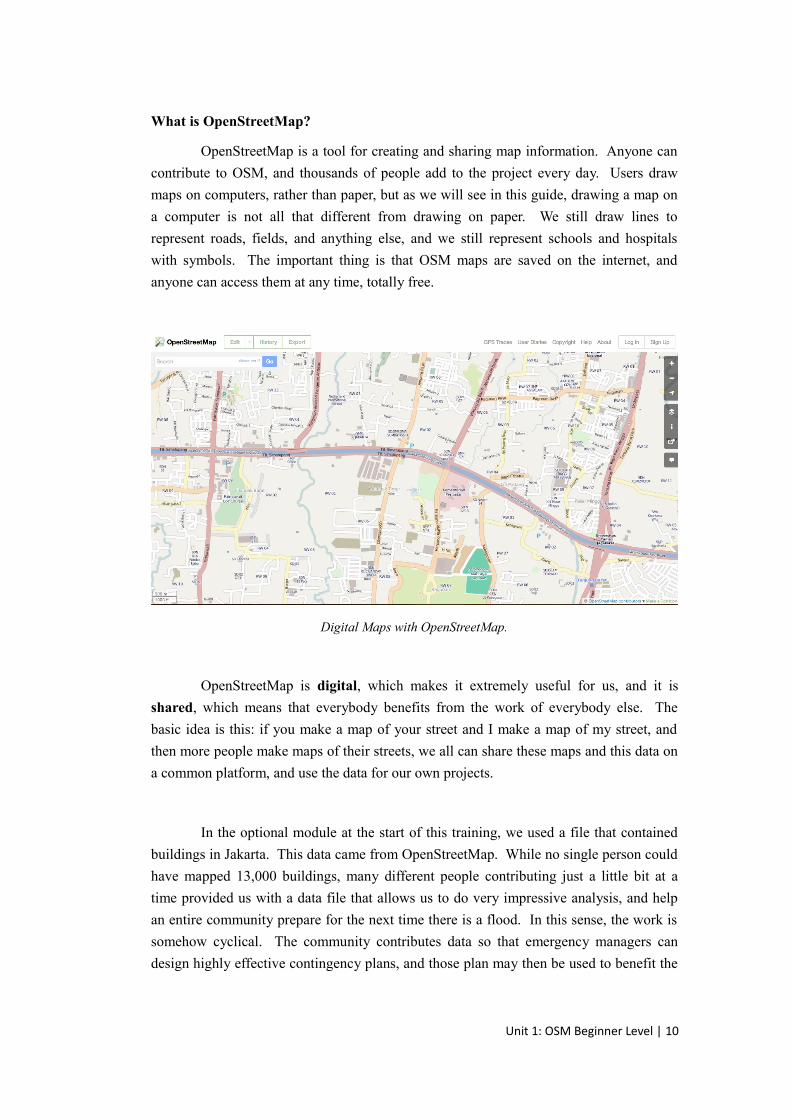
What is OpenStreetMap?
OpenStreetMap is a tool for creating and sharing map information. Anyone can
contribute to OSM, and thousands of people add to the project every day. Users draw
maps on computers, rather than paper, but as we will see in this guide, drawing a map on
a computer is not all that different from drawing on paper. We still draw lines to
represent roads, fields, and anything else, and we still represent schools and hospitals
with symbols. The important thing is that OSM maps are saved on the internet, and
anyone can access them at any time, totally free.
Digital Maps with OpenStreetMap.
OpenStreetMap is digital, which makes it extremely useful for us, and it is
shared, which means that everybody benefits from the work of everybody else. The
basic idea is this: if you make a map of your street and I make a map of my street, and
then more people make maps of their streets, we all can share these maps and this data on
a common platform, and use the data for our own projects.
In the optional module at the start of this training, we used a file that contained
buildings in Jakarta. This data came from OpenStreetMap. While no single person could
have mapped 13,000 buildings, many different people contributing just a little bit at a
time provided us with a data file that allows us to do very impressive analysis, and help
an entire community prepare for the next time there is a flood. In this sense, the work is
somehow cyclical. The community contributes data so that emergency managers can
design highly effective contingency plans, and those plan may then be used to benefit the
Unit 1: OSM Beginner Level | 10

community at large. And the more data that the community provides, the better the
contingency planning can be.
In this unit, you will learn how to make a digital map. You will learn how to use
the OpenStreetMap platform, and you will make your first edits and additions to the
worldwide map.
Unit 1: OSM Beginner Level | 11
Module 2
Working with OSM
Learning Objectives
● Visit OpenStreetMap website● Navigate map in OpenStreetMap website● Saving image from OpenStreetMap● Register an OpenStreetMap account● Editing a map● Save Edits
In this module we will learn step by step how to navigate the OpenStreetMap
website, view and print maps, and sign up for a user account. After you have your own
username and password, you will be able to add your first points to the map.
1. Visit the OpenStreetMap Website
● Be sure that your computer is on and you are connected to the internet.● To visit the OpenStreetMap website, you need to open your web browser. Start your
browser - Firefox, Chrome, Opera, or Internet Explorer.● In the address bar at the top of the window, enter the following text:
www.openstreetmap.org
● When the page has finished loading, you should see something like this:
Unit 1: OSM Beginner Level | 12
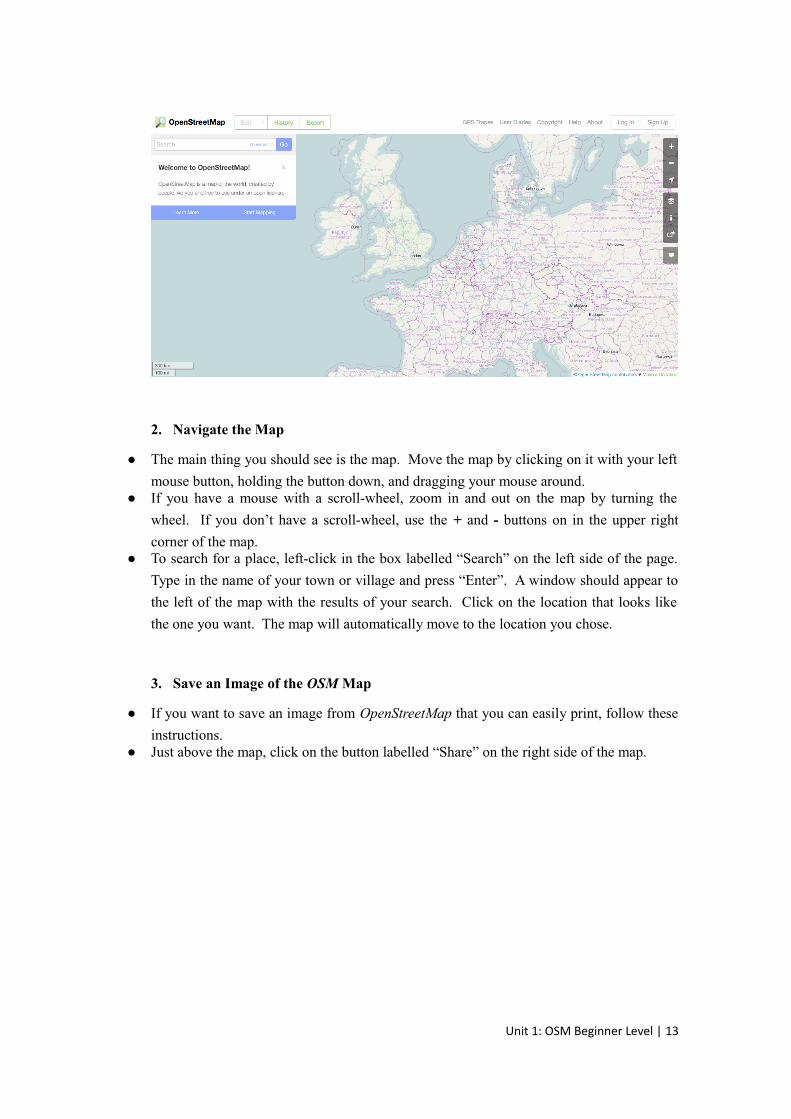
2. Navigate the Map
● The main thing you should see is the map. Move the map by clicking on it with your left
mouse button, holding the button down, and dragging your mouse around.● If you have a mouse with a scroll-wheel, zoom in and out on the map by turning the
wheel. If you don’t have a scroll-wheel, use the + and - buttons on in the upper right
corner of the map.● To search for a place, left-click in the box labelled “Search” on the left side of the page.
Type in the name of your town or village and press “Enter”. A window should appear to
the left of the map with the results of your search. Click on the location that looks like
the one you want. The map will automatically move to the location you chose.
3. Save an Image of the OSM Map
● If you want to save an image from OpenStreetMap that you can easily print, follow these
instructions.● Just above the map, click on the button labelled “Share” on the right side of the map.
Unit 1: OSM Beginner Level | 13
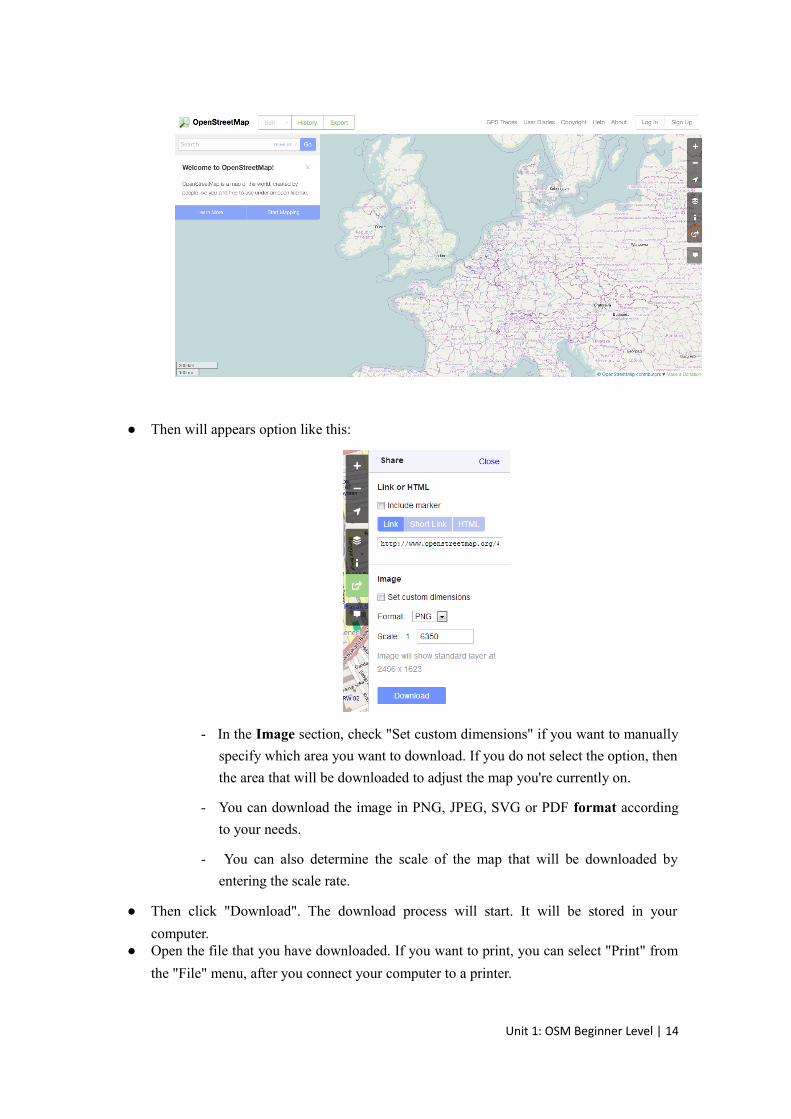
● Then will appears option like this:
- In the Image section, check "Set custom dimensions" if you want to manually
specify which area you want to download. If you do not select the option, then
the area that will be downloaded to adjust the map you're currently on.
- You can download the image in PNG, JPEG, SVG or PDF format according
to your needs.
- You can also determine the scale of the map that will be downloaded by
entering the scale rate.
● Then click "Download". The download process will start. It will be stored in your
computer.● Open the file that you have downloaded. If you want to print, you can select "Print" from
the "File" menu, after you connect your computer to a printer.
Unit 1: OSM Beginner Level | 14
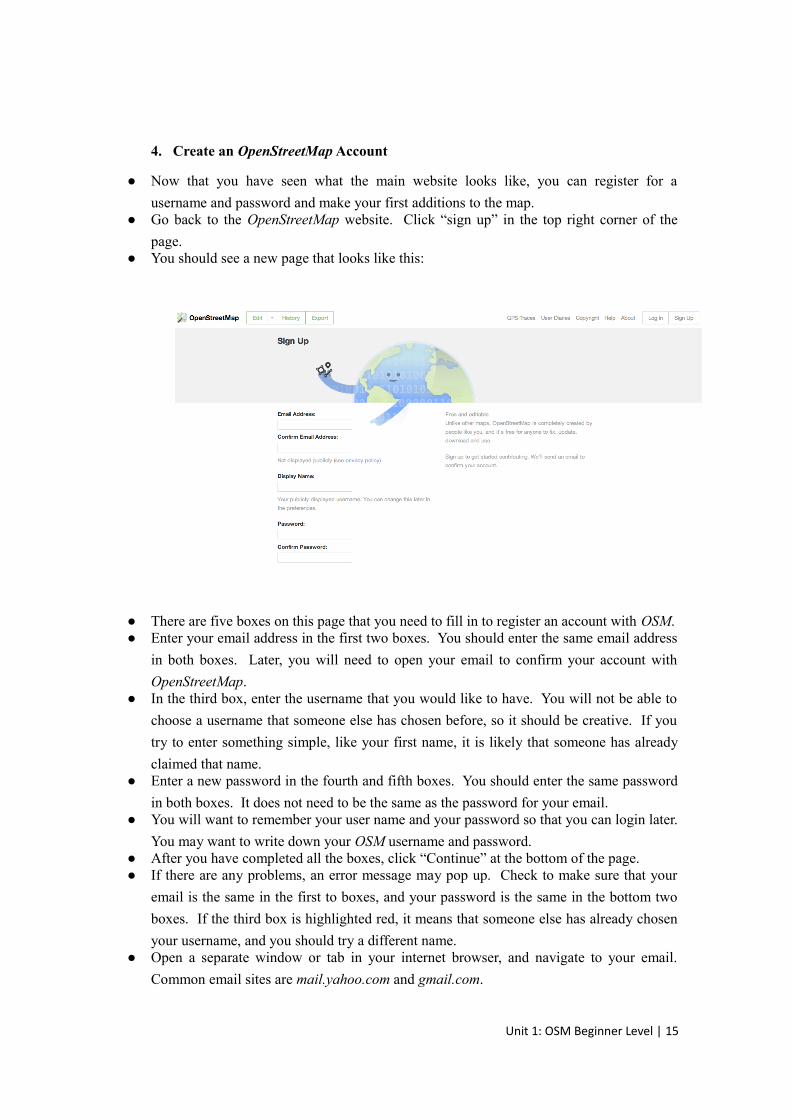
4. Create an OpenStreetMap Account
● Now that you have seen what the main website looks like, you can register for a
username and password and make your first additions to the map.● Go back to the OpenStreetMap website. Click “sign up” in the top right corner of the
page.● You should see a new page that looks like this:
● There are five boxes on this page that you need to fill in to register an account with OSM.● Enter your email address in the first two boxes. You should enter the same email address
in both boxes. Later, you will need to open your email to confirm your account with
OpenStreetMap.● In the third box, enter the username that you would like to have. You will not be able to
choose a username that someone else has chosen before, so it should be creative. If you
try to enter something simple, like your first name, it is likely that someone has already
claimed that name.● Enter a new password in the fourth and fifth boxes. You should enter the same password
in both boxes. It does not need to be the same as the password for your email.● You will want to remember your user name and your password so that you can login later.
You may want to write down your OSM username and password.● After you have completed all the boxes, click “Continue” at the bottom of the page.● If there are any problems, an error message may pop up. Check to make sure that your
email is the same in the first to boxes, and your password is the same in the bottom two
boxes. If the third box is highlighted red, it means that someone else has already chosen
your username, and you should try a different name.● Open a separate window or tab in your internet browser, and navigate to your email.
Common email sites are mail.yahoo.com and gmail.com.
Unit 1: OSM Beginner Level | 15
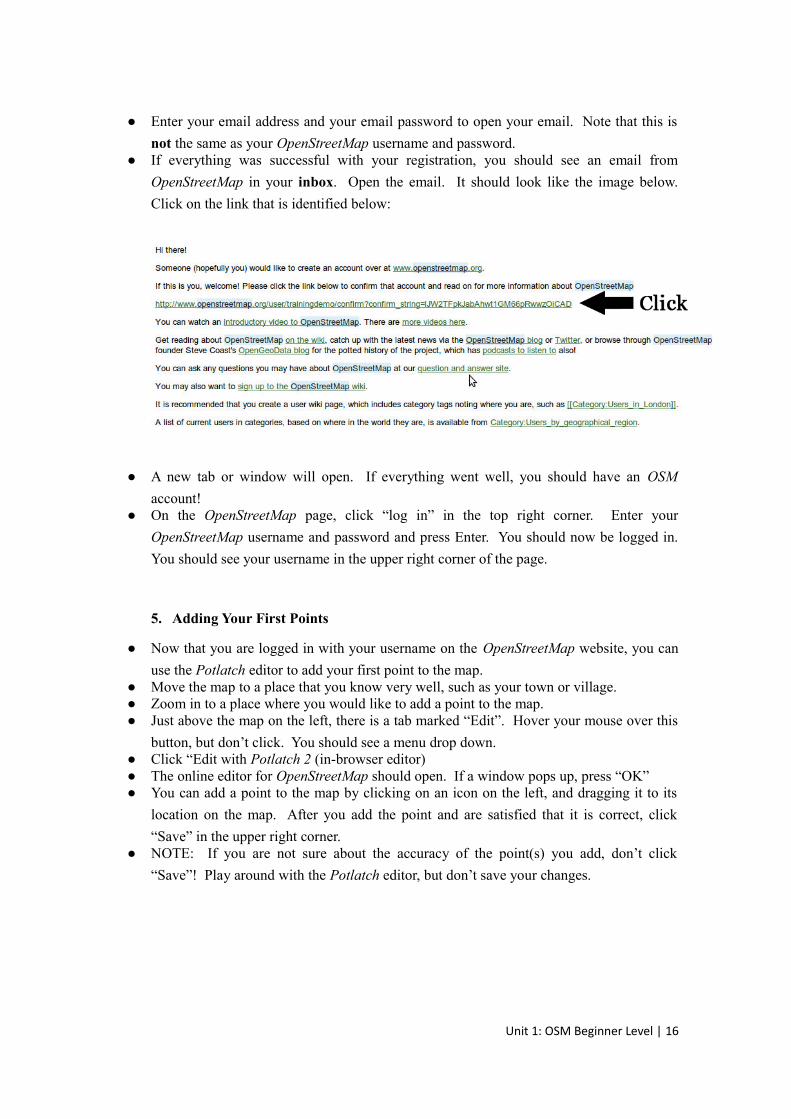
● Enter your email address and your email password to open your email. Note that this is
not the same as your OpenStreetMap username and password.● If everything was successful with your registration, you should see an email from
OpenStreetMap in your inbox. Open the email. It should look like the image below.
Click on the link that is identified below:
● A new tab or window will open. If everything went well, you should have an OSM
account!● On the OpenStreetMap page, click “log in” in the top right corner. Enter your
OpenStreetMap username and password and press Enter. You should now be logged in.
You should see your username in the upper right corner of the page.
5. Adding Your First Points
● Now that you are logged in with your username on the OpenStreetMap website, you can
use the Potlatch editor to add your first point to the map.● Move the map to a place that you know very well, such as your town or village.● Zoom in to a place where you would like to add a point to the map.● Just above the map on the left, there is a tab marked “Edit”. Hover your mouse over this
button, but don’t click. You should see a menu drop down.● Click “Edit with Potlatch 2 (in-browser editor)● The online editor for OpenStreetMap should open. If a window pops up, press “OK”● You can add a point to the map by clicking on an icon on the left, and dragging it to its
location on the map. After you add the point and are satisfied that it is correct, click
“Save” in the upper right corner.● NOTE: If you are not sure about the accuracy of the point(s) you add, don’t click
“Save”! Play around with the Potlatch editor, but don’t save your changes.
Unit 1: OSM Beginner Level | 16
Module 3
Working with JOSM
Learning Objectives
● Download JOSM● JOSM Installation● JOSM Preferences● Using Basic Tools● Drawing nodes, way, and shape in JOSM based on map that you made in the previous
session● Change Objects● Add informations to the objects using ‘presets’ menu
In this module we will learn step by step how to download and install JOSM, the
Java OpenStreetMap editor. We will change some of the settings in JOSM to make it
easier to use. Then we will open a sample map and learn some of the basic operations of
the software. Remember in Module 1 when we asked you to draw a map of your town or
village? We will conclude this module by drawing your map again, this time digitally.
After this you should have a good understanding of how to draw maps in JOSM.
1. Download JOSM
● There is a copy of JOSM in the software/ folder that of the package that accompanies this
guide. If you don’t have this or would like the most up-to-date version, follow the
instructions here. Otherwise skip to section 2. Install JOSM.● Open your web browser - this may be Firefox, Chrome, Opera, or Internet Explorer.● In the address bar at the top of the window, enter the following text and press Enter:
josm.openstreetmap.de
● You can also find this website by searching for “JOSM”● The website should look something like this:
Unit 1: OSM Beginner Level | 17
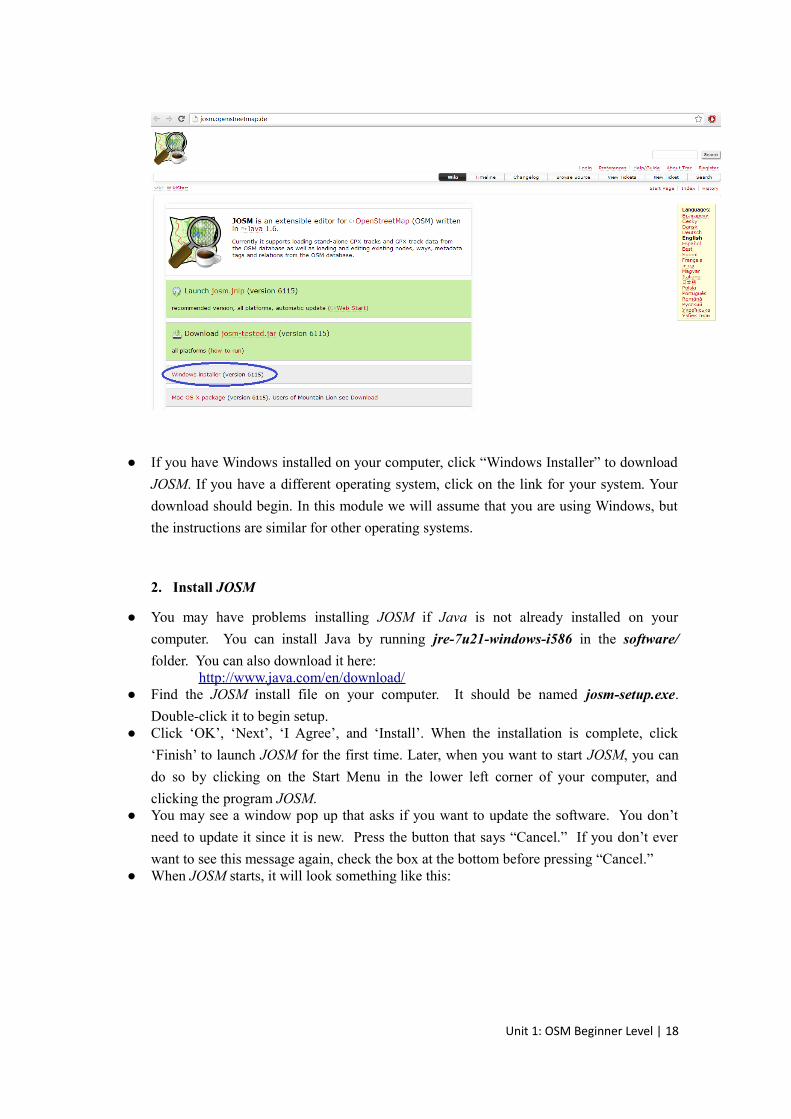
● If you have Windows installed on your computer, click “Windows Installer” to download
JOSM. If you have a different operating system, click on the link for your system. Your
download should begin. In this module we will assume that you are using Windows, but
the instructions are similar for other operating systems.
2. Install JOSM
● You may have problems installing JOSM if Java is not already installed on your
computer. You can install Java by running jre-7u21-windows-i586 in the software/
folder. You can also download it here:http://www.java.com/en/download/
● Find the JOSM install file on your computer. It should be named josm-setup.exe.
Double-click it to begin setup.● Click ‘OK’, ‘Next’, ‘I Agree’, and ‘Install’. When the installation is complete, click
‘Finish’ to launch JOSM for the first time. Later, when you want to start JOSM, you can
do so by clicking on the Start Menu in the lower left corner of your computer, and
clicking the program JOSM.● You may see a window pop up that asks if you want to update the software. You don’t
need to update it since it is new. Press the button that says “Cancel.” If you don’t ever
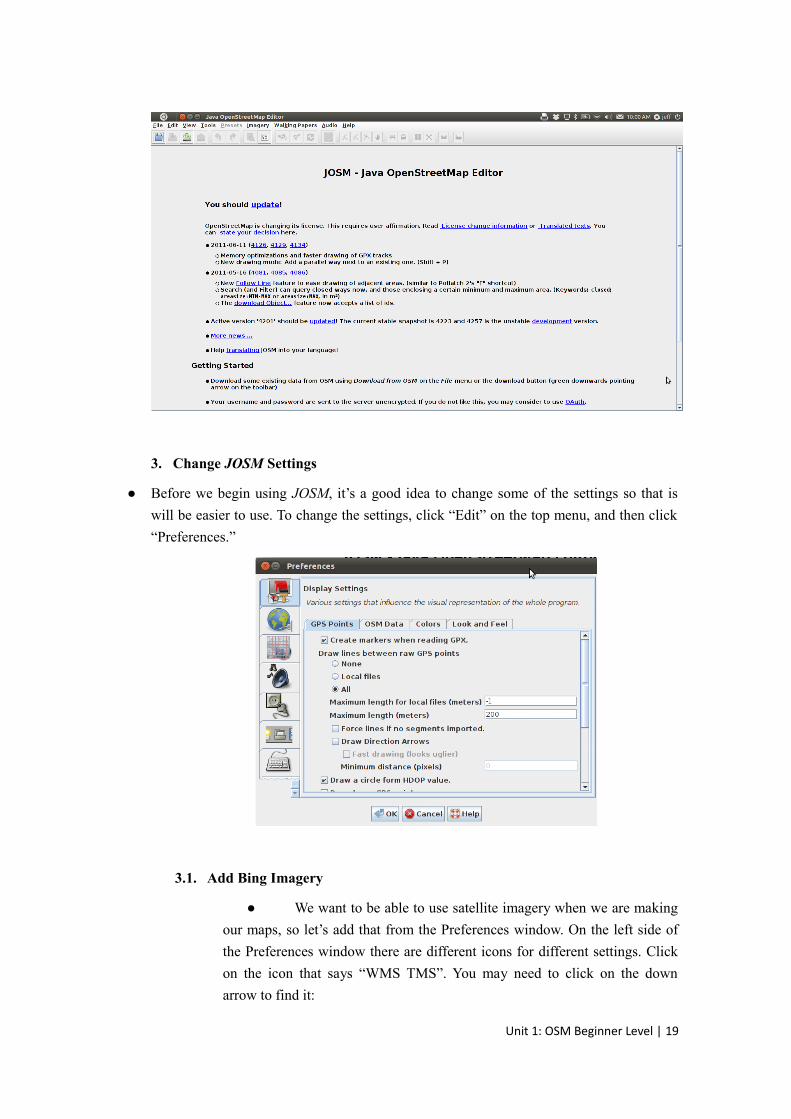
want to see this message again, check the box at the bottom before pressing “Cancel.”● When JOSM starts, it will look something like this:
Unit 1: OSM Beginner Level | 18
3. Change JOSM Settings
● Before we begin using JOSM, it’s a good idea to change some of the settings so that is
will be easier to use. To change the settings, click “Edit” on the top menu, and then click
“Preferences.”
3.1. Add Bing Imagery
● We want to be able to use satellite imagery when we are making
our maps, so let’s add that from the Preferences window. On the left side of
the Preferences window there are different icons for different settings. Click
on the icon that says “WMS TMS”. You may need to click on the down
arrow to find it:
Unit 1: OSM Beginner Level | 19
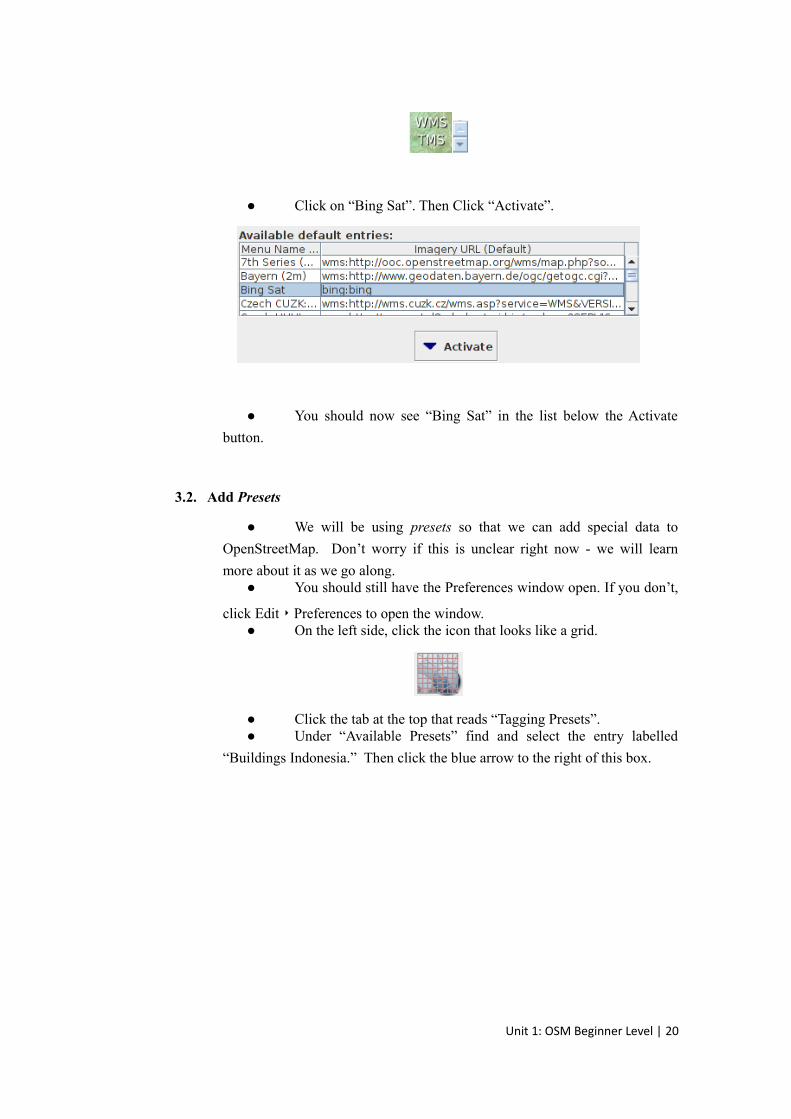
● Click on “Bing Sat”. Then Click “Activate”.
● You should now see “Bing Sat” in the list below the Activate
button.
3.2. Add Presets
● We will be using presets so that we can add special data to
OpenStreetMap. Don’t worry if this is unclear right now - we will learn
more about it as we go along.● You should still have the Preferences window open. If you don’t,
click Edit ‣ Preferences to open the window.● On the left side, click the icon that looks like a grid.
● Click the tab at the top that reads “Tagging Presets”.● Under “Available Presets” find and select the entry labelled
“Buildings Indonesia.” Then click the blue arrow to the right of this box.
Unit 1: OSM Beginner Level | 20
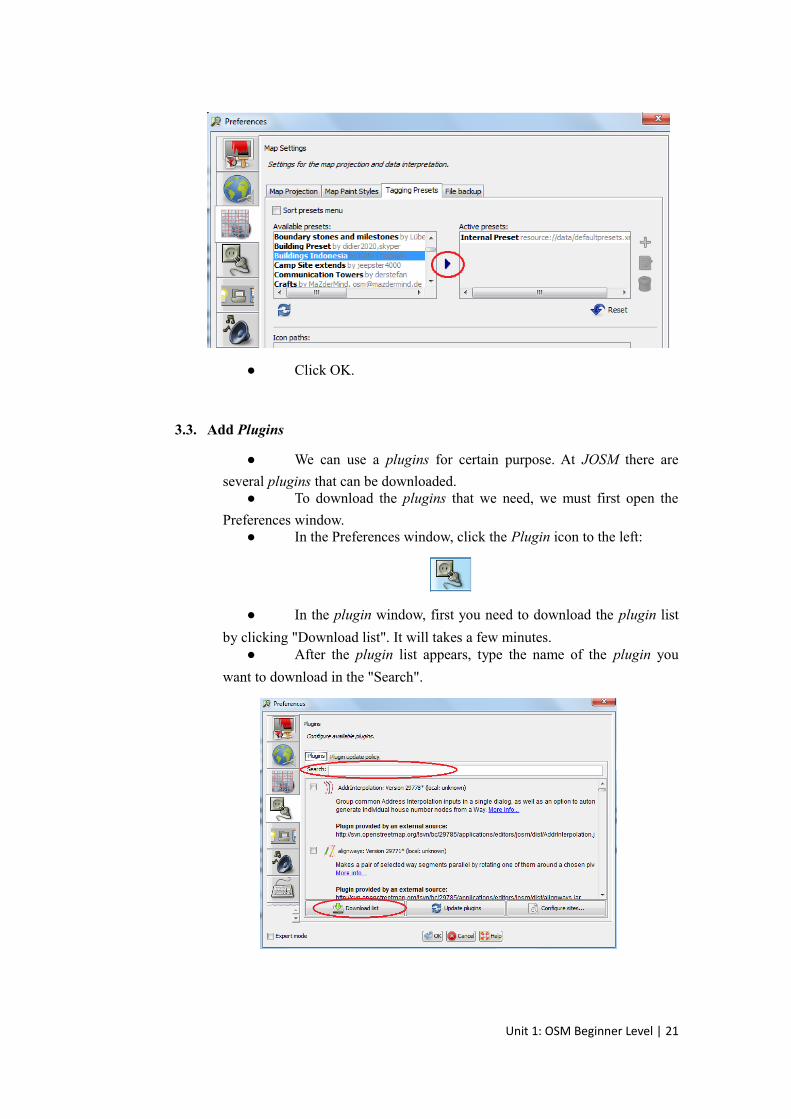
● Click OK.
3.3. Add Plugins
● We can use a plugins for certain purpose. At JOSM there are
several plugins that can be downloaded.● To download the plugins that we need, we must first open the
Preferences window.● In the Preferences window, click the Plugin icon to the left:
● In the plugin window, first you need to download the plugin list
by clicking "Download list". It will takes a few minutes.● After the plugin list appears, type the name of the plugin you
want to download in the "Search".
Unit 1: OSM Beginner Level | 21
● After found the plugin will be downloaded, give a 'check' on the
left of the plugin name.● Click OK.
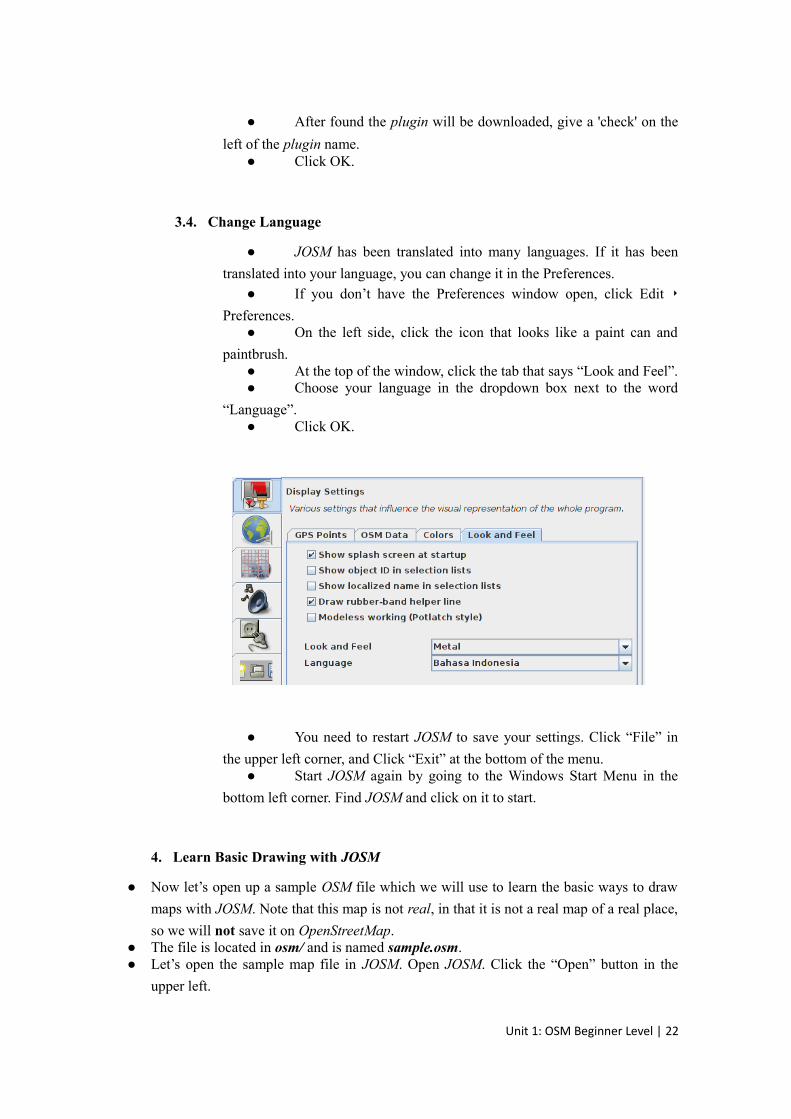
3.4. Change Language
● JOSM has been translated into many languages. If it has been
translated into your language, you can change it in the Preferences.● If you don’t have the Preferences window open, click Edit ‣
Preferences.● On the left side, click the icon that looks like a paint can and
paintbrush.● At the top of the window, click the tab that says “Look and Feel”.● Choose your language in the dropdown box next to the word
“Language”.● Click OK.
● You need to restart JOSM to save your settings. Click “File” in
the upper left corner, and Click “Exit” at the bottom of the menu.● Start JOSM again by going to the Windows Start Menu in the
bottom left corner. Find JOSM and click on it to start.
4. Learn Basic Drawing with JOSM
● Now let’s open up a sample OSM file which we will use to learn the basic ways to draw
maps with JOSM. Note that this map is not real, in that it is not a real map of a real place,
so we will not save it on OpenStreetMap.● The file is located in osm/ and is named sample.osm.● Let’s open the sample map file in JOSM. Open JOSM. Click the “Open” button in the
upper left.
Unit 1: OSM Beginner Level | 22
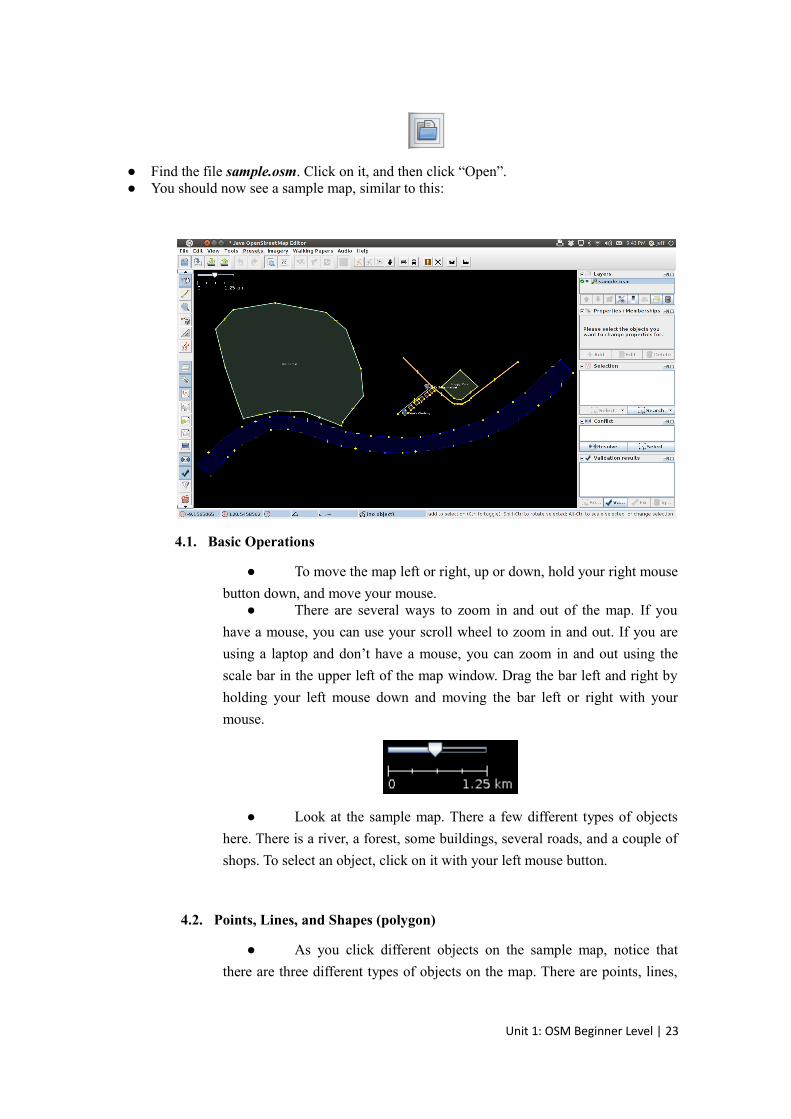
● Find the file sample.osm. Click on it, and then click “Open”.● You should now see a sample map, similar to this:
4.1. Basic Operations
● To move the map left or right, up or down, hold your right mouse
button down, and move your mouse.● There are several ways to zoom in and out of the map. If you
have a mouse, you can use your scroll wheel to zoom in and out. If you are
using a laptop and don’t have a mouse, you can zoom in and out using the
scale bar in the upper left of the map window. Drag the bar left and right by
holding your left mouse down and moving the bar left or right with your
mouse.
● Look at the sample map. There a few different types of objects
here. There is a river, a forest, some buildings, several roads, and a couple of
shops. To select an object, click on it with your left mouse button.
4.2. Points, Lines, and Shapes (polygon)
● As you click different objects on the sample map, notice that
there are three different types of objects on the map. There are points, lines,
Unit 1: OSM Beginner Level | 23
and shapes (polygon). For 'shapes' word, in mapping it is usually called as a
'polygon'.● Points are a single location, represented by symbols. On this
sample map, there are two points, a clothing shop and a market. The clothing
shop is represented by a shirt symbol, and the market is represented by a
shopping cart.● There are several lines on the map as well, which represent
roads. If you look closely you will see that within the lines, there are points
as well. These points don’t have any symbols or other information associated
with them, but they help to define where the line is located.● Lastly, there are numerous shapes on the sample map,
representing different places - a forest, a river, and buildings. A shape
generally represents an area, like a field or a building. A shape is exactly like
a line - the only difference is that the line begins at the same point where it
ends.● You may notice that when you select an object, a list appears to
the right of the map in a window called “Properties”. These are known as
tags. Tags are information that is tied to a point, line or shape that describes
what it is. For now all you need to know is that this information helps
describe whether our object is a forest, a river, a building, or something else.● Think about drawing a map by hand, and how you are also
drawing points, lines, and shapes. What other places are best represented by
points? Lines? Shapes?
Now, let’s try to practice drawing an object (point, line and shape).
● On the left side of a JOSM is a column of buttons. Many of these
buttons open new windows on the right side that provide more information
about the map. The most important buttons, however, are at the top of these
column. These buttons change what you can do with your mouse.● The top four buttons in this column are the most important. They
allow you to:○ Select○ Draw○ Zoom in○ Delete
● Until now, you have been using the Select tool, which looks like
this:
Unit 1: OSM Beginner Level | 24
● Before you draw, you need to make sure that nothing is selected.
Click in the black space on the map, where it is empty, to make sure nothing
is selected.● Click on the second button, the Draw tool.
● Find an empty area on the map, and double-click with your
mouse. This will draw a single point.● To draw a line, single-click with your mouse. Move your mouse
and click again. Continue until you are happy with your line. To end the line,
double-click your mouse.● Draw a shape the same way that you draw a line, but finish the
shape by double-clicking on the point where you started the line.
4.3. Changing Objects
● Select the forest on the left side of the map. Be sure to click on
the line around the forest, not one of the points on the line. Now hold your
left mouse button down and drag your mouse. You should be able to move
the forest to a new location on the map.● Click on one of the points on the line around the forest. Hold
your left mouse button down and drag your mouse. You should be able to
move the point. This is how you can change the shape of an object, or move a
point.
4.4. Add Presets
● Now we know how to draw points, lines and shapes, but we still
haven’t defined what they represent. We want to be able to say that our points
are shops, schools, or something else, and whether our shapes are fields,
buildings, or something else.● Click on the Select tool, in the column of buttons on the left.
● Select one of the objects that you drew with the Draw tool. On
the top menu, click “Presets”. Move your mouse through the sub-menu to the
type of location you would like to define.● When you click on a preset, a form will pop up asking you for
more information. You do not have to fill in every field, but you may wish to
add some of the important fields, such as the name of the object.
Unit 1: OSM Beginner Level | 25
● When you are finished entering the information, click “Apply
Preset”. If everything went well, your point, line, or shape should change
colors or show a symbol. This is because you have defined what it is.
Exercise:
● Now let’s draw a map in order to practice the techniques you have learned. You may wish
to redraw the map that you drew on paper in Module 1.● Drag the map away from the sample map. Hold the right mouse button and drag your
mouse, until you have a nice empty area to draw on.● Use the Draw tool to create points, lines, and shapes. Describe what your objects are by
selecting from the Presets menu.● When you are finished, you should have your own map, similar to the sample map that
we opened in sample.osm.
Unit 1: OSM Beginner Level | 26
Module 4
Using GPS
Learning Objectives
● Understanding what is GPS and types of GPS● Turn on GPS● Setting GPS● Understanding the factor that affected GPS accuracy● Understanding about track and waypoints● Collect data using GPS● Copy GPS data (track dan waypoint) to computer● Open waypoint and track on JOSM● Upload GPS track in JOSM● Editing based on GPS data on JOSM
In this module we will see what a GPS does and how it works. You will learn
how to operate a GPS, and how to use it to create maps. In this module we will explain
how to operate the Garmin eTrex Vista HCx, a common GPS used for mapping. There
are many other models of GPS which do the same thing, so if you are working with a
different one, don’t worry - the principles remain the same.
1. What is GPS?
A GPS is like a mobile phone, except that instead of receiving radio signals from
telephone companies, it receives signals from satellites that are going around the Earth.
By receiving these signals from the satellites, a GPS is able to calculate your exact
location on the planet. It records this location in coordinates, which are two long
numbers. One number tells you how far East or West you are - this is called longitude.
The second number tells you how far North or South you are - this is called latitude.
Every place on Earth has unique geographic coordinates.
For example: -8.639298 Latitude, 116.311607 Longitude is a location in Lombok,
Indonesia.
Unit 1: OSM Beginner Level | 27
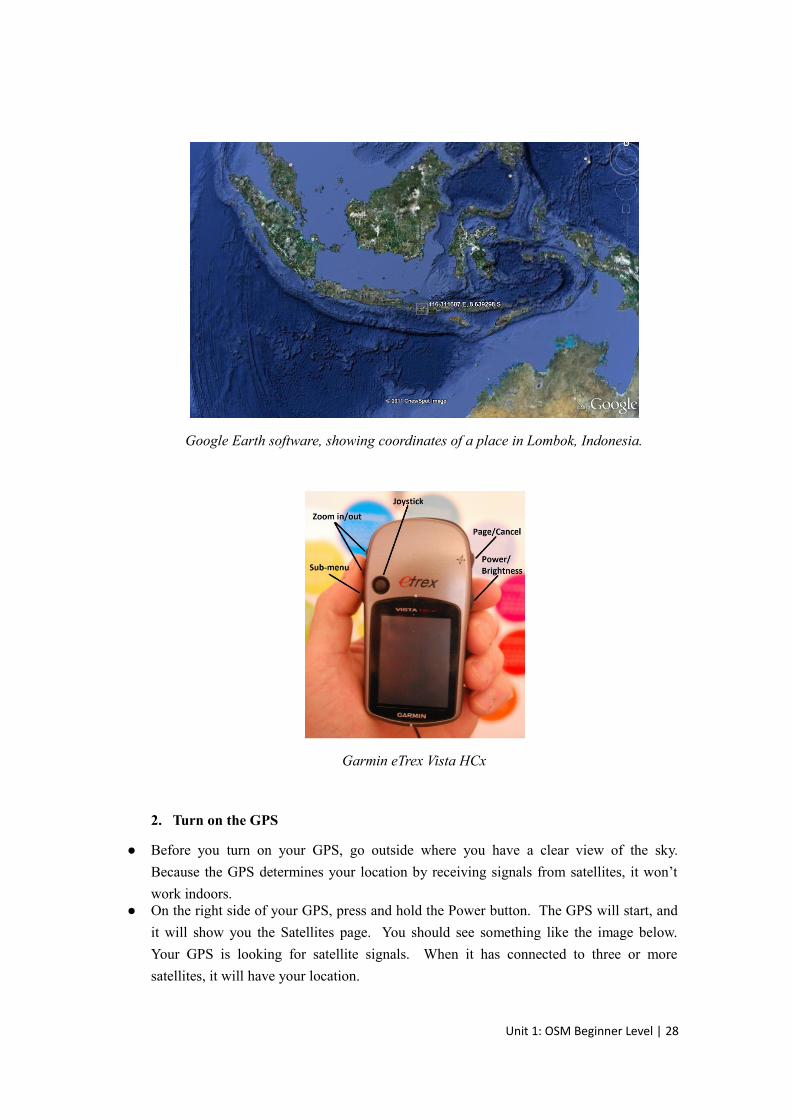
Google Earth software, showing coordinates of a place in Lombok, Indonesia.
Garmin eTrex Vista HCx
2. Turn on the GPS
● Before you turn on your GPS, go outside where you have a clear view of the sky.
Because the GPS determines your location by receiving signals from satellites, it won’t
work indoors.● On the right side of your GPS, press and hold the Power button. The GPS will start, and
it will show you the Satellites page. You should see something like the image below.
Your GPS is looking for satellite signals. When it has connected to three or more
satellites, it will have your location.
Unit 1: OSM Beginner Level | 28
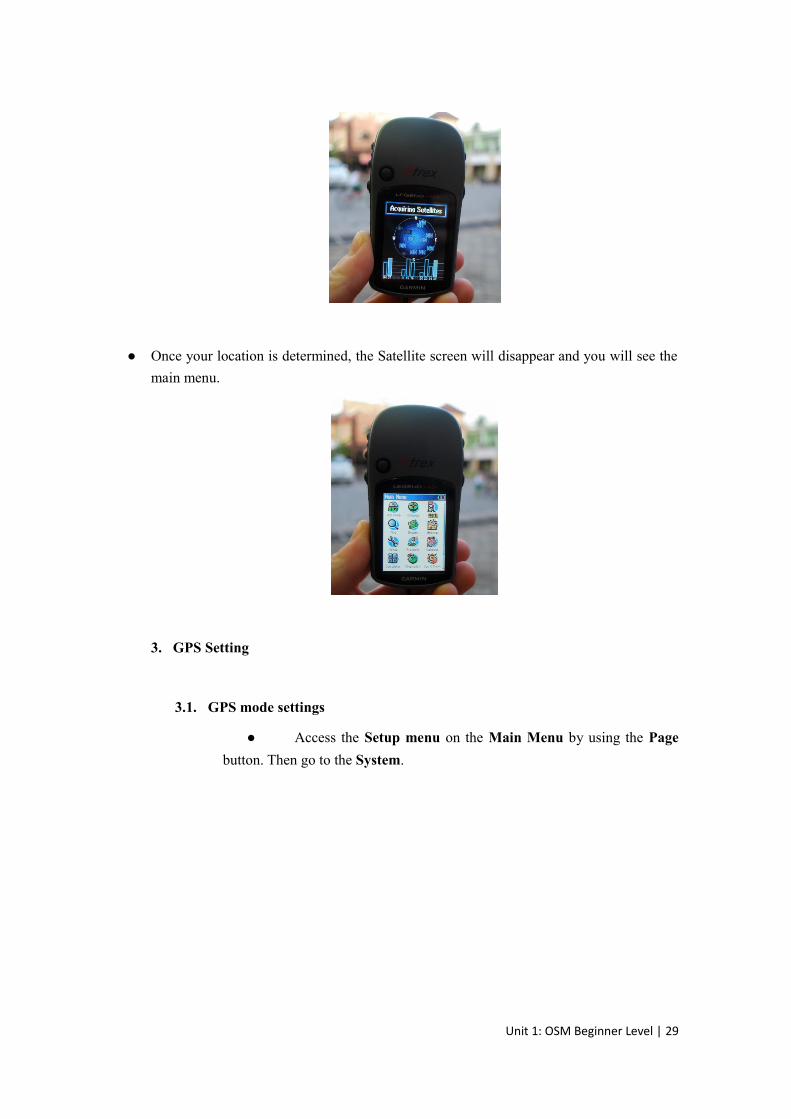
● Once your location is determined, the Satellite screen will disappear and you will see the
main menu.
3. GPS Setting
3.1. GPS mode settings
● Access the Setup menu on the Main Menu by using the Page
button. Then go to the System.
Unit 1: OSM Beginner Level | 29
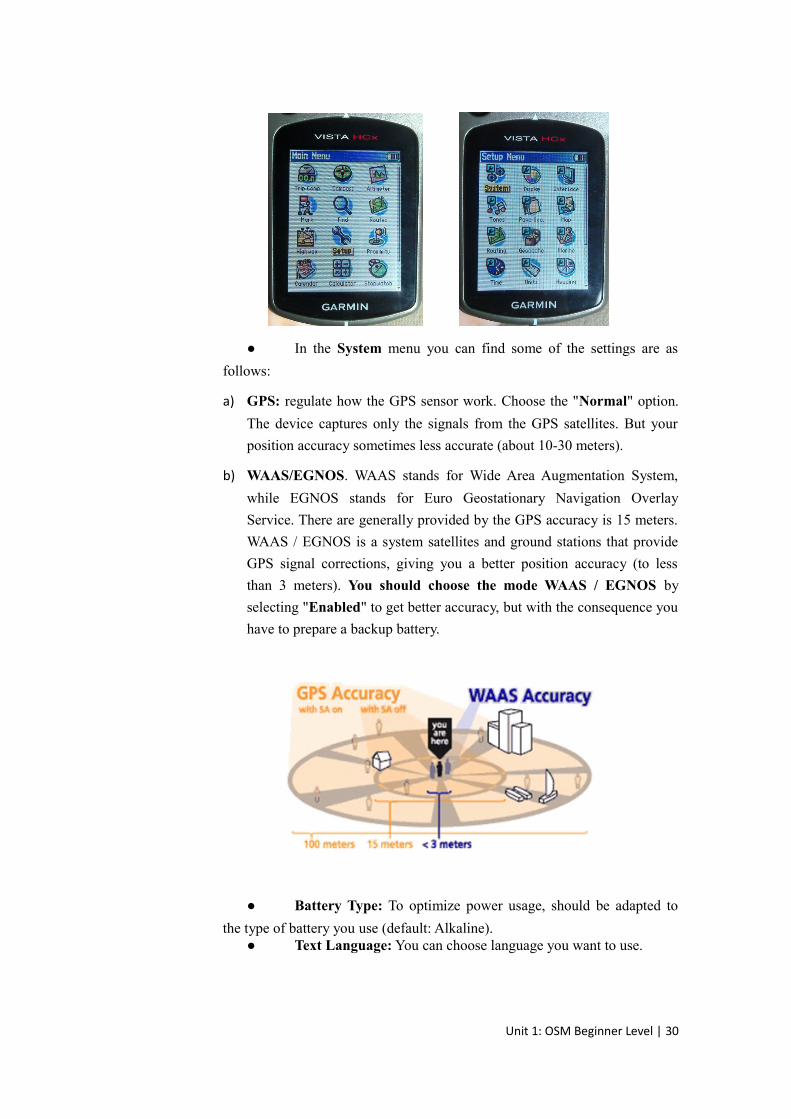
● In the System menu you can find some of the settings are as
follows:
a) GPS: regulate how the GPS sensor work. Choose the "Normal" option.
The device captures only the signals from the GPS satellites. But your
position accuracy sometimes less accurate (about 10-30 meters).
b) WAAS/EGNOS. WAAS stands for Wide Area Augmentation System,
while EGNOS stands for Euro Geostationary Navigation Overlay
Service. There are generally provided by the GPS accuracy is 15 meters.
WAAS / EGNOS is a system satellites and ground stations that provide
GPS signal corrections, giving you a better position accuracy (to less
than 3 meters). You should choose the mode WAAS / EGNOS by
selecting "Enabled" to get better accuracy, but with the consequence you
have to prepare a backup battery.
● Battery Type: To optimize power usage, should be adapted to
the type of battery you use (default: Alkaline).● Text Language: You can choose language you want to use.
Unit 1: OSM Beginner Level | 30
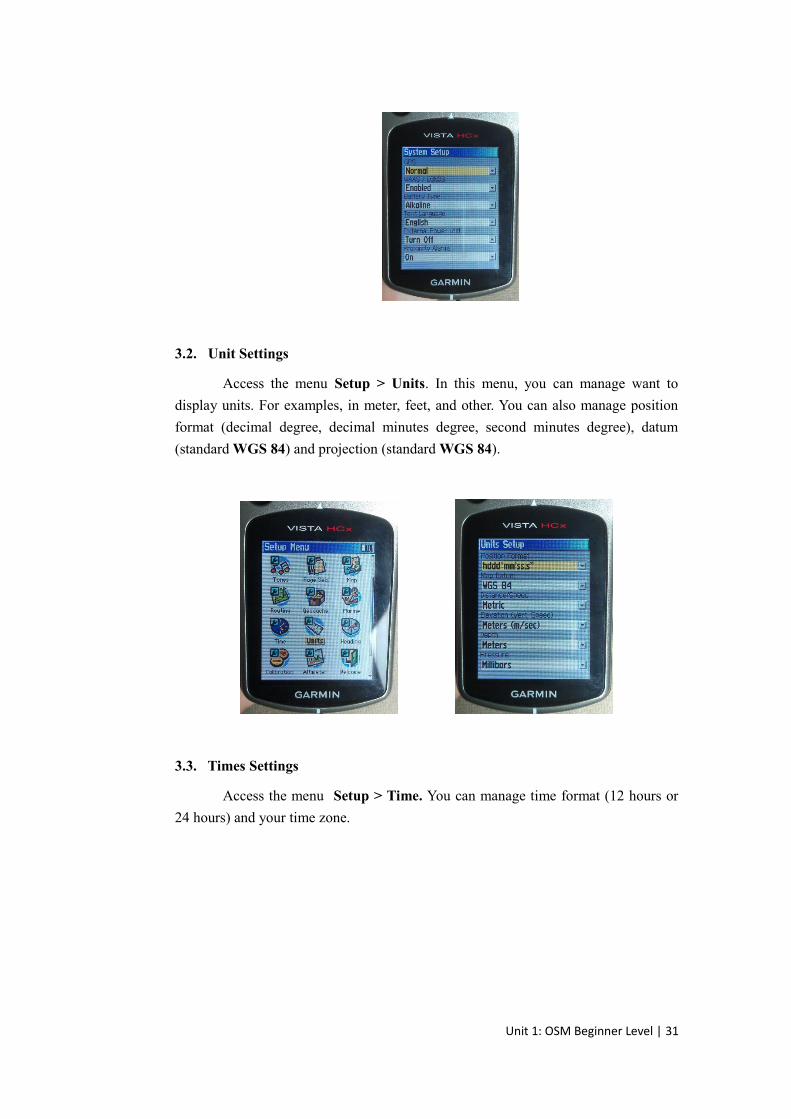
3.2. Unit Settings
Access the menu Setup > Units. In this menu, you can manage want to
display units. For examples, in meter, feet, and other. You can also manage position
format (decimal degree, decimal minutes degree, second minutes degree), datum
(standard WGS 84) and projection (standard WGS 84).
3.3. Times Settings
Access the menu Setup > Time. You can manage time format (12 hours or
24 hours) and your time zone.
Unit 1: OSM Beginner Level | 31
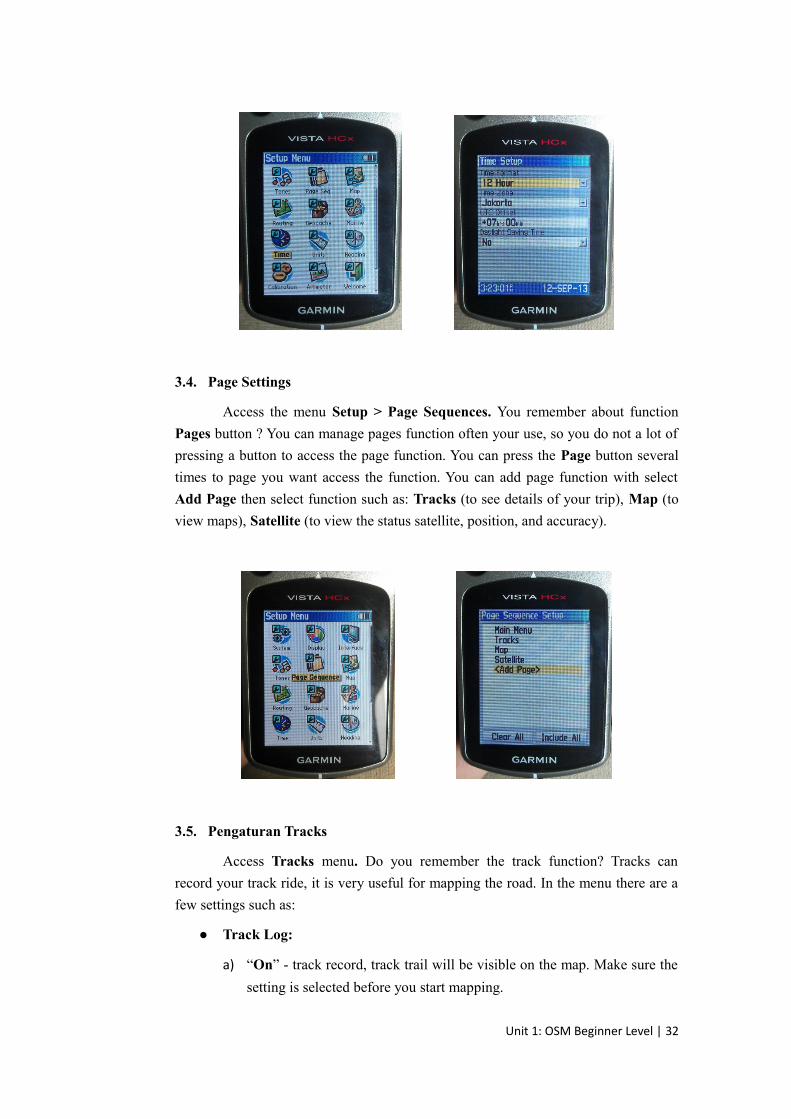
3.4. Page Settings
Access the menu Setup > Page Sequences. You remember about function
Pages button ? You can manage pages function often your use, so you do not a lot of
pressing a button to access the page function. You can press the Page button several
times to page you want access the function. You can add page function with select
Add Page then select function such as: Tracks (to see details of your trip), Map (to
view maps), Satellite (to view the status satellite, position, and accuracy).
3.5. Pengaturan Tracks
Access Tracks menu. Do you remember the track function? Tracks can
record your track ride, it is very useful for mapping the road. In the menu there are a
few settings such as:
● Track Log:
a) “On” - track record, track trail will be visible on the map. Make sure the
setting is selected before you start mapping.
Unit 1: OSM Beginner Level | 32
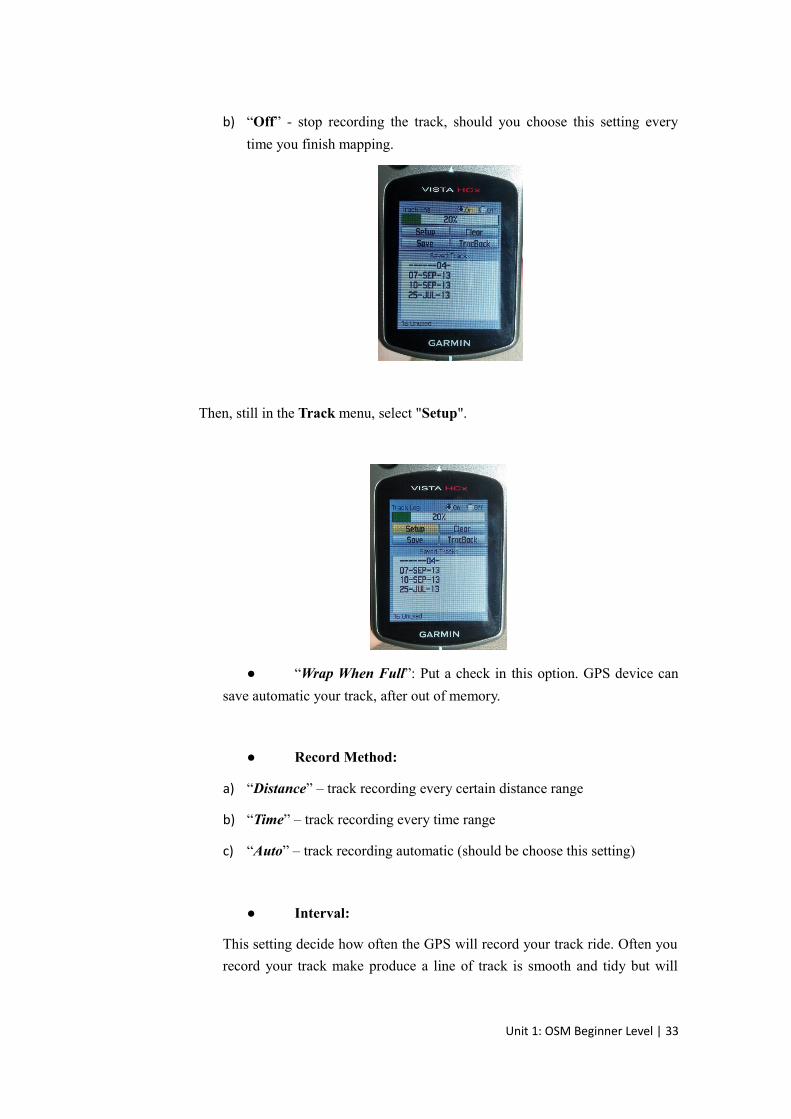
b) “Off” - stop recording the track, should you choose this setting every
time you finish mapping.
Then, still in the Track menu, select "Setup".
● “Wrap When Full”: Put a check in this option. GPS device can
save automatic your track, after out of memory.
● Record Method:
a) “Distance” – track recording every certain distance range
b) “Time” – track recording every time range
c) “Auto” – track recording automatic (should be choose this setting)
● Interval:
This setting decide how often the GPS will record your track ride. Often you
record your track make produce a line of track is smooth and tidy but will
Unit 1: OSM Beginner Level | 33
drain the battery faster. If least often, recording infrequently, the line
produced track will appear broken.
a) “Most often” – track recording at any time as often as possible
b) “More often” – track recording done as often as possible
c) “Normal” – track recording at normal
d) “Less often” – track recording not at any time (below normally)
e) “Least often” – track recording infrequently
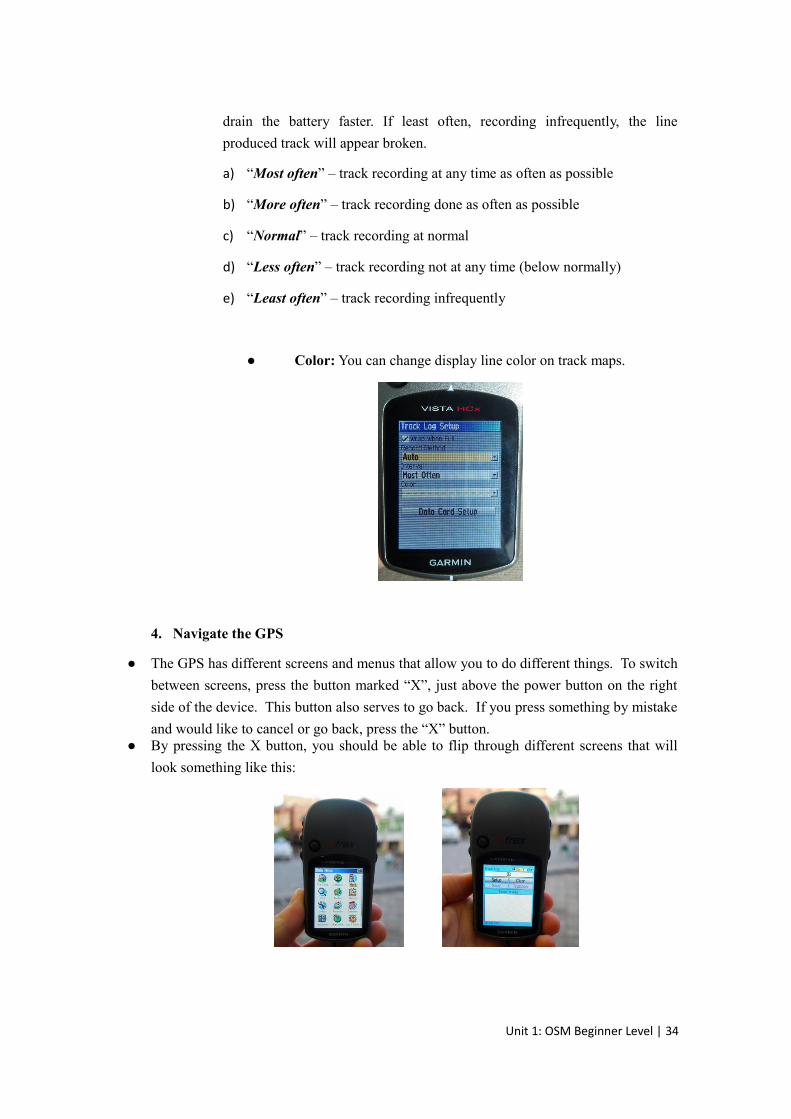
● Color: You can change display line color on track maps.
4. Navigate the GPS
● The GPS has different screens and menus that allow you to do different things. To switch
between screens, press the button marked “X”, just above the power button on the right
side of the device. This button also serves to go back. If you press something by mistake
and would like to cancel or go back, press the “X” button.● By pressing the X button, you should be able to flip through different screens that will
look something like this:
Unit 1: OSM Beginner Level | 34
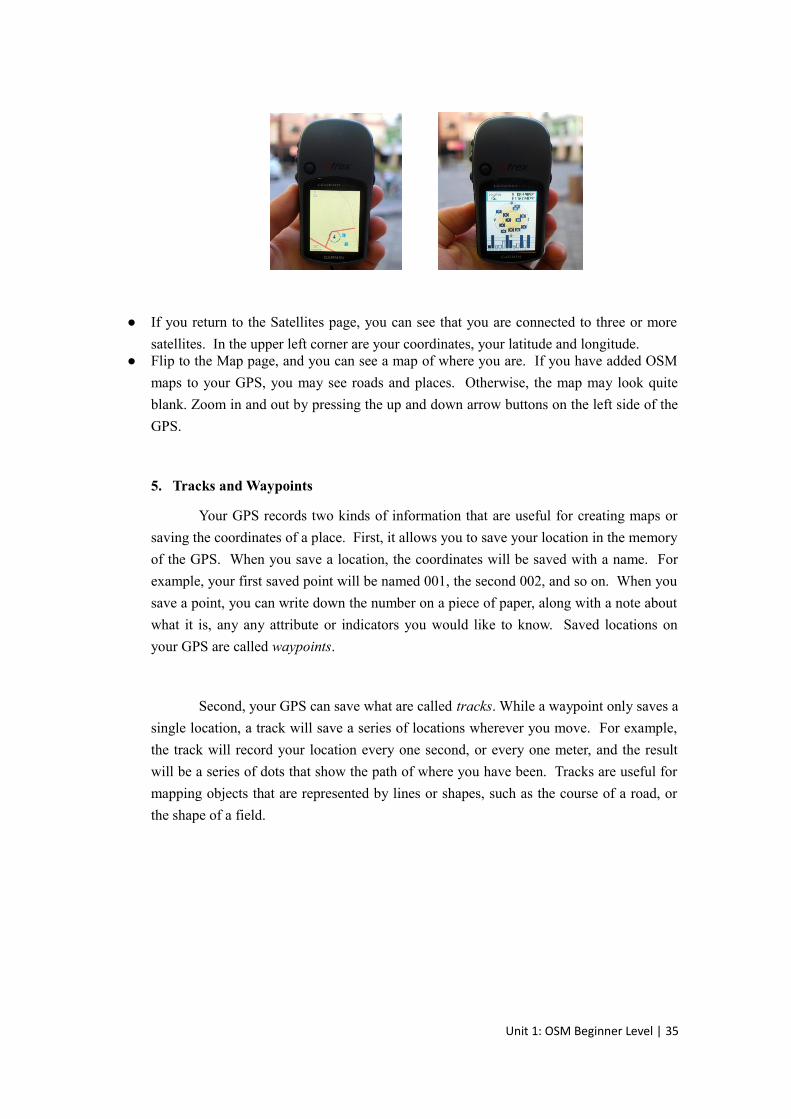
● If you return to the Satellites page, you can see that you are connected to three or more
satellites. In the upper left corner are your coordinates, your latitude and longitude.● Flip to the Map page, and you can see a map of where you are. If you have added OSM
maps to your GPS, you may see roads and places. Otherwise, the map may look quite
blank. Zoom in and out by pressing the up and down arrow buttons on the left side of the
GPS.
5. Tracks and Waypoints
Your GPS records two kinds of information that are useful for creating maps or
saving the coordinates of a place. First, it allows you to save your location in the memory
of the GPS. When you save a location, the coordinates will be saved with a name. For
example, your first saved point will be named 001, the second 002, and so on. When you
save a point, you can write down the number on a piece of paper, along with a note about
what it is, any any attribute or indicators you would like to know. Saved locations on
your GPS are called waypoints.
Second, your GPS can save what are called tracks. While a waypoint only saves a
single location, a track will save a series of locations wherever you move. For example,
the track will record your location every one second, or every one meter, and the result
will be a series of dots that show the path of where you have been. Tracks are useful for
mapping objects that are represented by lines or shapes, such as the course of a road, or
the shape of a field.
Unit 1: OSM Beginner Level | 35
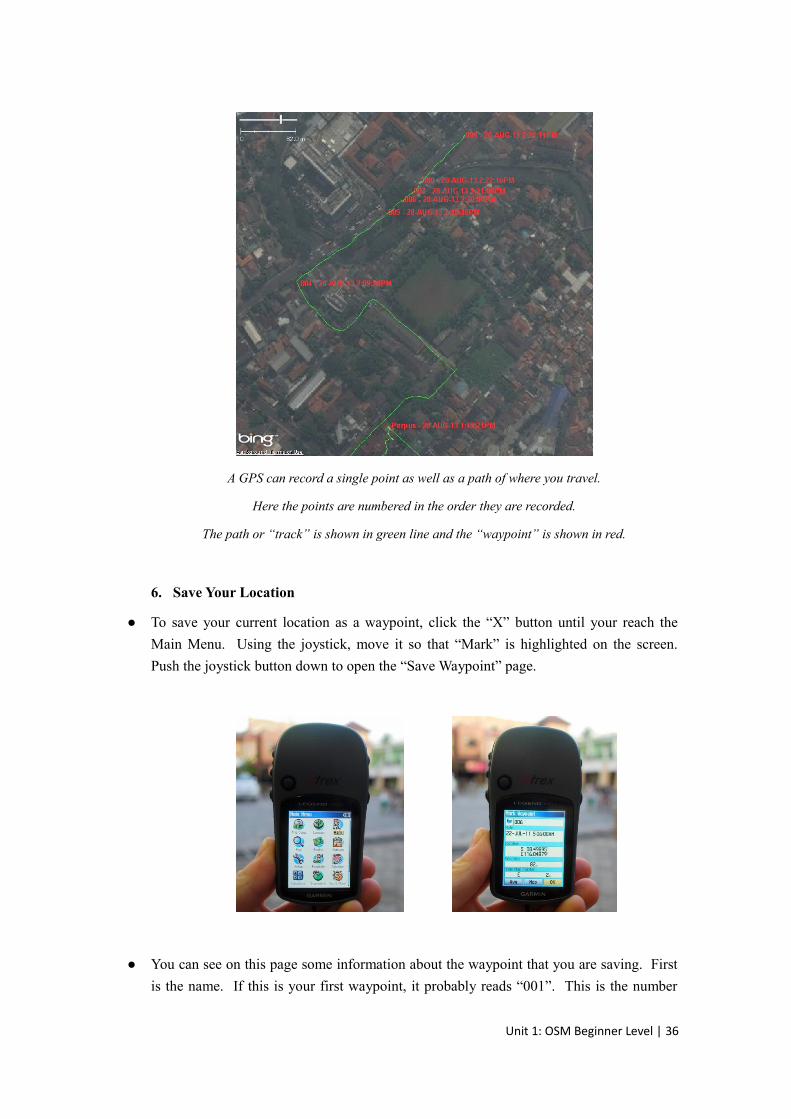
A GPS can record a single point as well as a path of where you travel.
Here the points are numbered in the order they are recorded.
The path or “track” is shown in green line and the “waypoint” is shown in red.
6. Save Your Location
● To save your current location as a waypoint, click the “X” button until your reach the
Main Menu. Using the joystick, move it so that “Mark” is highlighted on the screen.
Push the joystick button down to open the “Save Waypoint” page.
● You can see on this page some information about the waypoint that you are saving. First
is the name. If this is your first waypoint, it probably reads “001”. This is the number
Unit 1: OSM Beginner Level | 36
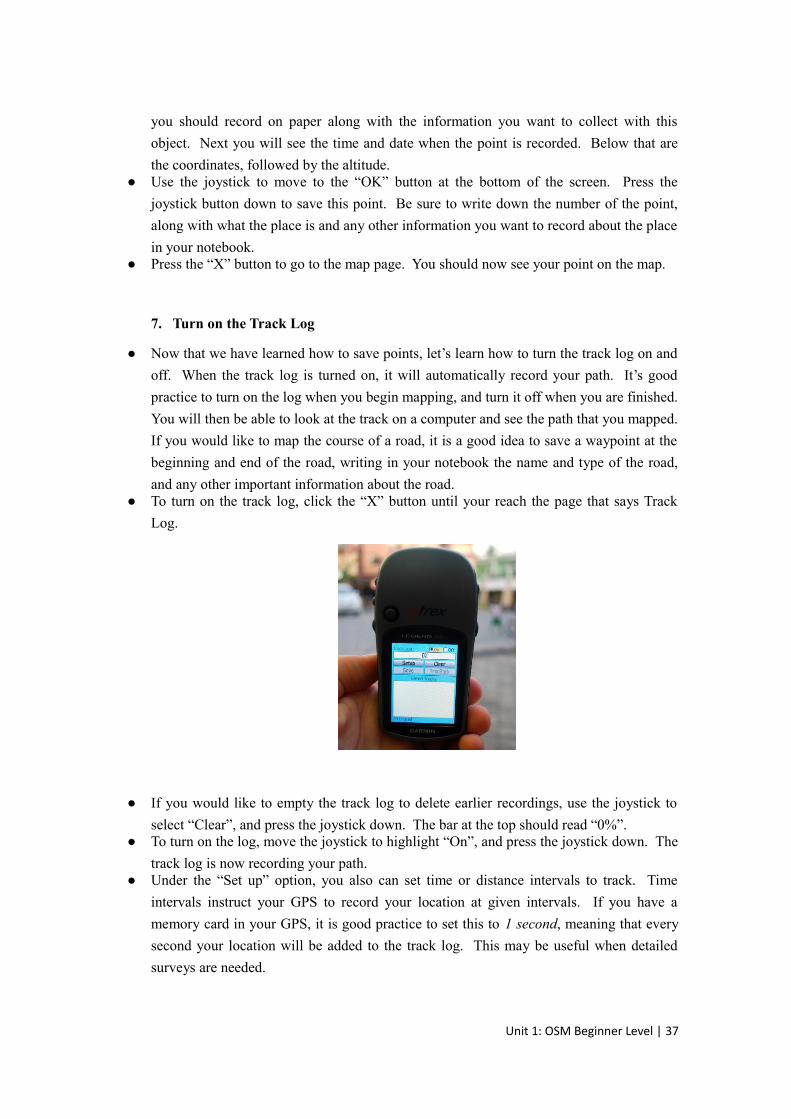
you should record on paper along with the information you want to collect with this
object. Next you will see the time and date when the point is recorded. Below that are
the coordinates, followed by the altitude.● Use the joystick to move to the “OK” button at the bottom of the screen. Press the
joystick button down to save this point. Be sure to write down the number of the point,
along with what the place is and any other information you want to record about the place
in your notebook.● Press the “X” button to go to the map page. You should now see your point on the map.
7. Turn on the Track Log
● Now that we have learned how to save points, let’s learn how to turn the track log on and
off. When the track log is turned on, it will automatically record your path. It’s good
practice to turn on the log when you begin mapping, and turn it off when you are finished.
You will then be able to look at the track on a computer and see the path that you mapped.
If you would like to map the course of a road, it is a good idea to save a waypoint at the
beginning and end of the road, writing in your notebook the name and type of the road,
and any other important information about the road.● To turn on the track log, click the “X” button until your reach the page that says Track
Log.
● If you would like to empty the track log to delete earlier recordings, use the joystick to
select “Clear”, and press the joystick down. The bar at the top should read “0%”.● To turn on the log, move the joystick to highlight “On”, and press the joystick down. The
track log is now recording your path.● Under the “Set up” option, you also can set time or distance intervals to track. Time
intervals instruct your GPS to record your location at given intervals. If you have a
memory card in your GPS, it is good practice to set this to 1 second, meaning that every
second your location will be added to the track log. This may be useful when detailed
surveys are needed.
Unit 1: OSM Beginner Level | 37
● Press the “X” button to go to the map page. As you move you will see your track shown
as a series of dots.
8. Copy Waypoints and Tracks to the Computer
8.1. Attach GPS to the Computer
● When you are finished mapping with the GPS you will want to
copy the points and tracks to your computer so that you can open them in
JOSM. First, turn off the track log on your GPS, by going to the track page
and selecting “Off”.● Attach the GPS to your computer with the cable. One end should
plug into your computer’s USB port, and the other goes into the back of the
GPS, beneath the rubber flap at the top. The GPS should be turned on to
copy the points and tracks.
8.2. Install GPS Drivers
● You may need to install GPS drivers on your computer. Open
your training folder and find software/USBDrivers_23.exe. Double-click it
and install.● If you don’t have this file, you can download it. Open your
internet browser and go to:
http://www8.garmin.com/support/download_details.jsp?id=591● Click “Download” to get the installation file. Locate it on your
computer, and double-click to install.
8.3. Get the GPSBabel Setup Program
● GPSBabel is a program that allows us to copy data from the
GPS. It is saved as GPSBabel-1.4.2-Setup in the software/ folder.● If you don’t have GPSbabel already, open your web browser and
go to www.gpsbabel.org● Click “Downloads” at the top of the page.● Scroll down the page. If your computer uses Windows, you want
to download the installation file for Windows. Click GPSBabel-1.4.2-
Setup.exe. The file will be downloaded to your computer.
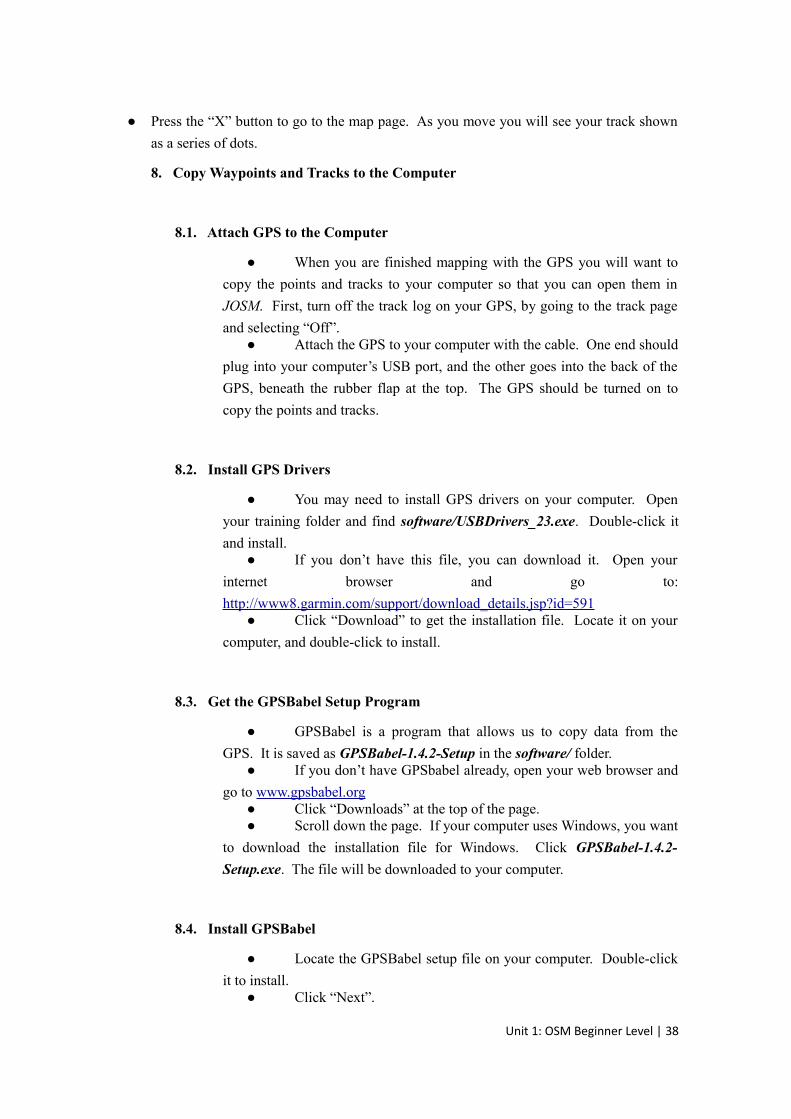
8.4. Install GPSBabel
● Locate the GPSBabel setup file on your computer. Double-click
it to install.● Click “Next”.
Unit 1: OSM Beginner Level | 38

● Click “I accept” and “Next”.● Continue clicking “Next” until the program installs.● When the program has finished installing, click “Finish” to start
GPSBabel.
Unit 1: OSM Beginner Level | 39
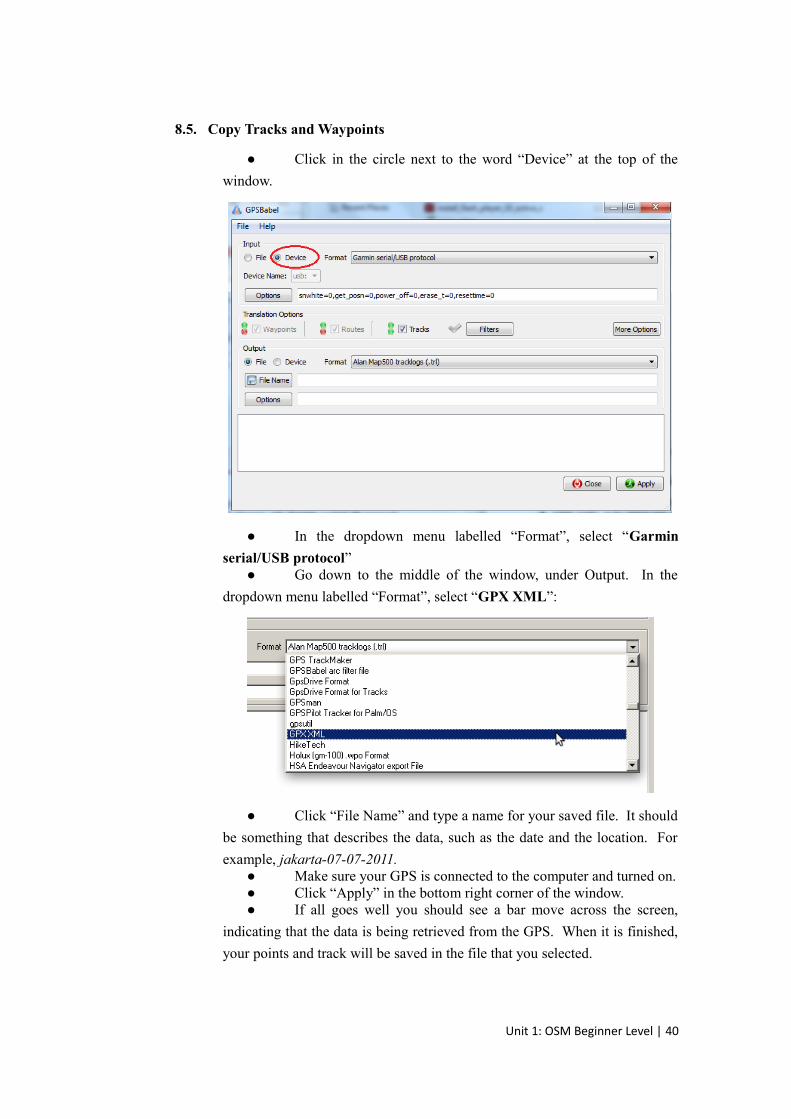
8.5. Copy Tracks and Waypoints
● Click in the circle next to the word “Device” at the top of the
window.
● In the dropdown menu labelled “Format”, select “Garmin
serial/USB protocol”● Go down to the middle of the window, under Output. In the
dropdown menu labelled “Format”, select “GPX XML”:
● Click “File Name” and type a name for your saved file. It should
be something that describes the data, such as the date and the location. For
example, jakarta-07-07-2011.● Make sure your GPS is connected to the computer and turned on.● Click “Apply” in the bottom right corner of the window.● If all goes well you should see a bar move across the screen,
indicating that the data is being retrieved from the GPS. When it is finished,
your points and track will be saved in the file that you selected.
Unit 1: OSM Beginner Level | 40
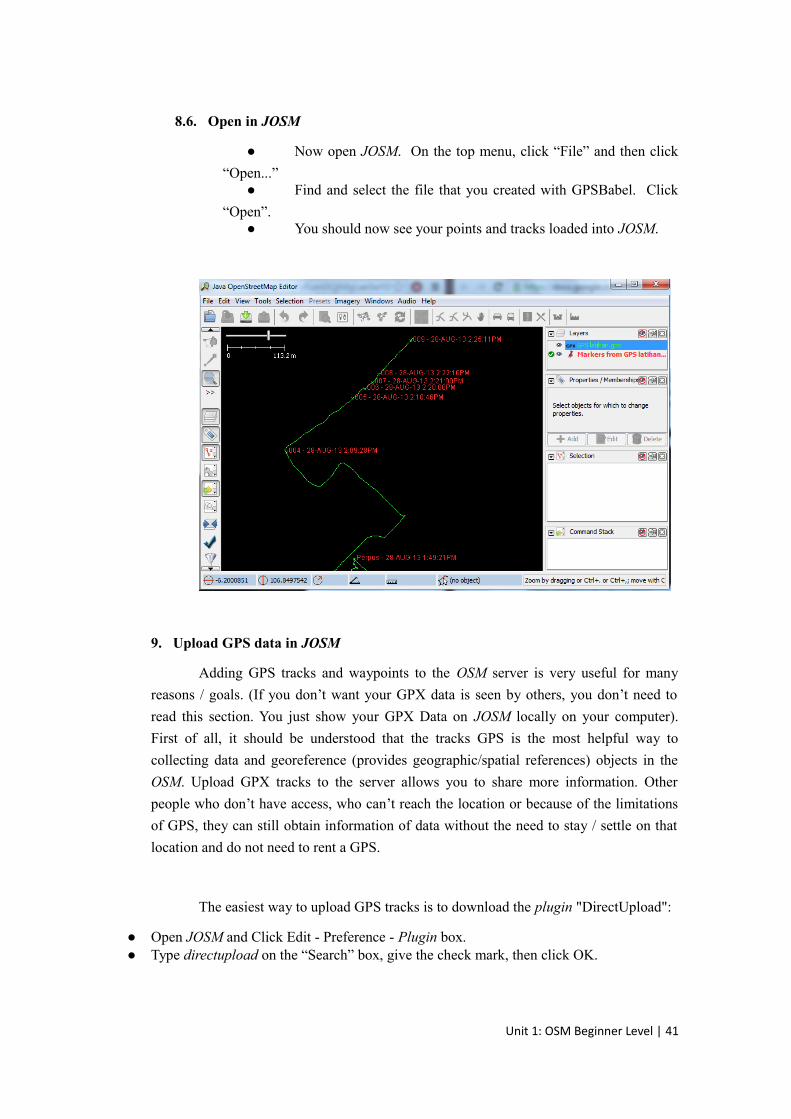
8.6. Open in JOSM
● Now open JOSM. On the top menu, click “File” and then click
“Open...”● Find and select the file that you created with GPSBabel. Click
“Open”.● You should now see your points and tracks loaded into JOSM.
9. Upload GPS data in JOSM
Adding GPS tracks and waypoints to the OSM server is very useful for many
reasons / goals. (If you don’t want your GPX data is seen by others, you don’t need to
read this section. You just show your GPX Data on JOSM locally on your computer).
First of all, it should be understood that the tracks GPS is the most helpful way to
collecting data and georeference (provides geographic/spatial references) objects in the
OSM. Upload GPX tracks to the server allows you to share more information. Other
people who don’t have access, who can’t reach the location or because of the limitations
of GPS, they can still obtain information of data without the need to stay / settle on that
location and do not need to rent a GPS.
The easiest way to upload GPS tracks is to download the plugin "DirectUpload":
● Open JOSM and Click Edit - Preference - Plugin box.● Type directupload on the “Search” box, give the check mark, then click OK.
Unit 1: OSM Beginner Level | 41
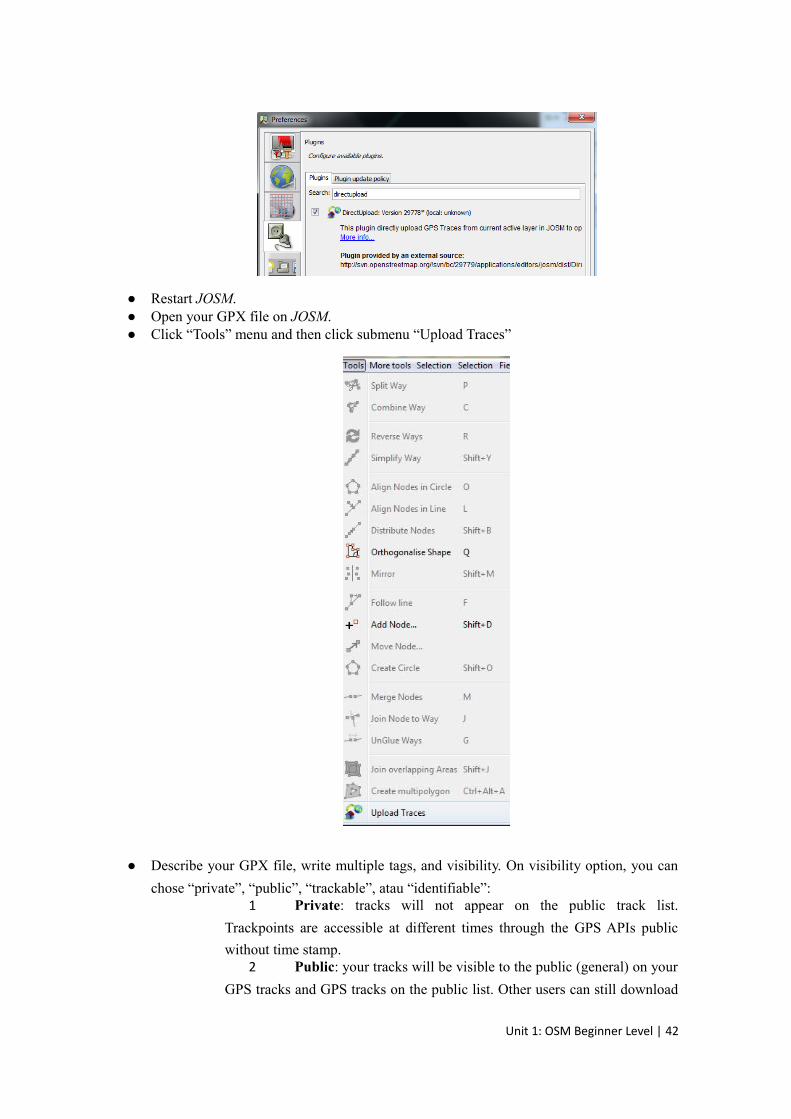
● Restart JOSM.● Open your GPX file on JOSM.● Click “Tools” menu and then click submenu “Upload Traces”
● Describe your GPX file, write multiple tags, and visibility. On visibility option, you can
chose “private”, “public”, “trackable”, atau “identifiable”: 1 Private: tracks will not appear on the public track list.
Trackpoints are accessible at different times through the GPS APIs public
without time stamp.2 Public: your tracks will be visible to the public (general) on your
GPS tracks and GPS tracks on the public list. Other users can still download
Unit 1: OSM Beginner Level | 42
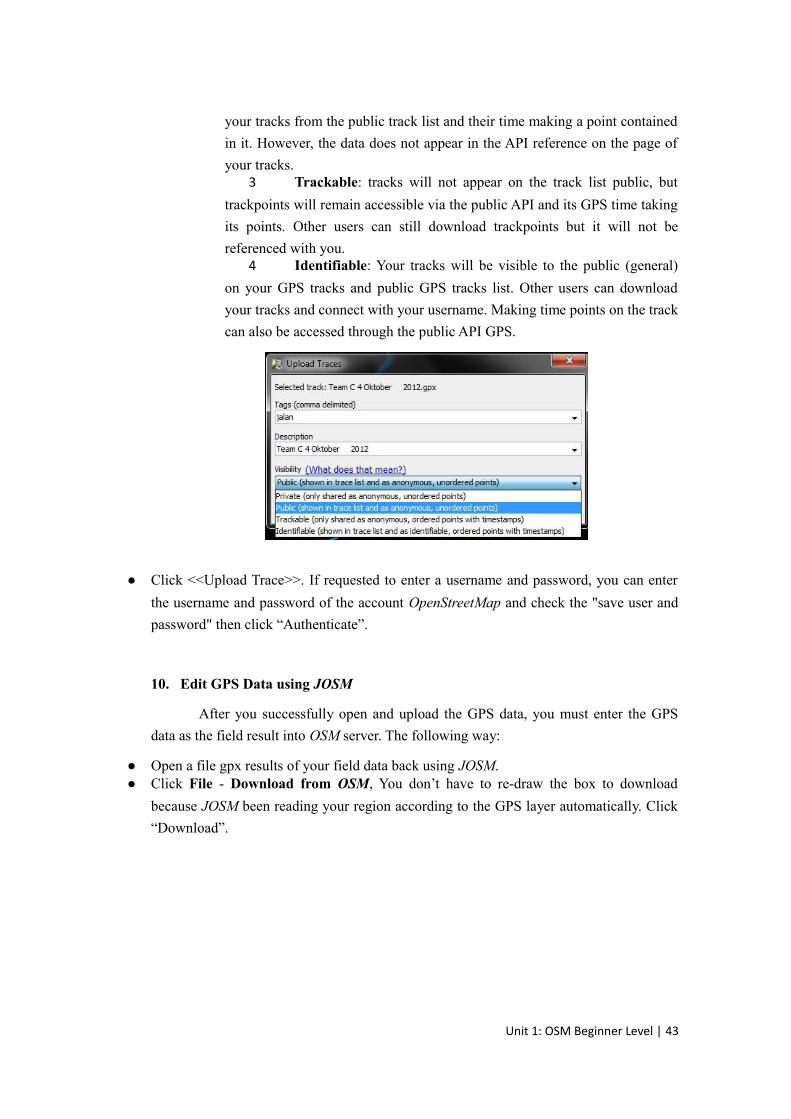
your tracks from the public track list and their time making a point contained
in it. However, the data does not appear in the API reference on the page of
your tracks.3 Trackable: tracks will not appear on the track list public, but
trackpoints will remain accessible via the public API and its GPS time taking
its points. Other users can still download trackpoints but it will not be
referenced with you.4 Identifiable: Your tracks will be visible to the public (general)
on your GPS tracks and public GPS tracks list. Other users can download
your tracks and connect with your username. Making time points on the track
can also be accessed through the public API GPS.
● Click <<Upload Trace>>. If requested to enter a username and password, you can enter
the username and password of the account OpenStreetMap and check the "save user and
password" then click “Authenticate”.
10. Edit GPS Data using JOSM
After you successfully open and upload the GPS data, you must enter the GPS
data as the field result into OSM server. The following way:
● Open a file gpx results of your field data back using JOSM. ● Click File - Download from OSM, You don’t have to re-draw the box to download
because JOSM been reading your region according to the GPS layer automatically. Click
“Download”.
Unit 1: OSM Beginner Level | 43
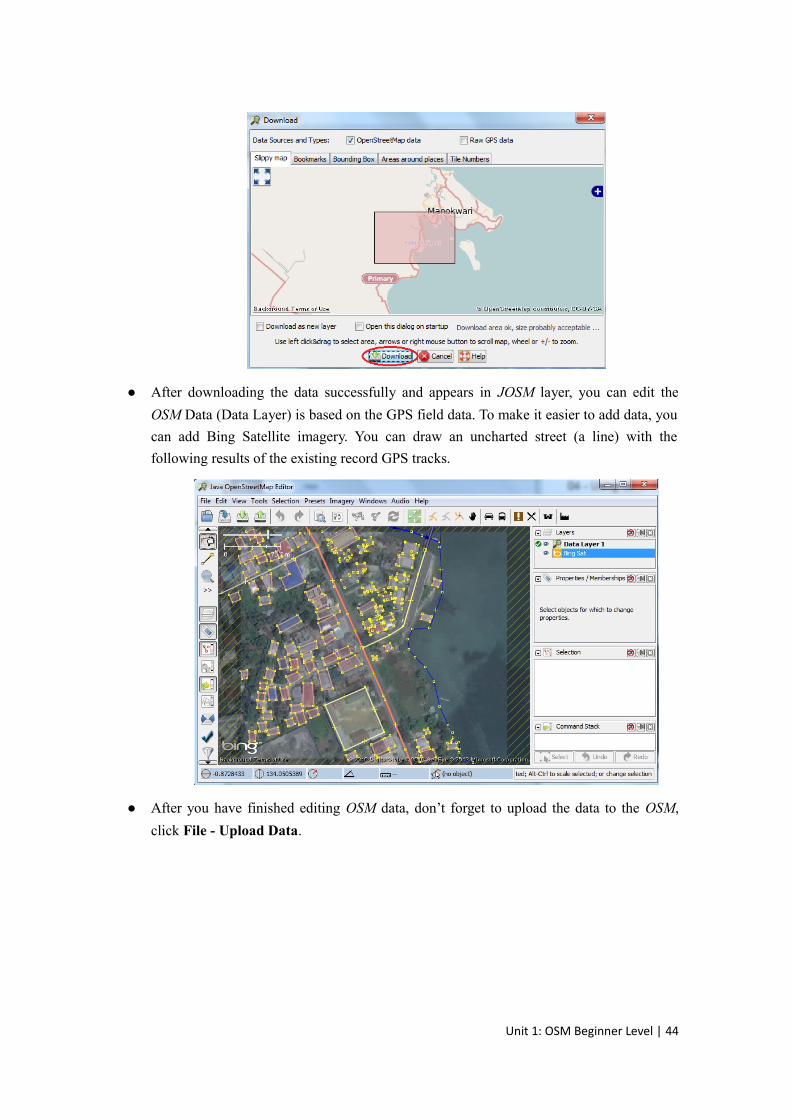
● After downloading the data successfully and appears in JOSM layer, you can edit the
OSM Data (Data Layer) is based on the GPS field data. To make it easier to add data, you
can add Bing Satellite imagery. You can draw an uncharted street (a line) with the
following results of the existing record GPS tracks.
● After you have finished editing OSM data, don’t forget to upload the data to the OSM,
click File - Upload Data.
Unit 1: OSM Beginner Level | 44
Module 5
Field Papers
Learning Objectives
● How to use Field Papers● Make and print Field Papers● Add data to print using Field Papers● Scan and upload Field Papers to Field Papers website● Open Field Papers into JOSM
In this module we will see how we can record the coordinates of places without a
GPS. We will use a tool called Field Papers, which allows you to print a map of an area,
draw on it and add notes, and load the paper back into JOSM, where you can add your
locations to OpenStreetMap.
1. Overview of Field Papers
Before going into detail about Field Papers, let’s look at an overview of how the
process works:
Step 1: Locate the area you want to map on the Field Papers website. Print out a
map of this area. You can choose to print the current map of the area with
OpenStreetMap, or you can choose to print aerial imagery, if it is available in your
area.
Step 2: Use your printed map to survey the area. Add more places by drawing them
on the map. Draw lines for roads, shapes for buildings, and so forth. Write notes
about each location directly on the map, or write numbers on the map that relate to
numbers in your notebook, where you can write more detailed information about each
object.
Unit 1: OSM Beginner Level | 45
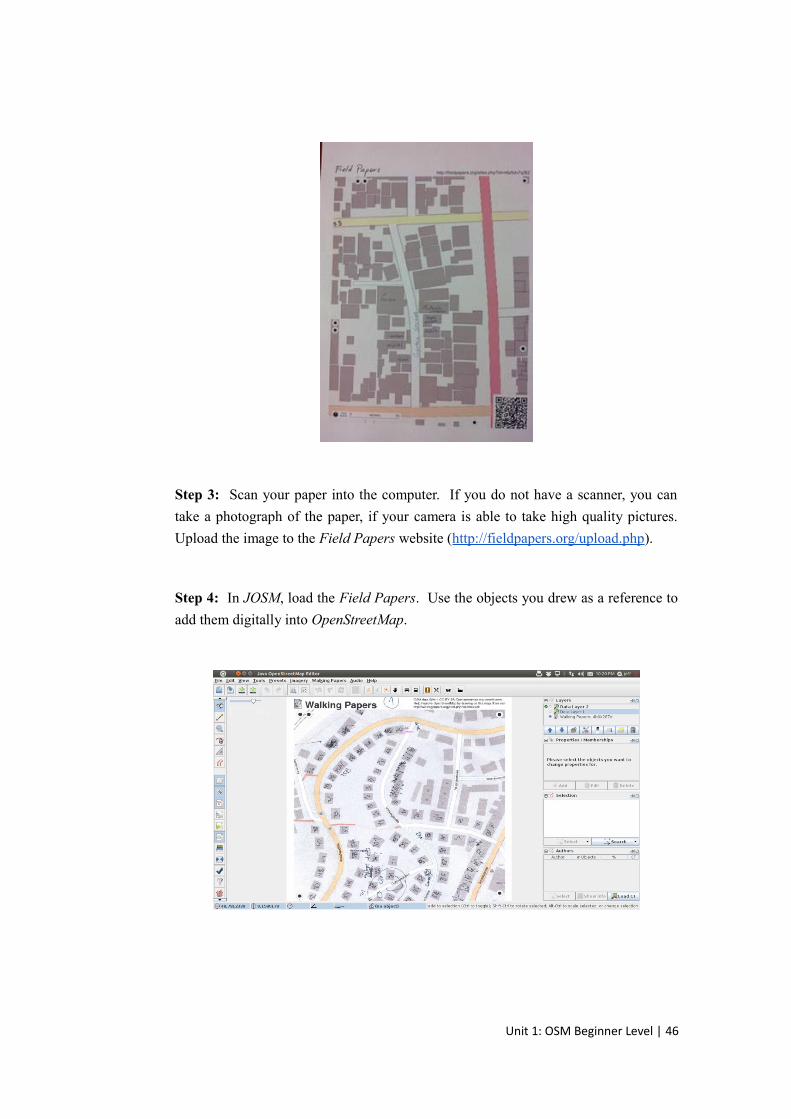
Step 3: Scan your paper into the computer. If you do not have a scanner, you can
take a photograph of the paper, if your camera is able to take high quality pictures.
Upload the image to the Field Papers website (http://fieldpapers.org/upload.php).
Step 4: In JOSM, load the Field Papers. Use the objects you drew as a reference to
add them digitally into OpenStreetMap.
Unit 1: OSM Beginner Level | 46
2. How does Field Papers work?
If you follow the Field Papers process described above, you will be collecting
accurate geographic coordinates of places with nothing more than paper. How is this
possible?
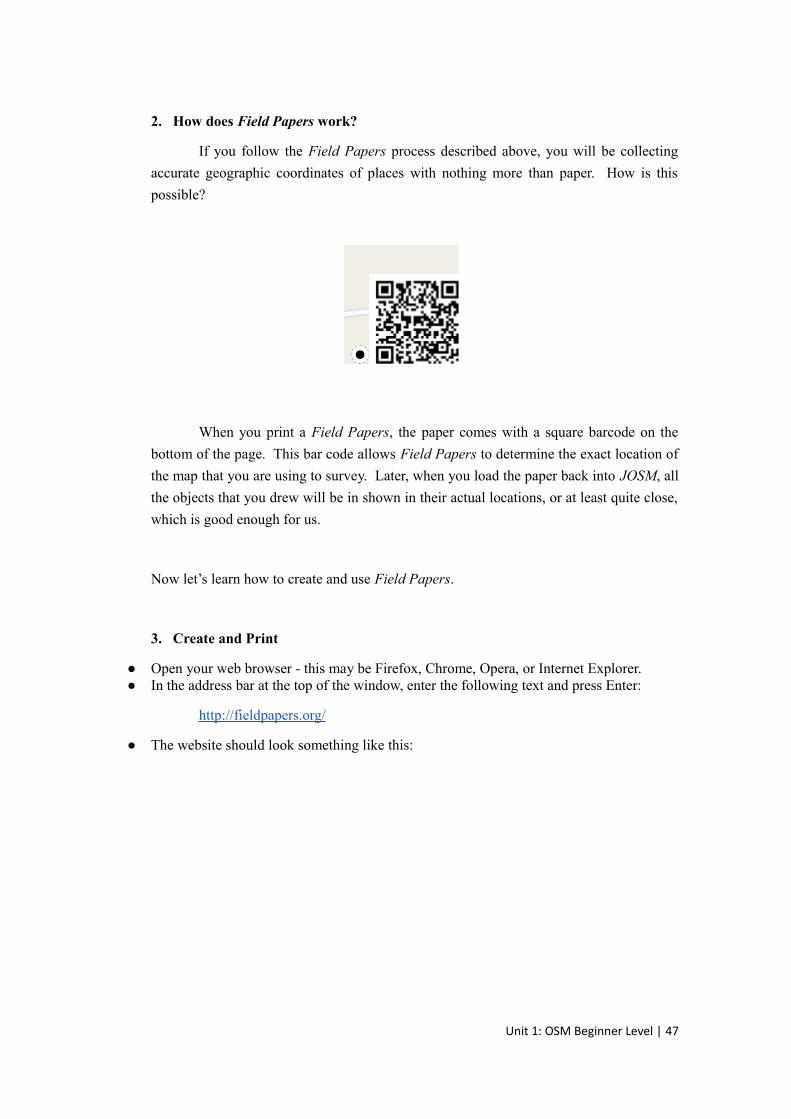
When you print a Field Papers, the paper comes with a square barcode on the
bottom of the page. This bar code allows Field Papers to determine the exact location of
the map that you are using to survey. Later, when you load the paper back into JOSM, all
the objects that you drew will be in shown in their actual locations, or at least quite close,
which is good enough for us.
Now let’s learn how to create and use Field Papers.
3. Create and Print
● Open your web browser - this may be Firefox, Chrome, Opera, or Internet Explorer.● In the address bar at the top of the window, enter the following text and press Enter:
http://fieldpapers.org/
● The website should look something like this:
Unit 1: OSM Beginner Level | 47
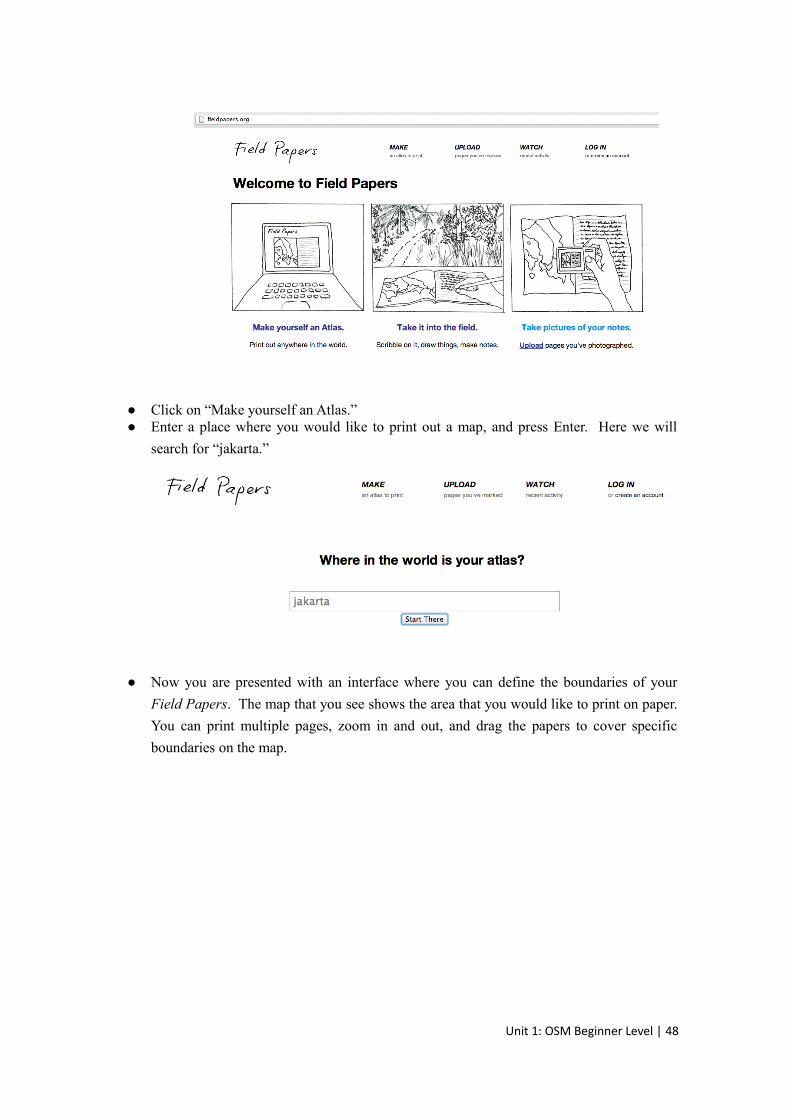
● Click on “Make yourself an Atlas.”● Enter a place where you would like to print out a map, and press Enter. Here we will
search for “jakarta.”
● Now you are presented with an interface where you can define the boundaries of your
Field Papers. The map that you see shows the area that you would like to print on paper.
You can print multiple pages, zoom in and out, and drag the papers to cover specific
boundaries on the map.
Unit 1: OSM Beginner Level | 48
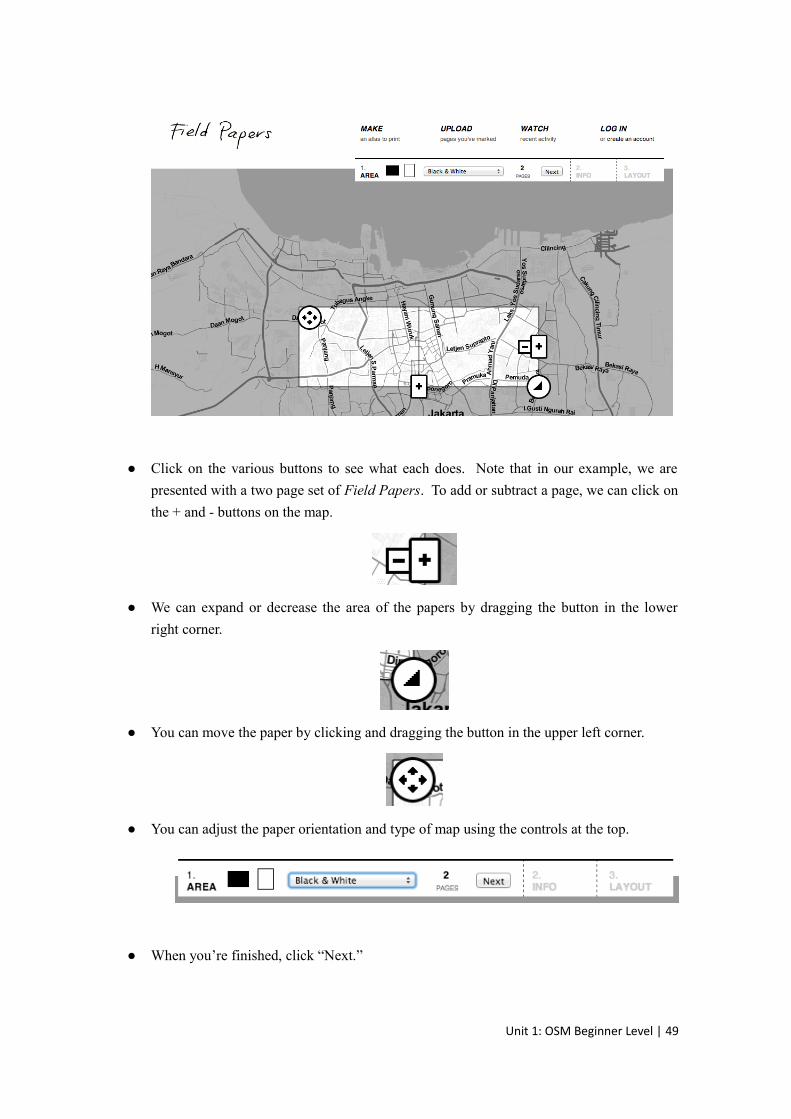
● Click on the various buttons to see what each does. Note that in our example, we are
presented with a two page set of Field Papers. To add or subtract a page, we can click on
the + and - buttons on the map.
● We can expand or decrease the area of the papers by dragging the button in the lower
right corner.
● You can move the paper by clicking and dragging the button in the upper left corner.
● You can adjust the paper orientation and type of map using the controls at the top.
● When you’re finished, click “Next.”
Unit 1: OSM Beginner Level | 49
● Next give your map a name, and if you want, you can add notes to be printed on the map,
such as questions you want to remember to answer or specific places you want to identify.
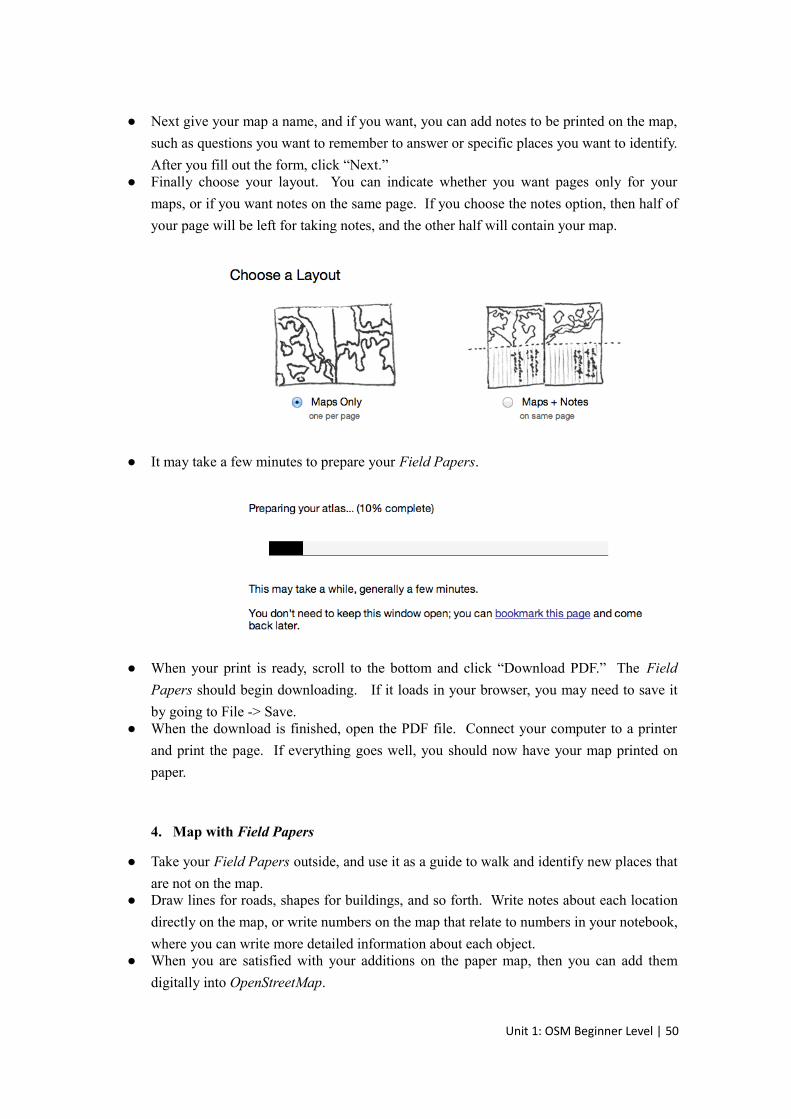
After you fill out the form, click “Next.”● Finally choose your layout. You can indicate whether you want pages only for your
maps, or if you want notes on the same page. If you choose the notes option, then half of
your page will be left for taking notes, and the other half will contain your map.
● It may take a few minutes to prepare your Field Papers.
● When your print is ready, scroll to the bottom and click “Download PDF.” The Field
Papers should begin downloading. If it loads in your browser, you may need to save it
by going to File -> Save.● When the download is finished, open the PDF file. Connect your computer to a printer
and print the page. If everything goes well, you should now have your map printed on
paper.
4. Map with Field Papers
● Take your Field Papers outside, and use it as a guide to walk and identify new places that
are not on the map.● Draw lines for roads, shapes for buildings, and so forth. Write notes about each location
directly on the map, or write numbers on the map that relate to numbers in your notebook,
where you can write more detailed information about each object.● When you are satisfied with your additions on the paper map, then you can add them
digitally into OpenStreetMap.
Unit 1: OSM Beginner Level | 50
5. Scan and Upload
● Field Papers are very useful for mapping with nothing more than paper, but they are not
100% magic. We will still need to add our paper into JOSM, add our information
digitally, and save our changes on OpenStreetMap.● The first step is to scan your Field Papers into your computer. You can do this by
attaching a scanner to your computer, scanning the paper, and saving it as an image file.
If you don’t have a scanner, you can take a photography of the paper, but you should be
carefully to take a very good photo. Make sure that the paper is flat and your camera is
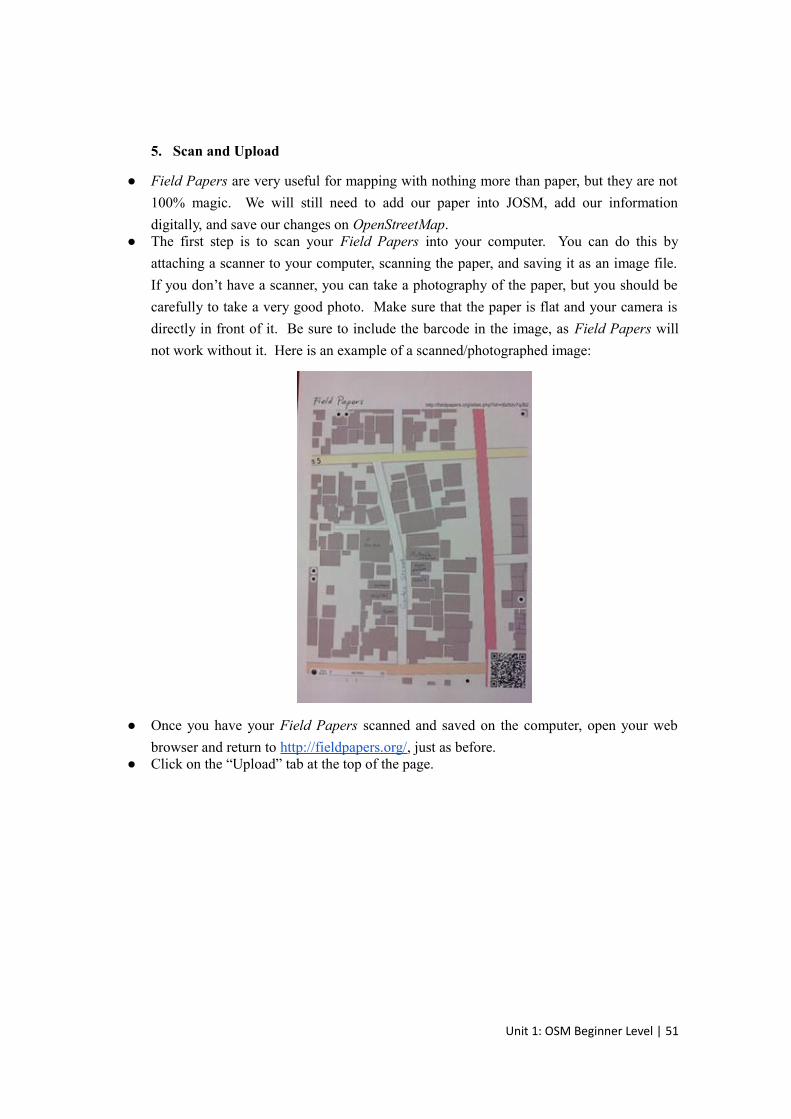
directly in front of it. Be sure to include the barcode in the image, as Field Papers will
not work without it. Here is an example of a scanned/photographed image:
● Once you have your Field Papers scanned and saved on the computer, open your web
browser and return to http://fieldpapers.org/, just as before.● Click on the “Upload” tab at the top of the page.
Unit 1: OSM Beginner Level | 51
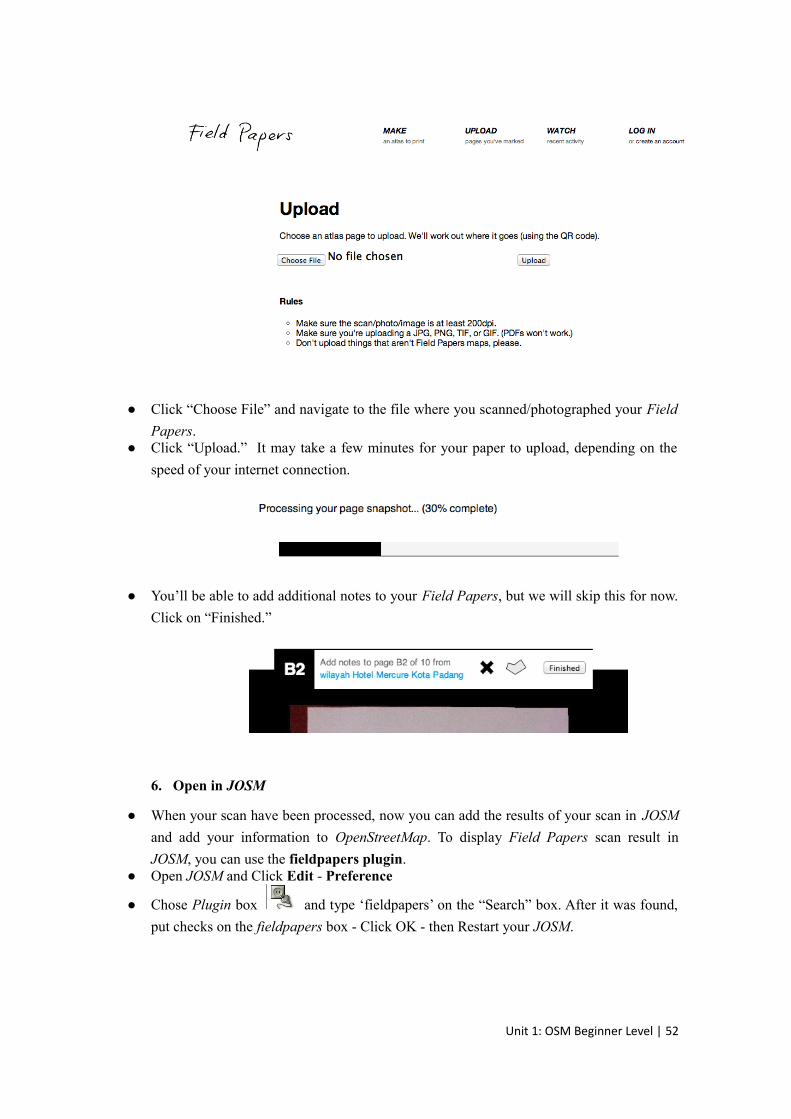
● Click “Choose File” and navigate to the file where you scanned/photographed your Field
Papers.● Click “Upload.” It may take a few minutes for your paper to upload, depending on the
speed of your internet connection.
● You’ll be able to add additional notes to your Field Papers, but we will skip this for now.
Click on “Finished.”
6. Open in JOSM
● When your scan have been processed, now you can add the results of your scan in JOSM
and add your information to OpenStreetMap. To display Field Papers scan result in
JOSM, you can use the fieldpapers plugin.● Open JOSM and Click Edit - Preference
● Chose Plugin box and type ‘fieldpapers’ on the “Search” box. After it was found,
put checks on the fieldpapers box - Click OK - then Restart your JOSM.
Unit 1: OSM Beginner Level | 52
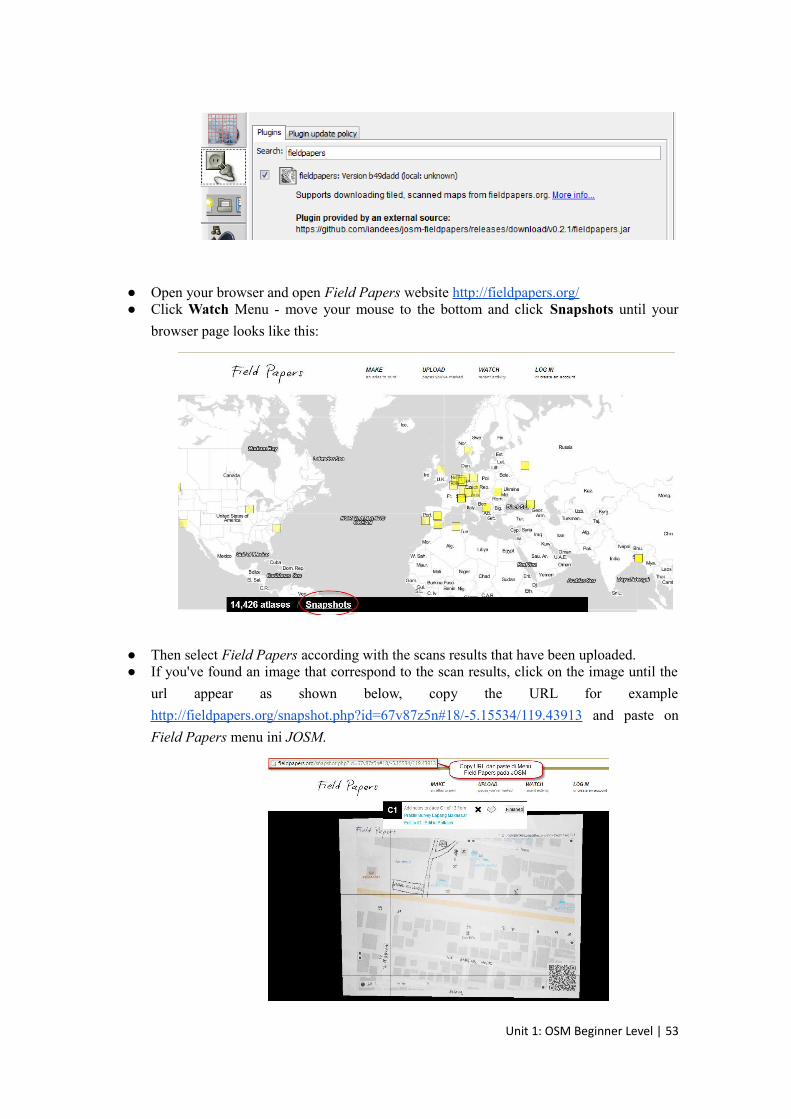
● Open your browser and open Field Papers website http://fieldpapers.org/ ● Click Watch Menu - move your mouse to the bottom and click Snapshots until your
browser page looks like this:
● Then select Field Papers according with the scans results that have been uploaded.● If you've found an image that correspond to the scan results, click on the image until the
url appear as shown below, copy the URL for example
http://fieldpapers.org/snapshot.php?id=67v87z5n#18/-5.15534/119.43913 and paste on
Field Papers menu ini JOSM.
Unit 1: OSM Beginner Level | 53
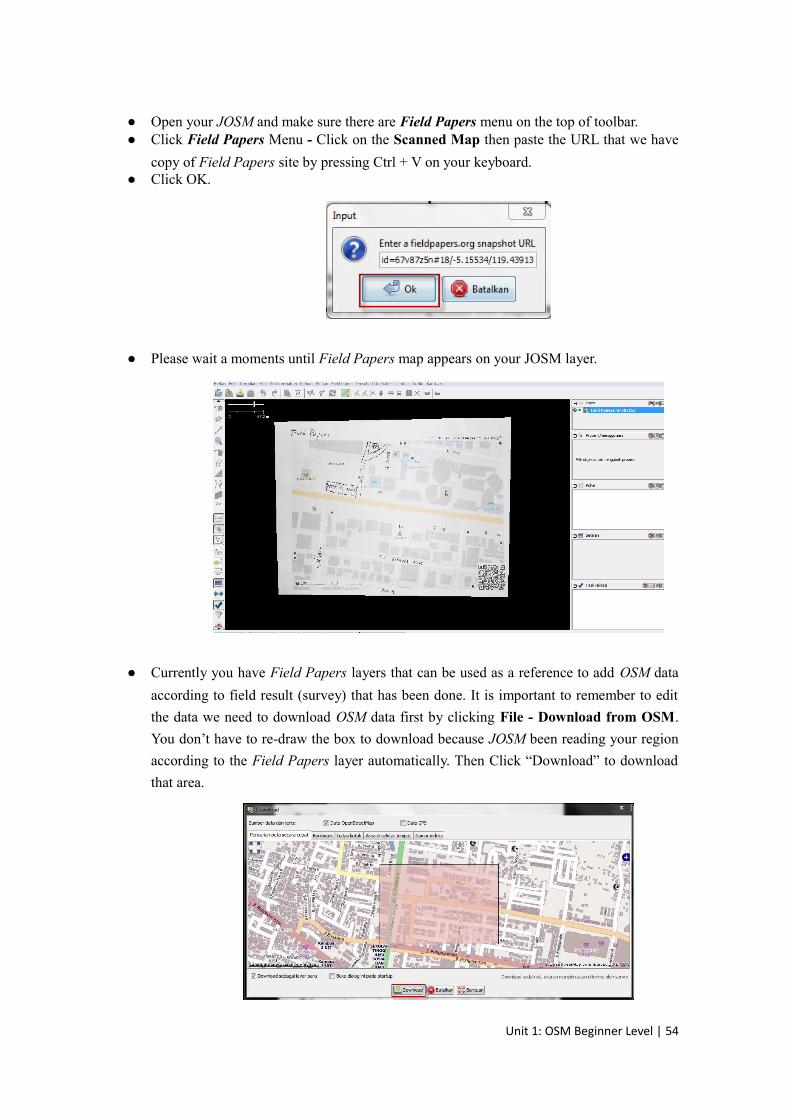
● Open your JOSM and make sure there are Field Papers menu on the top of toolbar.● Click Field Papers Menu - Click on the Scanned Map then paste the URL that we have
copy of Field Papers site by pressing Ctrl + V on your keyboard. ● Click OK.
● Please wait a moments until Field Papers map appears on your JOSM layer.
● Currently you have Field Papers layers that can be used as a reference to add OSM data
according to field result (survey) that has been done. It is important to remember to edit
the data we need to download OSM data first by clicking File - Download from OSM.
You don’t have to re-draw the box to download because JOSM been reading your region
according to the Field Papers layer automatically. Then Click “Download” to download
that area.
Unit 1: OSM Beginner Level | 54
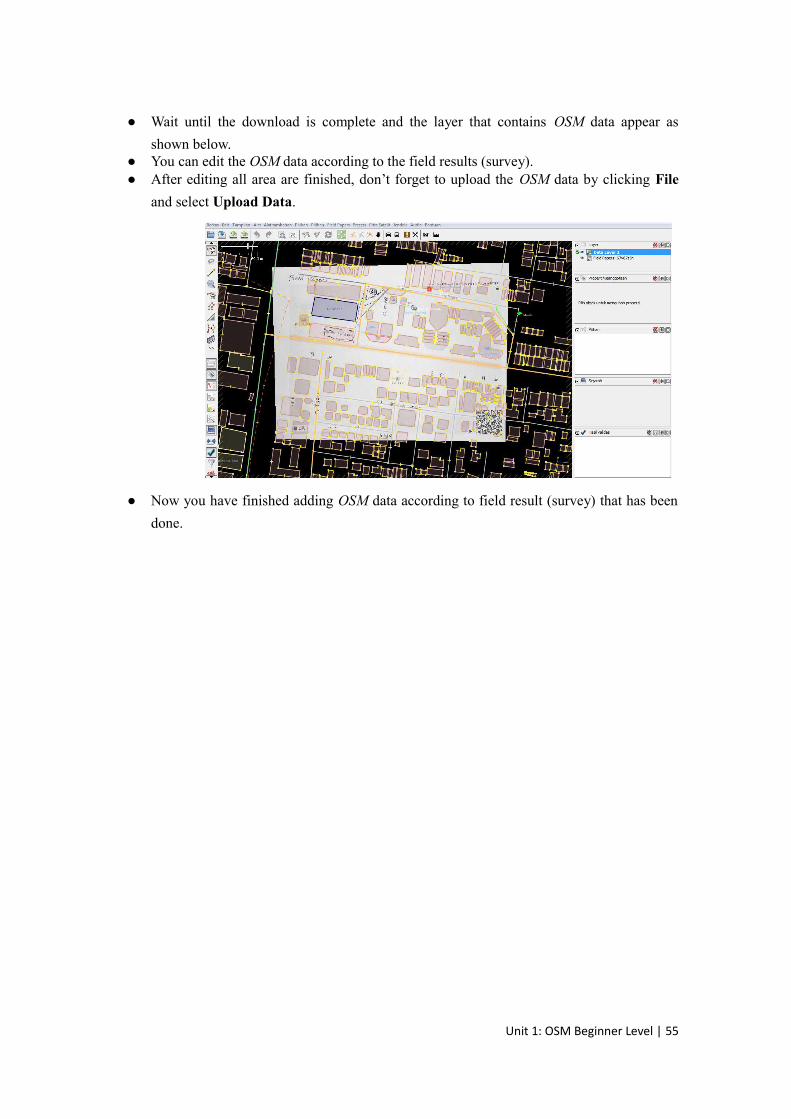
● Wait until the download is complete and the layer that contains OSM data appear as
shown below.● You can edit the OSM data according to the field results (survey). ● After editing all area are finished, don’t forget to upload the OSM data by clicking File
and select Upload Data.
● Now you have finished adding OSM data according to field result (survey) that has been
done.
Unit 1: OSM Beginner Level | 55
Module 6
Editing OpenStreetMap with JOSM
Learning Objectives
● Download current OSM data on the area you want to edit.● Set the layer JOSM● Editing OSM data● Editing Tag● Upload OSM data● Save OSM files
In Module 3 you installed JOSM and began drawing your first points, lines, and
shapes. You added presets to these objects in order to attach information about them. By
the end, you were able to draw your own map in JOSM.
Drawing maps in Module 3 was an exercise to learn JOSM and learn how to draw
places on the map. But our maps were not accurate, because we had not yet included
location. In the past two modules we have examined two tools, GPS and Field Papers,
which allow us to collect actual locations of places (Generally, GPS receivers determine
your location within +/- 10 meters, so they may not be completely accurate, especially if
you only take one waypoint). These locations are represented by coordinates.
Drawing a real map, that is, a map where all the points, lines, and shapes are in
their proper location, is no different than drawing the maps we drew in Module 3. But
now, we will use our GPS points and tracks, and our Field Papers, to draw similar maps
at their correct locations on the planet.
In this module we will learn how to edit the map on OpenStreetMap and add our
improvements. We’ll learn the basic cycle of mapping on OSM:
Unit 1: OSM Beginner Level | 56
I. Download the current map data from OSM
1. Explore JOSM
2. Download OSM Data
3. JOSM Layers
II. Edit OSM data
4. Edit Tag
5. Common Problem
III. Save changes to OpenStreetMap
1. Upload Changes
2. See Your Changes on the Map
3. Saving OSM files
By the end of this module, we will be able to see our additions on the OSM map.
1. Explore JOSM
● First, to start JOSM click on the Start Menu in the lower left corner of your computer, and
find the program “JOSM”.● Then, load your gpx file and your Field Paper in JOSM. You don’t need to open both, but
you can if you want. Refer to the previous two modules if you don’t remember how to
open these in JOSM. ● A quick tour of JOSM’s features: JOSM has many different features. The main window
in JOSM you are already familiar with- this is the map window, and it is where most of
the action takes place. Here you view, edit, and add to the OpenStreetMap data.● To the right of the map window are a series of panels, which each do something different.
Typically when you first install JOSM several panels are shown by default, such as
“Layers”, “Properties”, and “Selection”. When you select a point, line, or shape in the
map window, it will be shown in the “Selection” panel. Information about the object will
be shown in the “Properties” panel, and the username of the author of that object will be
shown in the “Authors” panel.
Unit 1: OSM Beginner Level | 57
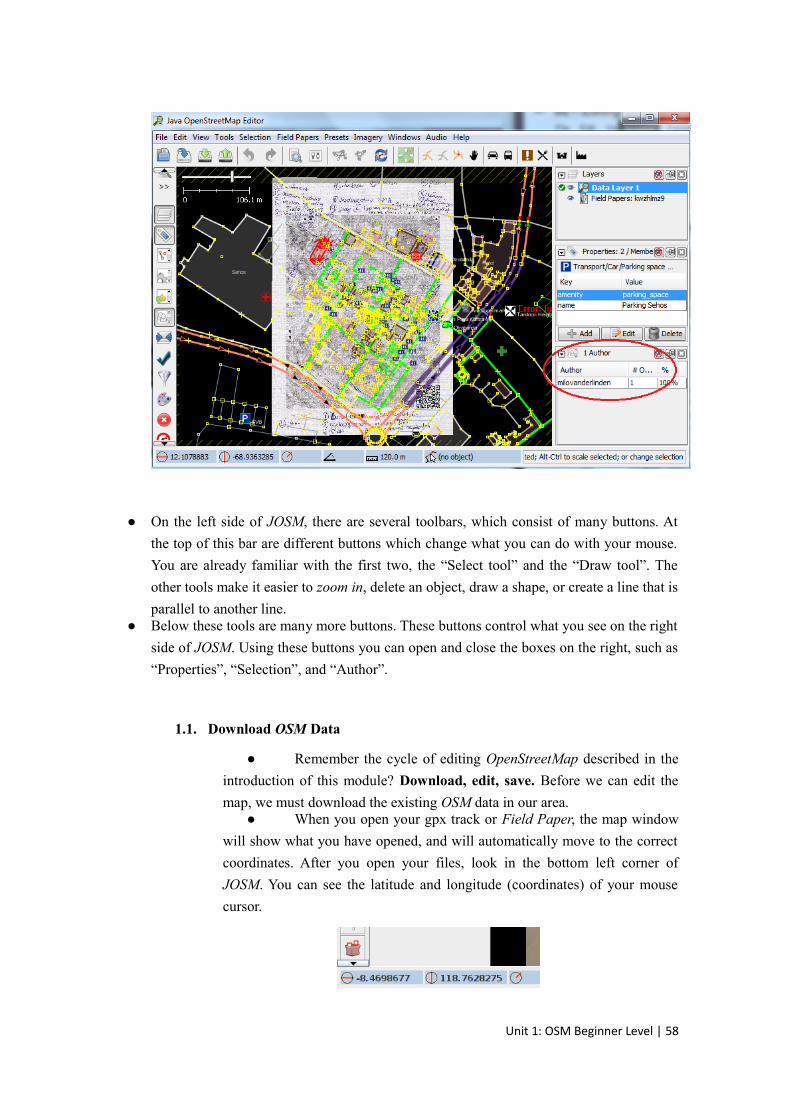
● On the left side of JOSM, there are several toolbars, which consist of many buttons. At
the top of this bar are different buttons which change what you can do with your mouse.
You are already familiar with the first two, the “Select tool” and the “Draw tool”. The
other tools make it easier to zoom in, delete an object, draw a shape, or create a line that is
parallel to another line.● Below these tools are many more buttons. These buttons control what you see on the right
side of JOSM. Using these buttons you can open and close the boxes on the right, such as
“Properties”, “Selection”, and “Author”.
1.1. Download OSM Data
● Remember the cycle of editing OpenStreetMap described in the
introduction of this module? Download, edit, save. Before we can edit the
map, we must download the existing OSM data in our area.● When you open your gpx track or Field Paper, the map window
will show what you have opened, and will automatically move to the correct
coordinates. After you open your files, look in the bottom left corner of
JOSM. You can see the latitude and longitude (coordinates) of your mouse
cursor.
Unit 1: OSM Beginner Level | 58
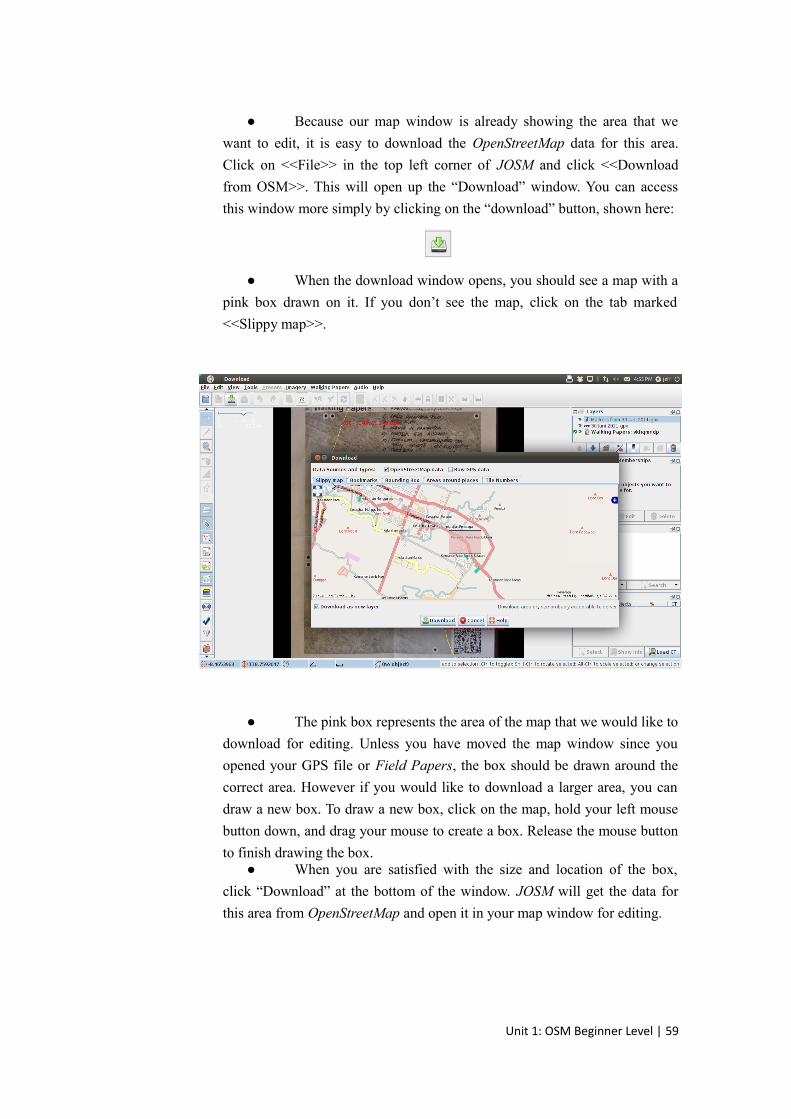
● Because our map window is already showing the area that we
want to edit, it is easy to download the OpenStreetMap data for this area.
Click on <<File>> in the top left corner of JOSM and click <<Download
from OSM>>. This will open up the “Download” window. You can access
this window more simply by clicking on the “download” button, shown here:
● When the download window opens, you should see a map with a
pink box drawn on it. If you don’t see the map, click on the tab marked
<<Slippy map>>.
● The pink box represents the area of the map that we would like to
download for editing. Unless you have moved the map window since you
opened your GPS file or Field Papers, the box should be drawn around the
correct area. However if you would like to download a larger area, you can
draw a new box. To draw a new box, click on the map, hold your left mouse
button down, and drag your mouse to create a box. Release the mouse button
to finish drawing the box.● When you are satisfied with the size and location of the box,
click “Download” at the bottom of the window. JOSM will get the data for
this area from OpenStreetMap and open it in your map window for editing.
Unit 1: OSM Beginner Level | 59
2. JOSM Layers
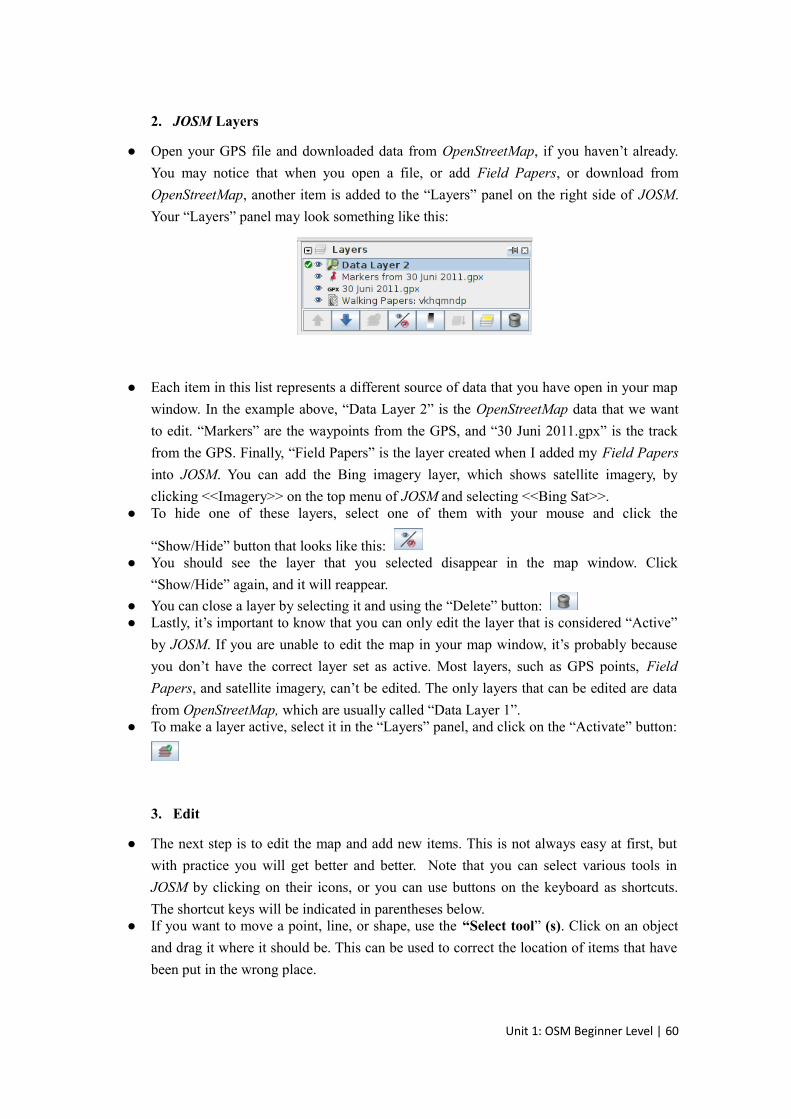
● Open your GPS file and downloaded data from OpenStreetMap, if you haven’t already.
You may notice that when you open a file, or add Field Papers, or download from
OpenStreetMap, another item is added to the “Layers” panel on the right side of JOSM.
Your “Layers” panel may look something like this:
● Each item in this list represents a different source of data that you have open in your map
window. In the example above, “Data Layer 2” is the OpenStreetMap data that we want
to edit. “Markers” are the waypoints from the GPS, and “30 Juni 2011.gpx” is the track
from the GPS. Finally, “Field Papers” is the layer created when I added my Field Papers
into JOSM. You can add the Bing imagery layer, which shows satellite imagery, by
clicking <<Imagery>> on the top menu of JOSM and selecting <<Bing Sat>>.● To hide one of these layers, select one of them with your mouse and click the
“Show/Hide” button that looks like this: ● You should see the layer that you selected disappear in the map window. Click
“Show/Hide” again, and it will reappear.
● You can close a layer by selecting it and using the “Delete” button: ● Lastly, it’s important to know that you can only edit the layer that is considered “Active”
by JOSM. If you are unable to edit the map in your map window, it’s probably because
you don’t have the correct layer set as active. Most layers, such as GPS points, Field
Papers, and satellite imagery, can’t be edited. The only layers that can be edited are data
from OpenStreetMap, which are usually called “Data Layer 1”.● To make a layer active, select it in the “Layers” panel, and click on the “Activate” button:
3. Edit
● The next step is to edit the map and add new items. This is not always easy at first, but
with practice you will get better and better. Note that you can select various tools in
JOSM by clicking on their icons, or you can use buttons on the keyboard as shortcuts.
The shortcut keys will be indicated in parentheses below.● If you want to move a point, line, or shape, use the “Select tool” (s). Click on an object
and drag it where it should be. This can be used to correct the location of items that have
been put in the wrong place.
Unit 1: OSM Beginner Level | 60
● Use the “Draw tool” (a) to draw new points, lines, and shapes. Describe these objects by
selecting from the “Presets” menu, as you did in Module 3.
● Remember that your GPS points and your Field Papers don’t automatically go into
OpenStreetMap. You need to add them to the OSM map digitally, using the “draw tool”.
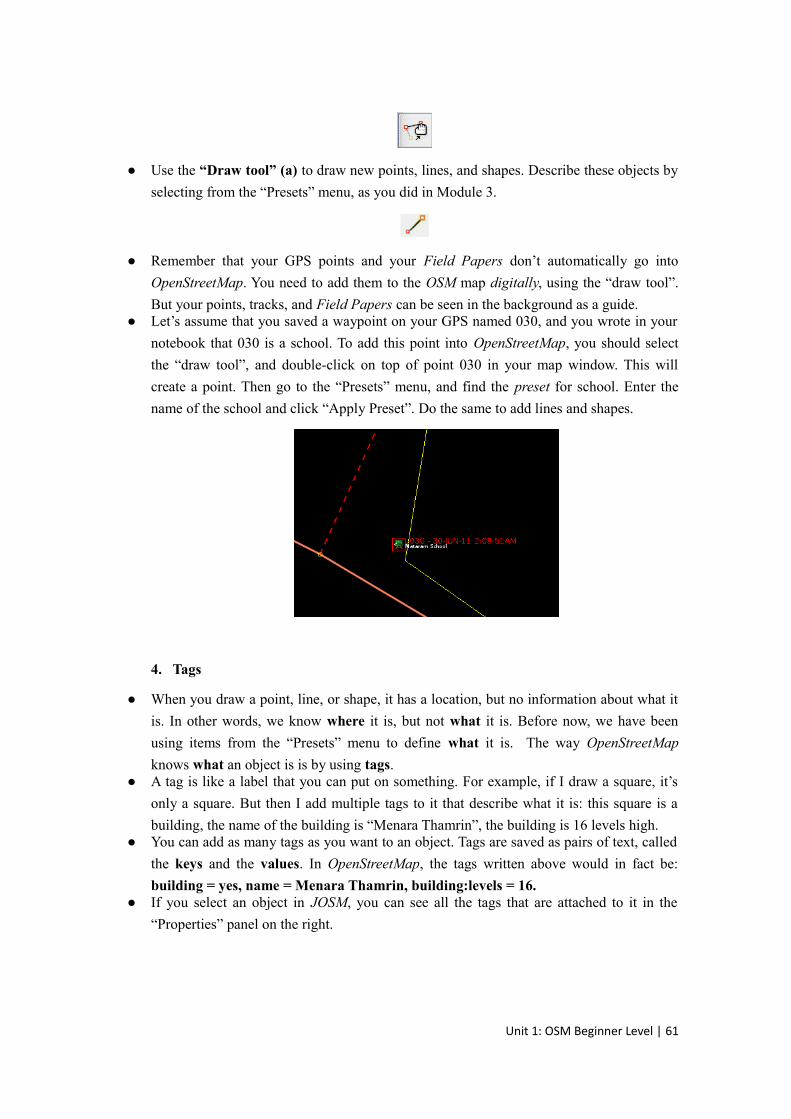
But your points, tracks, and Field Papers can be seen in the background as a guide.● Let’s assume that you saved a waypoint on your GPS named 030, and you wrote in your
notebook that 030 is a school. To add this point into OpenStreetMap, you should select
the “draw tool”, and double-click on top of point 030 in your map window. This will
create a point. Then go to the “Presets” menu, and find the preset for school. Enter the
name of the school and click “Apply Preset”. Do the same to add lines and shapes.
4. Tags
● When you draw a point, line, or shape, it has a location, but no information about what it
is. In other words, we know where it is, but not what it is. Before now, we have been
using items from the “Presets” menu to define what it is. The way OpenStreetMap
knows what an object is is by using tags. ● A tag is like a label that you can put on something. For example, if I draw a square, it’s
only a square. But then I add multiple tags to it that describe what it is: this square is a
building, the name of the building is “Menara Thamrin”, the building is 16 levels high.● You can add as many tags as you want to an object. Tags are saved as pairs of text, called
the keys and the values. In OpenStreetMap, the tags written above would in fact be:
building = yes, name = Menara Thamrin, building:levels = 16.● If you select an object in JOSM, you can see all the tags that are attached to it in the
“Properties” panel on the right.
Unit 1: OSM Beginner Level | 61
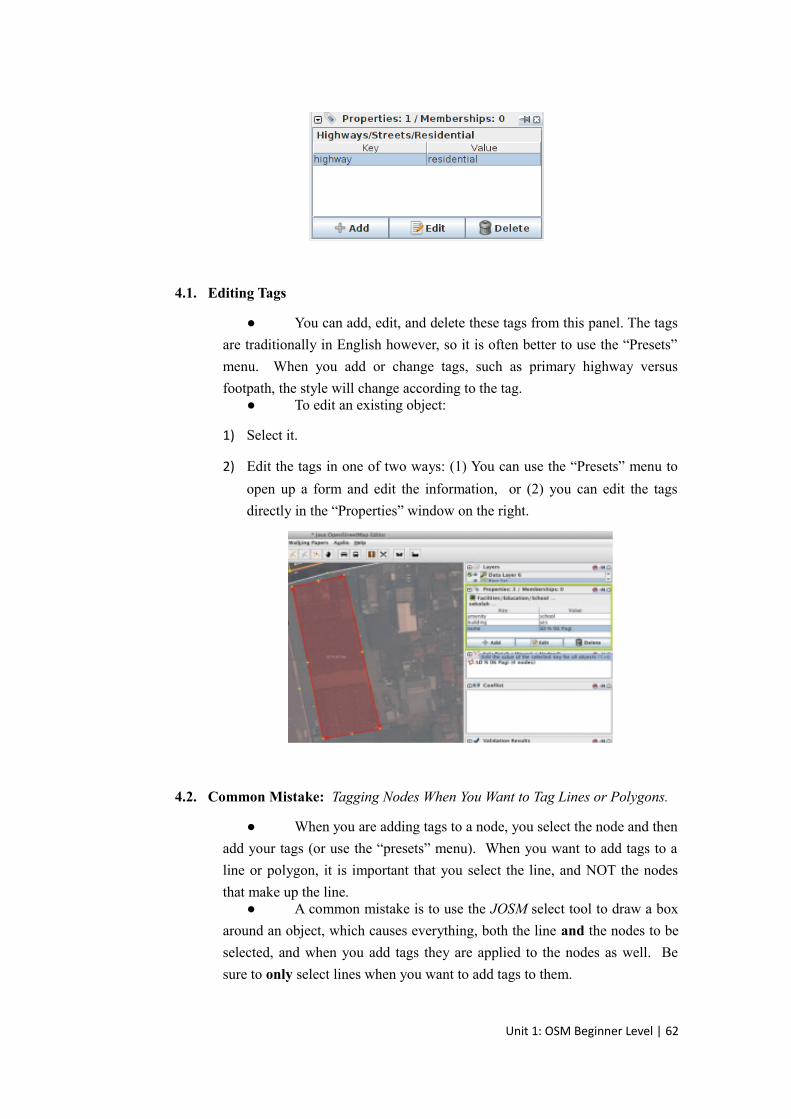
4.1. Editing Tags
● You can add, edit, and delete these tags from this panel. The tags
are traditionally in English however, so it is often better to use the “Presets”
menu. When you add or change tags, such as primary highway versus
footpath, the style will change according to the tag.● To edit an existing object:
1) Select it.
2) Edit the tags in one of two ways: (1) You can use the “Presets” menu to
open up a form and edit the information, or (2) you can edit the tags
directly in the “Properties” window on the right.
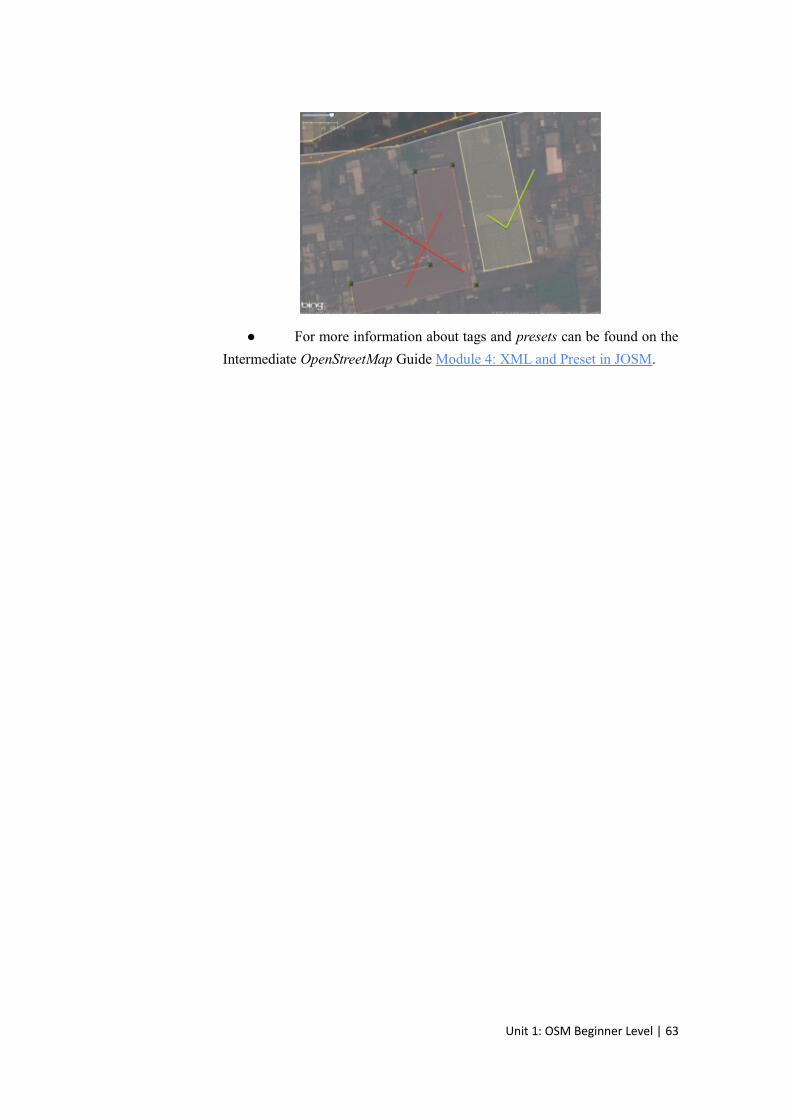
4.2. Common Mistake: Tagging Nodes When You Want to Tag Lines or Polygons.
● When you are adding tags to a node, you select the node and then
add your tags (or use the “presets” menu). When you want to add tags to a
line or polygon, it is important that you select the line, and NOT the nodes
that make up the line. ● A common mistake is to use the JOSM select tool to draw a box
around an object, which causes everything, both the line and the nodes to be
selected, and when you add tags they are applied to the nodes as well. Be
sure to only select lines when you want to add tags to them.
Unit 1: OSM Beginner Level | 62
● For more information about tags and presets can be found on the
Intermediate OpenStreetMap Guide Module 4: XML and Preset in JOSM.
Unit 1: OSM Beginner Level | 63
5. Upload Changes
● After you have made a couple of changes to improve the map, let’s save those changes to
OpenStreetMap. To save the changes, we need to be connected to the internet, because we
are in fact uploading the changes to OpenStreetMap.● Click <<File>> on the top menu, and then click <<Upload Data>>. This will open up the
upload window. You can access this window more simply by clicking on the upload
button, shown here:
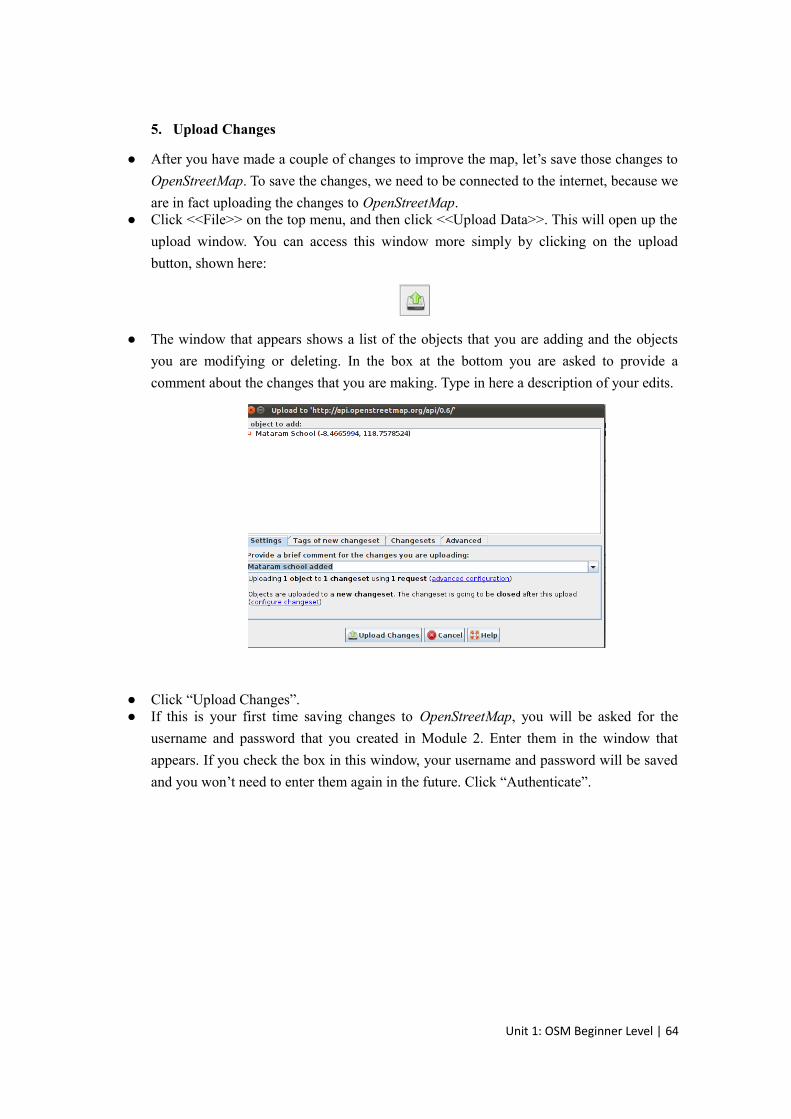
● The window that appears shows a list of the objects that you are adding and the objects
you are modifying or deleting. In the box at the bottom you are asked to provide a
comment about the changes that you are making. Type in here a description of your edits.
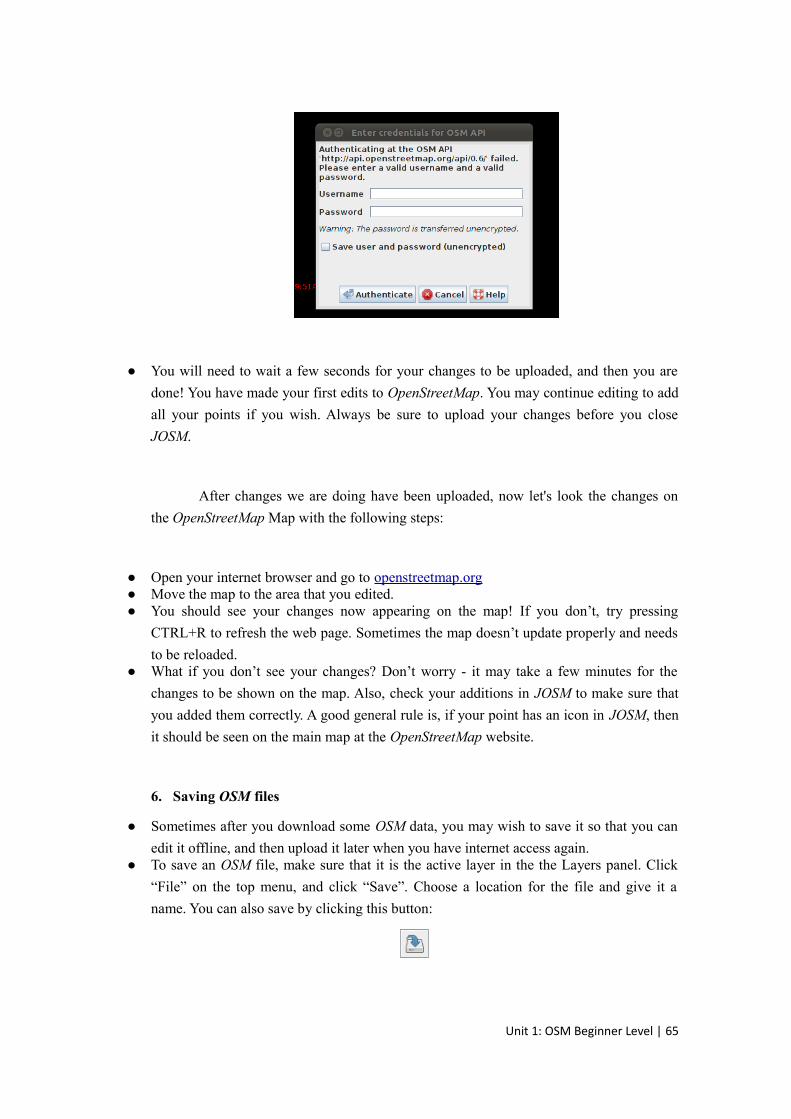
● Click “Upload Changes”.● If this is your first time saving changes to OpenStreetMap, you will be asked for the
username and password that you created in Module 2. Enter them in the window that
appears. If you check the box in this window, your username and password will be saved
and you won’t need to enter them again in the future. Click “Authenticate”.
Unit 1: OSM Beginner Level | 64
● You will need to wait a few seconds for your changes to be uploaded, and then you are
done! You have made your first edits to OpenStreetMap. You may continue editing to add
all your points if you wish. Always be sure to upload your changes before you close
JOSM.
After changes we are doing have been uploaded, now let's look the changes on
the OpenStreetMap Map with the following steps:
● Open your internet browser and go to openstreetmap.org● Move the map to the area that you edited.● You should see your changes now appearing on the map! If you don’t, try pressing
CTRL+R to refresh the web page. Sometimes the map doesn’t update properly and needs
to be reloaded.● What if you don’t see your changes? Don’t worry - it may take a few minutes for the
changes to be shown on the map. Also, check your additions in JOSM to make sure that
you added them correctly. A good general rule is, if your point has an icon in JOSM, then
it should be seen on the main map at the OpenStreetMap website.
6. Saving OSM files
● Sometimes after you download some OSM data, you may wish to save it so that you can
edit it offline, and then upload it later when you have internet access again.● To save an OSM file, make sure that it is the active layer in the the Layers panel. Click
“File” on the top menu, and click “Save”. Choose a location for the file and give it a
name. You can also save by clicking this button:
Unit 1: OSM Beginner Level | 65
● You can now close JOSM and your data will be saved. When you want to open the file
again, simply open JOSM, go to the “File” menu, and click “Open...”
7. Choosing a variety of options and menu by using the keyboard
Sometimes you become dizzy to click again and again to select the various
options and different menu in JOSM. Fortunately, there is a shortcut in JOSM on the
keyboard that allows you to do common things. This is the list of keyboard shortcuts and
their functions are generally used:
● s : Select tool (select objects)
● a : Draw tool (draw objects)
● z : Zoom tool
● Ctrl + > : Zoom out
● Ctrl + < : Zoom in
● p : Split Way
● c : Combine Way
● o : Align in Circle (set the points into a circle)● l : Align in line (set the points into a straight line)● q : Orthogonalize (make into a square shape)
Unit 1: OSM Beginner Level | 66
Module 7
Imagery Offset
Learning Objectives
● Understanding definition of Imagery Offset● Understanding part of imagery (resolution and georeference)● Understanding how to imagery offset occur● Fixing imagery offset
Using aerial imagery is the most widely used approach in making maps with
OpenStreetMap. Mappers typically use Bing satellite as a background layer while
making their maps, or imagery from another provider. We have already seen this in
action. In this module we will learn a little bit more about aerial imagery, and we will
learn how to solve the one important problem of using aerial photographs - imagery
offset.
1. Definition Imagery Offset
At first, the satellite image is a combination of photographs and satellite
coordinates. Special software is used to calculate each side of the photographs. In general,
satellite images have high resolution enables more accurate calculation. But there are
thousands of photographs and the surface of the earth is not a perfect circle ellipsoid.
Satellite imagery provider can not verify the accuracy of each photo, so the coordinates
can be shifted from the actual position. That is why satellite imagery can be shifted 1-2
meters and sometimes up to hundreds of meters. In the mountainous or hilly areas,
satellite imagery often has a non-linear distortion. Shift or distortion is called imagery
offset / shift satellite imagery.
2. Part of Imagery
Unit 1: OSM Beginner Level | 67
Aerial imagery is the term that we use to describe photographs that are taken
from the sky. These can be taken from airplanes, helicopters, or even kites and balloons,
but the most common source of imagery comes from satellites orbiting the Earth.
In the module on GPS we learned about the dozens of satellites orbiting Earth
which allow our GPS receivers to identify our latitude and longitude. In addition to these
GPS satellites, there are also satellites which take photos of the earth. These photos are
then manipulated so that they can be used in GIS (mapping) software. Bing Aerial
Imagery is made up of satellite photos.
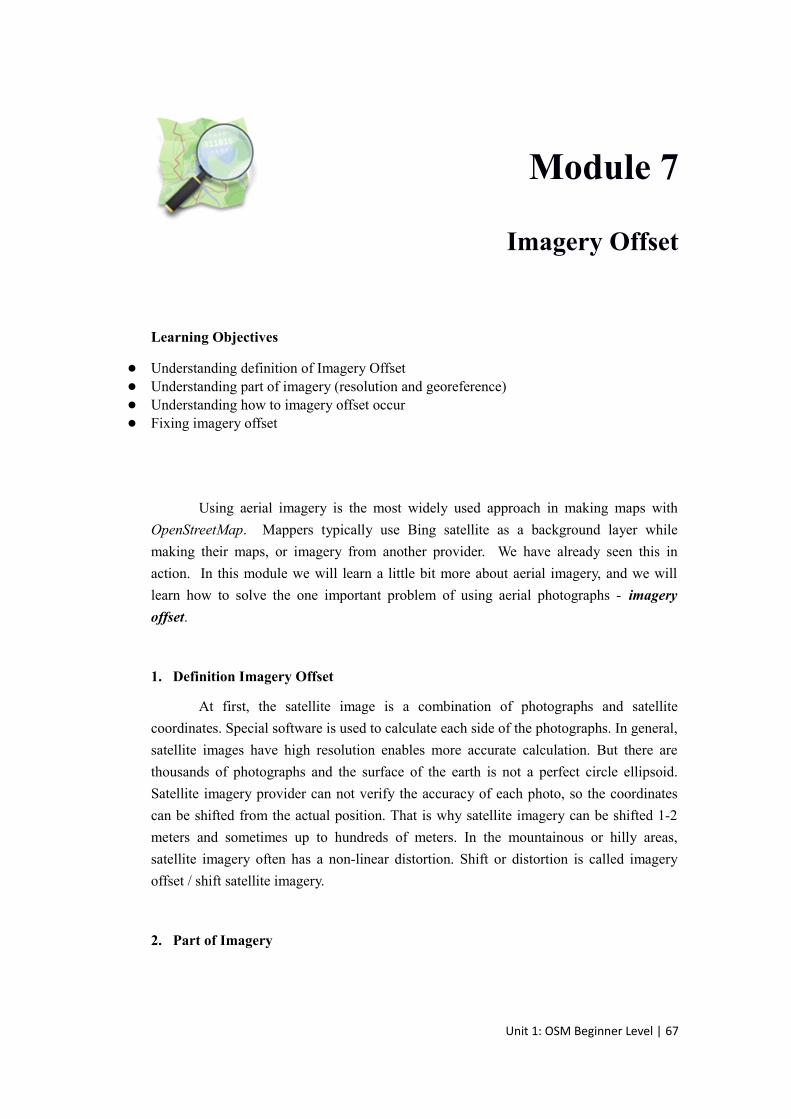
2.1. Resolution
All digital photographs are made up of pixels. If you zoom in very close on a
photograph, you will notice the the image starts to get blurry, and eventually you’ll
see that an image is made up of thousands of little squares that are each a different
color. This is true whether the photograph is taken with a handheld camera, a mobile
phone, or a satellite orbiting Earth.
Resolution refers to the number of pixels wide by the number of pixels high
that an image is. More pixels means higher resolution, which means that you are able
to see greater detail in the photograph. Resolution in handheld cameras is often
measured in megapixels. The more megapixels your camera is able to record, the
higher the resolution of your photos.
Aerial imagery is the same, except that we usually talk about resolution
differently. Measurement is important with aerial photographs - hence, a pixel
represents a certain distance on the ground. We usually describe imagery as
something like “two meter resolution imagery,” which means that one pixel is
equivalent to two meters on the ground. One meter resolution imagery would have a
higher resolution than this, and 50cm resolution would be higher still. This is
Unit 1: OSM Beginner Level | 68
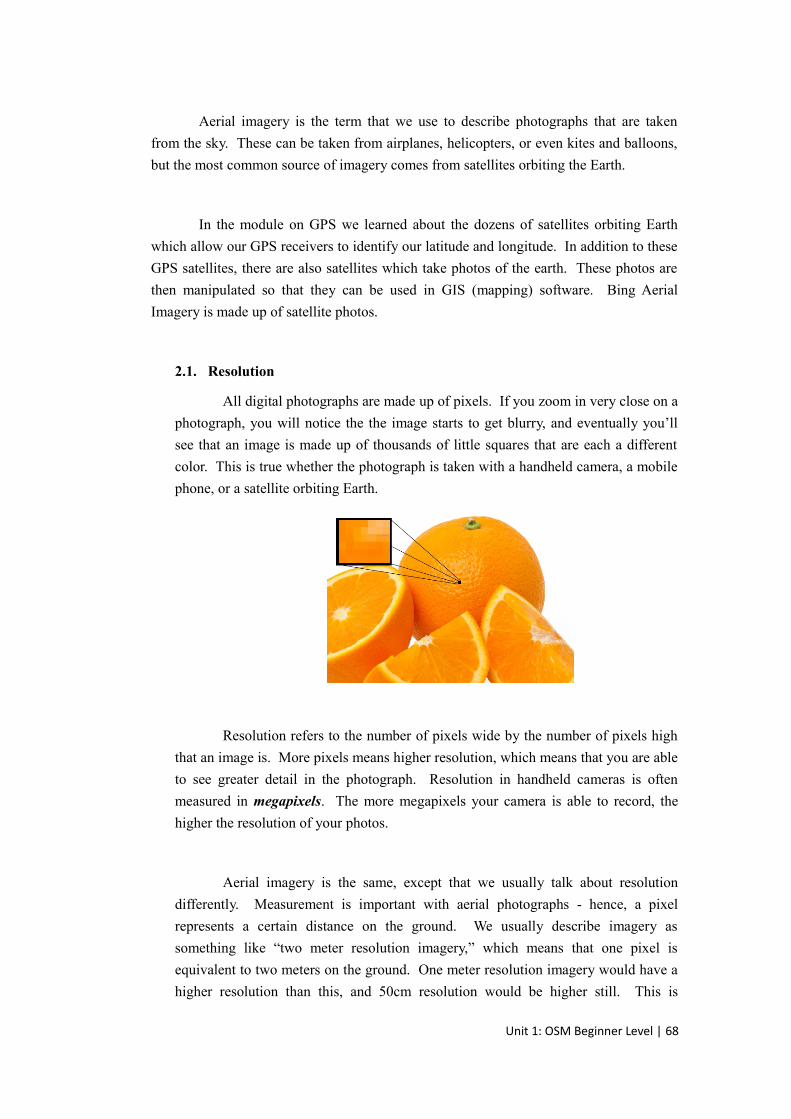
generally the range of imagery that is provided by Bing, though it varies between
locations, and in many places it is worse than two meters, at which point it becomes
difficult to identify objects in the image.
The higher the resolution of an aerial image, the easier it is to use in making
maps.
2.2. Georeferencing
Every aerial image is georeferenced, meaning that it is manipulated so that it
can be shown in its correct location on the Earth. Georeferencing is a relatively
complex process, because images are flat and the Earth is round, and the images need
to be positioned and stretched so that the pixels are accurately positioned on the
planet.
In unit four we will learn how to georeference an image ourselves, but for
now that’s not necessary. We can happily use Bing imagery to help add to
OpenStreetMap, so long as we understand a little bit about the imagery we are using,
and so long as we are aware of one common pitfall - imagery offset.
3. Imagery Offset
Imagery providers usually do a pretty good job of georeferencing their imagery,
but occasionally the images can be out of position. This is particularly true in hilly or
mountainous areas, where it can be difficult to stretch a flat image over an area of the
Earth with many contours. When you load imagery in JOSM, it can sometimes be ten
meters or more from its true position. This is called imagery offset.
Unit 1: OSM Beginner Level | 69
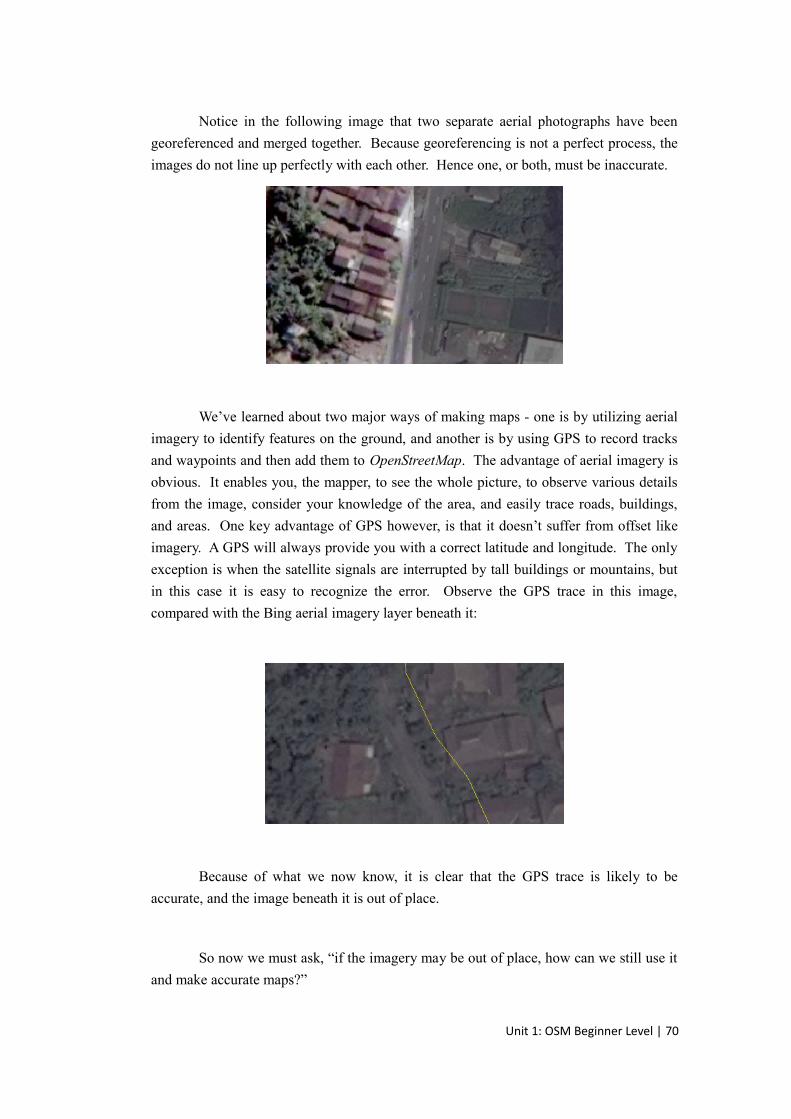
Notice in the following image that two separate aerial photographs have been
georeferenced and merged together. Because georeferencing is not a perfect process, the
images do not line up perfectly with each other. Hence one, or both, must be inaccurate.
We’ve learned about two major ways of making maps - one is by utilizing aerial
imagery to identify features on the ground, and another is by using GPS to record tracks
and waypoints and then add them to OpenStreetMap. The advantage of aerial imagery is
obvious. It enables you, the mapper, to see the whole picture, to observe various details
from the image, consider your knowledge of the area, and easily trace roads, buildings,
and areas. One key advantage of GPS however, is that it doesn’t suffer from offset like
imagery. A GPS will always provide you with a correct latitude and longitude. The only
exception is when the satellite signals are interrupted by tall buildings or mountains, but
in this case it is easy to recognize the error. Observe the GPS trace in this image,
compared with the Bing aerial imagery layer beneath it:
Because of what we now know, it is clear that the GPS trace is likely to be
accurate, and the image beneath it is out of place.
So now we must ask, “if the imagery may be out of place, how can we still use it
and make accurate maps?”
Unit 1: OSM Beginner Level | 70
4. Correcting Imagery Offset
The answer to the preceding question is that we can move the imagery so that it
aligns with things that we know are in the correct location, such as GPS tracks. It is easy
to correct imagery offset in JOSM.
The best references for adjusting imagery are GPS tracks that follow roads. And
the more GPS tracks that you have to reference, the more accurate you will be able to
align your imagery. Since OpenStreetMap users often upload their GPS tracks to the
OSM database, we can download them and use them to align our imagery.
● Click on the download button.
● Check the box next to “Raw GPS Data” near the top of the Download window. Select
your area and click “Download.”
● This will download an additional layer to JOSM containing GPS tracks. Depending on
how many tracks have been uploaded by OSM users, you may see few tracks (or even no
tracks):
● Or, you may see many tracks:
Unit 1: OSM Beginner Level | 71
● To adjust an imagery layer, click on the “Adjust imagery offset” button at the top of
JOSM.
● Ignoring the box that pops up, use your mouse to drag the imagery layer so that it aligns
correctly with the GPS tracks. The GPS tracks should line up with the roads on the
imagery as closely as possible. You will see the offset numbers in the box change.
● If you like, you can save these offset settings by entering a bookmark name and then
clicking OK. You can then automatically apply the same settings later by going to
Imagery ‣ Imagery offset and clicking on your bookmark.● If you do not want to save the offset, simply click OK without entering a bookmark name.
What if there are no GPS tracks on OpenStreetMap, and you don’t have a GPS?
Without GPS tracks, it is difficult to align imagery. If it is a relatively empty area (not
much mapping done), you might choose to simply use the imagery as it is and correct the
data later. It’s better to have map an area 20 or 30 meters offset than to not map at all.
Unit 1: OSM Beginner Level | 72
If you can positively identify the latitude and longitude of one object on the
ground, you can ensure the imagery is correctly placed by following these steps:
● First, identify the object whose position you know on the imagery.● Click on the latitude and longitude in the bottom left corner of JOSM.
● In the dialog that opens, enter the latitude and longitude of the place that you know, and
enter a small number for Zoom, about five or ten.
● This will zoom and center the map to your longitude and latitude. Now you can move the
imagery as you did previously so that the feature you know is centered at the correct
position.
If, on the other hand, the area has already been extensively mapped, then
hopefully the previous mappers have drawn objects in their correct locations. In this
case, you can align the imagery to the OSM map, but beware! Other mappers may not be
aware of imagery offset, and they may have made mistakes when they mapped.
4.1. The Imagery Offset Database
Now you know how to watch out for and correct imagery offset, but there is
one major problem with this approach that we have overlooked thus far. If every
OpenStreetMap user adjusts the imagery differently, everybody will be mapping with
slightly different backgrounds.
Imagine that you are mapping a small town, and you realize that Bing
imagery is offset by 15 meters to the north. So you adjust the imagery and then use it
Unit 1: OSM Beginner Level | 73
to map the whole town accurately. But then somebody else wants to add something
to the map, so they download the data and load Bing imagery, but they don’t know
about the imagery offset you discovered! They will think that something is wrong
and all of the objects in town are misplaced by 15 meters, and they will start to move
them, which is not correct! This can be disastrous for the town’s map data.
For this reason it is important that all users are aware of imagery offset, and
should always check for it before mapping an area. To help with this problem, some
smart people created a plugin that allows users to save offset information in a
database and share it with others. Let’s see how this works:
● Open the Preferences menu in JOSM, and click on the Plugins
tab.● Find the plugin named “imagery_offset_db” and check the box
next to it.
● Click OK. You will need to restart JOSM to finish the plugin
installation.
In the same way that you are able to save offsets as bookmarks, this plugin
allows you to save offsets to a central database, and to access the offsets that other
users have created. Hence, if one mapper creates an imagery offset in an area, other
users can use the exact same offset to map with.
When using aerial imagery layers, you should ALWAYS check for existing
offsets, and when you create your own offset, you should ALWAYS save it to this
database.
Unit 1: OSM Beginner Level | 74
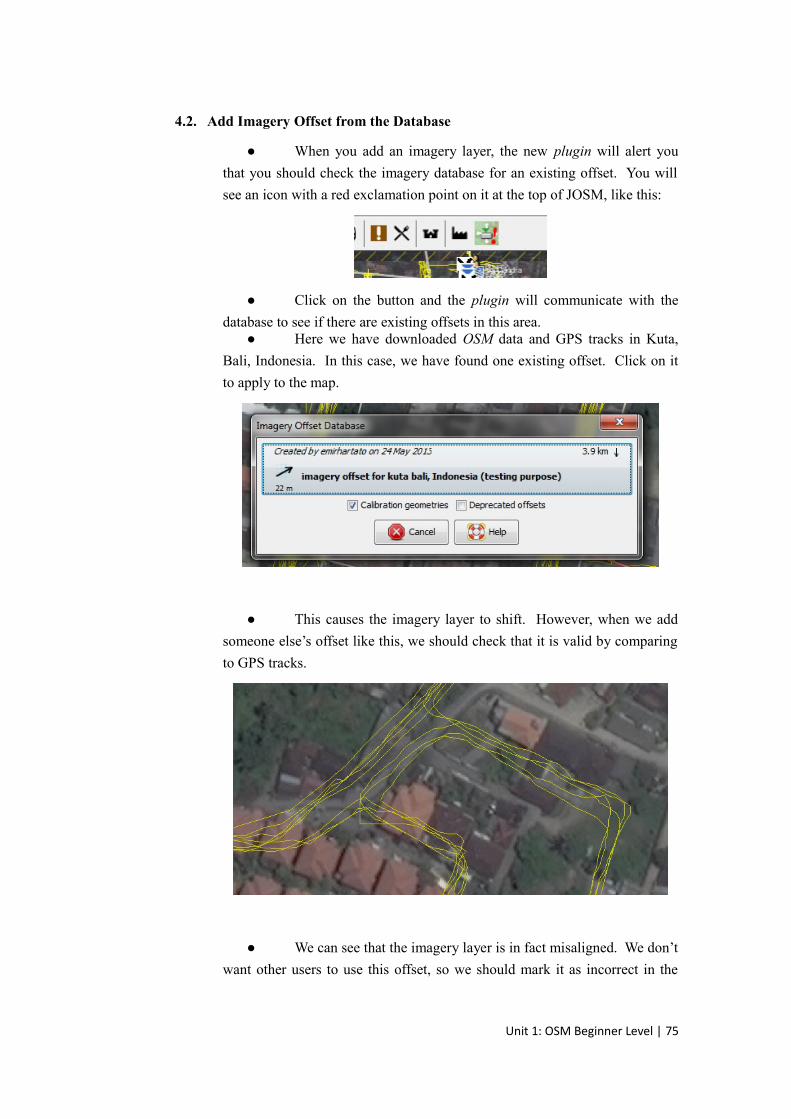
4.2. Add Imagery Offset from the Database
● When you add an imagery layer, the new plugin will alert you
that you should check the imagery database for an existing offset. You will
see an icon with a red exclamation point on it at the top of JOSM, like this:
● Click on the button and the plugin will communicate with the
database to see if there are existing offsets in this area.● Here we have downloaded OSM data and GPS tracks in Kuta,
Bali, Indonesia. In this case, we have found one existing offset. Click on it
to apply to the map.
● This causes the imagery layer to shift. However, when we add
someone else’s offset like this, we should check that it is valid by comparing
to GPS tracks.
● We can see that the imagery layer is in fact misaligned. We don’t
want other users to use this offset, so we should mark it as incorrect in the
Unit 1: OSM Beginner Level | 75
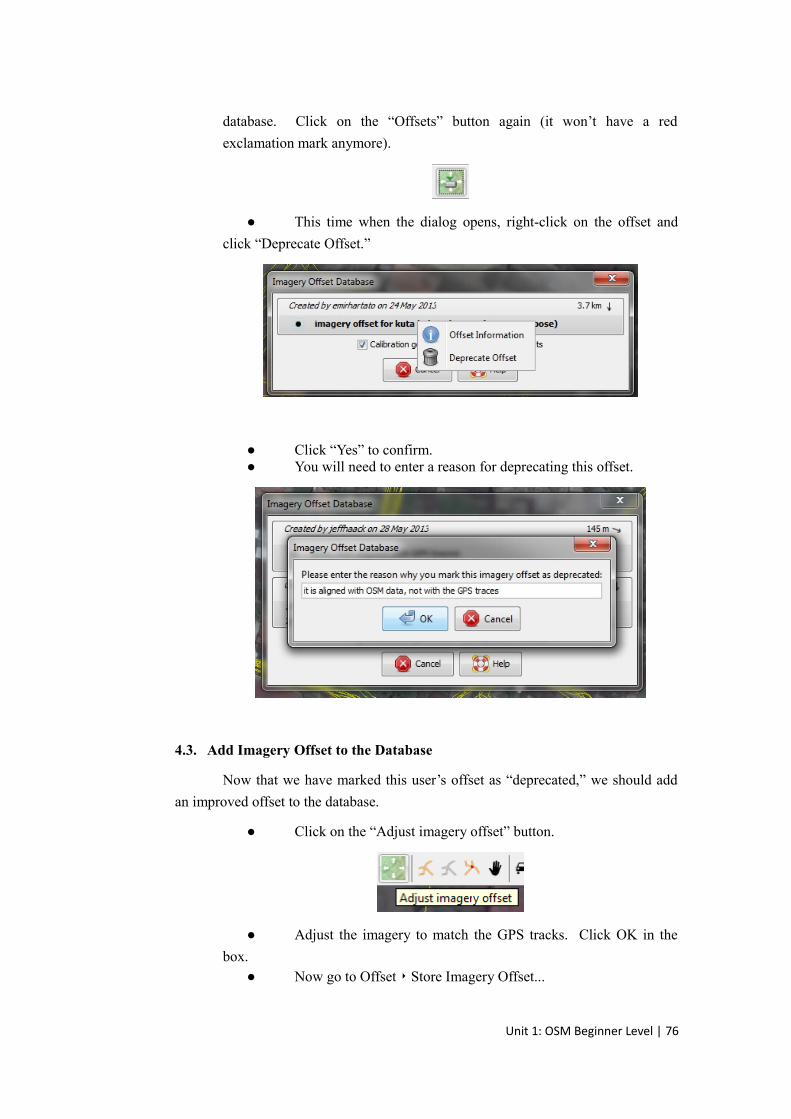
database. Click on the “Offsets” button again (it won’t have a red
exclamation mark anymore).
● This time when the dialog opens, right-click on the offset and
click “Deprecate Offset.”
● Click “Yes” to confirm.● You will need to enter a reason for deprecating this offset.
4.3. Add Imagery Offset to the Database
Now that we have marked this user’s offset as “deprecated,” we should add
an improved offset to the database.
● Click on the “Adjust imagery offset” button.
● Adjust the imagery to match the GPS tracks. Click OK in the
box.● Now go to Offset ‣ Store Imagery Offset...
Unit 1: OSM Beginner Level | 76
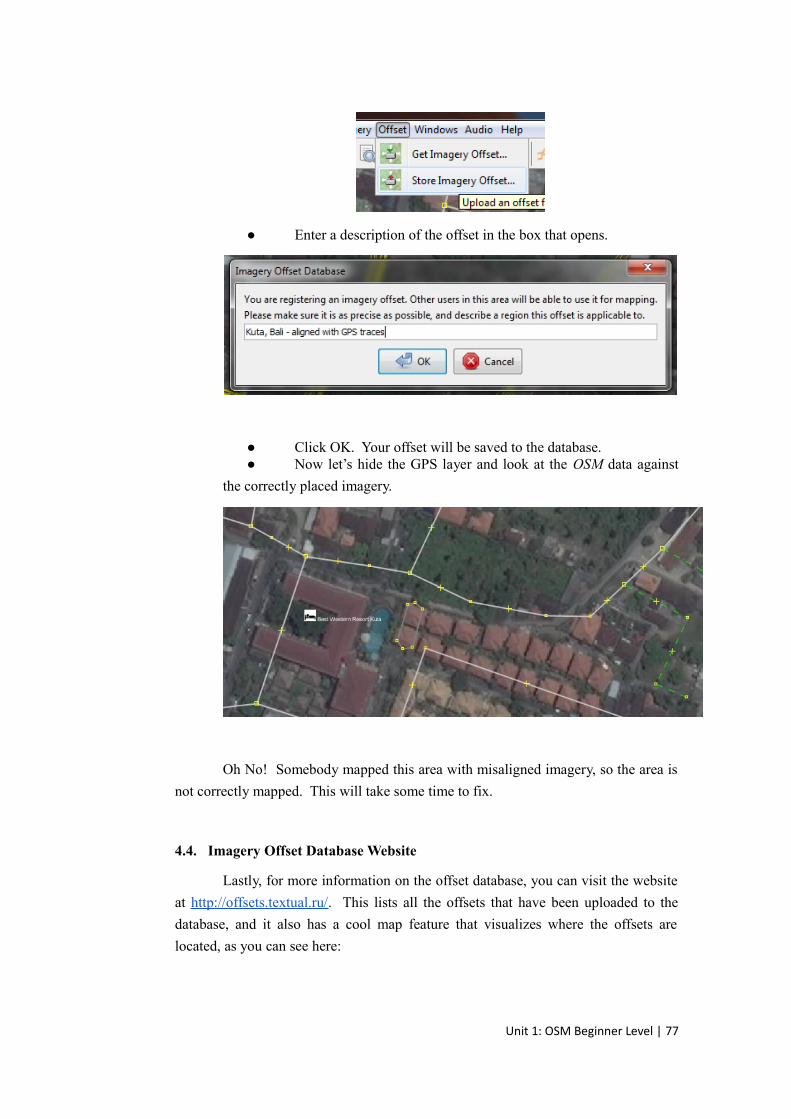
● Enter a description of the offset in the box that opens.
● Click OK. Your offset will be saved to the database.● Now let’s hide the GPS layer and look at the OSM data against
the correctly placed imagery.
Oh No! Somebody mapped this area with misaligned imagery, so the area is
not correctly mapped. This will take some time to fix.
4.4. Imagery Offset Database Website
Lastly, for more information on the offset database, you can visit the website
at http://offsets.textual.ru/. This lists all the offsets that have been uploaded to the
database, and it also has a cool map feature that visualizes where the offsets are
located, as you can see here:
Unit 1: OSM Beginner Level | 77
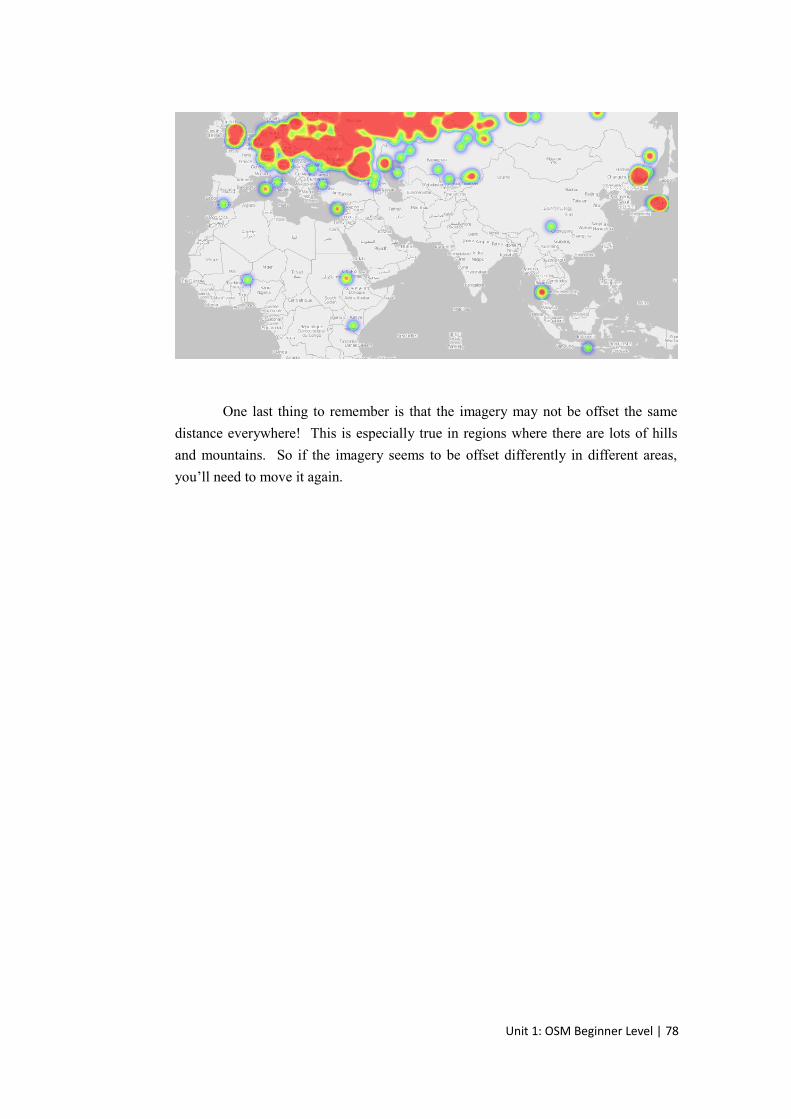
One last thing to remember is that the imagery may not be offset the same
distance everywhere! This is especially true in regions where there are lots of hills
and mountains. So if the imagery seems to be offset differently in different areas,
you’ll need to move it again.
Unit 1: OSM Beginner Level | 78
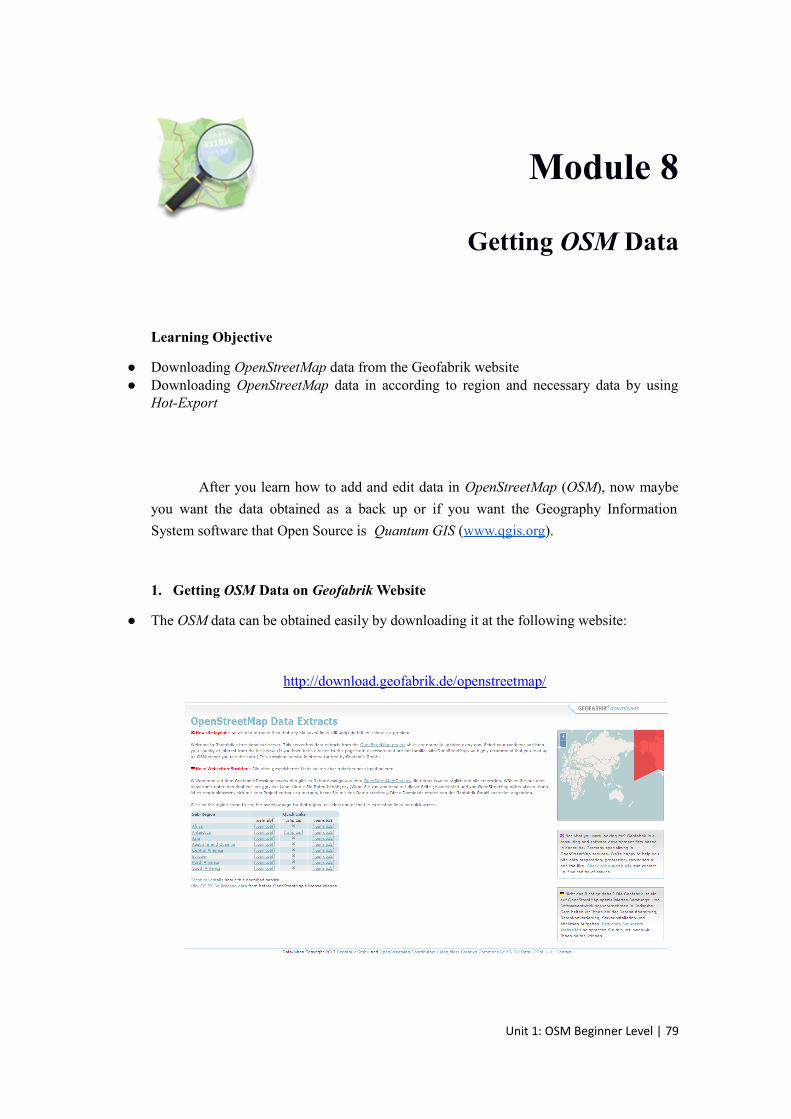
Module 8
Getting OSM Data
Learning Objective
● Downloading OpenStreetMap data from the Geofabrik website ● Downloading OpenStreetMap data in according to region and necessary data by using
Hot-Export
After you learn how to add and edit data in OpenStreetMap (OSM), now maybe
you want the data obtained as a back up or if you want the Geography Information
System software that Open Source is Quantum GIS (www.qgis.org).
1. Getting OSM Data on Geofabrik Website
● The OSM data can be obtained easily by downloading it at the following website:
http://download.geofabrik.de/openstreetmap/
Unit 1: OSM Beginner Level | 79
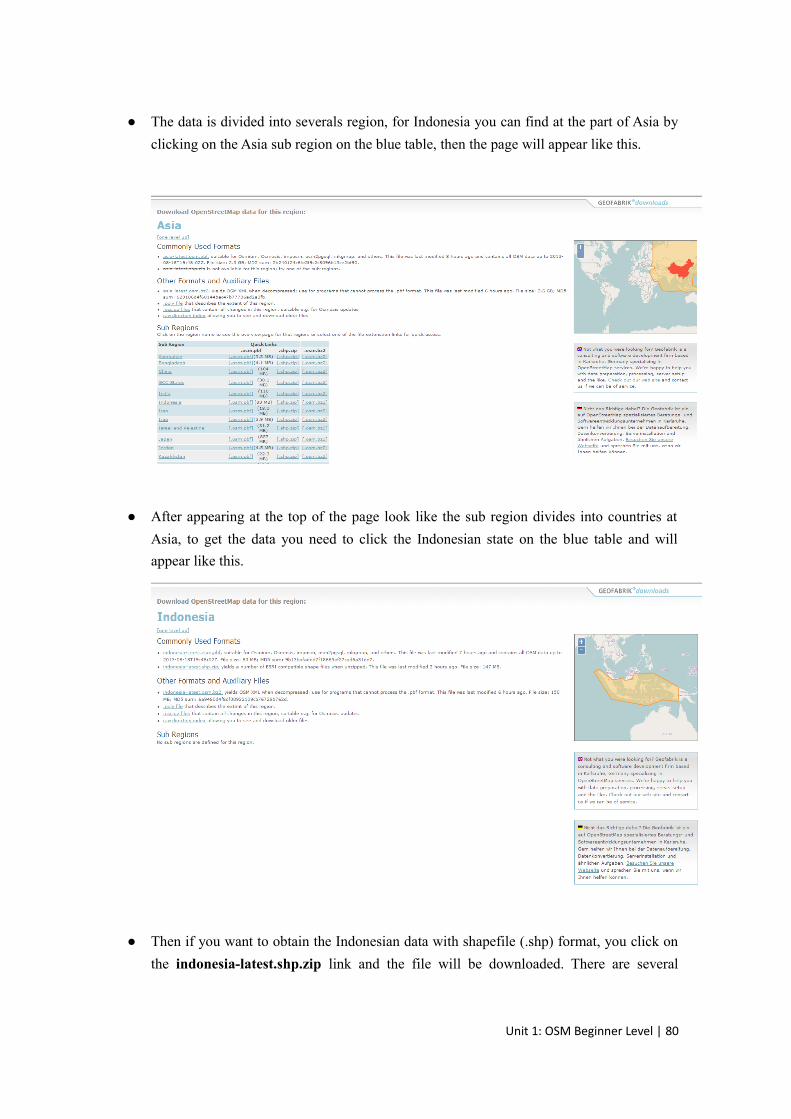
● The data is divided into severals region, for Indonesia you can find at the part of Asia by
clicking on the Asia sub region on the blue table, then the page will appear like this.
● After appearing at the top of the page look like the sub region divides into countries at
Asia, to get the data you need to click the Indonesian state on the blue table and will
appear like this.
● Then if you want to obtain the Indonesian data with shapefile (.shp) format, you click on
the indonesia-latest.shp.zip link and the file will be downloaded. There are several
Unit 1: OSM Beginner Level | 80
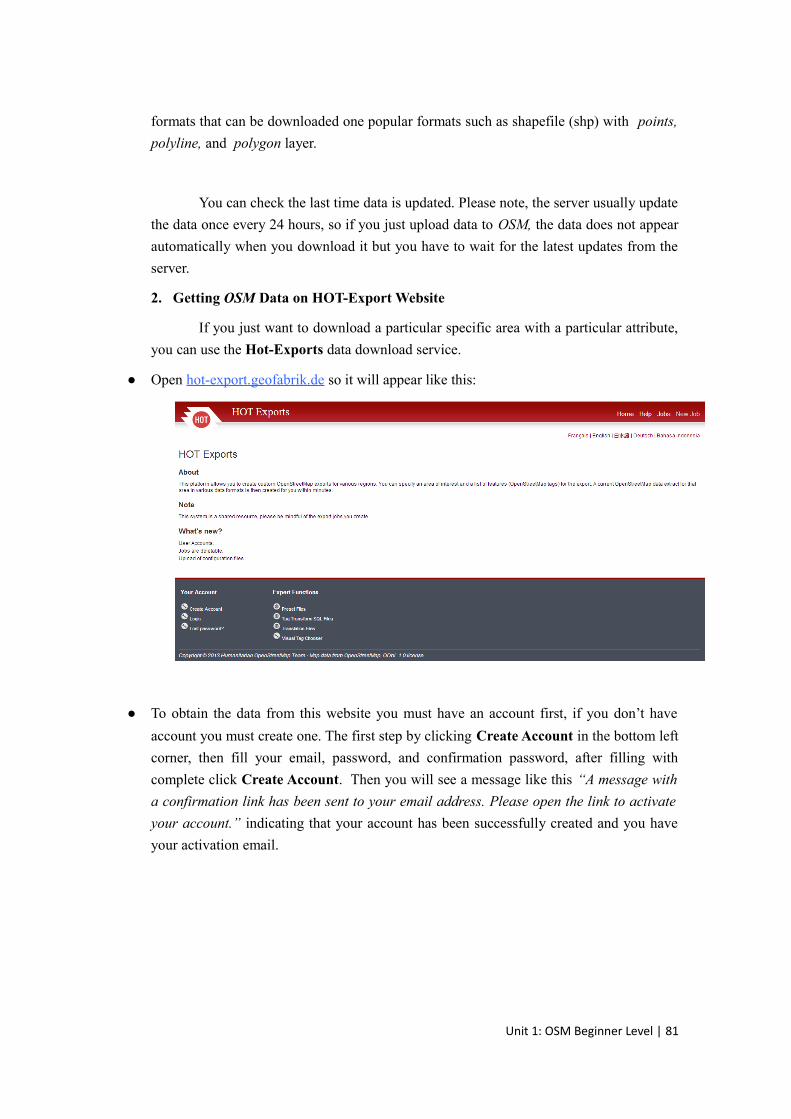
formats that can be downloaded one popular formats such as shapefile (shp) with points,
polyline, and polygon layer.
You can check the last time data is updated. Please note, the server usually update
the data once every 24 hours, so if you just upload data to OSM, the data does not appear
automatically when you download it but you have to wait for the latest updates from the
server.
2. Getting OSM Data on HOT-Export Website
If you just want to download a particular specific area with a particular attribute,
you can use the Hot-Exports data download service.
● Open hot-export.geofabrik.de so it will appear like this:
● To obtain the data from this website you must have an account first, if you don’t have
account you must create one. The first step by clicking Create Account in the bottom left
corner, then fill your email, password, and confirmation password, after filling with
complete click Create Account. Then you will see a message like this “A message with
a confirmation link has been sent to your email address. Please open the link to activate
your account.” indicating that your account has been successfully created and you have
your activation email.
Unit 1: OSM Beginner Level | 81
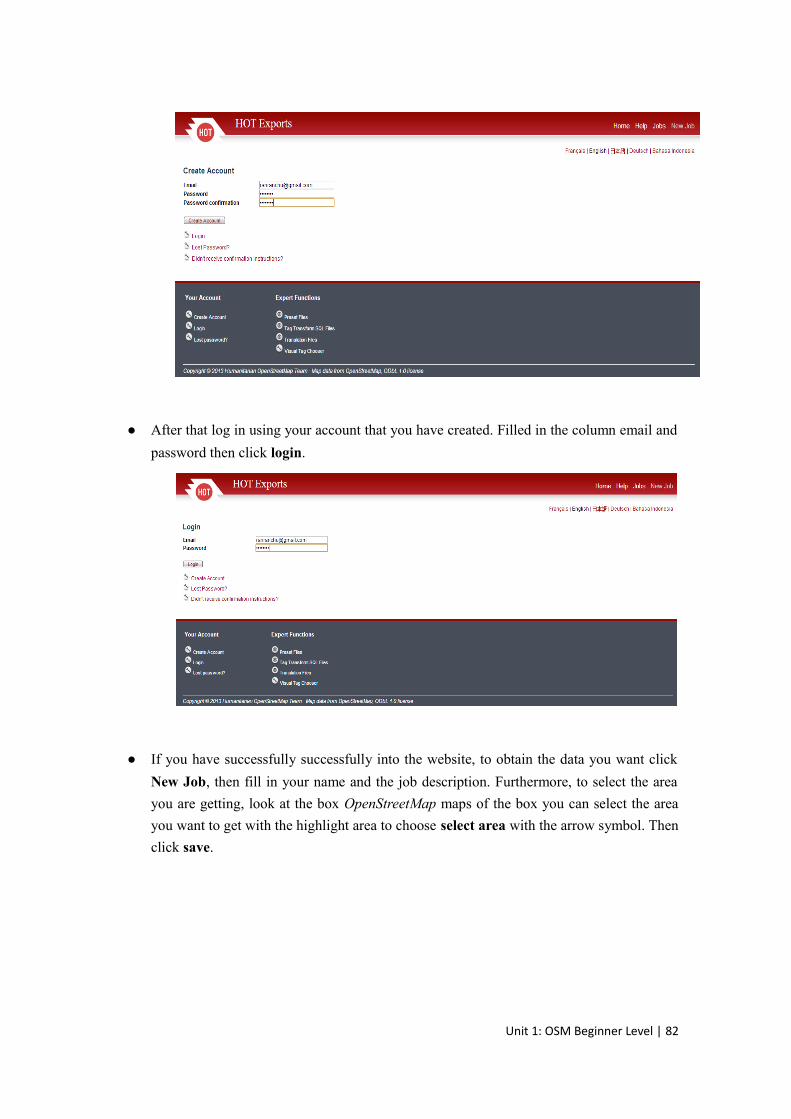
● After that log in using your account that you have created. Filled in the column email and
password then click login.
● If you have successfully successfully into the website, to obtain the data you want click
New Job, then fill in your name and the job description. Furthermore, to select the area
you are getting, look at the box OpenStreetMap maps of the box you can select the area
you want to get with the highlight area to choose select area with the arrow symbol. Then
click save.
Unit 1: OSM Beginner Level | 82
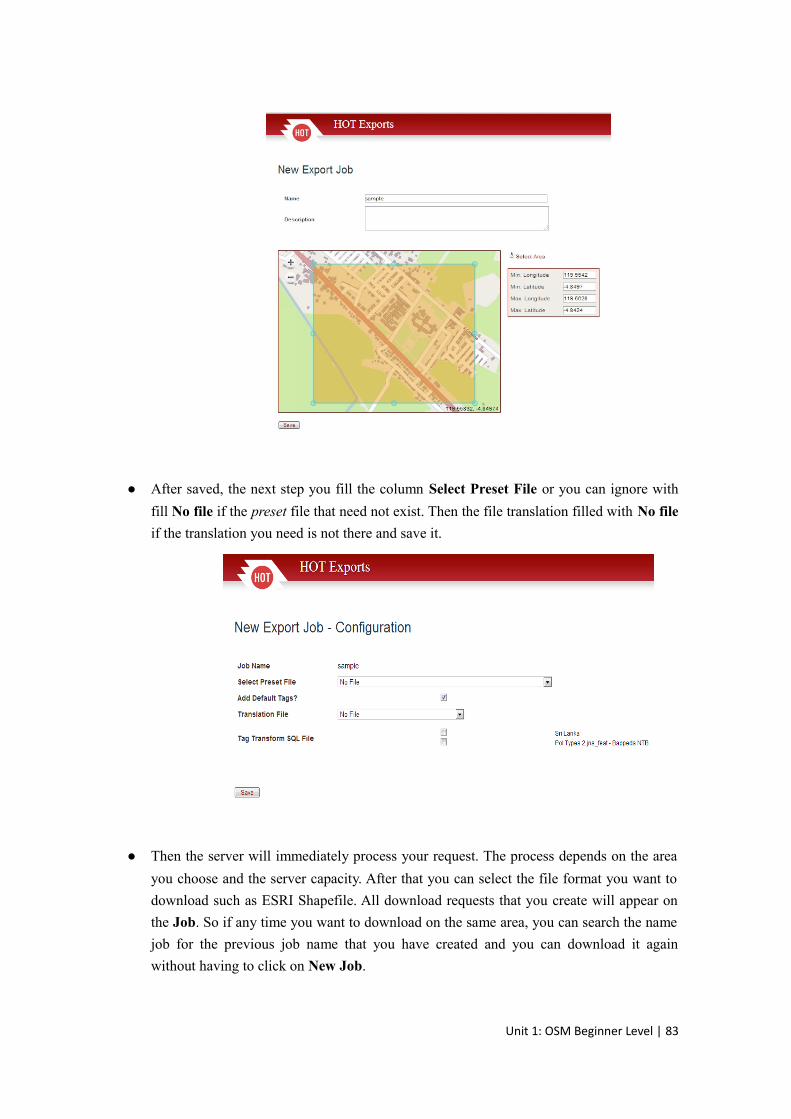
● After saved, the next step you fill the column Select Preset File or you can ignore with
fill No file if the preset file that need not exist. Then the file translation filled with No file
if the translation you need is not there and save it.
● Then the server will immediately process your request. The process depends on the area
you choose and the server capacity. After that you can select the file format you want to
download such as ESRI Shapefile. All download requests that you create will appear on
the Job. So if any time you want to download on the same area, you can search the name
job for the previous job name that you have created and you can download it again
without having to click on New Job.
Unit 1: OSM Beginner Level | 83
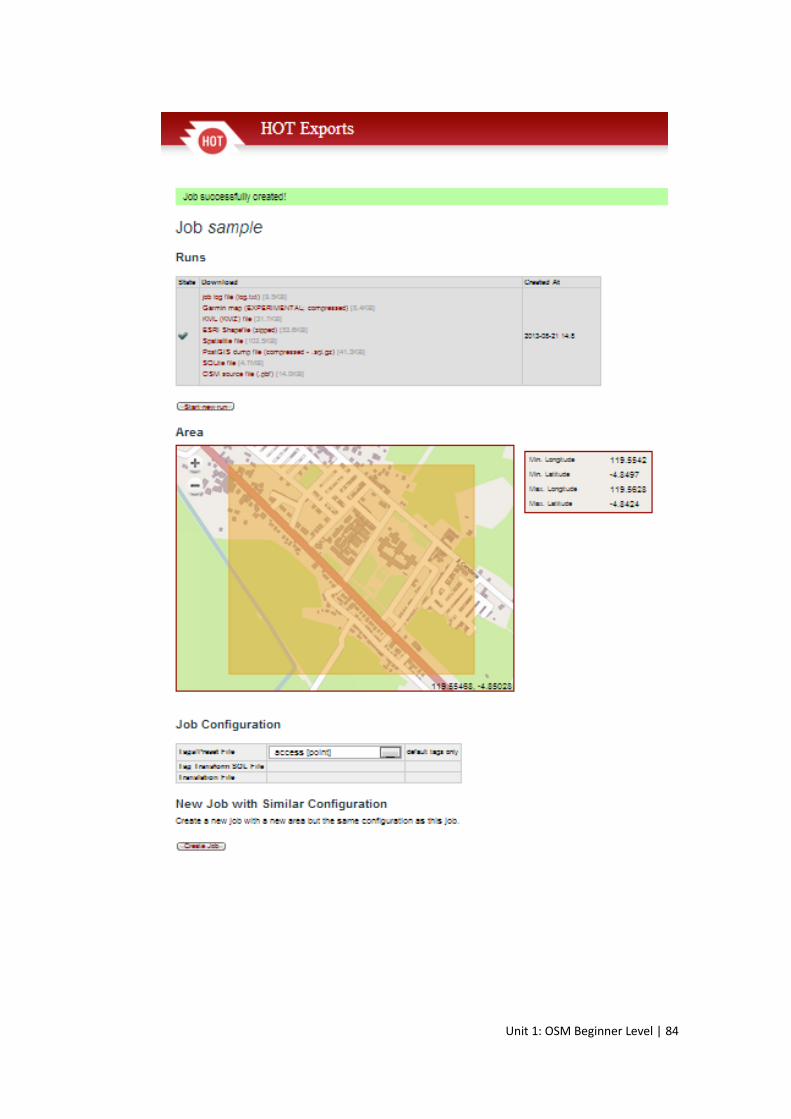
Unit 1: OSM Beginner Level | 84