Embed Size (px)
Citation preview

Understanding your inhibitions: modulation ofbrain cortical metabolism by GABAB receptors
Fatima A Nasrallah1, Julian L Griffin2, Vladimir J Balcar3 and Caroline Rae1,4
1Prince of Wales Medical Research Institute, Randwick, New South Wales, Australia; 2Department ofBiochemistry, The University of Cambridge, Cambridge, UK; 3Institute for Biomedical Research and Schoolof Medical Sciences, The University of Sydney, Sydney, New South Wales, Australia; 4School of Chemistry,The University of New South Wales, Sydney, New South Wales, Australia
Although the impact of neuronal excitation on the functional activity of brain is well understood, thenature of functional responses to inhibitory modulation is far from clear. In this work, weinvestigated the effects of modulation of the metabotropic GABAB receptor on brain metabolismusing a targeted neuropharmacological, 1H/13C nuclear magnetic resonance spectroscopy, andmetabolomic approach. While agonists at GABAB receptors (Baclofen and SKF 97541) generallydecreased metabolic activity, mild agonist action could also stimulate metabolism. Less potentantagonists (CGP 35348, Phaclofen) significantly decreased metabolic activity, while more potentantagonists (CGP 52432 and SCH 50911) had opposite, stimulatory, effects. Examination of the databy principal components analysis showed clear divisions of the effects into excitatory and inhibitorycomponents. GABAergic modulation can, therefore, have stimulatory, inhibitory, or even neutral neteffects on metabolic activity in brain tissue. This is consistent with GABAergic activity being contextdependent, and this conclusion should be taken into account when evaluating functional imagingdata involving modulation of neuronal inhibition.Journal of Cerebral Blood Flow & Metabolism (2007) 27, 1510–1520; doi:10.1038/sj.jcbfm.9600453; published online7 February 2007
Keywords: g-Aminobutyric acid; 13C NMR spectroscopy; functional brain imaging; inhibitory activity; metabolomics;principal components analysis
Introduction
The major inhibitory neurotransmitter in the brain,g-aminobutyric acid (GABA) mediates its effects viatwo major receptor types; a subset of ionotropicreceptors known as GABAA receptors (includes theionotropic r subunit-containing GABAC receptors)and the metabotropic GABAB receptor. Comparedwith GABAA receptors (Barnard et al, 1998; Rudolphet al, 2001), the subunit heterogeneity and pharma-cology of GABAB receptors is relatively simple.There are two identified subunits, GABAB1 andGABAB2, and the receptor is an obligate heterodimerwith the GABAB1 subunit responsible for GABAbinding while the GABAB2 subunit is critical forinteracting with the G-protein coupled secondmessenger cascade (Bettler et al, 2004). While a
number of splice variants have been identified, it isnot yet clear whether any of these are active in vivoapart from the GABAB1a and GABAB1b variants(Bowery et al, 2002). The receptor is found widelydistributed throughout the brain (Charles et al, 2003;Fritschy et al, 1999) at both pre- and postsynapticlocations (Deisz et al, 1997). The GABAB1a andGABAB1b variants have been associated with pre-and postsynaptic locations respectively (Billintonet al, 1999; Perez-Garci et al, 2006) and the GABAB1a
isoform with presynaptic autoreceptors inhibitingglutamate release, while GABAB1b in the hippocam-pus mainly mediates postsynaptic inhibition (Perez-Garci et al, 2006; Vigot et al, 2006; for a review seeBettler et al, 2004). Additionally, GABAB receptorsare located extrasynaptically (Pham et al, 1998).Blockage of presynaptic GABAB receptors has beenreported to require five- to 10-fold higher concentra-tions of antagonists than postsynaptic GABAB
receptors (Pozza et al, 1999), but currently no trulypharmacologically distinct populations of receptorshave been identified.
At present, the impact of inhibitory activity onneuronal activity and hence brain energy demandsand metabolism is an open subject. The relationship
Received 31 October 2006; revised 13 December 2006; accepted18 December 2006; published online 7 February 2007
Correspondence: Dr C Rae, Prince of Wales Medical ResearchInstitute, Barker Street, Randwick, New South Wales 2031,Australia. E-mail: [email protected]
This work was supported by the Australian Research Council
(DP0557664) and NewSouth Global, UNSW.
Journal of Cerebral Blood Flow & Metabolism (2007) 27, 1510–1520& 2007 ISCBFM All rights reserved 0271-678X/07 $30.00
www.jcbfm.com

of excitatory activity to metabolism is now reason-ably well described (Shmuel et al, 2006; Sibson et al,1998). However, almost any changes in neuronalactivity require increased ionic conductance result-ing in greater passive movements of ions across themembranes that have to be compensated by in-creased energy-dependent active transport. There-fore, both increased excitatory or inhibitory activitycould manifest as increased signal in fMRI orpositron emission tomography (Ackermann et al,1984) (but there are alternative opinions; Lauritzen,2005).
The results, to date, examining the effect ofinhibitory input have been somewhat contradictory.g-Aminobutyric acid uptake in astrocytes was foundnot to be linked to significant energy demand, and itwas therefore concluded that GABA-ergic activity isunlikely to contribute to brain imaging signals basedon 2-deoxyglucose (Chatton et al, 2003). This is incontrast to earlier reports, which showed varying2-deoxyglucose uptake to various GABA ligands,including muscimol, bicuculline, and THIP(Palacios et al, 1982; Peyron et al, 1994; Roland andFriberg, 1988); indeed, it has been suggested that themetabolic response is dependent on the inhibitioncontext, local connectivity, and type of inhibitoryconnection (Tagamets and Horwitz, 2001).
In contrast to GABAA-mediated inhibition, thereis a dearth of data on the effect of GABAB activity onbrain metabolism. However, the GABAB receptor isnot only less variable than the GABAA receptor, interms of having fewer available subunits and iso-forms, but also has the advantage that pharmaco-logically specific drugs are available for its study.We have developed a guinea-pig cortical brain tissueslice model system of metabolism, which produces a‘metabolic fingerprint’ in response to metabolism ofthe stable isotope 13C, supplied as [3-13C]pyruvate.This approach has been shown to be robust,reproducible, and capable of distinguishing subtledifferences in the metabolic functional activityinduced by a range of receptors and/or transporters.Further, the metabolic fingerprint can be analyzedby multivariate statistics, allowing identification ofligands that result in similar metabolic outcomesligands (Moussa et al, 2002; Moussa et al, 2007; Raeet al, 2000, 2003, 2005b, 2006; Stanton et al, 2003).In this work, we used this approach to determine themetabolic sequelae of modulation of the GABAB
receptor, using both classic and more recentlydeveloped ligands.
Materials and methods
Materials
Guinea-pigs (Dunkin-Hartley), weighing 400 to 800 g, werefed ad libitum on standard guinea-pig/rabbit pellets, withfresh cabbage leaves and lucerne hay roughage. Animalswere maintained on a 12 h light/dark cycle. All experi-ments were conducted in accordance with the guidelines
of the National Health and Medical Research Council ofAustralia and were approved by the institutional (UNSW)Animal Care Ethics Committee.
Sodium [3-13C]pyruvate and sodium [13C]formate werepurchased from Cambridge Isotope Laboratories Inc.(Andover, MA, USA). (RS)-Baclofen (Baclofen, (RS)-4-amino-3-(4-chlorophenyl)butanoic acid); SKF 97541 (CGP35024, 3-aminopropyl(methyl)phosphinic acid); CGP35348 ((3-aminopropyl) (diethoxymethyl)phosphinicacid); CGP 52432 (3-[[(3,4-dichlorophenyl)methyl]amino]-propyl]diethoxymethyl)phosphinic acid), SCH 50911 (( +)-(S)-5,5-dimethylmorpholinyl-2-acetic acid), and phaclo-fen (3-[[(3,4-dichloromethyl)methyl]amino]propyl] dietho-xymethyl)phosphinic acid) were purchased from TocrisCookson, UK. All other reagents were of AR grade.
Preparation of Brain Cortical Tissue Slices
Guinea-pigs were killed by cervical dislocation. The brainwas rapidly removed from the cranial vault, and the cortexdissected, and chopped into 350mm slices in the paraxialplane using a McIlwain tissue chopper. The resultingslices were immediately washed three times in a modifiedKrebs–Henseleit buffer (124 mmol/L NaCl, 5 mmol/L KCl,1.2 mmol/L KH2PO4, 1.2 mmol/L CaCl2, 1.2 mmol/LMgSO4, and 26 mmol/L NaHCO3 (Badar-Goffer et al,1990) resuspended for 1 h in fresh buffer containing10 mmol/L unlabelled glucose and gassed with 95%O2/5% CO2 in a shaking water bath, maintained at 371C,to allow metabolic recovery (McIlwain and Bachelard,1985). Slices were then washed three times in glucose-freebuffer and resuspended in fresh buffer with the substrateof choice.
Modulation of GABAB Activity
To determine the effect of modulation of GABAB receptorson metabolic activity, slices were incubated with 2 mmol/L sodium [3-13C]pyruvate (control) and also, in the case ofligand treatment groups, with one of two concentrations ofthe ligand. We used 2 mmol/L sodium [3-13C]pyruvate asthe 13C substrate as this compound in our experience (Raeet al, 2000, 2003, 2005b, 2006) labels a higher proportionof metabolites (it is problematic, for example, adequatelyto label aspartate and glutamine in the brain slice using[1-13C]glucose) as well as a larger number of metaboliccompartments within the slice. This is not becausepyruvate is a more efficiently used substrate than glucose,but simply reflects improved penetration of the labelbecause of the higher relative concentration of [3-13C]pyr-uvate. At 2 mmol/L, pyruvate satisfies maximal respirationrates similar to those provided by 5–10 mmol/L glucose(McIlwain and Bachelard, 1985).
Ligands used included the GABAB agonists, 1 and10 mmol/L Baclofen (specific and classic GABAB agonist(Davies and Watkins, 1974)), 0.2 and 2.0mmol/L SKF97541 (CGP 35024, potent GABAB agonist (Froestl et al,1995)), and the GABAB antagonists, CGP 35348 (50and 200mmol/L, brain penetrant antagonist with higheraffinity at pre- versus postsynaptic receptors (Olpe et al,
GABAB and metabolismFA Nasrallah et al
1511
Journal of Cerebral Blood Flow & Metabolism (2007) 27, 1510–1520

1990)), 0.1 and 1.0mmol/L CGP 52432 (potent antagonistmost effective at GABAB autoreceptors (Lanza et al, 1993)),and 5 and 50 mmol/L SCH 50911 (potent, orally activecompetitive antagonist, (Ong et al, 1998)), and 100 and300mmol/L Phaclofen (classic antagonist at GABAB (Kerret al, 1987)). Phaclofen was dissolved in NaOH and the pHof the incubation buffer subsequently adjusted to that ofthe control buffer using HCl.
The concentrations of ligands were chosen to reflect theaffinity of GABAB agonists and antagonists and to separateother possible nonspecific activities. Typically, the con-centrations studied were around the KM or Kd (whicheverpublished values were available) and 10 times thisamount.
Slices were incubated for 1 h with [3-13C]pyruvate andthe experiment was stopped as indicated.
Preparation of Samples and Nuclear MagneticResonance Analysis
On completion of the incubation period, slices wereremoved from the incubation buffer by rapid filtrationand extracted in methanol/chloroform according to themethod of Le Belle et al (2002). Extracts were lyophilized,and the pellet retained for protein estimation by the Lowrytechnique. Lyophilized supernatants were stored at �201Cuntil required for nuclear magnetic resonance analysis.Samples were resuspended in 0.65 mL D2O containing2 mmol/L sodium [13C]formate as an internal intensity andchemical shift reference (13C d 171.8). Fully relaxed 1H and1H[13C-decoupled] spectra (total cycle of 30 secs, compris-ing 24 secs relaxation delay, 4 secs water suppression, andB2 secs acquisition time), WURST-40 (Kupce and Free-man, 1995) with a 112-step phase cycle (Skinner andBendall, 1997), decoupling during acquisition wereobtained at 600.13 MHz on a Bruker DRX-600 spectro-meter with a 5-mm dual 1H/13C probe, followed by 13C [1H-decoupled] spectra (typically 3000–5000 transients, cycleof 4 secs comprising 2 secs relaxation delay and B2 secsacquisition time, continuous WALTZ-16 decoupling)131072 data points. Assignments were made as describedpreviously (Rae et al, 2000).
13C [1H-Decoupled] spectra were transformed using 3 Hzexponential line-broadening and peak areas were deter-mined by integration using standard Bruker software(TOPSPIN, Version 1.3) after baseline correction. Peakareas were adjusted for nuclear Overhauser effect, satura-tion and natural abundance effects, and quantified byreference to the area of the internal standard resonance of[13C]formate. Glu C3 was not quantified because ofpossible resonance overlap with residual pyruvate dimer,as described previously (Rae et al, 2000). Metabolite poolsizes (lactate, alanine, GABA, glutamate, glutamine, andaspartate) were determined by integration of resonances infully relaxed 600 MHz 1H[13C-decoupled] spectra using[13C]formate as the internal intensity reference.
Experimental data (N = 4) are given as means (standarddeviation). Statistical analysis was performed usingANOVA for comparing ligand-treated metabolism at eachreceptor with control (N = 24), followed, only where
statistical significance was indicated by Scheffe F-test,by a nonparametric (Mann–Whitney U test) test (StatviewStudent). Significance was assumed at a= 0.05.
Pattern Recognition of the Data
Multivariate pattern recognition and data reduction toolsare preferable to standard univariate statistical approachessince they have the capacity to handle hundreds ofvariables simultaneously and can cope with numerousco-linearities in the data set, making them a powerful toolin systems biology (Goodacre et al, 2004; Rochfort, 2005).Principal components analysis (PCA) is a projectionmethod designed to extract and highlight the inherentvariation in a data set by defining a series of principalcomponents (PCs). The approach is unsupervised andclassifies the data into groups solely based on thevariables that change the most and no information isgiven regarding class membership. Thus, it is less liable toover-fitting compared with supervised techniques. Toassess model robustness, the fractional variance repre-sented by a model is calculated by R2 (a goodness of fitalgorithm). An R2 > 0.60 signifies a highly robust modelexplaining the majority of variance in the data set; in thecase of this work, all models had R2 > 0.7 across threecomponents.
Each experiment (representing two drug concentrations)was performed with its own control sample. The controlsamples for all experiments were averaged. These meanvalues were then subtracted from the samples exposed todrugs to produce a new data set that represented the effectof the drug less the metabolic fluxes/pool sizes of therelevant control samples. Pattern recognition was per-formed on this change in metabolism, rather than poolsize/flux rates per se; this latter analysis is shown in Figure1 and Table 1, while the PCA of the drug effects is shownin Figures 2 and 3. This is a departure from our previousapproach to PCA of such data, where the first PC hasalways represented the variance in the control versus theexperimental data (Rae et al, 2005b, 2006). This variance isillustrated well in Figure 1 and is less interesting.
The data was imported into SIMCA (Umetrics, Umea,Sweden; www.umetrics.com) where the data reductiontool PCA was used. Data were initially scaled with unitvariance scaling, where the variable is centered around themean and then divided by 1/ss, where ss is the standarddeviation of that variable. This has the effect of ensuringthat every variable contributes to the model equally. Thedata set was then analyzed by PCA, which reduces themajor variance of the data set into a smaller number oflatent variables called PCs. This allows the easy visualiza-tion of trends in two-dimensional scores plots. To examinewhich metabolites contribute the most to these trends, thecorresponding loadings plots are examined.
Results
GABAB Agonists—(RS)-Baclofen
Incubation of cortical brain slices with 1.0 mmol/LBaclofen resulted in significantly decreased net flux
GABAB and metabolismFA Nasrallah et al
1512
Journal of Cerebral Blood Flow & Metabolism (2007) 27, 1510–1520

of 13C into Glu C2 and C4, GABA C2, Lactate C3, AspC2 and C3, and Ala C3 compared with all controls(N = 20; Figure 1). There was a significant decreasein anaplerotic activity measured by comparinglabelling at Asp C3 versus Asp C2. Increasing theconcentration of Baclofen to 10mmol/L also de-creased net flux into Glu C2 and C4, GABA C2, andAsp C2 and Asp C3 although the decreases were lessthan that seen using 1.0 mmol/L Baclofen (statisti-cally significantly less only for Glu C4; Figure 1).The metabolite pool size of Lactate, Glu, GABA, andAla was significantly decreased by 1.0 mmol/LBaclofen, while 10 mmol/L Baclofen had no signifi-cant effect on pool sizes (Table 1).
SKF 97541
SKF 97541 (0.2 mmol/L) had no significant effects onnet flux (Figure 1) but resulted in a significantincrease in the metabolite pool size of Asp and Ala(Table 1). By contrast, 2.0 mmol/L SKF 97541significantly decreased net flux into Glu C2 and
C4, Gln C4, and Asp C2 and C3 (Figure 1) andsignificantly increased the metabolite pool sizes ofGABA, Gln, and Ala.
GABAB Antagonists—CGP 35348
The centrally active antagonist CGP 35348 (50 mmol/L) had no significant effect on net flux (Figure 1) butsignificantly decreased the pool size of GABA andAsp in the slices (Table 1). A higher concentration ofthe ligand (200 mmol/L) resulted in significantdecreases in net flux into Glu C2 and C4, GABAC2, Asp C2 and C3, and Ala C3 (Figure 1). The poolsizes of lactate, Glu, GABA, Asp, and Gln were alsosignificantly decreased by this concentration ofligand (Table 1).
Phaclofen
The baclofen derivative and classic GABAB antago-nist phaclofen at 100 mmol/L resulted in signifi-cantly decreased net flux into Glu C2 and C4, Gln
Figure 1 Effects of GABAB receptor ligands on net flux of 13C in brain cortical tissue slices incubated 1 h with sodium[3-13C]pyruvate. Clear bars, control (N = 24); hatched bars, lower dose of ligand (N = 4); cross-hatched bars, higher dose of ligand(N = 4). Values shown are means, while error bars show standard deviations. *Significantly different to control; # significantlydifferent to higher dose ligand. * or #P < 0.05, ** or ##P < 0.01.
GABAB and metabolismFA Nasrallah et al
1513
Journal of Cerebral Blood Flow & Metabolism (2007) 27, 1510–1520

C4, and Asp C2 and C3 compared with control(Figure 1), while the anaplerotic activity measuredvia Asp C3/C2 was also significantly decreased.The metabolite pool sizes of lactate, Glu, and GABAwere significantly increased (Table 1). Phaclofen at300 mmol/L significantly decreased net flux into GluC2 and C4, Gln C4, and Asp C2 and C3 (Figure 1),while the metabolite pool size of lactate was alsosignificantly decreased, those of glutamine andGABA were increased (Table 1).
SCH 50911
The competitive antagonist SCH 50911 had nosignificant effect on net flux of 13C at the lowerconcentration measured (5 mmol/L) but resulted insignificant increases in net flux into Glu C2 and C4and Asp C2 and C3 when the concentration wasincreased to 50 mmol/L (Figure 1). The total pool sizeof GABA and Asp were increased by addition of5mmol/L SCH 50911, while 50 mmol/L SCH 50911had no significant impact on metabolite pool sizes.
CGP 52432
The antagonist with higher activity at GABAB
autoreceptors CGP 52432, at 0.1 mmol/L, resulted in
increased net flux into Glu C4 and GABA C2 (Figure1). Increasing the concentration to 1.0 mmol/L sig-nificantly stimulated net flux into Glu C4, GABA C2,Gln C4, and Asp C2 and C3. The anaplerotic ratiocalculated from the difference in Asp C3/C2 label-ling was also increased, indicating an increasednet flux of label via pyruvate carboxylase activityrelative to control. The total metabolite pool of Aspwas increased (Table 1), while those of lactate andAla were significantly decreased (Table 1).
Principal Components Analysis of GABAB LigandEffects on Metabolic Activity
A three component PCA model was formed withthese PCs representing 46%, 24%, and 14% of thetotal variation in the data set, respectively. Acrossall three PCs, the data readily clustered according todrug type and dose. The contributions of individualvariables to each PC are shown in Figure 3. PC1(Figure 3A) represents the engagement of Krebscycle and anaplerotic activity and increased meta-bolic activity across the total metabolon, and can beargued to show the degree of excitatory activityinduced by the added ligand. PC2 (Figure 3B), bycontrast, represents net flux into metabolites synon-ymous with engagement of the GABA-ergic system
Table 1 Total metabolite pool sizes
Lactate Glu GABA Asp Gln Ala
Control 4.64 10.44 5.36 7.05 1.63 2.76N = 24 (0.25) (0.97) (0.72) (0.93) (0.32) (0.41)
1.0mmol/L (RS)� 3.37** 8.73* 4.39* 6.86 1.68 2.20**Baclofen (0.03) (0.10) (0.06) (0.08) (0.03) (0.05)10mmol/L (RS)� 4.87# 10.55 5.45 7.48 2.03* 2.93#
Baclofen (0.05) (0.07) (0.05) (0.04) (0.01) (0.04)0.2mmol/L SKF 4.46 11.04 6.05 8.72** 1.81 3.28*97541 (0.10) (0.17) (0.05) (0.11) (0.10) (0.08)2.0mmol/L SKF 4.78 11.14 6.40** 8.36** 2.05** 3.90**97541 (0.06) (0.15) (0.10) (0.08) (0.02) (0.05)
50mmol/L CGP 4.63# 9.41# 4.12** 5.17** 1.26 2.0535348 (0.09) (0.19) (0.07) (0.11) (0.05) (0.08)200mmol/L CGP 3.29** 7.82** 3.23** 4.17** 1.21* 2.3435348 (0.07) (0.63) (0.06) (0.08) (0.04) (0.03)100mmol/L 5.09** 12.29** 7.15** 7.49 1.88 2.89Phaclofen (0.08) (0.30) (0.06) (0.09)## (0.02) (0.04)300mmol/L 3.40** 11.28 6.88** 8.14 2.34** 2.40Phaclofen (0.17) (0.24) (0.43) (0.16) (0.07) (0.04)5.0mmol/L SCH 4.78 11.06 6.28** 8.24* 1.96 2.8450911 (0.09) (0.08) (0.14) (0.14) (0.05) (0.07)50mmol/L SCH 4.51 10.78 5.31 8.04 1.73 1.7350911 (0.08) (0.06) (0.09) (0.10) (0.08) (0.08)0.1mmol/L CGP 4.35 11.30 6.20 7.49 1.88 2.8952432 (0.14) (0.06) (0.06) (0.12) (0.02) (0.04)1.0mmol/L CGP 4.22* 11.06 6.04 8.26** 1.96 2.35*52432 (0.09) (0.08) (0.06) (0.04) (0.02) (0.02)
Data are shown as means (s.d.). Each drug (two concentrations, N = 4)) was compared to control data (N = 24) using ANOVA. Where statistical significant(a= 0.05) was indicated by Scheffe F test, a probability was computed using a nonparametric comparison (Mann–Whitney U test).* or #P < 0.05, ** or##P < 0.01. Asterisks indicate significantly different to control, hatches indicate significantly different to the higher concentration of the same ligand.
GABAB and metabolismFA Nasrallah et al
1514
Journal of Cerebral Blood Flow & Metabolism (2007) 27, 1510–1520

Figure 2 Principal components analysis of labelling and total metabolite concentrations for GABAB receptor ligands. (A) The figureshows the first two PCs of the analysis and shows separation of metabolic profiles according to the amount of Krebs cycle activity(increases with positive loading in PC1; Figure 3A) and the amount of inhibitory activity (PC2, which reflects the impact on pool sizesand alanine/lactate cycling; Figure 3B). For example, the ligands causing most increase in net flux into Krebs cycle markers, CGP52432 (0.1 and 1.0 mmol/L), SKF 97541 (0.2 mmol/L), and SCH 50911 (50mmol/L) are clustered to the right along PC1, whilethose causing the greater decrease in net flux (Baclofen, Phaclofen, cluster to the left. (B) The second and third PCs of the analysisare shown. PC3 is composed of the relative amount of net flux into metabolites and their pool sizes (Figure 3C; i.e., a measure offractional enrichment) and so represents the degree of penetration of label into the total metabolon. The large outer ellipse represents95% confidence interval (Hotellings score). The shaded ellipses define subset groupings to make the figure more readable and arenot representative of any statistical certainty.
GABAB and metabolismFA Nasrallah et al
1515
Journal of Cerebral Blood Flow & Metabolism (2007) 27, 1510–1520
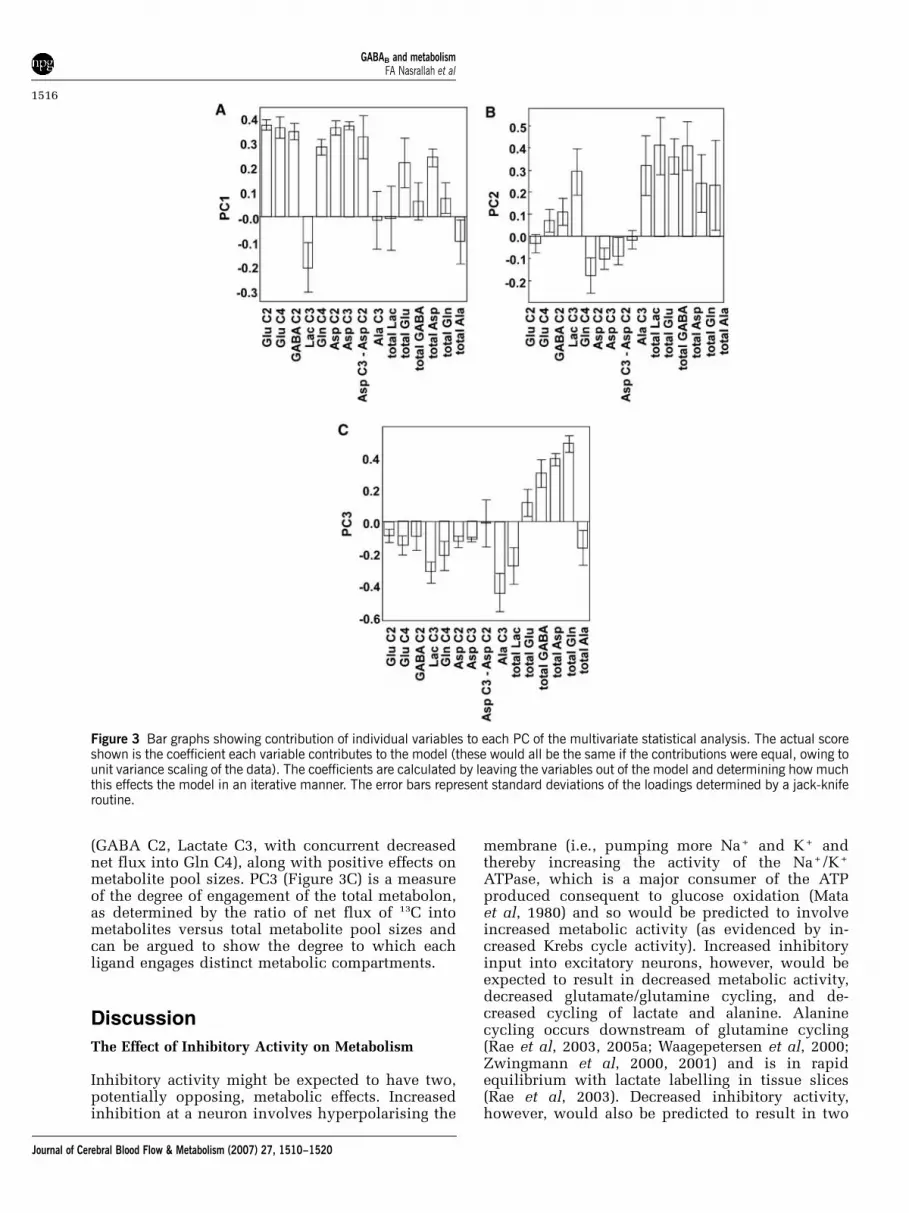
(GABA C2, Lactate C3, with concurrent decreasednet flux into Gln C4), along with positive effects onmetabolite pool sizes. PC3 (Figure 3C) is a measureof the degree of engagement of the total metabolon,as determined by the ratio of net flux of 13C intometabolites versus total metabolite pool sizes andcan be argued to show the degree to which eachligand engages distinct metabolic compartments.
Discussion
The Effect of Inhibitory Activity on Metabolism
Inhibitory activity might be expected to have two,potentially opposing, metabolic effects. Increasedinhibition at a neuron involves hyperpolarising the
membrane (i.e., pumping more Na + and K + andthereby increasing the activity of the Na+/K+
ATPase, which is a major consumer of the ATPproduced consequent to glucose oxidation (Mataet al, 1980) and so would be predicted to involveincreased metabolic activity (as evidenced by in-creased Krebs cycle activity). Increased inhibitoryinput into excitatory neurons, however, would beexpected to result in decreased metabolic activity,decreased glutamate/glutamine cycling, and de-creased cycling of lactate and alanine. Alaninecycling occurs downstream of glutamine cycling(Rae et al, 2003, 2005a; Waagepetersen et al, 2000;Zwingmann et al, 2000, 2001) and is in rapidequilibrium with lactate labelling in tissue slices(Rae et al, 2003). Decreased inhibitory activity,however, would also be predicted to result in two
Figure 3 Bar graphs showing contribution of individual variables to each PC of the multivariate statistical analysis. The actual scoreshown is the coefficient each variable contributes to the model (these would all be the same if the contributions were equal, owing tounit variance scaling of the data). The coefficients are calculated by leaving the variables out of the model and determining how muchthis effects the model in an iterative manner. The error bars represent standard deviations of the loadings determined by a jack-kniferoutine.
GABAB and metabolismFA Nasrallah et al
1516
Journal of Cerebral Blood Flow & Metabolism (2007) 27, 1510–1520

different potential outcomes; decreased inhibitoryactivity of inhibitory neurons would result indecreased metabolic activity for these neurons asthey could attain a resting, rather than hyper-polarised, membrane potential, while decreasedinhibitory input into excitatory neurons would beexpected to produce similar metabolic outcomes tothat expected for mildly increased excitatoryactivity. That is, greater numbers of spontaneousexcitatory potentials, increased Krebs cycle flux,increased glutamate/glutamine cycling, and in-creased cycling of lactate and alanine. Therefore,the net outcome of addition of agonists or antago-nists to our system ought strictly to be viewed as anet sum of these effects, as it is in a brain imagingexperiment conducted in vivo. With this in mind,interpretation of the apparently conflicting out-comes consequent on modulation of the GABAB
receptor becomes more straightforward (Figure 4).Agonists at GABAB, such as Baclofen or the higher
concentration (2.0 mmol/L) of SKF 97541, showedresults consistent with decreased net flux into theKrebs cycle (decreased net flux into Glu C2 and C4,and Asp C2 and C3), a neutral effect on net flux intoGln C4 and decreased net flux into Ala C3 and LacC3, consistent with decreased alanine/lactatecycling. These metabolic effects are consistent withincreased inhibitory and decreased excitatory acti-vity, consistent with the scenario shown in Figure 4B.Although the lower concentration of SKF 97541 didnot show any individual net flux changes that weresignificantly different to the total control fluxes, theacross the board higher values for net flux into Krebscycle intermediates (Glu C2, C4 and Asp C2 and C3)suggested that Krebs cycle activity was higher in thiscase (if there was no change, on probabilities onemight reasonably expect there to be an equal numberof higher and lower values compared with controlvalues). Indeed, if the control data were limited onlyto those obtained concurrently with the SKF data,and not widened to include the full control range,there were significant increases in net flux into GluC4 and Asp C2 and C3, with significantly greater netflux into GABA C2, indicative of increased Krebscycle activity and increased labelling of the GABApool (GABA C2) with no change in net flux into GluC4. It could therefore be argued that the lowerconcentration of SKF 97541 is stimulating inhibitory(hyperpolarisation) activity without greatly effectingexcitatory activity, as is illustrated in Figure 4A.This is also supported by the clustering of the datafrom the lower concentration of SKF 97541 to theright along PC1 (Figure 2A) in the company of thepotent antagonist CGP 52432.
The weak antagonist CGP 35348 shows netmetabolic effects similar to that of Baclofen (Figure1), illustrated by this drug clustering in the sameHotellings quadrant as a similar concentration ofBaclofen along all PCs (Figure 2). The main separat-ing factor of CGP 35348 from Baclofen is in the poolsizes, which are lower in the case of CGP 35348. The
weak antagonist Phaclofen also separates in thesame quadrant as Baclofen and CGP 35348, showingsimilar patterns of net flux, but the pool sizes in thiscase are increased. The net metabolic activity bestmatched by this is illustrated in Figure 4, scenario C.
The potent antagonists SCH 50911 and CGP 52432show quite different patterns of net flux to the otherligands employed in this study. The profiles showincreased Krebs cycle activity (illustrated by in-creased net flux into Glu C2, C4, Asp C2 and C3),significantly increased anaplerotic activity (mea-sured by the difference in Asp C3 versus C2labelling), and increased net flux into Gln C4,consistent with increased glutamate/glutaminecycling (and increased glutamatergic activity). Thissuggests an outcome consistent with that illustratedin Figure 4, scenario D.
Figure 4 Scheme showing additive contribution of excitatoryand inhibitory compartments to net metabolism. Under restingconditions, a theoretical contribution to total net metabolism ismade by excitatory (hatched, 80%) and inhibitory (gray, 20%activity. Addition of GABAB ligands can produce a spectrum ofresponses of which four possible outcomes are illustrated here.(A) Addition of mild agonist increases membrane potential atinhibitory cells and has small input into excitatory cells, so totalnet output results in increased metabolic activity. (B) Addition ofmore potent agonist increases membrane potential at inhibitorycells and has induces less activity in excitatory cells, so total netoutput is to decrease overall metabolism. (C) Addition ofantagonist active mostly at postsynaptic receptors, inducesdecreased metabolic activity in inhibitory cells and increasedmetabolic activity at a small population of excitatory cells, sothat total output is to decrease overall metabolism. (D) Additionof potent pre- and postsynaptic antagonist results in decreasedactivity at inhibitory cells and greatly increased activity atexcitatory cells, with overall net stimulation of metabolism.
GABAB and metabolismFA Nasrallah et al
1517
Journal of Cerebral Blood Flow & Metabolism (2007) 27, 1510–1520

It is apparent from the present results that itcannot be automatically inferred that increasedinhibitory activity causes a decrease in total meta-bolic activity, or that decreased inhibitory activity isnecessarily stimulatory. More specifically, if theneuronal activity is understood in terms of changesin membrane permeabilities (resulting in ioniccurrents using transmembrane potentials that re-quire energy to be maintained), it should be clearthat both depolarization (excitation) or hyperpolar-ization (inhibition) can put extra demand on energymetabolism. In addition, other factors such as therole of signalling mechanisms triggered by changedionic concentrations inside the cells need to beconsidered (Lauritzen, 2005) in all interpretationof functional imaging data regardless of whetherpathways involved are predominantly excitatory orinhibitory.
GABA Pool Sizes
Pool sizes in brain cortical slices are subject tofluctuations depending on the metabolic activity inthe brain slice and on the rate of loss of substrate tothe medium. The rate of loss of substrate to themedium is surprising low; however, in the absenceof transporter inhibitors and exchange betweencompartments tends to be tight, with competitionfrom exogenously added substrates difficult to show(Lozovaya et al, 2004; Rae et al, 2003). It is thereforevalid to conclude that fluctuations in brain tissueslice pool sizes are strongly correlated with meta-bolic rate, and therefore indicative of the level ofmetabolic pool size that might be expected undersimilar circumstances in vivo. g-Aminobutyric acidlevels are now frequently measured in clinicalinvestigations using magnetic resonance spectro-scopy under both normal functional conditions, forexample (Floyer-Lea et al, 2005), and in diseasestates (Chang et al, 2003), and inferences have beendrawn from these levels about the function of theGABAergic system. Inspection of GABA pool sizesin Table 1, however, shows that levels of GABA perse are not necessarily indicative of functionalactivity. g-Aminobutyric acid pool sizes correlatedwell with the net flux of 13C label into GABA C2under conditions where GABAergic ligands wereadded to the slices (Spearman’s correlation coeffi-cient rs = 0.52, N = 48, P = 0.0001), but not with netflux into Glu C4 (rs = 0.22). From this one mightconclude that GABA levels correlate well with theamount of engagement of the GABAergic compart-ment, but not with glutamatergic activity. However,there is a negative, significant correlation betweenGABA pool sizes and the rate of net flux of label intoGlu C2. Glu C2, which occurs on the second turn ofthe Krebs cycle, might be considered a betterindicator of Krebs cycle activity than Glu C4, whichis also influenced strongly by glutamate/glutaminecycle rates. Glu C2 correlates negatively with GABA
pool sizes (rs =�0.30, N = 48, P = 0.04) suggestingthat increased GABA levels do indeed relate todecreased Krebs cycle activity, although the correla-tion is weak. Examination of the contribution of thetotal GABA pool size to each PC (Figure 3) in thiscase is useful, as it shows that engagement (increase)in the pool size is more strongly related to PC2 andPC3 (i.e., the degree of engagement of the GABAergiccompartment and the amount to which this thenengages the total metabolon) than it is to PC1 (i.e.,excitatory activity).
In summary, we have shown that total metabolicactivity subsequent to modulation at GABAB recep-tors represents a summation of excitatory andinhibitory effects, contributed to by a number ofdifferent metabolic compartments, and that thesecompartments may or may not be engaged byGABAB modulation, depending on the potency andnature of the ligand employed.
Acknowledgements
The authors are grateful to Dr Graham Ball, Dr JamesHook, and Ms Hilde Stender of UNSW School ofChemistry for expert technical assistance.
References
Ackermann RF, Finch DM, Babb TL, Engel J (1984)Increased glucose-metabolism during long-durationrecurrent inhibition of hippocampal pyramidal cells.J Neurosci 4:251–64
Badar-Goffer R, Bachelard H, Morris P (1990) Cerebralmetabolism of acetate and glucose studied by 13C NMRspectroscopy. Biochem J 266:133–9
Barnard EA, Skolnick P, Olsen RW, Mohler H, Sieghart W,Biggio G, Braestrup C, Bateson AN, Langer SZ (1998)International union of pharmacology. XV. Subtypes of gaminobutyric acidA receptors: classification on thebasis of subunit structure and receptor function.Pharmacol Rev 50:291–313
Bettler B, Kaupmann K, Mosbacher J, Gassmann M (2004)Molecular structre and physiological functions ofGABAB receptors. Physiol Rev 84:835–67
Billinton A, Upton N, Bowery NG (1999) GABA(B)receptor isoforms GBR1a and GBR1b appear to beassociated with pre- and post-synaptic elements re-spectively in rat and human cerebellum. Br J Pharma-col 126:1387–92
Bowery NG, Bettler B, Froestl W, Gallagher JP, Marshall F,Raiteri M, Bonner TI, Enna SJ (2002) Internationalunion of pharmacology. XXXIII. Mammalian g-amino-butyric acidB receptors: structure and function. Phar-macol Rev 54:247–64
Chang L, Cloak CC, Ernst T (2003) Magnetic resonancespectroscopy studies of GABA in neuropsychiatricdisorders. J Clin Psychiatry 64(Suppl 3):7–14
Charles KJ, Calver AR, Jourdain S, Pangalos MN (2003)Distribution of a GABAB-like receptor protein in the ratcentral nervous system. Brain Res 989:135–46
Chatton JY, Pellerin L, Magistretti PJ (2003) GABA uptakeinto astrocytes is not associated with significant
GABAB and metabolismFA Nasrallah et al
1518
Journal of Cerebral Blood Flow & Metabolism (2007) 27, 1510–1520

metabolic cost: implications for brain imaging ofinhibitory transmission. Proc Natl Acad SciUSA100:12456–61
Davies J, Watkins JC (1974) The action of b-phenyl-GABAderivatives on neurones of the cat cerebral cortex. BrainRes 70:501–5
Deisz RA, Billard J-M, Zieglgansberger W (1997) Presy-naptic and postsynaptic GABAB receptors of neo-cortical neurons of the rat in vitro: differences inpharmacology and ionic mechanisms. Synapse 25:62–72
Floyer-Lea A, Wylezinska M, Kincses T, Matthews PM(2005) Rapid modulation of GABA concentrationin human sensorimotor cortex during motor learning.J Neurophysiol 95:1639–44
Fritschy JM, Meskenaite V, Weinmann O, Honer M, BenkeD, Mohler H (1999) GABAB-receptor splice variantsGB1a and GB1b in rat brain: developmental regulation,cellular distribution and extrasynaptic localization.Eur J Neurosci 11:761–8
Froestl W, Mickel SJ, Hall RG, von Sprecher G, Strub D,Baumann PA, Brugger F, Gentsch C, Jaekel J, Olpe H-R,Rihs G, Vassout A, Waldmeier PC, Bittinger H(1995) Phosphinic acid analogues of GABA. 1. Newpotent and selective GABAB agonists. J Med Chem 38:3297–312
Goodacre R, Vaidyanathan S, Dunn WB, GHarrigan GG,Kell DB (2004) Metabolomics by numbers: acquiringand understanding global metabolite data. TrendsBiotechnol 22:245–52
Kerr DIB, Ong J, Prager RH, Gynther BD, Curtis DR (1987)Phaclofen—a peripheral ad central baclofen antagonist.Brain Res 405:150–4
Kupce E, Freeman R (1995) Adiabatic pulses for widebandinversion and broadband decoupling. J Magn Reson A115:273–6
Lanza M, Fassio A, Gemignani A, Bonnanno G, Raiteri M(1993) CGP 52432: a novel potent and selective GABAB
autoreceptor antagonist in rat cerebral cortex. Eur JPharmacol 237:191–5
Lauritzen M (2005) Reading vascular changes in brainimaging: is dendritic calcium the key? Nat RevNeurosci 6:77–85
Le Belle JE, Harris NG, Williams SR, Bhakoo KK (2002) Acomparison of cell and tissue extraction techniquesusing high-resolution 1H NMR spectroscopy. NMRBiomed 15:37–44
Lozovaya N, Melnik S, Tsintsadze T, Grebenyuk S,Kirichok Y, Krishtal O (2004) Protective capoverCA1 synapses: extrasynaptic glutamate doesnot reach the postsynaptic density. Brain Res1011:195–205
Mata M, Fink DJ, Gainer H, Smith CB, Davidsen L,Savaki H, Schwartz WJ, Sokoloff L (1980) Activity-dependent energy metabolism in rat posterior pituitaryprimarily reflects sodium pump activity. J Neurochem34:213–5
McIlwain H, Bachelard H (1985) Biochemistry and thecentral nervous system. Edinburgh: Churchill Living-stone
Moussa CE-H, Mitrovic AD, Vandenberg RJ, Provis T, RaeC, Bubb WA, Balcar VJ (2002) Effects of L-glutamatetransport inhibition by a conformationally restrictedglutamate analogue (2S,10S,20R)-2-(carboxycyclopro-pyl)glycine (L-CCG III) on metabolism in brain tissuein vitro analysed by NMR spectroscopy. NeurochemRes 27:27–35
Moussa CE-H, Rae C, Bubb WA, Griffin JL, Deters NA,Balcar VJ (2007) Inhibitors of glutamate transportmodulate distinct patterns in brain metabolism.J Neurosci Res 85:342–50
Olpe H-R, Karlsson G, Pozza MF, Brugger F, Steinmann M,Van Riezen H, Fagg G, Hall RG, Froestl W, Bittinger H(1990) CGP 35348—a centrally active blocker of GABA-B receptors. Eur J Pharmacol 187:27–38
Ong J, Marino V, Parker DAS, Kerr DIB, Blythin DJ (1998)The morpholino-acetic acid analogue SCH 50911 is aselective GABAB receptor antagonist in rat neocorticalslices. Eur J Pharmacol 362:35–41
Palacios JM, Kuhar MJ, Rapoport SI, London ED (1982)Effects of g-aminobutyric acid agonist and antagonistdrugs on local cerebral glucose utilization. J Neurosci2:853–60
Perez-Garci E, Gassmann M, Bettler B, Larkum ME (2006)The GABAB1b isoform mediates long-lasting inhibitionof dendritic Ca2+ spikes in layer 5 somatosensorypyramidal neurons. Neuron 50:603–16
Peyron R, Le Bars D, Cinotti L, Garcia-Larrea L, Galy G,Landais P, Millet P, Lavenne F, Froment JC, Krogsgaard-Larsen P (1994) Effects of GABAA receptors activationon brain glucose metabolism in normal subjects andtemporal lobe epilepsy (TLE) patients. A positronemission tomography (PET) study. Part 1: Brain glucosemetabolism is increased after GABAA receptors activa-tion. Epilepsy Res 19:45–54
Pham TM, Nurse S, Lacaille JC (1998) Distinct GABA(B)actions via synaptic and extrasynaptic receptorsin rat hippocampus in vitro. J Neurophysiol 80:297–308
Pozza MF, Manuel NA, Steinmann M, Froestl W, DaviesCH (1999) Comparison of antagonist potencies at pre-and post-synaptic GABAB receptors at inhibitorysynapses in the CA1 region of the rat hippocampus.Br J Pharmacol 127:211–9
Rae C, Hansen JT, Bubb WA, Broer S, Broer A (2005a)Alanine transport, metabolism and cycling in the brain.Proc Int Soc Magn Reson Med 2481
Rae C, Hare N, Bubb WA, McEwan SR, Broer A, McQuillanJA, Balcar VJ, Conigrave AD, Broer S (2003) Inhibitionof glutamine transport depletes glutamate and GABAneurotransmitter pools: further evidence for metaboliccompartmentation. J Neurochem 85:503–14
Rae C, Lawrance ML, Dias LS, Provis T, Bubb WA, BalcarVJ (2000) Strategies for studies of potentially neuro-toxic mechanisms involving deficient transport ofL-glutamate: antisense knockout in rat brain in vivoand changes in the neurotransmitter metabolismfollowing inhibition of glutamate transport in guineapigs brain slices. Brain Res Bull 53:373–81
Rae C, Moussa CE-H, Griffin JL, Bubb WA, Wallis T,Balcar VJ (2005b) Group I and II metabotropicglutamate receptors alter brain cortical metabolicand glutamate/glutamine cycle activity: a 13C NMRspectroscopy and metabolomic study. J Neurochem92:405–16
Rae C, Moussa CE-H, Griffin JL, Parekh SB, Bubb WA,Hunt NH, Balcar VJ (2006) A metabolomic approachto ionotropic glutamate receptor subtype function:a nuclear magnetic resonance in vitro investigation.J Cereb Blood Flow Metab 26:1005–17
Rochfort S (2005) Metabolomics reviewed: a new ‘Omics’platform technology for systems biology and implica-tions for natural products research. J Nat Products68:1813–20
GABAB and metabolismFA Nasrallah et al
1519
Journal of Cerebral Blood Flow & Metabolism (2007) 27, 1510–1520

Roland PE, Friberg L (1988) The effect of the GABA-Aagonist THIP on regional cortical blood flow inhumans. A new test of hemispheric dominance. J CerebBlood Flow Metab 8:314–23
Rudolph U, Crestani F, Mohler H (2001) GABAa receptorsubtypes: dissecting their pharmacological functions.Trends Pharmacol Sci 22:188–94
Shmuel A, Augath M, Oeltermann A, Logothetis NK(2006) functional MRI response correlates with de-creases in neuronal activity in monkey visual area V1.Nat Neurosci 9:569–77
Sibson NR, Dhankhar A, Mason GF, Rothman DL,Behar KL, Shulman RG (1998) Stoichiometriccoupling of brain glucose metabolism and glutamater-gic neuronal activity. Proc Natl Acad Sci USA 95:316–321
Skinner TE, Bendall MR (1997) A phase-cycling algorithmfor reducing side bands in adiabatic decoupling. J MagnResonance 124:474–8
Stanton D, Liao LP, Moussa CE-H, Rae C, Bubb WA, BalcarVJ (2003) Can inhibition of glutamate transport con-tribute to the action of neuroleptics? Psychiatrie(Prague) 7:6–11
Tagamets MA, Horwitz B (2001) Interpreting PET and fMRImeasures of functional neural activity: the effects ofsynaptic inhibition on cortical activation in humanimaging studies. Brain Res Bull 54:267–73
Vigot R, Barbieri SB-OH, Turecek R, Shegimoto R, ZhangY-P, Lujan R, Jacobson LH, Biermann C-M, Fritschy JM,Vacher C-M, Muller M, Sansig G, Guetg N, Cryan JF,Kaupmann K, Gassmann M, Oertner TG, Bettler B (2006)Differential compartmentalization and distinct functionsof GABAB receptor variants. Neuron 50:589–601
Waagepetersen HS, Sonnewald U, Larsson OM, Schous-boe A (2000) A possible role of alanine for ammoniatransfer between astrocytes and glutamatergic neurons.J Neurochem 75:471–9
Zwingmann C, Richter-Landsberg C, Brand A, Leibfritz D(2000) NMR spectroscopic study on the metabolic fateof [3-13C]alanine in astrocytes, neurons and cocultures:implications for glia-neuron interactions in neurotrans-mitter metabolism. Glia 32:286–303
Zwingmann C, Richter-Landsberg C, Leibfritz D (2001) 13Cisotopomer analysis of glucose and alanine metabolismreveals cytosolic pyruvate compartmentation as part ofenergy metabolism in astrocytes. Glia 34:200–12
GABAB and metabolismFA Nasrallah et al
1520
Journal of Cerebral Blood Flow & Metabolism (2007) 27, 1510–1520


