Embed Size (px)
Citation preview
NJT-RUCAIT-20-008
Ultraviolet (UV) and other Disinfection Devices for
Public Transit in Response to COVID-19
FINAL REPORT August 2020
Submitted by: Patrick J. Szary Ph.D. *
Associate Director ORCID ID 0000-0003-3566-8855
Brian T. Buckley Ph.D. *** Executive Director of Laboratories
Associate Director of Administration ORCID ID 0000-0001-7336-4321
Jie Gong, Ph.D. Associate Professor** and CAIT Affiliate*
ORCID ID 0000-0002-7915-7304
Shane Mott * Research Project Manager
ORCID ID 0000-0001-7012-0970 Cathleen Doherty, Ph.D. ***
Inorganic Analysis Section Leader ORCID ID 0000-0001-8831-6330
Nicole Renkel *** Laboratory Researcher
ORCID ID 0000-0002-2343-2266
* Center for Advanced Infrastructure and Transportation ** Department of Civil and Environmental Engineering
Rutgers, The State University of New Jersey 100 Brett Road
Piscataway, NJ 08854
*** Environmental and Occupational Health Sciences Institute Rutgers University
170 Frelinghuysen Road Piscataway NJ 08854
New Jersey Transit Project Manager John (Jack) Dean
In cooperation with
Rutgers, The State University of New Jersey And
New Jersey TRANSIT
Disclaimer Statement
The contents of this report reflect the views of the authors,
who are responsible for the facts and the accuracy of the
information presented herein. This document is disseminated
under the sponsorship of New Jersey Transit, in the interest of
information exchange. The U.S. Government assumes no
liability for the contents or use thereof.
Every effort was made to uniformly contact each technology
manufacturer/vendor. Cost information was provided by vendors
or acquired from commercial websites. Results and recommendations
presented herein provide a side-by-side comparison of
technology which may or may not account for all variables or benefits.
The application of any recommended practices or technologies
contained herein is voluntary. The conclusions do not represent “absolutes”
but instead are intended to provide broad guidance that can be used to
help guide decision makers.
1. Report No.
NJT-RUCAIT-20-008 2. Government Accession No. 3. Recipient’s Catalog No.
4. Title and Subtitle
Ultraviolet (UV) and other Disinfection Devices for Public Transit in Response to COVID-19
5. Report Date
August 2020 6. Performing Organization Code
CAIT and EOHSI Rutgers University
7. Author(s)
Patrick J. Szary Ph.D. ORCID ID 0000-0003-3566-8855; Brian T. Buckley Ph.D. ORCID ID 0000-0001-7336-4321; Jie Gong, Ph.D. ORCID ID 0000-0002-7915-7304 ; Shane Mott ORCID ID 0000-0001-7012-0970; Cathleen Doherty, Ph.D. ORCID ID 0000-0001-8831-6330; Nicole Renkel ORCID ID 0000-0002-2343-2266
8. Performing Organization Report No.
NJT-RUCAIT-20-008
9. Performing Organization Name and Address
Center for Advanced Infrastructure and Transportation
Rutgers, The State University of New Jersey
100 Brett Road
Piscataway, NJ 08854
10. Work Unit No.
11. Contract or Grant No.
69A3551847102 12. Sponsoring Agency Name and Address 13. Type of Report and Period Covered
Final Report 6/15/2020 – 8/21/2020
14. Sponsoring Agency Code
15. Supplementary Notes
U.S. Department of Transportation/OST-R
1200 New Jersey Avenue, SE
Washington, DC 20590-0001
16. Abstract
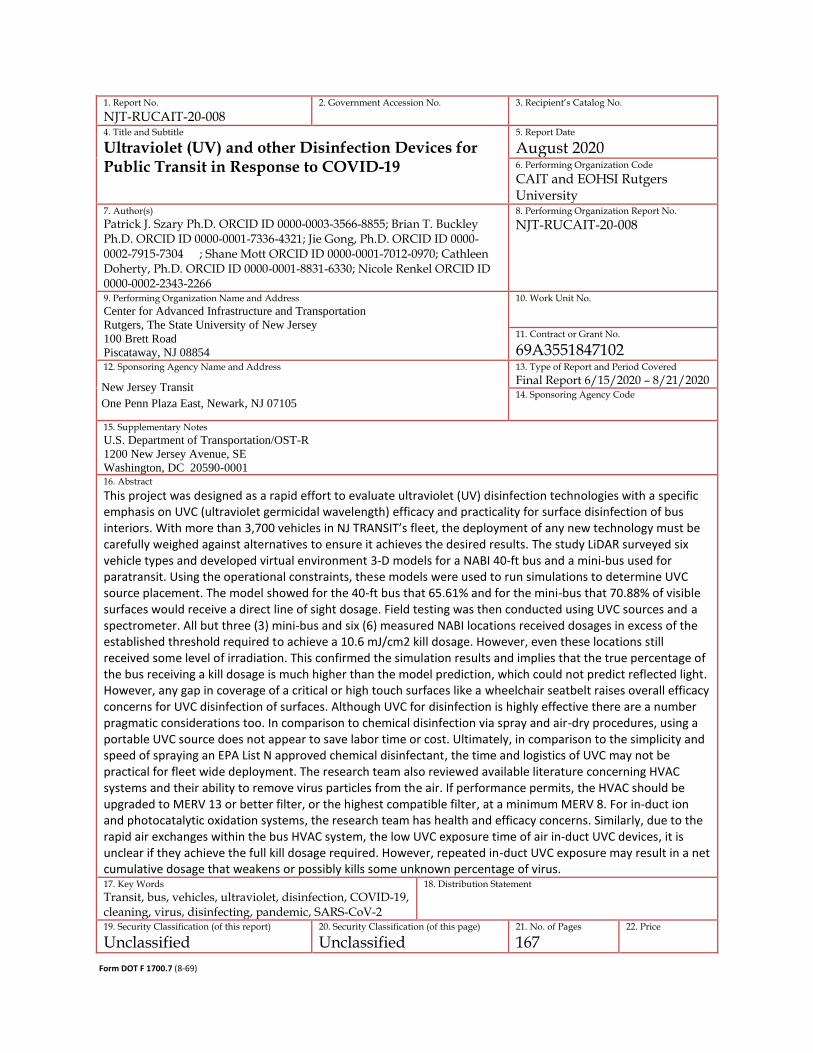
This project was designed as a rapid effort to evaluate ultraviolet (UV) disinfection technologies with a specific emphasis on UVC (ultraviolet germicidal wavelength) efficacy and practicality for surface disinfection of bus interiors. With more than 3,700 vehicles in NJ TRANSIT’s fleet, the deployment of any new technology must be carefully weighed against alternatives to ensure it achieves the desired results. The study LiDAR surveyed six vehicle types and developed virtual environment 3-D models for a NABI 40-ft bus and a mini-bus used for paratransit. Using the operational constraints, these models were used to run simulations to determine UVC source placement. The model showed for the 40-ft bus that 65.61% and for the mini-bus that 70.88% of visible surfaces would receive a direct line of sight dosage. Field testing was then conducted using UVC sources and a spectrometer. All but three (3) mini-bus and six (6) measured NABI locations received dosages in excess of the established threshold required to achieve a 10.6 mJ/cm2 kill dosage. However, even these locations still received some level of irradiation. This confirmed the simulation results and implies that the true percentage of the bus receiving a kill dosage is much higher than the model prediction, which could not predict reflected light. However, any gap in coverage of a critical or high touch surfaces like a wheelchair seatbelt raises overall efficacy concerns for UVC disinfection of surfaces. Although UVC for disinfection is highly effective there are a number pragmatic considerations too. In comparison to chemical disinfection via spray and air-dry procedures, using a portable UVC source does not appear to save labor time or cost. Ultimately, in comparison to the simplicity and speed of spraying an EPA List N approved chemical disinfectant, the time and logistics of UVC may not be practical for fleet wide deployment. The research team also reviewed available literature concerning HVAC systems and their ability to remove virus particles from the air. If performance permits, the HVAC should be upgraded to MERV 13 or better filter, or the highest compatible filter, at a minimum MERV 8. For in-duct ion and photocatalytic oxidation systems, the research team has health and efficacy concerns. Similarly, due to the rapid air exchanges within the bus HVAC system, the low UVC exposure time of air in-duct UVC devices, it is unclear if they achieve the full kill dosage required. However, repeated in-duct UVC exposure may result in a net cumulative dosage that weakens or possibly kills some unknown percentage of virus. 17. Key Words
Transit, bus, vehicles, ultraviolet, disinfection, COVID-19, cleaning, virus, disinfecting, pandemic, SARS-CoV-2
18. Distribution Statement
19. Security Classification (of this report)
Unclassified 20. Security Classification (of this page)
Unclassified 21. No. of Pages
167 22. Price
New Jersey Transit
One Penn Plaza East, Newark, NJ 07105
Form DOT F 1700.7 (8-69)
Acknowledgments The authors would like to acknowledge the LiDAR collection effort of Yi Yu; as well as the modeling and simulation effort of Jiahao Xia and Chong Di all of whom are PhD students In the Department of Civil & Environmental Engineering at Rutgers University. The authors would also like to thank the personnel at New Jersey Transit who supported this project and provided input into the research effort: Chelsea Ramos, John (Jack) Dean, Brad Mason, John Geitner, Adam Katz, Lea Sheridan, Anna Magri, Susan Godard, and Joseph Murtagh.
Table of Contents
1 Table of Contents 2 ABSTRACT .............................................................................................................................................. 1
3 DESCRIPTION OF THE PROBLEM ........................................................................................................... 3
4 APPROACH ............................................................................................................................................ 4
5 FINDINGS ............................................................................................................................................... 5
5.1 Best Practices and Literature Review............................................................................................ 5
5.1.1 Ultraviolet Background and Kill Dosage ................................................................................ 5
5.1.2 What are Transit Agencies Doing .......................................................................................... 6
5.1.3 Other than List N disinfectants ........................................................................................... 10
5.1.4 Health and safety guidance................................................................................................. 10
5.2 UVC Disinfection of Surfaces ....................................................................................................... 12
5.2.1 LiDAR Model ........................................................................................................................ 14
5.2.1.1 LiDAR scan and coverage modeling ................................................................................ 14
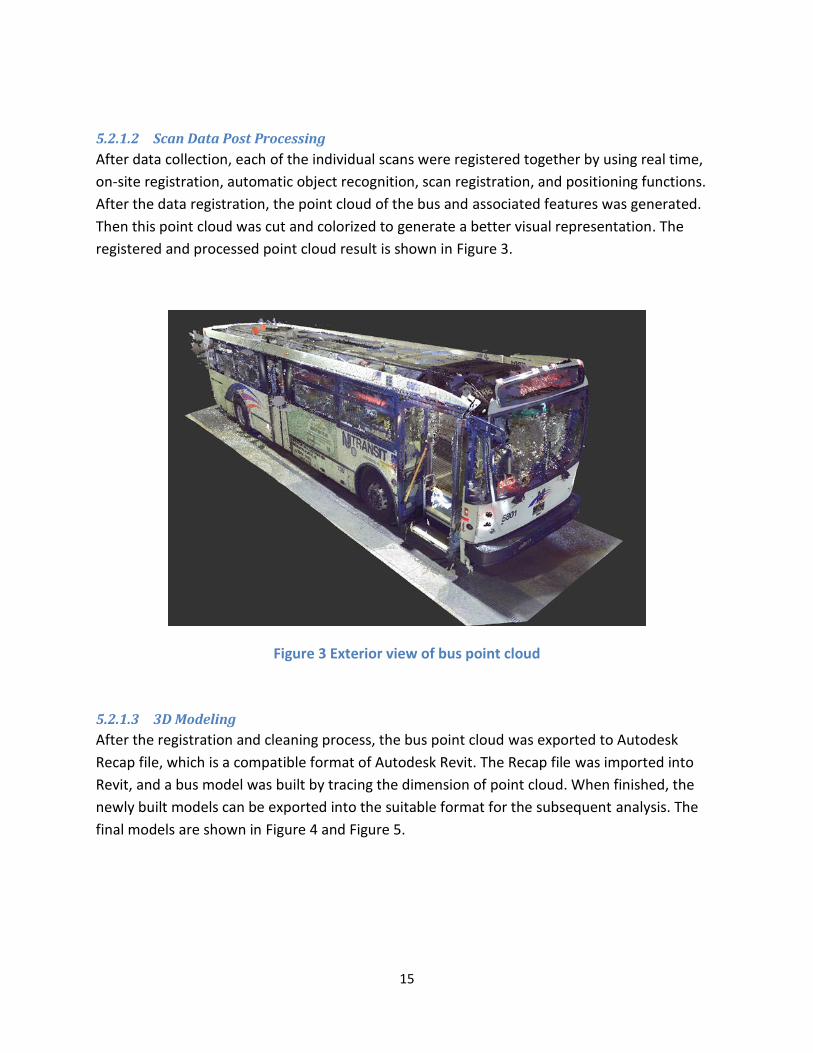
5.2.1.2 Scan Data Post Processing .............................................................................................. 15
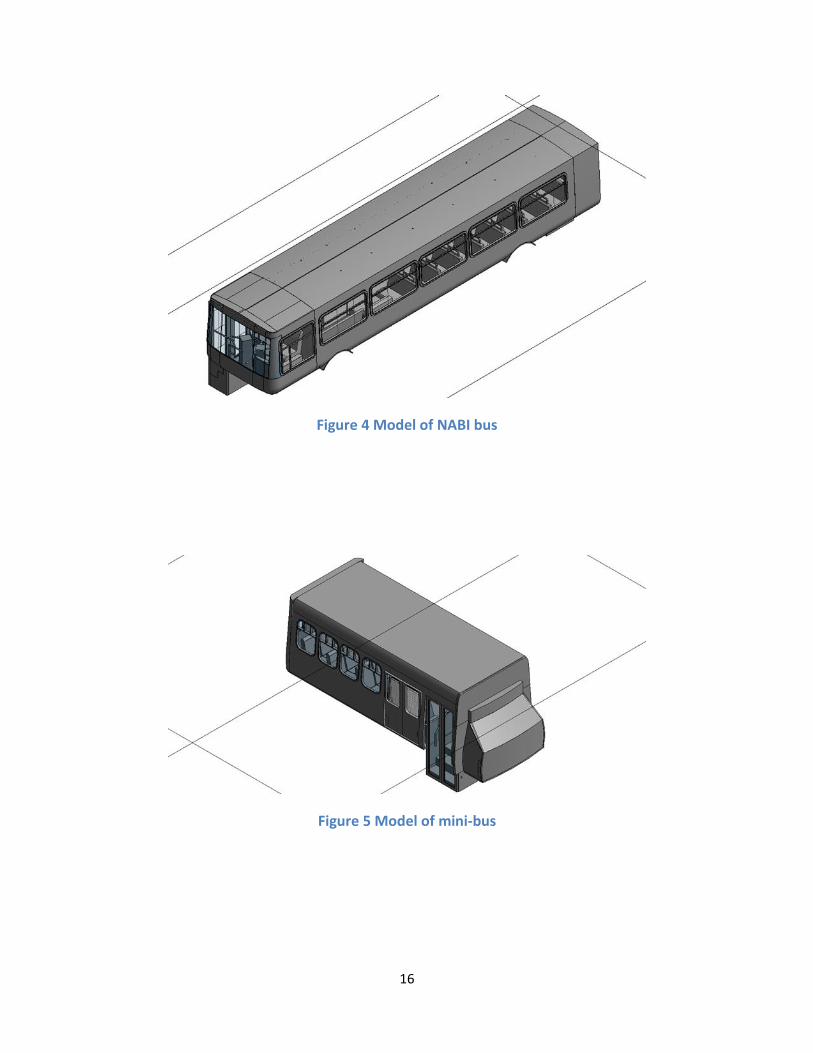
5.2.1.3 3D Modeling .................................................................................................................... 15
5.2.2 UVC Source Direct Line of Sight Coverage Analysis ............................................................ 17
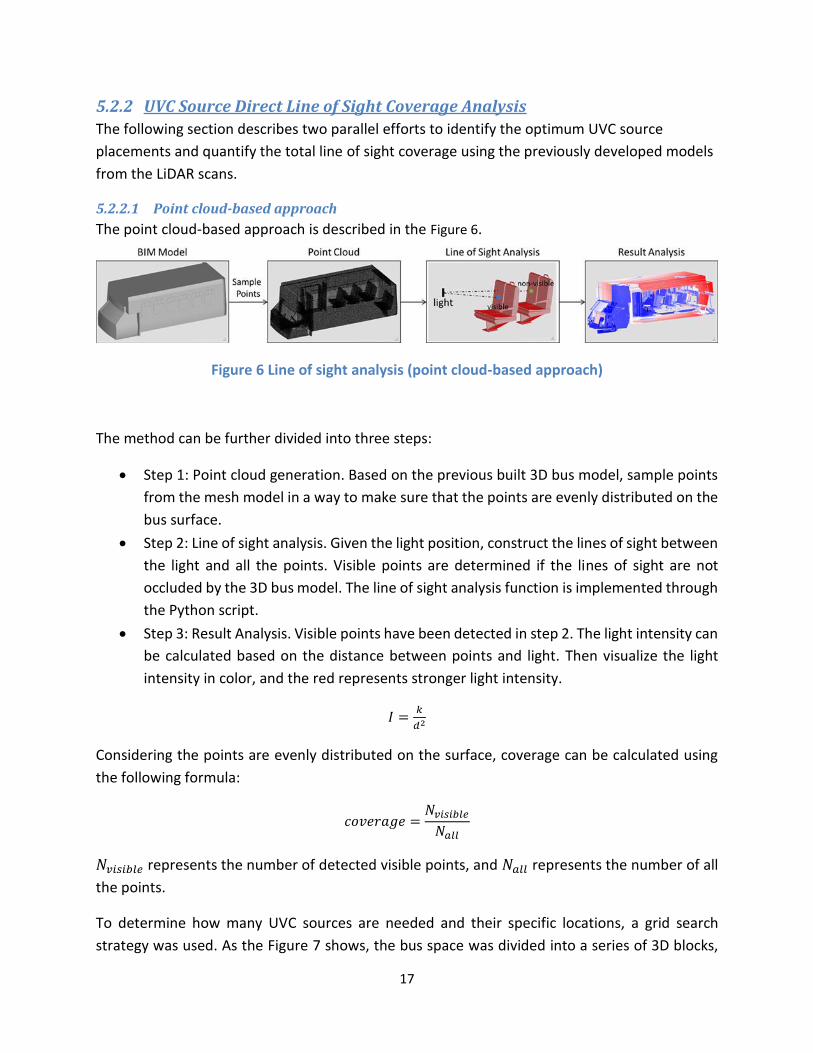
5.2.2.1 Point cloud-based approach ........................................................................................... 17
5.2.2.2 Mesh model-based approach ......................................................................................... 18
5.2.3 Mercury UVC Source placement and coverage .................................................................. 21
5.2.3.1 NABI bus coverage analysis ............................................................................................. 21
5.2.3.2 Mini-bus (paratransit) bus coverage analysis ................................................................. 25
5.2.4 Pulsed Xenon Source Analysis ............................................................................................. 30
5.2.4.1 Pulsed Xenon NABI bus coverage analysis ...................................................................... 33
5.2.4.2 Pulsed Xenon Mini-bus (paratransit) bus coverage analysis .......................................... 37
5.2.5 Spectrometry Measurements ............................................................................................. 40
5.2.5.1 Field measurement protocol ........................................................................................... 41
5.2.5.2 Data obtained continuous wave (CW) ............................................................................ 41
5.2.5.3 Mini-bus Vehicle ............................................................................................................. 42
5.2.5.3.1 One-Mercury UVC source results ............................................................................. 42
5.2.5.3.2 Two-Mercury UVC source results ............................................................................. 45
5.2.5.3.3 Three-UVC source results ......................................................................................... 48
5.2.5.3.4 Light leakage measurement ...................................................................................... 52
5.2.5.4 NABI Bus .......................................................................................................................... 54
5.2.5.4.1 Four-UVC source results ........................................................................................... 55
5.2.5.5 Pulsed Xenon Spectrometer Results ............................................................................... 58
5.2.6 Catalog of UV disinfection systems ..................................................................................... 66
5.2.6.1 Portable (Less than 50lbs) ............................................................................................... 66
5.2.6.1.1 Lantern UV Disinfection System ............................................................................... 66
5.2.6.1.2 Helo F1 UV Disinfecting Fixture (no flange) .............................................................. 67
5.2.6.1.3 Sentry M1-2 Mobile UV Disinfecting Unit ................................................................. 67
5.2.6.1.4 Industrial Portable 300W Surface & Air Sanitation Cart UVCART300 ...................... 68
5.2.6.1.5 Diversey MoonBeam 3 UVC Disinfection Device ...................................................... 68
5.2.6.1.6 Sanidyne Prime UVC Portable - 143W UV Output .................................................... 69
5.2.6.1.7 SPECTRA 500 UV Disinfection System ....................................................................... 69
5.2.6.2 Larger UV Systems (Greater than 50lbs) ......................................................................... 70
5.2.6.2.1 Torch Tower .............................................................................................................. 70
5.2.6.2.2 LightStrike Germ-Zapping Robot .............................................................................. 71
5.2.6.2.3 Tru-D SmartUVC ........................................................................................................ 71
5.2.6.2.4 MRS33-8 Mobile UV Unit .......................................................................................... 72
5.2.6.2.5 MRS45-12 Mobile UV Unit ........................................................................................ 72
5.2.6.2.6 UV-C High Power Disinfection System Mobile .......................................................... 73
5.2.6.2.7 Optimum-UV Enlight System .................................................................................... 73
5.2.6.2.8 Industrial Portable 1000W Surface & Air Sanitation Cart UVCART1000 .................. 74
5.2.6.2.9 GermFalcon ............................................................................................................... 74
5.2.6.3 Summary of Findings for UV Disinfection Products ........................................................ 75
5.2.7 Ultraviolet light long-term impacts (life span) on materials ............................................... 77
5.2.8 Power and cable management plan ................................................................................... 81
5.2.9 Concept of Operations ........................................................................................................ 82
5.2.9.1 Notes for Pulsed Xenon Source....................................................................................... 85
5.2.10 Fleet Wide Deployment Cost Comparison .......................................................................... 87
5.2.10.1 Spray and air-dry chemical disinfection ...................................................................... 87
5.2.10.2 Mercury UVC Disinfection ........................................................................................... 88
5.2.10.3 Pulsed Xenon UVC Disinfection ................................................................................... 90
5.2.10.4 Cost Comparison Discussion ....................................................................................... 92
5.2.10.5 Bulb life cycle cost ....................................................................................................... 93
5.3 HVAC and Disinfection of Air ...................................................................................................... 95
5.3.1 Fresh Air Exchanges and Power Vents/Hatches ................................................................. 96
5.3.2 Filtration ............................................................................................................................ 100
5.3.3 In-duct UVC Technologies ................................................................................................. 106
5.3.3.1 Product 1 - NFI Parts - UV-C Lighting Kit ....................................................................... 111
5.3.3.2 Product 2 – SanUVAire - Breathe-Safe System, Air Purification & Coil Disinfection .... 111
5.3.3.3 Product 4 - Mobile Climate Control (MCC) - Aire-Shield UVC ....................................... 112
5.3.4 In-duct Photocatalytic, Photohydroionization, and Ion technologies .............................. 113
5.3.4.1 Ion (Plasma) Generator ................................................................................................. 114
5.3.4.2 Photocatalytic Oxidizer and Photohydroionization ...................................................... 116
5.3.4.3 CCT 24V-1 Ion Generator .............................................................................................. 118
5.3.4.4 United Safety RGF PHI Cell Technology Photocatalytic Oxidizer .................................. 118
5.3.4.5 Luminator - Grignard Pure ............................................................................................ 119
5.3.4.6 In-duct Photocatalytic and Ion Follow-up ..................................................................... 120
5.3.5 Emerging Techniques using HVAC .................................................................................... 122
5.3.5.1 Disinfection by using Vehicle HVAC to Increase Interior Temperature ........................ 122
5.3.5.2 Modifying Vehicle Airflow to Increase Driver Safety .................................................... 124
5.3.5.3 Experimental HVAC Modifications Summary................................................................ 125
5.3.6 Cost Summary for In-Duct Disinfection of Air ................................................................... 127
5.3.6.1 Bulb Replacement and Life-Cycle Cost .......................................................................... 128
6 CONCLUSIONS ................................................................................................................................... 130
6.1 Implementation and Next Steps ............................................................................................... 138
7 FUTURE WORK .................................................................................................................................. 139
8 APPENDIX – CDC Transit Guidance ................................................................................................... 141
9 APPENDIX – EPA CFL Cleanup and Disposal Guidance ...................................................................... 147
10 APPENDIX – Reference Locations for Portable Mercury UVC ....................................................... 151
List of Figures Figure 1 Scanning the interior of a bus ....................................................................................................... 14
Figure 2 Scanning the exterior of a bus ...................................................................................................... 14
Figure 3 Exterior view of bus point cloud ................................................................................................... 15
Figure 4 Model of NABI bus ........................................................................................................................ 16
Figure 5 Model of mini-bus ......................................................................................................................... 16
Figure 6 Line of sight analysis (point cloud-based approach) ..................................................................... 17
Figure 7 UVC source light position candidates ........................................................................................... 18
Figure 8 Blender mesh cleaning .................................................................................................................. 19
Figure 9 Candidate UVC source locations ................................................................................................... 20
Figure 10 UVC source placement (Perspective View) ................................................................................. 21
Figure 11 UVC source placement (left) profile view and (right) plan view ................................................. 21
Figure 12 Overall Bus Interior Coverage ..................................................................................................... 22
Figure 13 Bus Shell Coverage ...................................................................................................................... 23
Figure 14 Seat Coverage Analysis ............................................................................................................... 23
Figure 15 Window Coverage Analysis ......................................................................................................... 24
Figure 16 Railing Coverage Analysis ............................................................................................................ 24
Figure 17 Close-up of railings showing how top portion of railing isn’t receiving light.............................. 24
Figure 18 Plan view of UVC source locations (plan view) ........................................................................... 25
Figure 19 Profile view of UVC source locations (profile view) .................................................................... 25
Figure 20 Mini-bus interior coverage (see through view) .......................................................................... 26
Figure 21 Overall mini-bus interior coverage ............................................................................................. 26
Figure 22 Coverage of bus shell analysis..................................................................................................... 27
Figure 23 Front of seats coverage analysis ................................................................................................. 28
Figure 24 Back of seats coverage analysis .................................................................................................. 28
Figure 25 Window coverage analysis .......................................................................................................... 29
Figure 26 Railing coverage analysis............................................................................................................. 29
Figure 27 M1-2 product specification20 ...................................................................................................... 30
Figure 28 M1-2 product dimensions showing two head configuration20, .................................................. 31
Figure 29 Sample railcar configuration from APTA white paper60, ............................................................ 31
Figure 30 Plan view of UVC source locations (plan view) ........................................................................... 33
Figure 31 Profile view of UVC source locations (profile view) .................................................................... 33
Figure 32 Light 1 (1a+1b), coverage: 29.90% .............................................................................................. 34
Figure 33 Light 2 (2a+2b), coverage: 27.21% .............................................................................................. 34
Figure 34 Light 3 (3a+3b), coverage: 24.09% .............................................................................................. 35
Figure 35 Combine light 1, 2, 3, coverage: 53.72% ..................................................................................... 35
Figure 36 Coverage of bus shell analysis..................................................................................................... 36
Figure 37 Seat coverage analysis ................................................................................................................ 36
Figure 38 Railing coverage analysis............................................................................................................. 36
Figure 39 Plan view of UVC source locations (plan view) ........................................................................... 37
Figure 40 Profile view of UVC source locations (profile view) .................................................................... 37
Figure 41 Left image of source one model showing 40.81% coverage; and Right image of source two
model showing 44.89% coverage ............................................................................................................... 38
Figure 42 Overall Source one and two combined result 59.11% coverage ................................................ 38
Figure 43 Seat coverage analysis ................................................................................................................ 39
Figure 44 Select positions of spectrometer measurements and light source ............................................ 42
Figure 45 UVC spectra shown for all locations on the mini-bus using one-lamp ....................................... 44
Figure 46 UVC spectra highlighting the locations with peak intensities below the 25 µW/cm2 ................ 44
Figure 47 Select positions of low intensity spectrometer measurements on the mini-bus using a single
UVC source configuration. .......................................................................................................................... 45
Figure 48 UVC spectra shown for all locations on the mini-bus using two-lamps ..................................... 46
Figure 49 UVC spectra highlighting the locations with peak intensities below the 25 µW/cm2 ............... 46
Figure 50 UVC spectra showing the intensity comparison between one and two sources for replicate
measurements on the steering wheel ........................................................................................................ 47
Figure 51 UVC spectra showing the intensity comparison between one and two sources for replicate
measurements between two windows ...................................................................................................... 48
Figure 52 UVC spectra shown for all locations on the mini-bus using three-lamps ................................... 49
Figure 53 UVC spectra highlighting the locations with peak intensities below the 25 µW/cm2 ................ 50
Figure 54 Select positions of spectrometer measurements on the mini-bus using a three-UVC source ... 50
Figure 55 UVC spectra showing comparison between one, two, and three UVC sources ......................... 51
Figure 56 UVC spectra showing the intensity comparison between one, two, and three UVC sources
behind rear-most passenger seat ............................................................................................................... 52
Figure 57 UVC spectra for light leakage measurements ............................................................................. 53
Figure 58 Four UVC source configuration #1: Positions A-G and H-O were measured using sources 1, 2,
and 3. .......................................................................................................................................................... 54
Figure 59 Four UVC source configuration #2: Positions P-Z and AA-EE were measured using sources 2, 3,
and 4. .......................................................................................................................................................... 55
Figure 60 Select positions of spectrometer measurements in 40-ft NABI bus ........................................... 55
Figure 61 UVC spectra shown for all locations on 40-ft NABI bus. ............................................................. 57
Figure 62 UVC spectra highlighting the six locations with peak intensities below the 25 µW/cm2 ........... 57
Figure 63 Intensity of light vs. line of sight distance for all sample locations on the NABI bus ................. 58
Figure 64 Photograph showing the proximity of the UVC Mercury source to the pulsed Xenon source. . 60
Figure 65 Photograph showing the pulsed Xenon source unit set up ........................................................ 60
Figure 66 Single pulse Xenon spectrum, captured from bus position I using a 75 mS integration ............ 62
Figure 67 Single pulse Xenon spectrum, captured from bus position I using a 35 mS integration ............ 62
Figure 68 Comparison of the Mercury vs. the pulsed Xenon source spectrum ......................................... 63
Figure 69 UV and visible light spectra for light leakage .............................................................................. 65
Figure 70 Lantern UV System ...................................................................................................................... 66
Figure 71 Helo F1 UV Fixture ...................................................................................................................... 67
Figure 72 Sentry M1-2 Mobile UV Unit ....................................................................................................... 67
Figure 73 Industrial Portable 300W UVCART300 ........................................................................................ 68
Figure 74 Diversey MoonBeam 3 UVC Device ............................................................................................ 68
Figure 75 Sanidyne Prime UVC Portable ..................................................................................................... 69
Figure 76 SPECTRA 500 UV Disinfection System ......................................................................................... 69
Figure 77 Torch Tower ................................................................................................................................ 70
Figure 78 LightStrike Germ-Zapping Robot ................................................................................................. 71
Figure 79 Tru-D SmartUVC .......................................................................................................................... 71
Figure 80 MRS33-8 Mobile UV Unit ............................................................................................................ 72
Figure 81 MRS45-12 Mobile UV Unit .......................................................................................................... 72
Figure 82 UV-C High Power System ............................................................................................................ 73
Figure 83 Optimum-UV Enlight System ...................................................................................................... 73
Figure 84 Industrial Portable 1000W UVCART1000 .................................................................................... 74
Figure 85 GermFalcon ................................................................................................................................. 74
Figure 86 Example of auto retracting cord reel with 12AWG x 50-ft and triple glow outlets .................... 82
Figure 87 Example of extension cord reel 25-ft manual hand crank 16/3 AWG ........................................ 82
Figure 88 Rolling cart with UVC sources and supplies ................................................................................ 83
Figure 89 Caution signage warning that safety glasses are required ......................................................... 83
Figure 90 Inverted UVC source positioned near the back of the bus ......................................................... 84
Figure 91 UVC source positioned on pedestal near center of bus ............................................................. 84
Figure 92 Inverted UVC source with safety chain ....................................................................................... 84
Figure 93 Illuminated UVC source observed through the windshield ........................................................ 85
Figure 94 Pulsed Xenon UVC source placement on mini-bus ..................................................................... 86
Figure 95 Gantt Chart for setup, run, removal of pulsed UVC sources - full chart shows 42 buses per shift
which averages to 6 per hour ..................................................................................................................... 91
Figure 96 NFI Parts Power Vented Safety Roof Hatch Kit .......................................................................... 98
Figure 97 NFI MERV 8 filter with antimicrobial approved for MCI74, ....................................................... 103
Figure 98 Example UVC air cleaning process within a building’s HVAC system (ASHRAE)., .................... 106
Figure 99 NFI Parts - UV-C Lighting Kit ...................................................................................................... 111
Figure 100 SanUVAire - Breathe-Safe System, Air Purification & Coil Disinfection .................................. 111
Figure 101 Mobile Climate Control (MCC) - Aire-Shield UVC ................................................................... 112
Figure 102 Climate Comfort Technologies CCT 24V-1 .............................................................................. 118
Figure 103 United Safety RGF PHI Cell Technology Photocatalytic Oxidizer ............................................ 118
Figure 104 Luminator - Grignard Pure ...................................................................................................... 119
Figure 105 Ford Explorer police cruiser undergoing studies on heat increase application ...................... 122
Figure 106 Modified Honda Odyssey with view of interior polycarbonate barrier .................................. 124
Figure 107 Pressure differentials shown within the vehicle ..................................................................... 125
List of Tables Table 1 UVC Spectrometer measurements for one-lamp configuration .................................................... 43
Table 2 UVC Spectrometer measurements for two-UVC source configuration ......................................... 45
Table 3 UVC Spectrometer measurements for three-lamp configuration ................................................. 49
Table 4 UVC Spectrometer measurements for light leakage ...................................................................... 53
Table 5 UVC Spectrometer measurements for 40-ft NABI ......................................................................... 56
Table 6 Qualitative summary of damage to common healthcare polymers from UV exposure,44, ........... 78
Table 7 Typical MERV Rating Chart ........................................................................................................... 100
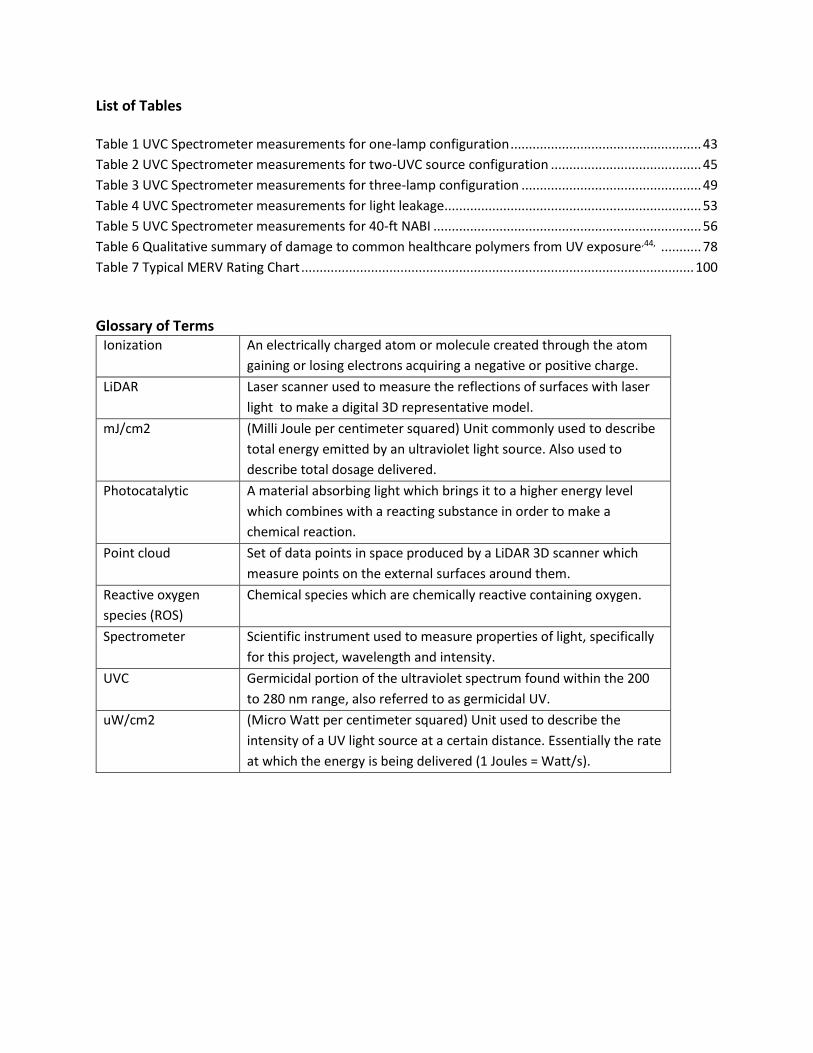
Glossary of Terms Ionization An electrically charged atom or molecule created through the atom
gaining or losing electrons acquiring a negative or positive charge.
LiDAR Laser scanner used to measure the reflections of surfaces with laser
light to make a digital 3D representative model.
mJ/cm2 (Milli Joule per centimeter squared) Unit commonly used to describe
total energy emitted by an ultraviolet light source. Also used to
describe total dosage delivered.
Photocatalytic A material absorbing light which brings it to a higher energy level
which combines with a reacting substance in order to make a
chemical reaction.
Point cloud Set of data points in space produced by a LiDAR 3D scanner which
measure points on the external surfaces around them.
Reactive oxygen
species (ROS)
Chemical species which are chemically reactive containing oxygen.
Spectrometer Scientific instrument used to measure properties of light, specifically
for this project, wavelength and intensity.
UVC Germicidal portion of the ultraviolet spectrum found within the 200
to 280 nm range, also referred to as germicidal UV.
uW/cm2 (Micro Watt per centimeter squared) Unit used to describe the
intensity of a UV light source at a certain distance. Essentially the rate
at which the energy is being delivered (1 Joules = Watt/s).
1
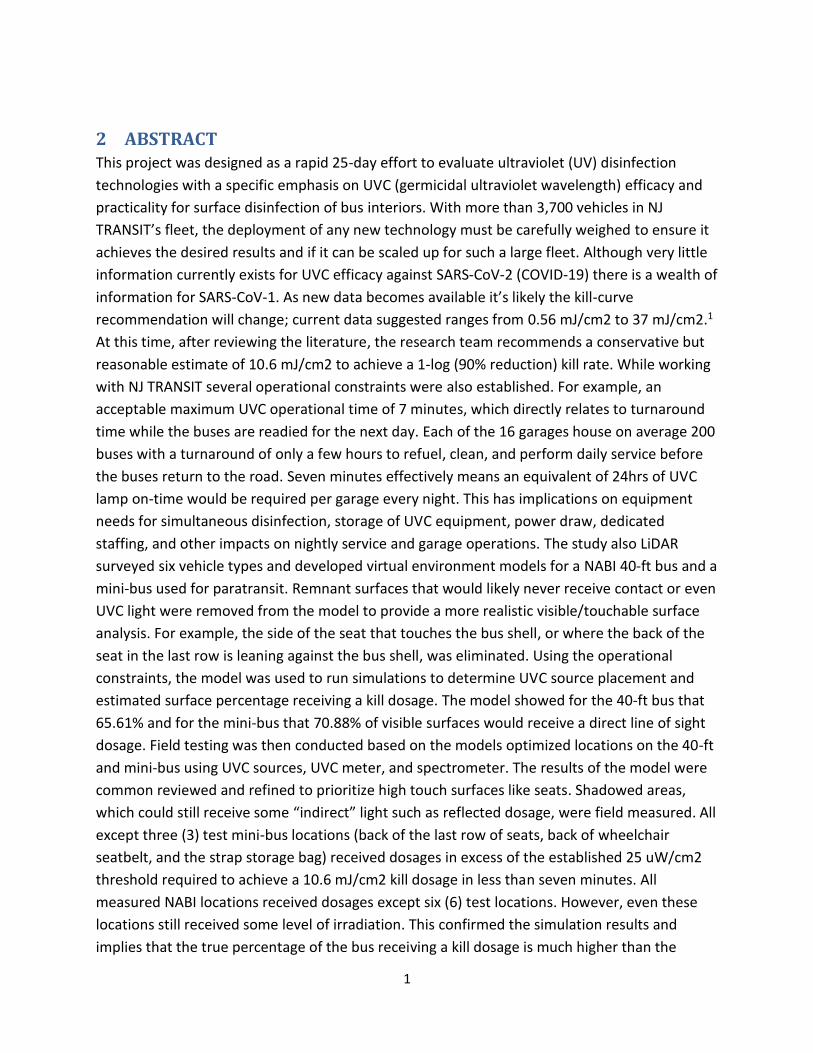
2 ABSTRACT This project was designed as a rapid 25-day effort to evaluate ultraviolet (UV) disinfection
technologies with a specific emphasis on UVC (germicidal ultraviolet wavelength) efficacy and
practicality for surface disinfection of bus interiors. With more than 3,700 vehicles in NJ
TRANSIT’s fleet, the deployment of any new technology must be carefully weighed to ensure it
achieves the desired results and if it can be scaled up for such a large fleet. Although very little
information currently exists for UVC efficacy against SARS-CoV-2 (COVID-19) there is a wealth of
information for SARS-CoV-1. As new data becomes available it’s likely the kill-curve
recommendation will change; current data suggested ranges from 0.56 mJ/cm2 to 37 mJ/cm2.1
At this time, after reviewing the literature, the research team recommends a conservative but
reasonable estimate of 10.6 mJ/cm2 to achieve a 1-log (90% reduction) kill rate. While working
with NJ TRANSIT several operational constraints were also established. For example, an
acceptable maximum UVC operational time of 7 minutes, which directly relates to turnaround
time while the buses are readied for the next day. Each of the 16 garages house on average 200
buses with a turnaround of only a few hours to refuel, clean, and perform daily service before
the buses return to the road. Seven minutes effectively means an equivalent of 24hrs of UVC
lamp on-time would be required per garage every night. This has implications on equipment
needs for simultaneous disinfection, storage of UVC equipment, power draw, dedicated
staffing, and other impacts on nightly service and garage operations. The study also LiDAR
surveyed six vehicle types and developed virtual environment models for a NABI 40-ft bus and a
mini-bus used for paratransit. Remnant surfaces that would likely never receive contact or even
UVC light were removed from the model to provide a more realistic visible/touchable surface
analysis. For example, the side of the seat that touches the bus shell, or where the back of the
seat in the last row is leaning against the bus shell, was eliminated. Using the operational
constraints, the model was used to run simulations to determine UVC source placement and
estimated surface percentage receiving a kill dosage. The model showed for the 40-ft bus that
65.61% and for the mini-bus that 70.88% of visible surfaces would receive a direct line of sight
dosage. Field testing was then conducted based on the models optimized locations on the 40-ft
and mini-bus using UVC sources, UVC meter, and spectrometer. The results of the model were
common reviewed and refined to prioritize high touch surfaces like seats. Shadowed areas,
which could still receive some “indirect” light such as reflected dosage, were field measured. All
except three (3) test mini-bus locations (back of the last row of seats, back of wheelchair
seatbelt, and the strap storage bag) received dosages in excess of the established 25 uW/cm2
threshold required to achieve a 10.6 mJ/cm2 kill dosage in less than seven minutes. All
measured NABI locations received dosages except six (6) test locations. However, even these
locations still received some level of irradiation. This confirmed the simulation results and
implies that the true percentage of the bus receiving a kill dosage is much higher than the
2
model prediction. This includes reflections onto critical high-touch areas such as armrests,
backs of seatbelts, tops of handrails near the ceiling, and the back of some seats. However, any
gap in coverage of a critical or high touch surfaces like a seatbelt raises overall efficacy concerns
for UVC disinfection of surfaces. Although UVC for disinfection is highly effective there are a
number pragmatic considerations too. In comparison to chemical disinfection via spray and air-
dry procedures, using a portable UVC source does not appear to save labor time or cost.
Nevertheless, portable UVC can still be invaluable to supplement chemical disinfection for
particular applications. For example, UVC disinfection might be used to further minimize risk as
a redundant safety procedure; such as when its known that a bodily fluid was discharged (i.e.
blood, vomit) or if an employee is confirmed COVID-19 positive. Ultimately, in comparison to
the simplicity and speed of spraying an EPA List N approved chemical disinfectant, the time and
logistics of UVC may not be practical for fleet wide deployment for surface disinfection but it
can still be a valuable tool. The research team was also asked to review available literature
concerning HVAC disinfection devices for air treatment. Increased ventilation and better
filtration are commonly cited as recommendations. If system performance permits, the HVAC
should be upgraded to MERV 13 or better filter, or the highest compatible filter, at a minimum
MERV 8, preferably with antimicrobial. At this time, in reference to in-duct ion and
photocatalytic oxidation systems, the research team has health and efficacy concerns. Similarly,
due to low UVC exposure time the in-duct UVC devices it is unclear if they achieve the full kill
dosage required. However, due to the rapid air exchanges within the bus HVAC system,
repeated in-duct UVC exposure may result in a net cumulative dosage that weakens or possibly
kills some unknown percentage of virus. This approach may lower the overall risk exposure
without the same health concerns. However, it’s more than likely that the HVAC cannot be
upgraded to MERV 13 or better either due to filter availability, lack of pressure testing data, or
overall HVAC system inability; therefore, it’s highly-recommended to further investigate and
incorporate an in-duct system such as in-duct UVC system along with at a minimum MERV 8
filter.
3
3 DESCRIPTION OF THE PROBLEM
Due to the COVID-19 pandemic, extra measures are being taken in the regular disinfection of
public spaces, including all forms of public transportation. The supplementation of ultraviolet
(UV) disinfection devices to current cleaning practices used on public transit vehicles, stations,
and facilities has the potential to reduce the spread of COVID-19, restore the general public’s
confidence in using public transportation, and expedite restart and recovery.
This effort was conducted by Rutgers University’s Center for Advanced Infrastructure and
Transportation (CAIT) in partnership with the Environmental and Occupational Health Sciences
Institute (EOHSI) in response to NJ TRANSIT’s request for assistance in the investigation of the
applicability and feasibility of disinfection devices for use on their public transit vehicles. The
ability to kill or disable viruses is of keen importance during the COVID-19 pandemic as well as
for the recovery periods that follow to make customers more confident in their use of public
transit, particularly vulnerable transit customers such as seniors or customers with disabilities.
Recent studies have shown that rider confidence is down drastically when it comes to using
public transportation. Surveys as recently as April 2020 have consistently shown that between
48% and 54% of riders were found to be averse to taking public transportation.2,3 “More than
20% of respondents who regularly used buses, subways or trains now said they no longer
would, and another 28% said they likely would use public transportation less often.”
In response to the COVID-19 pandemic, NJ TRANSIT has enhanced its cleaning procedures to
disinfect its vehicles every 24 hours, and at major stations and terminals on each shift
throughout the day in an effort to help control the spread of coronavirus. In coordination with
this enhanced cleaning regime, the use of UVC disinfection during these cleaning times shows
potential to help reduce the spread of COVID-19 and restore rider confidence.
Ultraviolet light in the germicidal range (200-280 nm light) known as “UVC” has proven to be
effective at disinfecting water and surfaces, and may help reduce the risk of infection due to
the COVID-19 virus. UVC light energy is not the same as the UVA and UVB light wavelengths
found in exposure to sunlight.
As per NJ TRANSIT’s request, the purpose of this study is to test and provide validation support
for a pilot UVC deployment. The research team was tasked to perform a LiDAR survey of
representative bus vehicles and model the placement of UVC light sources to quantify the
surface areas that would receive UVC disinfection exposure. The team was also to perform field
validation tests using a spectrometer to measure the intensity of exposure throughout the bus
based on the recommended locations from the LiDAR survey. Lastly, the team was to review
potential air disinfection technologies within the context of published materials.
4
4 APPROACH This project was designed as a rapid 25-day effort to evaluate UVC disinfection technologies
with a specific emphasis on UVC efficacy and practicality for surface disinfection of bus
interiors. With over 3,700 vehicles in NJ TRANSITs bus fleet the deployment of any new
technology must be carefully weighed to ensure it achieves the desired results and if it can be
scaled up for such a large fleet. The research approach focused on fast turnaround of results for
NJ TRANSIT. For this reason, certain assumptions, operational parameters, and simplified
testing processes were established to expedite results. A more robust testing schema is
recommended to expand on these initial findings.
For example, Mercury UVC bulbs are readily available from many manufacturers and are used
in a variety of different UVC devices. These devices have differing number of total bulbs, bulb
length, intensity, power requirements, size, weight, timers, motion sensors, intensity sensors,
and other features. However, the intent was not to identify a specific vendor for deployment
but instead provide guidance on the overall ability of UVC to provide the irradiance, or more
specifically energy over a time duration required to disinfect. A variety of devices were
identified as reference to ensure that indeed a commercially available product exists that
matches the operational parameters required. Therefore, a representative UVC source was
used for this project even though a number of devices were identified that could be used with
differing durations and placements.
The research approach of this project addresses:
• Literature search and best practices
• UVC disinfection of surfaces
o LiDAR assisted Bus Sanitization Modeling: Perform LiDAR survey inside bus, build
BIM model of bus, model UVC source locations to determine line of sight
coverage
▪ Testing efficacy of the UVC disinfection: UVC intensity measured
spectrophotometrically and with a UVC meter, ensuring that a high
enough UVC light intensity is achieved at all spaces to be disinfected.
o UV light bleed - validate exterior safety measures, measure any exterior UVA,
UVB, and UVC penetration through windows
o Identify commercially available UVC devices and collect general information on
o Preliminary cable management and power
• HVAC and airflow for air disinfection
o Review best practices and any vendor/agency recommendations for HVAC
filtration and UVC treatment in HVAC. Review ion generation technology within
the context of published materials.
5
5 FINDINGS
5.1 Best Practices and Literature Review
Disinfectants and biocidal agents employ non-specific methods for either inactivating or
membrane disruption of microbial pathogens (i.e. bacteria, fungi or viruses) often found in
droplets that can lead to epidemics or pandemics. Non- “chemical” disinfection techniques
include, for example, ultraviolet germicidal irradiation (UVGI), photocatalytic oxidation (PCO),
or plasma ion generation. The disinfection efficacy is driven by physicochemical characteristics
of the agent, as well as the cell morphology, and physiological status of the microorganism.
Membrane disruption, macromolecular modification, and metabolic inhibition create
downstream effects that render the pathogen neutralized, either directly resulting in cell death
or by initiation of self-destructive processes.
5.1.1 Ultraviolet Background and Kill Dosage
Ultraviolet (UV) light to disinfect is widely used in clinical, water treatment, and other settings.
UV is found in the 100-400 nm wavelength with UV-A, UV-B, and UV-C being subsets. UVC is
well established as germicidal in the 200-280 nm wavelengths where 254 nm is commonly cited
as the germicidal wavelength as it’s generated from readily available Mercury UVC bulbs. In
addition to Mercury UVC there are also LED and pulsed Xenon (sometimes referred to as PX-
UV) lamps. Mercury bulbs are “on” with a constant wave UVC intensity; while pulsed Xenon
flashes “on/off” at a higher intensity every few seconds. LED UVs don’t contain Mercury and
have longer lifecycles. However, they are much less common than Mercury bulbs. Due to the
different mechanism and sources, the amount and duration of disinfecting energy is different
as are the specific wavelengths produced. Regardless of the source, UVC light within the 200-
280 nm range has been shown to inactivate viruses by altering the DNA of the virus, thus
rendering it unable to reproduce and spread amongst humans.
While UVC light may be effective at killing bacteria and viruses, it also poses a health risk to
humans. Light within this spectrum can cause damage to the outer epidermal layer as well as
well as the outer layer of the cornea. The 222 nm wavelength referred to as Far-UVC is more
recently cited as claiming to reduce human exposure risk while still providing germinal benefits.
Wavelengths of UVC light in the 222 nm are said to be safer on the skin and corneal tissue than
other more commonly found UVC light sources which generally operate around the 254 nm
range, although there have been inconsistent studies confirming these claims.4,5
At the lowest end of the ultraviolet spectrum, the 100- 200 nm range, UVC light begins to
produce ozone as a bi-product by reacting with the air. Ozone has the potential to be used as
an additional disinfecting measure, but comes with its own health risks including irritating nasal
6
passages, nausea, and with longer exposures, lung inflammation.6 Therefore, the UVC in the
254 nm wavelength was selected for the purposes of this project since it is well established for
disinfection and its health exposure complications are known and manageable.
Very little information currently exists for UVC efficacy to disinfect SARS-CoV-2 (COVID-19)
however there is a wealth of information for SARS-CoV-1. As new data becomes available it’s
likely the kill-curve recommendation will change; current data suggested ranges from 0.56
mJ/cm2 to 37 mJ/cm2 1 and even higher. After reviewing several journal articles, the recently
published May 2020 paper titled Ultraviolet irradiation doses for coronavirus inactivation –
review and analysis of coronavirus photoinactivation studies provides an excellent summary.
“Coronavirus inactivation experiments with ultraviolet light performed in the past were
evaluated to determine the UV radiation and dose required for a 90% virus reduction. This
analysis is based on the fact that all coronaviruses have a similar structure and similar RNA
strand length. The available data reveals large variations, which are apparently not caused by
the coronaviruses but by the experimental conditions selected. If these are excluded as far as
possible, it appears that coronaviruses are very UV sensitive. The upper limit determined for
the log-reduction dose (90% reduction) is approximately 10.6 mJ/cm2 (median), while the true
value is probably only 3.7 mJ/cm2 (median).” 1
The paper goes onto discuss the results of 34 published studies for many different
coronaviruses, including SARS-CoV-1, MERS, and others but not SARS-CoV-2. It also discusses
the methodology to and the elimination of outliers and results from higher-absorption media
suggesting that “the total median log reduction dose would be 3.7 mJ/cm2 (average 5.8±5.5
mJ/cm2).”1
For the purposes of this feasibility study the research team used 10.6 mJ/cm2, which
conservatively will result in a 1-log (90% reduction) kill rate. Please note that according to a July
7, 2020 press release, US Environmental Protection Agency (EPA) has partnered with Los
Angeles Metropolitan Transportation Authority to evaluate a number of new technologies,
including UVC and air filtration for public transit systems to address COVID-19.7 When the
recommendation from EPA to achieve a kill dosage is finalized at some later date, if it’s closer to
3.7 mJ/cm2 then the 10.6 mJ/cm2 would likely result in a 2-log (99% reduction) or better.
5.1.2 What are Transit Agencies Doing
NJ TRANSIT has increased cleaning efforts in order to better combat the spread of SARS-CoV-2
(COVID-19) through daily disinfection of their bus fleet using foggers containing known antiviral
pesticide solutions. In response to the COVID-19 pandemic, NJ TRANSIT has enhanced its
cleaning procedures to disinfect its vehicles every 24 hours, and at major stations and terminals
7
on each shift throughout the day in an effort to help control the spread of coronavirus. In
coordination with this enhanced cleaning regime, the additional use of UVC disinfection during
these cleaning times shows potential to help reduce the spread of COVID-19 and restore rider
confidence.
Transit agencies throughout the US and worldwide have also begun to use new technologies
such as UVC light to help disinfect their vehicles in an effort to reduce the spread of COVID-19.
Internationally, the public transportation firm Yanggao in Shanghai, China is using UVC
disinfection lights inside bus interiors as well as UVC lighted cleaning bays to illuminate each
bus from the outside as well. Transit authorities within the U.S. such as New York’s
Metropolitan Transportation Authority (MTA) have also begun to explore the usage of UVC. A
pilot study using a pulsed xenon UVC system manufactured by Puro UV Disinfection Lighting
onboard their subway is currently underway with plans to eventually expand the use of UVC
disinfection to their entire fleet of vehicles.
The Southeastern Pennsylvania Transportation Authority (SEPTA) has currently increased their
sanitizing efforts of both their rail vehicles as well as buses to at least twice per day utilizing
backpack sprayers with disinfecting pesticides, and an additional deep cleaning of each vehicle
every 14 days.8
Dallas Area Rapid Transit (DART) has recently adopted an increased daily cleaning regime using
hydrogen peroxide foggers as well. Long before the COVID-19 outbreak, DART also equipped
over 70% of their buses with SanUVAire Breathe Safe Germicidal UV Systems which utilize UVC
disinfection within the HVAC units to help kill viruses as air is recirculated throughout the bus. 9
Without conducting a full survey of Transit agencies it’s impossible to know exactly what each
agency is doing to address COVID-19. However, for reference purposes the research team
scanned media reports and agency websites to capture a sample of activities that major transit
agencies are deploying or researching; these include:
1. New York City Transit Authority a) EPA-registered antimicrobial products b) Ultraviolet light (UV) c) Ozone d) Steam e) Electrostatic sprayers f) Foggers
2. Washington Metropolitan Area Transit Authority
a) Frequent cleaning of buses, trains and high-touch surfaces b) Rear-door boarding c) Supply conservation

8
d) Mask/face-covering requirement e) Additional buses to provide more capacity/service
3. Chicago Transit Authority
a) Rear-door boarding b) Ridership limits c) Electrostatic sprayers d) Preventative surface coatings e) UVC Lighting
4. Massachusetts Bay Transportation Authority
a) Daily disinfecting with focus on high-touch points b) Fogging c) Electrostatic sprayers
5. Bay Area Rapid Transit District
a) Hospital-grade disinfectant in stations and on trains b) Longer trains to help promote social distancing c) Personal hand straps d) UVC lighting
6. Port Authority of New York and New Jersey
a) Required face masks/coverings b) Disinfect high touch areas 3 times per day c) Electrostatic sprayers d) Deploying hand sanitizer stations e) Increased train schedule
7. Southeastern Pennsylvania Transportation Authority
a) Rear-door boarding b) Ridership limitations c) Increased cleaning/disinfecting d) Operator shields e) Markers for social distancing
8. Metropolitan Atlanta Rapid Transit Authority
a) Electrostatic sprayers b) Traditional cleaning c) Increased frequency of cleaning
9. Los Angeles County Metropolitan Transportation Authority
a) Disinfect high-touch surface 3 times per day b) EPA-approved disinfectants c) UVC lighting
9
d) Air filtration systems,
10. Miami-Dade Transit a) Increased disinfection frequency b) Sprayers c) Installing hand sanitizer units aboard buses d) Additional busses
11. Port Authority Transit Corporation
a) Enhanced cleaning and sanitization of High-touch areas b) Awareness campaign promoting hygiene c) Participating in workshops to share information and best practices
12. Staten Island Rapid Transit Operating Authority
a) Changed schedule to match Staten Island Ferry b) Staten Island Ferry requires masks and is using markers to promote social
distancing
13. Maryland Transit Administration a) Face mask requirement b) Increased frequency of disinfecting high-touch surfaces
14. Greater Cleveland Regional Transit Authority
a) UVC lighting to clean high traffic areas b) cleaning all touchable surfaces with a cleaning agent recommended by the
Centers for Disease Control (CDC).
As of the time this report was prepared, the only recommended disinfection for transit vehicles
by the Center for Disease Control and Prevention (CDC) is through pesticides found on the
United States Environmental Protection Agency’s (EPA) “List N” disinfectants, containing
primarily hydrogen peroxide, quaternary ammonium, and chlorine-based products. There are
currently no EPA or CDC recommended guidelines for the use of UVC light towards the
disinfection of transit vehicles (viruses in general).
The American Public Transportation Association (APTA) is currently recommending that all
transit agencies perform their own research when it comes to the use of UVC light for
disinfection of their vehicles as there are currently no consolidated list of UVC products
suitable for use by transit agencies nor are there any established standards. 10
10
5.1.3 Other than List N disinfectants
EPA List N includes surface disinfectants registered with EPA but does not include devices such
as UVC for surface or air treatment, ion generators, ionizer/electrolytic, and ozonation devices.
The EPA doesn’t routinely review efficacy of UV disinfection devices nor other pesticidal
devices. Although the devices are not regulated, the manufacturers cannot make false and
misleading claims. Therefore, manufacturers are required to have scientific data to support
their claims. EPA “therefore cannot confirm whether, or under what circumstances, such
products might be effective against the spread of COVID-19.” 11
5.1.4 Health and safety guidance
The recommended maximum UVC exposure time given by the National Institute for
Occupational Safety and Health (NIOSH) is no more than one minute at 50 uW/cm2 (which
calculates to do not exceed 3 mJ/cm2 per 1-minute of exposure) total irradiance incident on
unprotected skin or eyes.12,13 Occupational Safety and Health Administration (OSHA) does not
have an established UV level of exposure limit. According to the 2004 International Commission
on Non-Ionizing Radiation Protection (ICNIRP) report the amount of 254 nm wavelength should
not exceed 6 mJ/cm2 per 8-hour exposure.14 This is quite low and would be exceeded rapidly
while working unprotected in proximity to any of the commonly available devices. Therefore,
precautions such as PPE, protocols to avoid exposure, employee training, motion sensors to
shut off devices, or a combination of these measures must be used to ensure worker exposure
is less than the one minute recommended by NIOSH.
While UVC light is absorbed (i.e. filtered out) by most conventional glass and plastic, there are
some additional concerns regarding pulsed Xenon lamps. The pulsed Xenon flashes and
produces a wavelength in the visual spectrum that readily passes through the windows, which
can be a visual distraction and a potential hazard for drivers and workers in the bus
garage/depot environment.
As with any common fluorescent and compact fluorescent lights (CFLs), the bulbs contain
harmful Mercury. Generally, these bulbs are safe from Mercury contact exposure when intact,
but do pose a safety risk when broken. Procedures and guidelines for disposal and handling of
broken UVC bulbs is comparable to similar size standard fluorescents. Precautions should be
taken while handling to avoid bulb breakage. Loose dangling power cords or safety chains,
coiling of power cords, bumping, dropping, etc. can all result in broken bulbs and Mercury
exposure. Unlike standard fluorescents, UVC bulbs use quartz glass which allow the UVC
wavelength to pass through the glass; this type of glass has the same potential hazard of any
broken glass. Efforts to minimize dispersal, generating dust, and spreading of the Mercury
vapor should be taken, turn off blowers, avoid using vacuum cleaners, use stiff paper to scoop
11
up debris, use duct tape to pick up small bits, use a damp cloth, and properly dispose of waste
in a plastic bag or closed container. EPA has developed cleanup and disposal guidance to
minimize health risk exposure, these have been included in the appendix of this report.
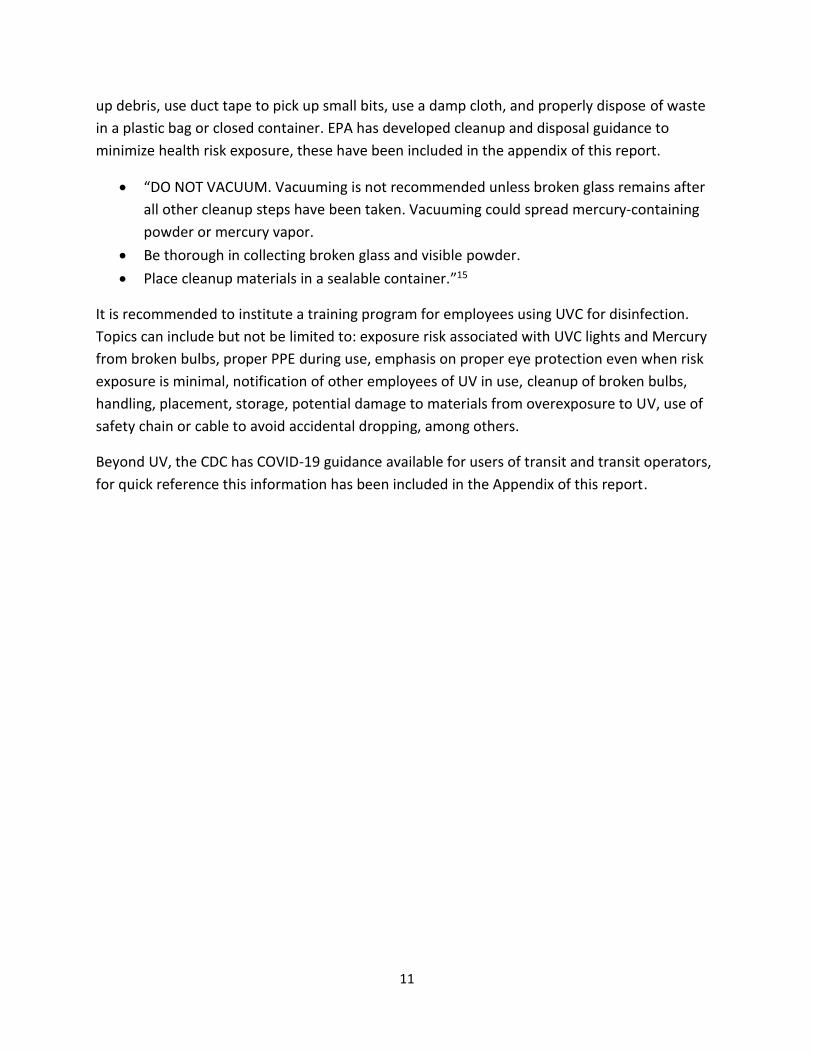
• “DO NOT VACUUM. Vacuuming is not recommended unless broken glass remains after
all other cleanup steps have been taken. Vacuuming could spread mercury‐containing
powder or mercury vapor.
• Be thorough in collecting broken glass and visible powder.
• Place cleanup materials in a sealable container.”15
It is recommended to institute a training program for employees using UVC for disinfection.
Topics can include but not be limited to: exposure risk associated with UVC lights and Mercury
from broken bulbs, proper PPE during use, emphasis on proper eye protection even when risk
exposure is minimal, notification of other employees of UV in use, cleanup of broken bulbs,
handling, placement, storage, potential damage to materials from overexposure to UV, use of
safety chain or cable to avoid accidental dropping, among others.
Beyond UV, the CDC has COVID-19 guidance available for users of transit and transit operators,
for quick reference this information has been included in the Appendix of this report.
12
5.2 UVC Disinfection of Surfaces
UVC has been used for more than 40 years to disinfect drinking water, waste water, air, and
surfaces, and all bacteria and viruses tested to date respond to UV disinfection. UVC
disinfection systems are already being used in some hospitals globally and have been shown to
reduce infection rates at hospitals as much as 30% when added to regular cleaning.16 In
addition to UVC lamps and robotic systems being used in select hospitals, some international
transit agencies have also begun deploying UVC systems in an effort to reduce the spread of
coronavirus. The public transportation firm Yanggao in Shanghai, China is currently using UVC
disinfection lights inside bus interiors as well as UVC lighted cleaning bays to illuminate each
bus from the outside as well. Transit authorities within the U.S. such as New York’s
Metropolitan Transportation Authority (MTA) have begun to explore the usage of UVC
disinfection as well through the trial use of UVC lamps within their subway vehicles.
Deploying UV disinfection systems across NJ TRANSIT’s significant assets is a sizable
undertaking with a daily weekday ridership of nearly 1M riders. Broadly speaking, NJ TRANSIT
assets include: 166 rail stations, 62 light rail stations, 30 bus terminals, and more than 16,000
bus stops; 1,081 commuter railcars and 71 light railcars; and 3,707 buses (owned and leased).
Given the time sensitive nature of this project the research team implemented a rapid and
practical approach to this study with respect to the technologies available. UVC disinfection has
been shown to be very effective in the past. However, there are some practical considerations
that were made:
• Time and distance - Light dissipates with distance, therefore the further a UV bulb is
from a surface the less effective it will be at disinfecting. Alternatively, a UVC bulb will
require more time to achieve the same disinfection as one that is closer. Therefore, bulb
intensity, time, and distance are all major factors.
• Light travels in a straight line – Surfaces that are shadowed or not in the line of sight of
the UV bulb will not receive full intensity disinfection, though there might be some level
of UV penetration into shadowed areas. Therefore, the straightest line to the surface
being disinfected is a major factor.
• Prioritize disinfection of horizontal surfaces - Horizontal surfaces tend to be: a) high
touch areas and b) a larger percentage of settlement zones. Therefore, any technology
that can show a preference for horizontal surfaces will likely be more effective at
eliminating COVID-19 virus.
While working with NJ TRANSIT, several operational constraints were established. For example,
an acceptable UV operational time of 7 minutes; which directly relates to turnaround time
while the buses are readied for the next day. Each of the 16 garages house on average 200
buses with a turnaround of only a few hours to refuel and perform daily service before the
13
buses return to the road. This effectively means that an equivalent of 24hrs of UV lamp on-time
would be required per garage every night. This has implication on equipment needs for
simultaneous disinfection, storage of UV equipment, power draw, dedicated staffing, and other
impacts on nightly service and garage operations.
[200 buses * 7 minutes per bus / 60 minutes per hour = 23.3 hrs disinfection per garage]
These items have been addressed in detail in the following sections. However, the overarching
goal of this task was to provide NJ TRANSIT with rapid results on recommended UVC light
positions and corresponding intensity of light delivered over interior surfaces based on a
continuous Mercury UV light source already purchased by NJ TRANSIT.
14
5.2.1 LiDAR Model
5.2.1.1 LiDAR scan and coverage modeling
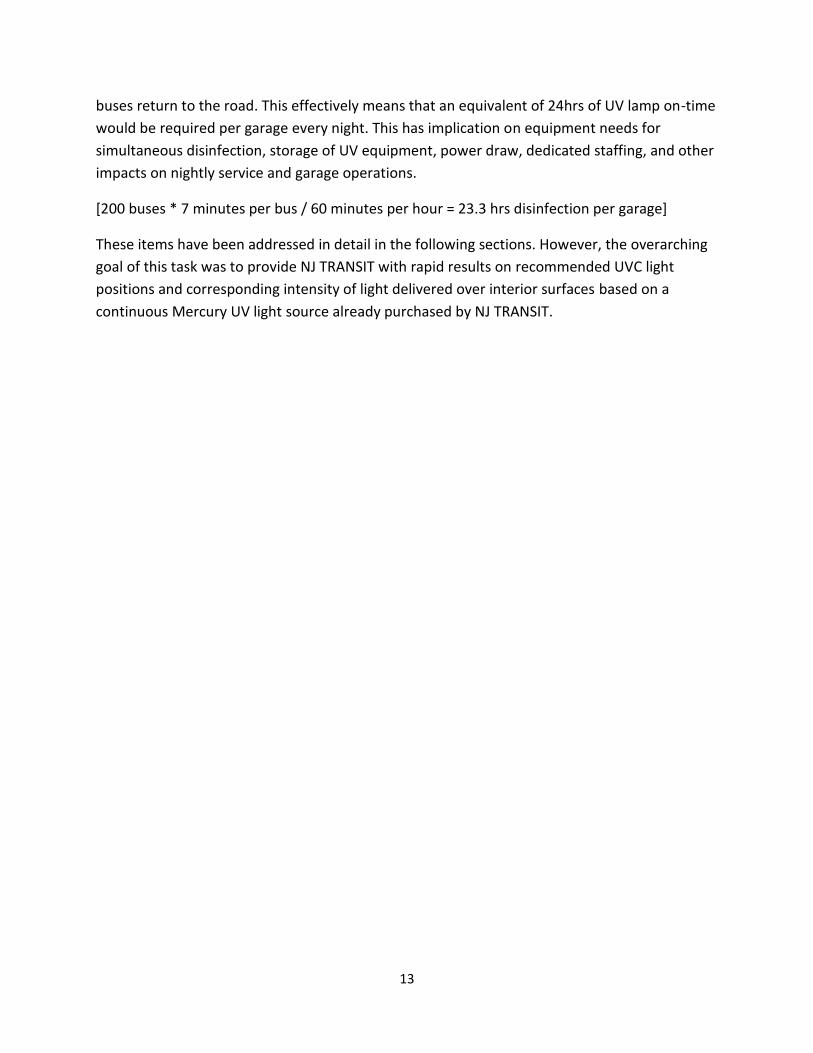
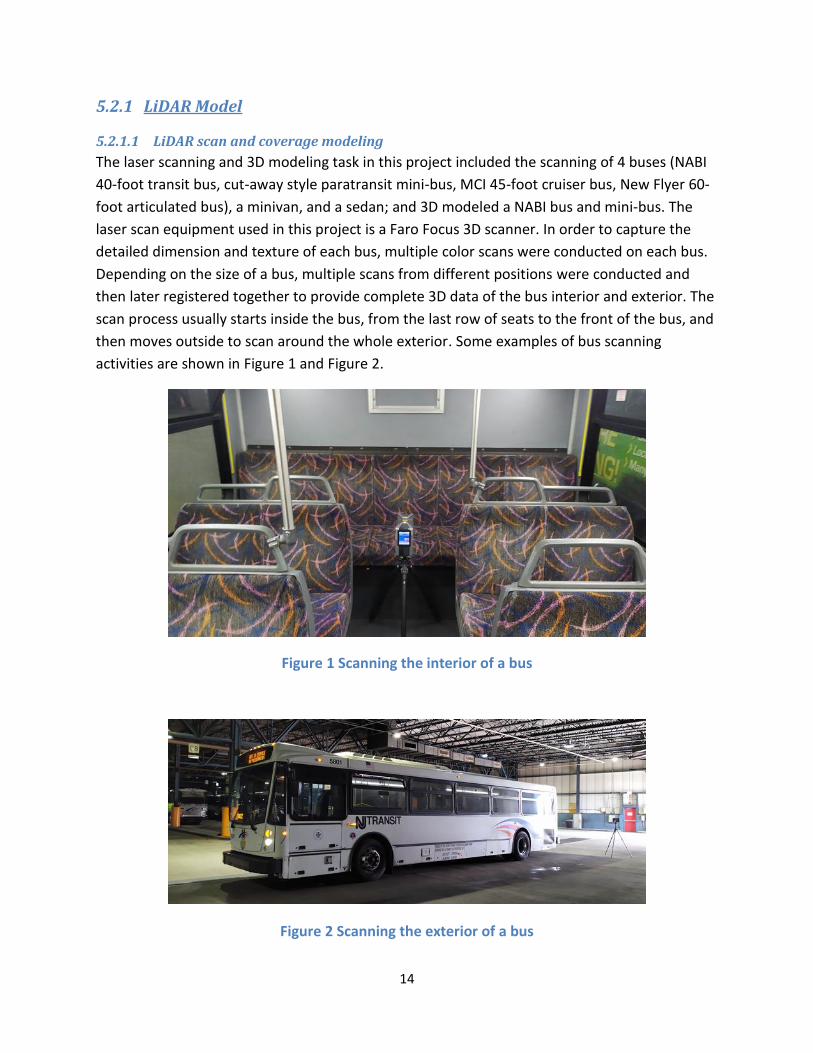
The laser scanning and 3D modeling task in this project included the scanning of 4 buses (NABI
40-foot transit bus, cut-away style paratransit mini-bus, MCI 45-foot cruiser bus, New Flyer 60-
foot articulated bus), a minivan, and a sedan; and 3D modeled a NABI bus and mini-bus. The
laser scan equipment used in this project is a Faro Focus 3D scanner. In order to capture the
detailed dimension and texture of each bus, multiple color scans were conducted on each bus.
Depending on the size of a bus, multiple scans from different positions were conducted and
then later registered together to provide complete 3D data of the bus interior and exterior. The
scan process usually starts inside the bus, from the last row of seats to the front of the bus, and
then moves outside to scan around the whole exterior. Some examples of bus scanning
activities are shown in Figure 1 and Figure 2.
Figure 1 Scanning the interior of a bus
Figure 2 Scanning the exterior of a bus
15
5.2.1.2 Scan Data Post Processing
After data collection, each of the individual scans were registered together by using real time,
on-site registration, automatic object recognition, scan registration, and positioning functions.
After the data registration, the point cloud of the bus and associated features was generated.
Then this point cloud was cut and colorized to generate a better visual representation. The
registered and processed point cloud result is shown in Figure 3.
Figure 3 Exterior view of bus point cloud
5.2.1.3 3D Modeling
After the registration and cleaning process, the bus point cloud was exported to Autodesk
Recap file, which is a compatible format of Autodesk Revit. The Recap file was imported into
Revit, and a bus model was built by tracing the dimension of point cloud. When finished, the
newly built models can be exported into the suitable format for the subsequent analysis. The
final models are shown in Figure 4 and Figure 5.
16
Figure 4 Model of NABI bus
Figure 5 Model of mini-bus
17
5.2.2 UVC Source Direct Line of Sight Coverage Analysis
The following section describes two parallel efforts to identify the optimum UVC source
placements and quantify the total line of sight coverage using the previously developed models
from the LiDAR scans.
5.2.2.1 Point cloud-based approach
The point cloud-based approach is described in the Figure 6.
Figure 6 Line of sight analysis (point cloud-based approach)
The method can be further divided into three steps:
• Step 1: Point cloud generation. Based on the previous built 3D bus model, sample points
from the mesh model in a way to make sure that the points are evenly distributed on the
bus surface.
• Step 2: Line of sight analysis. Given the light position, construct the lines of sight between
the light and all the points. Visible points are determined if the lines of sight are not
occluded by the 3D bus model. The line of sight analysis function is implemented through
the Python script.
• Step 3: Result Analysis. Visible points have been detected in step 2. The light intensity can
be calculated based on the distance between points and light. Then visualize the light
intensity in color, and the red represents stronger light intensity.
𝐼 =𝑘
𝑑2
Considering the points are evenly distributed on the surface, coverage can be calculated using
the following formula:
𝑐𝑜𝑣𝑒𝑟𝑎𝑔𝑒 =𝑁𝑣𝑖𝑠𝑖𝑏𝑙𝑒
𝑁𝑎𝑙𝑙
𝑁𝑣𝑖𝑠𝑖𝑏𝑙𝑒 represents the number of detected visible points, and 𝑁𝑎𝑙𝑙 represents the number of all
the points.
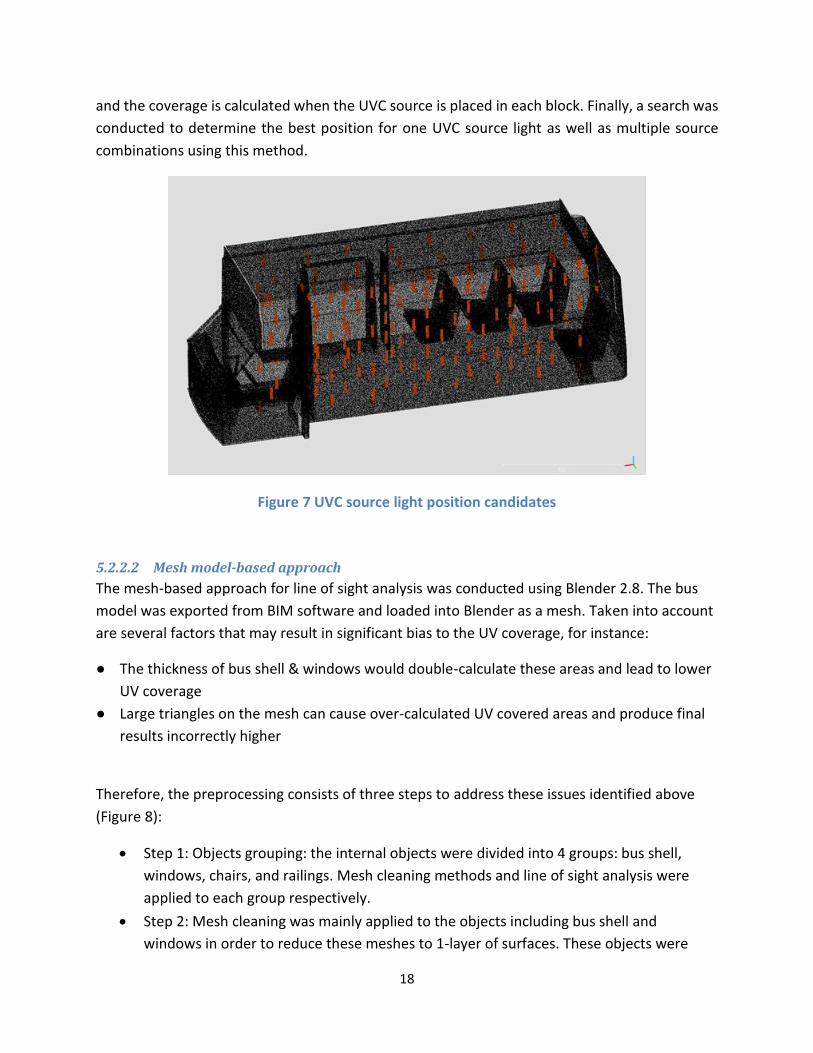
To determine how many UVC sources are needed and their specific locations, a grid search
strategy was used. As the Figure 7 shows, the bus space was divided into a series of 3D blocks,
18
and the coverage is calculated when the UVC source is placed in each block. Finally, a search was
conducted to determine the best position for one UVC source light as well as multiple source
combinations using this method.
Figure 7 UVC source light position candidates
5.2.2.2 Mesh model-based approach
The mesh-based approach for line of sight analysis was conducted using Blender 2.8. The bus
model was exported from BIM software and loaded into Blender as a mesh. Taken into account
are several factors that may result in significant bias to the UV coverage, for instance:
● The thickness of bus shell & windows would double-calculate these areas and lead to lower
UV coverage
● Large triangles on the mesh can cause over-calculated UV covered areas and produce final
results incorrectly higher
Therefore, the preprocessing consists of three steps to address these issues identified above
(Figure 8):
• Step 1: Objects grouping: the internal objects were divided into 4 groups: bus shell,
windows, chairs, and railings. Mesh cleaning methods and line of sight analysis were
applied to each group respectively.
• Step 2: Mesh cleaning was mainly applied to the objects including bus shell and
windows in order to reduce these meshes to 1-layer of surfaces. These objects were
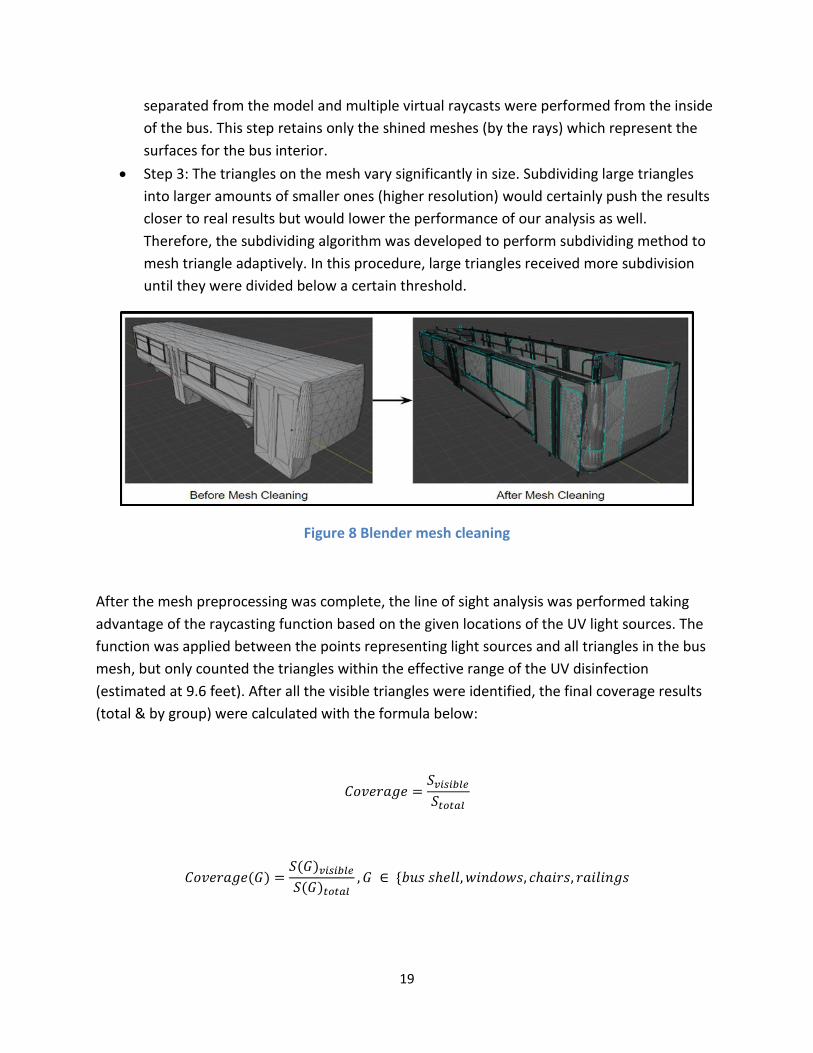
19
separated from the model and multiple virtual raycasts were performed from the inside
of the bus. This step retains only the shined meshes (by the rays) which represent the
surfaces for the bus interior.
• Step 3: The triangles on the mesh vary significantly in size. Subdividing large triangles
into larger amounts of smaller ones (higher resolution) would certainly push the results
closer to real results but would lower the performance of our analysis as well.
Therefore, the subdividing algorithm was developed to perform subdividing method to
mesh triangle adaptively. In this procedure, large triangles received more subdivision
until they were divided below a certain threshold.
Figure 8 Blender mesh cleaning
After the mesh preprocessing was complete, the line of sight analysis was performed taking
advantage of the raycasting function based on the given locations of the UV light sources. The
function was applied between the points representing light sources and all triangles in the bus
mesh, but only counted the triangles within the effective range of the UV disinfection
(estimated at 9.6 feet). After all the visible triangles were identified, the final coverage results
(total & by group) were calculated with the formula below:
𝐶𝑜𝑣𝑒𝑟𝑎𝑔𝑒 =𝑆𝑣𝑖𝑠𝑖𝑏𝑙𝑒
𝑆𝑡𝑜𝑡𝑎𝑙
𝐶𝑜𝑣𝑒𝑟𝑎𝑔𝑒(𝐺) =𝑆(𝐺)𝑣𝑖𝑠𝑖𝑏𝑙𝑒
𝑆(𝐺)𝑡𝑜𝑡𝑎𝑙, 𝐺 ∈ {𝑏𝑢𝑠 𝑠ℎ𝑒𝑙𝑙, 𝑤𝑖𝑛𝑑𝑜𝑤𝑠, 𝑐ℎ𝑎𝑖𝑟𝑠, 𝑟𝑎𝑖𝑙𝑖𝑛𝑔𝑠
20
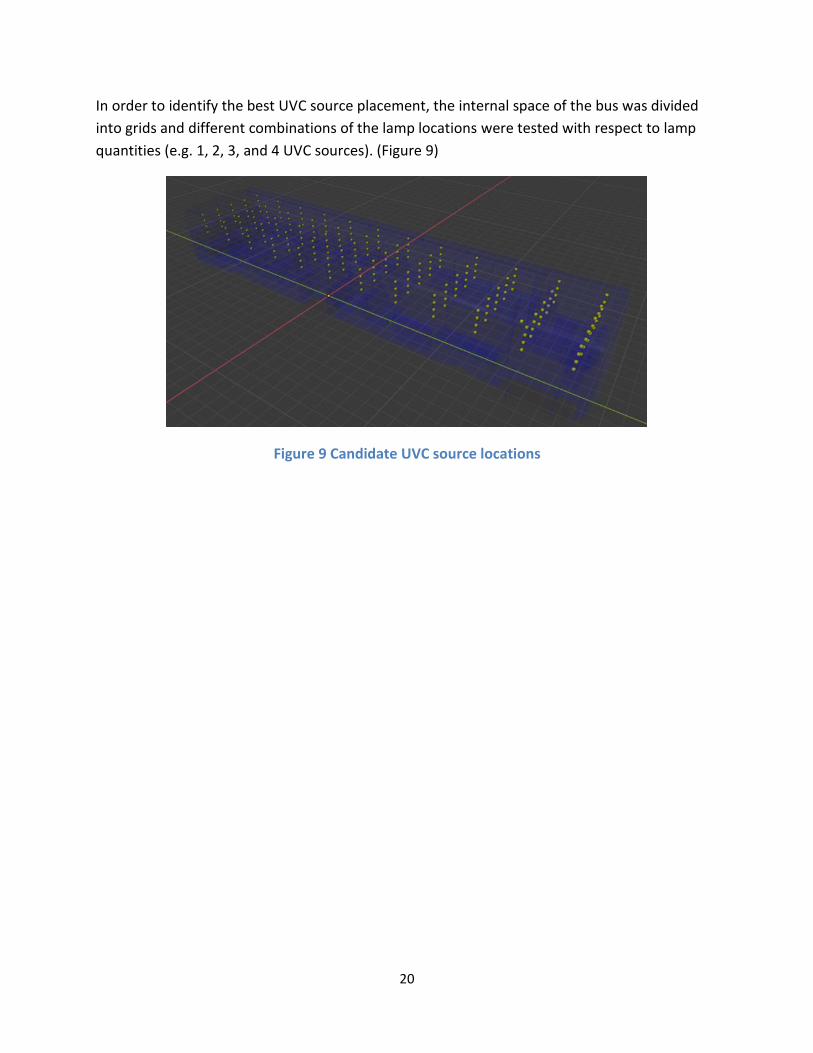
In order to identify the best UVC source placement, the internal space of the bus was divided
into grids and different combinations of the lamp locations were tested with respect to lamp
quantities (e.g. 1, 2, 3, and 4 UVC sources). (Figure 9)
Figure 9 Candidate UVC source locations
21
5.2.3 Mercury UVC Source placement and coverage
5.2.3.1 NABI bus coverage analysis
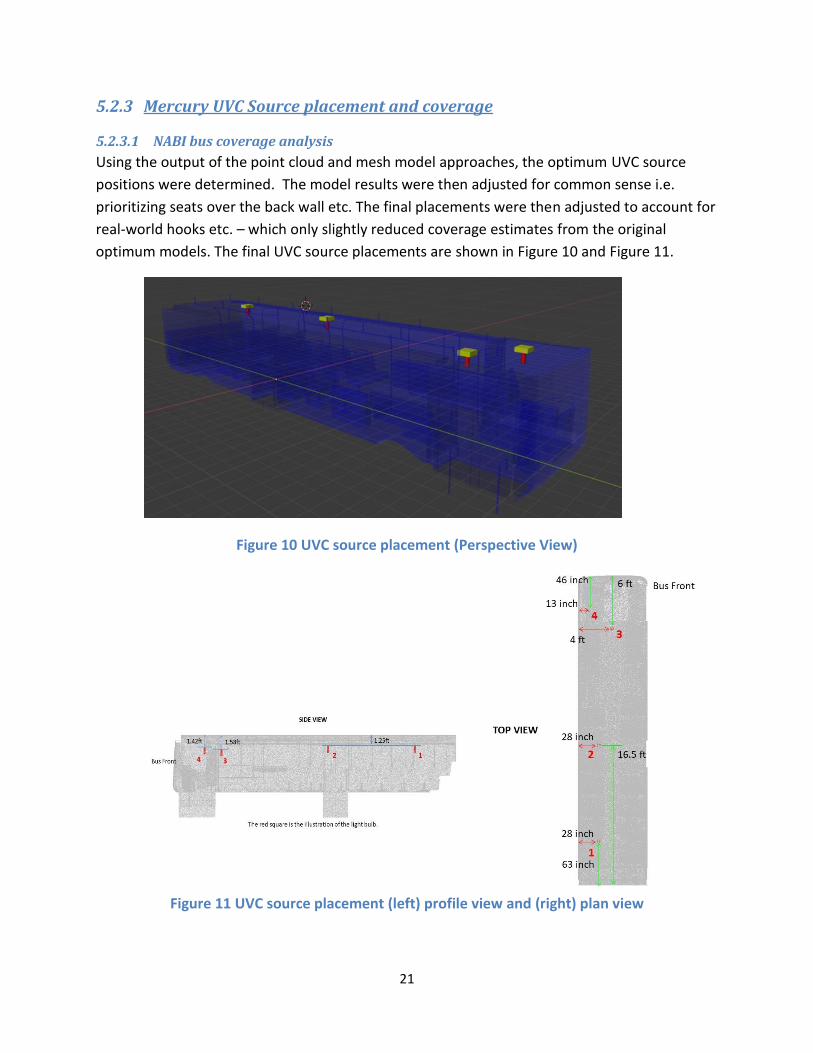
Using the output of the point cloud and mesh model approaches, the optimum UVC source
positions were determined. The model results were then adjusted for common sense i.e.
prioritizing seats over the back wall etc. The final placements were then adjusted to account for
real-world hooks etc. – which only slightly reduced coverage estimates from the original
optimum models. The final UVC source placements are shown in Figure 10 and Figure 11.
Figure 10 UVC source placement (Perspective View)
Figure 11 UVC source placement (left) profile view and (right) plan view
22
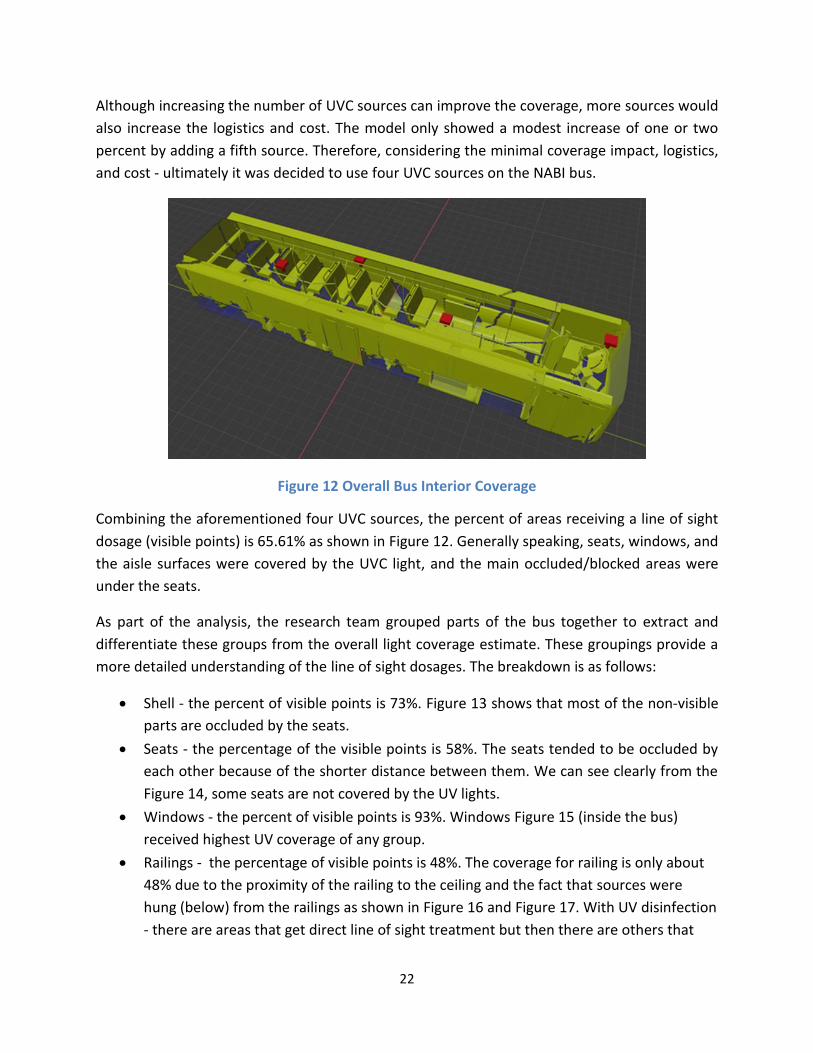
Although increasing the number of UVC sources can improve the coverage, more sources would
also increase the logistics and cost. The model only showed a modest increase of one or two
percent by adding a fifth source. Therefore, considering the minimal coverage impact, logistics,
and cost - ultimately it was decided to use four UVC sources on the NABI bus.
Figure 12 Overall Bus Interior Coverage
Combining the aforementioned four UVC sources, the percent of areas receiving a line of sight
dosage (visible points) is 65.61% as shown in Figure 12. Generally speaking, seats, windows, and
the aisle surfaces were covered by the UVC light, and the main occluded/blocked areas were
under the seats.
As part of the analysis, the research team grouped parts of the bus together to extract and
differentiate these groups from the overall light coverage estimate. These groupings provide a
more detailed understanding of the line of sight dosages. The breakdown is as follows:
• Shell - the percent of visible points is 73%. Figure 13 shows that most of the non-visible
parts are occluded by the seats.
• Seats - the percentage of the visible points is 58%. The seats tended to be occluded by
each other because of the shorter distance between them. We can see clearly from the
Figure 14, some seats are not covered by the UV lights.
• Windows - the percent of visible points is 93%. Windows Figure 15 (inside the bus)
received highest UV coverage of any group.
• Railings - the percentage of visible points is 48%. The coverage for railing is only about
48% due to the proximity of the railing to the ceiling and the fact that sources were
hung (below) from the railings as shown in Figure 16 and Figure 17. With UV disinfection
- there are areas that get direct line of sight treatment but then there are others that
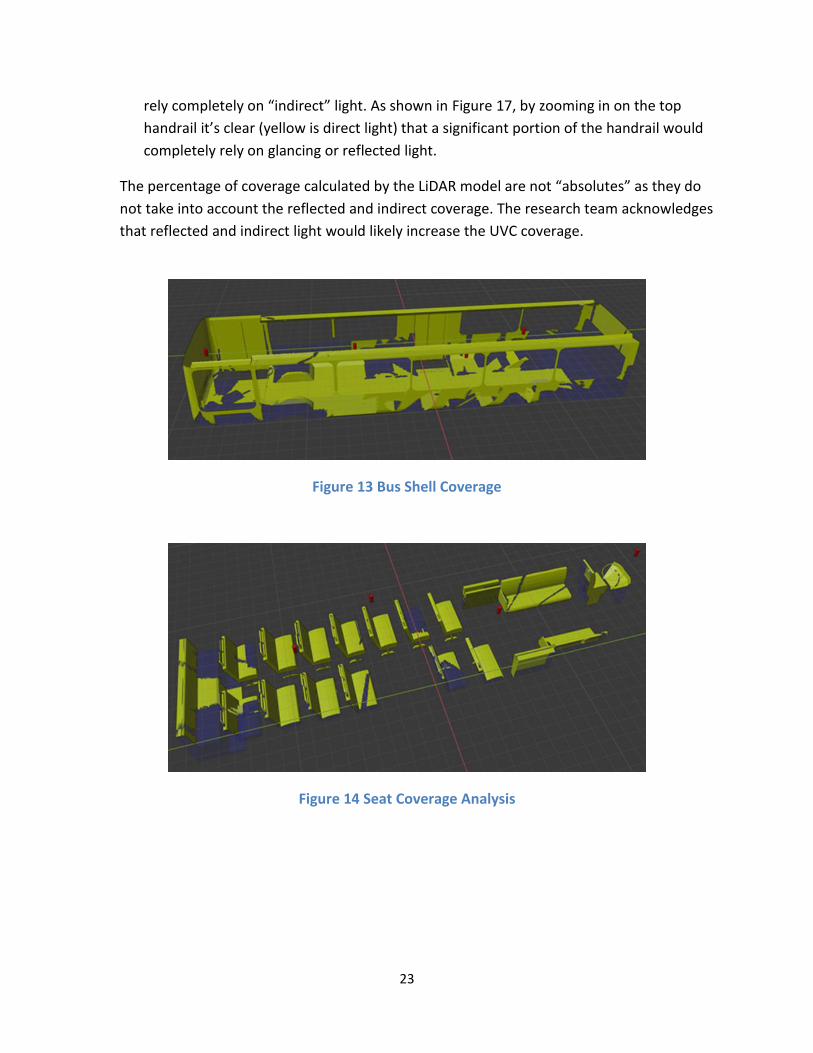
23
rely completely on “indirect” light. As shown in Figure 17, by zooming in on the top
handrail it’s clear (yellow is direct light) that a significant portion of the handrail would
completely rely on glancing or reflected light.
The percentage of coverage calculated by the LiDAR model are not “absolutes” as they do
not take into account the reflected and indirect coverage. The research team acknowledges
that reflected and indirect light would likely increase the UVC coverage.
Figure 13 Bus Shell Coverage
Figure 14 Seat Coverage Analysis
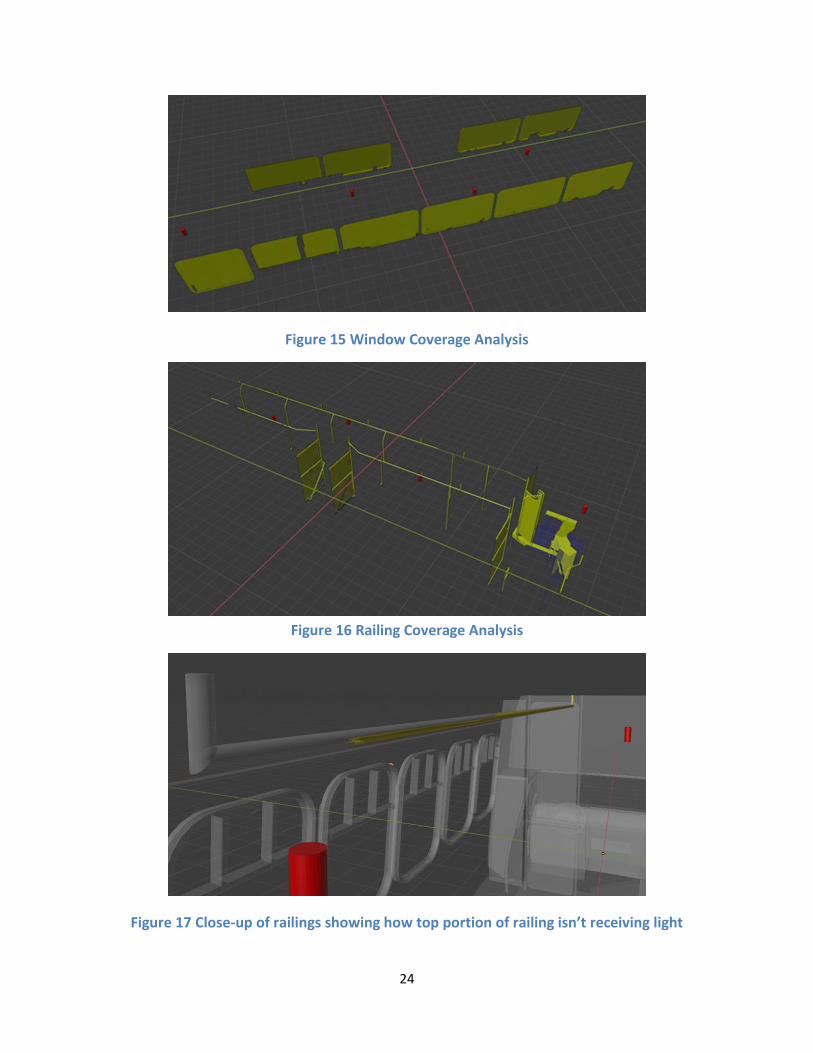
24
Figure 15 Window Coverage Analysis
Figure 16 Railing Coverage Analysis
Figure 17 Close-up of railings showing how top portion of railing isn’t receiving light
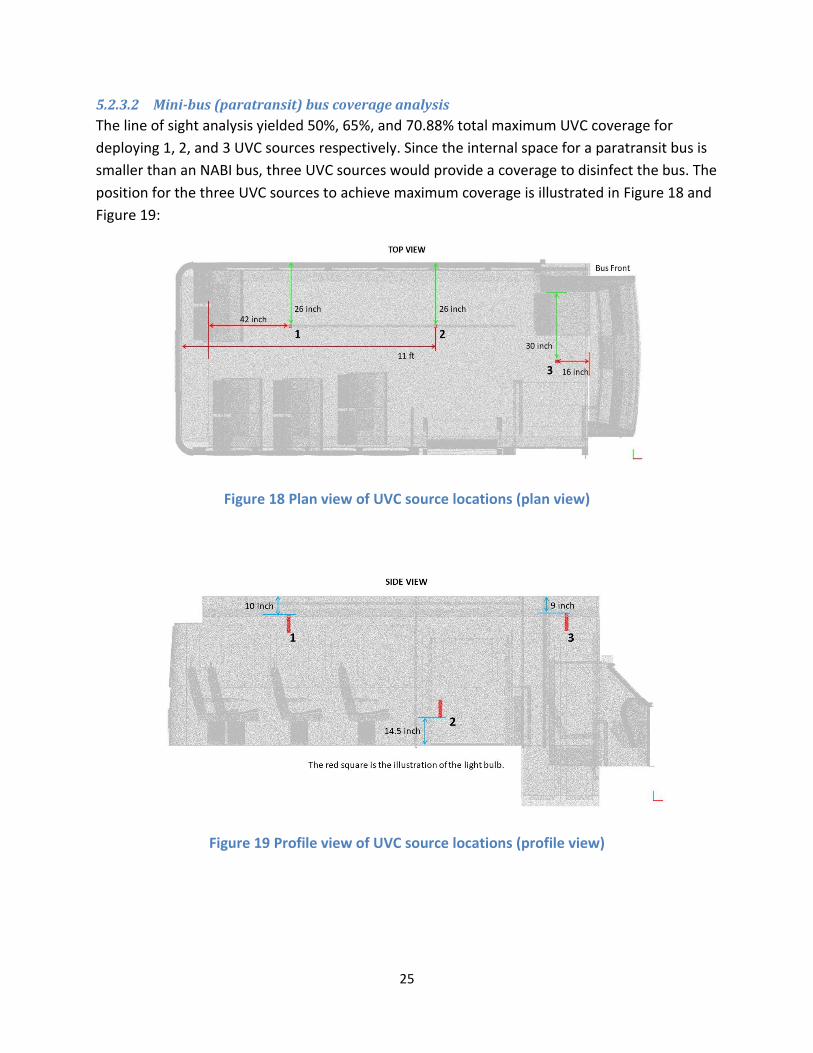
25
5.2.3.2 Mini-bus (paratransit) bus coverage analysis
The line of sight analysis yielded 50%, 65%, and 70.88% total maximum UVC coverage for
deploying 1, 2, and 3 UVC sources respectively. Since the internal space for a paratransit bus is
smaller than an NABI bus, three UVC sources would provide a coverage to disinfect the bus. The
position for the three UVC sources to achieve maximum coverage is illustrated in Figure 18 and
Figure 19:
Figure 18 Plan view of UVC source locations (plan view)
Figure 19 Profile view of UVC source locations (profile view)
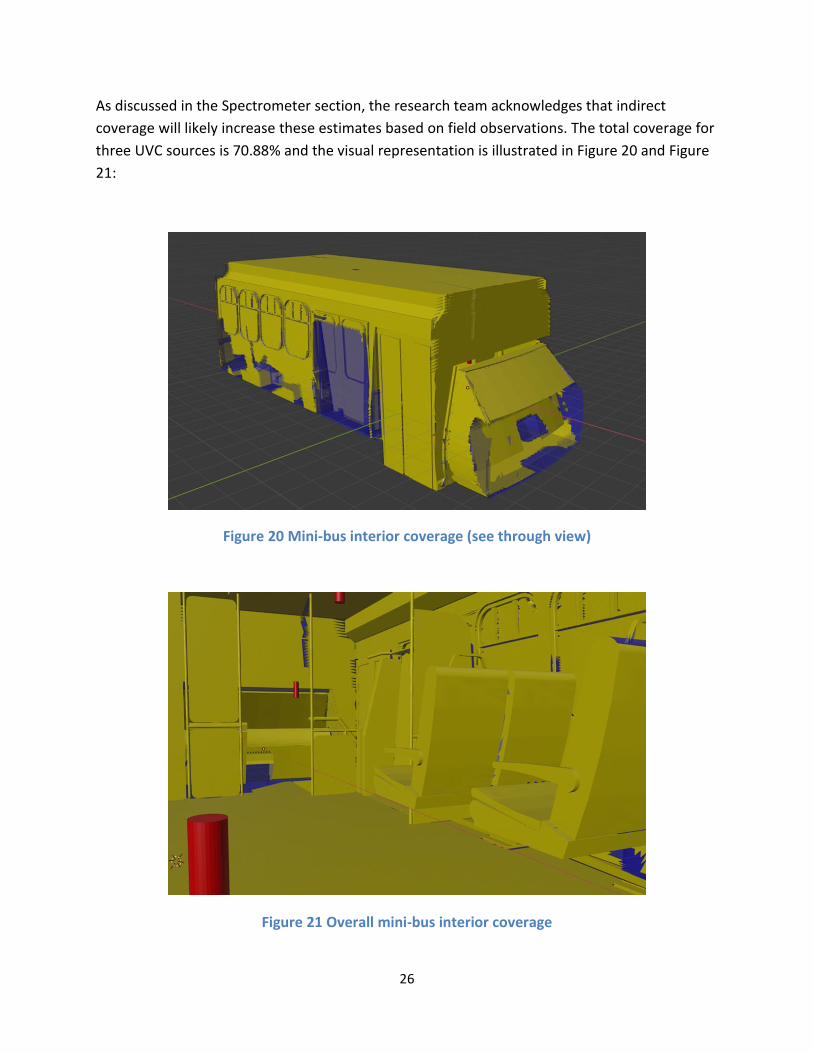
26
As discussed in the Spectrometer section, the research team acknowledges that indirect
coverage will likely increase these estimates based on field observations. The total coverage for
three UVC sources is 70.88% and the visual representation is illustrated in Figure 20 and Figure
21:
Figure 20 Mini-bus interior coverage (see through view)
Figure 21 Overall mini-bus interior coverage
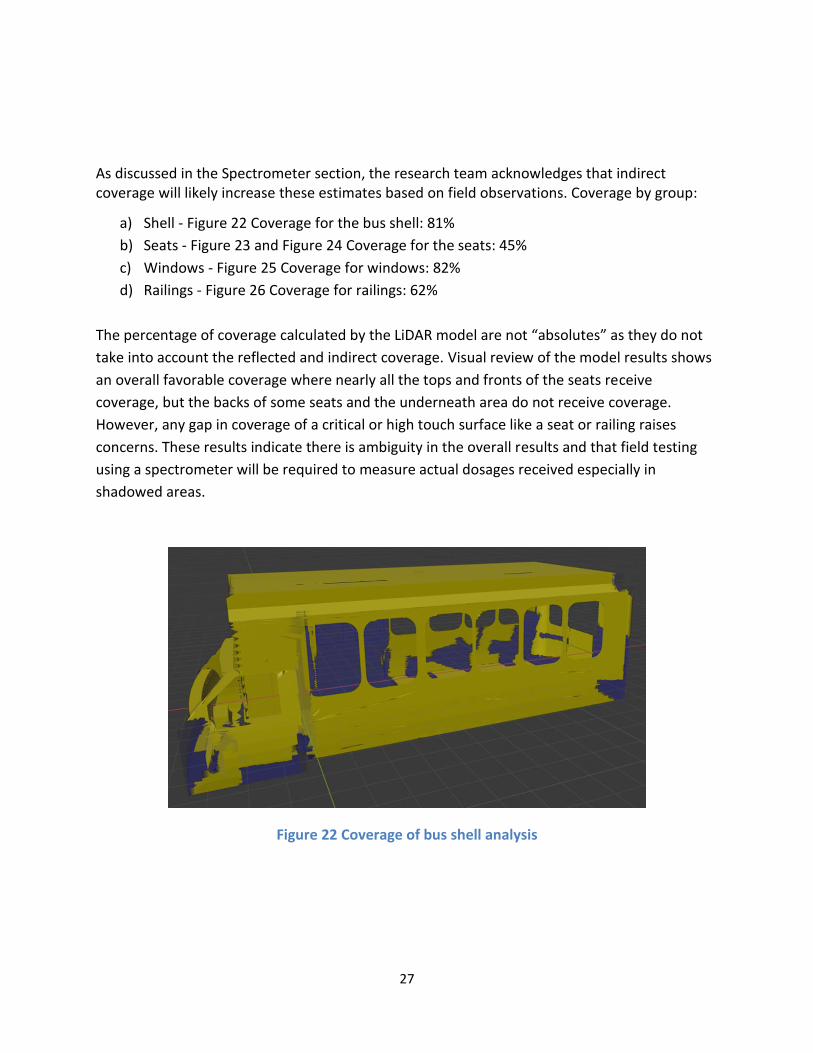
27
As discussed in the Spectrometer section, the research team acknowledges that indirect coverage will likely increase these estimates based on field observations. Coverage by group:
a) Shell - Figure 22 Coverage for the bus shell: 81%
b) Seats - Figure 23 and Figure 24 Coverage for the seats: 45%
c) Windows - Figure 25 Coverage for windows: 82%
d) Railings - Figure 26 Coverage for railings: 62%
The percentage of coverage calculated by the LiDAR model are not “absolutes” as they do not
take into account the reflected and indirect coverage. Visual review of the model results shows
an overall favorable coverage where nearly all the tops and fronts of the seats receive
coverage, but the backs of some seats and the underneath area do not receive coverage.
However, any gap in coverage of a critical or high touch surface like a seat or railing raises
concerns. These results indicate there is ambiguity in the overall results and that field testing
using a spectrometer will be required to measure actual dosages received especially in
shadowed areas.
Figure 22 Coverage of bus shell analysis
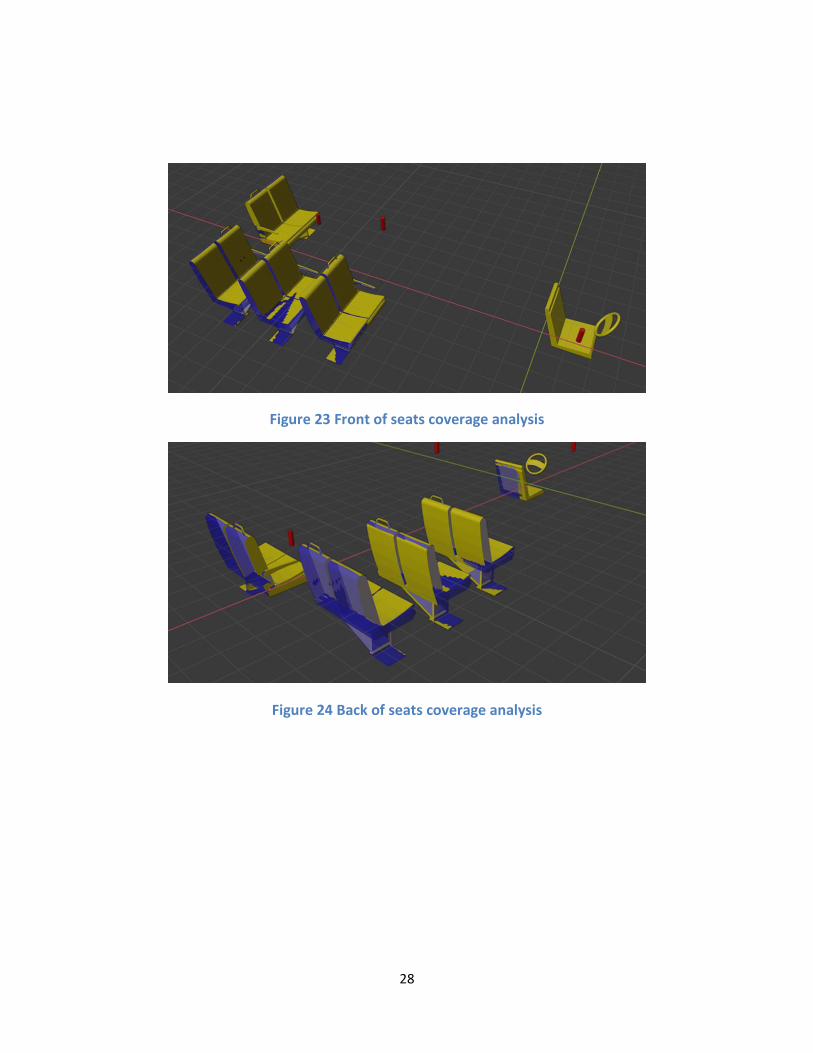
28
Figure 23 Front of seats coverage analysis
Figure 24 Back of seats coverage analysis
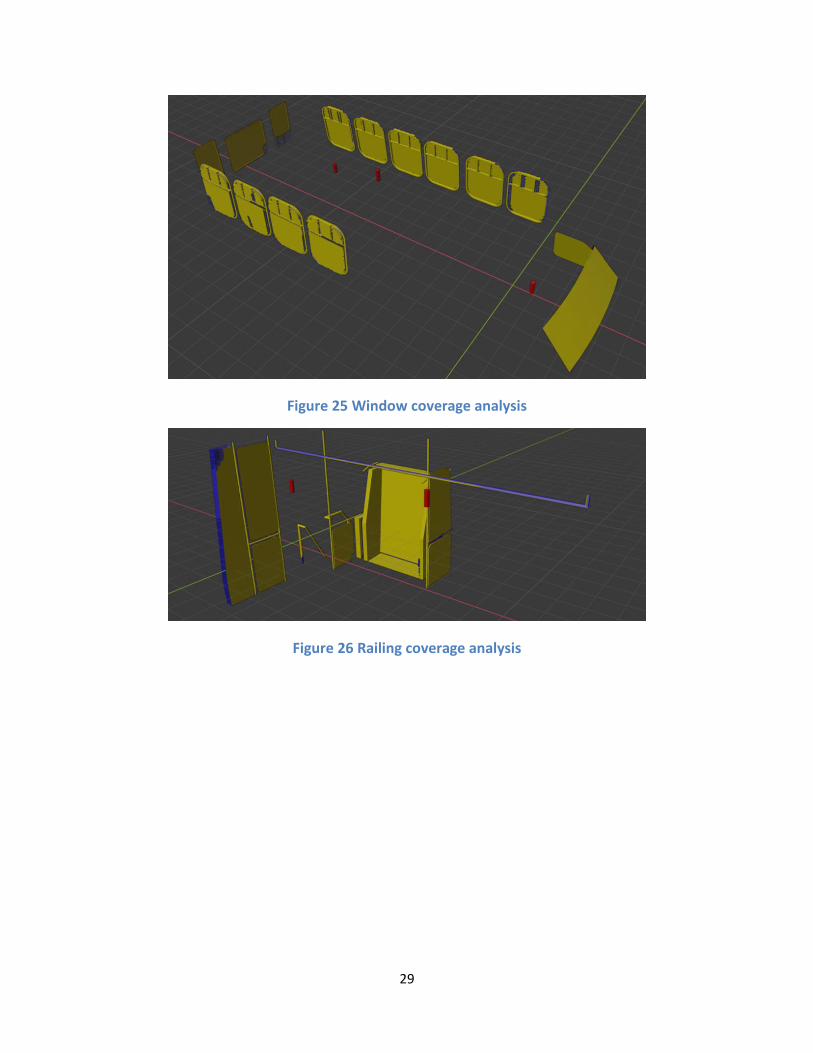
29
Figure 25 Window coverage analysis
Figure 26 Railing coverage analysis

30
5.2.4 Pulsed Xenon Source Analysis
This report is UVC source agnostic. However, since the research team was only able to identify
two potential pulsed Xenon UVC vendors, and one of those products was not applicable for
buses due to size, specific information regarding operation for the Puro M1-2 unit is included
here as reference.
As shown in Figure 27 and Figure 28, the M1-2 does not follow standard bulb irradiance but
instead has two heads with a directional beam angle. The two heads result in a beam angle
coverage of 340 degrees resulting in a small zone that will not receive direct line of sight
irradiance.
Figure 27 M1-2 product specification20i
i Photo Credit: Image by Puro via https://purolighting.com/wp-content/uploads/2020/07/Puro-Sentry-M1-Spec-Sheet.pdf
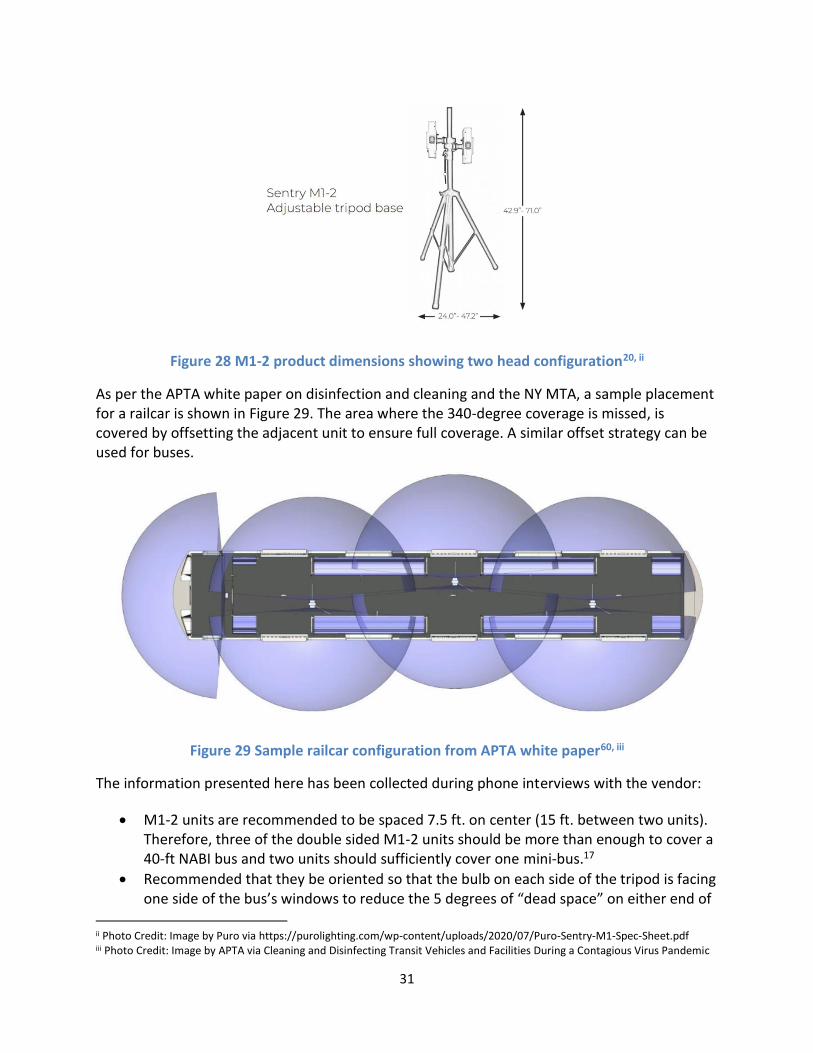
31
Figure 28 M1-2 product dimensions showing two head configuration20, ii
As per the APTA white paper on disinfection and cleaning and the NY MTA, a sample placement for a railcar is shown in Figure 29. The area where the 340-degree coverage is missed, is covered by offsetting the adjacent unit to ensure full coverage. A similar offset strategy can be used for buses.
Figure 29 Sample railcar configuration from APTA white paper60, iii
The information presented here has been collected during phone interviews with the vendor:
• M1-2 units are recommended to be spaced 7.5 ft. on center (15 ft. between two units). Therefore, three of the double sided M1-2 units should be more than enough to cover a 40-ft NABI bus and two units should sufficiently cover one mini-bus.17
• Recommended that they be oriented so that the bulb on each side of the tripod is facing one side of the bus’s windows to reduce the 5 degrees of “dead space” on either end of
ii Photo Credit: Image by Puro via https://purolighting.com/wp-content/uploads/2020/07/Puro-Sentry-M1-Spec-Sheet.pdf iii Photo Credit: Image by APTA via Cleaning and Disinfecting Transit Vehicles and Facilities During a Contagious Virus Pandemic
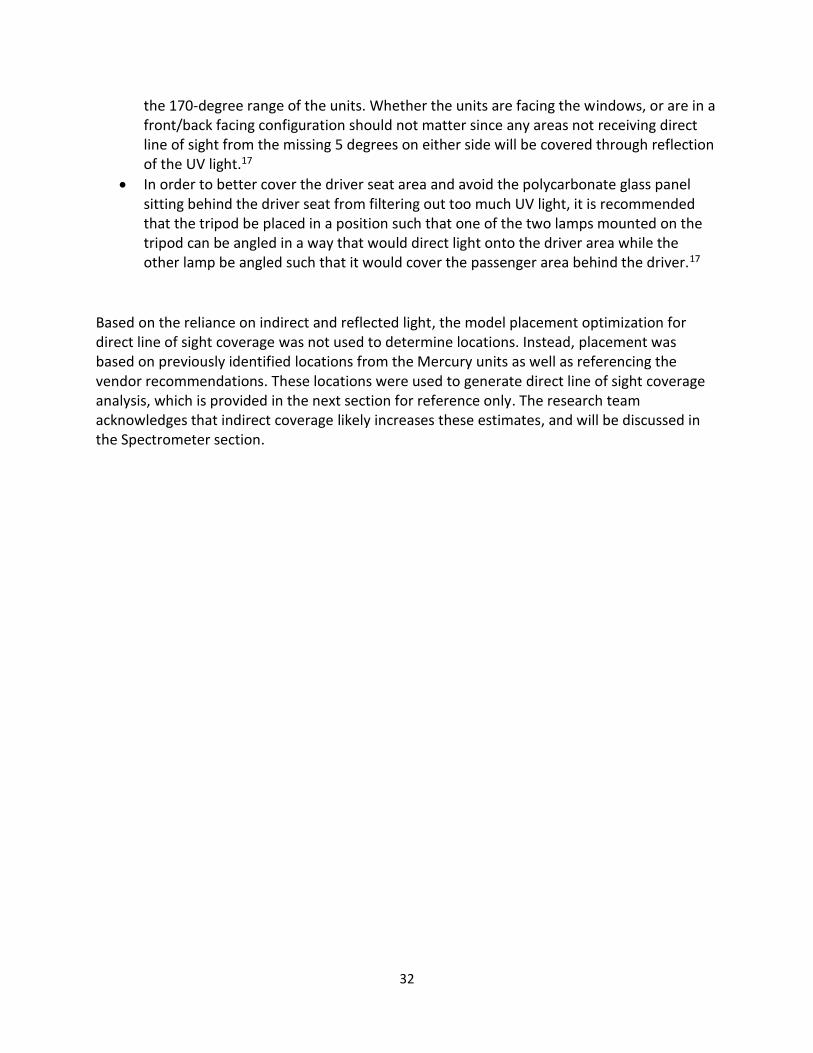
32
the 170-degree range of the units. Whether the units are facing the windows, or are in a front/back facing configuration should not matter since any areas not receiving direct line of sight from the missing 5 degrees on either side will be covered through reflection of the UV light.17
• In order to better cover the driver seat area and avoid the polycarbonate glass panel sitting behind the driver seat from filtering out too much UV light, it is recommended that the tripod be placed in a position such that one of the two lamps mounted on the tripod can be angled in a way that would direct light onto the driver area while the other lamp be angled such that it would cover the passenger area behind the driver.17
Based on the reliance on indirect and reflected light, the model placement optimization for direct line of sight coverage was not used to determine locations. Instead, placement was based on previously identified locations from the Mercury units as well as referencing the vendor recommendations. These locations were used to generate direct line of sight coverage analysis, which is provided in the next section for reference only. The research team acknowledges that indirect coverage likely increases these estimates, and will be discussed in the Spectrometer section.
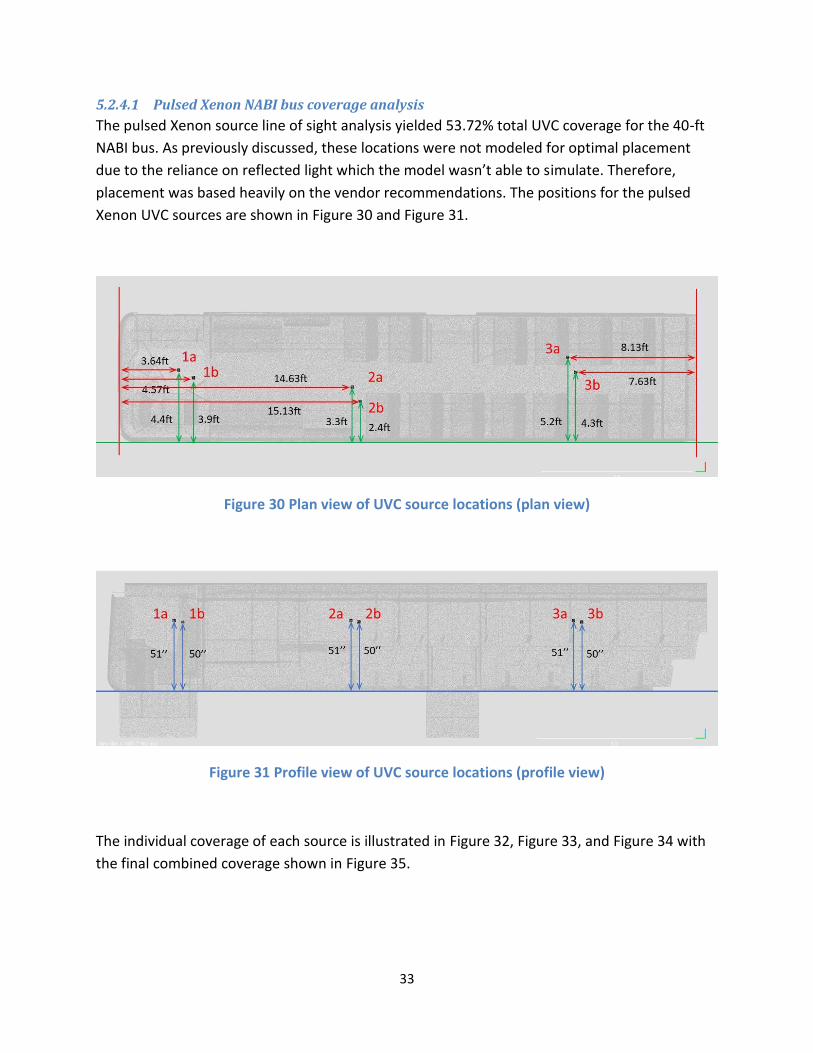
33
5.2.4.1 Pulsed Xenon NABI bus coverage analysis
The pulsed Xenon source line of sight analysis yielded 53.72% total UVC coverage for the 40-ft
NABI bus. As previously discussed, these locations were not modeled for optimal placement
due to the reliance on reflected light which the model wasn’t able to simulate. Therefore,
placement was based heavily on the vendor recommendations. The positions for the pulsed
Xenon UVC sources are shown in Figure 30 and Figure 31.
Figure 30 Plan view of UVC source locations (plan view)
Figure 31 Profile view of UVC source locations (profile view)
The individual coverage of each source is illustrated in Figure 32, Figure 33, and Figure 34 with
the final combined coverage shown in Figure 35.
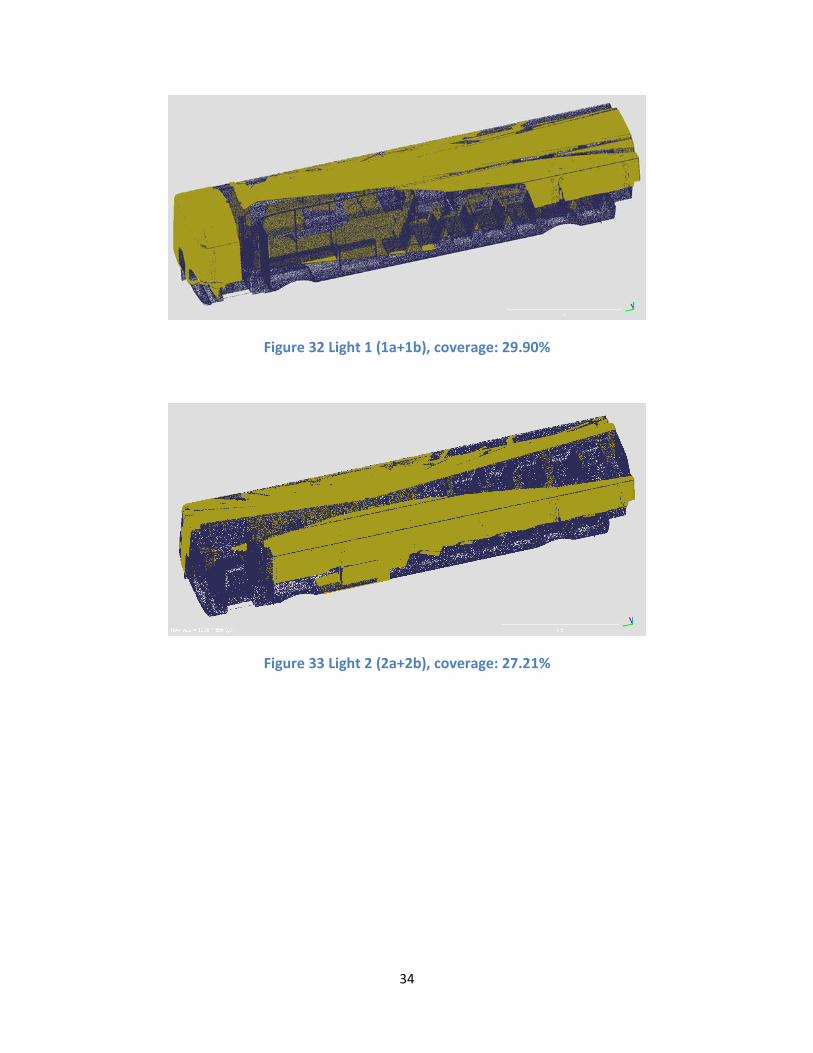
34
Figure 32 Light 1 (1a+1b), coverage: 29.90%
Figure 33 Light 2 (2a+2b), coverage: 27.21%
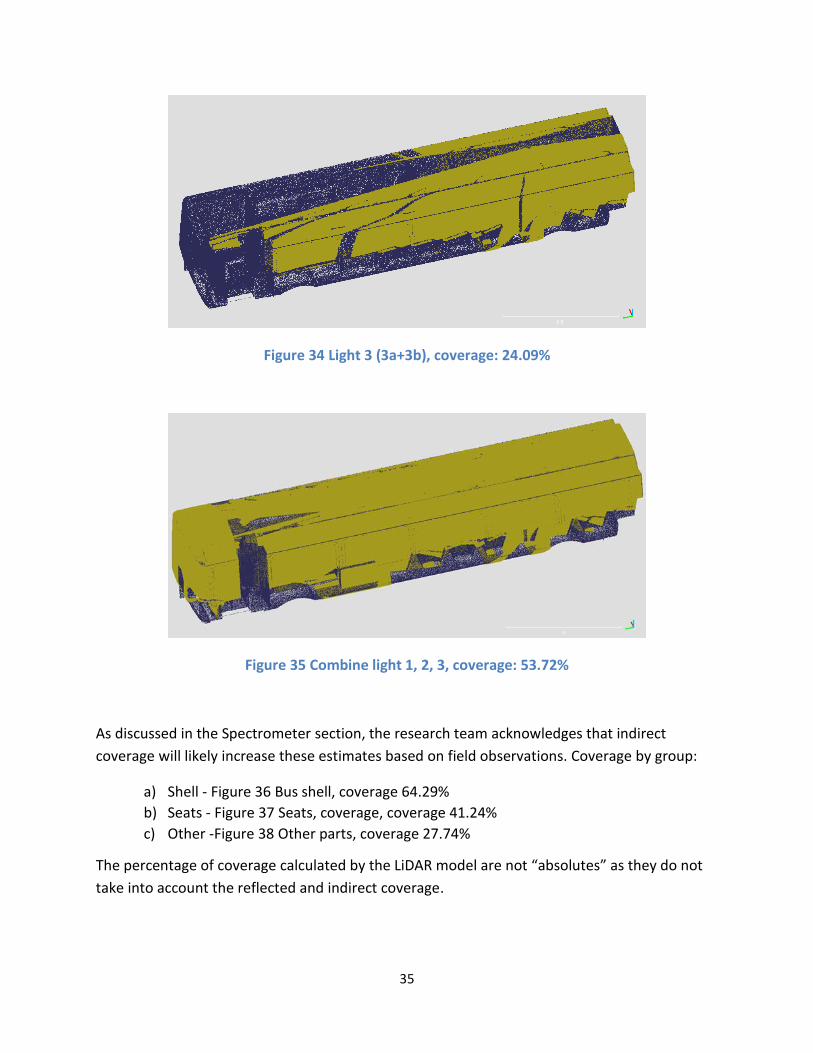
35
Figure 34 Light 3 (3a+3b), coverage: 24.09%
Figure 35 Combine light 1, 2, 3, coverage: 53.72%
As discussed in the Spectrometer section, the research team acknowledges that indirect
coverage will likely increase these estimates based on field observations. Coverage by group:
a) Shell - Figure 36 Bus shell, coverage 64.29%
b) Seats - Figure 37 Seats, coverage, coverage 41.24%
c) Other -Figure 38 Other parts, coverage 27.74%
The percentage of coverage calculated by the LiDAR model are not “absolutes” as they do not
take into account the reflected and indirect coverage.
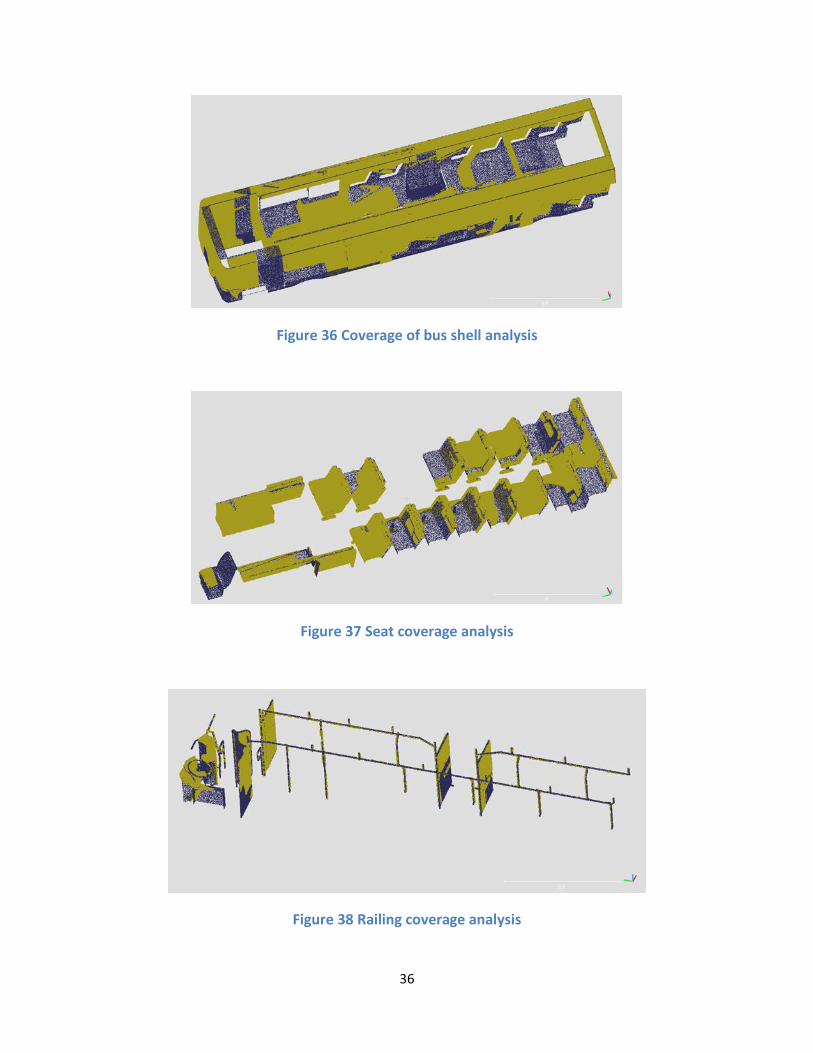
36
Figure 36 Coverage of bus shell analysis
Figure 37 Seat coverage analysis
Figure 38 Railing coverage analysis
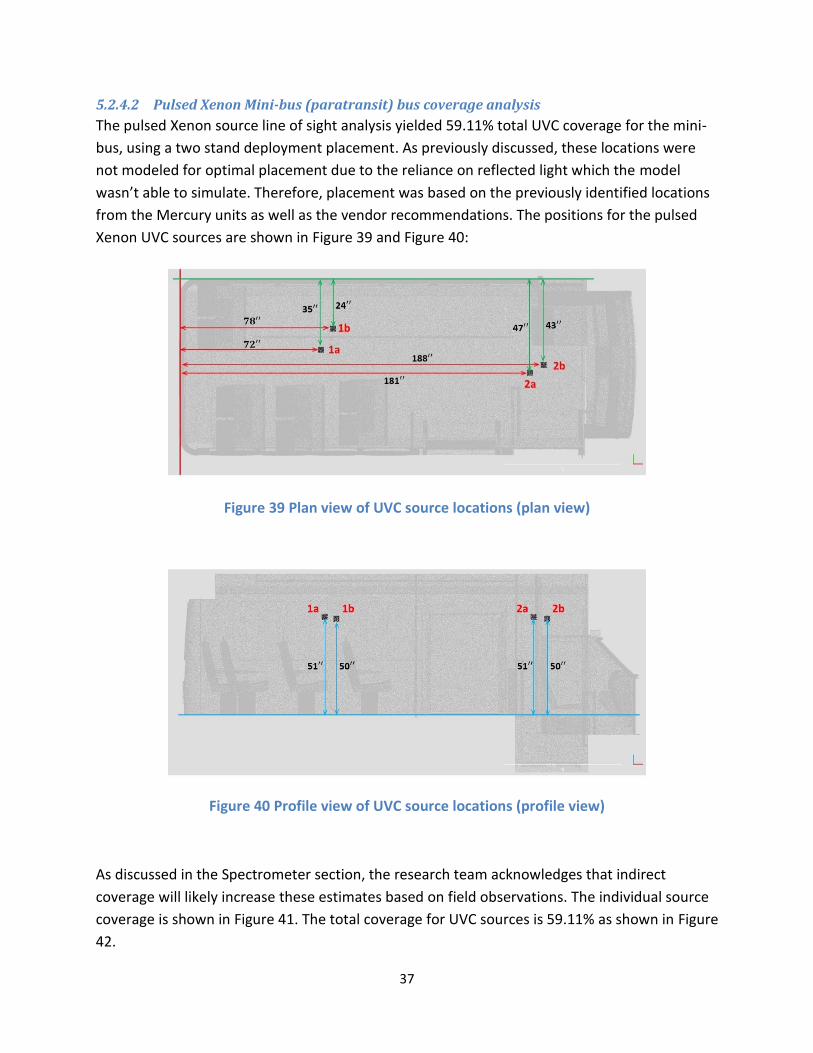
37
5.2.4.2 Pulsed Xenon Mini-bus (paratransit) bus coverage analysis
The pulsed Xenon source line of sight analysis yielded 59.11% total UVC coverage for the mini-
bus, using a two stand deployment placement. As previously discussed, these locations were
not modeled for optimal placement due to the reliance on reflected light which the model
wasn’t able to simulate. Therefore, placement was based on the previously identified locations
from the Mercury units as well as the vendor recommendations. The positions for the pulsed
Xenon UVC sources are shown in Figure 39 and Figure 40:
Figure 39 Plan view of UVC source locations (plan view)
Figure 40 Profile view of UVC source locations (profile view)
As discussed in the Spectrometer section, the research team acknowledges that indirect
coverage will likely increase these estimates based on field observations. The individual source
coverage is shown in Figure 41. The total coverage for UVC sources is 59.11% as shown in Figure
42.
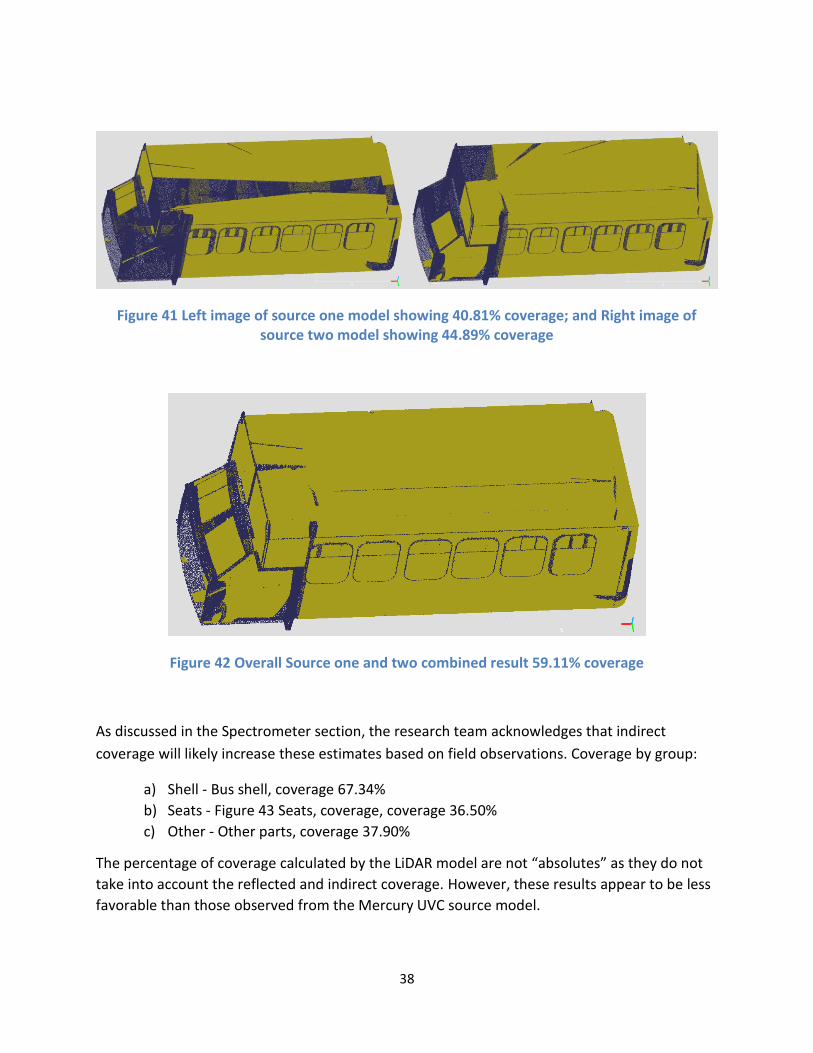
38
Figure 41 Left image of source one model showing 40.81% coverage; and Right image of source two model showing 44.89% coverage
Figure 42 Overall Source one and two combined result 59.11% coverage
As discussed in the Spectrometer section, the research team acknowledges that indirect
coverage will likely increase these estimates based on field observations. Coverage by group:
a) Shell - Bus shell, coverage 67.34%
b) Seats - Figure 43 Seats, coverage, coverage 36.50%
c) Other - Other parts, coverage 37.90%
The percentage of coverage calculated by the LiDAR model are not “absolutes” as they do not
take into account the reflected and indirect coverage. However, these results appear to be less
favorable than those observed from the Mercury UVC source model.
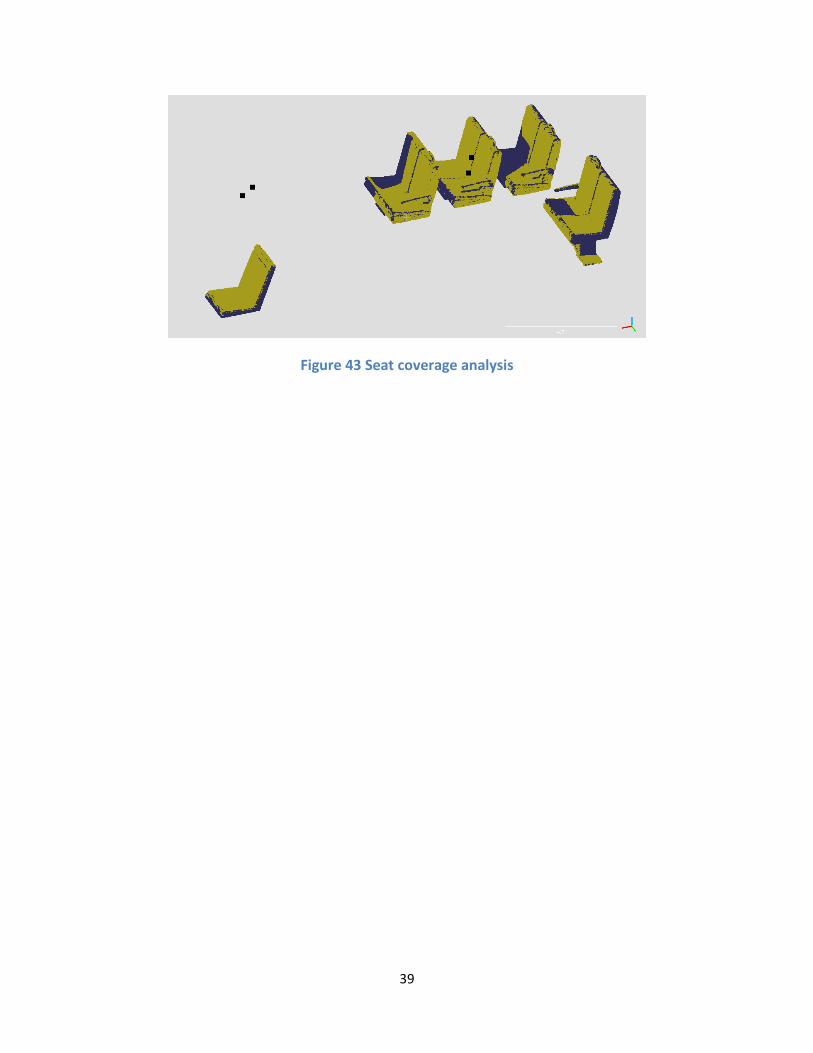
39
Figure 43 Seat coverage analysis
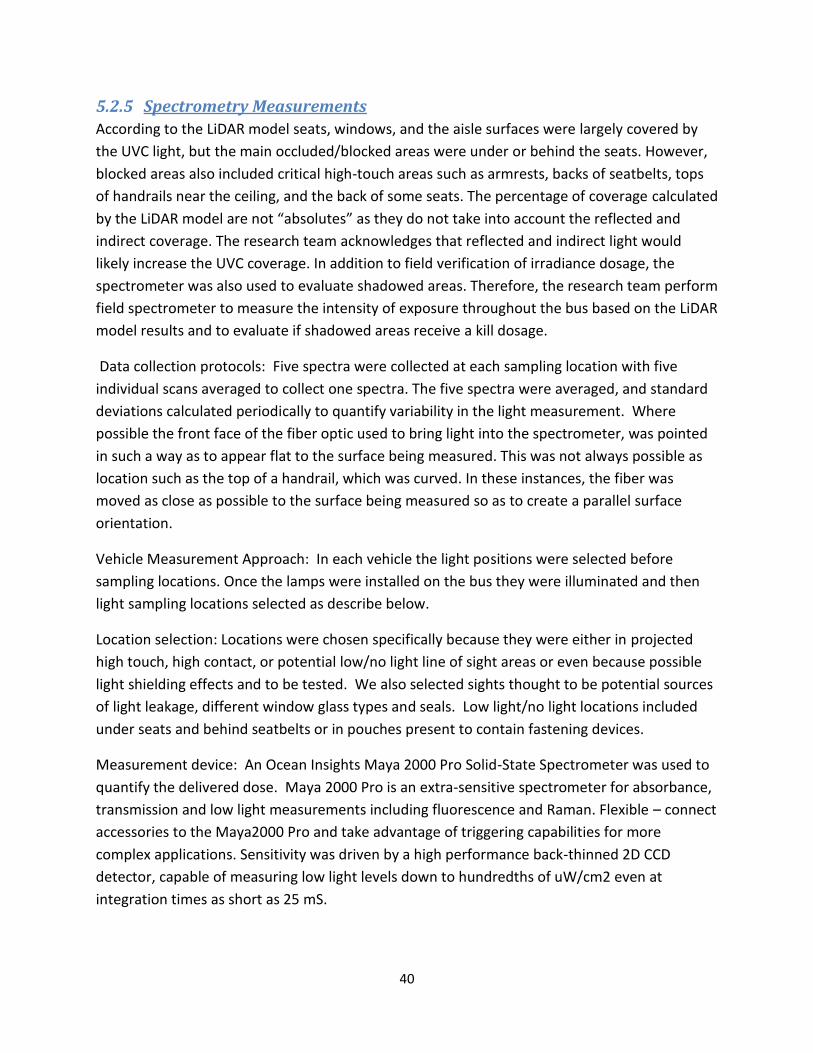
40
5.2.5 Spectrometry Measurements
According to the LiDAR model seats, windows, and the aisle surfaces were largely covered by
the UVC light, but the main occluded/blocked areas were under or behind the seats. However,
blocked areas also included critical high-touch areas such as armrests, backs of seatbelts, tops
of handrails near the ceiling, and the back of some seats. The percentage of coverage calculated
by the LiDAR model are not “absolutes” as they do not take into account the reflected and
indirect coverage. The research team acknowledges that reflected and indirect light would
likely increase the UVC coverage. In addition to field verification of irradiance dosage, the
spectrometer was also used to evaluate shadowed areas. Therefore, the research team perform
field spectrometer to measure the intensity of exposure throughout the bus based on the LiDAR
model results and to evaluate if shadowed areas receive a kill dosage.
Data collection protocols: Five spectra were collected at each sampling location with five
individual scans averaged to collect one spectra. The five spectra were averaged, and standard
deviations calculated periodically to quantify variability in the light measurement. Where
possible the front face of the fiber optic used to bring light into the spectrometer, was pointed
in such a way as to appear flat to the surface being measured. This was not always possible as
location such as the top of a handrail, which was curved. In these instances, the fiber was
moved as close as possible to the surface being measured so as to create a parallel surface
orientation.
Vehicle Measurement Approach: In each vehicle the light positions were selected before
sampling locations. Once the lamps were installed on the bus they were illuminated and then
light sampling locations selected as describe below.
Location selection: Locations were chosen specifically because they were either in projected
high touch, high contact, or potential low/no light line of sight areas or even because possible
light shielding effects and to be tested. We also selected sights thought to be potential sources
of light leakage, different window glass types and seals. Low light/no light locations included
under seats and behind seatbelts or in pouches present to contain fastening devices.
Measurement device: An Ocean Insights Maya 2000 Pro Solid-State Spectrometer was used to
quantify the delivered dose. Maya 2000 Pro is an extra-sensitive spectrometer for absorbance,
transmission and low light measurements including fluorescence and Raman. Flexible – connect
accessories to the Maya2000 Pro and take advantage of triggering capabilities for more
complex applications. Sensitivity was driven by a high performance back-thinned 2D CCD
detector, capable of measuring low light levels down to hundredths of uW/cm2 even at
integration times as short as 25 mS.
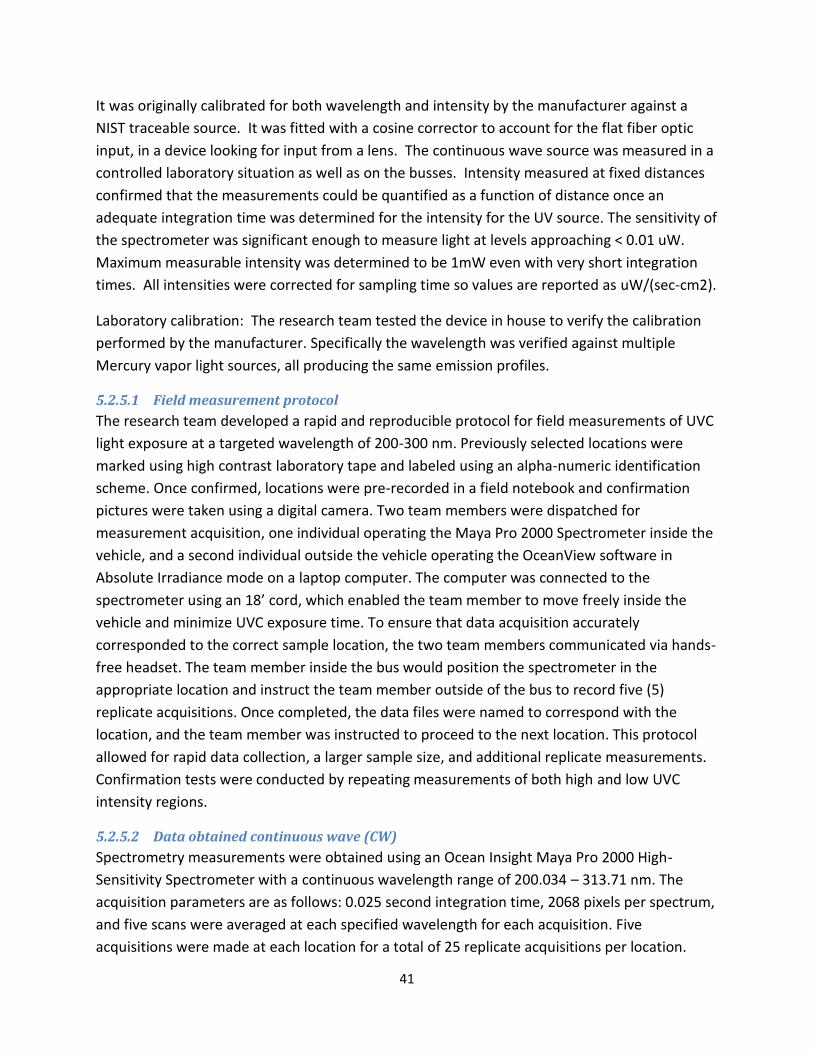
41
It was originally calibrated for both wavelength and intensity by the manufacturer against a
NIST traceable source. It was fitted with a cosine corrector to account for the flat fiber optic
input, in a device looking for input from a lens. The continuous wave source was measured in a
controlled laboratory situation as well as on the busses. Intensity measured at fixed distances
confirmed that the measurements could be quantified as a function of distance once an
adequate integration time was determined for the intensity for the UV source. The sensitivity of
the spectrometer was significant enough to measure light at levels approaching < 0.01 uW.
Maximum measurable intensity was determined to be 1mW even with very short integration
times. All intensities were corrected for sampling time so values are reported as uW/(sec-cm2).
Laboratory calibration: The research team tested the device in house to verify the calibration
performed by the manufacturer. Specifically the wavelength was verified against multiple
Mercury vapor light sources, all producing the same emission profiles.
5.2.5.1 Field measurement protocol
The research team developed a rapid and reproducible protocol for field measurements of UVC
light exposure at a targeted wavelength of 200-300 nm. Previously selected locations were
marked using high contrast laboratory tape and labeled using an alpha-numeric identification
scheme. Once confirmed, locations were pre-recorded in a field notebook and confirmation
pictures were taken using a digital camera. Two team members were dispatched for
measurement acquisition, one individual operating the Maya Pro 2000 Spectrometer inside the
vehicle, and a second individual outside the vehicle operating the OceanView software in
Absolute Irradiance mode on a laptop computer. The computer was connected to the
spectrometer using an 18’ cord, which enabled the team member to move freely inside the
vehicle and minimize UVC exposure time. To ensure that data acquisition accurately
corresponded to the correct sample location, the two team members communicated via hands-
free headset. The team member inside the bus would position the spectrometer in the
appropriate location and instruct the team member outside of the bus to record five (5)
replicate acquisitions. Once completed, the data files were named to correspond with the
location, and the team member was instructed to proceed to the next location. This protocol
allowed for rapid data collection, a larger sample size, and additional replicate measurements.
Confirmation tests were conducted by repeating measurements of both high and low UVC
intensity regions.
5.2.5.2 Data obtained continuous wave (CW)
Spectrometry measurements were obtained using an Ocean Insight Maya Pro 2000 High-
Sensitivity Spectrometer with a continuous wavelength range of 200.034 – 313.71 nm. The
acquisition parameters are as follows: 0.025 second integration time, 2068 pixels per spectrum,
and five scans were averaged at each specified wavelength for each acquisition. Five
acquisitions were made at each location for a total of 25 replicate acquisitions per location.
42
Electric dark correction (e.g. background intensities in the absence of light) and non-linearity
correction were applied to wavelength intensities across the spectrum. The spectrum peak
intensity was observed at 253.3 nm. As discussed earlier in this report, based on previously
published literature a peak intensity of 25 µW/cm2 was determined as a reasonable and
conservative threshold for disinfection at the targeted wavelength of 253 nm for a continuous
exposure duration of 7 minutes.
5.2.5.3 Mini-bus Vehicle
Sample number: 22 measurement locations
Locations: Sample locations were selected to assess UVC intensity in the following scenarios:
high touch regions, direct line of sight to UVC source, indirect line of sight to UVC source,
potential reflected light areas, shaded areas based on the LiDAR model, and areas with
protective shields (e.g. polycarbonate partitions).
Figure 44 Select positions of spectrometer measurements and light source
Figure 44 shows select positions of spectrometer measurements and light source position on the
mini-bus. Spectrometer measurements were collected on high touch surface such as railings, as
well as shaded interior positions described below.
5.2.5.3.1 One-Mercury UVC source results
The first series of measurements were collected in 15 locations using a single UVC source hung
from the overhead hand railing at the middle of the bus. Four locations received irradiance of
less than 25 µW/cm2, which has been identified as the threshold for disinfection at the targeted
wavelength of 253 nm for a duration of 7 minutes i.e. disinfection/kill dosage. The locations with
obscured line of sight to the light source included: (G) steering wheel, (L) seatbelt anchor behind
43
the last row of seats, and (N) the polycarbonate partition adjacent to the wheelchair ramp,
opposite the side facing the light source. All other locations received light with an intensity
greater than 25 µW/cm2 indicating that these locations received a sufficient disinfection/kill
dosage.
Table 1 UVC Spectrometer measurements for one-lamp configuration
Table 1 shows UVC Spectrometer measurements for one-lamp configuration reported in
µW/sec-cm2. Five scans were averaged at each specified wavelength for each acquisition. Five
acquisitions were made at each location for a total of 25 replicate acquisitions per location.
Mean, standard deviation (Stdev), and percent RSD are reported for each location. Erroneous
acquisitions were excluded for locations B, E, J, and N.
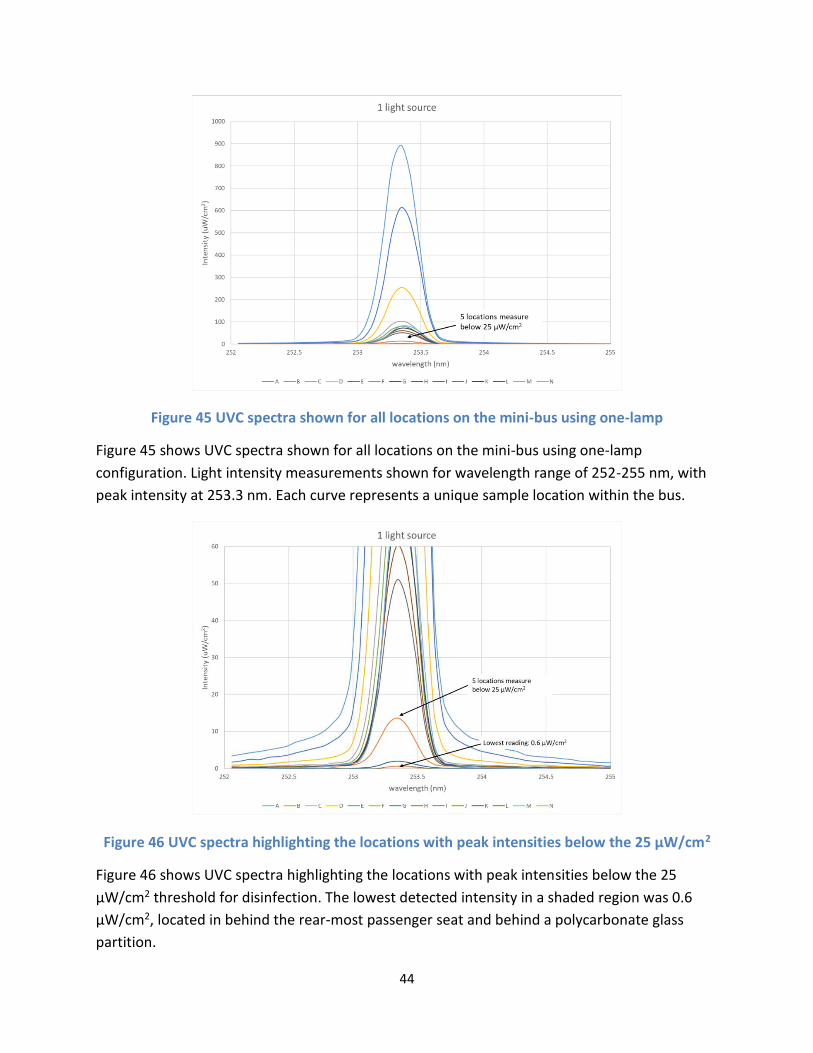
44
Figure 45 UVC spectra shown for all locations on the mini-bus using one-lamp
Figure 45 shows UVC spectra shown for all locations on the mini-bus using one-lamp
configuration. Light intensity measurements shown for wavelength range of 252-255 nm, with
peak intensity at 253.3 nm. Each curve represents a unique sample location within the bus.
Figure 46 UVC spectra highlighting the locations with peak intensities below the 25 µW/cm2
Figure 46 shows UVC spectra highlighting the locations with peak intensities below the 25
µW/cm2 threshold for disinfection. The lowest detected intensity in a shaded region was 0.6
µW/cm2, located in behind the rear-most passenger seat and behind a polycarbonate glass
partition.
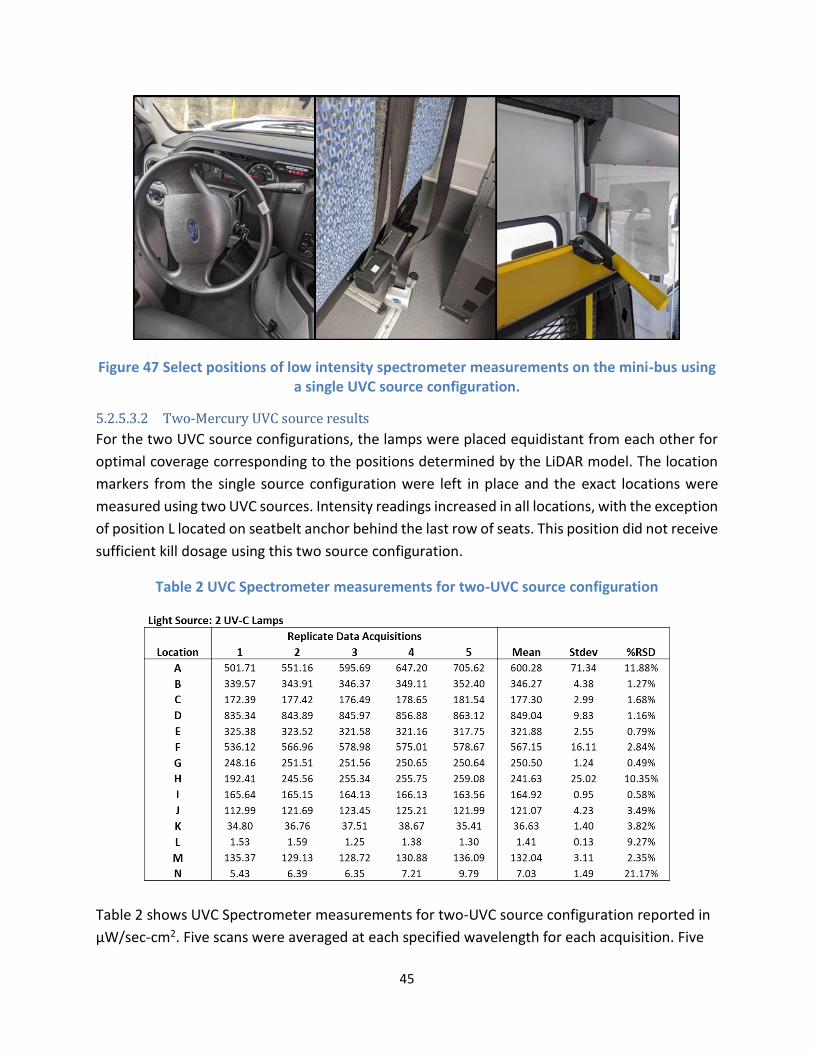
45
Figure 47 Select positions of low intensity spectrometer measurements on the mini-bus using a single UVC source configuration.
5.2.5.3.2 Two-Mercury UVC source results
For the two UVC source configurations, the lamps were placed equidistant from each other for
optimal coverage corresponding to the positions determined by the LiDAR model. The location
markers from the single source configuration were left in place and the exact locations were
measured using two UVC sources. Intensity readings increased in all locations, with the exception
of position L located on seatbelt anchor behind the last row of seats. This position did not receive
sufficient kill dosage using this two source configuration.
Table 2 UVC Spectrometer measurements for two-UVC source configuration
Table 2 shows UVC Spectrometer measurements for two-UVC source configuration reported in
µW/sec-cm2. Five scans were averaged at each specified wavelength for each acquisition. Five
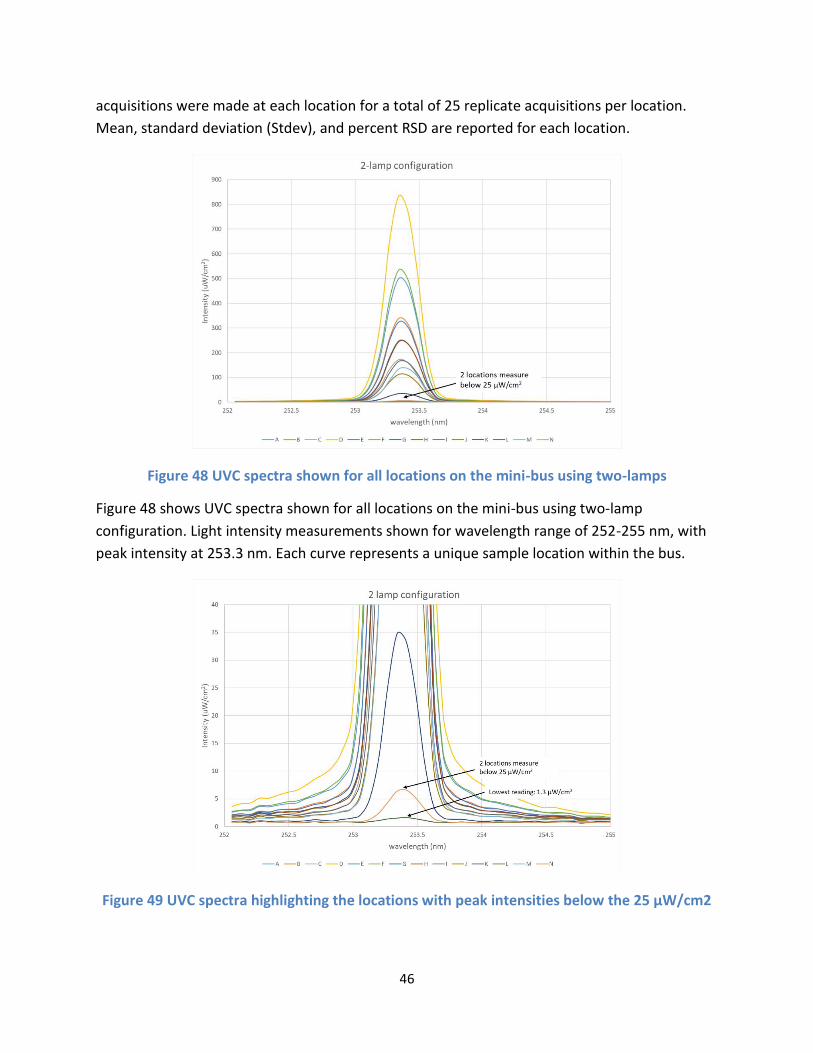
46
acquisitions were made at each location for a total of 25 replicate acquisitions per location.
Mean, standard deviation (Stdev), and percent RSD are reported for each location.
Figure 48 UVC spectra shown for all locations on the mini-bus using two-lamps
Figure 48 shows UVC spectra shown for all locations on the mini-bus using two-lamp
configuration. Light intensity measurements shown for wavelength range of 252-255 nm, with
peak intensity at 253.3 nm. Each curve represents a unique sample location within the bus.
Figure 49 UVC spectra highlighting the locations with peak intensities below the 25 µW/cm2
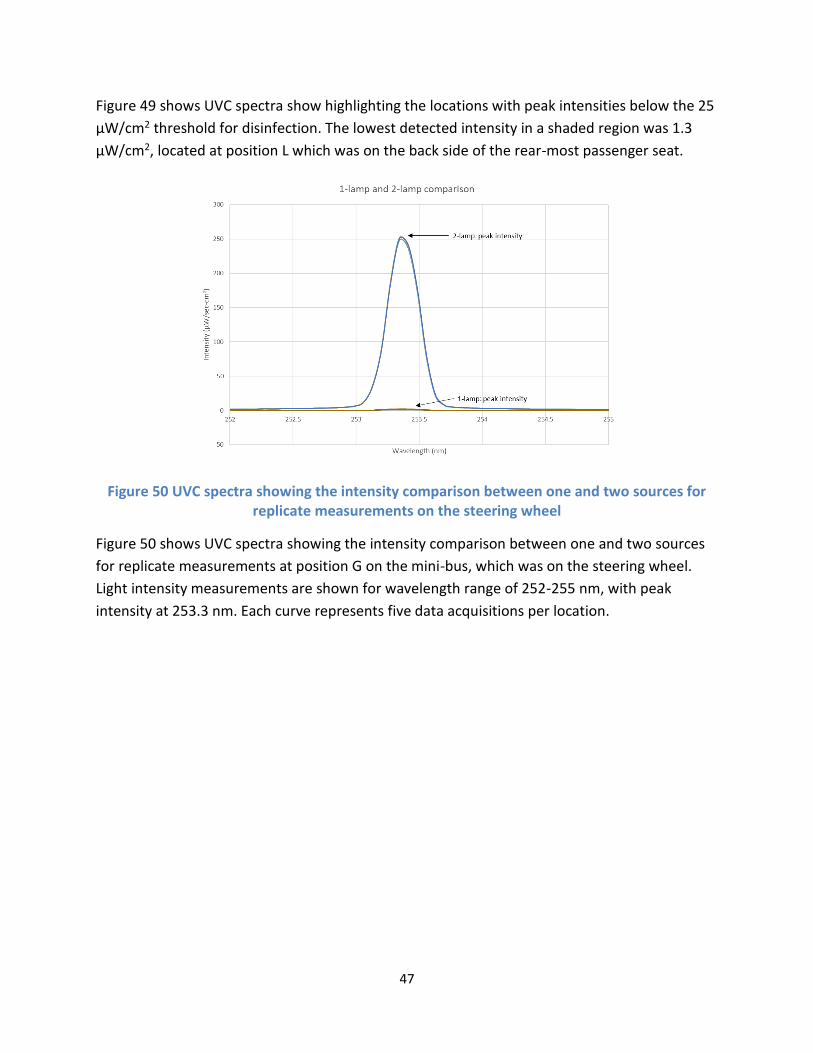
47
Figure 49 shows UVC spectra show highlighting the locations with peak intensities below the 25
µW/cm2 threshold for disinfection. The lowest detected intensity in a shaded region was 1.3
µW/cm2, located at position L which was on the back side of the rear-most passenger seat.
Figure 50 UVC spectra showing the intensity comparison between one and two sources for replicate measurements on the steering wheel
Figure 50 shows UVC spectra showing the intensity comparison between one and two sources
for replicate measurements at position G on the mini-bus, which was on the steering wheel.
Light intensity measurements are shown for wavelength range of 252-255 nm, with peak
intensity at 253.3 nm. Each curve represents five data acquisitions per location.
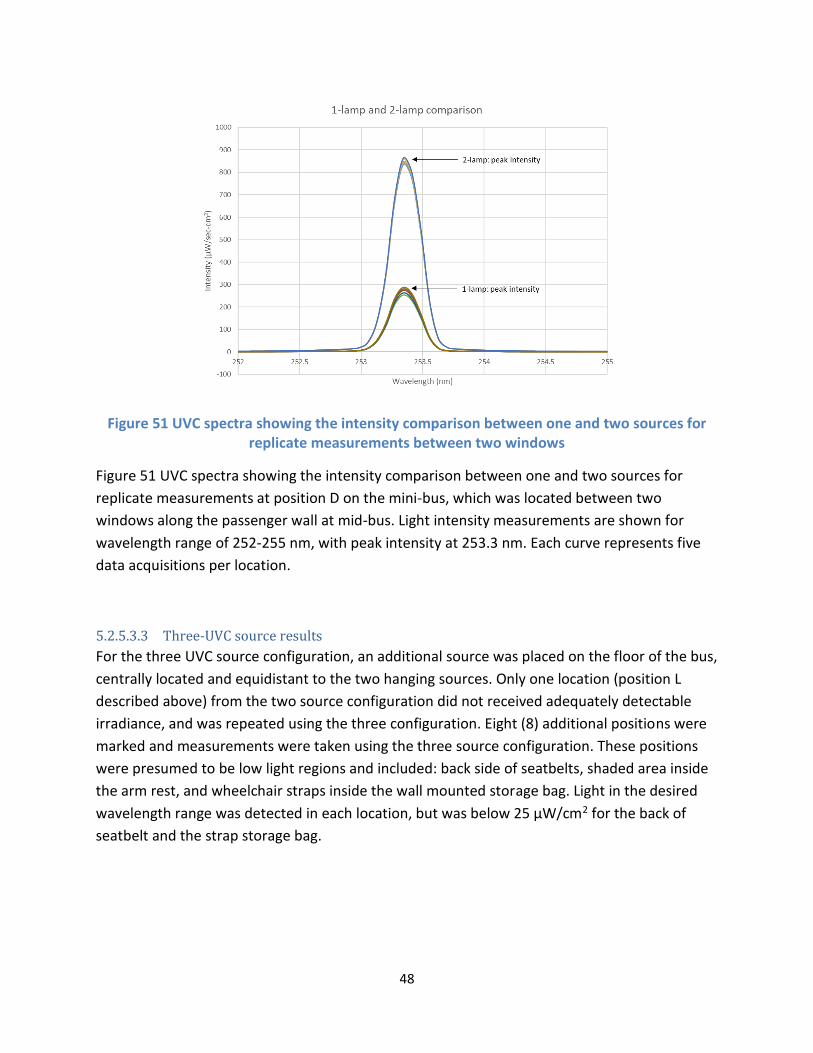
48
Figure 51 UVC spectra showing the intensity comparison between one and two sources for replicate measurements between two windows
Figure 51 UVC spectra showing the intensity comparison between one and two sources for
replicate measurements at position D on the mini-bus, which was located between two
windows along the passenger wall at mid-bus. Light intensity measurements are shown for
wavelength range of 252-255 nm, with peak intensity at 253.3 nm. Each curve represents five
data acquisitions per location.
5.2.5.3.3 Three-UVC source results
For the three UVC source configuration, an additional source was placed on the floor of the bus,
centrally located and equidistant to the two hanging sources. Only one location (position L
described above) from the two source configuration did not received adequately detectable
irradiance, and was repeated using the three configuration. Eight (8) additional positions were
marked and measurements were taken using the three source configuration. These positions
were presumed to be low light regions and included: back side of seatbelts, shaded area inside
the arm rest, and wheelchair straps inside the wall mounted storage bag. Light in the desired
wavelength range was detected in each location, but was below 25 µW/cm2 for the back of
seatbelt and the strap storage bag.
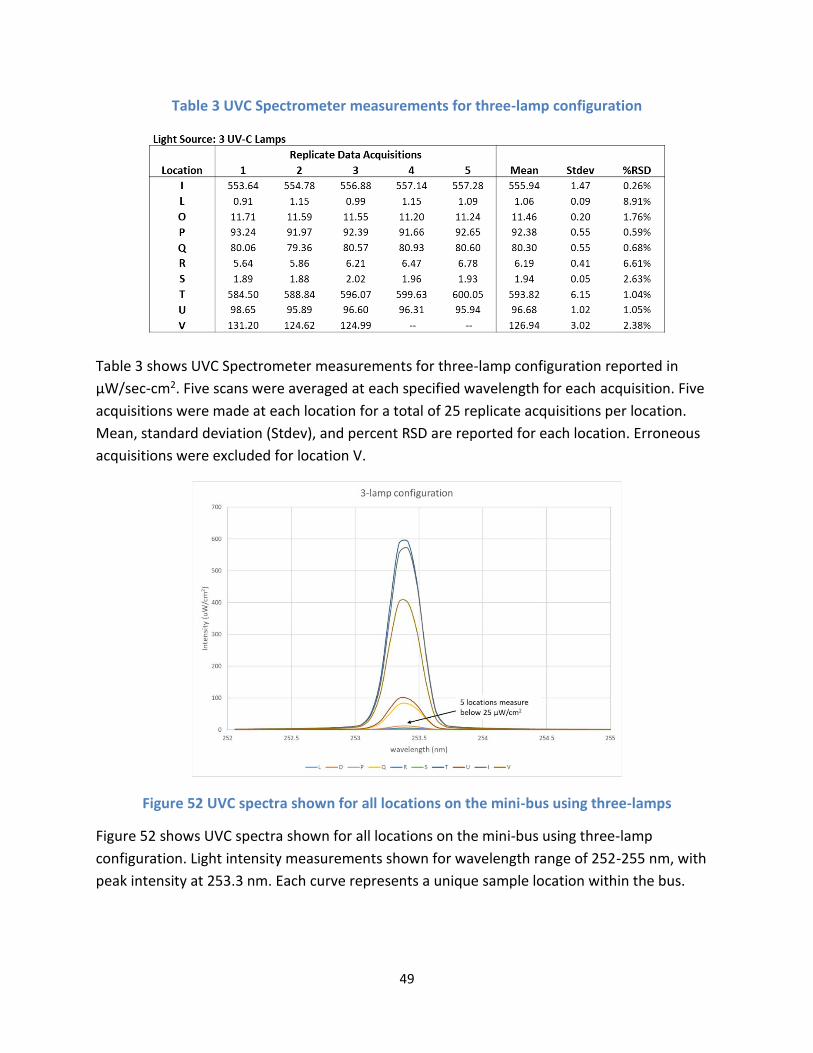
49
Table 3 UVC Spectrometer measurements for three-lamp configuration
Table 3 shows UVC Spectrometer measurements for three-lamp configuration reported in
µW/sec-cm2. Five scans were averaged at each specified wavelength for each acquisition. Five
acquisitions were made at each location for a total of 25 replicate acquisitions per location.
Mean, standard deviation (Stdev), and percent RSD are reported for each location. Erroneous
acquisitions were excluded for location V.
Figure 52 UVC spectra shown for all locations on the mini-bus using three-lamps
Figure 52 shows UVC spectra shown for all locations on the mini-bus using three-lamp
configuration. Light intensity measurements shown for wavelength range of 252-255 nm, with
peak intensity at 253.3 nm. Each curve represents a unique sample location within the bus.
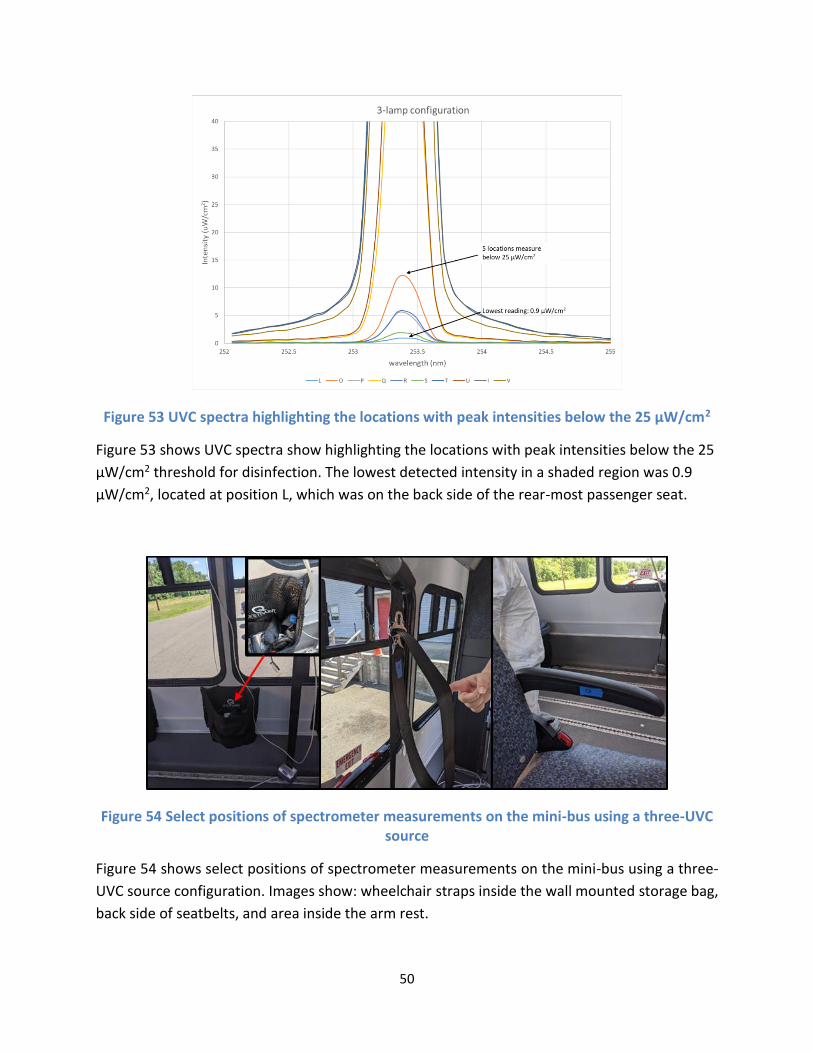
50
Figure 53 UVC spectra highlighting the locations with peak intensities below the 25 µW/cm2
Figure 53 shows UVC spectra show highlighting the locations with peak intensities below the 25
µW/cm2 threshold for disinfection. The lowest detected intensity in a shaded region was 0.9
µW/cm2, located at position L, which was on the back side of the rear-most passenger seat.
Figure 54 Select positions of spectrometer measurements on the mini-bus using a three-UVC source
Figure 54 shows select positions of spectrometer measurements on the mini-bus using a three-
UVC source configuration. Images show: wheelchair straps inside the wall mounted storage bag,
back side of seatbelts, and area inside the arm rest.
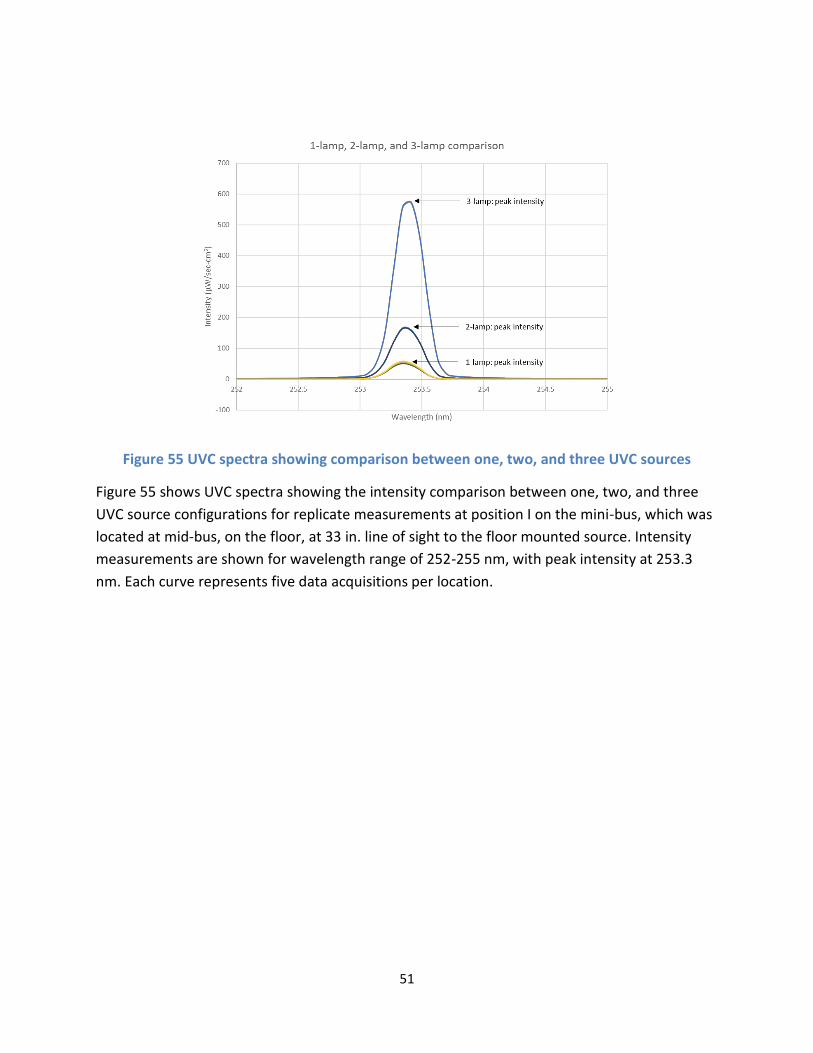
51
Figure 55 UVC spectra showing comparison between one, two, and three UVC sources
Figure 55 shows UVC spectra showing the intensity comparison between one, two, and three
UVC source configurations for replicate measurements at position I on the mini-bus, which was
located at mid-bus, on the floor, at 33 in. line of sight to the floor mounted source. Intensity
measurements are shown for wavelength range of 252-255 nm, with peak intensity at 253.3
nm. Each curve represents five data acquisitions per location.
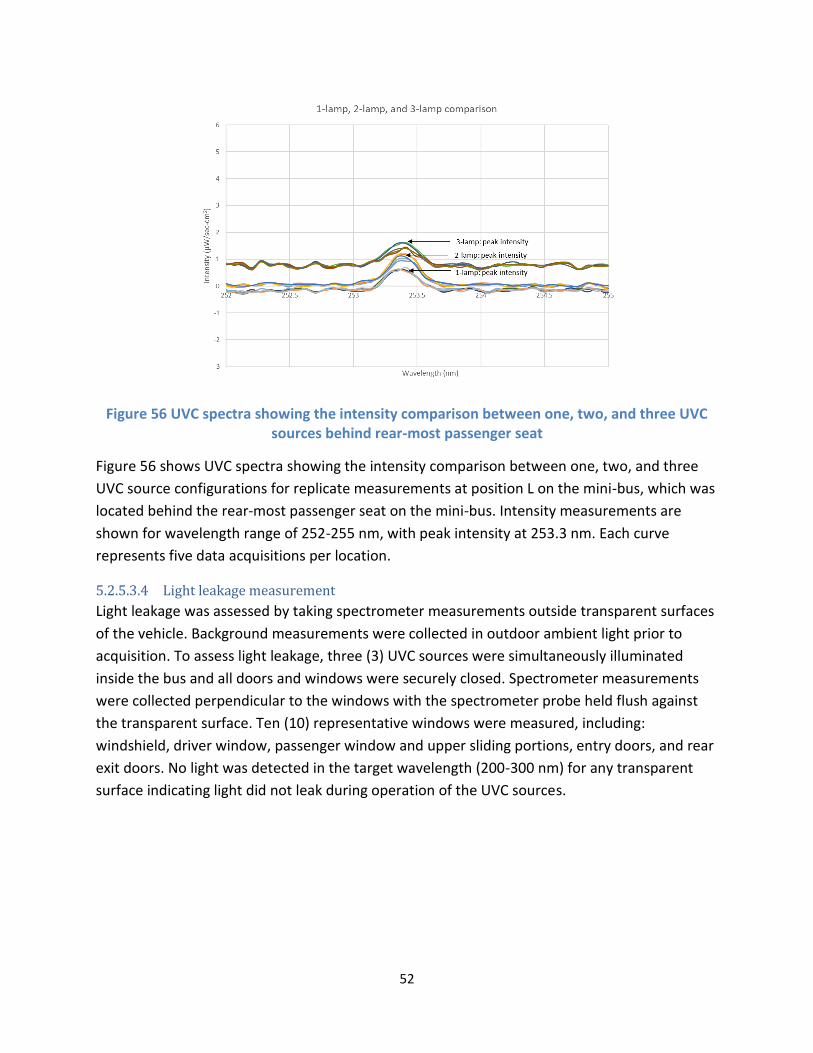
52
Figure 56 UVC spectra showing the intensity comparison between one, two, and three UVC sources behind rear-most passenger seat
Figure 56 shows UVC spectra showing the intensity comparison between one, two, and three
UVC source configurations for replicate measurements at position L on the mini-bus, which was
located behind the rear-most passenger seat on the mini-bus. Intensity measurements are
shown for wavelength range of 252-255 nm, with peak intensity at 253.3 nm. Each curve
represents five data acquisitions per location.
5.2.5.3.4 Light leakage measurement
Light leakage was assessed by taking spectrometer measurements outside transparent surfaces
of the vehicle. Background measurements were collected in outdoor ambient light prior to
acquisition. To assess light leakage, three (3) UVC sources were simultaneously illuminated
inside the bus and all doors and windows were securely closed. Spectrometer measurements
were collected perpendicular to the windows with the spectrometer probe held flush against
the transparent surface. Ten (10) representative windows were measured, including:
windshield, driver window, passenger window and upper sliding portions, entry doors, and rear
exit doors. No light was detected in the target wavelength (200-300 nm) for any transparent
surface indicating light did not leak during operation of the UVC sources.
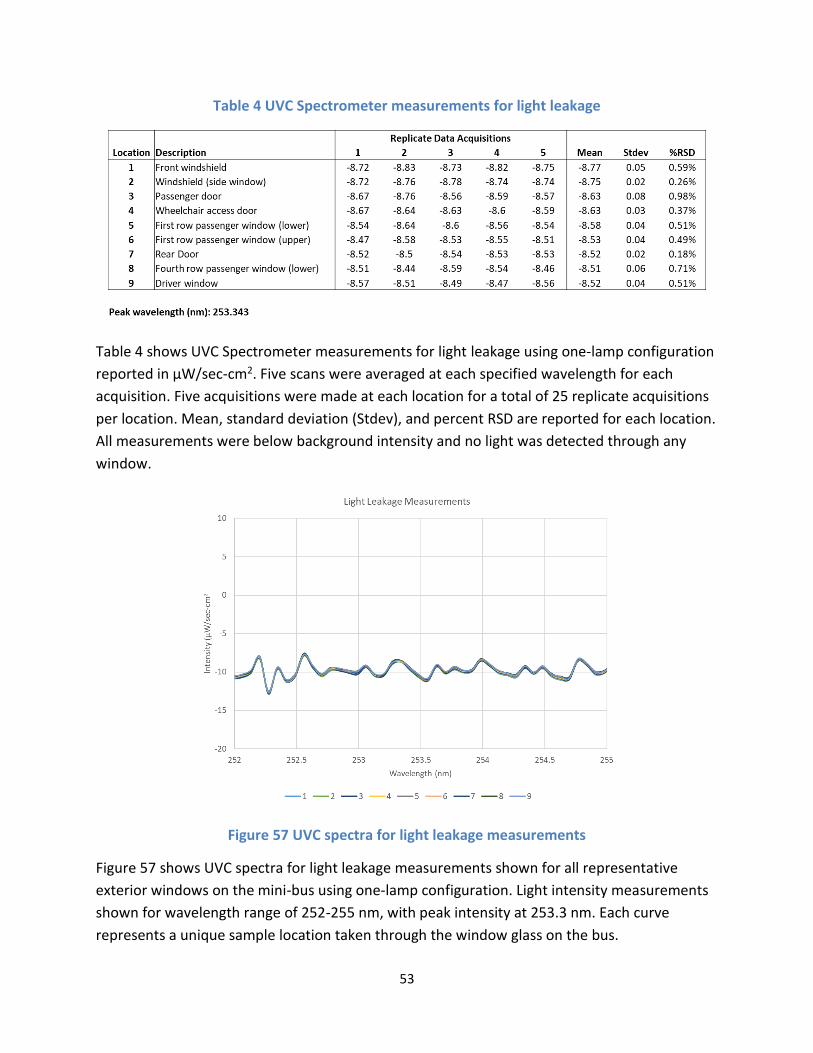
53
Table 4 UVC Spectrometer measurements for light leakage
Table 4 shows UVC Spectrometer measurements for light leakage using one-lamp configuration
reported in µW/sec-cm2. Five scans were averaged at each specified wavelength for each
acquisition. Five acquisitions were made at each location for a total of 25 replicate acquisitions
per location. Mean, standard deviation (Stdev), and percent RSD are reported for each location.
All measurements were below background intensity and no light was detected through any
window.
Figure 57 UVC spectra for light leakage measurements
Figure 57 shows UVC spectra for light leakage measurements shown for all representative
exterior windows on the mini-bus using one-lamp configuration. Light intensity measurements
shown for wavelength range of 252-255 nm, with peak intensity at 253.3 nm. Each curve
represents a unique sample location taken through the window glass on the bus.
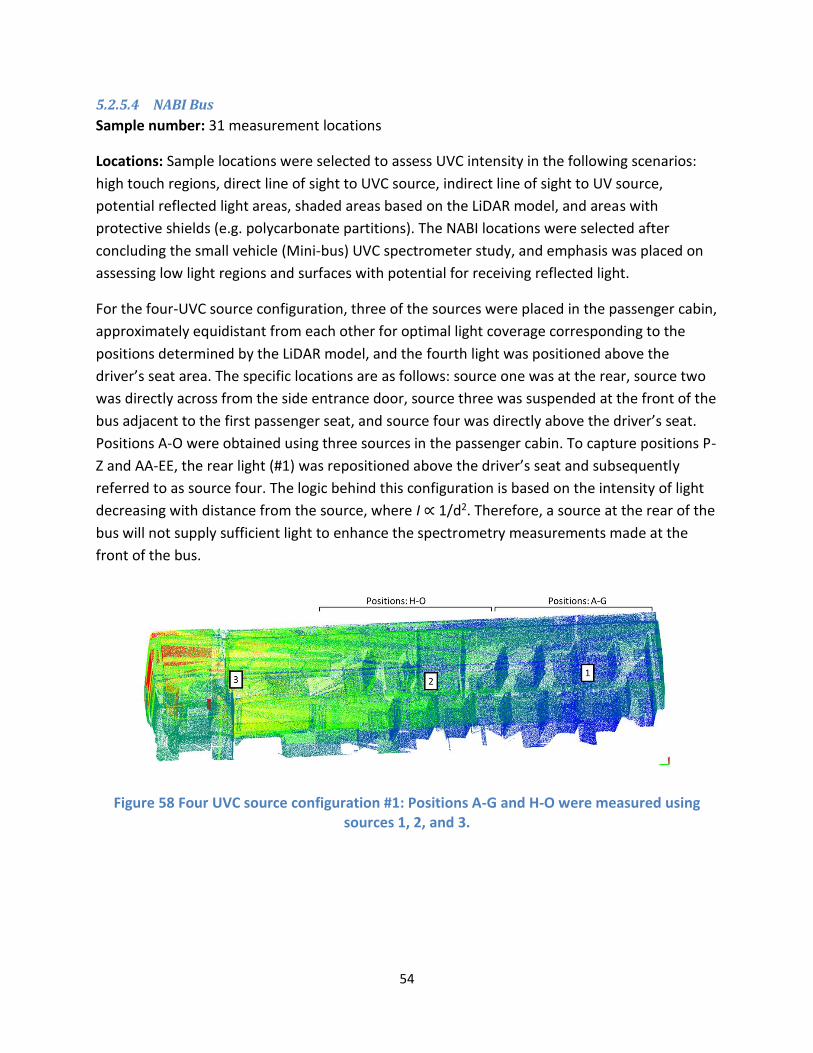
54
5.2.5.4 NABI Bus
Sample number: 31 measurement locations
Locations: Sample locations were selected to assess UVC intensity in the following scenarios:
high touch regions, direct line of sight to UVC source, indirect line of sight to UV source,
potential reflected light areas, shaded areas based on the LiDAR model, and areas with
protective shields (e.g. polycarbonate partitions). The NABI locations were selected after
concluding the small vehicle (Mini-bus) UVC spectrometer study, and emphasis was placed on
assessing low light regions and surfaces with potential for receiving reflected light.
For the four-UVC source configuration, three of the sources were placed in the passenger cabin,
approximately equidistant from each other for optimal light coverage corresponding to the
positions determined by the LiDAR model, and the fourth light was positioned above the
driver’s seat area. The specific locations are as follows: source one was at the rear, source two
was directly across from the side entrance door, source three was suspended at the front of the
bus adjacent to the first passenger seat, and source four was directly above the driver’s seat.
Positions A-O were obtained using three sources in the passenger cabin. To capture positions P-
Z and AA-EE, the rear light (#1) was repositioned above the driver’s seat and subsequently
referred to as source four. The logic behind this configuration is based on the intensity of light
decreasing with distance from the source, where I ∝ 1/d2. Therefore, a source at the rear of the
bus will not supply sufficient light to enhance the spectrometry measurements made at the
front of the bus.
Figure 58 Four UVC source configuration #1: Positions A-G and H-O were measured using sources 1, 2, and 3.
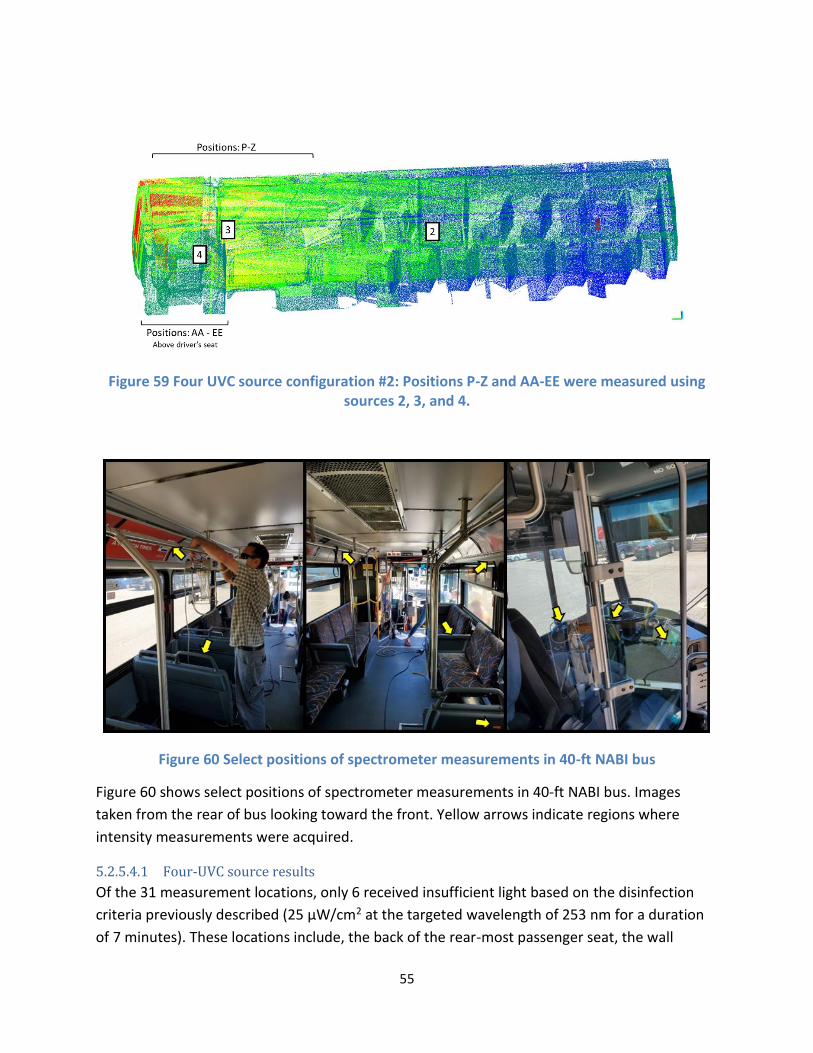
55
Figure 59 Four UVC source configuration #2: Positions P-Z and AA-EE were measured using sources 2, 3, and 4.
Figure 60 Select positions of spectrometer measurements in 40-ft NABI bus
Figure 60 shows select positions of spectrometer measurements in 40-ft NABI bus. Images
taken from the rear of bus looking toward the front. Yellow arrows indicate regions where
intensity measurements were acquired.
5.2.5.4.1 Four-UVC source results
Of the 31 measurement locations, only 6 received insufficient light based on the disinfection
criteria previously described (25 µW/cm2 at the targeted wavelength of 253 nm for a duration
of 7 minutes). These locations include, the back of the rear-most passenger seat, the wall
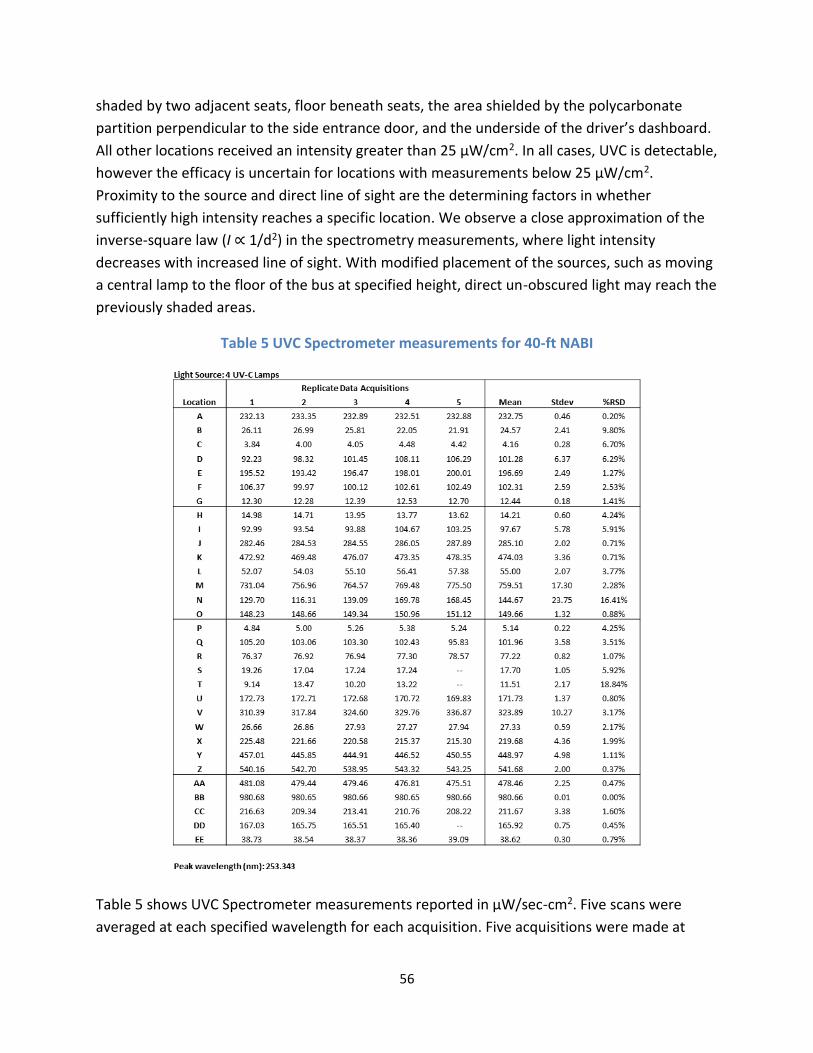
56
shaded by two adjacent seats, floor beneath seats, the area shielded by the polycarbonate
partition perpendicular to the side entrance door, and the underside of the driver’s dashboard.
All other locations received an intensity greater than 25 µW/cm2. In all cases, UVC is detectable,
however the efficacy is uncertain for locations with measurements below 25 µW/cm2.
Proximity to the source and direct line of sight are the determining factors in whether
sufficiently high intensity reaches a specific location. We observe a close approximation of the
inverse-square law (I ∝ 1/d2) in the spectrometry measurements, where light intensity
decreases with increased line of sight. With modified placement of the sources, such as moving
a central lamp to the floor of the bus at specified height, direct un-obscured light may reach the
previously shaded areas.
Table 5 UVC Spectrometer measurements for 40-ft NABI
Table 5 shows UVC Spectrometer measurements reported in µW/sec-cm2. Five scans were
averaged at each specified wavelength for each acquisition. Five acquisitions were made at
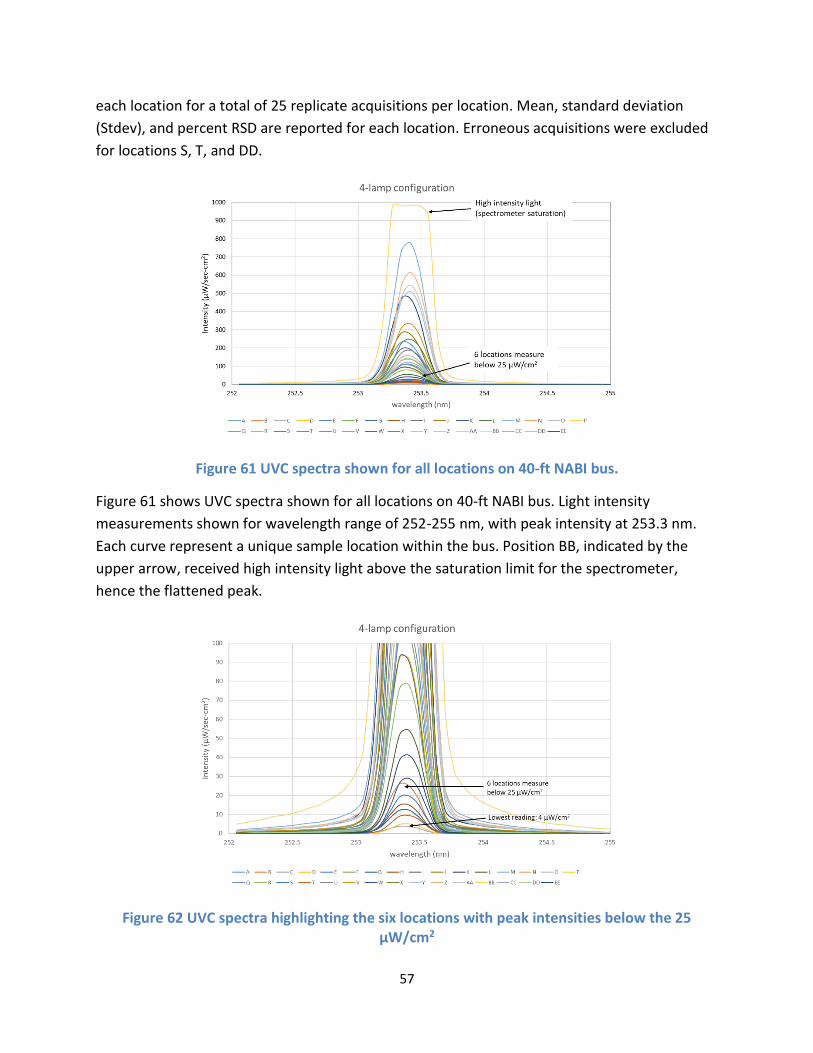
57
each location for a total of 25 replicate acquisitions per location. Mean, standard deviation
(Stdev), and percent RSD are reported for each location. Erroneous acquisitions were excluded
for locations S, T, and DD.
Figure 61 UVC spectra shown for all locations on 40-ft NABI bus.
Figure 61 shows UVC spectra shown for all locations on 40-ft NABI bus. Light intensity
measurements shown for wavelength range of 252-255 nm, with peak intensity at 253.3 nm.
Each curve represent a unique sample location within the bus. Position BB, indicated by the
upper arrow, received high intensity light above the saturation limit for the spectrometer,
hence the flattened peak.
Figure 62 UVC spectra highlighting the six locations with peak intensities below the 25 µW/cm2
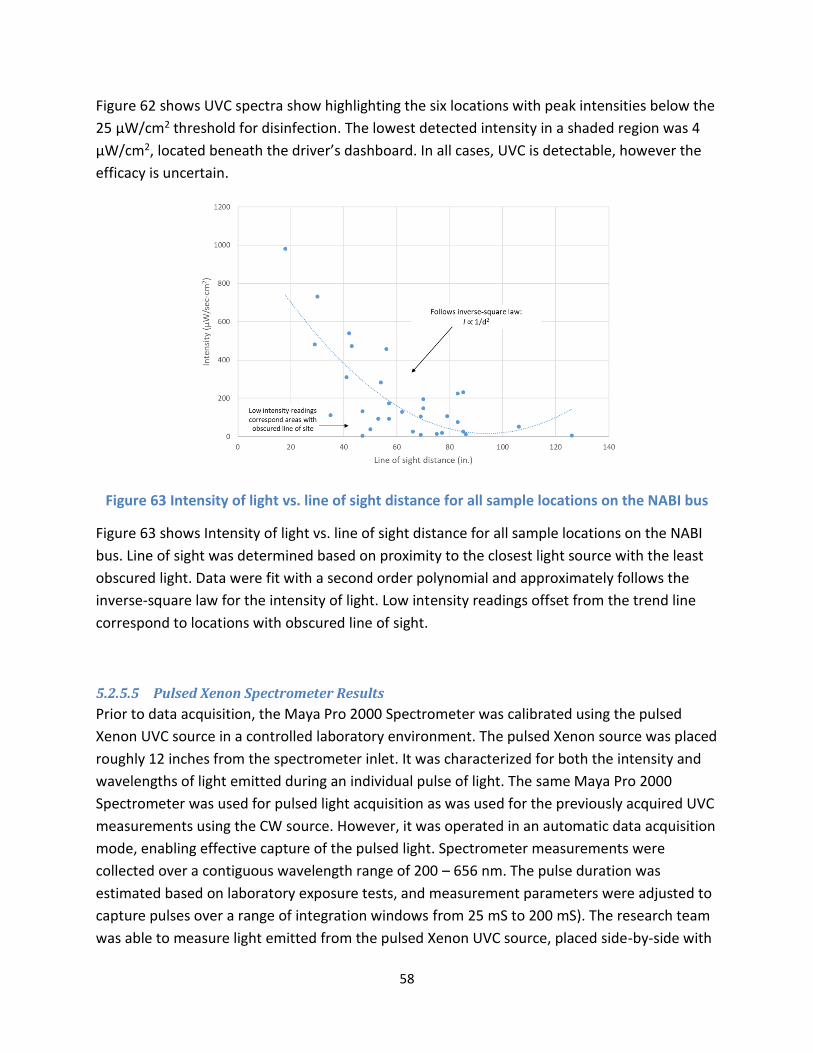
58
Figure 62 shows UVC spectra show highlighting the six locations with peak intensities below the
25 µW/cm2 threshold for disinfection. The lowest detected intensity in a shaded region was 4
µW/cm2, located beneath the driver’s dashboard. In all cases, UVC is detectable, however the
efficacy is uncertain.
Figure 63 Intensity of light vs. line of sight distance for all sample locations on the NABI bus
Figure 63 shows Intensity of light vs. line of sight distance for all sample locations on the NABI
bus. Line of sight was determined based on proximity to the closest light source with the least
obscured light. Data were fit with a second order polynomial and approximately follows the
inverse-square law for the intensity of light. Low intensity readings offset from the trend line
correspond to locations with obscured line of sight.
5.2.5.5 Pulsed Xenon Spectrometer Results
Prior to data acquisition, the Maya Pro 2000 Spectrometer was calibrated using the pulsed
Xenon UVC source in a controlled laboratory environment. The pulsed Xenon source was placed
roughly 12 inches from the spectrometer inlet. It was characterized for both the intensity and
wavelengths of light emitted during an individual pulse of light. The same Maya Pro 2000
Spectrometer was used for pulsed light acquisition as was used for the previously acquired UVC
measurements using the CW source. However, it was operated in an automatic data acquisition
mode, enabling effective capture of the pulsed light. Spectrometer measurements were
collected over a contiguous wavelength range of 200 – 656 nm. The pulse duration was
estimated based on laboratory exposure tests, and measurement parameters were adjusted to
capture pulses over a range of integration windows from 25 mS to 200 mS). The research team
was able to measure light emitted from the pulsed Xenon UVC source, placed side-by-side with
59
the Mercury UVC source, and demonstrate the difference in the emission spectrum for each
source. The continuous wave unit uses a Mercury vapor source which produces a line spectrum
of very distinct wavelengths, with a peak maximum at a wavelength of ~254 nm in the UV
range. In contrast, the pulsed system uses Xenon gas and produces a broad continuous
spectrum from about 200 - 700 nm, extending from the UV to visible light range. The maximum
wavelength detected by the spectrometer was 656 nm, and therefore all graphs are shown
within the range of 200-650 nm. For the pulsed source, some data were collected with high
intensity signals being attenuated, when the ability of the spectrometer to follow the high light
emission intensity, is exceeded. The overall peak patterns were preserved and allowed for
direct comparison.
The full duration of a single pulse was estimated to be about 60 mS based on readings taken
using a 25 mS time window with two spectra being averaged. This creates a 50 mS window of
time in which a single pulse can measured. Our data shows that this pulse of light is detected
over two integration windows (i.e. intervals of time). When looking at a series of acquisition
data we observed the intervals when light is not present vs. when it is present. Therefore, the
research team used the absence of light as a benchmark for the window of time prior to the
first pulse acquisition. The two subsequent acquisitions will have a split signal, with most of the
light recorded in the first acquisition/capture. Therefore, the reported data represent a close
approximation of the measured intensities (in µW/cm2), but with a potential signal reduction of
up to 18% calculated based on successive acquisitions.
Following laboratory calibration and optimization of the acquisition parameters, the pulsed
Xenon source was taken to the mini-bus and measurements were made at four positions inside
the bus. As shown in Figure 64, the pulsed Xenon source was placed directly below the Mercury
source to approximate equal line of sight distances between the spectrometer and both UVC
light sources. Four additional positions outside the bus were measured to check for light
leakage, using the same light source configuration.
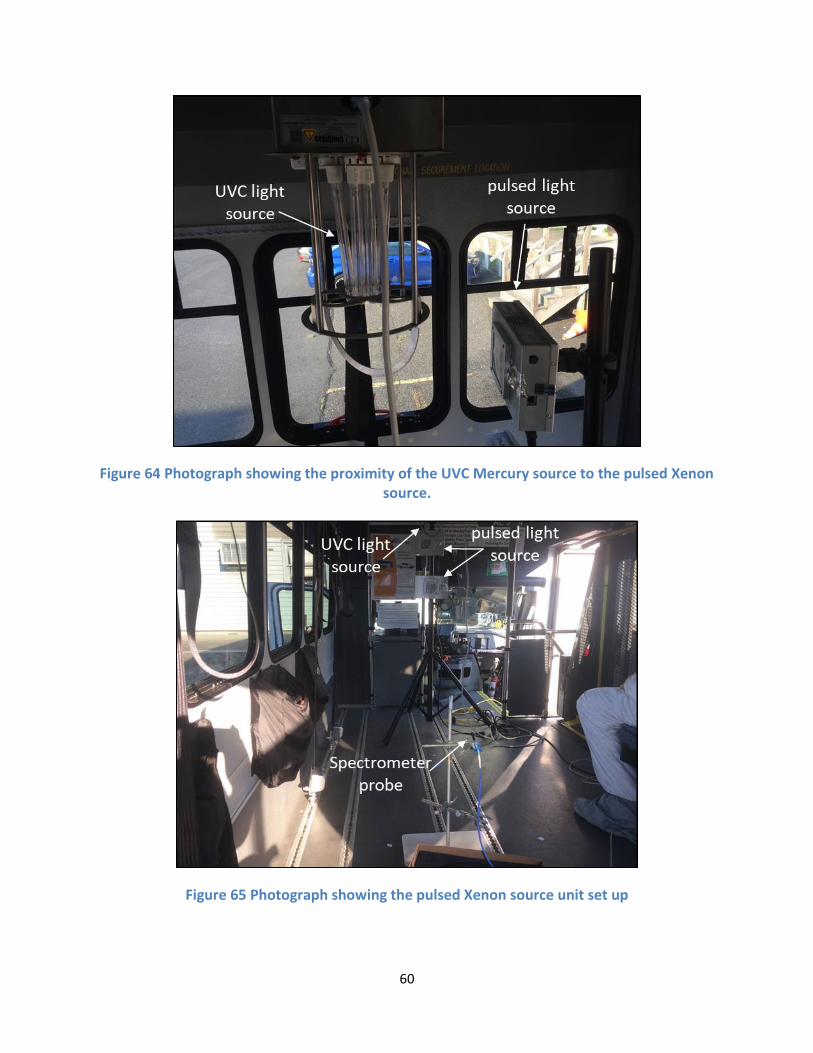
60
Figure 64 Photograph showing the proximity of the UVC Mercury source to the pulsed Xenon source.
Figure 65 Photograph showing the pulsed Xenon source unit set up
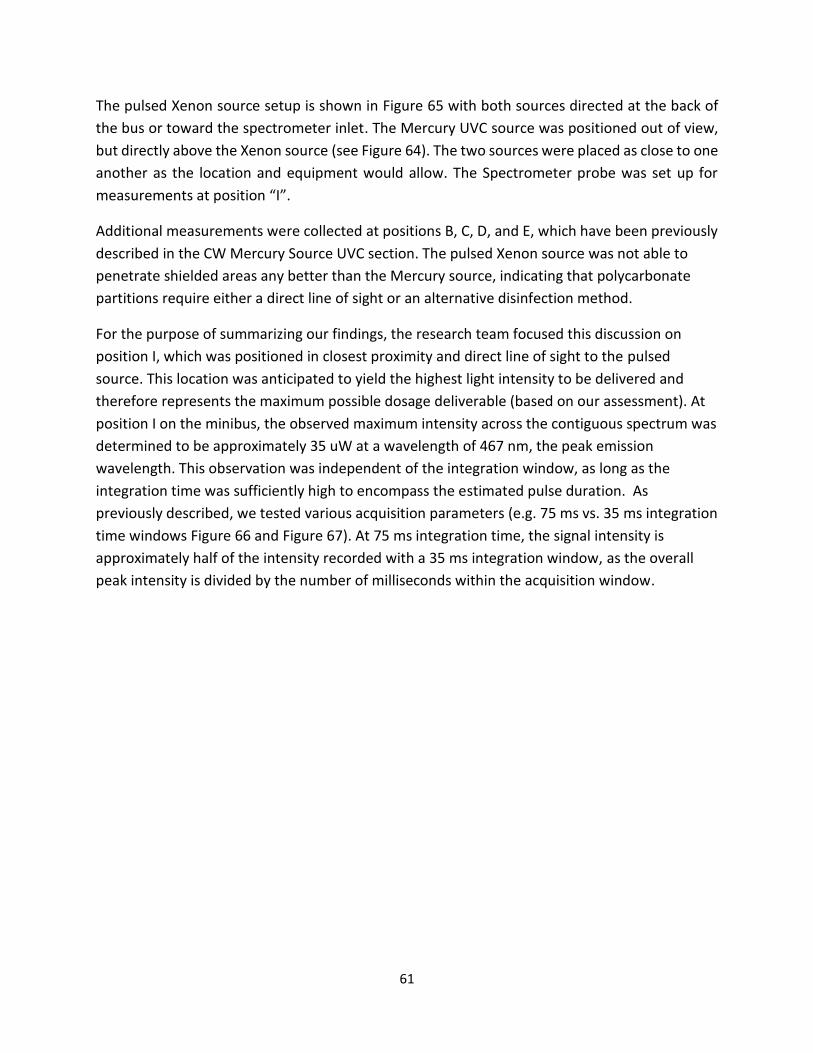
61
The pulsed Xenon source setup is shown in Figure 65 with both sources directed at the back of
the bus or toward the spectrometer inlet. The Mercury UVC source was positioned out of view,
but directly above the Xenon source (see Figure 64). The two sources were placed as close to one
another as the location and equipment would allow. The Spectrometer probe was set up for
measurements at position “I”.
Additional measurements were collected at positions B, C, D, and E, which have been previously
described in the CW Mercury Source UVC section. The pulsed Xenon source was not able to
penetrate shielded areas any better than the Mercury source, indicating that polycarbonate
partitions require either a direct line of sight or an alternative disinfection method.
For the purpose of summarizing our findings, the research team focused this discussion on
position I, which was positioned in closest proximity and direct line of sight to the pulsed
source. This location was anticipated to yield the highest light intensity to be delivered and
therefore represents the maximum possible dosage deliverable (based on our assessment). At
position I on the minibus, the observed maximum intensity across the contiguous spectrum was
determined to be approximately 35 uW at a wavelength of 467 nm, the peak emission
wavelength. This observation was independent of the integration window, as long as the
integration time was sufficiently high to encompass the estimated pulse duration. As
previously described, we tested various acquisition parameters (e.g. 75 ms vs. 35 ms integration
time windows Figure 66 and Figure 67). At 75 ms integration time, the signal intensity is
approximately half of the intensity recorded with a 35 ms integration window, as the overall
peak intensity is divided by the number of milliseconds within the acquisition window.
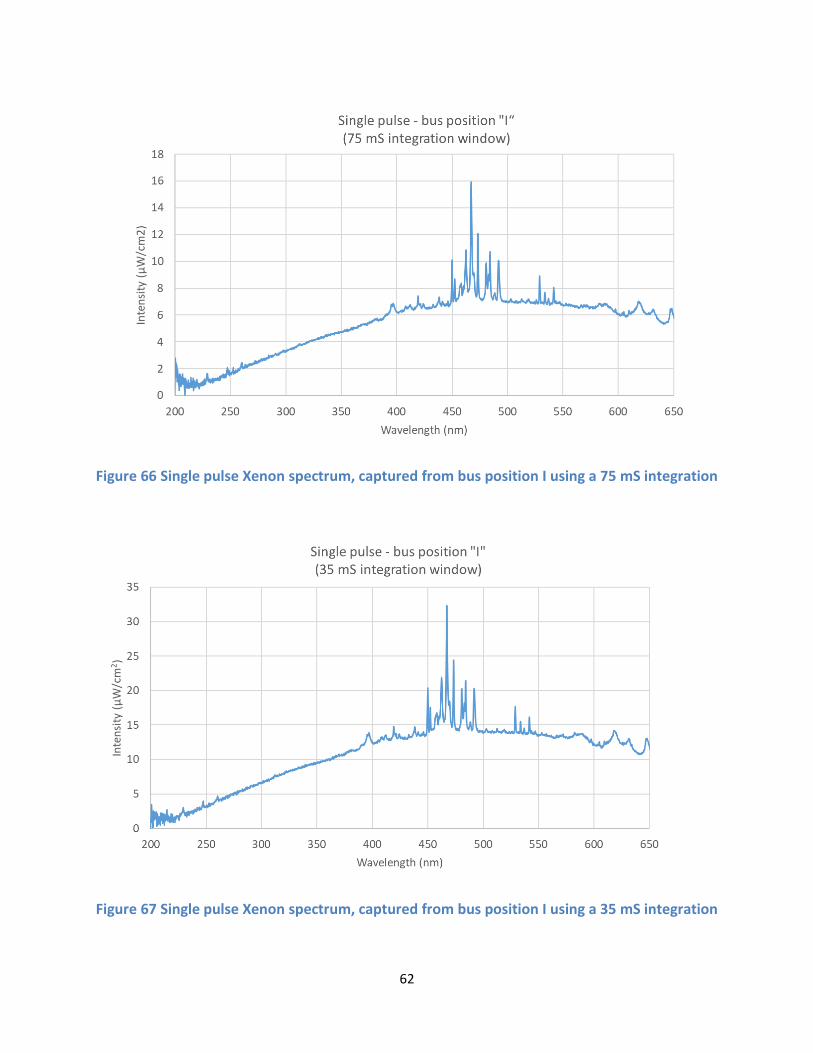
62
Figure 66 Single pulse Xenon spectrum, captured from bus position I using a 75 mS integration
Figure 67 Single pulse Xenon spectrum, captured from bus position I using a 35 mS integration
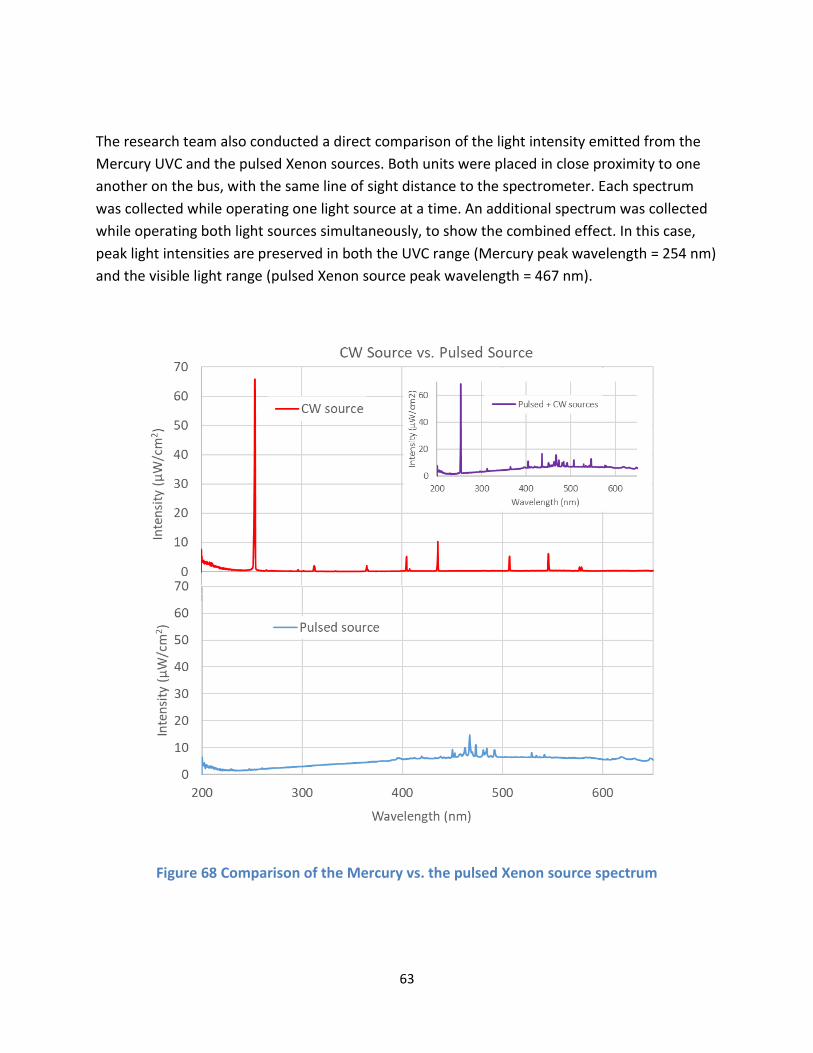
63
The research team also conducted a direct comparison of the light intensity emitted from the
Mercury UVC and the pulsed Xenon sources. Both units were placed in close proximity to one
another on the bus, with the same line of sight distance to the spectrometer. Each spectrum
was collected while operating one light source at a time. An additional spectrum was collected
while operating both light sources simultaneously, to show the combined effect. In this case,
peak light intensities are preserved in both the UVC range (Mercury peak wavelength = 254 nm)
and the visible light range (pulsed Xenon source peak wavelength = 467 nm).
Figure 68 Comparison of the Mercury vs. the pulsed Xenon source spectrum
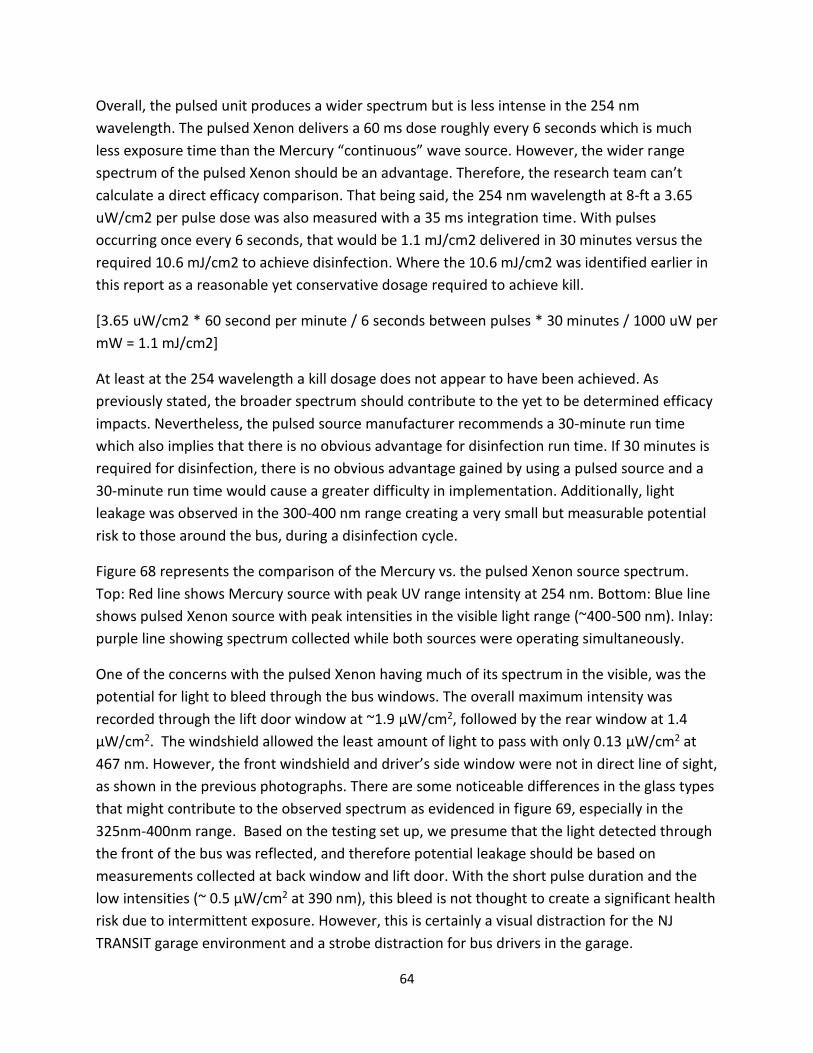
64
Overall, the pulsed unit produces a wider spectrum but is less intense in the 254 nm
wavelength. The pulsed Xenon delivers a 60 ms dose roughly every 6 seconds which is much
less exposure time than the Mercury “continuous” wave source. However, the wider range
spectrum of the pulsed Xenon should be an advantage. Therefore, the research team can’t
calculate a direct efficacy comparison. That being said, the 254 nm wavelength at 8-ft a 3.65
uW/cm2 per pulse dose was also measured with a 35 ms integration time. With pulses
occurring once every 6 seconds, that would be 1.1 mJ/cm2 delivered in 30 minutes versus the
required 10.6 mJ/cm2 to achieve disinfection. Where the 10.6 mJ/cm2 was identified earlier in
this report as a reasonable yet conservative dosage required to achieve kill.
[3.65 uW/cm2 * 60 second per minute / 6 seconds between pulses * 30 minutes / 1000 uW per
mW = 1.1 mJ/cm2]
At least at the 254 wavelength a kill dosage does not appear to have been achieved. As
previously stated, the broader spectrum should contribute to the yet to be determined efficacy
impacts. Nevertheless, the pulsed source manufacturer recommends a 30-minute run time
which also implies that there is no obvious advantage for disinfection run time. If 30 minutes is
required for disinfection, there is no obvious advantage gained by using a pulsed source and a
30-minute run time would cause a greater difficulty in implementation. Additionally, light
leakage was observed in the 300-400 nm range creating a very small but measurable potential
risk to those around the bus, during a disinfection cycle.
Figure 68 represents the comparison of the Mercury vs. the pulsed Xenon source spectrum.
Top: Red line shows Mercury source with peak UV range intensity at 254 nm. Bottom: Blue line
shows pulsed Xenon source with peak intensities in the visible light range (~400-500 nm). Inlay:
purple line showing spectrum collected while both sources were operating simultaneously.
One of the concerns with the pulsed Xenon having much of its spectrum in the visible, was the
potential for light to bleed through the bus windows. The overall maximum intensity was
recorded through the lift door window at ~1.9 µW/cm2, followed by the rear window at 1.4
µW/cm2. The windshield allowed the least amount of light to pass with only 0.13 µW/cm2 at
467 nm. However, the front windshield and driver’s side window were not in direct line of sight,
as shown in the previous photographs. There are some noticeable differences in the glass types
that might contribute to the observed spectrum as evidenced in figure 69, especially in the
325nm-400nm range. Based on the testing set up, we presume that the light detected through
the front of the bus was reflected, and therefore potential leakage should be based on
measurements collected at back window and lift door. With the short pulse duration and the
low intensities (~ 0.5 µW/cm2 at 390 nm), this bleed is not thought to create a significant health
risk due to intermittent exposure. However, this is certainly a visual distraction for the NJ
TRANSIT garage environment and a strobe distraction for bus drivers in the garage.
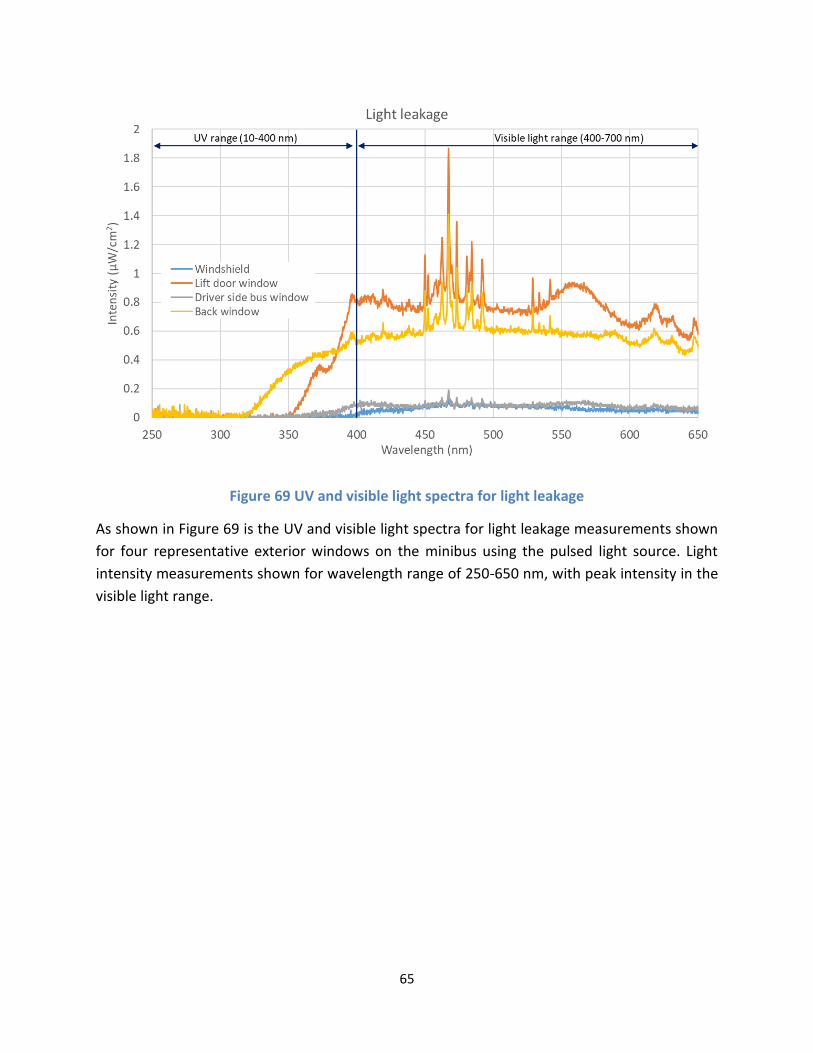
65
Figure 69 UV and visible light spectra for light leakage
As shown in Figure 69 is the UV and visible light spectra for light leakage measurements shown
for four representative exterior windows on the minibus using the pulsed light source. Light
intensity measurements shown for wavelength range of 250-650 nm, with peak intensity in the
visible light range.
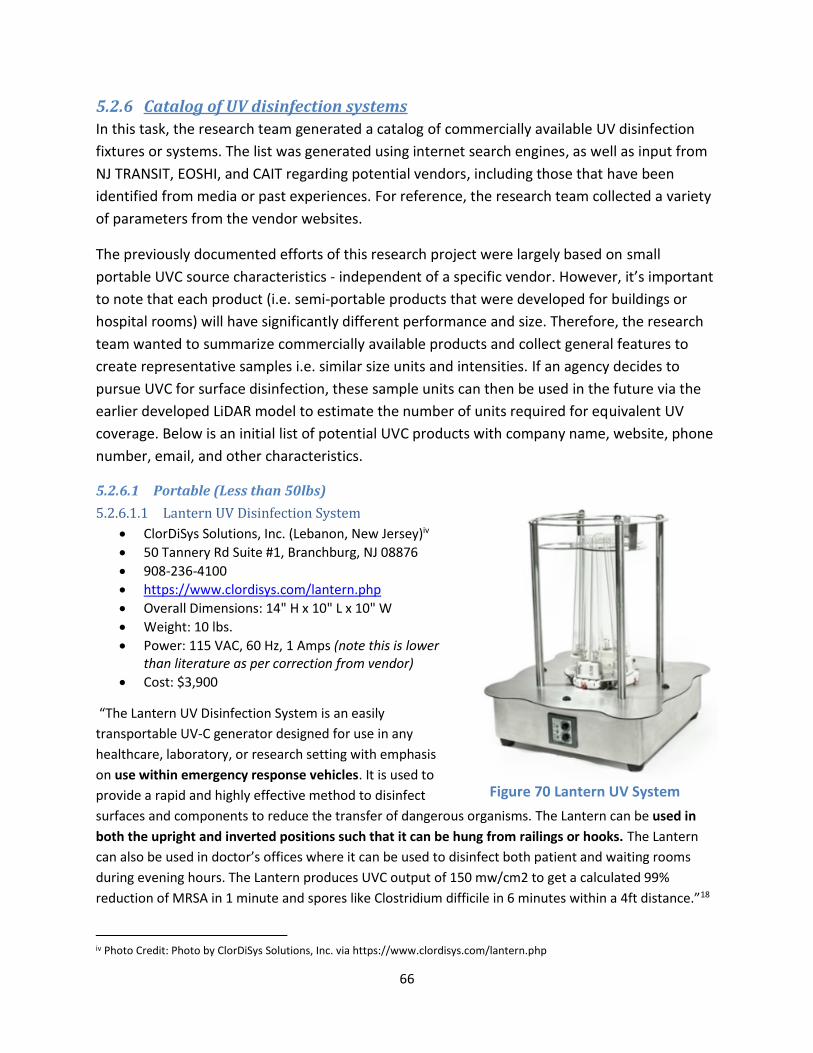
66
5.2.6 Catalog of UV disinfection systems
In this task, the research team generated a catalog of commercially available UV disinfection
fixtures or systems. The list was generated using internet search engines, as well as input from
NJ TRANSIT, EOSHI, and CAIT regarding potential vendors, including those that have been
identified from media or past experiences. For reference, the research team collected a variety
of parameters from the vendor websites.
The previously documented efforts of this research project were largely based on small
portable UVC source characteristics - independent of a specific vendor. However, it’s important
to note that each product (i.e. semi-portable products that were developed for buildings or
hospital rooms) will have significantly different performance and size. Therefore, the research
team wanted to summarize commercially available products and collect general features to
create representative samples i.e. similar size units and intensities. If an agency decides to
pursue UVC for surface disinfection, these sample units can then be used in the future via the
earlier developed LiDAR model to estimate the number of units required for equivalent UV
coverage. Below is an initial list of potential UVC products with company name, website, phone
number, email, and other characteristics.
5.2.6.1 Portable (Less than 50lbs)
5.2.6.1.1 Lantern UV Disinfection System
• ClorDiSys Solutions, Inc. (Lebanon, New Jersey)iv
• 50 Tannery Rd Suite #1, Branchburg, NJ 08876
• 908-236-4100
• https://www.clordisys.com/lantern.php
• Overall Dimensions: 14" H x 10" L x 10" W
• Weight: 10 lbs.
• Power: 115 VAC, 60 Hz, 1 Amps (note this is lower than literature as per correction from vendor)
• Cost: $3,900
“The Lantern UV Disinfection System is an easily
transportable UV-C generator designed for use in any
healthcare, laboratory, or research setting with emphasis
on use within emergency response vehicles. It is used to
provide a rapid and highly effective method to disinfect
surfaces and components to reduce the transfer of dangerous organisms. The Lantern can be used in
both the upright and inverted positions such that it can be hung from railings or hooks. The Lantern
can also be used in doctor’s offices where it can be used to disinfect both patient and waiting rooms
during evening hours. The Lantern produces UVC output of 150 mw/cm2 to get a calculated 99%
reduction of MRSA in 1 minute and spores like Clostridium difficile in 6 minutes within a 4ft distance.”18
iv Photo Credit: Photo by ClorDiSys Solutions, Inc. via https://www.clordisys.com/lantern.php
Figure 70 Lantern UV System
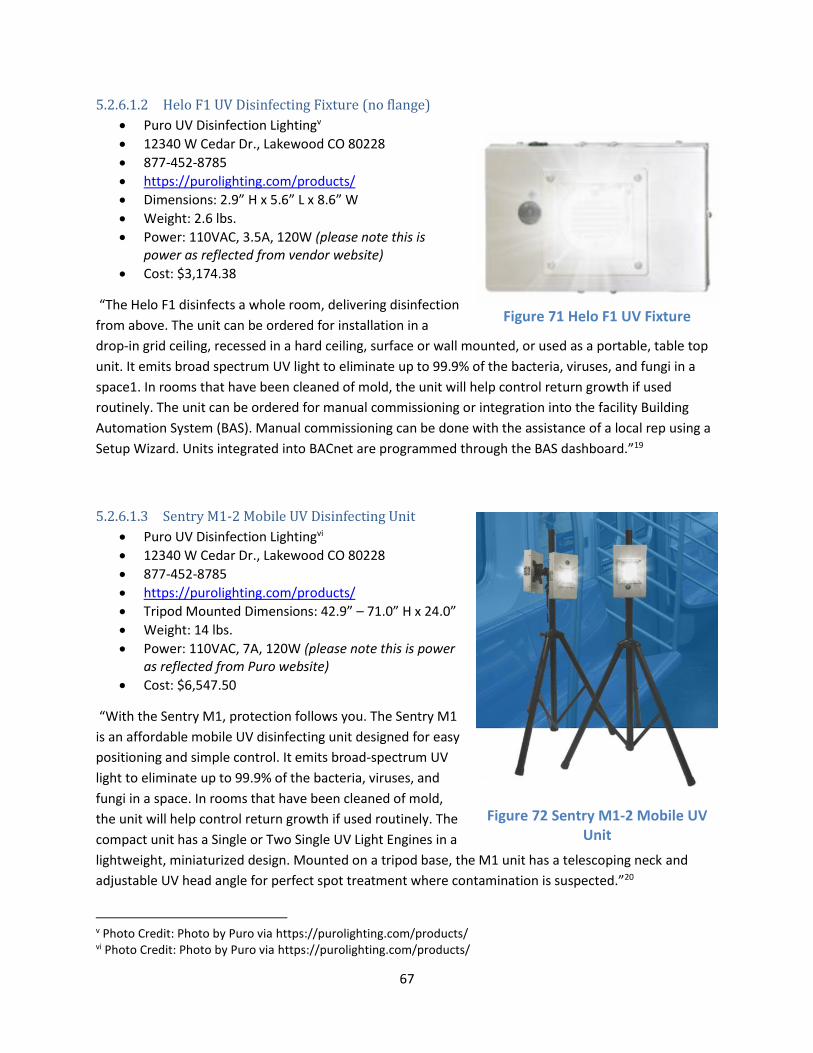
67
5.2.6.1.2 Helo F1 UV Disinfecting Fixture (no flange)
• Puro UV Disinfection Lightingv
• 12340 W Cedar Dr., Lakewood CO 80228
• 877-452-8785
• https://purolighting.com/products/
• Dimensions: 2.9” H x 5.6” L x 8.6” W
• Weight: 2.6 lbs.
• Power: 110VAC, 3.5A, 120W (please note this is power as reflected from vendor website)
• Cost: $3,174.38
“The Helo F1 disinfects a whole room, delivering disinfection
from above. The unit can be ordered for installation in a
drop-in grid ceiling, recessed in a hard ceiling, surface or wall mounted, or used as a portable, table top
unit. It emits broad spectrum UV light to eliminate up to 99.9% of the bacteria, viruses, and fungi in a
space1. In rooms that have been cleaned of mold, the unit will help control return growth if used
routinely. The unit can be ordered for manual commissioning or integration into the facility Building
Automation System (BAS). Manual commissioning can be done with the assistance of a local rep using a
Setup Wizard. Units integrated into BACnet are programmed through the BAS dashboard.”19
5.2.6.1.3 Sentry M1-2 Mobile UV Disinfecting Unit
• Puro UV Disinfection Lightingvi
• 12340 W Cedar Dr., Lakewood CO 80228
• 877-452-8785
• https://purolighting.com/products/
• Tripod Mounted Dimensions: 42.9” – 71.0” H x 24.0”
• Weight: 14 lbs.
• Power: 110VAC, 7A, 120W (please note this is power as reflected from Puro website)
• Cost: $6,547.50
“With the Sentry M1, protection follows you. The Sentry M1
is an affordable mobile UV disinfecting unit designed for easy
positioning and simple control. It emits broad-spectrum UV
light to eliminate up to 99.9% of the bacteria, viruses, and
fungi in a space. In rooms that have been cleaned of mold,
the unit will help control return growth if used routinely. The
compact unit has a Single or Two Single UV Light Engines in a
lightweight, miniaturized design. Mounted on a tripod base, the M1 unit has a telescoping neck and
adjustable UV head angle for perfect spot treatment where contamination is suspected.”20
v Photo Credit: Photo by Puro via https://purolighting.com/products/ vi Photo Credit: Photo by Puro via https://purolighting.com/products/
Figure 71 Helo F1 UV Fixture
Figure 72 Sentry M1-2 Mobile UV Unit
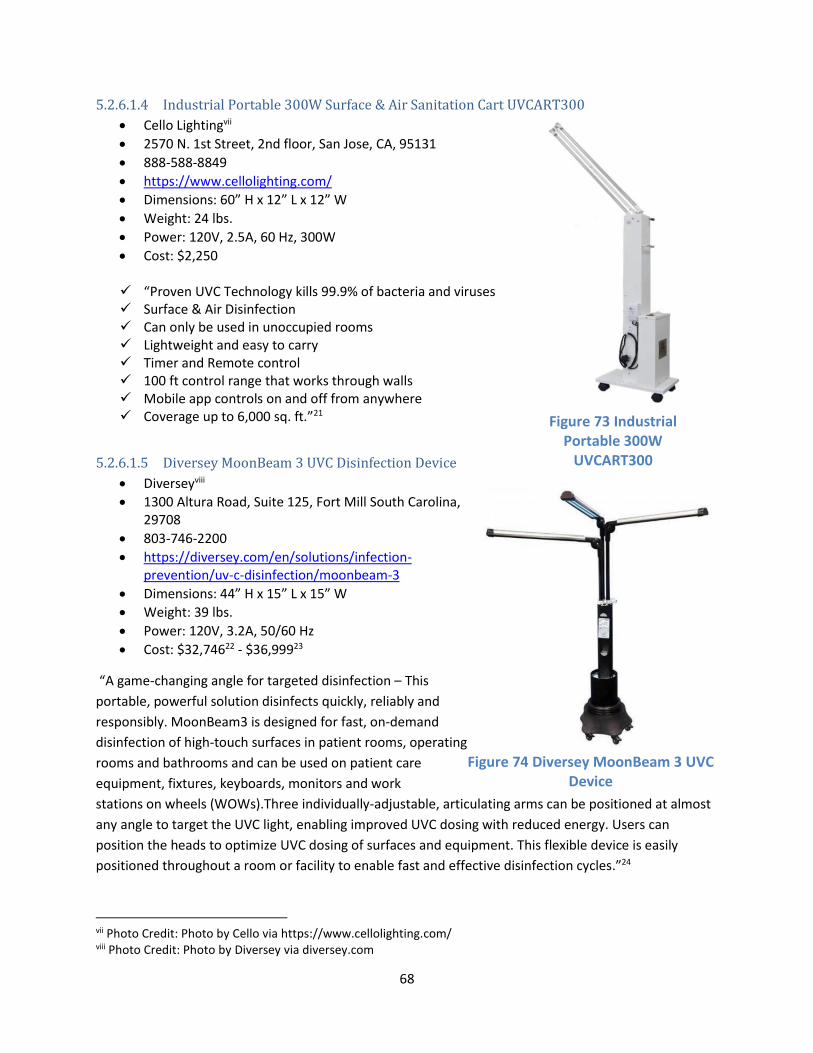
68
5.2.6.1.4 Industrial Portable 300W Surface & Air Sanitation Cart UVCART300
• Cello Lightingvii
• 2570 N. 1st Street, 2nd floor, San Jose, CA, 95131
• 888-588-8849
• https://www.cellolighting.com/
• Dimensions: 60” H x 12” L x 12” W
• Weight: 24 lbs.
• Power: 120V, 2.5A, 60 Hz, 300W
• Cost: $2,250
✓ “Proven UVC Technology kills 99.9% of bacteria and viruses ✓ Surface & Air Disinfection ✓ Can only be used in unoccupied rooms ✓ Lightweight and easy to carry ✓ Timer and Remote control ✓ 100 ft control range that works through walls ✓ Mobile app controls on and off from anywhere ✓ Coverage up to 6,000 sq. ft.”21
5.2.6.1.5 Diversey MoonBeam 3 UVC Disinfection Device
• Diverseyviii
• 1300 Altura Road, Suite 125, Fort Mill South Carolina, 29708
• 803-746-2200
• https://diversey.com/en/solutions/infection-prevention/uv-c-disinfection/moonbeam-3
• Dimensions: 44” H x 15” L x 15” W
• Weight: 39 lbs.
• Power: 120V, 3.2A, 50/60 Hz
• Cost: $32,74622 - $36,99923
“A game-changing angle for targeted disinfection – This
portable, powerful solution disinfects quickly, reliably and
responsibly. MoonBeam3 is designed for fast, on-demand
disinfection of high-touch surfaces in patient rooms, operating
rooms and bathrooms and can be used on patient care
equipment, fixtures, keyboards, monitors and work
stations on wheels (WOWs).Three individually-adjustable, articulating arms can be positioned at almost
any angle to target the UVC light, enabling improved UVC dosing with reduced energy. Users can
position the heads to optimize UVC dosing of surfaces and equipment. This flexible device is easily
positioned throughout a room or facility to enable fast and effective disinfection cycles.”24
vii Photo Credit: Photo by Cello via https://www.cellolighting.com/ viii Photo Credit: Photo by Diversey via diversey.com
Figure 73 Industrial Portable 300W
UVCART300
Figure 74 Diversey MoonBeam 3 UVC Device
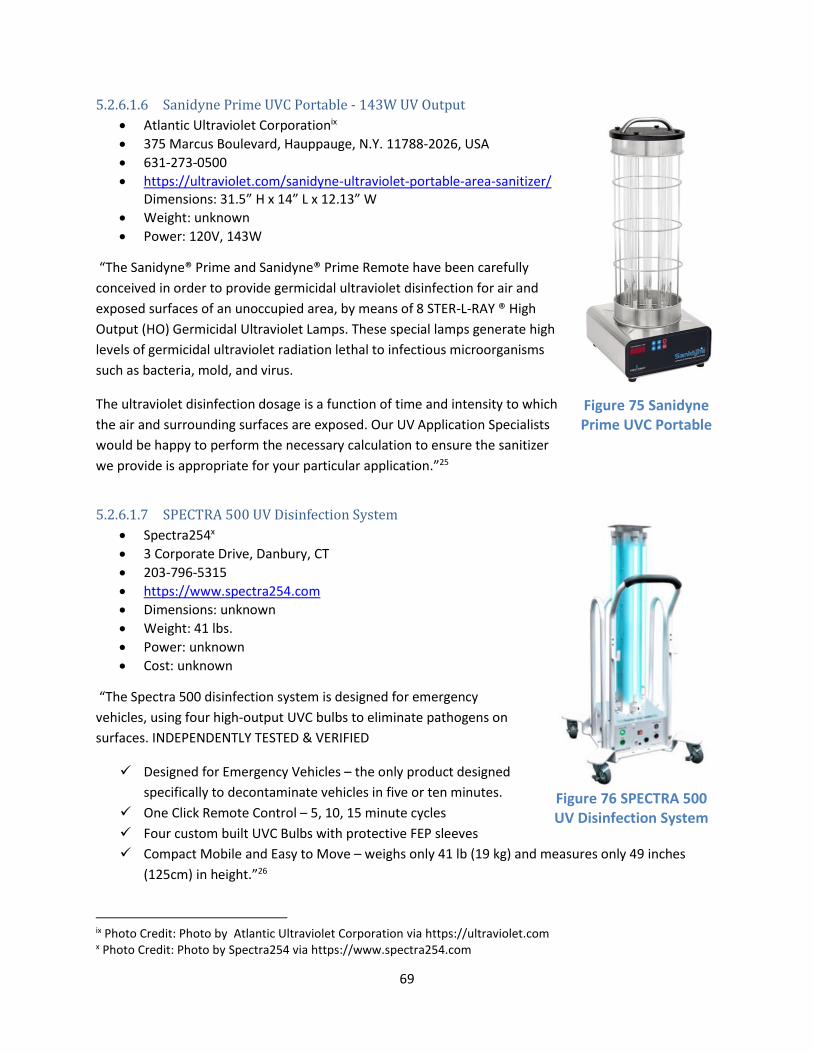
69
5.2.6.1.6 Sanidyne Prime UVC Portable - 143W UV Output
• Atlantic Ultraviolet Corporationix
• 375 Marcus Boulevard, Hauppauge, N.Y. 11788-2026, USA
• 631-273-0500
• https://ultraviolet.com/sanidyne-ultraviolet-portable-area-sanitizer/ Dimensions: 31.5” H x 14” L x 12.13” W
• Weight: unknown
• Power: 120V, 143W
“The Sanidyne® Prime and Sanidyne® Prime Remote have been carefully
conceived in order to provide germicidal ultraviolet disinfection for air and
exposed surfaces of an unoccupied area, by means of 8 STER-L-RAY ® High
Output (HO) Germicidal Ultraviolet Lamps. These special lamps generate high
levels of germicidal ultraviolet radiation lethal to infectious microorganisms
such as bacteria, mold, and virus.
The ultraviolet disinfection dosage is a function of time and intensity to which
the air and surrounding surfaces are exposed. Our UV Application Specialists
would be happy to perform the necessary calculation to ensure the sanitizer
we provide is appropriate for your particular application.”25
5.2.6.1.7 SPECTRA 500 UV Disinfection System
• Spectra254x
• 3 Corporate Drive, Danbury, CT
• 203-796-5315
• https://www.spectra254.com
• Dimensions: unknown
• Weight: 41 lbs.
• Power: unknown
• Cost: unknown
“The Spectra 500 disinfection system is designed for emergency
vehicles, using four high-output UVC bulbs to eliminate pathogens on
surfaces. INDEPENDENTLY TESTED & VERIFIED
✓ Designed for Emergency Vehicles – the only product designed
specifically to decontaminate vehicles in five or ten minutes.
✓ One Click Remote Control – 5, 10, 15 minute cycles
✓ Four custom built UVC Bulbs with protective FEP sleeves
✓ Compact Mobile and Easy to Move – weighs only 41 lb (19 kg) and measures only 49 inches
(125cm) in height.”26
ix Photo Credit: Photo by Atlantic Ultraviolet Corporation via https://ultraviolet.com x Photo Credit: Photo by Spectra254 via https://www.spectra254.com
Figure 75 Sanidyne Prime UVC Portable
Figure 76 SPECTRA 500 UV Disinfection System

70
5.2.6.2 Larger UV Systems (Greater than 50lbs)
5.2.6.2.1 Torch Towerxi
• ClorDiSys Solutions, Inc. (Lebanon, New Jersey)
• 50 Tannery Rd Suite #1 Branchburg, NJ 08876
• 908-236-4100
• https://www.clordisys.com/torch.php
• Dimensions: 23" W x 68" H x 23" D
• Weight: 72 lbs
• Power: 110-240VAC, 6A, 50/60 Hz
• Cost: $25,000
“The TORCH Tower is an inexpensive, easily transportable, powerful
disinfection system designed for use in any healthcare,
pharmaceutical, manufacturing, laboratory, or research setting. It is
used to provide a rapid and highly effective method to disinfect
surfaces, components, room surfaces and common touch points to
reduce the transfer of dangerous organisms. It also offers a way to
disinfect components without removing them from the room, which
helps minimize the chance for cross-contamination. The TORCH
contains eight high powered UVC lamps to provide quick disinfection times. It simply plugs into any
standard wall outlet. The TORCH produces an efficient UVC output of 12 mJ/minute (200 μw/cm2) to
get a calculated 99% reduction of MRSA in 10 seconds. A 99% reduction of spores like Clostridium
difficile can be achieved in 5 minutes within a distance of 10 feet. A recent study shows that traditional
UV systems such as the TORCH provide similar results as expensive Pulsed Xenon Ultraviolet Light
Systems. Click here to read the full study The TORCH system is designed to be so economical that
multiple units are affordable enough to place into a room at the same time to eliminate shadow areas
and maximize coverage for the most thorough disinfection process.”27
xi Photo Credit: Photo by ClorDiSys Solutions, Inc. via https://www.clordisys.com/torch.php
Figure 77 Torch Tower
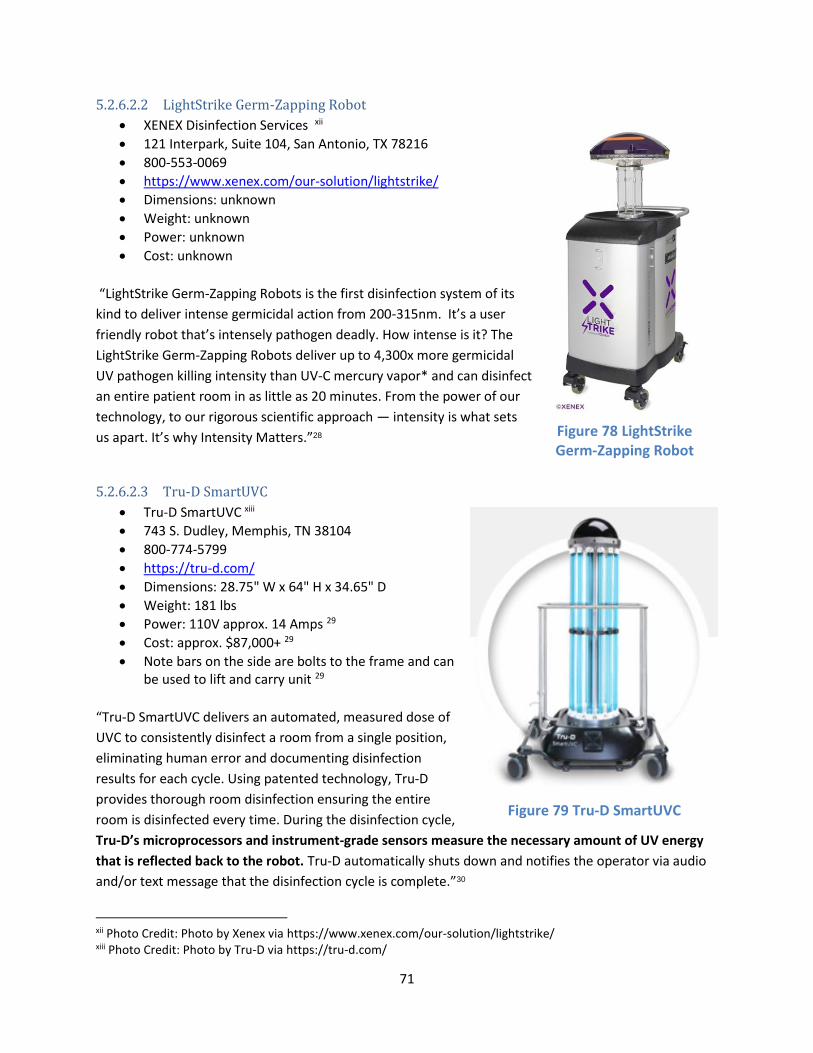
71
5.2.6.2.2 LightStrike Germ-Zapping Robot
• XENEX Disinfection Services xii
• 121 Interpark, Suite 104, San Antonio, TX 78216
• 800-553-0069
• https://www.xenex.com/our-solution/lightstrike/
• Dimensions: unknown
• Weight: unknown
• Power: unknown
• Cost: unknown
“LightStrike Germ-Zapping Robots is the first disinfection system of its
kind to deliver intense germicidal action from 200-315nm. It’s a user
friendly robot that’s intensely pathogen deadly. How intense is it? The
LightStrike Germ-Zapping Robots deliver up to 4,300x more germicidal
UV pathogen killing intensity than UV-C mercury vapor* and can disinfect
an entire patient room in as little as 20 minutes. From the power of our
technology, to our rigorous scientific approach — intensity is what sets
us apart. It’s why Intensity Matters.”28
5.2.6.2.3 Tru-D SmartUVC
• Tru-D SmartUVC xiii
• 743 S. Dudley, Memphis, TN 38104
• 800-774-5799
• https://tru-d.com/
• Dimensions: 28.75" W x 64" H x 34.65" D
• Weight: 181 lbs
• Power: 110V approx. 14 Amps 29
• Cost: approx. $87,000+ 29
• Note bars on the side are bolts to the frame and can be used to lift and carry unit 29
“Tru-D SmartUVC delivers an automated, measured dose of
UVC to consistently disinfect a room from a single position,
eliminating human error and documenting disinfection
results for each cycle. Using patented technology, Tru-D
provides thorough room disinfection ensuring the entire
room is disinfected every time. During the disinfection cycle,
Tru-D’s microprocessors and instrument-grade sensors measure the necessary amount of UV energy
that is reflected back to the robot. Tru-D automatically shuts down and notifies the operator via audio
and/or text message that the disinfection cycle is complete.”30
xii Photo Credit: Photo by Xenex via https://www.xenex.com/our-solution/lightstrike/ xiii Photo Credit: Photo by Tru-D via https://tru-d.com/
Figure 78 LightStrike Germ-Zapping Robot
Figure 79 Tru-D SmartUVC
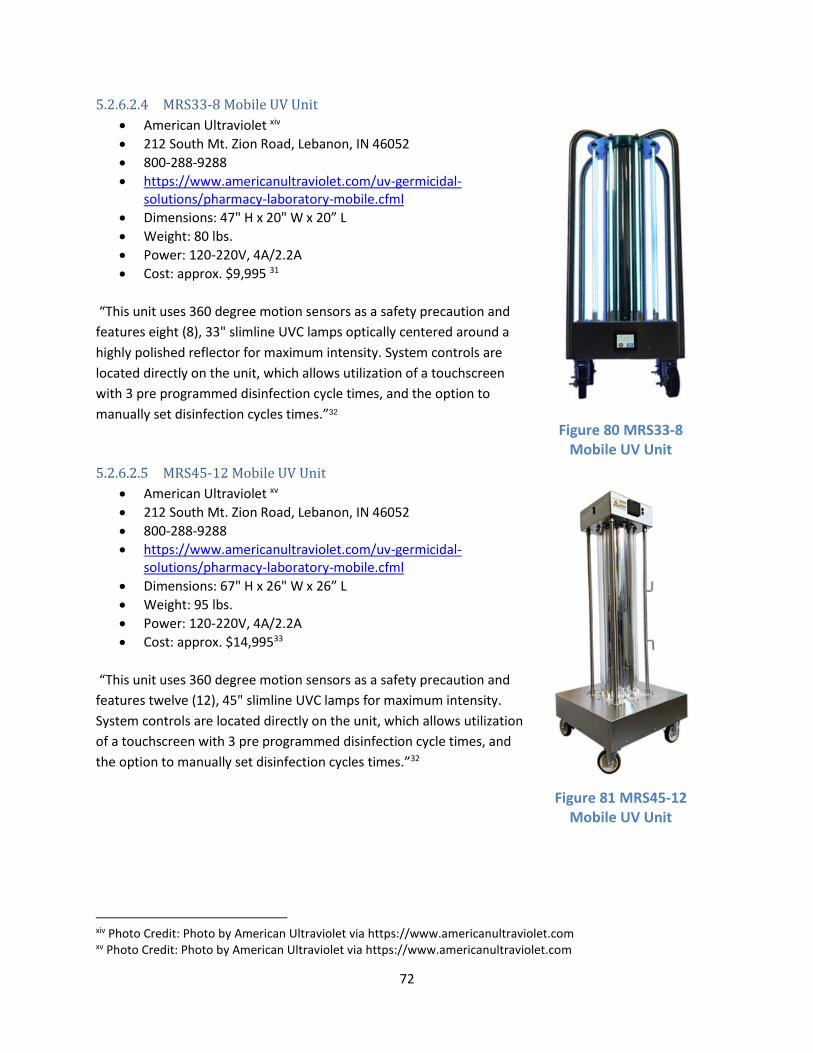
72
5.2.6.2.4 MRS33-8 Mobile UV Unit
• American Ultraviolet xiv
• 212 South Mt. Zion Road, Lebanon, IN 46052
• 800-288-9288
• https://www.americanultraviolet.com/uv-germicidal-solutions/pharmacy-laboratory-mobile.cfml
• Dimensions: 47" H x 20" W x 20” L
• Weight: 80 lbs.
• Power: 120-220V, 4A/2.2A
• Cost: approx. $9,995 31
“This unit uses 360 degree motion sensors as a safety precaution and
features eight (8), 33" slimline UVC lamps optically centered around a
highly polished reflector for maximum intensity. System controls are
located directly on the unit, which allows utilization of a touchscreen
with 3 pre programmed disinfection cycle times, and the option to
manually set disinfection cycles times.”32
5.2.6.2.5 MRS45-12 Mobile UV Unit
• American Ultraviolet xv
• 212 South Mt. Zion Road, Lebanon, IN 46052
• 800-288-9288
• https://www.americanultraviolet.com/uv-germicidal-solutions/pharmacy-laboratory-mobile.cfml
• Dimensions: 67" H x 26" W x 26” L
• Weight: 95 lbs.
• Power: 120-220V, 4A/2.2A
• Cost: approx. $14,99533
“This unit uses 360 degree motion sensors as a safety precaution and
features twelve (12), 45" slimline UVC lamps for maximum intensity.
System controls are located directly on the unit, which allows utilization
of a touchscreen with 3 pre programmed disinfection cycle times, and
the option to manually set disinfection cycles times.”32
xiv Photo Credit: Photo by American Ultraviolet via https://www.americanultraviolet.com xv Photo Credit: Photo by American Ultraviolet via https://www.americanultraviolet.com
Figure 80 MRS33-8 Mobile UV Unit
Figure 81 MRS45-12 Mobile UV Unit
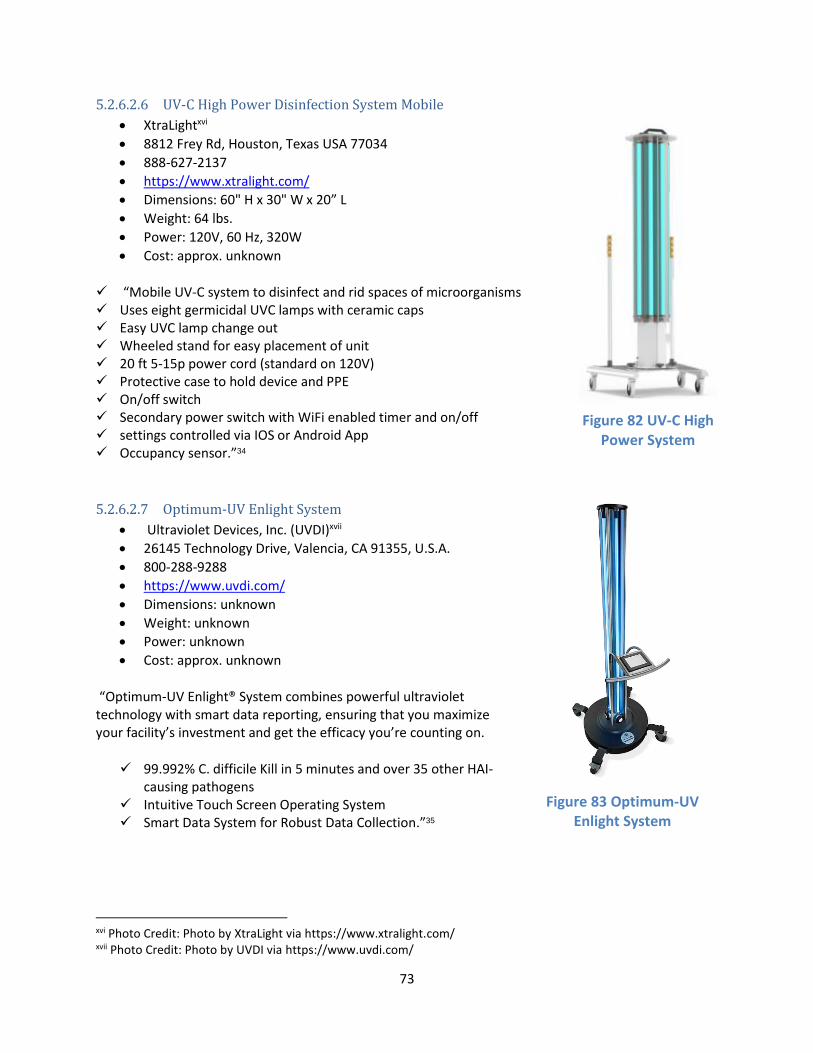
73
5.2.6.2.6 UV-C High Power Disinfection System Mobile
• XtraLightxvi
• 8812 Frey Rd, Houston, Texas USA 77034
• 888-627-2137
• https://www.xtralight.com/
• Dimensions: 60" H x 30" W x 20” L
• Weight: 64 lbs.
• Power: 120V, 60 Hz, 320W
• Cost: approx. unknown
✓ “Mobile UV-C system to disinfect and rid spaces of microorganisms ✓ Uses eight germicidal UVC lamps with ceramic caps ✓ Easy UVC lamp change out ✓ Wheeled stand for easy placement of unit ✓ 20 ft 5-15p power cord (standard on 120V) ✓ Protective case to hold device and PPE ✓ On/off switch ✓ Secondary power switch with WiFi enabled timer and on/off ✓ settings controlled via IOS or Android App ✓ Occupancy sensor.”34
5.2.6.2.7 Optimum-UV Enlight System
• Ultraviolet Devices, Inc. (UVDI)xvii
• 26145 Technology Drive, Valencia, CA 91355, U.S.A.
• 800-288-9288
• https://www.uvdi.com/
• Dimensions: unknown
• Weight: unknown
• Power: unknown
• Cost: approx. unknown
“Optimum-UV Enlight® System combines powerful ultraviolet technology with smart data reporting, ensuring that you maximize your facility’s investment and get the efficacy you’re counting on.
✓ 99.992% C. difficile Kill in 5 minutes and over 35 other HAI-causing pathogens
✓ Intuitive Touch Screen Operating System ✓ Smart Data System for Robust Data Collection.”35
xvi Photo Credit: Photo by XtraLight via https://www.xtralight.com/ xvii Photo Credit: Photo by UVDI via https://www.uvdi.com/
Figure 82 UV-C High Power System
Figure 83 Optimum-UV Enlight System
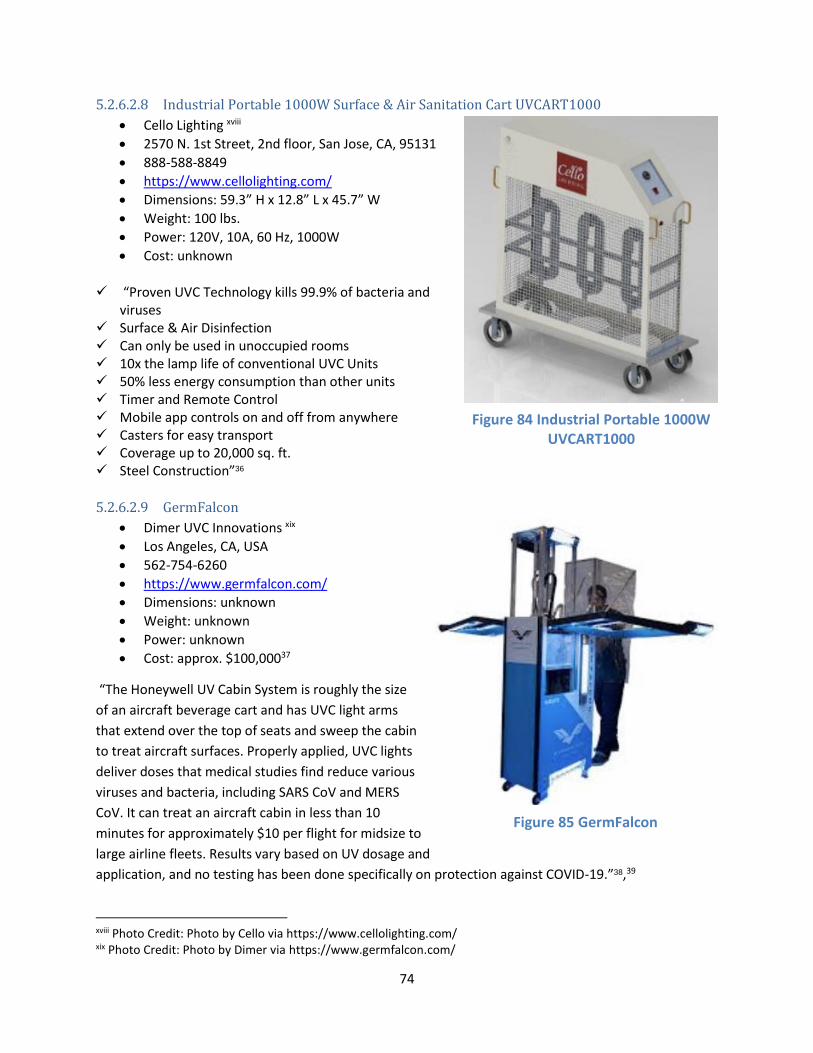
74
5.2.6.2.8 Industrial Portable 1000W Surface & Air Sanitation Cart UVCART1000
• Cello Lighting xviii
• 2570 N. 1st Street, 2nd floor, San Jose, CA, 95131
• 888-588-8849
• https://www.cellolighting.com/
• Dimensions: 59.3” H x 12.8” L x 45.7” W
• Weight: 100 lbs.
• Power: 120V, 10A, 60 Hz, 1000W
• Cost: unknown
✓ “Proven UVC Technology kills 99.9% of bacteria and viruses
✓ Surface & Air Disinfection ✓ Can only be used in unoccupied rooms ✓ 10x the lamp life of conventional UVC Units ✓ 50% less energy consumption than other units ✓ Timer and Remote Control ✓ Mobile app controls on and off from anywhere ✓ Casters for easy transport ✓ Coverage up to 20,000 sq. ft. ✓ Steel Construction”36
5.2.6.2.9 GermFalcon
• Dimer UVC Innovations xix
• Los Angeles, CA, USA
• 562-754-6260
• https://www.germfalcon.com/
• Dimensions: unknown
• Weight: unknown
• Power: unknown
• Cost: approx. $100,00037
“The Honeywell UV Cabin System is roughly the size
of an aircraft beverage cart and has UVC light arms
that extend over the top of seats and sweep the cabin
to treat aircraft surfaces. Properly applied, UVC lights
deliver doses that medical studies find reduce various
viruses and bacteria, including SARS CoV and MERS
CoV. It can treat an aircraft cabin in less than 10
minutes for approximately $10 per flight for midsize to
large airline fleets. Results vary based on UV dosage and
application, and no testing has been done specifically on protection against COVID-19.”38,39
xviii Photo Credit: Photo by Cello via https://www.cellolighting.com/ xix Photo Credit: Photo by Dimer via https://www.germfalcon.com/
Figure 84 Industrial Portable 1000W UVCART1000
Figure 85 GermFalcon
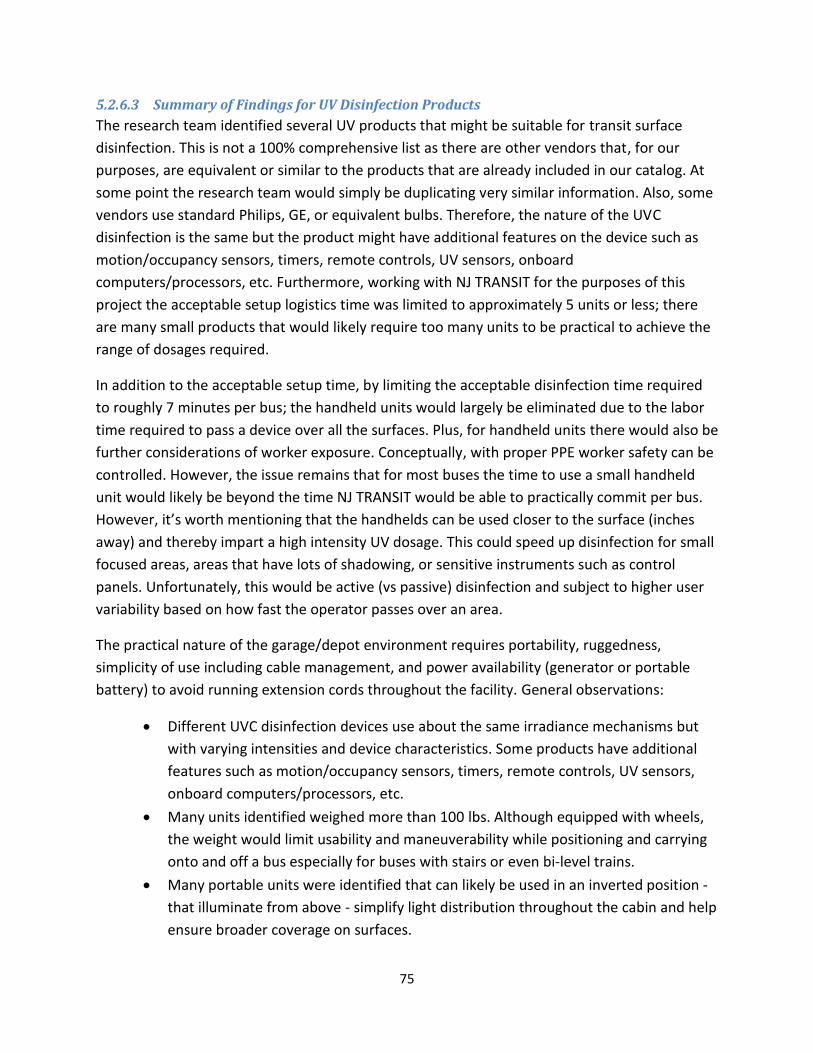
75
5.2.6.3 Summary of Findings for UV Disinfection Products
The research team identified several UV products that might be suitable for transit surface
disinfection. This is not a 100% comprehensive list as there are other vendors that, for our
purposes, are equivalent or similar to the products that are already included in our catalog. At
some point the research team would simply be duplicating very similar information. Also, some
vendors use standard Philips, GE, or equivalent bulbs. Therefore, the nature of the UVC
disinfection is the same but the product might have additional features on the device such as
motion/occupancy sensors, timers, remote controls, UV sensors, onboard
computers/processors, etc. Furthermore, working with NJ TRANSIT for the purposes of this
project the acceptable setup logistics time was limited to approximately 5 units or less; there
are many small products that would likely require too many units to be practical to achieve the
range of dosages required.
In addition to the acceptable setup time, by limiting the acceptable disinfection time required
to roughly 7 minutes per bus; the handheld units would largely be eliminated due to the labor
time required to pass a device over all the surfaces. Plus, for handheld units there would also be
further considerations of worker exposure. Conceptually, with proper PPE worker safety can be
controlled. However, the issue remains that for most buses the time to use a small handheld
unit would likely be beyond the time NJ TRANSIT would be able to practically commit per bus.
However, it’s worth mentioning that the handhelds can be used closer to the surface (inches
away) and thereby impart a high intensity UV dosage. This could speed up disinfection for small
focused areas, areas that have lots of shadowing, or sensitive instruments such as control
panels. Unfortunately, this would be active (vs passive) disinfection and subject to higher user
variability based on how fast the operator passes over an area.
The practical nature of the garage/depot environment requires portability, ruggedness,
simplicity of use including cable management, and power availability (generator or portable
battery) to avoid running extension cords throughout the facility. General observations:
• Different UVC disinfection devices use about the same irradiance mechanisms but
with varying intensities and device characteristics. Some products have additional
features such as motion/occupancy sensors, timers, remote controls, UV sensors,
onboard computers/processors, etc.
• Many units identified weighed more than 100 lbs. Although equipped with wheels,
the weight would limit usability and maneuverability while positioning and carrying
onto and off a bus especially for buses with stairs or even bi-level trains.
• Many portable units were identified that can likely be used in an inverted position -
that illuminate from above - simplify light distribution throughout the cabin and help
ensure broader coverage on surfaces.
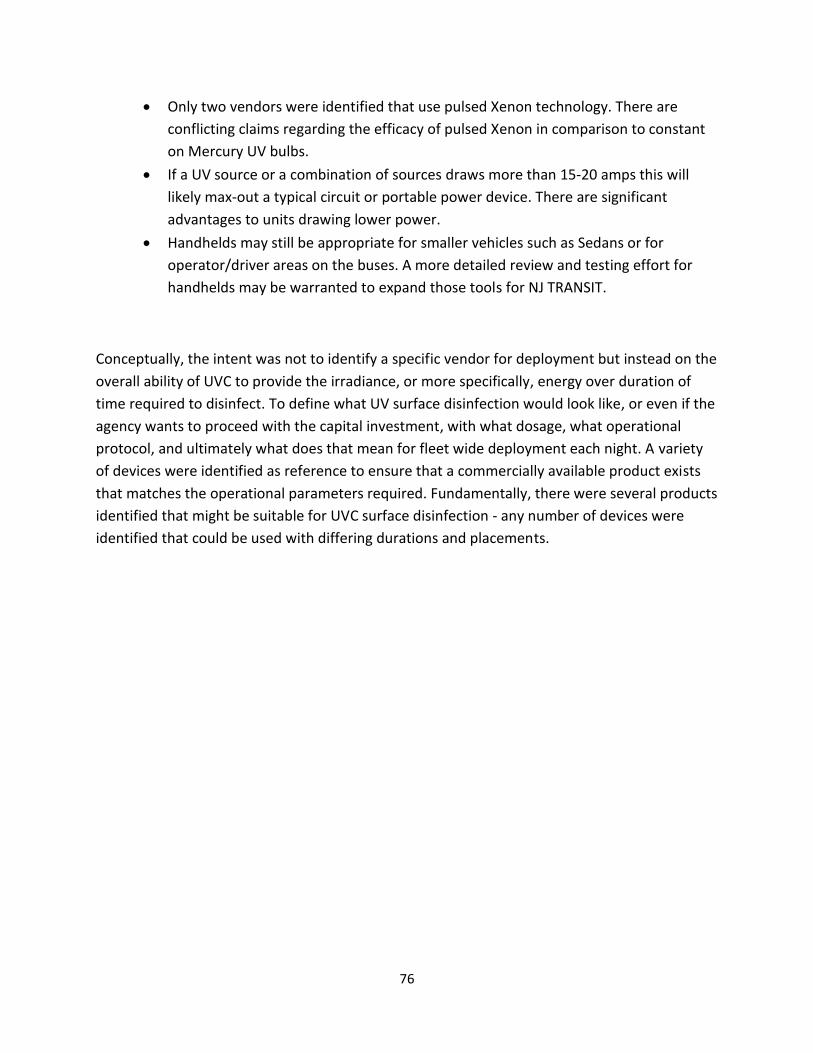
76
• Only two vendors were identified that use pulsed Xenon technology. There are
conflicting claims regarding the efficacy of pulsed Xenon in comparison to constant
on Mercury UV bulbs.
• If a UV source or a combination of sources draws more than 15-20 amps this will
likely max-out a typical circuit or portable power device. There are significant
advantages to units drawing lower power.
• Handhelds may still be appropriate for smaller vehicles such as Sedans or for
operator/driver areas on the buses. A more detailed review and testing effort for
handhelds may be warranted to expand those tools for NJ TRANSIT.
Conceptually, the intent was not to identify a specific vendor for deployment but instead on the
overall ability of UVC to provide the irradiance, or more specifically, energy over duration of
time required to disinfect. To define what UV surface disinfection would look like, or even if the
agency wants to proceed with the capital investment, with what dosage, what operational
protocol, and ultimately what does that mean for fleet wide deployment each night. A variety
of devices were identified as reference to ensure that a commercially available product exists
that matches the operational parameters required. Fundamentally, there were several products
identified that might be suitable for UVC surface disinfection - any number of devices were
identified that could be used with differing durations and placements.
77
5.2.7 Ultraviolet light long-term impacts (life span) on materials
A significant amount of literature exists regarding UV degradation of plastics. However, the
majority of past research focuses on wavelengths found in sunlight and not UVC. Over time, UV
will cause many plastics to chalk, become brittle, discolor, and crack as well as cause loss of
strength in fibers/fabrics. Common anecdotal comments regarding UV exposure imply a 10%
reduction in life. “If the plastic would normally last about ten years, and it's exposed to
germicidal UVC light the entire time, it would probably need to be replaced in 9 years.”40
Although widely stated, the research team was unable to identify any data or research to
support this claim. Although not quantified, several plastic suppliers and manufactures state
that UVC is more likely [than UVA and UVB] to affect plastics.41 Based on the higher energy of
UVC, it’s reasonable to expect it to breakdown the molecular bonds more than other
wavelengths.
The Business and Institutional Furniture Manufacturer’s Association (BIFMA) HCF 8.1 Health
Care Furniture Design – Guidelines for Cleanability identified 28.8-29.1 J/cm2 as an expected
cumulative UVC (254 nm) exposure at a weekly dosage for seven years.42,43 This dosage was
based on a hospital furniture’s useful life span requirement and a weekly dosage required to kill
certain bacteria - representing a furniture design target and not necessarily a damage
threshold. However, the 28.8 J/cm2 is widely used in standardized testing and therefore is a
common reference point.
Earlier in this report, the research team recommended a conservative but reasonable estimate
of 10.6 mJ/cm2 to achieve a 1-log (90% reduction) kill rate. However, due to uneven
distribution produced by only using three or four UVC sources, some surfaces were measured
to receive as much as 200uW/cm2. Using an assumed 7-minute duration, this would result in an
84 mJ/cm2 dosage. Although some areas of the bus will receive an excess UV dose; the extra
exposure is unavoidable unless more but lower powered UVC sources are used to more evenly
distribute the light.
[200uW/cm2 *60 seconds per minute * 7 minutes / 1000 uW per mW = 84 mJ/cm2]
Using the BIFMA 28.8 J/cm2 as a reference along with the 10.6mJ/cm2 to 84 mJ/cm2 of
expected real-world dosages - the BIFMA guidance would be exceeded in 2716 to 342
treatments respectively. This means that in as little as 1 to 7 years the BIFMA guidance would
be exceeded. In comparison to the BIFMA guidance in the healthcare setting, a seven-year life
means many plastics may have already reached the end of their useful life for other reasons.
However, this is not likely the case for a transit asset.
[28.8 J/cm2 / 10.6 mJ/cm2 * 1000 mJ/J = 2,716 treatments]
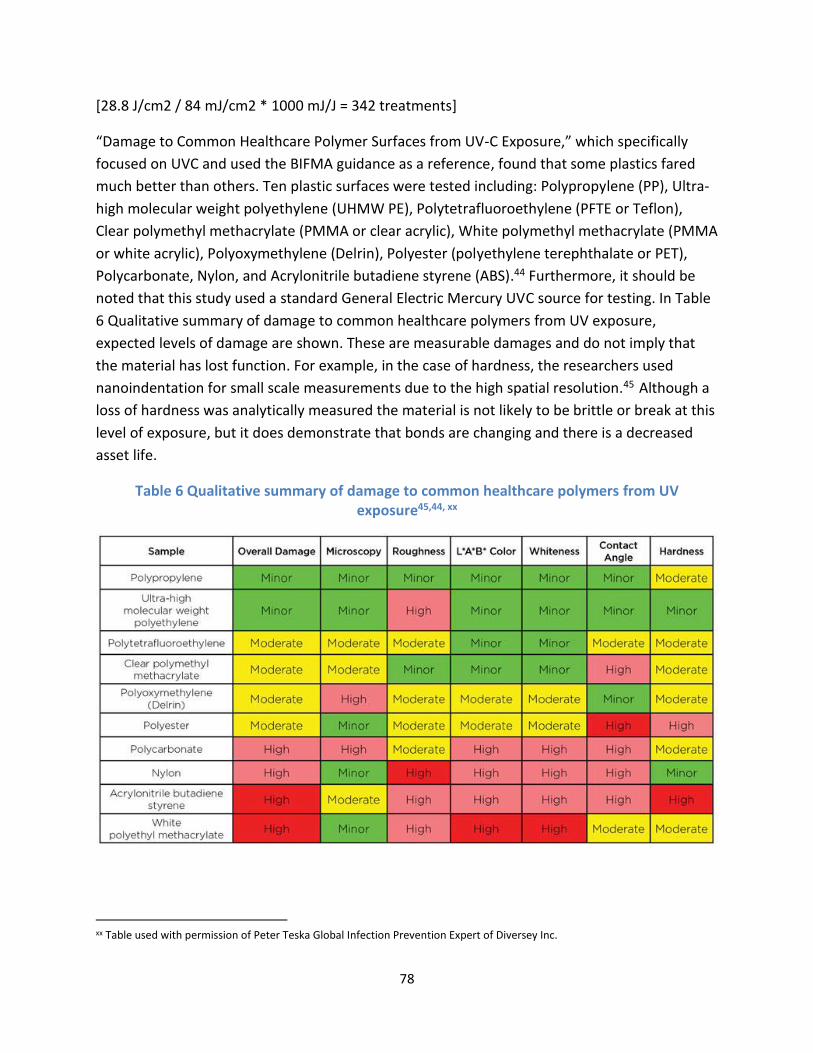
78
[28.8 J/cm2 / 84 mJ/cm2 * 1000 mJ/J = 342 treatments]
“Damage to Common Healthcare Polymer Surfaces from UV-C Exposure,” which specifically
focused on UVC and used the BIFMA guidance as a reference, found that some plastics fared
much better than others. Ten plastic surfaces were tested including: Polypropylene (PP), Ultra-
high molecular weight polyethylene (UHMW PE), Polytetrafluoroethylene (PFTE or Teflon),
Clear polymethyl methacrylate (PMMA or clear acrylic), White polymethyl methacrylate (PMMA
or white acrylic), Polyoxymethylene (Delrin), Polyester (polyethylene terephthalate or PET),
Polycarbonate, Nylon, and Acrylonitrile butadiene styrene (ABS).44 Furthermore, it should be
noted that this study used a standard General Electric Mercury UVC source for testing. In Table
6 Qualitative summary of damage to common healthcare polymers from UV exposure,
expected levels of damage are shown. These are measurable damages and do not imply that
the material has lost function. For example, in the case of hardness, the researchers used
nanoindentation for small scale measurements due to the high spatial resolution.45 Although a
loss of hardness was analytically measured the material is not likely to be brittle or break at this
level of exposure, but it does demonstrate that bonds are changing and there is a decreased
asset life.
Table 6 Qualitative summary of damage to common healthcare polymers from UV exposure45,44, xx
xx Table used with permission of Peter Teska Global Infection Prevention Expert of Diversey Inc.
79
The biggest expectation of damage is discoloration, typically a shift in color from white to
yellow. Darker colored plastics are less likely to be noticeable but there would still be a color
shift. The first damage will be discoloration followed by other changes such as becoming more
rigid, brittle, cracking, or chalking. The discoloration represents the first stage of micro-damage;
not functional damage which will occur in the future, well after the initial color change is
observed.
Another study demonstrated that all organic materials are degraded by UVC radiation of 254
nm. However, the “main effect of UVC exposure was crater formation/mass loss as opposed to
the cross-linking/bulk degradation reported for materials exposed to UVA and UVB. Since the
photodegradation was localized at the surface, the mass loss was minimal with the depth of the
created crater being measured in microns.”46 Furthermore, “solid materials performed better
than porous/fibrous materials due to the minimal surface penetration by the UVC radiation. Of
the materials tested, only aluminum foil and glass fibers were totally resistant to
photodegradation.”46 This study was conducted with respect to UVC impact on HVAC systems
including wiring and plastic drip pans. Therefore, based on the higher UVC intensity within the
HVAC environment, and the less durable materials such as thin wire coatings, the study implies
that it is highly likely that any damage will be minor and cosmetic.
Prior to becoming so damaged that it is brittle, plastic is more likely to experience several of the
micro-damages including an increased surface roughness. The roughness may increase the
cleaning difficulty and theoretically the effectiveness of disinfectants. “It is clear that at least for
some plastics, excessive exposure to UV-C energy is likely to cause unacceptable levels of
surface degradation that are visually impactful, and which may compromise the hygienic safety
and/or use of the surface, which may represent an increased risk to patient safety, although
this requires further study.”45
Therefore, it’s reasonable to expect that if UVC were to be applied daily that a majority of
plastics found within a bus, including panels, seats, plastic handgrips, and Polycarbonate
dividers, will have some level of damage (micro-damages) in as little as 1 years with the
majority of surfaces in 7 years. It would likely vary by not only the type of plastic but also grade
of material and additives during manufacturing – meaning that even different seat
manufacturers would have a different performance. As per Table 6 above, it should be noted
that ABS was identified as one of the worst performing plastics when exposed to UVC.
If UVC were to be applied daily, there would be some level of damage to the plastics. However,
without accelerated UVC testing the research team cannot predict the decrease in useful life of
the interior finishes. Based on a 7-minute daily dosage, an accelerated test could be conducted
where 2 weeks could represent 8 years or more of exposure. Such a test would likely yield little
80
more than visual observations or measurements that wouldn’t necessarily translate to a precise
functional life reduction or actionable item for NJ TRANSIT.
[14days * 24 hrs per day * 60 minutes per hour / 7 minutes per dose / 365 days per year = 7.89
years]
• The biggest expectation of damage is discoloration.
• Micro-damages may impact roughness which may increase the cleaning difficulty and
theoretically the effectiveness of disinfectants.
• The research team cannot predict a decrease in useful life of the interior finishes.
However, it is highly likely that any damage will be minor and cosmetic.
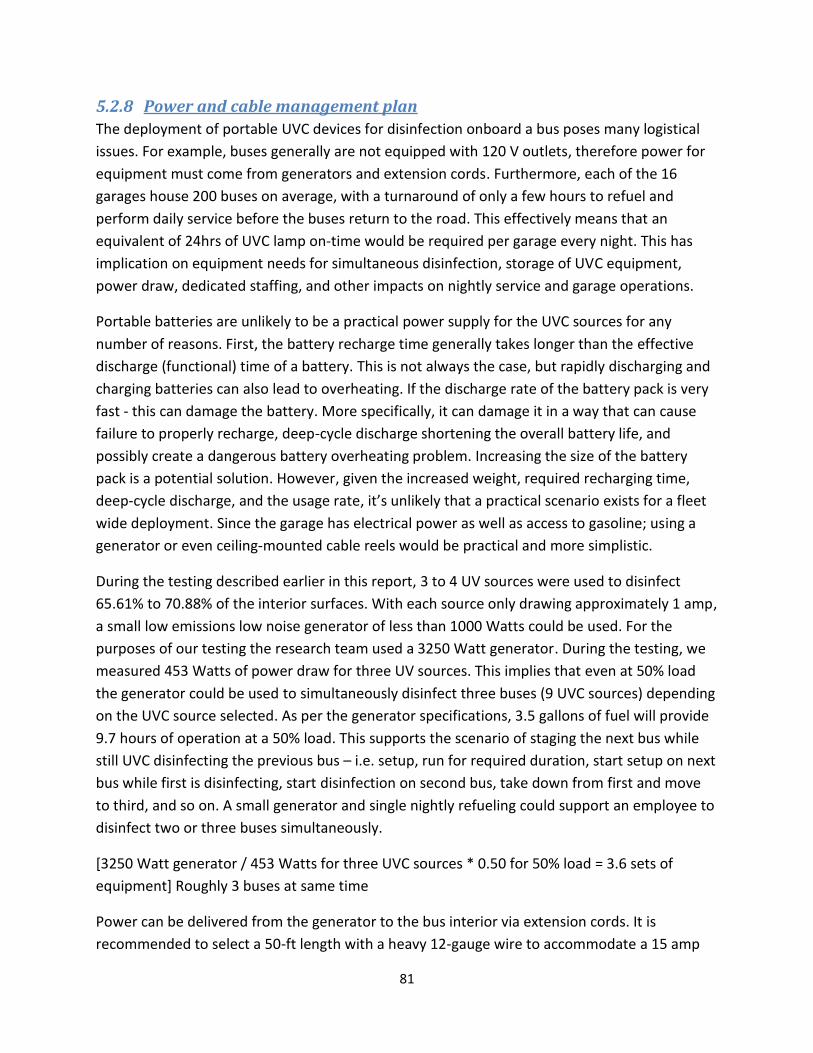
81
5.2.8 Power and cable management plan
The deployment of portable UVC devices for disinfection onboard a bus poses many logistical
issues. For example, buses generally are not equipped with 120 V outlets, therefore power for
equipment must come from generators and extension cords. Furthermore, each of the 16
garages house 200 buses on average, with a turnaround of only a few hours to refuel and
perform daily service before the buses return to the road. This effectively means that an
equivalent of 24hrs of UVC lamp on-time would be required per garage every night. This has
implication on equipment needs for simultaneous disinfection, storage of UVC equipment,
power draw, dedicated staffing, and other impacts on nightly service and garage operations.
Portable batteries are unlikely to be a practical power supply for the UVC sources for any
number of reasons. First, the battery recharge time generally takes longer than the effective
discharge (functional) time of a battery. This is not always the case, but rapidly discharging and
charging batteries can also lead to overheating. If the discharge rate of the battery pack is very
fast - this can damage the battery. More specifically, it can damage it in a way that can cause
failure to properly recharge, deep-cycle discharge shortening the overall battery life, and
possibly create a dangerous battery overheating problem. Increasing the size of the battery
pack is a potential solution. However, given the increased weight, required recharging time,
deep-cycle discharge, and the usage rate, it’s unlikely that a practical scenario exists for a fleet
wide deployment. Since the garage has electrical power as well as access to gasoline; using a
generator or even ceiling-mounted cable reels would be practical and more simplistic.
During the testing described earlier in this report, 3 to 4 UV sources were used to disinfect
65.61% to 70.88% of the interior surfaces. With each source only drawing approximately 1 amp,
a small low emissions low noise generator of less than 1000 Watts could be used. For the
purposes of our testing the research team used a 3250 Watt generator. During the testing, we
measured 453 Watts of power draw for three UV sources. This implies that even at 50% load
the generator could be used to simultaneously disinfect three buses (9 UVC sources) depending
on the UVC source selected. As per the generator specifications, 3.5 gallons of fuel will provide
9.7 hours of operation at a 50% load. This supports the scenario of staging the next bus while
still UVC disinfecting the previous bus – i.e. setup, run for required duration, start setup on next
bus while first is disinfecting, start disinfection on second bus, take down from first and move
to third, and so on. A small generator and single nightly refueling could support an employee to
disinfect two or three buses simultaneously.
[3250 Watt generator / 453 Watts for three UVC sources * 0.50 for 50% load = 3.6 sets of
equipment] Roughly 3 buses at same time
Power can be delivered from the generator to the bus interior via extension cords. It is
recommended to select a 50-ft length with a heavy 12-gauge wire to accommodate a 15 amp
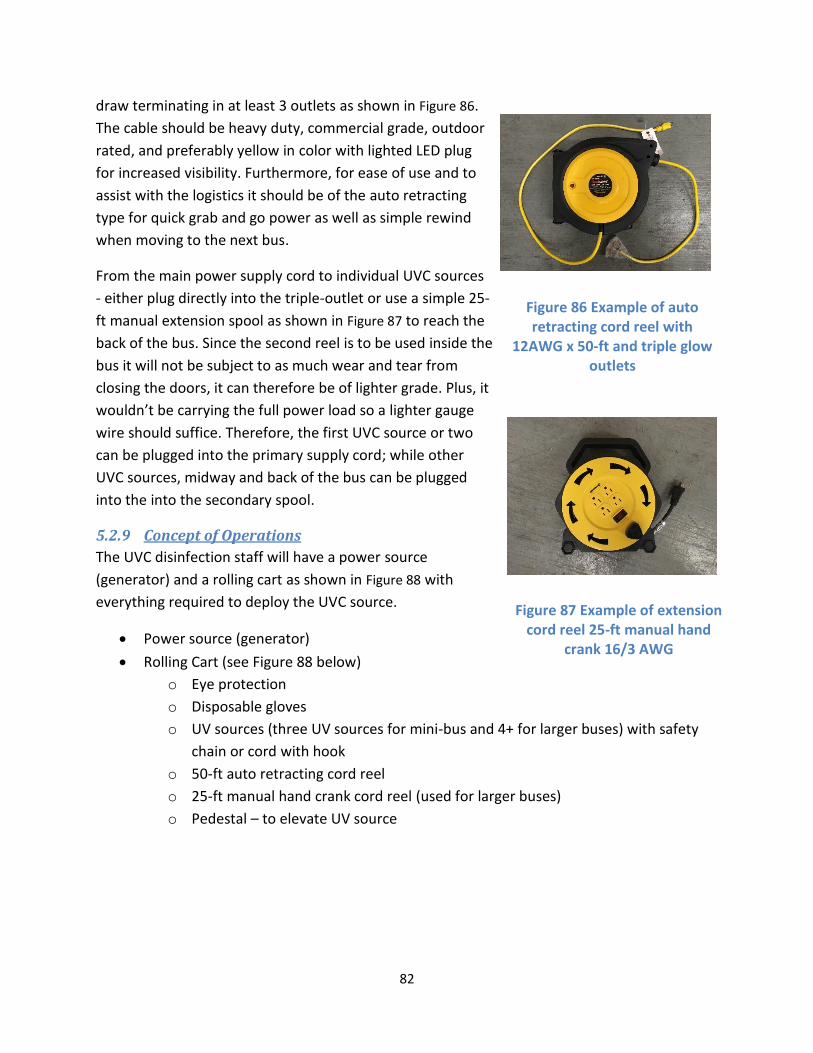
82
draw terminating in at least 3 outlets as shown in Figure 86.
The cable should be heavy duty, commercial grade, outdoor
rated, and preferably yellow in color with lighted LED plug
for increased visibility. Furthermore, for ease of use and to
assist with the logistics it should be of the auto retracting
type for quick grab and go power as well as simple rewind
when moving to the next bus.
From the main power supply cord to individual UVC sources
- either plug directly into the triple-outlet or use a simple 25-
ft manual extension spool as shown in Figure 87 to reach the
back of the bus. Since the second reel is to be used inside the
bus it will not be subject to as much wear and tear from
closing the doors, it can therefore be of lighter grade. Plus, it
wouldn’t be carrying the full power load so a lighter gauge
wire should suffice. Therefore, the first UVC source or two
can be plugged into the primary supply cord; while other
UVC sources, midway and back of the bus can be plugged
into the into the secondary spool.
5.2.9 Concept of Operations
The UVC disinfection staff will have a power source
(generator) and a rolling cart as shown in Figure 88 with
everything required to deploy the UVC source.
• Power source (generator)
• Rolling Cart (see Figure 88 below)
o Eye protection
o Disposable gloves
o UV sources (three UV sources for mini-bus and 4+ for larger buses) with safety
chain or cord with hook
o 50-ft auto retracting cord reel
o 25-ft manual hand crank cord reel (used for larger buses)
o Pedestal – to elevate UV source
Figure 86 Example of auto retracting cord reel with
12AWG x 50-ft and triple glow outlets
Figure 87 Example of extension cord reel 25-ft manual hand
crank 16/3 AWG
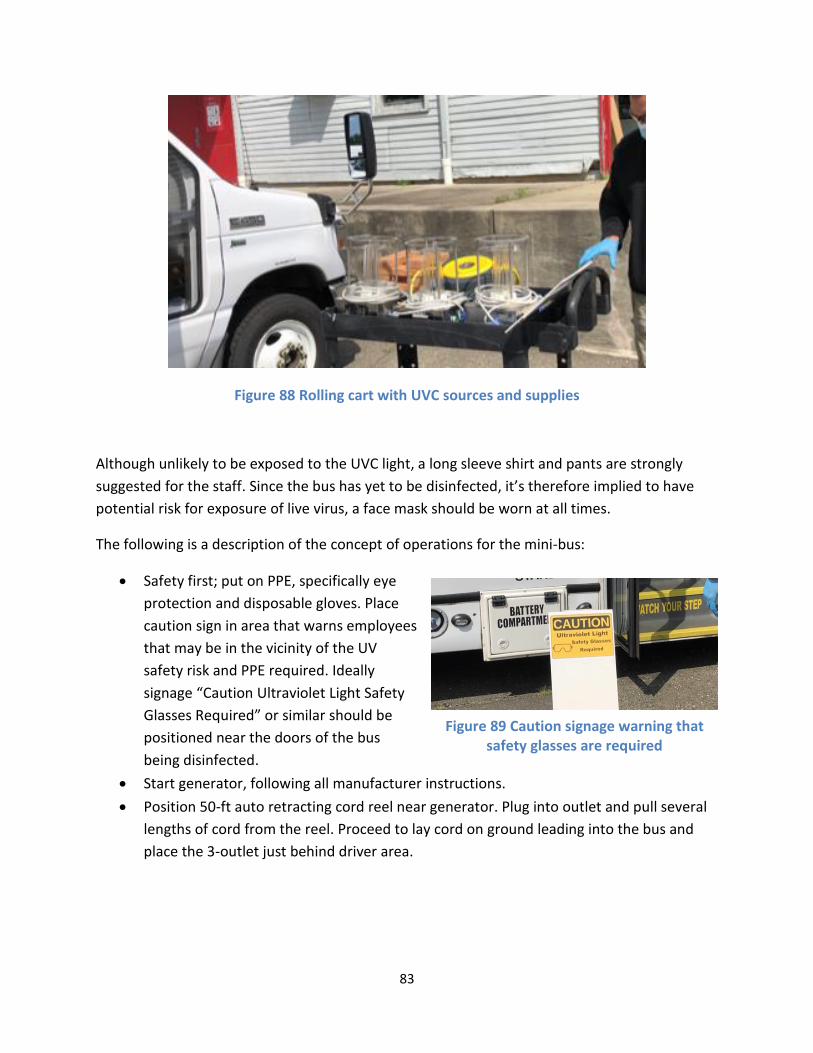
83
Figure 88 Rolling cart with UVC sources and supplies
Although unlikely to be exposed to the UVC light, a long sleeve shirt and pants are strongly
suggested for the staff. Since the bus has yet to be disinfected, it’s therefore implied to have
potential risk for exposure of live virus, a face mask should be worn at all times.
The following is a description of the concept of operations for the mini-bus:
• Safety first; put on PPE, specifically eye
protection and disposable gloves. Place
caution sign in area that warns employees
that may be in the vicinity of the UV
safety risk and PPE required. Ideally
signage “Caution Ultraviolet Light Safety
Glasses Required” or similar should be
positioned near the doors of the bus
being disinfected.
• Start generator, following all manufacturer instructions.
• Position 50-ft auto retracting cord reel near generator. Plug into outlet and pull several
lengths of cord from the reel. Proceed to lay cord on ground leading into the bus and
place the 3-outlet just behind driver area.
Figure 89 Caution signage warning that safety glasses are required
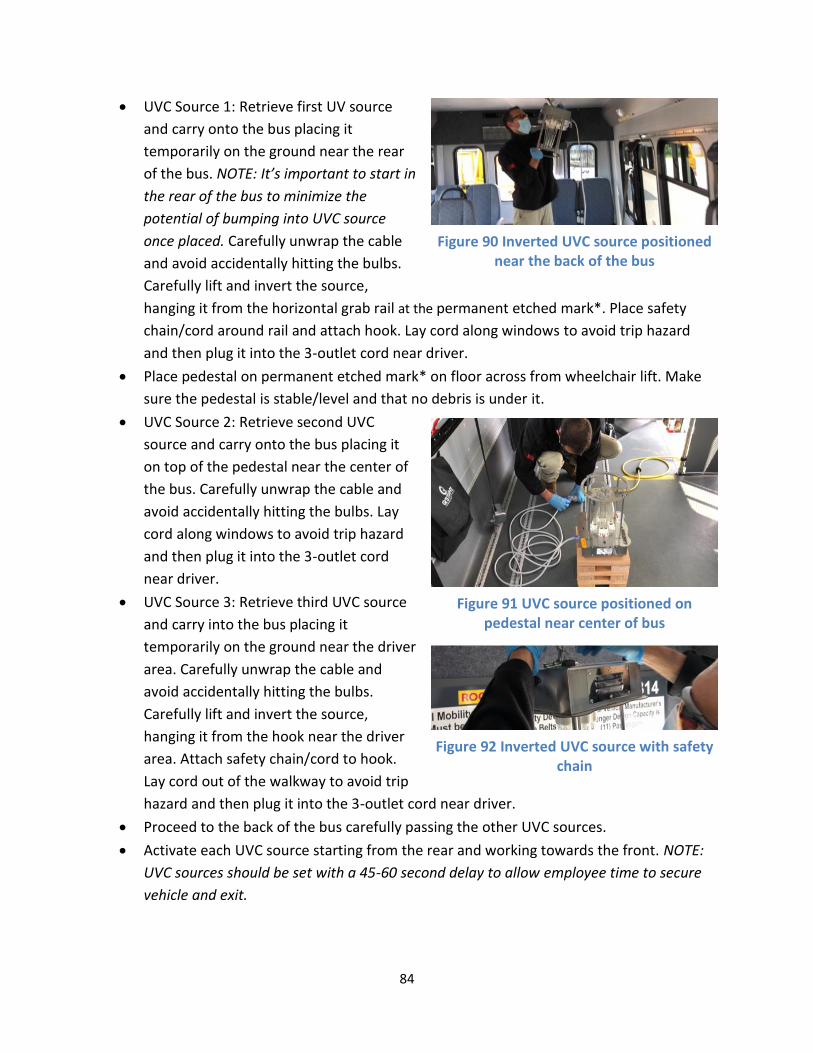
84
• UVC Source 1: Retrieve first UV source
and carry onto the bus placing it
temporarily on the ground near the rear
of the bus. NOTE: It’s important to start in
the rear of the bus to minimize the
potential of bumping into UVC source
once placed. Carefully unwrap the cable
and avoid accidentally hitting the bulbs.
Carefully lift and invert the source,
hanging it from the horizontal grab rail at the permanent etched mark*. Place safety
chain/cord around rail and attach hook. Lay cord along windows to avoid trip hazard
and then plug it into the 3-outlet cord near driver.
• Place pedestal on permanent etched mark* on floor across from wheelchair lift. Make
sure the pedestal is stable/level and that no debris is under it.
• UVC Source 2: Retrieve second UVC
source and carry onto the bus placing it
on top of the pedestal near the center of
the bus. Carefully unwrap the cable and
avoid accidentally hitting the bulbs. Lay
cord along windows to avoid trip hazard
and then plug it into the 3-outlet cord
near driver.
• UVC Source 3: Retrieve third UVC source
and carry into the bus placing it
temporarily on the ground near the driver
area. Carefully unwrap the cable and
avoid accidentally hitting the bulbs.
Carefully lift and invert the source,
hanging it from the hook near the driver
area. Attach safety chain/cord to hook.
Lay cord out of the walkway to avoid trip
hazard and then plug it into the 3-outlet cord near driver.
• Proceed to the back of the bus carefully passing the other UVC sources.
• Activate each UVC source starting from the rear and working towards the front. NOTE:
UVC sources should be set with a 45-60 second delay to allow employee time to secure
vehicle and exit.
Figure 90 Inverted UVC source positioned near the back of the bus
Figure 91 UVC source positioned on pedestal near center of bus
Figure 92 Inverted UVC source with safety chain
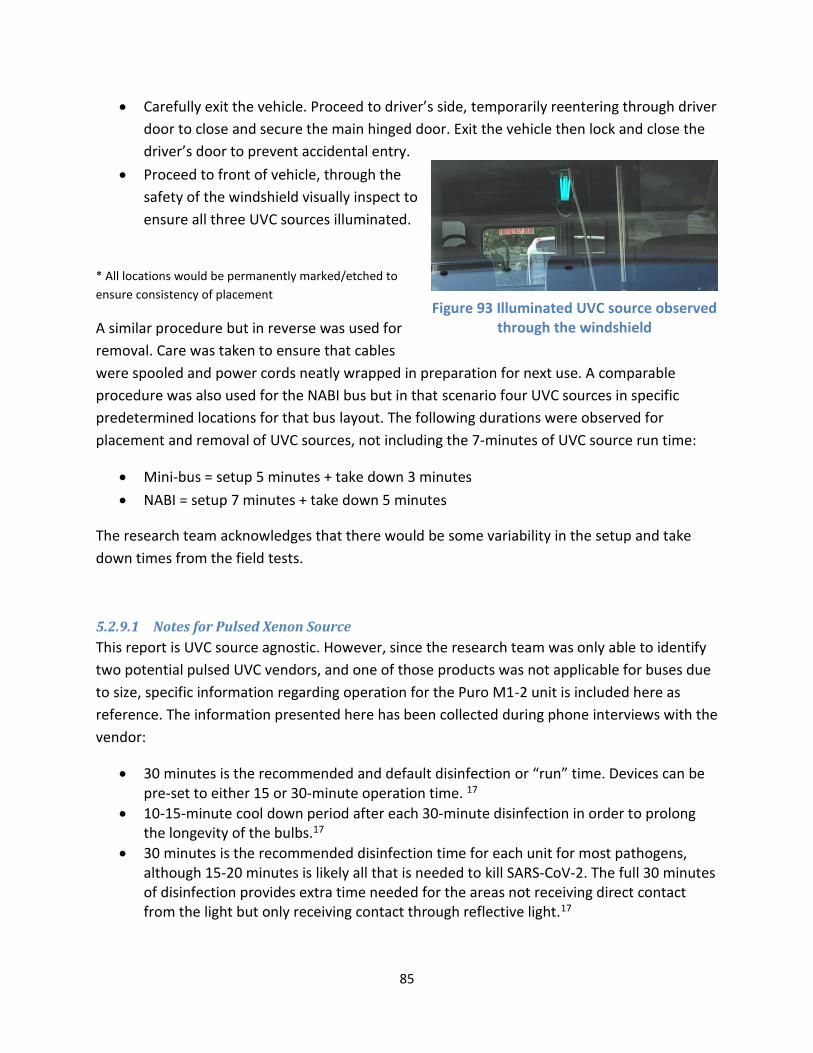
85
• Carefully exit the vehicle. Proceed to driver’s side, temporarily reentering through driver
door to close and secure the main hinged door. Exit the vehicle then lock and close the
driver’s door to prevent accidental entry.
• Proceed to front of vehicle, through the
safety of the windshield visually inspect to
ensure all three UVC sources illuminated.
* All locations would be permanently marked/etched to
ensure consistency of placement
A similar procedure but in reverse was used for
removal. Care was taken to ensure that cables
were spooled and power cords neatly wrapped in preparation for next use. A comparable
procedure was also used for the NABI bus but in that scenario four UVC sources in specific
predetermined locations for that bus layout. The following durations were observed for
placement and removal of UVC sources, not including the 7-minutes of UVC source run time:
• Mini-bus = setup 5 minutes + take down 3 minutes
• NABI = setup 7 minutes + take down 5 minutes
The research team acknowledges that there would be some variability in the setup and take
down times from the field tests.
5.2.9.1 Notes for Pulsed Xenon Source
This report is UVC source agnostic. However, since the research team was only able to identify
two potential pulsed UVC vendors, and one of those products was not applicable for buses due
to size, specific information regarding operation for the Puro M1-2 unit is included here as
reference. The information presented here has been collected during phone interviews with the
vendor:
• 30 minutes is the recommended and default disinfection or “run” time. Devices can be pre-set to either 15 or 30-minute operation time. 17
• 10-15-minute cool down period after each 30-minute disinfection in order to prolong the longevity of the bulbs.17
• 30 minutes is the recommended disinfection time for each unit for most pathogens, although 15-20 minutes is likely all that is needed to kill SARS-CoV-2. The full 30 minutes of disinfection provides extra time needed for the areas not receiving direct contact from the light but only receiving contact through reflective light.17
Figure 93 Illuminated UVC source observed through the windshield
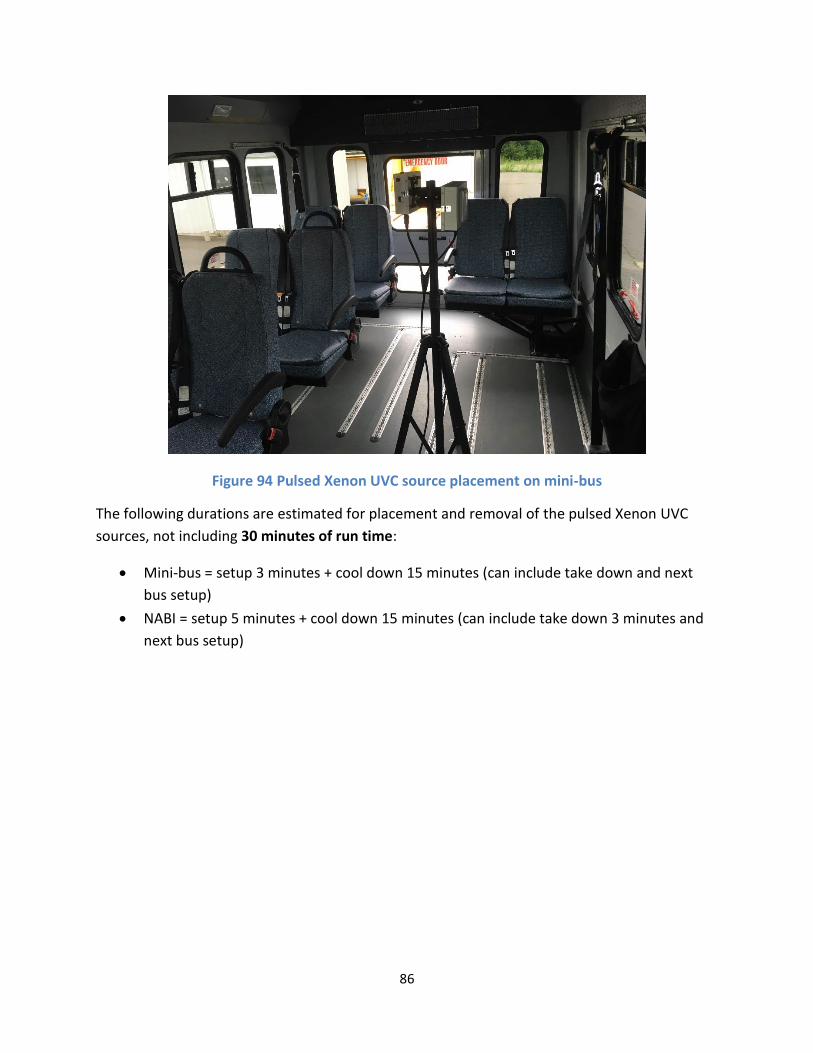
86
Figure 94 Pulsed Xenon UVC source placement on mini-bus
The following durations are estimated for placement and removal of the pulsed Xenon UVC
sources, not including 30 minutes of run time:
• Mini-bus = setup 3 minutes + cool down 15 minutes (can include take down and next
bus setup)
• NABI = setup 5 minutes + cool down 15 minutes (can include take down 3 minutes and
next bus setup)
87
5.2.10 Fleet Wide Deployment Cost Comparison
5.2.10.1 Spray and air-dry chemical disinfection
The concentrated disinfectant costs about $9.65 per gallon (possibly will be more expensive in
the future with pandemic demand). Manufacturer instructions generally recommend 2 oz per
gallon of water; “for use as a one-step, general, hospital disinfectant, fungicide, virucide,
cleaner: Pre-clean heavily soiled areas. Apply use solution of 2 oz of this product per gal. of
water.”47 Knowing that it takes approximately 50 oz of diluted solution to disinfect a bus (i.e.
about 1/3 of a gallon) – the disinfectant cost would be $0.06 per bus.
[$9.65 per gallon / 128 oz per gallon * 2 oz concentrate yields a gallon of solution / 128 oz per
gallon * 50 oz used per bus = $0.06 per bus]
Assuming the cost of disinfectant, hand sprayers, supplies, etc. to be comparable to similar
consumable items from the UVC disinfection scenario, the labor + UVC equipment would
become the main factors.
NJ TRANSIT estimates that it takes a single employee approximately 2 minutes for a mini-bus
and 3 minutes per 40-ft bus to disinfect via the spray chemical disinfectant application. Using 5
minutes as a more conservative estimate indicates that each disinfection employee would be
able to disinfect twelve 40-ft buses per hour.
[60 minutes per hr / 5 minutes per bus = 12 buses per hour]
For the purposes of this analysis the rate for full sized buses was used throughout for all
scenarios. There will be some error as the mini-buses are quicker to disinfect, but the
articulated-buses will take longer to disinfect. This applies the error uniformly as to cause
minimal impact to the overall comparison.
Validation of estimates; one of the NJ TRANSIT garages currently contracts COVID disinfection
efforts which provides a precise estimate of the time required. It has been found that “with 3
staff, sometimes 4 employees, they average 164 to 174 buses a night between 8pm to 1pm”48
Therefore the range would be between 8.2 and 11.6 buses per hour. On average this is
approximately 10 buses per hour, which is slightly less than the previous estimate. Therefore,
for analysis purposes the 10-buses per hour average rate was used to make the analysis more
accurate.
Worst case [164 buses / 4 employees / 5 hours = 8.2 buses per hour]
Best case [174 buses / 3 employees / 5 hours = 11.6 buses per hour]
Average [ (8.2 + 11.6 buses per hour) /2 = 9.9 buses per hour] roughly 10 buses per hour
88
Using the same 7-hr shift (approximate effective time for 8-hr shift less lunch and breaks)
requirement as the UVC scenario - to disinfect all the 40-ft buses in a 200-bus garage in a 7-
hour shift, would require 2.1 fulltime equivalent staff dedicated to disinfection.
[200 buses per garage / 10 buses per hour / 7-hr shift per staff = 2.86 staff] NOTE factor of
safety assume 3 FTE
This estimate is probably deemed accurate as it is close to real-world observations from the
garages with the extra COVID disinfection effort. Thus, for all 16 garages this would be
approximately 48 dedicated disinfection staff. The three staff per garage estimate was
confirmed with NJ TRANSIT as an accurate assessment of the increased labor requirement since
COVID-19 began.
[3 staff per garage * 16 garages = 48 total staff]
• 48 dedicated disinfection staff
• disinfectant cost $0.06 per bus
• hand sprayers, PPE supplies, and other consumables assumed to be roughly comparable
to similar items from other scenarios
5.2.10.2 Mercury UVC Disinfection
Each disinfection employee would likely be able to disinfect buses by staggering setup,
disinfection, and take down for a maximum rate of approximately five 40-ft buses per hour or
seven mini-buses per hour. The rate that buses can be treated would be roughly the same
regardless of size because the UVC disinfection time relationship depends on the number of
UVC sources deployed based on size.
[7 minutes setup + 7 minutes disinfection + 5 minutes removal = 19 minutes per bus] [60
minutes per hour / 19 minutes per bus *2 staggered staging -1 incomplete bus = 5 full sized
buses per hour]
[5 minutes setup + 7 minutes disinfection + 3 minutes removal = 15 minutes per bus] [60
minutes per hour / 15 minutes per bus *2 staggered staging -1 incomplete bus = 7 mini-buses
per hour]
As previously stated, for the purposes of the analysis the rate for full sized buses was used
throughout for all scenarios. There will be some error as the mini-buses are quicker but the
articulated buses will take longer to setup. This applies the error uniformly as to cause minimal
impact to the overall comparison.
89
During field testing, the power draw for three UVC sources was measured at 453 Watts of
power. Using the building’s outlets as the source of power at an approximate cost of $0.19/kW-
hr would results in a cost of $0.01 per bus.
[453 Watts * 7 minutes / 60 minutes per hour / 1000 W per kW * $0.19 per kW-hr = $0.01 cost
of electricity per bus]
Alternatively, gas to run the generator for UVC disinfection would be nominal. Assuming three
buses simultaneously disinfected with gas costing approximately $2/gallon and the generator
running constantly during setup, disinfection, and removal for about 20 minutes per bus; at the
consumption rate for 50% load stated above results in approximately $0.14 per bus.
[3250 Watt generator at 50% load = 1625 Watts < 453 Watts * 3 simultaneous buses = 1359
Watts] [3.5 gallons of fuel will provide 9.7 hours of operation at a 50% load] [3.5 gallons / 9.7
hours *$2 per gallon / 5 buses per hour = $0.14 per bus]
Furthermore, to disinfect all the 40-ft buses in a 200-bus garage in a 7-hr shift (approximate
effective time for 8-hr shift less lunch and breaks) would require 6 fulltime equivalent staff
dedicated to disinfection.
[200 bus garage / 5 buses per hour / 7-hr shift = 5.71 FTE] NOTE factor of safety assume 6 FTE
This estimate is probably low as it doesn’t account for downtime and requires staff to be 100%
productive for the entire shift. Ultimately it might be closer to six personnel. For all 16 garages
this would be approximately 96 dedicated disinfection staff.
[16 garages * 6 FTE = 96 staff]
From an equipment perspective, to stagger disinfection it would require eight UVC sources to
equip each of the six-staff identified, which results in 48 UVC sources per garage.
[8 UV sources * 6 staff = 48 UVC sources]
This automatically provides some equipment redundancy because some buses only require
three sources. Furthermore, for all 16 garages this would be approximately 768 UVC sources.
[16 garages * 48 UVC sources = 768 sources]
From the catalog of UVC products there are any number of UVC units in the $2250 to $6550
range that might be appropriate. Using $4,400 as an estimate the expected capital expenditure
before considering carts, generators, and extension cords would be roughly $3.4M in UVC
sources.
90
[768 UVC sources * $4,400 = $3,379,000]
• 96 dedicated disinfection staff
• 768 UVC sources at an estimated at $3.4M
• Cost of generator fuel or electricity less than $0.14 per bus
• Support items including carts, generators, extension cords, bulb replacement (less than
$70 each), and other expenses were not included at this time
• PPE supplies and other consumables assumed to be roughly comparable to similar items
from other scenarios
5.2.10.3 Pulsed Xenon UVC Disinfection
For pulsed Xenon UVC sources, it was estimated that for a full-size bus using three UVC sources
that the operational protocol would require 5 minutes setup + 30 minutes disinfection + 15
minutes cool down (which can also serve as 3 minute removal as well as the 5 minute setup
time for the next bus). The research team reviewed the timing to develop a process that
minimizes labor while maximizing one-time capital equipment costs. The research team
acknowledges that this may not be the optimum cost-benefit scenario, but it minimizes labor
with the assumption that capital is recouped over several years. See Figure 95 for a Gantt Chart
representing a potential worker schedule for the pulsed sources. After thoroughly reviewing
the timing, the research team estimates that over a 7-hr shift a single employee can stage and
disinfect 42 buses (averaging six buses per hour) by rotating 21 pulsed UVC sources.
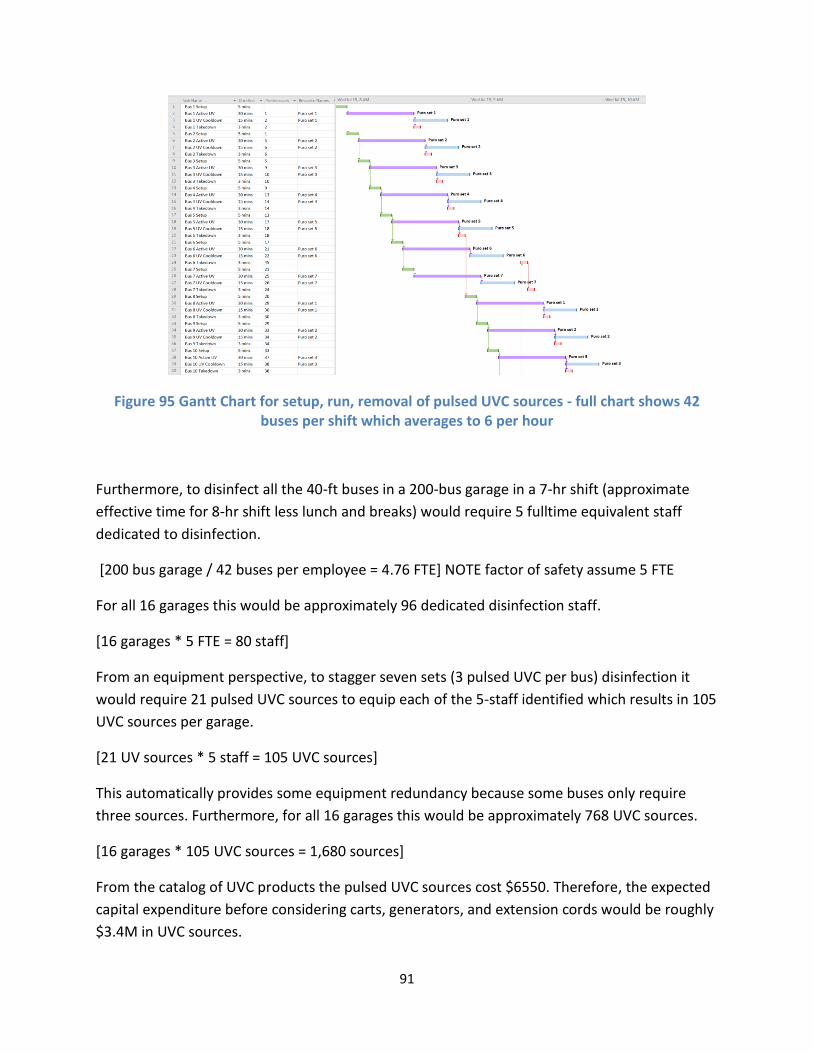
91
Figure 95 Gantt Chart for setup, run, removal of pulsed UVC sources - full chart shows 42 buses per shift which averages to 6 per hour
Furthermore, to disinfect all the 40-ft buses in a 200-bus garage in a 7-hr shift (approximate
effective time for 8-hr shift less lunch and breaks) would require 5 fulltime equivalent staff
dedicated to disinfection.
[200 bus garage / 42 buses per employee = 4.76 FTE] NOTE factor of safety assume 5 FTE
For all 16 garages this would be approximately 96 dedicated disinfection staff.
[16 garages * 5 FTE = 80 staff]
From an equipment perspective, to stagger seven sets (3 pulsed UVC per bus) disinfection it
would require 21 pulsed UVC sources to equip each of the 5-staff identified which results in 105
UVC sources per garage.
[21 UV sources * 5 staff = 105 UVC sources]
This automatically provides some equipment redundancy because some buses only require
three sources. Furthermore, for all 16 garages this would be approximately 768 UVC sources.
[16 garages * 105 UVC sources = 1,680 sources]
From the catalog of UVC products the pulsed UVC sources cost $6550. Therefore, the expected
capital expenditure before considering carts, generators, and extension cords would be roughly
$3.4M in UVC sources.
92
[1,680 UVC sources * $6,550 = $11,004,000]
• 80 dedicated disinfection staff
• 1,680 UVC sources at an estimated at $11M
• PPE supplies and other consumables assumed to be roughly comparable to similar items
from other scenarios
5.2.10.4 Cost Comparison Discussion
In comparison to spray and air-dry disinfection cost analysis – there would be a substantial
increase in staffing and capital expenditure required for UVC deployment; a detailed analysis
including support items such as carts, generators, extension cords, bulb replacement (less than
$70 each), and other expenses was not performed. Although valuable for budget planning, it’s
clear that from a macro perspective the overall cost for UVC disinfection would be substantially
more than chemical disinfection.
• 48 dedicated staff for chemical disinfection versus 96 and 80 dedicated staff for Mercury
and pulsed Xenon UVC respectively
• Equipment cost for UVC far exceeds hand or backpack sprayers
• PPE supplies and other consumables assumed to be roughly comparable to similar items
from other scenarios
The research team acknowledges that there would be some variability in the setup and take
down times from the field tests. However, this same variability would exist with the chemical
disinfectant application too.
Furthermore, testing and analysis was performed using a bus configuration with a fairly open
floor plan. It can reasonably be assumed that the overall effectiveness of UVC disinfection for a
coach bus would be somewhat less effective. Furthermore, since the labor + equipment of UVC
for surface disinfectant exceeded the labor time for the chemical disinfectant for an open
floorplan, it is also reasonable to expect the labor + equipment to be equal to if not great for a
coach bus. As the bus configuration is more complex the UVC disinfection becomes even less
practical.
Efficacy being assumed to be roughly equivalent - the research team only envisions one
circumstance where the UVC labor component would be roughly equal to chemical application
for fleet wide deployment:
• If the chemical application method was substantially different such as spray and wipe as
opposed to spray and air-dry. As per the manufacturer instruction “wipe dry with a
93
clean cloth or allow to air dry.”47 The spray and wipe method would substantially
increase the labor time by as much as double. The spray and air-dry method is
compliant with the manufacturer instruction but NJ TRANSIT may consider that during a
weekly spray and wipe cleaning to perform a more thorough cleaning and to remove
any build-up.
Efficacy being assumed to be roughly equivalent - the research team only envisions one
circumstance where the UVC labor component would be less than chemical application for fleet
wide deployment:
• If the bus were to have permanently mounted UVC disinfection installed. This is
probably not practical as a retrofit. At this time, the research team was unable to
identify any permanent retrofit efforts for UVC surface disinfection by other agencies or
companies. However, built in permanently mounted UVC is something that could be
considered as a future requirement for the next generations of buses. In that scenario,
more lights can be built-in and evenly distribute irradiance throughout the cabin and
even cover more shadowed areas. The source may very well be small UVC LEDs
throughout the bus shell, ceiling, and floor area. The increased capital expense may
even be recouped by labor savings.
5.2.10.5 Bulb life cycle cost
If NJ TRANSIT were to adopt a portable UVC disinfection device there would be a number of life
cycle costs such as electricity, repair, full unit replacement, and bulb replacement, as well as
additional peripherals including but not limited to extension cords, carts, storage racks, and
possibly generators. Also, since the bulbs don’t have a protective lens it may be necessary to
clean the bulbs to remove dust that accumulates over years of use and storage in a garage
environment.
After the initial purchase, the most substantial life cycle cost beyond device replacement would
be bulb replacement. As per Phillips website, a typical UVC Mercury bulb has a 9000 hour useful
operational life.49 However, each UVC device may have different sized bulbs or may require 3,
4 or even 8 bulbs – therefore the lifecycle cost is also highly variable and dependent of the final
device selected. The previously documented efforts of this research project were largely based
on small portable UVC source characteristics independent of a specific vendor. However, using
a representative device to provide an estimate life based on four TUV PL-L 35W bulbs can be
calculated, which will be consistent with the previously referenced UVC source quantities.
Based on the operational profile discussed earlier, a 9,000-hour bulb life should last for six
years of use.
94
[5 buses per hour * 7 hour shift * 7 minutes per bus = 245 minutes on-time per night]
[9,000 hours * 60 minutes per hour / 245 minutes on-time per night / 365 days per year = 6
years between each bulb replacement]
Replacement bulbs are estimated at approximately $70 per bulb but can likely be found for less
from other third-party suppliers or via bulk purchasing. However, using $70 per bulb, the total
cost to replace all of the bulbs within the estimated 768 devices (four bulbs per device) is
approximately $215k every six years.
[768 UVC sources * 4 bulbs per unit * $70 per bulb = $215, 040 every six years]
• Approximately $215k will be required every six years to replace all Mercury bulbs at 9,000 hours useful life per bulb
95
5.3 HVAC and Disinfection of Air
The previous sections of this report addressed portable UVC sources for surface disinfection.
This section of the report addresses air treatment and disinfection techniques. Air treatment is
an important aspect of a broader strategy to manage exposure to COVID-19 and minimize risks
for employees and passengers while the vehicles are in-service.
Recent briefings by the World Health Organization (WHO) suggests that COVID-19 is primarily
transmitted through respiratory droplets, but also suggests that aerosolization is another
possible mode of transmission.50 These respiratory droplets can be expelled when a person
coughs, sneezes, talks or sings.51 Particles in the range of >5-10 μm diameter are considered
respiratory droplets, while particles <5μm in diameter are considered aerosols.52 The WHO has
also suggested that airborne transmission of the virus may also be possible within indoor
crowded spaces citing examples such as choir practice, inside restaurants, or attending a fitness
class.50 There have documented cases of COVID-19 transmission reported in enclosed spaces
such as restaurants, nightclubs, and work. Droplet transmission within these environments is
certainly a concern. WHO also mentions that aerosol transmission of the virus cannot be ruled
out in these crowded inadequately ventilated spaces where infected persons may spend long
periods of time with others.53
While there have only been limited cases specifically attributed to transit bus ridership, it may
be inferred that having people in close proximity in an enclosed place such as a bus may put
them at increased risk for airborne transmission of the virus. Certain countermeasures can be
taken by transit agencies that may decrease risk of spreading the virus on vehicles. WHO has
stated that more studies are urgently needed to investigate the significance of instances of
potential airborne transmission happening outside of health care settings.50 Furthermore, bus
drivers could potentially be at greater risk than a transit passenger simply due to them being in
an enclosed space longer. The Centers of Disease Control and Prevention (CDC) primarily
endorses the use of cloth face coverings to help slow the spread of COVID-19,54 they have also
prepared a list of preventative measures specific to bus transit operators that can reduce their
risk of infection.55 This include the following items that are specific to exposure via reparatory
or aerosol transmission:
• “Limit close contact with others by maintaining a distance of at least 6 feet, when possible.
• Consider asking bus passengers to enter and exit the bus through rear entry doors.
• Request passengers avoid standing or sitting within 6 feet of the bus driver.”55
While all of the above precautions will likely reduce the chance of infection, other more
proactive measures can be implemented on buses to passively treat the air. The research team
96
has identified the following broad categories of air treatment/disinfection practices and
technologies that may reduce exposure risk related to COVID-19:
• Increase fresh air and ventilation
• Upgrade HVAC air filters
• Installation of HVAC in-duct systems: o UV disinfection systems o Ion generator systems o Photocatalytic oxidizer systems
However, each of the aforementioned practices and technologies have their own advantages
and disadvantages. The use of in-duct systems requires balancing numerous factors including:
air flow velocity impacting disinfection contact time or even worsening the spread of virus,
airflow restrictions impacting HVAC performance and equipment damage, release of
disinfection agents at concentrations too low to be effective, and introduction of agents into
breathing areas at a concentration too high to be deemed safe. With over 3,700 vehicles in NJ
TRANSIT’s fleet, the deployment of any new technology must be carefully weighed to ensure it
safely achieves the desired results.
5.3.1 Fresh Air Exchanges and Power Vents/Hatches
There has been some discussion in the literature about shutting off HVAC systems. For example,
one media outlet indicated that “During the epidemic period, it is not recommended to use air
conditioning for vehicles. It is recommended to open windows for ventilation or use skylight
exhaust fans to achieve the effect of rapid air exchange in the compartment.”56 Other articles
referenced a Chinese restaurant where the spread of the virus was reportedly linked to the air-
conditioning system, suggesting that such systems should be disabled.
The research team did indeed find reputable sources (CDC) advising against recirculation mode
- but could not identify any research to support turning HVAC systems off.
For example, in May 2020 in response to the Chinese restaurant incident, Carrier released a
white paper clearly stating that proper air management is essential and that the HVAC system
should be used to introduce fresh air and provide filtration.57 However, the paper also
cautioned “that the increase of the ventilation rate may cause an increase of load, and the
HVAC unit, if not properly sized, may not be able to provide sufficient cooling capacity.”57
CDC guidance would also appear to support the idea of using the air conditioning on non-
recirculation mode58 to try to introduce as much fresh air as possible. CDC guidance for
buildings is more comprehensive indicating to increase levels of outdoor air to increase the
overall potential COVID-19 dilution,59 thereby decreasing the potential risk of exposure. CDC
also cites and recommends the American Society of Heating, Refrigerating, and Air-Conditioning
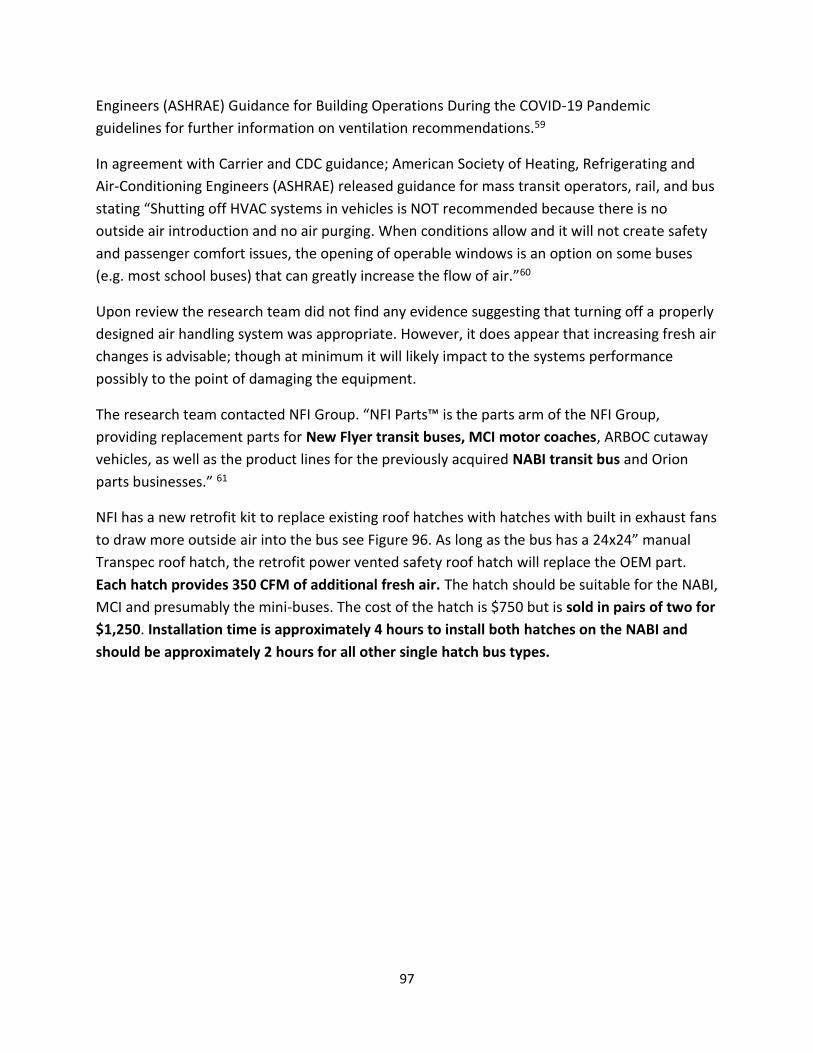
97
Engineers (ASHRAE) Guidance for Building Operations During the COVID-19 Pandemic
guidelines for further information on ventilation recommendations.59
In agreement with Carrier and CDC guidance; American Society of Heating, Refrigerating and
Air-Conditioning Engineers (ASHRAE) released guidance for mass transit operators, rail, and bus
stating “Shutting off HVAC systems in vehicles is NOT recommended because there is no
outside air introduction and no air purging. When conditions allow and it will not create safety
and passenger comfort issues, the opening of operable windows is an option on some buses
(e.g. most school buses) that can greatly increase the flow of air.”60
Upon review the research team did not find any evidence suggesting that turning off a properly
designed air handling system was appropriate. However, it does appear that increasing fresh air
changes is advisable; though at minimum it will likely impact to the systems performance
possibly to the point of damaging the equipment.
The research team contacted NFI Group. “NFI Parts™ is the parts arm of the NFI Group,
providing replacement parts for New Flyer transit buses, MCI motor coaches, ARBOC cutaway
vehicles, as well as the product lines for the previously acquired NABI transit bus and Orion
parts businesses.” 61
NFI has a new retrofit kit to replace existing roof hatches with hatches with built in exhaust fans
to draw more outside air into the bus see Figure 96. As long as the bus has a 24x24” manual
Transpec roof hatch, the retrofit power vented safety roof hatch will replace the OEM part.
Each hatch provides 350 CFM of additional fresh air. The hatch should be suitable for the NABI,
MCI and presumably the mini-buses. The cost of the hatch is $750 but is sold in pairs of two for
$1,250. Installation time is approximately 4 hours to install both hatches on the NABI and
should be approximately 2 hours for all other single hatch bus types.
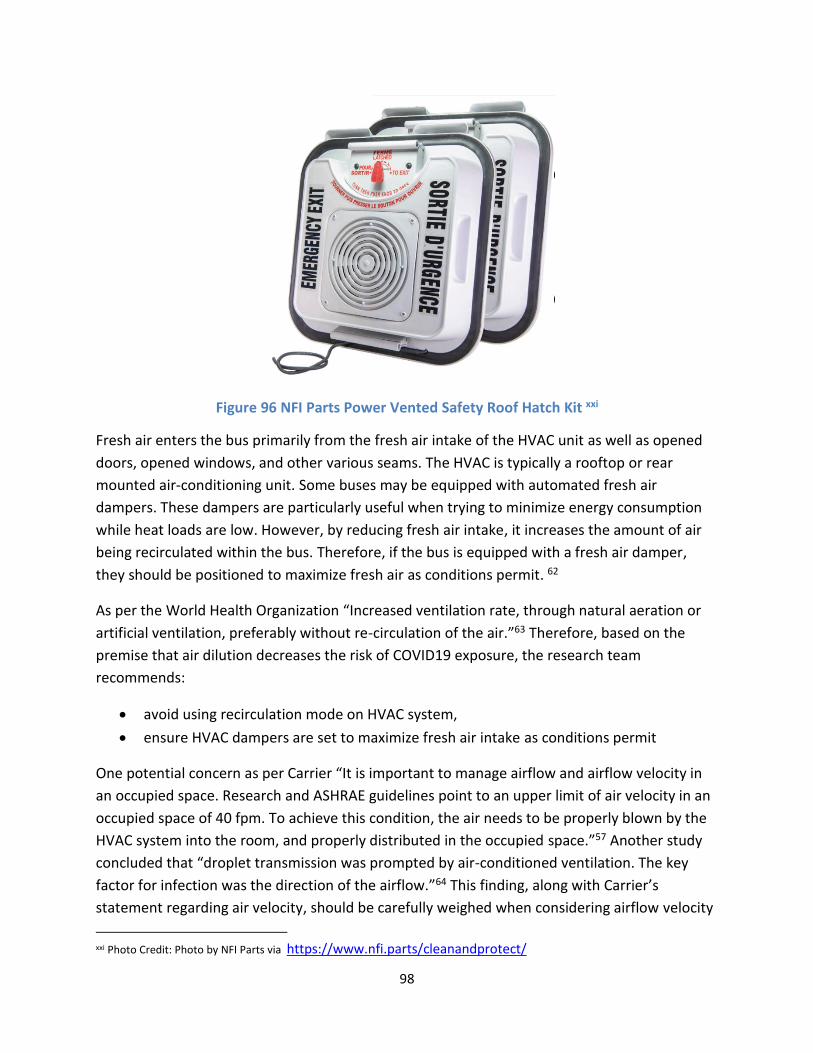
98
Figure 96 NFI Parts Power Vented Safety Roof Hatch Kit xxi
Fresh air enters the bus primarily from the fresh air intake of the HVAC unit as well as opened
doors, opened windows, and other various seams. The HVAC is typically a rooftop or rear
mounted air-conditioning unit. Some buses may be equipped with automated fresh air
dampers. These dampers are particularly useful when trying to minimize energy consumption
while heat loads are low. However, by reducing fresh air intake, it increases the amount of air
being recirculated within the bus. Therefore, if the bus is equipped with a fresh air damper,
they should be positioned to maximize fresh air as conditions permit. 62
As per the World Health Organization “Increased ventilation rate, through natural aeration or
artificial ventilation, preferably without re-circulation of the air.”63 Therefore, based on the
premise that air dilution decreases the risk of COVID19 exposure, the research team
recommends:
• avoid using recirculation mode on HVAC system,
• ensure HVAC dampers are set to maximize fresh air intake as conditions permit
One potential concern as per Carrier “It is important to manage airflow and airflow velocity in
an occupied space. Research and ASHRAE guidelines point to an upper limit of air velocity in an
occupied space of 40 fpm. To achieve this condition, the air needs to be properly blown by the
HVAC system into the room, and properly distributed in the occupied space.”57 Another study
concluded that “droplet transmission was prompted by air-conditioned ventilation. The key
factor for infection was the direction of the airflow.”64 This finding, along with Carrier’s
statement regarding air velocity, should be carefully weighed when considering airflow velocity
xxi Photo Credit: Photo by NFI Parts via https://www.nfi.parts/cleanandprotect/
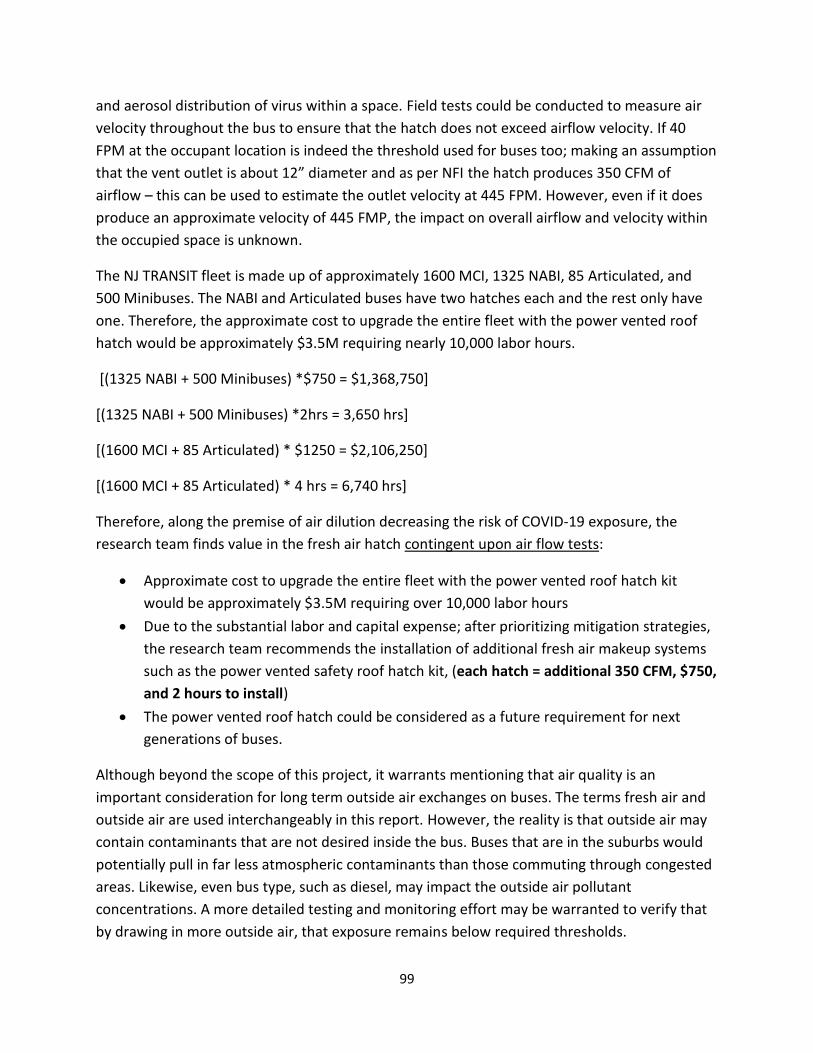
99
and aerosol distribution of virus within a space. Field tests could be conducted to measure air
velocity throughout the bus to ensure that the hatch does not exceed airflow velocity. If 40
FPM at the occupant location is indeed the threshold used for buses too; making an assumption
that the vent outlet is about 12” diameter and as per NFI the hatch produces 350 CFM of
airflow – this can be used to estimate the outlet velocity at 445 FPM. However, even if it does
produce an approximate velocity of 445 FMP, the impact on overall airflow and velocity within
the occupied space is unknown.
The NJ TRANSIT fleet is made up of approximately 1600 MCI, 1325 NABI, 85 Articulated, and
500 Minibuses. The NABI and Articulated buses have two hatches each and the rest only have
one. Therefore, the approximate cost to upgrade the entire fleet with the power vented roof
hatch would be approximately $3.5M requiring nearly 10,000 labor hours.
[(1325 NABI + 500 Minibuses) *$750 = $1,368,750]
[(1325 NABI + 500 Minibuses) *2hrs = 3,650 hrs]
[(1600 MCI + 85 Articulated) * $1250 = $2,106,250]
[(1600 MCI + 85 Articulated) * 4 hrs = 6,740 hrs]
Therefore, along the premise of air dilution decreasing the risk of COVID-19 exposure, the
research team finds value in the fresh air hatch contingent upon air flow tests:
• Approximate cost to upgrade the entire fleet with the power vented roof hatch kit
would be approximately $3.5M requiring over 10,000 labor hours
• Due to the substantial labor and capital expense; after prioritizing mitigation strategies,
the research team recommends the installation of additional fresh air makeup systems
such as the power vented safety roof hatch kit, (each hatch = additional 350 CFM, $750,
and 2 hours to install)
• The power vented roof hatch could be considered as a future requirement for next
generations of buses.
Although beyond the scope of this project, it warrants mentioning that air quality is an
important consideration for long term outside air exchanges on buses. The terms fresh air and
outside air are used interchangeably in this report. However, the reality is that outside air may
contain contaminants that are not desired inside the bus. Buses that are in the suburbs would
potentially pull in far less atmospheric contaminants than those commuting through congested
areas. Likewise, even bus type, such as diesel, may impact the outside air pollutant
concentrations. A more detailed testing and monitoring effort may be warranted to verify that
by drawing in more outside air, that exposure remains below required thresholds.
100
5.3.2 Filtration
Increasing the effectiveness of the air filters already being used within a bus’s HVAC system can
be an inexpensive and quick way to reduce airborne particles throughout the bus. These
particles may contain viruses; including aerosolized or even larger sneeze droplets. The use of
filtration in HVAC systems is recommended to be used as part of an overall risk mitigation
strategy when it comes to the spread of COVID-19 by organizations such as The National Air
Filtration Association (NAFA). They also do not regard HVAC air filtration as a solution by itself.65
Air filters used in conjunction with HVAC systems are given a Minimum Efficiency Reporting
Value (MERV) rating to determine the filters effectiveness at filtering particles of different sizes.
The higher the MERV rating of a filter, the higher the particle removal efficiency as illustrated in
Table 7.
Table 7 Typical MERV Rating Chart66
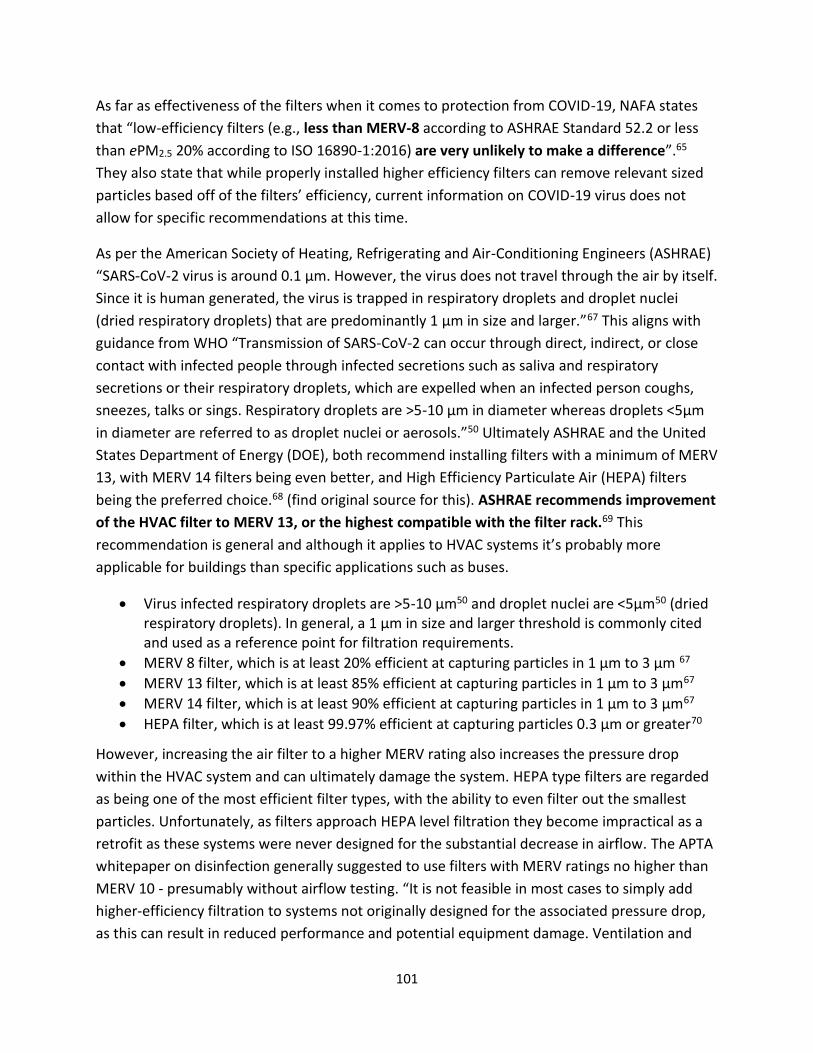
101
As far as effectiveness of the filters when it comes to protection from COVID-19, NAFA states
that “low-efficiency filters (e.g., less than MERV-8 according to ASHRAE Standard 52.2 or less
than ePM2.5 20% according to ISO 16890-1:2016) are very unlikely to make a difference”.65
They also state that while properly installed higher efficiency filters can remove relevant sized
particles based off of the filters’ efficiency, current information on COVID-19 virus does not
allow for specific recommendations at this time.
As per the American Society of Heating, Refrigerating and Air-Conditioning Engineers (ASHRAE)
“SARS-CoV-2 virus is around 0.1 µm. However, the virus does not travel through the air by itself.
Since it is human generated, the virus is trapped in respiratory droplets and droplet nuclei
(dried respiratory droplets) that are predominantly 1 µm in size and larger.”67 This aligns with
guidance from WHO “Transmission of SARS-CoV-2 can occur through direct, indirect, or close
contact with infected people through infected secretions such as saliva and respiratory
secretions or their respiratory droplets, which are expelled when an infected person coughs,
sneezes, talks or sings. Respiratory droplets are >5-10 μm in diameter whereas droplets <5μm
in diameter are referred to as droplet nuclei or aerosols.”50 Ultimately ASHRAE and the United
States Department of Energy (DOE), both recommend installing filters with a minimum of MERV
13, with MERV 14 filters being even better, and High Efficiency Particulate Air (HEPA) filters
being the preferred choice.68 (find original source for this). ASHRAE recommends improvement
of the HVAC filter to MERV 13, or the highest compatible with the filter rack.69 This
recommendation is general and although it applies to HVAC systems it’s probably more
applicable for buildings than specific applications such as buses.
• Virus infected respiratory droplets are >5-10 μm50 and droplet nuclei are <5μm50 (dried respiratory droplets). In general, a 1 µm in size and larger threshold is commonly cited and used as a reference point for filtration requirements.
• MERV 8 filter, which is at least 20% efficient at capturing particles in 1 µm to 3 µm 67
• MERV 13 filter, which is at least 85% efficient at capturing particles in 1 µm to 3 µm67
• MERV 14 filter, which is at least 90% efficient at capturing particles in 1 µm to 3 µm67
• HEPA filter, which is at least 99.97% efficient at capturing particles 0.3 µm or greater70
However, increasing the air filter to a higher MERV rating also increases the pressure drop
within the HVAC system and can ultimately damage the system. HEPA type filters are regarded
as being one of the most efficient filter types, with the ability to even filter out the smallest
particles. Unfortunately, as filters approach HEPA level filtration they become impractical as a
retrofit as these systems were never designed for the substantial decrease in airflow. The APTA
whitepaper on disinfection generally suggested to use filters with MERV ratings no higher than
MERV 10 - presumably without airflow testing. “It is not feasible in most cases to simply add
higher-efficiency filtration to systems not originally designed for the associated pressure drop,
as this can result in reduced performance and potential equipment damage. Ventilation and
102
airflow testing of the vehicle or facility HVAC system is encouraged, to determine whether any
increase in MERV rating can be accommodated.”10 Another potential disadvantage of increasing
the MERV rating is that the filters may load with dust and particles more quickly, requiring
more frequent filter changes.65
It should be noted that during this study, NFI Group Inc. began offering a MERV 12 filters,
however as of August 2020 has since discontinued offering filters above MERV 8. Upon inquiry,
no information was provided about the discontinuation of the higher-grade filters. The research
team surmises that it’s either due to lack of product availability or the improper match with
most bus HVAC pressure/flow requirements.
In addition to traditional MERV rated filters, specialty antimicrobial filters can be added
alongside the MERV filters. These thin antimicrobial layers in theory break down and inactivate
viruses passing through them by using silver and copper embedded within the media which
react with and sterilize the virus. Studies have also shown higher filtration efficiency and
delayed deterioration of the filter.71 Further investigation into the efficacy of these
antimicrobial filters are currently being tested by transit agencies.10 EPA guidelines must be
met for the antimicrobial product to be used and the product must have data proving the claim.
Copper is a well-established and is an EPA approved biocidal antimicrobial material. However,
the specific efficacy as filter is unclear, it is suggested that copper and other chemical
antimicrobial additives will inactivate the virus in hours instead of days.72,73 Nonetheless, it is
unclear if the antimicrobial layer aids in disinfecting the air or if it simply prevents colonization
on the filter media itself. The efficacy for specific products was not confirmed as part of this
review. Although efficacy remains uncertain the research team does not have any health
concerns at this time and recommends adopting antimicrobial filters. Since other techniques
will take months to adopt and retrofit, given the rapid deployment, at a minimum the
antimicrobial filter should help maintain the efficiency of the filter longer and have some virus
reducing impact, even if it’s only within the filter media. However, future testing to determine
the efficacy is needed. Furthermore, given the sizeable year-over-year cost, reevaluation is
needed as NJ TRANSIT adopts other technologies which may negate the benefit from the
antimicrobial layer.
The NJ TRANSIT fleet is made up of approximately 1600 MCI, 1325 NABI, 85 Articulated, and
500 Minibuses. As shown in Figure 97; NFI has evaluated the flow rate for MCI buses and
determined that “Flow-rate tested and approved for MCI brand. Coach applications - will not
harm fan motor. No modifications needed - no need for filter frame reconstruction, can be cut
and installed in existing filter assemblies”74 NFI recommends a 3-month replacement schedule.
• MERV 7 filter: $57 for 90-ft roll (assume the current MERV 5 filters roughly the same
cost as MERV 7)75
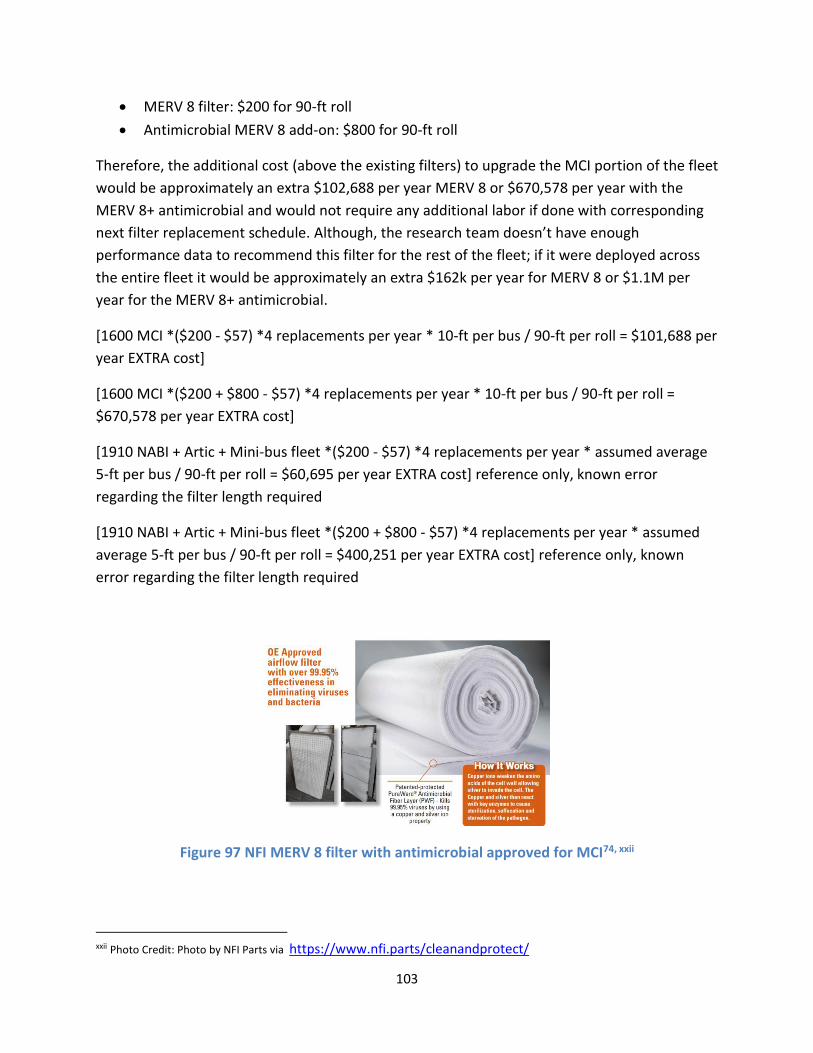
103
• MERV 8 filter: $200 for 90-ft roll
• Antimicrobial MERV 8 add-on: $800 for 90-ft roll
Therefore, the additional cost (above the existing filters) to upgrade the MCI portion of the fleet
would be approximately an extra $102,688 per year MERV 8 or $670,578 per year with the
MERV 8+ antimicrobial and would not require any additional labor if done with corresponding
next filter replacement schedule. Although, the research team doesn’t have enough
performance data to recommend this filter for the rest of the fleet; if it were deployed across
the entire fleet it would be approximately an extra $162k per year for MERV 8 or $1.1M per
year for the MERV 8+ antimicrobial.
[1600 MCI *($200 - $57) *4 replacements per year * 10-ft per bus / 90-ft per roll = $101,688 per
year EXTRA cost]
[1600 MCI *($200 + $800 - $57) *4 replacements per year * 10-ft per bus / 90-ft per roll =
$670,578 per year EXTRA cost]
[1910 NABI + Artic + Mini-bus fleet *($200 - $57) *4 replacements per year * assumed average
5-ft per bus / 90-ft per roll = $60,695 per year EXTRA cost] reference only, known error
regarding the filter length required
[1910 NABI + Artic + Mini-bus fleet *($200 + $800 - $57) *4 replacements per year * assumed
average 5-ft per bus / 90-ft per roll = $400,251 per year EXTRA cost] reference only, known
error regarding the filter length required
Figure 97 NFI MERV 8 filter with antimicrobial approved for MCI74, xxii
xxii Photo Credit: Photo by NFI Parts via https://www.nfi.parts/cleanandprotect/
104
It’s clear that upgrading to a MERV 8 filter alone will help reduce exposure risk - but it’s not
sufficient to remove a majority of virus particles. Based on the consensus of several
organizations’ recommendations; the research team suggests that:
• If system performance permits that the HVAC should be upgraded to MERV 13 or better filter, or the highest compatible filter at a minimum MERV 8 or even MERV 8 with antimicrobial layer
• More than likely - if the HVAC cannot be upgraded to MERV 13 or better either due to filter availability, lack of pressure testing data, or overall HVAC system inability; it’s highly-recommended to further investigate and incorporate an in-duct system such as in-duct UVC system along with at a minimum MERV 8 filter.
• At this time NFI has “Flow-rate tested and approved for MCI brand coach applications -
will not harm fan motor” the MERV 8+antimicrobial; this would be an extra $670,578 per
year beyond what NJ TRANSIT currently spends on filters. This retrofit would not require
any additional labor if done with corresponding next filter replacement schedule.
• If it is possible to deploy MERV 8 uniformly across the entire fleet, the approximate
added cost might be in the range of an extra $162k per year for MERV 8 or $1.1M per
year for the MERV 8+ antimicrobial. (in addition to current filter costs and with known
errors in the estimate mentioned above) Although the antimicrobial efficacy remains
uncertain the research team does not have any health concerns at this time and
recommends adopting antimicrobial filters. However, future testing to determine the
efficacy is needed. Furthermore, given the sizeable year-over-year cost, reevaluation is
needed as NJ TRANSIT adopts other technologies which may negate the benefit from the
antimicrobial layer.
• If MERV 13 or better is achievable; an in-duct system would still add value but might be
considered recommended or supplemental.
• It is recommended that future bus designs accommodate MERV 13 or better filters.
Some transit agencies such as SEPTA have already begun replacing HVAC filters in their transit
vehicles with higher rated MERV filters. Many of their bus filters have already been upgraded to
a MERV 8 rating with plans to evaluate air flow to upgrade to a MERV 14 in the future, while
their rail vehicles have already been slated to be upgraded to a MERV 14 filter.
Removal and replacement of a used filter is also an important consideration as it’s reasonable
to assume that the filter will have some virus material present. Employees should exercise
caution and follow established recommendations for replacement to manage health risks.
ASHRAE has recommended that for each filter replacement the personnel changing them wear
proper PPE while doing so. It is also recommended that spent filters be sealed in plastic bags for
disposal.69 The following ASHRAE guidelines highlight proper HVAC system maintenance and
filter replacement during the COVID-19 pandemic:
105
• For HVAC systems suspected to be contaminated with SARS-CoV-2, it is not necessary to suspend HVAC system maintenance, including filter changes, but additional safety precautions are warranted.
• The risks associated with handling filters contaminated with coronaviruses in ventilation systems under field-use conditions have not been evaluated.
• Workers performing maintenance and/or replacing filters on any ventilation system with the potential for viral contamination should wear appropriate personal protective equipment (PPE):
• A properly-fitted respirator (N95 or higher)
• Eye protection (safety glasses, goggles, or face shield)
• Disposable gloves
• Consider letting the filter load up further than usual to reduce frequency of filter changes.
• Don’t let pressure drop increase enough to disrupt room pressure differentials.
• Confirm filters remain snug in their frames.
• When feasible, filters can be disinfected with a 10% bleach solution or another appropriate disinfectant, approved for use against SARS-CoV-2, before removal. Filters (disinfected or not) can be bagged and disposed of in regular trash.
• When maintenance tasks are completed, maintenance personnel should immediately wash their hands with soap and water or use an alcohol-based hand sanitizer.76
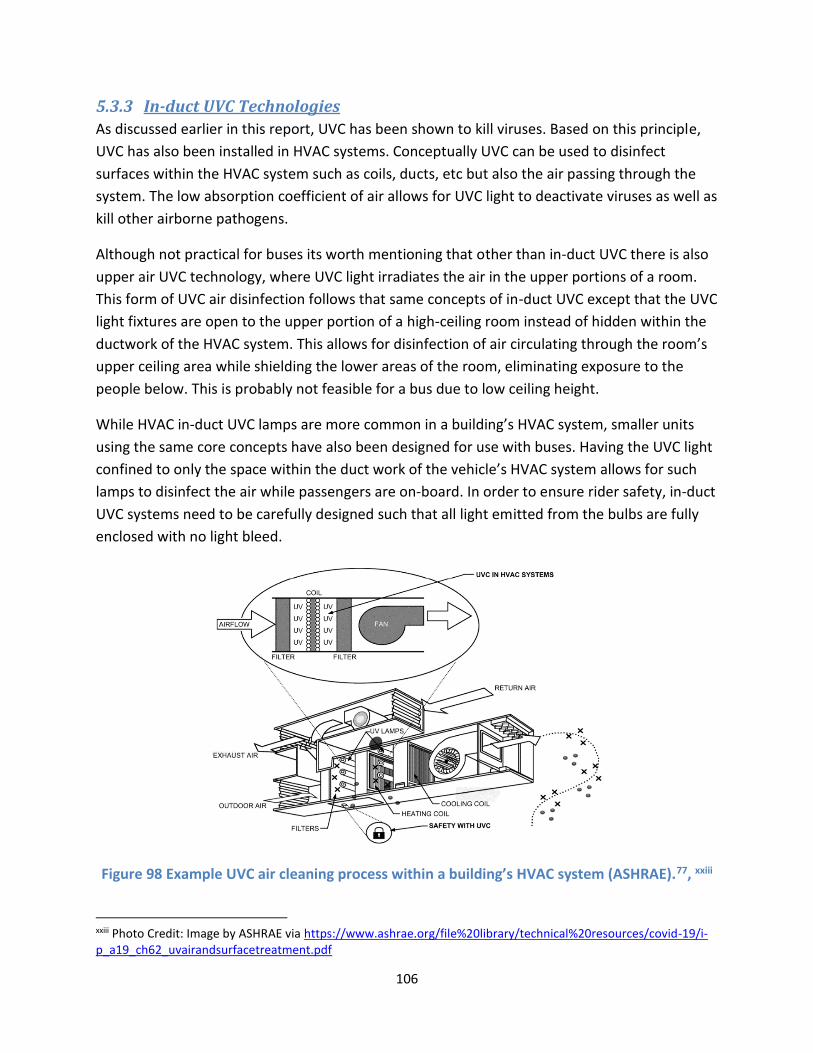
106
5.3.3 In-duct UVC Technologies
As discussed earlier in this report, UVC has been shown to kill viruses. Based on this principle,
UVC has also been installed in HVAC systems. Conceptually UVC can be used to disinfect
surfaces within the HVAC system such as coils, ducts, etc but also the air passing through the
system. The low absorption coefficient of air allows for UVC light to deactivate viruses as well as
kill other airborne pathogens.
Although not practical for buses its worth mentioning that other than in-duct UVC there is also
upper air UVC technology, where UVC light irradiates the air in the upper portions of a room.
This form of UVC air disinfection follows that same concepts of in-duct UVC except that the UVC
light fixtures are open to the upper portion of a high-ceiling room instead of hidden within the
ductwork of the HVAC system. This allows for disinfection of air circulating through the room’s
upper ceiling area while shielding the lower areas of the room, eliminating exposure to the
people below. This is probably not feasible for a bus due to low ceiling height.
While HVAC in-duct UVC lamps are more common in a building’s HVAC system, smaller units
using the same core concepts have also been designed for use with buses. Having the UVC light
confined to only the space within the duct work of the vehicle’s HVAC system allows for such
lamps to disinfect the air while passengers are on-board. In order to ensure rider safety, in-duct
UVC systems need to be carefully designed such that all light emitted from the bulbs are fully
enclosed with no light bleed.
Figure 98 Example UVC air cleaning process within a building’s HVAC system (ASHRAE).77, xxiii
xxiii Photo Credit: Image by ASHRAE via https://www.ashrae.org/file%20library/technical%20resources/covid-19/i-p_a19_ch62_uvairandsurfacetreatment.pdf
107
Placement of UVC lamps directly behind wet or damp areas inside the HVAC system such as the
cooling coils and drain pans has been shown to significantly reduce the build-up of bacteria and
mold-containing biofilms in these areas and is an ideal location for the lamps78. Outside of air
disinfection, some installed UVC lamp systems within large buildings have been placed
specifically to irradiate these coils with mold killing properties in mind. Ideally, bulb placement
on a transit vehicle would be located in an area that could provide proper irradiation to the
HVAC coils to prevent any biofilm buildup as well as sufficiently provide enough dwell time for
any airborne particles to be treated while passing through the irradiated area.
When it comes to the effectiveness of in-duct UVC in the treatment and disinfection of moving
air-streams, laboratory studies have concluded that this form of UVC technology is effective.79 80 The U.S. Environmental Protection Agency (EPA), through its Office of Research and
Development’s National Homeland Security Research Center (NHSRC) funded a study of UVC
for in-duct systems in 2006. “The objective of testing the device was to evaluate its bioaerosol
inactivation efficiency as a heating, ventilation, and air-conditioning (HVAC) in-duct ultraviolet
light system. [sic] The bioaerosol inactivation efficiencies calculated for the three organisms
were 96% for B. atrophaeus, 99.96% for S. marcescens, and 99% for MS2.”81 It should be noted
that these studies took place on a larger scale duct system such as one which would be more
commonly found within a building and not on a smaller scale system similar to a bus.
While these studies show that the concept of using UVC to disinfect HVAC airstreams works,
agencies such as ASHRAE are not currently making any recommendations for or against the use
of UVC disinfection within air systems.62 Other organizations such as the CDC have published
studies which approve the use of UVC used in conjunction with proper filtration for the
reduction of infectious diseases such as tuberculosis in a published guideline on the
technology’s application.82 However, it should also be noted that these studies focused on
“upper-room” UVC to disinfect the air-streams. While in-duct UVC has been more widely used
within building HVAC systems, their evaluation for use within bus HVAC systems is less
documented.
As per ASHRAE “In-duct air disinfection systems should be designed to have the desired single-
pass inactivation level under worst-case conditions of air temperature and velocity in the
irradiated zone.”77 Furthermore, ASHRAE recommends that in-duct systems should provide a
minimum of 0.25 s of exposure in order to minimize system power consumption.77 Based on
compact size of a bus HVAC system and the air velocity it is highly unlikely that a 0.25s exposure
time can be obtained nor an overall exposure time to achieve a single-pass inactivation.
Therefore, the single-pass inactivation concept is likely the biggest argument against adopting
in-duct UVC technology on a bus. Without a single-pass dosage being delivered, it is unknown
how repeated dosages at different time intervals will impact the UVC kill-dosage required. This
108
is likely why ASHRAE does not currently recommend using UVC light as a disinfecting agent
within a transit vehicle’s HVAC system due to concerns that pathogens passing through the
system may not obtain proper exposure durations due to the UVC light’s shorter dwell time in
these smaller HVAC systems.60 However, with an estimated rate of one air exchange per minute
typically found on NJ TRANSIT buses, air passing through the irradiated area of the of the HVAC
system will be treated with a dose of UVC light roughly once a minute. Depending on the
intensity of the bulbs being used and the length of the irradiated area, the dwell time of the air
passing through that area of the HVAC system can be calculated to determine how many Joules
of energy are delivered on each pass. Even though there is an efficacy uncertainty, there has
been support for in-duct UVC systems on buses84, and some transit findings include:
• Dallas Area Rapid Transit (DART) had already installed internal HVAC UV systems on 70% of their buses prior to the COVID-19 epidemic.9 The research team reached out to DART who confirmed that 77% of their buses have the SanUVaire product installed. DART has relied on the vendor claims and has not conducted efficacy testing. The vendor claims that it will reduce the requirement to clean the evaporator coil, and DART has observed that the coils are very clean. DART has also conducted fleet reliability studies and the HVAC systems are generally top performers; this implies that they are indeed effective in reducing maintenance costs.83 In summary, DART has deployed in-duct UVC since 2013 with no major logistics concerns.
• A Federal Transit Administration (FTA) funded study by the Transportation Research Board (TRB) “Ultraviolet Germicidal Irradiation for Transit Buses” Transit IDEA project #53 of 14 Houston Metropolitan Transit Authority buses investigated the benefits of such UVC systems on transit buses.84 The study ultimately found that the addition of an in-duct UVC system installed behind the heater coil would increase system efficiencies and reduce airborne pathogens. Depending on the age and model of the bus being evaluated, the UVC system was found to increase airflow by reducing mold and fungi built up around the evaporator anywhere from 23% to 31%, and increase temperature efficiencies by 9.4% to 19.4%, resulting in better cooling and lower maintenance costs for the bus’s air conditioning system. The pathogen tests resulted in a 95% to 99% reduction in mold, fungi, and bacteria on the buses, and a 99% reduction in common viruses.84 “to test the effectiveness of the UVGI System to improve the air quality in transit buses by reducing harmful pathogens, mold, fungi, bacteria and, viruses within the bus for passengers, drivers and employees. [sic] The tests conducted by Biological Consulting Services of North Florida, Inc. and Dr. James W. Kimbrough, Mycologist, University of Florida, showed an effective reduction of 95% to 99% on mold, fungi, and bacteria on the buses tested. Testing showed a 99% reduction in common viruses. The use of UVGI Systems designed for transit buses was effective and produced positives results. These test results were very similar to other test results found in hospitals, schools, commercial buildings, food processing plants, and other stationary applications of UVGI Systems. EPA Office of Research and Development, National Homeland Security Research Center testing for hospitals and commercial buildings titled
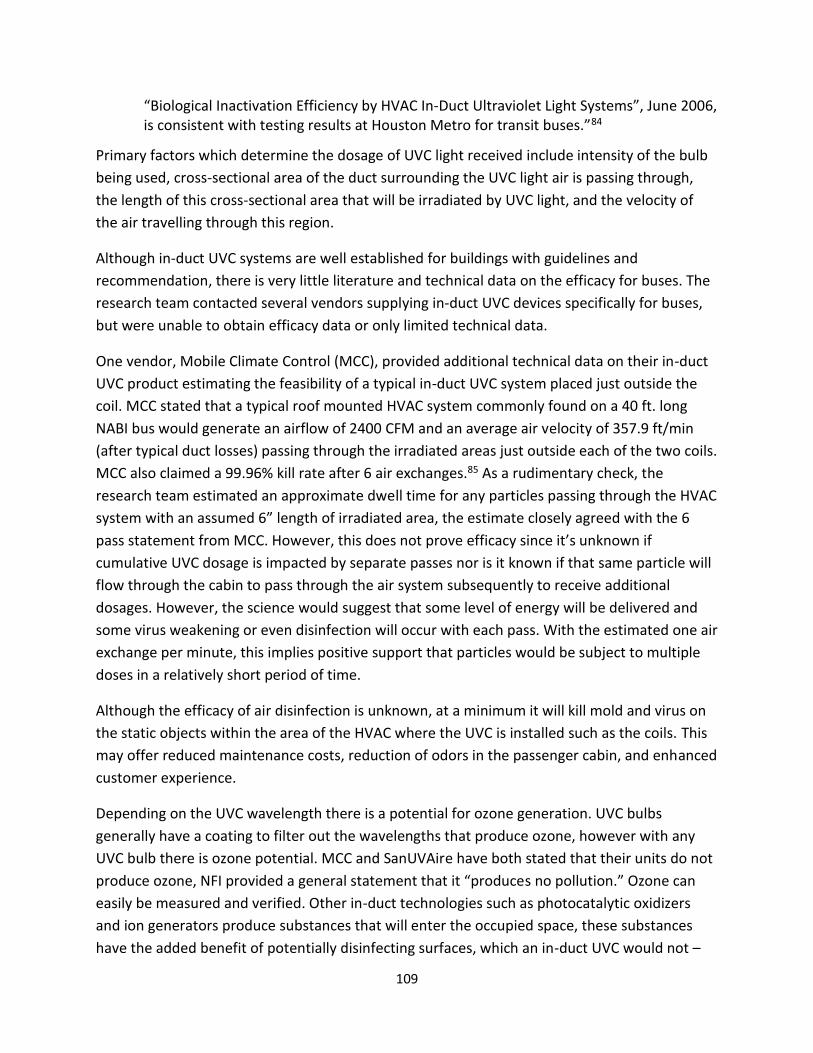
109
“Biological Inactivation Efficiency by HVAC In-Duct Ultraviolet Light Systems”, June 2006, is consistent with testing results at Houston Metro for transit buses.”84
Primary factors which determine the dosage of UVC light received include intensity of the bulb
being used, cross-sectional area of the duct surrounding the UVC light air is passing through,
the length of this cross-sectional area that will be irradiated by UVC light, and the velocity of
the air travelling through this region.
Although in-duct UVC systems are well established for buildings with guidelines and
recommendation, there is very little literature and technical data on the efficacy for buses. The
research team contacted several vendors supplying in-duct UVC devices specifically for buses,
but were unable to obtain efficacy data or only limited technical data.
One vendor, Mobile Climate Control (MCC), provided additional technical data on their in-duct
UVC product estimating the feasibility of a typical in-duct UVC system placed just outside the
coil. MCC stated that a typical roof mounted HVAC system commonly found on a 40 ft. long
NABI bus would generate an airflow of 2400 CFM and an average air velocity of 357.9 ft/min
(after typical duct losses) passing through the irradiated areas just outside each of the two coils.
MCC also claimed a 99.96% kill rate after 6 air exchanges.85 As a rudimentary check, the
research team estimated an approximate dwell time for any particles passing through the HVAC
system with an assumed 6” length of irradiated area, the estimate closely agreed with the 6
pass statement from MCC. However, this does not prove efficacy since it’s unknown if
cumulative UVC dosage is impacted by separate passes nor is it known if that same particle will
flow through the cabin to pass through the air system subsequently to receive additional
dosages. However, the science would suggest that some level of energy will be delivered and
some virus weakening or even disinfection will occur with each pass. With the estimated one air
exchange per minute, this implies positive support that particles would be subject to multiple
doses in a relatively short period of time.
Although the efficacy of air disinfection is unknown, at a minimum it will kill mold and virus on
the static objects within the area of the HVAC where the UVC is installed such as the coils. This
may offer reduced maintenance costs, reduction of odors in the passenger cabin, and enhanced
customer experience.
Depending on the UVC wavelength there is a potential for ozone generation. UVC bulbs
generally have a coating to filter out the wavelengths that produce ozone, however with any
UVC bulb there is ozone potential. MCC and SanUVAire have both stated that their units do not
produce ozone, NFI provided a general statement that it “produces no pollution.” Ozone can
easily be measured and verified. Other in-duct technologies such as photocatalytic oxidizers
and ion generators produce substances that will enter the occupied space, these substances
have the added benefit of potentially disinfecting surfaces, which an in-duct UVC would not –
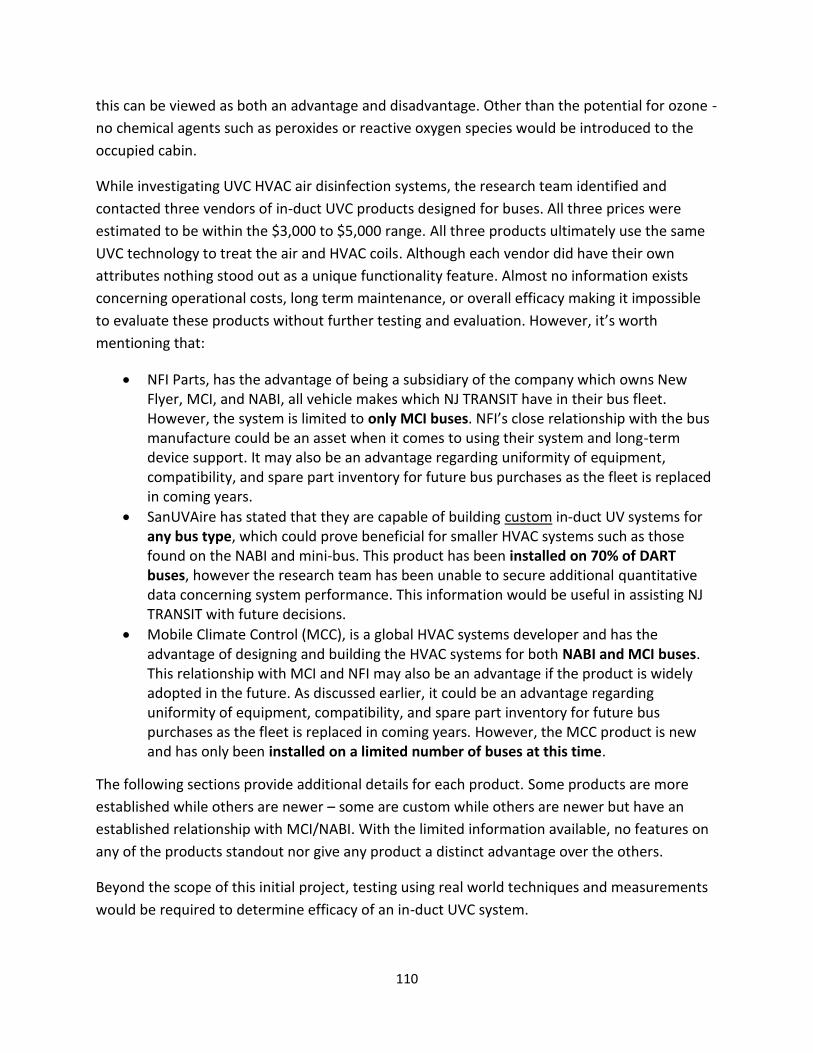
110
this can be viewed as both an advantage and disadvantage. Other than the potential for ozone -
no chemical agents such as peroxides or reactive oxygen species would be introduced to the
occupied cabin.
While investigating UVC HVAC air disinfection systems, the research team identified and
contacted three vendors of in-duct UVC products designed for buses. All three prices were
estimated to be within the $3,000 to $5,000 range. All three products ultimately use the same
UVC technology to treat the air and HVAC coils. Although each vendor did have their own
attributes nothing stood out as a unique functionality feature. Almost no information exists
concerning operational costs, long term maintenance, or overall efficacy making it impossible
to evaluate these products without further testing and evaluation. However, it’s worth
mentioning that:
• NFI Parts, has the advantage of being a subsidiary of the company which owns New Flyer, MCI, and NABI, all vehicle makes which NJ TRANSIT have in their bus fleet. However, the system is limited to only MCI buses. NFI’s close relationship with the bus manufacture could be an asset when it comes to using their system and long-term device support. It may also be an advantage regarding uniformity of equipment, compatibility, and spare part inventory for future bus purchases as the fleet is replaced in coming years.
• SanUVAire has stated that they are capable of building custom in-duct UV systems for any bus type, which could prove beneficial for smaller HVAC systems such as those found on the NABI and mini-bus. This product has been installed on 70% of DART buses, however the research team has been unable to secure additional quantitative data concerning system performance. This information would be useful in assisting NJ TRANSIT with future decisions.
• Mobile Climate Control (MCC), is a global HVAC systems developer and has the advantage of designing and building the HVAC systems for both NABI and MCI buses. This relationship with MCI and NFI may also be an advantage if the product is widely adopted in the future. As discussed earlier, it could be an advantage regarding uniformity of equipment, compatibility, and spare part inventory for future bus purchases as the fleet is replaced in coming years. However, the MCC product is new and has only been installed on a limited number of buses at this time.
The following sections provide additional details for each product. Some products are more
established while others are newer – some are custom while others are newer but have an
established relationship with MCI/NABI. With the limited information available, no features on
any of the products standout nor give any product a distinct advantage over the others.
Beyond the scope of this initial project, testing using real world techniques and measurements
would be required to determine efficacy of an in-duct UVC system.
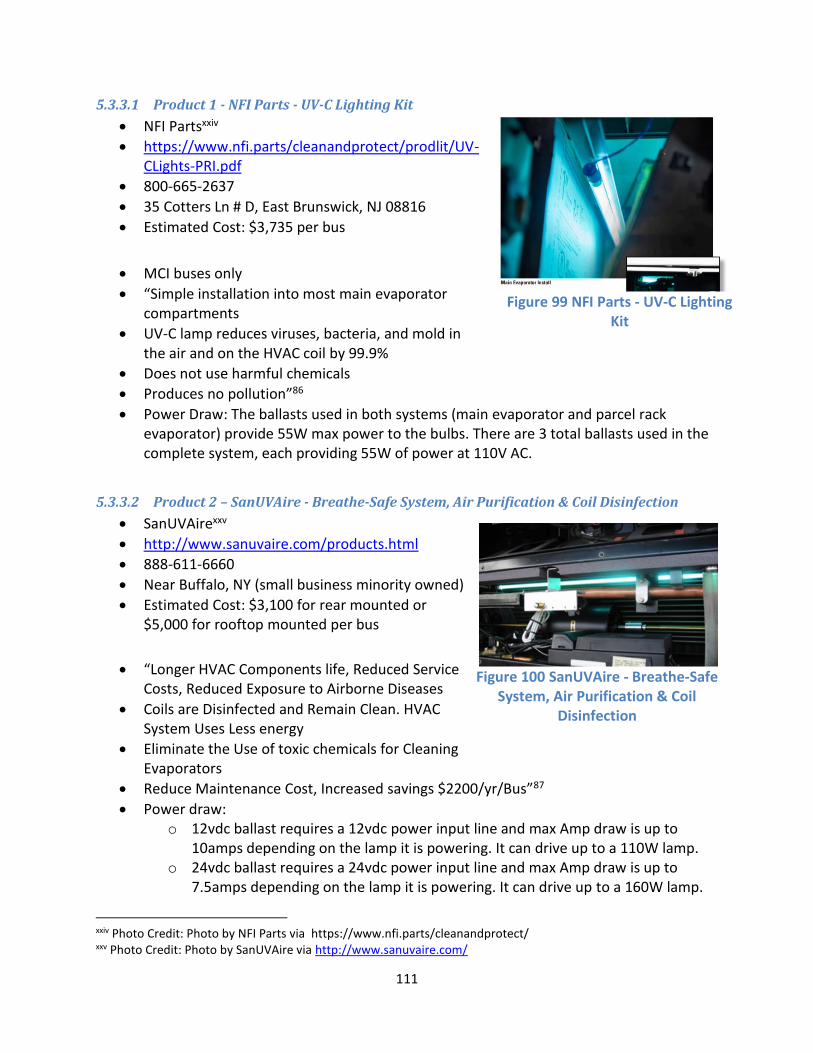
111
5.3.3.1 Product 1 - NFI Parts - UV-C Lighting Kit
• NFI Partsxxiv
• https://www.nfi.parts/cleanandprotect/prodlit/UV-CLights-PRI.pdf
• 800-665-2637
• 35 Cotters Ln # D, East Brunswick, NJ 08816
• Estimated Cost: $3,735 per bus
• MCI buses only
• “Simple installation into most main evaporator compartments
• UV-C lamp reduces viruses, bacteria, and mold in the air and on the HVAC coil by 99.9%
• Does not use harmful chemicals
• Produces no pollution”86
• Power Draw: The ballasts used in both systems (main evaporator and parcel rack evaporator) provide 55W max power to the bulbs. There are 3 total ballasts used in the complete system, each providing 55W of power at 110V AC.
5.3.3.2 Product 2 – SanUVAire - Breathe-Safe System, Air Purification & Coil Disinfection
• SanUVAirexxv
• http://www.sanuvaire.com/products.html
• 888-611-6660
• Near Buffalo, NY (small business minority owned)
• Estimated Cost: $3,100 for rear mounted or $5,000 for rooftop mounted per bus
• “Longer HVAC Components life, Reduced Service Costs, Reduced Exposure to Airborne Diseases
• Coils are Disinfected and Remain Clean. HVAC System Uses Less energy
• Eliminate the Use of toxic chemicals for Cleaning Evaporators
• Reduce Maintenance Cost, Increased savings $2200/yr/Bus”87
• Power draw: o 12vdc ballast requires a 12vdc power input line and max Amp draw is up to
10amps depending on the lamp it is powering. It can drive up to a 110W lamp. o 24vdc ballast requires a 24vdc power input line and max Amp draw is up to
7.5amps depending on the lamp it is powering. It can drive up to a 160W lamp.
xxiv Photo Credit: Photo by NFI Parts via https://www.nfi.parts/cleanandprotect/ xxv Photo Credit: Photo by SanUVAire via http://www.sanuvaire.com/
Figure 99 NFI Parts - UV-C Lighting Kit
Figure 100 SanUVAire - Breathe-Safe System, Air Purification & Coil
Disinfection
112
5.3.3.3 Product 4 - Mobile Climate Control (MCC) - Aire-Shield UVC
• Mobile Climate Controlxxvi
• www.mcc-hvac.com
• 717-309-0548
• 17103, State Road 4 East Goshen, Indiana 46528
• Estimated Cost: $3,000 per bus
• “99.96% kill rate after 6 air changes*
• Sterilizes air as it passes by the evaporator
• Reduces evaporator maintenance
• Available for retrofit and new MCC systems
• Interlock switches prevent accidental exposure
• Sterilizes bus air volume up to once per minute
• Does not produce Ozone
• Teflon coating contains contents in case of breakage *Results based on modeling from Eco 353 systems, data from laboratory testing
of existing coronaviruses, UVC bulb intensity after 9,000 hours of operation, and
HVAC unit air flow. Without enough data on COVID- 19 (SARS CoV-2), UVC
dosage values of other viruses in the SARS family are used for the novel
coronavirus kill rate.
• 18,000-hour lamp life
• 46" & 60" Teflon coated lamps emit 17-25 UVC Watts
• Lamp emits 100% 254nm UVC light
• Power draw: 24VDC, 4A per UVC lamp”85
xxvi Photo Credit: Photo by MCC via www.mcc-hvac.com
Figure 101 Mobile Climate Control (MCC) - Aire-Shield UVC
113
5.3.4 In-duct Photocatalytic, Photohydroionization, and Ion technologies
In addition to UVC to disinfect air within a vehicle’s HVAC system, there are other in-duct HVAC
disinfecting systems using Ionization and Photocatalytic Oxidation to treat the air. The National
Air Filtration Association (NAFA) – which admittedly might be biased toward filtration - has
stated that ionizers, ozone generators, plasma, and other air cleaning technologies have not
been proven to reduce infection in real buildings, even if they may show promise based off of
tests performed in a laboratory under idealized settings.65 However, ASHRAE, which would not
appear, to have the same biases and is often cited and referred to by CDC, has summarized the
technology efficacy as:
“Photocatalytic Oxidation (PCO)
• Consists of a pure or doped metal oxide semiconductor material
• Most Common Photocatalyst is Ti02 (titanium dioxide)
• Activated by a UV light source
• UV-A (400-315nm)
• UV-C (280-200nm)
• UV-V (under 200nm) Ozone can be formed at UV-V wavelengths
• Light mediated, redox reaction of gases and biological particles absorbed on the surface
• Some units claim disinfection from gaseous hydrogen peroxide.
• Possible by-products formed by incomplete oxidizing.
• Some air cleaners using PCO remove harmful contaminants to levels below limits for
reducing health risks set by recognized cognizant authorities.
• Some are ineffective in reducing concentrations significantly; manufacturer data
should be considered carefully.”76
“Bipolar Ionization/Corona Discharge
• High voltage electrodes create reactive ions in air that react with airborne contaminants,
including viruses.
• The design of the corona discharge system can be modified to create mixtures of reactive
oxygen species (ROS), ozone, hydroxyl radicals and super¬oxide anions.
• Systems are reported to range from ineffective to very effective in reducing airborne
particulates and acute health symptoms.
• Convincing scientifically-rigorous, peer-reviewed studies do not currently exist on this
emerging technology; manufacturer data should be carefully considered.
• Systems may emit ozone, some at high levels. Manufacturers are likely to have ozone
generation test data.”76
114
5.3.4.1 Ion (Plasma) Generator
With any disinfection technique that disperses disinfectant into the breathing zone of riders, it
is difficult to maintain the safety of the rider or unprotected worker while simultaneously
achieving the desired disinfection. Biological inactivation of the virus caused by the activity of
the disinfecting agent is at best an irritant and at worst a potential health concern to those
inhaling the agent. While application of disinfection techniques may be appropriate for filters
within an air handling unit, the release of the disinfecting agent into breathing areas is generally
either at a concentration too low to be effective yet safe to those without respiratory
protection, or too high to be deemed safe.
There are multiple ways to generate a plasma, described as an ionized gas with roughly equal
concentrations of positive and negative ions. Like a gas they have undefined shape but can be
directed using electric or magnetic fields. It is often referred to as the 4th state of matter as it
results from application of energy to a gas. Commercial devices have many applications
including analytical chemistry, metal etching, television pictures, power generation and
disinfection. Plasmas are easy to generate at low pressures but more difficult at atmospheric
pressure. They are generated at atmospheric pressure by ionization of gasses that make up air
or those introduced into a chamber at higher concentrations. They are generated using both DC
and AC voltages to remove electrons from the gas and then exciting the electrons for further
gas ionization. These plasmas are the principle means for generating the ions thought to be the
driver of the disinfection or inactivation process.
Disinfection technologies that use ionization generate reactive ions within the space that they
are created. Typically, two parallel plate capacitors are maintained with a voltage between
them, high enough to remove the electrons from the water vapor in the air, generating reactive
oxygen (and other) species.
One mechanism proposed for disinfection is that ions are added to the membrane of the cell of
a bacteria spore or virus until the infecting species can no longer tolerate the surface charge
and because the membrane ruptures, possibly due to columbic repulsion. In an uncontrolled
environment there is no way to continue to force charges to continue to accumulate on a
membrane until disruption of the membrane occurs.
One study demonstrated that currents of approximately 100uA for 90 seconds was required to
achieve a disinfection of 106 CFU. The bus concentrations of ions were roughly 106 lower in air.
On June 2nd, CCT joined representatives of New Jersey Transit to identify optimal locations for
the CCT24V-1 on the MCI bus and the CCT24V-D12 for the NABI bus. CCT used the Alphalabs
AIC2 meter for testing the concentrations. One of these devices was employed in a bus under
partially controlled conditions. It was not moving nor was it picking up passengers at multiple
115
stops, but did record door opening and closing events. As per the vendor test and report, the
concentration of ions measured fluctuated between zero and > 150,000 ions/cm3 during the
study.
In general, the maximum and minimum ion concentrations can be measured within the
breathing zone of a bus, but whether these concentrations are high enough for virus
inactivation, or low enough not to present a human health risk, has yet to be determined. The
reactivity of the ions that remain, as well as their concentration, will both help to determine the
efficacy of ionization as a disinfection technique for air particulate.
Application and mounting of the device seems possible. However, which ions generated
(including free radical plus electrons) and under what conditions, are questions that have yet to
be fully characterized and quantified. Overall, the technique as it is applied to disinfection
outside the duct cannot be evaluated thoroughly at this time.
The limitations of approach include no characterization of the ion types (their reactivity) was
provided by the vendor other than Ozone concentrations. However, H20 has several hydroxyl
combinations beyond ozone such as oxygen O2 but also O2- superoxide or oxide anion, as well
as OH and OH-, and even H2O2 hydrogen peroxide. There has been little work on the
characterization of the radical ions released by these devices that are essentially novel
modifications of devices designed to work within a duct. While many of the more reactive
species are expected to have short half-lives, the ions or ionic species that are longer lived have
generally just been counted rather than characterized. They are proposed to be cluster ions
(multiple atoms with an associated charge) but without further spectroscopic characterization
within the larger environment of their release (i.e. bus cabin), the research team cannot
confirm what they are or even how reactive. Furthermore, real-world uncontrolled factors such
as relative humidity, surface composition and other air substituents (VOCs and chemical
disinfectants), will all contribute to the composition to the actual ions that remain to inactivate
virus.
The research team was unable to identify any scientific peer reviewed publications regarding
the ion concentration required for efficacy within a breathing environment. The measured
concentrations may be effective if the ionic species are highly reactive and mixed well within
the breathing space but if they are highly reactive, they also represent a health risk to the
passengers and especially the driver who would be exposed for a much greater duration of the
day. As described above, the measured concentrations are orders of magnitudes lower than
those founds in many bacteria disinfection studies where the plasmas generated were only a
few centimeters above the active cultures that were neutralized. If the ions are less reactive
and present little or no health risk, it is likely that disinfection times will be much longer than
the resident time of a particle within the bus, possibly hours.
116
The overall conclusions are there are many unknowns and many possible pathways to negative
health outcomes. Conversely, it’s equally possible that it will or will not generated high enough
ion concentrations in the bus to be effective or that it could be only marginally effective.
However, this technology does have the potential to disinfect, especially in a closed
environment within the duct. The research team is unable to confirm efficacy or fully assess
health impacts without additional information.
5.3.4.2 Photocatalytic Oxidizer and Photohydroionization
Photocatalytic oxidation generates reactive oxygen species (ROS) that inactivate or kill the virus
or bacteria. These include oxygen and O2 radicals, peroxide and others. It is an emerging
technology used in HVAC systems, primarily to kill airborne bacteria, that uses a photoreaction
accelerated by a catalyst (TiO2, WO3, ZnS, etc.). The ROS are formed on the catalytic surface
when exposed to light of the appropriate wavelength. ROS are highly reactive and generally
short lived because of their reactivity. They create free radicals that can reduce and oxidize
compounds which are also present on the catalyst surface that undergo secondary reactions
that generate biocides. They can also react to form aldehydes, ketones etc. that in turn present
a secondary potential health risk to those exposed. Only a small percentage of the pathogens
will be killed in a single pass system because those pathogens need to be absorbed to the
catalytic surface and efficiency is also reduced by accumulation of a surface layer of pathogens
already killed by the process. This is an emerging technology with varying efficacy claims for
large scale air disinfection applications.
Its efficacy has not been demonstrated though inactivation or biocidal removal of the virus for
application outside of an air duct. It may generate harmful byproducts. While there are no
standardized test methods there are only a few studies to verify performance. According to
RGF’s oxidation test results the device in 6 hours achieves 99% inactivation of H1N1; and in
approximately 2-3 hours achieves 99% inactivation of Avian Influenza.88 At the very least it can
aid in the overall disinfection of the air with the understanding that its efficiency is low or may
take hours to have measurable results.
The limitations of the approach are they largely used for disinfection of water but has also been
used for disinfection of air. There may not be any suitable devices to be used for general air
disinfection. It may be more applicable to disinfection of air filtration devices because of the
localized generation of reactive species.
The overall conclusions include that these devices are too new for complete air disinfection but
may support or be used in conjunction with other technologies. Like the plasma generators, the
species generated on the surface of the catalyst are at least irritants and at worst a potential
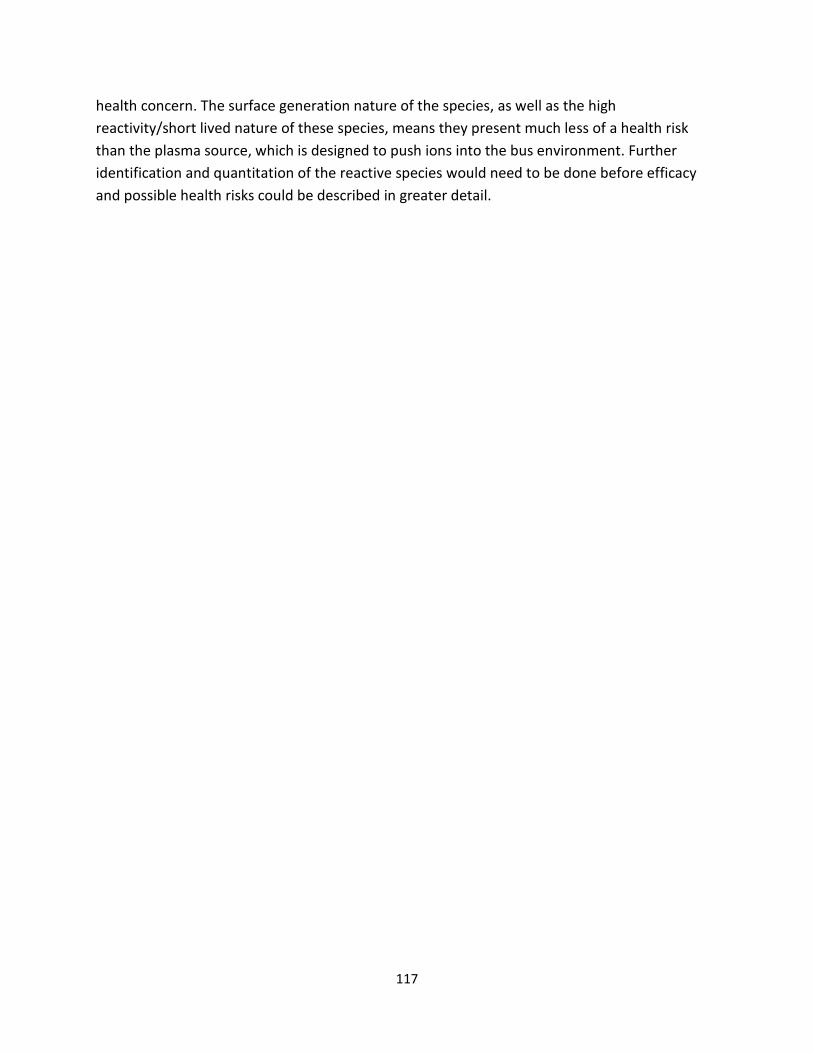
117
health concern. The surface generation nature of the species, as well as the high
reactivity/short lived nature of these species, means they present much less of a health risk
than the plasma source, which is designed to push ions into the bus environment. Further
identification and quantitation of the reactive species would need to be done before efficacy
and possible health risks could be described in greater detail.
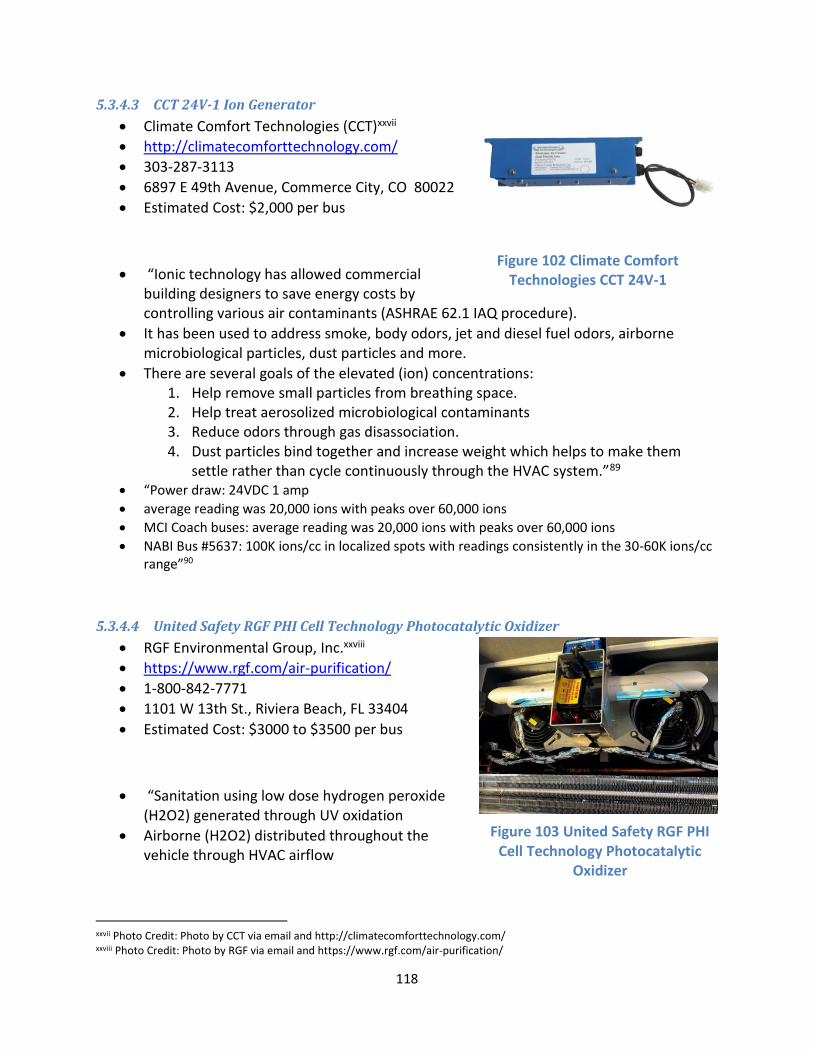
118
5.3.4.3 CCT 24V-1 Ion Generator
• Climate Comfort Technologies (CCT)xxvii
• http://climatecomforttechnology.com/
• 303-287-3113
• 6897 E 49th Avenue, Commerce City, CO 80022
• Estimated Cost: $2,000 per bus
• “Ionic technology has allowed commercial building designers to save energy costs by controlling various air contaminants (ASHRAE 62.1 IAQ procedure).
• It has been used to address smoke, body odors, jet and diesel fuel odors, airborne microbiological particles, dust particles and more.
• There are several goals of the elevated (ion) concentrations: 1. Help remove small particles from breathing space. 2. Help treat aerosolized microbiological contaminants 3. Reduce odors through gas disassociation. 4. Dust particles bind together and increase weight which helps to make them
settle rather than cycle continuously through the HVAC system.”89 • “Power draw: 24VDC 1 amp
• average reading was 20,000 ions with peaks over 60,000 ions
• MCI Coach buses: average reading was 20,000 ions with peaks over 60,000 ions
• NABI Bus #5637: 100K ions/cc in localized spots with readings consistently in the 30-60K ions/cc range”90
5.3.4.4 United Safety RGF PHI Cell Technology Photocatalytic Oxidizer
• RGF Environmental Group, Inc.xxviii
• https://www.rgf.com/air-purification/
• 1-800-842-7771
• 1101 W 13th St., Riviera Beach, FL 33404
• Estimated Cost: $3000 to $3500 per bus
• “Sanitation using low dose hydrogen peroxide (H2O2) generated through UV oxidation
• Airborne (H2O2) distributed throughout the vehicle through HVAC airflow
xxvii Photo Credit: Photo by CCT via email and http://climatecomforttechnology.com/ xxviii Photo Credit: Photo by RGF via email and https://www.rgf.com/air-purification/
Figure 102 Climate Comfort Technologies CCT 24V-1
Figure 103 United Safety RGF PHI Cell Technology Photocatalytic
Oxidizer
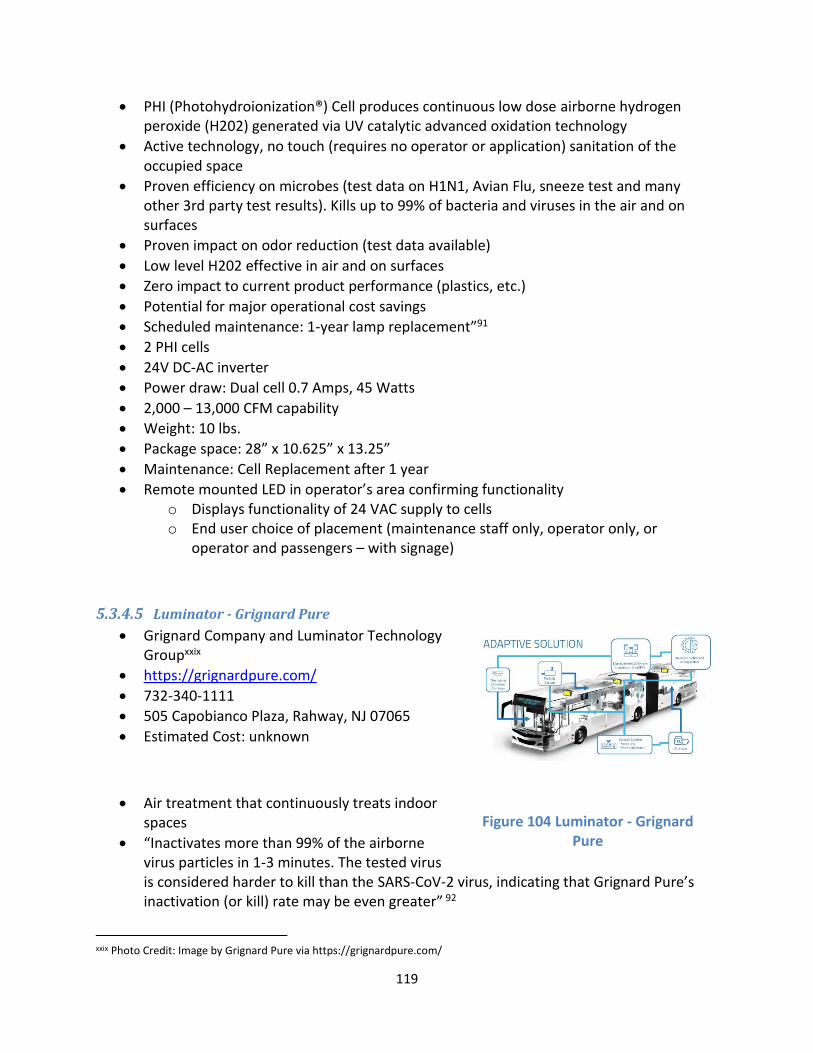
119
• PHI (Photohydroionization®) Cell produces continuous low dose airborne hydrogen peroxide (H202) generated via UV catalytic advanced oxidation technology
• Active technology, no touch (requires no operator or application) sanitation of the occupied space
• Proven efficiency on microbes (test data on H1N1, Avian Flu, sneeze test and many other 3rd party test results). Kills up to 99% of bacteria and viruses in the air and on surfaces
• Proven impact on odor reduction (test data available)
• Low level H202 effective in air and on surfaces
• Zero impact to current product performance (plastics, etc.)
• Potential for major operational cost savings
• Scheduled maintenance: 1-year lamp replacement”91
• 2 PHI cells
• 24V DC-AC inverter
• Power draw: Dual cell 0.7 Amps, 45 Watts
• 2,000 – 13,000 CFM capability
• Weight: 10 lbs.
• Package space: 28” x 10.625” x 13.25”
• Maintenance: Cell Replacement after 1 year
• Remote mounted LED in operator’s area confirming functionality o Displays functionality of 24 VAC supply to cells o End user choice of placement (maintenance staff only, operator only, or
operator and passengers – with signage)
5.3.4.5 Luminator - Grignard Pure
• Grignard Company and Luminator Technology Groupxxix
• https://grignardpure.com/
• 732-340-1111
• 505 Capobianco Plaza, Rahway, NJ 07065
• Estimated Cost: unknown
• Air treatment that continuously treats indoor spaces
• “Inactivates more than 99% of the airborne virus particles in 1-3 minutes. The tested virus is considered harder to kill than the SARS-CoV-2 virus, indicating that Grignard Pure’s inactivation (or kill) rate may be even greater” 92
xxix Photo Credit: Image by Grignard Pure via https://grignardpure.com/
Figure 104 Luminator - Grignard Pure
120
• Intrinsik Toxicology Risk Assessment – United States: “Based on available data, Grignard Pure MEETS the requirements for classification as not toxic (acute/chronic), corrosive, a skin/eye irritant, or a strong sensitizer as defined in 16 CFR 1500.3, when used as intended or under circumstances involving reasonable foreseeable misuse. In addition, the ingredients in the product are not included in the list of banned hazardous substances cited in 16 CFR 1500.17.”92
• “NIOSH concluded that air treatment products did not affect people with asthma. The EPA has said that the active ingredient in Grignard Pure does not cause harm when inhaled. Locations where Grignard Pure is in use to provide protection against airborne microbes will have the “Protected by Grignard Pure” logo prominently displayed at major entrances, to advise people who might have questions about their own health and to give them the clear option not to enter the facility should they not feel comfortable.”92
• Currently under review for an emergency exemption from the United States Environmental Protection Agency (EPA) and several state-level regulatory programs93
5.3.4.6 In-duct Photocatalytic and Ion Follow-up
The research team contacted several vendors supplying in-duct Ion and Photocatalytic devices
specifically for buses. The pricing on all three of these systems is likely similar although pricing
for the Grignard Pure unit has not yet been released.
• Climate Comfort Technologies (CCT) performed a demonstration for NJ TRANSIT highlighting system operation on June 2, 2020. The unit operates by generating ions and hydroxyl radicals and introducing them via the HVAC system into the occupied space of the bus. Ion concentrations were measured by CCT and a CCT report was supplied to NJ TRANSIT. Rutgers followed up with CCT on July 14, 2020 in which a number of concerns were discussed. The interview mainly focused on 1) is the device emitting things into the air that are unhealthy to breath? Such as reactive oxygen species and radical hydroxyls and 2) if not then do you have enough time to kill in the air stream? Other topics included biological testing, disinfection concertation for surfaces versus air, right concentration to kill on surfaces within the air stream, discussion about use while occupied, and other items.
o CCT responded on July 30, 2020 with a 3-page memo responding to the potential concerns raised during the earlier discussion ultimately stating “Our products are producing positive and negative ions which when they surround microorganisms, they bond and create hydroxyls with a life span of 50-100 milliseconds. The chemistry has demonstrated ionization and the working mechanism of hydroxyls is effective and the toxicology side (Odorox GLP study) demonstrated hydroxyls are harmless to people animals and plants. I hope to find other studies to support our position, but at this point I have not found any to say otherwise, but I would welcome any information you feel relevant.”94
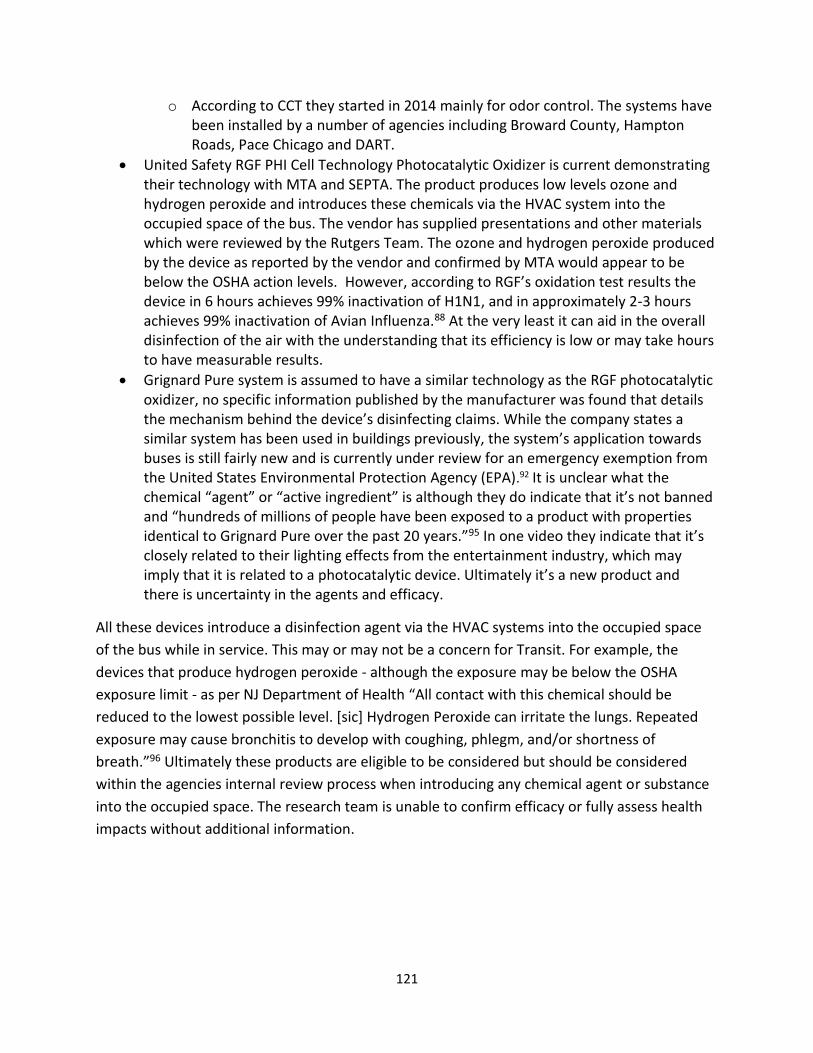
121
o According to CCT they started in 2014 mainly for odor control. The systems have been installed by a number of agencies including Broward County, Hampton Roads, Pace Chicago and DART.
• United Safety RGF PHI Cell Technology Photocatalytic Oxidizer is current demonstrating their technology with MTA and SEPTA. The product produces low levels ozone and hydrogen peroxide and introduces these chemicals via the HVAC system into the occupied space of the bus. The vendor has supplied presentations and other materials which were reviewed by the Rutgers Team. The ozone and hydrogen peroxide produced by the device as reported by the vendor and confirmed by MTA would appear to be below the OSHA action levels. However, according to RGF’s oxidation test results the device in 6 hours achieves 99% inactivation of H1N1, and in approximately 2-3 hours achieves 99% inactivation of Avian Influenza.88 At the very least it can aid in the overall disinfection of the air with the understanding that its efficiency is low or may take hours to have measurable results.
• Grignard Pure system is assumed to have a similar technology as the RGF photocatalytic oxidizer, no specific information published by the manufacturer was found that details the mechanism behind the device’s disinfecting claims. While the company states a similar system has been used in buildings previously, the system’s application towards buses is still fairly new and is currently under review for an emergency exemption from the United States Environmental Protection Agency (EPA).92 It is unclear what the chemical “agent” or “active ingredient” is although they do indicate that it’s not banned and “hundreds of millions of people have been exposed to a product with properties identical to Grignard Pure over the past 20 years.”95 In one video they indicate that it’s closely related to their lighting effects from the entertainment industry, which may imply that it is related to a photocatalytic device. Ultimately it’s a new product and there is uncertainty in the agents and efficacy.
All these devices introduce a disinfection agent via the HVAC systems into the occupied space
of the bus while in service. This may or may not be a concern for Transit. For example, the
devices that produce hydrogen peroxide - although the exposure may be below the OSHA
exposure limit - as per NJ Department of Health “All contact with this chemical should be
reduced to the lowest possible level. [sic] Hydrogen Peroxide can irritate the lungs. Repeated
exposure may cause bronchitis to develop with coughing, phlegm, and/or shortness of
breath.”96 Ultimately these products are eligible to be considered but should be considered
within the agencies internal review process when introducing any chemical agent or substance
into the occupied space. The research team is unable to confirm efficacy or fully assess health
impacts without additional information.
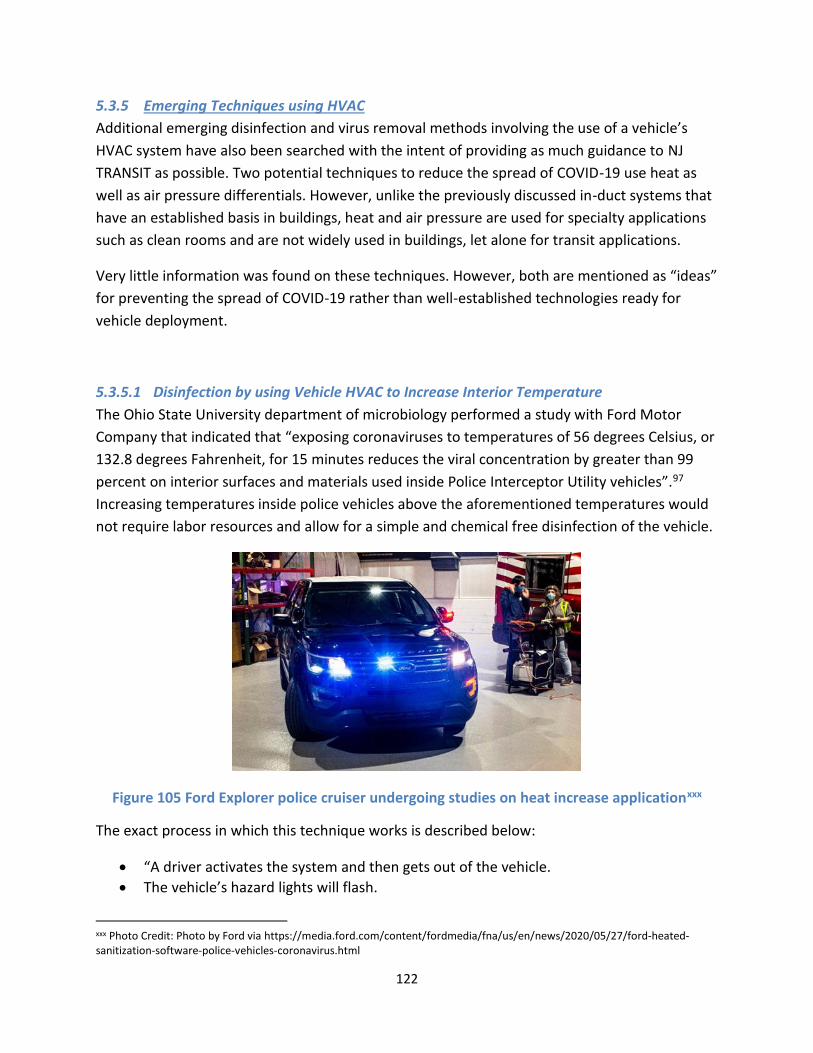
122
5.3.5 Emerging Techniques using HVAC
Additional emerging disinfection and virus removal methods involving the use of a vehicle’s
HVAC system have also been searched with the intent of providing as much guidance to NJ
TRANSIT as possible. Two potential techniques to reduce the spread of COVID-19 use heat as
well as air pressure differentials. However, unlike the previously discussed in-duct systems that
have an established basis in buildings, heat and air pressure are used for specialty applications
such as clean rooms and are not widely used in buildings, let alone for transit applications.
Very little information was found on these techniques. However, both are mentioned as “ideas”
for preventing the spread of COVID-19 rather than well-established technologies ready for
vehicle deployment.
5.3.5.1 Disinfection by using Vehicle HVAC to Increase Interior Temperature
The Ohio State University department of microbiology performed a study with Ford Motor
Company that indicated that “exposing coronaviruses to temperatures of 56 degrees Celsius, or
132.8 degrees Fahrenheit, for 15 minutes reduces the viral concentration by greater than 99
percent on interior surfaces and materials used inside Police Interceptor Utility vehicles”.97
Increasing temperatures inside police vehicles above the aforementioned temperatures would
not require labor resources and allow for a simple and chemical free disinfection of the vehicle.
Figure 105 Ford Explorer police cruiser undergoing studies on heat increase applicationxxx
The exact process in which this technique works is described below:
• “A driver activates the system and then gets out of the vehicle.
• The vehicle’s hazard lights will flash.
xxx Photo Credit: Photo by Ford via https://media.ford.com/content/fordmedia/fna/us/en/news/2020/05/27/ford-heated-sanitization-software-police-vehicles-coronavirus.html
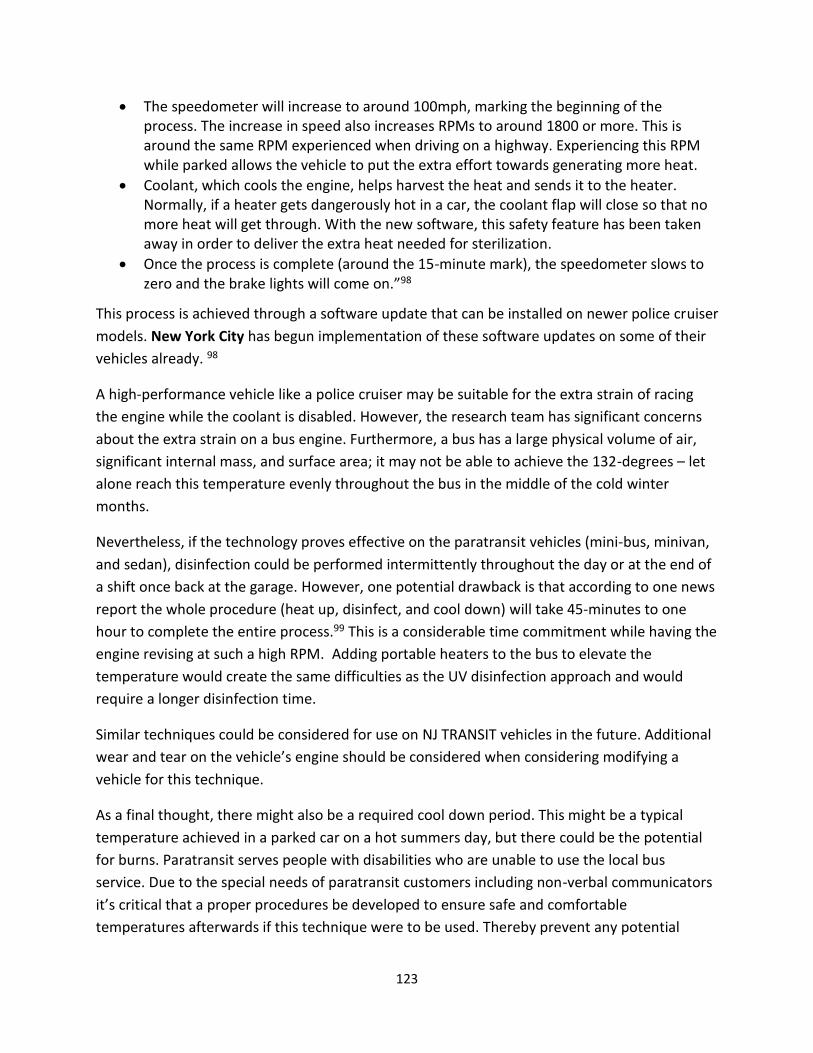
123
• The speedometer will increase to around 100mph, marking the beginning of the process. The increase in speed also increases RPMs to around 1800 or more. This is around the same RPM experienced when driving on a highway. Experiencing this RPM while parked allows the vehicle to put the extra effort towards generating more heat.
• Coolant, which cools the engine, helps harvest the heat and sends it to the heater. Normally, if a heater gets dangerously hot in a car, the coolant flap will close so that no more heat will get through. With the new software, this safety feature has been taken away in order to deliver the extra heat needed for sterilization.
• Once the process is complete (around the 15-minute mark), the speedometer slows to zero and the brake lights will come on.”98
This process is achieved through a software update that can be installed on newer police cruiser
models. New York City has begun implementation of these software updates on some of their
vehicles already. 98
A high-performance vehicle like a police cruiser may be suitable for the extra strain of racing
the engine while the coolant is disabled. However, the research team has significant concerns
about the extra strain on a bus engine. Furthermore, a bus has a large physical volume of air,
significant internal mass, and surface area; it may not be able to achieve the 132-degrees – let
alone reach this temperature evenly throughout the bus in the middle of the cold winter
months.
Nevertheless, if the technology proves effective on the paratransit vehicles (mini-bus, minivan,
and sedan), disinfection could be performed intermittently throughout the day or at the end of
a shift once back at the garage. However, one potential drawback is that according to one news
report the whole procedure (heat up, disinfect, and cool down) will take 45-minutes to one
hour to complete the entire process.99 This is a considerable time commitment while having the
engine revising at such a high RPM. Adding portable heaters to the bus to elevate the
temperature would create the same difficulties as the UV disinfection approach and would
require a longer disinfection time.
Similar techniques could be considered for use on NJ TRANSIT vehicles in the future. Additional
wear and tear on the vehicle’s engine should be considered when considering modifying a
vehicle for this technique.
As a final thought, there might also be a required cool down period. This might be a typical
temperature achieved in a parked car on a hot summers day, but there could be the potential
for burns. Paratransit serves people with disabilities who are unable to use the local bus
service. Due to the special needs of paratransit customers including non-verbal communicators
it’s critical that a proper procedures be developed to ensure safe and comfortable
temperatures afterwards if this technique were to be used. Thereby prevent any potential
124
burns or other temperature related concerns and meeting NJ TRANSIT’s mission to help safely
serve these customers.
5.3.5.2 Modifying Vehicle Airflow to Increase Driver Safety
Another HVAC related modification manipulates the air flow between the passenger and driver
zones within a vehicle to help protect drivers. The City of Detroit worked with engineers at
Honda on a system that would modify the HVAC systems on their Honda Odyssey minivans,
which are used to transport healthcare workers as well as potentially infected passengers.
Figure 106 Modified Honda Odyssey with view of interior polycarbonate barrierxxxi
The modification involves two parts to the process. In the first step, as shown in Figure 106 a
sealed polycarbonate barrier would be installed between the front seat compartment and rear
seating area (as shown in the figure above). The second half of this process involved
modification of the ventilation system to provide a more positive pressure zone in the front
driver area and a more negative air pressure to the passenger zone. This modification to the
ventilation system would reduce potential for droplet infection migration by creating an air
pressure differential which would allow the air passing through the vehicle to exhaust out the
vents in the rear of the vehicle without ever be recycled back to the driver zone. 100
xxxi Photo Credit: Photo by Honda via prnewire.com
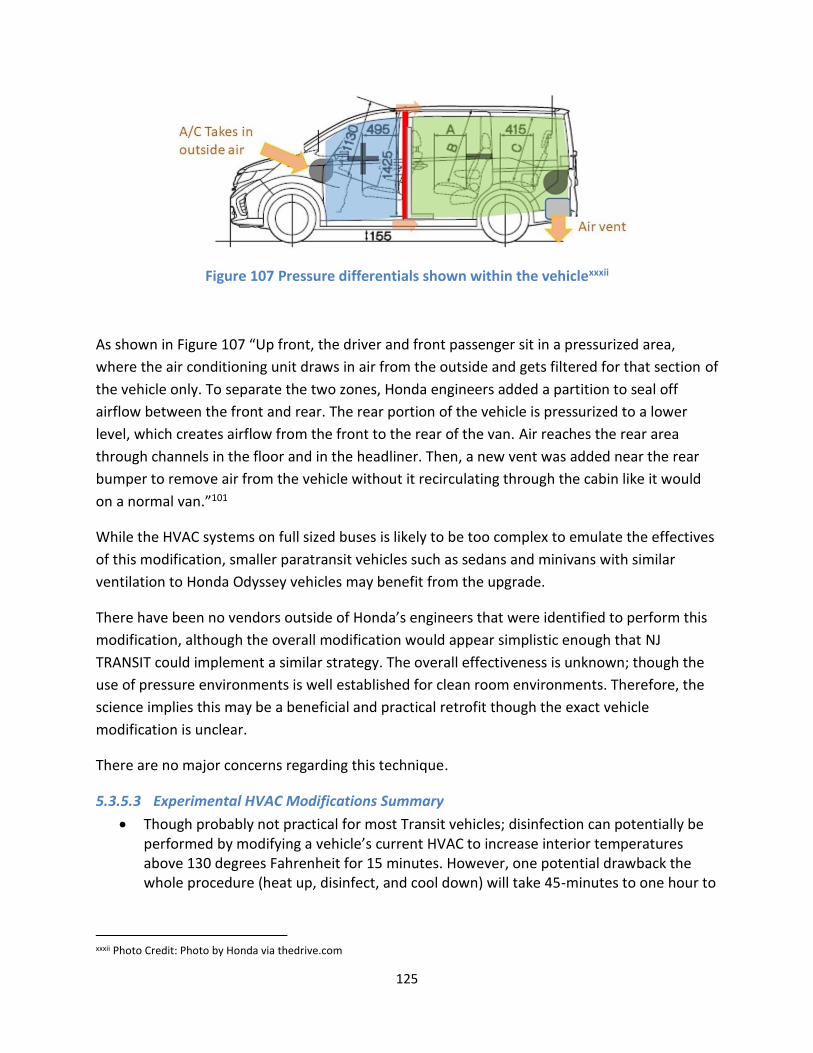
125
Figure 107 Pressure differentials shown within the vehiclexxxii
As shown in Figure 107 “Up front, the driver and front passenger sit in a pressurized area,
where the air conditioning unit draws in air from the outside and gets filtered for that section of
the vehicle only. To separate the two zones, Honda engineers added a partition to seal off
airflow between the front and rear. The rear portion of the vehicle is pressurized to a lower
level, which creates airflow from the front to the rear of the van. Air reaches the rear area
through channels in the floor and in the headliner. Then, a new vent was added near the rear
bumper to remove air from the vehicle without it recirculating through the cabin like it would
on a normal van.”101
While the HVAC systems on full sized buses is likely to be too complex to emulate the effectives
of this modification, smaller paratransit vehicles such as sedans and minivans with similar
ventilation to Honda Odyssey vehicles may benefit from the upgrade.
There have been no vendors outside of Honda’s engineers that were identified to perform this
modification, although the overall modification would appear simplistic enough that NJ
TRANSIT could implement a similar strategy. The overall effectiveness is unknown; though the
use of pressure environments is well established for clean room environments. Therefore, the
science implies this may be a beneficial and practical retrofit though the exact vehicle
modification is unclear.
There are no major concerns regarding this technique.
5.3.5.3 Experimental HVAC Modifications Summary
• Though probably not practical for most Transit vehicles; disinfection can potentially be performed by modifying a vehicle’s current HVAC to increase interior temperatures above 130 degrees Fahrenheit for 15 minutes. However, one potential drawback the whole procedure (heat up, disinfect, and cool down) will take 45-minutes to one hour to
xxxii Photo Credit: Photo by Honda via thedrive.com
126
complete. Additional wear and tear on the engine as well as allowing for proper cooling of the vehicle should be considered.
• Modifying the airflow in a vehicle using polycarbonate barriers alongside modification of the air pressure differentials within the driver and passenger zones can help move potentially contaminated air from passengers away from the driver.
• These airflow modifications have only been performed on Honda Odyssey minivans used in Detroit to transport passengers, but could potentially be emulated on other transit sedans and minivans outside of the Odyssey car model as well.
127
5.3.6 Cost Summary for In-Duct Disinfection of Air
The NJ TRANSIT fleet is made up of approximately 1600 MCI, 1325 NABI, 85 Articulated, and
500 Minibuses. It is unlikely the minivans and sedans can be retrofitted with an in-duct device
and have been omitted from the capital cost estimate. However, for full fleet wide deployment
as an initial estimate of the in-duct UVC might cost between $10.5M-16.3M, in duct plasma
$7M, and in-duct PHI $12.3M.
[3010 MCI + NABI + Artic fleet * $5000 for in-duct UVC device (split rooftop system) + ($2500
single bulb UVC * 500 Mini-bus) = $16.3M capital cost]
[3510 MCI + NABI + Artic + Mini-bus fleet * $3000 for in-duct UVC device (lower end of range) =
$10.5M capital cost]
[3510 MCI + NABI + Artic + Mini-bus fleet * $2000 for in-duct plasma device = $7M capital cost]
[3510 MCI + NABI + Artic + Mini-bus fleet * $3500 for in-duct PHI device = $12.3M capital cost]
As per the previously discussed Federal Transit Administration (FTA) funded study by the
Transportation Research Board (TRB) “Ultraviolet Germicidal Irradiation for Transit Buses”
Transit IDEA project #53 of 14 Houston Metropolitan Transit Authority buses
• “The UVGI System in combination with the Reusable Electrostatic Air Filters allowed for
a new labor saving method of cleaning evaporators without chemicals, merely by using
a vacuum. Evaporator cleaning was reduced to 10 minutes labor time.
• By using the UVGI System and Reusable Electrostatic Air Filters, maintenance cost
savings identified are estimated to be approximately $129,000 per year, per 100 buses.
[i.e. $1,290 per bus per year] At an estimated cost of $2,100 per UVGI system, that
would provide a return on investment in about 18 months.”84
It’s likely the return on investment (ROI) may be longer than stated for the NABI due to the split
rooftop configuration requiring “two” UVC devices. However, based on the FTA report the ROI
would still likely be less than 4 years. As confirmation, the research team also discussed one in-
duct UVC vendors claim of $2,200 savings per year.102 The majority of the vendors estimated
savings was from 6.25 gallons of diesel fuel saved per day for 200 days resulting in $1,250 saved
per bus per year. The balance of the estimate consisted of $250 for 1-day drive absenteeism,
$350 for 1-day driver replacement (time and a half overtime pay), $300 coil cleaning labor, and
$40 coil cleaning solution.102
The vendor approach differs significantly from the TRB Transit 53 study – specifically 1-day
driver absenteeism/replacement versus 1-day bus out-of-service time respectively.
Furthermore, the FTA study only estimated 0.4 gallons instead of 6.25 gallons of fuel saved per
128
day. Though the evaporator coil cleaning and solution were roughly in agreement at $400 and
$40 respectively per bus. By taking the most conservative estimate of 0.4 gallons of diesel per
day at $2.29/gallon and removing evaporator coil labor this results in a $334 savings per year.
[(0.4 gallons * $2.29 per gallon of diesel) * 365 operating days per year = $334 saved per year]
• As per the previously discussed Federal Transit Administration (FTA) funded study the
ROI for an in-duct UVC device is estimated at $1,290 annually
• Estimated $334 saving per year per in-duct UVC device is likely on the low end of the
actual savings but still represents a measurable and significant ROI.
5.3.6.1 Bulb Replacement and Life-Cycle Cost
If NJ TRANSIT were to adopt an in-duct UVC device further investigation is needed to fully
understand the life cycle costs. After the initial purchase, the most substantial life cycle cost
beyond device replacement would be bulb replacement.
In-duct UVC devices are generally designed to be “on” when the bus is running. However, since
the coils is where moisture condenses it’s a prime location for mold and biofilm to form, there
is an argument to keep the UVC device on even when the bus is off to minimize growth.
However, for the purposes of this analysis it is assumed that the UVC devices will by synced
with the bus and will therefore run for 2 shifts at 16-hours per day.
As per Phillips website, a typical UVC Mercury bulb has a 9000 hour useful operational life.103
However, one manufacturer 8000-10,000 hour (consistent with Phillips data) as well as 16,000
hour bulb.104 Based on these two bulb lives where they are in use for 365 operating days per
year for 16-hours per day the bulbs should last between 1.7 to 2.7 years.
[10,000 hours / 16 hours per day / 365 days per year = 1.7 years between each bulb
replacement]
[16,000 hours / 16 hours per day / 365 days per year = 2.7 years between each bulb
replacement]
Most buses will Replacement bulbs are estimated at approximately $150 per bulb. The total
cost to replace all of the bulbs is approximately $978k every 1.7 to 2.7 years.
[3010 MCI + NABI + Artic fleet * 2 bulbs * $150 for in-duct UVC device (split rooftop system) +
($150 single bulb UVC * 500 Mini-bus) = $978k replacement cost]
Therefore, the annual average bulb replacement cost is approximately $469k per on average
fleet wide.
129
[($978k/ 1.7 years + $978 / 2.7 years) / 2 = $575k + $362k per year / 2 = 469k per year on
average]
With a $16.3M initial capital expenditure and an estimated $469k annual bulb replacement cost
compared to the FTA Transit #53 report’s estimated $1,290 annual maintenance savings per
year the ROI breakeven point is 4 years. Using the research teams more conservative estimate
of $334 annual saving per bus the ROI breakeven point is 23 years. Whether it’s 4 years based
on the FTA report or 23 years based on a more conservative estimate there is a measurable and
overall positive ROI.
[$16,300,000 capital cost / ($469,000 annualize bulb replacement cost – ($1,290 annual
maintenance savings per year *3510 bus fleet)) = 4 years ROI breakeven point]
[$16,300,000 capital cost / ($469,000 annualize bulb replacement cost – ($334 annual
fuel/maintenance savings per year *3510 bus fleet)) = 23 years ROI breakeven point]
• In-duct UVC bulbs should last between 1.7 to 2.7 years
• Approximately $469k will be required on average per year to replace all in-duct UVC bulbs
• Estimated 4 years ROI based on the FTA report or 23 years ROI based on the more conservative estimate; there is a measurable and overall positive ROI.
130
6 CONCLUSIONS
The surface disinfection efforts of this research project were largely based on small portable UVC source characteristics - independent of a specific vendor. It’s important to note that each product will have significantly different performance and size. For example, each UVC device may have different sized bulbs or may require 3, 4 or even 8 bulbs – therefore the conclusions do not represent “absolutes” but instead are intended to provide broad guidance that can be used to help guide decision makers. As such, the quantifiable values presented in the conclusions are based on a two “representative” UVC sources – one Mercury and one pulsed Xenon. As such the exact coverages, costs, labor etc. will vary however the overall intent of the finding remain unchanged.
A Summary of the Findings for Mercury Source UVC Disinfection of Surfaces Includes:
• The 40-ft bus four Mercury UVC sources model showed that 65.61% of visible surfaces
would receive a direct line of sight dosage. The measured values demonstrate the
models are very conservative as they do not estimate contribution from reflected light.
• The mini-bus three Mercury UVC sources model showed that 70.88% of visible surfaces
would receive a direct line of sight dosage.
• Shadowed areas, which could still receive some “indirect” light such as reflected dosage,
were field measured. Results imply that the true percentage of the bus receiving a kill
dosage is much higher than the model prediction.
• All except three (3) test mini-bus locations (back of the last row of seats, back of
wheelchair seatbelt, and the strap storage bag) received dosages in excess of the
established 25 uW/cm2 threshold required to achieve a 10.6 mJ/cm2 kill dosage in less
than seven minutes.
• All except six (6) test NABI locations received dosages in excess of the established 25
uW/cm2 threshold required to achieve a 10.6 mJ/cm2 kill dosage in less than seven
minutes.
• However, any gap in coverage of a critical or high touch surfaces like a seatbelt raises
overall efficacy concerns for UVC disinfection of surfaces.
• No light leakage was detected in the target wavelength (200-300 nm) for any
transparent surfaces (i.e. windows) during operation of the UVC sources.
A Summary of the Findings for Pulsed Xenon Source UVC Disinfection of Surfaces Includes:
• The model showed for three pulsed Xenon UVC sources the 40-ft bus that 53.72% of
visible surfaces would receive a direct line of sight dosage.
• The model showed for two pulsed Xenon UVC sources the mini-bus that 59.11% of
visible surfaces would receive a direct line of sight dosage.
131
• Overall, the pulsed unit produces a wider spectrum but is far less intense in the 254 nm
wavelength. The pulsed Xenon delivers a 60 ms dose roughly every 6 seconds which is
much less exposure time than the Mercury “continuous” wave source. However, the
wider range spectrum of the pulsed Xenon should be an advantage. Therefore, the
research team can’t calculate a direct efficacy comparison. That being said, the 254 nm
wavelength at 8-ft a 3.65 uW/cm2 per pulse dose was also measured with a 35 ms
integration time. With pulses occurring once every 6 seconds, that would be 1.1 mJ/cm2
delivered in 30 minutes versus the required 10.6 mJ/cm2 to achieve disinfection. Where
the 10.6 mJ/cm2 was identified earlier in this report as a reasonable yet conservative
dosage required to achieve kill.
• At least at the 254 wavelength a kill dosage does not appear to have been achieved. As
previously stated, the broader spectrum should contribute to the yet to be determined
efficacy impacts.
• Light leakage was observed in the 300-400 nm range creating a very small but
measurable potential risk to those around the bus, during a disinfection cycle.
Furthermore, peak intensities in the visible spectrum which can certainly be a visual
distraction for the NJ TRANSIT garage environment and a strobe distraction for bus
drivers in the garage.
General Observations for UVC Devices for Surface Disinfection:
• Different UVC disinfection devices basically use the same irradiance mechanisms but
with varying intensities and device characteristics. Some products have additional
features such as motion/occupancy sensors, timers, remote controls, UV sensors,
onboard computers/processors, etc.
• Many UVC devices identified weighed more than 100lbs. Although equipped with
wheels, the weight would limit usability and maneuverability while positioning and
carrying onto and off a bus, especially for buses with stairs, including the bi-level trains.
• Many portable units were identified that can likely be used in an inverted position - that
illuminate from above - simplify light distribution throughout the cabin and help ensure
broader coverage on surfaces.
• Only two vendors were identified that use pulsed Xenon technology. There are
conflicting claims regarding the efficacy of pulsed Xenon in comparison to constant on
Mercury UV bulbs.
• Handhelds may still be appropriate for smaller vehicles such as Sedans or for
operator/driver areas on the buses. A more detailed review and testing effort for
handhelds may be warranted to expand those tools for TRANSIT.
• A significant amount of literature exists regarding UV degradation of plastics. However,
a majority of past research focuses on wavelengths found in sunlight and not UVC. UV
132
over time will cause many plastics to chalk, become brittle, discolor, and crack as well as
cause loss of strength in fibers/fabrics.
• The biggest expectation of damage is discoloration. The discoloration represents the
first stage of micro-damage; not functional damage which will occur in the future, well
after the initial color change is observed.
• Prior to becoming so damaged that it’s brittle, plastic is more likely to experience
several of the micro-damages including an increased surface roughness. The roughness
may increase the cleaning difficulty and theoretically the effectiveness of disinfectants.
• If UVC were to be applied daily, there would be some level of damage to the plastics.
However, without accelerated UVC testing the research team cannot predict the
decrease in useful life of the interior finishes but it is highly likely that any damage will
be minor and cosmetic.
• Since the garage has electrical power as well as access to gasoline, using a generator or
even ceiling mounted cable reels would be practical and simplistic.
Cost Comparison of Chemical Application (Spray and air-dry), Mercury UVC, and Pulsed Xenon
UVC Observations:
• It’s estimated that for placement, operation, and removal of Mercury UVC sources it will
take:
o Mini-bus = setup 5 minutes + disinfection 7 minutes + take down 3 minutes and
o NABI = setup 7 minutes + disinfection 7 minutes + take down 5 minutes.
• It’s estimated that for placement, operation, and removal of pulsed Xenon UVC sources
it will take:
o Mini-bus = setup 3 minutes + disinfection 30 minutes + cool down 15 minutes
(can include take down and next bus setup)
o NABI = setup 5 minutes + disinfection 30 minutes + cool down 15 minutes (can
include take down 3 minutes and next bus setup)
• Fleet wide chemical disinfection cost scenario = 48 dedicated disinfection staff
• Fleet wide Mercury UVC disinfection cost scenario = 96 dedicated disinfection staff +
768 UVC sources (estimated at $3.4M)
• Fleet wide Pulsed Xenon UVC disinfection scenario = 80 dedicated disinfection staff +
1,680 UVC sources at an estimated at $11M
• Approximately $215k will be required every six years to replace all Mercury bulbs at 9,000 hours useful life per bulb
• Equipment cost for UVC far exceeds hand or backpack sprayers
• PPE supplies and other consumables assumed to be roughly comparable to similar items
from other scenarios
133
• The research team acknowledges that there would be some variability in the setup and
take down times from the field tests. However, this same variability would exist with the
chemical disinfectant application too.
• The spray and air-dry method is compliant with the manufacturer instructions, but NJ
TRANSIT may consider a weekly spray and wipe cleaning to perform a more thorough
cleaning and to remove any build-up.
• The research team was not able to identify any permanently retrofit efforts by other
agencies or companies at this time. However, permanently mounted built in UVC
disinfection is something that should be considered as a future requirement for next
generations of buses.
Efficacy being assumed to be roughly equivalent - the research team only envisions one
circumstance where the labor component would be less than chemical disinfection via spray
and air-dry procedures for fleet wide deployment- if the bus were to have permanently
mounted UVC disinfection installed. This is probably not practical as a retrofit. The research
team was unable to identify any permanent retrofit efforts for UV surface disinfection by other
agencies or companies at this time. However, this is something that could be considered as a
future requirement for the next generation of buses. In that scenario, more lights can be built-
in and evenly distribute irradiance throughout the cabin and even cover more shadowed areas.
The source may very well be small UVC LEDs throughout the bus shell, ceiling, and floor area.
The increased capital expense may even be recouped by labor savings.
Although UVC for surface disinfection is highly effective, there are a number pragmatic
considerations too. In comparison to chemical disinfection via spray and air-dry procedures,
using a portable UVC source does not appear to save labor time or cost. Nevertheless, portable
UVC can still be invaluable to supplement chemical disinfection for particular applications. For
example, UVC disinfection might be used to further minimize risk as a redundant safety
procedure, such as when its known that a bodily fluid was discharged (i.e. blood, vomit) or if an
employee is confirmed COVID-19 positive. Ultimately, in comparison to the simplicity and speed
of spraying an EPA List N approved chemical disinfectant, the time and logistics of portable UVC
deployment may not be practical for fleet wide deployment for surface disinfection but it can
still be a valuable tool. However, consideration may be given to including UVC lamps as built-in
features of future bus purchases.
134
A Summary of the Findings for HVAC Air and Filters for Disinfection of Airborne Materials
Include:
• Avoid using recirculation mode on HVAC system,
• Ensure HVAC dampers are set to maximize fresh air intake as conditions permit
• Approximate cost to upgrade the entire fleet with the power vented roof hatch kit would be approximately $3.5M requiring over 10,000 labor hours
• Due to the substantial labor and capital expense; after prioritizing other mitigation strategies and contingent upon air flow tests, the research team recommends the installation of additional fresh air makeup systems such as the power vented safety roof hatch kit, (each hatch = additional 350 CFM, $750, and 2 hours to install)
• The power vented roof hatch could be considered as a future requirement for next generations of buses.
• If system performance permits, the HVAC filter should be upgraded to MERV 13 or better, or the highest compatible filter at a minimum MERV 8, or even MERV 8 with antimicrobial
• More than likely, if the HVAC cannot be upgraded to MERV 13 or better either due to filter availability, lack of pressure testing data, or overall HVAC system inability; it’s highly-recommended to further investigate and incorporate an in-duct system such as in-duct UVC system along with at a minimum MERV 8 filter.
• At this time NFI has “Flow-rate tested and approved for MCI brand coach applications - will not harm fan motor” the MERV 8+antimicrobial; this would be an extra $670,578 per year beyond what NJ TRANSIT currently spends on filters. This retrofit would not require any additional labor if done with corresponding next filter replacement schedule.
• If possible to deploy MERV 8 uniformly across entire fleet the approximately might be in the range of an extra $162k per year for MERV 8 or $1.1M per year for the MERV 8+antimicrobial (in addition to current filter costs and with known errors in the estimate mentioned above). Although the antimicrobial efficacy remains uncertain the research team does not have any health concerns at this time and recommends adopting antimicrobial filters. However, future testing to determine the efficacy is needed. Furthermore, given the sizeable year-over-year cost, reevaluation is needed as NJ TRANSIT adopts other technologies which may negate the benefit from these antimicrobial layers.
• If MERV 13 or better is achievable, an in-duct system would still add value but might be considered recommended or supplemental.
• It is recommended that future bus designs accommodate MERV 13 or better filters.
A Summary of the Findings for HVAC In-Duct Disinfection Include:
• For in-duct UVC - without a single-pass kill dosage being delivered, it is unknown how repeated dosages of airborne materials at different time intervals will impact the UVC kill-dosage required. However, the science would suggest that some level of energy will
135
be delivered and some virus weakening or even disinfection will occur with each pass. With the estimated one air exchange per minute, this implies positive support that particles would be subject to multiple doses in a relatively short period of time. Even though there is an efficacy uncertainty, there has been support for in-duct UVC systems on buses.
• Some in-duct UVC products are more established while others are newer – some are custom while others are newer but have an established relationship with MCI/NABI. With the limited information available, no features on any of the products standout nor give any product a distinct advantage over the others.
• For Ion (plasma) generators there are many unknowns and many possible pathways to negative health outcomes. Conversely, it’s equally possible that it will or will not generated high enough ion concentrations in the bus to be effective, or that it could be only marginally effective. However, this technology does have the potential to disinfect, especially in a closed environment within the duct. The research team is unable to confirm efficacy or fully assess health impacts without additional information.
• Photocatalytic Oxidizer (PCO) and similar technologies are too new for complete air disinfection but may support or be used in conjunction with other technologies. The surface generation nature of the species and the high reactivity/short lived nature of these species means they present much less a health risk than the plasma source which is designed to push ions into the bus environment. Further identification and quantitation of the reactive species would need to be done before efficacy and possible health risks could be described in greater detail.
A Summary of the Findings for HVAC In-Duct Costs Include:
• Full fleet wide deployment might cost between $10.5M-16.3M for in-duct UVC, in duct
plasma $7M, and in-duct PHI $12.3M.
• As per the previously discussed Federal Transit Administration (FTA) funded study the
return on investment for an in-duct UVC device is estimated at $1,290 annually
• Estimated $334 saving per year per in-duct UVC device is likely on the low end of the
actual savings but still represents a measurable and significant return on investment.
• In-duct UVC bulbs should last between 1.7 to 2.7 years
• Approximately $469k will be required on average per year to replace all in-duct UVC
bulbs
• Estimated 4 years ROI based on the FTA report or 23 years ROI based on the more
conservative estimate; there is a measurable and overall positive return on investment.
Emerging Technologies Observations Include:
• Though probably not practical for most Transit vehicles, disinfection can potentially be performed by modifying a vehicle’s current HVAC to increase interior temperatures above 130 degrees Fahrenheit for 15 minutes. Additional wear and tear on the engine as well as allowing for proper cooling of the vehicle should be considered.
136
• Modifying the airflow in a vehicle using polycarbonate barriers alongside modification of the air pressure differentials within the driver and passenger zones can help move potentially contaminated air from passengers away from the driver.
• These airflow modifications have only been performed on Honda Odyssey minivans used in Detroit to transport passengers, but could potentially be emulated on other transit sedans and minivans outside of the Odyssey car model as well.
The use of in-duct disinfection technology while the bus is occupied, and in-service is very
appealing to help protect passengers from contracting SARS-CoV-2 (COVID-19) from a
passenger that is exhaling virus particles. Such systems may offer continuous disinfection
activity. This is a different problem and solution set than surface disinfection systems discussed
in prior sections of this report that are only effective well after a virus particle is introduced to
the vehicle by customer or operator.
However, each in-duct technology discussed in the previous sections of this report has an
efficacy or health concern that remains unclear. The research team believes that some products
are indeed effective in killing viruses. However, it’s uncertain how long it will take or how many
exposures to reduce concentrations significantly – i.e. minutes or even hours. Furthermore,
there is conflicting information on some technologies as well as lack of peer-reviewed studies
for these products in the NJ TRANSIT operating environment. Ultimately, disinfection that
occurs in the occupied space remains a challenge. The general rule that remains true is that if a
concentration is high enough to kill viruses it may also be harmful to occupants. On the other
hand, concentrations that don’t harm occupants may not be effective in killing the viruses in a
reasonable time to be effective.
While each air treatment technology has its own merits as a stand-alone system, certain
technologies will potentially work better in conjunction with each other or will be more
effective on specific vehicle types. For example, proper filtration is recommended in
conjunction with in-duct UVC bulbs in order to reduce an accumulation of dust and debris
which may build up over time and reduce the effectiveness of the UVC lamp output. A
minimum MERV 8 filter is recommended by ASHRAE to be used alongside in-duct UVC systems
for dust control.105 Technology readiness and the labor time to install some of these devices
fleet wide may take a year or more. Economics aside the practicality and speed unfortunately
becomes a driving consideration too; retrofit labor plans may become quickly obsolete if the
vehicle is to be retired in the near future.
The in-duct systems will cost between $7M-$16.3M for fleet wide deployment, representing a
substantial capital cost. Beyond COVID-19, filtration has a track record of removing particles
from the air which is beneficial for everyday dust irritants as well as harmful viruses. Likewise,
137
UVC has a proven track record of killing viruses and bacteria so the benefit extends beyond the
immediate pandemic. UVC is a well-established technology where the health exposure
concerns are well defined and can be measured and mitigated. Furthermore, DART has
deployed in-duct UVC since 2013 with no major logistics concerns. This is further supported by
recommendation from a 2009 Federal Transit Administration (FTA) funded study by the
Transportation Research Board (TRB) “Ultraviolet Germicidal Irradiation for Transit Buses”
Transit IDEA project #53. Furthermore, based on the FTA report the return on investment dues
to maintenance savings would likely be between 2 to 4 years depending on bus type. Estimated
4 years ROI based on the FTA report or 23 years ROI based on the more conservative estimate;
there is a measurable and overall positive return on investment. Whereas other in-duct
technologies have many unknowns and many possible pathways to negative health outcomes;
further identification and quantitation of the reactive species would need to be done before
efficacy and possible health risks could be described in greater detail. In-duct UVC is not the
cheapest option at approximately $16.3M but has a favorable potential breakeven ROI. Nor is it
without its own drawbacks but given the other technologies health and efficacy uncertainty the
research team recommends the in-duct UVC. With that said, the research team recommends
immediately focusing efforts to upgrade the filtration as well as conducting a pilot for in-duct
UVC systems with the intention of near-term fleet wide adoption would appear to be a
prudent, reasonable, and conservative approach.
138
6.1 Implementation and Next Steps
All Vehicles: Continue using an EPA List N approved chemical disinfectant following the manufacturer instructions. In comparison to chemical disinfection via spray and air-dry procedures, using portable UVC sources fleet wide does not appear to save labor time or cost. All Vehicles: Consider adopting a weekly spray and wipe cleaning to achieve a more thorough cleaning and to remove any residue build-up. Develop a nightly rotation schedule to minimize labor requirement throughout the week. All Vehicles: Review HVAC systems to ensure that recirculation mode on HVAC system is turned off and that HVAC dampers are set to maximize fresh air intake as conditions permit. All Vehicles but likely more appropriate for buses: Review filters and upgrade filters as appropriate, will need to conduct air flow testing to ensure the system is within design specification. The goal is to upgrade to MERV 13 or better, but MERV 8 or even MERV 8 with antimicrobial would add value. NFI antimicrobial product has been flow tested for MCI Coach buses. The cost will likely exceed $1.1M above what NJ TRANSIT is currently spending on filters.
All Vehicles: NJ TRANSIT should review the original design specification for the vehicles and identify the original HVAC air flow design requirements. This information will be needed to develop an air flow testing plan for the filter upgrades.
Bus Vehicles (NABI, MCI, and Mini-bus): Consider soliciting in-duct UVC vendors with a Request for Information (RFI) and/or conduct pilot testing on a few buses. The parent company of New Flyer (NABI) and MCI is NFI Group which has a product for MCI Coach buses. SanUVaire has a product that has been deployed by DART on NABI buses since 2013. There may be additional vendors and other factors to consider which is why the RFI process and pilot is recommended to develop the full approach, light leakage measurements, retrofit time, maintenance costs, and overall cost estimate.
All Vehicles: Alternatively, if a vehicle is nearing retirement given the capital investment, though less ideal, NJ TRANSIT may elect to forego the in-duct UVC retrofit and attempt to reduce exposure through mitigation controls. For example, strategies may include physical distancing, reduced vehicle capacity limits, mask requirements, route changes, additional disinfection throughout the day, and others.
Paratransit vehicles specifically sedan and minivan: Consider emerging technologies, such as reprograming HVAC system in the sedan for heat disinfection as well the airflow modification (barrier and extra vents) to create positive pressure environment in the minivans. Future Vehicles: NJ TRANSIT could develop a working group to review and provide recommendation and design review for future vehicles. Testing, modeling, and vetting vendor claims may be required.
139
7 FUTURE WORK In-duct UVC systems show promise. The research team recommends a pilot study be performed on select in-duct UVC systems. This study could be as simple as installation and demonstration i.e. working through the logistics for specific buses and fully documenting the retrofit requirements and installation process. However, it could also be a robust efficacy evaluation involving surrogates. For the latter, a testing plan would need to be developed and conducted to determine efficacy of the system. This effort could be laboratory or on-vehicle but a testing plan likely with Institution Biosafety Review Board review and approval would be required. Swab type testing could be used, but to quantify a reduction the environment would have to be controlled start to finish. This would certainly provide a higher level of confidence regarding energy delivered by the UVC in-duct system with each pass.
As part of the in-duct UVC pilot testing plan, the research team would also recommend testing for UV light leakage into the passenger area and confirm that no ozone is produced. No significant levels of ozone are expected based on the emitted wavelength of light these lamps, this would simply be an extra precautionary measure. Additionally, light leakage is not expected to be an issue with these systems. However, there is a potential for small amounts of light to leak from around the filter frame, through the filter media, air vents, and other areas depending on lamp placement. The visible blue light emitted is not UVC, UVC is invisible, the research team would need to verify light leakage through the use of a spectrometer.
The research team recommended the adoption of antimicrobial filters. Although efficacy remains uncertain the research team does not have any health concerns at this time. However, future testing to determine the efficacy would be prudent to fully justify the expenditure. Furthermore, given the sizeable year-over-year cost of approximately $940k just for the antimicrobial layer, reevaluation is needed as NJ TRANSIT adopts other technologies i.e. in-duct UVC which may negate the overall benefit from these antimicrobial filters.
Many in-duct air treatment systems, such as ionization and photocatalytic oxidation, may warrant further investigation. Development of a testing plan to provide guidance on how to properly evaluate each of these technologies for efficacy, characterization of species, as well as health safety is needed. This is a larger time consuming undertaking, therefore NJ TRANSIT may elect to forego this effort in order to expedite other well established and more readily deployable technologies. For the ion generator type devices, the research team recommends further testing to identify and quantify ions of the reactive species to resolve the uncertainty regarding possible health risks as well as testing to confirm the efficacy.
Upgrading air filters to a more efficient MERV ratings is a potential strategy when it comes to treating the air circulating through HVAC systems. Though, pressure drop and airflow restrictions in the HVAC system can damage systems and may prevent higher MERV rated filters from being used. Furthermore, filter performance changes over use i.e. clean filters perform differently than clogged filters. The research team recommends airflow testing before adopting a higher rated MERV filter.
140
Many technologies mentioned throughout this report can be used for light rail, commuter rail, facilities, and buildings. However, since this project focused on buses there might be other approaches for light rail and commuter rail. Furthermore, there are many more devices not included herein that can be used for buildings. For example, other disinfection technologies such as upper-room UVC are more common in buildings but just not practical for a bus. A deeper look into how these technologies could be used alongside similar systems already researched thoroughly in this report would be beneficial. The knowledge gained throughout this study would provide a starting point for future research. The research team recommends identifying additional technologies and to develop a detailed plan to effectively deploy disinfection technologies for NJ TRANSIT light rail, commuter rail, and facilities.
Air quality is an important consideration for long term outside air exchanges on buses. The terms fresh air and outside air are used interchangeably in this report. However, the reality is that outside air may contain contaminants that are not desired inside the bus. Buses that are in the suburbs would potentially pull in far less atmospheric contaminants than those commuting through congested areas. If NJ TRANSIT adopts the power vent roof hatch, the research team recommends a more detailed testing and monitoring effort may be warranted to verify that by drawing in more outside air, that exposure remains below required thresholds.
NJ TRANSIT will most certainly be looking to go through an extensive design review for future vehicles. The research team recommends developing a working group to review and provide recommendations. Furthermore, efforts may include testing and modeling to help validate vendor claims and recommendations. This group can also serve to provide ongoing support, quick commentary on new products, interpretation of news stories, and general engineering and public health guidance as the need arises. The specification may include:
• MERV 13 or better filters or even HEPA filtration
• Coupling technologies such as filters and UVC lights to increase contact time of particles which would also require a significantly different filter placement deeper in the system where UVC can illuminate without potential exposure
• Power vent roof hatch to increase ventilation
• Positive pressure environments or even possibly heat disinfection
• Built in permanently mounted UVC. Simple to use and could evenly distribute irradiance throughout the cabin and even cover more shadowed areas. The source may very well be small UVC LEDs throughout the bus shell, ceiling, and floor area. The increased capital expense may even be recouped by labor savings.
• Safety interlocks, occupancy sensors, and other safety devices
• Other new technologies
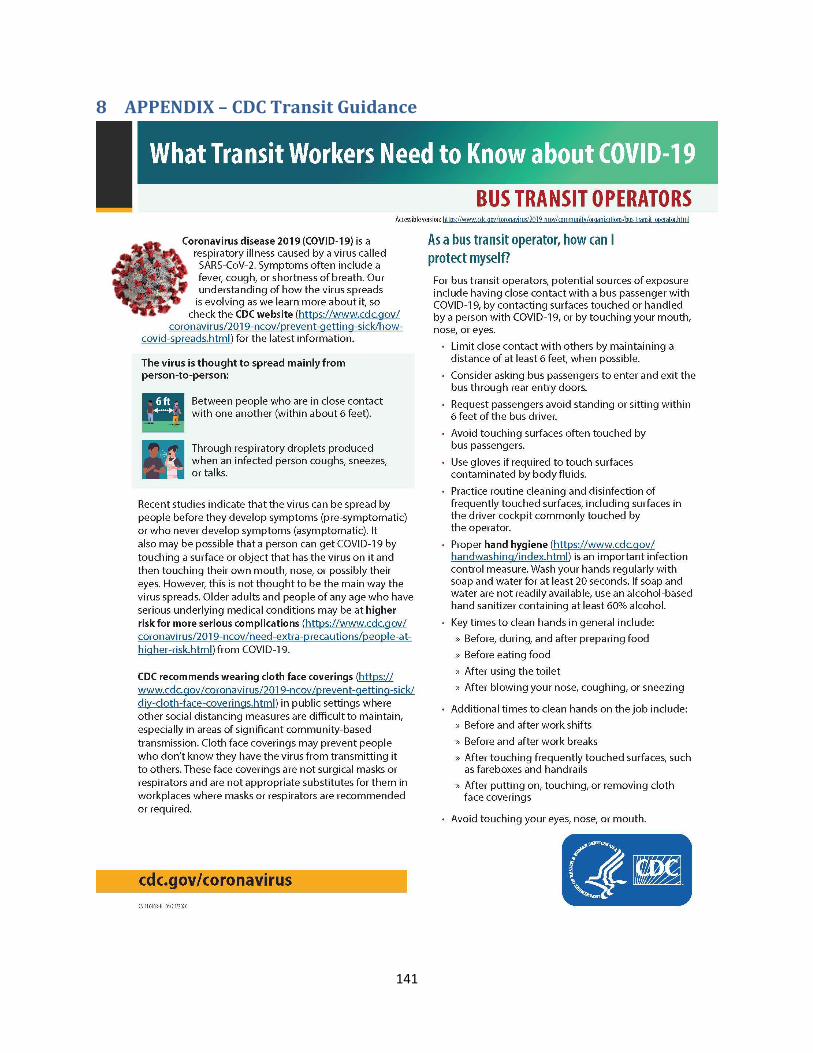
141
8 APPENDIX – CDC Transit Guidance
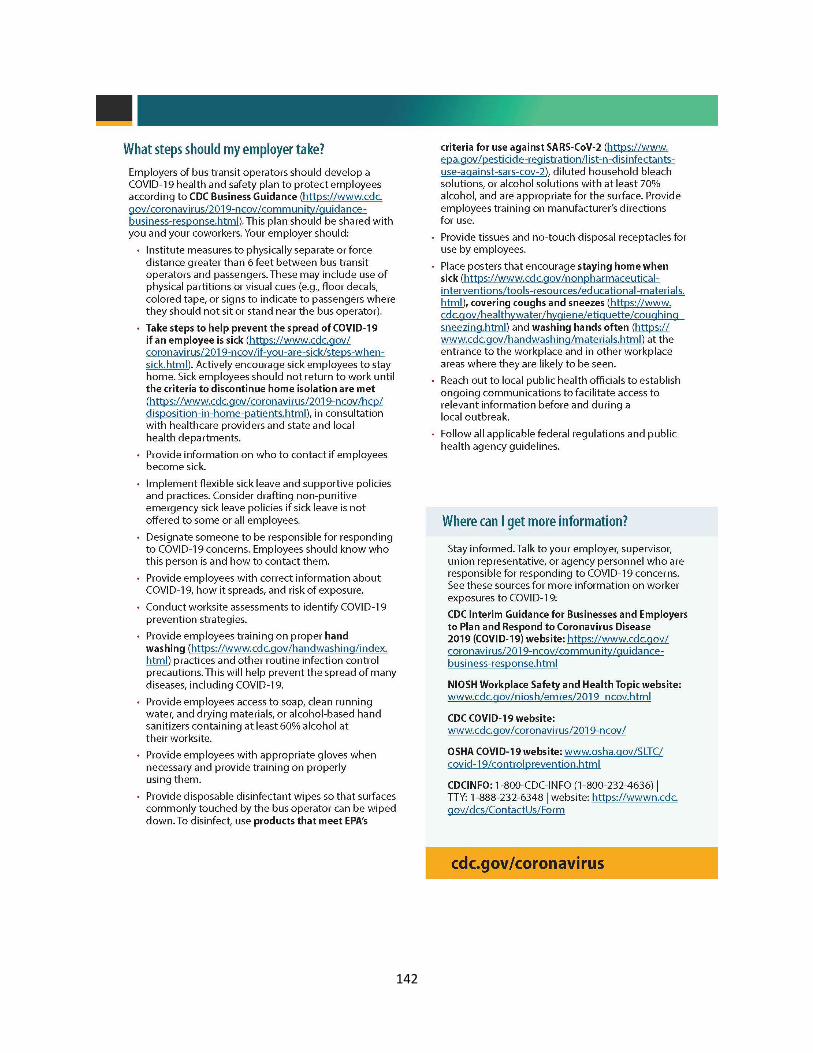
142
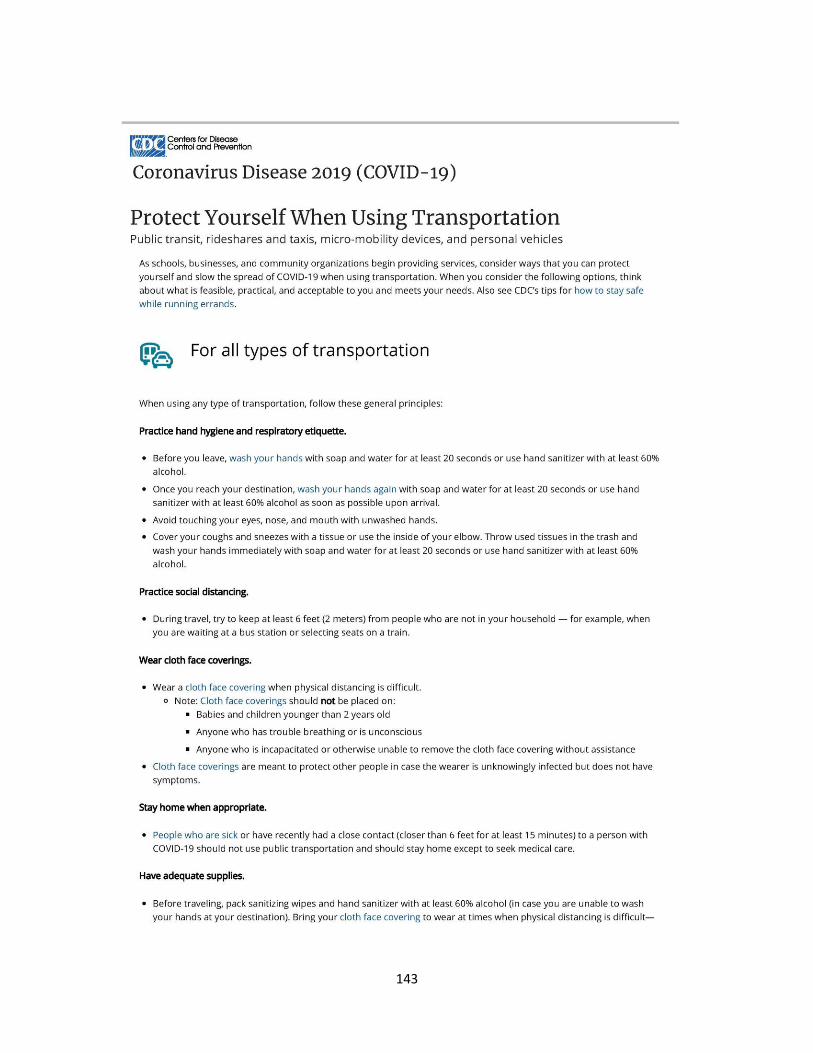
143
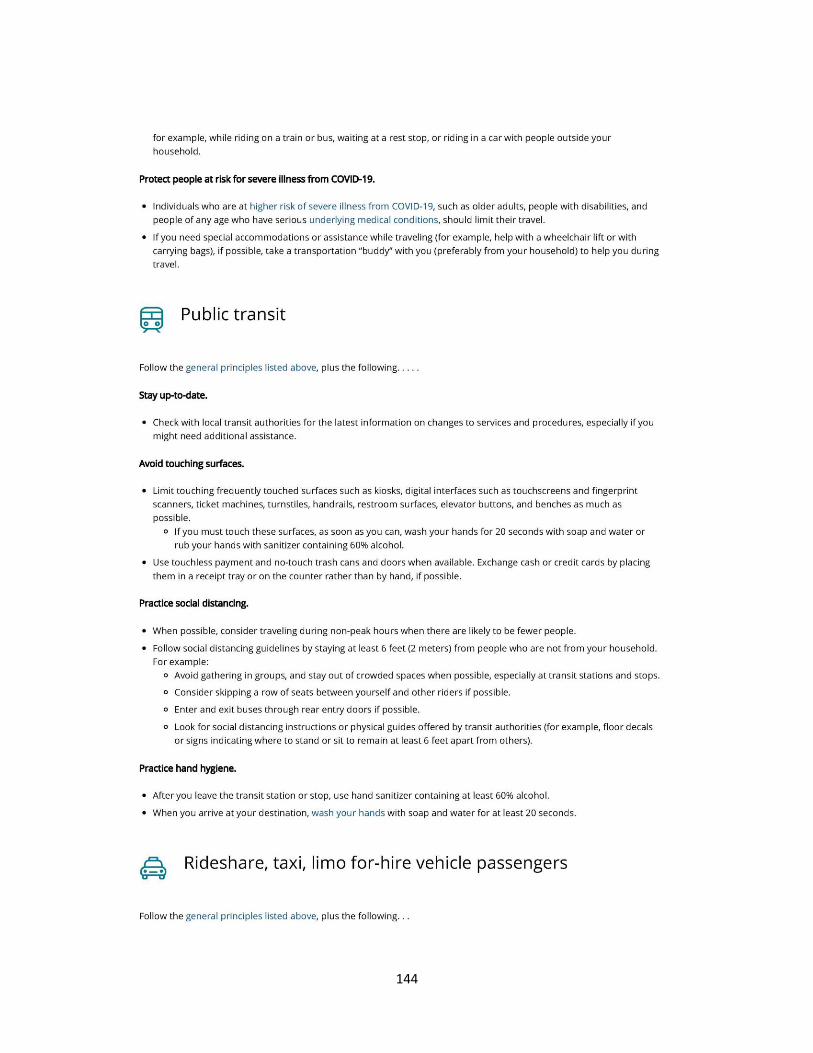
144
145
146
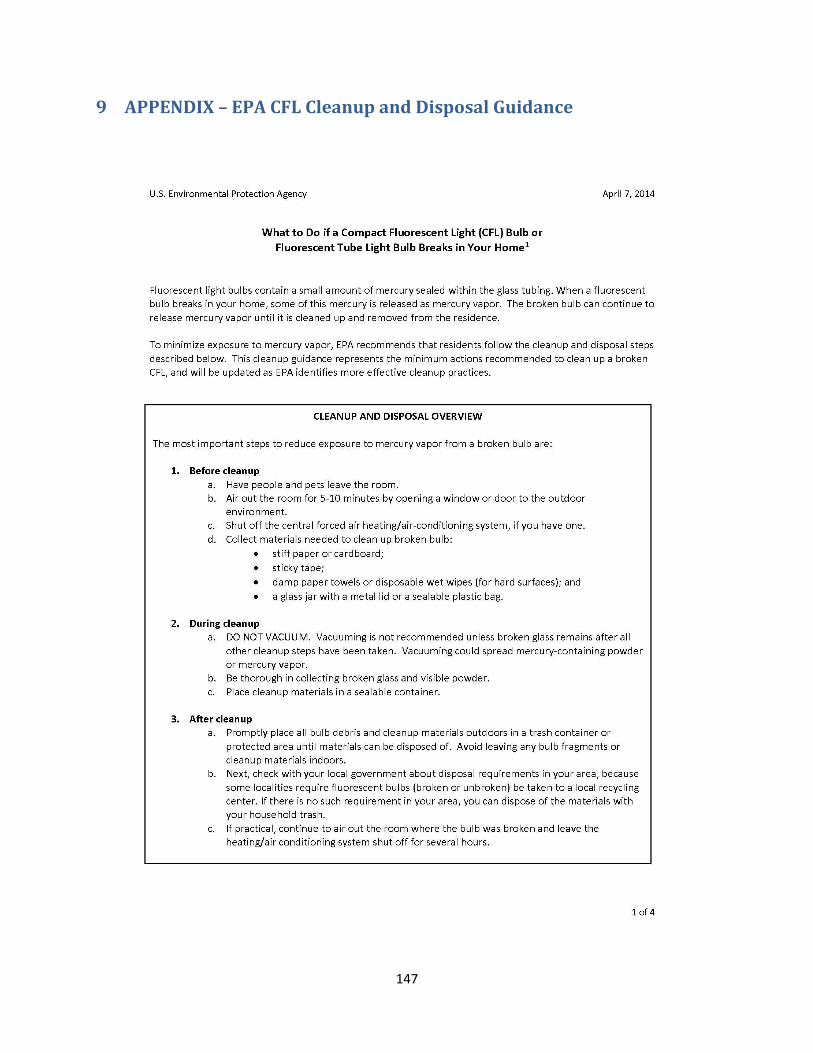
147
9 APPENDIX – EPA CFL Cleanup and Disposal Guidance
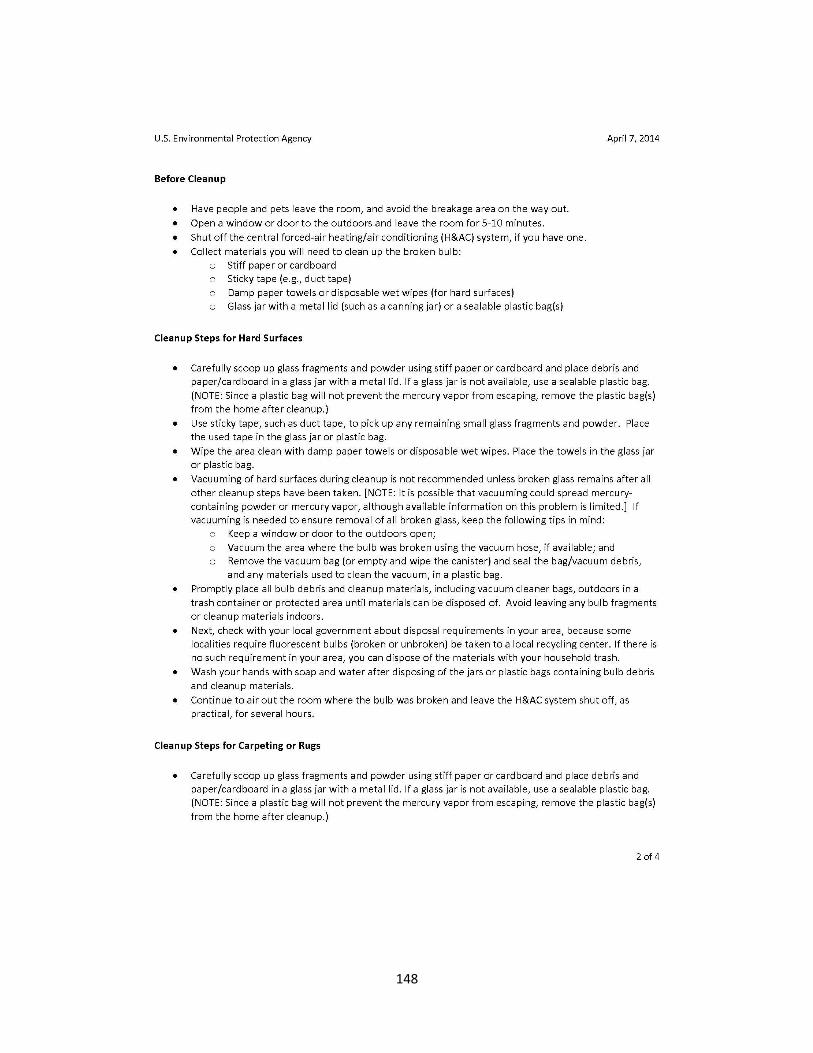
148
149
150
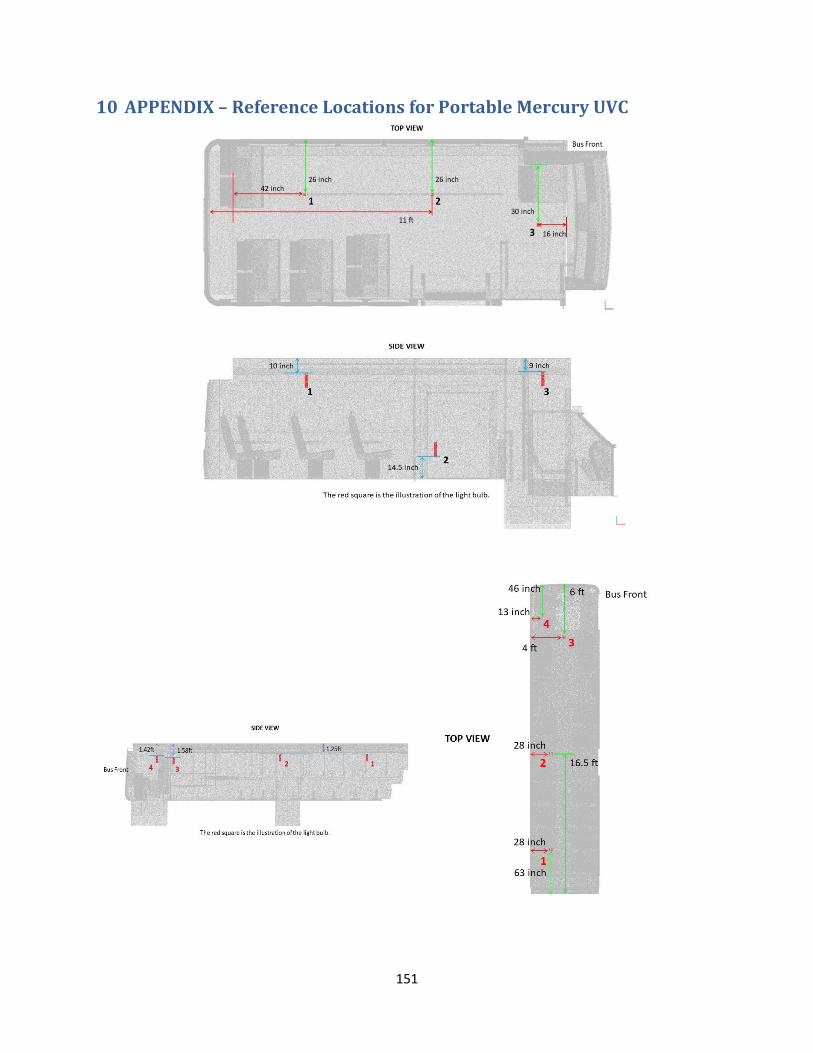
151
10 APPENDIX – Reference Locations for Portable Mercury UVC
152
1 Heßling M, Hönes K, Vatter P, Lingenfelder C. Ultraviolet irradiation doses for coronavirus inactivation – review
and analysis of coronavirus photoinactivation studies. GMS Hyg Infect Control. 2020;15:Doc08. DOI: 10.3205/dgkh000343, URN: urn:nbn:de:0183-dgkh0003436 2 Morin, R. (2020, April 30). Haircut? Sure. Flying? Maybe not. As states reopen, Americans more comfortable with small steps, survey shows. USA TODAY. https://www.usatoday.com/story/news/politics/2020/04/30/states-reopen-americans-more-comfortable-small-steps-survey/3052951001/ 3 Irwin, J. (2020, May 6). COVID-19 has consumers rethinking mobility options. WardsAuto. https://www.wardsauto.com/industry/covid-19-has-consumers-rethinking-mobility-options 4 Buonanno, M., Ponnaiya, B., Welch, D., Stanislauskas, M., Randers-Pehrson, G., Smilenov, L., Lowy, F. D., Owens, D. M., & Brenner, D. J. (2017, February 22). Germicidal Efficacy and Mammalian Skin Safety of 222-nm UV Light. Radiation research, 187(4), 483–491. https://doi.org/10.1667/RR0010CC.1 5 Woods, J. A., Evans, A., Forbes, P. D., Coates, P. J., Gardner, J., Valentine, R. M., Ibbotson, S. H., Ferguson, J., Fricker, C., & Moseley, H. (2015, May 31). The effect of 222-nm UVC phototesting on healthy volunteer skin: a pilot study. Photodermatology, photoimmunology & photomedicine, 31(3), 159–166. https://doi.org/10.1111/phpp.12156 6 Lam, K. (n.d.). Ozone Disinfection of SARS-Contaiminated Areas. Ozonetech. https://www.ozonetech.com/sites/default/files2/pdf/Ozone_disinfection_of_SARS_Contaminated_Areas.pdf 7United States Environmental Protection Agency, Press office. (2020, July 10). Trump EPA research studying the effectiveness of longer-lasting disinfectants [Press release]. https://www.epa.gov/newsreleases/trump-epa-research-studying-effectiveness-longer-lasting-disinfectants 8 Southeastern Pennsylvania Transportation Authority. (2020, April 2). Overview of SEPTA’s Service Adjustments and Enhanced Cleaning Efforts for COVID-19. SEPTA | Southeastern Pennsylvania Transportation Authority. https://www.septa.org/media/pdf/Response-to-TWU-Summary-of-SEPTA-Cleaning-Efforts-and-Service-Changes.pdf 9 Shattles, G., & Ball, M. (2020, May 1). DART Continues Focus on Cleaning as Riders Return to Work [Press release]. DART.org - Dallas Area Rapid Transit. https://www.dart.org/news/news.asp?ID=1497 10 The American Public Transportation Association. (2020, June 22). Cleaning and Disinfecting Transit Vehicles and Facilities During a Contagious Virus Pandemic. https://www.apta.com/wp-content/uploads/APTA_WP_Cleaning_and_Disinfecting_Transit_Vehicles_and_Facilities_During_a_Contagious_Virus_Pandemic_FINAL_6-22-2020.pdf 11 United States Environmental Protection Agency. (2020, July 16). Why aren’t ozone generators, UV lights, or air purifiers on list N? Can I use these or other pesticidal devices to kill the virus that causes COVID-19? https://www.epa.gov/coronavirus/why-arent-ozone-generators-uv-lights-or-air-purifiers-list-n-can-i-use-these-or-other 12 Akram, M., & Rubock, P. (2005). Working Safely with Ultraviolet Radiation Policy and Procedures. Columbia University Health Sciences Division. https://docplayer.net/20974978-Columbia-university-health-sciences-division.html 13 https://www.cdc.gov/niosh/docs/73-11009/pdf/73-11009A.pdf?id=10.26616/NIOSHPUB7311009 14 The International Commission on Non-Ionizing Radiation Protection. (2004, August). GUIDELINES ON LIMITS OF EXPOSURE TO ULTRAVIOLET RADIATION OF WAVELENGTHS BETWEEN 180 nm AND 400 nm (INCOHERENT OPTICAL RADIATION). https://www.icnirp.org/cms/upload/publications/ICNIRPUV2004.pdf 15 United States Environmental Protection Agency. (2020, April 16). Cleaning up a broken CFL. https://www.epa.gov/cfl/cleaning-broken-cfl#qi 16 Sampathkumar, P; Folkert, C; Barth, J; Nation, L; Benz, M; Hesse, A; Mielke, C; Zaveleta, K November 27, 2018 Trial of pulsed xenon ultraviolet disinfection to reduce Clostridioides difficile infection https://www.ajicjournal.org/article/S0196-6553(18)30948-9/fulltext 17 Interview with Jim Colantoni Chief Strategy Officer, Puro Lighting Inc. on 7/28/2020 18 Clordisys Solutions, Inc. (n.d.). The Lantern UV Disinfection System. https://www.clordisys.com/lantern.php
153
19 Puro Lighting. (2020). Helo F1 UV Disinfecting Fixture. Puro Lighting – Focused on Health and Wellness. https://purolighting.com/wp-content/uploads/2020/06/Puro-Helo-F1-Spec-Sheet.pdf 20 Puro Lighting. (2020). Sentry M1 Mobile UV Disinfecting Unit. Puro Lighting – Focused on Health and Wellness. https://purolighting.com/wp-content/uploads/2020/06/Puro-Sentry-M1-Spec-Sheet.pdf 21 Cello Lighting. (n.d.). Homepage. https://www.cellolighting.com/ 22 Dobmeier Janitor Supply, Inc. (n.d.). Diversey moonbeam 3 UVC disinfection device. Dobmeier Janitorial Cleaning Supplies Outlet. https://www.dobmeierjanitorialsupplies.com/Diversey-MoonBeam-3-UVC-Disinfection-Device-SKU-Diversey-MOONBEAM3 23 Rehabmart. (n.d.). Diversey moonbeam 3 UVC disinfection device. Rehabmart.com. https://www.rehabmart.com/product/diversey-moonbeam-3-uvc-disinfection-device-48794.html 24 Diversey, Inc. (n.d.). MoonBeam 3 Diversey. https://diversey.com/en/solutions/infection-prevention/uv-c-disinfection/moonbeam-3 25 ProLampSales. (n.d.). Sanidyne prime UVC portable - 143W UV output. https://www.prolampsales.com/products/sanidyne-prime-uv-portable-air-and-surface-sanitizers 26 MedicalExpo. (n.d.). Spectra 900 - UV disinfection system. https://www.medicalexpo.com/prod/spectra254/product-106567-700405.html 27 ClorDiSys Solutions, Inc. (n.d.). The TORCH Tower. https://www.clordisys.com/torch.php 28 Xenex Disinfection Services. (2017, December 19). LightStrike germ-zapping robots. https://www.xenex.com/our-solution/lightstrike/ 29 Stark, C. (2020, June 23). Interview. 30 Tru-D SmartUVC, LLC. (2019). Tru-D 2019 Brochure Pages. https://tru-d.com/wp-content/uploads/2019/02/Tru-D-2019-Brochure_Pages.pdf 31 Regency Lighting. (n.d.). Germicidal UVC mobile unit - American UV. https://shop.regencylighting.com/mrs33-8-auv.html 32American Ultraviolet. (n.d.). UV Germicidal Solutions. https://www.americanultraviolet.com/uv-germicidal-solutions/pharmacy-laboratory-mobile.cfml 33 Regency Lighting. (n.d.). Germicidal UVC mobile unit - American UV. https://shop.regencylighting.com/mrs45-12-auv.html 34 XtraLight. (2020). UV-C High Power Disinfection System Mobile. https://www.xtralight.com/wp-content/uploads/2020/04/UVC-Mobile-1.pdf 35 Ultraviolet Devices, Inc. (n.d.). Homepage. https://www.uvdi.com/ 36 Cello Lighting. (n.d.). Homepage. https://www.cellolighting.com/ 37D'Onfro, J. (2020, March 10). Robots to the rescue: How high-tech machines are being used to contain the Wuhan coronavirus. Forbes. https://www.forbes.com/sites/jilliandonfro/2020/02/02/robots-to-the-rescue-how-high-tech-machines-are-being-used-to-contain-the-wuhan-coronavirus/#21f109c41779 38 GermFalcon. (n.d.). Homepage. https://www.germfalcon.com/ 39 Kress, A. (2020, June 9). Honeywell to introduce fast, affordable ultraviolet cleaning system for airplane cabins [Press release]. Honeywell Aerospace. https://aerospace.honeywell.com/en/learn/about-us/press-release/2020/06/uv-cleaning-system-for-airplane-cabins 40 American Ultraviolet, A. (n.d.). UV Germicidal Solutions Frequently Asked Questions. https://www.americanultraviolet.com/uv-germicidal-solutions/faq-germicidal.cfml 41 United States Plastic Corp. (2009, December 11). What does UV radiation actually do to degrade plastics? https://www.usplastic.com/knowledgebase/article.aspx?contentkey=858 42 The Business and Institutional Furniture Manufacturers Association. (2014, October 6). Health Care Furniture Design - Guidelines for Cleanability. https://cdn.ymaws.com/www.bifma.org/resource/resmgr/standards/BIFMA_CleanGuide_6Oct14.pdf 43 Diversey. (2020, March 23). Damage to Common Healthcare Polymer Surfaces from UV-C Exposure. National Institute of Standards and Technology. https://www.nist.gov/system/files/documents/2020/03/23/Panel%20I%20Peter%20Teska%20presentation.pdf 44 Teska, P. (2020, June 9). Risks of surface damage to polymeric (Plastic) surfaces from UV-C exposure. UV Solutions. https://uvsolutionsmag.com/articles/2020/risks-of-surface-damage-to-polymeric-plastic-surfaces-from-uv-c-exposure/
154
45 Teska, P., Dayton, R., Li, X., Lamb, J., & Strader, P. (2020). Damage to common healthcare polymer surfaces from
UV exposure. Nano LIFE, 2050001. https://doi.org/10.1142/s1793984420500014 46 Kauffman, R. E. (2010). RP-1509 -- Study the Degradation of Typical HVAC Materials, Filters and Components Irradiated by UVC Energy. The American Society of Heating, Refrigerating and Air-Conditioning Engineers, 103. https://www.techstreet.com/standards/rp-1509-study-the-degradation-of-typical-hvac-materials-filters-and-components-irradiated-by-uvc-energy?product_id=1802175#jumps 47 Lemon Skies Disinfectant. (2020). Lemon Skies Disinfectant Label Instructions. Contract Cleaners Supply. https://www.ccssupply.com/lemon-skies-disinfectant/ 48 Egnatzky, J. (2020, July 24). Email exchange. 49 https://www.assets.signify.com/is/content/PhilipsLighting/Assets/philips-lighting/global/20200615-philips-uvc-lamps-disinfection.pdf 50 World Health Organization. (2020, July 9). Transmission of SARS-Cov-2: Implications for infection prevention precautions. https://www.who.int/news-room/commentaries/detail/transmission-of-sars-cov-2-implications-for-infection-prevention-precautions 51 Liu, J., Liao, X., Qian, S., Yuan, J., Wang, F., Liu, Y., Wang, Z., Wang, F. S., Liu, L., & Zhang, Z. (2020). Community Transmission of Severe Acute Respiratory Syndrome Coronavirus 2, Shenzhen, China, 2020. Emerging infectious diseases, 26(6), 1320–1323. https://doi.org/10.3201/eid2606.200239 52 World Health Organization. (2014, April). Infection prevention and control of epidemic- and pandemic-prone acute respiratory infections in health care. WHO Guidelines. https://apps.who.int/iris/bitstream/handle/10665/112656/9789241507134_eng.pdf;jsessionid=8B4995789385BD7AF287B9B0CCA59992?sequence=1 53 World Health Organization. (2020, July 9). Q&A: How is COVID-19 transmitted? https://www.who.int/news-room/q-a-detail/q-a-how-is-covid-19-transmitted 54 Centers for Disease Control and Prevention. (2020, May 27). Use of Masks to Help Slow the Spread of COVID-19. https://www.cdc.gov/coronavirus/2019-ncov/prevent-getting-sick/diy-cloth-face-coverings.html 55 Centers for Disease Control and Prevention. (2020, April 14). What Bus Transit Operators Need to Know About COVID-19. https://www.cdc.gov/coronavirus/2019-ncov/community/organizations/bus-transit-operator.html 56 Sustainable Bus. (2020, March 9). Coronavirus recommendations: How to use the bus A/C correctly. https://www.sustainable-bus.com/news/coronavirus-recommendations-how-to-use-the-bus-a-c-correctly/ 57 Carrier. (2020). Air Conditioning and COVID-19: Slowing the Spread. https://www.shareddocs.com/hvac/docs/1001/Public/02/COVID-19-WHITE-PAPER.pdf. 58 Centers for Disease Control and Prevention. (2020, May 26). Protect Yourself When Using Transportation. https://www.cdc.gov/coronavirus/2019-ncov/daily-life-coping/using-transportation.html#PublicTransit 59 Centers for Disease Control and Prevention. (2020, May 6). Interim Guidance for Businesses and Employers Responding to Coronavirus Disease 2019 (COVID-19). https://www.cdc.gov/coronavirus/2019-ncov/community/guidance-business-response.html 60 The American Society of Heating, Refrigerating and Air-Conditioning Engineers. (n.d.). Technical Resources - Transportation. ashrae.org. https://www.ashrae.org/technical-resources/transportation 61 NFI Parts. (2020, April 27). Clean and Protect Products. NFI Group. https://www.nfigroup.com/site-content/uploads/2020/04/Clean-and-Protect-Products-NFI-Parts-Rolls-Out-More-Options.pdf 62 The American Society of Heating, Refrigerating and Air-Conditioning Engineers. (2020, April 14). ASHRAE Position Document on Infectious Aerosols. https://www.ashrae.org/file%20library/about/position%20documents/pd_infectiousaerosols_2020.pdf 63 World Health Organization. (2020, May 10). Considerations for public health and social measures in the workplace in the context of COVID-19. https://www.who.int/publications/i/item/considerations-for-public-health-and-social-measures-in-the-workplace-in-the-context-of-covid-19 64 Lu, J., Gu, J., Li, K., Xu, C., Su, W., Lai, Z....Yang, Z. (2020). COVID-19 Outbreak Associated with Air Conditioning in Restaurant, Guangzhou, China, 2020. Emerging Infectious Diseases, 26(7), 1628-1631. https://dx.doi.org/10.3201/eid2607.200764. 65 National Air Filtration Association. (2020, April 2). COVID-19 (Corona virus) and air filtration frequently asked questions (FAQs). https://www.nafahq.org/covid-19-corona-virus-and-air-filtration-frequently-asked-questions-faqs/
155
66 MERV Rating Chart. (n.d.). Mechanical Reps Inc. https://www.mechreps.com/PDF/Merv_Rating_Chart.pdf 67 The American Society of Heating, Refrigerating and Air-Conditioning Engineers. (n.d.). Filtration and disinfection FAQ. https://www.ashrae.org/technical-resources/filtration-and-disinfection-faq 68 Brugato, T. (2020, July 1). Federal agencies highlight COVID-19 best practices for HVAC systems. Lexology. https://www.lexology.com/library/detail.aspx?g=f4024116-a128-4ff2-99d2-e7524721993d 69 Schoen, L. (2020, May). Guidance for Building Operations During the COVID-19 Pandemic. The American Society of Heating, Refrigerating and Air-Conditioning Engineers. https://www.ashrae.org/file%20library/technical%20resources/ashrae%20journal/2020journaldocuments/72-74_ieq_schoen.pdf 70 United States Environmental Protection Agency. (2020, May 5). What is a MERV rating? https://www.epa.gov/indoor-air-quality-iaq/what-merv-rating-1 71 https://sfamjournals.onlinelibrary.wiley.com/doi/full/10.1046/j.1365-2672.2003.01820.x 72 S. Warnes, Z. Little and W. Keevil, “Human Coronavirus 229E Remains Infectious on Common Touch Surface Materials,” American Society for Microbiology, pp. 1-10, 2015. https://mbio.asm.org/content/6/6/e01697-15 73 N. van Doremalen, D.H. Morris, M.G. Holbrooks and A. Gamble, “Aerosol and Surface Stability of SARS-CoV-2 as Compared with SARS-CoV-1,” The New England Journal of Medicine, pp. 1564-1567, 2020. https://www.nejm.org/doi/full/10.1056/nejmc2004973 74 NFI Parts. (n.d.). Antimicrobial Filter Information Sheet. https://nfi.parts/cleanandprotect/prodlit/Antimicrobial%20Filter-PRI.pdf 75 NFI Parts. (2020, August, 4). Price Quote. 76 The American Society of Heating, Refrigerating and Air-Conditioning Engineers. (n.d.). Filtration / Disinfection. https://www.ashrae.org/technical-resources/filtration-disinfection#mechanical 77 The American Society of Heating, Refrigerating and Air-Conditioning Engineers. (2019). Ultraviolet Air and Surface Treatment. In ASHRAE handbook 2019 - Hvac applications. https://www.ashrae.org/file%20library/technical%20resources/covid-19/i-p_a19_ch62_uvairandsurfacetreatment.pdf 78 Levetin, E., R. Shaughnessy, C. Rogers, and R. Scheir. 2001. Effectiveness of germicidal UV radiation for reducing fungal contamination within airhandling units. Applied and Environmental Microbiology 67(8):3712-3715 79 RTI. 2005. Test/QA plan for biological inactivation efficiency by HVAC induct ultraviolet light air cleaners. Research Triangle Institute, Research Triangle Park, NC. 80 VanOsdell, D., and K. Foarde. 2002. Defining the effectiveness of UV lamps installed in circulating air ductwork. Final Report, Air-Conditioning and Refrigeration Technology Institute 21-CR Project 61040030. 81 Foarde, K., Franke, D., Webber, T., Hanley, J., & Owen, K. (n.d.). Biological Inactivation Efficiency by HVAC In-Duct Ultraviolet Light Systems. Unites States Environmental Protection Agency . https://cfpub.epa.gov/si/si_public_file_download.cfm?p_download_id=459254&Lab=NHSRC 82 Centers for Disease Control and Prevention National. (2009, March). Environmental Control for Tuberculosis: Basic Upper-Room Ultraviolet Germicidal Irradiation Guidelines for Healthcare Settings. https://www.cdc.gov/niosh/docs/2009-105/pdfs/2009-105.pdf 83 Interview with DART, August 18, 2020 84 Huston, L. (2009, July). Ultraviolet Germicidal Irradiation for Transit Buses. Transit IDEA Program Transportation Research Board. https://onlinepubs.trb.org/onlinepubs/archive/studies/idea/finalreports/transit/Transit53_Final_Report.pdf 85 Mobile Climate Control. (2018). Aire Shield Brochure. https://www.mcc-hvac.com/wp-content/uploads/2018/01/MCC-Aire-Shield-UVC-FullG_2_web.pdf 86 NFI Parts. (n.d.). UV-C Lighting Kits Information Sheets. https://www.nfi.parts/cleanandprotect/prodlit/UV-CLights-PRI.pdf 87 SanUVAire. (2016, February 1). Breathe-Safe System - Air Purification in-HVAC (Roof Top/Rear Mount) Coil Disinfection Bus/Rail Car/ Boat/Marine Applications. http://www.sanuvaire.com/uploads/7/6/2/9/76291369/sanuvaire_breathe-safe_transit-brochurer1.pdf 88 RGF Environmental Group, Inc. (2016). ADVANCED OXIDATION TEST RESULTS 2000-2016. https://www.rgf.com/wp-content/uploads/2016/06/Test_booklet2016_READER.pdf?x12494
156
89 Climate Comfort Technologies. (n.d.). Transit Air Cleaning. https://climatecomforttechnologies.com/transit-air-cleaning 90 Scott, J. (2020). New Jersey Transit Trip June 2 MCI & NABI. Climate Comfort Technologies. 91 Southeastern Pennsylvania Transportation Authority. (2020, June 1). Operation – Transit Clean Air SEPTA SOW. 92 Grignard Pure. (n.d.). Effectiveness & Safety. https://grignardpure.com/effectiveness-safety/ 93 Seifert, K., & Johnson, A. (2020, June 24). Luminator technology group and Grignard company partner to deliver innovative air treatment solution for public transit systems amid coronavirus pandemic [Press release]. Business Wire. https://www.businesswire.com/news/home/20200624005529/en/Luminator-Technology-Group-Grignard-Company-Partner-Deliver 94 Climate Comfort Technologies. (2020, July 30). Response Memo to Rutgers. 95 Grignard Pure. (2020, August 8). TECHNOLOGY COMPARISON ANALYSIS PREVENTION AND MITIGATION SOLUTIONS FOR SARS-COV2 TRANSMISSION. 96 NJ Department of Health Hazardous substance fact sheet right to know for Hydrogen Peroxide 97 Ford Media Center. (n.d.). PACKING HEAT: HOW FORD’S LATEST TECH HELPS POLICE VEHICLES NEUTRALIZE COVID-19. Ford Motor Company. https://media.ford.com/content/fordmedia/fna/us/en/news/2020/05/27/ford-heated-sanitization-software-police-vehicles-coronavirus.html 98 Bryant Motors. (2020, August 11). Ford finds way to sanitize police car interiors with heater. https://www.bryantmotors.com/blog/news-specials/ford-heater-hack-covid.html 99 https://www.cbsnews.com/video/ford-turns-up-the-heat-to-keep-new-york-police-officers-safe-from-covid-19/#x 100 Honda. (2020, May 12). Detroit-area residents will be transported to COVID-19 testing in modified Honda Odyssey Minivans. Honda Corporate Newsroom. https://hondanews.com/en-US/honda-corporate/releases/release-b262241b363797081e713bf599003a5a-detroit-area-residents-will-be-transported-to-covid-19-testing-in-modified-honda-odyssey-minivans 101 Teague, C. (2020, April 17). How Honda is transforming the Odyssey to transport COVID-19 patients. The Drive. https://www.thedrive.com/tech/33052/how-honda-is-transforming-the-odyssey-minivan-to-transport-covid-19-patients 102 http://www.sanuvaire.com/uploads/7/6/2/9/76291369/breathe-safe-air-purification-system-transit_roi.pdf 103 https://www.assets.signify.com/is/content/PhilipsLighting/Assets/philips-lighting/global/20200615-philips-uvc-lamps-disinfection.pdf 104 Interview with SanUVaire 8/20/2020 105 The American Society of Heating, Refrigerating and Air-Conditioning Engineers. (n.d.). Technical Resources - Filtration/Disinfection. https://www.ashrae.org/technical-resources/filtration-disinfection#iso