Embed Size (px)
Citation preview
Tsunamigenic ionospheric hole
Yoshihiro Kakinami,1 Masashi Kamogawa,2 Yuichiro Tanioka,1 Shigeto Watanabe,3
Aditya Riadi Gusman,1 Jann-Yenq Liu,4 Yasuyuki Watanabe,2 and Toru Mogi1
Received 31 October 2011; revised 17 April 2012; accepted 22 April 2012; published 1 June 2012.
[1] Traveling ionospheric disturbances generated by an epi-central ground/sea surface motion, ionospheric disturbancesassociated with Rayleigh-waves as well as post-seismic4-minute monoperiodic atmospheric resonances and other-period atmospheric oscillations have been observed in largeearthquakes. In addition, a giant tsunami after the subductionearthquake produces an ionospheric hole which is widely asudden depletion of ionospheric total electron content(TEC) in the hundred kilometer scale and lasts for a few tensof minutes over the tsunami source area. The tsunamigenicionospheric hole detected by the TEC measurement withGlobal Position System (GPS) was found in the 2011M9.0 off the Pacific coast of Tohoku, the 2010 M8.8 Chile,and the 2004 M9.1 Sumatra earthquakes. This occursbecause plasma is descending at the lower thermospherewhere the recombination of ions and electrons is highthrough the meter-scale downwelling of sea surface at the tsu-nami source area, and is highly depleted due to the chemicalprocesses. Citation: Kakinami, Y., M. Kamogawa, Y. Tanioka,S. Watanabe, A. R. Gusman, J.-Y. Liu, Y. Watanabe, and T. Mogi(2012), Tsunamigenic ionospheric hole, Geophys. Res. Lett., 39,L00G27, doi:10.1029/2011GL050159.
1. Introduction
[2] Ionosphere is disturbed by large earthquakes [Ducicet al., 2003; Liu et al., 2006a] and tsunamis [Artru et al.,2005; Liu et al., 2006b; Rolland et al., 2010]. When a ver-tical sudden displacement of the ground and sea surfacecaused by the earthquake and tsunami excites acoustic-gravity waves in the atmosphere [see Watada, 2009], theacoustic-gravity waves propagate into the ionosphere anddisturb ionospheric plasma. The disturbances originatedfrom the ground and sea surface motions were observedinitially with ionosondes and high-frequency (HF) Dopplersounding systems [e.g., Leonard and Barnes, 1965] andrecently with the measurement of Ground PositioningSystem - Total Electron Content (GPS-TEC) [e.g., Ducicet al. 2003]. As an extraordinary case, the M9.1 Sumatra-Andaman earthquake (Sumatra EQ), which occurred at
00:58 (Universal time: UT) on 26 December 2004, causedlarge-scale ionospheric disturbances. The sea surface dis-placement associated with tsunami generated a travelingionospheric disturbance with several periods [Heki et al.,2006; Liu et al., 2006b]. Rayleigh waves travelling whichproduces the large vertical displacement also generatedionospheric disturbances [Liu et al., 2006a]. Post-seismic4-minute monoperiodic atmospheric resonance, i.e., acoustic-gravity wave oscillations between the lithosphere and thethermosphere was observed during four hours, one hourafter the mainshock [Choosakul et al., 2009]. As a similarevent, the M8.8 Chile EQ, which was a large subductionEQ, occurred at 6:34 UT on 27 February 2010. A tsunamiwas also generated in the Chile EQ and the tsunami thattraveled across the Pacific Ocean caused ionospheric dis-turbances [Galvan et al., 2011]. The M9.0 off the Pacificcoast of Tohoku earthquake (Tohoku EQ) which was also alarge subduction EQ occurred at 5:46 UT on 11 March2011 in the western Pacific Ocean. The epicenter waslocated in 38.297�N and 142.372�E and the focal depth was30 km. The Tohoku EQ resembles the Sumatra EQ in itsmagnitude and fault type. Liu et al. [2011] reported that thesimilar large-scale seismogenic and tsunamigenic iono-spheric disturbances in the Tohoku EQ. As shown later, anionospheric hole, widely a sudden depletion of TEC, isfound. The ionospheric hole is attributed to the Tohoku EQand is different from the above mentioned co-/post-seismicionospheric phenomena. The ionospheric hole occurs afterthe acoustic-gravity waves generated by the EQ reached theionosphere and gradually disappeared within a few tens ofminutes. On the other hand, the ionospheric holes did notappear in the inland EQs such as the 1999 M7.6 TaiwanChi-Chi inland EQ [see Liu et al., 2010, Figure 3]. There-fore, the ionospheric hole is expected to be attributed to atsunami.[3] In this paper, we present that the ionospheric hole
appears in the subduction earthquake and is generated by thetsunami, verifying the results of not only the 2011 M9.0Tohoku but also the 2004 M9.1 Sumatra and the 2010 M8.8Chile EQs. The physical mechanism of the tsunamigeneicionospheric hole is discussed.
2. Observation
[4] The GPS is used to derive the TEC along the slant pathbetween the satellite and the receiver using dual frequency(1575.42 and 1222.60 MHz) radio signals. Assuming thatthe ionosphere exists at 300 km as a thin layer, vertical TECis obtained with considering the elevation angle of the GPSsatellites [Liu et al., 1996]. Since there are several factorssuch as the satellite and receiver instrumental biases, wefocus on the variation of slant TEC. The point that the raypath from a GPS satellite to a ground-based receiver intercepts
1Institute of Seismology and Volcanology, Hokkaido University,Sapporo, Japan.
2Department of Physics, Tokyo Gakugei University, Tokyo, Japan.3Department of Cosmoscience, Hokkaido University, Sapporo, Japan.4Institute of Space Science, National Central University, Chung-li,
Taiwan.
Corresponding author: M. Kamogawa, Department of Physics, TokyoGakugei University, 4-1-1 Nukuikita-machi, Koganei-shi, Tokyo184-8501, Japan. ([email protected])
Copyright 2012 by the American Geophysical Union.0094-8276/12/2011GL050159
GEOPHYSICAL RESEARCH LETTERS, VOL. 39, L00G27, doi:10.1029/2011GL050159, 2012
L00G27 1 of 6
the ionosphere is named ionospheric point. Each iono-spheric point which acts as a monitoring station by mea-suring the TEC is employed to detect the ionosphericdisturbances. Footprint of the ionospheric point on Earth’ssurface is termed a subionospheric point (SIP).[5] In this study, GPS data are provided by the Geo-
graphical Survey Institute (GSI) of Japan which has installedmore than 1000 receivers in Japan as a nationwide GPSarray, named GPS Earth Observation Network (GEONET)(ftp://terras.gsi.go.jp/). The sampling time of the GPSdata record in GEONET is 30 seconds. For the Chile EQcase, the GPS data are provided by Instituto GeograficoNacional De La República Argentina (http://www.ign.gob.ar/DescargaRamsac) for AZUL, CFAG, CSJ1, CSLO,LHCL, MZAC, UNSJ, SL01, UCOR, SVIC, TERO, JBAL,and ALUM stations (15-second sampling time) and theScripps Orbit and Permanent Array Center (SOPAC) (http://sopac.ucsd.edu/) for COPO and ANTC (30-second sam-pling time). For the Sumatra EQ case, the GPS data are alsoprovided by SOPAC for SAMP and NTUS (30-secondsampling time), and ABGS, MKMK, NGNG, and PRKB(2-minnute sampling time).[6] For the comparison between the ionospheric distur-
bance and the tsunami generation, the tsunami wave in theTohoku EQ is calculated. Tsunamis generated by theTohoku EQ are numerically computed from the slip distri-bution estimated from the tsunami waveforms and thecoseismic crustal deformation data [Tanioka et al., 2011].The linear shallow water equations with a spherical coordi-nate system are numerically solved using the finite differ-ence method as described by Johnson [1998]. Because thetsunamis on the deep ocean are not much affected by non-linear coastal effects, the simulation of the tsunami using thelinear shallow water equations is widely accepted [Synolakiset al., 2008]. The grid spacing used in the tsunami simula-tion is 90 arc-seconds. The grid bathymetry data for thetsunami simulation are made from the General BathymetricChart of the Oceans (GEBCO) 30 arc-second data set andthe Japan Hydrographic Association’s M7001 and M7002bathymetric contour data sets. The computation area rangesfrom 130�E to 160�E and from 10�N to 50�N.
3. Result and Discussion
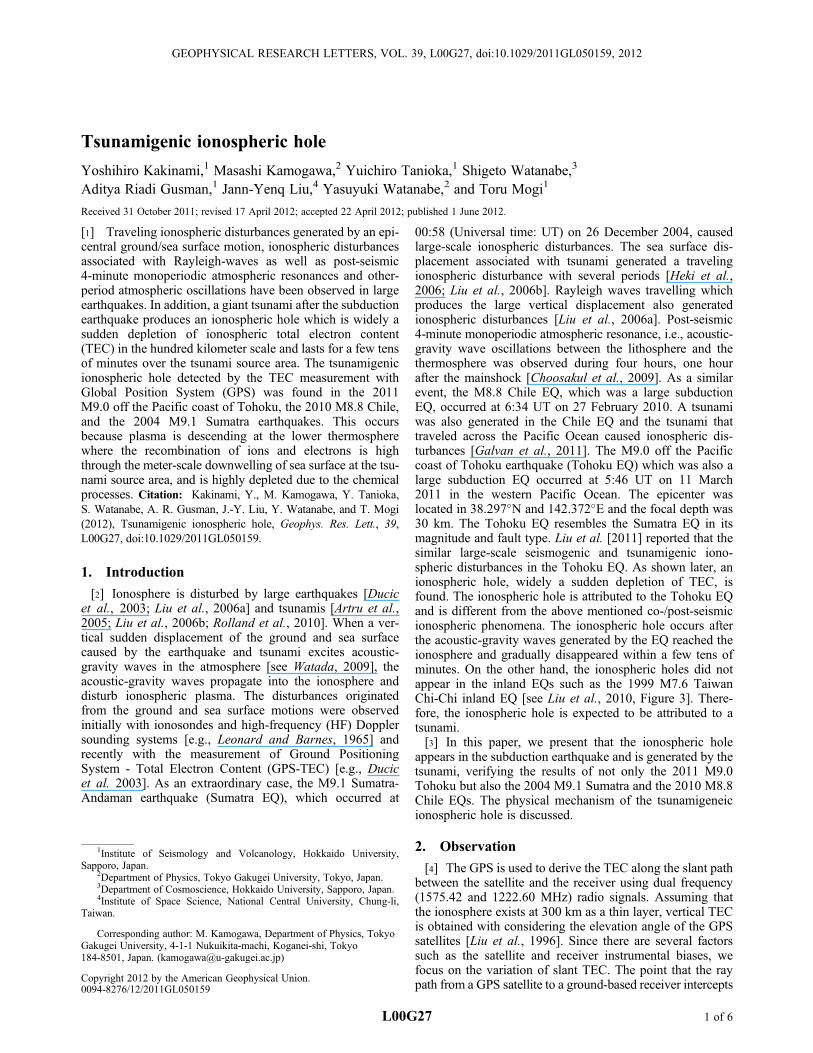
[7] Several visible satellites above the epicentral regionwere observed around the time of mainshocks of the EQs.Figure 1 illustrates the epicenter, the location of receivingstations, and the SIPs together with the slant TEC time-seriesof one of the visible satellites around the mainshocks withthe reference slant TEC curves, which are obtained by thesimilar orbits of the same satellite one day later. Dst indicesat the time of the mainshock of the EQ and the referencedays are about �80 and �44 nT in the Tohoku EQ, �5 and�3 in the Sumatra EQ, �1 and 16 in the Chile EQ, respec-tively (see World Data Centers for Geomagnetism, KyotoUniversity; http://wdc.kugi.kyoto-u.ac.jp/dstdir/index.html).Therefore, the Tohoku EQ occurred during the recoveryphase of the magnetic storm, while the Sumatra and theChile EQs occurred under the geomagnetically quiet condi-tions. Even in the Tohoku EQ, the slant TECs on the EQand the reference days reveal the similar tendencies. In thepresent study, both the slant TEC curves of the EQ andthe reference days are offset to be zero at the time of the
mainshock. From the two curves of the receiving stations,the following features arise in the three large EQs:1) Ionospheric disturbance occurs around 9 minutes afterthe mainshock. 2) In some of the receiving stations, theenhancement of TEC with the amplitude of a few TECu(1 TECu = 1 � 1016 electron / m2) is initially observed(type A), while in the others, the TEC starts decreasing(type B). 3) Then, the large depletion of TEC occurs withina few minutes. The amplitude of the large depletion exceedsabout 5 TECu and is large near the epicenter. The depletionwith four-minute monoperiodic signature lasts for tens ofminutes. In Figure 1c, only the SIP for SAMP (satellite 23)is located around the tsunami source region [see Taniokaet al., 2006, Figure 3], while the others are far from thisregion. Therefore, the large depletion of TEC is observedonly at SAMP in Figure 1c. The result of the Sumatra EQalso is consistent with that of the Tohoku earthquake.[8] In the Tohoku EQ, the spatial distributions of slant
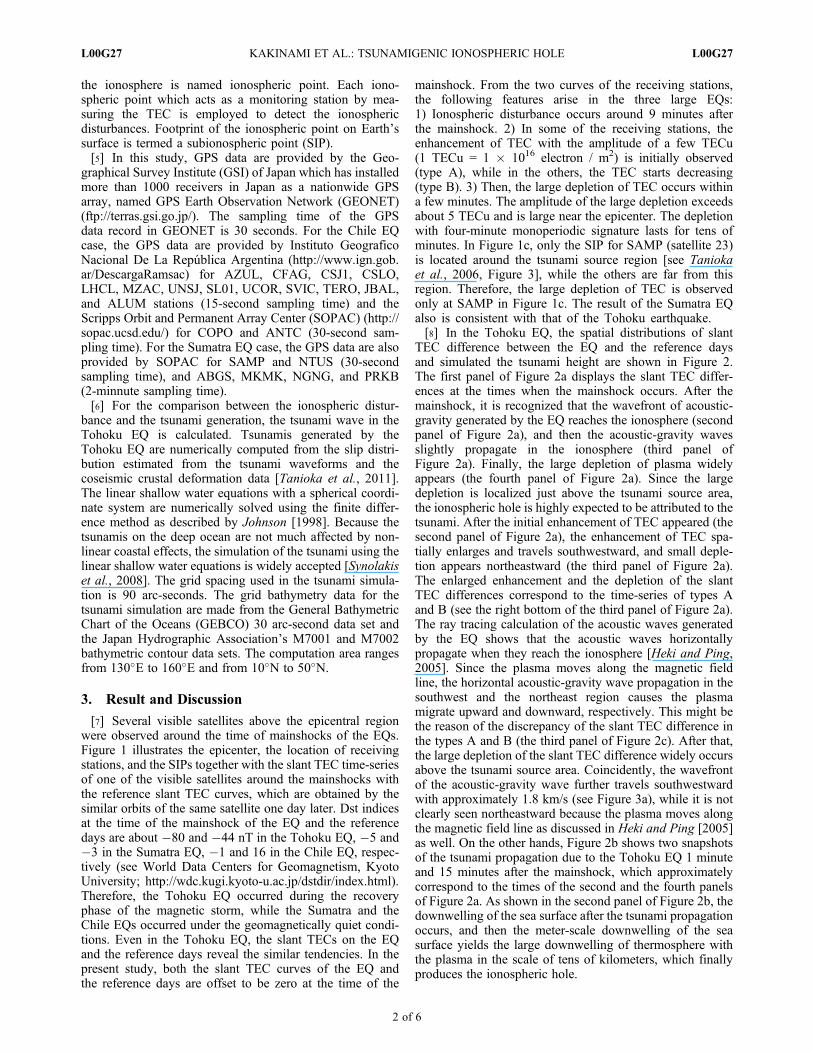
TEC difference between the EQ and the reference daysand simulated the tsunami height are shown in Figure 2.The first panel of Figure 2a displays the slant TEC differ-ences at the times when the mainshock occurs. After themainshock, it is recognized that the wavefront of acoustic-gravity generated by the EQ reaches the ionosphere (secondpanel of Figure 2a), and then the acoustic-gravity wavesslightly propagate in the ionosphere (third panel ofFigure 2a). Finally, the large depletion of plasma widelyappears (the fourth panel of Figure 2a). Since the largedepletion is localized just above the tsunami source area,the ionospheric hole is highly expected to be attributed to thetsunami. After the initial enhancement of TEC appeared (thesecond panel of Figure 2a), the enhancement of TEC spa-tially enlarges and travels southwestward, and small deple-tion appears northeastward (the third panel of Figure 2a).The enlarged enhancement and the depletion of the slantTEC differences correspond to the time-series of types Aand B (see the right bottom of the third panel of Figure 2a).The ray tracing calculation of the acoustic waves generatedby the EQ shows that the acoustic waves horizontallypropagate when they reach the ionosphere [Heki and Ping,2005]. Since the plasma moves along the magnetic fieldline, the horizontal acoustic-gravity wave propagation in thesouthwest and the northeast region causes the plasmamigrate upward and downward, respectively. This might bethe reason of the discrepancy of the slant TEC difference inthe types A and B (the third panel of Figure 2c). After that,the large depletion of the slant TEC difference widely occursabove the tsunami source area. Coincidently, the wavefrontof the acoustic-gravity wave further travels southwestwardwith approximately 1.8 km/s (see Figure 3a), while it is notclearly seen northeastward because the plasma moves alongthe magnetic field line as discussed in Heki and Ping [2005]as well. On the other hands, Figure 2b shows two snapshotsof the tsunami propagation due to the Tohoku EQ 1 minuteand 15 minutes after the mainshock, which approximatelycorrespond to the times of the second and the fourth panelsof Figure 2a. As shown in the second panel of Figure 2b, thedownwelling of the sea surface after the tsunami propagationoccurs, and then the meter-scale downwelling of the seasurface yields the large downwelling of thermosphere withthe plasma in the scale of tens of kilometers, which finallyproduces the ionospheric hole.
KAKINAMI ET AL.: TSUNAMIGENIC IONOSPHERIC HOLE L00G27L00G27
2 of 6
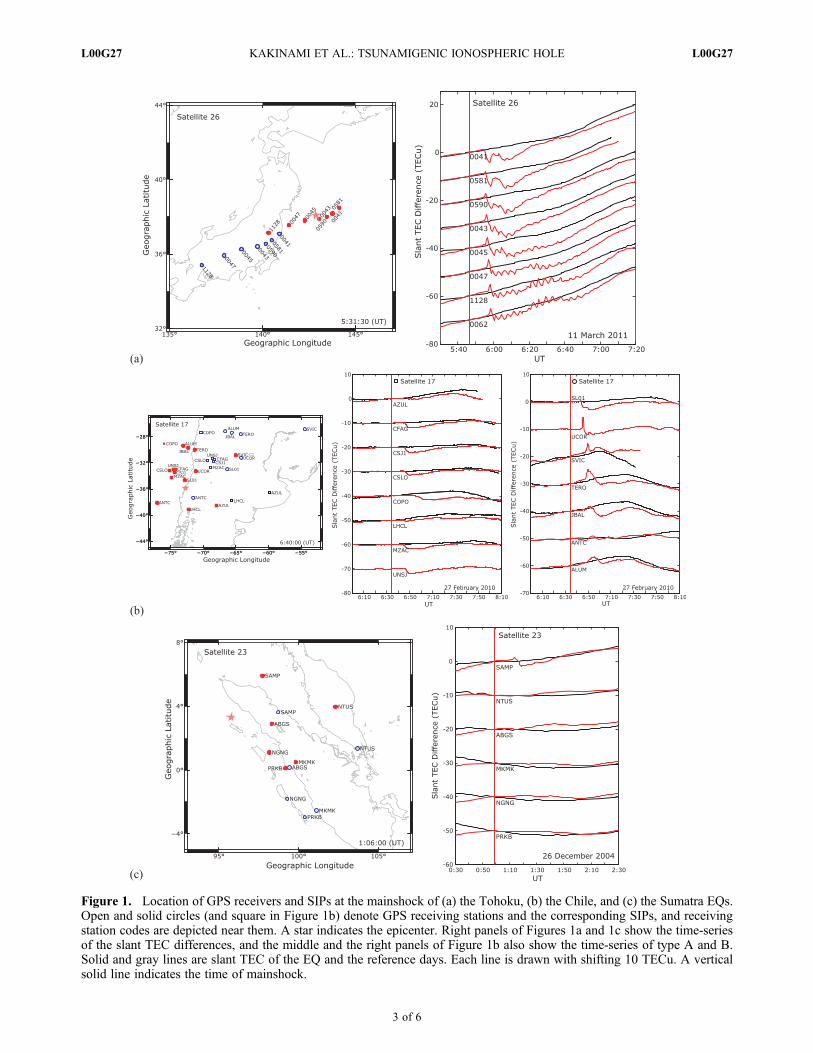
Figure 1. Location of GPS receivers and SIPs at the mainshock of (a) the Tohoku, (b) the Chile, and (c) the Sumatra EQs.Open and solid circles (and square in Figure 1b) denote GPS receiving stations and the corresponding SIPs, and receivingstation codes are depicted near them. A star indicates the epicenter. Right panels of Figures 1a and 1c show the time-seriesof the slant TEC differences, and the middle and the right panels of Figure 1b also show the time-series of type A and B.Solid and gray lines are slant TEC of the EQ and the reference days. Each line is drawn with shifting 10 TECu. A verticalsolid line indicates the time of mainshock.
KAKINAMI ET AL.: TSUNAMIGENIC IONOSPHERIC HOLE L00G27L00G27
3 of 6
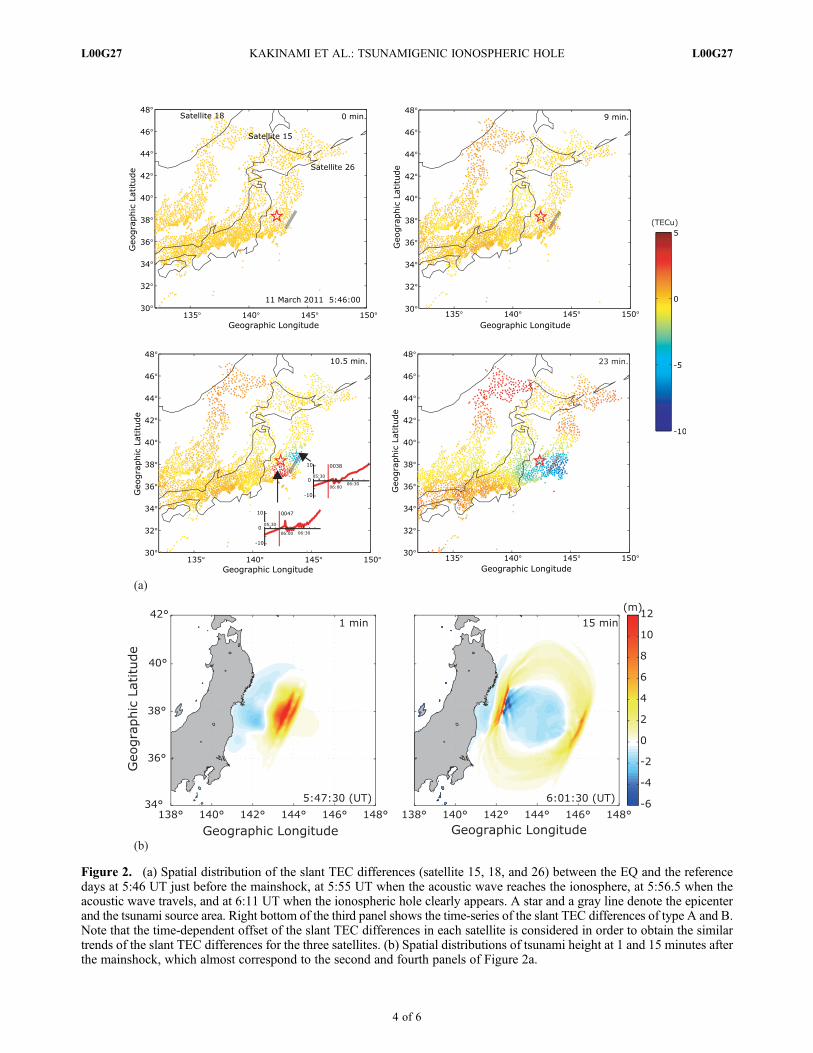
Figure 2. (a) Spatial distribution of the slant TEC differences (satellite 15, 18, and 26) between the EQ and the referencedays at 5:46 UT just before the mainshock, at 5:55 UT when the acoustic wave reaches the ionosphere, at 5:56.5 when theacoustic wave travels, and at 6:11 UT when the ionospheric hole clearly appears. A star and a gray line denote the epicenterand the tsunami source area. Right bottom of the third panel shows the time-series of the slant TEC differences of type A and B.Note that the time-dependent offset of the slant TEC differences in each satellite is considered in order to obtain the similartrends of the slant TEC differences for the three satellites. (b) Spatial distributions of tsunami height at 1 and 15 minutes afterthe mainshock, which almost correspond to the second and fourth panels of Figure 2a.
KAKINAMI ET AL.: TSUNAMIGENIC IONOSPHERIC HOLE L00G27L00G27
4 of 6
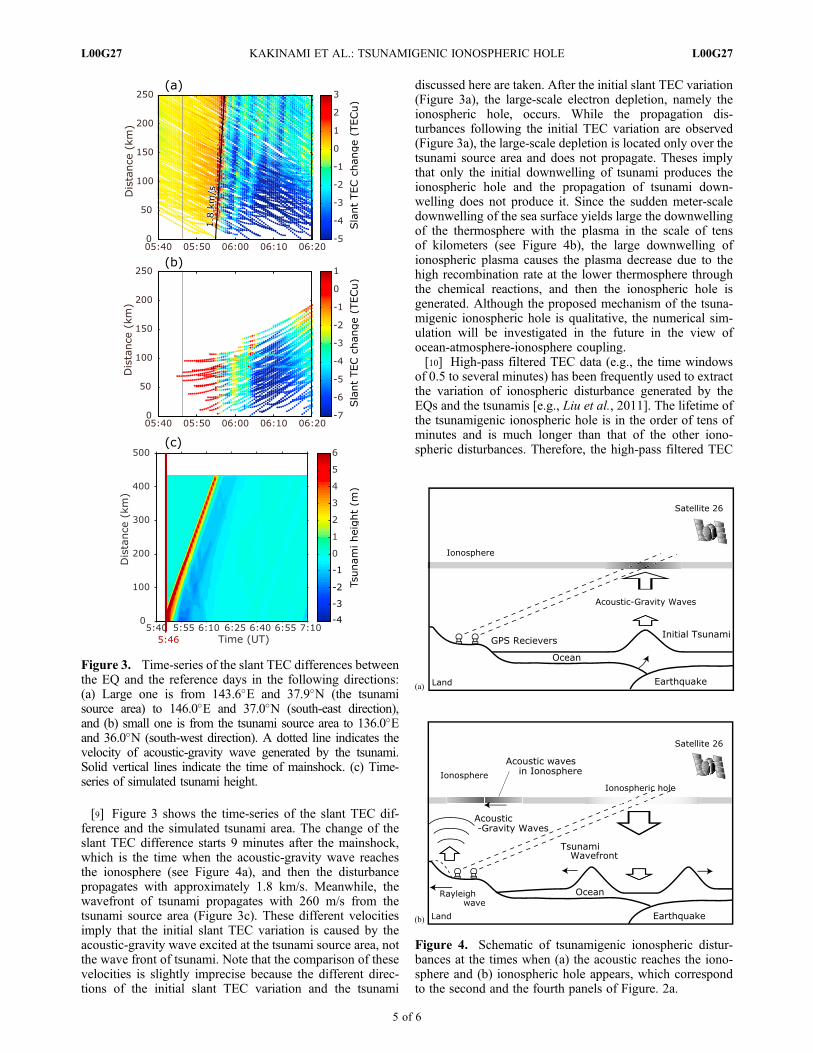
[9] Figure 3 shows the time-series of the slant TEC dif-ference and the simulated tsunami area. The change of theslant TEC difference starts 9 minutes after the mainshock,which is the time when the acoustic-gravity wave reachesthe ionosphere (see Figure 4a), and then the disturbancepropagates with approximately 1.8 km/s. Meanwhile, thewavefront of tsunami propagates with 260 m/s from thetsunami source area (Figure 3c). These different velocitiesimply that the initial slant TEC variation is caused by theacoustic-gravity wave excited at the tsunami source area, notthe wave front of tsunami. Note that the comparison of thesevelocities is slightly imprecise because the different direc-tions of the initial slant TEC variation and the tsunami
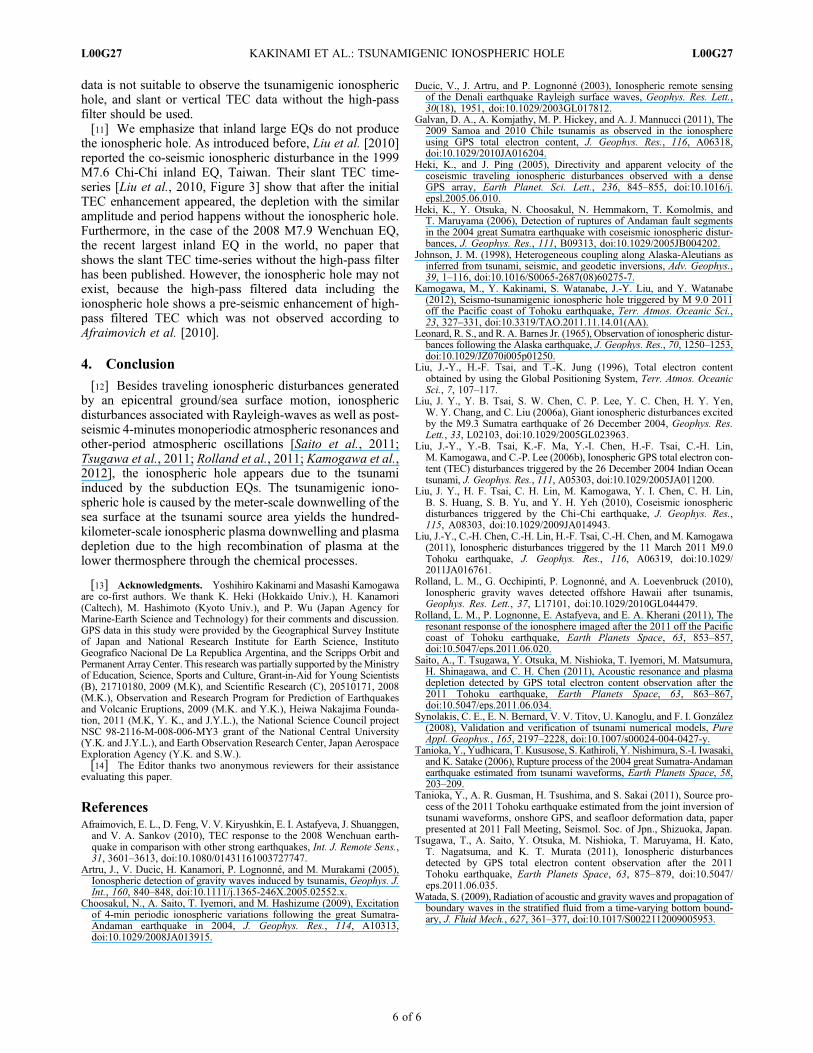
discussed here are taken. After the initial slant TEC variation(Figure 3a), the large-scale electron depletion, namely theionospheric hole, occurs. While the propagation dis-turbances following the initial TEC variation are observed(Figure 3a), the large-scale depletion is located only over thetsunami source area and does not propagate. Theses implythat only the initial downwelling of tsunami produces theionospheric hole and the propagation of tsunami down-welling does not produce it. Since the sudden meter-scaledownwelling of the sea surface yields large the downwellingof the thermosphere with the plasma in the scale of tensof kilometers (see Figure 4b), the large downwelling ofionospheric plasma causes the plasma decrease due to thehigh recombination rate at the lower thermosphere throughthe chemical reactions, and then the ionospheric hole isgenerated. Although the proposed mechanism of the tsuna-migenic ionospheric hole is qualitative, the numerical sim-ulation will be investigated in the future in the view ofocean-atmosphere-ionosphere coupling.[10] High-pass filtered TEC data (e.g., the time windows
of 0.5 to several minutes) has been frequently used to extractthe variation of ionospheric disturbance generated by theEQs and the tsunamis [e.g., Liu et al., 2011]. The lifetime ofthe tsunamigenic ionospheric hole is in the order of tens ofminutes and is much longer than that of the other iono-spheric disturbances. Therefore, the high-pass filtered TEC
Figure 3. Time-series of the slant TEC differences betweenthe EQ and the reference days in the following directions:(a) Large one is from 143.6�E and 37.9�N (the tsunamisource area) to 146.0�E and 37.0�N (south-east direction),and (b) small one is from the tsunami source area to 136.0�Eand 36.0�N (south-west direction). A dotted line indicates thevelocity of acoustic-gravity wave generated by the tsunami.Solid vertical lines indicate the time of mainshock. (c) Time-series of simulated tsunami height.
Figure 4. Schematic of tsunamigenic ionospheric distur-bances at the times when (a) the acoustic reaches the iono-sphere and (b) ionospheric hole appears, which correspondto the second and the fourth panels of Figure. 2a.
KAKINAMI ET AL.: TSUNAMIGENIC IONOSPHERIC HOLE L00G27L00G27
5 of 6
data is not suitable to observe the tsunamigenic ionospherichole, and slant or vertical TEC data without the high-passfilter should be used.[11] We emphasize that inland large EQs do not produce
the ionospheric hole. As introduced before, Liu et al. [2010]reported the co-seismic ionospheric disturbance in the 1999M7.6 Chi-Chi inland EQ, Taiwan. Their slant TEC time-series [Liu et al., 2010, Figure 3] show that after the initialTEC enhancement appeared, the depletion with the similaramplitude and period happens without the ionospheric hole.Furthermore, in the case of the 2008 M7.9 Wenchuan EQ,the recent largest inland EQ in the world, no paper thatshows the slant TEC time-series without the high-pass filterhas been published. However, the ionospheric hole may notexist, because the high-pass filtered data including theionospheric hole shows a pre-seismic enhancement of high-pass filtered TEC which was not observed according toAfraimovich et al. [2010].
4. Conclusion
[12] Besides traveling ionospheric disturbances generatedby an epicentral ground/sea surface motion, ionosphericdisturbances associated with Rayleigh-waves as well as post-seismic 4-minutes monoperiodic atmospheric resonances andother-period atmospheric oscillations [Saito et al., 2011;Tsugawa et al., 2011; Rolland et al., 2011; Kamogawa et al.,2012], the ionospheric hole appears due to the tsunamiinduced by the subduction EQs. The tsunamigenic iono-spheric hole is caused by the meter-scale downwelling of thesea surface at the tsunami source area yields the hundred-kilometer-scale ionospheric plasma downwelling and plasmadepletion due to the high recombination of plasma at thelower thermosphere through the chemical processes.
[13] Acknowledgments. Yoshihiro Kakinami andMasashi Kamogawaare co-first authors. We thank K. Heki (Hokkaido Univ.), H. Kanamori(Caltech), M. Hashimoto (Kyoto Univ.), and P. Wu (Japan Agency forMarine-Earth Science and Technology) for their comments and discussion.GPS data in this study were provided by the Geographical Survey Instituteof Japan and National Research Institute for Earth Science, InstitutoGeografico Nacional De La Republica Argentina, and the Scripps Orbit andPermanent Array Center. This research was partially supported by theMinistryof Education, Science, Sports and Culture, Grant-in-Aid for Young Scientists(B), 21710180, 2009 (M.K), and Scientific Research (C), 20510171, 2008(M.K.), Observation and Research Program for Prediction of Earthquakesand Volcanic Eruptions, 2009 (M.K. and Y.K.), Heiwa Nakajima Founda-tion, 2011 (M.K, Y. K., and J.Y.L.), the National Science Council projectNSC 98-2116-M-008-006-MY3 grant of the National Central University(Y.K. and J.Y.L.), and Earth Observation Research Center, Japan AerospaceExploration Agency (Y.K. and S.W.).[14] The Editor thanks two anonymous reviewers for their assistance
evaluating this paper.
ReferencesAfraimovich, E. L., D. Feng, V. V. Kiryushkin, E. I. Astafyeva, J. Shuanggen,and V. A. Sankov (2010), TEC response to the 2008 Wenchuan earth-quake in comparison with other strong earthquakes, Int. J. Remote Sens.,31, 3601–3613, doi:10.1080/01431161003727747.
Artru, J., V. Ducic, H. Kanamori, P. Lognonné, and M. Murakami (2005),Ionospheric detection of gravity waves induced by tsunamis, Geophys. J.Int., 160, 840–848, doi:10.1111/j.1365-246X.2005.02552.x.
Choosakul, N., A. Saito, T. Iyemori, and M. Hashizume (2009), Excitationof 4-min periodic ionospheric variations following the great Sumatra-Andaman earthquake in 2004, J. Geophys. Res., 114, A10313,doi:10.1029/2008JA013915.
Ducic, V., J. Artru, and P. Lognonné (2003), Ionospheric remote sensingof the Denali earthquake Rayleigh surface waves, Geophys. Res. Lett.,30(18), 1951, doi:10.1029/2003GL017812.
Galvan, D. A., A. Komjathy, M. P. Hickey, and A. J. Mannucci (2011), The2009 Samoa and 2010 Chile tsunamis as observed in the ionosphereusing GPS total electron content, J. Geophys. Res., 116, A06318,doi:10.1029/2010JA016204.
Heki, K., and J. Ping (2005), Directivity and apparent velocity of thecoseismic traveling ionospheric disturbances observed with a denseGPS array, Earth Planet. Sci. Lett., 236, 845–855, doi:10.1016/j.epsl.2005.06.010.
Heki, K., Y. Otsuka, N. Choosakul, N. Hemmakorn, T. Komolmis, andT. Maruyama (2006), Detection of ruptures of Andaman fault segmentsin the 2004 great Sumatra earthquake with coseismic ionospheric distur-bances, J. Geophys. Res., 111, B09313, doi:10.1029/2005JB004202.
Johnson, J. M. (1998), Heterogeneous coupling along Alaska-Aleutians asinferred from tsunami, seismic, and geodetic inversions, Adv. Geophys.,39, 1–116, doi:10.1016/S0065-2687(08)60275-7.
Kamogawa, M., Y. Kakinami, S. Watanabe, J.-Y. Liu, and Y. Watanabe(2012), Seismo-tsunamigenic ionospheric hole triggered by M 9.0 2011off the Pacific coast of Tohoku earthquake, Terr. Atmos. Oceanic Sci.,23, 327–331, doi:10.3319/TAO.2011.11.14.01(AA).
Leonard, R. S., and R. A. Barnes Jr. (1965), Observation of ionospheric distur-bances following the Alaska earthquake, J. Geophys. Res., 70, 1250–1253,doi:10.1029/JZ070i005p01250.
Liu, J.-Y., H.-F. Tsai, and T.-K. Jung (1996), Total electron contentobtained by using the Global Positioning System, Terr. Atmos. OceanicSci., 7, 107–117.
Liu, J. Y., Y. B. Tsai, S. W. Chen, C. P. Lee, Y. C. Chen, H. Y. Yen,W. Y. Chang, and C. Liu (2006a), Giant ionospheric disturbances excitedby the M9.3 Sumatra earthquake of 26 December 2004, Geophys. Res.Lett., 33, L02103, doi:10.1029/2005GL023963.
Liu, J.-Y., Y.-B. Tsai, K.-F. Ma, Y.-I. Chen, H.-F. Tsai, C.-H. Lin,M. Kamogawa, and C.-P. Lee (2006b), Ionospheric GPS total electron con-tent (TEC) disturbances triggered by the 26 December 2004 Indian Oceantsunami, J. Geophys. Res., 111, A05303, doi:10.1029/2005JA011200.
Liu, J. Y., H. F. Tsai, C. H. Lin, M. Kamogawa, Y. I. Chen, C. H. Lin,B. S. Huang, S. B. Yu, and Y. H. Yeh (2010), Coseismic ionosphericdisturbances triggered by the Chi‐Chi earthquake, J. Geophys. Res.,115, A08303, doi:10.1029/2009JA014943.
Liu, J.-Y., C.-H. Chen, C.-H. Lin, H.-F. Tsai, C.-H. Chen, and M. Kamogawa(2011), Ionospheric disturbances triggered by the 11 March 2011 M9.0Tohoku earthquake, J. Geophys. Res., 116, A06319, doi:10.1029/2011JA016761.
Rolland, L. M., G. Occhipinti, P. Lognonné, and A. Loevenbruck (2010),Ionospheric gravity waves detected offshore Hawaii after tsunamis,Geophys. Res. Lett., 37, L17101, doi:10.1029/2010GL044479.
Rolland, L. M., P. Lognonne, E. Astafyeva, and E. A. Kherani (2011), Theresonant response of the ionosphere imaged after the 2011 off the Pacificcoast of Tohoku earthquake, Earth Planets Space, 63, 853–857,doi:10.5047/eps.2011.06.020.
Saito, A., T. Tsugawa, Y. Otsuka, M. Nishioka, T. Iyemori, M. Matsumura,H. Shinagawa, and C. H. Chen (2011), Acoustic resonance and plasmadepletion detected by GPS total electron content observation after the2011 Tohoku earthquake, Earth Planets Space, 63, 863–867,doi:10.5047/eps.2011.06.034.
Synolakis, C. E., E. N. Bernard, V. V. Titov, U. Kanoglu, and F. I. González(2008), Validation and verification of tsunami numerical models, PureAppl. Geophys., 165, 2197–2228, doi:10.1007/s00024-004-0427-y.
Tanioka, Y., Yudhicara, T. Kususose, S. Kathiroli, Y. Nishimura, S.-I. Iwasaki,and K. Satake (2006), Rupture process of the 2004 great Sumatra-Andamanearthquake estimated from tsunami waveforms, Earth Planets Space, 58,203–209.
Tanioka, Y., A. R. Gusman, H. Tsushima, and S. Sakai (2011), Source pro-cess of the 2011 Tohoku earthquake estimated from the joint inversion oftsunami waveforms, onshore GPS, and seafloor deformation data, paperpresented at 2011 Fall Meeting, Seismol. Soc. of Jpn., Shizuoka, Japan.
Tsugawa, T., A. Saito, Y. Otsuka, M. Nishioka, T. Maruyama, H. Kato,T. Nagatsuma, and K. T. Murata (2011), Ionospheric disturbancesdetected by GPS total electron content observation after the 2011Tohoku earthquake, Earth Planets Space, 63, 875–879, doi:10.5047/eps.2011.06.035.
Watada, S. (2009), Radiation of acoustic and gravity waves and propagation ofboundary waves in the stratified fluid from a time-varying bottom bound-ary, J. Fluid Mech., 627, 361–377, doi:10.1017/S0022112009005953.
KAKINAMI ET AL.: TSUNAMIGENIC IONOSPHERIC HOLE L00G27L00G27
6 of 6


