Embed Size (px)
Citation preview
Canadian High Arctic Ionospheric Network (CHAIN)
P. T. Jayachandran,1 R. B. Langley,2 J. W. MacDougall,3 S. C. Mushini,1
D. Pokhotelov,1 A. M. Hamza,1 I. R. Mann,4 D. K. Milling,4 Z. C. Kale,4
R. Chadwick,1 T. Kelly,1 D. W. Danskin,5 and C. S. Carrano6
Received 18 October 2008; revised 3 March 2009; accepted 18 March 2009; published 23 May 2009.
[1] Polar cap ionospheric measurements are important for the complete understanding ofthe various processes in the solar wind-magnetosphere-ionosphere system as well asfor space weather applications. Currently, the polar cap region is lacking high temporaland spatial resolution ionospheric measurements because of the orbit limitations ofspace-based measurements and the sparse network providing ground-based measurements.Canada has a unique advantage in remedying this shortcoming because it has the mostaccessible landmass in the high Arctic regions, and the Canadian High Arctic IonosphericNetwork (CHAIN) is designed to take advantage of Canadian geographic vantage pointsfor a better understanding of the Sun-Earth system. CHAIN is a distributed array ofground-based radio instruments in the Canadian high Arctic. The instrumentcomponents of CHAIN are 10 high data rate Global Positioning System ionosphericscintillation and total electron content monitors and six Canadian Advanced DigitalIonosondes. Most of these instruments have been sited within the polar cap region exceptfor two GPS reference stations at lower latitudes. This paper briefly overviews thescientific capabilities, instrument components, and deployment status of CHAIN. Thispaper also reports a GPS signal scintillation episode associated with a magnetosphericimpulse event. More details of the CHAIN project and data can be found at http://chain.physics.unb.ca/chain.
Citation: Jayachandran, P. T., et al. (2009), Canadian High Arctic Ionospheric Network (CHAIN), Radio Sci., 44, RS0A03,
doi:10.1029/2008RS004046.
1. Introduction
[2] The creation of the Canadian High Arctic Iono-spheric Network (CHAIN) is primarily motivated by thefundamental need for a greater understanding of plane-tary environments that are affected by the short- andlong-term variability of solar output. The Sun-Earth
system is a vast coupled system, where many physicalprocesses take place, with solar variability driving theeffects felt in the terrestrial and space environments. Acomplete understanding of this complex system necessi-tates knowledge about the individual physical processestaking place in the system and in turn necessitates relevantobservations. Through the construction and operation ofCHAIN, we seek to understand the individual physicalprocesses necessary for the fundamental understanding ofthe solar-terrestrial coupling and its influence on ourplanetary environment.[3] The Earth’s upper atmosphere (ionosphere) in the
polar region is embedded in the ‘‘magnetosphere,’’ acavity carved by the interaction of the solar wind and its‘‘frozen-in’’ magnetic field with the terrestrial magneticfield. Large-scale electric currents are a ubiquitous fea-ture of this environment; they are powered by the solarwind, and continuously deposit electric (Joule) and ther-mal energy as well as particles in the Earth’s upper atmo-sphere, and thus modify the global upper atmosphericchemistry, circulation pattern, and energy budget. The
RADIO SCIENCE, VOL. 44, RS0A03, doi:10.1029/2008RS004046, 2009
1Physics Department, University of New Brunswick, Fredericton,New Brunswick, Canada.
2Department of Geodesy and Geomatics Engineering, University ofNew Brunswick, Fredericton, New Brunswick, Canada.
3Department of Physics and Astronomy, University of WesternOntario, London, Ontario, Canada.
4Department of Physics, University of Alberta, Edmonton, Alberta,Canada.
5Geomagnetic Laboratory, Natural Resources Canada, Ottawa,Ontario, Canada.
6Atmospheric and Environmental Research, Inc., Lexington,Massachusetts, USA.
Copyright 2009 by the American Geophysical Union.
0048-6604/09/2008RS004046
RS0A03 1 of 10
solar wind is inherently nonsteady, with its magnetic field,density, and flow speed varying on a range of temporaland amplitude scales. Variations in the solar wind modu-late the solar-terrestrial coupling processes which drivethe transport of mass, energy and momentum into near-Earth space, leading to variations of the magnetosphericparticle population, electric currents, and the aurora; suchdisturbances in the Sun-Earth system are commonly called‘‘space weather.’’ Space weather effects can damagesatellite systems [e.g., Baker et al., 1998], affect commu-
nication systems, and cause disruption of power trans-missions [Boteler, 1998; Pulkkinen et al., 2005] and causeother phenomena [Hunsucker and Hargreaves, 2003].Increased ionization and disturbances in the upper atmo-sphere also affect satellite-based communication systemsand terrestrial high-frequency radio communication, andcan introduce significant position errors in radio naviga-tion systems such as the Global Positioning System (GPS)[e.g., Lanzerotti, 2001].
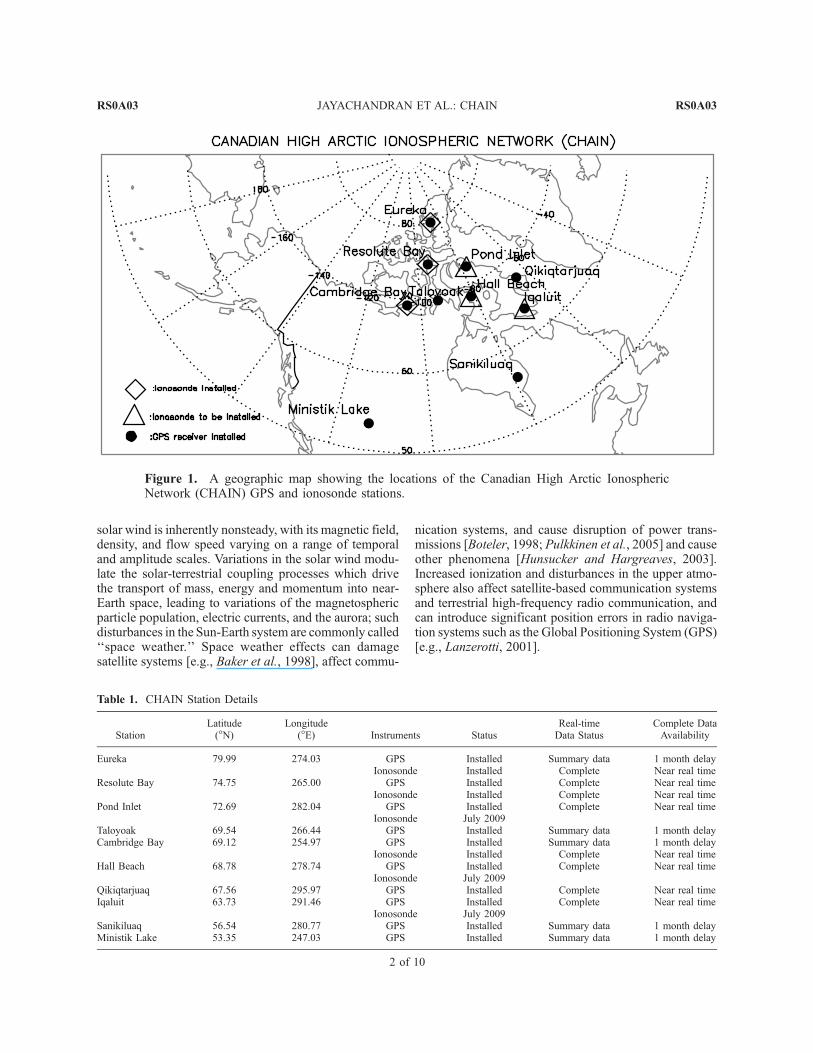
Figure 1. A geographic map showing the locations of the Canadian High Arctic IonosphericNetwork (CHAIN) GPS and ionosonde stations.
Table 1. CHAIN Station Details
StationLatitude(�N)
Longitude(�E) Instruments Status
Real-timeData Status
Complete DataAvailability
Eureka 79.99 274.03 GPS Installed Summary data 1 month delayIonosonde Installed Complete Near real time
Resolute Bay 74.75 265.00 GPS Installed Complete Near real timeIonosonde Installed Complete Near real time
Pond Inlet 72.69 282.04 GPS Installed Complete Near real timeIonosonde July 2009
Taloyoak 69.54 266.44 GPS Installed Summary data 1 month delayCambridge Bay 69.12 254.97 GPS Installed Summary data 1 month delay
Ionosonde Installed Complete Near real timeHall Beach 68.78 278.74 GPS Installed Complete Near real time
Ionosonde July 2009Qikiqtarjuaq 67.56 295.97 GPS Installed Complete Near real timeIqaluit 63.73 291.46 GPS Installed Complete Near real time
Ionosonde July 2009Sanikiluaq 56.54 280.77 GPS Installed Summary data 1 month delayMinistik Lake 53.35 247.03 GPS Installed Summary data 1 month delay
RS0A03 JAYACHANDRAN ET AL.: CHAIN
2 of 10
RS0A03
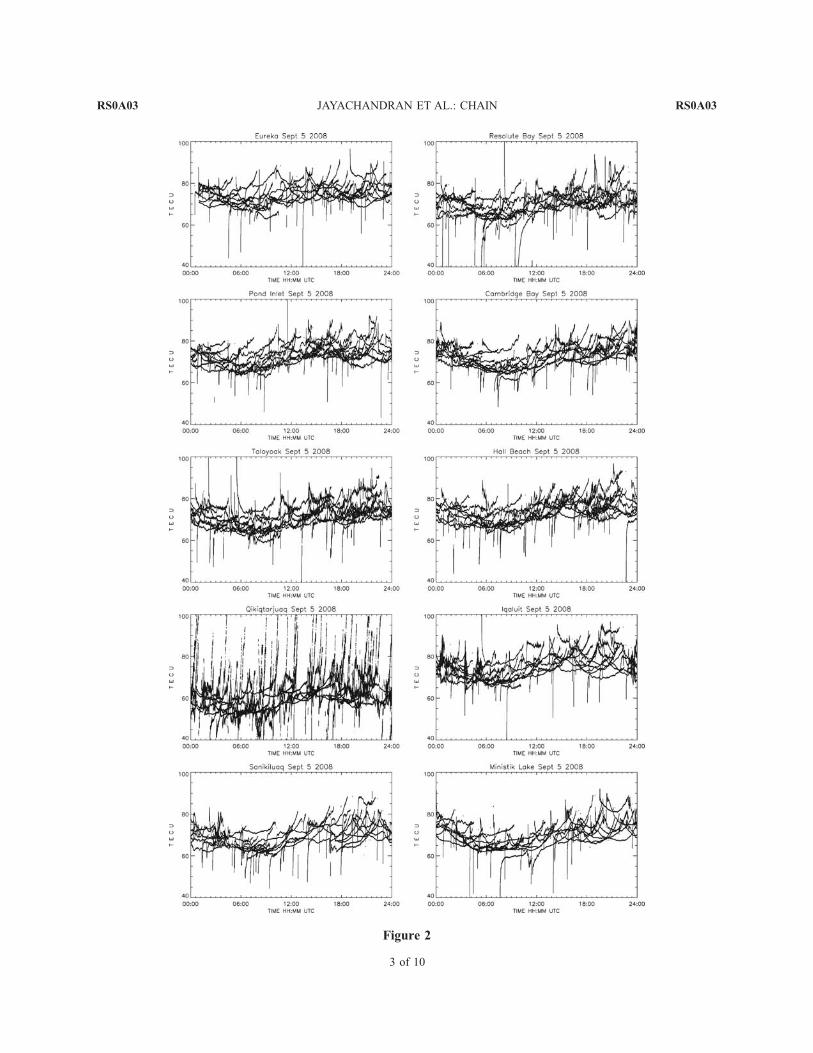
Figure 2
RS0A03 JAYACHANDRAN ET AL.: CHAIN
3 of 10
RS0A03
[4] For the influence of the Sun on the near-Earthenvironment to be fully explained, understanding andmonitoring the fundamental processes responsible forsolar-terrestrial coupling is vital. Monitoring the spatialand temporal development of the global electric fieldand current systems, transport of energy and momen-tum across the polar cap, and generation and dynamicsof ionospheric irregularities of different scale sizes, andultimately the role of the ionosphere in the whole solarwind-magnetosphere-ionosphere (SW-M-I) couplingprocess is essential in the understanding of the Sun-Earth system. Given the size of the SW-M-I system onecan only accumulate knowledge over time and try to puttogether a coherent physical picture. One way to addressthis problem is to use ionospheric measurements as a‘‘road map’’ to understand the SW-M-I interaction. Thisis possible because in the high-latitude regions, the highconductivity along terrestrial magnetic field lines, whichhave a footprint in the high-latitude ionosphere, forms aclosed electric circuit together with the conductingionosphere. The current/voltage generated through thesolar wind magnetosphere dynamo/generator is appliedto the high-latitude ionosphere through this circuit.
2. CHAIN Instruments, Locations,
and Status
[5] CHAIN is a distributed array of radio instrumentsprimarily in the polar cap. The CHAIN instrument com-ponents consist of 10 specialized GPS receivers and sixdigital ionosondes. A unique feature of CHAIN is that 6of the 10 GPS receivers are collocated with ionosondes.This configuration of instruments (collocated ionosondesand GPS receivers) will have an added advantage in thetomographic imaging of the electron density structures inthe polar cap and calibration of the GPS data. NewResolute Bay Incoherent Scatter Radar (AMISR) willalso help in the tomographic reconstruction of theionosphere. Locations of the CHAIN instruments areshown in Figure 1. Ten GPS receivers and three ion-sondes are now installed and collecting data routinely.The remaining three ionosondes will be installed duringthe summer of 2009. Data from these stations aretransferred to the University of New Brunswick CHAINData Center on a near-real-time basis. Table 1 providesstation details, including the instruments located at eachsite, status of deployment, and a summary of the near-real-time data collection. Brief descriptions of theCHAIN instruments are given below.[6] The CHAIN GPS receivers are GPS Ionospheric
Scintillation and TEC Monitors (GISTMs) model. In
summary, a GISTM consists of a NovAtel OEM4 dualfrequency receiver with special firmware specificallyconfigured to measure amplitude and phase scintillationderived from the L1 frequency GPS signals and iono-spheric total electron content (TEC) derived from the L1and L2 frequency GPS signals. This receiver is capable oftracking and reporting scintillation and TEC measure-ments from up to 10 GPS satellites in view. Phase andamplitude data are sampled at a rate of 50 Hz. TheGSV4004Bs automatically compute and log the ampli-tude scintillation index, S4, and phase scintillation index,sF, computed over 60 s. Phase and amplitude data, eitherin raw form or detrended, are also logged at 50 Hz. Nine ofthe 10 receivers are currently fed by a NovAtel GPS-702antenna. The exception is the receiver at Qikiqtarjuaqwhich shares an Ashtech ASH701945E_M antenna witha preexisting Natural Resources Canada GPS receiverthrough a splitter. Examples of the 50 Hz slant TECvariation (uncalibrated and uncorrected for cycle slips)for one day (5 September 2008) from all 10 CHAIN GPSstations are shown in Figure 2.[7] The CHAIN ionosondes are Canadian Advanced Dig-
ital Ionosondes (CADIs) [MacDougall and Jayachandran,2001]. The CADI is a modern digital ionosonde, which iscapable of providing ionospheric drift measurementsalong with conventional ionograms. A CADI employsan antenna array consisting of four short dipoles arrangedalong the sides of a square of 30 m on each side, and onereceiver is dedicated to each antenna. Fixed frequencyDoppler samples with 64 data points are obtained at30s intervals and an ionogram of 95 frequencies isobtained every minute. The convection velocity (speedand azimuth) and other echo properties are derived fromthe fixed frequency Doppler measurements. Examples ofthe fixed frequency drift measurements from Eureka,Resolute Bay, and Cambridge Bay for 30 August 2008are shown in Figure 3.
3. Scientific Objectives of CHAIN
[8] Most of the time, the polar cap ionosphere, a regionof open field lines, is directly coupled to the solar windand interplanetary magnetic field. Mass and energyderived from the interaction are transported across thepolar cap and are directly controlled by the variability ofsolar input (both particle and electromagnetic). Becauseof this coupling, the polar cap ionosphere is oftencomposed of ionization and electromagnetic structures[Tsunoda, 1988; Crowley, 1996; Aarons, 1997; Basu andValladares, 1999; Aarons et al., 2000; Jayachandranand MacDougall, 2001; Foster et al., 2005; MacDougall
Figure 2. An example of daily variation of slant total electron content derived using 50 Hz measurements from all10 CHAIN GPS stations for 5 September 2008.
RS0A03 JAYACHANDRAN ET AL.: CHAIN
4 of 10
RS0A03
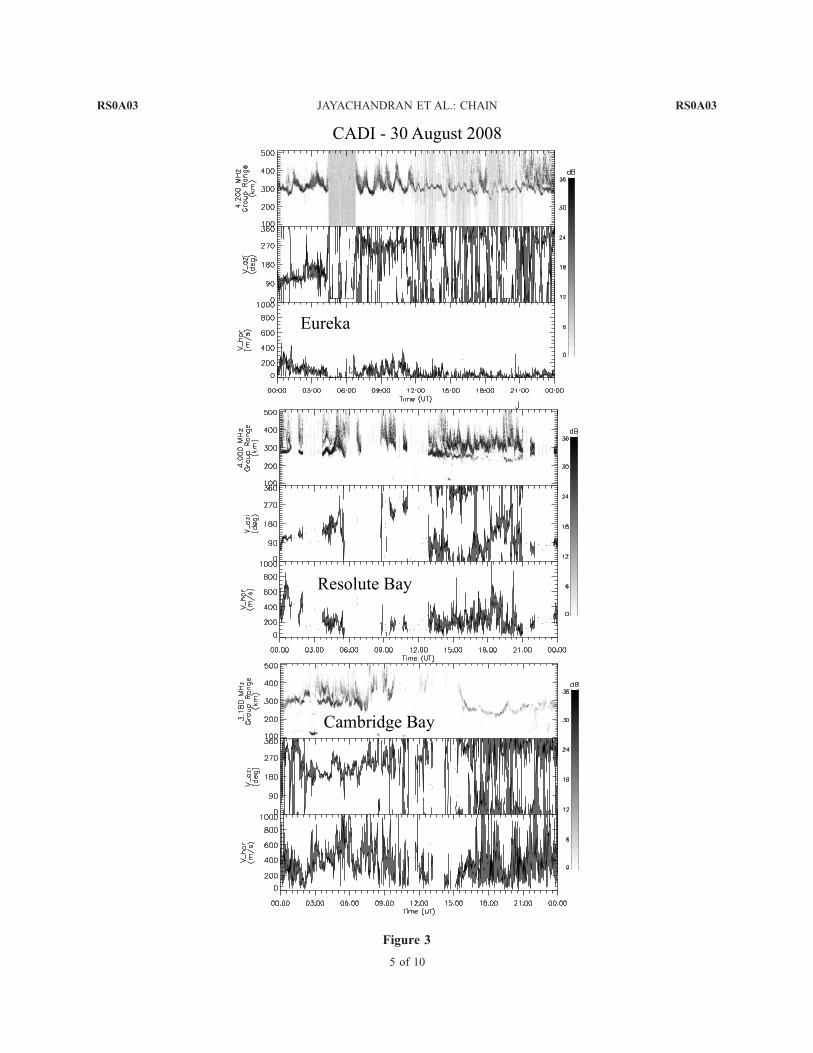
Figure 3
RS0A03 JAYACHANDRAN ET AL.: CHAIN
5 of 10
RS0A03
and Jayachandran, 2007]. Understanding of the polar capionosphere will go a long way in understanding the SW-M-I coupling and CHAIN scientific objectives are aimedat understanding the polar cap processes. Since wecannot accommodate here (due to lack of space) athorough description of individual scientific objectives,just the broad-based scientific objectives of CHAIN maybe given. They include the understanding of (1) driversand variabilities of polar cap convection, (2) generationand dynamics of ionization structures in the polar cap(macroscale, tongue of ionization (>1000 km); meso-scale, polar patches (few hundred kilometers); micro-scale, scintillation producing structures (few kilometers),and (3) role of ionosphere in M-I coupling.[9] The basic CHAIN measurements, relevant to these
scientific objectives, are the 30s resolution measurement
of the convection and one minute resolution measure-ment of the ionograms at the six CADI locations, andGPS-based measurements of TEC and scintillation at10 stations (50 Hz sampling). As mentioned earlier, oneimportant and unique factor regarding CHAIN is that the6 of the 10 GPS receivers are collocated with iono-sondes. This configuration will allow us to perform morerealistic 4D (three spatial dimensions plus time) tomo-graphic inversions of the ionosphere using the Multi-Instrument Data Analysis System (MIDAS) [Mitchelland Spencer, 2003; Bust et al., 2007] or the GlobalAssimilative Ionospheric Model (GAIM) [Hajj et al.,2004] for addressing some of the scientific objectives.CHAIN along with other instruments such as Super-DARN radars, Resolute Bay Incoherent Scatter Radar(AMISR), and array of optical imagers will form a
Figure 3. An example of Canadian Advanced Digital Ionosonde measurements from three CHAIN stations(Eureka, Resolute, and Cambridge Bay) for 30 August 2008. The plots for each station represent group height at a(top) fixed frequency, (middle) convection azimuth, and (bottom) speed.
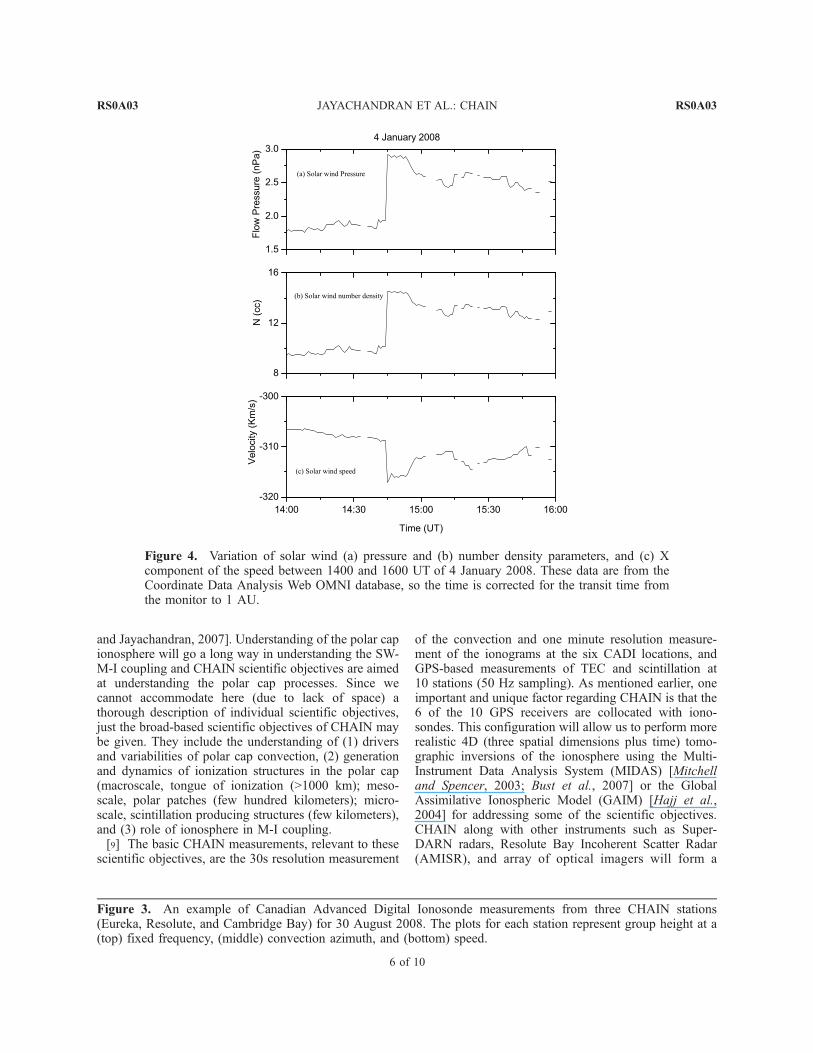
Figure 4. Variation of solar wind (a) pressure and (b) number density parameters, and (c) Xcomponent of the speed between 1400 and 1600 UT of 4 January 2008. These data are from theCoordinate Data Analysis Web OMNI database, so the time is corrected for the transit time fromthe monitor to 1 AU.
RS0A03 JAYACHANDRAN ET AL.: CHAIN
6 of 10
RS0A03
powerful ground-based suite of instruments to study thehigh-latitude phenomena and SW-M-I coupling.
4. Observation of GPS Scintillation
Associated With a Magnetospheric Impulse
Event Using CHAIN Measurements
[10] Ionospheric scintillations are rapid random fluctu-ations of the phase and field strength (amplitude) of radiofrequency signals that transit the ionosphere [Hey et al.,1946]. These signal fluctuations are caused by thepresence of small-scale electron density structures (irreg-ularities) in the ionosphere [e.g., Aarons, 1982; Tsunoda,1988; Aarons et al., 2000]. Most of the early radiowavescintillation studies were based on geostationary satellitesignals at lower frequencies [e.g., Aarons, 1982]. Therecent explosion of GPS-based ionospheric research andthe mushrooming use of GPS signals for navigationalpurposes has put renewed interest on the nature andcause of radiowave scintillations. (For more on GPS andscintillations, see Kintner et al. [2007].) However, recent
scintillation studies based on GPS data were conductedfor extreme magnetic storm conditions [Mitchell et al.,2005; Meggs et al., 2008]. In geospace, there are otherevents that can also produce considerable changes in theionosphere. One such event is the magnetospheric im-pulse event (MIE) [Lanzerotti et al., 1990]. MIEs havebeen historically identified using ground magnetic fieldmeasurements and long-period Pc5 ground magneticpulsations is one of the main signatures of MIEs [e.g.,Arnoldy et al., 1996]. These MIEs are mostly externallydriven and several mechanisms such as magnetic recon-nection [Konik et al., 1994] and the impact of dense solarwind with the magnetopause and its penetration into themagnetosphere [e.g., Heikkila, 1982; Sibeck et al., 1989;Kataoka et al., 2003] are proposed. Since these MIEsproduce significant changes in the ground magnetic field,it is expected that they will also produce changes in theionosphere. Impacts ofMIEs onGPS signals are relativelyunknown. A case study of an MIE-related scintillationevent using CHAINGPSmeasurements is presented below.[11] The event of interest occurred between 1400 and
1600 UT on 4 January 2008. Variations of solar wind
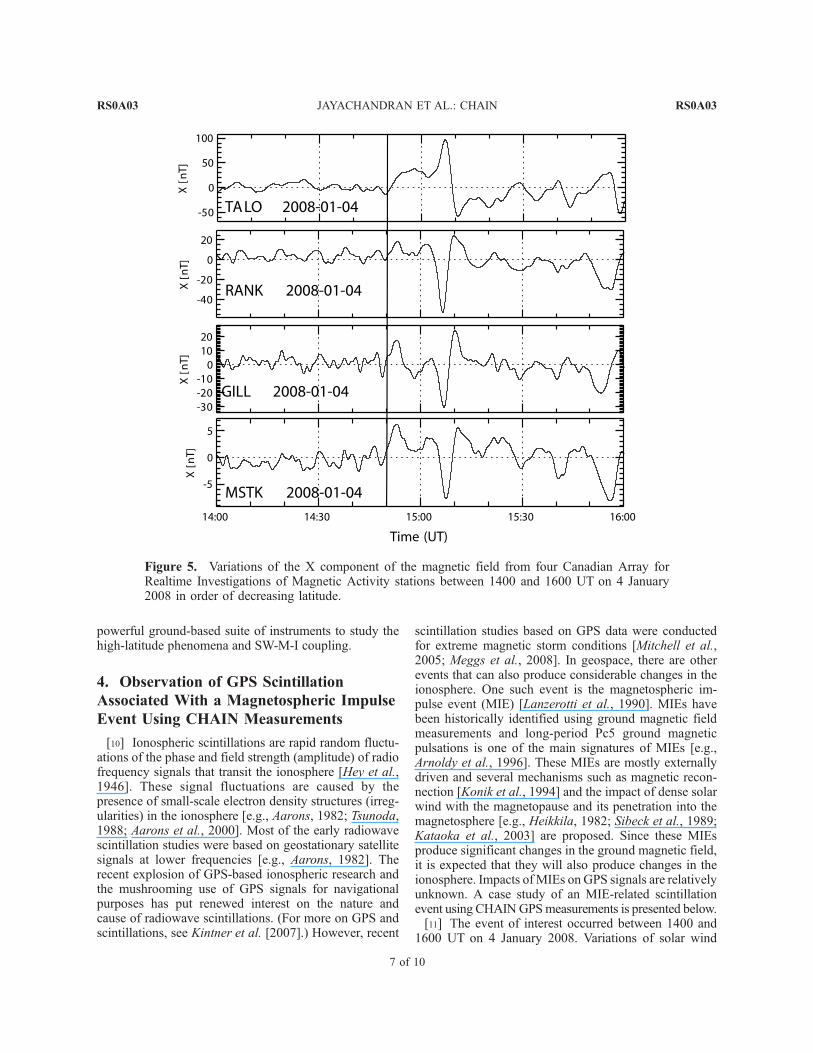
Figure 5. Variations of the X component of the magnetic field from four Canadian Array forRealtime Investigations of Magnetic Activity stations between 1400 and 1600 UT on 4 January2008 in order of decreasing latitude.
RS0A03 JAYACHANDRAN ET AL.: CHAIN
7 of 10
RS0A03
(SW) parameters using the OMNI database are shown inFigure 4. Figure 4a shows the variations of the SW flowpressure, Figure 4b shows number density, and Figure 4cshows the X component of the SW velocity. It can beclearly seen from Figure 4 that SW pressure increased(primarily due to the increase in the SW density) sud-denly around 1445 UT. One point to keep in mind is thatthe OMNI database has already been corrected for thepropagation of the SWvariations from themonitor to 1AU.Temporal variation of the X component of the groundmagnetometers for the interval 1400–1600 UT is shownin Figure 5. The magnetometer data used are from fourCanadian Array for Realtime Investigations of MagneticActivity (CARISMA) [Mann et al., 2008] stations,namely, TALO (69.54�N, 266.45�E); RANK (62.82�N,267.89�E); GILL (56.38�N, 265.36�E); and MSTK(53.35�N, 247.03�E) and they are arranged in decreasing
latitudes from top to bottom in Figure 5. It can be seenfrom Figure 5 that there was a simultaneous magneticfield change (change in polarity between TALO andother stations due to their locations) detected at all thesestations around 1450 UT with a maximum change in themagnetic field around 1508 UT. The presence of periodicoscillations (�15 min periodicity) in the magnetic fieldfollowing the initial signature can also be noted. Thesemagnetic field variations are typical signatures of MIE[Lanzerotti et al., 1990]. By looking at Figures 4 and 5,one can obviously conclude that the increase in the SWdynamic pressure is the cause of this MIE as suggestedby Sibeck et al. [1989].[12] Only 2 of the 10 GPS receivers were deployed and
providing data during this event. These stations wereCambridge Bay (69.12�N, 254.97�E) and Ministik Lake(53.35�N, 247.03�E–one of the magnetometer stations).
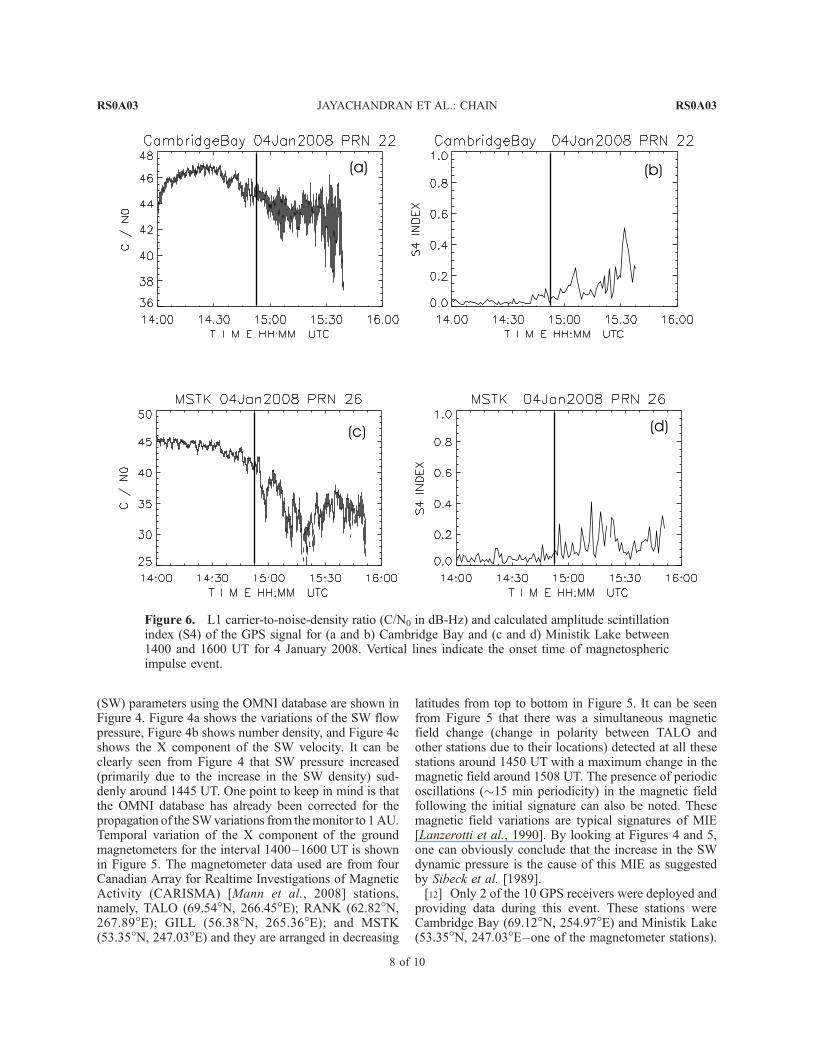
Figure 6. L1 carrier-to-noise-density ratio (C/N0 in dB-Hz) and calculated amplitude scintillationindex (S4) of the GPS signal for (a and b) Cambridge Bay and (c and d) Ministik Lake between1400 and 1600 UT for 4 January 2008. Vertical lines indicate the onset time of magnetosphericimpulse event.
RS0A03 JAYACHANDRAN ET AL.: CHAIN
8 of 10
RS0A03
Figure 6 shows the carrier-to-noise-density ratio (a mea-sure of the received power), expressed in dB-Hz, of theGPS signals from satellites at two stations (PRN 22 forCambridge Bay and PRN 26 for Ministik Lake) alongwith the S4 index (derived from the 50 Hz data). Wehave selected data above 10 degrees elevation and theelevation angle varied between 20 and 15 degrees forPRN 22 and between 30 and 25 degrees for PRN 26. Onecan clearly see the start of scintillation activity in the GPSsignal around �1450 UT at these two stations (alongcertain raypaths) associated with the MIE. Prior to this,there was no scintillation activity in the GPS signals (a lowS4 index). For this event, eight satellites were visible fromeach of these stations and scintillation activity is observedonly on the raypaths in the N–W direction of the stationand analysis of the raypath along with a statistical locationof the plasmapause showed that the scintillation signatureis only seen on the raypath skimming the plasmapause.One point to note here is that we have looked at only oneevent for this study and in order to make a valid connec-tion between MIE and scintillation and to identify thegeneration mechanism of scintillations, we have to look atmore events and a detailed study is already in progress.
5. Summary
[13] CHAIN is a network of 10 dual frequency highdata rate GPS receivers and six CADIs. Six of the 10 GPSreceivers are collocated with CADIs providing a uniqueinstrument configuration for detailed high-latitude iono-spheric studies. Broader scientific objectives of CHAINare the understanding of (1) drivers and variabilities ofpolar cap convection, (2) generation and dynamics ofionization structures (of different temporal and spatialscales), and (3) role of ionosphere in M-I coupling. TenGPS receivers and three CADIs are now in operationproviding near-real-time data. More details of the CHAINproject and data can be found at http://chain.physics.unb.ca/chain. A case study of GPS signal scintillationshowed the onset of scintillation associated with a MIE.
[14] Acknowledgments. Infrastructure funding for CHAINwas provided by the Canada Foundation for Innovation and theNew Brunswick Innovation Foundation. CHAIN andCARISMA operations are conducted in collaboration with theCanadian Space Agency. Science funding is provided by theNatural Sciences and Engineering Research Council of Canada.We acknowledge NASA’s Coordinate Data Analysis Web(CDAWEB) for providing the OMNI solar wind data.
References
Aarons, J. (1982), Global morphology of ionospheric scintilla-
tions, Proc. IEEE, 70(4), 360, doi:10.1109/PROC.
1982.12314.
Aarons, J. (1997), Global positioning system phase fluctuations
at auroral latitudes, J. Geophys. Res., 102, 17,219, doi:10.
1029/97JA01118.
Aarons, J., B. Lin, M. Mendillo, K. Liou, and M. Codrescu
(2000), Global positioning system phase fluctuations and
ultraviolet images from polar satellite, J. Geophys. Res.,
105, 5201, doi:10.1029/1999JA900409.
Arnoldy, R. L., M. J. Engebretson, J. L. Alford, R. E. Erlandson,
and B. J. Anderson (1996), Magnetic impulse events and
associated Pc 1 bursts at dayside high latitudes, J. Geophys.
Res., 101, 7793, doi:10.1029/95JA03378.
Baker, D., J. Allen, S. Kanekal, and G. Reeves (1998), Distrubed
space environment may have been related to pager satellite
failure, Eos Trans. AGU, 79(40), 477, doi:10.1029/
98EO00359.
Basu, S., and C. Valladares (1999), Global aspects of plasma
structures, J. Atmos. Sol. Terr. Phys., 61, 127, doi:10.1016/
S1364-6826(98)00122-9.
Boteler, D. H. (1998), Geomagnetic effect on electrical systems,
Phys. Can., 5, 332.
Bust, G. S., G. Crowley, T. W. Garner, T. L. Gaussiran II, R. W.
Meggs, C. N. Mitchell, P. S. J. Spencer, P. Yin, and B. Zapfe
(2007), Four-dimensional GPS imaging of space weather
storms, Space Weather, 5 , S02003, doi:10.1029/
2006SW000237.
Crowley, G. (1996), Critical review of Ionospheric patches and
blobs, in Review of Radio Science 1993–1996, edited by
W. R. Stone, pp. 619–648, Int. Union of Radio Sci., Brussels.
Foster, J. C., A. J. Coster, P. J. Erickson, J. M. Holt, F. D. Lind,
W. Rideout, M. McCready, A. VanEyken, R. A. Greenwald,
and F. J. Rich (2005), Multiradar observations of the polar
tongue of ionization, J. Geophys. Res., 110, A09S31,
doi:10.1029/2004JA010928.
Hajj, G. A., B. D. Wilson, C. Wang, X. Pi, and I. G. Rosen
(2004), Data assimilation of ground GPS total electron con-
tent into a physics-based ionospheric model by use of the
Kalman filter, Radio Sci., 39, RS1S05, doi:10.1029/
2002RS002859.
Heikkila, W. J. (1982), Impulsive plasma transport through the
magnetopause, Geophys. Res. Lett., 9, 159, doi:10.1029/
GL009i002p00159.
Hey, J. S., S. J. Parsons, and J. W. Phillips (1946), Fluctuations
in cosmic radiation at radio-frequencies, Nature, 158, 234,
10.1038/158234a0.
Hunsucker, R. D., and J. K. Hargreaves (2003), High Latitude
Ionosphere and its Effect on Radio Propagation, Cambridge
Univ. Press, Cambridge, U. K.
Jayachandran, P. T., and J. W. MacDougall (2001), Sunward
polar cap convection, J. Geophys. Res., 106, 29,009,
doi:10.1029/2001JA000101.
Kataoka, R., H. Fukunishi, and L. J. Lanzerotti (2003), Statis-
tical identification of solar wind origins of magnetic impulse
events, J. Geophys. Res., 108(A12), 1436, doi:10.1029/
2003JA010202.
RS0A03 JAYACHANDRAN ET AL.: CHAIN
9 of 10
RS0A03
Kintner, P. M., B. M. Ledvina, and E. R. de Paula (2007), GPS
and ionospheric scintillations, Space Weather, 5, S09003,
doi:10.1029/2006SW000260.
Konik, R. M., L. J. Lanzerotti, A. Wolfe, D. Venkatesan, and
C. G. Maclennan (1994), Cusp latitude magnetic impulse
events: 2. Interplanetary magnetic field and solar wind con-
ditions, J. Geophys. Res., 99, 14,831, doi:10.1029/
93JA03241.
Lanzerotti, L. J. (2001), Space weather effects on technologies,
in Space Weather, Geophys. Monogr. Ser., vol. 125, edited
by P. Song, H. J. Singer, and G. L. Siscoe, pp. 11–22, AGU,
Washington, D. C.
Lanzerotti, L. J., A. Wolfe, N. Trivedi, C. G. Maclennan, and
L. V. Medford (1990), Magnetic impulse events at high
latitudes: Magnetopause and boundary plasma processes,
J. Geophys. Res., 95, 97, doi:10.1029/JA095iA01p00097.
MacDougall, J. W., and P. T. Jayachandran (2001), Polar cap
convection relationship with solar wind, Radio Sci., 36,
1869, doi:10.1029/2001RS001007.
MacDougall, J. W., and P. T. Jayachandran (2007), Polar
patches: Auroral zone precipitation effects, J. Geophys.
Res., 112, A05312, doi:10.1029/2006JA011930.
Mann, I. R., et al. (2008), The upgraded CARISMA magne-
tometer array in the THEMIS era, Space Sci. Rev., 141, 413,
doi:10.1007/s11214-008-9457-6.
Meggs, R. W., C. N. Mitchell, and F. Honary (2008), GPS
scintillation over the European arctic during the November
2004 storms, GPS Solutions, 12, 281, doi:10.1007/s10291-
008-0090-3.
Mitchell, C. N., and P. S. J. Spencer (2003), A three dimen-
sional time-dependent algorithm for ionospheric imaging
using GPs signals, Ann. Geophys., 46, 687.
Mitchell, C. N., L. Alfonsi, G. De Franceschi, M. Lester,
V. Romano, and A. W. Wernik (2005), GPS TEC and scin-
tillation measurements from the polar ionosphere during the
October 2003 storm, Geophys. Res. Lett., 32, L12S03,
doi:10.1029/2004GL021644.
Pulkkinen, A., S. Lindahl, A. Viljanen, and R. Pirjola (2005),
Geomagnetic storm of 29–31 October 2003: Geomagneti-
cally induced currents and their relation to problems in the
Swedish high-voltage power transmission system, Space
Weather, 3, S08C03, doi:10.1029/2004SW000123.
Sibeck, D. G., W. Baumjohann, and R. E. Lopez (1989), Solar
wind dynamic pressure variations and transient magneto-
spheric signals, Geophys. Res. Lett., 16, 13, doi:10.1029/
GL016i001p00013.
Tsunoda, R. T. (1988), High latitude F region irregularities: A
review and synthesis, Rev. Geophys., 26, 719, doi:10.1029/
RG026i004p00719.
������������C. S. Carrano, Atmospheric and Environmental Research,
Inc., 131 Hartwell Avenue, Lexington, MA 02421, USA.
R. Chadwick, A. M. Hamza, P. T. Jayachandran, T. Kelly,
S. C. Mushini, and D. Pokhotelov, Physics Department, Univer-
sity of New Brunswick, Fredericton, NB E3B 5A3, Canada.
D. W. Danskin, Geomagnetic Laboratory, Natural Resources
Canada, 580 Booth, Ottawa, ON K1A 0E8, Canada.
Z. C. Kale, I. R. Mann, and D. K. Milling, Department of
Physics, University of Alberta, Edmonton, AB T6G 2R3,
Canada.
R. B. Langley, Department of Geodesy and Geomatics
Engineering, University of New Brunswick, Fredericton, NB
E3B 5A3, Canada.
J. W. MacDougall, Department of Physics and Astronomy,
University of Western Ontario, London, ON N6A 3K7,
Canada.
RS0A03 JAYACHANDRAN ET AL.: CHAIN
10 of 10
RS0A03


