Embed Size (px)
Citation preview
https://doi.org/10.30598/barekengvol16iss1pp343-354
March 2022 Volume 16 Issue 1 Page 343–354
P-ISSN: 1978-7227 E-ISSN: 2615-3017
BAREKENG: Jurnal Ilmu Matematika dan Terapan
343 https://ojs3.unpatti.ac.id/index.php/barekeng/ [email protected]
TREND SEMI AVERAGE AND LEAST SQUARE IN
FORECASTING YAMAHA MOTORCYCLE SALES Ines Saraswati Machfiroh1, Widiya Astuti Alam Sur2*, Robby Tri Pangestu3
1,2,3Accountancy Study Program Politeknik Negeri Tanah Laut
Jl. A. Yani No.Km.06, Pemuda, Kec. Pelaihari, Kabupaten Tanah Laut, Kalimantan Selatan 70815,
Indonesia
Corresponding author e-mail : 2* [email protected]
Abstract. This study compared the Semi Average and Least Square methods to determine the sales trend of Yamaha
motorcycles in obtaining the best method for predicting motorcycle sales at CV Surya Prima Pelaihari. Mean Absolute Percentage Error (MAPE) was used to determine the accuracy of the Semi Average and Least Square
methods in predicting the sales of CV Surya Prima Pelaihari motorbikes. Semi Average method was based on the
MAPE value of 43.96%. The Least Square method has a MAPE value of 31.89%. The comparison of MAPE values
shows that the Least Square method provides better predicting results because of the lower MAPE value. Therefore, the Least Square method was used to predict sales at CV Surya Prima Pelaihari. A more accurate output can be
obtained than the Semi Average method.
Keywords: Semi Average, Least Square, MAPE
Article info:
Submitted: 01st July 2021 Accepted: 10th March 2022
How to cite this article: I. S. Machfiroh, W. A. A. Sur, and R. T. Pangestu, “TREND SEMI AVERAGE AND LEAST SQUARE IN FORECASTING YAMAHA
MOTORCYCLE SALES”, BAREKENG: J. Il. Mat. & Ter., vol. 16, iss. 1, pp. 343-354, Mar. 2022.
This work is licensed under a Creative Commons Attribution-ShareAlike 4.0 International License. Copyright © 2022 Ines Saraswati Machfiroh,Widiya Astuti Alam Sur, Robby Tri Pangestu.

344 Machfiroh, et. al. Trend Semi Average And Least Square In …..…
1. INTRODUCTION
Sales at trading companies aim to support the company's growth and, of course, make a profit. In
carrying out its activities, a company certainly expects a good opportunity in the present or the future.
However, we do not know what opportunities will be obtained in the future, whether good opportunities or
vice versa.
A sales report is a form of a report that presents sales information compiled as sales analysis and
recording. Sales become the spearhead of a trading company, where sales reports act as a medium to convey
information about changes in the company's sales activities, whether there are increases or decreases [1]. The
more detailed, accurate, and easy to understand a sales report, the easier it is to make decisions related to
product sales in the future [2].
To avoid or minimize losses on sales that are not certain to come, the company should carry out a
predicting activity whose goal is that the company can calculate the estimated level of sales in the next period.
If the company does not carry out forecasting activities, the company will not know the picture of the
company's future state and will not develop for the better. According to [3], the technique used to make sales
forecasts is to create or prepare data or records that we have obtained regarding sales from the company, link
the company's sales with overall industry sales, and then conduct relationship analysis.
As for the forecasting analysis method to minimize losses on company sales, one of which is periodic
series analysis. Time series analysis is the art and science of predicting events that will occur using historical
data such as a company's financial statements and projecting it into the future with a mathematical model to
reduce unwanted risks. One of its uses is determining the financial estimates used for production in the future.
Therefore, an appropriate forecasting method is needed so that companies can get the maximum benefit from
a forecasting process.
In the time series analysis, several components can be used to analyze. One of which is trend analysis
which can be used to predict the sales production of a company in the future. Trend analysis is a statistical
analysis method that aims to determine the financial situation in the future. According to [4], trend analysis
is a statistical method that shows a forecast for the future. The right trend analysis method to precisely
determine the company's condition in terms of sales is the Half Average (Semi Average) method and the
Least Square method.
Semi Average is a forecasting method to determine the value of a variable at a certain time by dividing
the data into two parts. According to [5], the Semi Average method divides the data into two parts, namely
the first and second groups. Furthermore, these two groups are used to calculate trends and forecasting.
Meanwhile, according to [6], the trend equation obtained by using the Semi Average determines the tendency
of the value of a variable from time to time and be used to predict the value of a variable at a certain time.
Least Square is a forecasting method that uses two variables and also requires sales data in the past to
forecast sales in the future. Based on [7], the Least Square method is one method in the form of time-series
data, which requires sales data in the past to forecast sales in the future so that the results can be determined.
Meanwhile, according to [8], the Least Square method is used to find a linear relationship between two
variables by determining the trend line, which has the smallest number of squares of the difference between
the original data and the data on the trend line.
The Mean Absolute Percentage Error (MAPE) value measures the error rate in both methods, which is
a statistical measurement method for forecasting or prediction accuracy in two or more methods. The lower
the MAPE value, the ability of the forecasting method can be said to be feasible. According to [9], MAPE
can calculate the difference between the original and forecasted data. The difference is absolute and then
calculated as a percentage of the original data. The mean value is obtained from the result of the percentage.
A model has very good performance if the MAPE value is below 10% and has good performance if the MAPE
value is between 10% and 20%. Meanwhile, [10] is used to calculate the average absolute error percentage.
Motorcycles are the favorite means of transportation used by many people. As technology improves,
motorcycle manufacturers are increasingly developing their products. Various kinds of the latest types of
motorcycles are produced to attract public interest. Therefore, motorcycle dealers always provide the latest
motorcycles to increase the interest of the surrounding community every year, such as the Yamaha dealer in
Tanah Laut Regency, South Kalimantan.

BAREKENG: J. Il. Mat. & Ter., vol. 16(1), pp. 343-354, Mar. 2022. 345
CV Surya Prima is one of the most popular Yamaha dealers in Tanah Laut. This dealer is located on
Jl. H. Boejasin No. 1b Rt. 19, Angsau, Pelaihari District, Tanah Laut Regency, South Kalimantan Province
70812. CV Surya Prima Pelaihari is a branch of PT (Ltd.) Surya Inti Putra located in Surabaya, East Java.
CV Surya Prima Pelaihari offers loan services with attractive DP and monthly instalment promos. Surya
Prima Pelaihari and insurance companies are known to have tie-ups, thus making it easy for the buyer to get
their motorcycle insured at the dealership only. Surya Prima Pelaihari also has a service centre providing
original motorcycle accessories and several reliable mechanics. Various motorcycle models are available,
including Matic, Moped, Sport, Pp, At, and Lpm. Each year, the units sold vary. Sales in 2015 were 2,263
units, 1,240 units in 2016, 1,388 units in 2017, 2,410 units in 2018, and 3,501 units in 2019. Every year, CV
Surya Prima Pelaihari always provides the latest types of motorcycles.
2. RESEARCH METHODS
The object of this research was the sale of motorcycles at CV Surya Prima Pelaihari. CV Surya Prima
is one of the most popular Yamaha dealers in Tanah Laut Regency. This dealer is located on Jl. H. Boejasin
No. 1b Rt. 19, Angsau, Pelaihari District, Tanah Laut Regency, South Kalimantan Province 70812.
2.1 Description of Research
Objects The object of this research is the sale of motorcycles at CV Surya Prima Pelaihari. CV Surya
Prima is one of the most popular Yamaha dealers in Tanah Laut Regency. This dealer is located on Jl. H.
Boejasin No. 1b Rt. 19, Angsau, Pelaihari District, Tanah Laut Regency, South Kalimantan Province 70812.
2.2 Types of Data
The type of data is quantitative. The research method was descriptive and quantitative. The authors
performed data calculations using the trend of Semi Average and Least Square from the sales of CV Surya
Prima Pelaihari in 2015-2019 and then described the calculation results
2.3 Sources of Data
Sources of data that the authors get was secondary data. The data was obtained by the author directly
from CV Surya Prima Pelaihari in the Marketing section.
2.4 Documentation Data Collection Techniques
1) Documentation is the method used to obtain data and information in books, writings, pictures, and others
that support research. The documentation used in this study was from 2015-2019 motorcycle sales report
data.
2) The author conducted a literature study or library research by reading and studying books and journals
related to the problem to be studied as a literature review. References used were in the form of books,
journals, and searches via the internet as a media to assist the author in completing articles [11]
2.5 Data Analysis Techniques
In analyzing the research data, the authors used several methods:
1. Semi Average Method
This method divides the data into two groups, and each group was calculated on average. If the data is
even, then it is divided into two. If the data is odd, the data in the middle can be omitted or made twice
[12]. The formula or equation trend of the Semi Average method is as follows:
𝑌` = 𝑎 + 𝑏𝑋 (1)
Description:
Y` = Trend Value
a = Average group 1
b = 𝐾2−𝐾1
𝑛 (2)
K = Average in group
n = Number of data in one group
X = Period to be calculated
346 Machfiroh, et. al. Trend Semi Average And Least Square In …..…
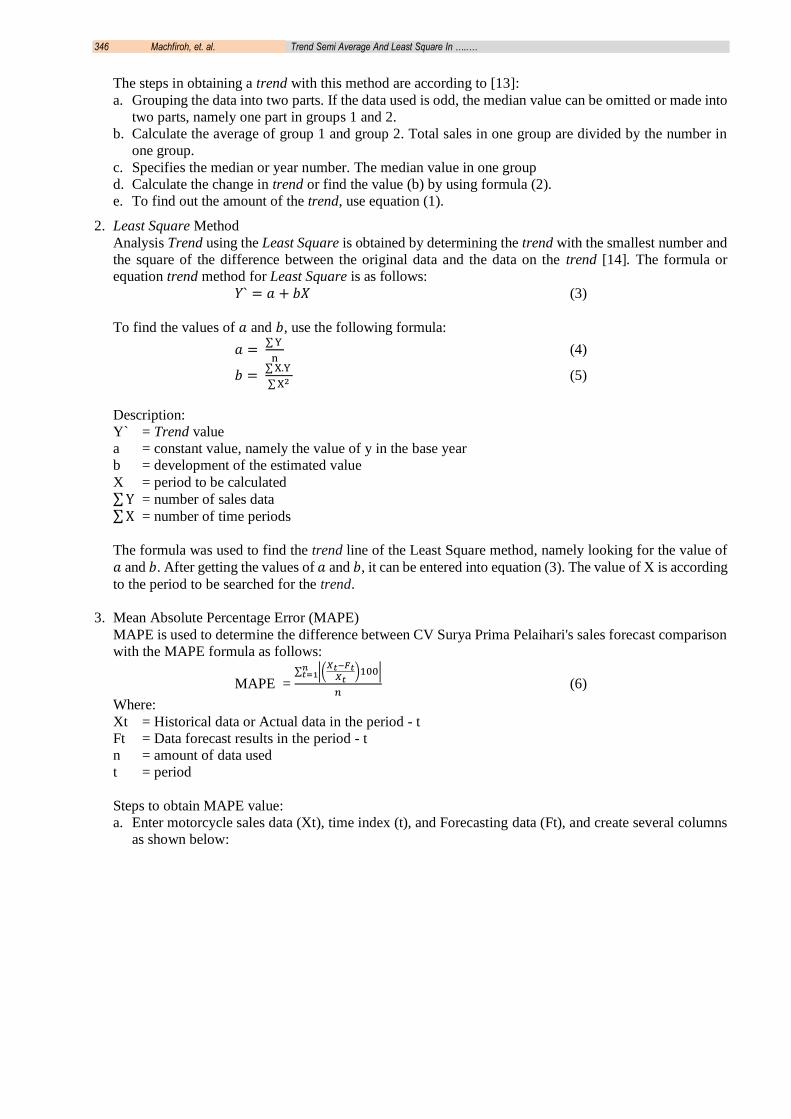
The steps in obtaining a trend with this method are according to [13]:
a. Grouping the data into two parts. If the data used is odd, the median value can be omitted or made into
two parts, namely one part in groups 1 and 2.
b. Calculate the average of group 1 and group 2. Total sales in one group are divided by the number in
one group.
c. Specifies the median or year number. The median value in one group
d. Calculate the change in trend or find the value (b) by using formula (2).
e. To find out the amount of the trend, use equation (1).
2. Least Square Method
Analysis Trend using the Least Square is obtained by determining the trend with the smallest number and
the square of the difference between the original data and the data on the trend [14]. The formula or
equation trend method for Least Square is as follows:
𝑌` = 𝑎 + 𝑏𝑋 (3)
To find the values of 𝑎 and 𝑏, use the following formula:
𝑎 = ∑ Y
n (4)
𝑏 = ∑ X.Y
∑ X2 (5)
Description:
Y` = Trend value
a = constant value, namely the value of y in the base year
b = development of the estimated value
X = period to be calculated ∑ Y = number of sales data ∑ X = number of time periods
The formula was used to find the trend line of the Least Square method, namely looking for the value of
𝑎 and 𝑏. After getting the values of 𝑎 and 𝑏, it can be entered into equation (3). The value of X is according
to the period to be searched for the trend.
3. Mean Absolute Percentage Error (MAPE)
MAPE is used to determine the difference between CV Surya Prima Pelaihari's sales forecast comparison
with the MAPE formula as follows:
MAPE = ∑ |(
𝑋𝑡−𝐹𝑡𝑋𝑡
)100|𝑛𝑡=1
𝑛 (6)
Where:
Xt = Historical data or Actual data in the period - t
Ft = Data forecast results in the period - t
n = amount of data used
t = period
Steps to obtain MAPE value:
a. Enter motorcycle sales data (Xt), time index (t), and Forecasting data (Ft), and create several columns
as shown below:
BAREKENG: J. Il. Mat. & Ter., vol. 16(1), pp. 343-354, Mar. 2022. 347
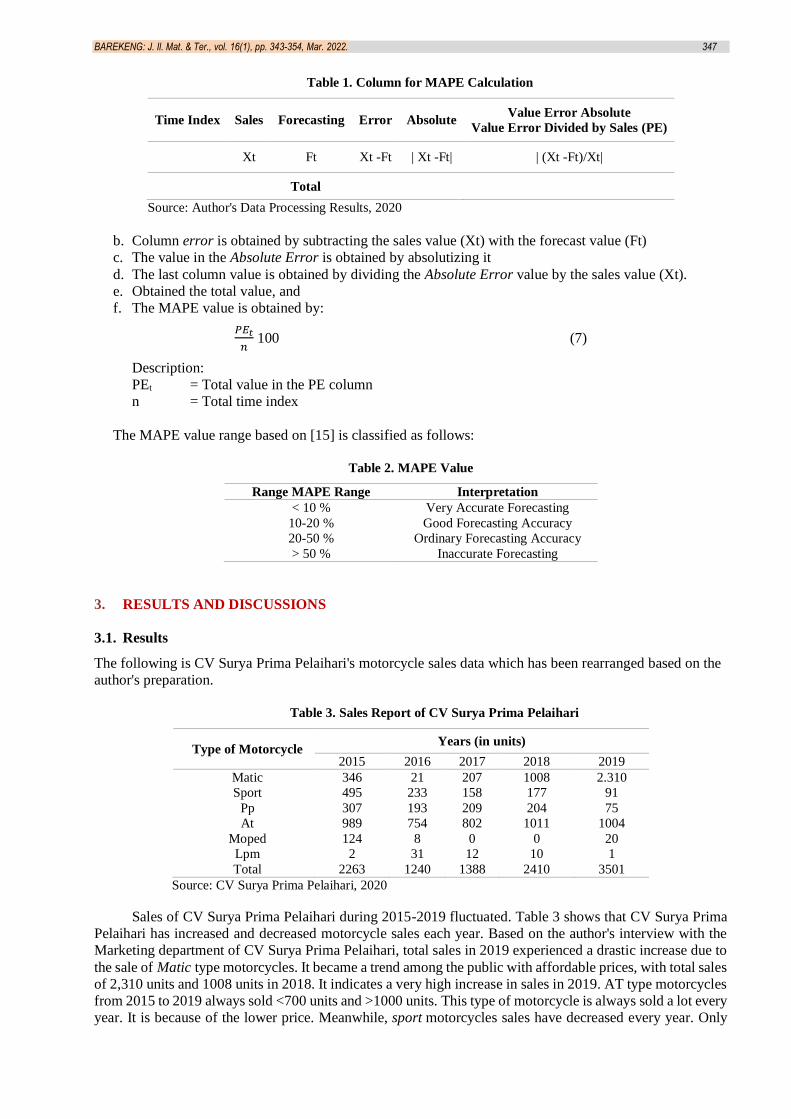
Table 1. Column for MAPE Calculation
Time Index Sales Forecasting Error Absolute Value Error Absolute
Value Error Divided by Sales (PE)
Xt Ft Xt -Ft | Xt -Ft| | (Xt -Ft)/Xt|
Total
Source: Author's Data Processing Results, 2020
b. Column error is obtained by subtracting the sales value (Xt) with the forecast value (Ft)
c. The value in the Absolute Error is obtained by absolutizing it
d. The last column value is obtained by dividing the Absolute Error value by the sales value (Xt).
e. Obtained the total value, and
f. The MAPE value is obtained by:
𝑃𝐸𝑡
𝑛 100 (7)
Description:
PEt = Total value in the PE column
n = Total time index
The MAPE value range based on [15] is classified as follows:
Table 2. MAPE Value
Range MAPE Range Interpretation
< 10 % Very Accurate Forecasting
10-20 % Good Forecasting Accuracy
20-50 % Ordinary Forecasting Accuracy
> 50 % Inaccurate Forecasting
3. RESULTS AND DISCUSSIONS
3.1. Results
The following is CV Surya Prima Pelaihari's motorcycle sales data which has been rearranged based on the
author's preparation.
Table 3. Sales Report of CV Surya Prima Pelaihari
Type of Motorcycle Years (in units)
2015 2016 2017 2018 2019
Matic 346 21 207 1008 2.310
Sport 495 233 158 177 91
Pp 307 193 209 204 75
At 989 754 802 1011 1004
Moped 124 8 0 0 20
Lpm 2 31 12 10 1
Total 2263 1240 1388 2410 3501
Source: CV Surya Prima Pelaihari, 2020
Sales of CV Surya Prima Pelaihari during 2015-2019 fluctuated. Table 3 shows that CV Surya Prima
Pelaihari has increased and decreased motorcycle sales each year. Based on the author's interview with the
Marketing department of CV Surya Prima Pelaihari, total sales in 2019 experienced a drastic increase due to
the sale of Matic type motorcycles. It became a trend among the public with affordable prices, with total sales
of 2,310 units and 1008 units in 2018. It indicates a very high increase in sales in 2019. AT type motorcycles
from 2015 to 2019 always sold <700 units and >1000 units. This type of motorcycle is always sold a lot every
year. It is because of the lower price. Meanwhile, sport motorcycles sales have decreased every year. Only
348 Machfiroh, et. al. Trend Semi Average And Least Square In …..…
in 2018 did it increases from 2017, and in 2019 it decreased again. It is due to the people's interest who prefer
to use a simple motorcycle for travelling, and the price is higher than others.
For Lpm-type motorcycles, each year, the units sold fluctuate. As shown in Table 2, the highest sales
occurred only in 2016, 31 units. Meanwhile, the lowest sales in 2019 were only 1 unit. It was due to the lack
of demand for goods on the market for Lpm vehicle types. For PP-type motorcycles and Sport types, sales
are always low compared to 2015, with 307 units. Compared to other motorcycles, the Moped in 2017 and
2018 had absolutely no sales occurred because, in that year, customers or the public were less interested in the
Moped type. In 2019, there were sales of 20 units. According to the Sales department of CV Surya Prima
Pelaihari, the ups and downs of sales each year are due to the increasing public interest and
following trends among the public. The demand for motorcycles also increased.
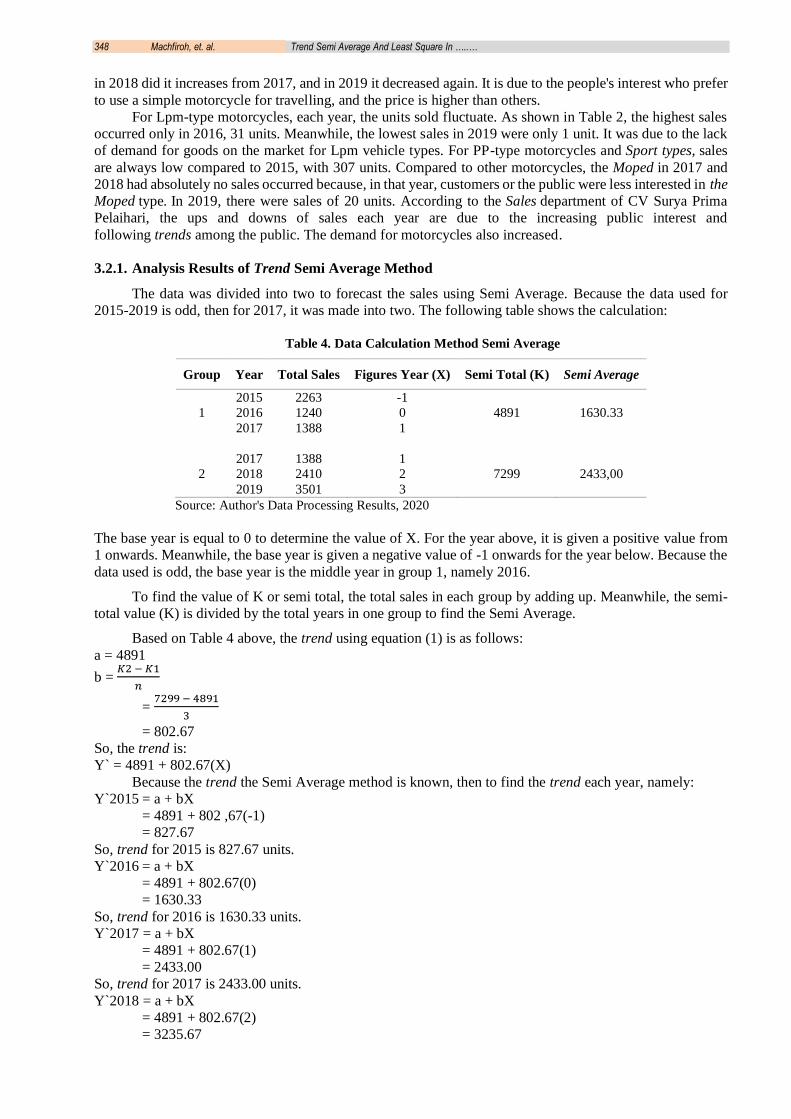
3.2.1. Analysis Results of Trend Semi Average Method
The data was divided into two to forecast the sales using Semi Average. Because the data used for
2015-2019 is odd, then for 2017, it was made into two. The following table shows the calculation:
Table 4. Data Calculation Method Semi Average
Group Year Total Sales Figures Year (X) Semi Total (K) Semi Average
2015 2263 -1
1 2016 1240 0 4891 1630.33
2017 1388 1
2017 1388 1
2 2018 2410 2 7299 2433,00
2019 3501 3
Source: Author's Data Processing Results, 2020
The base year is equal to 0 to determine the value of X. For the year above, it is given a positive value from
1 onwards. Meanwhile, the base year is given a negative value of -1 onwards for the year below. Because the
data used is odd, the base year is the middle year in group 1, namely 2016.
To find the value of K or semi total, the total sales in each group by adding up. Meanwhile, the semi-
total value (K) is divided by the total years in one group to find the Semi Average.
Based on Table 4 above, the trend using equation (1) is as follows:
a = 4891
b = 𝐾2 − 𝐾1
𝑛
= 7299 − 4891
3
= 802.67
So, the trend is:
Y` = 4891 + 802.67(X)
Because the trend the Semi Average method is known, then to find the trend each year, namely:
Y`2015 = a + bX
= 4891 + 802 ,67(-1)
= 827.67
So, trend for 2015 is 827.67 units.
Y`2016 = a + bX
= 4891 + 802.67(0)
= 1630.33
So, trend for 2016 is 1630.33 units.
Y`2017 = a + bX
= 4891 + 802.67(1)
= 2433.00
So, trend for 2017 is 2433.00 units.
Y`2018 = a + bX
= 4891 + 802.67(2)
= 3235.67
BAREKENG: J. Il. Mat. & Ter., vol. 16(1), pp. 343-354, Mar. 2022. 349
So, trend for 2018 is 3235.67 units.
Y`2019 = a + bX
= 4891 + 802.67(3)
= 4038.33
So, trend for 2019 is 4038.33 units.
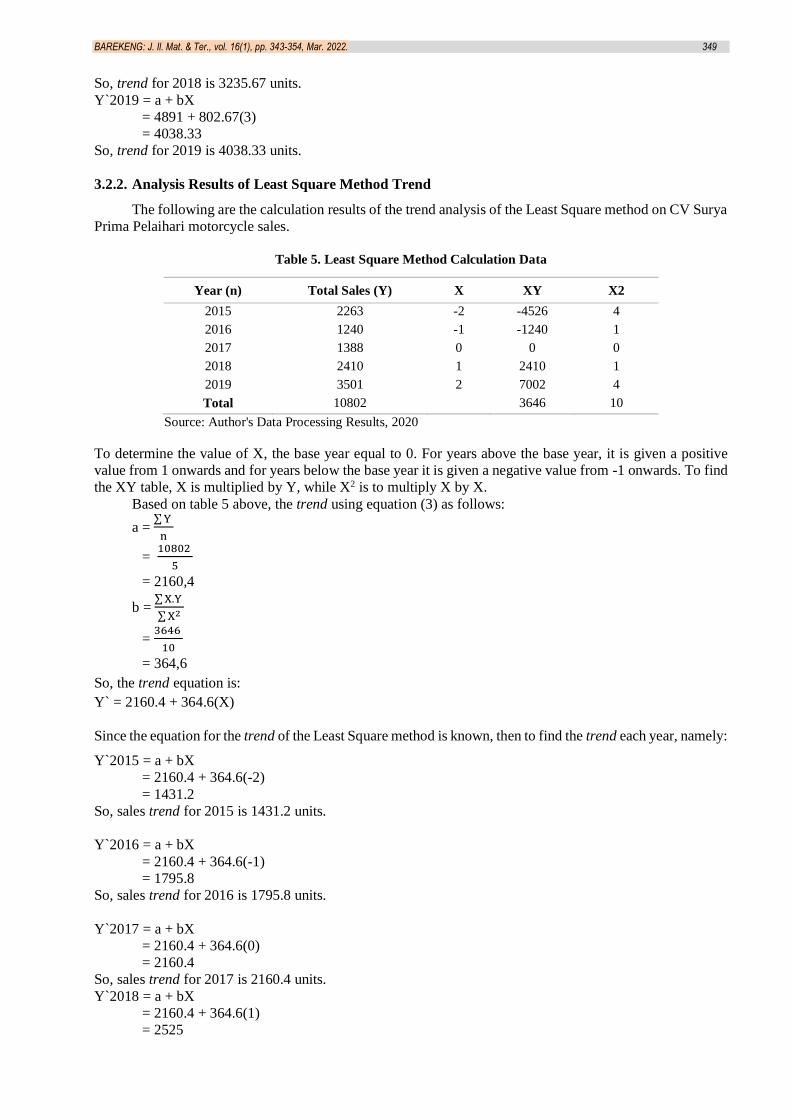
3.2.2. Analysis Results of Least Square Method Trend
The following are the calculation results of the trend analysis of the Least Square method on CV Surya
Prima Pelaihari motorcycle sales.
Table 5. Least Square Method Calculation Data
Year (n) Total Sales (Y) X XY X2
2015 2263 -2 -4526 4
2016 1240 -1 -1240 1
2017 1388 0 0 0
2018 2410 1 2410 1
2019 3501 2 7002 4
Total 10802 3646 10
Source: Author's Data Processing Results, 2020
To determine the value of X, the base year equal to 0. For years above the base year, it is given a positive
value from 1 onwards and for years below the base year it is given a negative value from -1 onwards. To find
the XY table, X is multiplied by Y, while X2 is to multiply X by X.
Based on table 5 above, the trend using equation (3) as follows:
a = ∑ Y
n
= 10802
5
= 2160,4
b = ∑ X.Y
∑ X2
= 3646
10
= 364,6
So, the trend equation is:
Y` = 2160.4 + 364.6(X)
Since the equation for the trend of the Least Square method is known, then to find the trend each year, namely:
Y`2015 = a + bX
= 2160.4 + 364.6(-2)
= 1431.2
So, sales trend for 2015 is 1431.2 units.
Y`2016 = a + bX
= 2160.4 + 364.6(-1)
= 1795.8
So, sales trend for 2016 is 1795.8 units.
Y`2017 = a + bX
= 2160.4 + 364.6(0)
= 2160.4
So, sales trend for 2017 is 2160.4 units.
Y`2018 = a + bX
= 2160.4 + 364.6(1)
= 2525
350 Machfiroh, et. al. Trend Semi Average And Least Square In …..…
So, sales trend for 2018 is 2525 units.
Y`2019 = a + bX
= 2160.4 + 364.6(2)
= 2889.6
So, sales trend for 2019 is 2889.6 units.
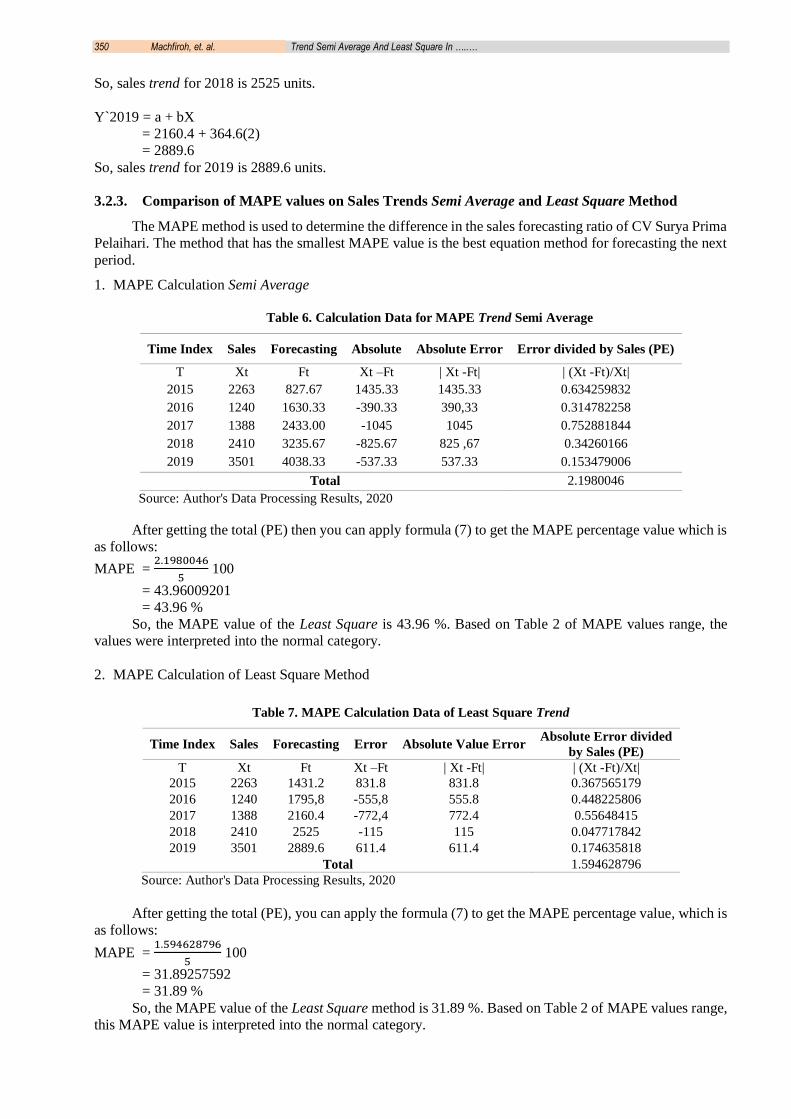
3.2.3. Comparison of MAPE values on Sales Trends Semi Average and Least Square Method
The MAPE method is used to determine the difference in the sales forecasting ratio of CV Surya Prima
Pelaihari. The method that has the smallest MAPE value is the best equation method for forecasting the next
period.
1. MAPE Calculation Semi Average
Table 6. Calculation Data for MAPE Trend Semi Average
Time Index Sales Forecasting Absolute Absolute Error Error divided by Sales (PE)
T Xt Ft Xt –Ft | Xt -Ft| | (Xt -Ft)/Xt|
2015 2263 827.67 1435.33 1435.33 0.634259832
2016 1240 1630.33 -390.33 390,33 0.314782258
2017 1388 2433.00 -1045 1045 0.752881844
2018 2410 3235.67 -825.67 825 ,67 0.34260166
2019 3501 4038.33 -537.33 537.33 0.153479006
Total 2.1980046
Source: Author's Data Processing Results, 2020
After getting the total (PE) then you can apply formula (7) to get the MAPE percentage value which is
as follows:
MAPE = 2.1980046
5 100
= 43.96009201
= 43.96 %
So, the MAPE value of the Least Square is 43.96 %. Based on Table 2 of MAPE values range, the
values were interpreted into the normal category.
2. MAPE Calculation of Least Square Method
Table 7. MAPE Calculation Data of Least Square Trend
Time Index Sales Forecasting Error Absolute Value Error Absolute Error divided
by Sales (PE)
T Xt Ft Xt –Ft | Xt -Ft| | (Xt -Ft)/Xt|
2015 2263 1431.2 831.8 831.8 0.367565179
2016 1240 1795,8 -555,8 555.8 0.448225806
2017 1388 2160.4 -772,4 772.4 0.55648415
2018 2410 2525 -115 115 0.047717842
2019 3501 2889.6 611.4 611.4 0.174635818
Total 1.594628796
Source: Author's Data Processing Results, 2020
After getting the total (PE), you can apply the formula (7) to get the MAPE percentage value, which is
as follows:
MAPE = 1.594628796
5 100
= 31.89257592
= 31.89 %
So, the MAPE value of the Least Square method is 31.89 %. Based on Table 2 of MAPE values range,
this MAPE value is interpreted into the normal category.
BAREKENG: J. Il. Mat. & Ter., vol. 16(1), pp. 343-354, Mar. 2022. 351
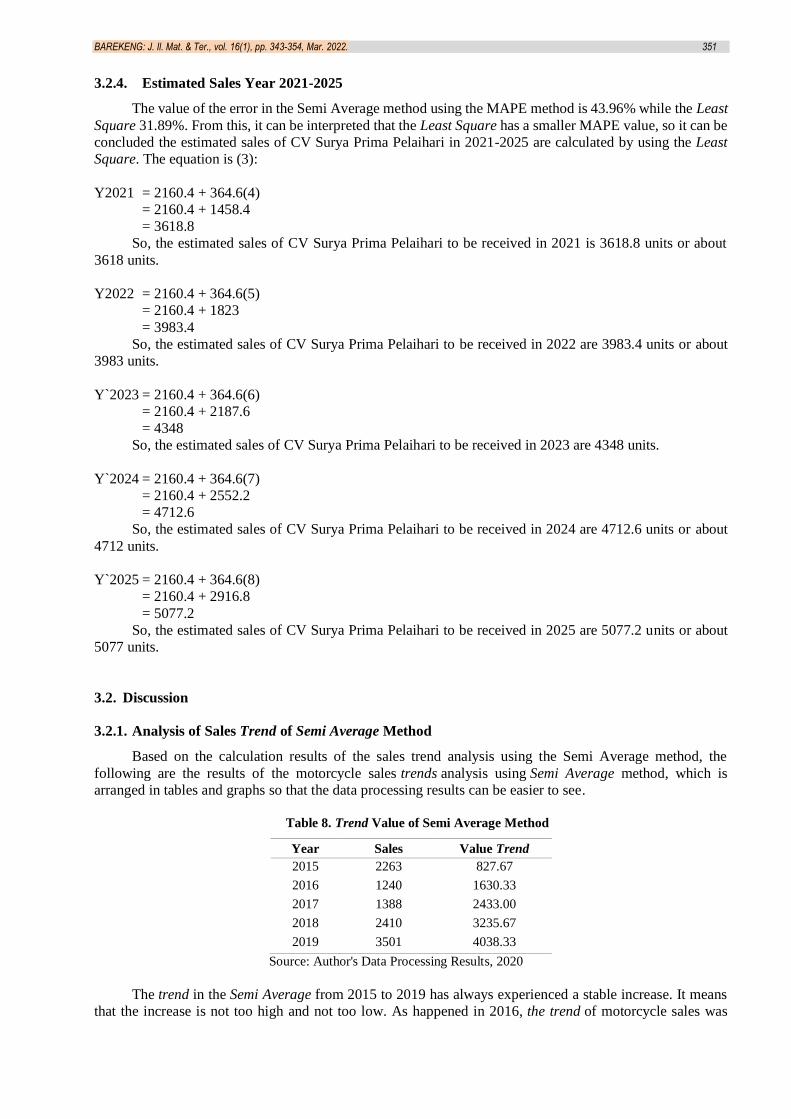
3.2.4. Estimated Sales Year 2021-2025
The value of the error in the Semi Average method using the MAPE method is 43.96% while the Least
Square 31.89%. From this, it can be interpreted that the Least Square has a smaller MAPE value, so it can be
concluded the estimated sales of CV Surya Prima Pelaihari in 2021-2025 are calculated by using the Least
Square. The equation is (3):
Y2021 = 2160.4 + 364.6(4)
= 2160.4 + 1458.4
= 3618.8
So, the estimated sales of CV Surya Prima Pelaihari to be received in 2021 is 3618.8 units or about
3618 units.
Y2022 = 2160.4 + 364.6(5)
= 2160.4 + 1823
= 3983.4
So, the estimated sales of CV Surya Prima Pelaihari to be received in 2022 are 3983.4 units or about
3983 units.
Y`2023 = 2160.4 + 364.6(6)
= 2160.4 + 2187.6
= 4348
So, the estimated sales of CV Surya Prima Pelaihari to be received in 2023 are 4348 units.
Y`2024 = 2160.4 + 364.6(7)
= 2160.4 + 2552.2
= 4712.6
So, the estimated sales of CV Surya Prima Pelaihari to be received in 2024 are 4712.6 units or about
4712 units.
Y`2025 = 2160.4 + 364.6(8)
= 2160.4 + 2916.8
= 5077.2
So, the estimated sales of CV Surya Prima Pelaihari to be received in 2025 are 5077.2 units or about
5077 units.
3.2. Discussion
3.2.1. Analysis of Sales Trend of Semi Average Method
Based on the calculation results of the sales trend analysis using the Semi Average method, the
following are the results of the motorcycle sales trends analysis using Semi Average method, which is
arranged in tables and graphs so that the data processing results can be easier to see.
Table 8. Trend Value of Semi Average Method
Year Sales Value Trend
2015 2263 827.67
2016 1240 1630.33
2017 1388 2433.00
2018 2410 3235.67
2019 3501 4038.33
Source: Author's Data Processing Results, 2020
The trend in the Semi Average from 2015 to 2019 has always experienced a stable increase. It means
that the increase is not too high and not too low. As happened in 2016, the trend of motorcycle sales was

352 Machfiroh, et. al. Trend Semi Average And Least Square In …..…
1630.33. It increases if compared to 2015, in which the trend was 827.67. Meanwhile, in 2017
the trend increased again by 2433.00. Likewise, in 2018 and 2019 were 3235.67 and 4038.33, respectively.
3.2.2. Analysis of Sales Trend of Least Square Method
Based on the calculation results of the sales trend analysis using the Least Square method, the following
are the results of the motorcycle sales trends analysis using the Least Square method, which are arranged in
the tables and graphs so that the data processing results can be easier to see.
Table 9. Trend of Least Square Method
Year Sales Value Trend
2015 2263 1431.20
2016 1240 1795.80
2017 1388 2160.40
2018 2410 2525.00
2019 3501 2889.60
Source: Author's Data Processing Results, 2020
The trend value on the Least Square method from 2015 to 2019 also always increases as the Semi
Average method. The value trend is not as far as the Semi Average method but remains stable from year to
year. As happened in 2016, the motorcycle sales trend was 1795.80, which increases compared to 2015, in
which the trend was 1431.20. Meanwhile, in 2017 the trend increased again by 2160.40. Likewise, 2018 and
2019 were 2525.00 and 2889.60, respectively.
3.2.3. Analysis of MAPE Values in the Semi Average and Least Square Methods
Based on the calculation results of the analysis of the MAPE values in the Semi Average and Least
Square, the MAPE values obtained from each method are 43.96% for the Semi Average method and 31.89%
for Method Least Square. Based on table 2, the MAPE value range, the MAPE value for the Semi Average
included in the normal category because the MAPE value is between 20-50%. Meanwhile, the Least Square
is also included in the normal category because the MAPE value is still between 20-50%. Both methods can
be used to forecast or predict motorcycle sales at CV Surya Prima Pelaihari.
The lower the MAPE value, the ability of the forecasting method can be said to be feasible. Based on
the MAPE value in both methods, the MAPE value for the Least Square is lower than the Semi Average.
Therefore, the Least Square can forecast or predict CV Surya Prima Pelaihari motorcycle sales in 2021 and
the future.
It is in line with Rachmad Budi Septiawan and Erna Zuni Astuti's entitled "Comparison of the Semi
Average Method and the Least Square for Forecasting Company Revenues at BLU UPTD Terminal
Mangkang Semarang." The Least Square is concluded to be better than the Semi Average in forecasting the
income of the Mangkang Terminal BLU.
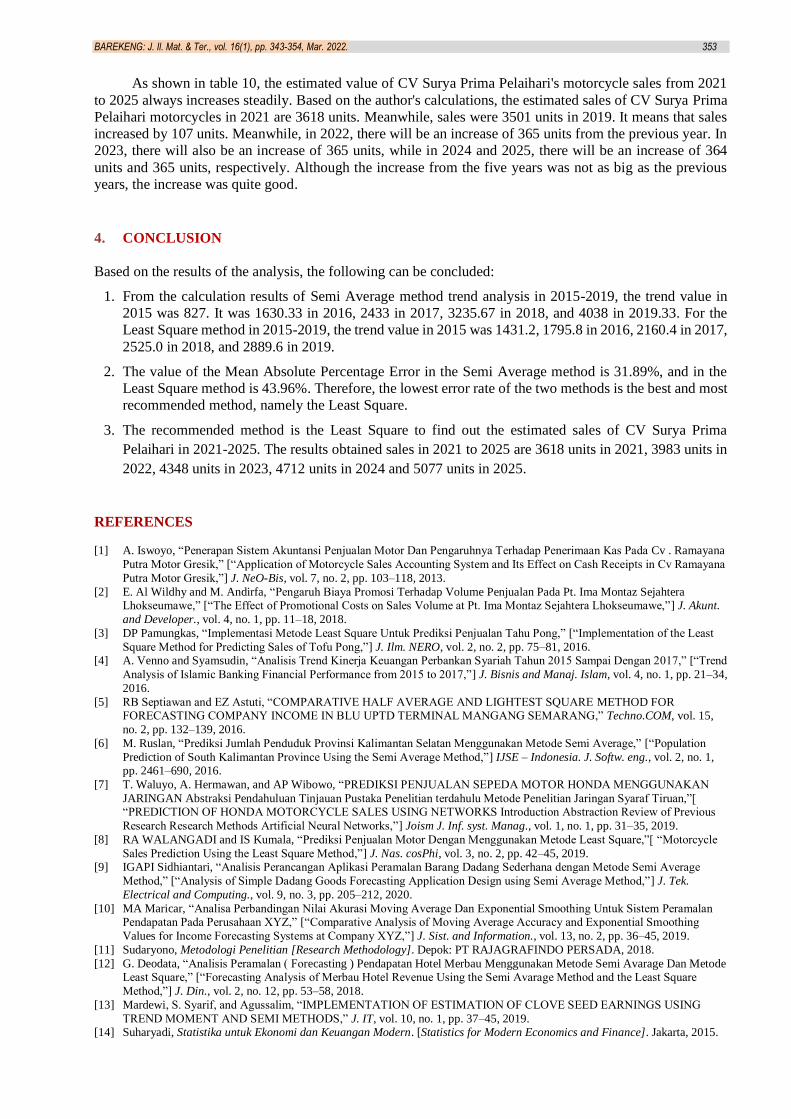
3.2.4. Analysis of Motorcycle Sales Estimation at CV Surya Prima Pelaihari in 2021-2025
To find out the estimated sales of motorcycles at CV Surya Prima Pelaihari in 2021 to 2025, the best
or more accurate method is the Least Square method. The estimated sales of CV Surya Prima Pelaihari
motorcycles for the next five years are presented in the form of Table 10 below:
Table 10. Estimated Sales Value in 2021-2025
Years Estimated Value
2021 3618
2022 3983
2023 4348
2024 4712
2025 5077
Source: Author’s Data Processing Results, 2020
BAREKENG: J. Il. Mat. & Ter., vol. 16(1), pp. 343-354, Mar. 2022. 353
As shown in table 10, the estimated value of CV Surya Prima Pelaihari's motorcycle sales from 2021
to 2025 always increases steadily. Based on the author's calculations, the estimated sales of CV Surya Prima
Pelaihari motorcycles in 2021 are 3618 units. Meanwhile, sales were 3501 units in 2019. It means that sales
increased by 107 units. Meanwhile, in 2022, there will be an increase of 365 units from the previous year. In
2023, there will also be an increase of 365 units, while in 2024 and 2025, there will be an increase of 364
units and 365 units, respectively. Although the increase from the five years was not as big as the previous
years, the increase was quite good.
4. CONCLUSION
Based on the results of the analysis, the following can be concluded:
1. From the calculation results of Semi Average method trend analysis in 2015-2019, the trend value in
2015 was 827. It was 1630.33 in 2016, 2433 in 2017, 3235.67 in 2018, and 4038 in 2019.33. For the
Least Square method in 2015-2019, the trend value in 2015 was 1431.2, 1795.8 in 2016, 2160.4 in 2017,
2525.0 in 2018, and 2889.6 in 2019.
2. The value of the Mean Absolute Percentage Error in the Semi Average method is 31.89%, and in the
Least Square method is 43.96%. Therefore, the lowest error rate of the two methods is the best and most
recommended method, namely the Least Square.
3. The recommended method is the Least Square to find out the estimated sales of CV Surya Prima
Pelaihari in 2021-2025. The results obtained sales in 2021 to 2025 are 3618 units in 2021, 3983 units in
2022, 4348 units in 2023, 4712 units in 2024 and 5077 units in 2025.
REFERENCES [1] A. Iswoyo, “Penerapan Sistem Akuntansi Penjualan Motor Dan Pengaruhnya Terhadap Penerimaan Kas Pada Cv . Ramayana
Putra Motor Gresik,” [“Application of Motorcycle Sales Accounting System and Its Effect on Cash Receipts in Cv Ramayana
Putra Motor Gresik,”] J. NeO-Bis, vol. 7, no. 2, pp. 103–118, 2013.
[2] E. Al Wildhy and M. Andirfa, “Pengaruh Biaya Promosi Terhadap Volume Penjualan Pada Pt. Ima Montaz Sejahtera Lhokseumawe,” [“The Effect of Promotional Costs on Sales Volume at Pt. Ima Montaz Sejahtera Lhokseumawe,”] J. Akunt.
and Developer., vol. 4, no. 1, pp. 11–18, 2018.
[3] DP Pamungkas, “Implementasi Metode Least Square Untuk Prediksi Penjualan Tahu Pong,” [“Implementation of the Least
Square Method for Predicting Sales of Tofu Pong,”] J. Ilm. NERO, vol. 2, no. 2, pp. 75–81, 2016. [4] A. Venno and Syamsudin, “Analisis Trend Kinerja Keuangan Perbankan Syariah Tahun 2015 Sampai Dengan 2017,” [“Trend
Analysis of Islamic Banking Financial Performance from 2015 to 2017,”] J. Bisnis and Manaj. Islam, vol. 4, no. 1, pp. 21–34,
2016.
[5] RB Septiawan and EZ Astuti, “COMPARATIVE HALF AVERAGE AND LIGHTEST SQUARE METHOD FOR FORECASTING COMPANY INCOME IN BLU UPTD TERMINAL MANGANG SEMARANG,” Techno.COM, vol. 15,
no. 2, pp. 132–139, 2016.
[6] M. Ruslan, “Prediksi Jumlah Penduduk Provinsi Kalimantan Selatan Menggunakan Metode Semi Average,” [“Population
Prediction of South Kalimantan Province Using the Semi Average Method,”] IJSE – Indonesia. J. Softw. eng., vol. 2, no. 1, pp. 2461–690, 2016.
[7] T. Waluyo, A. Hermawan, and AP Wibowo, “PREDIKSI PENJUALAN SEPEDA MOTOR HONDA MENGGUNAKAN
JARINGAN Abstraksi Pendahuluan Tinjauan Pustaka Penelitian terdahulu Metode Penelitian Jaringan Syaraf Tiruan,”[ “PREDICTION OF HONDA MOTORCYCLE SALES USING NETWORKS Introduction Abstraction Review of Previous
Research Research Methods Artificial Neural Networks,”] Joism J. Inf. syst. Manag., vol. 1, no. 1, pp. 31–35, 2019.
[8] RA WALANGADI and IS Kumala, “Prediksi Penjualan Motor Dengan Menggunakan Metode Least Square,”[ “Motorcycle
Sales Prediction Using the Least Square Method,”] J. Nas. cosPhi, vol. 3, no. 2, pp. 42–45, 2019. [9] IGAPI Sidhiantari, “Analisis Perancangan Aplikasi Peramalan Barang Dadang Sederhana dengan Metode Semi Average
Method,” [“Analysis of Simple Dadang Goods Forecasting Application Design using Semi Average Method,”] J. Tek.
Electrical and Computing., vol. 9, no. 3, pp. 205–212, 2020.
[10] MA Maricar, “Analisa Perbandingan Nilai Akurasi Moving Average Dan Exponential Smoothing Untuk Sistem Peramalan Pendapatan Pada Perusahaan XYZ,” [“Comparative Analysis of Moving Average Accuracy and Exponential Smoothing
Values for Income Forecasting Systems at Company XYZ,”] J. Sist. and Information., vol. 13, no. 2, pp. 36–45, 2019.
[11] Sudaryono, Metodologi Penelitian [Research Methodology]. Depok: PT RAJAGRAFINDO PERSADA, 2018.
[12] G. Deodata, “Analisis Peramalan ( Forecasting ) Pendapatan Hotel Merbau Menggunakan Metode Semi Avarage Dan Metode Least Square,” [“Forecasting Analysis of Merbau Hotel Revenue Using the Semi Avarage Method and the Least Square
Method,”] J. Din., vol. 2, no. 12, pp. 53–58, 2018.
[13] Mardewi, S. Syarif, and Agussalim, “IMPLEMENTATION OF ESTIMATION OF CLOVE SEED EARNINGS USING
TREND MOMENT AND SEMI METHODS,” J. IT, vol. 10, no. 1, pp. 37–45, 2019. [14] Suharyadi, Statistika untuk Ekonomi dan Keuangan Modern. [Statistics for Modern Economics and Finance]. Jakarta, 2015.

354 Machfiroh, et. al. Trend Semi Average And Least Square In …..…
[15] TW Epps, Quantitative Finance Its Development, Mathematical Foundations and Current Scope. United States of America:
John Wiley & Sons, 2009.