Embed Size (px)
Citation preview

Journal of Transport Geography 31 (2013) 181–191
Contents lists available at ScienceDirect
Journal of Transport Geography
journal homepage: www.elsevier .com/ locate / j t rangeo
Transportation planning methodologies for post-disaster recoveryin regional communities: the East Japan Earthquake and tsunami 2011
0966-6923/$ - see front matter � 2013 Elsevier Ltd. All rights reserved.http://dx.doi.org/10.1016/j.jtrangeo.2013.07.005
⇑ Corresponding author. Tel.: +61 6206 3942.E-mail addresses: [email protected] (H. Nakanishi), k-matsuo@
ace.tut.ac.jp (K. Matsuo), [email protected] (J. Black).
1 In Japan, the Ministry of Land, Infrastructure, Transport and Tourism (Mconducted the national transport survey in selected 70 cities and 60 towns/vunderstand the situation of transportation since 1987. The surveyed cities anvillages include: three metropolitan area (Tokyo, Osaka, Nagoya and their sing cities); regional center cities (Sapporo, Sendai, Hiroshima, KitakyuFukuoka) and their surrounding cities; regional cities (more than 400,000tion); regional cities (less than 400,000 population); other regional cities, agtowns/villages (25); rural towns/villages (35). The most recent survey was coin 2010.
Hitomi Nakanishi a,⇑, Kojiro Matsuo b, John Black c
a Faculty of Business, Government and Law, University of Canberra, Bruce, ACT 2601, Australiab Department of Architecture and Civil Engineering, Toyohashi University of Technology, 1-1 Hibarigaoka, Tempaku, Toyohashi, Aichi 441-8580, Japanc Transport Engineering School of Civil and Environmental Engineering, University of New South Wales, Sydney, NSW 2052, Australia
a r t i c l e i n f o
Keywords:Disaster management cycleTransportation planning modelScenario planningRegional communityEarthquakeJapan
a b s t r a c t
Spatial planning provides tools to government authorities that support integrated response strategies aspart of the disaster management but regional communities outside of the metropolitan areas often lackthe necessary capacity and resources to implement these approaches. Unlike in the USA, there are noguidelines for transportation planners in coping with post-disaster situations in Japan. There is a substan-tive literature on institutions, concepts of urban sustainability and resilience, community engagementand travel behavioral adjustments to natural disasters and man-made disruptions to transportation sup-ply in the emergency phase but only limited research into travel demand modeling in the recovery phase.This paper focuses on the recovery phase – and constructs conceptual and operational demand and sup-ply models for the recovery phase to help seek options for more sustainable outcome. The methodology isapplied to the city of Ishinomaki, Japan, one of the many regional communities devastated by the March,2011 earthquake and tsunami where only limited capacity and data are available. Future hypotheticalscenarios for the city are analyzed to illustrate the potential practicality of the proposed methodologywith the indicators of travel performance of the scenarios in the case study area. The paper concludeswith implication to planning, including the full re-location of peninsular villages, and further researchneeds.
� 2013 Elsevier Ltd. All rights reserved.
LIT) hasillages tod towns/urround-
1. Introduction
Integrated response strategies to disasters are needed in orderto create resilient communities capable of facing risks with greaterflexibility (Reis, 2013; Sapountzaki et al., 2011). This entails linkingactors and policies throughout a disaster management cycle thathas the following stages: (a) reconstruction and recovery, concern-ing the long-term activities aimed at returning an area to ‘normal-ity’ after severe devastation; (b) pre-disaster or preventiveplanning covering activities which range from the construction ofdefensive engineering works to land-use planning and elaborationof evacuation plans; (c) preparedness reflecting alertness immedi-ately before the onset of a hazard; and (d) response referring toreaction activities immediately before and after the event and(emergency) relief operations (Smith, 2001).
The problem is that, within this disaster management cycle,spatial planning (and transportation planning) is largely absent.Spatial planning ‘has the tools’ to guide new residential, commer-cial and economic development away from identified hazardous
areas (Sapountzaki et al., 2011). Transportation planning is a com-ponent of spatial planning so it is hypothesized there must be a lit-erature on decision support tools and techniques that can readilybe applied to the recovery of communities devastated by naturaldisasters, such as earthquakes, floods, typhoons and tsunamis.The aim of this research – more broadly into planning for resilienturban development (Campanella, 2006; Ganor and Ben-lavy, 2003;Godschalk, 2003; Haigh and Amaratunga, 2010) – is to developdecision support tools for governments responsible for the recon-struction of devastated regional cities in Japan. We define in thisresearch Japanese regional communities as being located neitherin the metropolitan areas nor in the regional center areas, and haveless than a population of 400,000 (MLIT, 2012).1
syu andpopula-
riculturalnducted
182 H. Nakanishi et al. / Journal of Transport Geography 31 (2013) 181–191
We have identified that much of the transportation research onpost-disasters is US-based, where the planning authorities are gen-erally well resourced with strategic transportation planning toolsand have professional expertise and data bases for decision sup-port. For example, the US Federal Highway Administration/FederalTransit Administration (2007) offers a briefing book for transporta-tion decision makers, officials, and staff. However, there are sub-stantial resource constraints in the developing world, or in theregional cities of the developed world, that has led us to searchthe literature for relevant tools; in their absence, we propose asuitable methodology from first principles for post-disaster trans-portation planning. The existing literature has rarely exploredpost-disaster transportation arrangements or mid-to long-termtravel behavioral responses of residents remaining after a disaster(Section 2).
Two years after the 11th March 2011 earthquake and tsunamidisaster in Japan, the challenges that local governments are facingare: how to re-design the transportation system considering pro-jected mid-term and long-term settlement and land use; andhow to generate designs that enhance the preparedness for futureevents. To address these challenges, the classification of the stages/phases of a disaster based on a lifecycle is useful as it helps to illus-trate what strategies could be considered or developed at the var-ious stages of a disaster, and how to move into the next stage(Ritchie, 2004). In Section 3, four phases are distinguished – thepre-disaster situation; the emergency disaster phase; the tempo-rary settlement phase; and the recovery phase – and we constructconceptual demand and supply models for the recovery phase. Theresearch reported here focuses on planning frameworks and deci-sion tools applied to a specific case study of Ishinomaki, Japan,which was impacted by the earthquake and tsunami (Section 4).Scenarios of future spatial distributions of population and employ-ment are constructed and the operational models formulated areapplied to estimate various standard performance indicators suchas vehicle kilometers of travel. The paper concludes with the impli-cations to spatial planning in the case study city and research moregenerally in the transportation field of disaster management.
2. A review of research on decision support tools on post-disaster transport provision
2.1. Travel demand
There is extensive research on the behavioral adjustments thaturban travelers make in response to transportation disruptions,irrespective of whether caused by natural or man-made events.This literature includes travel behavioral responses to network dis-ruptions caused by public transit strikes; bridge closures; specialevents, such as the Summer Olympic and the Winter OlympicGames; and earthquakes, floods and tsunamis. Most of these stud-ies are largely descriptive of behavioral change – usually with sta-tistics typically based on a change of traffic flows on highways andtime of day of travel before and after the event. One of the most re-cent studies is by Zhu et al. (2010) who analyzed the adjustmentsto traveler’s decisions following the collapse of the I-35 W bridgeover the Mississippi River in Minneapolis in 2007 with a view tobetter understand the short-term traffic dynamics and behavioralreactions to major transportation network disruptions. This studyfollows a line of travel behavior research in North Americaprompted by natural disasters, or infrastructure repair and mainte-nance, such as the 1989 Loma Prieta earthquake in San Francisco(Ardekani, 1992), the 1994 Northridge earthquake, Los Angeles(Deakin, 1997; Guiliano and Golob, 1998), the traffic managementoperations during the I-195 Providence River Bridge Repair Project(Devine et al., 1992), and the 14-month closure for repair of the
Centre Street Bridge in downtown Calgary, Canada (Hunt et al.,2002).
Zhu and Levinson (2008) identify short-term travel behavioralchanges immediately after a network disruption as:
– Change in the normal routes followed by drivers of vehiclesbecause of road, and ramp closures or congestion caused bytraffic re-allocating over non-effected routes.
– Adjustment in travel-time departure to avoid as much conges-tion as possible.
– Consolidation of trip purposes and, or, less frequent travel.– Switch to alternative transport modes; and– Share travel duties among family members.
There has been less emphasis on modeling behavior with thenotable exception of Osaragi (2012) and Holguin-Veras et al.(2003), who conducted a stated-preference experiment on NewYork residents six months after the September 11th terrorist at-tacks on the Twin Tower Buildings on lower Manhattan. They at-tempted to determine the process people use to decide whetherto make an inter-city trip by airplane, train or automobile. Statedpreference data were used to calibrate behavioral mode-choicemodels based on Random Utility Theory. Osaragi (2012) con-structed several models that describe decision-making and behav-ior of individuals in a large city attempting to reach home on footin the wake of a major earthquake. Probability models were cali-brated using data taken from questionnaire surveys and person-trip surveys conducted in the Tokyo Metropolitan area. This simu-lation of the movement of individuals having decided to returnhome on foot was then applied to determine the spatio-temporaldistribution of those who might be exposed to city fires that are ig-nited during earthquakes.
Suarez et al. (2005) applied the traditional four-step transporta-tion model calibrated for Boston, Massachusetts, with a set of plau-sible assumptions to test the impacts of severe flooding scenarios.Assumptions include: a flooded road implies that the link is ren-dered useless, and therefore its capacity was set equal to zero;no trips were generated from flooded residential areas; commutingtrips that have as destination a flooded industrial or commercialarea were canceled from the data base; and shopping trips thathave as destination a flooded area were redirected to the closestcommercial area. By comparing the transportation model run thatincorporates these changes with the run under non-flooded condi-tions, a number of performance indicators were obtained. These in-clude: the number of trips canceled due to flooding of the origin ordestination; the number of trips canceled due to inability to gofrom origin to destination; the difference in vehicle miles traveled(VMT) and the difference in vehicle hours traveled (VHT), which isan economic impact based on the additional network delay thatcan be allocated a cost using the monetary value of time appropri-ate for the study area. Despite the efforts in understanding thetransportation demand and travel behavioral responses after theunexpected disruption of a transportation network, the authors lo-cated no literature that analyzes the transition in transportationdemand and behavior, within the disaster management. The recentwork by Chang et al. (2012) examined the dynamics of urban disas-ter risk of 35 years in Metro Vancouver and its link with casualtiesand transportation risk. However, the analysis was focused on thetransportation disruption during the emergency phase, by the lossof a bridge.
2.2. Transport supply
Studies of behavioral travel demand change is accompanied byquantification of damage to transportation supply. In most of thepublished studies of disruptions to the transportation system,
H. Nakanishi et al. / Journal of Transport Geography 31 (2013) 181–191 183
diagrammatic maps show the links in the transportation networkthat have been taken out of service. By using GIS, Bono and Gut-iérrez (2011) applied a method that integrates spatial and networkanalysis into a before and after connectivity network in the after-math of the Haiti earthquake in 2010. A study by Chang and Noj-ima (2001) proposes transport performance measures for thesituation before and after a disaster. One measure is the ratio ofthe network length open after the event to what was before theevent took place (where 0 equates with total system failure; and1 with a completely-functioning network). Another measure isthe overall measure of the accessibility of the network based onnetwork node connections before and after the event. It is worthpointing out that Kansky (1963), drawing on graph theory, cameup with a wider array of quantitative indices describing transpor-tation networks, including connectivity measures. Furthermore, ifthe spatial distribution of social and economic activities on the net-work (both before and after the event) is known then other mea-sures of potential accessibility can be deployed (Geurs and vanEck, 2001).
2.3. Implications for research in regional cities
Whilst we agree with Sapountzaki et al. (2011) that spatialplanning ‘has the tools’ to guide new residential, commercial,and economic development away from identified hazardous areasthis research have found no literature on post-disaster transporta-tion planning for regional cities like the disaster encountered in Ja-pan during and after the 2011 earthquake and tsunami. Moreover,the focus of the literature is dominantly on tentative transporta-tion provision and travel behavioral response in the emergencyphase. This guides the understanding of the emergency travel de-mand but fails to assist the spatial planning that requires a consid-eration of the resettlement of people and the communitypreparedness to engage in future planning of the area. Recoveryis a long-term process but the literature rarely focused on land-use and transportation planning support tools that assist decisionsabout future development. Therefore, our aim is to develop trans-portation planning decision support tools for authorities responsi-ble for the reconstruction, especially of devastated, regional cities.From the literature review it is clear that there are quantitativetools for transportation supply analysis, travel demand forecastingand the kinds of behavioral adjustments that travelers make afternatural or man-made disruptions to the transportation system.However, to the best of our knowledge no one has tried to putthese tools together in recovery cycle that can form the basis ofsustainability in regional cities, including in Japan.
3. Methodology
3.1. Conceptual model of travel and location behavior after disasters
One of the most explicit representation of travel behavior (bothas a set of decisions made by individuals in response to the phys-ical transportation system, and in response to the decisions ofother travelers (especially in congested urban situations), is givenby Teply (1982). In ‘saturated networks’ travelers are forced tore-evaluate their decisions in response to excessive travel timesor ‘costs of travel’ (Teply, 1982).
At the first level, choice involves considerations about the needand motivation for making a trip. If the activities themselves arenot considered worthwhile then no trips are made. (The substitu-tion of travel by tele-communications is relevant here.) The secondlevel is about locational decisions that affect the origin and the des-tination of the trip. In the short term, this may involve choosingdestinations closer to origins, or implementing trip chaining to
reduce the amount of travel, but, in the long-term, level 2 includesrelocation of residences and workplaces, and the rearrangement ofsocial, cultural and recreational activities. The third level of choiceinvolves time of travel (both the time of departure from the originas well as the time of arrival at the destination, and this is clearly acomplex phenomenon (Teply, 1982). In the advent of a disturbanceto any established equilibrium (such as a transportation mode thatis suddenly unavailable) the fourth level of choice indicatestransportation-choice decisions: for users of private transporta-tion, a partial change (for example, use of park-and-ride) or a com-plete change to public transportation; for users of publictransportation who are not captive riders there is a choice of pri-vate transportation. The fifth level of choice is where alternativeroutes that can be constantly modified on impulse at any pointin time by motorists – there are various reasons for this changeranging from when an unusually long queue of vehicles is ap-proached, or selecting another route just for a change of scenery.Finally, for the final choice (and one closely tied to route choice)is parking at the destination.
These levels of choice imply a stable home base and activity setsas represented by alternative destinations. Devastating events suchas a tsunami destroy large parts of human settlements so there areinevitable re-locations of homes and activity destinations. This canbe thought of as having four sequential phases. This researchdeconstructs the problem into four parts with each correspondingto a major temporal event: an urban area and its travel patterns themoment before the disaster strikes; the situation with travelbehavior and the transportation infrastructure and services duringthe disaster; the situation after the emergency survival mode per-iod is over; and the long-term future as the urban area struggles torecover to normal – if indeed that is possible. Among the fourphases in Table 1, this research focuses on the recovery phase –the long-term reconstruction of communities and the travel behav-ioral responses involved, and the identification of potential datasources in regional cities.
In the recovery phase, central and local governments oftenmake new institutional arrangements to assist with the rebuildingof communities. Depending on the complexity of planning recon-struction, and the involvement of stakeholders, including the com-munity, this may take up to two years (Blakely, 2011). Togeneralize our conceptual model this research will assume thatthe strategic planning work and detailed urban design work iscompleted by time, t + epsilon. Experience from previous naturaldisasters can shed some light on these recovery times (Kameland Loukaitou-Sideris, 2004; Perry and Lindell, 2003).
Authorities must make strategic choices as to whether to re-build the human settlements in the same place, or relocate devel-opment to safer areas and abandon the former settlement. There isanother important question: should the creation of a new settle-ment meet new urban design standards and aim to be more sus-tainable than the previous settlement? Once an urban layout hasbeen determined, or preferably, as part of that planning process,land-use and transportation planning models can be applied tooptimize designs given nominated objectives. Broad infrastructurecosts and economic, social and environmental impacts and benefitscan be estimated using standard procedures (US Federal HighwayAdministration/Federal Transit Administration, 2007). Future tra-vel behavior in any case study area can readily be quantified if sur-veys have been conducted – although this was not the case for theCity of Ishinomaki and in many regional cities in Japan.
3.2. Japanese study area
The Pacific coast area of eastern Japan was struck by the GreatEast Japan Earthquake that occurred at 14:46 on 11 March 2011.The magnitude of this earthquake was 9.0 – the largest in Japan’s
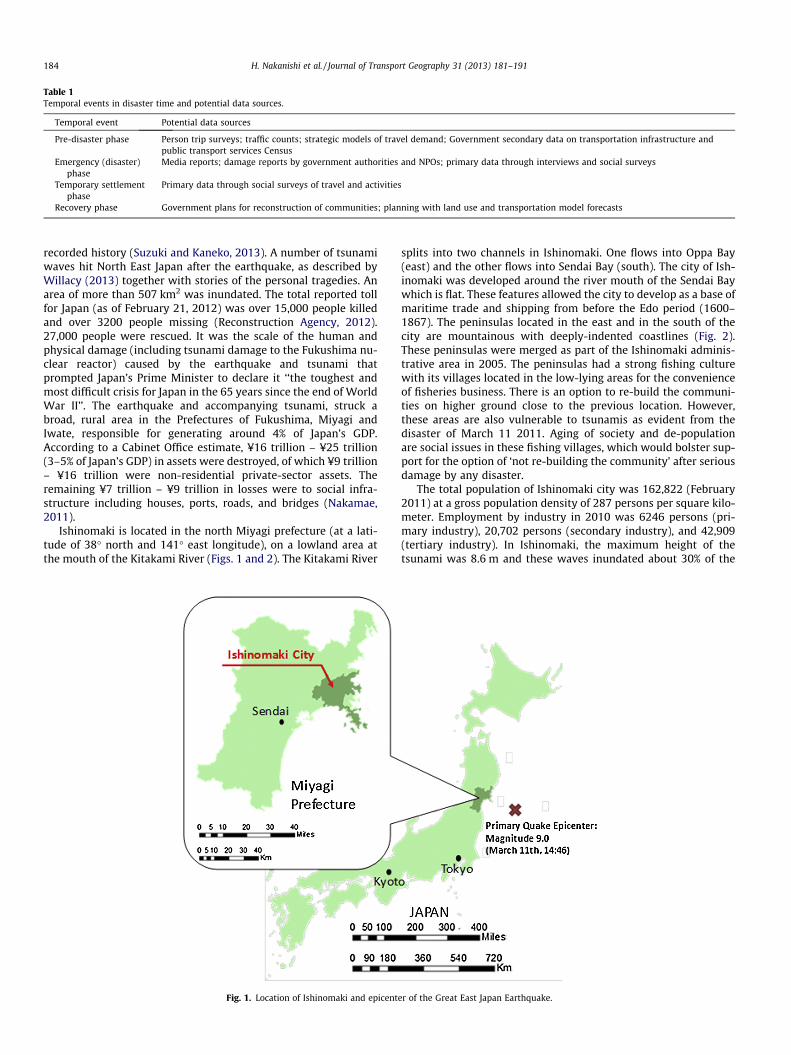
Table 1Temporal events in disaster time and potential data sources.
Temporal event Potential data sources
Pre-disaster phase Person trip surveys; traffic counts; strategic models of travel demand; Government secondary data on transportation infrastructure andpublic transport services Census
Emergency (disaster)phase
Media reports; damage reports by government authorities and NPOs; primary data through interviews and social surveys
Temporary settlementphase
Primary data through social surveys of travel and activities
Recovery phase Government plans for reconstruction of communities; planning with land use and transportation model forecasts
184 H. Nakanishi et al. / Journal of Transport Geography 31 (2013) 181–191
recorded history (Suzuki and Kaneko, 2013). A number of tsunamiwaves hit North East Japan after the earthquake, as described byWillacy (2013) together with stories of the personal tragedies. Anarea of more than 507 km2 was inundated. The total reported tollfor Japan (as of February 21, 2012) was over 15,000 people killedand over 3200 people missing (Reconstruction Agency, 2012).27,000 people were rescued. It was the scale of the human andphysical damage (including tsunami damage to the Fukushima nu-clear reactor) caused by the earthquake and tsunami thatprompted Japan’s Prime Minister to declare it ‘‘the toughest andmost difficult crisis for Japan in the 65 years since the end of WorldWar II’’. The earthquake and accompanying tsunami, struck abroad, rural area in the Prefectures of Fukushima, Miyagi andIwate, responsible for generating around 4% of Japan’s GDP.According to a Cabinet Office estimate, ¥16 trillion – ¥25 trillion(3–5% of Japan’s GDP) in assets were destroyed, of which ¥9 trillion– ¥16 trillion were non-residential private-sector assets. Theremaining ¥7 trillion – ¥9 trillion in losses were to social infra-structure including houses, ports, roads, and bridges (Nakamae,2011).
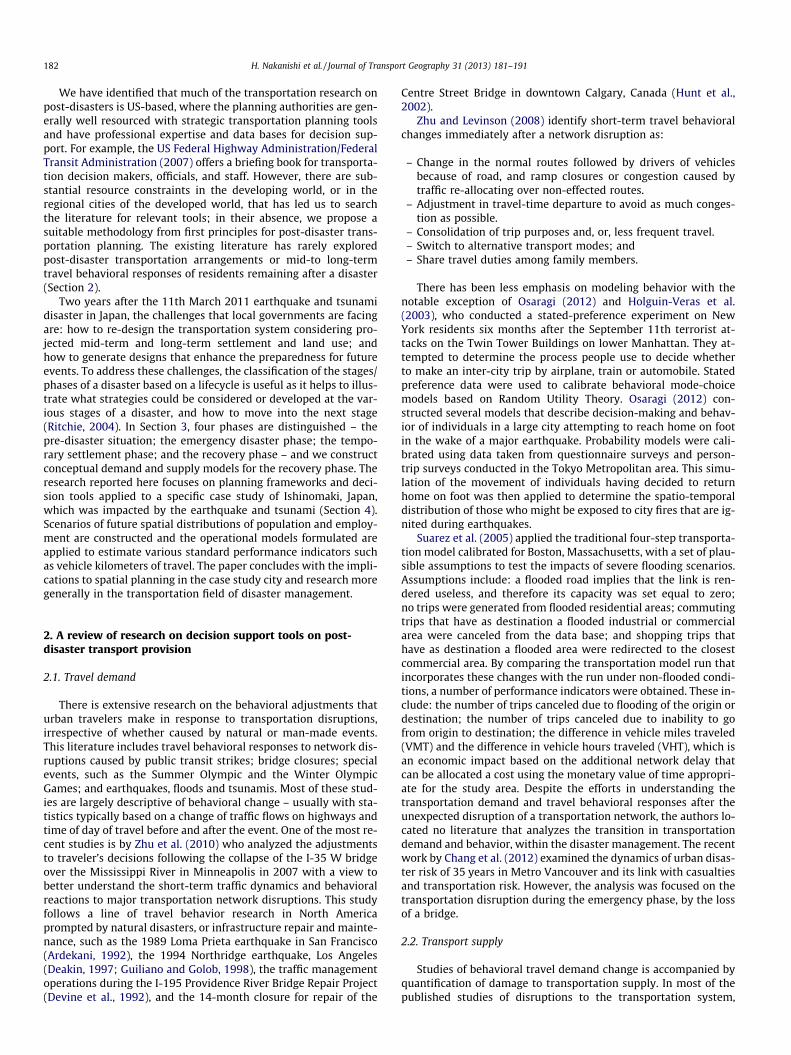
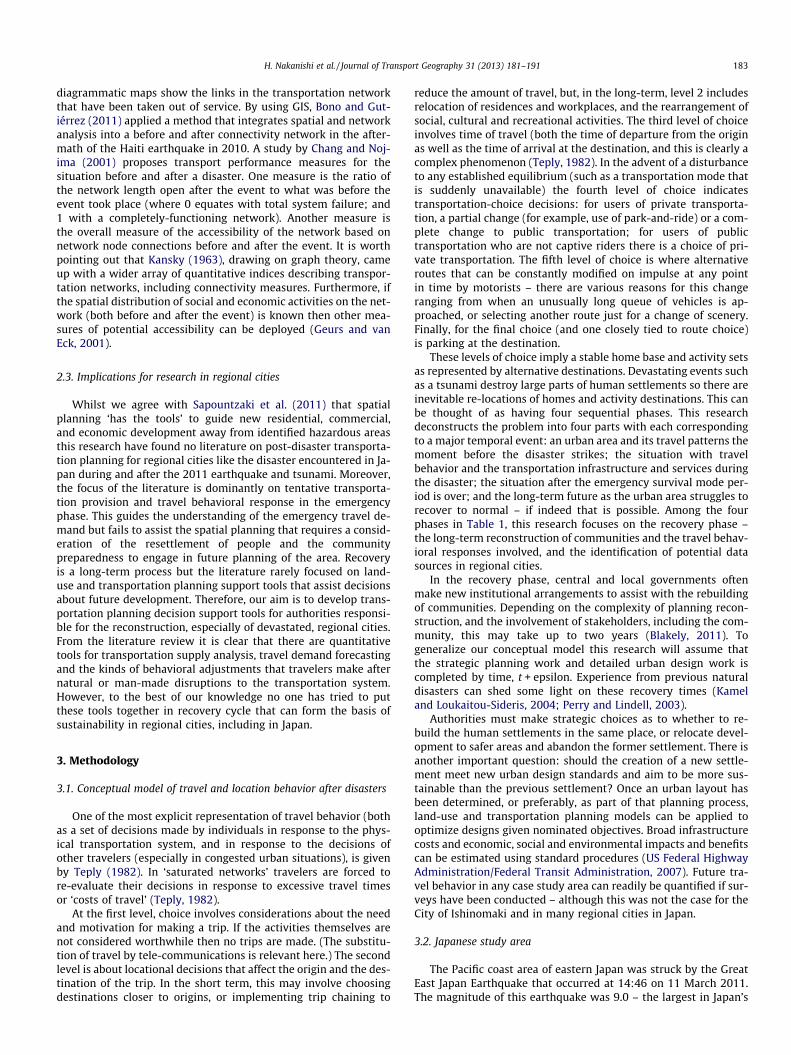
Ishinomaki is located in the north Miyagi prefecture (at a lati-tude of 38� north and 141� east longitude), on a lowland area atthe mouth of the Kitakami River (Figs. 1 and 2). The Kitakami River
Fig. 1. Location of Ishinomaki and epicent
splits into two channels in Ishinomaki. One flows into Oppa Bay(east) and the other flows into Sendai Bay (south). The city of Ish-inomaki was developed around the river mouth of the Sendai Baywhich is flat. These features allowed the city to develop as a base ofmaritime trade and shipping from before the Edo period (1600–1867). The peninsulas located in the east and in the south of thecity are mountainous with deeply-indented coastlines (Fig. 2).These peninsulas were merged as part of the Ishinomaki adminis-trative area in 2005. The peninsulas had a strong fishing culturewith its villages located in the low-lying areas for the convenienceof fisheries business. There is an option to re-build the communi-ties on higher ground close to the previous location. However,these areas are also vulnerable to tsunamis as evident from thedisaster of March 11 2011. Aging of society and de-populationare social issues in these fishing villages, which would bolster sup-port for the option of ‘not re-building the community’ after seriousdamage by any disaster.
The total population of Ishinomaki city was 162,822 (February2011) at a gross population density of 287 persons per square kilo-meter. Employment by industry in 2010 was 6246 persons (pri-mary industry), 20,702 persons (secondary industry), and 42,909(tertiary industry). In Ishinomaki, the maximum height of thetsunami was 8.6 m and these waves inundated about 30% of the
er of the Great East Japan Earthquake.
H. Nakanishi et al. / Journal of Transport Geography 31 (2013) 181–191 185
coastal plains (Fig. 2). 3145 people were killed and 447 people arestill officially missing (as of January 2013) – about 2.2% of the pop-ulation can be assumed to have died. Seventy percent of houses(53,742) were affected, of which 40% (22,357) were completely de-stroyed. 50,000 people were evacuated from their homes to 250shelters, and later – 7300 temporary housings were constructed(City of Ishinomaki, 2011). All fishing ports (40 in total) in Ishino-maki were damaged. Many breakwaters were damaged and sweptaway, and virtually all fixed nets and aquaculture facilities weredestroyed. 86% of fishing boats had to be written off (City of Ishino-maki, January 2013).
Ishinomaki City Council issued the Ishinomakishi Shinsai FukkoKeikaku (Ishinomaki Recovery Master Plan) in December, 2011(nine months after the disaster), followed by the IshinomakishiShinsai Fukko Keikaku Zisshi Keikaku (Implementation Plan) (Feb-ruary, 2012). The Ishinomaki Recovery Master Plan includes theprinciples of recovery, and group re-location to safer areas. Recon-struction of public housing is planned (target of 4000 dwellings)and the group re-location of 46 communities has already beendecided in Ishinomaki. Residents in vulnerable areas are resettledon available land away from the coast, or on higher hillside loca-tions in coastal peninsular fishing communities.
3.3. Data and scenario analysis
For the purpose of this paper, traffic demand and travel distanceand time in Ishinomaki were analyzed with regard to the proposedscenarios in the recovery phase. In this section, the data sourcesand the conditions for the analysis are explained. Normally, in Jap-anese cities, travel demand is estimated by the four-step method,with disaggregate mode-choice models and equilibrium road traf-fic assignments. These models are based on data from surveys suchas person trip surveys. However, there are no data for IshinomakiCity, as it has never been included in any person trip survey. Also,no transportation supply surveys have been conducted. Thus, ourtraffic demand analysis has relied on the three-step method, wheretrip distribution between each traffic zone pair is estimated basedon socioeconomic data of each zone (e.g. population and employ-ment) whilst the four-step method (Black, 1981: US TransportationResearch Record, 1998) estimates trip generation/attraction ofeach zone based on the socioeconomic data prior to the estimationof the trip distribution. Although the three-step method is simpler
Fig. 2. Spatial structure of Ishinomaki and
than those methods mentioned above, it will be adequate for thepurpose of this analysis – that is to approximate traffic demandin regard to the recovery phase for the purpose of strategic orsketch planning.
It should be noted that in data-rich countries such as the USA aconsiderable amount of data on travel demand has accumulatedover the years and default model parameters established for citiesof different city population size. This is referred to as ‘Quick Re-sponse Systems’ (Black, 1981). In the case of the models developedfor Ishinomaki it is the deterrence, or friction, factor in the gravitymodel (Black and Salter, 1975) that required a calibration parame-ter. We adopted a power function consistent with the originalNewtonian analogy from physics that has been widely applied inthe geographical literature, and an assumed parameter based onprevious fundamental research into size of cities and parametervalues (Black and Cheng, 1993). The boundary line data of smallareas per district per town in Ishinomaki were collected from theGeospatial Information Authority of Japan and the data were con-verted into traffic zones for this analysis.
In order to calculate the trip distribution between respectivezones, the following production-constrained gravity model wasused:
Tð1Þij ¼Pð1Þi � A
ð1Þj =tc
ijPj¼1Að1Þj =tcij
ð1Þ
where Tð1Þtj is daily trip from zone i to zone j for phase one (i.e. pre-disaster phase); Pð1Þi is population (2010) of zone i; Að1Þi is employ-ment (2010) of zone i; tij is travel time from zone i to zone j; c isthe parameter relating to travel time resistance. The population ofeach zone in 2010 was collected from the National Census Japan2010 while the employment of each zone in 2010 was proportion-ately estimated from the Economic Census Japan 2006 (Fig. 3). Tra-vel time between each zone was estimated by firstly calculating theshortest distance between each zone based on the road networkdata, explained later, and then dividing the distance uniformly by30 km/h as travel speed – typical mean speeds given the narrowroads in the city. In post-disaster area, understanding OD is impor-tant to sketch the traffic demand as people re-locate to differentareas. Parameter c was assumed to be 0.3 (which is representativeof friction factors in the smaller regional communities). Thisassumption is not too problematic because all scenarios are being
the extent of the March 2011 tsunami.
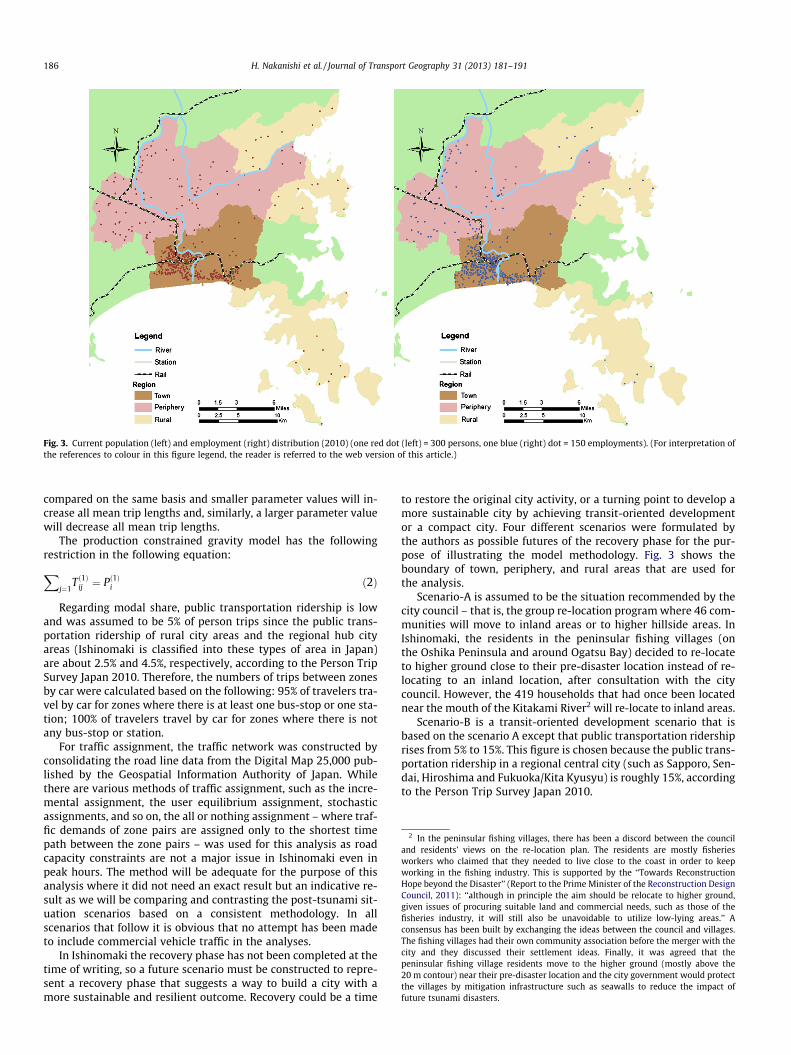
Fig. 3. Current population (left) and employment (right) distribution (2010) (one red dot (left) = 300 persons, one blue (right) dot = 150 employments). (For interpretation ofthe references to colour in this figure legend, the reader is referred to the web version of this article.)
2 In the peninsular fishing villages, there has been a discord between the counciland residents’ views on the re-location plan. The residents are mostly fisheriesworkers who claimed that they needed to live close to the coast in order to keepworking in the fishing industry. This is supported by the ‘‘Towards ReconstructionHope beyond the Disaster’’ (Report to the Prime Minister of the Reconstruction DesignCouncil, 2011): ‘‘although in principle the aim should be relocate to higher ground,given issues of procuring suitable land and commercial needs, such as those of thefisheries industry, it will still also be unavoidable to utilize low-lying areas.’’ Aconsensus has been built by exchanging the ideas between the council and villages.The fishing villages had their own community association before the merger with thecity and they discussed their settlement ideas. Finally, it was agreed that thepeninsular fishing village residents move to the higher ground (mostly above the20 m contour) near their pre-disaster location and the city government would protectthe villages by mitigation infrastructure such as seawalls to reduce the impact offuture tsunami disasters.
186 H. Nakanishi et al. / Journal of Transport Geography 31 (2013) 181–191
compared on the same basis and smaller parameter values will in-crease all mean trip lengths and, similarly, a larger parameter valuewill decrease all mean trip lengths.
The production constrained gravity model has the followingrestriction in the following equation:
Xj¼1
Tð1Þij ¼ Pð1Þi ð2Þ
Regarding modal share, public transportation ridership is lowand was assumed to be 5% of person trips since the public trans-portation ridership of rural city areas and the regional hub cityareas (Ishinomaki is classified into these types of area in Japan)are about 2.5% and 4.5%, respectively, according to the Person TripSurvey Japan 2010. Therefore, the numbers of trips between zonesby car were calculated based on the following: 95% of travelers tra-vel by car for zones where there is at least one bus-stop or one sta-tion; 100% of travelers travel by car for zones where there is notany bus-stop or station.
For traffic assignment, the traffic network was constructed byconsolidating the road line data from the Digital Map 25,000 pub-lished by the Geospatial Information Authority of Japan. Whilethere are various methods of traffic assignment, such as the incre-mental assignment, the user equilibrium assignment, stochasticassignments, and so on, the all or nothing assignment – where traf-fic demands of zone pairs are assigned only to the shortest timepath between the zone pairs – was used for this analysis as roadcapacity constraints are not a major issue in Ishinomaki even inpeak hours. The method will be adequate for the purpose of thisanalysis where it did not need an exact result but an indicative re-sult as we will be comparing and contrasting the post-tsunami sit-uation scenarios based on a consistent methodology. In allscenarios that follow it is obvious that no attempt has been madeto include commercial vehicle traffic in the analyses.
In Ishinomaki the recovery phase has not been completed at thetime of writing, so a future scenario must be constructed to repre-sent a recovery phase that suggests a way to build a city with amore sustainable and resilient outcome. Recovery could be a time
to restore the original city activity, or a turning point to develop amore sustainable city by achieving transit-oriented developmentor a compact city. Four different scenarios were formulated bythe authors as possible futures of the recovery phase for the pur-pose of illustrating the model methodology. Fig. 3 shows theboundary of town, periphery, and rural areas that are used forthe analysis.
Scenario-A is assumed to be the situation recommended by thecity council – that is, the group re-location program where 46 com-munities will move to inland areas or to higher hillside areas. InIshinomaki, the residents in the peninsular fishing villages (onthe Oshika Peninsula and around Ogatsu Bay) decided to re-locateto higher ground close to their pre-disaster location instead of re-locating to an inland location, after consultation with the citycouncil. However, the 419 households that had once been locatednear the mouth of the Kitakami River2 will re-locate to inland areas.
Scenario-B is a transit-oriented development scenario that isbased on the scenario A except that public transportation ridershiprises from 5% to 15%. This figure is chosen because the public trans-portation ridership in a regional central city (such as Sapporo, Sen-dai, Hiroshima and Fukuoka/Kita Kyusyu) is roughly 15%, accordingto the Person Trip Survey Japan 2010.
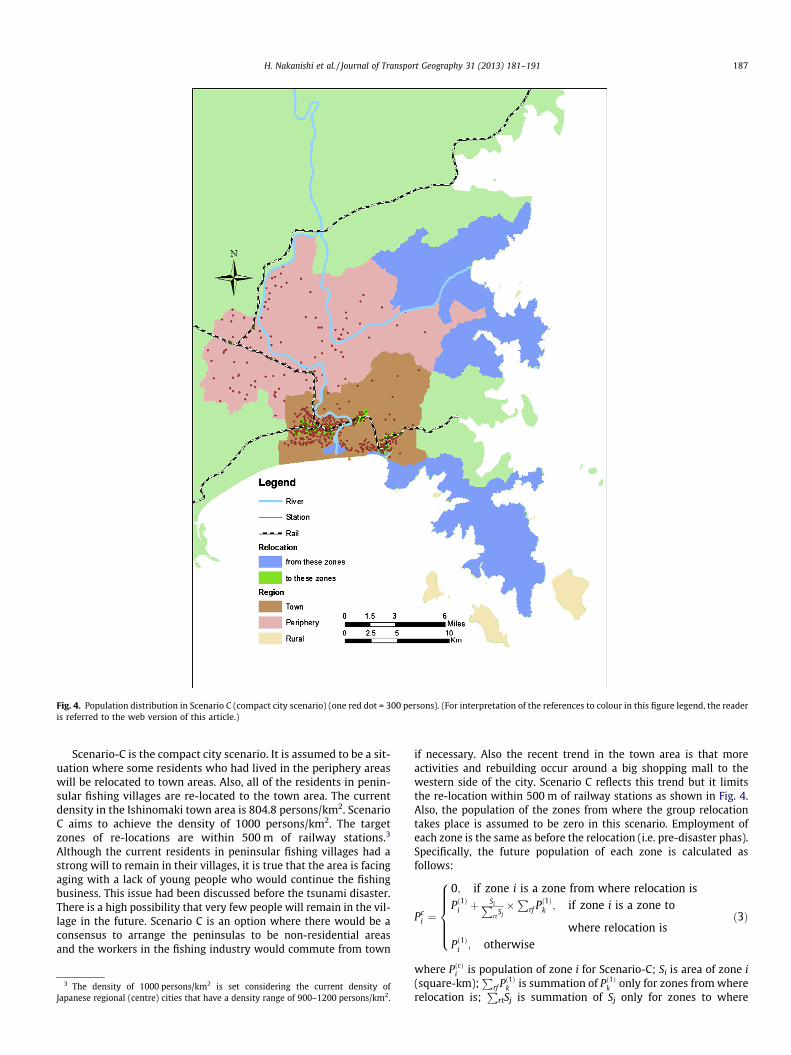
Fig. 4. Population distribution in Scenario C (compact city scenario) (one red dot = 300 persons). (For interpretation of the references to colour in this figure legend, the readeris referred to the web version of this article.)
H. Nakanishi et al. / Journal of Transport Geography 31 (2013) 181–191 187
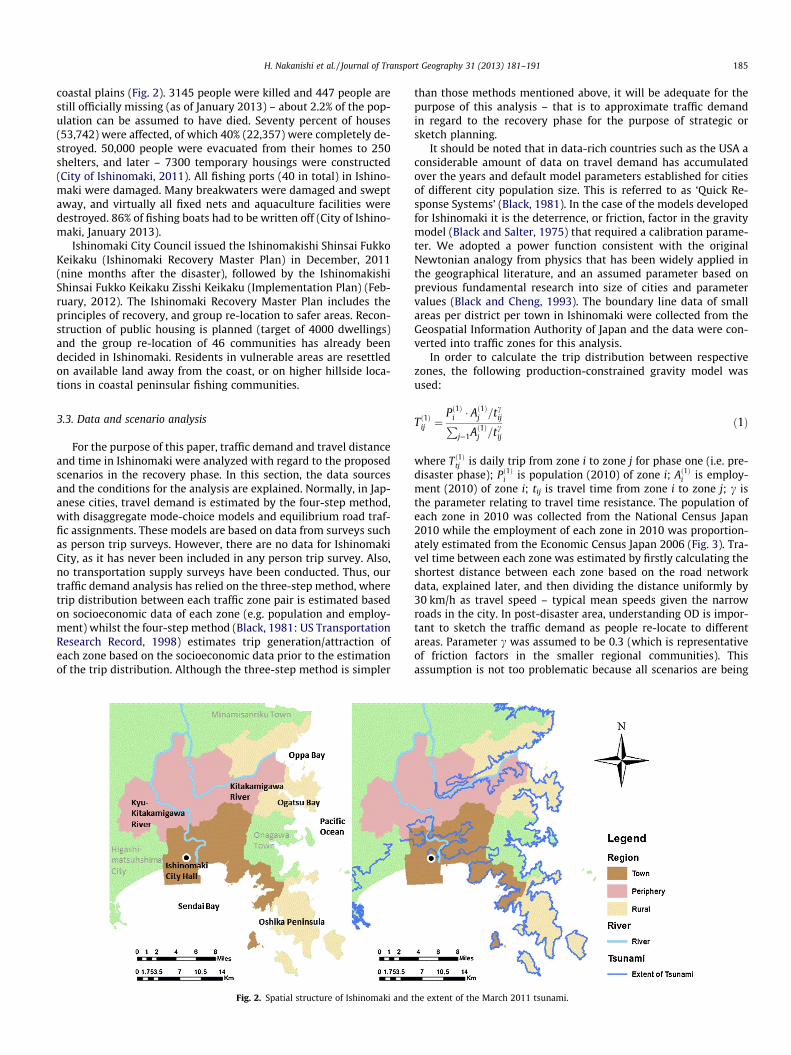
Scenario-C is the compact city scenario. It is assumed to be a sit-uation where some residents who had lived in the periphery areaswill be relocated to town areas. Also, all of the residents in penin-sular fishing villages are re-located to the town area. The currentdensity in the Ishinomaki town area is 804.8 persons/km2. ScenarioC aims to achieve the density of 1000 persons/km2. The targetzones of re-locations are within 500 m of railway stations.3
Although the current residents in peninsular fishing villages had astrong will to remain in their villages, it is true that the area is facingaging with a lack of young people who would continue the fishingbusiness. This issue had been discussed before the tsunami disaster.There is a high possibility that very few people will remain in the vil-lage in the future. Scenario C is an option where there would be aconsensus to arrange the peninsulas to be non-residential areasand the workers in the fishing industry would commute from town
3 The density of 1000 persons/km2 is set considering the current density ofJapanese regional (centre) cities that have a density range of 900–1200 persons/km2.
if necessary. Also the recent trend in the town area is that moreactivities and rebuilding occur around a big shopping mall to thewestern side of the city. Scenario C reflects this trend but it limitsthe re-location within 500 m of railway stations as shown in Fig. 4.Also, the population of the zones from where the group relocationtakes place is assumed to be zero in this scenario. Employment ofeach zone is the same as before the relocation (i.e. pre-disaster phas).Specifically, the future population of each zone is calculated asfollows:
Pci ¼
0; if zone i is a zone from where relocation isPð1Þi þ
SiPrt
Sj�P
rf Pð1Þk ; if zone i is a zone to
where relocation isPð1Þi ; otherwise
8>>>><>>>>:
ð3Þ
where PðcÞi is population of zone i for Scenario-C; Si is area of zone i(square-km);
Prf Pð1Þk is summation of Pð1Þk only for zones from where
relocation is;P
rtSj is summation of Sj only for zones to where
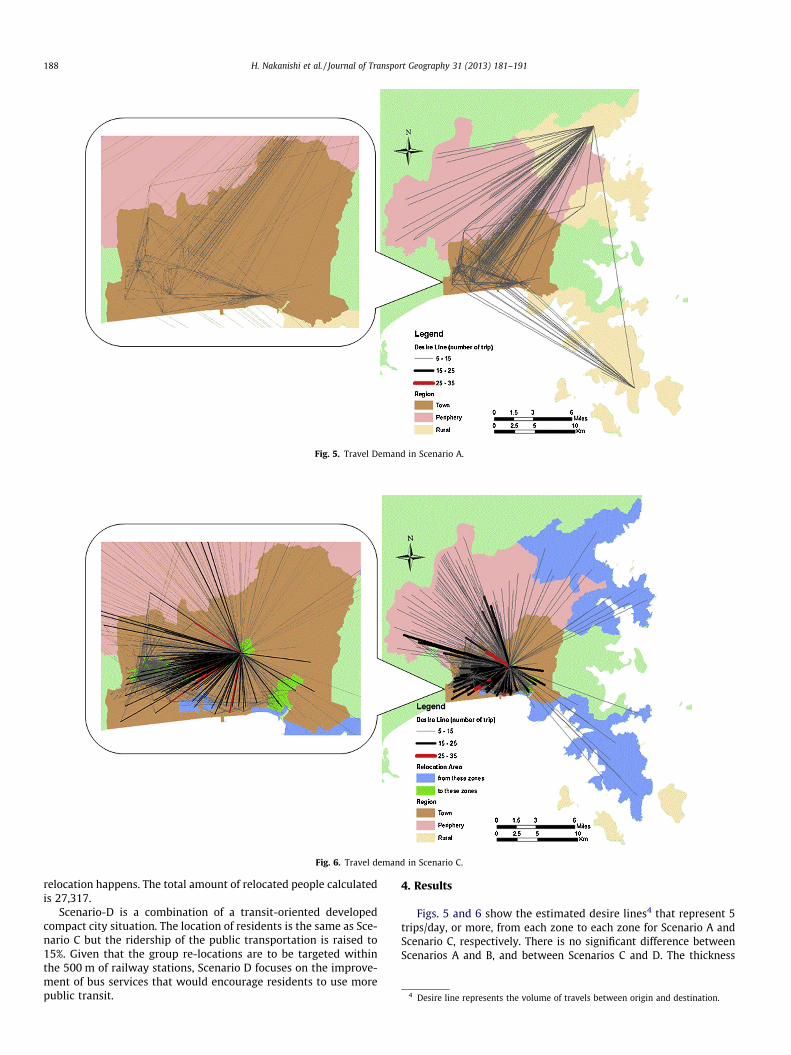
Fig. 5. Travel Demand in Scenario A.
Fig. 6. Travel demand in Scenario C.
4 Desire line represents the volume of travels between origin and destination.
188 H. Nakanishi et al. / Journal of Transport Geography 31 (2013) 181–191
relocation happens. The total amount of relocated people calculatedis 27,317.
Scenario-D is a combination of a transit-oriented developedcompact city situation. The location of residents is the same as Sce-nario C but the ridership of the public transportation is raised to15%. Given that the group re-locations are to be targeted withinthe 500 m of railway stations, Scenario D focuses on the improve-ment of bus services that would encourage residents to use morepublic transit.
4. Results
Figs. 5 and 6 show the estimated desire lines4 that represent 5trips/day, or more, from each zone to each zone for Scenario A andScenario C, respectively. There is no significant difference betweenScenarios A and B, and between Scenarios C and D. The thickness
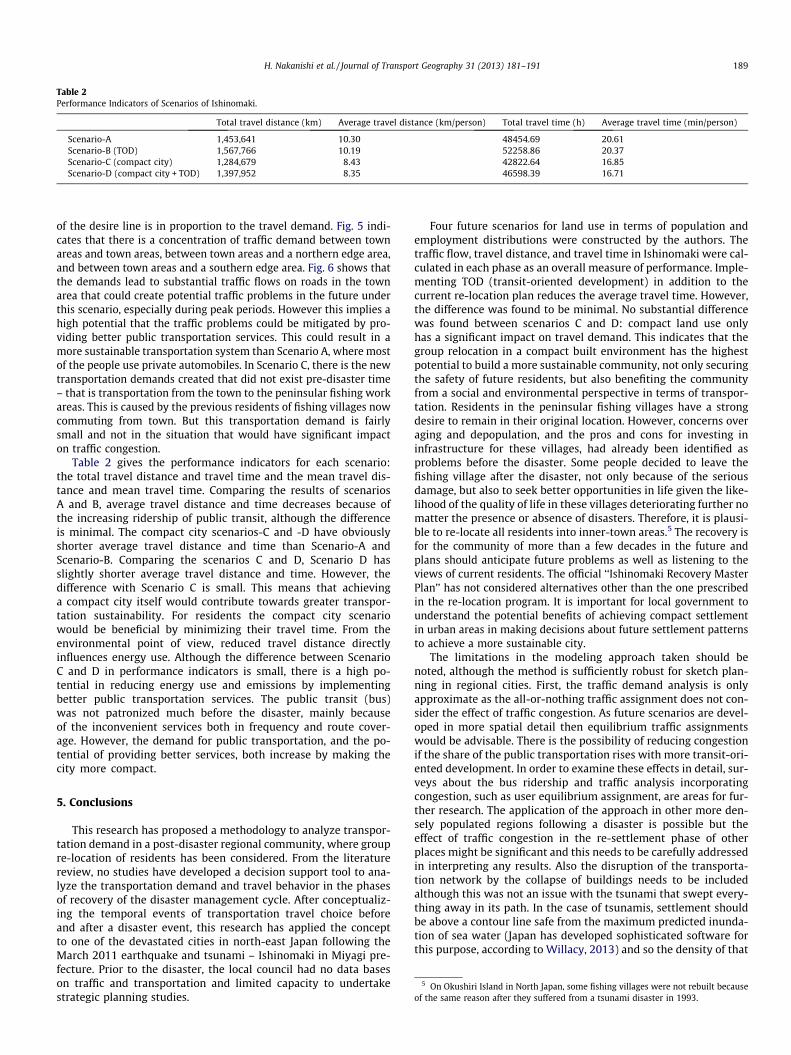
Table 2Performance Indicators of Scenarios of Ishinomaki.
Total travel distance (km) Average travel distance (km/person) Total travel time (h) Average travel time (min/person)
Scenario-A 1,453,641 10.30 48454.69 20.61Scenario-B (TOD) 1,567,766 10.19 52258.86 20.37Scenario-C (compact city) 1,284,679 8.43 42822.64 16.85Scenario-D (compact city + TOD) 1,397,952 8.35 46598.39 16.71
H. Nakanishi et al. / Journal of Transport Geography 31 (2013) 181–191 189
of the desire line is in proportion to the travel demand. Fig. 5 indi-cates that there is a concentration of traffic demand between townareas and town areas, between town areas and a northern edge area,and between town areas and a southern edge area. Fig. 6 shows thatthe demands lead to substantial traffic flows on roads in the townarea that could create potential traffic problems in the future underthis scenario, especially during peak periods. However this implies ahigh potential that the traffic problems could be mitigated by pro-viding better public transportation services. This could result in amore sustainable transportation system than Scenario A, where mostof the people use private automobiles. In Scenario C, there is the newtransportation demands created that did not exist pre-disaster time– that is transportation from the town to the peninsular fishing workareas. This is caused by the previous residents of fishing villages nowcommuting from town. But this transportation demand is fairlysmall and not in the situation that would have significant impacton traffic congestion.
Table 2 gives the performance indicators for each scenario:the total travel distance and travel time and the mean travel dis-tance and mean travel time. Comparing the results of scenariosA and B, average travel distance and time decreases because ofthe increasing ridership of public transit, although the differenceis minimal. The compact city scenarios-C and -D have obviouslyshorter average travel distance and time than Scenario-A andScenario-B. Comparing the scenarios C and D, Scenario D hasslightly shorter average travel distance and time. However, thedifference with Scenario C is small. This means that achievinga compact city itself would contribute towards greater transpor-tation sustainability. For residents the compact city scenariowould be beneficial by minimizing their travel time. From theenvironmental point of view, reduced travel distance directlyinfluences energy use. Although the difference between ScenarioC and D in performance indicators is small, there is a high po-tential in reducing energy use and emissions by implementingbetter public transportation services. The public transit (bus)was not patronized much before the disaster, mainly becauseof the inconvenient services both in frequency and route cover-age. However, the demand for public transportation, and the po-tential of providing better services, both increase by making thecity more compact.
5 On Okushiri Island in North Japan, some fishing villages were not rebuilt becauseof the same reason after they suffered from a tsunami disaster in 1993.
5. Conclusions
This research has proposed a methodology to analyze transpor-tation demand in a post-disaster regional community, where groupre-location of residents has been considered. From the literaturereview, no studies have developed a decision support tool to ana-lyze the transportation demand and travel behavior in the phasesof recovery of the disaster management cycle. After conceptualiz-ing the temporal events of transportation travel choice beforeand after a disaster event, this research has applied the conceptto one of the devastated cities in north-east Japan following theMarch 2011 earthquake and tsunami – Ishinomaki in Miyagi pre-fecture. Prior to the disaster, the local council had no data baseson traffic and transportation and limited capacity to undertakestrategic planning studies.
Four future scenarios for land use in terms of population andemployment distributions were constructed by the authors. Thetraffic flow, travel distance, and travel time in Ishinomaki were cal-culated in each phase as an overall measure of performance. Imple-menting TOD (transit-oriented development) in addition to thecurrent re-location plan reduces the average travel time. However,the difference was found to be minimal. No substantial differencewas found between scenarios C and D: compact land use onlyhas a significant impact on travel demand. This indicates that thegroup relocation in a compact built environment has the highestpotential to build a more sustainable community, not only securingthe safety of future residents, but also benefiting the communityfrom a social and environmental perspective in terms of transpor-tation. Residents in the peninsular fishing villages have a strongdesire to remain in their original location. However, concerns overaging and depopulation, and the pros and cons for investing ininfrastructure for these villages, had already been identified asproblems before the disaster. Some people decided to leave thefishing village after the disaster, not only because of the seriousdamage, but also to seek better opportunities in life given the like-lihood of the quality of life in these villages deteriorating further nomatter the presence or absence of disasters. Therefore, it is plausi-ble to re-locate all residents into inner-town areas.5 The recovery isfor the community of more than a few decades in the future andplans should anticipate future problems as well as listening to theviews of current residents. The official ‘‘Ishinomaki Recovery MasterPlan’’ has not considered alternatives other than the one prescribedin the re-location program. It is important for local government tounderstand the potential benefits of achieving compact settlementin urban areas in making decisions about future settlement patternsto achieve a more sustainable city.
The limitations in the modeling approach taken should benoted, although the method is sufficiently robust for sketch plan-ning in regional cities. First, the traffic demand analysis is onlyapproximate as the all-or-nothing traffic assignment does not con-sider the effect of traffic congestion. As future scenarios are devel-oped in more spatial detail then equilibrium traffic assignmentswould be advisable. There is the possibility of reducing congestionif the share of the public transportation rises with more transit-ori-ented development. In order to examine these effects in detail, sur-veys about the bus ridership and traffic analysis incorporatingcongestion, such as user equilibrium assignment, are areas for fur-ther research. The application of the approach in other more den-sely populated regions following a disaster is possible but theeffect of traffic congestion in the re-settlement phase of otherplaces might be significant and this needs to be carefully addressedin interpreting any results. Also the disruption of the transporta-tion network by the collapse of buildings needs to be includedalthough this was not an issue with the tsunami that swept every-thing away in its path. In the case of tsunamis, settlement shouldbe above a contour line safe from the maximum predicted inunda-tion of sea water (Japan has developed sophisticated software forthis purpose, according to Willacy, 2013) and so the density of that
190 H. Nakanishi et al. / Journal of Transport Geography 31 (2013) 181–191
settlement is not a factor in terms of safety. However, in the case ofearthquake damage Japanese construction codes are highly techni-cally advanced to minimize structural failure in tall buildings, butolder single- and two- storey buildings are more vulnerable todamage and collapse. Second, the analysis does not consider thepossible changes in employment in each zone following the re-location that will start in Ishinomaki in mid 2014. In this study,the future population of each zone is estimated based on the citycouncil’s re-location plan, but the analysis uses the employmentin each zone in the pre-disaster phase, appropriately scaled. Thedata that will represent the real change in employment in eachzone will only be available close to the timing that the residentialre-location will start. Further analysis will be possible at that timeto obtain more accurate results. Third, the research only analyzedthe commuting travel, although this is still useful as an illustrationof the modeling approach given that more than 40 per cent of thepre-disaster population were employed. Even accepting thesemethodological limitations, the research has application in spatialplanning.
Through the dialogue with community groups and the citycouncil that we undertook in August 2012, it was found that, inthe post-disaster situation, the significant transportation problemwas students’ travel to school (primary, junior-high and highschool). Some students are required to go to school from differentplaces to that before the disaster, or they are required to changeschool which is closer to their new residence (e.g. temporary hous-ing). To support their children to go to school, a significant numberof parents needed to drive them to school which is an unusual so-cial behavior in Japan. This might have caused unexpected trans-portation demands in peak periods that were not observed in thepre-disaster phase. Our study could not analyze this travel toschool because of the lack of data. Also, other travel data, such asshopping and other trip purposes, are also currently unavailable.
In Ishinomaki, the group re-location is going to start in mid2014 with a high priority of resettling residents to safer areas.From our analysis, we recommend that the re-location should beimplemented in such a way that makes the built environmentmore compact, thereby achieving a more sustainable outcome.The effect of transit-oriented development (TOD) was found tobe small in the analysis, but this would provide an opportunityto counter an auto-oriented transportation system so common inmany regional Japanese towns. Furthermore, TOD would providemore adequate public transportation services, especially for the el-derly, which is already a serious issue in Japan before the tsunamidisaster. Even in regional communities, TOD is possible if there is asufficient density in a compact urban form and appropriate incen-tives – as evident in some European towns.
It is obvious that safety is of paramount importance in disaster-prone areas just after a disaster. However, if governments want toachieve more than securing safety of its residents, there should bean option that considers spatial planning under a comprehensiveand integrated strategy. This should include the visioning of a fu-ture community. At the time of writing – two years after the tsu-nami – the focus by government is only on group re-location.Although some residents might not agree with the council havinga long-term perspective on city form, as their concerns tend to beon a daily-needs basis, we emphasize that it is this time that pro-vides an opportunity for the local council to rethink urban formand initiate discussions with stakeholders and residents as tohow they would like to rebuild their community, not only to makeit safer but also to achieve more resilience and sustainable socialand environmental outcomes for the next generation. In this con-text, the community consultation that is ongoing for building con-sensus for group re-location should be utilized to also discuss thefuture of the community in a more-broader sense. The authors ob-serve that the current discussion in the affected areas of north east
Japan (not only in our case study city) lacks such a comprehensiveview, and capacity building amongst stakeholders is recom-mended, as is occurring, for example, in Victoria, Australia, withits Emergency Management White Paper (Forster, 2013). Localdrivers of sustainable development and more resilient towns willguide the development of realistic scenarios other than the ratherartificial ones illustrated in this research. The formulation of spatialplanning objectives, together with the visualization of modelingresults, should be a component of stakeholder and communityengagement.
There are additional research areas identified from this study.The research verified that the proposed methodology provides suf-ficient information to assist decision-making on strategic spatialplanning in the recovery phases when there are limited data con-straints in regional cities. The conceptual model of travel behavioris generally applicable to any place where a disaster has occurredand the re-construction of settlements is expected. The applicationof the modeling aspects will be largely dependent on the capabili-ties of the key stakeholders in the effected regional cities, espe-cially access to spatial data and GIS. The sketch planning modelsapplied in this paper require minimum data input and could bereadily applied in any regional city in Japan and elsewhere depend-ing on the above stated capability. As discussed above, the detailedsurvey about public transportation use and traffic would lead to afurther examination of the transportation demand. Data on vehicletypes in the traffic stream would allow the estimation of CO2 emis-sions and so provide an idea of environmental impact. There is alack of research that analyzes the travel to school affected by thedisruption of transportation networks. No research that focuseson this issue was found from our literature review. Not only in af-fected areas in Japan, but many areas globally would have similarproblems that students struggle to go to school in post-disastercommunities, thus creating unexpected travel behavioral re-sponses. This is a research topic that would add to the literaturein the transport geography field given the importance of inter-gen-eration equity and the fact that positive attitudes to public trans-portation and the environment can be forged early amongstyoung people.
Acknowledgements
This research is supported by a University of Canberra ExternalCollaboration Grant. The authors wish to thank partner organiza-tions in this case study: Guruguru Oendan; Ishinomaki Sports Pro-motion Support Center; Ishinomaki City Council; and SanrikuKahoku Shinpo (for providing data and materials through the col-laborative work in the recovery projects). The authors also thankthe communities in the case study area who provided valuableinformation under difficult circumstances. The constructive com-ments provided by the anonymous reviewers are also gratefullyacknowledged.
References
Reconstruction Agency. 2012. Road to recovery. Government of Japan, Tokyo.Ardekani, S., 1992. Transportation operations following the 1989 Loma Prieta
earthquake. Transportation Quarterly 46 (2), 219–233.Black, J., 1981. Urban Transport Planning: Theory and Practice: London. Croom
Helm Ltd..Black, J., Cheng, Y., 1993. Dynamics of urban spatial structure and trip distribution
model calibration. In: Selected Proceedings of the Sixth World Conference onTransport Research., Lyon ‘92, Volume II Demand, Traffic and NetworkModeling, L’imprimerie Chirat, St-Just-La-Perdue, pp. 913–924.
Black, J.A., Salter, R.J., 1975. A statistical evaluation of the accuracy of a family ofgravity models. Proceedings of the Institution of Civil Engineers 59, 1–26.
Blakely, E.J., 2011. My Storm: Managing the Recovery of New Orleans in the Wake ofKatrina. University of Pennsylvania Press, Philadelphia.
Bono, F., Gutiérrez, E., 2011. A network-based analysis of the impact of structuraldamage on urban accessibility following a disaster: the case of the seismically
H. Nakanishi et al. / Journal of Transport Geography 31 (2013) 181–191 191
damaged Port A Prince and Carrefour urban road networks. Journal of TransportGeography 19 (6), 1443–1455.
Campanella, T.J., 2006. Urban resilience and the recovery of New Orleans. Journal ofthe American Planning Association 72 (2), 141–146.
Chang, S.E., Nojima, N., 2001. Measuring post-disaster transportation systemperformance: the 1995 Kobe earthquake in comparative perspective.Transportation Research Part A 35, 475–494.
Chang, S.E., Gregorian, M., Pathman, K., Yumagulova, L., Tse, W., 2012. Urban growthand long-term changes in natural hazard risk. Environment and Planning A 44(4), 989–1008.
City of Ishinomaki. 2011. Ishinomaki Recovery Master Plan. City of Ishinomaki,Ishinomaki. City of Ishinomaki, 2013. Current situation. Visited June 8 2013.City of Ishinomaki, Ishinomaki. <http://www.city.ishinomaki.lg.jp/>.
Deakin, A.K., 1997. Factoring motorists’ responses to the 1994 Northridgeearthquake. Computers, Environmental and Urban Systems 21 (5), 335–357.
Devine, S., Bucci, J., Berman, D., 1992. Traffic management during the I-195Providence River bridge repair project. Transportation Research Record 1360,1–3.
Forster, H., 2013. Secondary, Compound and Multiple Hazards: How a ChangingClimate Necessitates an All-Hazard, All Agency Approach. Sydney: ClimateAdaptation 2013 Knowledge + Partnership, 25–27 June, 2013, Conference CD –Rom.
Ganor, M., Ben-Lavy, Y., 2003. Community resilience: lessons derived from Gilounder fire. Journal of Jewish Communal Service Winter/Spring (pp. 105–108).
Geurs, K.T., van Eck, J.R., 2001. Accessibility measures: review and applications,RIVM report 408505006. National Institute of Public Health and theEnvironment, Bilthoven.
Godschalk, D., 2003. Urban hazard mitigation: creating resilient cities. NaturalHazards Review 4, 136–143.
Guiliano, G., Golob, J., 1998. Impacts of the Northridge earthquake on transit andhighway use. Journal of Transportation and Statistics May, 1–20.
Haigh, R., Amaratunga, D., 2010. An integrative review of the built environmentdiscipline’s role in the development of society’s resilience to disasters.International Journal of Disaster Resilience in Built Environment 1 (1), 11–24.
Holguin-Veras, J., Paaswell, R.E., Yali, A-M., 2003. Impacts of Extreme Events onIntercity Passenger Travel Behavior: The September 11th Experience. NaturalHazards Research and Applications Information Center, Public Entity RiskInstitute, and Institute for Civil Infrastructure Systems, Beyond September 11th:An Account of Post- Disaster Research. Special Publication No. 39. Boulder, CO:Natural Hazards Research and Applications Information Center, University ofColorado. pp. 373–404.
Hunt, J. D., Brownlee, A. T., Stefan, K. J., 2002. Responses to centre street bridgeclosure where the ‘‘Disappearing’’ travelers went. Transportation ResearchRecord: Journal of the Transportation Research Board 1807 paper No. 02-2491.
Kamel, N.M.O., Loukaitou-Sideris, A., 2004. Residential assistance and recoveryfollowing the Northridge earthquake. Urban Studies 41 (3), 533–562.
Kansky, K.J., 1963. Structure of Transportation Networks: Relationships betweenNetwork Geometry and Regional Characteristics. University of Chicago, Chicago.
Ministry of Land, Infrastructure. Transport and Tourism (MLIT), 2012. The urbantravel behavior (from the 2010 national travel survey, Ministry of Land,Infrastructure, Transport and Tourism, Tokyo.
Nakamae, T., 2011. Putting Tohoku into Perspective. The International Economy,Spring (pp. 50–64).
Osaragi, T., 2012. Modeling a spatiotemporal distribution of stranded peoplereturning home on foot in the aftermath of a large-scale earthquake. NaturalHazards, 1–14.
Perry, R.W., Lindell, M.K., 2003. Preparedness for emergency response: guidelinesfor the emergency planning process. Disasters 27 (4), 336–350.
Reconstruction Design Council. 2011. Towards Reconstruction Hope beyond theDisaster Report to the Prime Minister of the Reconstruction Design Council.Reconstruction Design Council, Tokyo.
Reis, K., 2013. Re-conceptualising community resilience in Australian disaster riskmanagement. In: Conference CD – Rom, Sydney, Climate Adaptation 2013Knowledge + Partnership, 25–27 June, 2013.
Ritchie, B.W., 2004. Chaos, crises and disasters: a strategic approach to crisismanagement in the tourism industry. Tourism management 25 (6), 669–683.
Sapountzaki, K., Wanczura, S., Casertano, G., Greiving, S., Xanthopoulos, G., Ferrara,F.F., 2011. Disconnected policies and actors and the missing role of spatialplanning throughout the risk management cycle. Natural Hazards 59 (3), 1445–1474.
Smith, K., 2001. Environmental Hazards – Assessing Risk and Reducing Disaster,third ed. Routledge, New York.
Suarez, P., Anderson, W., Mahal, V., Lakshmanan, T.R., 2005. Impacts of flooding andclimate change on urban transportation: a system wide performanceassessment of the Boston Metro Area. Transportation Research Part D:Transport and Environment 10 (3), 231–244.
Suzuki, I., Kaneko, Y., 2013. Japan’s Disaster Governance: How was the 3.11 CrisisManaged? New York, Dordrecht: Springer.
Teply, S., 1982. Network travel behaviour, ‘levels of choice’ and urbantransportation management. Traffic Engineering and Control 23, 71–76.
US Federal Highway Administration/Federal Transit Administration. 2007. TheTransportation Planning Process: Key Issues – A Briefing Book forTransportation Decisionmakers, Officials, and Staff – A Publication of theTransportation Planning Capacity Building Program, Updated September 2007<http://www.planning.dot.gov/documents/BriefingBook/BBook.htm#15BB>.(accessed 22.01.13).
US Transportation Research Record. 1998. Travel Estimation Techniques for UrbanPlanning. National Cooperative Highway Research Program, Report 365.Program, <http://ntl.bts.gov/lib/21000/21500/21563/PB99126724.pdf>.(accessed 18.09.12).
Willacy, M., 2013. Fukushima: Japan’s Tsunami and the Inside Story of the NuclearMeltdowns. Pan Macmillan Australia, Sydney.
Zhu, S., Levinson, D., 2008. Planned and unplanned disruptions to transportnetworks, Transportation Research Synthesis 0803 Transportation Networks.
Zhu, S., Levinson, D., Liu, H., Harder, K., 2010. The traffic and behavioral effects of theI-35W Mississippi River bridge collapse. Transportation Research Part A 44,771–784.


