Embed Size (px)
Citation preview
Journal of Experimental Botany, Vol. 64, No. 16, pp. 5115–5131, 2013doi:10.1093/jxb/ert303 Advance Access publication 5 October, 2013This paper is available online free of all access charges (see http://jxb.oxfordjournals.org/open_access.html for further details)
© The Author 2013. Published by Oxford University Press.
This is an Open Access article distributed under the terms of the Creative Commons Attribution License (http://creativecommons.org/licenses/by/3.0/), which permits unrestricted reuse, distribution, and reproduction in any medium, provided the original work is properly cited.
Abbreviations: bHLH, basic helix–loop–helix; ESI, electrospray ionization; FRAP, ferric reducing antioxidant power; LC, liquid chromatography; MS, mass spectrom-etry; PGSC, Potato Genome Sequencing Consortium; qRT-PCR, quantitative real-time PCR.
ReseaRch papeR
Transcription factors, sucrose, and sucrose metabolic genes interact to regulate potato phenylpropanoid metabolism
Raja S. Payyavula1,2,*, Rajesh K. Singh1,2 and Duroy A. Navarre1,3,†
1 Irrigated Agricultural Research and Extension Center, Washington StateUniversity, Prosser, WA 99164, USA2 Department of Horticulture and Landscape Architecture, Washington State University, Pullman, WA 99164, USA3 USDA-Agricultural Research Service 24106 North Bunn Road, Prosser, WA 99350, USA
* Present address: Oak Ridge National Laboratory, Oak Ridge, TN 37831, USA.† To whom correspondence should be addressed. E-mail: [email protected]
Received 4 March 2013; Revised 11 August 2013; Accepted 12 August 2013
Abstract
Much remains unknown about how transcription factors and sugars regulate phenylpropanoid metabolism in tuber crops like potato (Solanum tuberosum). Based on phylogeny and protein similarity to known regulators of phenylpro-panoid metabolism, 15 transcription factors were selected and their expression was compared in white, yellow, red, and purple genotypes with contrasting phenolic and anthocyanin profiles. Red and purple genotypes had increased phenylalanine ammonia lyase (PAL) enzyme activity, markedly higher levels of phenylpropanoids, and elevated expres-sion of most phenylpropanoid structural genes, including a novel anthocyanin O-methyltransferase. The transcrip-tion factors Anthocyanin1 (StAN1), basic Helix Loop Helix1 (StbHLH1), and StWD40 were more strongly expressed in red and purple potatoes. Expression of 12 other transcription factors was not associated with phenylpropanoid content, except for StMYB12B, which showed a negative relationship. Increased expression of AN1, bHLH1, and WD40 was also associated with environmentally mediated increases in tuber phenylpropanoids. Treatment of potato plantlets with sucrose induced hydroxycinnamic acids, flavonols, anthocyanins, structural genes, AN1, bHLH1, WD40, and genes encoding the sucrose-hydrolysing enzymes SUSY1, SUSY4, and INV2. Transient expression of StAN1 in tobacco leaves induced bHLH1, structural genes, SUSY1, SUSY4, and INV1, and increased phenylpropanoid amounts. StAN1 infiltration into tobacco leaves decreased sucrose and glucose concentrations. In silico promoter analysis revealed the presence of MYB and bHLH regulatory elements on sucrolytic gene promoters and sucrose-responsive elements on the AN1 promoter. These findings reveal an interesting dynamic between AN1, sucrose, and sucrose metabolic genes in modulating potato phenylpropanoids.
Key words: Anthocyanins, bHLH, chlorogenic acid, nutrition, MYB, phenolics, phenylpropanoids, phytonutrients, potato, sucrose, tobacco.
Introduction
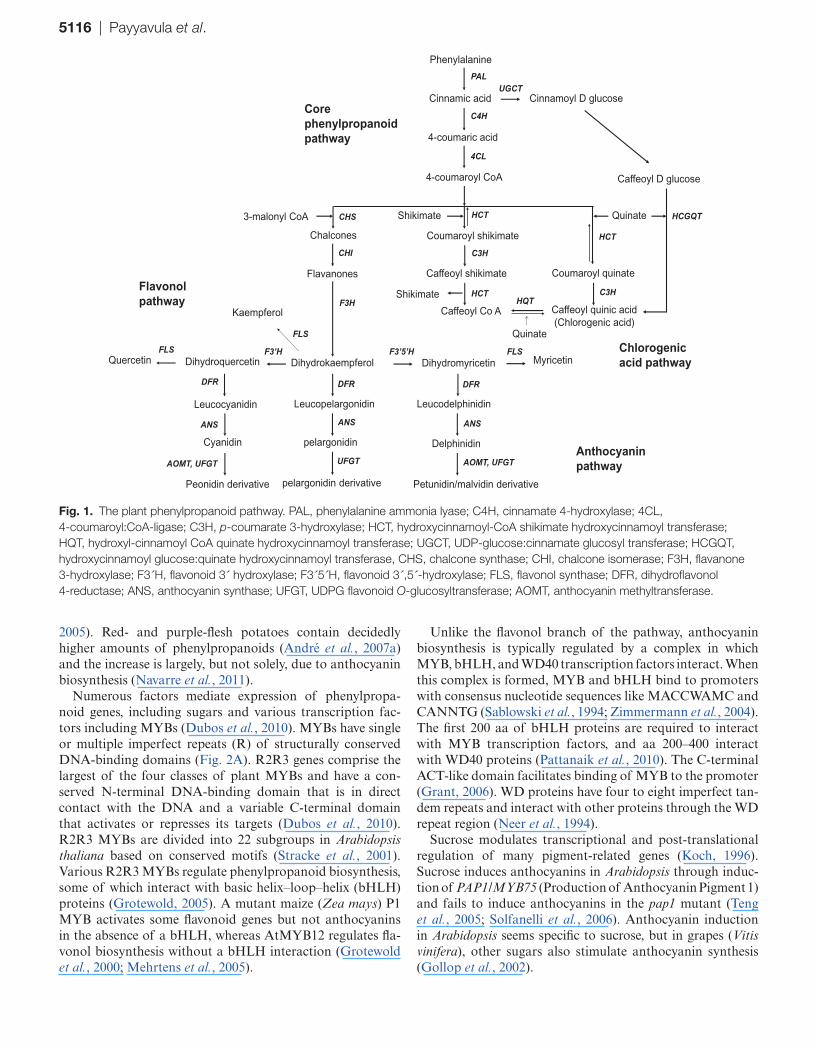
Plants synthesize an array of phenylpropanoids with diverse roles including in plant growth and development, flowering, pigmentation, signal transduction, and structural integrity (Fig. 1; Koes et al., 2005; Vogt, 2010). Phenylpropanoids are also important plant dietary constituents that possess various
health-promoting properties, including against cardiovascu-lar disease and cancers (Parr and Bolwell, 2000). White pota-toes (Solanum tuberosum L.) contain modest amounts of phenylpropanoids and are the third largest source of dietary phenylpropanoids because of high consumption (Chun et al.,
5116 | Payyavula et al.
2005). Red- and purple-flesh potatoes contain decidedly higher amounts of phenylpropanoids (André et al., 2007a) and the increase is largely, but not solely, due to anthocyanin biosynthesis (Navarre et al., 2011).
Numerous factors mediate expression of phenylpropa-noid genes, including sugars and various transcription fac-tors including MYBs (Dubos et al., 2010). MYBs have single or multiple imperfect repeats (R) of structurally conserved DNA-binding domains (Fig. 2A). R2R3 genes comprise the largest of the four classes of plant MYBs and have a con-served N-terminal DNA-binding domain that is in direct contact with the DNA and a variable C-terminal domain that activates or represses its targets (Dubos et al., 2010). R2R3 MYBs are divided into 22 subgroups in Arabidopsis thaliana based on conserved motifs (Stracke et al., 2001). Various R2R3 MYBs regulate phenylpropanoid biosynthesis, some of which interact with basic helix–loop–helix (bHLH) proteins (Grotewold, 2005). A mutant maize (Zea mays) P1 MYB activates some flavonoid genes but not anthocyanins in the absence of a bHLH, whereas AtMYB12 regulates fla-vonol biosynthesis without a bHLH interaction (Grotewold et al., 2000; Mehrtens et al., 2005).
Unlike the flavonol branch of the pathway, anthocyanin biosynthesis is typically regulated by a complex in which MYB, bHLH, and WD40 transcription factors interact. When this complex is formed, MYB and bHLH bind to promoters with consensus nucleotide sequences like MACCWAMC and CANNTG (Sablowski et al., 1994; Zimmermann et al., 2004). The first 200 aa of bHLH proteins are required to interact with MYB transcription factors, and aa 200–400 interact with WD40 proteins (Pattanaik et al., 2010). The C-terminal ACT-like domain facilitates binding of MYB to the promoter (Grant, 2006). WD proteins have four to eight imperfect tan-dem repeats and interact with other proteins through the WD repeat region (Neer et al., 1994).
Sucrose modulates transcriptional and post-translational regulation of many pigment-related genes (Koch, 1996). Sucrose induces anthocyanins in Arabidopsis through induc-tion of PAP1/MYB75 (Production of Anthocyanin Pigment 1) and fails to induce anthocyanins in the pap1 mutant (Teng et al., 2005; Solfanelli et al., 2006). Anthocyanin induction in Arabidopsis seems specific to sucrose, but in grapes (Vitis vinifera), other sugars also stimulate anthocyanin synthesis (Gollop et al., 2002).
Chalcones
Flavanones
CHI
F3H
CHS
Dihydrokaempferol
pelargonidin
ANS
UFGT
pelargonidin derivative
FLS Quercetin
4-coumaroyl CoA
3-malonyl CoA
Phenylalanine
PAL
C4H
4-coumaric acid
Cinnamic acid
4CL
Leucopelargonidin
Coumaroyl shikimate
C3H
Caffeoyl shikimate
Caffeoyl Co A
HCTHQT
Shikimate HCT
Coumaroyl quinate
Caffeoyl quinic acid(Chlorogenic acid)
C3H
HCT
Quinate
Cinnamoyl D glucose
Caffeoyl D glucose
UGCT
HCGQT
Delphinidin
ANS
AOMT, UFGT
Petunidin/malvidin derivative
Leucodelphinidin
DFR
F3’H Dihydromyricetin
DFR
F3’5’H Dihydroquercetin
ANS
AOMT, UFGT
Peonidin derivative
Leucocyanidin
DFR
Cyanidin
FLS Myricetin
Kaempferol
FLS QuinateChlorogenic acid pathway
Anthocyanin pathway
Flavonol pathway
Core phenylpropanoid pathway
Shikimate
Fig. 1. The plant phenylpropanoid pathway. PAL, phenylalanine ammonia lyase; C4H, cinnamate 4-hydroxylase; 4CL, 4-coumaroyl:CoA-ligase; C3H, p-coumarate 3-hydroxylase; HCT, hydroxycinnamoyl-CoA shikimate hydroxycinnamoyl transferase; HQT, hydroxyl-cinnamoyl CoA quinate hydroxycinnamoyl transferase; UGCT, UDP-glucose:cinnamate glucosyl transferase; HCGQT, hydroxycinnamoyl glucose:quinate hydroxycinnamoyl transferase, CHS, chalcone synthase; CHI, chalcone isomerase; F3H, flavanone 3-hydroxylase; F3´H, flavonoid 3´ hydroxylase; F3´5´H, flavonoid 3´,5´-hydroxylase; FLS, flavonol synthase; DFR, dihydroflavonol 4-reductase; ANS, anthocyanin synthase; UFGT, UDPG flavonoid O-glucosyltransferase; AOMT, anthocyanin methyltransferase.
Regulation of potato phenylpropanoids | 5117
As a staple food, potatoes are an attractive target for phy-tonutrient enhancement. Tuber-specific overexpression of the MYB transcription factor StMtf1 resulted in elevated amounts of phenylpropanoids (Rommens et al., 2008). Tuber anthocyanin synthesis in the periderm is controlled in part by three loci, D, P, and R. P and R were found to be structural
genes, whereas D encodes an R2R3 MYB (Jung et al., 2005, 2009; Zhang et al., 2009a). The D locus maps to a region of chromosome 10 that harbours StAN2, which was later renamed StAN1 (Jung et al., 2009). StAN1 expression cor-related with anthocyanin levels in drought-stressed potatoes (André et al., 2009).
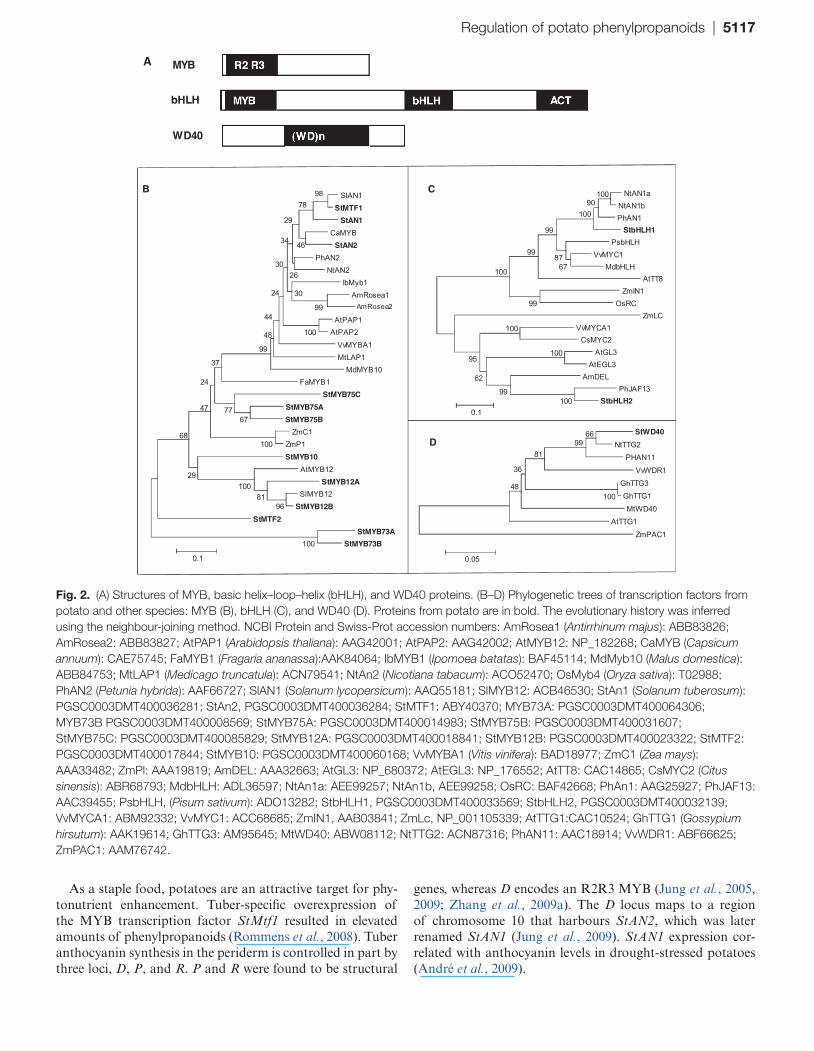
Fig. 2. (A) Structures of MYB, basic helix–loop–helix (bHLH), and WD40 proteins. (B–D) Phylogenetic trees of transcription factors from potato and other species: MYB (B), bHLH (C), and WD40 (D). Proteins from potato are in bold. The evolutionary history was inferred using the neighbour-joining method. NCBI Protein and Swiss-Prot accession numbers: AmRosea1 (Antirrhinum majus): ABB83826; AmRosea2: ABB83827; AtPAP1 (Arabidopsis thaliana): AAG42001; AtPAP2: AAG42002; AtMYB12: NP_182268; CaMYB (Capsicum annuum): CAE75745; FaMYB1 (Fragaria ananassa):AAK84064; IbMYB1 (Ipomoea batatas): BAF45114; MdMyb10 (Malus domestica): ABB84753; MtLAP1 (Medicago truncatula): ACN79541; NtAn2 (Nicotiana tabacum): ACO52470; OsMyb4 (Oryza sativa): T02988; PhAN2 (Petunia hybrida): AAF66727; SlAN1 (Solanum lycopersicum): AAQ55181; SlMYB12: ACB46530; StAn1 (Solanum tuberosum): PGSC0003DMT400036281; StAn2, PGSC0003DMT400036284; StMTF1: ABY40370; MYB73A: PGSC0003DMT400064306; MYB73B PGSC0003DMT400008569; StMYB75A: PGSC0003DMT400014983; StMYB75B: PGSC0003DMT400031607; StMYB75C: PGSC0003DMT400085829; StMYB12A: PGSC0003DMT400018841; StMYB12B: PGSC0003DMT400023322; StMTF2: PGSC0003DMT400017844; StMYB10: PGSC0003DMT400060168; VvMYBA1 (Vitis vinifera): BAD18977; ZmC1 (Zea mays): AAA33482; ZmPl: AAA19819; AmDEL: AAA32663; AtGL3: NP_680372; AtEGL3: NP_176552; AtTT8: CAC14865; CsMYC2 (Citus sinensis): ABR68793; MdbHLH: ADL36597; NtAn1a: AEE99257; NtAn1b, AEE99258; OsRC: BAF42668; PhAn1: AAG25927; PhJAF13: AAC39455; PsbHLH, (Pisum sativum): ADO13282; StbHLH1, PGSC0003DMT400033569; StbHLH2, PGSC0003DMT400032139; VvMYCA1: ABM92332; VvMYC1: ACC68685; ZmIN1, AAB03841; ZmLc, NP_001105339; AtTTG1:CAC10524; GhTTG1 (Gossypium hirsutum): AAK19614; GhTTG3: AM95645; MtWD40: ABW08112; NtTTG2: ACN87316; PhAN11: AAC18914; VvWDR1: ABF66625; ZmPAC1: AAM76742.
A
5118 | Payyavula et al.
The goal of this study was to determine how sugars and transcription factors modulate biosynthesis of potato phe-nylpropanoids, including hydroxycinnamic acids, flavonols, and anthocyanins. The involvement of sugars and 15 tran-scription factors was characterized and provided evidence that AN1 along with bHLH1, sucrose, and sucrose metabolic genes interact to regulate the pathway.
Materials and methods
Plant materialsSmall tubers (~25–50 g) from NY144, Challenger, ORO4198-1, AmaRosa and Magic Molly were harvested from field-grown plants in Moses Lake, WA, USA, in August 2011. Tubers were peeled and frozen in liquid nitrogen within minutes of harvest. Analysis of environmental influences on transcription factor expression was performed on potatoes grown in Texas, Florida, and four locations in Alaska (Payyavula et al., 2012). For sucrose feeding studies, internodes from 1-month-old potato (cv. Purple Majesty) plants were propagated on MS medium supplemented with 0 or 120 mM sucrose at 25 °C with 16 h light. Plantlets were collected after 5 d.
Phenylpropanoid analysisPhenolics were extracted from 50 mg freeze-dried homogenized sam-ple with 1.5 ml of 50% methanol, 1 mM EDTA, and 2.5% metaphos-phoric acid using a validated method (Shakya and Navarre, 2006). Total phenolics were estimated by the Folin–Ciocalteu method (Singleton and Rossi, 1965). Individual phenolics were analysed on a 100 × 4.6 mm Onyx monolithic C-18 (Phenomenex) column with an Agilent 1100 HPLC system equipped with a quaternary pump, refrigerated autosampler, and column heater. Detectors were a DAD and SL ion trap with an electrospray ionization (ESI) source oper-ated in both positive and negative ion mode, as described previously (Navarre et al., 2011). Anthocyanins were extracted from 50 mg of dry powder using a total of 2 ml of 50% methanol containing 2.5% formic acid. Total anthocyanins were estimated by a pH differen-tial method (Wrolstad et al., 2005). Individual anthocyanins were determined by liquid chromatography/ mass spectrometry (LC/MS) as described previously (Payyavula et al., 2012). Retention times and MS data for the quantitated compounds are shown in Supplementary Tables S1 and S2 at JXB online.
RNA extraction, cDNA synthesis, and quantitative real-time PCR (qRT-PCR)RNA was extracted using hot cetyl trimethylammonium bro-mide (Chang et al., 1993), with slight modification (Payyavula et al., 2012). Samples were quantified with a NanoDrop ND-1000 spectrophotometer (NanoDrop Technologies) and quality was assayed on a 1% agarose gel. cDNA synthesis used 2 μg of total RNA, Moloney murine leukemia virus reverse transcriptase (New England BioLabs), and oligo(dT) 20VN primers at 42 °C for 2 h. Quantitative PCR was performed in 384-well plates on a LightCycler 480 (Roche) with 3.5 ng of equivalent cDNA. Relative abundance was calculated with the ΔCT method (Livak and Schmittgen, 2001) using elongation factor-1, actin, and ribosomal protein L2 for template normalization. The primers are listed in Supplementary Table S3 at JXB online. Statistical analysis was performed with standard analysis of variance using SAS 9.2 Proc GLM. The means were obtained using LSMEANS with Tukey adjustments for the degrees of freedom and P<0.05 default sepa-ration (Rourke et al., 2005). Pearson correlation coefficients were calculated using Microsoft Excel and visualized with HeatMapper Plus (Verhaak et al., 2006).
Phylogenetic tree and protein similarityProtein sequences collected by the best BLAST match from the Potato Genome Sequencing Consortium (PGSC) database (http://solanaceae.plantbiology.msu.edu/pgsc_download.shtml) or NCBI were aligned and a phylogenetic tree developed using MEGA4 (Tamura et al., 2007). The evolutionary history was inferred using the neighbour-joining method with 500 bootstrap replicates. The evolutionary distances were computed using the Poisson correction method with units of the number of amino acid substitutions per site. Percentage similarity was calculated with GeneDoc (Nicholas et al., 1997).
Antioxidant and enzyme assaysA ferric reducing antioxidant power (FRAP) assay was performed as reported elsewhere (Benzie and Strain, 1996). To an aliquot of 15–30 μl of phenolic extract, 1 ml of the pre-warmed (37 °C) FRAP reagent was added, incubated 5 min at 37 °C, and then centrifuged for 1 min. Absorbance at 593 nm (A593) was read and antioxidant capacity was estimated as trolox equivalents. Phenylalanine ammo-nia lyase (PAL) catalyses the first reaction of the phenylpropanoid pathway (Fig. 1) and activity was measured as described previously (Zucker, 1965). In a 1.5 ml tube, 700 μl of 50 mM sodium borate buffer (pH 8.8) and 200 μl of 50 mM phenylalanine were pre-warmed at 37 °C prior to adding 100 μl of extract. The reaction was contin-ued for 1 h at 37 °C and then stopped with 200 μl of 12% trichlo-roacetic acid and measured at A290. Sugars were extracted twice at 80 °C for 15 min from 25 mg of freeze-dried sample with a total of 2 ml of 80% ethanol. Pigments were removed by re-extracting with 50 mg of activated charcoal. Sucrose and glucose were estimated using Sigma kits (SCA20 and GAHK20).
Cloning and leaf infiltrationsFull-length coding sequences of the potato transcription factors AN1, bHLH1, and WD40 and the structural gene AOMT3 (antho-cyanin O-methyltransferase 3) were amplified from Magic Molly or Purple Majesty tuber cDNA using Phusion® DNA polymerase (New England Biolabs). Full-length fragments were ligated into the modified binary vector pOREO2 with a 35S promoter (Coutu et al., 2007). Clones were confirmed by sequencing (Retrogen). Sequences for StAN1 (JX848659), StbHLH1 (JX848660), StWD40 (JX848661) and StAOMT3 (JX848662) were submitted to GenBank.
A single positive colony was cultured in 5 ml of LB medium over-night and used to inoculate 50 ml of medium. Cells were harvested and redissolved in 10 mM MgCl2 containing 100 μM acetosyringone and adjusted to an optical density of 0.5. Cultures were then diluted (1:1) with the gene silencing suppression vector p19TBSV of tomato bushy stunt virus (Voinnet et al., 2003) to avoid co-suppression. Samples were infiltrated into leaves of 3-week-old tobacco plants (Nicotiana tabacum cv. Samsun and Nicotiana benthamiana) main-tained in a growth chamber under conditions of 15 h light. Leaves were harvested at 4 d post-infiltration.
Results
Phylogenetic analysis and protein similarity
A total of 12 MYBs were selected for characterization based on BLAST searches conducted against the potato genome database (The Potato Genome Sequencing Consortium, 2011) using nucleotide sequences of transcription factors described previously in the literature. Arabidopsis has 198 MYB genes (Yanhui et al., 2006) of which AtPAP1 (GenBank accession no. AF325123) and AtPAP2 (MYB90, AF325124) are known to be involved in anthocyanin synthesis (Dubos
Regulation of potato phenylpropanoids | 5119
et al., 2010). Three putative potato MYB genes, StMYB75A, StMYB7B, and StMYB75C, were identified based on homol-ogy to AtPAP1 and AtPAP2. StMYB12A and StMYB12B are homologous to SlMYB12 (EU419748) and AtMYB12 (NM_130314), which regulate flavonols in tomato (Solanum lycopersicum) and Arabidopsis (Mehrtens et al., 2005). StAN1 and StAN2 (AY841127 and AY841131) are MYBs impli-cated in regulating anthocyanin biosynthesis in tuber skin and drought-stressed potatoes (André et al., 2009; Jung et al., 2009). Numerous sequences were found in the PGSC data-base with homology to StAN1 and StAN2, but only the two with highest similarity were chosen. StMTF1 (EU310399) and StMTF2 (CV506186) are MYBs shown to regulate potato phenylpropanoids with varying efficacy (Rommens et al., 2008). StMYb73A and StMYb73B were collected by blasting a MYB73 sequence that was upregulated 44-fold in the purple portions of tubers compared with the white por-tions (Stushnoff et al., 2010). StMYB10 was homologous to NtAn2 (FJ472647) and MdMYB10 (EU518249), which regulate anthocyanin biosynthesis in tobacco floral tissue and apple (Malus domestica), respectively (Espley et al., 2007; Pattanaik et al., 2010).
AtTT8 (AJ277509), AtGL3 (NM_148067.3), JAF13 (AF020545.1), and NtAN1 (HQ589209) are bHLH genes involved in anthocyanin synthesis (Nesi et al., 2000; Quattrocchio et al., 1998; Feyissa et al., 2009; Bai et al., 2011). After BLASTing these sequences, the two best matches in potato were bHLH1 and bHLH2. AtTTG1 (AJ133743), MtWD40-1 (EU040206), and PhAN11 (U94748) are WD40 members that regulate anthocyanin synthesis (Vetten et al., 1997; Walker et al., 1999; Pang et al., 2009) and their sequences were used to identify StWD40.
The protein sequences of these 12 MYBs, two bHLHs, and one WD40 from potato were used to develop a phylo-genetic tree (Fig. 2B–D). StAN1 and StAN2 were closely associated with the MYBs of other solanaceous species, SlAN1, NtAN2, and CaMYB, known to regulate antho-cyanins (Mathews et al., 2003; Borovsky et al., 2004; Pattanaik et al., 2010). StAN1 was 66 and 58% similar to StAN2 and NtAN2, respectively, and StMTF1 was 89% similar to SlAN1 (Supplementary Table S4A at JXB online). StMYB12A and StMYB12B clustered with AtMYB12 and SlMYB12 (Luo et al., 2008; Ballester et al., 2010). MYB73A and MYB73B formed a unique clade. All the MYBs from solanaceous species had highly conserved R2 and R3 MYB domains (Supplementary Fig. S1A at JXB online). StbHLH1 clustered and shared around 80% similarity with NtAN1a and PhAN1, which regulate anthocyanins in tobacco and petunia (Petunia hybrida) and was only 43% similar to StbHLH2. However, StbHLH2 was 86% similar to PhJAF13 (Supplementary Table S4B). These proteins are conserved in MYB and bHLH domains but are diversified in other regions (Supplementary Fig. S1B).
StWD40 is clustered with NtTTG2, PhAN11, and VvWDR1, and is 97% similar to NtTTG2 and 94 and 88% similar to PhAN11 and VvWDR1, respectively (Supplementary Table S4C), which regulate anthocyanin syn-thesis in petunia and grapes (Vetten et al., 1997; Matus et al.,
2010). These proteins are slightly distinct at the N-terminal end but are highly conserved in the middle and C-terminal end (Supplementary Fig. S1C).
Basal phenylpropanoid metabolism
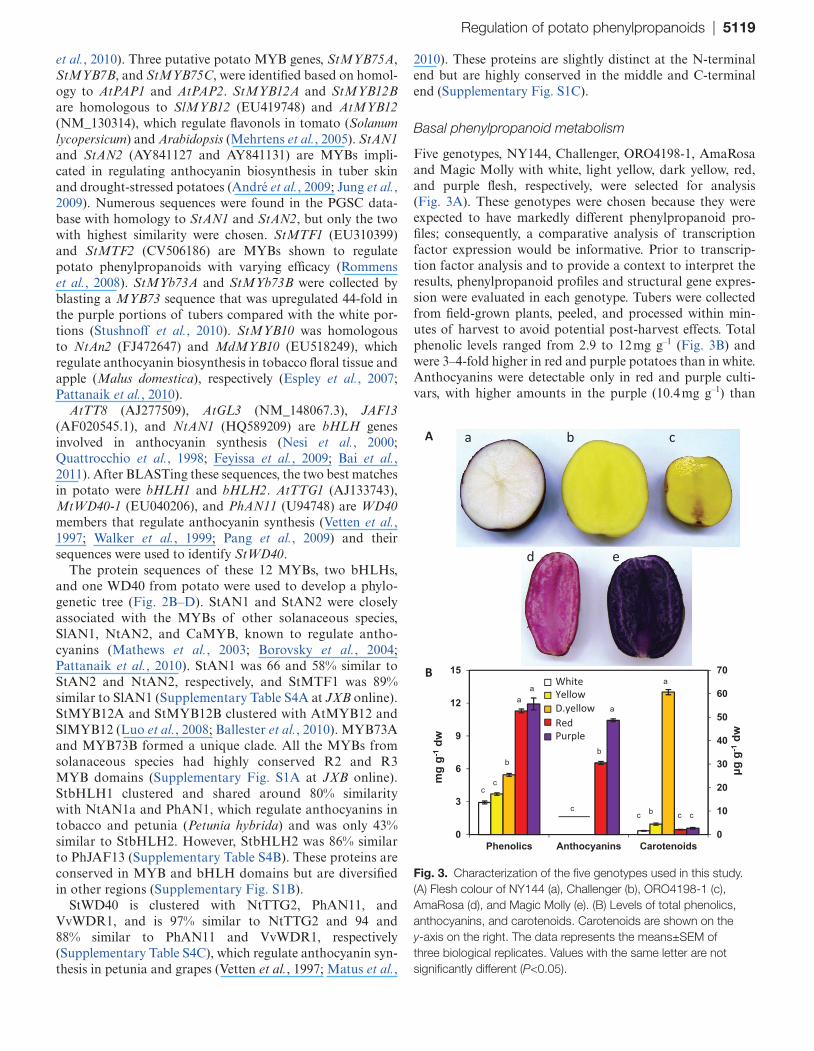
Five genotypes, NY144, Challenger, ORO4198-1, AmaRosa and Magic Molly with white, light yellow, dark yellow, red, and purple flesh, respectively, were selected for analysis (Fig. 3A). These genotypes were chosen because they were expected to have markedly different phenylpropanoid pro-files; consequently, a comparative analysis of transcription factor expression would be informative. Prior to transcrip-tion factor analysis and to provide a context to interpret the results, phenylpropanoid profiles and structural gene expres-sion were evaluated in each genotype. Tubers were collected from field-grown plants, peeled, and processed within min-utes of harvest to avoid potential post-harvest effects. Total phenolic levels ranged from 2.9 to 12 mg g–1 (Fig. 3B) and were 3–4-fold higher in red and purple potatoes than in white. Anthocyanins were detectable only in red and purple culti-vars, with higher amounts in the purple (10.4 mg g–1) than
Fig. 3. Characterization of the five genotypes used in this study. (A) Flesh colour of NY144 (a), Challenger (b), ORO4198-1 (c), AmaRosa (d), and Magic Molly (e). (B) Levels of total phenolics, anthocyanins, and carotenoids. Carotenoids are shown on the y-axis on the right. The data represents the means±SEM of three biological replicates. Values with the same letter are not significantly different (P<0.05).
5120 | Payyavula et al.
in the red (6.5 mg g–1) genotype. Carotenoids were highest (60.7 μg g–1) in the dark yellow genotype.
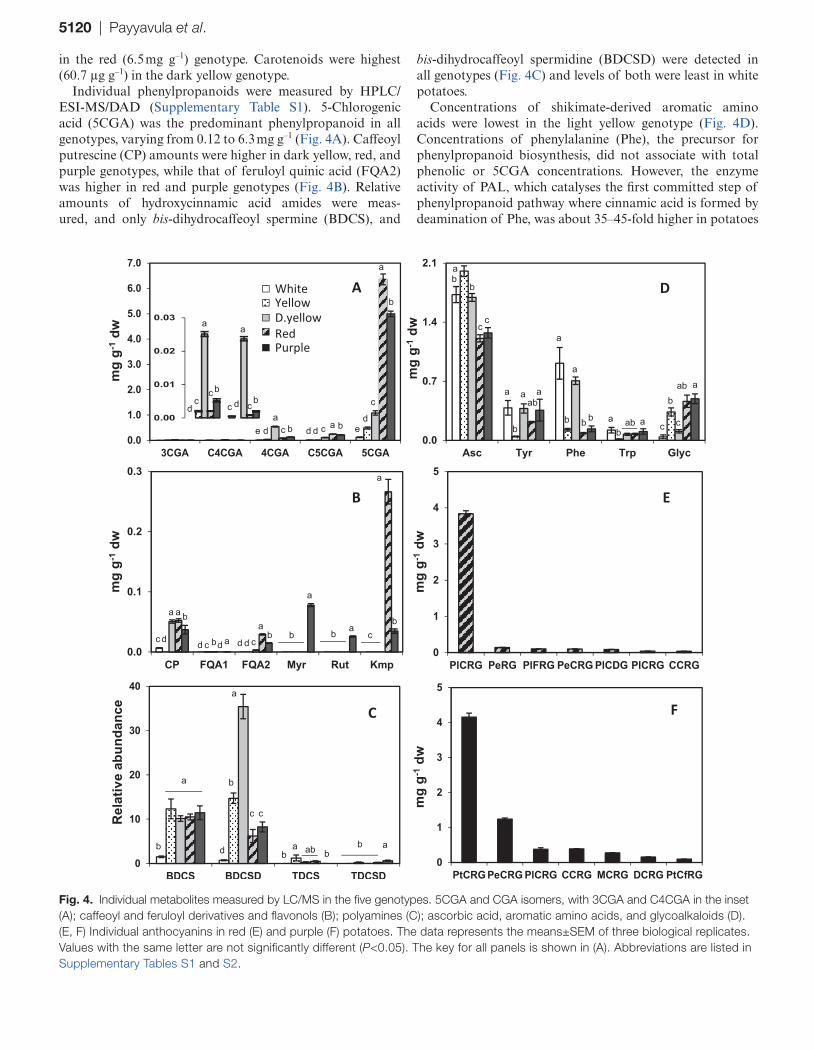
Individual phenylpropanoids were measured by HPLC/ESI-MS/DAD (Supplementary Table S1). 5-Chlorogenic acid (5CGA) was the predominant phenylpropanoid in all genotypes, varying from 0.12 to 6.3 mg g–1 (Fig. 4A). Caffeoyl putrescine (CP) amounts were higher in dark yellow, red, and purple genotypes, while that of feruloyl quinic acid (FQA2) was higher in red and purple genotypes (Fig. 4B). Relative amounts of hydroxycinnamic acid amides were meas-ured, and only bis-dihydrocaffeoyl spermine (BDCS), and
bis-dihydrocaffeoyl spermidine (BDCSD) were detected in all genotypes (Fig. 4C) and levels of both were least in white potatoes.
Concentrations of shikimate-derived aromatic amino acids were lowest in the light yellow genotype (Fig. 4D). Concentrations of phenylalanine (Phe), the precursor for phenylpropanoid biosynthesis, did not associate with total phenolic or 5CGA concentrations. However, the enzyme activity of PAL, which catalyses the first committed step of phenylpropanoid pathway where cinnamic acid is formed by deamination of Phe, was about 35–45-fold higher in potatoes
Fig. 4. Individual metabolites measured by LC/MS in the five genotypes. 5CGA and CGA isomers, with 3CGA and C4CGA in the inset (A); caffeoyl and feruloyl derivatives and flavonols (B); polyamines (C); ascorbic acid, aromatic amino acids, and glycoalkaloids (D). (E, F) Individual anthocyanins in red (E) and purple (F) potatoes. The data represents the means±SEM of three biological replicates. Values with the same letter are not significantly different (P<0.05). The key for all panels is shown in (A). Abbreviations are listed in Supplementary Tables S1 and S2.
Regulation of potato phenylpropanoids | 5121
with higher amounts of phenylpropanoids (Supplementary Fig. S2 at JXB online). Another major source of tuber anti-oxidant capacity is ascorbic acid, which varied from 1.2 to 2.0 mg g–1 among genotypes (Fig. 4D). Antioxidant capacity was measured by FRAP and was greater in red and purple potatoes (Supplementary Fig. S2).
Flavonols and anthocyanins
Among these genotypes, flavonols were observed only in red and purple potatoes (Fig. 4B). Purple potatoes accumulated myricetin-3-O-rutionside (Myr), quercetin-3-O-rutinoside (Rut), and kaempferol-3-O-rutinoside (Kmp), and the red genotype only accumulated Kmp but in greater amounts than the total flavonols in purple potatoes. Numerous antho-cyanins were present in red and purple genotypes, and the more abundant were analysed (Supplementary Table S2). Pelargonidin-3-(coumaroyl)-rutinoside-5 glucoside (PlCRG) was the predominant anthocyanin in the red genotype, contributing to >90% of total anthocyanins (Fig. 4E). In purple potatoes, petunidin-3-(coumaroyl)-rutinoside-5 glu-coside (PtCRG) and peonidin-3-(coumaroyl)-rutinoside-5 glucoside (PeCRG) comprised >80% of total anthocyanins (Fig. 4F).
Phenylpropanoid structural gene expression
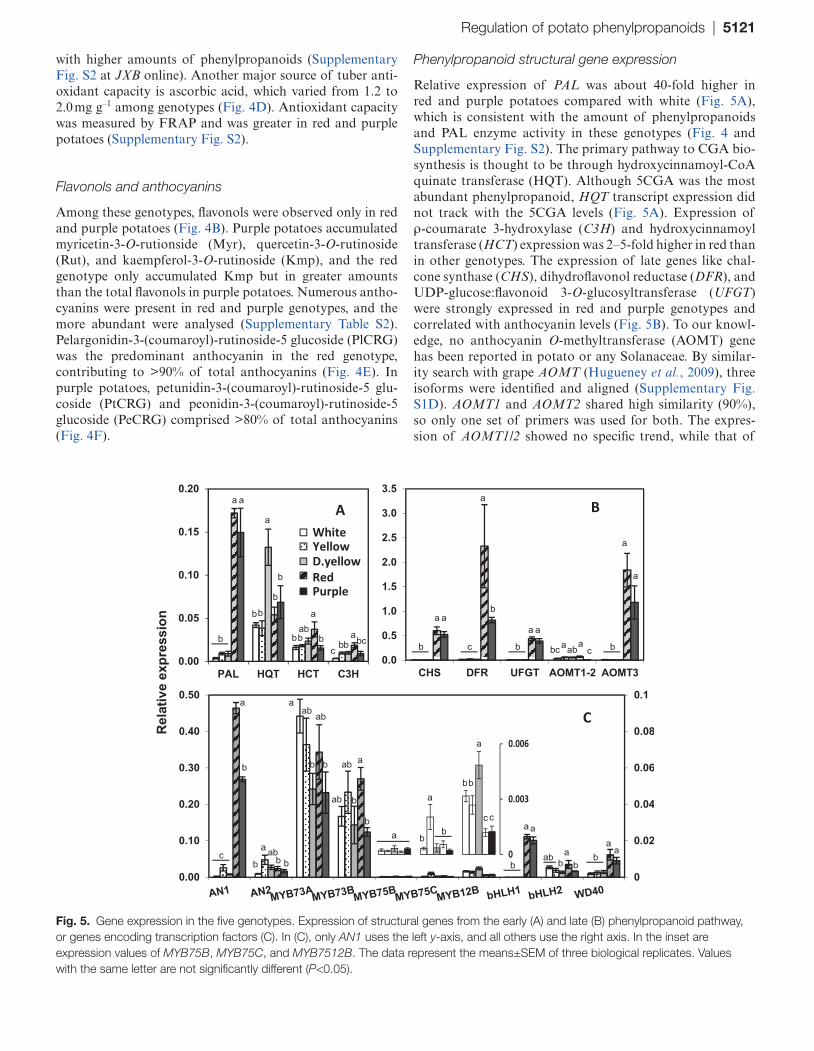
Relative expression of PAL was about 40-fold higher in red and purple potatoes compared with white (Fig. 5A), which is consistent with the amount of phenylpropanoids and PAL enzyme activity in these genotypes (Fig. 4 and Supplementary Fig. S2). The primary pathway to CGA bio-synthesis is thought to be through hydroxycinnamoyl-CoA quinate transferase (HQT). Although 5CGA was the most abundant phenylpropanoid, HQT transcript expression did not track with the 5CGA levels (Fig. 5A). Expression of ρ-coumarate 3-hydroxylase (C3H) and hydroxycinnamoyl transferase (HCT) expression was 2–5-fold higher in red than in other genotypes. The expression of late genes like chal-cone synthase (CHS), dihydroflavonol reductase (DFR), and UDP-glucose:flavonoid 3-O-glucosyltransferase (UFGT) were strongly expressed in red and purple genotypes and correlated with anthocyanin levels (Fig. 5B). To our knowl-edge, no anthocyanin O-methyltransferase (AOMT) gene has been reported in potato or any Solanaceae. By similar-ity search with grape AOMT (Hugueney et al., 2009), three isoforms were identified and aligned (Supplementary Fig. S1D). AOMT1 and AOMT2 shared high similarity (90%), so only one set of primers was used for both. The expres-sion of AOMT1/2 showed no specific trend, while that of
Fig. 5. Gene expression in the five genotypes. Expression of structural genes from the early (A) and late (B) phenylpropanoid pathway, or genes encoding transcription factors (C). In (C), only AN1 uses the left y-axis, and all others use the right axis. In the inset are expression values of MYB75B, MYB75C, and MYB7512B. The data represent the means±SEM of three biological replicates. Values with the same letter are not significantly different (P<0.05).
5122 | Payyavula et al.
AOMT3 was strongly expressed in red and purple potatoes (Fig. 5B).
Transcription factor analysis
Expression of the 15 potato transcription factors listed in the phylogenetic analysis was studied by qRT-PCR in the flesh of the five genotypes. Expression of MTF1, MTF2, MYB10, MYB12A, and MYB75A were below quantifiable levels. Primers amplified an appropriately sized fragment from genomic DNA eliminating sequence compatibility as an issue. The expression data for the remaining ten transcription fac-tors is shown in Fig. 5C. AN1 was by far the most abundantly expressed of those analysed, and was more than 100-fold higher in the flesh of red and purple genotypes. To evaluate whether differences in the AN1 protein might account for the differential phenylpropanoid profiles observed among the five genotypes, full-length coding regions were cloned and sequenced. The sequence was identical among Challenger, AmaRosa, and Purple Majesty, whereas a white and yel-low cultivar each had two nucleotide changes resulting in leucine-to-phenylalanine and leucine-to-valine substitutions (Supplementary Fig. S3a at JXB online).
Sequencing of ~1500 bp of the StAN1 promoter region revealed substantial differences. The promoter region was 97% similar between the low-phenylpropanoid white and yellow genotypes, and 93% similar between the purple and red pota-toes. However, only 37% similarity occurred between the white/yellow and red/purple genotypes. Interestingly, the white/yellow genotypes had only one sucrose-responsive (SURE) element, whereas the red and purple potatoes had six (Supplementary Fig. S3b). Similarly, no methyl jasmonate-responsive elements were present in the promoter region examined in the white and yellow potatoes, but five were present in red and four in purple potatoes. Despite using various primers, the promoter sequence of Challenger could not be amplified.
The expression of AN2, MYB75B, and MYB75C was much lower and did not associate with total phenylpropa-noid concentrations. Excluding AN1, the expression levels of MYB73A and MYB73B were higher than other transcription factors but did not associate with phenylpropanoid concen-trations. MYB12B was poorly expressed in all genotypes, but was the only gene that showed a clear inverse association with phenylpropanoid amounts. MYB12B expression was 2–4-fold higher in white and yellow genotypes compared with that in red and purple potatoes.
The expression of bHLH1 in tuber flesh was ~10–20-fold lower than that of AN1 and was detected only in red and pur-ple potatoes (Fig. 5C), whereas bHLH2 was expressed in all potatoes but did not show any association with phenylpropa-noid concentrations. WD40 expression was 3–5-fold higher in the red and purple potatoes.
Environmental effects on transcription factor expression
These results suggested that the differences in the phenyl-propanoid concentrations among different cultivars were
probably partly determined by AN1, bHLH1, and WD40, i.e. they have a role in determining the inter-genotypical varia-tion. However, phenylpropanoid concentrations can also vary significantly within potatoes of a single genotype. Potatoes from the same cultivar grown under the same management regime can have different concentrations in different years or locations. To determine whether AN1, bHLH1, and WD40 were also associated with intra-genotypical variation, purple potatoes grown in four locations in Alaska, plus in Texas and Florida, were examined. The Alaskan potatoes had signifi-cantly higher amounts of phenylpropanoids (Payyavula et al., 2012) that correlated with higher expression of AN1, bHLH1, and WD40 (Supplementary Fig. S4 at JXB online). AN1 expression was strongest in tuber samples from Wiseman, the northern-most site located in the Arctic Circle, and least in the southern-most locations. Similar patterns were observed for bHLH1 and WD40.
Evaluation of the role of sugars in phenylpropanoid metabolism
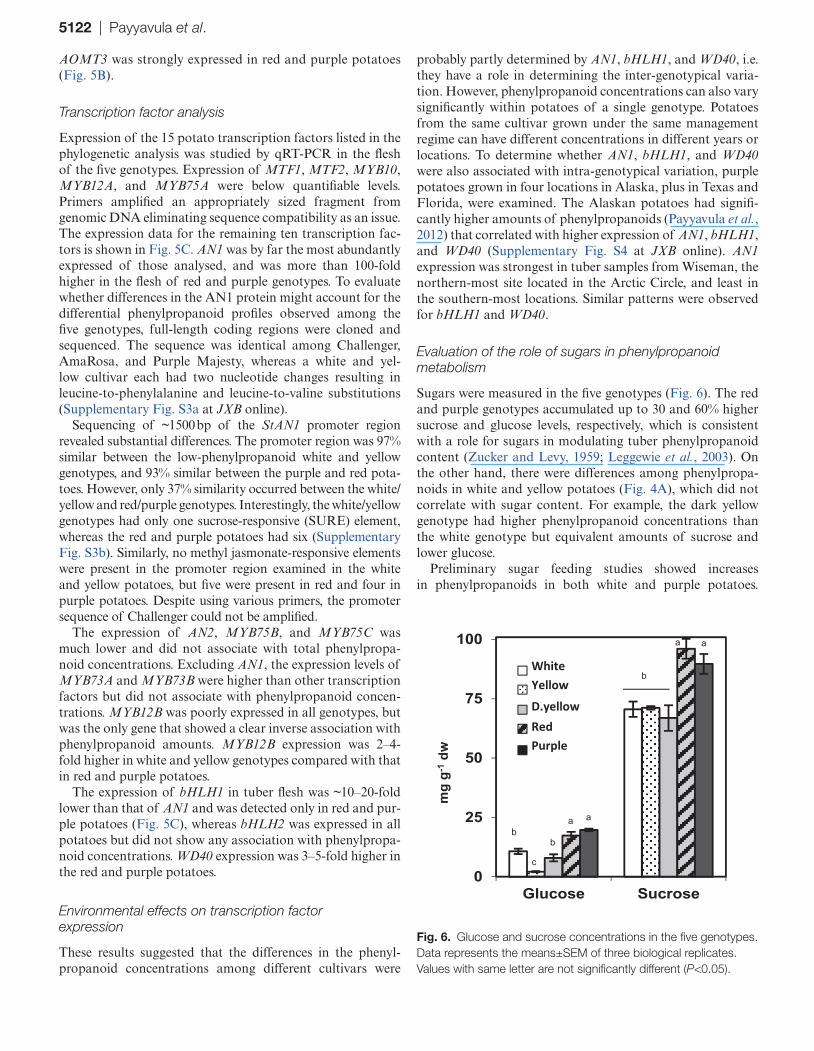
Sugars were measured in the five genotypes (Fig. 6). The red and purple genotypes accumulated up to 30 and 60% higher sucrose and glucose levels, respectively, which is consistent with a role for sugars in modulating tuber phenylpropanoid content (Zucker and Levy, 1959; Leggewie et al., 2003). On the other hand, there were differences among phenylpropa-noids in white and yellow potatoes (Fig. 4A), which did not correlate with sugar content. For example, the dark yellow genotype had higher phenylpropanoid concentrations than the white genotype but equivalent amounts of sucrose and lower glucose.
Preliminary sugar feeding studies showed increases in phenylpropanoids in both white and purple potatoes.
Fig. 6. Glucose and sucrose concentrations in the five genotypes. Data represents the means±SEM of three biological replicates. Values with same letter are not significantly different (P<0.05).
Regulation of potato phenylpropanoids | 5123
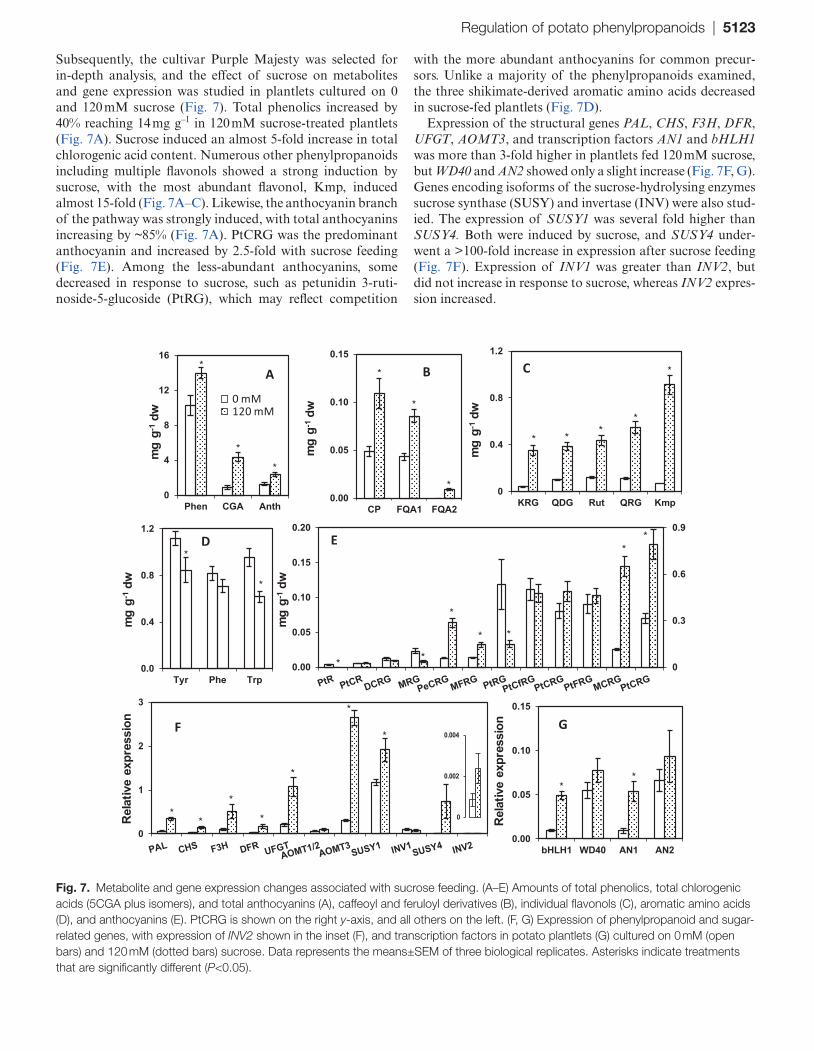
Subsequently, the cultivar Purple Majesty was selected for in-depth analysis, and the effect of sucrose on metabolites and gene expression was studied in plantlets cultured on 0 and 120 mM sucrose (Fig. 7). Total phenolics increased by 40% reaching 14 mg g–1 in 120 mM sucrose-treated plantlets (Fig. 7A). Sucrose induced an almost 5-fold increase in total chlorogenic acid content. Numerous other phenylpropanoids including multiple flavonols showed a strong induction by sucrose, with the most abundant flavonol, Kmp, induced almost 15-fold (Fig. 7A–C). Likewise, the anthocyanin branch of the pathway was strongly induced, with total anthocyanins increasing by ~85% (Fig. 7A). PtCRG was the predominant anthocyanin and increased by 2.5-fold with sucrose feeding (Fig. 7E). Among the less-abundant anthocyanins, some decreased in response to sucrose, such as petunidin 3-ruti-noside-5-glucoside (PtRG), which may reflect competition
with the more abundant anthocyanins for common precur-sors. Unlike a majority of the phenylpropanoids examined, the three shikimate-derived aromatic amino acids decreased in sucrose-fed plantlets (Fig. 7D).
Expression of the structural genes PAL, CHS, F3H, DFR, UFGT, AOMT3, and transcription factors AN1 and bHLH1 was more than 3-fold higher in plantlets fed 120 mM sucrose, but WD40 and AN2 showed only a slight increase (Fig. 7F, G). Genes encoding isoforms of the sucrose-hydrolysing enzymes sucrose synthase (SUSY) and invertase (INV) were also stud-ied. The expression of SUSY1 was several fold higher than SUSY4. Both were induced by sucrose, and SUSY4 under-went a >100-fold increase in expression after sucrose feeding (Fig. 7F). Expression of INV1 was greater than INV2, but did not increase in response to sucrose, whereas INV2 expres-sion increased.
Fig. 7. Metabolite and gene expression changes associated with sucrose feeding. (A–E) Amounts of total phenolics, total chlorogenic acids (5CGA plus isomers), and total anthocyanins (A), caffeoyl and feruloyl derivatives (B), individual flavonols (C), aromatic amino acids (D), and anthocyanins (E). PtCRG is shown on the right y-axis, and all others on the left. (F, G) Expression of phenylpropanoid and sugar-related genes, with expression of INV2 shown in the inset (F), and transcription factors in potato plantlets (G) cultured on 0 mM (open bars) and 120 mM (dotted bars) sucrose. Data represents the means±SEM of three biological replicates. Asterisks indicate treatments that are significantly different (P<0.05).
5124 | Payyavula et al.
Transient leaf infiltration assays
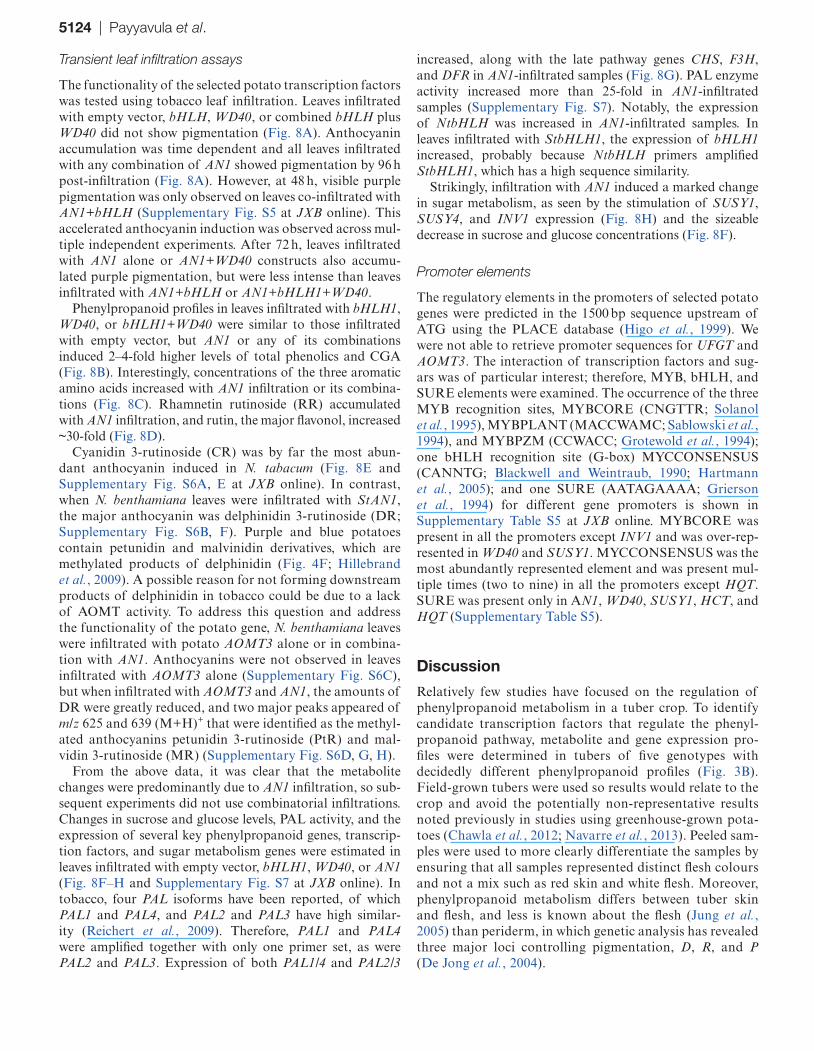
The functionality of the selected potato transcription factors was tested using tobacco leaf infiltration. Leaves infiltrated with empty vector, bHLH, WD40, or combined bHLH plus WD40 did not show pigmentation (Fig. 8A). Anthocyanin accumulation was time dependent and all leaves infiltrated with any combination of AN1 showed pigmentation by 96 h post-infiltration (Fig. 8A). However, at 48 h, visible purple pigmentation was only observed on leaves co-infiltrated with AN1+bHLH (Supplementary Fig. S5 at JXB online). This accelerated anthocyanin induction was observed across mul-tiple independent experiments. After 72 h, leaves infiltrated with AN1 alone or AN1+WD40 constructs also accumu-lated purple pigmentation, but were less intense than leaves infiltrated with AN1+bHLH or AN1+bHLH1+WD40.
Phenylpropanoid profiles in leaves infiltrated with bHLH1, WD40, or bHLH1+WD40 were similar to those infiltrated with empty vector, but AN1 or any of its combinations induced 2–4-fold higher levels of total phenolics and CGA (Fig. 8B). Interestingly, concentrations of the three aromatic amino acids increased with AN1 infiltration or its combina-tions (Fig. 8C). Rhamnetin rutinoside (RR) accumulated with AN1 infiltration, and rutin, the major flavonol, increased ~30-fold (Fig. 8D).
Cyanidin 3-rutinoside (CR) was by far the most abun-dant anthocyanin induced in N. tabacum (Fig. 8E and Supplementary Fig. S6A, E at JXB online). In contrast, when N. benthamiana leaves were infiltrated with StAN1, the major anthocyanin was delphinidin 3-rutinoside (DR; Supplementary Fig. S6B, F). Purple and blue potatoes contain petunidin and malvinidin derivatives, which are methylated products of delphinidin (Fig. 4F; Hillebrand et al., 2009). A possible reason for not forming downstream products of delphinidin in tobacco could be due to a lack of AOMT activity. To address this question and address the functionality of the potato gene, N. benthamiana leaves were infiltrated with potato AOMT3 alone or in combina-tion with AN1. Anthocyanins were not observed in leaves infiltrated with AOMT3 alone (Supplementary Fig. S6C), but when infiltrated with AOMT3 and AN1, the amounts of DR were greatly reduced, and two major peaks appeared of m/z 625 and 639 (M+H)+ that were identified as the methyl-ated anthocyanins petunidin 3-rutinoside (PtR) and mal-vidin 3-rutinoside (MR) (Supplementary Fig. S6D, G, H).
From the above data, it was clear that the metabolite changes were predominantly due to AN1 infiltration, so sub-sequent experiments did not use combinatorial infiltrations. Changes in sucrose and glucose levels, PAL activity, and the expression of several key phenylpropanoid genes, transcrip-tion factors, and sugar metabolism genes were estimated in leaves infiltrated with empty vector, bHLH1, WD40, or AN1 (Fig. 8F–H and Supplementary Fig. S7 at JXB online). In tobacco, four PAL isoforms have been reported, of which PAL1 and PAL4, and PAL2 and PAL3 have high similar-ity (Reichert et al., 2009). Therefore, PAL1 and PAL4 were amplified together with only one primer set, as were PAL2 and PAL3. Expression of both PAL1/4 and PAL2/3
increased, along with the late pathway genes CHS, F3H, and DFR in AN1-infiltrated samples (Fig. 8G). PAL enzyme activity increased more than 25-fold in AN1-infiltrated samples (Supplementary Fig. S7). Notably, the expression of NtbHLH was increased in AN1-infiltrated samples. In leaves infiltrated with StbHLH1, the expression of bHLH1 increased, probably because NtbHLH primers amplified StbHLH1, which has a high sequence similarity.
Strikingly, infiltration with AN1 induced a marked change in sugar metabolism, as seen by the stimulation of SUSY1, SUSY4, and INV1 expression (Fig. 8H) and the sizeable decrease in sucrose and glucose concentrations (Fig. 8F).
Promoter elements
The regulatory elements in the promoters of selected potato genes were predicted in the 1500 bp sequence upstream of ATG using the PLACE database (Higo et al., 1999). We were not able to retrieve promoter sequences for UFGT and AOMT3. The interaction of transcription factors and sug-ars was of particular interest; therefore, MYB, bHLH, and SURE elements were examined. The occurrence of the three MYB recognition sites, MYBCORE (CNGTTR; Solanol et al., 1995), MYBPLANT (MACCWAMC; Sablowski et al., 1994), and MYBPZM (CCWACC; Grotewold et al., 1994); one bHLH recognition site (G-box) MYCCONSENSUS (CANNTG; Blackwell and Weintraub, 1990; Hartmann et al., 2005); and one SURE (AATAGAAAA; Grierson et al., 1994) for different gene promoters is shown in Supplementary Table S5 at JXB online. MYBCORE was present in all the promoters except INV1 and was over-rep-resented in WD40 and SUSY1. MYCCONSENSUS was the most abundantly represented element and was present mul-tiple times (two to nine) in all the promoters except HQT. SURE was present only in AN1, WD40, SUSY1, HCT, and HQT (Supplementary Table S5).
Discussion
Relatively few studies have focused on the regulation of phenylpropanoid metabolism in a tuber crop. To identify candidate transcription factors that regulate the phenyl-propanoid pathway, metabolite and gene expression pro-files were determined in tubers of five genotypes with decidedly different phenylpropanoid profiles (Fig. 3B). Field-grown tubers were used so results would relate to the crop and avoid the potentially non-representative results noted previously in studies using greenhouse-grown pota-toes (Chawla et al., 2012; Navarre et al., 2013). Peeled sam-ples were used to more clearly differentiate the samples by ensuring that all samples represented distinct flesh colours and not a mix such as red skin and white flesh. Moreover, phenylpropanoid metabolism differs between tuber skin and flesh, and less is known about the flesh (Jung et al., 2005) than periderm, in which genetic analysis has revealed three major loci controlling pigmentation, D, R, and P (De Jong et al., 2004).
Regulation of potato phenylpropanoids | 5125
AN1, bHLH1, and WD40 regulate tuber anthocyanins and other phenylpropanoids
Red and purple potatoes had higher expression of phenyl-propanoid structural genes and contained higher amounts of
phenylpropanoids, not just anthocyanins but colourless com-pounds such as 5CGA (Figs 3B and 4A, B). Compared with concentrations reported previously in transgenic tubers over-expressing the R2R3 MYB StMTF1 (Rommens et al., 2008), the wild-type red and purple potatoes in this study contained
0
20
40
60
Glucose Sucrose0
10
20
30
40
0
0.4
0.8
1.2
PoCG PeR DR CR
0
1
2
3
4
Rut Kmp RR
0
0.6
1.2
1.8
2.4
0
4
8
12
PAL1 PAL2 CHS F3H DFR bHLH
0
0.2
0.4
0.6
0.8
Tyr Phe Trp
0
30
60
90
Phen CGA Anth
mg
g-1
dw
mg
g-1
dw
mg
g-1
dw
mg
g-1
dw
mg
g-1
dw
Rel
ativ
e ex
pre
ssio
n
Rel
ativ
e ex
pre
ssio
n
0
0.003
0.006
b
a
a
b
a
b
d
c
a
b
a
b a
b
a
b
a
b
a
b b
a
b
ab
a
a
aa
c
b
aab
ab
cc
d
a
b
b
a
aa
c
ad
b
a
b
c
a
aabb
d
c
aab
b
aa
b
c e
a
bd b
aab
b c
d
bbbcddc
abcaabc
bcab
a
ab
c
abc
bc
abc
Fig. 8. Metabolite and gene expression in transient leaf infiltration assays. (A) Tobacco leaves infiltrated with individual constructs or combinations of the four constructs. The letter on each leaf indicates the construct(s) infiltrated into that leaf. E, empty vector; B, bHLH1; W, WD40; A, AN1. (B) Levels of total phenolics, chlorogenic acids, and anthocyanins in leaves infiltrated with the designated construct(s). (C–F) Levels of aromatic amino acids (C), flavonols (D), and individual anthocyanins (E), and sugars (F). CR in (E) uses the y-axis on the right. The key in (B) also applies to (C)–(E). (G) Expression of phenylpropanoid genes and bHLH1. PAL1 is PAL1+PAL4 and PAL2 is PAL2+PAL3. (H) Sucrolytic gene expression in tobacco leaves infiltrated with different constructs. Expression of SUSY4 and INV2 is shown in the inset. The key for (G) and (H) is shown in (F). Asterisks indicate compounds below the limit of detection. The data represent the means±SEM of three biological replicates. Values with same letter are not significantly different (P<0.05).
5126 | Payyavula et al.
higher levels of phenylpropanoids, including almost 4-fold and 2-fold higher amounts of 5CGA and Kmp, respectively. Analysis of the potential involvement of 15 transcription fac-tors was measured by qRT-PCR. AN1 was the most abun-dantly expressed transcription factor and was >100-fold higher in red and purple potatoes than in white. Besides AN1, only two of the other examined transcription factors, bHLH1 and WD40, showed a positive correlation with phenylpropa-noid concentrations (Supplementary Fig. S8 at JXB online). Over 30 phenylpropanoid-related compounds were meas-ured, of which most were only minor components of total soluble tuber phenylpropanoids in red and purple potatoes (Fig. 4). Notably 5CGA and a single anthocyanin accounted for 80–90% of the total. Amounts of CGA and total phe-nylpropanoids strongly correlated with AN1 expression in genotypes with different phenylpropanoid profiles, and in response to environmental signals, sucrose feeding, and AN1 infiltration. These results suggested that AN1 can mediate marked changes in phenylpropanoids outside the anthocya-nin pathway, as chlorogenic acid is synthesized by a different branch of the pathway from anthocyanins. Consistent with this finding is the fact that 5CGA is found in much higher amounts in red and purple potatoes than in white or yellow (André et al., 2007b; Navarre et al., 2011).
To our knowledge, this is the first report of a potato WD40 whose expression correlates with phenolics and anthocya-nins (Supplementary Fig. S8). WD40 was not able to induce phenylpropanoid expression on its own in infiltration studies (Fig. 8A), consistent with previous results where overexpres-sion of WD40 from Medicago truncatula (MtWD40) in hairy roots failed to induce flavonols, proanthocyanidins, or antho-cyanins (Pang et al., 2009). In contrast, overexpression of MtWD40 was able to complement the lack of red-pigmented phenotype of a mutant line NF0977, which suggests that WD40 is required but not sufficient for anthocyanin pathway activation (Pang et al., 2009). However, ectopic expression of a grape WD40 induced anthocyanins in Arabidopsis leaves (Matus et al., 2010). These results illustrate the complex inter-actions among the transcription factors.
bHLH1 but not bHLH2 showed a strong association with phenylpropanoid expression. A quantitative trait locus study linked a potato bHLH to anthocyanin synthesis and reported that it was expressed in all the coloured genotypes and in 21 of 53 white or yellow genotypes, suggesting that it is required but not sufficient for anthocyanin synthesis (Zhang et al., 2009b). While we were unable to determine if these bHLHs are the same because sequence information was not available for the previous bHLH, both are localized on chromosome 9. The expression patterns of AN1, bHLH1, and WD40 sug-gest that they are determinants of the amounts of phenyl-propanoids that a given genotype will contain. AN1, bHLH1, and WD40 were also implicated in the intra-genotypical vari-ation that occurs in potatoes in response to environmental variations, such as when the same purple genotype was grown in Alaska, Texas, and Florida (Supplementary Fig. S4). The higher expression in the Alaskan-grown potatoes might be due to the lower temperatures or longer day length, and potentially reflects greater stress.
Unlike a previous microarray study that reported an ~40-fold increase in MYB73 in the purple flesh of a sectored potato that had both white and purple regions (Stushnoff et al., 2010), elevated expression of MYB73 was not observed in the red or purple genotypes relative to the white or yellow potatoes (Fig. 5C). MYB12, which regulates the flavonol branch of the pathway in Arabidopsis (Mehrtens et al., 2005), appeared to be negatively associated with tuber phenylpropanoid content. The minimal repression domain (TLLLFR) present at the C terminus of AtMYBL2, a nega-tive regulator of anthocyanin biosynthesis in Arabidopsis (Matsui et al., 2008), was not found in StMYB12B or in other MYB transcription factors in this study. Nor was the ERF-associated amphiphilic repression (EAR) motif, associated with repression of anthocyanin gene transcrip-tion, present in any in these potato MYBs (Ohta et al., 2001; Lin-Wang et al., 2011). Expression of other transcription factors varied among the genotypes but did not seem to be associated with phenylpropanoid content. Among the potato MYBs examined, StMTF1 has the highest percent-age similarity with AtPAP1 (Supplementary Table S4); how-ever, the StMTF1 transcript was not present at detectable levels in any of the genotypes examined, suggesting that the native gene does not have a major role in tuber phenylpro-panoid metabolism. A previous study showing a stimulatory effect of StMTF1 (Rommens et al., 2008) may be due to its being expressed under a heterologous promoter. Potentially StMTF1 under its own promoter is active in other tissues or conditions.
Importantly, the stimulatory effects of AN1 on phenylpro-panoid metabolism were not limited to anthocyanins because other compounds were also upregulated, notably 5CGA, the predominant soluble phenylpropanoid in potatoes (Fig. 8B). The increase in expression of CHS and F3H (Fig. 8G) along with a 30-fold increase in Rut (Fig. 8D) suggested that StAN1 upregulates 3´-hydroxylated flavonones. Collectively, the rela-tionship between StAN1 expression and high pelargonidin and petunidin concentrations in coloured potatoes and the induction of cyanidin or delphinidin derivatives in StAN1-infiltrated N. tabacum or N. benthamiana leaves suggest that StAN1 regulates flavanone 3-hydroxylase (F3H), flavo-noid 3-hydroxylase (F3´H), and flavonoid 3´,5´-hydroxylase (F3´5´H).
Differences were seen in aromatic amino acid pools among the samples. No obvious relationship was observed between these amino acids and phenylpropanoids in the field-grown tubers, whereas sucrose feeding lowered aro-matic amino acid concentrations but increased phe-nylpropanoids, AN1, bHLH1, and WD40 expression. However, AN1 infiltration decreased sucrose and glucose but increased the amounts of aromatic amino acids. The increase was particularly clear with tyrosine and not quite so dramatic with phenylalanine and tryptophan. Thus, sucrose feeding and AN1 infiltration both increased phe-nylpropanoids, whereas sucrose treatments decreased aromatic amino acid amounts but AN1 increased them. Understanding the basis for these differences will require further study.
Regulation of potato phenylpropanoids | 5127
AOMT
To our knowledge, a gene for AOMT has not been reported previously in potatoes or other solanaceous plants. AOMT3 but not AOMT1/2 showed a strong correlation with antho-cyanins (Supplementary Fig. S8) and altered anthocyanin profiles when infiltrated into leaves. AOMT3 probably plays a key role in determining the type of anthocyanins that accumulate in potatoes, and its identification offers another potential target for efforts to manipulate tuber anthocyanin composition. The failure of N. benthamiana leaves to synthe-size methylated anthocyanins when infiltrated with StAN1 suggests that either AN1 does not regulate AOMT or that tobacco leaves lack a functional AOMT. BLAST searches for an AOMT3 homologue in tobacco did not identify any candidates.
Sucrose induces AN1 and phenylpropanoid biosynthesis
In addition to providing carbon for phenylpropanoid metab-olism, sugars also regulate anthocyanin biosynthesis (Teng et al., 2005). During grape berry development, the increase in sugars modulates expression of anthocyanin biosynthetic genes (Boss et al., 1996). High-phenylpropanoid red and pur-ple potatoes had substantially higher amounts of sucrose and glucose than white or yellow tubers (Fig. 6). Similar relationships were seen in a tuber developmental study in which sugar and phenylpropanoid concentrations were cor-related (Navarre et al., 2013). To gain direct evidence, potato plantlets were cultured on medium supplemented with 0 or 120 mM sucrose, resulting in large increases in phenylpropa-noids (Fig. 7A). Sucrose stimulated significant increases in the expression of AN1, bHLH1, and WD40, demonstrating that the stimulatory effect of sucrose on potato phenylpro-panoid metabolism is at least partly modulated through these transcription factors. Supporting this finding is the higher expression of AN1, bHLH1, and WD40 in the field-grown potatoes that had highest sucrose and phenylpropanoid concentrations.
The presence of SURE elements in the promoter of AN1 (Supplementary Fig. S3b) is consistent with its regulation by sucrose. In addition to greater amounts of sucrose, purple and red potatoes contained six SURE elements in the AN1 promoter, whereas white and yellow potatoes had a single SURE element. A mechanism for the 5-fold increase in CGA (Fig. 7A) in response to sucrose is suggested by the MYB, bHLH, and SURE elements present in the promoter of HQT. SURE elements were not observed in the bHLH1 promoter, but bHLH1 expression was upregulated by sucrose treat-ment. A possible explanation is that the potato AN1 induced expression of tobacco bHLH in transient assays (Fig. 8G), which is consistent with a previous report of tobacco tran-scription factors (Bai et al., 2011). AN1-infiltrated leaves showed a 24 h delay in anthocyanin formation compared with AN1+bHLH1 co-infiltrated leaves (Supplementary Fig. S5), and the delay may reflect the time needed for AN1 to recruit bHLH. The promoters of potato PAL, CHS, F3H,
and DFR did not have SURE elements, but had MYB and bHLH regulatory elements (Supplementary Table S5), sug-gesting that the increased expression after sucrose feeding was due to AN1 and bHLH1. Anthocyanin levels in potato correlated with the expression of ANS and UFGT (Hu et al., 2011; Keifenheim et al., 2006) and higher expression of these genes was observed in this study in the high-phenylpropanoid potatoes and sucrose-treated potato plantlets (Figs 5B and 7F).
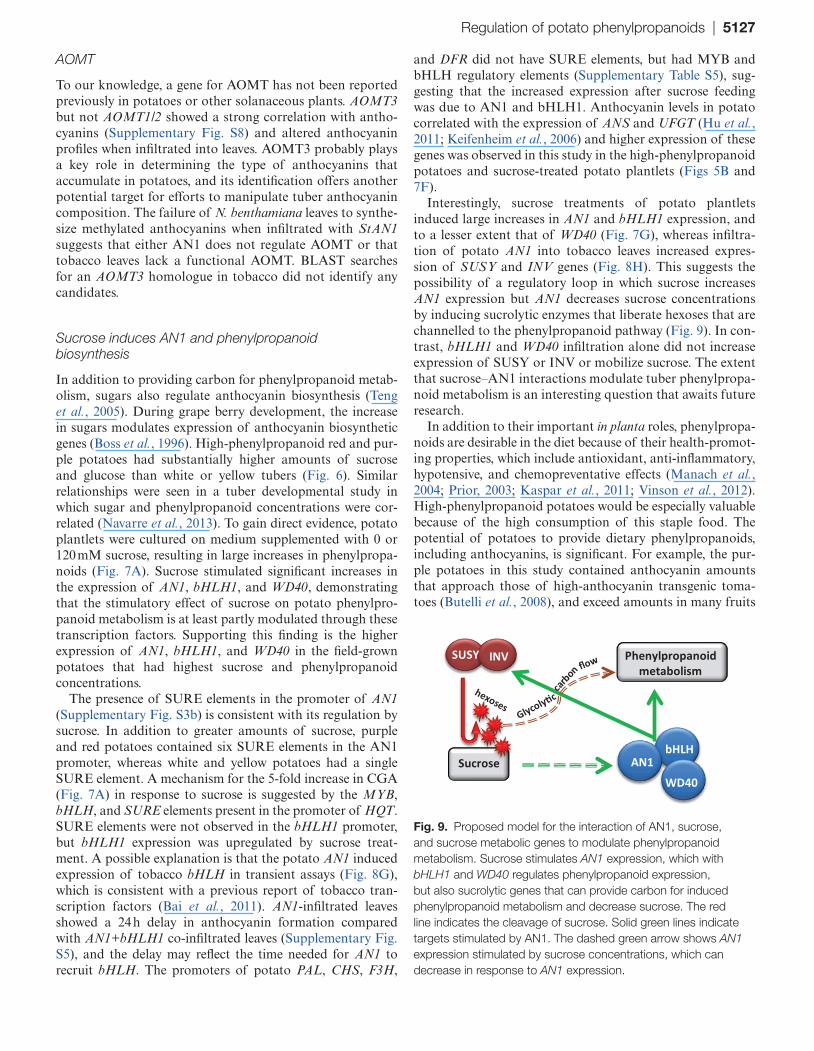
Interestingly, sucrose treatments of potato plantlets induced large increases in AN1 and bHLH1 expression, and to a lesser extent that of WD40 (Fig. 7G), whereas infiltra-tion of potato AN1 into tobacco leaves increased expres-sion of SUSY and INV genes (Fig. 8H). This suggests the possibility of a regulatory loop in which sucrose increases AN1 expression but AN1 decreases sucrose concentrations by inducing sucrolytic enzymes that liberate hexoses that are channelled to the phenylpropanoid pathway (Fig. 9). In con-trast, bHLH1 and WD40 infiltration alone did not increase expression of SUSY or INV or mobilize sucrose. The extent that sucrose–AN1 interactions modulate tuber phenylpropa-noid metabolism is an interesting question that awaits future research.
In addition to their important in planta roles, phenylpropa-noids are desirable in the diet because of their health-promot-ing properties, which include antioxidant, anti-inflammatory, hypotensive, and chemopreventative effects (Manach et al., 2004; Prior, 2003; Kaspar et al., 2011; Vinson et al., 2012). High-phenylpropanoid potatoes would be especially valuable because of the high consumption of this staple food. The potential of potatoes to provide dietary phenylpropanoids, including anthocyanins, is significant. For example, the pur-ple potatoes in this study contained anthocyanin amounts that approach those of high-anthocyanin transgenic toma-toes (Butelli et al., 2008), and exceed amounts in many fruits
Fig. 9. Proposed model for the interaction of AN1, sucrose, and sucrose metabolic genes to modulate phenylpropanoid metabolism. Sucrose stimulates AN1 expression, which with bHLH1 and WD40 regulates phenylpropanoid expression, but also sucrolytic genes that can provide carbon for induced phenylpropanoid metabolism and decrease sucrose. The red line indicates the cleavage of sucrose. Solid green lines indicate targets stimulated by AN1. The dashed green arrow shows AN1 expression stimulated by sucrose concentrations, which can decrease in response to AN1 expression.
5128 | Payyavula et al.
and vegetables (see Table 2 in Wu et al., 2006). Collectively, these data suggest that interactions among sucrose, sucrolytic enzymes, and AN1 modulate the pathway, and that AN1 is a key regulator of the most abundant tuber phenylpropanoids. Increased understanding of tuber phenylpropanoid metabo-lism will facilitate efforts to develop potatoes with optimal types and concentrations of phenylpropanoids.
Supplementary data
Supplementary data are available at JXB online.Supplementary Fig. S1. Protein sequence alignment of
representative (A) MYBs, (B) bHLH, (C) WD40, and (D) AOMT from potato and from other species.
Supplementary Fig. S2. PAL enzyme activity and FRAP antioxidant activity in the five genotypes.
Supplementary Fig. S3. (A) StAN1 protein sequence of the five potato genotypes used in this study. (B) StAN1 promoter region from four genotypes used in this study.
Supplementary Fig. S4. Expression of selected transcrip-tion factors in purple potatoes grown in Alaska (Wiseman, Fairbanks, Palmer and Juneau), Texas and Florida.
Supplementary Fig. S5. Tobacco leaves 48 and 72 h after infiltrating with a binary construct harbouring AN1 (A) alone or AN1 + bHLH1 (AB).
Supplementary Fig. S6. MS extracted ion data of the most abundant anthocyanins formed in (A) N. tabacum (Samsun) infiltrated with AN1. (B) N. benthamiana leaves infiltrated with AN1, (C) AOMT3, and (D) AN1+AOMT3.
Supplementary Fig. S7. PAL activity in tobacco leaves infiltrated with (E) empty vector, (B) bHLH1, (W) WD40, or (A) AN1.
Supplementary Fig. S8. Correlation analysis of tran-script and metabolite expression in tubers from five potato genotypes.
Supplementary Table S1. Retention times and MS data of select compounds present in potato phenolic extracts sepa-rated by HPLC.
Supplementary Table S2. Retention times and MS data of anthocyanins in potato extracts separated by HPLC.
Supplementary Table S3. List of primers used in this study.Supplementary Table S4. Protein similarity matrix of tran-
scription factors from different species.Supplementary Table S5. List of regulatory elements in pro-
moters of different genes from S. tuberosum group Phureja.
Acknowledgments
We thank Mel Martin, the J.R. Simplot Company, Joe Kuhl, and Creighton Miller for providing the potatoes used in this study and Vijaya Pasapula for statistical analysis. We thank the Washington State Potato Commission for support.
References
André CM, Ghislain M, Bertin P, Oufir M, Herrera Mdel R, Hoffmann L, Hausman JF, Larondelle Y, Evers D. 2007a. Andean potato cultivars (Solanum tuberosum L.) as a source of antioxidant
and mineral micronutrients. Journal of Agricultural and Food Chemistry 55, 366–378.
André CM, Oufir M, Guignard C, Hoffmann L, Hausman JF, Evers D, Larondelle Y. 2007b. Antioxidant profiling of native Andean potato tubers (Solanum tuberosum L.) reveals cultivars with high levels of beta-carotene, alpha-tocopherol, chlorogenic acid, and petanin. Journal of Agricultural and Food Chemistry 55, 10839–10849.
André CM, Schafleitner R, Legay S, Lefèvre I, Aliaga CAA, Nomberto G, Hoffmann L, Hausman J-F, Larondelle Y, Evers D. 2009. Gene expression changes related to the production of phenolic compounds in potato tubers grown under drought stress. Phytochemistry 70, 1107–1116.
Bai Y, Pattanaik S, Patra B, Werkman J, Xie C, Yuan L. 2011. Flavonoid-related basic helix-loop-helix regulators, NtAn1a and NtAn1b, of tobacco have originated from two ancestors and are functionally active. Planta 234, 363–375.
Ballester AR, Molthoff J, de Vos R, et al. 2010. Biochemical and molecular analysis of pink tomatoes: deregulated expression of the gene encoding transcription factor SlMYB12 leads to pink tomato fruit color. Plant Physiology 152, 71–84.
Benzie IFF, Strain JJ. 1996. The ferric reducing ability of plasma (FRAP) as a measure of “antioxidant power”: the FRAP assay. Analytical Biochemistry 239, 70–76.
Blackwell T, Weintraub H. 1990. Differences and similarities in DNA-binding preferences of MyoD and E2A protein complexes revealed by binding site selection. Science 250, 1104–1110.
Borovsky Y, Oren-Shamir M, Ovadia R, Jong W, Paran I. 2004. The A locus that controls anthocyanin accumulation in pepper encodes a MYB transcription factor homologous to Anthocyanin2 of Petunia. Theoretical and Applied Genetics 109, 23–29.
Boss PK, Davies C, Robinson SP. 1996. Analysis of the expression of anthocyanin pathway genes in developing Vitis vinifera L. cv Shiraz grape berries and the implications for pathway regulation. Plant Physiology 111, 1059–1066.
Butelli E, Titta L, Giorgio M, et al. 2008. Enrichment of tomato fruit with health-promoting anthocyanins by expression of select transcription factors. Nature Biotechnology 26, 1301–1308.
Chang SJ, Puryear J, Cairney J. 1993. A simple and efficient method for isolating RNA from pine trees. Plant Molecular Biology Reporter 11, 113–116.
Chawla R, Shakya R, Rommens CM. 2012. Tuber-specific silencing of asparagine synthetase-1 reduces the acrylamide-forming potential of potatoes grown in the field without affecting tuber shape and yield. Plant Biotechnology Journal 10, 913–924.
Chun OK, Kim DO, Smith N, Schroeder D, Han JT, Lee CY. 2005. Daily consumption of phenolics and total antioxidant capacity from fruit and vegetables in the American diet. Journal of the Science of Food and Agriculture 85, 1715–1724.
Coutu C, Brandle J, Brown D, Brown K, Miki B, Simmonds J, Hegedus D. 2007. pORE: a modular binary vector series suited for both monocot and dicot plant transformation. Transgenic Research 16, 771–781.
De Jong WS, Eannetta NT, De Jong DM, Bodis M. 2004. Candidate gene analysis of anthocyanin pigmentation loci in the Solanaceae. Theoretical and Applied Genetics 108, 423–432.
Regulation of potato phenylpropanoids | 5129
Dubos C, Stracke R, Grotewold E, Weisshaar B, Martin C, Lepiniec L. 2010. MYB transcription factors in Arabidopsis. Trends in Plant Science 15, 573–581.
Espley RV, Hellens RP, Putterill J, Stevenson DE, Kutty-Amma S, Allan AC. 2007. Red colouration in apple fruit is due to the activity of the MYB transcription factor, MdMYB10. The Plant Journal 49, 414–427.
Feyissa D, Lovdal T, Olsen K, Slimestad R, Lillo C. 2009. The endogenous GL3, but not EGL3, gene is necessary for anthocyanin accumulation as induced by nitrogen depletion in Arabidopsis rosette stage leaves. Planta 230, 747–754.
Gollop R, Even S, Colova-Tsolova V, Perl A. 2002. Expression of the grape dihydroflavonol reductase gene and analysis of its promoter region. Journal of Experimental Botany 53, 1397–1409.
Grant GA. 2006. The ACT domain: A small molecule binding domain and its role as a common regulatory element. Journal of Biological Chemistry 281, 33825–33829.
Grierson C, Du J-S, De Torres Zabala M, Beggs K, Smith C, Holdsworth M, Bevan M. 1994. Separate cis sequences and trans factors direct metabolic and developmental regulation of a potato tuber storage protein gene. The Plant Journal 5, 815–826.
Grotewold E, Drummond BJ, Bowen B, Peterson T. 1994. The myb-homologous P gene controls phlobaphene pigmentation in maize floral organs by directly activating a flavonoid biosynthetic gene subset. Cell 76, 543–553.
Grotewold E, Sainz MB, Tagliani L, Hernandez JM, Bowen B, Chandler VL. 2000. Identification of the residues in the Myb domain of maize C1 that specify the interaction with the bHLH cofactor R. Proceedings of the Academy of Sciences, USA 97, 13579–13584.
Grotewold E. 2005. Plant metabolic diversity: a regulatory perspective. Trends in Plant Science 10, 57–62.
Hartmann U, Sagasser M, Mehrtens F, Stracke R, Weisshaar B. 2005. Differential combinatorial interactions of cis-acting elements recognized by R2R3-MYB, BZIP, and BHLH factors control light-responsive and tissue-specific activation of phenylpropanoid biosynthesis genes. Plant Molecular Biology 57, 155–171.
Higo K, Ugawa Y, Iwamoto M, Korenaga T. 1999. Plant cis-acting regulatory DNA elements (PLACE) database: 1999. Nucleic Acids Research 27, 297–300.
Hillebrand S, Naumann H, Kitzinski N, Kohler N, Winterhalter P. 2009. Isolation and characterization of anthocyanins from blue-fleshed potatoes (Solanum tuberosum L.). Food 3, 96–101.
Hu C, Gong Y, Jin S, Zhu Q. 2011. Molecular analysis of a UDP-glucose: flavonoid 3-O-glucosyltransferase (UFGT) gene from purple potato (Solanum tuberosum). Molecular Biology Reports 38, 561–567.
Hugueney P, Provenzano S, Verries C, Ferrandino A, Meudec E, Batelli G, Merdinoglu D, Cheynier V, Schubert A, Ageorges A. 2009. A novel cation-dependent O-methyltransferase involved in anthocyanin methylation in grapevine. Plant Physiology 150, 2057–2070.
Jung CS, Griffiths HM, De Jong DM, Cheng S, Bodis M, De Jong WS. 2005. The potato P locus codes for flavonoid 3´,5´-hydroxylase. Theoretical and Applied Genetics 110, 269–275.
Jung CS, Griffiths HM, De Jong DM, Cheng S, Bodis M, Kim TS, De Jong WS. 2009. The potato developer (D) locus encodes an R2R3 MYB transcription factor that regulates expression of multiple anthocyanin structural genes in tuber skin. Theoretical and Applied Genetics 120, 45–57.
Kaspar KL, Park JS, Brown CR, Mathison BD, Navarre DA, Chew BP. 2011. Pigmented potato consumption alters oxidative stress and inflammatory damage in men. Journal of Nutrition 141, 108–111.
Keifenheim D, Smith A, Tong C. 2006. Cloning and accumulation of anthocyanin biosynthesis genes in developing tubers. American Journal Potato Research 83, 233–239.
Koch KE. 1996. Carbohydrate-modulated gene expression in plants. Annual Review of Plant Physiology and Plant Molecular Biology 47, 509–540.
Koes R, Verweij W, Quattrocchio F. 2005. Flavonoids: a colorful model for the regulation and evolution of biochemical pathways. Trends in Plant Science 10, 236–242.
Leggewie G, Kolbe A, Lemoine R, et al. 2003. Overexpression of the sucrose transporter SoSUT1 in potato results in alterations in leaf carbon partitioning and in tuber metabolism but has little impact on tuber morphology. Planta 217, 158–167.
Lin-Wang K, Micheletti D, Palmer J, et al. 2011. High temperature reduces apple fruit colour via modulation of the anthocyanin regulatory complex. Plant, Cell & Environment 34, 1176–1190.
Livak KJ, Schmittgen TD. 2001. Analysis of relative gene expression data using real-time quantitative PCR and the 2–ΔΔCT method. Methods 25, 402–408.
Luo J, Butelli E, Hill L, Parr A, Niggeweg R, Bailey P, Weisshaar B, Martin C. 2008. AtMYB12 regulates caffeoyl quinic acid and flavonol synthesis in tomato: expression in fruit results in very high levels of both types of polyphenol. The Plant Journal 56, 316–326.
Manach C, Scalbert A, Morand C, Remesy C, Jimenez L. 2004. Polyphenols: food sources and bioavailability. American Journal of Clinical Nutrition 79, 727–747.
Mathews H, Clendennen SK, Caldwell CG, et al. 2003. Activation tagging in tomato identifies a transcriptional regulator of anthocyanin biosynthesis, modification, and transport. Plant Cell 15, 1689–1703.
Matsui K, Umemura Y, Ohme-Takagi M. 2008. AtMYBL2, a protein with a single MYB domain, acts as a negative regulator of anthocyanin biosynthesis in Arabidopsis. The Plant Journal 55, 954–967.
Matus JT, Poupin MJ, Canon P, Bordeu E, Alcalde JA, Arce-Johnson P. 2010. Isolation of WDR and bHLH genes related to flavonoid synthesis in grapevine (Vitis vinifera L.). Plant Molecular Biology 72, 607–620.
Mehrtens F, Kranz H, Bednarek P, Weisshaar B. 2005. The Arabidopsis transcription factor MYB12 is a flavonol-specific regulator of phenylpropanoid biosynthesis. Plant Physiology 138, 1083–1096.
Navarre DA, Payyavula RS, R S, Knowles NR, Pillai S. 2013. Changes in potato phenylpropanoid metabolism during tuber development. Plant Physiology and Biochemistry 65, 89–101.
Navarre DA, Pillai S, Shakya R, Holden MJ. 2011. HPLC profiling of phenolics in diverse potato genotypes. Food Chemistry 127, 34–41.
5130 | Payyavula et al.
Neer EJ, Schmidt CJ, Nambudripad R, Smith TF. 1994. The ancient regulatory-protein family of WD-repeat proteins. Nature 371, 297–300.
Nesi N, Debeaujon I, Jond C, Pelletier G, Caboche M, Lepiniec L. 2000. The TT8 gene encodes a basic helix-loop-helix domain protein required for expression of DFR and BAN genes in Arabidopsis siliques. Plant Cell 12, 1863–1878.
Nicholas KB, Nicholas HBJ, Deerfield DWI. 1997. GeneDoc: analysis and visualization of genetic variation. EMBNEW.NEWS 4, 14.
Ohta M, Matsui K, Hiratsu K, Shinshi H, Ohme-Takagi M. 2001. Repression domains of class II ERF transcriptional repressors share an essential motif for active repression. Plant Cell 13, 1959–1968.
Pang Y, Wenger JP, Saathoff K, et al. 2009. A WD40 repeat protein from Medicago truncatula is necessary for tissue-specific anthocyanin and proanthocyanidin biosynthesis but not for trichome development. Plant Physiology 151, 1114–1129.
Parr AJ, Bolwell GP. 2000. Phenols in the plant and in man. The potential for possible nutritional enhancement of the diet by modifying the phenols content or profile. Journal of the Science of Food and Agriculture 80, 985–1012.
Pattanaik S, Kong Q, Zaitlin D, Werkman JR, Xie CH, Patra B, Yuan L. 2010. Isolation and functional characterization of a floral tissue-specific R2R3 MYB regulator from tobacco. Planta 231, 1061–1076.
Payyavula RS, Navarre DA, Kuhl JC, Pantoja A, Pillai SS. 2012. Differential effects of environment on potato phenylpropanoid and carotenoid expression. BMC Plant Biology 12, 39.
Prior RL. 2003. Fruits and vegetables in the prevention of cellular oxidative damage. American Journal of Clinical Nutrition 78, 570S-578S.
Quattrocchio F, Wing JF, Va K, De, Woude, Mol JNM, Koes R. 1998. Analysis of bHLH and MYB domain proteins: species-specific regulatory differences are caused by divergent evolution of target anthocyanin genes. The Plant Journal 13, 475–488.
Reichert AI, He XZ, Dixon RA. 2009. Phenylalanine ammonia-lyase (PAL) from tobacco (Nicotiana tabacum): characterization of the four tobacco PAL genes and active heterotetrameric enzymes. Biochemical Journal 242, 233–242.
Rommens CM, Richael CM, Yan H, Navarre DA, Ye J, Krucker M, Swords K. 2008. Engineered native pathways for high kaempferol and caffeoylquinate production in potato. Plant Biotechnology Journal 6, 870–886.
Rourke N O, Hatcher L, Stepanski EJ. 2005. A step-by-step approach to using SAS for univariate and multivariate statistics , 2nd edition. Cary, NC: SAS Institute Inc.
Sablowski RW, Moyano E, Culianez-Macia FA, Schuch W, Martin C, Bevan M. 1994. A flower-specific Myb protein activates transcription of phenylpropanoid biosynthetic genes. EMBO Journal 1, 128–137.
Shakya R, Navarre DA. 2006. Rapid screening of ascorbic acid, glycoalkaloids, and phenolics in potato using high-performance liquid chromatography. Journal of Agricultural and Food Chemistry 54, 5253–5260.
Singleton VL, Rossi Jr JA. 1965. Colorimetry of total phenolics with phosphomolybdic-phosphotungstic acid reagents. American Journal of Enology and Viticulture 16, 144–158.
Solanol R, Nieto C, Avila J, Cafias L, Diaz I, Paz-Ares J. 1995. Dual DNA binding specificity of a petal epidermis specific MYB transcription factor (MYB.Ph3) from Petunia hybrida. EMBO Journal 14, 1773–1784.
Solfanelli C, Poggi A, Loreti E, Alpi A, Perata P. 2006. Sucrose-specific induction of the anthocyanin biosynthetic pathway in Arabidopsis. Plant Physiology 140, 637–646.
Stracke R, Werber M, Weisshaar B. 2001. The R2R3-MYB gene family in Arabidopsis thaliana. Current Opinion in Plant Biology 4, 447–456.
Stushnoff C, Ducreux LJ, Hancock RD, et al. 2010. Flavonoid profiling and transcriptome analysis reveals new gene-metabolite correlations in tubers of Solanum tuberosum L. Journal of Experimental Botany 61, 1225–1238.
Tamura K, Dudley J, Nei M, Kumar S. 2007. MEGA4: Molecular evolutionary genetics analysis (MEGA) software version 4.0. Molecular Biology and Evolution 24, 1596–1599.
Teng S, Keurentjes J, Bentsink Ln, Koornneef M, Smeekens S. 2005. Sucrose-specific induction of anthocyanin biosynthesis in Arabidopsis requires the MYB75/PAP1 gene. Plant Physiology 139, 1840–1852.
The Potato Genome Sequencing Consortium. 2011. Genome sequence and analysis of the tuber crop potato. Nature 475, 189–195.
Verhaak RG, Sanders MA, Bijl MA, Delwel R, Horsman S, Moorhouse MJ, van der Spek PJ, Lowenberg B, Valk PJ. 2006. HeatMapper: powerful combined visualization of gene expression profile correlations, genotypes, phenotypes and sample characteristics. BMC Bioinformatics 7, 337.
Vetten Nd, Quattrocchio F, Mol J, Koes R. 1997. The an11 locus controlling flower pigmentation in petunia encodes a novel WD-repeat protein conserved in yeast, plants, and animals. Genes & Development 11, 1422–1434.
Vinson JA, Demkosky CA, Navarre DA, Smyda MA. 2012. High-antioxidant potatoes: acute in vivo antioxidant source and hypotensive agent in humans after supplementation to hypertensive subjects. Journal of Agricultural and Food Chemistry 60, 6749–6754.
Vogt T. 2010. Phenylpropanoid biosynthesis. Molecular Plant 3, 2–20.
Voinnet O, Rivas S, Mestre P, Baulcombe D. 2003. An enhanced transient expression system in plants based on suppression of gene silencing by the p19 protein of tomato bushy stunt virus. The Plant Journal 33, 949–956.
Walker AR, Davison PA, Bolognesi-Winfield AC, James CM, Srinivasan N, Blundell TL, Esch JJ, Marks MD, Gray JC. 1999. The TRANSPARENT TESTA GLABRA1 locus, which regulates trichome differentiation and anthocyanin biosynthesis in Arabidopsis, encodes a WD40 repeat protein. Plant Cell 11, 1337–1349.
Wrolstad RE, Durst RW, Lee J. 2005. Determination of total monomeric anthocyanin pigment content of fruit juices, beverages, natural colorants, and wines by the pH differential method: Collaborative study. Journal of AOAC International 88, 1269–1278.
Regulation of potato phenylpropanoids | 5131
Wu X, Beecher GR, Holden JM, Haytowitz DB, Gebhardt SE, Prior RL. 2006. Concentrations of anthocyanins in common foods in the United States and estimation of normal consumption. Journal of Agricultural and Food Chemistry 54, 4069–4075.
Yanhui C, Xiaoyuan Y, Kun H, et al. 2006. The MYB transcription factor superfamily of Arabidopsis: expression analysis and phylogenetic comparison with the rice MYB family. Plant Molecular Biology 60, 107–124.
Zhang Y, Cheng S, De Jong D, Griffiths H, Halitschke R, De Jong W. 2009a. The potato R locus codes for dihydroflavonol 4-reductase. Theoretical and Applied Genetics 119, 931–937.
Zhang Y, Jung CS, De Jong WS. 2009b. Genetic analysis of pigmented tuber flesh in potato. Theoretical and Applied Genetics 119, 143–150.
Zimmermann IM, Heim MA, Weisshaar B, Uhrig JF. 2004. Comprehensive identification of Arabidopsis thaliana MYB transcription factors interacting with R/B-like BHLH proteins. Plant Journal 40, 22–34.
Zucker M, Levy CC. 1959. Some factors which affect the synthesis of chlorogenic acid in disks of potato tuber. Plant Physiology 34, 108–112.
Zucker M. 1965. Induction of phenylalanine deaminase by light and its relation to chlorogenic acid synthesis in potato tuber tissue. Plant Physiology 40, 779–784.


![Evolution of the Structural Representation of Sucrose [1]](https://img.dokumen.tips/doc/110x75/6349252e2cd4c1a3540d5d77/evolution-of-the-structural-representation-of-sucrose-1.jpg)


