Embed Size (px)
Citation preview
Provided by the author(s) and University College Dublin Library in accordance with publisher policies. Please
cite the published version when available.
Downloaded 2016-01-21T02:53:28Z
Some rights reserved. For more information, please see the item record link above.
Title Transaction costs of firms in the EU ETS
Author(s) Jaraite, Jurate; Convery, Frank J.; Di Maria, Corrado
PublicationDate 2009-04
Publisher Irish Economic Association
Link topublisher's
version
http://www.iea.ie/conferences/2009/JaraiteConveryDiMariaPaper.pdf
This item'srecord/moreinformation
http://hdl.handle.net/10197/2077

TRANSACTION COSTS OF FIRMS IN THE EU ETS
J. Jaraite1, F. Convery, C. Di Maria
Version: January 15, 2009
Abstract
This paper is a first attempt to empirically measure transaction costs – a composite of administrativecosts and trading costs – of firms in the European Union’s CO2 Emissions Trading Scheme (EU ETS)during its trial phase (2005-2007). This analysis provides some evidence that transaction costs of firmswere mainly of administrative nature. There are also remarkable economies of scale, with the costs pertonne of CO2 lower for participants with larger allocation. The composition of these costs diverges tooas the share of early implementation costs tend to be significantly larger emitters. Trading transactioncosts were not significant and, hence, trade prohibitive and other factors – self-sufficiency incompliance and low allowance price – played a major role in deciding whether to trade or not duringthe trial trading period.
Keywords Climate policy, European Union Emissions Trading Scheme, Transaction costs
JEL Classification D23 H41 O13 Q52 Q54 Q58
1 University College Dublin, School of Geography, Planning and Environmental Policy, Richview, Clonskeagh, Dublin 14,Ireland, [email protected]

2
Content
1. Introduction........................................................................................................................................... 32. Environmental policy and transaction costs: theory and application.................................................... 43. Taxonomy of transaction costs in the EU ETS..................................................................................... 64. Research Methods ................................................................................................................................. 75. Findings................................................................................................................................................. 9
5.1 Early implementation costs............................................................................................................. 95.2 Monitoring, Reporting and Verification (MRV) costs.................................................................. 115.3 Trading costs ................................................................................................................................. 14
6. Conclusions and policy implications .................................................................................................. 15References ............................................................................................................................................... 18
List of tables
Table 1 Distribution of allowances across installations in the EU ETS, 2005-2007 ................................ 8
List of figures
Figure 1 Distribution of verified emissions across companies in the EU ETS, 2005-2007 ..................... 8Figure 2 Early implementation costs per respondent across different respondents’ categories ............. 10Figure 3 Early implementation costs per tonne of CO2 emissions emitted across different respondents’categories ................................................................................................................................................ 10Figure 4 Composition of total early implementation costs across different respondents’ categories..... 11Figure 5 The breakdown of the total MRV costs across different respondents’ categories ................... 12Figure 6 3-year MRV costs per respondent across different respondents’ categories............................ 13Figure 7 3-year MRV costs per tonne of CO2 emissions emitted across different respondents’ categories................................................................................................................................................................. 13Figure 8 Composition of MRV costs across different respondents’ categories...................................... 13Figure 9 Total transaction costs per respondent across different respondents’ categories ..................... 16Figure 10 Total transaction costs per tonne of CO2 emissions emitted across different respondents’categories ................................................................................................................................................ 16
List of annexes
Annex 1 A copy of transaction costs’ survey ......................................................................................... 20Annex 2 Ireland’s Allocation (2005-2007)............................................................................................. 26Annex 3 Summary of companies contacted............................................................................................ 27Annex 4 Interview Profiles ..................................................................................................................... 28Annex 5 Monetisation of the early implementation costs and the MRV costs....................................... 29Annex 6 Early implementation cost........................................................................................................ 30Annex 7 MRV costs................................................................................................................................ 31Annex 8 Total transaction costs .............................................................................................................. 32

3
“…we have to take into account the costs involved in operating the various social arrangements(whether it be the working of a market or of a government department), as well as the cots involved inmoving to a new system. In devising and choosing between social arrangements we should have regardfor the total effect. This, above all, is the change in approach which I am advocating.”
Coase (1960, p. 44)
1. IntroductionThe European Union’s CO2 Emission Trading Scheme (EU ETS), as any other pollution tradingsystem, is expected to produce efficiency gains in reaching the CO2 emissions target, i.e. firms withlower abatement costs will abate first, and will sell their surplus of allowances to firms with higherabatement costs. As abatement will occur where costs are lowest, abatement targets are met at leastcost. Montgomery (1972) shows that this efficient equilibrium is independent on initial allocationsuggesting that regulator can distribute permits as he or she wish. These main features – cost-effectiveness and non-necessity of information to allocate emissions – of environmental tradingschemes are the main arguments why emission trading was favoured over other alternativeenvironmental regulations in order to mitigate climate change. However, Stavins (1995) uses simplebut sophisticated theoretical framework and shows that the potential costs savings from trading systemsmight be compromised by the presence of trading transaction costs. Nature of transaction costs candetermine whether the initial allocation matters to reach the efficient equilibrium. Likewise, Tietenberg(2006) argues, that a complete ex-post evaluation of cost-effectiveness of any trading programmeshould address total compliance costs – abatement costs as well as trading transaction costs andadministrative costs. This total costs evaluation approach is especially useful at the early stages of thetrading programs as it might provide some insights for the further policy design.
These theoretical findings on transaction costs are testified by some empirical analyses of thepioneering environmental trading systems in the US. Kerr and Maré (1998) find that the presence oftransaction costs in the lead permits programme caused efficiency losses of 10-20 percent, andGangadharan (2000) shows that the effect of transaction costs on the Regional Clean Air IncentivesMarket (RECLAIM) participation was significant; without these costs the probability of trading wouldhave increased by 12-32 percent.
Based on this evidence from the early environmental trading programmes and the fact that the EU ETSis the biggest and the most complex environmental trading scheme that encompasses firms with verydifferent industrial and organisational structure which use very different technologies to produce(provide) very heterogeneous goods (services), it is important to understand transaction costs in the EUETS over its trial phase (2005-2007).
This study addresses only transaction costs incurred by firms, but it must be understood thatgovernments also incur transaction costs. The European Commission (EC) faced transaction costsassociated with the creation and maintenance of an EU ETS team in Brussels. In addition, each EUmember state had to establish an organisation to identify the potential CO2 emitters and ensure thatbaseline monitoring of emissions was carried out. Member states also had to decide how to distributeallowances among participants, monitor and verify emissions, set up and maintain the registers,conduct an allowance auction if necessary, communicate and negotiate with the EC and enforce theprovisions of the Directive.
The transaction costs incurred by firms are associated with setting up a monitoring scheme, reportingemissions, hiring an emission verifier every year and trading allowances. Some of these costs areincurred only at the initial stage of the policy implementation; however, the costs associated withemissions monitoring, reporting and verification procedures are continuing costs. The costs related to

4
trade of allowances are variable as they depend on the number of trades conducted and/or a volume ofeach trade.
Unlike most studies on transaction costs in environmental trading systems, we focus on bothadministrative costs and trading transaction costs (hereafter transaction costs). An objective of thisstudy is to define the sources and nature of transaction costs and then to estimate the magnitude anddistribution of these costs among firms in the EU ETS. A core hypothesis is that these costs would berelatively modest, but that there would be considerable economies of scale, with the costs per tonne ofCO2 greater the smaller the allocation. We are also interested to know how these costs were distributedacross the preparation, implementation and compliance cycle, and to distinguish between total, fixedand marginal costs.
For this purpose all Irish companies covered by the scheme during 2005-2007 were asked to complete asurvey. While Ireland is not a representative EU member state in some respects – the share of Ireland’sCO2 emissions in the EU ETS is low (around 30%) due to dominance of agriculture and transportemissions, a rapid growing service economy, and industrial output that is concentrated primarily innon-energy intensive sectors – it is in others. Ireland is home to all sectors covered by the EU ETS,with the exception of metal processing. Also, Irish firms and installations vary in size and many firmshave several installations, thereby allowing an understanding of whether transaction costs differedacross installation of different size.
The remainder of this article is structured as follows: we start our analysis by reviewing theoretical andempirical literature on transaction costs (Section 2). Section 3 presents taxonomy of transaction costs inthe EU ETS. In section 4 the research methodology is presented. The survey’s findings are providedand discussed in Section 5. Section 6 provides summary on transaction costs, our conclusions, andsome policy implications for the future reform of the EU ETS.
2. Environmental policy and transaction costs: theory and applicationThe OECD (1993) defines transaction costs as “the costs involved in market exchange. These includethe costs of discovering market prices and the cots of writing and enforcing contracts,” while anotherOECD (2001) definition says that transaction costs are “the costs of gathering information, makingdecisions/contracting, and controlling/policing”. The former characterization encompasses marketrelated transaction costs; while the latter one covers both policy and non-policy related transactioncosts, a convention which we adopt.
Few studies attempt to conceptualise transaction costs of environmental policies. McCann et al. (2005)provide a comprehensive taxonomy of transaction costs also the different methodologies of measuringthese costs. In their framework transaction costs are more agent and time specific rather thantransaction specific. They promote an ‘absolute’ transaction costs evaluation approach. Opposite totheir arguments, Rao (2003) suggests that it is enough to consider only these transaction costs’components which are not common to alternative policies. We yield to the later approach.
Krutilla (1999) argues that, in principle, in the environmental economics literature, the area oftransaction costs is relatively unexplored. Transaction costs are not taken into account in the most ofthe studies on the governance of global commons (Ostrom 1990). However, despite the fact thatpollution trading gained its popularity quite recently, the attention for understanding transaction costs isquite adequate in the literature of environmental tradable systems.
Stavins (1995) published a study of the potential impacts of trading transaction costs on pollutiontrading. Within a theoretical framework he shows that under the presence of transaction costs, firstly,the efficient equilibrium of the trading systems might be undermined (decrease in the volume of

5
permits traded), and, secondly, the market equilibrium will depend on the initial allocation2.Nevertheless, discussing implication for public policy, Stavins points out that even with the existenceof transaction costs trading system will likely be less costly than a technology standard (less flexibilityfor firms in choosing abatement options).
Crals and Vereek (2005) compare transaction costs of tradable permit systems with environmentaltaxes. Their analysis denies a ‘conventional wisdom’ that environmental taxation is less complicatedand entails fewer transaction costs (especially set-up and negotiation costs) than a cap-and-and tradesystem. Polinsky and Shavell (1981) theoretically show that pollution taxes, as tradable permits, mightresult in different kinds of administrative costs, and, hence might also affect the optimal tax level.
Woerdman (2001) investigates the transaction costs of the three flexibility mechanism – JointImplementation (JI), Clean Development Mechanims (CDM) and International Emissions Trading(IET) - allowed by the Kyoto Protocol. His study concludes that transaction costs for JI and CDMproject will not necessarily be higher than those for IET. This conclusion is based on the argument thattransaction costs for CDM and JI and IET flexibility mechanisms considerably depend on the market’sdesign and the political elaboration of relevant documentation. The differences between pollutiontrading and project based mechanisms in terms of their transaction costs are also addressed by Betz(2005). She notes that in baseline and credit scheme3 transaction costs only occur if credits aregenerated, while in tradable programme some of the firm’s costs (e.g. set-up costs and MRV costs)exist even without engaging in trade. Similarly to (Woerdman 2001) findings, author concludes thatbaseline and credit schemes might result in higher one-time administration costs in setting up theproject, but will have less ongoing costs when rules and standardized procedures are established.
Ex-ante literature on tradable schemes usually neglects or incompletely anticipates the presence oftransaction costs (Ellerman, Joskow et al. 2005; Tietenberg 2006). One of the early simulation studies(Capros and Mantzos 2000) on cost savings of the EU-wide emission trading assumes non-zeroadministrative costs, while an allowance market is considered as perfect without any transaction costs.The latest simulation studies (Klepper and Peterson 2005; Peterson 2006; Alexeeva-Talebi and Anger2007) only take into account the transaction costs associated with the project based mechanisms (CDMand JI) suggesting that transaction costs for the EU ETS are not considerable.
Where transaction costs present in the earlier trading systems? We look at some empirical evidence oftransaction costs in the earlier permit trading programmes.
The Fox River scheme in Wisconsin under which rights to discharge water pollutants into the FoxRiver could be traded is a well cited example of pollution trading failure due to the high transactioncosts. Only one trade has taken place at the initial stages of this scheme. Hahn and Hester (1989)explain that the main reasons of this no-trade situation were no opportunity for trading within a firm,trading barriers from regulator side, limited life of the rights, and high administrative requirements.
The lead permit trading programme that aimed for reductions in the amount of lead added to gasolineexperienced the high trading levels and is treated as an example of a successful marketable permitsprogramme (Hahn and Hester 1989). The minimal administrative requirements from regulatory side,well-established markets, a possibility to conduct intra and inter trades, homogeneity of participants,previous trading experience, and easiness to find trading partner were the major factors explaining thissuccess (Hahn and Hester 1989; Gangadharan 2000). Despite a success of this programme, Kerr andMaré (1998) use empirical data and find that transaction costs in this programme were significant for
2 Cason and Gangadharan (2003) confirm this theoretical finding by doing an experimental study.3 In baseline and credit scheme only emissions reductions compared to baseline or target are tradable.

6
first-trade transactions4 which account for around 10-20 percent of loss in cost effectiveness. Theselosses were highest for refineries in firms with few refineries and refineries in small firms.
Differently than the lead trading programme, the RECLAIM, initiated to reduce smog creatingpollutant in Los Angeles, encompassed firms with different industrial structure which participate indifferent input and output markets. Gangadharan (2000) empirically measures whether the presence oftransaction costs affected the trading probabilities of firms in the RECLAIM. Her study concludes thatwithout transaction costs probability of trading would increase by 32 percent in 1995 and by 12 percentin 1996 suggesting that these costs are more significant in the early stages of the programme and theyreduce as the market matures and participants learn how to trade (Cason and Gangadharan 2003).
The US market for SO2 trading is recognised as the most successful trading scheme of such a scale.Transaction costs were mentioned as one of the preconditions that could explain the low tradingactivity and successive low allowance price in the initial phase of this programme (Burtraw 1996).However, Conrad and Kohn (1996, p. 1051) conclude that “transaction costs and regulatory uncertaintyhave not significantly affected the price of allowance”. The brokerage fees – a proxy for tradingtransaction costs – were estimated to be less than 2 percent of the prevailing spot price of allowance(Joskow, Schmalensee et al. 1998). Low transaction costs of allowance trading are explained byexistence of low bulletin boards, anonymity of market participants, active brokers, and no restrictionsfrom the government on when and how to trade the assigned rights (Joskow, Schmalensee et al. 1998;Solomon 1999; Ellerman, Joskow et al. 2005). Homogeneity (only electric generating units) and thenumber of the participants might be other ingredients of this programme’s success.
The UK ETS was the world's first economy-wide greenhouse gas emissions trading scheme. Theparticipants noted that MRV procedures were the most time consuming requirements of the scheme,while brokers had a minimum floor for the volume of a trade, some charging a minimum arrangementfee which could make transaction costs of a small trade prohibitive (ENVIROS 2006).
3. Taxonomy of transaction costs in the EU ETSWe define transaction costs of firms’ in the EU ETS as a composite of administrative costs and tradingcosts. More explicitly, by ‘transactions costs’ experienced by the firms in the EU ETS trial phase wemean those costs the firms incurred in preparing for, and setting up systems to comply with theregulations required by participation in the EU ETS, and then engaging with the market. It would beunreasonable to analyse only one of these costs components or analyses them separately in differentdimensions. The experience of the previous pollution trading schemes shows that impediments fromregulatory side help to explain frictions in pollution trading markets. Betz (2005) points out that thatwhile trading (market) transaction costs are shifted from seller to other agents like brokers in theeconomy, whereas costs of administrative nature will be a loss to society, since they are real resourcelosses that do not affect the traded volume.
Transaction costs of firms covered under the EU ETS can be grouped into three categories: (1) earlyimplementation costs, i.e. costs that were incurred before 1 January 2005; (2) monitoring, reporting,and verification (MRV) costs, i.e. costs that were experienced annually; and (3) trading costs. First twocategories of costs were relevant for all firms in the scheme, whereas the third category of costs wasonly significant for firms that entered the CO2 trading market. Early implementation costs are almost
4 These costs are defined as the costs of making one trade rather than not trading.

7
all fixed costs, MRV costs are periodic costs, so the variable and, hence, the marginal costs would betrading costs5.
The early implementation costs are the costs incurred by firms before the official start of the scheme.During this time, the familiarisation with scheme rules and guidelines was achieved, baseline emissionswere calculated, an operator holding account for each installation was established, and any necessarycapital equipment was purchased. These costs can be considered as one-time fixed set-up costs anddivided into three categories: (i) internal costs incurred by the firms in terms of additional managementand staff time and training; (ii) consultancy costs incurred in terms of consultancy services taken on;and (iii) capital costs, meaning additional monitoring, recording, and data storage equipment needed tocomply.
The costs related to MRV activities were incurred annually since the MRV procedures were mandatoryon an annual basis for all installations in the EU ETS. At the end of the year every company had toprepare an annual emissions report which must then be verified. The EU ETS requires all annualemissions reports and monitoring to be verified by an independent accredited verifier. We assume thatMRV costs are a combination of internal company costs, mainly management and staff time, andconsultancy costs, where a firm buys in the necessary capacity to be MRV compliant (e.g. chargers forexternal consultancy services and for accredited verifiers).
Trading costs were incurred only by firms covered in the EU ETS which entered the CO2 tradingmarket. These costs depended on: the number of transactions conducted; the volume of allowancestraded; and any search or other fee costs incurred (the costs of the allowances themselves are notincluded). Any installation could trade with other installations in the same business group (internaltrade) or could trade with other installations outside the business group and financial institutions(external trade). Likewise, companies could trade either directly or indirectly, i.e. via a third-party.
4. Research MethodsThe survey of Irish firms consisted of two stages: (1) a mail survey and (2) face-to-face interviews. InStage 1, a questionnaire was sent for all 72 firms with 106 installations that were covered in the firstphase of the EU ETS6. According to the Ireland’s national allocation plan (NAP) 2005-2007 (EPA2005), the Ireland’s Environmental Protection Agency (EPA) allocated these installations with 66.96million of allowances (see Annex 2). These allowances were distributed to the following sectors: brickand ceramics (0.2%), cement and lime (18.1%), glass (0.1%), paper (0.1%), refining (1.9%) and energyactivities (power generation (66.3%) and other combustion (13.4%)). 92.1 percent of allowances wereallocated to 21 installations. By definition, the share of allocations received by the remaininginstallations was very small (see Table 1).
5 Alternative to this classification, Betz divides transaction costs as one-time costs (early implementation) and ongoing costs(MRV costs and trading costs).6 A questionnaire was sent to all companies that had a greenhouse gas permit before 31/03/2004, i.e. new planneddevelopments were included as their timing of the compliance was the same as for existing installations. For each company,the form was sent to an account holder of the permit. All contact details are provided in the database of the CITL. 4 out ofthe 72 companies contacted had closed down and do not participate in the second phase of the EU ETS. However, sincethey had to fully comply with the EU ETS procedures during 2005-2007, we contacted them as well.

8
Table 1 Distribution of allowances across installations in the EU ETS, 2005-2007
Size classification (3-year allocation, % oftotal)
Number ofinstallations
Cumulative numberof installations
3-year emissionallocation(% of total)
Cumulative 3-yearemission allocation(% of total)
Up to 0.1% 57 57 2.7 2.70.1%-0.2% 13 70 1.7 4.30.2%-0.5% 11 81 3.6 7.90.5%-2.5% 8 89 9.3 17.22.5%-5% 8 97 29.9 47.15%-22% 5 102 52.9 100.0
Note: Allocation to known planned developments is excluded.Sources: the Community Independent Transaction Log (CITL), EPA and author’s calculations.
27 firms7 completed and returned the questionnaire over 8 week period (7 July, 2008–1 September2008), with an understanding that no individual firms would be identified in the research results (seeAnnex 3 for a summary of firms contacted). These 27 respondents represented around 40 percent of allIrish firms in the EU ETS or 70 percent of the total Irish allowance allocation, during 2005-2007.According to the level of the respondents’ verified emissions, they were grouped into three categories:large (with an allocation share larger than 2% of the Irish total allocation), medium (0.1% - 2%) andsmall (up to 0.1%) (see Figure 1). In Stage 2, representative responses were identified, by sector andscale, and face-to-face interviews were conducted (see Annex 4 for the interview profiles).
42
21
9
15
7 5
0
15
30
45
Up to 0.1% 0.1%-2% More than 2%
Share in total verified emissions
Number of companies, total Number of companies, respondents
Sources: CITL, EPA and author’s calculations.
Figure 1 Distribution of verified emissions across companies in the EU ETS, 2005-2007
Before presenting the results, it is important to understand to what degree these results based on theIrish case study can be generalised and used for providing some insights for further policyimplementation in the context of transaction costs. Heterogeneous participants and institutions anddisharmonised monitoring, reporting and verification requirements across member states are the mainreasons suggesting that the below results would not hold for each member state. One could expectsome divergence between the participants in the East European new member states and those in the
7 2 firms-respondents, each with multiple installations, provided incomplete answers. One firm reported answers only forone of the installations. Another one – for 2 out of 3 installations.

9
EU15. However, even if there is some of it, it is not considerable. For instance, Trotignon and Ellerman(2008) find little difference between these participants when analyse the monetisation of allowancesurpluses in the EU ETS during 2005-2007. However, since the compliance framework of the EU ETSprocedures was the same for all participants and each member state had a similar composition ofparticipants in terms of allocation size8 (see e.g. EEA (2008) for a classification of installations by theirmagnitude of emissions across member states) one could think that the sources of transaction costs andtheir distribution would be comparable across member states. Although, the interpretation of themagnitude of the transaction costs estimates should be careful due to a fact that the results are based onthe low number of responses.
5. Findings
5.1 Early implementation costsTwenty five of the respondents (92.6%) experienced some internal costs consisting of time and staffcommitment. Twelve firms (44.4%) incurred consulting costs and seven (25.9%) incurred capitalequipment costs. Only five firms responded that they experienced all three kinds of costs, while twofirms answered that they incurred none of these costs in implementing the EU ETS rules.
Internal costs
To measure the opportunity costs of time, the firms were asked to report the number of staff membersinvolved and their time spent for the early implementation activities. The firms had two choices: (1) topartially or fully relocate the exiting staff from the regular duties (implicit costs); and (2) to hireadditional staff (explicit costs). In most of the firms (23 respondents) only internal staff was involved inthe early implementation process (in most of the cases only one person), and only in two companiesboth existing and newly hired staff were working on the launch of the EU ETS. Naturally, in the firmswith multiple installations more than one staff member were committed for implementing the EUETS9.
In terms of the total time required to engage with the scheme, the firms were asked to provide the timecommitment for implementing the EU ETS. Three respondents (12.5% of 24 respondents) estimate thatthe time required was less than one year, but more than nine months. Another five (20.8%) estimatethat it took from three to six months. Seven (29.2%) estimate that it required from one to three months,while nine (37.5%) estimate that it only required one working month of effort or less. It is worth notinghere that the companies with higher allocation spent more time on the early implementationprocedures, than companies with smaller allocation.
Consultancy costs
Twelve respondents incurred some consulting costs for implementing the EU ETS. The costs for suchservices vary from €3 thousand to €50 thousand per firm (€17 thousand on average). Again, thecompanies with higher allocations tend to incur higher consultancy costs than the companies withsmaller allocations. Initially, we could expect an opposite outcome, i.e. that the firms with lowerallocation could have lower in-house capacity and, hence, should be willing to engage with externalconsultant.
Capital costs
8 It has been intensively debated whether the EU ETS covers too many small installations with rather low emissions wherethe administrative costs substantially exceed the advantages of trading.9 This is especially true if management of the scheme is centralized not at the firm level, but at the installation level.

10
About one third of respondents incurred some capital costs. These costs vary from €5 thousand to €880thousand and, again, reflect the size of the respondents in terms of allocation. Most often meters hadbeen bought for quantification of fuel usage. One firm reported that necessary changes wereimplemented not only on tangible capital side, but also intangible capital side as necessary updateswere made on the information technologies for collating and reporting CO2 emissions data.
Summary of early implementation costs
Respondent ranked their early implementation activities according to the costs they experienced.Measurement of baseline emissions and learning about the functioning of the EU ETS were judged bymost to be the most costly early implementation procedures, while applying for allowances anddelivering a monitoring and reporting plan were the least costly.
Figure 2 and Figure 3 below summarise the early implementation costs faced by respondents expressedas Euros per firm and per tonne of verified emissions over the three years over the trial period10.
12.7036.88
340.16
71.86
0
70
140
210
280
350
All Large Medium Small
Internal costs Consultancy costsCapital costs Total costs
Source: Survey.
EUR, thousand
0.04 0.03
0.31
0.51
0.0
0.2
0.4
0.6
All Large Medium Small
Internal costs Consultancy costsCapital costs Total costs
Source: Survey.
EUR, per tonne of CO2 emissions verified
Figure 2 Early implementation costs per respondentacross different respondents’ categories
Figure 3 Early implementation costs per tonne of CO2emissions emitted across different respondents’categories
Figure 2 shows that the total early implementation costs tended to be higher for large firms than formedium and small firms. On average, large firms faced costs that were 10 times or 30 times higher thanthose faced by medium and small firms respectively. However, this pattern is reversed when costs areexpressed per tonne of CO2 emissions emitted (see Figure 3): costs per tonne of emissions aresignificantly higher for small firms. For instance, the early implementation costs were €0.03/tCO2 onaverage for large firms, while they were 17 times higher (€0.51/tCO2) on average for small firms.
These are not unexpected, and are consistent with other research studies (Schleich and Betz 2004; Betz2005) and with concerns expressed by the European Commission about the unequal distribution ofadministrative costs across EU ETS participants of different sizes (CEC 2008).
There is also a difference among firms by size in the composition of the early implementation costs. Asobserved in Figure 4, capital costs were the major component of the total early implementation costs
10 For the derivation of the total early implementation costs see Annex 5 and Annex 6. Alternatively, these costs could beexpressed per tonne of CO2 emissions reduced. However, as early implementation costs, as well as the MRV costs, are seenas fixed costs components not depending on the extent of the abatement, it is more reasonable to see whether these“inevitable” costs differ across different firms in terms of the size of their allocation.

11
for large firms, while internal costs among small and medium firms were larger than their capital andconsultancy costs combined.
0%
25%
50%
75%
100%
All Large Medium Small
Internal costs Consultancy costs Capital costs
Source: Survey.
Figure 4 Composition of total early implementation costs across different respondents’ categories
The high capital costs among large firms may be explained by the fact that large firms often havemultiple and complex points of emission, which may have required the installation of expensivemonitoring equipment. Large installations were also subject to more stringent monitoring and reportingrequirements than small installations, which may have required the installation of costly newtechnology. Small and medium firms, on the other hand, have fewer, less complex emissions points,and may have been able to track emissions from these points by using low-cost fuel meters. Therelatively low consultancy costs faced by firms in all size categories may imply that sufficientconsultation support was acquired at no cost from the governmental bodies responsible for thescheme’s implementation11 or that there was no need to engage with external consultants. However, theformer reason is unlikely, as most firms reported that learning about how the EU ETS worked was themost costly process.
5.2 Monitoring, Reporting and Verification (MRV) costsAs monitoring, reporting and verification procedures were mandatory for all operators in the EU ETS,all respondents incurred some MRV costs in the first period of the EU ETS. MRV costs consist of theinternal (staff) costs and the consulting costs (e.g. verification and consulting costs), and are generallyassumed to accrue annually, as MRV procedures were compulsory on annual basis.
Internal costs
In twenty four firms only internal staff members were involved in the MRV procedures (in most casesonly one person), while in the remaining three firms both existing and newly hired staff was involvedin these activities.
The annual time commitment for the MRV procedures is not significantly different from the total timecommitment for the early implementation procedures. Only one respondent estimated that the timerequired was less than one year, but more than nine working months. Another three estimated that it
11 If transaction costs were addressed across all agents affected by the scheme (e.g. governmental institutions in each member states), thisphenomenon would be considered as a reallocation of transaction costs from private to public organizations. In principle, this burdenshifting is welcome if regulators are more efficient than private entities in acquiring and providing information.

12
took between three and nine months. Four estimated that it required from one to three months, whilethe remaining fifteen estimated that it only required one working month of effort or less. Companieswith higher share of allocation spent more time on the MRV procedures, than companies with a smallervolume of allocation.
Consultancy costs
Over three-quarters of respondents incurred some consulting costs to comply with the MRVprocedures, with such costs per annum varying from €1 thousand to €100 thousand (€12.2 thousand onaverage). Firms with higher allocations and with multiple installations tend to incur higher consultancycosts than companies with smaller allocations. It should be noted here that the definition of consultancycosts encompass verification costs too which were incurred annually on mandatory basis by alloperators12.
Summary of MRV costs
What was the most costly MRV procedure for companies? As evident in Figure 5, large firms withmultiple emission points spent relatively more on monitoring. While firms were required to report theiremissions only on an annual basis, large and medium firms appear to monitor their emissions morefrequently, on weekly or monthly basis. This may explain why the share of costs for monitoring ishigher for large and medium firms. Likewise it reveals that participation in the scheme influenced mostof the firms’ day-to-day operations, since during the interviews most of the firms noted that they hadnot monitored their emissions before the launch of the EU ETS.
0%
20%
40%
60%
80%
100%
Large Medium Small
Monitoring Reporting Verification
Source: Survey.
Figure 5 The breakdown of the total MRV costs across different respondents’ categories
To understand the magnitude, the distribution and the composition of the MRV costs across the firmsof different sizes, the internal and the consultancy costs were calculated per firm and per tonne of CO2
emitted in the trail phase of the EU ETS13. These costs are presented in Figure 6 and Figure 7.
12 As seven respondents did not provide any information on consultancy costs, for further calculations, we assume that thesecosts for these respondents were of €3 thousand per annum (the modal value of the received answers).13 For the derivation of the total MRV costs see Annex 5 and Annex 6.
13
36.67
65.92
198.27
74.18
0
50
100
150
200
All Large Medium Small
Internal costs Consultancy costsTotal costs
Source: Survey.
EUR, thousand1.51
0.56
0.020.040.0
0.4
0.8
1.2
1.6
All Large Medium Small
Internal costs Consultancy costsTotal costs
Source: Survey.
EUR, per tonne of CO2 emissions verified
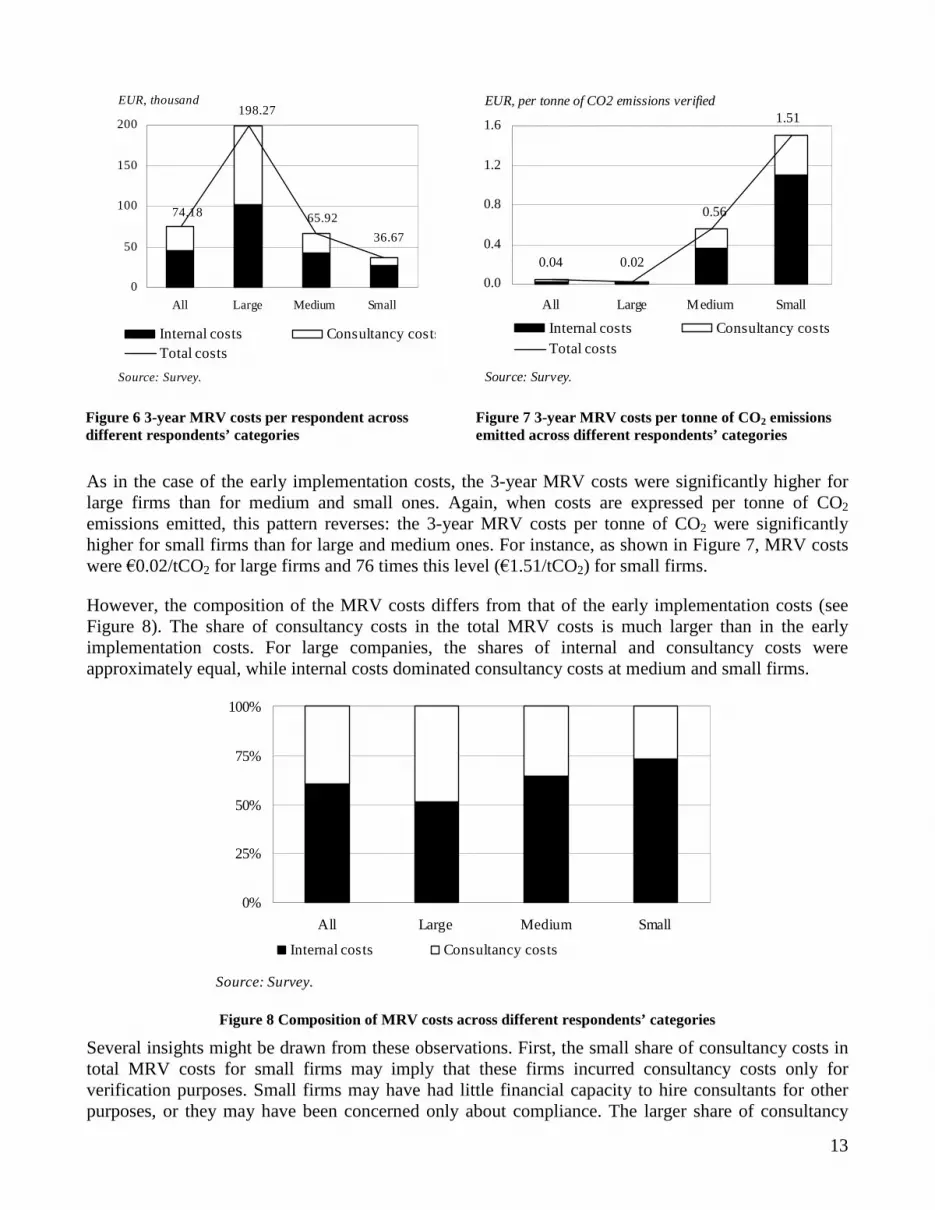
Figure 6 3-year MRV costs per respondent acrossdifferent respondents’ categories
Figure 7 3-year MRV costs per tonne of CO2 emissionsemitted across different respondents’ categories
As in the case of the early implementation costs, the 3-year MRV costs were significantly higher forlarge firms than for medium and small ones. Again, when costs are expressed per tonne of CO2
emissions emitted, this pattern reverses: the 3-year MRV costs per tonne of CO2 were significantlyhigher for small firms than for large and medium ones. For instance, as shown in Figure 7, MRV costswere €0.02/tCO2 for large firms and 76 times this level (€1.51/tCO2) for small firms.
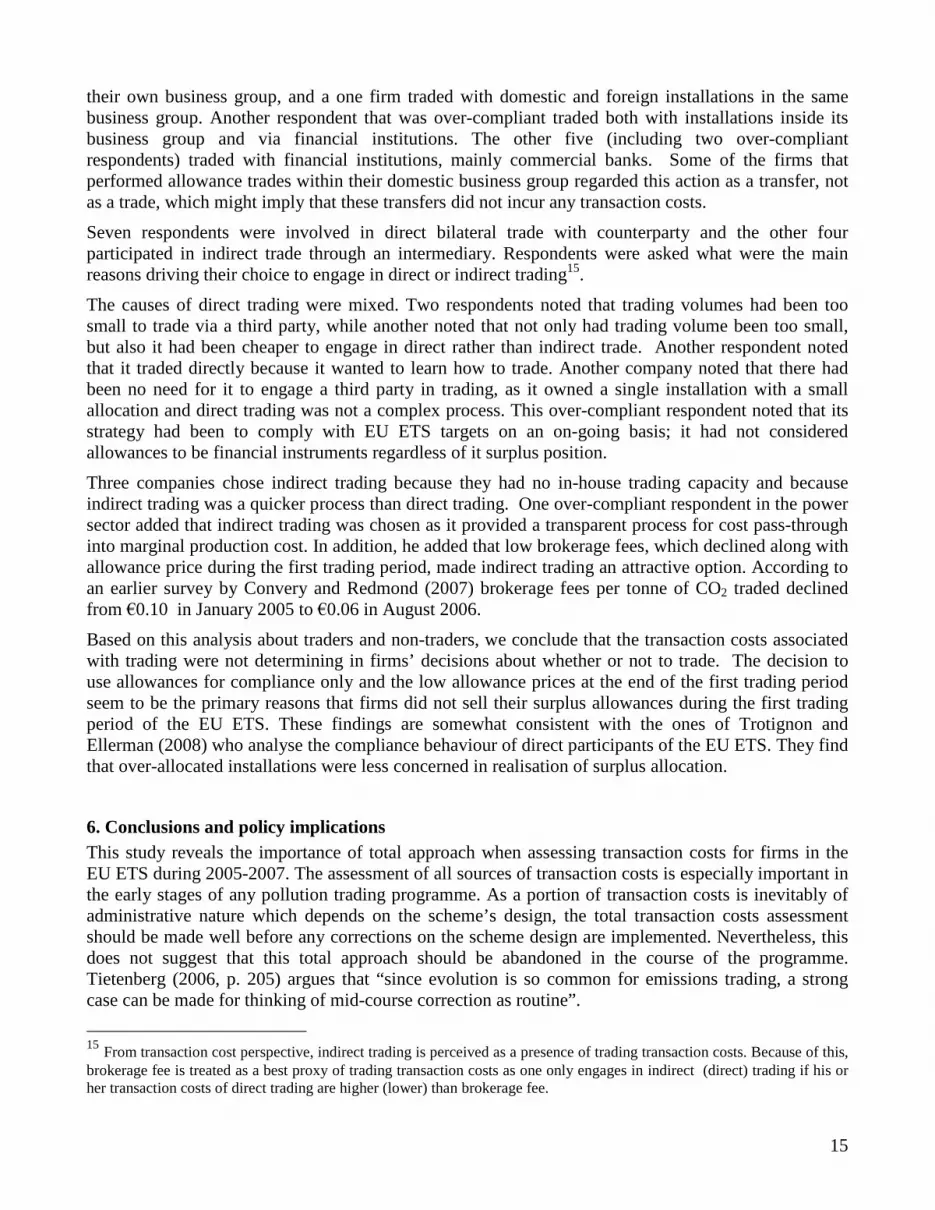
However, the composition of the MRV costs differs from that of the early implementation costs (seeFigure 8). The share of consultancy costs in the total MRV costs is much larger than in the earlyimplementation costs. For large companies, the shares of internal and consultancy costs wereapproximately equal, while internal costs dominated consultancy costs at medium and small firms.
0%
25%
50%
75%
100%
All Large Medium Small
Internal costs Consultancy costs
Source: Survey.
Figure 8 Composition of MRV costs across different respondents’ categories
Several insights might be drawn from these observations. First, the small share of consultancy costs intotal MRV costs for small firms may imply that these firms incurred consultancy costs only forverification purposes. Small firms may have had little financial capacity to hire consultants for otherpurposes, or they may have been concerned only about compliance. The larger share of consultancy

14
costs among large firms might suggest that these companies were concerned not only about compliancebut also how to reduce allowance costs. For instance, one large company noted during an interview thatthe same external consultant helped not only to perform the necessary MRV procedures, but also toidentify potential abatement opportunities.
5.3 Trading costsIn contrast to early implementation costs or the MRV costs, trading costs are variable, as they dependon the volume of allowances traded14. However, as pointed out by Stavins (1995), this form oftransaction costs can influence firms’ trading decisions and create inefficiencies.
There were some early concerns about the European allowance market liquidity. According to a recentsurvey’s results, incomprehension of how to trade and a fact that participants with long position did notfree-up their allowances in the market were indicated by the direct EU ETS participants as the mostimportant reasons of preventing allowance market from further improving liquidity (EuropeanCommission DG Environment, McKinsey et al. 2006). In addition, there were some concerns thatbrokers might somewhat burdensome participants with small allocations and with no in-house tradingcapacity by introducing the minimum threshold on trade volume (Convery and Redmond 2007).
Out of 27 respondents to the Irish survey, eleven firms traded some allowances in the first period of theEU ETS: six sold allowances, and five purchased allowances. Interestingly, three of the five whobought allowances held allowances in excess of their verified emissions at the end of the first period.The remaining sixteen respondents did not sell or buy allowances at all. Seven of these firms heldsignificant surplus allowances at the end of the trading period.
These observations raise at least two interesting questions. The first question is why the non-tradingfirms did not try to sell the surplus of the allowances. More interestingly, the second one is why thefirms that traded some allowances kept the surplus of the allowances in the end. Answering thesequestions might help understanding whether trading transaction costs were one of the reasons that‘challenged’ this behaviour.
Sixteen firms that did not trade allowance were asked why they chose not to participate in the market.Fourteen firms responded (7 of which had allowance surpluses), and they reported that had been able tomeet their CO2 obligations without engaging in trading. None of the respondents reported that CO2
abatement was cheaper than buying allowances or that trading was too expensive. In addition, none ofthe respondents mentioned transaction costs as a factor that discouraged trading.
The non-trading firms also had an opportunity to provide other comments about their non-participationin trade. These comments reveal operators’ uncertainty about the first period allocation and theirrecognition of the first period allowance price collapse. One firm noted that it maintained an allowancesurplus because it was not sure about the extra allocation it would receive from the new entrants’reserve for an expansion of capacity. Other respondents commented that the allowance price was toolow at the end of the period when the surplus was evident to bother with trading. Interestingly, somerespondents noted that they had considered transferring allowances to affiliated installations outsideIreland that were under common ownership, but they did not do so because the outside operators alsohad allowance surpluses.
The eleven respondents that did engage in trading (6 sold and 5 bought) were asked who their tradingpartners had been. Four firms responded that they had traded only with other Irish installations inside
14 This dependency might not be perfect, as trading transaction costs might have a fixed component as well. For instance,brokerage commissions might consist of a fee per trade (fixed component) and a fee depending on a volume of trade(variable component).
15
their own business group, and a one firm traded with domestic and foreign installations in the samebusiness group. Another respondent that was over-compliant traded both with installations inside itsbusiness group and via financial institutions. The other five (including two over-compliantrespondents) traded with financial institutions, mainly commercial banks. Some of the firms thatperformed allowance trades within their domestic business group regarded this action as a transfer, notas a trade, which might imply that these transfers did not incur any transaction costs.
Seven respondents were involved in direct bilateral trade with counterparty and the other fourparticipated in indirect trade through an intermediary. Respondents were asked what were the mainreasons driving their choice to engage in direct or indirect trading15.
The causes of direct trading were mixed. Two respondents noted that trading volumes had been toosmall to trade via a third party, while another noted that not only had trading volume been too small,but also it had been cheaper to engage in direct rather than indirect trade. Another respondent notedthat it traded directly because it wanted to learn how to trade. Another company noted that there hadbeen no need for it to engage a third party in trading, as it owned a single installation with a smallallocation and direct trading was not a complex process. This over-compliant respondent noted that itsstrategy had been to comply with EU ETS targets on an on-going basis; it had not consideredallowances to be financial instruments regardless of it surplus position.
Three companies chose indirect trading because they had no in-house trading capacity and becauseindirect trading was a quicker process than direct trading. One over-compliant respondent in the powersector added that indirect trading was chosen as it provided a transparent process for cost pass-throughinto marginal production cost. In addition, he added that low brokerage fees, which declined along withallowance price during the first trading period, made indirect trading an attractive option. According toan earlier survey by Convery and Redmond (2007) brokerage fees per tonne of CO2 traded declinedfrom €0.10 in January 2005 to €0.06 in August 2006.
Based on this analysis about traders and non-traders, we conclude that the transaction costs associatedwith trading were not determining in firms’ decisions about whether or not to trade. The decision touse allowances for compliance only and the low allowance prices at the end of the first trading periodseem to be the primary reasons that firms did not sell their surplus allowances during the first tradingperiod of the EU ETS. These findings are somewhat consistent with the ones of Trotignon andEllerman (2008) who analyse the compliance behaviour of direct participants of the EU ETS. They findthat over-allocated installations were less concerned in realisation of surplus allocation.
6. Conclusions and policy implicationsThis study reveals the importance of total approach when assessing transaction costs for firms in theEU ETS during 2005-2007. The assessment of all sources of transaction costs is especially important inthe early stages of any pollution trading programme. As a portion of transaction costs is inevitably ofadministrative nature which depends on the scheme’s design, the total transaction costs assessmentshould be made well before any corrections on the scheme design are implemented. Nevertheless, thisdoes not suggest that this total approach should be abandoned in the course of the programme.Tietenberg (2006, p. 205) argues that “since evolution is so common for emissions trading, a strongcase can be made for thinking of mid-course correction as routine”.
15 From transaction cost perspective, indirect trading is perceived as a presence of trading transaction costs. Because of this,brokerage fee is treated as a best proxy of trading transaction costs as one only engages in indirect (direct) trading if his orher transaction costs of direct trading are higher (lower) than brokerage fee.

16
The fact that the EU ETS enfold different participants in terms of main activity, initial emission permitallocation, in-house capacity raises a question whether the companies with small and singleinstallations have the same in-house capacity as the big companies with multiple installations coveredin the EU ETS. The concern that transaction costs (especially administrative ones) might be higher forsmaller installations has been raised by the European Commission too (e.g. see CEC (2008)). Theseconcerns are supported by the findings of this study.
Figure 9 and Figure 10 below summarize the burden of transaction costs borne by firms with small,medium and large emissions allowance allocations during the first EU ETS trading period. The costdistribution reveals that per-firm transaction costs were higher for large firms than for smaller firms,but that transaction costs per tonne of CO2 emitted were much higher for the smallest operators.Additionally, the composition of transaction costs shows that while early implementation costs weremore significant for large respondents, on-going MRV costs were more considerable for medium andsmall firms.
49.36102.80
538.43
146.04
0
180
360
540
All Large Medium Small
Early implementation MRV Total
Source: Survey.
EUR, thousand
0.09 0.06
0.87
2.02
0.0
0.7
1.4
2.1
All Large Medium Small
Early implementation MRV Total
Source: Survey.
EUR, per tonne of CO2 emissions verified
Figure 9 Total transaction costs per respondent acrossdifferent respondents’ categories
Figure 10 Total transaction costs per tonne of CO2emissions emitted across different respondents’categories
The early implementation cost are fixed costs that were incurred only once before the launch of theprogramme. If these costs were distributed across the life-span of the programme, they would besignificantly lower than other transaction costs components for most of the scheme’s participants.Therefore, the transaction costs going forward will be the MRV costs and the trading costs. Over time,MRV costs should diminish as a result of learning-by-doing and increased competition among verifiers.For instance, one quarter of respondents in the Irish survey claimed that their transaction costsdecreased over the three years of the EU ETS. As the direct scheme’s participants become more activein the CO2 market, the special attention should be given for understating the trading transaction costs,their nature and distribution across different agents. However, it remains true that the initial costs areunlikely to be negligible.
Although these transaction costs are extra costs that are incurred as a result of implementing theprogram, they are more appropriately seen as the costs of implementing a program of limitingemissions to the cap level. When considered on this basis, the cost of €0.06/ton for large firms, thosethat are responsible for the majority of CO2 emissions, is reasonable. The problem presented bytransaction costs lies in the small firms with significantly fewer emissions who face relatively high per-ton transaction costs.

17
What policy changes should be implemented to ensure that a reduction in transaction costs is achievedand their distribution is equalised across participants? The easiest way to reduce transaction costs forsmall operators would be to exempt them from seeking the environmental targets. This ‘opt-out’possibility of small operators was considered at the EC level too. However, this disburdenment of smallinstallations goes against the ‘polluter pays’ principle which is the core of the EU ETS. The EuropeanCommission notes that “an exclusion of small emitters from the EU ETS on the grounds of the cost-effectiveness cannot mean, however, that these installations do not need to contribute to the overallemission reduction targets of the EU. It would just mean there would need to be other more cost-effective measures to ensure the same objective” (CEC 2008, p. 24).
Carbon taxation is considered as one of the alternatives that would at least eliminate the markettransaction costs. However, from the ex-ante perspective it is quite difficult to consider whether anoverall effect of taxation would be more positive when the one of the pollution trading even withtransaction costs. Stavins (1995, p. 145) points out that “unless transaction costs are prohibitive,tradeable permits will retain an information advantage over command-and-control approaches andemission taxes, but that advantage will be less in the presence of significant transaction costs thanotherwise.” Moreover, the consideration of carbon taxation as a solution for transaction costs’ problemis in principle questionable here as this analysis and other supporting evidence (extent of cross-boardertrading, number of participants, competition in brokerage services) tell that market transaction costswere not significant in the EU ETS during 2005-2007.
The harmonisation and an increase of efficiency of the MRV activities are other ways to guarantee thereduction and the equalisation of transaction costs in the EU ETS across 27 EU member states and itsparticipants. No doubts, alongside the reforms on bureaucratic side, the learning will be a key inachieving the successful reduction in these costs. This learning might be considerably facilitatedthrough information provision and training process. All this should be a responsibility of regulators atboth the EU and each member state level.

18
References
Alexeeva-Talebi, V. and N. Anger (2007). Developing Supra-European Emissions Trading Schemes:An Efficiency and International Trade Analysis, ZEW - Zentrum für EuropäischeWirtschaftsforschung / Center for European Economic Research.
Betz, R. (2005). Emissions Trading to Combat Climate Change: The Impact of Scheme Design onTransaction costs Academic Conference in Association with UK Energy Research Centre, StJohn’s College Oxford British Institute of Energy Economics (BIEE).
Burtraw, D. (1996). "The SO2 Emissions Trading Program: Cost Savings without Allowance Trades."Contemporary Economic Policy 14(2): 79-94.
Capros, P. and L. Mantzos (2000). The Economic Effects of EU-Wide Industry Level EmissionsTrading to Reduce Greenhouse Gases, results from PRIME Energy-Systems Model. Athens,Institute of Communication and Computer Systems of National Technical University of Athens.
Cason, T. N. and L. Gangadharan (2003). "Transaction Costs in Tradable Permit Market: AnExperimental Study of Pollution Market Design." Journal of Regulatory Economics 23(2): 145-165.
CEC (2008). Accompanying document to the proposal for a directive of the European Parlament andthe Council amending Directive 2003/87/EC so as to improve and extend the EU greenhousegas emission allowance trading system: Impact Assessment. Brussels Commission of theEuropean Communities (CEC).
Coase, R. H. (1960). "The Problem of Social Cost." Journal of Law and Economics 3: 1-44.Conrad, K. and R. E. Kohn (1996). "The U.S. Market for SO2 Permits: Policy Implications of the Low
Price and Trading Volume." Energy Policy 24(12): 1051-1059.Convery, F. and L. Redmond (2007). "Market and Price Development in the European Emissions
Trading Scheme." Review of Environmental Economics and Policy 1(1).Crals, E. and L. Vereek (2005). "Taxes, Tradable Rights and Transaction Costs." European Journal of
Law and Economics 20: 199-223.EEA (2008). Application of the Emissions Trading Directive by EU Member States - reporting year
2007. EEA Technical report. Copenhagen, European Environmental Agency.Ellerman, A. D., P. L. Joskow, et al. (2005). Markets for Clean Air: the U.S. Acid Rain Program. New
York, Cambridge University Press.ENVIROS (2006). Appraisal of Years 1-4 of the UK Emissions Trading Scheme, Department for
Environment, Food and Rural Affairs (DEFRA).EPA (2005). Greenhouse Gas Emissions Trading: Ireland's National Allocation Methodology &
Allocation Decision 2005-2007, Environmental Protection Agency Ireland (EPA).European Commission DG Environment, McKinsey, et al. (2006). Review of EU Emissions Trading
Scheme, Survey Results. Brussels.Gangadharan, L. (2000). "Transaction Costs in Pollution Markets: An Empirical Study." Land
Economics 76(4): 601-614.Hahn, R. W. and G. L. Hester (1989). "Marketable Permits: Lessons for Theory and Practice." Ecology
Law Quarterly 16: 361-406.Joskow, P. L., R. Schmalensee, et al. (1998). "The Market for Sulfur Dioxide Emissions." The
American Economic Review 88(4): 669-685.Kerr, S. and D. C. Maré (1998). Transaction Costs and Tradable Permit Markets: The United States
Lead Phasedown Motu Economic and Public Policy Research draft manuscript. Wellington,Motu Economic and Public Policy Research
Klepper, G. and S. Peterson (2005). Emissions Trading, CDM, JI and More - The Climate strategy ofthe EU. Kilier Working Paper No. 1238. Kiel, Kiel Institute for World Economics.

19
Krutilla, K. (1999). Environmental Policy and Transactions Costs. Handbook of Environmental andResource Economics. J. C. J. M. van den Bergh. Cheltenham, Edward Elgar.
McCann, L., B. Colby, et al. (2005). "Transaction Cost Measurement for Evaluating EnvironmentalPolicies." Ecological Economics 52: 527-542.
Montgomery, W. (1972). "Markets in Licenses and Efficient Pollution Control Programs." Journal ofEconomic Theory 5(3): 395-418.
OECD (1993). Glossary of Industrial Organisation Economics and Competition Law, compiled by R.S. Khemani and D. M. Shapiro, commissioned by the Directorate for Financial, Fiscal andEnterprise Affairs.
OECD (2001). Transaction Costs and Multifunctionality Main Issues, OECD Analytical FrameworkGuiding Policy Design. Working Paper.
Ostrom, E. (1990). Governing the Commons. New York, Cambridge University Press.Peterson, S. (2006). Efficient Abatement in Separated Carbon Markets: A Theoretical and Quantitative
Analysis of the EU Emissions Trading Scheme. Kieler Working Paper No. 1271. Kiel, KielInstitute for World Economics.
Polinsky, A. M. and S. Shavell (1981). Pigouvian Taxation with Administrative Costs. NBER WorkingPaper, National Bureau of Economic Research, Inc.
Rao, P. K. (2003). The Economics of Transaction Costs: Theory, Methods and Applications. NewYork, Palgrave Macmillan.
Schleich, J. and R. Betz (2004). "EU emissions trading and transaction costs for small and mediumsized companies." Intereconomics 39(3): 121-123.
Solomon, B. D. (1999). "New Directions in Emissions Trading: the Potential Contribution of NewInstitutional Economics." Ecological Economics 30(3): 371-387.
Stavins, R. N. (1995). "Transaction Costs and Tradeable Permits." Journal of EnvironmentalEconomics and Management 29: 133-148.
Tietenberg, T. H. (2006). Emissions trading: principles and practice. Washington, DC, USA, Resourcesfor the Future.
Trotignon, R. and A. D. Ellerman (2008). Compliance Behavior in the EU-ETS: Cross Border Trading,Banking and Borrowing. Working Paper, MIT-CEEPR.
Woerdman, E. (2001). "Emissions trading and transaction costs: analyzing the flaws in the discussion."Ecological Economics 38(2): 293-304.

20
Annex 1 A copy of transaction costs’ survey
GENERAL DETAILS
Details of the person who led the completion of the questionnaire:PLEASE COMPELTE ACROSSNamePositionTelephone numberFax numberE-mail address
Firm nameNumber of employees
Local/regionalNationalOther European Union countries
In which geographic markets did your firm sell goods or servicesduring 2005-2007? TICK ALL THAT APPLY.
All other countriesYesIs your firm a part of a group with multiple installations involved in
the EU ETS? No
Unless otherwise stated please answer each question by marking X in the appropriate box(es).
TRANSACTION COSTS OF THE EU ETS
Transaction costs are the costs your firm incurred in preparing for, setting up systems to implement EU ETS, andthen participating in the market during 2005-2007. Transaction costs can be grouped into three categories:
1) early implementation costs;2) monitoring, reporting, and verification (MRV) costs; and,3) trading costs.
The first two categories of costs were relevant for all installations in the EU ETS. The third category of costs wassignificant only for installations that participated in the market and traded European Union CO2 emissionsallowances (EUA) during the first phase of the EU ETS. It should be noted that the costs of the EUA themselves arenot included in any of the above categories.
‘EUA’ is the European Union CO2 emissions allowance.
An allowance, according to the Directive 2003/87/EC of the European Parliament and of the Council of 13 October 2003,“…means an allowance to emit one Tonne of Carbon Dioxide Equivalent during a specified period, which shall be validonly for the purposes of meeting the requirements of this Directive and shall be transferable in accordance with theprovisions of this Directive.”
Installation, according to the Directive 2003/87/EC of the European Parliament and of the Council of 13 October 2003,“…means a stationary technical unit where one or more activities listed in Annex I are carried out and any other directlyassociated activities which have a technical connection with the activities carried out on that site and which could have aneffect on emissions and pollution.”

21
SECTION A Early implementation costs
The early implementation costs are the costs incurred by firms in the EU ETS before the official start of the scheme.These costs should have been incurred prior to January 1, 2005 but some firms may have realized these costs duringthe early stages of the first phase for a variety of reasons. Please consider your early implementation costs accordingto their nature, instead of timing.
During this time, familiarisation with scheme rules and guidelines was achieved, baseline emissions were calculated,monitoring equipment was installed, and an operator holding account for each installation was established. All thesecosts can be considered as one-time fixed set-up costs and divided into four categories:
- internal costs incurred by your firm in terms of additional management and staff time and training;- external costs incurred in terms of consultancy services taken on;- capital costs, meaning emissions measurement, monitoring, recording, and data storage equipment needed tocomply;- other costs not included in the above.
A1 Did your firm incur any internal costs for the early implementation procedures of the EU ETS?
Yes CONTINUENo GO TO A4
A2 Who performed the early implementation procedures of the EU ETS in your firm?
Number of people Percentage of time spentExisting internal staff %Newly hired staff %
A3 What is the estimate of overall full-time working days spent by your firm’s staff on the early implementation proceduresof the EU ETS? PLEASE WRITE IN NUMBER – RECORD NONE AS ‘00’.
A4 Did your firm incur any external costs for the early implementation procedures of the EU ETS?
Yes CONTINUENo GO TO A6
A5 Please provide your firm’s estimated overall external costs on the early implementation procedures of the EU ETS in000s of Euro.
A6 Did your firm incur any capital costs necessary to perform monitoring and reporting activities?
Yes CONTINUENo GO TO A9

22
A7 What necessary equipment or technology did your firm purchase to perform monitoring and reporting activities? Pleasedescribe.
A8 Please provide the estimated overall acquisition costs of equipment or technology necessary to perform monitoring andreporting activities in 000s of Euro.
A9 What part of the early implementation procedure was the most costly for your firm? Please rank the followingprocedures with 1 being least costly and 4 most costly.
Measurement of baseline emissionsBringing Monitoring and Reporting plan to the required standardLearning about the functioning of the EU ETSApplication procedures for allowances (other than measurement of baselineemissions)Other (please specify)
SECTION B Monitoring, reporting and verification (MRV) costs
MRV costs were incurred by all installations in the EU ETS. We assume that these costs are a combination ofinternal firm costs, mainly management and staff time, and external consultancy services, where your firm buys thenecessary capacity to be MRV compliant. Please, note that the MRV costs do not include fixed capital costs. Thefixed costs related to the MRV procedures are accounted for as early implementation costs for the purposes of thissurvey.
All questions refer to the decisions or actions taken during 2005-2007.
B1 Did your firm incur any internal costs for the MRV procedures of the EU ETS?
Yes CONTINUENo GO TO B4
B2 Who performed the MRV procedures of the EU ETS in your firm?
Number of people Percentage of time spentExisting internal staff %Newly hired staff %

23
B3 What is the estimate of the overall full-time working days spent (an annual average during 2005-2007) by your firm’sstaff on the MRV procedures of the EU ETS? PLEASE WRITE IN NUMBER – RECORD NONE AS ‘00’.
B4 Did your firm incur any external costs for the MRV procedures of the EU ETS?
Yes CONTINUENo GO TO B6
B5 Please provide your firm’s estimated overall external costs (an annual average during 2005-2007) on the MRVprocedures in 000s of Euro.
B6 Please provide a breakdown of your firm’s total MRV costs.
Monitoring %Reporting %Verification %Total MRV 100%
B7 How frequently did you monitor your firm’s CO2 emissions?
DailyWeeklyMonthlyQuarterlySemi-annuallyAnnuallyAd hoc (please specify)
SECTION C Trading costsTrading costs are incurred by firms covered by the EU ETS which traded EUAs during 2005-2007. Trading costs arethose related to the search of trading partner, price bargaining, enforcement of trade contract, and other legalities.The costs of the EUA themselves are not included.
All questions refer to the decisions or actions taken during 2005-2007.
C1 Did your firm trade any EUAs?
Yes GO TO C3No GO TO C2 ONLY
C2 What were the main reasons for not trading? TICK ALL THAT APPLY.
Met the CO2 obligation without buying EUAMet the CO2 obligation without selling EUACO2 abatement was cheaper than buying EUAOther (please specify)

24
C3 How many EUAs did your firm buy/sell? PLEASE WRITE IN NUMBER – RECORD NONE AS ‘00’.
Bought
Sold
C4 Who did your firm trade with? TICK ALL THAT APPLY.
Domestic installations inside your business groupForeign installations inside your business groupDomestic installations outside your business groupForeign installations outside your business groupWith financial institutions (e.g. brokers, exchanges) (please specify)
C5 How did your firm trade?
Directly, without a third party CONTINUEIndirectly, via a third party GO TO C10
C6 What were the main reasons for trading directly? TICK ALL THAT APPLY.
It was cheaper than trading via a third partyWanted to learn how to tradeTrade volume was too small to trade via a third partyOther (please specify)
C7 How often did your firm trade?
DailyWeeklyMonthlyQuarterlySemi-annuallyAnnuallyAd hoc ( please specify)
C8 Did your firm trade with the same partner more than once?
YesNo
C9 How long did a buy/sell transaction take to complete?
Buy transaction Sell transactionLess than one weekOne week or more, but less than one monthOther (please specify)

25
C10 What were the main reasons for trading via a third party? TICK ALL THAT APPLY.
It was cheaper than trading directlyIt was quicker than trading directlyThere was no in-house capacity to trade directlyOther (please specify)
C11 What intermediary services did your firm use to facilitate the trade of EUAs? TICK ALL THAT APPLY.
Financial institution (such as banks)Specialised carbon trading brokeragesExchangeOther (please specify)
SECTION D Summary of transaction costs
D1 What aspect of EU ETS compliance was the most costly for your firm? Please rank the following activitieswith 1 being least costly and 5 most costly.
Early implementationMonitoringReportingVerificationTrading
D2 How did your firm’s total transaction costs (except early implementation costs) evolve over 2005-2007?
They increasedThey decreasedThey remained the same
D3 Please provide below any additional comments which are important to understand the transaction costsexperienced by your firm.

26
Annex 2 Ireland’s Allocation (2005-2007)
Recipient Allowances Share of total allocation, %Installations permitted before 31/03/2004 65 006 999 97.1
allocation to existing installations 57 714 569 86.2allocation to known planned developments 7 292 430 10.9
New entrant Set Aside 1 004 400 1.5Auction 502 201 0.8Combined heat and power Set Aside 446 400 0.7TOTAL 66 960 000 100
Source: EPA and author’s calculations.

27
Annex 3 Summary of companies contacted
Contacted companies Contacted companies(closed companiesexcluded)
Respondents(% of contactedcompanies, closed plantsexcluded)
Number of companies 72 68 27 39.7Number of installations 106 101 40 39.6Initial allocation 2005-200716 57714569 56788736 39713822 69.9Verified CO2 emissions 2005-200717 64777597 64514997 45023963 69.8
Source: CITL and author’s calculations
16 Allocation to new developments is excluded.17 Allocation to new developments is included.

28
Annex 4 Interview Profiles
I II III IV V IVPosition Environmental
managerStrategydivision
Environmentalchemist
Environmentalengineer
Environmentalmanager
Financialcontroller
No. of employees ~800 ~2000 ~400 ~450 ~50 ~50Sector Private Private Private Private Private PrivateMulti installations Yes Yes No No No NoSingleinstallations
No No Yes Yes Yes Yes
Market Local/Foreign Local Local/Foreign Local/Foreign Local LocalSource: Survey.

29
Annex 5 Monetisation of the early implementation costs and the MRV costs
Total Per tonne of CO2 verified
Earlyimplementation
1. Answers to the questions used:-A3, internal costs in fulltime workingdays;-A5, external costs in 000s of EUR;-A8, capital costs in 000s of EUR.
2. Internal costs from total full-time daysconverted in 000s of EUR assuming:-8 hours of full-time working day;-average hourly labour (wages and salaries)rate of €37.8918.
3. Total costs-Internal costs, external costs and capitalcosts expressed in 000s of EUR are addedtogether
1. Total early implementation costs converted from000s of EUR to EUR.
2. Total early implementation costs in EUR aredivided by total verified emissions for 2005-2007period emitted by the respondents permitted before31/03/2004, i.e. new planned developments areincluded.
MRV costs 1. Answers to the questions used:-B3, internal costs in fulltime working
days, annual average during 2005-2007;-B5, external costs in 000s of EUR, annual
average during 2005-2007;
2. Internal costs from total full-time daysconverted in 000s of EUR assuming:
-8 hours of full-time working day;-average hourly labour (wages and salaries)
rate of €37.89 (see footnote 18)
3. Total costs:-Internal costs and external costs expressed
in 000s of EUR are multiplied by threeand added together.
1. Total MRV costs converted from 000s of EUR toEUR.
2. Total MRV costs in EUR are divided by totalverified emissions for 2005-2007 period emitted bythe respondents permitted before 31/03/2004, i.e.new planned developments are included.
18 The average hourly labour (wages and salaries) rate of €37.89 (4 Q 2007) is applied to estimate hours committed to set-up EUETS. The rate of €37.89 is an average hourly labour rate for managers, professional and associate professionals working inindustry’s sectors (mining and quarrying, manufacturing, electricity, gas and water supply). All wages and salaries payments aregross (i.e. before deduction of income tax and employees’ PRSI contributions). The statistics are provided by the Central StatisticsOffice Ireland. The reason for choosing the rate of €37.89 is that most of the returned questionnaires are answered byrepresentatives with managerial and engineering positions within the companies.

30
Annex 6 Early implementation cost
No. ofrespondents
Verified CO2emissions,2005-2007 Internal costs
Consultancycosts Capital costs Total costs
Total, EUR thousands
All 25 41903637 655.6 188.0 953.0 1796.59
Large 4 40734240 360.7 120.0 880.0 1360.65
Medium 7 822845 162.2 48.0 48.0 258.17
Small 14 346552 132.8 20.0 25.0 177.77
Per respondent, EUR thousands
All 25 41903637 26.2 7.5 38.1 71.86
Large 4 40734240 90.2 30.0 220.0 340.16
Medium 7 822845 23.2 6.9 6.9 36.88
Small 14 346552 9.5 1.4 1.8 12.70
Per tonne of CO2 emissions verified, EUR
All 25 41903637 0.02 0.00 0.02 0.04
Large 4 40734240 0.01 0.00 0.02 0.03
Medium 7 822845 0.20 0.06 0.06 0.31
Small 14 346552 0.38 0.06 0.07 0.51Source: Survey.

31
Annex 7 MRV costs
No. ofrespondents
Verified CO2
emissions,2005-2007
3-yearinternal costs
3-yearconsultancycosts
3-year totalcosts
Total, EUR thousands
All 27 45023963 1207.6 795.2 2002.78
Large 5 43835768 508.3 483.0 991.33
Medium 7 822845 296.5 165.0 461.45
Small 15 365350 402.8 147.2 550.00
Per respondent, EUR thousands
All 27 45023963 44.7 29.5 74.18
Large 5 43835768 101.7 96.6 198.27
Medium 7 822845 42.4 23.6 65.92
Small 15 365350 26.9 9.8 36.67
Per tonne of CO2 emissions verified, EUR
All 27 45023963 0.03 0.02 0.04
Large 5 43835768 0.01 0.01 0.02
Medium 7 822845 0.36 0.20 0.56
Small 15 365350 1.10 0.40 1.51Source: Survey.

32
Annex 8 Total transaction costs
Earlyimplementationcosts
3-year MRVcosts
3-year totaltransactioncosts
Total, EUR thousandsAll 1796.59 2002.78 3799.37Large 1360.65 991.33 2351.99Medium 258.17 461.45 719.62Small 177.77 550.00 727.76Per respondent, EUR thousandsAll 71.86 74.18 146.04Large 340.16 198.27 538.43Medium 36.88 65.92 102.80Small 12.70 36.67 49.36Per tonne of CO2 emissions verified, EURAll 0.04 0.04 0.09Large 0.03 0.02 0.06Medium 0.31 0.56 0.87Small 0.51 1.51 2.02
Source: Survey.