Embed Size (px)
Citation preview
TRANSACTION COSTS AND
MARKET QUALITY: OPEN
OUTCRY VERSUS
ELECTRONIC TRADING
YIUMAN TSE*TATYANA V. ZABOTINA
On May 10, 1999, the London International Financial Futures andOptions Exchange (LIFFE) transferred trading in the Financial TimesStock Exchange (FTSE) 100 Index futures contracts from outcry to LIFFECONNECT, its electronic trading system. We find lower spreads in theelectronic market after the transition. However, the open outcry mecha-nism has higher market quality (or smaller variance of the pricing error)on the basis of Hasbrouck’s (1993) model. Furthermore, employing theHasbrouck (1991) model, we show that trades in the open outcry markethave higher information content. Inventory control considerations alsoaffect the electronic market more than the open outcry market. The over-
The authors thank Robert I. Webb (the editor), two anonymous referees, Erik deVos, UpinderDhillon, Lisa Flynn, and Frank Samuel for their valuable comments. All errors are the responsibili-ty of the authors. They are grateful to the London International Financial Futures and OptionsExchange (LIFFE) for providing the tick data and detailed information of LIFFE CONNECT. Thisresearch was financially supported by a summer grant of the School of Management and a minigrantof the Office of Research and Sponsored Programs at Binghamton University.*Correspondence author, School of Management, Binghamton University (SUNY), Binghamton,New York 13902-6015; e-mail: ytse@binghamton.edu
Received May 2000; Accepted January 2001
� Yiuman Tse is an Associate Professor in the School of Management at BinghamtonUniversity (SUNY) in Binghamton, New York.
� Tatyana V. Zabotina is a Ph.D. student in the School of Management at BinghamtonUniversity (SUNY) in Binghamton, New York.
The Journal of Futures Markets, Vol. 21, No. 8, 713–735 (2001)© 2001 by John Wiley & Sons, Inc.
all results suggest that electronic trading should complement, but notreplace, open outcry in futures markets. © 2001 John Wiley & Sons, Inc.Jrl Fut Mark 21: 713–735, 2001
INTRODUCTION
As the number of exchanges worldwide using electronic systems in trad-ing options and futures sharply increased in the 1990s, the LondonInternational Financial Futures and Options Exchange (LIFFE) decidedto follow suit. On April 12, 1999, it began the rollout schedule for themigration of futures contracts to LIFFE CONNECT, its state-of-the-artelectronic order matching system. According to the LIFFE (“LIFFE’splatform,” 1999), transfer from open outcry to electronic trading wasaccompanied by an increase of 37% in the trading volume. On May 10,1999, trading in the Financial Times Stock Exchange (FTSE) 100 Indexfutures contracts was moved to LIFFE CONNECT.
Although many traders consider the implementation of CONNECTa big success of the LIFFE, there are numerous advocates of open outcrytrading in the futures markets. They argue that electronic trading neitherpossesses the necessary speed and flexibility to execute the complextrading strategies used with futures contracts nor provides liquidity aseffectively as open outcry. They also point out that electronic tradingdoes not perform well during times of high volatility.
Earlier studies have used the bid–ask spread as a benchmark forcomparison with observable trading prices (e.g., Blennerhassett &Bowman, 1998; Frino, McInish, & Toner, 1998; Pirrong, 1996). Thisspread is also an approximation of transaction costs; lowering such costsmay attract volume to the electronic markets. These studies report lowerspreads for the electronic trading system.
Many comparative studies of market performance and regulatoryimpact also base their analyses on the posted bid–ask spread. However,Hasbrouck (1993) and Grossman and Miller (1988) pointed out prob-lems associated with using the bid–ask spread as the measure of marketquality. They indicated that the quoted spread is twice the transactioncost for a market-order trader under numerous restrictive assumptions,including the absence of asymmetric information. Relaxing thoseassumptions will prevent us from measuring the costs accurately evenwith an effective spread (an actual return the marketmaker receives fromthe separated trades on ask and bid sides of the spread).
This article compares the trading costs and market quality for theFTSE 100 Index futures contracts on the LIFFE before and after thetransition to the screen trading mechanism. We consider two 3-month
714 Tse and Zabotina
periods: February to April 1999 for open outcry trading and June toAugust 1999 for electronic trading. We attempt to determine whichmechanism is more efficient for trading futures contracts by comparingthe daily median time-weighted spreads and market quality of Hasbrouck(1993). He proposed that the market price of an asset could be decom-posed into a random-walk component and a transient component. It isnatural to interpret the random-walk component as the efficient price.Under the assumption of a semistrong form of market efficiency, aninnovation to random walk reflects all possible newly released publicinformation. The transient component (or the pricing error) representsimplied transaction costs in the form of a discrepancy between the truevalue of an asset and the price the investor pays.
The model assumes that at any given moment, deviation from thetrue value is transient, and the market price reverts to the efficient priceover time. Thus, if the deviations of the market price from the efficientprice are large and/or last for a considerable time, the variance of thepricing error will be high. A lower variance of the pricing error impliesgreater pricing efficiency and higher market quality.
We further use the model of Hasbrouck (1991) to investigate differ-ences in the information content of trades in the two markets. The twoHasbrouck models share similar assumptions and frameworks, but theirfoci are different. Although the market quality model uses trade prices,the information content model employs revisions of the bid–askmidquotes in response to trades.
Our results indicate that the median bid–ask spread is lower inLIFFE CONNECT. However, the open outcry market for the FTSE 100Index futures contracts has higher quality (with a lower variance of thepricing error) than CONNECT. This supports the argument that thespread is not an accurate measure for pricing efficiency. The higher qual-ity of the open outcry market is explained by the speed of floor tradingand the ease of adjusting the terms of trade. The electronic market slowsdown the impounding of information into prices, especially in periods ofintensive information arrival. We find a higher degree of informationcontent of trades in the open outcry market and higher inventory costs inthe electronic market.
RELATED RESEARCH ON MARKET QUALITY
In an attempt to distinguish between the two trading mechanisms,researchers use various concepts of market quality. One of the earliestarticles on this subject (Grünbichler, Longstaff, & Schwartz, 1993)
Open Outcry and Electronic Trading 715
found that futures prices on the electronic market [DeutscheTerminborse (DTB)] of the German stock index Deutscher Aktienindex(DAX) lead prices of the floor traded index. However, Grünbichler et al.compared not only two trading mechanisms but also two different prod-ucts: cash index and index futures. Therefore, their evidence could bebiased by the tendency of the futures markets to lead the cash index mar-kets even when both are floor-traded (Chan, 1992).
Another approach to market quality is investigating liquidity and thebid–ask spread as a proxy. The bid–ask spread is commonly called theprice for immediacy. Pirrong (1996) documented that the spreads ofBund futures in the electronic market (DTB) are not greater than thosein the open outcry market (LIFFE). Moreover, Pirrong found that pricemovements on the DTB exhibit less bid–ask bounce and, therefore, aremore informative. This result is consistent with Blennerhassett andBowman (1998) and Frino et al. (1998), who found that spreads in theelectronic markets are lower than those in the open outcry system, if mar-ket activity is controlled for. However, this contradicts earlier findings ofShyy and Lee (1995) that the spread is greater on the electronic market.
The quoted spread correctly reflects the marketmaker profit onlywhen a marketmaker simultaneously fills two orders at the two sides ofthe spread. However, the quoted spread may not be considered a cost forthe counterparties of the marketmaker in these transactions. Moreoften, transactions on the opposite sides of the spread are separated intime, and the marketmaker profit becomes a so-called effective spread.However, a seller is only concerned about the bid side of the spread andfaces a choice between the market and limit orders; therefore, the effec-tive spread does not correctly approximate the price for immediacy. AsGrossman and Miller (1988) pointed out, a customer’s choice betweenlimit orders and market orders is thus determined not by the spread butby the likelihood that a buyer will arrive who is willing to pay more thanthe current bid.
A market is considered liquid only if an asset can be easily tradedthere at a price close enough to the efficient price approximated by themidquote of the bid and offered prices. However, market imperfectionscause market price deviations from the efficient price. Thus, a smallspread does not mean that the market price is close to the efficient price.Moreover, narrow spreads do not imply market depth (i.e., substantialvolume can be traded at the quoted prices). If the quoted prices are inef-ficient, traders will not be willing to trade large volumes. In this case, thespreads may rapidly widen as depth at the narrower spreads vanishes.Order withdrawal procedures, coupled with information asymmetry, may
716 Tse and Zabotina
cause depth in the electronic markets to be smaller. The small capacityof scalpers, who trade on their own accounts and provide liquidity in theopen outcry markets, may also cause depth to shrink there (Pirrong,1996).
An alternative measure of market quality is the overall volatility ofthe market price (see, among many others, Dhillon, Lasser, & Watanabe,1997). However, this measure may not be useful in these circumstancesbecause volatility has different implications for the open outcry andelectronic markets.
The pits of the open outcry exchange are characterized by the activ-ity of very short-horizon uninformed speculators trading for their ownaccounts: scalpers. According to the model of Grossman and Miller(1988), scalpers’ profits increase with their inventory positions andreturns volatility. The model also implies that, in a competitive open out-cry market, marketmakers reduce risk by diversifying it across many mar-ketmakers. Consistent with the model of Admati and Pfleiderer (1988),the number of scalpers on the floor increases at times of high volatility.They are willing to absorb large trading volumes and assume the inven-tory risk. Thus, investors may benefit from the increased liquidity of theopen outcry market under higher volatility.
In contrast, Martens (1998) and Frino et al. (1998) showed that theelectronic market pricing efficiency and liquidity deteriorate in volatileperiods. The difficulty of order withdrawal from the electronic orderbook causes marketmakers to charge a higher price for their services(Copeland & Galai, 1983) and providers of limit orders to post smallerorders in fear of being picked out by informed traders. This causes themarket depth to shrink and the spreads to widen in electronic marketsduring volatile periods.
Hasbrouck Models of Market Quality and Information of Trades
The Hasbrouck (1993) model considers pricing error as a measure of theimplicit transaction costs that traders pay over the true price of an asset.The market price is closer to the equilibrium price in markets withgreater quality than in markets with lesser quality. Hasbrouck definedthe measure of overall market quality as the variance of the pricing error,with lower variance implying a market of higher quality and greater pric-ing efficiency.
The overall market quality of Hasbrouck (1993) provides informa-tion on proximity of the market price to the efficient price, avoids
Open Outcry and Electronic Trading 717
problems of imperfect or spurious information transmission, and reflectsconcepts of liquidity and market depth. Thus, the overall market qualityis a better measure than the bid–ask spread for evaluating the pricingefficiency of different trading mechanisms.
Hasbrouck (1993) decomposes the price of a security into a random-walk component and a residual stationary component:
(1)
The random-walk component, mt � mt�1 � wt, is considered the effi-cient price. The innovation of the serially uncorrelated increment, wt,captures all public information released between time t � 1 and t. Thepricing error, st, embodies microstructure imperfections and can beviewed as the implicit cost of the trade. It measures costs paid overthe efficient price. The transaction price, pt, is allowed to deviate fromthe efficient price, but these deviations are transient; that is, the marketprice reverts to the efficient price over time.
The model provides a framework for joint price change and tradedynamics. The trades are allowed to be endogenous; they are related tothe previous price changes and trades. Price changes and trading volumeare influenced by the inventory control mechanisms, discrete prices,lagged price adjustments, and price smoothing requirements imposed bythe exchange.1
Therefore, the joint dynamics are represented in the vector autore-gression (VAR) form:
(2a)
(2b)
where �pt � log(pt/pt�1) is the log price change; xt is a trade indicatorvariable (�1 for a buy order and �1 for a sell order); and e1,t and e2,t arerandom disturbances with a covariance matrix, Cov(e).
Model 2 can be represented in the vector moving average form:
(3a)
(3b) xt � g*0 e1,t � g*1 e1,t�1 � p � d*0 e2,t � d*1 e2,t�1 � p � d*k e2,t�k � p¢pt � a*0 e1,t � a*1 e1,t�1 � p � b*0 e2,t � b*1 e2,t�1 � p � b*k e2,t�k � p
xt � c1¢pt�1 � c2¢pt�2 � p � d1 xt�1 � d2 xt�2 � p � e2,t,
¢pt � a1¢pt�1 � a2¢pt�2 � p � b1 xt�1 � b2 xt�2 � p � e1,t
pt � mt � st
718 Tse and Zabotina
1The aversion of a marketmaker to the risk of carrying unbalanced inventory may result in a negativeautocorrelation in the quote revisions and a positive serial correlation between the trades and laggedquote revisions. Lagged price adjustment and mandatory price smoothing may cause a positive auto-correlation in the trades and a positive serial correlation between the quote revisions and laggedtrades.

Beveridge and Nelson (1981) gave the following decomposition:
(4)
(5)
(6)
(7)
Market quality is defined as
(8)
It is clear from Equation 6 that st is determined by the price effects ofshocks one, two, or more periods after these shocks occur. We alsonotice that coefficients and reflect the permanent effect of theshocks on the price, that is, innovation to the efficient price. Thus,Equation 6 suggests that the implication of the news to the equilibriumprice is not completely recognized by the market at the instant the newsis released. This lagged adjustment produces the pricing error.
The market quality model of Hasbrouck (1993) and the informationcontent of the trades model of Hasbrouck (1991) share a similar VARframework. However, their purposes are different. The model of marketquality employs the actual trade prices, which allow it to measure thetotal departure of the market price from the efficient price. InHasbrouck (1991), changes in the midpoint of quoted prices, rt, reflect amarketmaker’s reaction to trades caused by the information content oftrades and the inventory control. The model assumes contemporaneouscausality running from trades to quote revisions.2
The same market microstructure imperfections, as in the marketquality model, underlie the VAR model:
(9a)
(9b)
where and and are the postedbid and ask quotes at time t, respectively. The same microstructure
qatqb
trt � log[(qbt � qa
t )�(qbt�1 � qt�1
a )]
xt � c1rt�1 � c2rt�2 � p � d1 xt�1 � p � v2,t,
rt � a1rt�1 � a2rt�2 � p � b0 xt � b1 xt�1 � p � v1,t
b*ja*j
s2s � a
�
k�0(ak bk) Cov(e)a ak
bk b
ak � � a�
j�k�1a*j and bk � � a
�
j�k�1b*j
st � a�
k�0ake1,t�k � a
�
k�0bk e2,t�k
mt � mt�1 � a�
j�0a*j e1,t � a
�
j�0b*j e2,t
pt � mt � st
Open Outcry and Electronic Trading 719
2That is, a marketmaker revises the quotes as a result of the contemporaneous trade and arrival ofpublic information that occurs between the trade order and quote revision.
imperfections that drive Equation 9 disturb the dichotomy that attrib-utes all public information to v1,t and all private information to v2,t. Weare especially interested in interpreting the coefficients in Equation 9that relate to the information content or asymmetry of trades and inven-tory costs.
Coefficient b0 represents immediate quote midpoint revision inresponse to a trade. If b0 is positive and significant, the quote midpoint isimmediately increased as a buy order is submitted. The higher the infor-mation content of the trade is, the more the marketmaker will revise hisor her estimation of the true price upward. Similarly, the quote midpointis revised downward immediately subsequent to a sell order.
Inventory control considerations of marketmakers are reflected bythe coefficients ci in Equation 9. The negative relation between tradesand lagged quote revisions indicates that a marketmaker with an inven-tory surplus (shortage) would reduce (increase) his or her quotes to elicitmore purchases (sales). Therefore, negative values of ci are consistentwith inventory control effects. Positive values of di indicate trade persist-ence, or lagged adjustment to information. However, the effect of inven-tory control affects these coefficients in the opposite direction. Positivesigns of di indicate that the effect of lagged adjustment to informationprevails.
LIFFE AND LIFFE CONNECT:INSTITUTIONAL DETAILS AND LIQUIDITY
Many earlier studies of differences in trading mechanisms examined thesame or closely related assets traded in geographically separated markets(e.g., the DTB and LIFFE Bund futures contracts). Geographical sepa-ration, imperfect signal extracting (King & Wadhwani, 1990), home orinstitutional bias (Huberman, 1997; Tesar & Werner, 1995; Tse, 1999c),and other factors may contaminate conclusions concerning efficiencyand quality in these markets.
The FTSE 100 Index futures contracts migrated from the open out-cry market (LIFFE) to the electronic market (LIFFE CONNECT) onMay 10, 1999. Unlike previous studies, this research considers the samemarket (and product) operating under two trading mechanisms in twosubsequent periods: 3 months before the transition (February to April1999) and 3 months after the transition (June to August 1999). Oursetting assumes that the open outcry and electronic markets have thesame underlying efficient price (evolving from the floor trading period tothe electronic trading period). For brevity, we refer to the open outcry
720 Tse and Zabotina
trading period as P1 and the electronic trading period as Q1. Londontime is used throughout the article.
Floor Trading on the LIFFE in P1 (February to April 1999)
Floor trading in the FTSE 100 Index futures contracts was conductedfrom 8:35 a.m. to 4:30 p.m. for P1.3 On the LIFFE, all bids and offersmust be announced to the floor before the execution of a trade (seeLIFFE Trading Rules 4.10.3 and 4.11.1). A trader can only cry out hisquote if it is better than the best current quote on the floor. Thus, all thequoted spreads are also the inside spreads. Scalpers, who provide liquid-ity through active intraday trading, take positions on both sides of thespread almost simultaneously and, on average, maintain zero inventorybalance. As a result, their quoted spreads closely approximate effectivespreads. Trading on the open outcry market is not anonymous; thenames and behavior of all traders can be observed on the floor. If a trad-er finds a bid (ask) attractive, he or she simply hits (takes) the price. Heor she can also choose with whom to trade when there are several traderswith the same bid or ask price.
Trading on LIFFE CONNECT in Q1 (June to August 1999)
At the heart of LIFFE CONNECT is the LIFFE Trading Host, whereorders are received and matched. The electronic market consists of theterminals connected to the host. Trading will take place through the sub-mission of orders into the LIFFE CONNECT central order book, whichcontains all the orders posted in the system. The system is similar to acontinuous auction system with automatic order matching in the centralorder book. “Trading Anonymity is a key aspect of the LIFFE CONNECTmarket. Traders in the market will not be aware of whose orders they areviewing or trading against, either before or after a trade” (“How theMarket Works,” 2000, p. 22). The criteria for determining trade priorityfollow the price and time priority. This ensures that no trade can occur ata price lower than the lowest ask or higher than the highest bid.
Version 2.0 of LIFFE CONNECT for Financial Futures (LCFF2.0)was released on April 12, 1999. The trading day in the FTSE 100 Index
Open Outcry and Electronic Trading 721
3From 14:46 to 6:00 p.m., floor trading is complemented by automated pit trading (APT). We do notconsider trades made through APT. As Martens (1998) and Tse (1999a) pointed out, there is a con-siderable drop in volume during APT. Moreover, the LSE is closed during APT.
futures contracts on LCFF starts at 6:00 a.m. From 6:00 a.m. to7:15 a.m., traders are allowed to log on to the electronic system andplace their orders. In the preopen period (7:15 a.m. to 8:00 a.m.), traderscan only submit limit orders and good till cancelled (GTC) orders.Traders are also able to revise orders, submit them, pull them, and soforth. Orders are matched during the market trading period (8:00 a.m. to4:30 p.m.). At the start of the market trading period, the system calcu-lates the prices for each type of contract at which the maximum numberwill be traded. During the market trading period, LCFF operates in thestyle of a continuous auction. The clearing house monitors marketactivity throughout the day to ensure that the settlement prices fairlyreflect the market. After 5:30 p.m., all trade ceases and new orders arenot accepted.
Traders on LCFF share access to the electronic order book thatallows them to observe the active, pulled, or cancelled orders, marketdepth,4 and order event history and to activate or stop market or limitorders. The electronic order book is automatically updated after eachorder matching, change or cancellation, and GTC expiration. A quote isvalid until it is explicitly withdrawn from the system. The order bookassists traders in effective management of their inventory and is espe-cially useful in quiet markets, when market information is not easilyattainable. Nevertheless, as Martens (1998) pointed out, when the mar-ket is volatile, the disadvantage of the order book lies in its slackness ofchanging prices involving order revisions or new order submissions.
Although the LIFFE claims that LCFF simply automates open out-cry, the nature of liquidity supply on LCFF differs from the one in anopen outcry market. In particular, as Pirrong (1996) contended,scalpers are the primary suppliers of liquidity in the open outcrymarkets but not on the automated exchanges. He contrasts costs ofbecoming a member of an automated exchange with those associatedwith an open outcry exchange.5 Costs of entering an automatedexchange are prohibitive for scalpers, individuals with relatively low per-sonal capital. If scalpers are squeezed out of an automated exchange, itmay lack liquidity.
722 Tse and Zabotina
4However, requests for providing full depth are subject to strict limits to prevent degradation of thesystem.5Pirrong (1996) wrote: “Small local traders are relatively unimportant suppliers of liquidity on auto-mated exchanges due to the structure of the costs incurred to participate in a computerized tradingsystem. Computerized systems require a substantial investment in computer equipment and marketanalytics. Moreover, most computerized systems charge relatively high fixed fees for the rental ofterminals or communication lines. . . . Also, the fixed fees paid to enter an automated market inthese ways are largely unrecoverable. This limits the pool of potential locals” (p. 521).

LCFF has designated marketmakers who are obligated to have bidand ask quotes posted during normal trading hours. However, like othertraders, marketmakers submit orders to the central order book, and theymust abide by the trading anonymity, automatic matching, and price andtime trading priority in the order book described previously.6 Therefore,marketmakers in the LCFF face more severe information asymmetrythan scalpers in the face-to-face open outcry market.
Unlike marketmakers in the LCFF, scalpers are attracted to thefloor by high volatility. The reason is that they can diversify risk whenthere are many traders on the floor (see Tse, 1999a). More importantly,quotes are valid only when the “breath is warm” and a simple hand signalcan change the quote or order. Thus, during volatile trading hours, liq-uidity is impaired in the LCFF (because of its slackness of changingprices) but not in the open outcry market.
DATA
The transaction data provided by the LIFFE contain every bid, ask, andtrade price stamped to the second. A trade is considered a buy (sell) orderwhen its price matches the prevailing ask (bid) quote. We use the mostliquid nearest contracts on the FTSE 100 Index for the two 3-monthperiods. Stocks constituting the FTSE 100 Index are traded on theLondon Stock Exchange (LSE). A considerable amount of arbitrage isusually conducted between the spot and futures markets. Therefore, wefocus on the trading hours of the LSE, 9 a.m. to 4:30 p.m., to preservethe amount of information transmitted through the arbitrage betweenthese two markets under both trading mechanisms on the LIFFE (seealso Chang, Jain, & Locke, 1995; Tse, 1999b).
Table I summarizes the market statistics of the P1 and Q1 periods.There are 61 and 65 trading days in P1 and Q1, respectively. Althoughaverage daily trading volumes are similar in the P1 and Q1 periods, thenumber of trades for the periods of electronic trading is more thanthree times that for the open outcry period. These results show that theaverage trade size on the electronic market is smaller. Indeed, the sizeof 45.8% of the Q1 trades is one contract, the size of 20.8% of thetrades is two contracts, and the size of 8.3% of the trades is three con-tracts. Martens (1998) argued that the adverse selection problem issevere in anonymous electronic trading. Therefore, traders will reduce
Open Outcry and Electronic Trading 723
6If a marketmaker does not wish to trade on one or both sides of the market, he or she can easily doso by posting an unattractive quote.

their trade sizes or shorten the average time span for the display of anorder in the order book. Because the LIFFE data do not provide trans-action volumes in the P1 period, we cannot obtain detailed informationof the trade size.
EMPIRICAL RESULTS
Testing for Structural Change
The assumption that the efficient price is the same in the two periods iscrucial to our analysis. To ensure that there is no structural change, weconduct a series of Chow tests. First, the tests do not reject the nullhypothesis of no structural change in daily price changes of the FTSE100 between the two periods with a p value of 0.99; that is, there is nostructural change. Second, we break period Q1 into two subperiods,June and July to August. We conduct the tests between (1) P1 and Juneand (2) June and July to August. Neither of the two rejects the null of nostructural change, with p values of 0.37 and 0.82, respectively.
We also follow Taylor, van Dijk, Franses, and Lucas (2000, p. 1296)closely to confirm that the subsequent analysis is not sensitive to the par-ticular sample periods used. We test the null hypothesis that the stan-dard deviations of daily price changes are the same in each period bycomparing the ratio of sample standard deviations in P1 and Q1. Theratio is 0.98 and is not significantly different from one, suggesting thatthe daily price changes are equally volatile over the two periods.
Finally, we searched The Wall Street Journal and The Economist. Wefound no event that could likely induce structural change. A graph ofdaily price changes (not reported) also indicated that no significantchange occurred.
724 Tse and Zabotina
TABLE I
Market Statistics
Open Outcry Electronic Trading
Number of trading days 61 65Daily trading volume (10e3) 34.1 34.0Daily open interest (10e3) 19.9 20.5Daily number of trades (10e3) 17.4 52.5Variance of daily price changes 0.270 0.281
Note. This table summarizes the market statistics for the periods of open outcry (P1, February toApril 1999) and electronic trading (Q1, June to August 1999).
Spreads
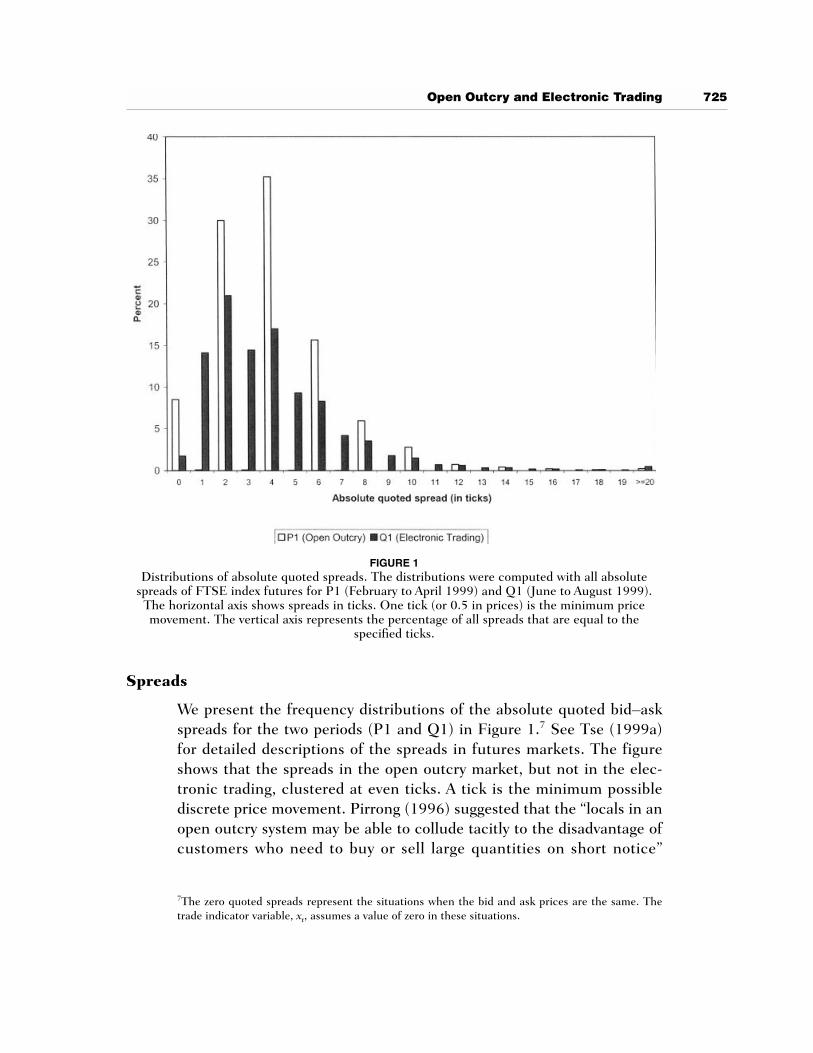
We present the frequency distributions of the absolute quoted bid–askspreads for the two periods (P1 and Q1) in Figure 1.7 See Tse (1999a)for detailed descriptions of the spreads in futures markets. The figureshows that the spreads in the open outcry market, but not in the elec-tronic trading, clustered at even ticks. A tick is the minimum possiblediscrete price movement. Pirrong (1996) suggested that the “locals in anopen outcry system may be able to collude tacitly to the disadvantage ofcustomers who need to buy or sell large quantities on short notice”
Open Outcry and Electronic Trading 725
FIGURE 1Distributions of absolute quoted spreads. The distributions were computed with all absolute
spreads of FTSE index futures for P1 (February to April 1999) and Q1 (June to August 1999).The horizontal axis shows spreads in ticks. One tick (or 0.5 in prices) is the minimum pricemovement. The vertical axis represents the percentage of all spreads that are equal to the
specified ticks.
7The zero quoted spreads represent the situations when the bid and ask prices are the same. Thetrade indicator variable, xt, assumes a value of zero in these situations.
(p. 527) Such a collusion is credible because traders interact repeatedlyand defecting will result in punishment.8
Gwilym, Clare, and Thomas (1998) also reported clustering. Theyfound that 97.8% of the spreads for the FTSE 100 Index futures con-tracts on the LIFFE are at even ticks. Their evidence is consistent withthe negotiation hypothesis of Harris (1991), that in periods of high trad-ing activity and for small trades, traders eliminate odd quotes to mini-mize the cost of negotiations.
We follow the approach of Skinner (1989) and Kumar, Sarin, andShastri (1998) to compare the bid–ask spreads of P1 and Q1. For eachday, we estimate the daily relative bid–ask spread as the weighted averageof all relative spreads in a day, where the weight is the amount of timethe quote is valid. The relative bid–ask spread is the difference betweenthe quoted bid and ask prices divided by the midquote of the bid and askprices. We compare the median daily relative bid–ask spreads for bothopen outcry and electronic trading. Our results show that the medianspread is higher for the open outcry market: 0.0315% for P1 and0.0244% for Q1.
This finding is consistent with the notion that nominal trading costsdecrease under electronic trading. For example, the labor costs of tradingthe Bund contracts on the DTB are two to three times lower than thoseon the floor of the LIFFE (Price Waterhouse, 1997). John Foyle, deputyCEO of LIFFE, stated, “[s]creen-based systems don’t always end up giv-ing buyers the best prices . . . but they’re cheaper to run . . . and theydon’t require as many esoteric skills” (Freedman, 2000). Sarkar and Tozzi(1998) also pointed out that the overhead costs are smaller in the elec-tronic trading markets. The transparency of the order book in theelectronic market allows effective inventory management. Hence, themarketmakers may be able to lower the spreads.
However, the initial capital cost of purchasing the computer equip-ment and software for trading in the electronic market is larger than thecost of setting up a floor booth. These costs may well be prohibitive forscalpers, individuals with comparatively low personal capital. Thus, theyare most likely to be squeezed out of the market by larger brokeragefirms. This may cause the average cost of providing liquidity to increasein the electronic market.
Scalpers constitute the major group of traders in the open outcrymarket. They rarely leave their positions in the market open overnight. If
726 Tse and Zabotina
8However, locals may not extract large profits from this collusion; otherwise, profits from defectingmay exceed the cost of punishment. In addition, locals face tougher competition from limit orderswhen they drive the price too high.
the role of scalpers (and their number) has diminished on the LIFFEafter the transition to the electronic trading, we would expect to observea greater number of overnight positions in the electronic market.However, there may be other forces acting in the opposite direction. Forexample, because electronic markets are characterized by smaller orders(Barclay & Hendershott, 2000), overnight positions may also be adverse-ly affected. Moreover, the adverse selection problem is presumably moreimportant for the electronic markets. Therefore, traders may be morereluctant to leave their positions open overnight.
To assess relative liquidity for the overnight positions, we examinedopen interest data for the P1 and Q1 periods. Bessembinder and Seguin(1993) suggested open interest as a proxy for liquidity. The average dailyopen interest for the open outcry period, 198,000 contracts (with anopen interest/trading volume ratio of 5.81), is marginally smaller thanthat for the electronic trading period, 205,000 contracts (with a ratio of6.03). The evidence, statistically significant at the 5% level, is consistentwith the diminished role of scalpers in the electronic market.
In addition, given that the arrival of information is reflected by theprice volatility, adverse selection is especially severe in the volatile mar-kets. Traders are unable to cancel or change orders rapidly because ofthe explicit procedure of order withdrawal from the electronic orderbook. When new information arrives, traders are unwilling to post ordersin the system, fearing that they will be picked out by other traders withsuperior information. Marketmakers also require a greater price for theirservices because offering liquidity becomes risky. This may widen thespread. Our evidence suggests that a decrease in the labor and overheadcosts and in the costs of managing inventory in the electronic marketoutweighs the costs of adverse selection.
Market Quality
In the Hasbrouck (1993) model, the overall market quality is measuredby the variance of the pricing error. A lower variance suggests greaterpricing efficiency and higher market quality. We run the market qualityVAR models of Equation 2 with five lags, following Hasbrouck (1991,1993). The results show that the quality of the open outcry market isgreater than that of its electronic heir. For the period P1, the variance ofthe pricing error is 0.920(10�5), whereas for the period of electronictrading, Q1, the estimated error variance is 4.70(10�5).9 We note that
Open Outcry and Electronic Trading 727
9We also estimate the average daily error variance during each period, and the average in P1 is sig-nificantly smaller than that in Q1.
the volatility of changes in the trade price is 0.00046 for P1 and 0.00021for Q1. Therefore, it is unlikely that the higher error variance in the elec-tronic trading market is induced by the volatility of price changes.
One explanation for these findings is that, in periods of high volatil-ity, when information is arriving at the market, the electronic marketfails to incorporate it into the prices. This is because traders are unwill-ing to submit orders in the system, fearing that they will be unable tochange them rapidly enough to cope with the pace of information arrival.In such periods, the market becomes thinner (Frino et al., 1998), andprice discovery is impaired (Martens, 1998). Absence of trading creates adramatic departure of the market price from the rapidly updated efficientprice. As a result, the quality of the market decreases.
In contrast, traders on the floor are most active when the market isvolatile (see Coval & Shumway, 2000). The return to scalpers increaseswith their inventory position and the volatility of the market (Grossman& Miller, 1988). Thus, the open outcry mechanism reflects informationmore efficiently than the electronic market in the volatile periods.
Quality of the open outcry may be weakened in the quiet periodsbecause the only source of information, trading and interaction betweentraders on the floor, is not available. At the same time, quality of theelectronic market may be greater in the quiet periods because of thetransparency of the electronic order book. However, a quiet marketimplies a low level of information, which suggests that the role of theseperiods in the determination of market quality is not very important.
To show that open outcry is more efficient when the market is morevolatile, we partition P1 into two groups, days with high and low tradingactivities. We compare the average daily pricing error variance in eachgroup. Like Jones, Kaul, and Lipson (1994), among many others, we usethe number of trades as a proxy for volatility and trading activity. We findthat the average error variance is in the volatile days 2.81 and in thequiet days 3.28. We do a similar analysis for Q1. In contrast to theresults of P1, the average error variance in the volatile days is marginallyhigher than that in the quiet days: 4.67 versus 4.56. Accordingly, foropen outcry (electronic market), the market is more efficient with alower error variance when the market is more (less) actively traded. Wealso note that the error variance of P1 is significantly smaller than that ofQ1 in both high and low volatile periods.
Given our findings of spread clustering, our estimation of marketquality for the open outcry market is lower (i.e., the estimated varianceof the pricing error is higher) than what it could be if there were anymeans to eliminate clustering or prevent locals from collusion. This is
728 Tse and Zabotina
because collusion causes choppier prices, which in turn increase thedeviation from the efficient price.
Information Content of the Trades
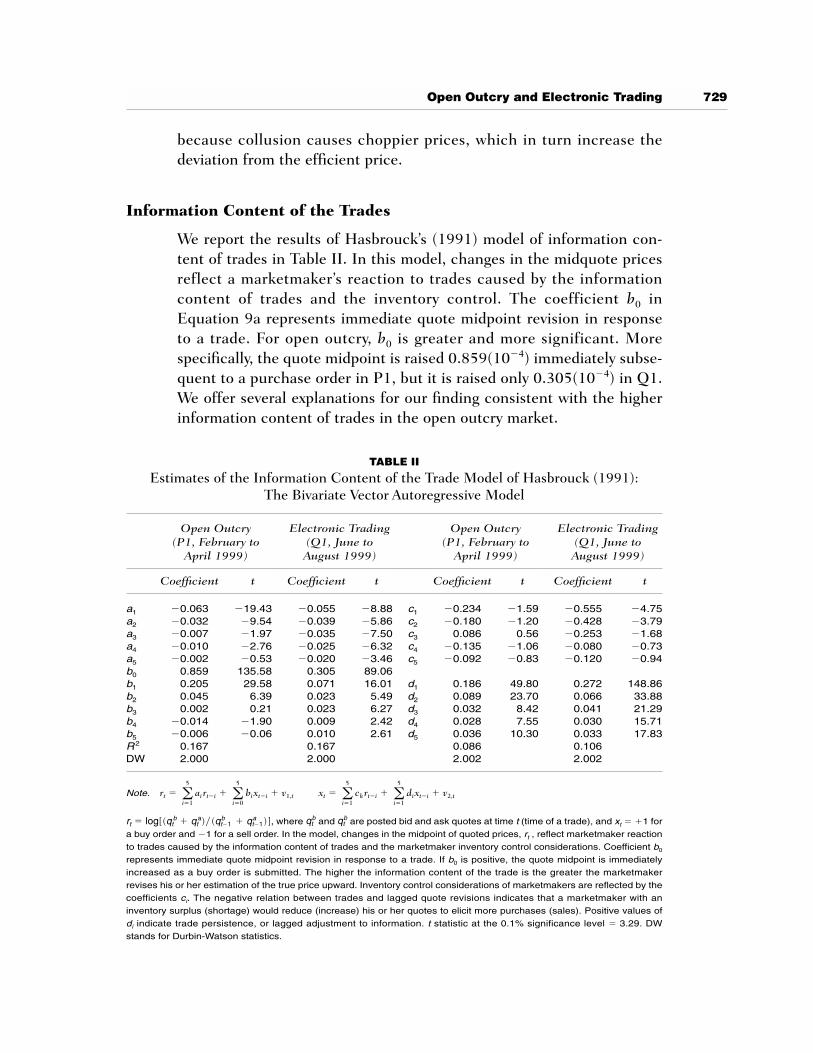
We report the results of Hasbrouck’s (1991) model of information con-tent of trades in Table II. In this model, changes in the midquote pricesreflect a marketmaker’s reaction to trades caused by the informationcontent of trades and the inventory control. The coefficient b0 inEquation 9a represents immediate quote midpoint revision in responseto a trade. For open outcry, b0 is greater and more significant. Morespecifically, the quote midpoint is raised 0.859(10�4) immediately subse-quent to a purchase order in P1, but it is raised only 0.305(10�4) in Q1.We offer several explanations for our finding consistent with the higherinformation content of trades in the open outcry market.
Open Outcry and Electronic Trading 729
TABLE II
Estimates of the Information Content of the Trade Model of Hasbrouck (1991):The Bivariate Vector Autoregressive Model
Open Outcry Electronic Trading Open Outcry Electronic Trading(P1, February to (Q1, June to (P1, February to (Q1, June to
April 1999) August 1999) April 1999) August 1999)
Coefficient t Coefficient t Coefficient t Coefficient t
a1 �0.063 �19.43 �0.055 �8.88 c1 �0.234 �1.59 �0.555 �4.75a2 �0.032 �9.54 �0.039 �5.86 c2 �0.180 �1.20 �0.428 �3.79a3 �0.007 �1.97 �0.035 �7.50 c3 0.086 0.56 �0.253 �1.68a4 �0.010 �2.76 �0.025 �6.32 c4 �0.135 �1.06 �0.080 �0.73a5 �0.002 �0.53 �0.020 �3.46 c5 �0.092 �0.83 �0.120 �0.94b0 0.859 135.58 0.305 89.06b1 0.205 29.58 0.071 16.01 d1 0.186 49.80 0.272 148.86b2 0.045 6.39 0.023 5.49 d2 0.089 23.70 0.066 33.88b3 0.002 0.21 0.023 6.27 d3 0.032 8.42 0.041 21.29b4 �0.014 �1.90 0.009 2.42 d4 0.028 7.55 0.030 15.71b5 �0.006 �0.06 0.010 2.61 d5 0.036 10.30 0.033 17.83R2 0.167 0.167 0.086 0.106DW 2.000 2.000 2.002 2.002
Note.
where and are posted bid and ask quotes at time t (time of a trade), and xt � �1 for
a buy order and �1 for a sell order. In the model, changes in the midpoint of quoted prices, rt , reflect marketmaker reaction
to trades caused by the information content of trades and the marketmaker inventory control considerations. Coefficient b0
represents immediate quote midpoint revision in response to a trade. If b0 is positive, the quote midpoint is immediately
increased as a buy order is submitted. The higher the information content of the trade is the greater the marketmaker
revises his or her estimation of the true price upward. Inventory control considerations of marketmakers are reflected by the
coefficients ci. The negative relation between trades and lagged quote revisions indicates that a marketmaker with an
inventory surplus (shortage) would reduce (increase) his or her quotes to elicit more purchases (sales). Positive values of
di indicate trade persistence, or lagged adjustment to information. t statistic at the 0.1% significance level � 3.29. DW
stands for Durbin-Watson statistics.
qtbqt
brt � log[(q bt � qt
a)�(qt�1 b � qt�1
a )],
xt � a5
i�1ck rt�i � a
5
i�1di xt�i � v2,trt � a
5
i�1ai rt�i � a
5
i�0bi xt�i � v1,t
The sequence of events implied in Hasbrouck’s (1991) model is asfollows. After an order to buy or sell, xt, is submitted, public informationarrives, and then the contemporaneous price midquote revision, rt, isannounced by a marketmaker. Hasbrouck contended that rt will be causedby the public information and by the private information revealed by xt.Hence, finding a relationship between rt and xt would indicate the privateinformation content of trades. However, the floor traders do not have real-time access to much fundamental information. Therefore, this relation-ship may indicate that scalpers derive public information from trades.
Miller (1990) asserted that futures prices are influenced by mar-ketwide information such as macroeconomic news. Also, informedinvestors, if any, are transparent on the floor. Even if a broker trades onbehalf of his informed client, scalpers detect information trading, as theyknow the identities of clients. Scalpers themselves possess no privateinformation and, while on the floor, do not have access to public infor-mation. They infer the information from the actions of their peers andbrokers on the floor.
Scalpers also heavily rely on looking into each others’ eyes and othermeans of human interaction. Coval and Shumway (2000) found asignificant relationship between the level of noise in the trading pit andsubsequent movements of price, trading volume, market breadth, andthe balance of orders between locals and brokers (Madhavan &Panchapagesan, in press, also showed that New York Stock Exchange(NYSE) specialists find the sound level contains information useful forsetting prices). A scalper needs to observe a buy (sell) order to concludethat there is some good (bad) news and revises the quoted prices imme-diately. Thus, even in the absence of private information in the openoutcry market, scalpers are able to rapidly impound public informationthey derive from trades into the prices.
Another explanation deals with the possibility of collusion amongthe scalpers. In quiet periods, there are fewer scalpers on the floorbecause they are only attracted to the pit by high market activity.Accordingly, scalpers mainly trade with brokers. Pirrong (1996) arguedthat scalpers are more aggressive when trading with brokers than withother scalpers. Repeated interaction on the floor of the open outcry mar-ket and personal acquaintance prevent scalpers from aggressive biddingof the price up or down when trading with each other. Thus, in a quietmarket, if scalpers know that a buy order is going to be received, theymay collude to drive the price up.
Our findings are also consistent with the inventory control consider-ations of the scalpers. In a quiet market, scalpers are unusually averse to
730 Tse and Zabotina
the risk of carrying unwanted inventory because they are unsure whetherthey will be able to reverse their positions rapidly. Thus, when an order topurchase (sell) is received, a scalper wants to increase (decrease) the ask(bid) to compensate himself for the imbalance in inventory in advance.Furthermore, scalpers act on both sides of the spread. If the scalper isexpecting an order on the other side of the market, he may simultane-ously increase (decrease) the bid (ask) to compensate himself for theinventory risk.
In active markets, the scalper’s inventory costs are negligible, andcollusion is not probable. However, in these cases our evidence is consis-tent with the scalper’s reputation considerations. Trading on both sidesof the market almost simultaneously, a scalper builds his reputation byproviding a high level of liquidity, that is, by trading with everybody whoneeds to trade, even if this trade will unbalance his inventory. He will tryto correct the imbalance immediately. Thus, when a sell order isreceived, a scalper will decrease his ask to sell part of the order simulta-neously, causing the midpoint of the bid and ask quotes to decrease aswell. When a purchase order is received, a scalper may immediatelyincrease his bid to attract inventory if he does not have enough of it onhand to fill the purchase order.10
In the electronic market, because of the order change/cancellationprocedure, response to an order will be less pronounced than in therapid, human-intensive open outcry market. Collusion is impossible inthe anonymous electronic system. However, finding b0 positive andhighly significant suggests that trades in the electronic market also havestrong information content, although it is less than in the open outcrymarket. These results are consistent with Huang (2000), who examinedstock price discovery by the Electronic Communication Networks andNASDAQ marketmakers. Huang argued that the information content oftrades in the electronic market is enhanced by informed traders who areenticed by the anonymity of trading but is impeded by liquidity traderswho are attracted by lower trading costs.
Inventory Control
For the open outcry market, we find the ci coefficients insignificant,suggesting no significant effect between trades and lagged quote revi-sions. In contrast, for the electronic market, we find the coefficients
Open Outcry and Electronic Trading 731
10These trades may not be exactly scratch trades, but they are close to them. In scratch trades,scalpers sell at the same price that they buy the assets. Smith and Whaley (1994) pointed out thatscalper profits are less than the bid–ask spread because of such trades.
significantly negative. This negative relation between trades and laggedquote revisions is consistent with inventory control effects. We use a0.1% significance level because the number of observations is sufficient-ly large: 106,390 for P1 and 341,374 for Q1.11
Our results are consistent with Silber (1984). He found that theaverage time a scalper’s inventory deviates from zero is about 2 min;therefore, scalpers find it very easy to control the level of their invento-ries. Moreover, according to the model of Grossman and Miller (1988),scalpers can diversify the inventory risk effectively in a volatile market.Because the presence of scalpers is very limited in electronic marketsand trading there is not as rapid as in the open outcry, marketmakers inelectronic trading are more concerned with carrying the unbalancedinventory.12
Like Goodhart, Ito, and Payne (1996) in their study of foreignexchange markets, we find that the ci coefficients (both for open outcryand for electronic trading) are considerably less significant than thosereported by Hasbrouck (1991). These results are consistent with thenotion that traders in the market with many competing markets, such asthe futures and foreign exchange markets, have much smaller inventorycontrol costs than those on the NYSE.
Positive signs of di coefficients indicate trade persistence and implythat the effect of lagged adjustment to information prevails over inven-tory control considerations. However, both magnitudes and values of thet statistics for di coefficients are generally greater for the electronic mar-ket. Evidence of slower adjustment to information in the electronicmarket suggests that deviations of the market price from the efficientprice last longer in the electronic market, supporting the finding oflower market quality in electronic trading.
CONCLUSIONS
On May 10, 1999, the LIFFE transferred floor trading in the FTSE100 Index futures contracts to the electronic trading system CONNECT.Using transaction data provided by the LIFFE, we compared the transac-tion costs and market quality between open outcry (from February toApril 1999) and electronic trading (from June to August 1999). We
732 Tse and Zabotina
11Connolly (1989) contended that the significance level should be adjusted downward to ensure thatthe interpretation of test statistics was not distorted by the large sample size used in the article.12Hasbrouck (1991) also mentioned that finding negative ci coefficients is also consistent with themodel of Leach and Madhavan (1989), in which a marketmaker sets quotes to optimally extractinformation from the traders.
employed the model of Hasbrouck (1993) to investigate market quality interms of the variance of the pricing error. We also used the model ofHasbrouck (1991) to investigate the information content of the tradesand inventory control effects in the two markets.
We find that the median daily time-weighted spreads are lower inthe electronic market. However, open outcry has higher quality and pric-ing efficiency. We attribute this to the superiority of the open outcry mar-ket over the electronic trading market in impounding information intoprices. Our results also indicate that trades in the open outcry markethave higher information content. The possible reasons are the efficienthuman intermediation on the floor and the specifics of scalper trading,such as trading on both sides of the spread and building reputations byproviding liquidity. Inventory control is higher in the electronic marketbecause scalpers are squeezed out of this market. The average aversionof traders to carrying unbalanced inventory is also higher in the elec-tronic market.
Our results support several earlier studies (e. g., Frino et al., 1998;Martens, 1998) that electronic trading should complement rather thanreplace open outcry and that open outcry cannot categorically be consid-ered outdated and inefficient. Our results also support the recent restruc-turing plan of the Chicago Board of Trade (CBOT). It calls for the CBOTto split into two competing for-profit companies, one that will retain openoutcry trading and another that will trade electronically. Although bothsystems are available, most of the CBOT volume remains in open outcry,suggesting that investors prefer its liquidity and efficiency (“Trading isalive and well,” 2000).
BIBLIOGRAPHY
Admati, A. R., & Pfleiderer, P. (1988). A theory of intraday trading patterns:Volume and price variability. Review of Financial Studies, 1, 3–40.
Barclay, M., & Hendershott, T. (2000). Price discovery and trading costs afterhours. Manuscript in preparation.
Bessembinder, H., & Seguin, P. (1993). Price volatility, trading volume, andmarket depth: Evidence from futures markets. Journal of Financial andQuantitative Analysis, 28, 21–39.
Beveridge, S., and Nelson, C. (1981). A new approach to the decomposition ofeconomic time series into permanent and transitory components with par-ticular attention to the measurement of the ‘business cycle.’ Journal ofMonetary Economics, 7, 151–174.
Blennerhassett, M., & Bowman, R. G. (1998). A change in market microstruc-ture: The switch to electronic screen trading on the New Zealand stockexchange. International Financial Markets, Institutions and Money, 8,261–276.
Open Outcry and Electronic Trading 733
Chan, K. (1992). A further analysis of the lead–lag relationship between thecash market and stock index futures markets. Review of Financial Studies,5, 123–152.
Chang, E. C., Jain, P. C., & Locke, P. R. (1995). Standard & Poor’s 500 Indexfutures volatility and price changes around the New York Stock Exchangeclose. Journal of Business, 68, 61–84.
Connolly, R. A. (1989). An examination of robustness of the weekend effect.Journal of Financial and Quantitative Analysis, 24, 133–170.
Copeland, T., & Galai, D. (1983). Information effects of the bid–ask spread.Journal of Finance, 38, 1457–1469.
Coval, J. D., & Shumway, T. (2000). Is sound just noise? Manuscript in prepa-ration.
Dhillon, U. S., Lasser, D. J., & Watanabe, T. (1997). Volatility, information, anddouble versus walrasian auction pricing in US and Japanese futures mar-kets. Journal of Banking and Finance, 21, 1045–1061.
Freedman, D. H. (2000, November 27). Net vs norm: A lifesaving revamp.Forbes ASAP, pp. 51–55.
Frino, A., McInish, T., & Toner, M. (1998). The liquidity of automatedexchanges: New evidence from German Bund futures. Journal ofInternational Financial Markets, Institutions and Money, 8, 225–242.
Goodhart, C., Ito, T., & Payne, R. (1996). One day in June 1993: A study of theworking of Reuters 2000-2 electronic foreign exchange trading system. In:J. A. Frankel, G. Galli, & A. Giovanni (Eds.), The microstructure of foreignexchange markets. Chicago: The University of Chicago Press.
Grossman, S. J., & Miller, M. H. (1988). Liquidity and market structure.Journal of Finance, 43, 617–633.
Grünbichler, A., Longstaff, F. A., & Schwartz, E. S. (1993). Electronic screentrading and the transmission of information: An empirical examination.Journal of Financial Intermediation, 3, 166–187.
Gwilym, O. A., Clare, A., & Thomas, S. (1998). Extreme price clustering in theLondon equity index futures and options markets. Journal of Banking andFinance, 22, 1193–1206.
Harris, L. E. (1991). Stock price clustering and discreteness. Review ofFinancial Studies, 4, 389–415.
Hasbrouck, J. (1991). Measuring the information content of stock trades.Journal of Finance, 46, 179–207.
Hasbrouck, J. (1993). Assessing the quality of a security market: A newapproach to transaction-cost measurement. Review of Financial Studies, 6,191–212.
Hasbrouck, J. (1995). One security, many markets: Determining the contribu-tions to price discovery. Journal of Finance, 50, 1175–1199.
How the market works: a guide to the electronic market. (2000). LIFFECONNECT™. LIFFE, http://www.Liffe.com.
Huang, R. D. (2000). Price discovery by ECNs and NASDAQ marketmakers.Manuscript in preparation.
Huberman, G. (1997). Familiarity breeds investment. Manuscript in preparation.Jones, C. M., Kaul, G., & Lipson, M. L. (1994). Transactions, volume and
volatility. Review of Financial Studies, 7, 631–651.
734 Tse and Zabotina

Jong, F. D., Nijman, T., & Röell, A. (1996). Price effects of trading and compo-nents of the bid–ask spread on the Paris Bourse. Journal of EmpiricalFinance, 3, 193–213.
King, M. A., & Wadhwani, S. (1990). Transition of volatility between stock mar-kets. Review of Financial Studies, 3, 5–33.
Kumar, R., Sarin, A., & Shastri, K. (1998). The impact of options trading on themarket quality of the underlying security: An empirical analysis. Journal ofFinance, 48, 717–732.
Leach, C., & Madhavan, A. (1989). Price experimentation and market struc-ture. Manuscript in preparation.
LIFFE’s new electronic trading platform. (1999, March 3). CONNECTION,issue 5.
Madhavan, A., & Panchapagesan, V. (2000). Price discovery in auction markets:A look inside the black box. Review of Financial Studies, 13, 627–658.
Martens, M. (1998). Price discovery in high and low volatility periods: Openoutcry versus electronic trading. Journal of International FinancialMarkets, Institutions and Money, 8, 243–260.
Miller, M. H. (1990). International competitiveness of U.S. futures exchanges.Journal of Financial Services Research, 4, 387–408.
Open outcry trading is alive and well. (2000, March 27). Business Week, 6.Pirrong, C. (1996). Market liquidity and depth on computerized and open out-
cry trading systems: A comparison of DTB and LIFFE Bund contracts.Journal of Futures Markets, 16, 519–544.
Price Waterhouse. (1997). The impact of technology on the futures and optionsindustry. London: Futures and Options Association.
Sarkar, A., & Tozzi, M. (1998). Electronic trading on futures exchanges. CurrentIssues in Economics and Finance, 4(1).
Shyy, G., & Lee, J.-H. (1995). Price transmission and information asymmetry inBund futures markets: LIFFE vs. DTB. Journal of Futures Markets, 15,87–99.
Silber, W. L. (1984). Marketmaker behavior in an auction market: An analysis ofscalpers in futures markets. Journal of Finance, 39, 937–953.
Skinner, D. J. (1989). Options markets and stock return volatility. Journal ofFinancial Economics, 23, 61–78.
Smith, T., & Whaley, R. E. (1994). Estimating the effective bid–ask spread fromthe time and sales data. Journal of Futures Markets, 14, 437–455.
Taylor, N., van Dijk, D., Franses, P. H., & Lucas, A. (2000). SETS, arbitrageactivity, and stock price dynamics. Journal of Banking and Finance, 24,1289–1306.
Tesar, I., & Werner, I. M. (1995). Home bias and high turnover. Journal ofInternational Money and Finance, 14, 467–492.
Tse, Y. (1999a). Market microstructure of FT-SE index futures markets: Anintraday empirical analysis. Journal of Futures Markets, 19, 31–58.
Tse, Y. (1999b). Price discovery and volatility spillovers in the DJIA index andfutures markets. Journal of Futures Markets, 19, 911–930.
Tse, Y. (1999c). Round-the-clock market efficiency and home bias: Evidencefrom the international Japanese government bonds futures markets.Journal of Banking and Finance, 23, 1831–1860.
Open Outcry and Electronic Trading 735


