Embed Size (px)
Citation preview
Corporate Ownership & Control / Volume 6, Issue 2, Winter 2008 – Continued – 2
283
TRANSACTION COSTS AND CORPORATE
GOVERNANCE OF SUGAR MILLS IN INDONESIA
Ahmad Erani Yustika*
Abstract
The sugar industry remains a priority for development in the Indonesian agricultural sector, especially in East Java. However, the performance of the sugar industry in East Java during the two last decades has declined, which is shown in the decreasing volume of production. This study utilized the analysis of transaction cost economics to identify the problems of the sugar mills in East Java – Indonesia. This research compares the transaction costs between state-owned (Ngadiredjo) and privately-owned (Kebon Agung) sugar mills. The study shows that in Kebon Agung Sugar Mill transaction costs are higher than production costs, while in Ngadiredjo Sugar Mill the reverse is true. However, the high transaction costs in Kebon Agung Sugar Mill cannot be attributed directly to inefficient institutions, because Ngadiredjo Sugar Mill incurred high costs for plants, land preparation, and fertilizer, which decreased the proportion of transaction costs. If analyzed in detail, the following facts are revealed: (i) market transaction costs in Kebon Agung Sugar Mill are higher than in Ngadiredjo Sugar Mill. This is because Kebon Agung Sugar Mill has established cooperation with sugarcane farmers in the form of extensions and transport subsidies; and (ii) the political transaction costs proportion in Ngadiredjo Sugar Mill is higher than in Kebon Agung Sugar Mill because of the imposition of many ‘illegal’ fees. There should be management (corporate) reform of sugar mills, both internal and external. Internally, sugar mill management must apply good corporate governance that guarantees the transparency and control of every activity. Nowadays, there is no controlling unit in sugar mill management that supervises corporate activity, so that it is susceptible to manipulation and mark-up. Externally, the relationship between sugar mill management (CEO) and the Board of Directors should be reformulated so that sugar mill management has wide authority to make corporate strategy decisions. Centralization of authority in holding firm (PTPN/PT. RNI) has caused high transaction costs as a result of the long hierarchy in decision-making. Keywords: transaction costs, corporate governance, sugar mill, East Java - Indonesia *Department of Development Economics University of Brawijaya - Indonesia
1. Introduction 1.1 Background Problems that have been encountered by the sugar industry in Indonesia recently are very complex, and are both internal and external. Generally, if we categorize, the sugar industry has four basic problems, i.e.: (i) inefficiency at the farmers’ level; (ii) inefficiency at the sugar mill level; (iii) government policy has not effectively stimulated the development of the national sugar industry; and (iv) the sugar industry and trading are very distorted in the international market (SUSILA, 2002:A4-8). Specifically, inefficiency at the sugar mill level is caused by the sugar mills being too old and by management of the sugar mills that is still traditional. This reality means that sugarcane cannot be well-processed (milled) so that the result is not maximal. If we describe based on ownership, privately-owned sugar mills are generally more efficient than are state-owned sugar mills (PRABOWO, 1998:12). This is because most of the privately-owned sugar mills are more newly
established so that their technology is better and they are managed with a more professional management system compared with state-owned sugar mills. In detail, management and technology cause a decrease in sugar mill performance. Some assumptions state that in general sugar industries in Indonesia are still efficient, although there are about 27 sugar mills that have problems and are inefficient. According to International LMC (1997), in the case of efficiency, Indonesian sugar industries occupy 21–30 ranks from 62 sugar producers in the world, with production costs of US$288 – 310 per ton. As a comparison, average production costs of the 15 countries most efficient are US$301.5 per ton (HUSODO, 1999:14). Yet given the fact that the total number of sugar mills in Indonesia nowadays remains at 64 units (compared with the total number of sugar mills in 1930 which reached 182 units), the assumption that sugar mills in Indonesia are not efficient is reasonable. One of the reasons a sugar mill is closed is because of the inadequacy of raw material (sugarcane) from sugarcane farmers. However, what we should not
Corporate Ownership & Control / Volume 6, Issue 2, Winter 2008 – Continued – 2
284
ignore is management performance of the sugar industry that is bad as a result of high spend-control. 1.2 Problem Setting However, there is one thing that escaped the notice of analysts of the sugar mill in Indonesia: that the decreasing performance of the sugar mill is caused by inefficiency of institutions in managing the relationships among economic actors in the sugar industry. 4 The institutional inefficiency can be detected in the high transaction costs in the sugar mill. In the sugar mill level, there is much evidence that management is not efficient, which raises many costs. For example, sugar mills must ask for approval from the director (PTPN) for buying equipment/machines, but the process takes a very long time because it is the PTPN itself that will buy the tools. This is disruptive to the production process. Government policies also burden sugar mills with things such as multiple taxation for water needs. There is much taxation conducted by government officials (from central to local) for various interests, which also raise transaction costs in the sugar mills. Accumulation from all of the institutional issues results in inefficiency of the sugar mill in Indonesia. From this perspective, inefficiency in the sugar mill can be seen not only in terms of production costs but also of transaction costs generated.
1.3. Research Questions The research will address the following questions:
1. How do the configuration of sugar mills’ transaction costs?
2. Are there any differences transaction costs between state-owned and privately-owned sugar mills?
1.4. Research Objective This research aims to describe the configuration of transaction costs of the sugar mill in East Java. Specifically, this research will describe the structure of corporate governance influencing the cost structure of sugar mills. Analysis of corporate governance will show whether the sugar mills’ rules of the game are already efficient or not. This research uses the transaction cost economics perspective, because this approach is one of appropriate analysis to evaluate the efficiency of economic institutions. This research also uses the comparative approach between the two
4 Theoretically, efficiency can be categorized as two types: technical efficiency and economic efficiency. In sugar production, technical efficiency refers to high crystal productivity that depends on sugar productivity and sucrose content rate. For sugar mills, technical efficiency is influenced by duration of mill time and capacity of the real mill. Meanwhile, economic efficiency is based on the production cost to produce the amount of the same product. See Dibyo PRABOWO, Antisipasi Industri Gula Menghadapi Ketidakpastian Ekonomi, Gula Indonesia, Vol. XXIII, Vol. 4, October – December 1998, p. 14
different institutions, state-owned and privately-owned sugar mills, in order to identify which is more efficient for the sugar mill in East Java. The specific objective of this research is to examine two issues:
1. To describe the configuration of sugar mills’ transaction costs in East Java – Indonesia
2. To compare transaction costs of state-owned and privately-owned sugar mills, consisting of market, managerial, and political transaction costs
2. Theoretical Framework 2.1 Transaction Cost Economics Transaction cost economics (TCE) views firms as governance structures, replacing the neoclassical view of them as production functions. In the latter, once the quantities of inputs used in a production process are specified, exogenous technological considerations will fix the quantity of output (or an efficient frontier linking quantities of multiple outputs). In the TCE view, the differing degrees of sunkenness of different inputs will affect the behavior of their owners, unobservability of quality or effort will influence the effectiveness of other inputs, managerial quality and effort will determine how well the inputs are combined, and so on. The mechanisms that are in place to counter these transaction-cost problems, for example, incentive schemes, will also influence the behavior of the various parties. In other words, organizational and governance structures of firms will have an important impact on what they do (DIXIT, 1996:51). In interpreting the transaction costs within a firm, it may be helpful to understand the ‘exchanges’ as ‘contractual arrangements.’ Firms’ transactions involve the contractual arrangement of factors of production, while markets involve the contractual arrangement of outputs (ZHANG, 2000:287).
FURUBOTN and RICHTER (as quoted by BENHAM
and BENHAM, 2000:368) pointed out typical examples of transaction costs are the costs of using the market (market transaction costs) and the costs of exercising the right to give orders within the firm (managerial
transaction costs). There is also the array of costs associated with the running and adjusting of the institutional framework of a polity (political
transaction costs). For each of these three types of transaction costs, it is possible to recognize two variants: (1) “fixed” transaction costs, that is, the specific investments made in setting up institutional arrangements; and (2) “variable” transaction costs, that is, costs that depend on the number or volume of transactions.
The costs of using the market (market transaction
costs) may be classified in more detail as follows: (1) the costs of preparing contracts (search and information costs narrowly defined), (2) the costs of concluding contracts (costs of bargaining and decision making), and (3) the costs of monitoring and enforcing the contractual obligations. Managerial transaction costs reduce to the following: (1) the costs of setting up,
Corporate Ownership & Control / Volume 6, Issue 2, Winter 2008 – Continued – 2
285
maintaining or changing an organizational design. Such costs relate to a rather wide array of operations. These are typically fixed transaction costs; and (2) the costs of running an organization, which fall largely into two subcategories: (a) information costs; and (b) the costs associated with the physical transfer of goods and services across a separable interface. Finally, political transaction costs deals with the provision of such organization and the public goods associated with it. They are, in a general sense, the costs of supplying public goods by collective action, and they can be understood as analogous to managerial transaction costs. Specifically, these are: (1) the costs of setting up, maintaining and changing a system’s formal and informal political organization; (2) the costs of running polity. These are current expenditures for those things formerly specified as the “duties of the sovereign” (FURUBOTN and RICHTER, 2000:44-47).
In the context of firms, STRASSMANN (2002:7) identifies transaction costs as costs of the organization of employees and users; information processing; coordination of suppliers; costs of acquisition; motivation of customers; managing distributors; compliance with regulations; satisfying shareholders and lenders; fees, commissions, tolls and taxes; and research and development. In another way, UNDP (2000:15) classified transaction costs into three forms. First, administrative costs. These arise from inputs of resources needed for transactions. Most include administrative overheads, in particular, staff time. Second, indirect costs. These result from the impact of the delivery mechanism on the achievement of development goals, for instance, transport subsidy and cut-load-carry activity. Third, opportunity costs. These measure the benefits forgone from alternative applications of the decision-making activities, especially the trade-off between centralistic and decentralistic managements.5
2.2 Ownership Problems and Corporate Governance In macro-perspective, one of the main issues relating to the firm is the ownership problem. The choice of public versus private provision depends on how different ownership patterns affect the incentives to deliver this non-contractible quality, as well as on the cost of such delivery. The efficiency concept here is intended to incorporate fully the social value of quality. To focus on both efficiency and quality, HART, SHLEIFER and VISHNY (1997) consider two types of
5 Besides interest expenses, POLSKI also formulated non-interest expenses, which consist of (1) employee salaries and benefits; (2) occupancy expenses; and (3) other miscellaneous expenses, i.e. fees paid to directors, trustees and advisory board members, legal fees, advertising, public relations and promotions, charitable contributions, office supplies, information processing, telephone expenses, examination and audit fees and so on. See Margaret M. POLSKI, Measuring Transaction Costs and Institutional Change in
the U.S. Commercial Banking Industry, Paper presented for the Annual Conference of the International Society for New Institutional Economics, 2000, Tübingen, Germany, p.17
investment incentives: those to reduce costs and those to improve quality or innovate (SHLEIFER, 1998:137-138). When assets are publicly owned, the public manager has relatively weak incentives to make either of these investments, because this manager is not the owner and hence gets only a fraction of the return. In contrast, private regulated contractors have much stronger incentives because, as owners, they get more of the returns on the investment. Which ownership structure is more efficient depends on whether having high-powered incentives to invest and innovate is a good idea.
Corporate governance issues arise in an organization whenever two conditions are present (HART, 1995:680). First, there is an agency problem; these might be owners, managers, workers, or consumers. Second, transaction costs are such that this agency problem cannot be dealt with through a contract. In a world of incomplete contracts (where agency problems are also present), governance structure does have a role. Governance structure can be seen as a mechanism for making decisions that have not been specified in the initial contract. More precisely, governance structure allocates residual
rights of control over the firm’s nonhuman assets; that is, the right to decide how these assets should be used, given that a usage has not been specified in an initial contract. In the context of this corporate governance, one important issue is the mechanism for controlling management. Finally, the transaction cost approach to the study of organizations has been applied at three levels of analysis (WILLIAMSON, 1981:549). The first
is the overall structure of the enterprise. This takes the scope of the enterprise as given and asks how the operating parts should be related one to another. Unitary, holding company, and multidivisional forms come under scrutiny when these issues are addressed. The second or middle level focuses on the operating parts and ask which activities should be performed within the firm, which outside it, and why. This can be thought of as developing the criteria for and defining the “efficient boundaries” of an operating unit. The third level of analysis is concerned with the manner in which human assets are organized. The object here is to match internal governance structures with the attributes of works groups in a discriminating way.
3. Research Methodology 3.1 Research Location The survey was carried out in two different regions in East Java - Indonesia, because about 40% of sugar mills have been operating in this area. The researcher intends to take samples of two kinds of sugar mills in East Java. First, a state-owned sugar mill is represented by Ngadiredjo Sugar Mill in Kediri District. Second, a privately-owned sugar mill is represented by Kebon Agung Sugar Mill in Malang District. The two sugar mills were chosen due to having the same production scale. Malang and Kediri Districts, chosen as locations for this research, are also
Corporate Ownership & Control / Volume 6, Issue 2, Winter 2008 – Continued – 2
286
relatively attractive regions (from an economic point of view) compared with other districts in East Java. 3.2 Data Sources Primary data was collected by using individual in-depth interviews are taken to obtain more detailed information. The person interviewed was free to voice his/her own expressions/ideas in an unstructured interview. The interviewer relied on open questions to introduce topics of interest without the interviewer imposing his ideas. Also, the researcher used key informants to collect information.6 The study of the sugar mills is expected to reveal processing, marketing, contract system, and enforcement procedures in the sugar mills. Besides empirical research, data was also collected from financial annual reports of the sugar mills. Data and information gained from field observation and by interviewing some key-informants turned out to be valuable for this study. 3.3 Method of Analysis In general, the data that are used in this research are based on the annual financial report of Kebon Agung and Ngadiredjo Sugar Mills (1999-2004). The data is classified into two types, i.e. production and transaction costs. The researcher used the ABC (Activity-Based Costing) approach to classify the types of costs (see Figure 3.1). Activity-based costing is an accounting methodology that assigns costs to activities rather than products or services. This enables resource and overhead costs to be more accurately assigned to the products and the services that incur them. In addition, other data were attained through interviews and key persons (accounting unit) in sugar mills in order to get the data that are not written in annual financial reports, such as overlapping activities costs. Decision-making costs were calculated through special measurement, i.e. by calculating the costs arising due to the lateness of decision-making. 3.4 Measuring Transaction Costs of Sugar Mills In the case of sugar mills, the transaction costs can be classified into the variables as follows: (i) market transaction costs (transport subsidies, bonuses, and extensions); (ii) managerial transaction costs (salaries/wages for administrative workers, food, facilities, equipment, special costs, electricity, staff
6 Perhaps the single most important diagnostic feature of good qualitative enquiry is its full exploitation of insights from key informants. By key informants we mean persons whose position or previous experience gives them particularly valuable information on a give topic. If the basis is position, the key informant becomes, in effect, a surrogate observer for the investigator. On the other hand, if the basis is experience, the informant provides the investigator with a chance to view information from other sources in historical perspective –in effect a longitudinal ‘time slice’. See Jon MORIS and James COPESTAKE, Qualitative Enquiry for Rural Development, Intermediate Technology Publications on Behalf of the Overseas Development Institute, 1993, London, p. 58
allowances, health, spare parts, telecommunications, maintenance, official transport, pensions, fire brigade, decision-making, overlapping activities); and (iii) political transaction costs (taxes, tax duplication, donations, security, and miscellaneous costs). Most of these variables are explicit (which means the researcher can get data from the annual financial report of the sugar mill). However, a few of the variables, such as decision-making, tax duplication, and overlapping activities costs must be approached with special calculations, because sugar mill officers usually do not calculate these variables (implicit). For the variables, the measurement can be explained as follows: • Decision-making = Costs of decision-making delay. Cost of the decision-making process is taken from two sources: (i) a milling machine stopped operating temporarily because of waiting for the machine spare parts that came late. From the total operational stoppage the sugar mill lost its chance to produce some sugar. The milling stop cost is calculated based on sugar loss multiplied by sugar price; and (ii) employees that have been contracted have no duties during the milling machine stoppage. The employees are given a wage rate/day, and this is multiplied by the number of employees to generate transaction costs (implicit). • Duplication tax = Cost of duplication tax is measured from water tax during the milling season (for six months/180 working days; this is only the case for Ngadiredjo Sugar Mill). In the milling season Ngadiredjo Sugar Mill is charged a water tax by two government agencies: Board of Kediri Revenue (Dispenda) and a state-owned water firm (Perum Jasa
Tirta). Each agent draws tax Rp 62.5 million/month for the same object. From duplication of this water tax, Ngadiredjo Sugar Mill bears total costs Rp 375 million (implicit). • Overlapping activities = This cost exists because one activity is conducted by two divisions (this is only the case for Ngadiredjo Sugar Mill). The measurement is based on the calculations of the Ngadiredjo Sugar Mill Accountancy Unit (implicit).
Corporate Ownership & Control / Volume 6, Issue 2, Winter 2008 – Continued – 2
287
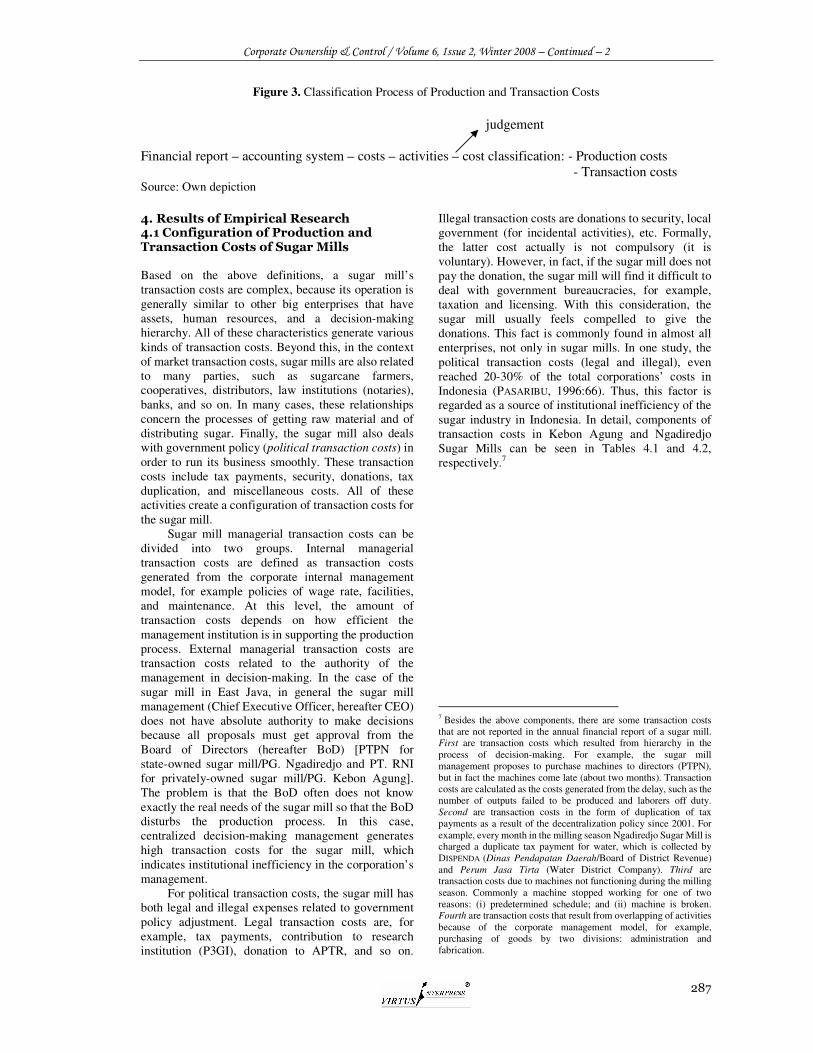
Figure 3. Classification Process of Production and Transaction Costs
judgement Financial report – accounting system – costs – activities – cost classification: - Production costs - Transaction costs Source: Own depiction
4. Results of Empirical Research 4.1 Configuration of Production and Transaction Costs of Sugar Mills Based on the above definitions, a sugar mill’s transaction costs are complex, because its operation is generally similar to other big enterprises that have assets, human resources, and a decision-making hierarchy. All of these characteristics generate various kinds of transaction costs. Beyond this, in the context of market transaction costs, sugar mills are also related to many parties, such as sugarcane farmers, cooperatives, distributors, law institutions (notaries), banks, and so on. In many cases, these relationships concern the processes of getting raw material and of distributing sugar. Finally, the sugar mill also deals with government policy (political transaction costs) in order to run its business smoothly. These transaction costs include tax payments, security, donations, tax duplication, and miscellaneous costs. All of these activities create a configuration of transaction costs for the sugar mill.
Sugar mill managerial transaction costs can be divided into two groups. Internal managerial transaction costs are defined as transaction costs generated from the corporate internal management model, for example policies of wage rate, facilities, and maintenance. At this level, the amount of transaction costs depends on how efficient the management institution is in supporting the production process. External managerial transaction costs are transaction costs related to the authority of the management in decision-making. In the case of the sugar mill in East Java, in general the sugar mill management (Chief Executive Officer, hereafter CEO) does not have absolute authority to make decisions because all proposals must get approval from the Board of Directors (hereafter BoD) [PTPN for state-owned sugar mill/PG. Ngadiredjo and PT. RNI for privately-owned sugar mill/PG. Kebon Agung]. The problem is that the BoD often does not know exactly the real needs of the sugar mill so that the BoD disturbs the production process. In this case, centralized decision-making management generates high transaction costs for the sugar mill, which indicates institutional inefficiency in the corporation’s management.
For political transaction costs, the sugar mill has both legal and illegal expenses related to government policy adjustment. Legal transaction costs are, for example, tax payments, contribution to research institution (P3GI), donation to APTR, and so on.
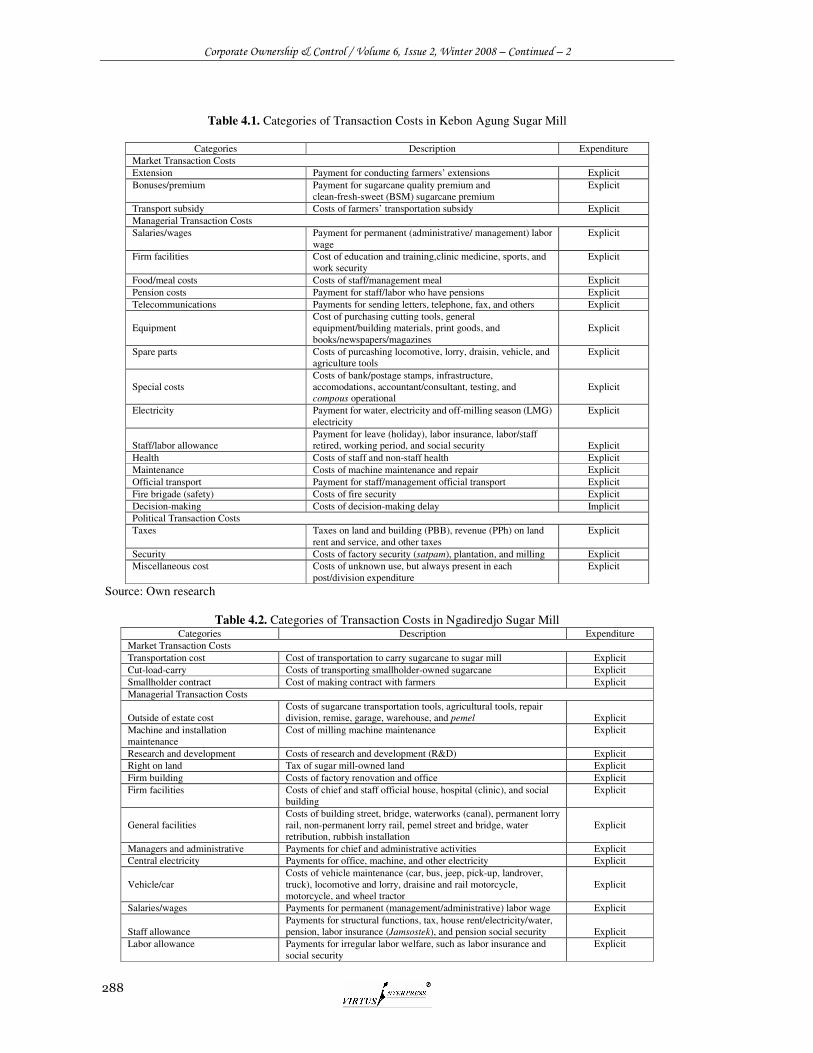
Illegal transaction costs are donations to security, local government (for incidental activities), etc. Formally, the latter cost actually is not compulsory (it is voluntary). However, in fact, if the sugar mill does not pay the donation, the sugar mill will find it difficult to deal with government bureaucracies, for example, taxation and licensing. With this consideration, the sugar mill usually feels compelled to give the donations. This fact is commonly found in almost all enterprises, not only in sugar mills. In one study, the political transaction costs (legal and illegal), even reached 20-30% of the total corporations’ costs in Indonesia (PASARIBU, 1996:66). Thus, this factor is regarded as a source of institutional inefficiency of the sugar industry in Indonesia. In detail, components of transaction costs in Kebon Agung and Ngadiredjo Sugar Mills can be seen in Tables 4.1 and 4.2, respectively.7
7 Besides the above components, there are some transaction costs that are not reported in the annual financial report of a sugar mill. First are transaction costs which resulted from hierarchy in the process of decision-making. For example, the sugar mill management proposes to purchase machines to directors (PTPN), but in fact the machines come late (about two months). Transaction costs are calculated as the costs generated from the delay, such as the number of outputs failed to be produced and laborers off duty. Second are transaction costs in the form of duplication of tax payments as a result of the decentralization policy since 2001. For example, every month in the milling season Ngadiredjo Sugar Mill is charged a duplicate tax payment for water, which is collected by DISPENDA (Dinas Pendapatan Daerah/Board of District Revenue) and Perum Jasa Tirta (Water District Company). Third are transaction costs due to machines not functioning during the milling season. Commonly a machine stopped working for one of two reasons: (i) predetermined schedule; and (ii) machine is broken. Fourth are transaction costs that result from overlapping of activities because of the corporate management model, for example, purchasing of goods by two divisions: administration and fabrication.
Corporate Ownership & Control / Volume 6, Issue 2, Winter 2008 – Continued – 2
288
Table 4.1. Categories of Transaction Costs in Kebon Agung Sugar Mill
Categories Description Expenditure Market Transaction Costs Extension Payment for conducting farmers’ extensions Explicit Bonuses/premium Payment for sugarcane quality premium and
clean-fresh-sweet (BSM) sugarcane premium Explicit
Transport subsidy Costs of farmers’ transportation subsidy Explicit Managerial Transaction Costs Salaries/wages Payment for permanent (administrative/ management) labor
wage Explicit
Firm facilities Cost of education and training,clinic medicine, sports, and work security
Explicit
Food/meal costs Costs of staff/management meal Explicit Pension costs Payment for staff/labor who have pensions Explicit Telecommunications Payments for sending letters, telephone, fax, and others Explicit Equipment
Cost of purchasing cutting tools, general equipment/building materials, print goods, and books/newspapers/magazines
Explicit
Spare parts Costs of purcashing locomotive, lorry, draisin, vehicle, and agriculture tools
Explicit
Special costs
Costs of bank/postage stamps, infrastructure, accomodations, accountant/consultant, testing, and compous operational
Explicit
Electricity Payment for water, electricity and off-milling season (LMG) electricity
Explicit
Staff/labor allowance
Payment for leave (holiday), labor insurance, labor/staff retired, working period, and social security
Explicit
Health Costs of staff and non-staff health Explicit Maintenance Costs of machine maintenance and repair Explicit Official transport Payment for staff/management official transport Explicit Fire brigade (safety) Costs of fire security Explicit Decision-making Costs of decision-making delay Implicit Political Transaction Costs Taxes Taxes on land and building (PBB), revenue (PPh) on land
rent and service, and other taxes Explicit
Security Costs of factory security (satpam), plantation, and milling Explicit Miscellaneous cost Costs of unknown use, but always present in each
post/division expenditure Explicit
Source: Own research
Table 4.2. Categories of Transaction Costs in Ngadiredjo Sugar Mill Categories Description Expenditure
Market Transaction Costs Transportation cost Cost of transportation to carry sugarcane to sugar mill Explicit Cut-load-carry Costs of transporting smallholder-owned sugarcane Explicit Smallholder contract Cost of making contract with farmers Explicit Managerial Transaction Costs Outside of estate cost
Costs of sugarcane transportation tools, agricultural tools, repair division, remise, garage, warehouse, and pemel
Explicit
Machine and installation maintenance
Cost of milling machine maintenance Explicit
Research and development Costs of research and development (R&D) Explicit Right on land Tax of sugar mill-owned land Explicit Firm building Costs of factory renovation and office Explicit Firm facilities Costs of chief and staff official house, hospital (clinic), and social
building Explicit
General facilities
Costs of building street, bridge, waterworks (canal), permanent lorry rail, non-permanent lorry rail, pemel street and bridge, water retribution, rubbish installation
Explicit
Managers and administrative Payments for chief and administrative activities Explicit Central electricity Payments for office, machine, and other electricity Explicit Vehicle/car
Costs of vehicle maintenance (car, bus, jeep, pick-up, landrover, truck), locomotive and lorry, draisine and rail motorcycle, motorcycle, and wheel tractor
Explicit
Salaries/wages Payments for permanent (management/administrative) labor wage Explicit Staff allowance
Payments for structural functions, tax, house rent/electricity/water, pension, labor insurance (Jamsostek), and pension social security
Explicit
Labor allowance Payments for irregular labor welfare, such as labor insurance and social security
Explicit
Corporate Ownership & Control / Volume 6, Issue 2, Winter 2008 – Continued – 2
289
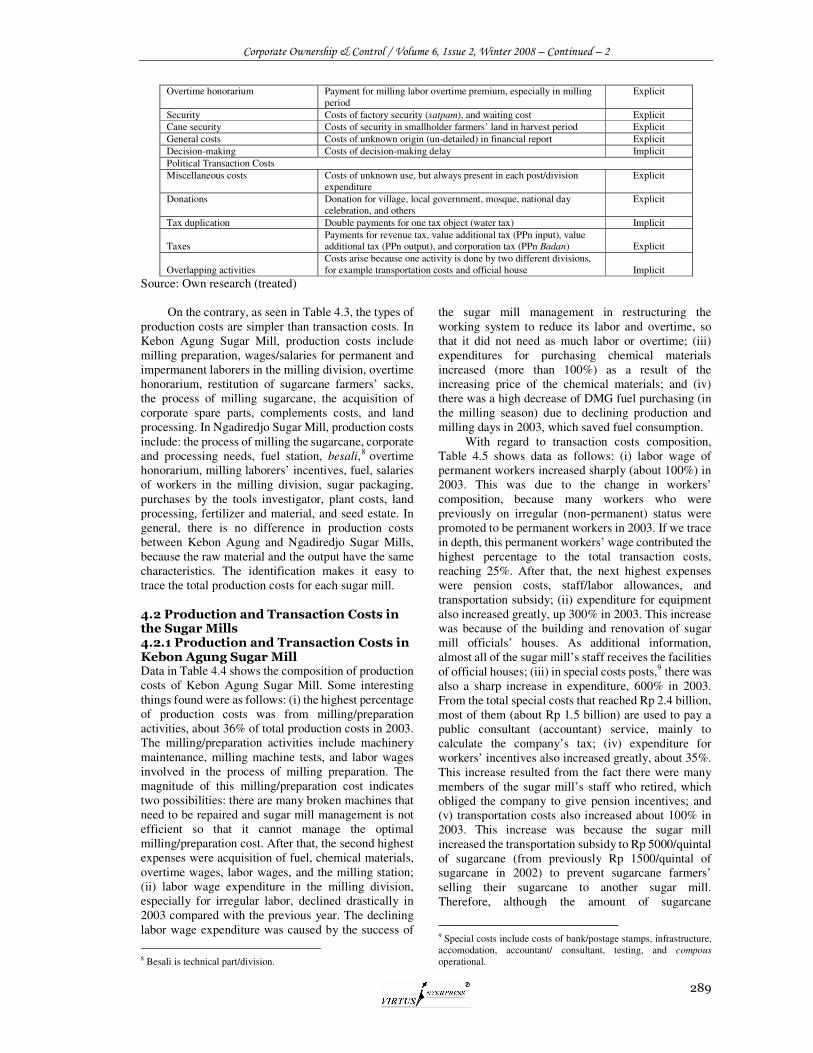
Overtime honorarium Payment for milling labor overtime premium, especially in milling period
Explicit
Security Costs of factory security (satpam), and waiting cost Explicit Cane security Costs of security in smallholder farmers’ land in harvest period Explicit General costs Costs of unknown origin (un-detailed) in financial report Explicit Decision-making Costs of decision-making delay Implicit Political Transaction Costs Miscellaneous costs Costs of unknown use, but always present in each post/division
expenditure Explicit
Donations Donation for village, local government, mosque, national day celebration, and others
Explicit
Tax duplication Double payments for one tax object (water tax) Implicit Taxes
Payments for revenue tax, value additional tax (PPn input), value additional tax (PPn output), and corporation tax (PPn Badan)
Explicit
Overlapping activities
Costs arise because one activity is done by two different divisions, for example transportation costs and official house
Implicit
Source: Own research (treated)
On the contrary, as seen in Table 4.3, the types of production costs are simpler than transaction costs. In Kebon Agung Sugar Mill, production costs include milling preparation, wages/salaries for permanent and impermanent laborers in the milling division, overtime honorarium, restitution of sugarcane farmers’ sacks, the process of milling sugarcane, the acquisition of corporate spare parts, complements costs, and land processing. In Ngadiredjo Sugar Mill, production costs include: the process of milling the sugarcane, corporate and processing needs, fuel station, besali,8 overtime honorarium, milling laborers’ incentives, fuel, salaries of workers in the milling division, sugar packaging, purchases by the tools investigator, plant costs, land processing, fertilizer and material, and seed estate. In general, there is no difference in production costs between Kebon Agung and Ngadiredjo Sugar Mills, because the raw material and the output have the same characteristics. The identification makes it easy to trace the total production costs for each sugar mill.
4.2 Production and Transaction Costs in the Sugar Mills 4.2.1 Production and Transaction Costs in Kebon Agung Sugar Mill Data in Table 4.4 shows the composition of production costs of Kebon Agung Sugar Mill. Some interesting things found were as follows: (i) the highest percentage of production costs was from milling/preparation activities, about 36% of total production costs in 2003. The milling/preparation activities include machinery maintenance, milling machine tests, and labor wages involved in the process of milling preparation. The magnitude of this milling/preparation cost indicates two possibilities: there are many broken machines that need to be repaired and sugar mill management is not efficient so that it cannot manage the optimal milling/preparation cost. After that, the second highest expenses were acquisition of fuel, chemical materials, overtime wages, labor wages, and the milling station; (ii) labor wage expenditure in the milling division, especially for irregular labor, declined drastically in 2003 compared with the previous year. The declining labor wage expenditure was caused by the success of
8 Besali is technical part/division.
the sugar mill management in restructuring the working system to reduce its labor and overtime, so that it did not need as much labor or overtime; (iii) expenditures for purchasing chemical materials increased (more than 100%) as a result of the increasing price of the chemical materials; and (iv) there was a high decrease of DMG fuel purchasing (in the milling season) due to declining production and milling days in 2003, which saved fuel consumption.
With regard to transaction costs composition, Table 4.5 shows data as follows: (i) labor wage of permanent workers increased sharply (about 100%) in 2003. This was due to the change in workers’ composition, because many workers who were previously on irregular (non-permanent) status were promoted to be permanent workers in 2003. If we trace in depth, this permanent workers’ wage contributed the highest percentage to the total transaction costs, reaching 25%. After that, the next highest expenses were pension costs, staff/labor allowances, and transportation subsidy; (ii) expenditure for equipment also increased greatly, up 300% in 2003. This increase was because of the building and renovation of sugar mill officials’ houses. As additional information, almost all of the sugar mill’s staff receives the facilities of official houses; (iii) in special costs posts,9 there was also a sharp increase in expenditure, 600% in 2003. From the total special costs that reached Rp 2.4 billion, most of them (about Rp 1.5 billion) are used to pay a public consultant (accountant) service, mainly to calculate the company’s tax; (iv) expenditure for workers’ incentives also increased greatly, about 35%. This increase resulted from the fact there were many members of the sugar mill’s staff who retired, which obliged the company to give pension incentives; and (v) transportation costs also increased about 100% in 2003. This increase was because the sugar mill increased the transportation subsidy to Rp 5000/quintal of sugarcane (from previously Rp 1500/quintal of sugarcane in 2002) to prevent sugarcane farmers’ selling their sugarcane to another sugar mill. Therefore, although the amount of sugarcane
9 Special costs include costs of bank/postage stamps, infrastructure, accomodation, accountant/ consultant, testing, and compous
operational.
Corporate Ownership & Control / Volume 6, Issue 2, Winter 2008 – Continued – 2
290
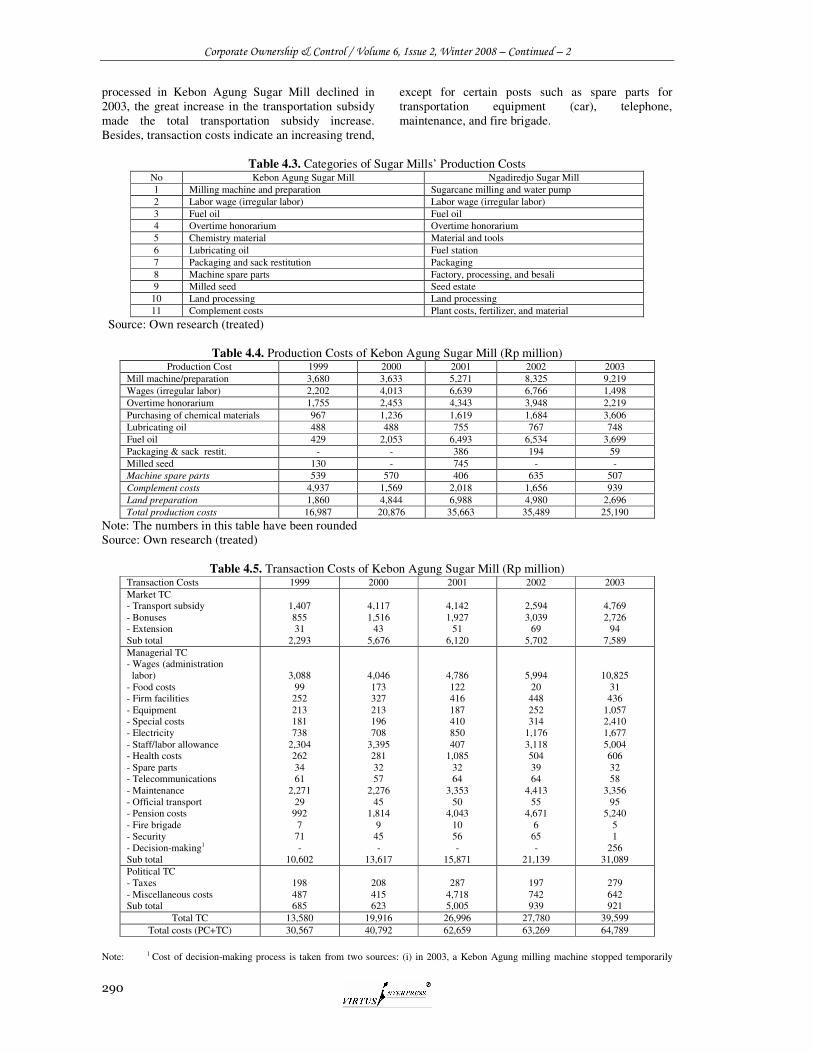
processed in Kebon Agung Sugar Mill declined in 2003, the great increase in the transportation subsidy made the total transportation subsidy increase. Besides, transaction costs indicate an increasing trend,
except for certain posts such as spare parts for transportation equipment (car), telephone, maintenance, and fire brigade.
Table 4.3. Categories of Sugar Mills’ Production Costs No Kebon Agung Sugar Mill Ngadiredjo Sugar Mill 1 Milling machine and preparation Sugarcane milling and water pump 2 Labor wage (irregular labor) Labor wage (irregular labor) 3 Fuel oil Fuel oil 4 Overtime honorarium Overtime honorarium 5 Chemistry material Material and tools 6 Lubricating oil Fuel station 7 Packaging and sack restitution Packaging 8 Machine spare parts Factory, processing, and besali 9 Milled seed Seed estate
10 Land processing Land processing 11 Complement costs Plant costs, fertilizer, and material
Source: Own research (treated)
Table 4.4. Production Costs of Kebon Agung Sugar Mill (Rp million) Production Cost 1999 2000 2001 2002 2003
Mill machine/preparation 3,680 3,633 5,271 8,325 9,219 Wages (irregular labor) 2,202 4,013 6,639 6,766 1,498 Overtime honorarium 1,755 2,453 4,343 3,948 2,219 Purchasing of chemical materials 967 1,236 1,619 1,684 3,606 Lubricating oil 488 488 755 767 748 Fuel oil 429 2,053 6,493 6,534 3,699 Packaging & sack restit. - - 386 194 59 Milled seed 130 - 745 - - Machine spare parts 539 570 406 635 507 Complement costs 4,937 1,569 2,018 1,656 939 Land preparation 1,860 4,844 6,988 4,980 2,696 Total production costs 16,987 20,876 35,663 35,489 25,190
Note: The numbers in this table have been rounded Source: Own research (treated)
Table 4.5. Transaction Costs of Kebon Agung Sugar Mill (Rp million) Transaction Costs 1999 2000 2001 2002 2003 Market TC - Transport subsidy - Bonuses - Extension Sub total
1,407 855 31
2,293
4,117 1,516
43 5,676
4,142 1,927
51 6,120
2,594 3,039
69 5,702
4,769 2,726
94 7,589
Managerial TC - Wages (administration labor) - Food costs - Firm facilities - Equipment - Special costs - Electricity - Staff/labor allowance - Health costs - Spare parts - Telecommunications - Maintenance - Official transport - Pension costs - Fire brigade - Security - Decision-making1 Sub total
3,088 99
252 213 181 738
2,304 262 34 61
2,271 29
992 7
71 -
10,602
4,046 173 327 213 196 708
3,395 281 32 57
2,276 45
1,814 9
45 -
13,617
4,786 122 416 187 410 850 407
1,085 32 64
3,353 50
4,043 10 56 -
15,871
5,994 20 448 252 314
1,176 3,118 504 39 64
4,413 55
4,671 6
65 -
21,139
10,825 31 436
1,057 2,410 1,677 5,004 606 32 58
3,356 95
5,240 5 1
256 31,089
Political TC - Taxes - Miscellaneous costs Sub total
198 487 685
208 415 623
287
4,718 5,005
197 742 939
279 642 921
Total TC 13,580 19,916 26,996 27,780 39,599 Total costs (PC+TC) 30,567 40,792 62,659 63,269 64,789
Note: 1 Cost of decision-making process is taken from two sources: (i) in 2003, a Kebon Agung milling machine stopped temporarily
Corporate Ownership & Control / Volume 6, Issue 2, Winter 2008 – Continued – 2
291
(stopped operating) for 291 hours because of waiting for the machine spare parts that came late. From the total, 25 hours are operational stopping that was planned and 266 hours were unplanned. As a result, Kebon Agung lost its chance to produce about 30 tons of sugar. If the total stoppage is multiplied by a sugar price of Rp 3140/kg, the transaction costs rise to Rp 110 million; and (ii) employees that had been contracted were not on duty during the time the milling machine was stopped. The employees are given wages of Rp 19,550/day with working hours being 8 hours (average Rp 2444/hour) and total employees reached 225 people, so that the generated transaction costs reached Rp 146 million. Thus, the total generated transaction costs from the stopped milling machine reached Rp 256 million (110 + 225). The numbers in this table have been rounded Source: Own research (treated)
If the composition of transaction costs is distinguished by its type, then the proportion of managerial transaction costs contributes the highest percentage to total transaction costs, reaching 78.5%. This is followed by market (19.2%) and political transaction costs (2.3%). This composition is reasonable because activities of sugar mills are mainly focused on the process of producing output so that most of the activities are related to production management. Market transaction costs of the sugar mill are associated with sugarcane farmers and related institutions, such as Smallholder Sugarcane Farmers Association (APTR), a cooperative, and banks. The sugar mill deals with government policy (political
transaction costs) on taxes and other expenditures, such as contributions to road reconstruction, national days activities, and so on. Thus, this information shows that most of the transaction costs for the sugar mill relate to the managerial aspect. On this point, the corporate management model is very influential on the magnitude of transaction costs. The more efficient the management model is the smaller the managerial transaction costs will be, and vice versa.10
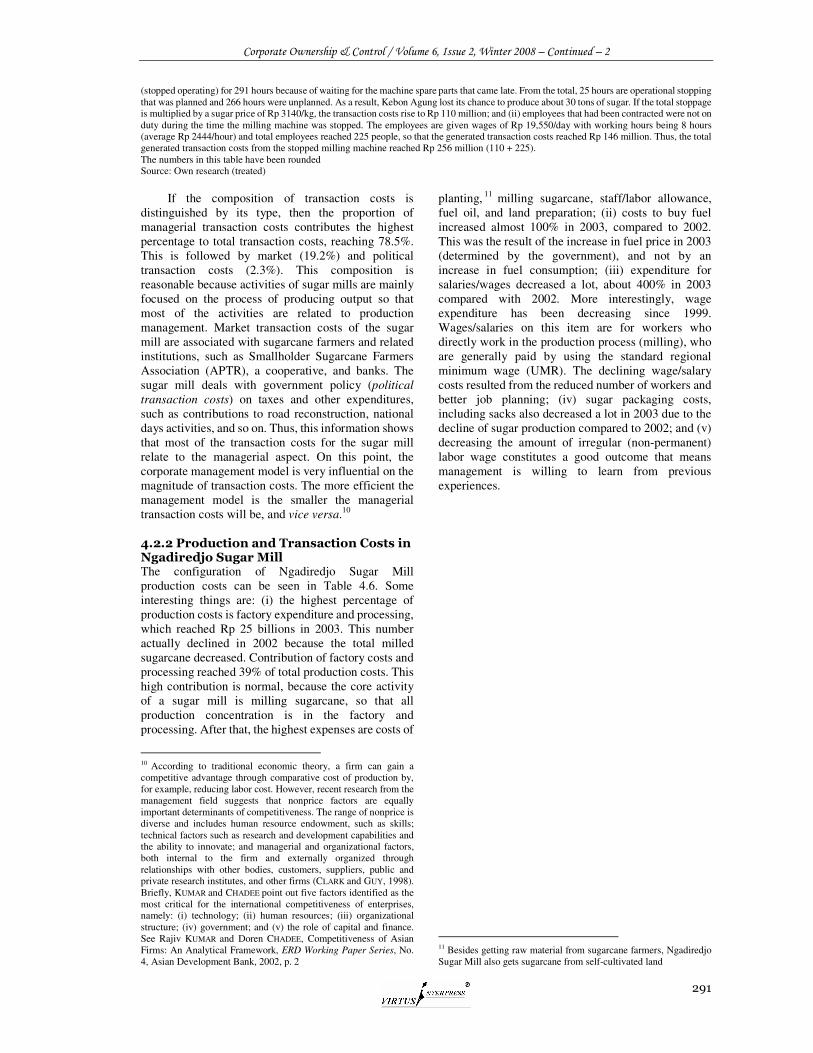
4.2.2 Production and Transaction Costs in Ngadiredjo Sugar Mill The configuration of Ngadiredjo Sugar Mill production costs can be seen in Table 4.6. Some interesting things are: (i) the highest percentage of production costs is factory expenditure and processing, which reached Rp 25 billions in 2003. This number actually declined in 2002 because the total milled sugarcane decreased. Contribution of factory costs and processing reached 39% of total production costs. This high contribution is normal, because the core activity of a sugar mill is milling sugarcane, so that all production concentration is in the factory and processing. After that, the highest expenses are costs of
10 According to traditional economic theory, a firm can gain a competitive advantage through comparative cost of production by, for example, reducing labor cost. However, recent research from the management field suggests that nonprice factors are equally important determinants of competitiveness. The range of nonprice is diverse and includes human resource endowment, such as skills; technical factors such as research and development capabilities and the ability to innovate; and managerial and organizational factors, both internal to the firm and externally organized through relationships with other bodies, customers, suppliers, public and private research institutes, and other firms (CLARK and GUY, 1998). Briefly, KUMAR and CHADEE point out five factors identified as the most critical for the international competitiveness of enterprises, namely: (i) technology; (ii) human resources; (iii) organizational structure; (iv) government; and (v) the role of capital and finance. See Rajiv KUMAR and Doren CHADEE, Competitiveness of Asian Firms: An Analytical Framework, ERD Working Paper Series, No. 4, Asian Development Bank, 2002, p. 2
planting, 11 milling sugarcane, staff/labor allowance, fuel oil, and land preparation; (ii) costs to buy fuel increased almost 100% in 2003, compared to 2002. This was the result of the increase in fuel price in 2003 (determined by the government), and not by an increase in fuel consumption; (iii) expenditure for salaries/wages decreased a lot, about 400% in 2003 compared with 2002. More interestingly, wage expenditure has been decreasing since 1999. Wages/salaries on this item are for workers who directly work in the production process (milling), who are generally paid by using the standard regional minimum wage (UMR). The declining wage/salary costs resulted from the reduced number of workers and better job planning; (iv) sugar packaging costs, including sacks also decreased a lot in 2003 due to the decline of sugar production compared to 2002; and (v) decreasing the amount of irregular (non-permanent) labor wage constitutes a good outcome that means management is willing to learn from previous experiences.
11 Besides getting raw material from sugarcane farmers, Ngadiredjo Sugar Mill also gets sugarcane from self-cultivated land
Corporate Ownership & Control / Volume 6, Issue 2, Winter 2008 – Continued – 2
292
Table 4.6. Production Costs of Ngadiredjo Sugar Mill (Rp million) Production Cost 1999 2000 2001 2002 2003
Sugarcane milling and water pump
4,227 7,279 77 9,868 10,080
Factory, processing, and besali 13,810 15,225 19,355 29,078 25,376 Fuel stasiun 884 1,190 668 1,491 3,080 Overtime honorarium - - 1,386 1,812 326 Fuel oil 1,213 1,281 2,955 3,289 6,037 Wages (irregular labor) 1,384 2,363 752 718 142 Packaging 1,379 1,525 2,072 2,408 1,670 Material & tools 1,604 1,520 1,774 1,766 1,553 Seed estate 735 996 1,283 1,463 461 Land preparation 1,892 2,317 2,101 3,553 4,356 Plant costs, fertilizer and material 10,900 15,868 19,530 21,467 12,037 Total production cost 38,028 49,564 51,953 76,913 65,118
Note: The numbers in this table have been rounded Source: Own research (treated)
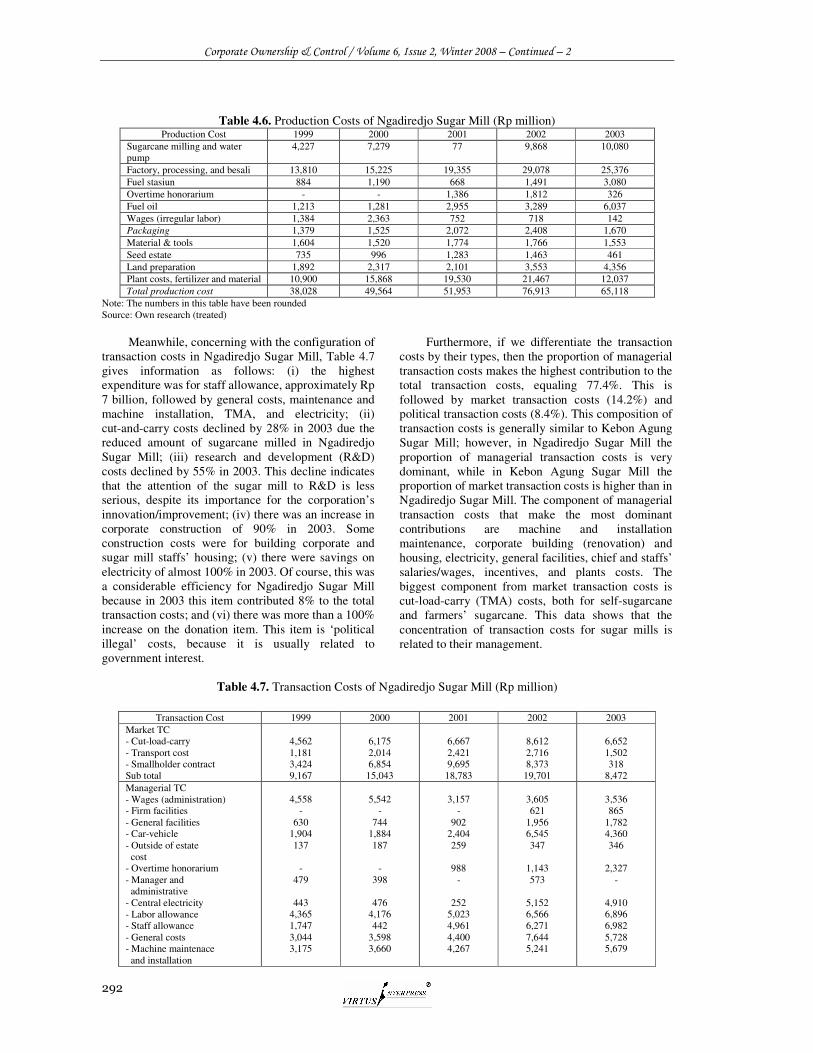
Meanwhile, concerning with the configuration of transaction costs in Ngadiredjo Sugar Mill, Table 4.7 gives information as follows: (i) the highest expenditure was for staff allowance, approximately Rp 7 billion, followed by general costs, maintenance and machine installation, TMA, and electricity; (ii) cut-and-carry costs declined by 28% in 2003 due the reduced amount of sugarcane milled in Ngadiredjo Sugar Mill; (iii) research and development (R&D) costs declined by 55% in 2003. This decline indicates that the attention of the sugar mill to R&D is less serious, despite its importance for the corporation’s innovation/improvement; (iv) there was an increase in corporate construction of 90% in 2003. Some construction costs were for building corporate and sugar mill staffs’ housing; (v) there were savings on electricity of almost 100% in 2003. Of course, this was a considerable efficiency for Ngadiredjo Sugar Mill because in 2003 this item contributed 8% to the total transaction costs; and (vi) there was more than a 100% increase on the donation item. This item is ‘political illegal’ costs, because it is usually related to government interest.
Furthermore, if we differentiate the transaction costs by their types, then the proportion of managerial transaction costs makes the highest contribution to the total transaction costs, equaling 77.4%. This is followed by market transaction costs (14.2%) and political transaction costs (8.4%). This composition of transaction costs is generally similar to Kebon Agung Sugar Mill; however, in Ngadiredjo Sugar Mill the proportion of managerial transaction costs is very dominant, while in Kebon Agung Sugar Mill the proportion of market transaction costs is higher than in Ngadiredjo Sugar Mill. The component of managerial transaction costs that make the most dominant contributions are machine and installation maintenance, corporate building (renovation) and housing, electricity, general facilities, chief and staffs’ salaries/wages, incentives, and plants costs. The biggest component from market transaction costs is cut-load-carry (TMA) costs, both for self-sugarcane and farmers’ sugarcane. This data shows that the concentration of transaction costs for sugar mills is related to their management.
Table 4.7. Transaction Costs of Ngadiredjo Sugar Mill (Rp million)
Transaction Cost 1999 2000 2001 2002 2003 Market TC - Cut-load-carry - Transport cost - Smallholder contract Sub total
4,562 1,181 3,424 9,167
6,175 2,014 6,854
15,043
6,667 2,421 9,695
18,783
8,612 2,716 8,373
19,701
6,652 1,502 318
8,472 Managerial TC - Wages (administration) - Firm facilities - General facilities - Car-vehicle - Outside of estate cost - Overtime honorarium - Manager and administrative - Central electricity - Labor allowance - Staff allowance - General costs - Machine maintenace and installation
4,558
- 630
1,904 137
-
479
443 4,365 1,747 3,044 3,175
5,542
- 744
1,884 187
-
398
476 4,176 442
3,598 3,660
3,157
- 902
2,404 259
988
-
252 5,023 4,961 4,400 4,267
3,605 621
1,956 6,545 347
1,143 573
5,152 6,566 6,271 7,644 5,241
3,536 865
1,782 4,360 346
2,327
-
4,910 6,896 6,982 5,728 5,679
Corporate Ownership & Control / Volume 6, Issue 2, Winter 2008 – Continued – 2
293
- R & D - Right on land - Firm building - Cane security - Decision-making1 - Overlapping activities2 Sub total
19 -
779 36 - -
21,316
30 -
577 50 - -
21,921
52 10
1,163 91 - -
27,929
156 120
2,883 118
- -
48,941
69 109
4,548 106 216
200
48,659 Political TC - Taxes - Tax duplication3 - Donations - Security costs - Miscellaneous costs Sub total
261
- 26 30
809 1,126
516
- 41 34
1,062 1,653
65 -
43 21
1,859 1,988
49 375 107 13
8,611 9,155
146 375 251 39
4,546 5,357
Total TC 31,609 38,617 48,700 77,797 62,488 Total costs (PC+TC) 69,637 88,181 100,613 154,710 127,606
Note: 1 Cost of decision-making process was calculated from two sources: (i) in 2003 there were 200 workers in the milling division off duty for two months because the purchasing of a machine was late (as a result of management centralization). Every worker was paid Rp 425 thousand/month despite being off duty (because they were bound in contract). In this case, Ngadiredjo Sugar Mill bore transaction costs of Rp 170 million; and (ii) in the 2003 milling season, a machine was disturbed which resulted in operations stopping for 125 hours, which happened because some spare parts of the milling machines were late. As a result, Ngadiredjo Sugar Mill lost its chance to produce about 14.6 tons of sugar. If the total stoppage is multiplied by a sugar price of Rp 3,140/kg, transaction costs raise to Rp 46 million (total is Rp 216 million). 2 Based on calculation of Ngadiredjo Sugar Mill Accountancy Unit 3 Cost of duplication tax is measured from water tax in milling season (for six months/180 working days). In the milling season water tax is imposed on Ngadiredjo Sugar Mill by two government agents: Kediri Revenue Office (Dispenda) and a state-owned water firm (Perum Jasa
Tirta). Each agency draws a tax of Rp 62.5 million/month for the same object. From duplication of this water tax, Ngadiredjo Sugar Mill bore total costs of Rp 375 million. The numbers in this table have been rounded Source: Own research (treated)
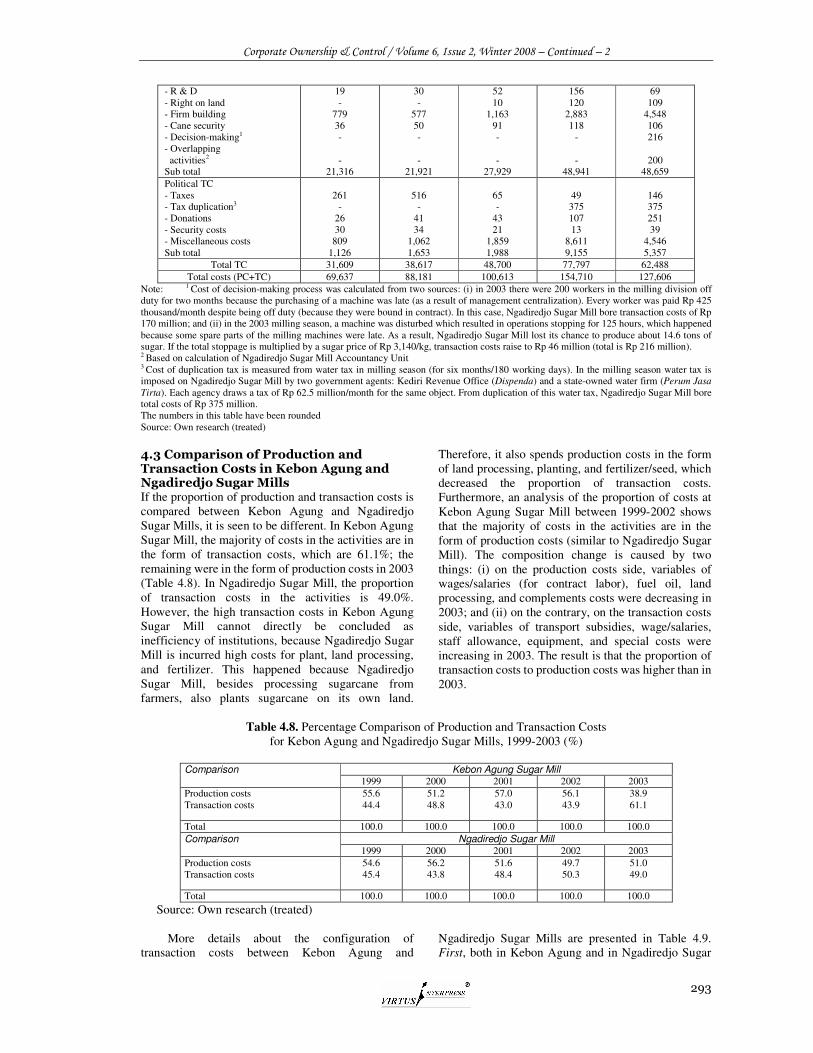
4.3 Comparison of Production and Transaction Costs in Kebon Agung and Ngadiredjo Sugar Mills If the proportion of production and transaction costs is compared between Kebon Agung and Ngadiredjo Sugar Mills, it is seen to be different. In Kebon Agung Sugar Mill, the majority of costs in the activities are in the form of transaction costs, which are 61.1%; the remaining were in the form of production costs in 2003 (Table 4.8). In Ngadiredjo Sugar Mill, the proportion of transaction costs in the activities is 49.0%. However, the high transaction costs in Kebon Agung Sugar Mill cannot directly be concluded as inefficiency of institutions, because Ngadiredjo Sugar Mill is incurred high costs for plant, land processing, and fertilizer. This happened because Ngadiredjo Sugar Mill, besides processing sugarcane from farmers, also plants sugarcane on its own land.
Therefore, it also spends production costs in the form of land processing, planting, and fertilizer/seed, which decreased the proportion of transaction costs. Furthermore, an analysis of the proportion of costs at Kebon Agung Sugar Mill between 1999-2002 shows that the majority of costs in the activities are in the form of production costs (similar to Ngadiredjo Sugar Mill). The composition change is caused by two things: (i) on the production costs side, variables of wages/salaries (for contract labor), fuel oil, land processing, and complements costs were decreasing in 2003; and (ii) on the contrary, on the transaction costs side, variables of transport subsidies, wage/salaries, staff allowance, equipment, and special costs were increasing in 2003. The result is that the proportion of transaction costs to production costs was higher than in 2003.
Table 4.8. Percentage Comparison of Production and Transaction Costs
for Kebon Agung and Ngadiredjo Sugar Mills, 1999-2003 (%)
Kebon Agung Sugar Mill Comparison 1999 2000 2001 2002 2003
Production costs Transaction costs
55.6 44.4
51.2 48.8
57.0 43.0
56.1 43.9
38.9 61.1
Total 100.0 100.0 100.0 100.0 100.0 Ngadiredjo Sugar Mill Comparison
1999 2000 2001 2002 2003 Production costs Transaction costs
54.6 45.4
56.2 43.8
51.6 48.4
49.7 50.3
51.0 49.0
Total 100.0 100.0 100.0 100.0 100.0
Source: Own research (treated)
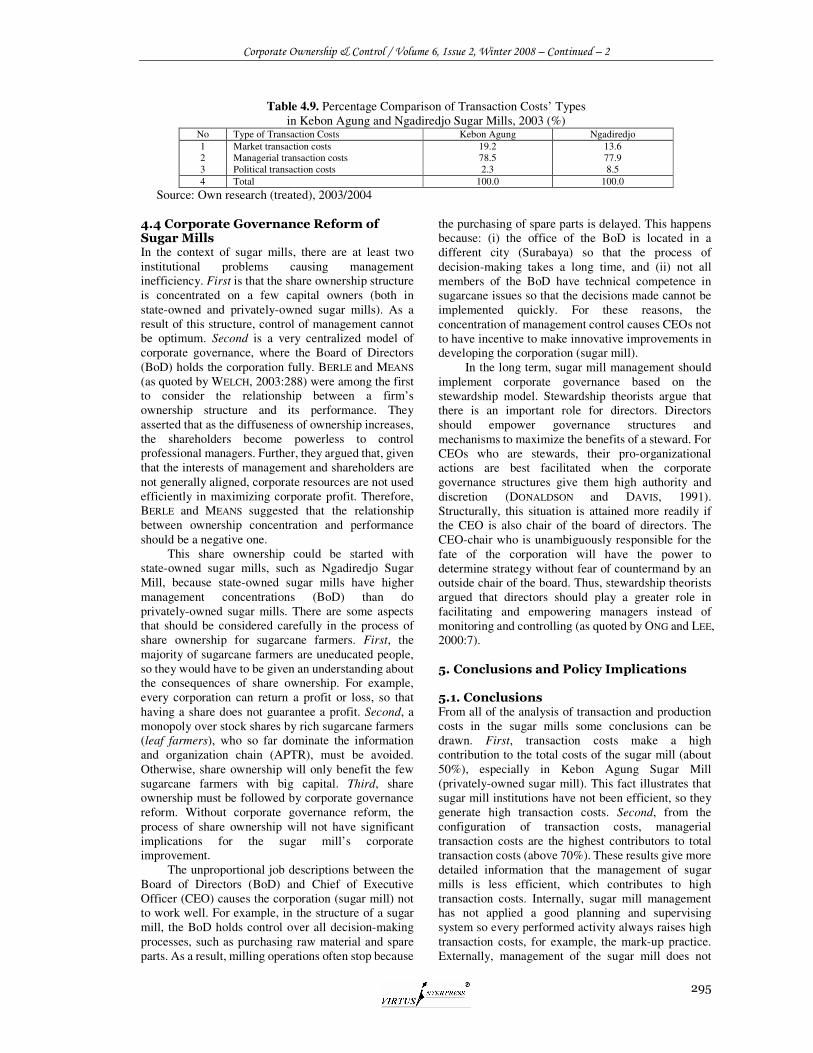
More details about the configuration of transaction costs between Kebon Agung and
Ngadiredjo Sugar Mills are presented in Table 4.9. First, both in Kebon Agung and in Ngadiredjo Sugar
Corporate Ownership & Control / Volume 6, Issue 2, Winter 2008 – Continued – 2
294
Mills, the most dominant transaction cost is managerial transaction costs. This is understandable because the managerial activities include almost all of the corporation’s main activities, such as the process of milling the sugarcane, staff salaries, and investment costs. 12 Second, market transaction costs in Kebon Agung Sugar Mill are higher than in Ngadiredjo Sugar Mill, 19.2% and 13.6%, respectively. Two alternative analyses are: (i) the considerably higher market transaction costs in Kebon Agung Sugar Mill are caused by the magnitude of activities related to other parties, especially sugarcane farmers. Kebon Agung Sugar Mill establishes cooperation with sugarcane farmers in the form of a partnership pattern, whose main purpose is to develop farmers’ sugarcane. For this partnership pattern, Kebon Agung Sugar Mill incurs considerably high costs. In addition, Kebon Agung Sugar Mill also provides high transportation subsidies to farmers in order for their sugarcane to be delivered to the sugar mill. In 2003, for example, Kebon Agung Sugar Mill allocated transportation subsidies up to Rp 5000/quintal of sugarcane, so that the total amount spent reached Rp 4.7 billion; and (ii) the internal management of Kebon Agung Sugar Mill is more efficient than Ngadiredjo Sugar Mill, which can reduce the managerial transaction costs. For example, machine and installation maintenance in Ngadiredjo Sugar Mill is Rp 2.3 billion higher than in Kebon Agung Sugar Mill. Electricity in Ngadiredjo Sugar Mill is Rp 3.5 billion higher than in Kebon Agung Sugar Mill. From this, it can be said that the internal management model in Kebon Agung Sugar Mill is more efficient than that in Ngadiredjo Sugar Mill. This happened because Ngadiredjo Sugar Mill is a state-owned enterprise managed more centrally and there is no desire to maximize its performance.
Third, the proportion of political transaction costs does not contribute significantly to total transaction costs. However, the political transaction costs of Ngadiredjo Sugar Mill are higher than in Kebon Agung Sugar Mill because of many ‘illegal’ costs activities. Unfortunately, the researcher cannot calculate other costs that are possibly spent by the sugar mills for certain purposes. For example, it is assumed that the sugar mills help the Smallholder Sugarcane Farmers Association (APTR) in delivering farmers to perform demonstrations in Jakarta (capital city of Indonesia) to encourage the government to stop sugar import or increase the import tariff. The sugar mills (especially through their directors) are also assumed to give bribes to the government to get licenses for the importing of
12 In general, management of a sugar mill is governed with a conventional model. Good corporate governance has not already been fully run; even the financial report system has not yet followed modern standard accountancy. Moreover, the supervising function is not run by the management of the sugar mill. As stated by Adig SUWANDI, corporate secretary of PTPN XI, ‘many people state that one of the causes of inability of the sugar industry based on smallholder farmers in Java is about management.’ For details, see Adig SUWANDI, Saham Petani vs Rekayasa Sosial, Sugar Observer, No. 24, 2003b, p. 3
sugar. 13 The study of DE SOTO (1989) calls these expenditures ‘non-market transaction costs,’ such as resources spent in waiting, getting permits to do business, cutting through red tape, bribing officials, and so on. These non-market transaction costs are rampant in developing and transition economies, though the size of the official transaction sector is small (WANG, 2003:6). If such information can be gained, it may be that political transaction costs are higher than indicated by this data survey which has already been taken.
Thus, the composition of transaction costs between Kebon Agung and Ngadiredjo Sugar Mills is not different, but market transaction costs in Kebon Agung Sugar Mill are relatively higher than in Ngadiredjo Sugar Mill. On this point, the conclusion that can be drawn is that the Kebon Agung Sugar Mill institution is relatively adaptive at relating to other parties, as can be seen from its structure of high market transaction costs. The high market transaction costs cannot directly be concluded as inefficient when they are useful to create certainty. In the case of transportation costs subsidies to sugarcane farmers in Kebon Agung Sugar Mill, compensation for the high transaction costs is made with the certainty that the sugar mill will get enough sugarcane. Without the transportation subsidies, sugarcane input will be uncertain, which could disturb the production process. On the other hand, the lower proportion of managerial transaction costs indicates that the internal management institutions of Kebon Agung Sugar Mill are better than those of Ngadiredjo Sugar Mill. This fact demonstrates that privately-owned enterprises contribute to improved performance of corporate management through giving more space to the CEO to make and implement strategic decisions.
13 Of course, from an interview with the chief of APTR Ngadiredjo, every sugar mill certainly gives financial aids to APTR in its working area. The financial aids are usually utilized by APTR to send farmers to participate in demonstrations or are all taken by core officials of APTR. In this category, financial aids from the sugar mill may help APTR be in the position of giving support to the sugar mill. Then, big distributors often bribe APTR to support certain aims desired by distributors, for example, the government is encouraged to withdraw the import license policy of certain distributors. One signature from APTR may have value up to Rp 5 billion, as stated by the chief of Ngadiredjo APTR. If this logic is used, then certainly sugar mills are doing something similar to get import incenses, especially state sugar mills because import licenses are only given to state sugar mills (PTPN) through SK Memperindag No. 343/2002. If this notion is true, these costs, of course, can be classified as political transaction costs.
Corporate Ownership & Control / Volume 6, Issue 2, Winter 2008 – Continued – 2
295
Table 4.9. Percentage Comparison of Transaction Costs’ Types in Kebon Agung and Ngadiredjo Sugar Mills, 2003 (%)
No Type of Transaction Costs Kebon Agung Ngadiredjo 1 2 3
Market transaction costs Managerial transaction costs Political transaction costs
19.2 78.5 2.3
13.6 77.9 8.5
4 Total 100.0 100.0
Source: Own research (treated), 2003/2004 4.4 Corporate Governance Reform of Sugar Mills In the context of sugar mills, there are at least two institutional problems causing management inefficiency. First is that the share ownership structure is concentrated on a few capital owners (both in state-owned and privately-owned sugar mills). As a result of this structure, control of management cannot be optimum. Second is a very centralized model of corporate governance, where the Board of Directors (BoD) holds the corporation fully. BERLE and MEANS
(as quoted by WELCH, 2003:288) were among the first to consider the relationship between a firm’s ownership structure and its performance. They asserted that as the diffuseness of ownership increases, the shareholders become powerless to control professional managers. Further, they argued that, given that the interests of management and shareholders are not generally aligned, corporate resources are not used efficiently in maximizing corporate profit. Therefore, BERLE and MEANS suggested that the relationship between ownership concentration and performance should be a negative one.
This share ownership could be started with state-owned sugar mills, such as Ngadiredjo Sugar Mill, because state-owned sugar mills have higher management concentrations (BoD) than do privately-owned sugar mills. There are some aspects that should be considered carefully in the process of share ownership for sugarcane farmers. First, the majority of sugarcane farmers are uneducated people, so they would have to be given an understanding about the consequences of share ownership. For example, every corporation can return a profit or loss, so that having a share does not guarantee a profit. Second, a monopoly over stock shares by rich sugarcane farmers (leaf farmers), who so far dominate the information and organization chain (APTR), must be avoided. Otherwise, share ownership will only benefit the few sugarcane farmers with big capital. Third, share ownership must be followed by corporate governance reform. Without corporate governance reform, the process of share ownership will not have significant implications for the sugar mill’s corporate improvement.
The unproportional job descriptions between the Board of Directors (BoD) and Chief of Executive Officer (CEO) causes the corporation (sugar mill) not to work well. For example, in the structure of a sugar mill, the BoD holds control over all decision-making processes, such as purchasing raw material and spare parts. As a result, milling operations often stop because
the purchasing of spare parts is delayed. This happens because: (i) the office of the BoD is located in a different city (Surabaya) so that the process of decision-making takes a long time, and (ii) not all members of the BoD have technical competence in sugarcane issues so that the decisions made cannot be implemented quickly. For these reasons, the concentration of management control causes CEOs not to have incentive to make innovative improvements in developing the corporation (sugar mill).
In the long term, sugar mill management should implement corporate governance based on the stewardship model. Stewardship theorists argue that there is an important role for directors. Directors should empower governance structures and mechanisms to maximize the benefits of a steward. For CEOs who are stewards, their pro-organizational actions are best facilitated when the corporate governance structures give them high authority and discretion (DONALDSON and DAVIS, 1991). Structurally, this situation is attained more readily if the CEO is also chair of the board of directors. The CEO-chair who is unambiguously responsible for the fate of the corporation will have the power to determine strategy without fear of countermand by an outside chair of the board. Thus, stewardship theorists argued that directors should play a greater role in facilitating and empowering managers instead of monitoring and controlling (as quoted by ONG and LEE, 2000:7).
5. Conclusions and Policy Implications 5.1. Conclusions From all of the analysis of transaction and production costs in the sugar mills some conclusions can be drawn. First, transaction costs make a high contribution to the total costs of the sugar mill (about 50%), especially in Kebon Agung Sugar Mill (privately-owned sugar mill). This fact illustrates that sugar mill institutions have not been efficient, so they generate high transaction costs. Second, from the configuration of transaction costs, managerial transaction costs are the highest contributors to total transaction costs (above 70%). These results give more detailed information that the management of sugar mills is less efficient, which contributes to high transaction costs. Internally, sugar mill management has not applied a good planning and supervising system so every performed activity always raises high transaction costs, for example, the mark-up practice. Externally, management of the sugar mill does not
Corporate Ownership & Control / Volume 6, Issue 2, Winter 2008 – Continued – 2
296
have authority to make strategic decisions, for example, investment decisions, spare parts purchasing, and goods acquisition. All activities are under the authority of the BoD (PT. RNI and PTPN X) located in Surabaya, which causes the production process to be disturbed. In other words, the centralization of decision-making causes high transaction costs for the sugar mills.
Third, market transaction costs in Kebon Agung Sugar Mill are higher than in Ngadiredjo Sugar Mill (state-owned sugar mill). Nevertheless, it cannot be concluded that the institution in Kebon Agung Sugar Mill is less efficient compared to Ngadiredjo Sugar Mill. The high market transaction costs in Kebon Agung Sugar Mill occurred because of the presence of a consistent partnership pattern and sugarcane transportation subsidies given to farmers in high amounts. The partnership pattern is done in order that farmers’ sugarcane quality increases, while the transportation subsidies are given in order that sugarcane farmers are willing to deliver their sugarcane to Kebon Agung Sugar Mill. Of course, the two activities generate high market transaction costs, besides also giving certainty to the sugar mill. 5.2. Policy Implications At the firm level, the components of managerial transaction costs are quite complicated. In addition to this, in the context of market transaction costs, sugar mills must also relate with many parties, such as sugarcane farmers, cooperatives, distributors, law institutions (notaries), banks, and so on. Sugar mills also deal with government policy adjustment (political
transaction costs) in order to operate smoothly. Regarding this research, aspects of sugar mill managerial transaction costs can be grouped into two types. First, internal managerial transaction costs are transaction costs generated from the corporation’s internal management model, for example, salary policies, facilities, maintenance, and overlapping activities. Second, external managerial transaction costs are transaction costs generated related to the hierarchy of management in decision-making. In the case of sugar mills, in general sugar mill management (Chief Executive Officer/CEO) does not have full authority to make decisions (especially for state-owned sugar mills) because all proposals must get the approval from the Board of Directors (BoD).
In the context of sugar mill’s transaction costs, the important factor that should be reformed soon is the restructuring of corporate governance and supervision aspects. From this corporate governance, the main problem is the wide authority of the BoD to plan and enforce all corporate strategic decisions; even technical activity is often done by the BoD (for example, tools purchasing). On the contrary, the CEO has almost no authority over the daily operational activities, except routine activity that has been decided by the BoD. With this condition, the rule of the game of the corporation (sugar mill) will not be efficient; for example, the process of decision-making is often late.
Furthermore, the supervision function of the BoD does not run well, mainly because their position is far from the location of the sugar mill (the location of the BoD is in Surabaya and the sugar mills are in Malang and Kediri Districts). With the long distance, of course, the process of supervision does not run well. Ultimately, these problems have potential to raise the transaction costs in the sugar mills. References 1. ALCHIANARUM, Muhamad. (2000). Kelembagaan
Petani: Pandangan Seorang Petani Tebu. Gula
Indonesia. Vol. XXV, No. 3-4, July – December: 39-41
2. BENHAM, Alexandra, and Lee BENHAM. (2000). Measuring the Cost of Exchange. In: Claude MÉNARD
(ed.). Institutions, Contracts and Organizations:
Perspectives from New Institutional Economics. Edward Elgar. UK and USA
3. COLLINS, Bruce M., and Frank J. FABOZZI. (1991). A Methodology for Measuring Transaction Costs. Financial Analysts Journal. March-April: 27-36
4. DIXIT, Avinash K. (1996). The Making of Economic
Policy: A Transaction-Cost Politics Perspective. CES and The MIT Press. Cambridge
5. FURUBOTN, Eirik, and Rudolf RICHTER. (2000). Institutions and Economic Theory: The Contribution of
the New Institutional Economics. The University of Michigan Press. Ann Arbor. USA
6. HART, Oliver. (1995). Corporate Governance: Some Theory and Implications. The Economic Journal. Vol. 105, Issue 430, May: 678-689
7. HUSODO, Siswono Yudho. (1999). Permasalahan Produksi dan Tata Niaga Gula di Akhir Abad XX. Gula
Indonesia. Vol. XXIV, No. 2, April – June: 9-14 8. KUMAR, Rajiv, and Doren CHADEE. (2002).
Competitiveness of Asian Firms: An Analytical
Framework. ERD Working Paper Series No. 4, Asian Development Bank. February
9. MORIS, Jon, and James COPESTAKE. (1993). Qualitative Enquiry for Rural Development. Intermediate Technology Publications on behalf of the Overseas Development Institute. London
10. NAKCHAROEN, Prasert, and K.J. (Jamies) ROGERS. (2004). Activity-Based Costing Approach to
Equipment Selection Problem for Flexible
Manufacturing Systems. Internet Source: http://arri.uta.edu/eif/prasertierc.pdf (October 7, 2004)
11. ONG, Huat Chin, and Soo Hoo LEE. (2000). Board Functions and Firm Performance: A Review and Directions for Future Research. Journal of
Comparative International Management. Vol. 3, No. 1, June: 1-14
12. PASARIBU, Bomer. (1996). Menampilkan Seutuhnya Wajah Pekerja Indonesia. Prisma. No. 7, Year XXV, July
13. POLSKI, Margareth M. (2001). Measuring Transaction
Cost and Institutional Change in U.S. Commercial
Banking Industry. Paper presented for the Annual Conference of the International Society for New Institutional Economics 2000 in Tübingen - Germany. Internet Website: http://www.spea.indiana.edu/ ids/pdfholder/ ISSN-01-3.pdf (Jan. 23, 2003)
14. PRABOWO, Dibyo. (1998). Antisipasi Industri Gula Menghadapi Ketidakpastian Ekonomi. Gula
Corporate Ownership & Control / Volume 6, Issue 2, Winter 2008 – Continued – 2
297
Indonesia. Vol. XXIII, No. 4, October - December: 8-17
15. SHLEIFER, Andrei. (1998). State versus Private Ownership. The American Economic Review. Vol. 12, Issue 4, Autumn: 133-150
16. STRASSMANN, Paul A. (2002). Measuring Information
Productivity. Goddard Information Science and Technology Colloquium. Internet Website: http://isandtcolloq.gsfc.nasa.gov/fall2002/presentations/strassmann.ppt (Jan. 23, 2003)
17. SUSILA, Wayan R. (2002). Kebijakan Pergulaan di
Beberapa Negara Produsen dan Alternatif Kebijakan
Pergulaan Nasional. Proceeding of P3GI Technical Meeting. P3GI. Pasuruan
18. SUWANDI, Adig. (2003). Saham Petani vs Rekayasa Sosial. Sugar Observer. No. 24, October
19. UNDP. (2000). Aid Transaction Costs in Viet Nam. Department for International Development. Ha Noi
20. WANG, Ning. (2003). Measuring Transaction Costs:
An Incomplete Survey. Paper presented at the Conference on Transaction Costs organized by the Ronald Coase Institutions. Chicago. USA
21. WELCH, Emma. (2003). The Relationship Between Ownership Structure and Performance in Listed Australian Companies. Australian Journal of
Management. Vol. 28, No. 3, December: 287-305 22. WILLIAMSON, Oliver E. (1981). The Economics of
Organization: The Transaction Cost Approach. American Journal of Sociology. Vol. 87, Issue 3, Nov: 548-577
23. ZHANG, Yaoqi. (2000). Costs of Plants vs. Costs of Markets: Reforms in China’s State-owned Forest Management. Development Policy Review. Vol. 18: 285-306


