Embed Size (px)
Citation preview
TRADE-OFFS OF LONGER PRODUCT
LIFETIMES
WHEN IS IT TIME TO REUSE A PRODUCT OR RECYCLE ITS
MATERIALS?
Number of words: 19,309
Emilie Deram Student number: 01902712
Academic promotor: Prof. dr. ir. Jo Dewulf
Non-academic supervisor: John Wante (OVAM)
Tutors: Gustavo Moraga,
Dr. ir. Sophie Huysveld
Master’s Dissertation submitted to Ghent University in partial fulfilment of the requirements for the
degree of International Master of Science in Sustainable and Innovative Natural Resource Management
Academic year: 2020 – 2021


Deze pagina is niet beschikbaar omdat ze persoonsgegevens bevat.Universiteitsbibliotheek Gent, 2022.
This page is not available because it contains personal information.Ghent University, Library, 2022.

Deze pagina is niet beschikbaar omdat ze persoonsgegevens bevat.Universiteitsbibliotheek Gent, 2022.
This page is not available because it contains personal information.Ghent University, Library, 2022.
iii
Acknowledgements
This project has been one of the hardest endeavours I have attempted in my life and
performing during the COVID-19 pandemic has been a struggle. I am extremely happy that it
has been finished and am proud of the results.
I would like to start by thanking Prof. Jo Dewulf for his insight and comments that were always
on the mark. As I struggled to find a direction, his contribution ensured a well-rounded topic.
Secondly, I would like to thank my tutors Sophie and Gustavo for their continuous guidance,
patience, and kindness. They are the reason this thesis is finished and somewhat coherent. I
am sorry that we were not able to work in person at the university as I would have liked to
have learned even more from them that way. I am also sorry that the report had to be delayed
and that Sophie could not participate in the last few months, but I am very excited for her and
wish her the best with her family.
I would like to thank Torsten Hummer for sharing some of his research with me and attempting
to help with data collection.
Thank you to my friends, Daniela, Ioanna, and Margot for always bringing laughter even during
moments when we are all having panic attacks. I would not have been able to complete this
degree without them. Thank you to Nathalie who, even though she lives 10,000 km away,
always brings a smile to my face.
I am thankful to my parents and siblings for always believing in me and continuously checking
in, and for giving me hope about the future. Most importantly, I am thankful to my baby niece,
whose videos made every day brighter. I cannot wait to meet her once the pandemic is over.
Last, but not least, I would like to thank my partner Jeremy for his kindness, patience, love,
and for powering through all the times I distracted him from his work. He has been my rock
through one of the hardest years of my life and I could not, and did not want to, do this without
him. I cannot wait to try and help him as he tackles his own master’s dissertation.
Thank you all, I am very excited for the next step of my life.
iv
Abstract
Circular economy principles push for materials to stay within the value chain for as long as
possible. However, electrical and electronic equipment must be evaluated specifically as their
technology improvements and relatively new recycling techniques make them a complex
stream. The environmental impacts of different end-of-life treatments is not as straightforward
as other products. Their heavy reliance on non-renewable resources and specialty metals
makes it crucial for them to be studied from a criticality perspective as well. To this end, the
environmental and criticality impacts of extending the lifetime of a laptop compared to
discarding and replacing it with a newer model are studied. A life cycle analysis of the access
to a laptop by the average consumer is performed following ISO standards 14040 and 14044.
Three scenarios are identified based on the Belgian collection system: preparing for reuse and
extending the lifetime of the laptop, recycling and replacing it, or incinerating and replacing it.
To evaluate the environmental effects, six impact categories are chosen. As for the criticality
impact, a novel method using European Union data for critical raw materials, the criticality-
based impact assessment method, is employed. Results show that extending the lifetime is
the most recommended option in all impacts studied mainly due to the high embedded impacts
during production. The only repair type that causes a change in results is if the printed circuit
board must be replaced. As well, the results were greatly influenced by the use of fossil fuels
throughout the life cycle and efforts must be made toward reducing their consumption,
especially in electricity production.
v
Table of Contents
Chapter 1 – Literature review ................................................................................................ 1
1.1. Background ................................................................................................................ 1
1.1.1. Introduction to sustainability ................................................................................. 1
1.1.2. The circular economy ........................................................................................... 3
1.1.3. The case of electrical and electronic equipment ................................................... 5
1.2. Environmental sustainability of electrical and electronic equipment ............................ 7
1.2.1. Resource depletion and criticality ......................................................................... 7
1.2.2. Sustainable electricity production ......................................................................... 7
1.3. Assessing environmental sustainability ....................................................................... 8
1.3.1. Life Cycle Assessment ......................................................................................... 8
1.3.2. Material Flow Analysis........................................................................................ 11
1.4. Review of environmental sustainability of EEE ......................................................... 13
1.4.1. Review of assessments ...................................................................................... 13
1.4.2. Criticality-based impact assessment method ...................................................... 14
Chapter 2 – Objective ......................................................................................................... 16
Chapter 3 – Materials and methods .................................................................................... 17
3.1. Goal and scope definition ......................................................................................... 17
3.1.1. Goal definition .................................................................................................... 17
3.1.2. Scope definition.................................................................................................. 17
3.2. Life Cycle Inventory .................................................................................................. 24
3.2.1. Laptop characteristics ........................................................................................ 24
3.2.2. Life cycle processes ........................................................................................... 26
3.3. Life Cycle Impact Assessment .................................................................................. 28
3.3.1. Impact categories ............................................................................................... 28
3.3.2. Criticality assessment......................................................................................... 29
Chapter 4 – Results and discussion .................................................................................... 30
4.1. Inventory analysis results ......................................................................................... 30
4.1.1. Weight ................................................................................................................ 30
vi
4.1.2. Energy use ......................................................................................................... 31
4.2. Life Cycle Assessment results .................................................................................. 32
4.2.1. Cumulative Exergy Extraction from the Natural Environment ............................. 33
4.2.2. Abiotic Depletion Potential ................................................................................. 36
4.2.3. Resource Cost ................................................................................................... 38
4.2.4. Global Warming Potential ................................................................................... 39
4.2.5. Terrestrial Ecotoxicity ......................................................................................... 40
4.2.6. Cumulative Energy Demand............................................................................... 40
4.2.7. Criticality-based Impact Assessment Method ..................................................... 41
4.2.8. Compilation of the impacts ................................................................................. 43
4.3. Scenario and sensitivity analyses ............................................................................. 44
4.3.1. Duration of extended lifetime .............................................................................. 44
4.3.2. Repair importance .............................................................................................. 45
4.3.3. Supply and disposal allocation basis .................................................................. 46
4.3.4. CRM sensitivity .................................................................................................. 48
4.4. Limitations and recommendations ............................................................................ 50
Chapter 5 – Conclusion and outlook ................................................................................... 52
5.1. Conclusion ................................................................................................................ 52
5.2. Outlook ..................................................................................................................... 53
References…………….. ...................................................................................................... 54
Appendix 1………. .............................................................................................................. 60
Appendix 2……… ............................................................................................................... 61
Appendix 3……… ............................................................................................................... 66
Appendix 4……… ............................................................................................................... 72
Appendix 5……… ............................................................................................................... 74
Appendix 6……… ............................................................................................................... 76
vii
List of figures
Figure 1. Cover image of the magazine Environmental Action: April 22 (Robertson, 2012). .. 1
Figure 2. The linear economy model, adapted from Wautelet (2018). ................................... 3
Figure 3. The circular economy model, adapted from EMF (2019). ....................................... 4
Figure 4. Stages of LCA and its potential applications (ISO, 2006a) ..................................... 9
Figure 5. Example of an acidification impact category (ISO, 2006b) .................................... 11
Figure 6. MFA procedure (Brunner & Rechberger, 2016). ................................................... 12
Figure 7. Time horizon definition of the environmental assessment of a laptop (the grayed-out
area is not in the scope as it remains the same for all scenarios), adapted from Hischier &
Böni (2021). ........................................................................................................................ 19
Figure 8. Schematic of the scenarios and system boundaries, as defined in the scope. ...... 23
Figure 9. Comparison of weight to release date for 14” laptops from 1999 to 2010, adapted
from Babbitt et al. (2020). .................................................................................................... 25
Figure 10. Evolution of weight of category 1 and 14” screened laptops over time, adapted from
ENERGY STAR (2020a). .................................................................................................... 30
Figure 11. Evolution of TEC of category 1 and 14” screened laptops over time, adapted from
ENERGY STAR (2020a). .................................................................................................... 31
Figure 12. Relationship between TEC and weight of category 1 and 14” screened laptops,
adapted from ENERGY STAR (2020a). .............................................................................. 32
Figure 13. Comparison of the results of Cumulative Exergy Extraction from the Natural
Environment for a repair and reuse, a recycle and replace, and an incinerate and replace
scenario of an average 14” laptop. ...................................................................................... 33
Figure 14. Distribution of the CEENE impact for the supply of a laptop. .............................. 34
Figure 15. Distribution of CEENE impacts per category. ..................................................... 35
Figure 16. Comparison of the results of Abiotic Depletion Potential of elements for a repair
and reuse, a recycle and replace, and an incinerate and replace scenario of an average 14”
laptop. ................................................................................................................................. 36
Figure 17. Comparison of the results of Abiotic Depletion Potential of fossil fuels for a repair
and reuse, a recycle and replace, and an incinerate and replace scenario of an average 14”
laptop. ................................................................................................................................. 37
Figure 18. Comparison of the results of Resource Cost for a repair and reuse, a recycle and
replace, and an incinerate and replace scenario of an average 14” laptop. ......................... 38
Figure 19. Distribution of Resource Cost damage for the three scenarios ........................... 38
Figure 20. Comparison of the results of Global Warming Potential for a repair and reuse, a
recycle and replace, and an incinerate and replace scenario of an average 14” laptop. ...... 39
viii
Figure 21. Comparison of the results of Terrestrial Ecotoxicity for a repair and reuse, a recycle
and replace, and an incinerate and replace scenario of an average 14” laptop. .................. 40
Figure 23. Comparison of the results of Cumulative Energy Demand for a repair and reuse, a
recycle and replace, and an incinerate and replace scenario for an average 14” laptop. ..... 41
Figure 24. Comparison of the results of the Criticality-based Impact Assessment Method for a
repair and reuse, a recycle and replace, and an incinerate and replace scenario for an average
14” laptop. ........................................................................................................................... 41
Figure 25. Distribution of the CIAM impact of supply by different resources. ....................... 42
Figure 26. Minimum amount of time the first laptop must be used after repair in scenario 1 for
the impacts to be lower than scenario 2. ............................................................................. 44
Figure 27. Comparison of CEENE, ADPel, and CIAM impacts for the scenario analysis of
allocation basis. .................................................................................................................. 47
Figure 28. Changes in Supply Risk and Economic Importance of bauxite since 2011 and
consequent criticality factor, adapted from Blengini et al. (2020). ........................................ 49
Figure 29. Sensitivity analysis of CIAM by changing the future criticality of bauxite. ............ 50
Figure A.1. Uncertainty analysis for criticality scores of Critical Raw Materials. ................... 76
ix
List of tables
Table 1. Targets of the responsible consumption and production goal, SDG 12 (UN, 2015). 5
Table 2. Characteristics of existing EEE assessments ........................................................ 15
Table 3. Composition of an average laptop, adapted from Babbitt et al. (2020)................... 26
Table 4. Quantity of materials and components found in an average 14” laptop. ................. 31
Table 5. Comparison of the impact of supply and of repair for one laptop. .......................... 45
Table 6. Comparison of the impact of supply and of maximum allowed repair for one laptop.
........................................................................................................................................... 46
Table A.1. Example of laptop energy use, adapted from ENERGY STAR (2020b). ............. 60
Table A.2. List of studied laptops. ....................................................................................... 61
Table A.3. Conversion list of elementary flow to Critical Raw Material. ............................... 67
Table A.4. Impacts per life cycle stage.. .............................................................................. 72
Table A.5. Amount of time required for reuse to be better than recycle, for each category .. 73
Table A.6. Comparison of allowed repair for reuse to be smaller than recycle to scope repair.
........................................................................................................................................... 74
Table A.7. Comparison of different repair scenarios. ........................................................... 75
x
List of abbreviations
ADP (el or ff) Abiotic Depletion Potential (elements or fossil fuels)
BOA Bill of attributes
CED Cumulative Energy Demand
CEENE Cumulative Exergy Extraction from the Natural Environment
CIAM Criticality-based impact assessment method
CML Centrum voor Milieuwetenschappen
CRM Critical Raw Materials
EEE Electrical and electronic equipment
EI Economic importance
EoL End-of-life
EU European Union
GHG Greenhouse gases
GWP Global Warming Potential
ICT Information and Communication Technology
IEA International Energy Agency
ILCD International Reference Life Cycle Data System
LCA Life Cycle Assessment
LCI Life Cycle Inventory
LCIA Life Cycle Impact Assessment
MFA Material Flow Analysis
PEF Product Environmental Footprint
PEFCR Product Environmental Footprint Category Rules
RC Resource Cost
SDG Sustainable Development Goals
SR Supply risk
TE Terrestrial Ecotoxicity
TEC Typical Energy Consumption
WEEE Waste electrical and electronic equipment
Chapter 1 – Literature review 1.1. Background
1 | Page
Chapter 1 – Literature review
1.1. Background
1.1.1. Introduction to sustainability
1.1.1.1 A bit of history
The modern environmental movement is believed to have been brought to the foreground in
the 1960s and 1970s, coming into focus with the 1962 book Silent Spring by Rachel Carson.
The book made many aware of how close they were to pollution and connected it to humanity’s
innate fear of poisons (Geary, 2020; Weyler, 2018). Though environmental awareness seems
to be a part of humanity since much before then (Weyler, 2018), the 1970s saw the
development of various discussions for environmental conservation. The concept of the
Spaceship Earth emerged in 1969 with Buckminster Fuller, and the report the Limits to Growth
in 1972 gave an economic perspective of the issues. As well, Greenpeace was established in
1969 (Weyler, 2018), and the United Nations Environment Program was inaugurated in 1972
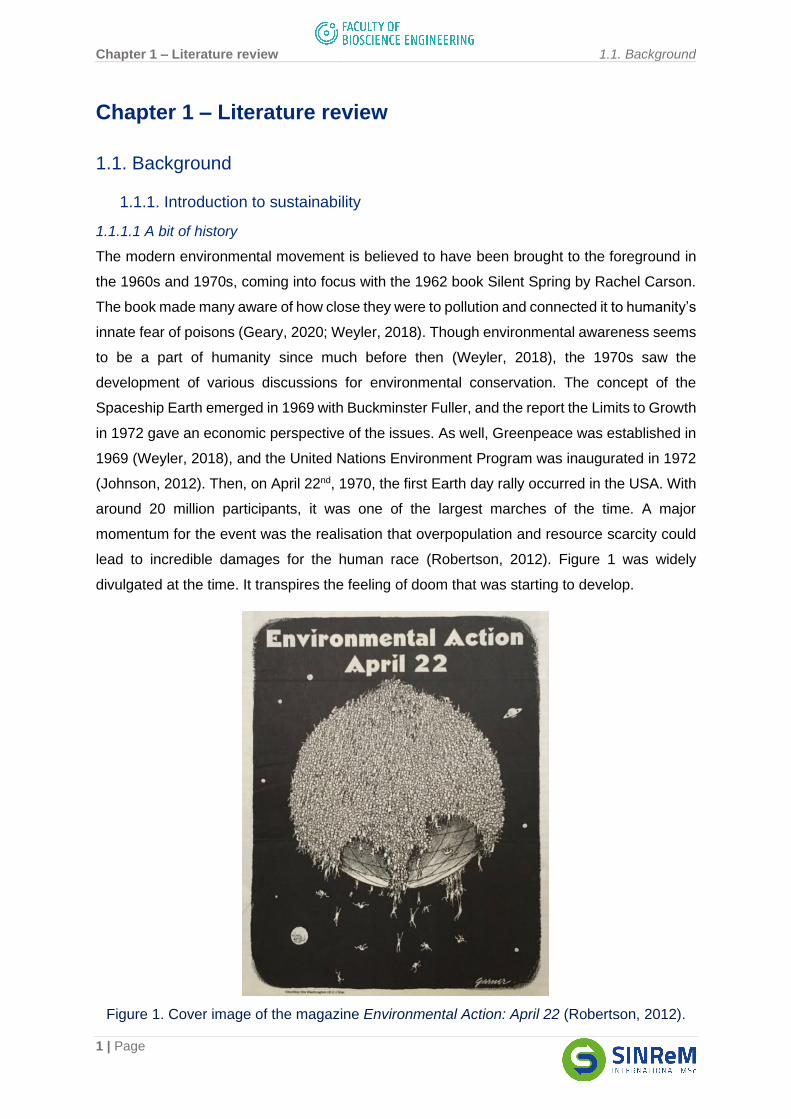
(Johnson, 2012). Then, on April 22nd, 1970, the first Earth day rally occurred in the USA. With
around 20 million participants, it was one of the largest marches of the time. A major
momentum for the event was the realisation that overpopulation and resource scarcity could
lead to incredible damages for the human race (Robertson, 2012). Figure 1 was widely
divulgated at the time. It transpires the feeling of doom that was starting to develop.
Figure 1. Cover image of the magazine Environmental Action: April 22 (Robertson, 2012).
Chapter 1 – Literature review 1.1. Background
2 | Page
1.1.1.2 Definition of sustainability
Since then, the knowledge that some of the planet’s resources are finite has spread and,
coupled with environmental issues such as climate change, there is a growing demand for
“sustainable” practices. The word “sustainable” in the Cambridge dictionary means to be “able
to continue for a period of time”, or, from an environmental point of view, something that is
“causing little or no damage to the environment and therefore able to continue for a long time”
(Cambridge University Press, 2008b). More specifically, a widely accepted definition of
sustainable development is by the Brundtland commission in 1987: “development that meets
the needs of the present without compromising the ability of future generations to meet their
own needs” (Brundtland, 1987).
As it may be complicated to define the exact needs of the current and future generations, the
Triple Bottom Line concept by John Elkington helps to structure those needs. It describes
sustainable businesses as those that respect three types of sustainability: economic, social,
and environmental. These are sometimes referred to as the three pillars of sustainability: profit,
people, and planet (Conway, 2018).
1.1.1.3 Definition of resource
Resources can be defined as “natural substances such as water and wood which are valuable
in supporting life” (Cambridge University Press, 2008a). From a more anthropocentric point-
of-view, they’ve also been defined as “elements that are extractable for human use and that
have a functional value to society” (Swart et al., 2015). According to Swart et al. (2015), they
can be either renewable or non-renewable depending on their replenishing time in nature.
They are considered non-renewable if they cannot replenish at the same rate as they are
consumed. Resources can also be biotic or abiotic, depending on their biological or non-
biological origin. As well, they can be funds, flows, or stocks. Because they are extracted from
nature by human activities, it is important to do so sustainably. If not, there can be
environmental damages or reduced availability of this resource in the future, otherwise known
as resource scarcity (Swart et al., 2015). For example, a non-renewable abiotic stock resource
can never be replenished and, if it is continuously extracted, it will ultimately be depleted.
When resources are extracted from nature, they are transformed into primary raw materials
or primary energy carriers by the primary production sector. Then, the manufacturing sector
may use these to produce goods and services (Dewulf et al., 2015). On the other side of the
supply chain, recyclers and waste management facilities can extract valuable materials from
waste and convert them to post-consumer secondary raw materials. Secondary raw materials
can also be produced during manufacturing and are then referred to as post-industrial (Moraga
et al., 2021).
Chapter 1 – Literature review 1.1. Background
3 | Page
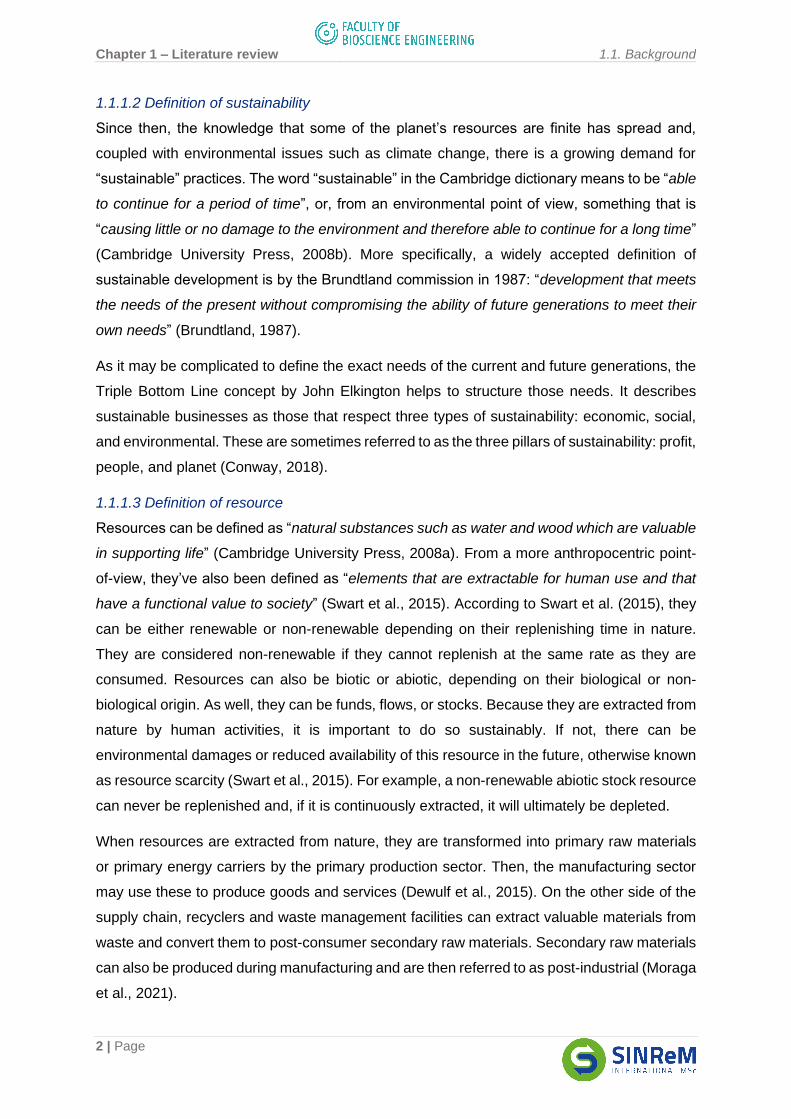
1.1.1.4 Economic setting
The current economic model is based on the “take, make, use, dispose” method (European
Commission (EC), 2020), where a product is produced, used and then thrown away and
replaced. By doing this, the materials embedded in the components are ignored. It is known
as the “linear economy” model and is represented in Figure 2.
Figure 2. The linear economy model, adapted from Wautelet (2018).
At each step of Figure 2, raw materials and energy are consumed, and waste and emissions
are produced. This model could work under the assumption that there are infinite resources
but is unsustainable under finite resources. As well, environmental issues, such as the
emissions of greenhouse gases (GHG), are associated with rising global temperatures, and
there are risks associated to large quantities of waste that cannot be absorbed and degraded
by the environment. Therefore, perpetuating the linear economy poses many threats to life.
This is accentuated by the growing population and the increase of people going above the
poverty line. It is expected that these cause increasing consumption and so that, by 2050, the
global population would require three times the amount of resources that the planet can
provide (EC, 2020).
1.1.2. The circular economy
Walter Stahel developed the “performance economy” notion in 1976 with the aim to reduce
resource extraction and waste production while maintaining economic competitiveness. In
parallel, the “Cradle to Cradle” framework was developed where the life cycle of a product
ends where another starts, eliminating the notion of waste. Along with other concepts, such
as the “Industrial Ecology”, the idea of a “circular economy” set its roots into modern economic
systems (Ellen Macarthur Foundation (EMF), n.d.). The circular economy model is viewed as
a way of practically implementing sustainable development into businesses though in practice
it is mainly about economic success and maintaining environmental value. It can be defined
as “an economic system that replaces the ‘end-of-life’ concept with reducing, alternatively
reusing, recycling and recovering materials in production/distribution and consumption
processes” (Kirchher et al., 2017). It has three major goals: to design out pollution and waste,
to maintain products and materials in use, and to regenerate natural cycles. Hence, it is
encouraged to close the cycle by mirroring natural ecosystems in which a species’ waste is
another’s resource. Material cycles can be closed by human activity: gathering waste and
turning it into raw materials (EMF, 2019). Figure 3 shows a schematic representation of the
concept.
Chapter 1 – Literature review 1.1. Background
4 | Page
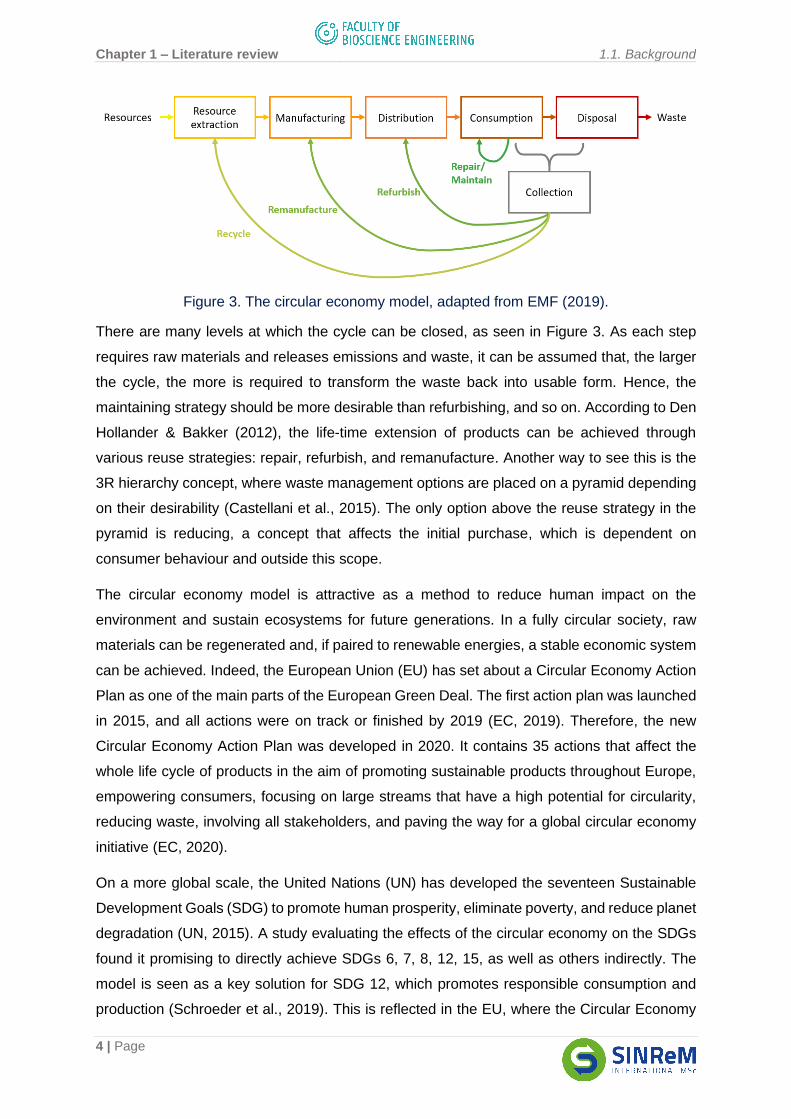
Figure 3. The circular economy model, adapted from EMF (2019).
There are many levels at which the cycle can be closed, as seen in Figure 3. As each step
requires raw materials and releases emissions and waste, it can be assumed that, the larger
the cycle, the more is required to transform the waste back into usable form. Hence, the
maintaining strategy should be more desirable than refurbishing, and so on. According to Den
Hollander & Bakker (2012), the life-time extension of products can be achieved through
various reuse strategies: repair, refurbish, and remanufacture. Another way to see this is the
3R hierarchy concept, where waste management options are placed on a pyramid depending
on their desirability (Castellani et al., 2015). The only option above the reuse strategy in the
pyramid is reducing, a concept that affects the initial purchase, which is dependent on
consumer behaviour and outside this scope.
The circular economy model is attractive as a method to reduce human impact on the
environment and sustain ecosystems for future generations. In a fully circular society, raw
materials can be regenerated and, if paired to renewable energies, a stable economic system
can be achieved. Indeed, the European Union (EU) has set about a Circular Economy Action
Plan as one of the main parts of the European Green Deal. The first action plan was launched
in 2015, and all actions were on track or finished by 2019 (EC, 2019). Therefore, the new
Circular Economy Action Plan was developed in 2020. It contains 35 actions that affect the
whole life cycle of products in the aim of promoting sustainable products throughout Europe,
empowering consumers, focusing on large streams that have a high potential for circularity,
reducing waste, involving all stakeholders, and paving the way for a global circular economy
initiative (EC, 2020).
On a more global scale, the United Nations (UN) has developed the seventeen Sustainable
Development Goals (SDG) to promote human prosperity, eliminate poverty, and reduce planet
degradation (UN, 2015). A study evaluating the effects of the circular economy on the SDGs
found it promising to directly achieve SDGs 6, 7, 8, 12, 15, as well as others indirectly. The
model is seen as a key solution for SDG 12, which promotes responsible consumption and
production (Schroeder et al., 2019). This is reflected in the EU, where the Circular Economy
Chapter 1 – Literature review 1.1. Background
5 | Page
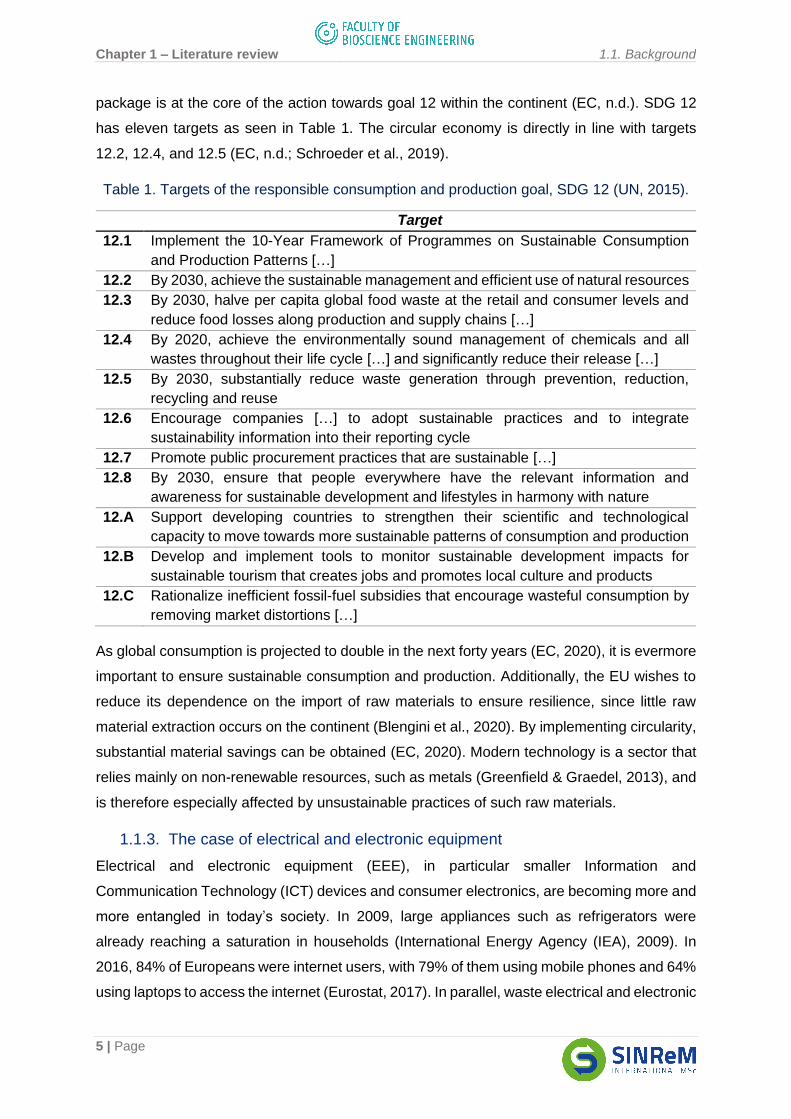
package is at the core of the action towards goal 12 within the continent (EC, n.d.). SDG 12
has eleven targets as seen in Table 1. The circular economy is directly in line with targets
12.2, 12.4, and 12.5 (EC, n.d.; Schroeder et al., 2019).
Table 1. Targets of the responsible consumption and production goal, SDG 12 (UN, 2015).
Target
12.1 Implement the 10-Year Framework of Programmes on Sustainable Consumption
and Production Patterns […]
12.2 By 2030, achieve the sustainable management and efficient use of natural resources
12.3 By 2030, halve per capita global food waste at the retail and consumer levels and
reduce food losses along production and supply chains […]
12.4 By 2020, achieve the environmentally sound management of chemicals and all
wastes throughout their life cycle […] and significantly reduce their release […]
12.5 By 2030, substantially reduce waste generation through prevention, reduction,
recycling and reuse
12.6 Encourage companies […] to adopt sustainable practices and to integrate
sustainability information into their reporting cycle
12.7 Promote public procurement practices that are sustainable […]
12.8 By 2030, ensure that people everywhere have the relevant information and
awareness for sustainable development and lifestyles in harmony with nature
12.A Support developing countries to strengthen their scientific and technological
capacity to move towards more sustainable patterns of consumption and production
12.B Develop and implement tools to monitor sustainable development impacts for
sustainable tourism that creates jobs and promotes local culture and products
12.C Rationalize inefficient fossil-fuel subsidies that encourage wasteful consumption by
removing market distortions […]
As global consumption is projected to double in the next forty years (EC, 2020), it is evermore
important to ensure sustainable consumption and production. Additionally, the EU wishes to
reduce its dependence on the import of raw materials to ensure resilience, since little raw
material extraction occurs on the continent (Blengini et al., 2020). By implementing circularity,
substantial material savings can be obtained (EC, 2020). Modern technology is a sector that
relies mainly on non-renewable resources, such as metals (Greenfield & Graedel, 2013), and
is therefore especially affected by unsustainable practices of such raw materials.
1.1.3. The case of electrical and electronic equipment
Electrical and electronic equipment (EEE), in particular smaller Information and
Communication Technology (ICT) devices and consumer electronics, are becoming more and
more entangled in today’s society. In 2009, large appliances such as refrigerators were
already reaching a saturation in households (International Energy Agency (IEA), 2009). In
2016, 84% of Europeans were internet users, with 79% of them using mobile phones and 64%
using laptops to access the internet (Eurostat, 2017). In parallel, waste electrical and electronic
Chapter 1 – Literature review 1.1. Background
6 | Page
equipment (WEEE) is one of the fastest growing waste streams in the EU while less than 40%
of it is recycled. This is why the European Commission has identified electronics and ICT as
one of its key product chains for the implementation of the circular economy (EC, 2020).
The Circular Electronics Initiative was then developed and its main goal is to promote longer
product lifetimes through greener design, and improved repair and take-back systems, among
others (EC, 2020). It seems straightforward, when looking at Figure 3, that repair and reuse
are more sustainable than recycling, as they involve less steps. The circular economy is also
known to aim for the extension of product life cycles (Circular Economy: Definition, Importance
and Benefits, 2015). However, it is a bit more complex for the case of electronics.
Indeed, technology is continuously progressing, and the energy efficiency of EEE keeps
improving. A 2009 report by the International Energy Agency (IEA) found that the energy
consumption per unit of large appliances dropped in the beginning of the twenty first century,
in part due to policies in developed countries (IEA, 2009). From the 1990s to the 2000s,
refrigerators evolved to consume about half as much electricity per year as their predecessors.
It was then recommended to replace older models with newer more performant ones (Kim et
al., 2006). Additionally, pushing for reuse can slow the progress towards newer, more efficient
technology by reducing investments and, if old equipment is sent to lower-income areas for
reuse, it can ultimately lead to loss in materials due to incorrect disposal at the end of its
second life (Van Eygen et al., 2016).
On the other hand, electricity production is becoming more and more green, with Europe
seeing in 2020 for the first time the production of energy from renewables surpassing the one
from petroleum products (Agora Energiewende & Ember, 2021). Furthermore, modern
technology, as it gets more complex, requires a wide variety of elements for specialised
functions. This means that it is dependent on a large section of the periodic table (Graedel et
al., 2015a). As appliances get smarter and devices get smaller but more performant, complex
combinations of elements are used. This complicates the production of new products but also
their recyclability as materials are harder to separate (Puca et al., 2017; Reuter et al., 2013).
A study by Ciacci et al. (2015) found that, compared to other sectors of metal usage,
electronics do not tend to lose material during use but that lack of recyclability due to small
quantities within devices lead to large losses of materials at end-of-life (EoL).
There are many terms and classifications for EEE. This report focuses on consumer EEE, in
other words, household and personal equipment only. Of those, Recupel, the Belgian
association responsible for collecting and recycling WEEE identifies five streams: large
household appliances (LHA), cooling and freezing appliances (C&F), small household
appliances including ICT (SHA), screens, and lamps (Deloitte, 2018). The EU WEEE
Chapter 1 – Literature review 1.2. Environmental sustainability of electrical and electronic
equipment
7 | Page
Directives 2012/19/EU has a similar classification though separate ICT from small equipment
and consider it the sixth stream of WEEE (Purchase et al., 2020).
1.2. Environmental sustainability of electrical and electronic equipment
1.2.1. Resource depletion and criticality
The electronics sector relies heavily on non-renewable resources. Indeed, EEE often contains
valuable and specialty metals, such as gold and rare earth elements. As population grows and
the decline in poverty allows for higher purchasing power, more consumption is expected
worldwide (EC, 2020). Parallel to this, ore grades for base and precious metals have declined
in the last century (Schaeffer et al., 2018). On the other hand, since EEE has such a complex
mix of elements, WEEE streams often contain higher grades than that found in ores and may
be an opportunity for the extraction of “secondary” resources (Schaeffer et al., 2018).
As modern society becomes more and more dependent on advanced technology, primary
materials are needed in products that bring benefits to society and for many industries to
survive. The economic importance of certain materials, paired with the potential risk in supply,
are factors that determine how critical said material is, as defined by the European
Commission (Blengini et al., 2020). A Relative Supply Risk can be found by considering the
concentration of the material in the Earth’s crust, the distribution of the reserves, the
concentration of production, the recycling rate and the geopolitical risks (Purchase et al.,
2020). By combining supply risk to the economic importance within Europe, the EU has
identified, as of 2020, 30 Critical Raw Materials (CRM) (Blengini et al., 2020).
Usually, when there is supply risk of a certain raw material, a manufacturer will attempt to
substitute it with materials with similar properties. However, as technology gets more
sophisticated and uses more elements of the periodic table, it becomes difficult to find potential
substitutes. Indeed, a study found that about 20% of the metals analysed did not have
adequate or any possible substitutes (Graedel et al., 2015b). Using substitutes also comes
with a risk of transferring the issue to another element that may also be scarce, instead of
solving the problem.
1.2.2. Sustainable electricity production
Another major consideration when evaluating the sustainability of EEE is the source of
electricity during the whole life cycle. In contrast to other goods, EEE do not only require
energy during the production, distribution, and disposal phases, they also consume electricity
during the use phase. And so, their environmental impacts continuously increase throughout
their lifetime.
Chapter 1 – Literature review 1.3. Assessing environmental sustainability
8 | Page
With the aforementioned changes in energy efficiency with improved technologies, it can be
expected that the impact during the lifetime will decrease with newer models. This is not
always the case because some, such as computers, also see an increase in processing power
and may end up consuming the same amount of electricity, or even more, as time goes on
(André et al., 2019). As well, newer technologies may require less known and optimised
production processes with higher costs and environmental impacts (Thomassen et al., 2020).
In truth, it is not the electricity usage by EEE that directly causes environmental impacts but
rather the production and distribution of the energy. Therefore, the way in which this it is
processed is important. Indeed, as energy production becomes less dependent on fossil fuels
and includes a higher share of renewables, the impacts per unit of electricity decrease. This
evolution will affect the preferred disposal method of EEE in the opposite way as energy
efficiency improvements do. This is true because, if electricity use is less harmful, reuse will
tend to be preferred while, if newer models are more efficient, recycling and replacing should
be preferred. It is then important for the relationship between the two and how their
progression changes which EoL strategy is most beneficial from an environmental standpoint
to be better understood.
1.3. Assessing environmental sustainability
1.3.1. Life Cycle Assessment
A widely used method for environmental assessments is the Life Cycle Assessment (LCA),
which can evaluate the entire life cycle of a good or service. It is recognised worldwide and
has great adaptability to any goods or service. However, this also means that there are many
ways to perform one and they may not be comparable. Hence, many guidelines have been
developed. On the European level, the International Reference Life Cycle Data System (ILCD)
Handbook was developed first and followed by the Product Environmental Footprint (PEF)
method (EC, 2010, EC, 2012). The guidelines are continuously studied and improved and PEF
was adjusted in 2018 (Zampori & Pant, 2019). It is accompanied by the PEF Category Rules
(PEFCR) guidelines which help with assumptions to ensure comparability of studies (EC,
2018). On the global level, representants of 23 different countries developed guidelines for
data gathering for LCA (Sonnemann et al., 2011).
LCA has been standardised under ISO standards 14040 and 14044, which set a systematic
methodological framework applicable for all products, which includes any kind of goods and
services (Finkbeiner et al., 2006; International Organization for Standardization (ISO), 2006a).
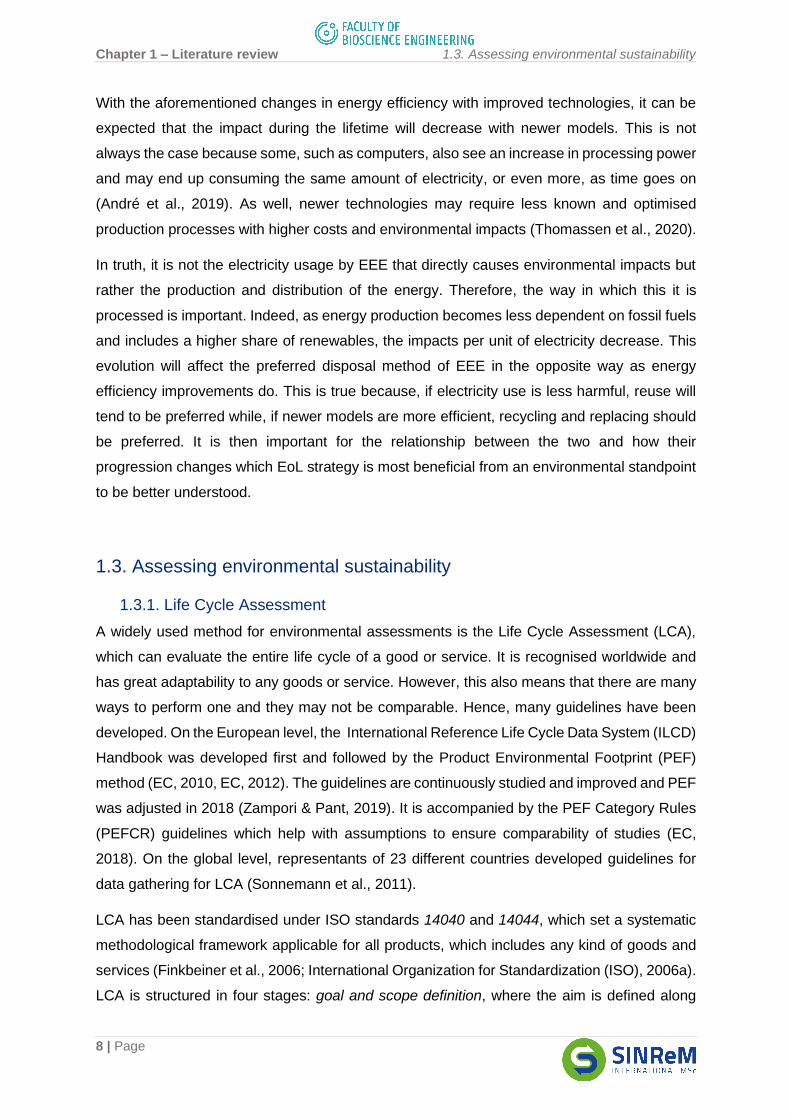
LCA is structured in four stages: goal and scope definition, where the aim is defined along
Chapter 1 – Literature review 1.3. Assessing environmental sustainability
9 | Page
with the system boundary; life cycle inventory (LCI), where the data collection occurs; life cycle
impact assessment (LCIA), where the prepared inventory is linked to categories of
environmental impact; and the interpretation phase, where results are summarised and
discussed (ISO, 2006a). Figure 4 shows the LCA phases and their interactions. The stages
are done in order but interactively: whereas more information is defined in later stages, the
earlier stages can be updated.
Figure 4. Stages of LCA and its potential applications (ISO, 2006a)
1.3.1.1 Goal and Scope Definition
Every LCA study starts with a goal definition in which the reasons for which the study is to be
performed are stated, as well as the intended audience and projected application. It is a crucial
step which will influence the methodology used throughout the different phases of the LCA
and the final results of the study. Then, the scope definition describes a series of conditions
and assumptions under which the study is to be performed. It needs to be closely aligned with
the study’s goal. The functional unit and system boundaries are defined in this phase. The
chosen impact categories for the study should be defined here as well but are used in the
LCIA phase, so will be discussed later. A functional unit is the “quantified performance of a
product system for use as a reference unit” upon which all further analyses are related to (ISO,
2006a).
Chapter 1 – Literature review 1.3. Assessing environmental sustainability
10 | Page
The system boundary is defined to identify which processes over the life cycle of the product
are included in the assessment. There should be alignment with the selected functional unit.
A complete life cycle analysis should cover all steps: from the extraction of resources to the
disposal of the product and waste. In other words, inputs and outputs of the system should be
elementary flows: material or energy drawn from or released into the environment without
further human intervention (ISO, 2006a). The study is then termed to be from cradle-to-grave.
However, on many occasions due to the lack of data or if the results will not drastically change
from omission, the LCA does not need to be so extensive. The choice of system boundary
depends on the goal of a study (ISO, 2006a). When identifying the system boundary, flows of
material and energy are defined to and from each product system, its unit processes, and the
environment in an iterative process (ISO, 2006b).
1.3.1.2 Life Cycle Inventory
LCI represents the second phase of an LCA. Data collection, modeling, and calculations are
performed. These steps must be done in accordance with the defined goal and following the
requirements of the scope. As such, each unit process must have its ins and outflows of
material and energy quantified and inventoried. Process flow diagrams can be employed to
better visualise these flows. There exist life cycle inventory databases such as ecoinvent and
the U.S. Life Cycle Inventory Database that already include production and disposal
information for many types of goods and services (ecoinvent, n.d.; NREL, n.d.). However,
these may need to be adapted for the specific scope of an LCA.
As well, there may be a lack of available data when performing an LCI as it could be
confidential or difficult to obtain. To overcome this, LCA practitioners need to make use of
different estimation methods to obtain the missing data, such as assumptions that similar
datasets could be employed (ISO, 2006a).
1.3.1.3 Life Cycle Impact Assessment
LCIA represents the third phase of an LCA. It uses the LCI results to evaluate environmental
impacts by associating the data collected during the LCI to specific impact categories,
category indicators, and characterisation factors. It translates emissions and raw material
values into impact scores so that the interpretation of results can be more straightforward.
Indeed, impact categories, chosen during the goal and scope definition phase, represent a
type of effect that process may have on the environment or life on the planet. The category
indicators are the quantitative measurement of an impact category. Then, characterisation
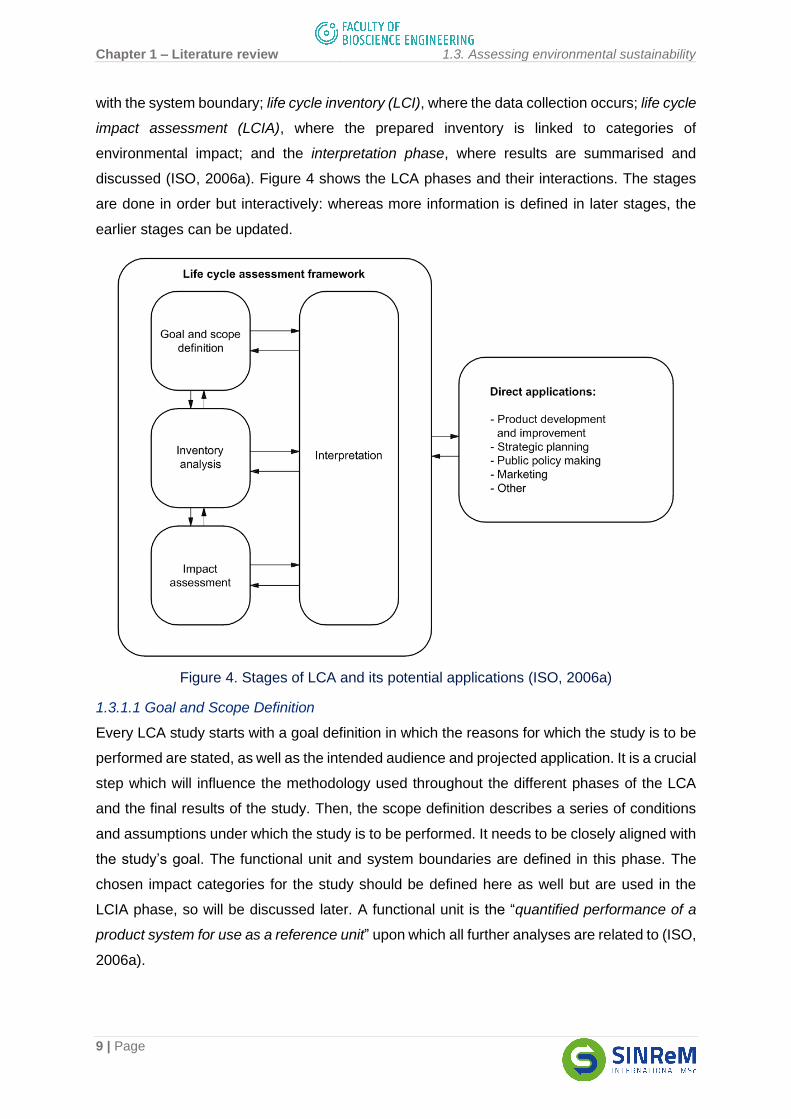
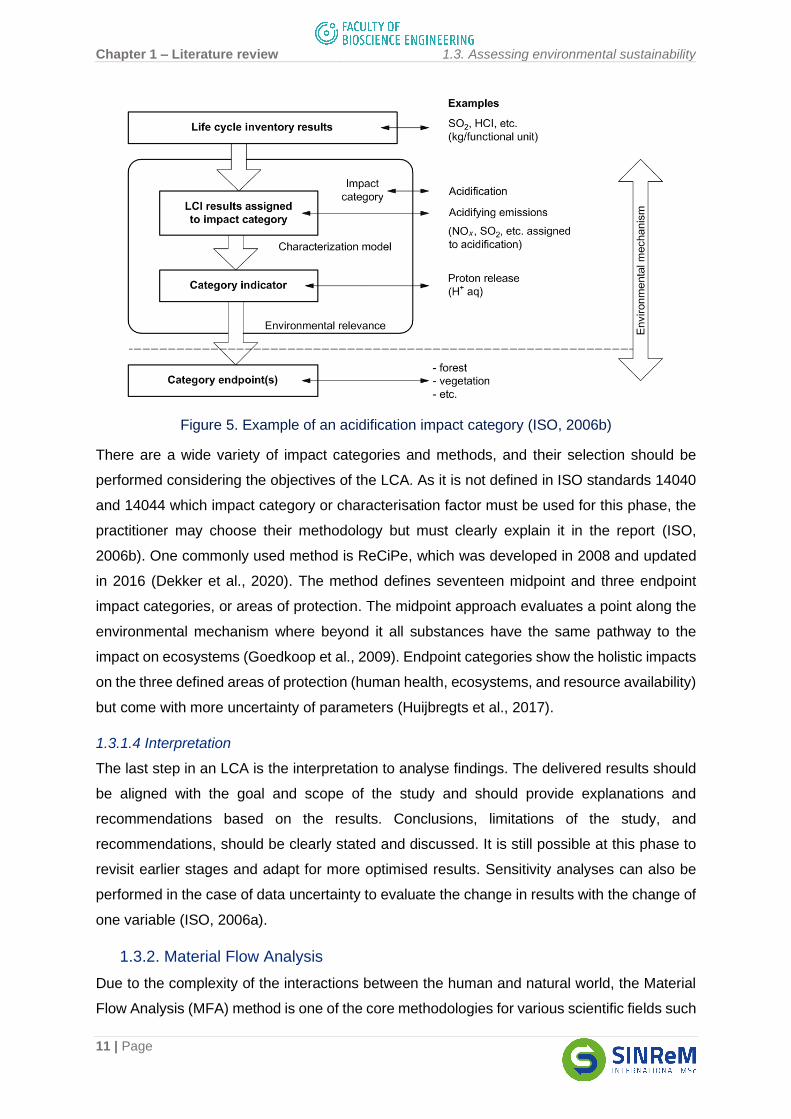
factors are used to convert LCI information into the category indicator (ISO, 2006b). Figure 5
illustrates the environmental mechanism of acidification as an LCA impact category.
Chapter 1 – Literature review 1.3. Assessing environmental sustainability
11 | Page
Figure 5. Example of an acidification impact category (ISO, 2006b)
There are a wide variety of impact categories and methods, and their selection should be
performed considering the objectives of the LCA. As it is not defined in ISO standards 14040
and 14044 which impact category or characterisation factor must be used for this phase, the
practitioner may choose their methodology but must clearly explain it in the report (ISO,
2006b). One commonly used method is ReCiPe, which was developed in 2008 and updated
in 2016 (Dekker et al., 2020). The method defines seventeen midpoint and three endpoint
impact categories, or areas of protection. The midpoint approach evaluates a point along the
environmental mechanism where beyond it all substances have the same pathway to the
impact on ecosystems (Goedkoop et al., 2009). Endpoint categories show the holistic impacts
on the three defined areas of protection (human health, ecosystems, and resource availability)
but come with more uncertainty of parameters (Huijbregts et al., 2017).
1.3.1.4 Interpretation
The last step in an LCA is the interpretation to analyse findings. The delivered results should
be aligned with the goal and scope of the study and should provide explanations and
recommendations based on the results. Conclusions, limitations of the study, and
recommendations, should be clearly stated and discussed. It is still possible at this phase to
revisit earlier stages and adapt for more optimised results. Sensitivity analyses can also be
performed in the case of data uncertainty to evaluate the change in results with the change of
one variable (ISO, 2006a).
1.3.2. Material Flow Analysis
Due to the complexity of the interactions between the human and natural world, the Material
Flow Analysis (MFA) method is one of the core methodologies for various scientific fields such
Chapter 1 – Literature review 1.3. Assessing environmental sustainability
12 | Page
as resource and waste management. Brunner & Rechberger, 2016 define it as a “systematic
assessment of the state and changes of flows and stocks of materials within a system defined
in space and time”. All inputs, outputs and accumulation should add up due to the law of
conservation of matter. Though it focuses on materials, it is often accompanied by a study of
energy and economics to better understand results (Brunner & Rechberger, 2016). This is why
it can be paired with an LCA to analyse environmental impacts (Brunner & Rechberger, 2016;
De Meester et al., 2019; Ljunggren Söderman & André, 2019; Van Eygen et al., 2016). By
thoroughly evaluating all material flows involved in a system, an MFA helps achieve an LCI
encompassing the entire life cycle, from cradle to grave.
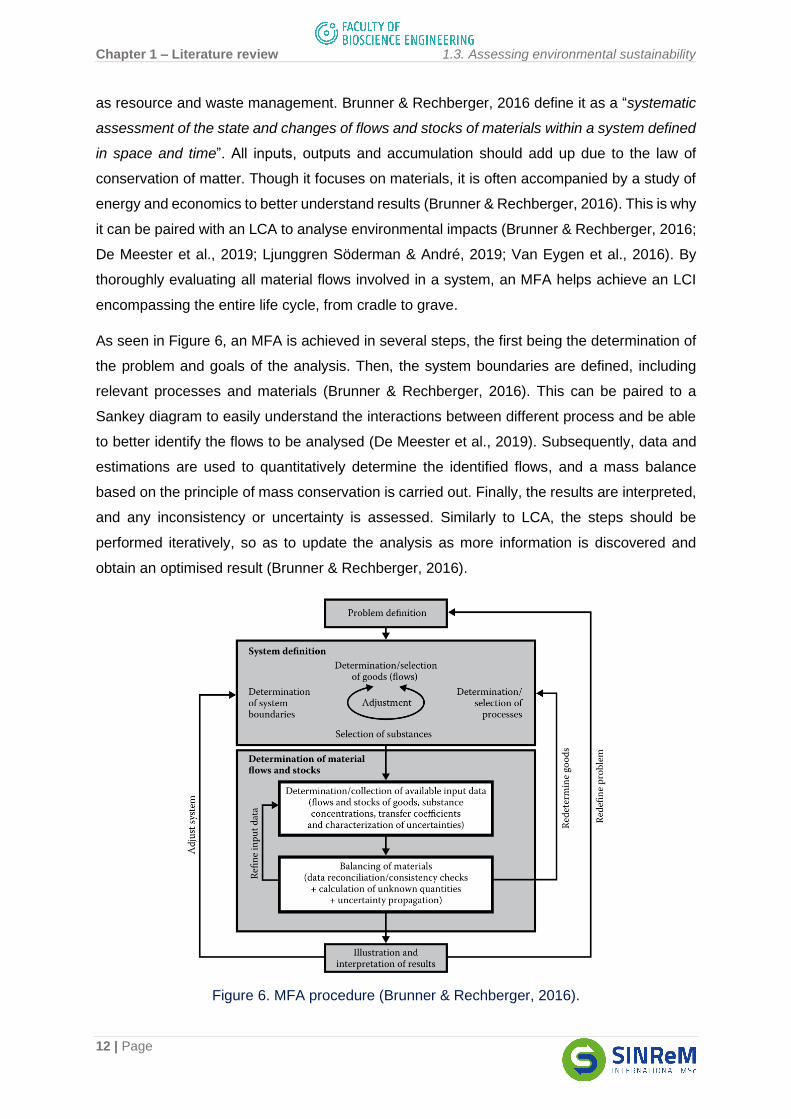
As seen in Figure 6, an MFA is achieved in several steps, the first being the determination of
the problem and goals of the analysis. Then, the system boundaries are defined, including
relevant processes and materials (Brunner & Rechberger, 2016). This can be paired to a
Sankey diagram to easily understand the interactions between different process and be able
to better identify the flows to be analysed (De Meester et al., 2019). Subsequently, data and
estimations are used to quantitatively determine the identified flows, and a mass balance
based on the principle of mass conservation is carried out. Finally, the results are interpreted,
and any inconsistency or uncertainty is assessed. Similarly to LCA, the steps should be
performed iteratively, so as to update the analysis as more information is discovered and
obtain an optimised result (Brunner & Rechberger, 2016).
Figure 6. MFA procedure (Brunner & Rechberger, 2016).
Chapter 1 – Literature review 1.4. Review of environmental sustainability of EEE
13 | Page
1.4. Review of environmental sustainability of EEE
1.4.1. Review of assessments
A literature review of existing assessments of the environmental sustainability of EEE was
performed. The key words environ*, assess* or LCA were combined to EEE or electr* and to
extended life*, reus*, refurbish*, remanufactur*, or recycl* in a Scopus search while removing
unrelated studies such as automotive or medical ones. Then, a screening of title and abstract
was carried out. Though no review of assessments of lifetime extension and different disposal
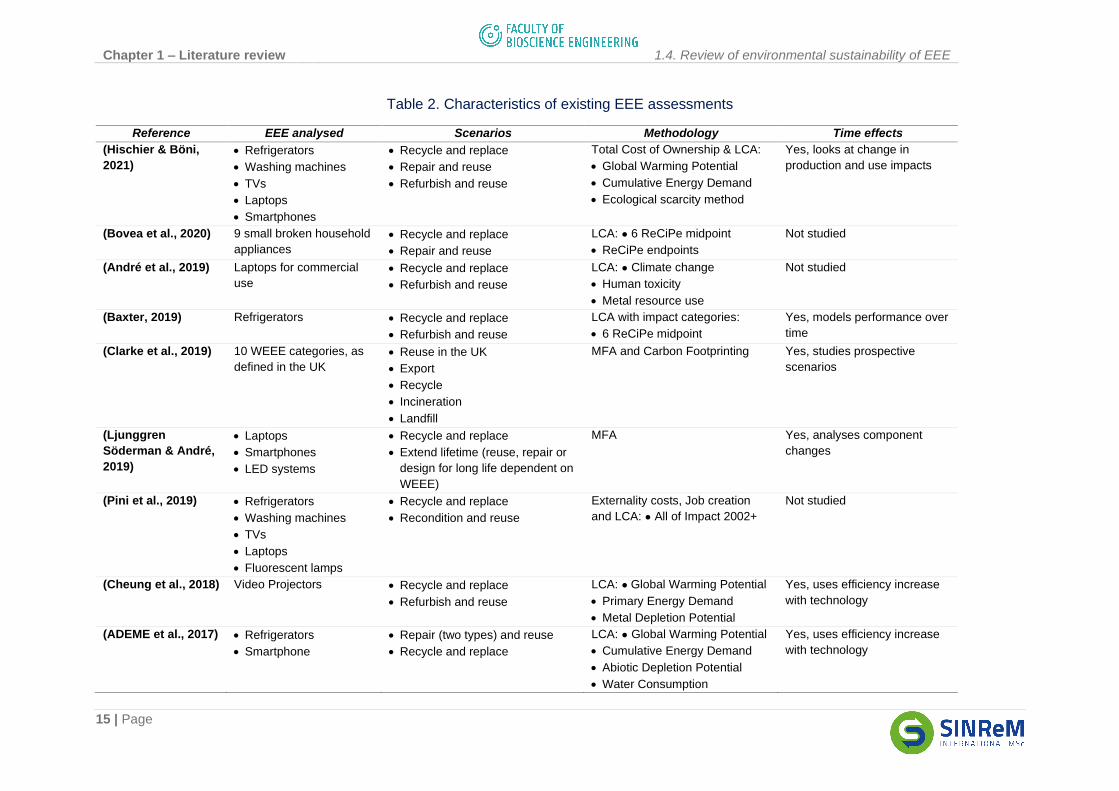
methods of EEE was found, many studies exist that tackle the subject. Table 2 shows a
summary of environmental assessments of EEE EoL strategies and their characteristics. Five
main characteristics were chosen. The first three (EEE analysed, scenarios, and
methodology) classify the articles by their aim, scope, and approach. They give an overview
of what the study is about. The last two characteristics were chosen as representatives of both
major sustainability issues identified in this text: resource depletion and energy consumption,
studied through assessments of criticality and changes in energy efficiency respectively.
Notice that none of the reviewed studies addressed criticality, hence it was not included in the
table. Though some studies consider the impacts of EEE EoL on metal use and depletion
potential (André et al., 2019; Clarke et al., 2019; Ljunggren Söderman & André, 2019), none
evaluates the less tangible importance, or criticality, of these materials.
The studies tend to either evaluate one EEE from each classification, as defined by Recupel
or the EU directive, or instead to focus on one type of device. Additionally, all compare
recycling scenarios to reuse ones for the EoL strategy. The method of reuse does vary
depending on if the product’s second life is with a different consumer than the first one and if
it goes to a repair facility or back to the original manufacturer. However, Bovea et al. (2020)
instead approached the question from the perspective that there are various types of
breakages in EEE which require different repair. They have found that in most cases, repair
is preferred to recycle, unless the component to be replaced is either a printed circuit board or
a motor (Bovea et al., 2020). To add to these findings, ADEME et al. (2017) found that it is
better to repair a smartphone than replace it, unless the device is already close to its EoL in
age. It is important to note that both of these are results for small appliances or ICT and may
not apply to all EEE.
Indeed, most analyses conclude that the preferred EoL strategy is highly dependent on the
type of EEE because some, like ICT, have a much more energy intensive production phase
than use phase, while large appliances tend to see an opposite trend (ADEME et al., 2017;
Baxter, 2019; Bovea et al., 2020; Cheung et al., 2018; Hischier & Böni, 2021; Pini et al., 2019).
For example, Hischier & Böni (2021) found that reuse is preferred in products which have their
Chapter 1 – Literature review 1.4. Review of environmental sustainability of EEE
14 | Page
production step as the most impactful but that otherwise, age is decisive. Bovea et al. (2020)
find similar results but argue that the type of breakage is also crucial, with components such
as the printed circuit boards not worthy of reuse. ADEME et al. (2017) reach the same age
conclusion for ICT but find that for large appliances, like refrigerators, energy efficiency is the
deciding factor and can make recycling and replacing by a newer, more efficient, model better
for the environment.
Seven out of nine articles employ LCA as the methodology for assessment. The recurring
impact categories are global warming, or climate change, as it is a large source of worry in
society, and energy demand, as EEE requires energy throughout its life cycle. There also
seems to be a focus on metal use and depletion potential as only one article did not account
for it since it focused on Switzerland and used the impact categories recommended by the
government (Hischier & Böni, 2021). As explained earlier, electronics use non-renewable
resources, so it makes sense to use this impact category.
Two studies were found to use MFA as a method of tracking WEEE flows after disposal. One
of those adds a layer of complexity through the carbon footprinting method to shed light to
potential climate change impacts of each identified scenario in their case study of the UK:
reuse in the country, export, recycle, incineration, or landfilling (Clarke et al., 2019). This lone
environmental assessment does not conclusively study all impacts throughout the life cycle of
the EEE. Indeed, the other MFA study recommends the use of an LCA in addition to an MFA
though it was outside of its scope (Ljunggren Söderman & André, 2019). In truth, De Meester
et al. (2019) have shown that combining MFA and LCA helps optimise the environmental
performance of WEEE recycling chains.
Only five studies were found to consider changes in efficiency and only one considers changes
in composition because of technology modernisation. However, technology is constantly
changing as it progresses (Purchase et al., 2020), so this should be taken into account in
environmental assessments. It also seems that studies focusing on one type of EEE consider
time effects more than those that study many devices.
1.4.2. Criticality-based impact assessment method
A method of evaluating the criticality of materials in an LCA was developed by Tran et al.
(2018). It allows for the incorporation of an equivalent criticality factor into the calculations.
This factor is a multiplication of the EU defined criteria of criticality: the supply risk (SR) and
economic importance (EI) values. The factor is used as a characterisation factor in the new
method, named criticality-based impact assessment method (CIAM). Including these values
in the calculations ensures that socioeconomic issues of resources are accounted for in the
LCA (Tran et al., 2018).
Chapter 1 – Literature review 1.4. Review of environmental sustainability of EEE
15 | Page
Table 2. Characteristics of existing EEE assessments
Reference EEE analysed Scenarios Methodology Time effects
(Hischier & Böni,
2021)
• Refrigerators
• Washing machines
• TVs
• Laptops
• Smartphones
• Recycle and replace
• Repair and reuse
• Refurbish and reuse
Total Cost of Ownership & LCA:
• Global Warming Potential
• Cumulative Energy Demand
• Ecological scarcity method
Yes, looks at change in
production and use impacts
(Bovea et al., 2020) 9 small broken household
appliances
• Recycle and replace
• Repair and reuse
LCA: ● 6 ReCiPe midpoint
• ReCiPe endpoints
Not studied
(André et al., 2019) Laptops for commercial
use
• Recycle and replace
• Refurbish and reuse
LCA: ● Climate change
• Human toxicity
• Metal resource use
Not studied
(Baxter, 2019) Refrigerators • Recycle and replace
• Refurbish and reuse
LCA with impact categories:
• 6 ReCiPe midpoint
Yes, models performance over
time
(Clarke et al., 2019) 10 WEEE categories, as
defined in the UK
• Reuse in the UK
• Export
• Recycle
• Incineration
• Landfill
MFA and Carbon Footprinting Yes, studies prospective
scenarios
(Ljunggren
Söderman & André,
2019)
• Laptops
• Smartphones
• LED systems
• Recycle and replace
• Extend lifetime (reuse, repair or
design for long life dependent on
WEEE)
MFA Yes, analyses component
changes
(Pini et al., 2019) • Refrigerators
• Washing machines
• TVs
• Laptops
• Fluorescent lamps
• Recycle and replace
• Recondition and reuse
Externality costs, Job creation
and LCA: ● All of Impact 2002+
Not studied
(Cheung et al., 2018) Video Projectors • Recycle and replace
• Refurbish and reuse
LCA: ● Global Warming Potential
• Primary Energy Demand
• Metal Depletion Potential
Yes, uses efficiency increase
with technology
(ADEME et al., 2017) • Refrigerators
• Smartphone
• Repair (two types) and reuse
• Recycle and replace
LCA: ● Global Warming Potential
• Cumulative Energy Demand
• Abiotic Depletion Potential
• Water Consumption
Yes, uses efficiency increase
with technology
Chapter 2 – Objective
16 | Page
Chapter 2 – Objective
As the use of electronics increases but resources become scarcer and/or recycling efficiency
remains low (Reuter et al., 2013; Schaeffer et al., 2018), it is important to make informed
decisions on the EoL of a device to reduce environmental impacts. Moreover, there is today
resource scarcity and geopolitical instability of material procurement, which is enhanced by
the importance of a particular material in Europe and potential lack of substitutability (Blengini
et al., 2020). Therefore, an economic and social perspective is also important and can be
evaluated with the European Union’s definition of criticality, which combines supply risk and
economic importance (Tran et al., 2018).
To encompass these aspects, a portable computer, or notebook, henceforth referred to as
laptop, is the electrical and electronic equipment of choice. Indeed, the laptop sector generates
almost three times more revenue than their main competitor in the computer industry:
desktops. Coupled with the fact that their market is expected to continue growing in the coming
years, laptops are some of the more common Information and Communication Technologies
(Kranjec, 2021). Laptops’ importance in Europe continue to rise because more than 90% of
European households have access to the internet since 2019 (Eurostat, 2020). Additionally,
one of the main focuses of this thesis is criticality which is studied through Critical Raw
Materials, often found in Information and Communication Technology. Finally, since
exclusively secondary data is used in this research, it was important to choose a subject with
readily available information and laptops were found to have relevant data in literature.
In this thesis, the effects of extending the lifetime of an electrical and electronic equipment on
its environmental impacts and criticality are studied. This is achieved by comparing the
impacts of extended lifetimes to replacement scenarios where the old device is discarded and
a new one is purchased. The project focuses on a resource-oriented approach with the aim of
aiding the conservation of resources and responsible consumption efforts in Europe and in
Sustainable Development Goal 12. As such, the objective of this work is to evaluate the
environmental impacts and criticality of materials of the life cycle of a laptop. Extending the
lifetime through repair and various EoL methods are considered, such as reuse and recycling.
In addition, trade-offs in energy consumption during the use phase are studied to determine
at which point it is better to recycle than to reuse, if there is such a point.
To do so, a life cycle assessment of a laptop is performed and complemented by a criticality-
based impact assessment method. As technologies and material criticality change through
time, temporality of the data must be considered.
Chapter 3 – Materials and methods 3.1. Goal and scope definition
17 | Page
Chapter 3 – Materials and methods
This chapter outlines the methodology employed in this thesis as a means of reaching the
defined goals. The thesis follows the ISO standards for Life Cycle Assessments (ISO, 2006a,
ISO, 2006b), the methodology of assessing the durability of EEE defined by Ardente &
Mathieux (2014), as well as the criticality impact assessment method (CIAM) defined by Tran
et al. (2018).
This thesis’ methodology follows the LCA framework. First, the goal and scope definition
section introduces the goal, the time horizon and durability question of EEE, the scenarios,
the system boundaries and product system, and the functional unit. The chosen impact
categories are defined later to avoid repetition. Second, the LCI is defined, with laptop
properties first and then the life cycle data for the different scenarios. Third, how the LCIA is
performed and the chosen impact categories are given. Finally, the CIAM is described as it is
a rather novel methodology. Results of the LCIA and the interpretation step are presented in
Chapter 4.
3.1. Goal and scope definition
3.1.1. Goal definition
The goal of the LCA is to yield results and a discussion that can reach the objective described
above. As explained in the objective, the environmental impacts and criticality of the use of a
laptop are evaluated. The LCA focuses on the former while CIAM explained later in the
document studies the latter. Hence, the goal of the LCA is to compare the environmental
impacts of extending the lifetime of a laptop to those of discarding and replacing the model
with a new one. The findings of this study are aimed towards helping draft new policies on
EEE use or guiding consumers in purchasing EEE. The projected application of this report is
to aid responsible consumption efforts.
3.1.2. Scope definition
In order to reach the goal of the LCA, the perspective taken is that of a consumer. The idea is
that there is someone that needs to make a decision about their laptop today and that they
would like to make the responsible and sustainable one. Therefore, the question to be
answered is: “Should someone that has had a laptop for a number of years discard it and
replace it for a newer version or continue using it from an environmental and criticality
standpoint?”. It is assumed that the consumer in question is using, and will continue to use, a
personal laptop indefinitely for everyday activities; this is not a professional setting. Therefore,
Chapter 3 – Materials and methods 3.1. Goal and scope definition
18 | Page
the laptop is modeled considering everyday activities that do not demand advanced
technological functionality and processing requirements.
3.1.2.1 Durability and time horizon definition
To study the impacts of extending the lifetime of an EEE, its durability should be considered.
Lifetime can be defined as how long the use phase of a product is. It depends on consumer
choices, such as trends and desires. Durability can be defined as “the characteristic of [an
object or material] that maintains [its] properties over time” (Mora, 2007). This can be
interpreted as how long the use phase of a product should be. Indeed, an electronic product
cannot be used forever as it will ultimately break or become obsolete. There can be two ways
to interpret durability: “the product’s economic life (determined by the opportunity cost, and
[the] product’s technical life (determined by the duration of the product’s ability to fulfill its
technical function)” (Kostecki, 2013). The latter is usually as designed by the producer while
the former is at the mercy of culture and consumer preference. For example, many consumers
might prefer to get rid of their old devices to buy the more “trendy” one instead. They will be
henceforth referred to as technical durability and economic durability respectively.
The method to assess the environmental impacts of the durability of EEE developed by
Ardente & Mathieux (2014), gives that two scenarios should be compared in such a study: a
base-case where the product is substituted after its lifetime by a new version and a scenario
where the device is continued to be used for a certain time and only then substituted by a new
version. It can be assumed that the lifetime of the product in the first scenario is equal to the
economic durability while in the second it is closer to the technical durability. By choosing the
second type of scenario, the consumer is simply delaying the purchase of a new device by a
certain duration. This can be in the hopes of increased performance, in preference
accompanied by an increase in energy efficiency. Or, by delaying purchase, the manufacturing
of the EEE is delayed, which allows for the extraction and processing of the materials and
components at a later date. This can be beneficial if criticality decreases over time or if
recycling technologies progress.
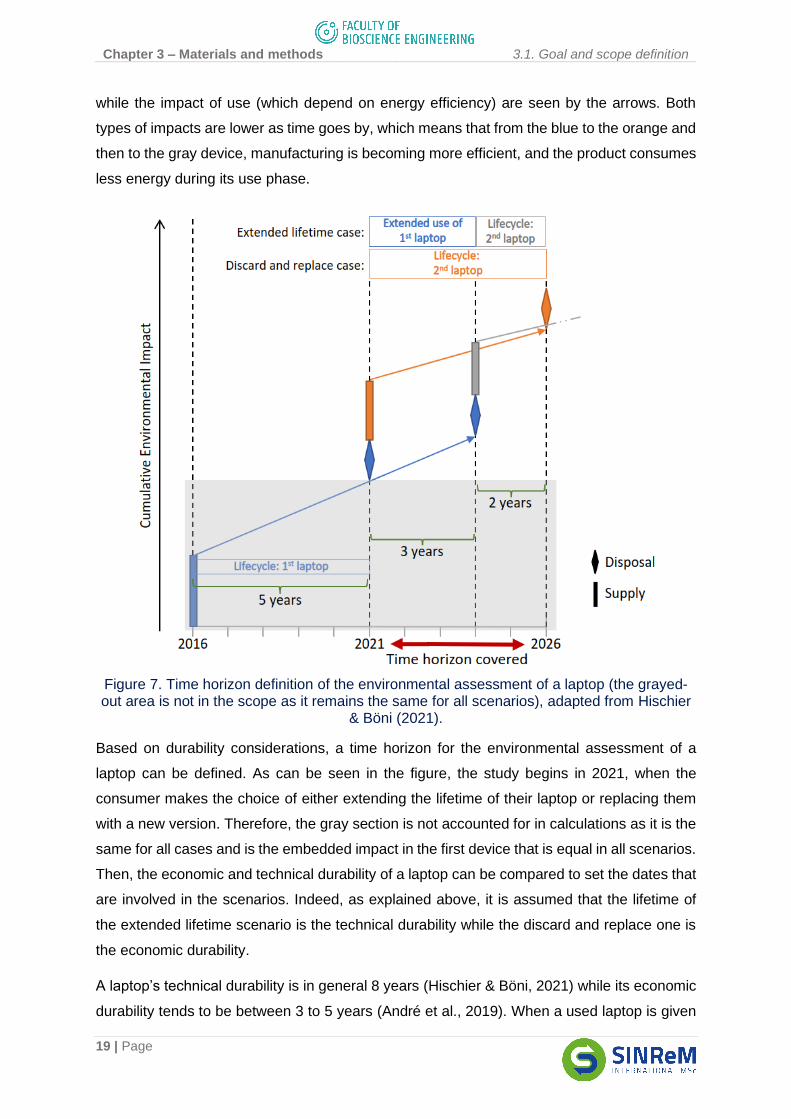
How durability information leads to the definition of the scope of this LCA and to a time horizon
is summarised in Figure 7. The x-axis represents time while the y-axis is the cumulative
environmental impact of the laptop life cycle. The diagram is not to scale but represents a
possible result of extending the lifetime of a laptop compared to discarding it and replacing
with a newer model. In this case, manufacturing impacts and energy consumption per use
decrease with new products. The life cycle of a laptop here is considered to include supply,
use, and disposal, as will be explained in the product system definition. Indeed, the impact of
manufacturing and disposal are represented by the vertical boxes and rhombi respectively,
Chapter 3 – Materials and methods 3.1. Goal and scope definition
19 | Page
while the impact of use (which depend on energy efficiency) are seen by the arrows. Both
types of impacts are lower as time goes by, which means that from the blue to the orange and
then to the gray device, manufacturing is becoming more efficient, and the product consumes
less energy during its use phase.
Figure 7. Time horizon definition of the environmental assessment of a laptop (the grayed-out area is not in the scope as it remains the same for all scenarios), adapted from Hischier
& Böni (2021).
Based on durability considerations, a time horizon for the environmental assessment of a
laptop can be defined. As can be seen in the figure, the study begins in 2021, when the
consumer makes the choice of either extending the lifetime of their laptop or replacing them
with a new version. Therefore, the gray section is not accounted for in calculations as it is the
same for all cases and is the embedded impact in the first device that is equal in all scenarios.
Then, the economic and technical durability of a laptop can be compared to set the dates that
are involved in the scenarios. Indeed, as explained above, it is assumed that the lifetime of
the extended lifetime scenario is the technical durability while the discard and replace one is
the economic durability.
A laptop’s technical durability is in general 8 years (Hischier & Böni, 2021) while its economic
durability tends to be between 3 to 5 years (André et al., 2019). When a used laptop is given
Chapter 3 – Materials and methods 3.1. Goal and scope definition
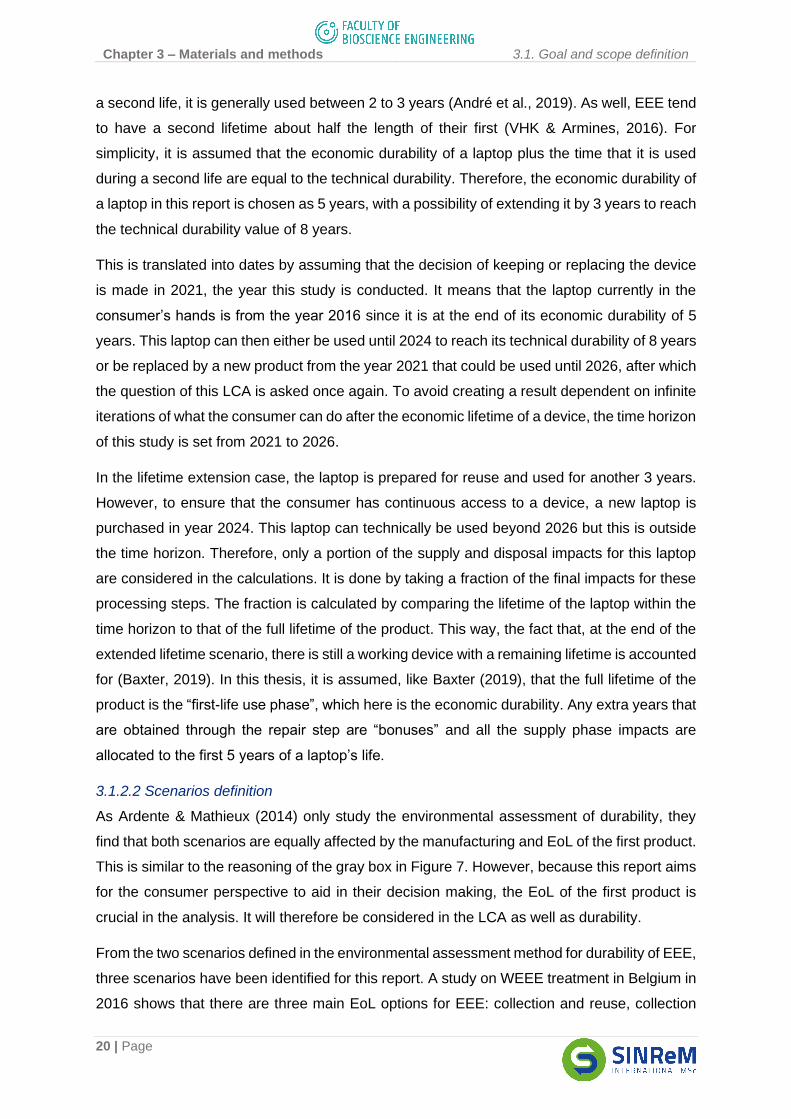
20 | Page
a second life, it is generally used between 2 to 3 years (André et al., 2019). As well, EEE tend
to have a second lifetime about half the length of their first (VHK & Armines, 2016). For
simplicity, it is assumed that the economic durability of a laptop plus the time that it is used
during a second life are equal to the technical durability. Therefore, the economic durability of
a laptop in this report is chosen as 5 years, with a possibility of extending it by 3 years to reach
the technical durability value of 8 years.
This is translated into dates by assuming that the decision of keeping or replacing the device
is made in 2021, the year this study is conducted. It means that the laptop currently in the
consumer’s hands is from the year 2016 since it is at the end of its economic durability of 5
years. This laptop can then either be used until 2024 to reach its technical durability of 8 years
or be replaced by a new product from the year 2021 that could be used until 2026, after which
the question of this LCA is asked once again. To avoid creating a result dependent on infinite
iterations of what the consumer can do after the economic lifetime of a device, the time horizon
of this study is set from 2021 to 2026.
In the lifetime extension case, the laptop is prepared for reuse and used for another 3 years.
However, to ensure that the consumer has continuous access to a device, a new laptop is
purchased in year 2024. This laptop can technically be used beyond 2026 but this is outside
the time horizon. Therefore, only a portion of the supply and disposal impacts for this laptop
are considered in the calculations. It is done by taking a fraction of the final impacts for these
processing steps. The fraction is calculated by comparing the lifetime of the laptop within the
time horizon to that of the full lifetime of the product. This way, the fact that, at the end of the
extended lifetime scenario, there is still a working device with a remaining lifetime is accounted
for (Baxter, 2019). In this thesis, it is assumed, like Baxter (2019), that the full lifetime of the
product is the “first-life use phase”, which here is the economic durability. Any extra years that
are obtained through the repair step are “bonuses” and all the supply phase impacts are
allocated to the first 5 years of a laptop’s life.
3.1.2.2 Scenarios definition
As Ardente & Mathieux (2014) only study the environmental assessment of durability, they
find that both scenarios are equally affected by the manufacturing and EoL of the first product.
This is similar to the reasoning of the gray box in Figure 7. However, because this report aims
for the consumer perspective to aid in their decision making, the EoL of the first product is
crucial in the analysis. It will therefore be considered in the LCA as well as durability.
From the two scenarios defined in the environmental assessment method for durability of EEE,
three scenarios have been identified for this report. A study on WEEE treatment in Belgium in
2016 shows that there are three main EoL options for EEE: collection and reuse, collection
Chapter 3 – Materials and methods 3.1. Goal and scope definition
21 | Page
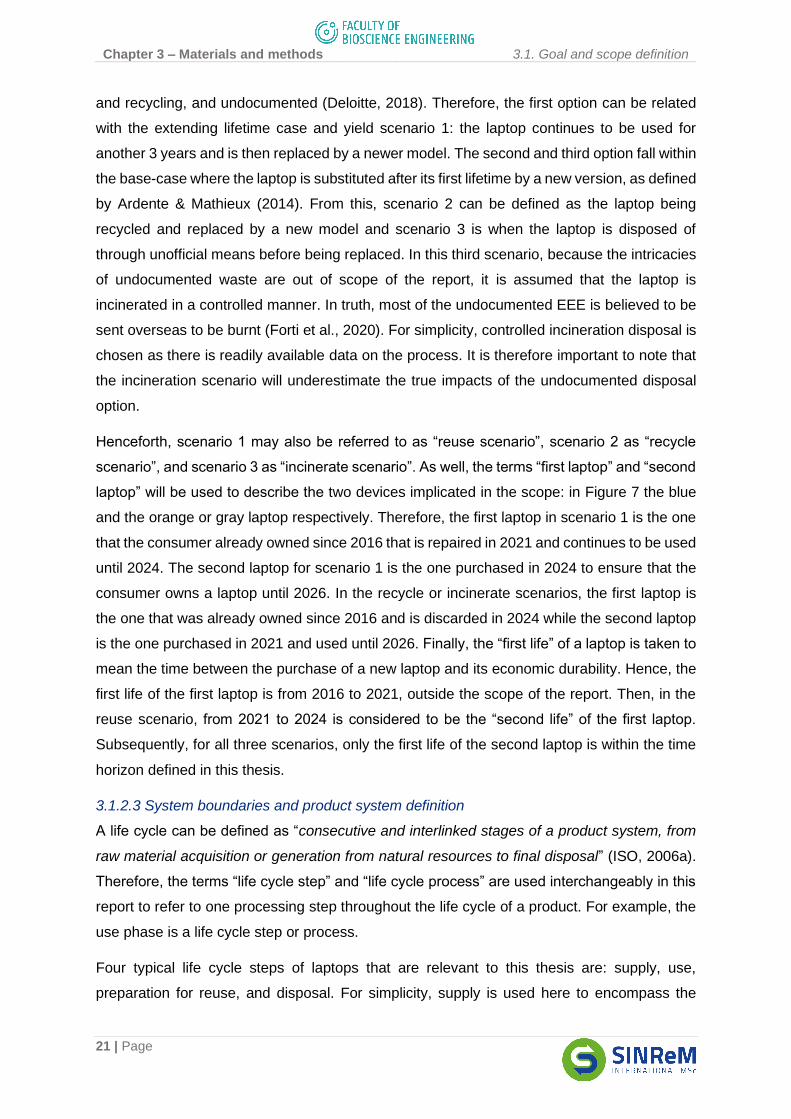
and recycling, and undocumented (Deloitte, 2018). Therefore, the first option can be related
with the extending lifetime case and yield scenario 1: the laptop continues to be used for
another 3 years and is then replaced by a newer model. The second and third option fall within
the base-case where the laptop is substituted after its first lifetime by a new version, as defined
by Ardente & Mathieux (2014). From this, scenario 2 can be defined as the laptop being
recycled and replaced by a new model and scenario 3 is when the laptop is disposed of
through unofficial means before being replaced. In this third scenario, because the intricacies
of undocumented waste are out of scope of the report, it is assumed that the laptop is
incinerated in a controlled manner. In truth, most of the undocumented EEE is believed to be
sent overseas to be burnt (Forti et al., 2020). For simplicity, controlled incineration disposal is
chosen as there is readily available data on the process. It is therefore important to note that
the incineration scenario will underestimate the true impacts of the undocumented disposal
option.
Henceforth, scenario 1 may also be referred to as “reuse scenario”, scenario 2 as “recycle
scenario”, and scenario 3 as “incinerate scenario”. As well, the terms “first laptop” and “second
laptop” will be used to describe the two devices implicated in the scope: in Figure 7 the blue
and the orange or gray laptop respectively. Therefore, the first laptop in scenario 1 is the one
that the consumer already owned since 2016 that is repaired in 2021 and continues to be used
until 2024. The second laptop for scenario 1 is the one purchased in 2024 to ensure that the
consumer owns a laptop until 2026. In the recycle or incinerate scenarios, the first laptop is
the one that was already owned since 2016 and is discarded in 2024 while the second laptop
is the one purchased in 2021 and used until 2026. Finally, the “first life” of a laptop is taken to
mean the time between the purchase of a new laptop and its economic durability. Hence, the
first life of the first laptop is from 2016 to 2021, outside the scope of the report. Then, in the
reuse scenario, from 2021 to 2024 is considered to be the “second life” of the first laptop.
Subsequently, for all three scenarios, only the first life of the second laptop is within the time
horizon defined in this thesis.
3.1.2.3 System boundaries and product system definition
A life cycle can be defined as “consecutive and interlinked stages of a product system, from
raw material acquisition or generation from natural resources to final disposal” (ISO, 2006a).
Therefore, the terms “life cycle step” and “life cycle process” are used interchangeably in this
report to refer to one processing step throughout the life cycle of a product. For example, the
use phase is a life cycle step or process.
Four typical life cycle steps of laptops that are relevant to this thesis are: supply, use,
preparation for reuse, and disposal. For simplicity, supply is used here to encompass the
Chapter 3 – Materials and methods 3.1. Goal and scope definition
22 | Page
extraction of resources and their processing into raw materials, the manufacturing of these
into components, the assembly of the final product, and distribution to reach the consumer. It
also includes any transportation within and between these steps. Use means the consumption
of the product by the owner, in this case, turning on and off the laptop and any time and
activities in between. Preparation for reuse includes the act of preparation to reuse itself and
the transportation to and from the center or store where it is performed. Finally, disposal
includes the collection from the consumer’s location and the EoL treatment. Figure 8 shows
these life cycle steps for a laptop and how they are relevant to each defined scenario.
As shows Figure 8, the system boundaries do not include the supply and use of the first laptop.
This is because they are identical, as explained above with the gray box in Figure 7. This LCA
is, nonetheless, a cradle-to-grave study because the entire lifecycle of the second laptop. It is
also a cradle-to-cradle analysis for the materials recovered through recycling. The schematic
also includes a certain depiction of time through the distance of a process away from the edge
of the image to reiterate that the time horizon does not include the entire life cycle of both the
first and second laptop.
The preparation for reuse life cycle step is assumed to be a repair process. Indeed, though
there are still 3 years left in the technical durability of the first laptop, it is common for small
defaults to occur before. These could be losses of computation speed or a decrease in energy
efficiency. Hence, a repair step is required to ensure that the device is within working condition.
The recycling life cycle step typically starts with a manual dismantling step, where components
such as the PCB and battery can be separated and processed specifically. Then, the leftover
components are shredded mechanically and sent through a separation process. This involves
magnetic separators to recover ferrous metals, an eddy-current separator to recover non-
ferrous metals, among others. Then, each separated stream is sent to specific treatment
methods for the recovery of secondary raw materials. Typically, common metals such as Al,
Cu, and steel can be recovered, while most of specialty materials are lost due to their
dispersed use and difficulty of recovery (André et al., 2019; De Meester et al., 2019; Ford et
al., 2016; Van Eygen et al., 2016). Co is also recovered from the battery (Wang et al., 2014).
The incineration step is assumed to be the traditional municipal incineration of each
component and material, since the real undocumented EoL treatment is out of scope. The
disposal of the second laptop in each scenario is assumed to be recycling, as that is the
desired direction. Choosing an identical disposal method for this second device eases the LCA
calculations. Otherwise, an iterative process could occur where, after 5 years, the research
question of what a consumer should do with a five-year-old laptop should do.
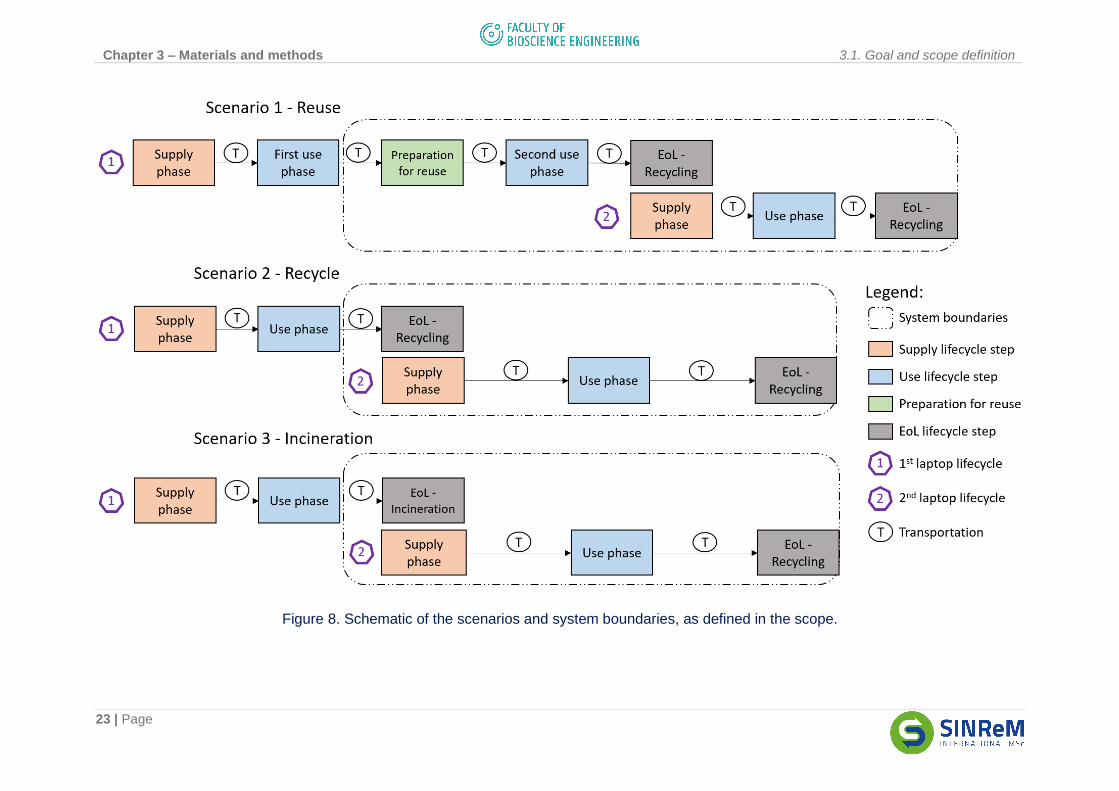
Chapter 3 – Materials and methods 3.1. Goal and scope definition
23 | Page
Figure 8. Schematic of the scenarios and system boundaries, as defined in the scope.
Chapter 3 – Materials and methods 3.2. Life Cycle Inventory
24 | Page
3.1.2.4 Functional unit
The functional unit for this LCA can be defined as the access to a laptop from 2021 to 2026
as well as the EoL of the first laptop already owned by the consumer. By access, it is meant
that only the fact of owning and being able to use a laptop is considered. How often and for
how long the device is used each time is not relevant here as an average consumption is
applied. This access considers the choice by the user to reuse their current device or discard
and replace it, the use phase from 2021 to 2016, as well as the supply phase of the second
device and its EoL treatment.
We assume that the user has had a device for five years and is choosing whether to reuse it
or replace it. If replaced, the first device will be recycled or incinerated. The first laptop’s supply
phase is not taken into account as it is allocated to the first life of the laptop, outside the scope
of the report. In the three scenarios, a second laptop is included in the calculations, as seen
in Figure 7. However, in the reuse scenario, as explained above, only a portion of the second
laptop’s production and EoL treatment impact is considered as it could still be used outside
the time horizon.
3.2. Life Cycle Inventory
Most of the LCI is based on the Ecoinvent 3.6 database.
3.2.1. Laptop characteristics
However, the data can be out-of-date and is built upon to fit more current results. Indeed, the
laptop used for the database is from 2003 (Lehmann & Hischier, 2007) and is dissimilar to
modern devices: CD/DVD drive, floppy disk drive, and trackpoint, among others. Because
technology is everchanging, it is important to ascertain the modern properties of a laptop. On
top of that, the scope of this thesis requires three different laptop kinds: one built and sold in
2016, one in 2021, and one in 2024. Therefore, the first step of this LCI is to study the evolution
of laptops through time, and, in particular, in the last few years, to attempt to notice a trend.
The ENERGY STAR certification (see Appendix 1 for an explanation of this certification) gives
a thorough database of laptops on the market and some of their characteristics. It is an energy
efficiency certification for EEE so it contains information on energy consumption, but weight
and composition parameters have to be found elsewhere. Nonetheless, it gives a good basis
for what laptops to study. The dataset used for this section of the LCI is found in Appendix 2:
98 laptops are used for the analysis. These devices were all released between September
2017 and April 2021. From this list, company and seller websites were browsed to extract
weight data. Only devices of average performance (or category 1 as seen in Appendix 1) are
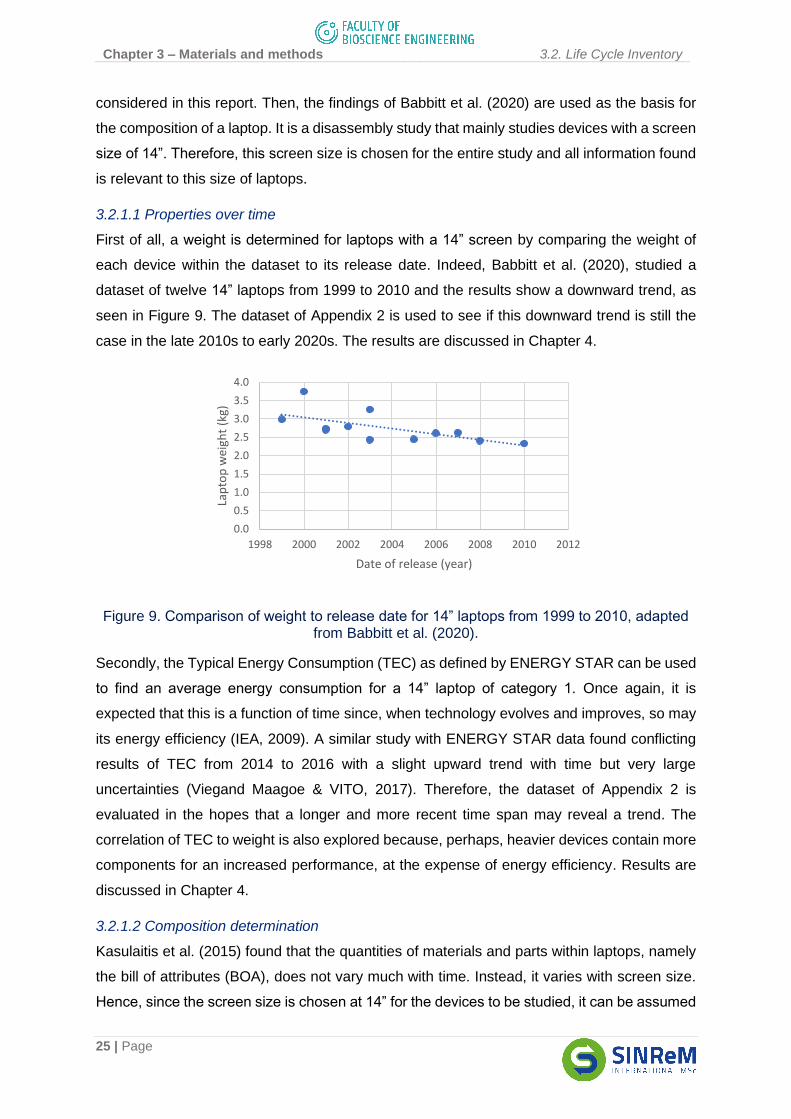
Chapter 3 – Materials and methods 3.2. Life Cycle Inventory
25 | Page
considered in this report. Then, the findings of Babbitt et al. (2020) are used as the basis for
the composition of a laptop. It is a disassembly study that mainly studies devices with a screen
size of 14”. Therefore, this screen size is chosen for the entire study and all information found
is relevant to this size of laptops.
3.2.1.1 Properties over time
First of all, a weight is determined for laptops with a 14” screen by comparing the weight of
each device within the dataset to its release date. Indeed, Babbitt et al. (2020), studied a
dataset of twelve 14” laptops from 1999 to 2010 and the results show a downward trend, as
seen in Figure 9. The dataset of Appendix 2 is used to see if this downward trend is still the
case in the late 2010s to early 2020s. The results are discussed in Chapter 4.
Figure 9. Comparison of weight to release date for 14” laptops from 1999 to 2010, adapted from Babbitt et al. (2020).
Secondly, the Typical Energy Consumption (TEC) as defined by ENERGY STAR can be used
to find an average energy consumption for a 14” laptop of category 1. Once again, it is
expected that this is a function of time since, when technology evolves and improves, so may
its energy efficiency (IEA, 2009). A similar study with ENERGY STAR data found conflicting
results of TEC from 2014 to 2016 with a slight upward trend with time but very large
uncertainties (Viegand Maagoe & VITO, 2017). Therefore, the dataset of Appendix 2 is
evaluated in the hopes that a longer and more recent time span may reveal a trend. The
correlation of TEC to weight is also explored because, perhaps, heavier devices contain more
components for an increased performance, at the expense of energy efficiency. Results are
discussed in Chapter 4.
3.2.1.2 Composition determination
Kasulaitis et al. (2015) found that the quantities of materials and parts within laptops, namely
the bill of attributes (BOA), does not vary much with time. Instead, it varies with screen size.
Hence, since the screen size is chosen at 14” for the devices to be studied, it can be assumed
0.0
0.5
1.0
1.5
2.0
2.5
3.0
3.5
4.0
1998 2000 2002 2004 2006 2008 2010 2012
Lap
top
wei
ght
(kg)
Date of release (year)
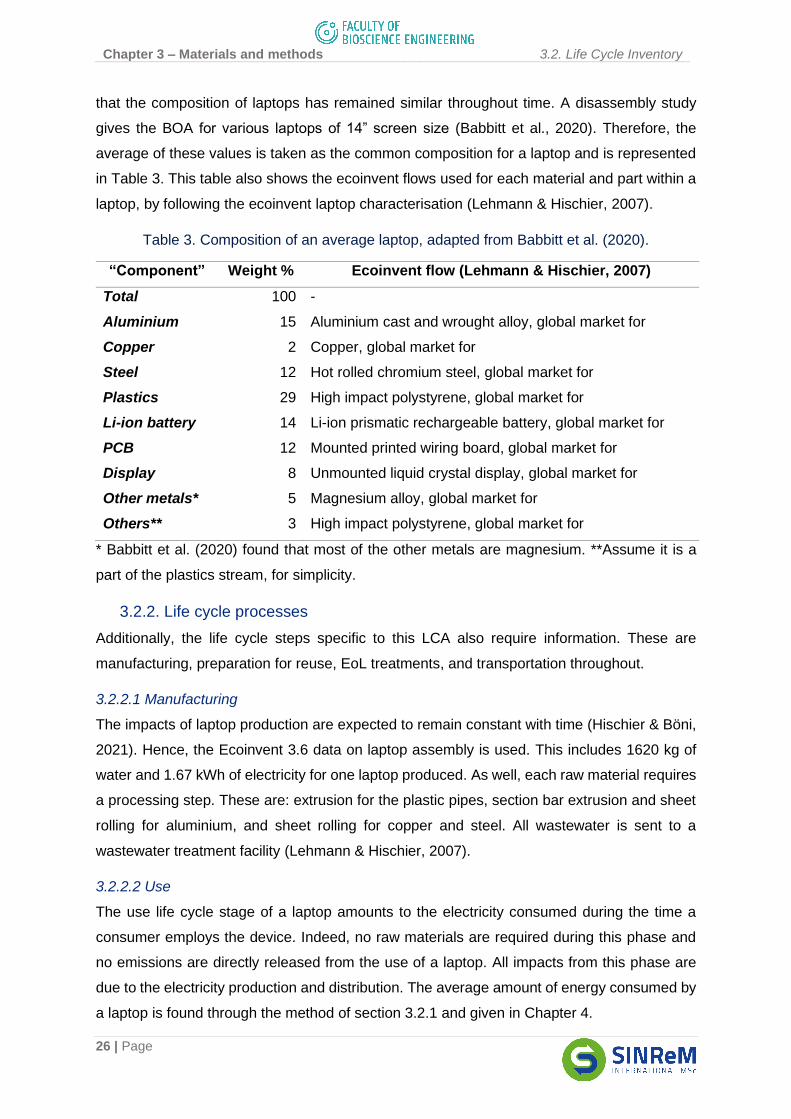
Chapter 3 – Materials and methods 3.2. Life Cycle Inventory
26 | Page
that the composition of laptops has remained similar throughout time. A disassembly study
gives the BOA for various laptops of 14” screen size (Babbitt et al., 2020). Therefore, the
average of these values is taken as the common composition for a laptop and is represented
in Table 3. This table also shows the ecoinvent flows used for each material and part within a
laptop, by following the ecoinvent laptop characterisation (Lehmann & Hischier, 2007).
Table 3. Composition of an average laptop, adapted from Babbitt et al. (2020).
“Component” Weight % Ecoinvent flow (Lehmann & Hischier, 2007)
Total 100 -
Aluminium 15 Aluminium cast and wrought alloy, global market for
Copper 2 Copper, global market for
Steel 12 Hot rolled chromium steel, global market for
Plastics 29 High impact polystyrene, global market for
Li-ion battery 14 Li-ion prismatic rechargeable battery, global market for
PCB 12 Mounted printed wiring board, global market for
Display 8 Unmounted liquid crystal display, global market for
Other metals* 5 Magnesium alloy, global market for
Others** 3 High impact polystyrene, global market for
* Babbitt et al. (2020) found that most of the other metals are magnesium. **Assume it is a
part of the plastics stream, for simplicity.
3.2.2. Life cycle processes
Additionally, the life cycle steps specific to this LCA also require information. These are
manufacturing, preparation for reuse, EoL treatments, and transportation throughout.
3.2.2.1 Manufacturing
The impacts of laptop production are expected to remain constant with time (Hischier & Böni,
2021). Hence, the Ecoinvent 3.6 data on laptop assembly is used. This includes 1620 kg of
water and 1.67 kWh of electricity for one laptop produced. As well, each raw material requires
a processing step. These are: extrusion for the plastic pipes, section bar extrusion and sheet
rolling for aluminium, and sheet rolling for copper and steel. All wastewater is sent to a
wastewater treatment facility (Lehmann & Hischier, 2007).
3.2.2.2 Use
The use life cycle stage of a laptop amounts to the electricity consumed during the time a
consumer employs the device. Indeed, no raw materials are required during this phase and
no emissions are directly released from the use of a laptop. All impacts from this phase are
due to the electricity production and distribution. The average amount of energy consumed by
a laptop is found through the method of section 3.2.1 and given in Chapter 4.
Chapter 3 – Materials and methods 3.2. Life Cycle Inventory
27 | Page
3.2.2.3 Preparation for reuse
Preparation for reuse should equal to the repair of the device to ensure that it is functioning
correctly. However, this is highly dependent on each repair case and each laptop requires
personal attention. Indeed, one may require an entire LCA study only on different repair types
(Bovea et al., 2020). Therefore, a repair facility’s average energy consumption is used instead.
The Inrego facility in Sweden handles approximately 200,000 laptops with 0.5 GWh of
electricity (André et al., 2019). This is converted to one laptop for this LCA: 2.5 kWh of
electricity for the treatment of one laptop.
3.2.2.4 End-of-life treatment
Two EoL methods are required to fulfill the scope: recycling or incinerating a laptop. First of
all, it is important to note that EEE does not, or to a very negligeable extent, lose materials to
its surroundings during use (Ciacci et al., 2015). Hence, all flows sent to waste treatment are
equal to the quantities described in Table 3. Composition of an average laptop, adapted from
Babbitt et al. (2020)Table 3.
The recycling step is based off of ecoinvent’s WEEE treatment (Hischier, 2007) and split into
three sections. The first is the manual separation treatment, defined by the ecoinvent flow
WEEE scrap manual treatment plant. The second is the subsequent treatment of each
separated fraction in its respective disposal treatment. These are as follows. Plastics are sent
to the disposal, plastic, consumer electronics stream to municipal incineration. The PCB is
sent to the disposal, treatment of printed wiring boards stream. Metals are sent to the
dismantling, shredder fraction from manual dismantling, mechanically, at plant stream. The
battery is sent to the disposal, Li-ions batteries, mixed technology stream. Finally, the screen
is sent to the disposal, LCD module, to municipal waste incineration stream.
The third part of the recycling is the avoided burdens. These are calculated from the
recyclability of each material from WEEE scrap compared to its quantity in the original laptop.
Van Eygen et al. (2016) give a 96%, 86% and 60% recovery for steel, aluminium and copper,
respectively. For steel, the avoided product is taken as low-alloyed steel because secondary
raw materials obtained from recycling can be lower quality than the typical primary raw
material (Hischier & Böni, 2021). As for aluminium and magnesium, both become cast alloys
of aluminium because magnesium is not separated from the aluminium recycling stream due
to low market prices (André et al., 2019). Finally, Wang et al. (2014) give an 89% recovery of
cobalt from Li-ion battery recycling. Recycled copper and cobalt are assumed to be sent back
to the general market for each substance.
For the incineration life cycle step, it is assumed that each material or component from the
laptop is incinerated. Therefore, each stream coming in (Table 3) is sent to an ecoinvent waste
Chapter 3 – Materials and methods 3.3. Life Cycle Impact Assessment
28 | Page
treatment flow. Steel, copper and aluminium are sent to treatment of scrap steel, copper, and
aluminium through municipal incineration respectively, the plastics are sent to the municipal
incineration of waste expanded polystyrene, the screen is sent to the treatment of used liquid
crystal display module through municipal waste incineration, and the PCB and battery are sent
to hazardous waste incineration.
3.2.2.5 Transportation
To find how far the manufactured laptop must go to reach Belgium, the location of the
consumer, one of the laptops seen in Appendix 2 is chosen. This is the HP laptop dk-14 series.
The final assembly for an HP laptop may occur at one of HP’s final assembly suppliers in the
province of Jiangsu in China (André et al., 2019). It is therefore assumed that the final product
is transported over 100 km by lorry to the port of Shanghai. Then, the product is shipped 10530
nautical miles or 19500 km to the port of Antwerp (Sea-distances, n.d.). Once again, the laptop
is put in a truck to go 60 km to Brussels, where it is sold, and the customer is assumed to drive
5 km in their personal car to bring it home, as given by the PEFCR guidelines (EC, 2018).
The reuse scenario assumes that the laptop is driven 5 km again to a repair shop in a personal
car and then back. Finally, for the EoL treatment of all devices, it is assumed that the customer
drops the device near their home and that it is transported 15 km by lorry to a disposal or
recycling facility outside the city of Brussels.
3.3. Life Cycle Impact Assessment
The software SimaPro 9.1.0.11 is used in conjunction to the ecoinvent 3.6 database and the
above-mentioned LCI to gather the relevant data. This data is organised following the scope
of the LCA. The software then performs calculations to convert flows to impacts for ease of
comparison.
3.3.1. Impact categories
As part of the focus of this work on resource efficiency and material analysis, three impact
categories are chosen first. They are recommended in the ILCD handbook when assessing
the environmental impact of resource use (Hauschild et al., 2011). Indeed, they give a good
overview of the four categories of impact assessment methods for resource consumption
defined by Hauschild et al. (2011) (Tran et al., 2018). The first impact category is Cumulative
Exergy Extraction from the Natural Environment (CEENE) by Dewulf et al. (2007). Here,
CEENE 2013 v1.00 for ecoinvent 3.6 is used and the impact is presented in terms of exergy
with the unit MJex. Then, Abiotic Depletion Potential (ADP) from the Centrum voor
Milieuwetenschappen (CML) methodology v3.06 by Guinée (2002) is chosen. It is split
Chapter 3 – Materials and methods 3.3. Life Cycle Impact Assessment
29 | Page
between two categories: elements (ADPel) in g Sb-eq and fossil fuels (ADPff) in MJ. The third
is Resource Cost (RC), or damage to resources in dollars (USD2013), from the ReCiPe 2016
endpoint (H) methodology v1.04 by Goedkoop et al. (2009).
Two other impact categories recommended by the ILCD handbook, and relevant to durability
studies as they are a good summary of many other indicators, are chosen as well (Ardente &
Mathieux, 2014). These are the Global Warming Potential (GWP) in kg CO2-eq from the
ReCiPe 2016 Midpoint (H) methodology v1.04 by Goedkoop et al. (2009) and Terrestrial
Ecotoxicity (TE) in kg 1,4-DCB from the CML methodology v3.06 by Guinée (2002). Finally,
Cumulative Energy Demand (CED) v1.11 in MJ is an important measure of general energy
use. As EEE not only require energy during supply and disposal but also during use, it is
relevant to this thesis. In truth, it is recommended by the “General principles for an
environmental communication on mass market products” standard for EEE, or BP X30-323-9
(ADEME et al., 2017).
These seven impact categories give a well-rounded basis for an analysis of resource
efficiency, durability, and energy efficiency of EEE.
3.3.2. Criticality assessment
Finally, CIAM is also employed as an impact catefory in this analysis but is discussed
separately in the text due to its novalty and its necessity of calculations outside of the SimaPro
software. Just like the other impact categories, CIAM uses characterisation factors to convert
elementary flow data to an impact unit. In this case, the impact unit is the criticality score,
measured in points (Pts). The characterisation factors for each flow are based on the SR and
EI values defined by the EU for all substance that they studied (Blengini et al., 2020). However,
as the raw materials evaluated in the CRM report may not be resources but a material already
resulting from human intervention, equivalent criticality ratios are defined for each elementary
flow by following a set of rules (see Appendix 3) (Tran et al., 2018). Appendix 3 also gives the
equivalent criticality scores for all elementary flows of resources as seen in SimaPro. The
equivalent criticality scores were updated from (Tran et al., 2018) with the most up to date
CRM data, published in 2020 (Blengini et al., 2020).
Then, the elementary flows for the defined life cycle steps of this LCA are extracted from the
SimaPro software and filtered to keep the resources relevant to the CIAM. Therefore, water,
land use, and occupation flows, among others, are removed. A criticality score per life cycle
step is defined by summing the impact of each flow (found by multiplying a flow’s amount
within a step to the equivalent criticality ratio). Then, each scenario is built as defined in the
scope and the results are calculated and shown with the other impact categories in Chapter
4, along with the interpretation step.
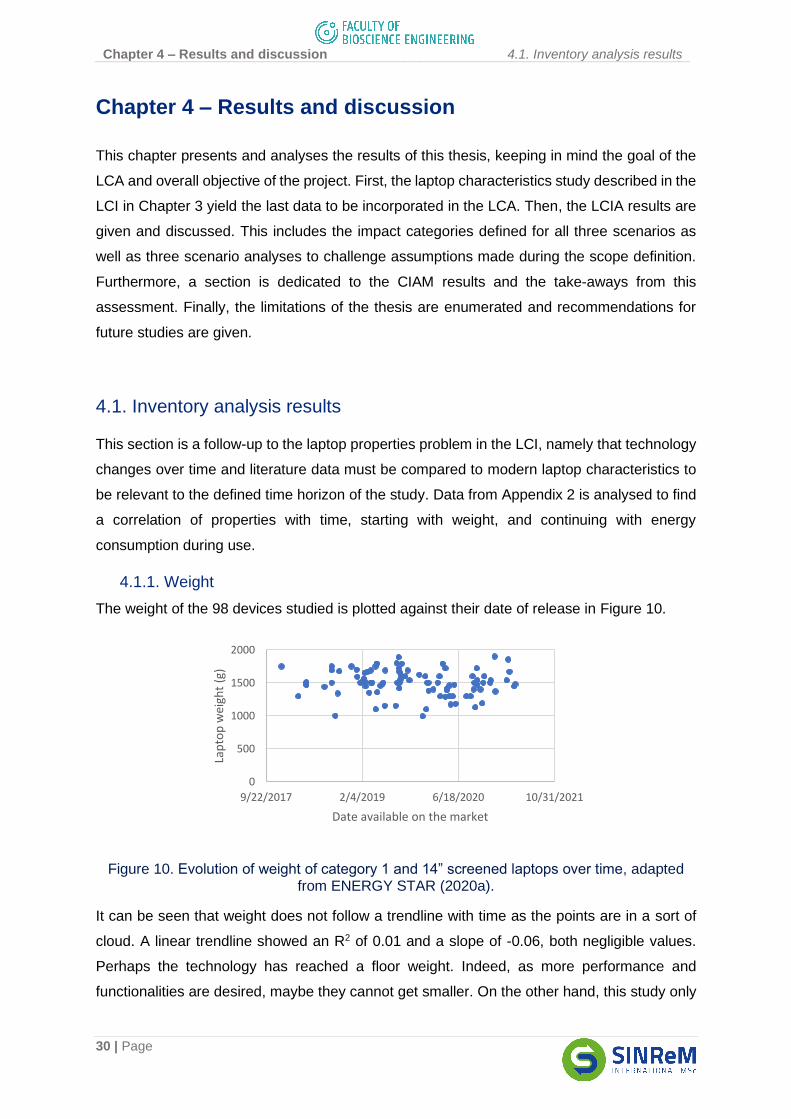
Chapter 4 – Results and discussion 4.1. Inventory analysis results
30 | Page
Chapter 4 – Results and discussion
This chapter presents and analyses the results of this thesis, keeping in mind the goal of the
LCA and overall objective of the project. First, the laptop characteristics study described in the
LCI in Chapter 3 yield the last data to be incorporated in the LCA. Then, the LCIA results are
given and discussed. This includes the impact categories defined for all three scenarios as
well as three scenario analyses to challenge assumptions made during the scope definition.
Furthermore, a section is dedicated to the CIAM results and the take-aways from this
assessment. Finally, the limitations of the thesis are enumerated and recommendations for
future studies are given.
4.1. Inventory analysis results
This section is a follow-up to the laptop properties problem in the LCI, namely that technology
changes over time and literature data must be compared to modern laptop characteristics to
be relevant to the defined time horizon of the study. Data from Appendix 2 is analysed to find
a correlation of properties with time, starting with weight, and continuing with energy
consumption during use.
4.1.1. Weight
The weight of the 98 devices studied is plotted against their date of release in Figure 10.
Figure 10. Evolution of weight of category 1 and 14” screened laptops over time, adapted from ENERGY STAR (2020a).
It can be seen that weight does not follow a trendline with time as the points are in a sort of
cloud. A linear trendline showed an R2 of 0.01 and a slope of -0.06, both negligible values.
Perhaps the technology has reached a floor weight. Indeed, as more performance and
functionalities are desired, maybe they cannot get smaller. On the other hand, this study only
0
500
1000
1500
2000
9/22/2017 2/4/2019 6/18/2020 10/31/2021
Lap
top
wei
ght
(g)
Date available on the market
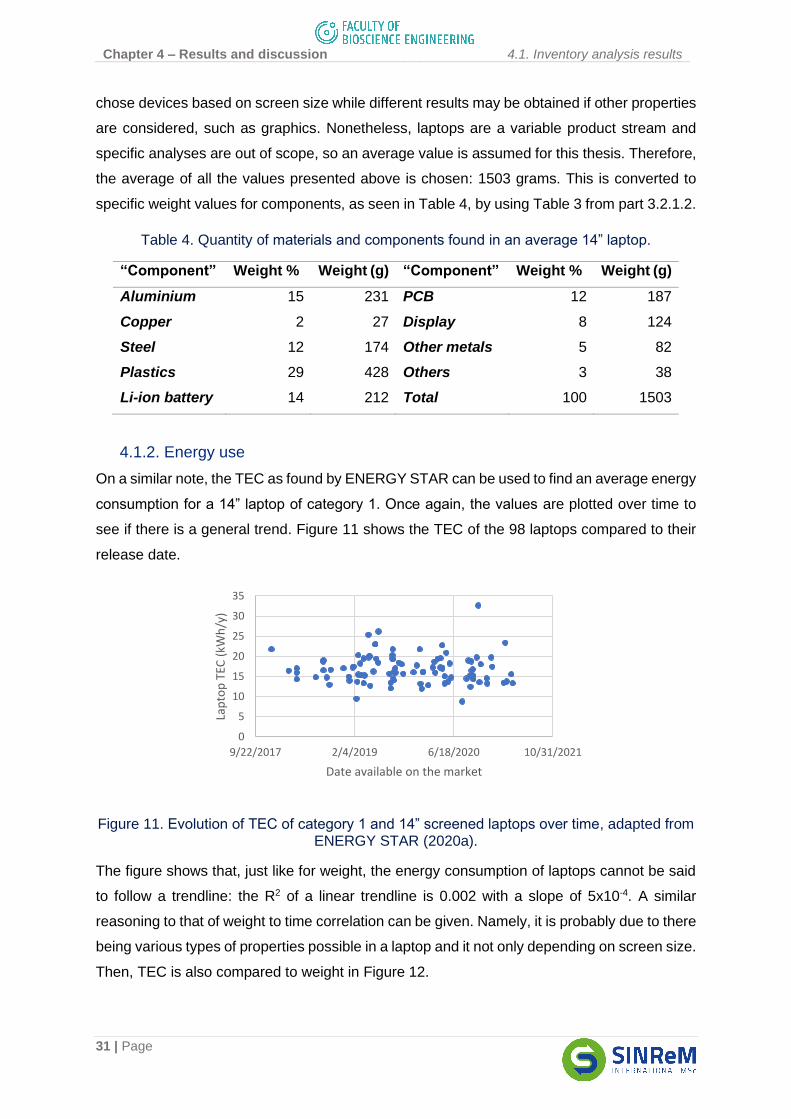
Chapter 4 – Results and discussion 4.1. Inventory analysis results
31 | Page
chose devices based on screen size while different results may be obtained if other properties
are considered, such as graphics. Nonetheless, laptops are a variable product stream and
specific analyses are out of scope, so an average value is assumed for this thesis. Therefore,
the average of all the values presented above is chosen: 1503 grams. This is converted to
specific weight values for components, as seen in Table 4, by using Table 3 from part 3.2.1.2.
Table 4. Quantity of materials and components found in an average 14” laptop.
“Component” Weight % Weight (g) “Component” Weight % Weight (g)
Aluminium 15 231 PCB 12 187
Copper 2 27 Display 8 124
Steel 12 174 Other metals 5 82
Plastics 29 428 Others 3 38
Li-ion battery 14 212 Total 100 1503
4.1.2. Energy use
On a similar note, the TEC as found by ENERGY STAR can be used to find an average energy
consumption for a 14” laptop of category 1. Once again, the values are plotted over time to
see if there is a general trend. Figure 11 shows the TEC of the 98 laptops compared to their
release date.
Figure 11. Evolution of TEC of category 1 and 14” screened laptops over time, adapted from ENERGY STAR (2020a).
The figure shows that, just like for weight, the energy consumption of laptops cannot be said
to follow a trendline: the R2 of a linear trendline is 0.002 with a slope of 5x10⁻⁴. A similar
reasoning to that of weight to time correlation can be given. Namely, it is probably due to there
being various types of properties possible in a laptop and it not only depending on screen size.
Then, TEC is also compared to weight in Figure 12.
0
5
10
15
20
25
30
35
9/22/2017 2/4/2019 6/18/2020 10/31/2021
Lap
top
TEC
(kW
h/y
)
Date available on the market
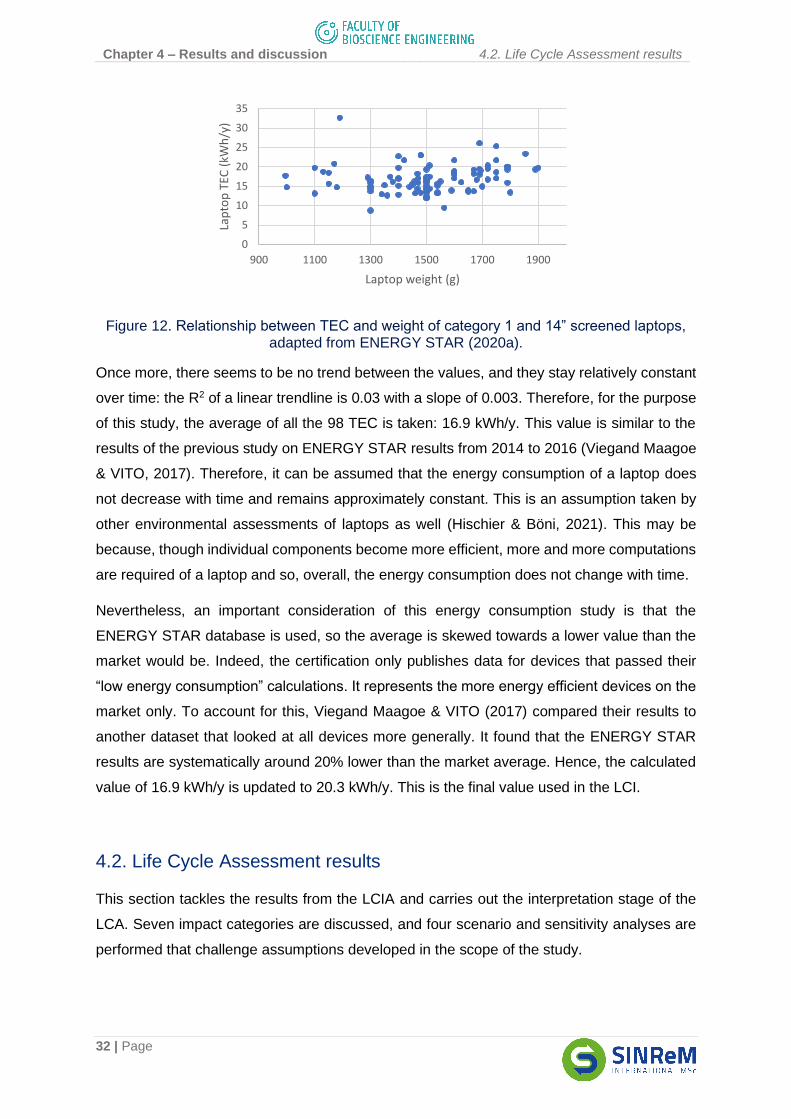
Chapter 4 – Results and discussion 4.2. Life Cycle Assessment results
32 | Page
Figure 12. Relationship between TEC and weight of category 1 and 14” screened laptops, adapted from ENERGY STAR (2020a).
Once more, there seems to be no trend between the values, and they stay relatively constant
over time: the R2 of a linear trendline is 0.03 with a slope of 0.003. Therefore, for the purpose
of this study, the average of all the 98 TEC is taken: 16.9 kWh/y. This value is similar to the
results of the previous study on ENERGY STAR results from 2014 to 2016 (Viegand Maagoe
& VITO, 2017). Therefore, it can be assumed that the energy consumption of a laptop does
not decrease with time and remains approximately constant. This is an assumption taken by
other environmental assessments of laptops as well (Hischier & Böni, 2021). This may be
because, though individual components become more efficient, more and more computations
are required of a laptop and so, overall, the energy consumption does not change with time.
Nevertheless, an important consideration of this energy consumption study is that the
ENERGY STAR database is used, so the average is skewed towards a lower value than the
market would be. Indeed, the certification only publishes data for devices that passed their
“low energy consumption” calculations. It represents the more energy efficient devices on the
market only. To account for this, Viegand Maagoe & VITO (2017) compared their results to
another dataset that looked at all devices more generally. It found that the ENERGY STAR
results are systematically around 20% lower than the market average. Hence, the calculated
value of 16.9 kWh/y is updated to 20.3 kWh/y. This is the final value used in the LCI.
4.2. Life Cycle Assessment results
This section tackles the results from the LCIA and carries out the interpretation stage of the
LCA. Seven impact categories are discussed, and four scenario and sensitivity analyses are
performed that challenge assumptions developed in the scope of the study.
0
5
10
15
20
25
30
35
900 1100 1300 1500 1700 1900
Lap
top
TEC
(kW
h/y
)
Laptop weight (g)
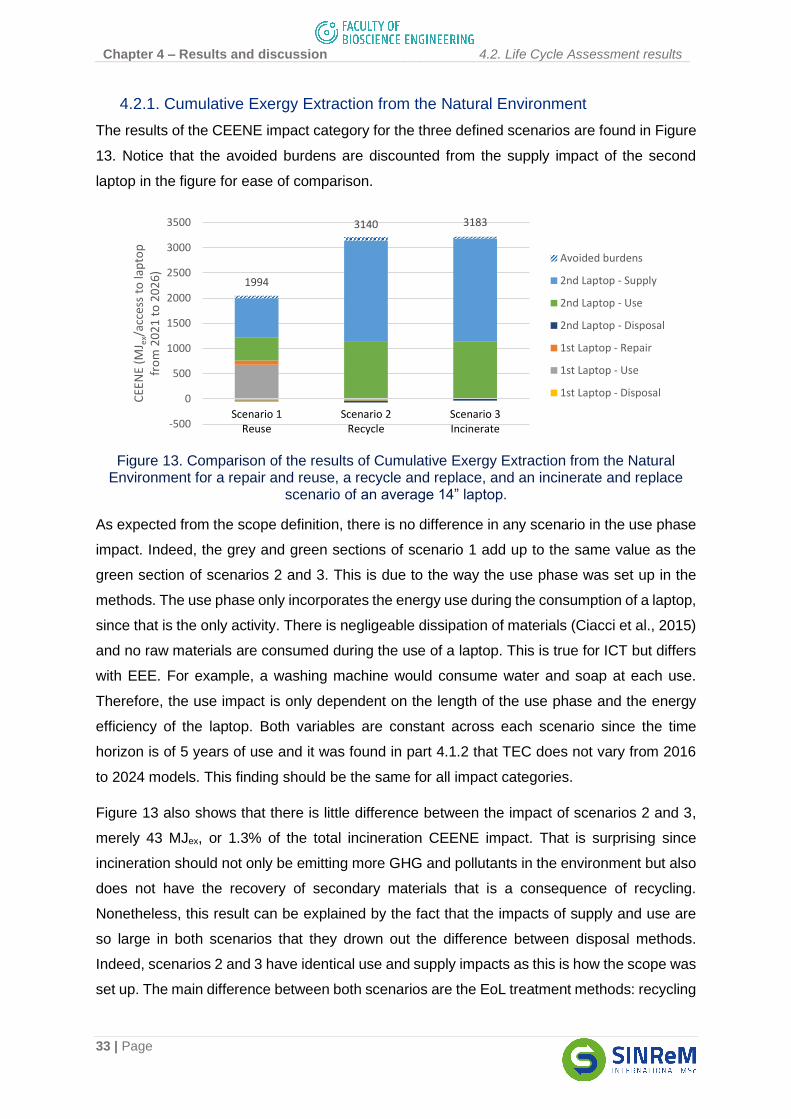
Chapter 4 – Results and discussion 4.2. Life Cycle Assessment results
33 | Page
4.2.1. Cumulative Exergy Extraction from the Natural Environment
The results of the CEENE impact category for the three defined scenarios are found in Figure
13. Notice that the avoided burdens are discounted from the supply impact of the second
laptop in the figure for ease of comparison.
Figure 13. Comparison of the results of Cumulative Exergy Extraction from the Natural Environment for a repair and reuse, a recycle and replace, and an incinerate and replace
scenario of an average 14” laptop.
As expected from the scope definition, there is no difference in any scenario in the use phase
impact. Indeed, the grey and green sections of scenario 1 add up to the same value as the
green section of scenarios 2 and 3. This is due to the way the use phase was set up in the
methods. The use phase only incorporates the energy use during the consumption of a laptop,
since that is the only activity. There is negligeable dissipation of materials (Ciacci et al., 2015)
and no raw materials are consumed during the use of a laptop. This is true for ICT but differs
with EEE. For example, a washing machine would consume water and soap at each use.
Therefore, the use impact is only dependent on the length of the use phase and the energy
efficiency of the laptop. Both variables are constant across each scenario since the time
horizon is of 5 years of use and it was found in part 4.1.2 that TEC does not vary from 2016
to 2024 models. This finding should be the same for all impact categories.
Figure 13 also shows that there is little difference between the impact of scenarios 2 and 3,
merely 43 MJex, or 1.3% of the total incineration CEENE impact. That is surprising since
incineration should not only be emitting more GHG and pollutants in the environment but also
does not have the recovery of secondary materials that is a consequence of recycling.
Nonetheless, this result can be explained by the fact that the impacts of supply and use are
so large in both scenarios that they drown out the difference between disposal methods.
Indeed, scenarios 2 and 3 have identical use and supply impacts as this is how the scope was
set up. The main difference between both scenarios are the EoL treatment methods: recycling
1994
3140 3183
-500
0
500
1000
1500
2000
2500
3000
3500
Scenario 1Reuse
Scenario 2Recycle
Scenario 3Incinerate
CEE
NE
(MJ e
x/ac
cess
to
lap
top
fr
om
20
21
to
20
26
)
Avoided burdens
2nd Laptop - Supply
2nd Laptop - Use
2nd Laptop - Disposal
1st Laptop - Repair
1st Laptop - Use
1st Laptop - Disposal
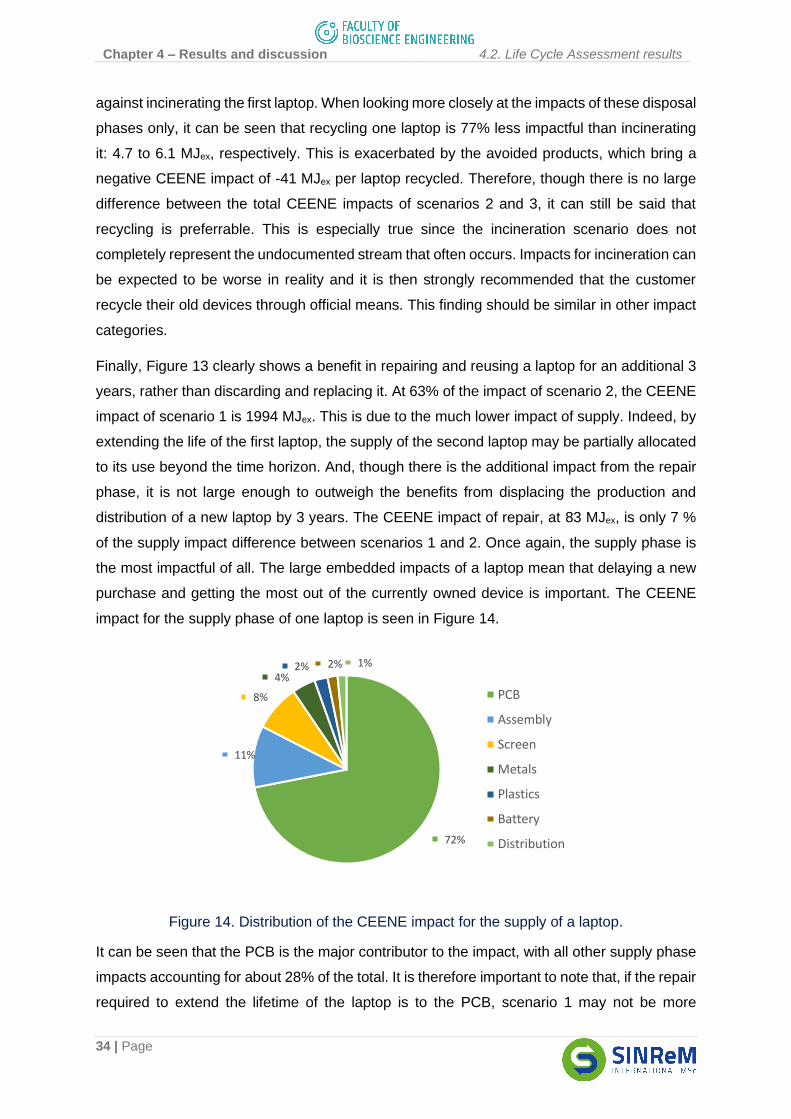
Chapter 4 – Results and discussion 4.2. Life Cycle Assessment results
34 | Page
against incinerating the first laptop. When looking more closely at the impacts of these disposal
phases only, it can be seen that recycling one laptop is 77% less impactful than incinerating
it: 4.7 to 6.1 MJex, respectively. This is exacerbated by the avoided products, which bring a
negative CEENE impact of -41 MJex per laptop recycled. Therefore, though there is no large
difference between the total CEENE impacts of scenarios 2 and 3, it can still be said that
recycling is preferrable. This is especially true since the incineration scenario does not
completely represent the undocumented stream that often occurs. Impacts for incineration can
be expected to be worse in reality and it is then strongly recommended that the customer
recycle their old devices through official means. This finding should be similar in other impact
categories.
Finally, Figure 13 clearly shows a benefit in repairing and reusing a laptop for an additional 3
years, rather than discarding and replacing it. At 63% of the impact of scenario 2, the CEENE
impact of scenario 1 is 1994 MJex. This is due to the much lower impact of supply. Indeed, by
extending the life of the first laptop, the supply of the second laptop may be partially allocated
to its use beyond the time horizon. And, though there is the additional impact from the repair
phase, it is not large enough to outweigh the benefits from displacing the production and
distribution of a new laptop by 3 years. The CEENE impact of repair, at 83 MJex, is only 7 %
of the supply impact difference between scenarios 1 and 2. Once again, the supply phase is
the most impactful of all. The large embedded impacts of a laptop mean that delaying a new
purchase and getting the most out of the currently owned device is important. The CEENE
impact for the supply phase of one laptop is seen in Figure 14.
Figure 14. Distribution of the CEENE impact for the supply of a laptop.
It can be seen that the PCB is the major contributor to the impact, with all other supply phase
impacts accounting for about 28% of the total. It is therefore important to note that, if the repair
required to extend the lifetime of the laptop is to the PCB, scenario 1 may not be more
72%
11%
8%
4%2% 2% 1%
PCB
Assembly
Screen
Metals
Plastics
Battery
Distribution
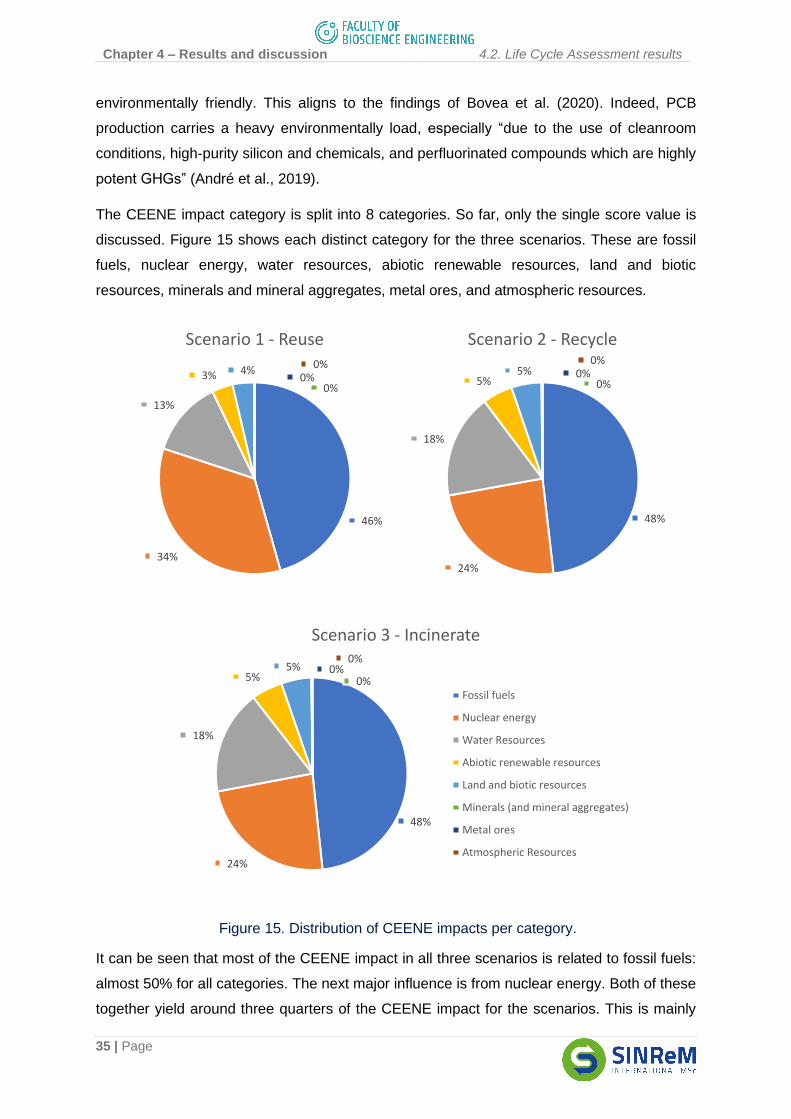
Chapter 4 – Results and discussion 4.2. Life Cycle Assessment results
35 | Page
environmentally friendly. This aligns to the findings of Bovea et al. (2020). Indeed, PCB
production carries a heavy environmentally load, especially “due to the use of cleanroom
conditions, high-purity silicon and chemicals, and perfluorinated compounds which are highly
potent GHGs” (André et al., 2019).
The CEENE impact category is split into 8 categories. So far, only the single score value is
discussed. Figure 15 shows each distinct category for the three scenarios. These are fossil
fuels, nuclear energy, water resources, abiotic renewable resources, land and biotic
resources, minerals and mineral aggregates, metal ores, and atmospheric resources.
Figure 15. Distribution of CEENE impacts per category.
It can be seen that most of the CEENE impact in all three scenarios is related to fossil fuels:
almost 50% for all categories. The next major influence is from nuclear energy. Both of these
together yield around three quarters of the CEENE impact for the scenarios. This is mainly
46%
34%
13%
3% 4%
0%0%
0%
Scenario 1 - Reuse
48%
24%
18%
5%5%
0%0%
0%
Scenario 2 - Recycle
48%
24%
18%
5%5%
0%0%
0%
Scenario 3 - Incinerate
Fossil fuels
Nuclear energy
Water Resources
Abiotic renewable resources
Land and biotic resources
Minerals (and mineral aggregates)
Metal ores
Atmospheric Resources
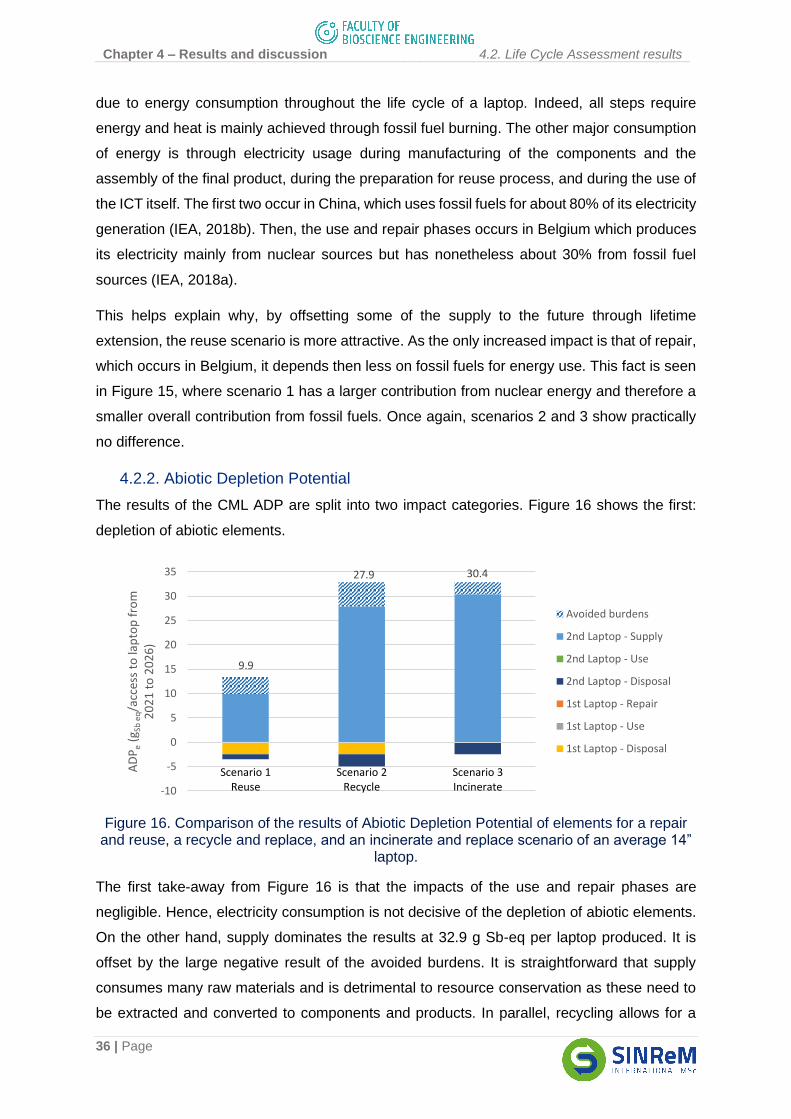
Chapter 4 – Results and discussion 4.2. Life Cycle Assessment results
36 | Page
due to energy consumption throughout the life cycle of a laptop. Indeed, all steps require
energy and heat is mainly achieved through fossil fuel burning. The other major consumption
of energy is through electricity usage during manufacturing of the components and the
assembly of the final product, during the preparation for reuse process, and during the use of
the ICT itself. The first two occur in China, which uses fossil fuels for about 80% of its electricity
generation (IEA, 2018b). Then, the use and repair phases occurs in Belgium which produces
its electricity mainly from nuclear sources but has nonetheless about 30% from fossil fuel
sources (IEA, 2018a).
This helps explain why, by offsetting some of the supply to the future through lifetime
extension, the reuse scenario is more attractive. As the only increased impact is that of repair,
which occurs in Belgium, it depends then less on fossil fuels for energy use. This fact is seen
in Figure 15, where scenario 1 has a larger contribution from nuclear energy and therefore a
smaller overall contribution from fossil fuels. Once again, scenarios 2 and 3 show practically
no difference.
4.2.2. Abiotic Depletion Potential
The results of the CML ADP are split into two impact categories. Figure 16 shows the first:
depletion of abiotic elements.
Figure 16. Comparison of the results of Abiotic Depletion Potential of elements for a repair and reuse, a recycle and replace, and an incinerate and replace scenario of an average 14”
laptop.
The first take-away from Figure 16 is that the impacts of the use and repair phases are
negligible. Hence, electricity consumption is not decisive of the depletion of abiotic elements.
On the other hand, supply dominates the results at 32.9 g Sb-eq per laptop produced. It is
offset by the large negative result of the avoided burdens. It is straightforward that supply
consumes many raw materials and is detrimental to resource conservation as these need to
be extracted and converted to components and products. In parallel, recycling allows for a
9.9
27.9 30.4
-10
-5
0
5
10
15
20
25
30
35
Scenario 1Reuse
Scenario 2Recycle
Scenario 3Incinerate
AD
Pe
(gSb
eq/a
cces
s to
lap
top
fro
m
20
21
to
20
26
)
Avoided burdens
2nd Laptop - Supply
2nd Laptop - Use
2nd Laptop - Disposal
1st Laptop - Repair
1st Laptop - Use
1st Laptop - Disposal
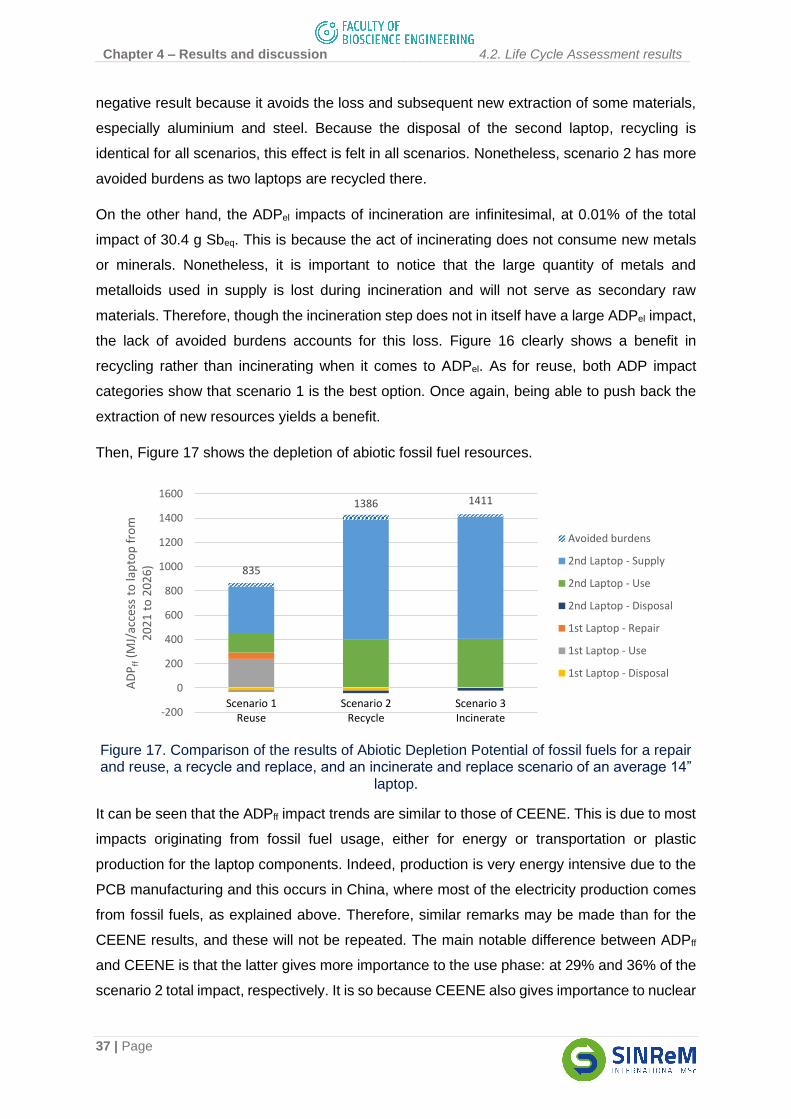
Chapter 4 – Results and discussion 4.2. Life Cycle Assessment results
37 | Page
negative result because it avoids the loss and subsequent new extraction of some materials,
especially aluminium and steel. Because the disposal of the second laptop, recycling is
identical for all scenarios, this effect is felt in all scenarios. Nonetheless, scenario 2 has more
avoided burdens as two laptops are recycled there.
On the other hand, the ADPel impacts of incineration are infinitesimal, at 0.01% of the total
impact of 30.4 g Sbeq. This is because the act of incinerating does not consume new metals
or minerals. Nonetheless, it is important to notice that the large quantity of metals and
metalloids used in supply is lost during incineration and will not serve as secondary raw
materials. Therefore, though the incineration step does not in itself have a large ADPel impact,
the lack of avoided burdens accounts for this loss. Figure 16 clearly shows a benefit in
recycling rather than incinerating when it comes to ADPel. As for reuse, both ADP impact
categories show that scenario 1 is the best option. Once again, being able to push back the
extraction of new resources yields a benefit.
Then, Figure 17 shows the depletion of abiotic fossil fuel resources.
Figure 17. Comparison of the results of Abiotic Depletion Potential of fossil fuels for a repair and reuse, a recycle and replace, and an incinerate and replace scenario of an average 14”
laptop.
It can be seen that the ADPff impact trends are similar to those of CEENE. This is due to most
impacts originating from fossil fuel usage, either for energy or transportation or plastic
production for the laptop components. Indeed, production is very energy intensive due to the
PCB manufacturing and this occurs in China, where most of the electricity production comes
from fossil fuels, as explained above. Therefore, similar remarks may be made than for the
CEENE results, and these will not be repeated. The main notable difference between ADPff
and CEENE is that the latter gives more importance to the use phase: at 29% and 36% of the
scenario 2 total impact, respectively. It is so because CEENE also gives importance to nuclear
835
1386 1411
-200
0
200
400
600
800
1000
1200
1400
1600
Scenario 1Reuse
Scenario 2Recycle
Scenario 3Incinerate
AD
Pff
(MJ/
acce
ss t
o la
pto
p f
rom
2
02
1 t
o 2
02
6)
Avoided burdens
2nd Laptop - Supply
2nd Laptop - Use
2nd Laptop - Disposal
1st Laptop - Repair
1st Laptop - Use
1st Laptop - Disposal
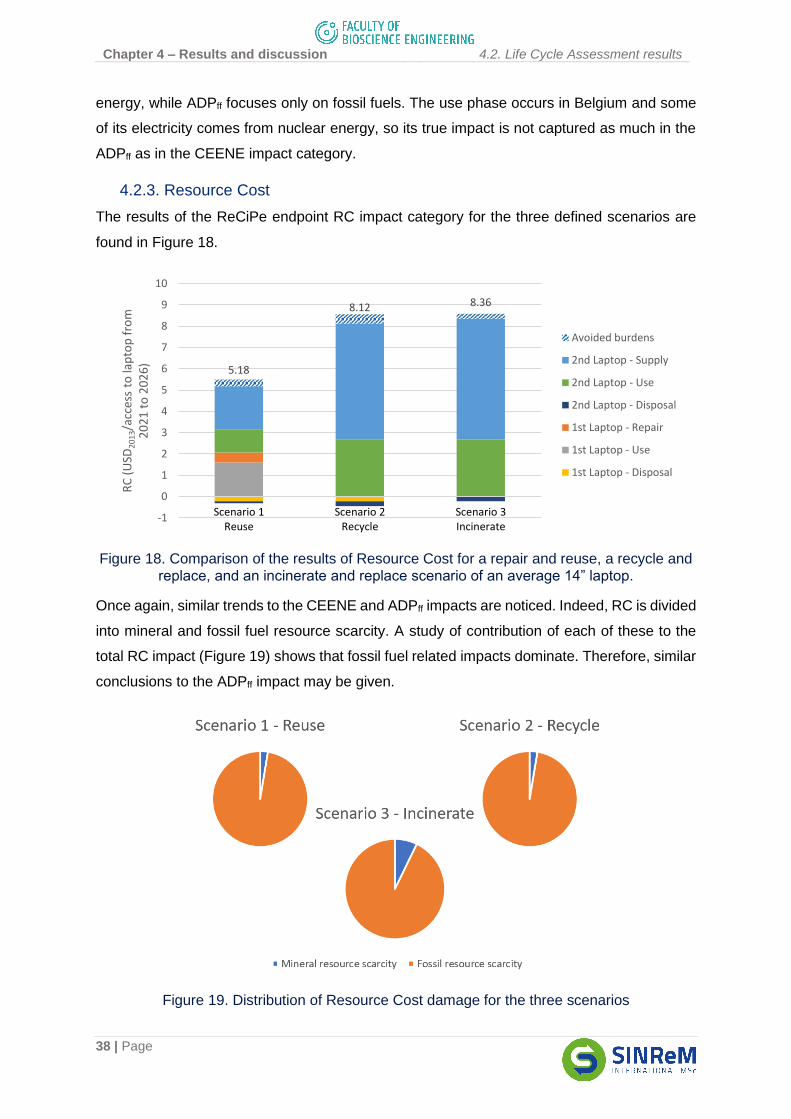
Chapter 4 – Results and discussion 4.2. Life Cycle Assessment results
38 | Page
energy, while ADPff focuses only on fossil fuels. The use phase occurs in Belgium and some
of its electricity comes from nuclear energy, so its true impact is not captured as much in the
ADPff as in the CEENE impact category.
4.2.3. Resource Cost
The results of the ReCiPe endpoint RC impact category for the three defined scenarios are
found in Figure 18.
Figure 18. Comparison of the results of Resource Cost for a repair and reuse, a recycle and replace, and an incinerate and replace scenario of an average 14” laptop.
Once again, similar trends to the CEENE and ADPff impacts are noticed. Indeed, RC is divided
into mineral and fossil fuel resource scarcity. A study of contribution of each of these to the
total RC impact (Figure 19) shows that fossil fuel related impacts dominate. Therefore, similar
conclusions to the ADPff impact may be given.
Figure 19. Distribution of Resource Cost damage for the three scenarios
5.18
8.12 8.36
-1
0
1
2
3
4
5
6
7
8
9
10
Scenario 1Reuse
Scenario 2Recycle
Scenario 3Incinerate
RC
(U
SD2
01
3/ac
cess
to
lap
top
fro
m
20
21
to
20
26
)
Avoided burdens
2nd Laptop - Supply
2nd Laptop - Use
2nd Laptop - Disposal
1st Laptop - Repair
1st Laptop - Use
1st Laptop - Disposal
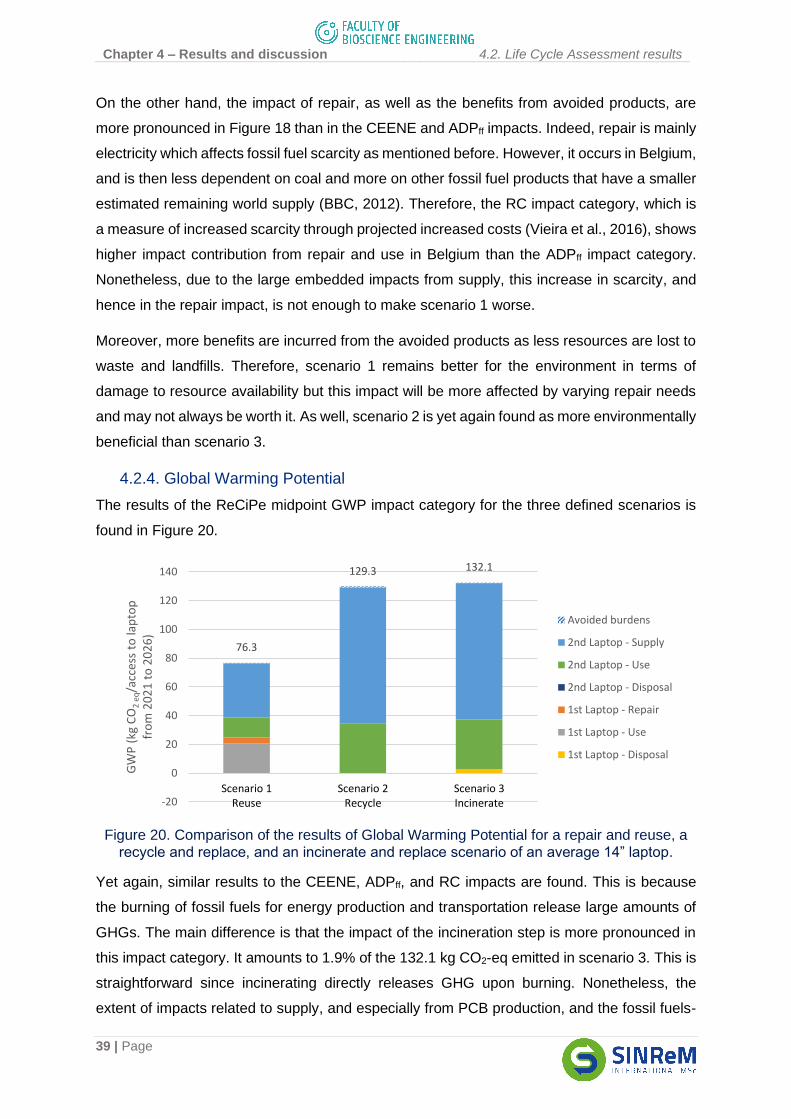
Chapter 4 – Results and discussion 4.2. Life Cycle Assessment results
39 | Page
On the other hand, the impact of repair, as well as the benefits from avoided products, are
more pronounced in Figure 18 than in the CEENE and ADPff impacts. Indeed, repair is mainly
electricity which affects fossil fuel scarcity as mentioned before. However, it occurs in Belgium,
and is then less dependent on coal and more on other fossil fuel products that have a smaller
estimated remaining world supply (BBC, 2012). Therefore, the RC impact category, which is
a measure of increased scarcity through projected increased costs (Vieira et al., 2016), shows
higher impact contribution from repair and use in Belgium than the ADPff impact category.
Nonetheless, due to the large embedded impacts from supply, this increase in scarcity, and
hence in the repair impact, is not enough to make scenario 1 worse.
Moreover, more benefits are incurred from the avoided products as less resources are lost to
waste and landfills. Therefore, scenario 1 remains better for the environment in terms of
damage to resource availability but this impact will be more affected by varying repair needs
and may not always be worth it. As well, scenario 2 is yet again found as more environmentally
beneficial than scenario 3.
4.2.4. Global Warming Potential
The results of the ReCiPe midpoint GWP impact category for the three defined scenarios is
found in Figure 20.
Figure 20. Comparison of the results of Global Warming Potential for a repair and reuse, a recycle and replace, and an incinerate and replace scenario of an average 14” laptop.
Yet again, similar results to the CEENE, ADPff, and RC impacts are found. This is because
the burning of fossil fuels for energy production and transportation release large amounts of
GHGs. The main difference is that the impact of the incineration step is more pronounced in
this impact category. It amounts to 1.9% of the 132.1 kg CO2-eq emitted in scenario 3. This is
straightforward since incinerating directly releases GHG upon burning. Nonetheless, the
extent of impacts related to supply, and especially from PCB production, and the fossil fuels-
76.3
129.3 132.1
-20
0
20
40
60
80
100
120
140
Scenario 1Reuse
Scenario 2Recycle
Scenario 3Incinerate
GW
P (
kg C
O2
eq/a
cces
s to
lap
top
fr
om
20
21
to
20
26
)
Avoided burdens
2nd Laptop - Supply
2nd Laptop - Use
2nd Laptop - Disposal
1st Laptop - Repair
1st Laptop - Use
1st Laptop - Disposal
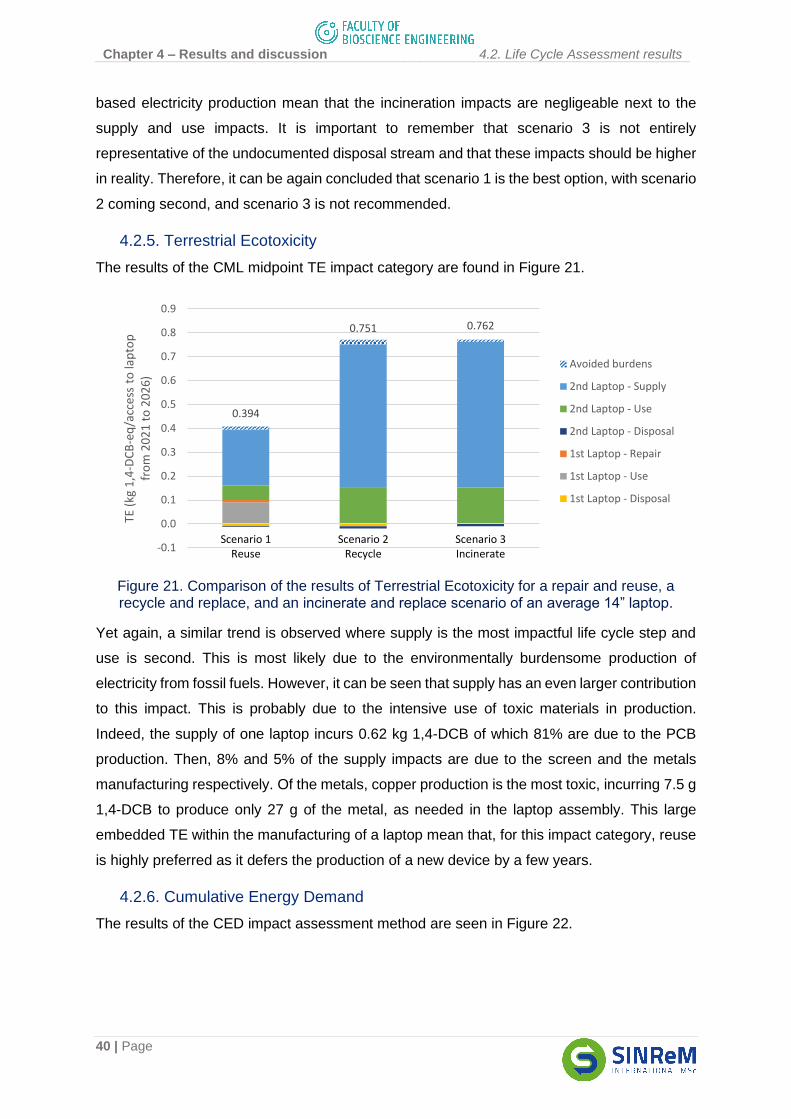
Chapter 4 – Results and discussion 4.2. Life Cycle Assessment results
40 | Page
based electricity production mean that the incineration impacts are negligeable next to the
supply and use impacts. It is important to remember that scenario 3 is not entirely
representative of the undocumented disposal stream and that these impacts should be higher
in reality. Therefore, it can be again concluded that scenario 1 is the best option, with scenario
2 coming second, and scenario 3 is not recommended.
4.2.5. Terrestrial Ecotoxicity
The results of the CML midpoint TE impact category are found in Figure 21.
Figure 21. Comparison of the results of Terrestrial Ecotoxicity for a repair and reuse, a recycle and replace, and an incinerate and replace scenario of an average 14” laptop.
Yet again, a similar trend is observed where supply is the most impactful life cycle step and
use is second. This is most likely due to the environmentally burdensome production of
electricity from fossil fuels. However, it can be seen that supply has an even larger contribution
to this impact. This is probably due to the intensive use of toxic materials in production.
Indeed, the supply of one laptop incurs 0.62 kg 1,4-DCB of which 81% are due to the PCB
production. Then, 8% and 5% of the supply impacts are due to the screen and the metals
manufacturing respectively. Of the metals, copper production is the most toxic, incurring 7.5 g
1,4-DCB to produce only 27 g of the metal, as needed in the laptop assembly. This large
embedded TE within the manufacturing of a laptop mean that, for this impact category, reuse
is highly preferred as it defers the production of a new device by a few years.
4.2.6. Cumulative Energy Demand
The results of the CED impact assessment method are seen in Figure 22.
0.394
0.751 0.762
-0.1
0.0
0.1
0.2
0.3
0.4
0.5
0.6
0.7
0.8
0.9
Scenario 1Reuse
Scenario 2Recycle
Scenario 3Incinerate
TE (
kg 1
,4-D
CB
-eq
/acc
ess
to la
pto
p
fro
m 2
02
1 t
o 2
02
6)
Avoided burdens
2nd Laptop - Supply
2nd Laptop - Use
2nd Laptop - Disposal
1st Laptop - Repair
1st Laptop - Use
1st Laptop - Disposal
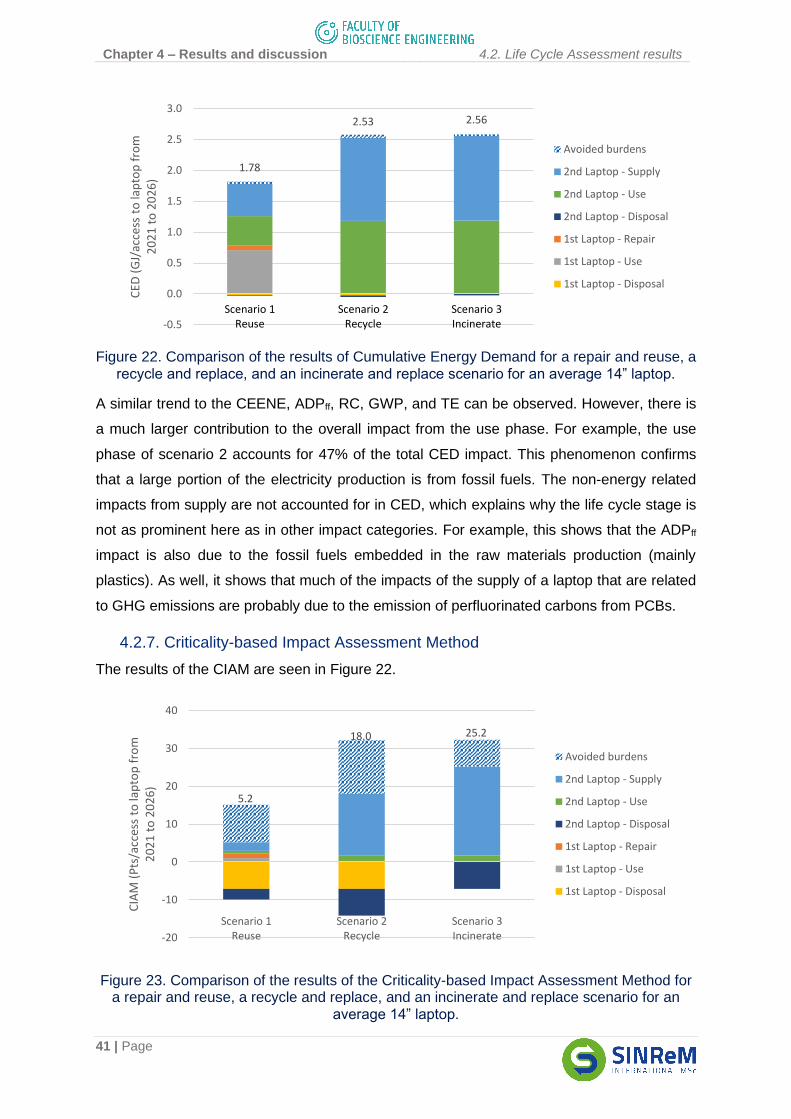
Chapter 4 – Results and discussion 4.2. Life Cycle Assessment results
41 | Page
Figure 22. Comparison of the results of Cumulative Energy Demand for a repair and reuse, a recycle and replace, and an incinerate and replace scenario for an average 14” laptop.
A similar trend to the CEENE, ADPff, RC, GWP, and TE can be observed. However, there is
a much larger contribution to the overall impact from the use phase. For example, the use
phase of scenario 2 accounts for 47% of the total CED impact. This phenomenon confirms
that a large portion of the electricity production is from fossil fuels. The non-energy related
impacts from supply are not accounted for in CED, which explains why the life cycle stage is
not as prominent here as in other impact categories. For example, this shows that the ADPff
impact is also due to the fossil fuels embedded in the raw materials production (mainly
plastics). As well, it shows that much of the impacts of the supply of a laptop that are related
to GHG emissions are probably due to the emission of perfluorinated carbons from PCBs.
4.2.7. Criticality-based Impact Assessment Method
The results of the CIAM are seen in Figure 22.
Figure 23. Comparison of the results of the Criticality-based Impact Assessment Method for a repair and reuse, a recycle and replace, and an incinerate and replace scenario for an
average 14” laptop.
1.78
2.53 2.56
-0.5
0.0
0.5
1.0
1.5
2.0
2.5
3.0
Scenario 1Reuse
Scenario 2Recycle
Scenario 3Incinerate
CED
(G
J/ac
cess
to
lap
top
fro
m
20
21
to
20
26
)Avoided burdens
2nd Laptop - Supply
2nd Laptop - Use
2nd Laptop - Disposal
1st Laptop - Repair
1st Laptop - Use
1st Laptop - Disposal
5.2
18.0 25.2
-20
-10
0
10
20
30
40
Scenario 1Reuse
Scenario 2Recycle
Scenario 3Incinerate
CIA
M (
Pts
/acc
ess
to la
pto
p f
rom
2
02
1 t
o 2
02
6)
Avoided burdens
2nd Laptop - Supply
2nd Laptop - Use
2nd Laptop - Disposal
1st Laptop - Repair
1st Laptop - Use
1st Laptop - Disposal
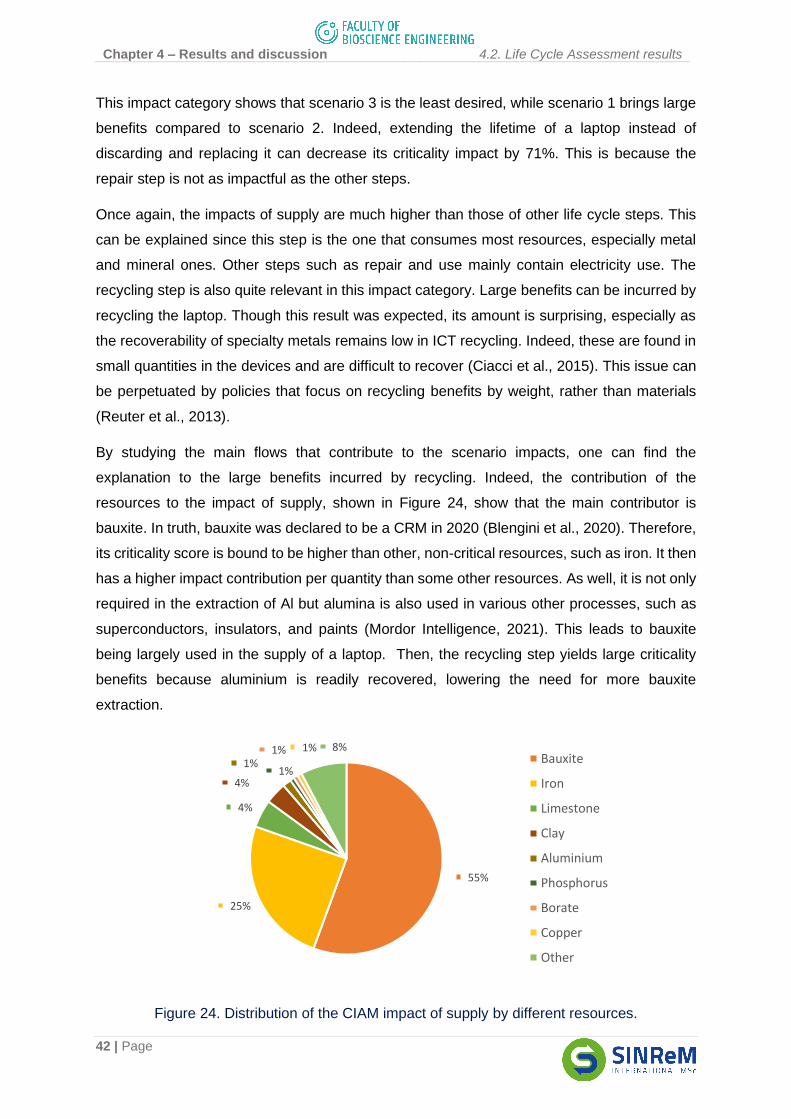
Chapter 4 – Results and discussion 4.2. Life Cycle Assessment results
42 | Page
This impact category shows that scenario 3 is the least desired, while scenario 1 brings large
benefits compared to scenario 2. Indeed, extending the lifetime of a laptop instead of
discarding and replacing it can decrease its criticality impact by 71%. This is because the
repair step is not as impactful as the other steps.
Once again, the impacts of supply are much higher than those of other life cycle steps. This
can be explained since this step is the one that consumes most resources, especially metal
and mineral ones. Other steps such as repair and use mainly contain electricity use. The
recycling step is also quite relevant in this impact category. Large benefits can be incurred by
recycling the laptop. Though this result was expected, its amount is surprising, especially as
the recoverability of specialty metals remains low in ICT recycling. Indeed, these are found in
small quantities in the devices and are difficult to recover (Ciacci et al., 2015). This issue can
be perpetuated by policies that focus on recycling benefits by weight, rather than materials
(Reuter et al., 2013).
By studying the main flows that contribute to the scenario impacts, one can find the
explanation to the large benefits incurred by recycling. Indeed, the contribution of the
resources to the impact of supply, shown in Figure 24, show that the main contributor is
bauxite. In truth, bauxite was declared to be a CRM in 2020 (Blengini et al., 2020). Therefore,
its criticality score is bound to be higher than other, non-critical resources, such as iron. It then
has a higher impact contribution per quantity than some other resources. As well, it is not only
required in the extraction of Al but alumina is also used in various other processes, such as
superconductors, insulators, and paints (Mordor Intelligence, 2021). This leads to bauxite
being largely used in the supply of a laptop. Then, the recycling step yields large criticality
benefits because aluminium is readily recovered, lowering the need for more bauxite
extraction.
Figure 24. Distribution of the CIAM impact of supply by different resources.
55%
25%
4%
4%
1%1%
1% 1% 8%Bauxite
Iron
Limestone
Clay
Aluminium
Phosphorus
Borate
Copper
Other
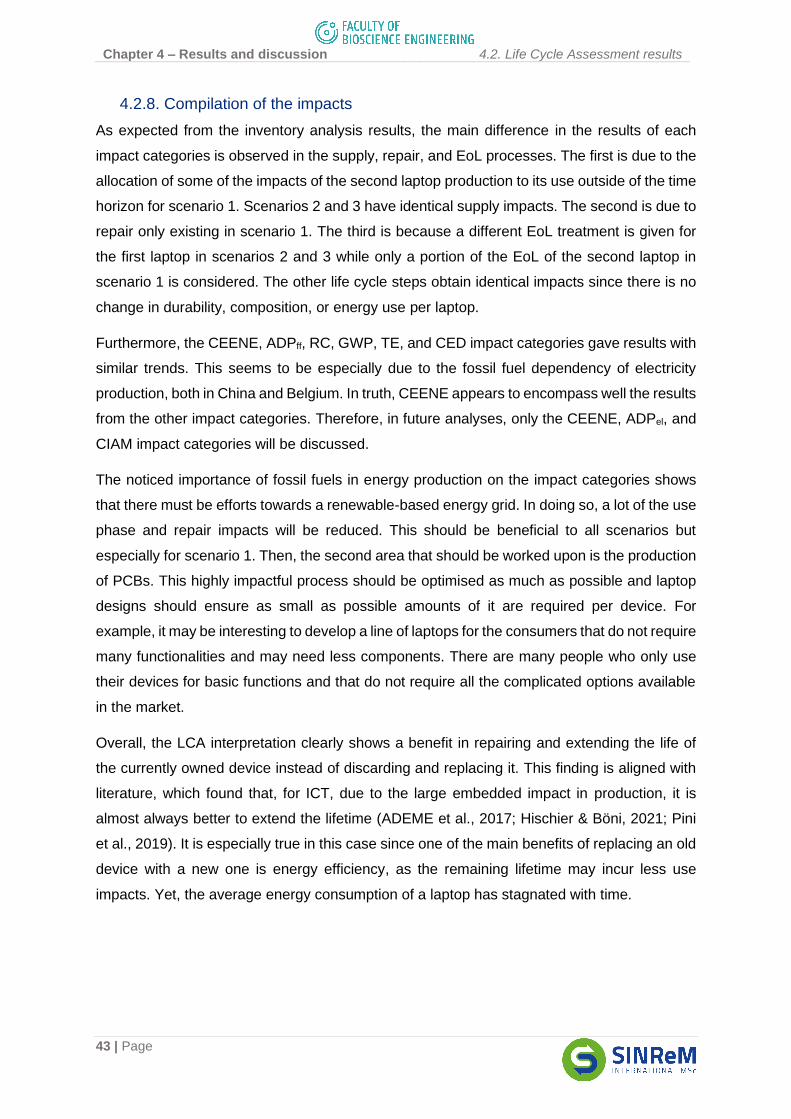
Chapter 4 – Results and discussion 4.2. Life Cycle Assessment results
43 | Page
4.2.8. Compilation of the impacts
As expected from the inventory analysis results, the main difference in the results of each
impact categories is observed in the supply, repair, and EoL processes. The first is due to the
allocation of some of the impacts of the second laptop production to its use outside of the time
horizon for scenario 1. Scenarios 2 and 3 have identical supply impacts. The second is due to
repair only existing in scenario 1. The third is because a different EoL treatment is given for
the first laptop in scenarios 2 and 3 while only a portion of the EoL of the second laptop in
scenario 1 is considered. The other life cycle steps obtain identical impacts since there is no
change in durability, composition, or energy use per laptop.
Furthermore, the CEENE, ADPff, RC, GWP, TE, and CED impact categories gave results with
similar trends. This seems to be especially due to the fossil fuel dependency of electricity
production, both in China and Belgium. In truth, CEENE appears to encompass well the results
from the other impact categories. Therefore, in future analyses, only the CEENE, ADPel, and
CIAM impact categories will be discussed.
The noticed importance of fossil fuels in energy production on the impact categories shows
that there must be efforts towards a renewable-based energy grid. In doing so, a lot of the use
phase and repair impacts will be reduced. This should be beneficial to all scenarios but
especially for scenario 1. Then, the second area that should be worked upon is the production
of PCBs. This highly impactful process should be optimised as much as possible and laptop
designs should ensure as small as possible amounts of it are required per device. For
example, it may be interesting to develop a line of laptops for the consumers that do not require
many functionalities and may need less components. There are many people who only use
their devices for basic functions and that do not require all the complicated options available
in the market.
Overall, the LCA interpretation clearly shows a benefit in repairing and extending the life of
the currently owned device instead of discarding and replacing it. This finding is aligned with
literature, which found that, for ICT, due to the large embedded impact in production, it is
almost always better to extend the lifetime (ADEME et al., 2017; Hischier & Böni, 2021; Pini
et al., 2019). It is especially true in this case since one of the main benefits of replacing an old
device with a new one is energy efficiency, as the remaining lifetime may incur less use
impacts. Yet, the average energy consumption of a laptop has stagnated with time.
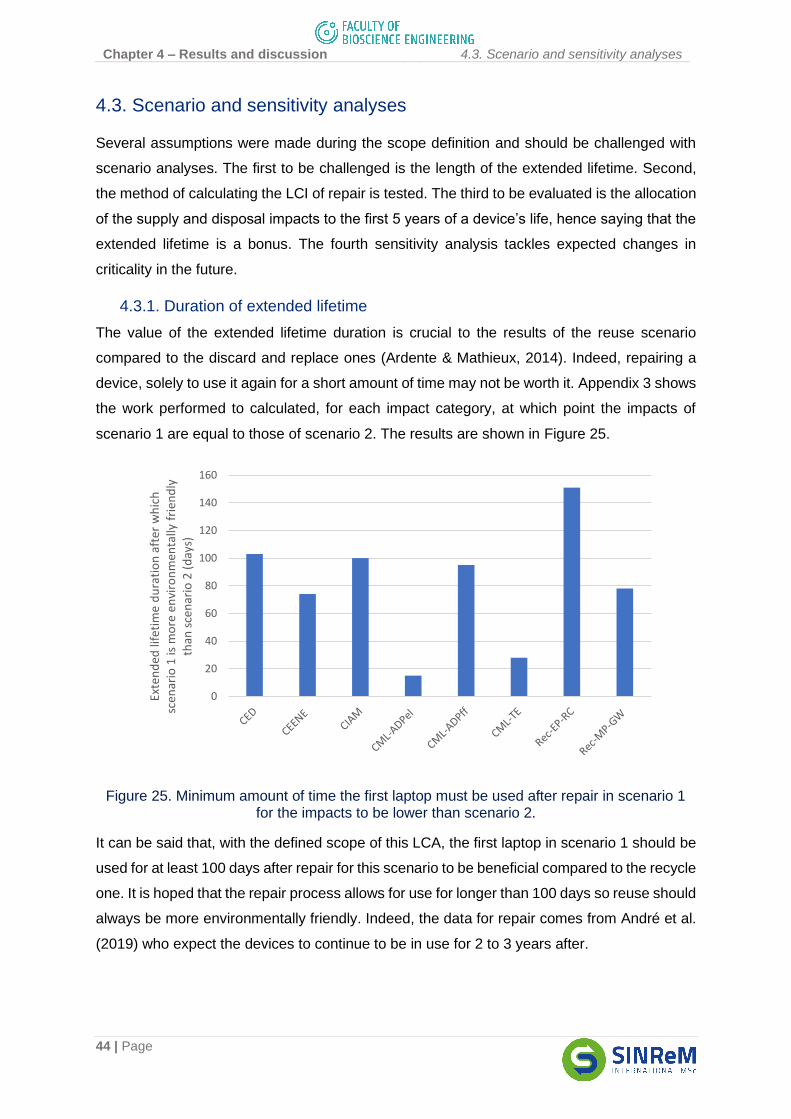
Chapter 4 – Results and discussion 4.3. Scenario and sensitivity analyses
44 | Page
4.3. Scenario and sensitivity analyses
Several assumptions were made during the scope definition and should be challenged with
scenario analyses. The first to be challenged is the length of the extended lifetime. Second,
the method of calculating the LCI of repair is tested. The third to be evaluated is the allocation
of the supply and disposal impacts to the first 5 years of a device’s life, hence saying that the
extended lifetime is a bonus. The fourth sensitivity analysis tackles expected changes in
criticality in the future.
4.3.1. Duration of extended lifetime
The value of the extended lifetime duration is crucial to the results of the reuse scenario
compared to the discard and replace ones (Ardente & Mathieux, 2014). Indeed, repairing a
device, solely to use it again for a short amount of time may not be worth it. Appendix 3 shows
the work performed to calculated, for each impact category, at which point the impacts of
scenario 1 are equal to those of scenario 2. The results are shown in Figure 25.
Figure 25. Minimum amount of time the first laptop must be used after repair in scenario 1 for the impacts to be lower than scenario 2.
It can be said that, with the defined scope of this LCA, the first laptop in scenario 1 should be
used for at least 100 days after repair for this scenario to be beneficial compared to the recycle
one. It is hoped that the repair process allows for use for longer than 100 days so reuse should
always be more environmentally friendly. Indeed, the data for repair comes from André et al.
(2019) who expect the devices to continue to be in use for 2 to 3 years after.
0
20
40
60
80
100
120
140
160
Exte
nd
ed li
feti
me
du
rati
on
aft
er w
hic
h
scen
ario
1 is
mo
re e
nvi
ron
men
tally
fri
end
ly
than
sce
nar
io 2
(d
ays)
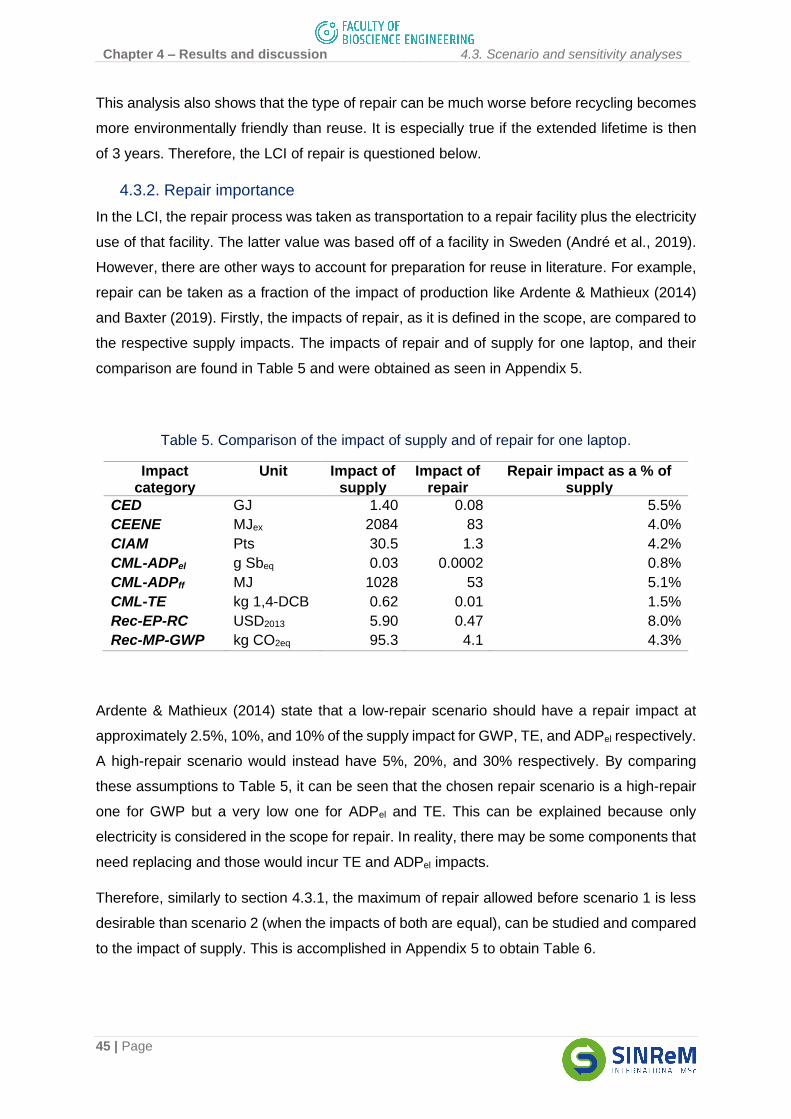
Chapter 4 – Results and discussion 4.3. Scenario and sensitivity analyses
45 | Page
This analysis also shows that the type of repair can be much worse before recycling becomes
more environmentally friendly than reuse. It is especially true if the extended lifetime is then
of 3 years. Therefore, the LCI of repair is questioned below.
4.3.2. Repair importance
In the LCI, the repair process was taken as transportation to a repair facility plus the electricity
use of that facility. The latter value was based off of a facility in Sweden (André et al., 2019).
However, there are other ways to account for preparation for reuse in literature. For example,
repair can be taken as a fraction of the impact of production like Ardente & Mathieux (2014)
and Baxter (2019). Firstly, the impacts of repair, as it is defined in the scope, are compared to
the respective supply impacts. The impacts of repair and of supply for one laptop, and their
comparison are found in Table 5 and were obtained as seen in Appendix 5.
Table 5. Comparison of the impact of supply and of repair for one laptop.
Impact category
Unit Impact of supply
Impact of repair
Repair impact as a % of supply
CED GJ 1.40 0.08 5.5%
CEENE MJex 2084 83 4.0%
CIAM Pts 30.5 1.3 4.2%
CML-ADPel g Sbeq 0.03 0.0002 0.8%
CML-ADPff MJ 1028 53 5.1%
CML-TE kg 1,4-DCB 0.62 0.01 1.5%
Rec-EP-RC USD2013 5.90 0.47 8.0%
Rec-MP-GWP kg CO2eq 95.3 4.1 4.3%
Ardente & Mathieux (2014) state that a low-repair scenario should have a repair impact at
approximately 2.5%, 10%, and 10% of the supply impact for GWP, TE, and ADPel respectively.
A high-repair scenario would instead have 5%, 20%, and 30% respectively. By comparing
these assumptions to Table 5, it can be seen that the chosen repair scenario is a high-repair
one for GWP but a very low one for ADPel and TE. This can be explained because only
electricity is considered in the scope for repair. In reality, there may be some components that
need replacing and those would incur TE and ADPel impacts.
Therefore, similarly to section 4.3.1, the maximum of repair allowed before scenario 1 is less
desirable than scenario 2 (when the impacts of both are equal), can be studied and compared
to the impact of supply. This is accomplished in Appendix 5 to obtain Table 6.
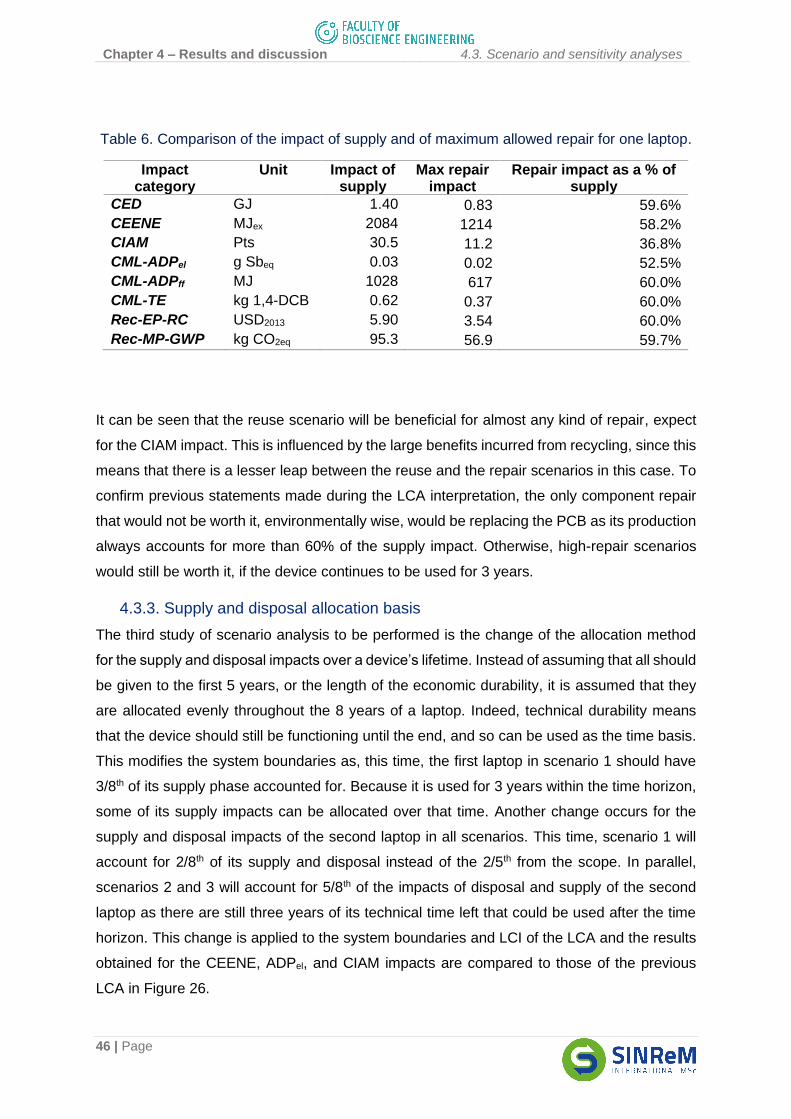
Chapter 4 – Results and discussion 4.3. Scenario and sensitivity analyses
46 | Page
Table 6. Comparison of the impact of supply and of maximum allowed repair for one laptop.
Impact category
Unit Impact of supply
Max repair impact
Repair impact as a % of supply
CED GJ 1.40 0.83 59.6%
CEENE MJex 2084 1214 58.2%
CIAM Pts 30.5 11.2 36.8%
CML-ADPel g Sbeq 0.03 0.02 52.5%
CML-ADPff MJ 1028 617 60.0%
CML-TE kg 1,4-DCB 0.62 0.37 60.0%
Rec-EP-RC USD2013 5.90 3.54 60.0%
Rec-MP-GWP kg CO2eq 95.3 56.9 59.7%
It can be seen that the reuse scenario will be beneficial for almost any kind of repair, expect
for the CIAM impact. This is influenced by the large benefits incurred from recycling, since this
means that there is a lesser leap between the reuse and the repair scenarios in this case. To
confirm previous statements made during the LCA interpretation, the only component repair
that would not be worth it, environmentally wise, would be replacing the PCB as its production
always accounts for more than 60% of the supply impact. Otherwise, high-repair scenarios
would still be worth it, if the device continues to be used for 3 years.
4.3.3. Supply and disposal allocation basis
The third study of scenario analysis to be performed is the change of the allocation method
for the supply and disposal impacts over a device’s lifetime. Instead of assuming that all should
be given to the first 5 years, or the length of the economic durability, it is assumed that they
are allocated evenly throughout the 8 years of a laptop. Indeed, technical durability means
that the device should still be functioning until the end, and so can be used as the time basis.
This modifies the system boundaries as, this time, the first laptop in scenario 1 should have
3/8th of its supply phase accounted for. Because it is used for 3 years within the time horizon,
some of its supply impacts can be allocated over that time. Another change occurs for the
supply and disposal impacts of the second laptop in all scenarios. This time, scenario 1 will
account for 2/8th of its supply and disposal instead of the 2/5th from the scope. In parallel,
scenarios 2 and 3 will account for 5/8th of the impacts of disposal and supply of the second
laptop as there are still three years of its technical time left that could be used after the time
horizon. This change is applied to the system boundaries and LCI of the LCA and the results
obtained for the CEENE, ADPel, and CIAM impacts are compared to those of the previous
LCA in Figure 26.
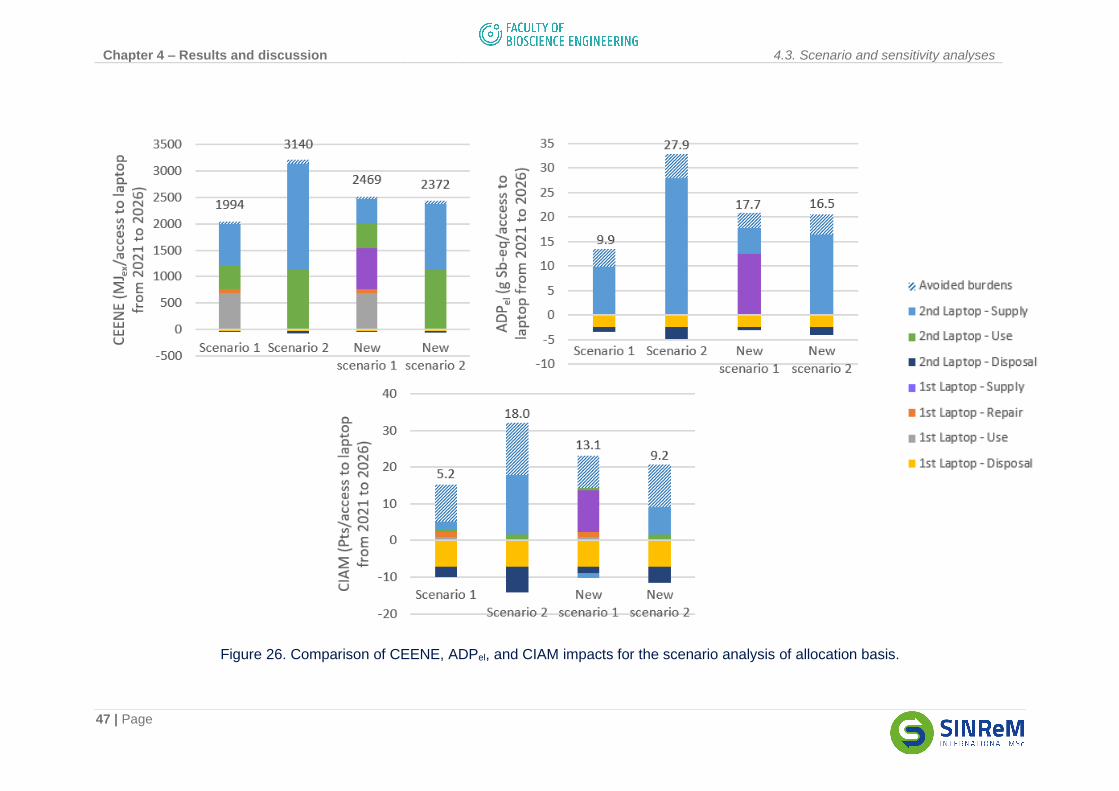
Chapter 4 – Results and discussion 4.3. Scenario and sensitivity analyses
47 | Page
Figure 26. Comparison of CEENE, ADPel, and CIAM impacts for the scenario analysis of allocation basis.
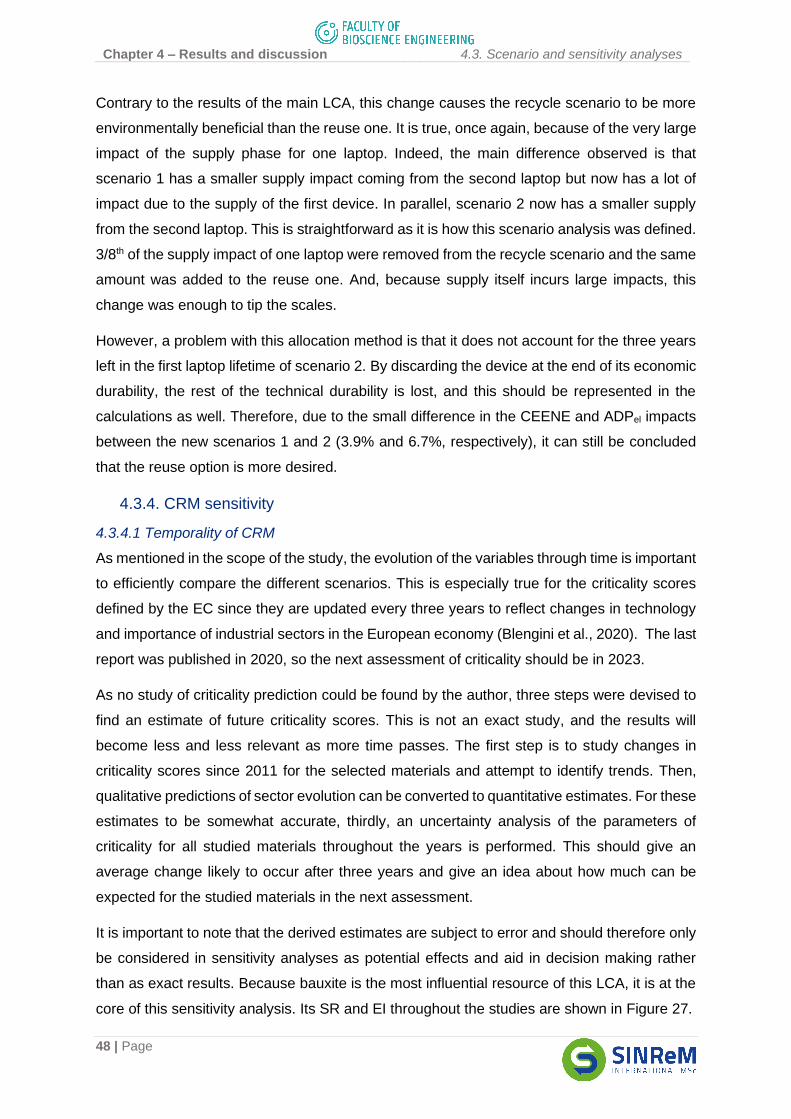
Chapter 4 – Results and discussion 4.3. Scenario and sensitivity analyses
48 | Page
Contrary to the results of the main LCA, this change causes the recycle scenario to be more
environmentally beneficial than the reuse one. It is true, once again, because of the very large
impact of the supply phase for one laptop. Indeed, the main difference observed is that
scenario 1 has a smaller supply impact coming from the second laptop but now has a lot of
impact due to the supply of the first device. In parallel, scenario 2 now has a smaller supply
from the second laptop. This is straightforward as it is how this scenario analysis was defined.
3/8th of the supply impact of one laptop were removed from the recycle scenario and the same
amount was added to the reuse one. And, because supply itself incurs large impacts, this
change was enough to tip the scales.
However, a problem with this allocation method is that it does not account for the three years
left in the first laptop lifetime of scenario 2. By discarding the device at the end of its economic
durability, the rest of the technical durability is lost, and this should be represented in the
calculations as well. Therefore, due to the small difference in the CEENE and ADPel impacts
between the new scenarios 1 and 2 (3.9% and 6.7%, respectively), it can still be concluded
that the reuse option is more desired.
4.3.4. CRM sensitivity
4.3.4.1 Temporality of CRM
As mentioned in the scope of the study, the evolution of the variables through time is important
to efficiently compare the different scenarios. This is especially true for the criticality scores
defined by the EC since they are updated every three years to reflect changes in technology
and importance of industrial sectors in the European economy (Blengini et al., 2020). The last
report was published in 2020, so the next assessment of criticality should be in 2023.
As no study of criticality prediction could be found by the author, three steps were devised to
find an estimate of future criticality scores. This is not an exact study, and the results will
become less and less relevant as more time passes. The first step is to study changes in
criticality scores since 2011 for the selected materials and attempt to identify trends. Then,
qualitative predictions of sector evolution can be converted to quantitative estimates. For these
estimates to be somewhat accurate, thirdly, an uncertainty analysis of the parameters of
criticality for all studied materials throughout the years is performed. This should give an
average change likely to occur after three years and give an idea about how much can be
expected for the studied materials in the next assessment.
It is important to note that the derived estimates are subject to error and should therefore only
be considered in sensitivity analyses as potential effects and aid in decision making rather
than as exact results. Because bauxite is the most influential resource of this LCA, it is at the
core of this sensitivity analysis. Its SR and EI throughout the studies are shown in Figure 27.
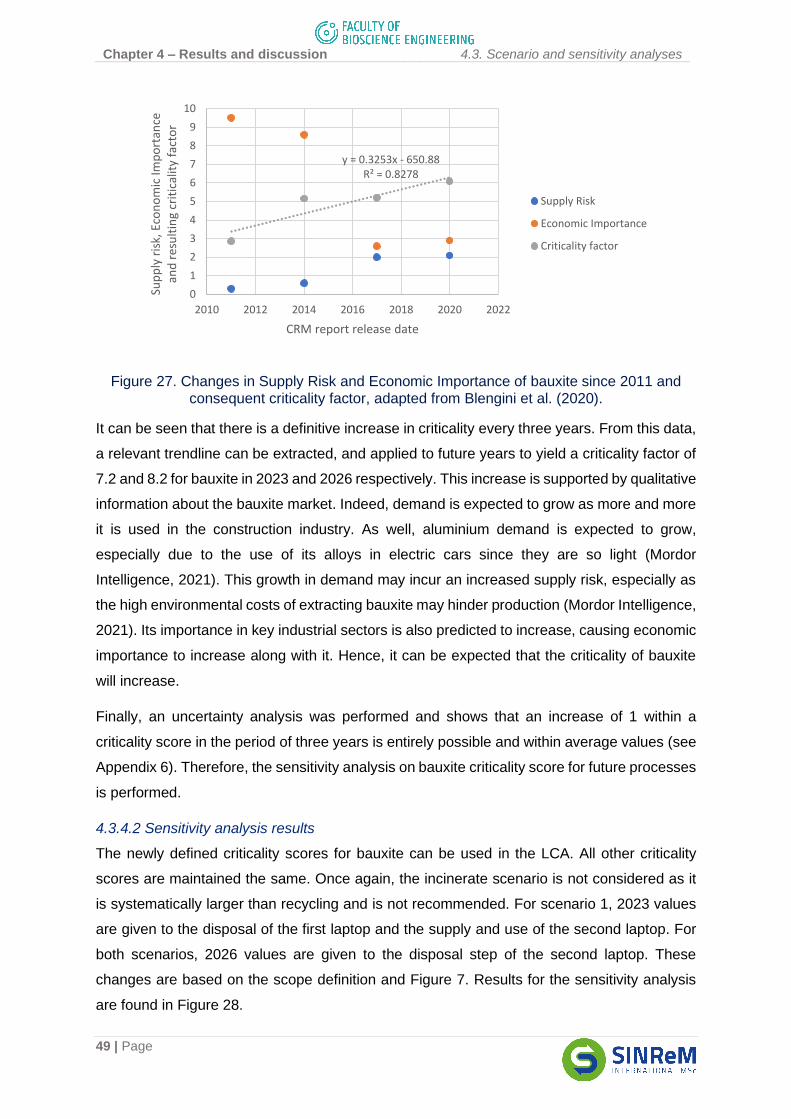
Chapter 4 – Results and discussion 4.3. Scenario and sensitivity analyses
49 | Page
Figure 27. Changes in Supply Risk and Economic Importance of bauxite since 2011 and consequent criticality factor, adapted from Blengini et al. (2020).
It can be seen that there is a definitive increase in criticality every three years. From this data,
a relevant trendline can be extracted, and applied to future years to yield a criticality factor of
7.2 and 8.2 for bauxite in 2023 and 2026 respectively. This increase is supported by qualitative
information about the bauxite market. Indeed, demand is expected to grow as more and more
it is used in the construction industry. As well, aluminium demand is expected to grow,
especially due to the use of its alloys in electric cars since they are so light (Mordor
Intelligence, 2021). This growth in demand may incur an increased supply risk, especially as
the high environmental costs of extracting bauxite may hinder production (Mordor Intelligence,
2021). Its importance in key industrial sectors is also predicted to increase, causing economic
importance to increase along with it. Hence, it can be expected that the criticality of bauxite
will increase.
Finally, an uncertainty analysis was performed and shows that an increase of 1 within a
criticality score in the period of three years is entirely possible and within average values (see
Appendix 6). Therefore, the sensitivity analysis on bauxite criticality score for future processes
is performed.
4.3.4.2 Sensitivity analysis results
The newly defined criticality scores for bauxite can be used in the LCA. All other criticality
scores are maintained the same. Once again, the incinerate scenario is not considered as it
is systematically larger than recycling and is not recommended. For scenario 1, 2023 values
are given to the disposal of the first laptop and the supply and use of the second laptop. For
both scenarios, 2026 values are given to the disposal step of the second laptop. These
changes are based on the scope definition and Figure 7. Results for the sensitivity analysis
are found in Figure 28.
y = 0.3253x - 650.88R² = 0.8278
0
1
2
3
4
5
6
7
8
9
10
2010 2012 2014 2016 2018 2020 2022
Sup
ply
ris
k, E
con
om
ic Im
po
rtan
ce
and
res
ult
ing
crit
ical
ity
fact
or
CRM report release date
Supply Risk
Economic Importance
Criticality factor
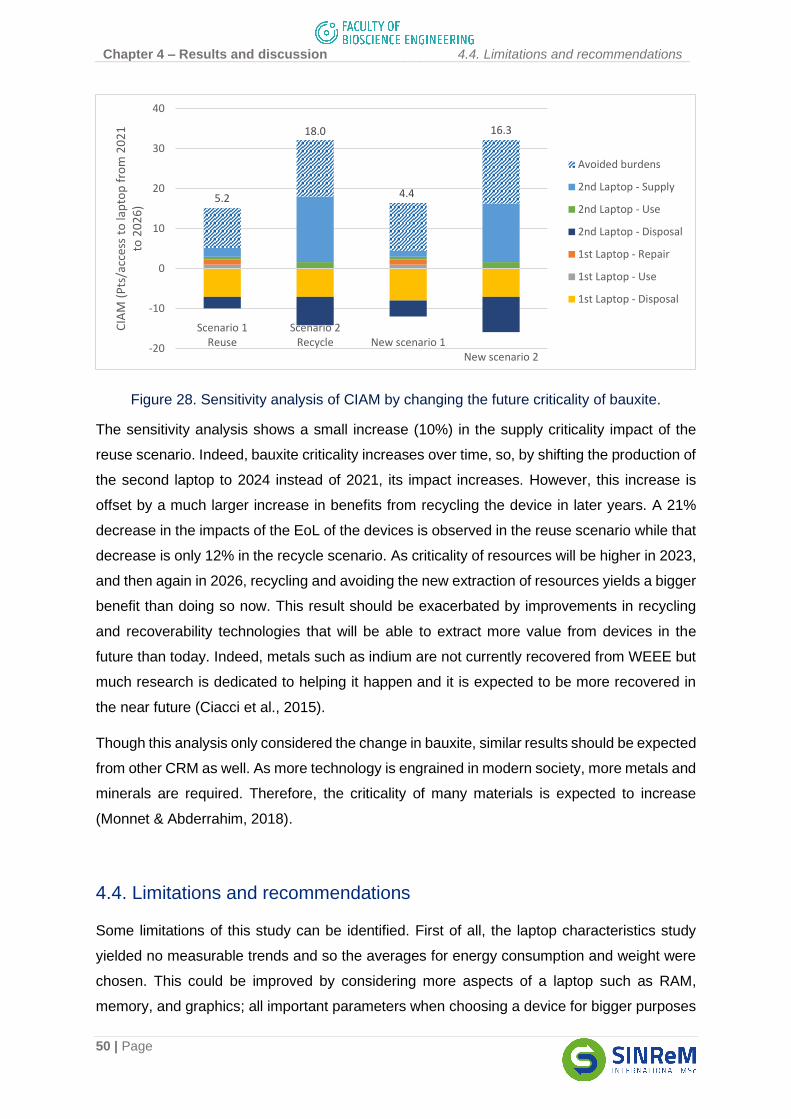
Chapter 4 – Results and discussion 4.4. Limitations and recommendations
50 | Page
Figure 28. Sensitivity analysis of CIAM by changing the future criticality of bauxite.
The sensitivity analysis shows a small increase (10%) in the supply criticality impact of the
reuse scenario. Indeed, bauxite criticality increases over time, so, by shifting the production of
the second laptop to 2024 instead of 2021, its impact increases. However, this increase is
offset by a much larger increase in benefits from recycling the device in later years. A 21%
decrease in the impacts of the EoL of the devices is observed in the reuse scenario while that
decrease is only 12% in the recycle scenario. As criticality of resources will be higher in 2023,
and then again in 2026, recycling and avoiding the new extraction of resources yields a bigger
benefit than doing so now. This result should be exacerbated by improvements in recycling
and recoverability technologies that will be able to extract more value from devices in the
future than today. Indeed, metals such as indium are not currently recovered from WEEE but
much research is dedicated to helping it happen and it is expected to be more recovered in
the near future (Ciacci et al., 2015).
Though this analysis only considered the change in bauxite, similar results should be expected
from other CRM as well. As more technology is engrained in modern society, more metals and
minerals are required. Therefore, the criticality of many materials is expected to increase
(Monnet & Abderrahim, 2018).
4.4. Limitations and recommendations
Some limitations of this study can be identified. First of all, the laptop characteristics study
yielded no measurable trends and so the averages for energy consumption and weight were
chosen. This could be improved by considering more aspects of a laptop such as RAM,
memory, and graphics; all important parameters when choosing a device for bigger purposes
5.2
18.0
4.4
16.3
-20
-10
0
10
20
30
40
Scenario 1Reuse
Scenario 2Recycle New scenario 1
New scenario 2
CIA
M (
Pts
/acc
ess
to la
pto
p f
rom
20
21
to
20
26
)
Avoided burdens
2nd Laptop - Supply
2nd Laptop - Use
2nd Laptop - Disposal
1st Laptop - Repair
1st Laptop - Use
1st Laptop - Disposal
Chapter 4 – Results and discussion 4.4. Limitations and recommendations
51 | Page
than the daily simple activities. Perhaps better trends with time could be observed so. On top
of that, it was assumed that the composition of a laptop remains constant over time, as
assumed by other literature. However, this is not fully realistic as each brand has its own
components and methods. Ljunggren Söderman & André (2019) identified two main changes
in technology in recent years that affect laptop composition: hard disk drives being replaced
by solid state drives changing the magnet requirements and lower gold contents in PCBs.
These changes could be evaluated for more truthful LCA results.
Moreover, the use phase of a laptop was modelled as an average use, defined by ENERGY
STAR. A more detailed approach could be to study different consumer habits of laptop use to
identify use trends that could be translated into different LCAs depending on consumer
preference. As well, more information on consumer use could allow for allocation of supply
and disposal impacts on usage patterns rather than age of laptop. This could lead to a
discounting method similar to that of ownership taxes, giving higher value to young devices.
Another aspect of laptop energy use that was not considered is the fact that devices lose
efficiency over time, as they get older. This could affect results and should be included in
further research.
As well, the undocumented EoL treatment option was modelled as a controlled incineration
waste scenario. This could be improved by studying more in depth the undocumented stream
and its impacts on the environment, economy, and human health. This way, a more thorough
sustainability assessment could be performed, with the three aspects of sustainability at play.
In any case, a true analysis of the undocumented scenario would most likely result in worse
impact results than the incinerate scenario.
Finally, this report attempted to evaluate criticality change over time. However, the EU
criticality studies have changed some important methodological steps from one study to
another. Therefore, comparing one year’s data to another is not very scientifically sound. A
more thorough study of criticality changes and expectations should be performed.
Nonetheless, that was outside the scope of this report, which merely attempted to give an idea
of the evolution.
It is important to remember that this LCA was modelled for a consumer in Belgium and that
their choices might differ a lot when modelled in another country. Therefore, other studies
should evaluate different regions. As well exclusively secondary data is used in this LCA; some
of which is relatively old and was updated as possible. For example, ecoinvent data is used
for the production of each laptop part (PCB, battery, screen, etc.). Results employing more
recent data and from studies in close collaboration with laptop manufacturers may lead to
different outcomes.
Chapter 5 – Conclusion and outlook
52 | Page
Chapter 5 – Conclusion and outlook
5.1. Conclusion
This thesis tackled the complexities of waste electrical and electronic equipment when it
comes to extending their lifetime rather than disposing and replacing them. It studied the
environmental and criticality impacts of this decision with a laptop. First, a thorough literature
review of the setting and similar works was performed. Then, a methodology was developed
to answer the main research question: “Should someone that has had a laptop for a number
of years discard it and replace it for a newer version or continue using it, from an environmental
and criticality standpoint?”. By performing a life cycle analysis comparing the access to a
laptop from 2016 to 2024 in three different scenarios, conclusions could be drawn.
A laptop’s characteristics study over time showed that there was no noticeable improvement
in energy efficiency or change in weight with time. From there, average laptop properties were
found and applied to the life cycle analysis. The three defined scenarios reflected the common
outcome of waste electrical and electronic equipment in Belgium: reused, recycled, or lost.
The latter was represented by a controlled incineration, and therefore consistently yielded
lower results than the expected reality. Even so, this scenario was always the most impactful.
Indeed, seven impact categories were studied and all found that repairing and reusing a laptop
was beneficial, compared to discarding and replacing it with a newer model. This is because
energy efficiency is stagnant and extending the lifetime allows for the displacement of some
of the production and disposal impacts to the use outside the defined time horizon.
The other main difference between the scenarios is the addition of a repair step when reusing.
It was consistently found that, though this step increases the impact of the reuse scenario, the
impact of supply was large enough to make this increase negligible. A sensitivity analysis on
the level of repair allowed for scenario 1 to be lower than scenario 2 showed that it could
increase to around 60% of the supply impact for most impact categories. Therefore, the repair
step can be much more intensive, and reusing will continue to be more beneficial than
recycling. The only part that is not allowed to need replacing is the printed circuit board, whose
production is the most impactful part of the supply step.
The environmental impact categories showed that most of the damage is due to the extensive
use of fossil fuels throughout the life cycle, either for energy or material production. Then, the
study on resource criticality showed that, as criticality is expected to increase for many critical
raw materials, the reuse scenario incurs more impact from production in the future than today.
Nonetheless, this was offset by the higher reward in recycling the device later as well. By
Chapter 5 – Conclusion and outlook
53 | Page
maintaining raw materials within the economy for as long as possible, benefits can be
obtained. This conclusion is in line with circular economy principles.
Ultimately, this report recommends consumers to maintain their information and
communication technology in use for their entire technical durability, even if small repairs are
required for them to perform correctly. As well, they should only discard of them in the official
way developed by their local waste treatment system.
5.2. Outlook
The results showed high dependency on the method of electricity production, with many of the
impacts highly influenced by fossil fuel use. Therefore, large efforts are required for more
renewable forms of energy. As the world develops this industry, similar studies to this thesis
must be repeated to update the results. It is likely then that more impact will be incurred from
resource use and that circular economy values will be even more beneficial. Improved
recycling technologies will also influence results in that direction.
The findings of this study may become relevant to other types of electrical and electronic
equipment. As more and more devices grow “smarter”, it can be expected that their
dependency on critical raw materials increases. Some examples are vacuums becoming
automatic and self-moving, refrigerators including a touch screen and computer abilities, and
lights automatically controlled or connected to smart homes.
References
54 | Page
References
ADEME, RDC Environment, & BV CODDE. (2017). Quantification de l’impact environnemental d’une action de réparation/réemploi/réutilisation.
Agora Energiewende, & Ember. (2021). The European Power Sector in 2020: Up-to-Date Analysis on the Electricity Transition. https://ember-climate.org/project/eu-power-sector-2020/
André, H., Ljunggren Söderman, M., & Nordelöf, A. (2019). Resource and environmental impacts of using second-hand laptop computers: A case study of commercial reuse. Waste Management, 88, 268–279. https://doi.org/10.1016/j.wasman.2019.03.050
Ardente, F., & Mathieux, F. (2014). Environmental assessment of the durability of energy-using products: Method and application. Journal of Cleaner Production, 74, 62–73. https://doi.org/10.1016/j.jclepro.2014.03.049
Babbitt, C. W., Madaka, H., Althaf, S., Kasulaitis, B., & Ryen, E. G. (2020). Disassembly-based bill of materials data for consumer electronic products. Scientific Data, 7(1). https://doi.org/10.1038/s41597-020-0573-9
Baxter, J. (2019). Systematic environmental assessment of end-of-life pathways for domestic refrigerators. Journal of Cleaner Production, 208, 612–620. https://doi.org/10.1016/j.jclepro.2018.10.173
BBC. (2012). Global resources stock check. BBC Future. https://www.bbc.com/future/article/20120618-global-resources-stock-check
Blengini, G. A., EL Latunussa, C., Eynard, U., C., T. de M., Wittmer, D., Georgitzikis, K., Pavel, C., Carrara, S., Mancini, L., Unguru, M., Blagoeva, D., Mathieux, F., & Pennington, D. (2020). Study on the EU’s list of Critical Raw Materials.
Bovea, M. D., Ibáñez-Forés, V., & Pérez-Belis, V. (2020). Repair vs. replacement: Selection of the best end-of-life scenario for small household electric and electronic equipment based on life cycle assessment. Journal of Environmental Management, 254. https://doi.org/10.1016/j.jenvman.2019.109679
Brundtland, G. H. (1987). Our common future. In World Commission on Environment and Development. Oxford University Press.
Brunner, P. H., & Rechberger, H. (2016). Handbook of material flow analysis: For environmental, resource, and waste engineers. CRC press.
Cambridge University Press. (2008a). Resource. In Cambridge Academic Content Dictionary. Cambridge University Press.
Cambridge University Press. (2008b). Sustainable. In Cambridge advanced learner’s dictionary. Cambridge University Press.
Castellani, V., Sala, S., & Mirabella, N. (2015). Beyond the throwaway society: A life cycle‐based assessment of the environmental benefit of reuse. Integrated Envionmental Assessment and Management, 11(3), 373–382.
Cheung, C. W., Berger, M., & Finkbeiner, M. (2018). Comparative life cycle assessment of re-use and replacement for video projectors. International Journal of Life Cycle Assessment, 23(1), 82–94. https://doi.org/10.1007/s11367-017-1301-3
Ciacci, L., Reck, B. K., Nassar, N. T., & Graedel, T. E. (2015). Lost by Design. Environmental Science & Technology, 49(16), 9443–9451. https://doi.org/10.1021/es505515z
References
55 | Page
Circular economy: definition, importance and benefits. (2015). European Parliament News. https://www.europarl.europa.eu/news/en/headlines/economy/20151201STO05603/circular-economy-definition-importance-and-benefits
Clarke, C., Williams, I. D., & Turner, D. A. (2019). Evaluating the carbon footprint of WEEE management in the UK. Resources, Conservation and Recycling, 141, 465–473. https://doi.org/10.1016/j.resconrec.2018.10.003
Conway, E. (2018). Sustainability, the Triple Bottom Line and Corporate Social Responsibility. In Contemporary Issues in Accounting (pp. 15–35). Springer.
De Meester, S., Nachtergaele, P., Debaveye, S., Vos, P., & Dewulf, J. (2019). Using material flow analysis and life cycle assessment in decision support: A case study on WEEE valorization in Belgium. Resources, Conservation and Recycling, 142, 1–9. https://doi.org/10.1016/j.resconrec.2018.10.015
Dekker, E., Zijp, M. C., van de Kamp, M. E., Temme, E. H. M., & van Zelm, R. (2020). A taste of the new ReCiPe for life cycle assessment: consequences of the updated impact assessment method on food product LCAs. International Journal of Life Cycle Assessment, 25(12), 2315–2324. https://doi.org/10.1007/s11367-019-01653-3
Deloitte. (2018). (W)EEE 2016 Mass balance and market structure in Belgium.
Den Hollander, M., & Bakker, C. (2012). A business model framework for product life extension. Proceedings of Sustainable Innovation 2012, Resource Efficiency, Innovation and Lifestyles, 29-30 October 2012, 110–118.
Dewulf, J., Bösch, M. E., De Meester, B., Van Der Vorst, G., Van Langenhove, H., Hellweg, S., & Huijbregts, M. A. J. (2007). Cumulative exergy extraction from the natural environment (CEENE): A comprehensive life cycle impact assessment method for resource accounting. Environmental Science and Technology, 41(24), 8477–8483. https://doi.org/10.1021/es0711415
Dewulf, J., Mancini, L., Blengini, G. A., Sala, S., Latunussa, C., & Pennington, D. (2015). Toward an Overall Analytical Framework for the Integrated Sustainability Assessment of the Production and Supply of Raw Materials and Primary Energy Carriers. Journal of Industrial Ecology, 19(6), 963–977. https://doi.org/https://doi.org/10.1111/jiec.12289
ECMA. (2010). Standard ECMA-383: Measuring the Energy Consumption of Personal Computing Products. ECMA International. https://www.ecma-international.org/wp-content/uploads/ECMA-383_3rd_edition_december_2010.pdf
ecoinvent. (n.d.). Ecoinvent. Retrieved February 19, 2021, from https://www.ecoinvent.org/
Ellen Macarthur Foundation (EMF). (n.d.). Schools of Thought. Retrieved December 17, 2020, from https://www.ellenmacarthurfoundation.org/circular-economy/concept/schools-of-thought#:~:text=Walter Stahel%2C architect and industrial,on job creation%2C economic competitiveness%2C
Ellen Macarthur Foundation (EMF). (2019). Circular Economy Systems Diagram. https://www.ellenmacarthurfoundation.org/circular-economy/concept/infographic
ENERGY STAR. (2020a). ENERGY STAR Certified Computers – Database. https://data.energystar.gov/Active-Specifications/ENERGY-STAR-Certified-Computers/j7nq-iepp/data
ENERGY STAR. (2020b). ENERGY STAR Program Requirements for Computers – Partner Commitments. https://www.energystar.gov/sites/default/files/ENERGY STAR Computers Final Version 8.0 Specification - Rev. April 2020_0.pdf
References
56 | Page
European Commission (EC). (n.d.). Goal 12. Ensure sustainable consumption and production patterns. Retrieved January 11, 2021, from https://ec.europa.eu/sustainable-development/goal12_en
European Commission (EC). (2010). International Reference Life Cycle Data System (ILCD) Handbook (E. 24708 EN (Ed.); first). Publications Office of the European Union.
European Commission (EC). (2012). Product Environmental Footprint (PEF) Guide.
European Commission (EC). (2018). Product Environmental Footprint Category Rules Guidance - version 6.3. https://ec.europa.eu/environment/eussd/smgp/pdf/PEFCR_guidance_v6.3.pdf
European Commission (EC). (2019). Report from the Commission to the European Parliament, the Council, the European Economic and Socil Committee and the Committee of the Regions on the implementation of the Circular Economy Action Plan. https://eur-lex.europa.eu/legal-content/EN/TXT/?qid=1551871195772&uri=CELEX:52019DC0190#document1
European Commission (EC). (2020). Circular Economy Action Plan, For a cleaner and more competitive Europe. https://ec.europa.eu/environment/circular-economy/pdf/new_circular_economy_action_plan.pdf
Eurostat. (2017). People & businesses online. https://ec.europa.eu/eurostat/cache/infographs/ict/bloc-1a.html
Eurostat. (2020). Digital economy and society statistics - households and individuals. https://ec.europa.eu/eurostat/statistics-explained/index.php?title=Digital_economy_and_society_statistics_-_households_and_individuals
Finkbeiner, M., Inaba, A., Tan, R. B. H., Christiansen, K., & Klüppel, H.-J. (2006). The new international standards for life cycle assessment: ISO 14040 and ISO 14044. International Journal of Life Cycle Assessment, 11(2), 80–85. https://doi.org/10.1065/lca2006.02.002
Ford, P., Santos, E., Ferrão, P., Margarido, F., Van Vliet, K. J., & Olivetti, E. (2016). Economics of End-of-Life Materials Recovery: A Study of Small Appliances and Computer Devices in Portugal. Environmental Science and Technology, 50(9), 4854–4862. https://doi.org/10.1021/acs.est.6b00237
Forti, V., Baldé, C. P., Kuehr, R., & Bel, G. (2020). The Global E-waste Monitor 2020 - Quantities, flows, and the circular economy potential. Ed Nations University (UNU)/United Nations Institute for Training and Research (UNITAR) – Co-Hosted SCYCLE Programme, International Telecommunication Union (ITU) & International Solid Waste Association (ISWA),. http://ewastemonitor.info/
Geary, D. (2020). Environmental movement. In Dictionary of American History.
Goedkoop, M., Heijungs, R., Huijbregts, M., De Schryver, A., Struijs, J., & Van Zelm, R. (2009). ReCiPe 2008. A Life Cycle Impact Assessment Method Which Comprises Harmonised Category Indicators at the Midpoint and the Endpoint Level, 1, 1–126.
Graedel, T. E., Harper, E. M., Nassar, N. T., & Reck, B. K. (2015a). Criticality of metals and metalloids. Proceedings of the National Academy of Sciences, 112(14), 4247–4262.
Graedel, T. E., Harper, E. M., Nassar, N. T., & Reck, B. K. (2015b). On the materials basis of modern society. Proceedings of the National Academy of Sciences of the United States of America, 112(20), 6295–6300. https://doi.org/10.1073/pnas.1312752110
References
57 | Page
Greenfield, A., & Graedel, T. E. (2013). The omnivorous diet of modern technology. Resources, Conservation and Recycling, 74, 1–7. https://doi.org/https://doi.org/10.1016/j.resconrec.2013.02.010
Guinée, J. B. (2002). Handbook on life cycle assessment : operational guide to the ISO standards. Dordrecht ; Boston : Kluwer Academic Publishers. http://lib.ugent.be/catalog/rug01:000777349
Hauschild, Goedkoop, M., Guinee, J., Heijungs, R., Huijbregts, M., Jolliet, O., Margni, M., De Schryver, A., Pennington, D., Pant, R., Sala, S., Brandao, M., & Wolf, M. (2011). Recommendations for Life Cycle Impact Assessment in the European context - based on existing environmental impact assessment models and factors. In JRC61049 (Ed.), International Reference Life Cycle Data System - ILCD handbook (EUR 24571). Publications Office of the European Union.
Hischier, R. (2007). Part V - Disposal of Electric and Electronic Equipment (e-Waste). In ecoinvent report No. 18. Empa / Technology & Society Lab (Ed.), Life cycle inventories of Electric and Electronic Equipment: Production, Use and Disposal (Vol. 2). Swiss Centre for Life Cycle Inventories.
Hischier, R., & Böni, H. W. (2021). Combining environmental and economic factors to evaluate the reuse of electrical and electronic equipment – a Swiss case study. Resources, Conservation and Recycling, 166. https://doi.org/10.1016/j.resconrec.2020.105307
Huijbregts, M. A. J., Steinmann, Z. J. N., Elshout, P. M. F., Stam, G., Verones, F., Vieira, M., Zijp, M., Hollander, A., & van Zelm, R. (2017). ReCiPe2016: a harmonised life cycle impact assessment method at midpoint and endpoint level. International Journal of Life Cycle Assessment, 22(2), 138–147. https://doi.org/10.1007/s11367-016-1246-y
International Energy Agency (IEA). (2009). Gadgets and Gigawatts, Policies for Energy Efficient Electronics. OECD.
International Energy Agency (IEA). (2018a). Belgium - Balance Sankey diagram. https://www.iea.org/sankey/#?c=Belgium&s=Balance
International Energy Agency (IEA). (2018b). People’s Republic of China - Balance Sankey diagram. https://www.iea.org/sankey/#?c=People’s Republic of China&s=Balance
International Organization for Standardization (ISO). (2006a). Environmental management - Life cycle assessment - Principles and framework. ISO 14040:2006(E).
International Organization for Standardization (ISO). (2006b). Environmental management - Life cycle assessment - Requirements and guidelines. ISO 14044:2006(E).
Johnson, S. (2012). United Nations Environment Program (UNEP), The first 40 years, a narrative. Report. https://www.unenvironment.org/resources/report/unep-first-40-years
Kasulaitis, B. V., Babbitt, C. W., Kahhat, R., Williams, E., & Ryen, E. G. (2015). Evolving materials, attributes, and functionality in consumer electronics: Case study of laptop computers. Resources, Conservation and Recycling, 100, 1–10. https://doi.org/10.1016/j.resconrec.2015.03.014
Kim, H. C., Keoleian, G. A., & Horie, Y. A. (2006). Optimal household refrigerator replacement policy for life cycle energy, greenhouse gas emissions, and cost. Energy Policy, 34(15), 2310–2323.
Kirchher, K., Reike, D., & Hekkert, M. (2017). Conceptualizing the circular economy: An analysis of 114 definition. Resources, Conservation and Recycling, 127, 221–232.
Kostecki, M. (Ed.). (2013). The durable use of consumer products: new options for business
References
58 | Page
and consumption. Springer Science & Business Media.
Kranjec, J. (2021). Laptop Sales to Generate Almost $150B in Revenue by 2025, Desktop PC Market to Drop to $54B. Finaria. https://www.finaria.it/trading/laptop-sales-to-generate-almost-150b-in-revenue-by-2025-desktop-pc-market-to-drop-to-54b/
Lehmann, M., & Hischier, R. (2007). Part III - Electronic Devices. In ecoinvent report No. 18. Empa / Technology & Society Lab (Ed.), Life cycle inventories of Electric and Electronic Equipment: Production, Use and Disposal. (Vol. 2). Swiss Centre for Life Cycle Inventories. https://doi.org/10.1007/978-3-540-47235-3_4
Ljunggren Söderman, M., & André, H. (2019). Effects of circular measures on scarce metals in complex products – Case studies of electrical and electronic equipment. Resources, Conservation and Recycling, 151. https://doi.org/10.1016/j.resconrec.2019.104464
Monnet, A., & Abderrahim, A. (2018). Report on major trends affecting future demand for critical raw materials.
Mora, E. P. (2007). Life cycle, sustainability and the transcendent quality of building materials. Buildinng and Environment, 42, 1329–1334.
Moraga, G., Huysveld, S., De Meester, S., & Dewulf, J. (2021). Development of circularity indicators based on the in-use occupation of materials. Journal of Cleaner Production, 279, 123889. https://doi.org/10.1016/j.jclepro.2020.123889
Mordor Intelligence. (2021). Bauxite Market - Growth, Trends, COVID-19 Impact, and Forecasts (2021 - 2026).
NREL. (n.d.). U.S. Life Cycle Inventory Database. Retrieved February 19, 2021, from https://www.nrel.gov/lci/
Pini, M., Lolli, F., Balugani, E., Gamberini, R., Neri, P., Rimini, B., & Ferrari, A. M. (2019). Preparation for reuse activity of waste electrical and electronic equipment: Environmental performance, cost externality and job creation. Journal of Cleaner Production, 222, 77–89. https://doi.org/10.1016/j.jclepro.2019.03.004
Puca, A., Carrano, M., Liu, G., Musella, D., Ripa, M., Viglia, S., & Ulgiati, S. (2017). Energy and eMergy assessment of the production and operation of a personal computer. Resources, Conservation and Recycling, 116, 124–136. https://doi.org/10.1016/j.resconrec.2016.09.030
Purchase, D., Abbasi, G., Bisschop, L., Chatterjee, D., Ekberg, C., Ermolin, M., Fedotov, P., Garelick, H., Isimekhai, K., Kandile, N. G., Lundström, M., Matharu, A., Miller, B. W., Pineda, A., Popoola, O. E., Retegan, T., Ruedel, H., Serpe, A., Sheva, Y., … Wong, M. H. (2020). Global occurrence, chemical properties, and ecological impacts of e-wastes (IUPAC Technical Report). Pure and Applied Chemistry, 92(11), 1733–1767. https://doi.org/10.1515/pac-2019-0502
Reuter, M., Hudson, C., van Schaik, A., Heiskanen, K., Meskers, C., & Hagelüken, C. (2013). Metal Recycling: Opportunities, Challenges, Infrastructure (International Resource Panel (Ed.)). United Nations Environment Programme.
Robertson, T. (2012). The Malthusian moment: global population growth and the birth of American environmentalism. Rutgers University Press.
Schaeffer, N., Passos, H., Billard, I., Papaiconomou, N., & Coutinho, J. A. P. (2018). Recovery of metals from waste electrical and electronic equipment (WEEE) using unconventional solvents based on ionic liquids. Critical Reviews in Environmental Science and Technology, 48(13–15), 859–922. https://doi.org/10.1080/10643389.2018.1477417
References
59 | Page
Schroeder, P., Anggraeni, K., & Weber, U. (2019). The Relevance of Circular Economy Practices to the Sustainable Development Goals. Journal of Industrial Ecology, 23(1), 77–95.
Sea-distances. (n.d.). SEA DISTANCES / PORT DISTANCES - online tool for calculation distances between sea ports. Retrieved July 15, 2021, from https://sea-distances.org/
Sonnemann, G., Vigon, B., Curran, M. A., Wang, H., Ciroth, A., Broadbent, C., Stevenson, M., Inaba, A., de Beaufort, A., Fava, J., Draucker, L., & Al., E. (2011). Global Guidance Principles for Life Cycle Assessment Databases - A basis for greener processes and products. UNEP. https://www.lifecycleinitiative.org/wp-content/uploads/2012/12/2011 - Global Guidance Principles.pdf
Swart, P., Alvarenga, R. A. F., & Dewulf, J. (2015). Abiotic Resource Use BT - Life Cycle Impact Assessment (M. Z. Hauschild & M. A. J. Huijbregts (Eds.); pp. 247–269). Springer Netherlands. https://doi.org/10.1007/978-94-017-9744-3_13
Thomassen, G., Van Passel, S., & Dewulf, J. (2020). A review on learning effects in prospective technology assessment. Renewable and Sustainable Energy Reviews, 130. https://doi.org/10.1016/j.rser.2020.109937
Tran, H. P., Schaubroeck, T., Swart, P., Six, L., Coonen, P., & Dewulf, J. (2018). Recycling portable alkaline/ZnC batteries for a circular economy: An assessment of natural resource consumption from a life cycle and criticality perspective. Resources, Conservation and Recycling, 135, 265–278. https://doi.org/10.1016/j.resconrec.2017.08.018
United Nations (UN). (2015). Transforming Our World: the 2030 Agenda for Sustainable Development. https://www.un.org/en/development/desa/population/migration/generalassembly/docs/globalcompact/A_RES_70_1_E.pdf
Van Eygen, E., De Meester, S., Tran, H. P., & Dewulf, J. (2016). Resource savings by urban mining: The case of desktop and laptop computers in Belgium. Resources, Conservation and Recycling, 107, 53–64.
VHK, & Armines. (2016). Preparatory study on the revision of the Ecodesign and Energy Labelling requirements on household refrigeration - Annex H.
Viegand Maagoe, & VITO. (2017). Preparatory study on the Review of Regulation 617/2013 (lot 3) - Computers and Computer Servers - Task 3 - Users.
Vieira, M., Ponsioen, T., Goedkoop, M., & Huijbregts, M. A. J. (2016). Surplus cost as a life cycle impact indicator for fossil resource scarcity. Resources, 5(2), 1–12. https://doi.org/10.1007/s11367-013-0676-z
Wang, X., Gaustad, G., Babbitt, C. W., & Richa, K. (2014). Economies of scale for future lithium-ion battery recycling infrastructure. Resources, Conservation and Recycling, 83, 53–62. https://doi.org/10.1016/j.resconrec.2013.11.009
Wautelet, T. (2018). Exploring the role of independent retailers in the circular economy: a case study approach.
Weyler, R. (2018). A Brief History of Environmentalism. Greenpeace. https://www.greenpeace.org/international/story/11658/a-brief-history-of-environmentalism/
Zampori, L., & Pant, R. (2019). Suggestions for updating the Product Environmental Footprint (PEF) method. In EUR 29682 EN. Publication Office of the European Union. https://publications.jrc.ec.europa.eu/repository/handle/JRC115959
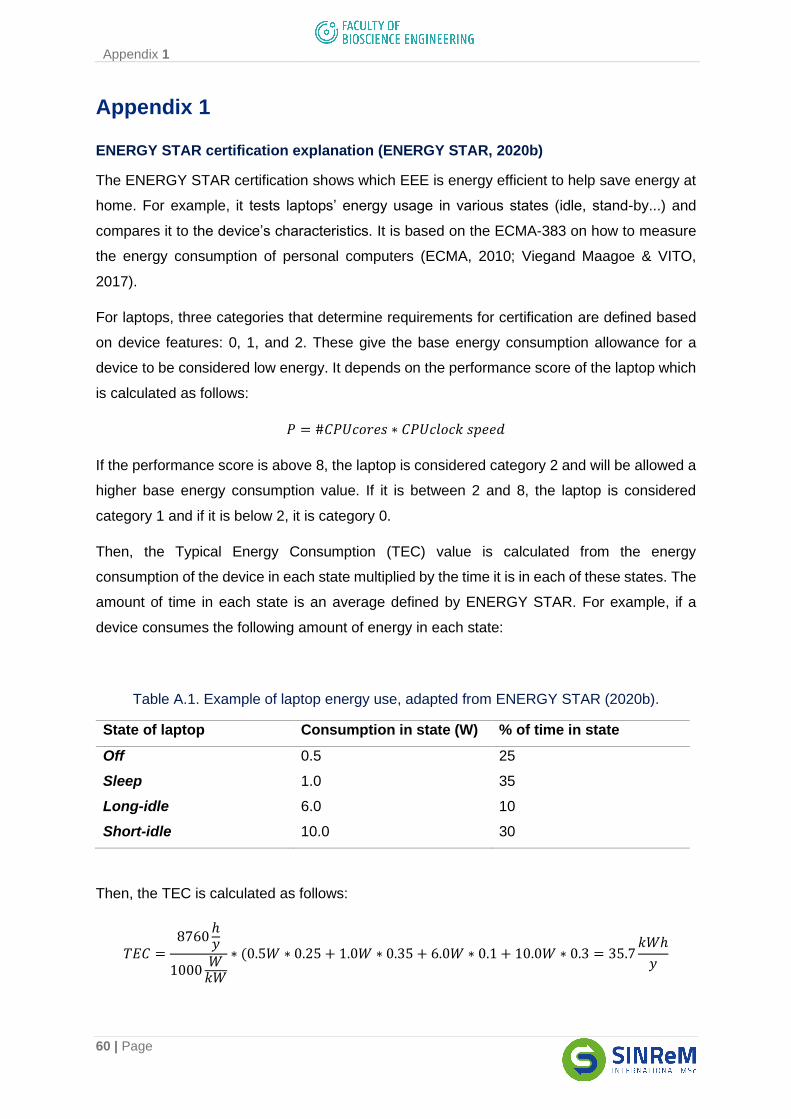
Appendix 1
60 | Page
Appendix 1
ENERGY STAR certification explanation (ENERGY STAR, 2020b)
The ENERGY STAR certification shows which EEE is energy efficient to help save energy at
home. For example, it tests laptops’ energy usage in various states (idle, stand-by...) and
compares it to the device’s characteristics. It is based on the ECMA-383 on how to measure
the energy consumption of personal computers (ECMA, 2010; Viegand Maagoe & VITO,
2017).
For laptops, three categories that determine requirements for certification are defined based
on device features: 0, 1, and 2. These give the base energy consumption allowance for a
device to be considered low energy. It depends on the performance score of the laptop which
is calculated as follows:
𝑃 = #𝐶𝑃𝑈𝑐𝑜𝑟𝑒𝑠 ∗ 𝐶𝑃𝑈𝑐𝑙𝑜𝑐𝑘 𝑠𝑝𝑒𝑒𝑑
If the performance score is above 8, the laptop is considered category 2 and will be allowed a
higher base energy consumption value. If it is between 2 and 8, the laptop is considered
category 1 and if it is below 2, it is category 0.
Then, the Typical Energy Consumption (TEC) value is calculated from the energy
consumption of the device in each state multiplied by the time it is in each of these states. The
amount of time in each state is an average defined by ENERGY STAR. For example, if a
device consumes the following amount of energy in each state:
Table A.1. Example of laptop energy use, adapted from ENERGY STAR (2020b).
State of laptop Consumption in state (W) % of time in state
Off 0.5 25
Sleep 1.0 35
Long-idle 6.0 10
Short-idle 10.0 30
Then, the TEC is calculated as follows:
𝑇𝐸𝐶 =8760
ℎ𝑦
1000𝑊
𝑘𝑊
∗ (0.5𝑊 ∗ 0.25 + 1.0𝑊 ∗ 0.35 + 6.0𝑊 ∗ 0.1 + 10.0𝑊 ∗ 0.3 = 35.7𝑘𝑊ℎ
𝑦
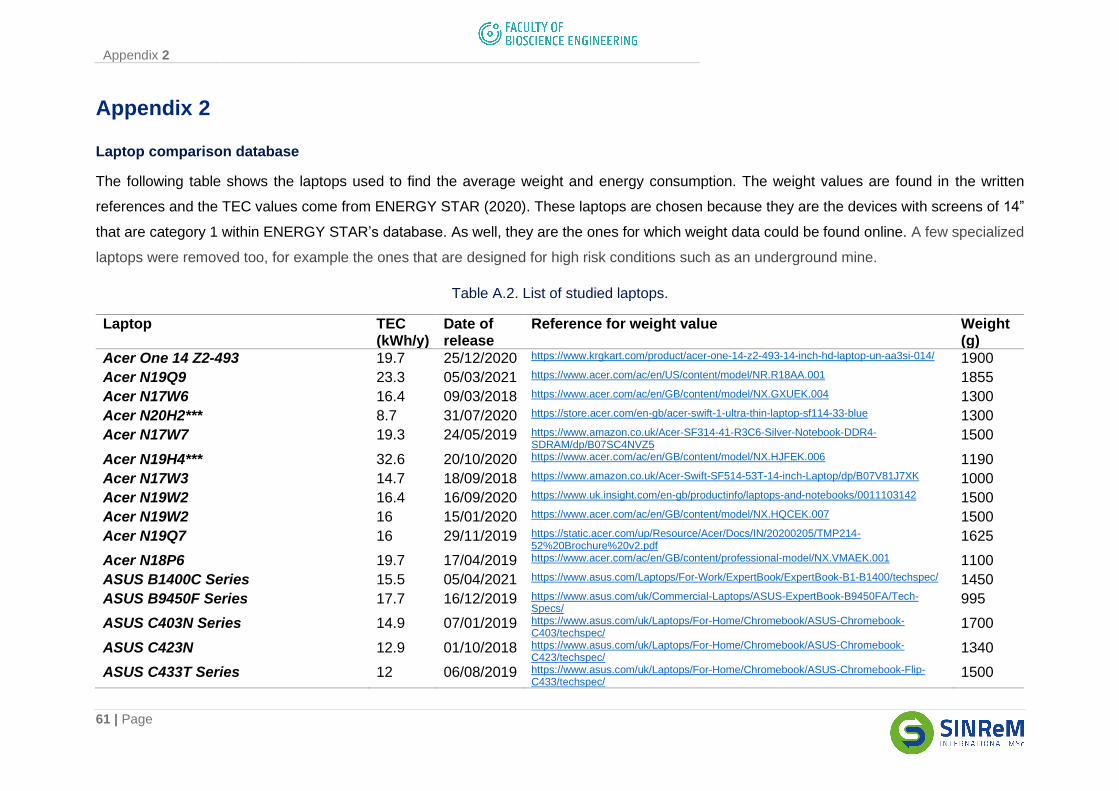
Appendix 2
61 | Page
Appendix 2
Laptop comparison database
The following table shows the laptops used to find the average weight and energy consumption. The weight values are found in the written
references and the TEC values come from ENERGY STAR (2020). These laptops are chosen because they are the devices with screens of 14”
that are category 1 within ENERGY STAR’s database. As well, they are the ones for which weight data could be found online. A few specialized
laptops were removed too, for example the ones that are designed for high risk conditions such as an underground mine.
Table A.2. List of studied laptops.
Laptop TEC (kWh/y)
Date of release
Reference for weight value Weight (g)
Acer One 14 Z2-493 19.7 25/12/2020 https://www.krgkart.com/product/acer-one-14-z2-493-14-inch-hd-laptop-un-aa3si-014/ 1900
Acer N19Q9 23.3 05/03/2021 https://www.acer.com/ac/en/US/content/model/NR.R18AA.001 1855
Acer N17W6 16.4 09/03/2018 https://www.acer.com/ac/en/GB/content/model/NX.GXUEK.004 1300
Acer N20H2*** 8.7 31/07/2020 https://store.acer.com/en-gb/acer-swift-1-ultra-thin-laptop-sf114-33-blue 1300
Acer N17W7 19.3 24/05/2019 https://www.amazon.co.uk/Acer-SF314-41-R3C6-Silver-Notebook-DDR4-SDRAM/dp/B07SC4NVZ5
1500
Acer N19H4*** 32.6 20/10/2020 https://www.acer.com/ac/en/GB/content/model/NX.HJFEK.006 1190
Acer N17W3 14.7 18/09/2018 https://www.amazon.co.uk/Acer-Swift-SF514-53T-14-inch-Laptop/dp/B07V81J7XK 1000
Acer N19W2 16.4 16/09/2020 https://www.uk.insight.com/en-gb/productinfo/laptops-and-notebooks/0011103142 1500
Acer N19W2 16 15/01/2020 https://www.acer.com/ac/en/GB/content/model/NX.HQCEK.007 1500
Acer N19Q7 16 29/11/2019 https://static.acer.com/up/Resource/Acer/Docs/IN/20200205/TMP214-52%20Brochure%20v2.pdf
1625
Acer N18P6 19.7 17/04/2019 https://www.acer.com/ac/en/GB/content/professional-model/NX.VMAEK.001 1100
ASUS B1400C Series 15.5 05/04/2021 https://www.asus.com/Laptops/For-Work/ExpertBook/ExpertBook-B1-B1400/techspec/ 1450
ASUS B9450F Series 17.7 16/12/2019 https://www.asus.com/uk/Commercial-Laptops/ASUS-ExpertBook-B9450FA/Tech-Specs/
995
ASUS C403N Series 14.9 07/01/2019 https://www.asus.com/uk/Laptops/For-Home/Chromebook/ASUS-Chromebook-C403/techspec/
1700
ASUS C423N 12.9 01/10/2018 https://www.asus.com/uk/Laptops/For-Home/Chromebook/ASUS-Chromebook-C423/techspec/
1340
ASUS C433T Series 12 06/08/2019 https://www.asus.com/uk/Laptops/For-Home/Chromebook/ASUS-Chromebook-Flip-C433/techspec/
1500
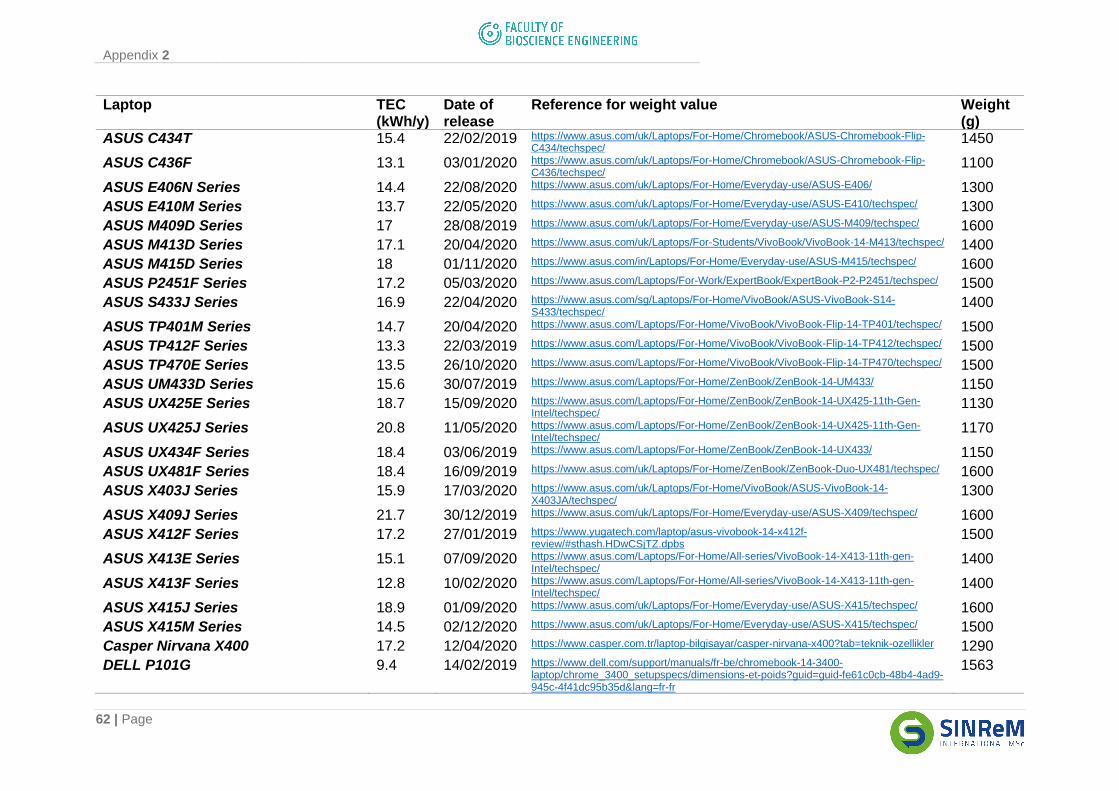
Appendix 2
62 | Page
Laptop TEC (kWh/y)
Date of release
Reference for weight value Weight (g)
ASUS C434T 15.4 22/02/2019 https://www.asus.com/uk/Laptops/For-Home/Chromebook/ASUS-Chromebook-Flip-C434/techspec/
1450
ASUS C436F 13.1 03/01/2020 https://www.asus.com/uk/Laptops/For-Home/Chromebook/ASUS-Chromebook-Flip-C436/techspec/
1100
ASUS E406N Series 14.4 22/08/2020 https://www.asus.com/uk/Laptops/For-Home/Everyday-use/ASUS-E406/ 1300
ASUS E410M Series 13.7 22/05/2020 https://www.asus.com/uk/Laptops/For-Home/Everyday-use/ASUS-E410/techspec/ 1300
ASUS M409D Series 17 28/08/2019 https://www.asus.com/uk/Laptops/For-Home/Everyday-use/ASUS-M409/techspec/ 1600
ASUS M413D Series 17.1 20/04/2020 https://www.asus.com/uk/Laptops/For-Students/VivoBook/VivoBook-14-M413/techspec/ 1400
ASUS M415D Series 18 01/11/2020 https://www.asus.com/in/Laptops/For-Home/Everyday-use/ASUS-M415/techspec/ 1600
ASUS P2451F Series 17.2 05/03/2020 https://www.asus.com/Laptops/For-Work/ExpertBook/ExpertBook-P2-P2451/techspec/ 1500
ASUS S433J Series 16.9 22/04/2020 https://www.asus.com/sg/Laptops/For-Home/VivoBook/ASUS-VivoBook-S14-S433/techspec/
1400
ASUS TP401M Series 14.7 20/04/2020 https://www.asus.com/Laptops/For-Home/VivoBook/VivoBook-Flip-14-TP401/techspec/ 1500
ASUS TP412F Series 13.3 22/03/2019 https://www.asus.com/Laptops/For-Home/VivoBook/VivoBook-Flip-14-TP412/techspec/ 1500
ASUS TP470E Series 13.5 26/10/2020 https://www.asus.com/Laptops/For-Home/VivoBook/VivoBook-Flip-14-TP470/techspec/ 1500
ASUS UM433D Series 15.6 30/07/2019 https://www.asus.com/Laptops/For-Home/ZenBook/ZenBook-14-UM433/ 1150
ASUS UX425E Series 18.7 15/09/2020 https://www.asus.com/Laptops/For-Home/ZenBook/ZenBook-14-UX425-11th-Gen-Intel/techspec/
1130
ASUS UX425J Series 20.8 11/05/2020 https://www.asus.com/Laptops/For-Home/ZenBook/ZenBook-14-UX425-11th-Gen-Intel/techspec/
1170
ASUS UX434F Series 18.4 03/06/2019 https://www.asus.com/Laptops/For-Home/ZenBook/ZenBook-14-UX433/ 1150
ASUS UX481F Series 18.4 16/09/2019 https://www.asus.com/uk/Laptops/For-Home/ZenBook/ZenBook-Duo-UX481/techspec/ 1600
ASUS X403J Series 15.9 17/03/2020 https://www.asus.com/uk/Laptops/For-Home/VivoBook/ASUS-VivoBook-14-X403JA/techspec/
1300
ASUS X409J Series 21.7 30/12/2019 https://www.asus.com/uk/Laptops/For-Home/Everyday-use/ASUS-X409/techspec/ 1600
ASUS X412F Series 17.2 27/01/2019 https://www.yugatech.com/laptop/asus-vivobook-14-x412f-review/#sthash.HDwCSjTZ.dpbs
1500
ASUS X413E Series 15.1 07/09/2020 https://www.asus.com/Laptops/For-Home/All-series/VivoBook-14-X413-11th-gen-Intel/techspec/
1400
ASUS X413F Series 12.8 10/02/2020 https://www.asus.com/Laptops/For-Home/All-series/VivoBook-14-X413-11th-gen-Intel/techspec/
1400
ASUS X415J Series 18.9 01/09/2020 https://www.asus.com/uk/Laptops/For-Home/Everyday-use/ASUS-X415/techspec/ 1600
ASUS X415M Series 14.5 02/12/2020 https://www.asus.com/uk/Laptops/For-Home/Everyday-use/ASUS-X415/techspec/ 1500
Casper Nirvana X400 17.2 12/04/2020 https://www.casper.com.tr/laptop-bilgisayar/casper-nirvana-x400?tab=teknik-ozellikler 1290
DELL P101G 9.4 14/02/2019 https://www.dell.com/support/manuals/fr-be/chromebook-14-3400-laptop/chrome_3400_setupspecs/dimensions-et-poids?guid=guid-fe61c0cb-48b4-4ad9-945c-4f41dc95b35d&lang=fr-fr
1563
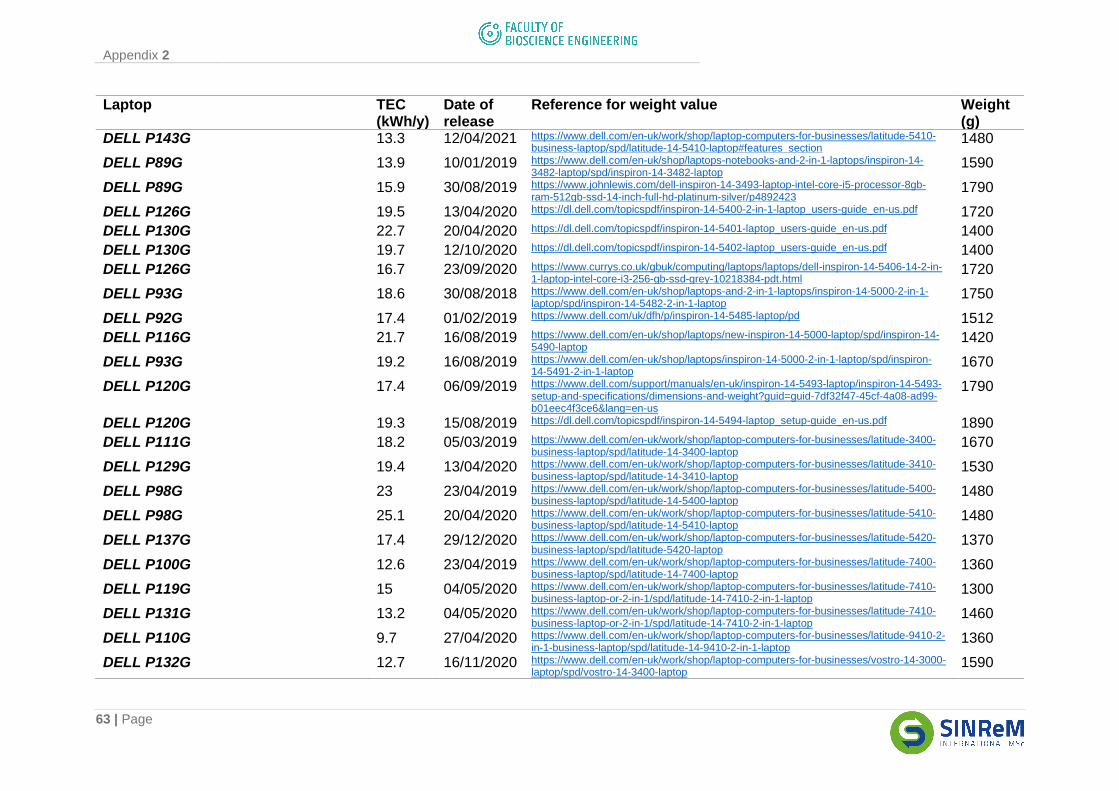
Appendix 2
63 | Page
Laptop TEC (kWh/y)
Date of release
Reference for weight value Weight (g)
DELL P143G 13.3 12/04/2021 https://www.dell.com/en-uk/work/shop/laptop-computers-for-businesses/latitude-5410-business-laptop/spd/latitude-14-5410-laptop#features_section
1480
DELL P89G 13.9 10/01/2019 https://www.dell.com/en-uk/shop/laptops-notebooks-and-2-in-1-laptops/inspiron-14-3482-laptop/spd/inspiron-14-3482-laptop
1590
DELL P89G 15.9 30/08/2019 https://www.johnlewis.com/dell-inspiron-14-3493-laptop-intel-core-i5-processor-8gb-ram-512gb-ssd-14-inch-full-hd-platinum-silver/p4892423
1790
DELL P126G 19.5 13/04/2020 https://dl.dell.com/topicspdf/inspiron-14-5400-2-in-1-laptop_users-guide_en-us.pdf 1720
DELL P130G 22.7 20/04/2020 https://dl.dell.com/topicspdf/inspiron-14-5401-laptop_users-guide_en-us.pdf 1400
DELL P130G 19.7 12/10/2020 https://dl.dell.com/topicspdf/inspiron-14-5402-laptop_users-guide_en-us.pdf 1400
DELL P126G 16.7 23/09/2020 https://www.currys.co.uk/gbuk/computing/laptops/laptops/dell-inspiron-14-5406-14-2-in-1-laptop-intel-core-i3-256-gb-ssd-grey-10218384-pdt.html
1720
DELL P93G 18.6 30/08/2018 https://www.dell.com/en-uk/shop/laptops-and-2-in-1-laptops/inspiron-14-5000-2-in-1-laptop/spd/inspiron-14-5482-2-in-1-laptop
1750
DELL P92G 17.4 01/02/2019 https://www.dell.com/uk/dfh/p/inspiron-14-5485-laptop/pd 1512
DELL P116G 21.7 16/08/2019 https://www.dell.com/en-uk/shop/laptops/new-inspiron-14-5000-laptop/spd/inspiron-14-5490-laptop
1420
DELL P93G 19.2 16/08/2019 https://www.dell.com/en-uk/shop/laptops/inspiron-14-5000-2-in-1-laptop/spd/inspiron-14-5491-2-in-1-laptop
1670
DELL P120G 17.4 06/09/2019 https://www.dell.com/support/manuals/en-uk/inspiron-14-5493-laptop/inspiron-14-5493-setup-and-specifications/dimensions-and-weight?guid=guid-7df32f47-45cf-4a08-ad99-b01eec4f3ce6&lang=en-us
1790
DELL P120G 19.3 15/08/2019 https://dl.dell.com/topicspdf/inspiron-14-5494-laptop_setup-guide_en-us.pdf 1890
DELL P111G 18.2 05/03/2019 https://www.dell.com/en-uk/work/shop/laptop-computers-for-businesses/latitude-3400-business-laptop/spd/latitude-14-3400-laptop
1670
DELL P129G 19.4 13/04/2020 https://www.dell.com/en-uk/work/shop/laptop-computers-for-businesses/latitude-3410-business-laptop/spd/latitude-14-3410-laptop
1530
DELL P98G 23 23/04/2019 https://www.dell.com/en-uk/work/shop/laptop-computers-for-businesses/latitude-5400-business-laptop/spd/latitude-14-5400-laptop
1480
DELL P98G 25.1 20/04/2020 https://www.dell.com/en-uk/work/shop/laptop-computers-for-businesses/latitude-5410-business-laptop/spd/latitude-14-5410-laptop
1480
DELL P137G 17.4 29/12/2020 https://www.dell.com/en-uk/work/shop/laptop-computers-for-businesses/latitude-5420-business-laptop/spd/latitude-5420-laptop
1370
DELL P100G 12.6 23/04/2019 https://www.dell.com/en-uk/work/shop/laptop-computers-for-businesses/latitude-7400-business-laptop/spd/latitude-14-7400-laptop
1360
DELL P119G 15 04/05/2020 https://www.dell.com/en-uk/work/shop/laptop-computers-for-businesses/latitude-7410-business-laptop-or-2-in-1/spd/latitude-14-7410-2-in-1-laptop
1300
DELL P131G 13.2 04/05/2020 https://www.dell.com/en-uk/work/shop/laptop-computers-for-businesses/latitude-7410-business-laptop-or-2-in-1/spd/latitude-14-7410-2-in-1-laptop
1460
DELL P110G 9.7 27/04/2020 https://www.dell.com/en-uk/work/shop/laptop-computers-for-businesses/latitude-9410-2-in-1-business-laptop/spd/latitude-14-9410-2-in-1-laptop
1360
DELL P132G 12.7 16/11/2020 https://www.dell.com/en-uk/work/shop/laptop-computers-for-businesses/vostro-14-3000-laptop/spd/vostro-14-3400-laptop
1590
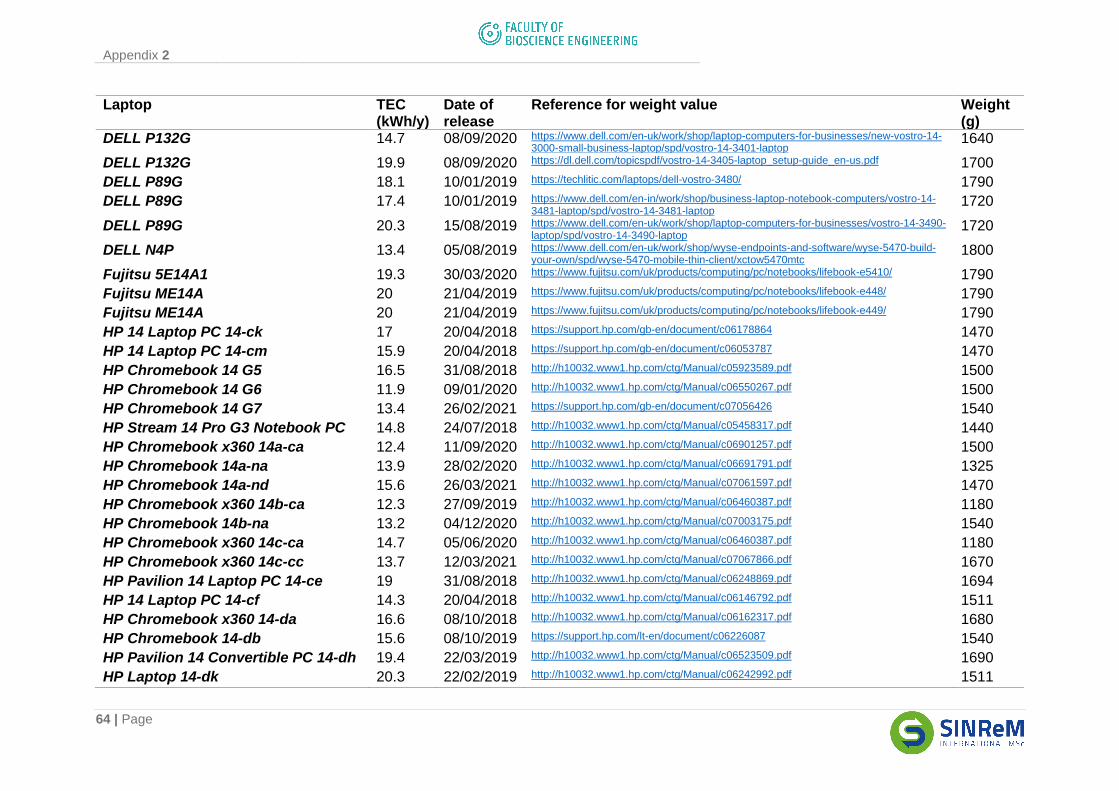
Appendix 2
64 | Page
Laptop TEC (kWh/y)
Date of release
Reference for weight value Weight (g)
DELL P132G 14.7 08/09/2020 https://www.dell.com/en-uk/work/shop/laptop-computers-for-businesses/new-vostro-14-3000-small-business-laptop/spd/vostro-14-3401-laptop
1640
DELL P132G 19.9 08/09/2020 https://dl.dell.com/topicspdf/vostro-14-3405-laptop_setup-guide_en-us.pdf 1700
DELL P89G 18.1 10/01/2019 https://techlitic.com/laptops/dell-vostro-3480/ 1790
DELL P89G 17.4 10/01/2019 https://www.dell.com/en-in/work/shop/business-laptop-notebook-computers/vostro-14-3481-laptop/spd/vostro-14-3481-laptop
1720
DELL P89G 20.3 15/08/2019 https://www.dell.com/en-uk/work/shop/laptop-computers-for-businesses/vostro-14-3490-laptop/spd/vostro-14-3490-laptop
1720
DELL N4P 13.4 05/08/2019 https://www.dell.com/en-uk/work/shop/wyse-endpoints-and-software/wyse-5470-build-your-own/spd/wyse-5470-mobile-thin-client/xctow5470mtc
1800
Fujitsu 5E14A1 19.3 30/03/2020 https://www.fujitsu.com/uk/products/computing/pc/notebooks/lifebook-e5410/ 1790
Fujitsu ME14A 20 21/04/2019 https://www.fujitsu.com/uk/products/computing/pc/notebooks/lifebook-e448/ 1790
Fujitsu ME14A 20 21/04/2019 https://www.fujitsu.com/uk/products/computing/pc/notebooks/lifebook-e449/ 1790
HP 14 Laptop PC 14-ck 17 20/04/2018 https://support.hp.com/gb-en/document/c06178864 1470
HP 14 Laptop PC 14-cm 15.9 20/04/2018 https://support.hp.com/gb-en/document/c06053787 1470
HP Chromebook 14 G5 16.5 31/08/2018 http://h10032.www1.hp.com/ctg/Manual/c05923589.pdf 1500
HP Chromebook 14 G6 11.9 09/01/2020 http://h10032.www1.hp.com/ctg/Manual/c06550267.pdf 1500
HP Chromebook 14 G7 13.4 26/02/2021 https://support.hp.com/gb-en/document/c07056426 1540
HP Stream 14 Pro G3 Notebook PC 14.8 24/07/2018 http://h10032.www1.hp.com/ctg/Manual/c05458317.pdf 1440
HP Chromebook x360 14a-ca 12.4 11/09/2020 http://h10032.www1.hp.com/ctg/Manual/c06901257.pdf 1500
HP Chromebook 14a-na 13.9 28/02/2020 http://h10032.www1.hp.com/ctg/Manual/c06691791.pdf 1325
HP Chromebook 14a-nd 15.6 26/03/2021 http://h10032.www1.hp.com/ctg/Manual/c07061597.pdf 1470
HP Chromebook x360 14b-ca 12.3 27/09/2019 http://h10032.www1.hp.com/ctg/Manual/c06460387.pdf 1180
HP Chromebook 14b-na 13.2 04/12/2020 http://h10032.www1.hp.com/ctg/Manual/c07003175.pdf 1540
HP Chromebook x360 14c-ca 14.7 05/06/2020 http://h10032.www1.hp.com/ctg/Manual/c06460387.pdf 1180
HP Chromebook x360 14c-cc 13.7 12/03/2021 http://h10032.www1.hp.com/ctg/Manual/c07067866.pdf 1670
HP Pavilion 14 Laptop PC 14-ce 19 31/08/2018 http://h10032.www1.hp.com/ctg/Manual/c06248869.pdf 1694
HP 14 Laptop PC 14-cf 14.3 20/04/2018 http://h10032.www1.hp.com/ctg/Manual/c06146792.pdf 1511
HP Chromebook x360 14-da 16.6 08/10/2018 http://h10032.www1.hp.com/ctg/Manual/c06162317.pdf 1680
HP Chromebook 14-db 15.6 08/10/2019 https://support.hp.com/lt-en/document/c06226087 1540
HP Pavilion 14 Convertible PC 14-dh 19.4 22/03/2019 http://h10032.www1.hp.com/ctg/Manual/c06523509.pdf 1690
HP Laptop 14-dk 20.3 22/02/2019 http://h10032.www1.hp.com/ctg/Manual/c06242992.pdf 1511
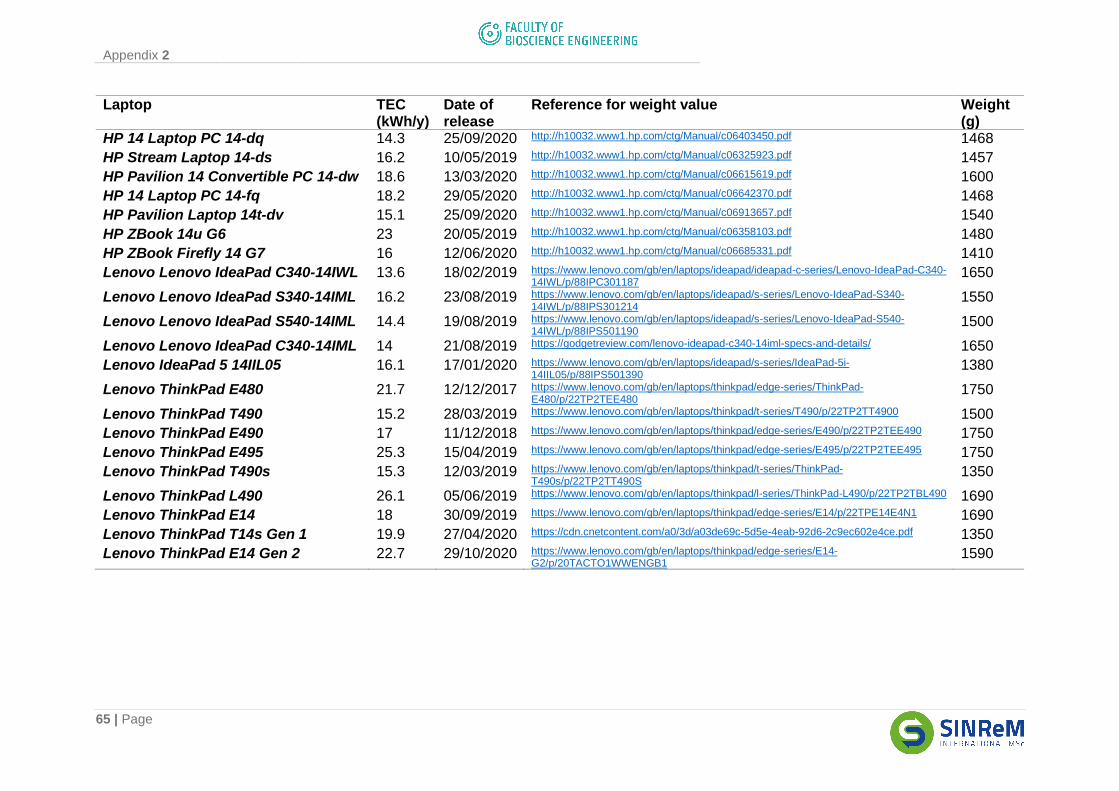
Appendix 2
65 | Page
Laptop TEC (kWh/y)
Date of release
Reference for weight value Weight (g)
HP 14 Laptop PC 14-dq 14.3 25/09/2020 http://h10032.www1.hp.com/ctg/Manual/c06403450.pdf 1468
HP Stream Laptop 14-ds 16.2 10/05/2019 http://h10032.www1.hp.com/ctg/Manual/c06325923.pdf 1457
HP Pavilion 14 Convertible PC 14-dw 18.6 13/03/2020 http://h10032.www1.hp.com/ctg/Manual/c06615619.pdf 1600
HP 14 Laptop PC 14-fq 18.2 29/05/2020 http://h10032.www1.hp.com/ctg/Manual/c06642370.pdf 1468
HP Pavilion Laptop 14t-dv 15.1 25/09/2020 http://h10032.www1.hp.com/ctg/Manual/c06913657.pdf 1540
HP ZBook 14u G6 23 20/05/2019 http://h10032.www1.hp.com/ctg/Manual/c06358103.pdf 1480
HP ZBook Firefly 14 G7 16 12/06/2020 http://h10032.www1.hp.com/ctg/Manual/c06685331.pdf 1410
Lenovo Lenovo IdeaPad C340-14IWL 13.6 18/02/2019 https://www.lenovo.com/gb/en/laptops/ideapad/ideapad-c-series/Lenovo-IdeaPad-C340-14IWL/p/88IPC301187
1650
Lenovo Lenovo IdeaPad S340-14IML 16.2 23/08/2019 https://www.lenovo.com/gb/en/laptops/ideapad/s-series/Lenovo-IdeaPad-S340-14IWL/p/88IPS301214
1550
Lenovo Lenovo IdeaPad S540-14IML 14.4 19/08/2019 https://www.lenovo.com/gb/en/laptops/ideapad/s-series/Lenovo-IdeaPad-S540-14IWL/p/88IPS501190
1500
Lenovo Lenovo IdeaPad C340-14IML 14 21/08/2019 https://godgetreview.com/lenovo-ideapad-c340-14iml-specs-and-details/ 1650
Lenovo IdeaPad 5 14IIL05 16.1 17/01/2020 https://www.lenovo.com/gb/en/laptops/ideapad/s-series/IdeaPad-5i-14IIL05/p/88IPS501390
1380
Lenovo ThinkPad E480 21.7 12/12/2017 https://www.lenovo.com/gb/en/laptops/thinkpad/edge-series/ThinkPad-E480/p/22TP2TEE480
1750
Lenovo ThinkPad T490 15.2 28/03/2019 https://www.lenovo.com/gb/en/laptops/thinkpad/t-series/T490/p/22TP2TT4900 1500
Lenovo ThinkPad E490 17 11/12/2018 https://www.lenovo.com/gb/en/laptops/thinkpad/edge-series/E490/p/22TP2TEE490 1750
Lenovo ThinkPad E495 25.3 15/04/2019 https://www.lenovo.com/gb/en/laptops/thinkpad/edge-series/E495/p/22TP2TEE495 1750
Lenovo ThinkPad T490s 15.3 12/03/2019 https://www.lenovo.com/gb/en/laptops/thinkpad/t-series/ThinkPad-T490s/p/22TP2TT490S
1350
Lenovo ThinkPad L490 26.1 05/06/2019 https://www.lenovo.com/gb/en/laptops/thinkpad/l-series/ThinkPad-L490/p/22TP2TBL490 1690
Lenovo ThinkPad E14 18 30/09/2019 https://www.lenovo.com/gb/en/laptops/thinkpad/edge-series/E14/p/22TPE14E4N1 1690
Lenovo ThinkPad T14s Gen 1 19.9 27/04/2020 https://cdn.cnetcontent.com/a0/3d/a03de69c-5d5e-4eab-92d6-2c9ec602e4ce.pdf 1350
Lenovo ThinkPad E14 Gen 2 22.7 29/10/2020 https://www.lenovo.com/gb/en/laptops/thinkpad/edge-series/E14-G2/p/20TACTO1WWENGB1
1590
Appendix 3
66 | Page
Appendix 3
Criticality-based impact assessment method, based on Tran et al. (2018)
The characterizing factors for this impact assessment method are yielded from criticality
scores found defined by the EU (Blengini et al., 2020). Because the SR and EI values are
defined for resources but also materials already touched by human processes, an equivalent
criticality score must be defined for each elementary flow of an LCA. This is achieved through
a set of rules (Tran et al., 2018):
A. For metals and metalloids, if:
1. The name does not differ from the elementary flow to the studied material, the
equivalent criticality score is simply the criticality score, found by multiplying the
SR to the EI.
2. The elementary flow contains both the element name and the ore in which it is
found, the equivalent criticality score is taken as the criticality score of the raw
material itself. The origin and co-extracted metals are not considered.
3. It is a metal group within the CRM study, the elementary flow takes the criticality
score of the metal group as its equivalent criticality score.
4. A material only has the criticality score of its ore in the EU study, the equivalent
criticality score for the elementary flow is corrected by a factor: the amount of
ore needed to extract that material on average.
5. Rule A.4. is not applicable if the ore is used in the industry for more than the
extraction of the metal in question. In that case, the conversion cannot be
achieved as it is not known where exactly the flow is going to.
B. For minerals and mineral aggregates, if:
1. The name does not differ from the elementary flow to the studied material, or it
is an equivalent name in the industry, the equivalent criticality score is simply
the criticality score.
2. The elementary flow is one of the species of a mineral/mineral group in the EU
study, the equivalent criticality score is that of this mineral or group.
3. The elementary flow has its components in the study, its criticality score can be
derived from those of the components by accounting for global extraction
values.
By employing these rules and the SR and EI values defined in 2020, the following list of
equivalent criticality ratios can be drafted and related to each elementary flow found on
SimaPro for this LCA.
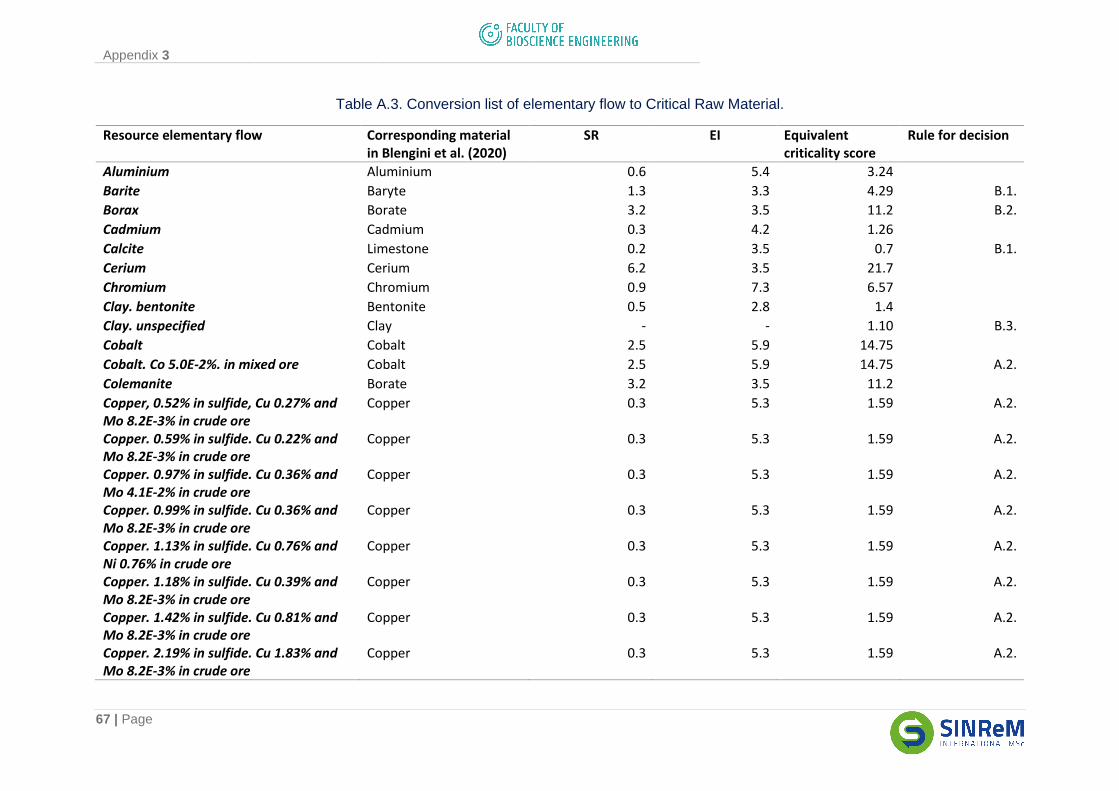
Appendix 3
67 | Page
Table A.3. Conversion list of elementary flow to Critical Raw Material.
Resource elementary flow Corresponding material in Blengini et al. (2020)
SR EI Equivalent criticality score
Rule for decision
Aluminium Aluminium 0.6 5.4 3.24
Barite Baryte 1.3 3.3 4.29 B.1.
Borax Borate 3.2 3.5 11.2 B.2.
Cadmium Cadmium 0.3 4.2 1.26
Calcite Limestone 0.2 3.5 0.7 B.1.
Cerium Cerium 6.2 3.5 21.7
Chromium Chromium 0.9 7.3 6.57
Clay. bentonite Bentonite 0.5 2.8 1.4
Clay. unspecified Clay - - 1.10 B.3.
Cobalt Cobalt 2.5 5.9 14.75
Cobalt. Co 5.0E-2%. in mixed ore Cobalt 2.5 5.9 14.75 A.2.
Colemanite Borate 3.2 3.5 11.2
Copper, 0.52% in sulfide, Cu 0.27% and Mo 8.2E-3% in crude ore
Copper 0.3 5.3 1.59 A.2.
Copper. 0.59% in sulfide. Cu 0.22% and Mo 8.2E-3% in crude ore
Copper 0.3 5.3 1.59 A.2.
Copper. 0.97% in sulfide. Cu 0.36% and Mo 4.1E-2% in crude ore
Copper 0.3 5.3 1.59 A.2.
Copper. 0.99% in sulfide. Cu 0.36% and Mo 8.2E-3% in crude ore
Copper 0.3 5.3 1.59 A.2.
Copper. 1.13% in sulfide. Cu 0.76% and Ni 0.76% in crude ore
Copper 0.3 5.3 1.59 A.2.
Copper. 1.18% in sulfide. Cu 0.39% and Mo 8.2E-3% in crude ore
Copper 0.3 5.3 1.59 A.2.
Copper. 1.42% in sulfide. Cu 0.81% and Mo 8.2E-3% in crude ore
Copper 0.3 5.3 1.59 A.2.
Copper. 2.19% in sulfide. Cu 1.83% and Mo 8.2E-3% in crude ore
Copper 0.3 5.3 1.59 A.2.
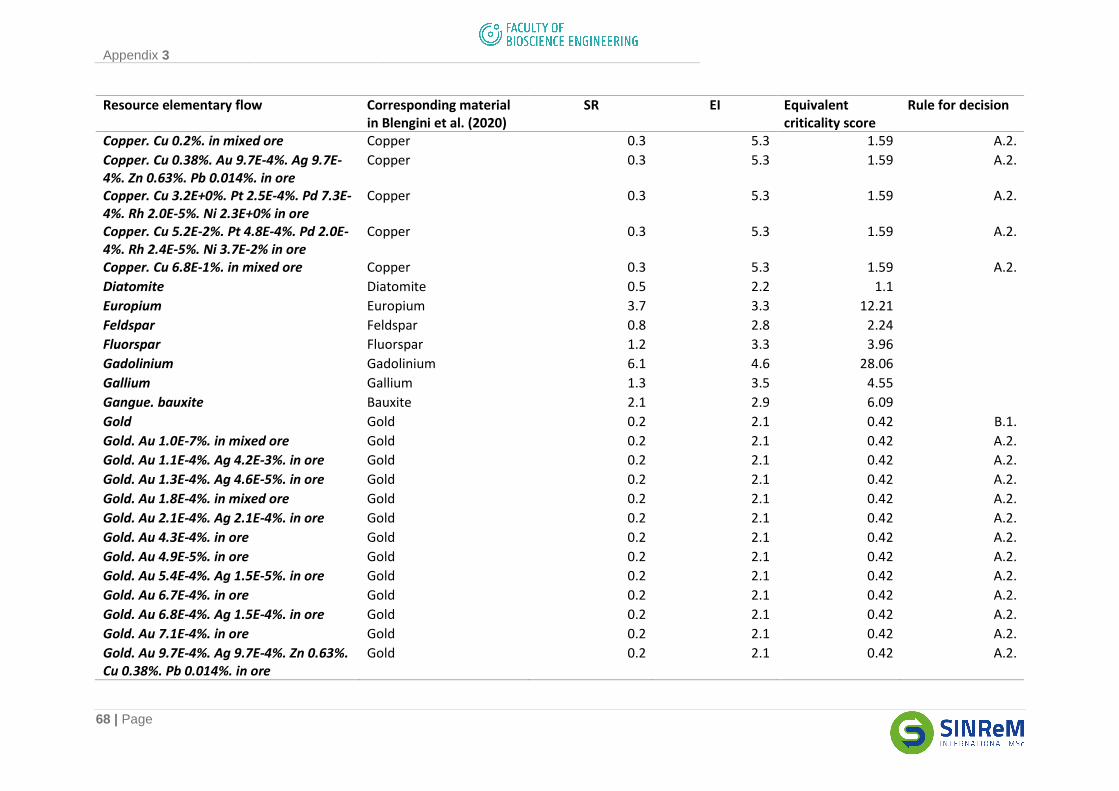
Appendix 3
68 | Page
Resource elementary flow Corresponding material in Blengini et al. (2020)
SR EI Equivalent criticality score
Rule for decision
Copper. Cu 0.2%. in mixed ore Copper 0.3 5.3 1.59 A.2.
Copper. Cu 0.38%. Au 9.7E-4%. Ag 9.7E-4%. Zn 0.63%. Pb 0.014%. in ore
Copper 0.3 5.3 1.59 A.2.
Copper. Cu 3.2E+0%. Pt 2.5E-4%. Pd 7.3E-4%. Rh 2.0E-5%. Ni 2.3E+0% in ore
Copper 0.3 5.3 1.59 A.2.
Copper. Cu 5.2E-2%. Pt 4.8E-4%. Pd 2.0E-4%. Rh 2.4E-5%. Ni 3.7E-2% in ore
Copper 0.3 5.3 1.59 A.2.
Copper. Cu 6.8E-1%. in mixed ore Copper 0.3 5.3 1.59 A.2.
Diatomite Diatomite 0.5 2.2 1.1
Europium Europium 3.7 3.3 12.21
Feldspar Feldspar 0.8 2.8 2.24
Fluorspar Fluorspar 1.2 3.3 3.96
Gadolinium Gadolinium 6.1 4.6 28.06
Gallium Gallium 1.3 3.5 4.55
Gangue. bauxite Bauxite 2.1 2.9 6.09
Gold Gold 0.2 2.1 0.42 B.1.
Gold. Au 1.0E-7%. in mixed ore Gold 0.2 2.1 0.42 A.2.
Gold. Au 1.1E-4%. Ag 4.2E-3%. in ore Gold 0.2 2.1 0.42 A.2.
Gold. Au 1.3E-4%. Ag 4.6E-5%. in ore Gold 0.2 2.1 0.42 A.2.
Gold. Au 1.8E-4%. in mixed ore Gold 0.2 2.1 0.42 A.2.
Gold. Au 2.1E-4%. Ag 2.1E-4%. in ore Gold 0.2 2.1 0.42 A.2.
Gold. Au 4.3E-4%. in ore Gold 0.2 2.1 0.42 A.2.
Gold. Au 4.9E-5%. in ore Gold 0.2 2.1 0.42 A.2.
Gold. Au 5.4E-4%. Ag 1.5E-5%. in ore Gold 0.2 2.1 0.42 A.2.
Gold. Au 6.7E-4%. in ore Gold 0.2 2.1 0.42 A.2.
Gold. Au 6.8E-4%. Ag 1.5E-4%. in ore Gold 0.2 2.1 0.42 A.2.
Gold. Au 7.1E-4%. in ore Gold 0.2 2.1 0.42 A.2.
Gold. Au 9.7E-4%. Ag 9.7E-4%. Zn 0.63%. Cu 0.38%. Pb 0.014%. in ore
Gold 0.2 2.1 0.42 A.2.
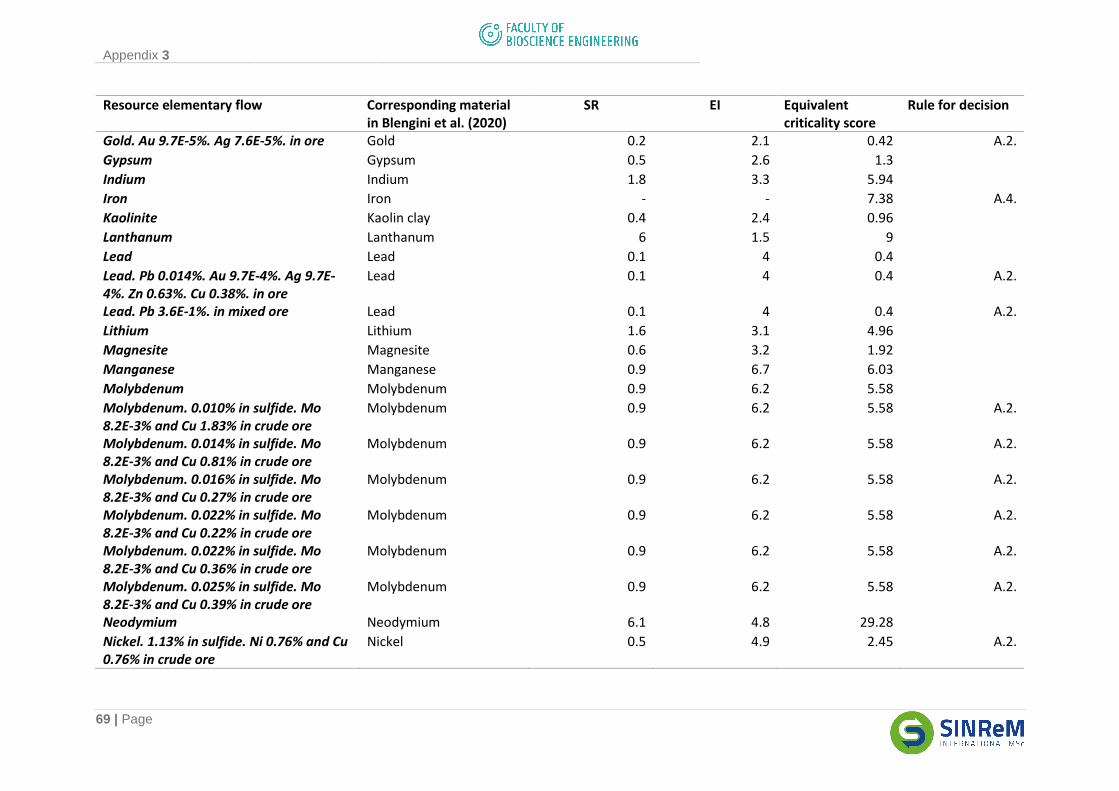
Appendix 3
69 | Page
Resource elementary flow Corresponding material in Blengini et al. (2020)
SR EI Equivalent criticality score
Rule for decision
Gold. Au 9.7E-5%. Ag 7.6E-5%. in ore Gold 0.2 2.1 0.42 A.2.
Gypsum Gypsum 0.5 2.6 1.3
Indium Indium 1.8 3.3 5.94
Iron Iron - - 7.38 A.4.
Kaolinite Kaolin clay 0.4 2.4 0.96
Lanthanum Lanthanum 6 1.5 9
Lead Lead 0.1 4 0.4
Lead. Pb 0.014%. Au 9.7E-4%. Ag 9.7E-4%. Zn 0.63%. Cu 0.38%. in ore
Lead 0.1 4 0.4 A.2.
Lead. Pb 3.6E-1%. in mixed ore Lead 0.1 4 0.4 A.2.
Lithium Lithium 1.6 3.1 4.96
Magnesite Magnesite 0.6 3.2 1.92
Manganese Manganese 0.9 6.7 6.03
Molybdenum Molybdenum 0.9 6.2 5.58
Molybdenum. 0.010% in sulfide. Mo 8.2E-3% and Cu 1.83% in crude ore
Molybdenum 0.9 6.2 5.58 A.2.
Molybdenum. 0.014% in sulfide. Mo 8.2E-3% and Cu 0.81% in crude ore
Molybdenum 0.9 6.2 5.58 A.2.
Molybdenum. 0.016% in sulfide. Mo 8.2E-3% and Cu 0.27% in crude ore
Molybdenum 0.9 6.2 5.58 A.2.
Molybdenum. 0.022% in sulfide. Mo 8.2E-3% and Cu 0.22% in crude ore
Molybdenum 0.9 6.2 5.58 A.2.
Molybdenum. 0.022% in sulfide. Mo 8.2E-3% and Cu 0.36% in crude ore
Molybdenum 0.9 6.2 5.58 A.2.
Molybdenum. 0.025% in sulfide. Mo 8.2E-3% and Cu 0.39% in crude ore
Molybdenum 0.9 6.2 5.58 A.2.
Neodymium Neodymium 6.1 4.8 29.28
Nickel. 1.13% in sulfide. Ni 0.76% and Cu 0.76% in crude ore
Nickel 0.5 4.9 2.45 A.2.
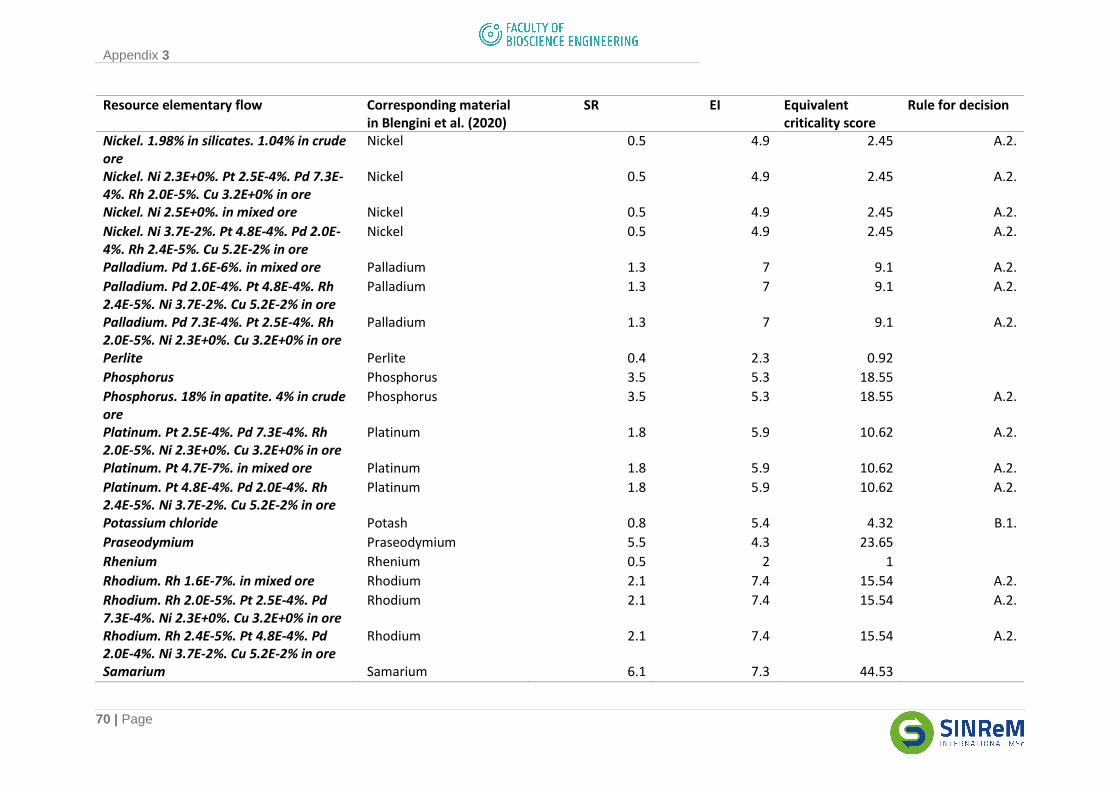
Appendix 3
70 | Page
Resource elementary flow Corresponding material in Blengini et al. (2020)
SR EI Equivalent criticality score
Rule for decision
Nickel. 1.98% in silicates. 1.04% in crude ore
Nickel 0.5 4.9 2.45 A.2.
Nickel. Ni 2.3E+0%. Pt 2.5E-4%. Pd 7.3E-4%. Rh 2.0E-5%. Cu 3.2E+0% in ore
Nickel 0.5 4.9 2.45 A.2.
Nickel. Ni 2.5E+0%. in mixed ore Nickel 0.5 4.9 2.45 A.2.
Nickel. Ni 3.7E-2%. Pt 4.8E-4%. Pd 2.0E-4%. Rh 2.4E-5%. Cu 5.2E-2% in ore
Nickel 0.5 4.9 2.45 A.2.
Palladium. Pd 1.6E-6%. in mixed ore Palladium 1.3 7 9.1 A.2.
Palladium. Pd 2.0E-4%. Pt 4.8E-4%. Rh 2.4E-5%. Ni 3.7E-2%. Cu 5.2E-2% in ore
Palladium 1.3 7 9.1 A.2.
Palladium. Pd 7.3E-4%. Pt 2.5E-4%. Rh 2.0E-5%. Ni 2.3E+0%. Cu 3.2E+0% in ore
Palladium 1.3 7 9.1 A.2.
Perlite Perlite 0.4 2.3 0.92
Phosphorus Phosphorus 3.5 5.3 18.55
Phosphorus. 18% in apatite. 4% in crude ore
Phosphorus 3.5 5.3 18.55 A.2.
Platinum. Pt 2.5E-4%. Pd 7.3E-4%. Rh 2.0E-5%. Ni 2.3E+0%. Cu 3.2E+0% in ore
Platinum 1.8 5.9 10.62 A.2.
Platinum. Pt 4.7E-7%. in mixed ore Platinum 1.8 5.9 10.62 A.2.
Platinum. Pt 4.8E-4%. Pd 2.0E-4%. Rh 2.4E-5%. Ni 3.7E-2%. Cu 5.2E-2% in ore
Platinum 1.8 5.9 10.62 A.2.
Potassium chloride Potash 0.8 5.4 4.32 B.1.
Praseodymium Praseodymium 5.5 4.3 23.65
Rhenium Rhenium 0.5 2 1
Rhodium. Rh 1.6E-7%. in mixed ore Rhodium 2.1 7.4 15.54 A.2.
Rhodium. Rh 2.0E-5%. Pt 2.5E-4%. Pd 7.3E-4%. Ni 2.3E+0%. Cu 3.2E+0% in ore
Rhodium 2.1 7.4 15.54 A.2.
Rhodium. Rh 2.4E-5%. Pt 4.8E-4%. Pd 2.0E-4%. Ni 3.7E-2%. Cu 5.2E-2% in ore
Rhodium 2.1 7.4 15.54 A.2.
Samarium Samarium 6.1 7.3 44.53
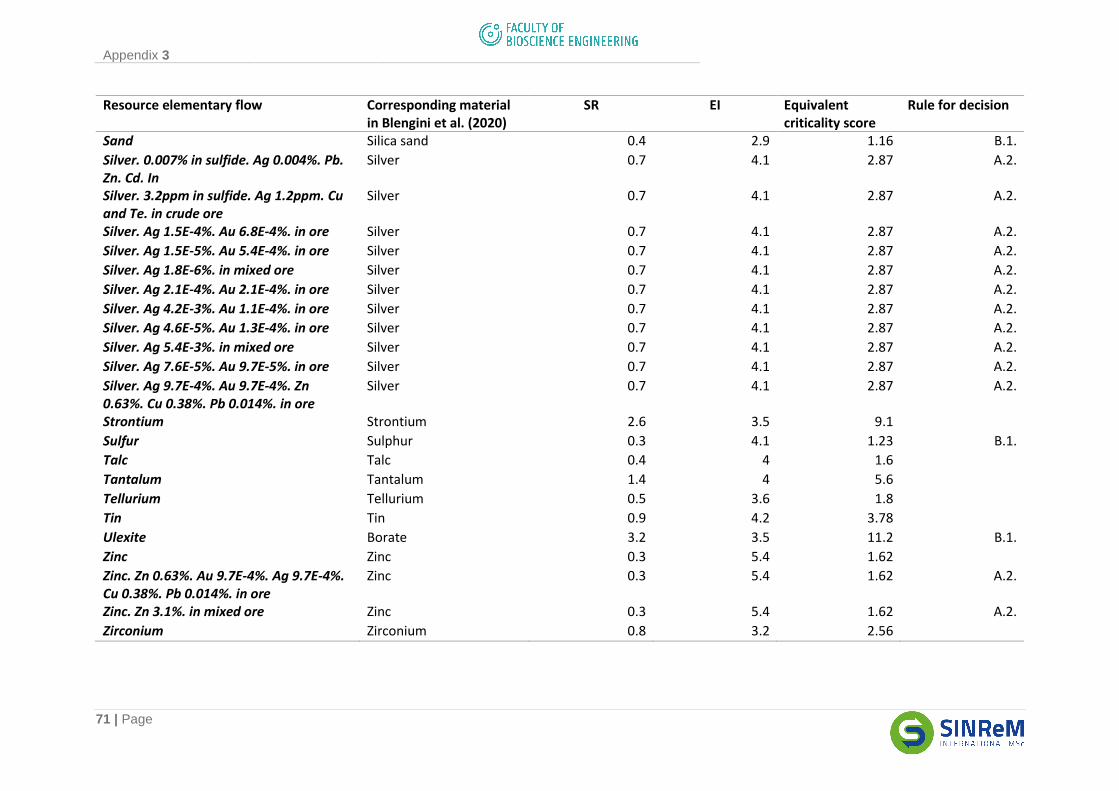
Appendix 3
71 | Page
Resource elementary flow Corresponding material in Blengini et al. (2020)
SR EI Equivalent criticality score
Rule for decision
Sand Silica sand 0.4 2.9 1.16 B.1.
Silver. 0.007% in sulfide. Ag 0.004%. Pb. Zn. Cd. In
Silver 0.7 4.1 2.87 A.2.
Silver. 3.2ppm in sulfide. Ag 1.2ppm. Cu and Te. in crude ore
Silver 0.7 4.1 2.87 A.2.
Silver. Ag 1.5E-4%. Au 6.8E-4%. in ore Silver 0.7 4.1 2.87 A.2.
Silver. Ag 1.5E-5%. Au 5.4E-4%. in ore Silver 0.7 4.1 2.87 A.2.
Silver. Ag 1.8E-6%. in mixed ore Silver 0.7 4.1 2.87 A.2.
Silver. Ag 2.1E-4%. Au 2.1E-4%. in ore Silver 0.7 4.1 2.87 A.2.
Silver. Ag 4.2E-3%. Au 1.1E-4%. in ore Silver 0.7 4.1 2.87 A.2.
Silver. Ag 4.6E-5%. Au 1.3E-4%. in ore Silver 0.7 4.1 2.87 A.2.
Silver. Ag 5.4E-3%. in mixed ore Silver 0.7 4.1 2.87 A.2.
Silver. Ag 7.6E-5%. Au 9.7E-5%. in ore Silver 0.7 4.1 2.87 A.2.
Silver. Ag 9.7E-4%. Au 9.7E-4%. Zn 0.63%. Cu 0.38%. Pb 0.014%. in ore
Silver 0.7 4.1 2.87 A.2.
Strontium Strontium 2.6 3.5 9.1
Sulfur Sulphur 0.3 4.1 1.23 B.1.
Talc Talc 0.4 4 1.6
Tantalum Tantalum 1.4 4 5.6
Tellurium Tellurium 0.5 3.6 1.8
Tin Tin 0.9 4.2 3.78
Ulexite Borate 3.2 3.5 11.2 B.1.
Zinc Zinc 0.3 5.4 1.62
Zinc. Zn 0.63%. Au 9.7E-4%. Ag 9.7E-4%. Cu 0.38%. Pb 0.014%. in ore
Zinc 0.3 5.4 1.62 A.2.
Zinc. Zn 3.1%. in mixed ore Zinc 0.3 5.4 1.62 A.2.
Zirconium Zirconium 0.8 3.2 2.56
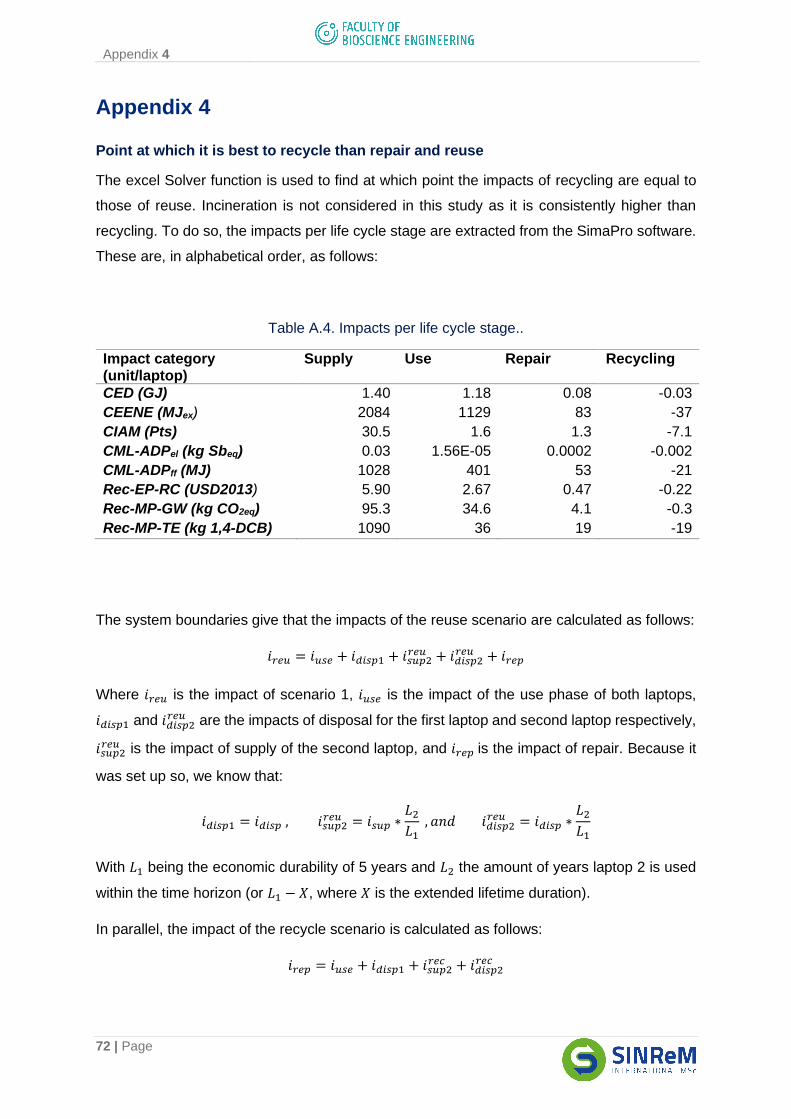
Appendix 4
72 | Page
Appendix 4
Point at which it is best to recycle than repair and reuse
The excel Solver function is used to find at which point the impacts of recycling are equal to
those of reuse. Incineration is not considered in this study as it is consistently higher than
recycling. To do so, the impacts per life cycle stage are extracted from the SimaPro software.
These are, in alphabetical order, as follows:
Table A.4. Impacts per life cycle stage..
Impact category (unit/laptop)
Supply Use Repair Recycling
CED (GJ) 1.40 1.18 0.08 -0.03
CEENE (MJex) 2084 1129 83 -37
CIAM (Pts) 30.5 1.6 1.3 -7.1
CML-ADPel (kg Sbeq) 0.03 1.56E-05 0.0002 -0.002
CML-ADPff (MJ) 1028 401 53 -21
Rec-EP-RC (USD2013) 5.90 2.67 0.47 -0.22
Rec-MP-GW (kg CO2eq) 95.3 34.6 4.1 -0.3
Rec-MP-TE (kg 1,4-DCB) 1090 36 19 -19
The system boundaries give that the impacts of the reuse scenario are calculated as follows:
𝑖𝑟𝑒𝑢 = 𝑖𝑢𝑠𝑒 + 𝑖𝑑𝑖𝑠𝑝1 + 𝑖𝑠𝑢𝑝2𝑟𝑒𝑢 + 𝑖𝑑𝑖𝑠𝑝2
𝑟𝑒𝑢 + 𝑖𝑟𝑒𝑝
Where 𝑖𝑟𝑒𝑢 is the impact of scenario 1, 𝑖𝑢𝑠𝑒 is the impact of the use phase of both laptops,
𝑖𝑑𝑖𝑠𝑝1 and 𝑖𝑑𝑖𝑠𝑝2𝑟𝑒𝑢 are the impacts of disposal for the first laptop and second laptop respectively,
𝑖𝑠𝑢𝑝2𝑟𝑒𝑢 is the impact of supply of the second laptop, and 𝑖𝑟𝑒𝑝 is the impact of repair. Because it
was set up so, we know that:
𝑖𝑑𝑖𝑠𝑝1 = 𝑖𝑑𝑖𝑠𝑝 , 𝑖𝑠𝑢𝑝2𝑟𝑒𝑢 = 𝑖𝑠𝑢𝑝 ∗
𝐿2
𝐿1 , 𝑎𝑛𝑑 𝑖𝑑𝑖𝑠𝑝2
𝑟𝑒𝑢 = 𝑖𝑑𝑖𝑠𝑝 ∗𝐿2
𝐿1
With 𝐿1 being the economic durability of 5 years and 𝐿2 the amount of years laptop 2 is used
within the time horizon (or 𝐿1 − 𝑋, where 𝑋 is the extended lifetime duration).
In parallel, the impact of the recycle scenario is calculated as follows:
𝑖𝑟𝑒𝑝 = 𝑖𝑢𝑠𝑒 + 𝑖𝑑𝑖𝑠𝑝1 + 𝑖𝑠𝑢𝑝2𝑟𝑒𝑐 + 𝑖𝑑𝑖𝑠𝑝2
𝑟𝑒𝑐
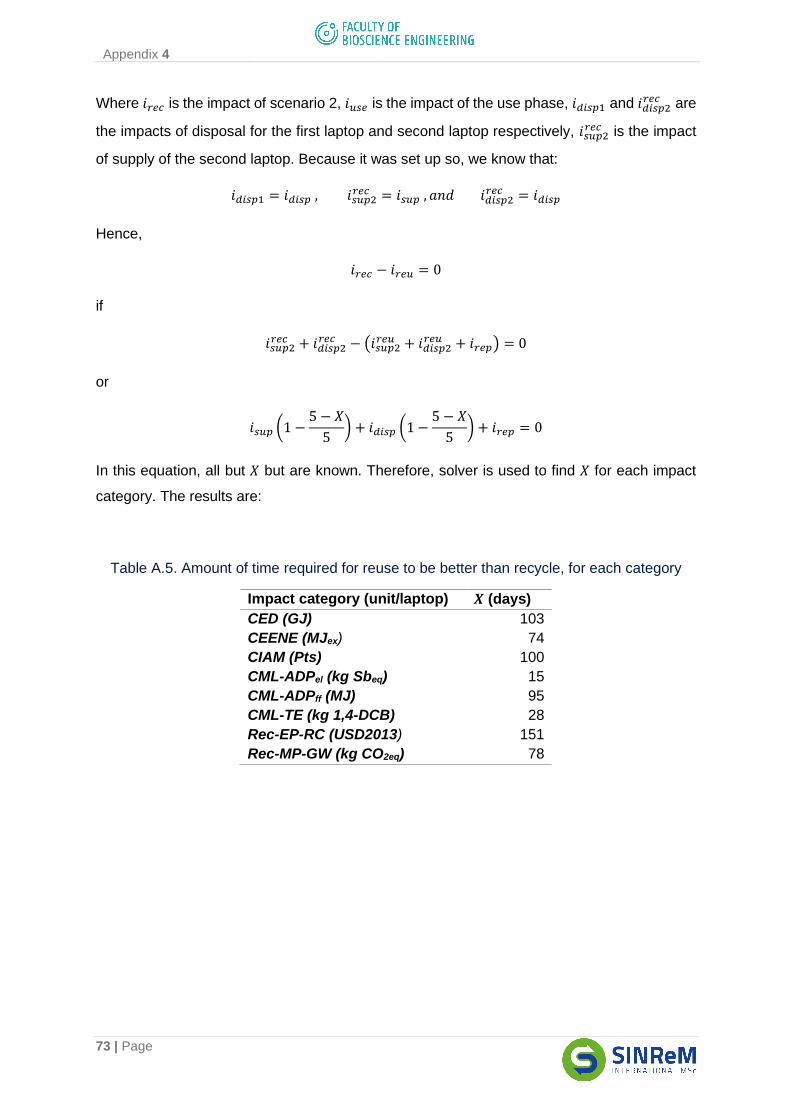
Appendix 4
73 | Page
Where 𝑖𝑟𝑒𝑐 is the impact of scenario 2, 𝑖𝑢𝑠𝑒 is the impact of the use phase, 𝑖𝑑𝑖𝑠𝑝1 and 𝑖𝑑𝑖𝑠𝑝2𝑟𝑒𝑐 are
the impacts of disposal for the first laptop and second laptop respectively, 𝑖𝑠𝑢𝑝2𝑟𝑒𝑐 is the impact
of supply of the second laptop. Because it was set up so, we know that:
𝑖𝑑𝑖𝑠𝑝1 = 𝑖𝑑𝑖𝑠𝑝 , 𝑖𝑠𝑢𝑝2𝑟𝑒𝑐 = 𝑖𝑠𝑢𝑝 , 𝑎𝑛𝑑 𝑖𝑑𝑖𝑠𝑝2
𝑟𝑒𝑐 = 𝑖𝑑𝑖𝑠𝑝
Hence,
𝑖𝑟𝑒𝑐 − 𝑖𝑟𝑒𝑢 = 0
if
𝑖𝑠𝑢𝑝2𝑟𝑒𝑐 + 𝑖𝑑𝑖𝑠𝑝2
𝑟𝑒𝑐 − (𝑖𝑠𝑢𝑝2𝑟𝑒𝑢 + 𝑖𝑑𝑖𝑠𝑝2
𝑟𝑒𝑢 + 𝑖𝑟𝑒𝑝) = 0
or
𝑖𝑠𝑢𝑝 (1 −5 − 𝑋
5) + 𝑖𝑑𝑖𝑠𝑝 (1 −
5 − 𝑋
5) + 𝑖𝑟𝑒𝑝 = 0
In this equation, all but 𝑋 but are known. Therefore, solver is used to find 𝑋 for each impact
category. The results are:
Table A.5. Amount of time required for reuse to be better than recycle, for each category
Impact category (unit/laptop) 𝑿 (days)
CED (GJ) 103
CEENE (MJex) 74
CIAM (Pts) 100
CML-ADPel (kg Sbeq) 15
CML-ADPff (MJ) 95
CML-TE (kg 1,4-DCB) 28
Rec-EP-RC (USD2013) 151
Rec-MP-GW (kg CO2eq) 78
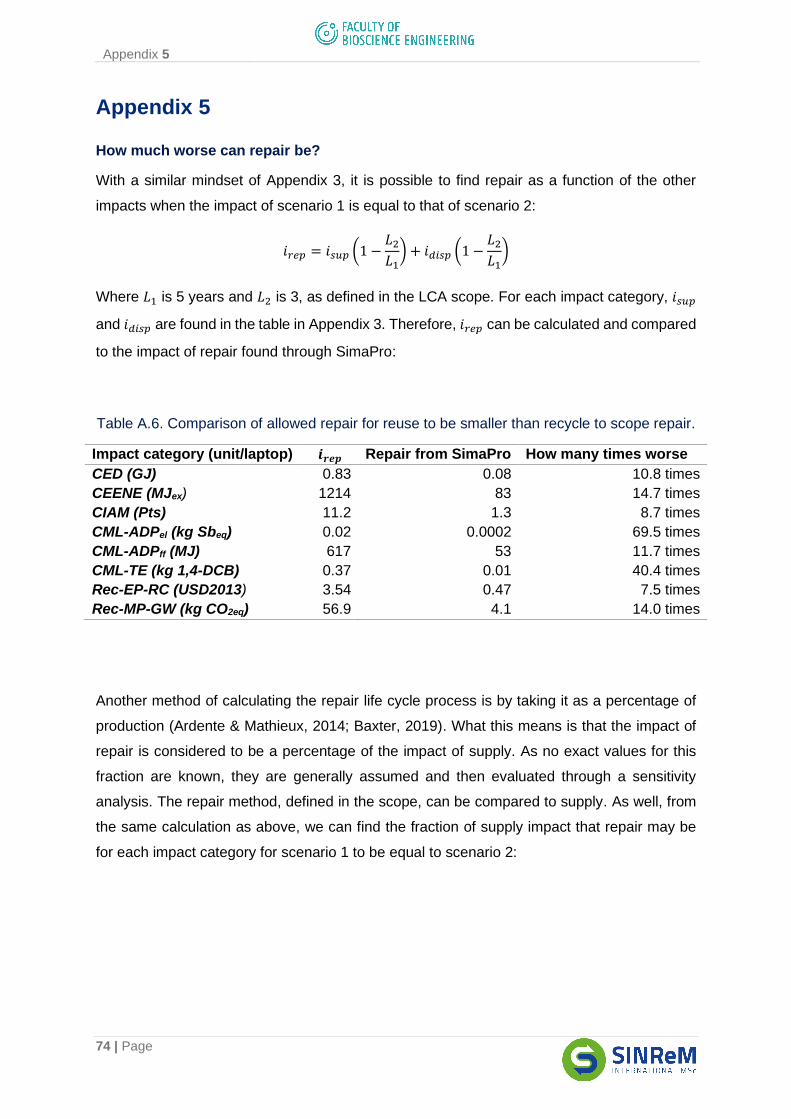
Appendix 5
74 | Page
Appendix 5
How much worse can repair be?
With a similar mindset of Appendix 3, it is possible to find repair as a function of the other
impacts when the impact of scenario 1 is equal to that of scenario 2:
𝑖𝑟𝑒𝑝 = 𝑖𝑠𝑢𝑝 (1 −𝐿2
𝐿1) + 𝑖𝑑𝑖𝑠𝑝 (1 −
𝐿2
𝐿1)
Where 𝐿1 is 5 years and 𝐿2 is 3, as defined in the LCA scope. For each impact category, 𝑖𝑠𝑢𝑝
and 𝑖𝑑𝑖𝑠𝑝 are found in the table in Appendix 3. Therefore, 𝑖𝑟𝑒𝑝 can be calculated and compared
to the impact of repair found through SimaPro:
Table A.6. Comparison of allowed repair for reuse to be smaller than recycle to scope repair.
Impact category (unit/laptop) 𝒊𝒓𝒆𝒑 Repair from SimaPro How many times worse
CED (GJ) 0.83 0.08 10.8 times
CEENE (MJex) 1214 83 14.7 times
CIAM (Pts) 11.2 1.3 8.7 times
CML-ADPel (kg Sbeq) 0.02 0.0002 69.5 times
CML-ADPff (MJ) 617 53 11.7 times
CML-TE (kg 1,4-DCB) 0.37 0.01 40.4 times
Rec-EP-RC (USD2013) 3.54 0.47 7.5 times
Rec-MP-GW (kg CO2eq) 56.9 4.1 14.0 times
Another method of calculating the repair life cycle process is by taking it as a percentage of
production (Ardente & Mathieux, 2014; Baxter, 2019). What this means is that the impact of
repair is considered to be a percentage of the impact of supply. As no exact values for this
fraction are known, they are generally assumed and then evaluated through a sensitivity
analysis. The repair method, defined in the scope, can be compared to supply. As well, from
the same calculation as above, we can find the fraction of supply impact that repair may be
for each impact category for scenario 1 to be equal to scenario 2:
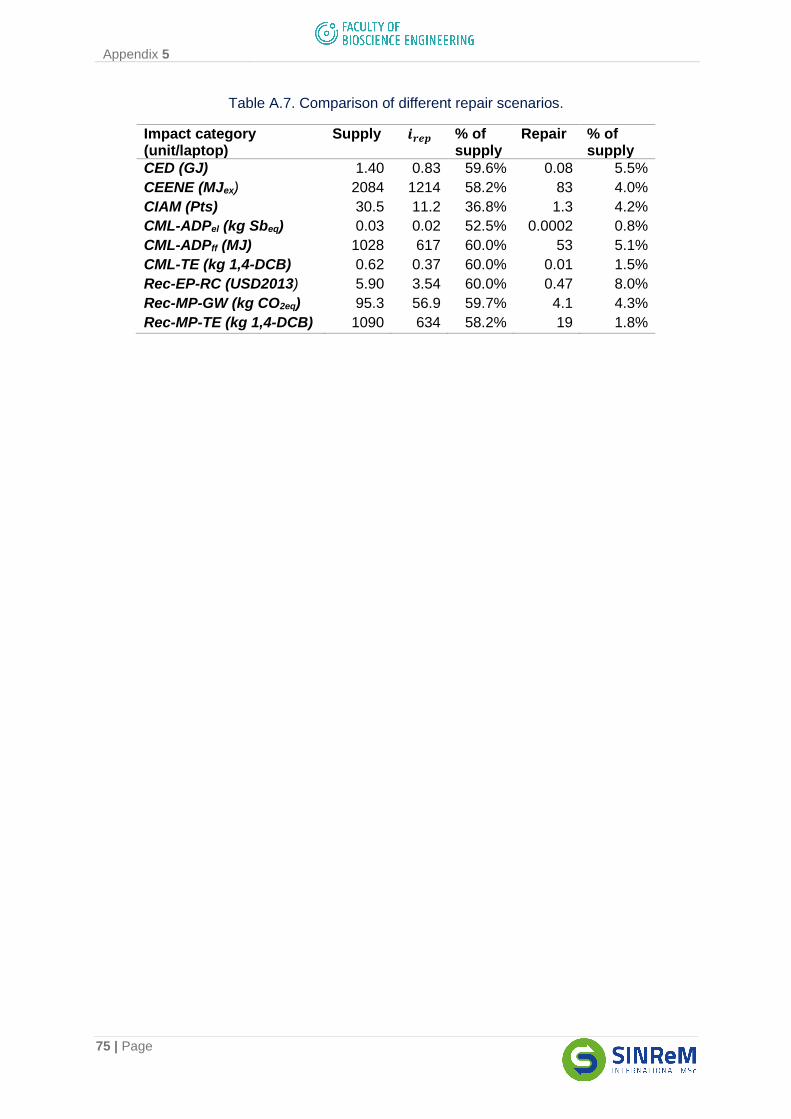
Appendix 5
75 | Page
Table A.7. Comparison of different repair scenarios.
Impact category (unit/laptop)
Supply 𝒊𝒓𝒆𝒑 % of supply
Repair % of supply
CED (GJ) 1.40 0.83 59.6% 0.08 5.5%
CEENE (MJex) 2084 1214 58.2% 83 4.0%
CIAM (Pts) 30.5 11.2 36.8% 1.3 4.2%
CML-ADPel (kg Sbeq) 0.03 0.02 52.5% 0.0002 0.8%
CML-ADPff (MJ) 1028 617 60.0% 53 5.1%
CML-TE (kg 1,4-DCB) 0.62 0.37 60.0% 0.01 1.5%
Rec-EP-RC (USD2013) 5.90 3.54 60.0% 0.47 8.0%
Rec-MP-GW (kg CO2eq) 95.3 56.9 59.7% 4.1 4.3%
Rec-MP-TE (kg 1,4-DCB) 1090 634 58.2% 19 1.8%
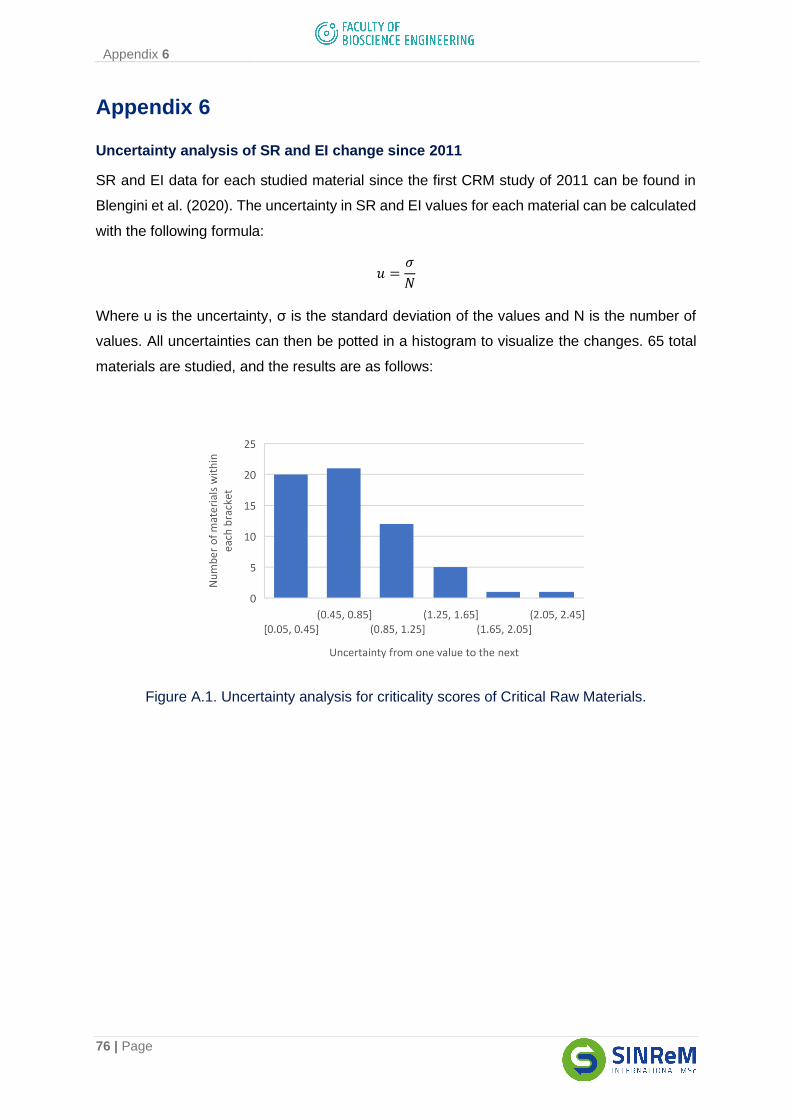
Appendix 6
76 | Page
Appendix 6
Uncertainty analysis of SR and EI change since 2011
SR and EI data for each studied material since the first CRM study of 2011 can be found in
Blengini et al. (2020). The uncertainty in SR and EI values for each material can be calculated
with the following formula:
𝑢 =𝜎
𝑁
Where u is the uncertainty, σ is the standard deviation of the values and N is the number of
values. All uncertainties can then be potted in a histogram to visualize the changes. 65 total
materials are studied, and the results are as follows:
Figure A.1. Uncertainty analysis for criticality scores of Critical Raw Materials.


