Embed Size (px)
Citation preview
WILL PEOPLE BE HEALTHY ENOUGH TO WORK LONGER?
Alicia H. Munnell, Mauricio Soto, and Alex Golub-Sass *
CRR WP 2008-11
Released: August 2008
Draft Submitted: July 2008
Center for Retirement Research at Boston College
Hovey House
140 Commonwealth Avenue
Chestnut Hill, MA 02467
Tel: 617-552-1762 Fax: 617-552-0191
http://www.bc.edu/crr
* Alicia H. Munnell is the Peter F. Drucker Professor of Management Sciences in Boston
College’s Carroll School of Management and Director of the Center for Retirement
Research at Boston College (CRR). Mauricio Soto is a research economist at the CRR,
and Alex Golub-Sass is a research associate at the CRR. The research reported herein
was performed pursuant to a grant from the U.S. Social Security Administration (SSA)
funded as part of the Retirement Research Consortium. The opinions and conclusions
expressed are solely those of the authors and should not be construed as representing the
opinions or policy of SSA, any agency of the Federal Government, or Boston College.
© 2008, by Alicia H. Munnell, Mauricio Soto, and Alex Golub-Sass. All rights reserved.
Short sections of text, not to exceed two paragraphs, may be quoted without explicit
permission provided that full credit, including © notice, is given to the source.
About the Center for Retirement Research The Center for Retirement Research at Boston College, part of a consortium that includes parallel centers at the University of Michigan and the National Bureau of Economic Research, was established in 1998 through a grant from the Social Security Administration. The Center’s mission is to produce first-class research and forge a strong link between the academic community and decision makers in the public and private sectors around an issue of critical importance to the nation’s future. To achieve this mission, the Center sponsors a wide variety of research projects, transmits new findings to a broad audience, trains new scholars, and broadens access to valuable data sources.
Center for Retirement Research at Boston College Hovey House
140 Commonwealth Avenue Chestnut Hill, MA 02467
phone: 617-552-1762 fax: 617-552-0191 e-mail: [email protected]
www.bc.edu/crr
Affiliated Institutions: American Enterprise Institute
The Brookings Institution Center for Strategic and International Studies
Massachusetts Institute of Technology Syracuse University
Urban Institute
Abstract
If Americans continue to retire at age 63, a great many will risk income shortfalls
especially at older ages. Because work directly increases current income, Social Security
benefits, retirement saving, and decreases the length of retirement, a logical solution
would be to increase the age of retirement. But are Americans healthy enough to work
longer? Using the National Health Interview Survey, this paper shows that healthy life
expectancy increased by about three years over 1970-2000 for the average 50-year old
man. This increase is largely the result of men moving up the education ladder, with
minimal increases within educational groups. Moreover, major disparities in healthy life
expectancy remain between those in the bottom and top quartiles of the population. And
these disparities mean that a vulnerable portion of the population – perhaps those who
most need to work longer – might not be able to extend their work lives.
1
Introduction
As recently as the mid-1960s, the median retirement age for men – the age at
which half of all men are no longer in the labor force – was 66. Today, it is 63. But
given the scheduled decline in Social Security replacement rates, increased longevity, and
the relatively low balances in 401(k) accounts, Americans risk serious income shortfalls,
especially at older ages, if they continue to retire at age 63. A rational response is to
move the average retirement age back to 66 or even older. Working longer directly
increases current income; it avoids the actuarial reduction in Social Security benefits; it
allows people to contribute more to their 401(k) plans; and it shortens the period of
retirement. By and large, those who continue to work until their mid-60s or beyond
should have a reasonably comfortable retirement.
A key consideration is whether people will be healthy enough to work longer. At
first blush, the answer seems obvious. Life expectancy has increased since the 1960s and
medical advances have improved outcomes for cardiovascular diseases and other health
problems. Evidence shows that many Americans leave the workforce long before their
health makes retirement necessary.1 On the other hand, two pieces of evidence suggests
that problems may exist. First, disparities in health and mortality outcomes may have
widened, as evidenced by the increasingly strong relationship between socioeconomic
status and health and the enormous variation in mortality rate across the population.
Second, the improvement in health outcomes for the populations in general may have
slowed or even reversed. The two trends suggest that a proportion of the population at
the low end of the socioeconomic ladder may simply be unfit for continued work, even if
appropriate employment opportunities were available.
The paper focuses on the health of older working-age men, those 50-64, and is
structured as follows. Section I summarizes the trends in mortality and healthy life
expectancy for the older male working-age population. As a prelude to estimating
changes for different segments of the population, Section II reviews the relationship
between health and mortality and socioeconomic status. Section III provides estimates of
the trends in health and healthy life expectancy by race and educational attainment and
summarizes the results for quartiles of the population. Section IV looks to the future and
1 See Steuerle, Spiro and Johnson (1999).
2
reviews the evidence suggesting that the improvement in health outcomes for the
population in general may have slowed or even reversed. Second V concludes.
I. Mortality and Health Trends: 1960-2000
Intuitively, people’s health affects their ability and desire to work. Poor health
can make work seem very difficult and unpleasant, leading people to withdraw from the
labor force. Poor health can reduce people’s productivity, leading to lower wages, and
lower wages reduce the incentive to work. Poor health can make people less attractive to
employers and therefore less likely to be hired. In the last 35 years, virtually all studies
show that poor health has a negative effect on the likelihood of being in the labor force,
the expected retirement age, as well as hours worked and wages earned.2 Therefore, the
health of the older working-age population is a key prerequisite to extending the
retirement age.
Survival Expectancies
Death is the end point, so a natural starting place for exploring the ability of older
people to work is life expectancy. An increase in life expectancy raises the possibility of
a longer worklife with the potential of some period of retirement at the end. Thus, it is
the first step for arguing that people are able to work longer.
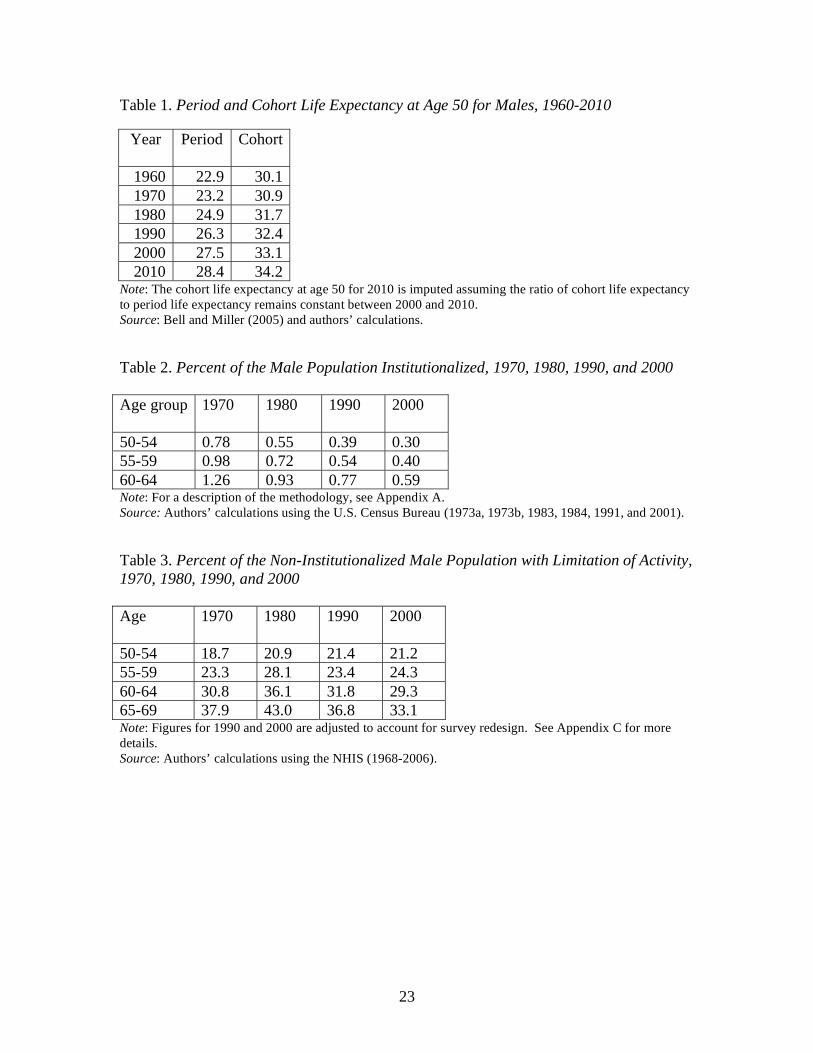
We have chosen life expectancy at age 50 as a proxy for the ability of older
people to work. Table 1 reports both period and cohort life expectancy. A period life
table for 2010 includes the life expectancy for a 50-year-old, born in 1960. In contrast, a
cohort life table for 2010 includes the life expectancy of a man who would be age 50 in
2060. Because of expected improvements in mortality rates over time, cohort life
expectancy is generally higher than period life expectancy. The appropriate life
expectancy table depends on the question being asked. We are concerned whether men
who are 50 today – the later baby boomers – will be able to work longer. Therefore, the
period life table is the more relevant. As shown in Table 1, men at age 50 today can look
forward to about five more years of life than they could have in 1960 when retirement
ages were much higher.
2 For a survey of the literature, see Currie and Madrian (1999) and Deschryvere (2005).
3
Trends in disability-free life expectancy for men 50-64, 1970-2000
Death, however, is not the only relevant end point for how long people can work.
Many non-fatal conditions may make it difficult for people to stay in the labor force.
Research has shown that increases in total expected years of life are not necessarily
accompanied by increases in expected disability-free life.3 According to Fries et al.
(1996), however, medical innovation has reduced the rate of long-term disability caused
by certain chronic conditions. Thus, it is important to examine how disability-free life
has changed for men and women over the last decades. The calculation of disability-free
life requires combining data on the incidence of disability with that on life expectancy.
The following analysis builds on the work of Crimmins, Saito, and Ingegneri (1989 and
1997).
Those with disabilities consist of two groups: the institutionalized population and
community residents with activity limitations. Data for the institutionalized population
come from the U.S. Bureau of the Census. As evident in Table 2, the incidence of
institutionalization has declined over the last three decades. This pattern is similar to the
decline in the nursing home population reported by Taeuber (1993) and Manton, Gu, and
Lamb (2006).
Data for the incidence of disability come from the National Health Interview
Survey (NHIS).4 This survey of about 100,000 people has been conducted annually since
1959 by the U.S. National Center for Health Statistics to monitor the population’s health
and health care utilization. The NHIS asks a series of questions to identify individuals
who have a “limitation of activities.” The survey is administered to at least one adult
member of the household who gives proxy responses for all member of the household
(when possible, all adult members participate in the interview). In 1997, the NHIS
switched from pencil and paper to a computer-assisted personal interviewing system
(CAPI), which relied on a laptop computer. The following discussion focuses on men
aged 50-64.
3 See Crimmins, Saito, and Ingegneri (1997) and Fries (1983).
4 According to Burkhauser et al (2002), the Current Population Survey (CPS) underestimates the magnitude
of work limitation-based disability and the NHIS is a more comprehensive measure.
4
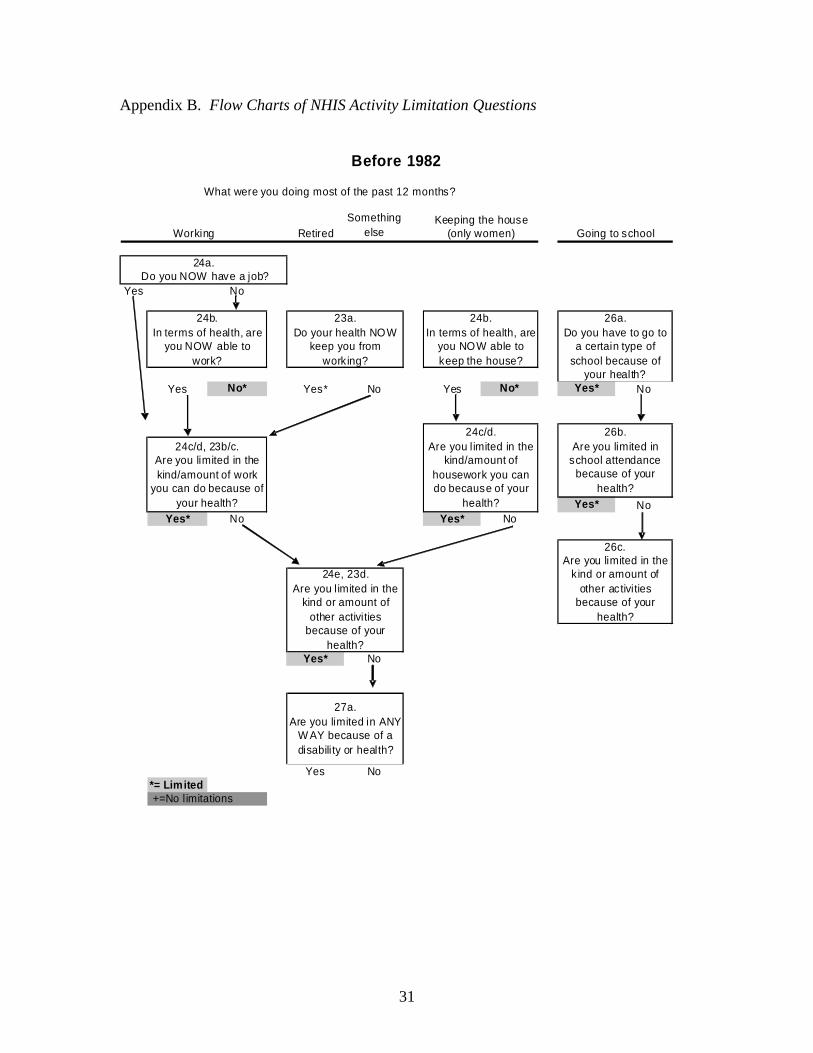
The NHIS experienced two major redesigns over the last 50 years, first in 1982
and then in 1997. Appendix B presents the flow charts of the activity limitation section
for each period. The 1982 redesign left the wording and order of the “activity limitation”
questions virtually unchanged.5 But this redesign changed how individuals were
classified depending on their “major activity.” Originally, people were asked to
categorize themselves according to their usual activity during the last twelve months –
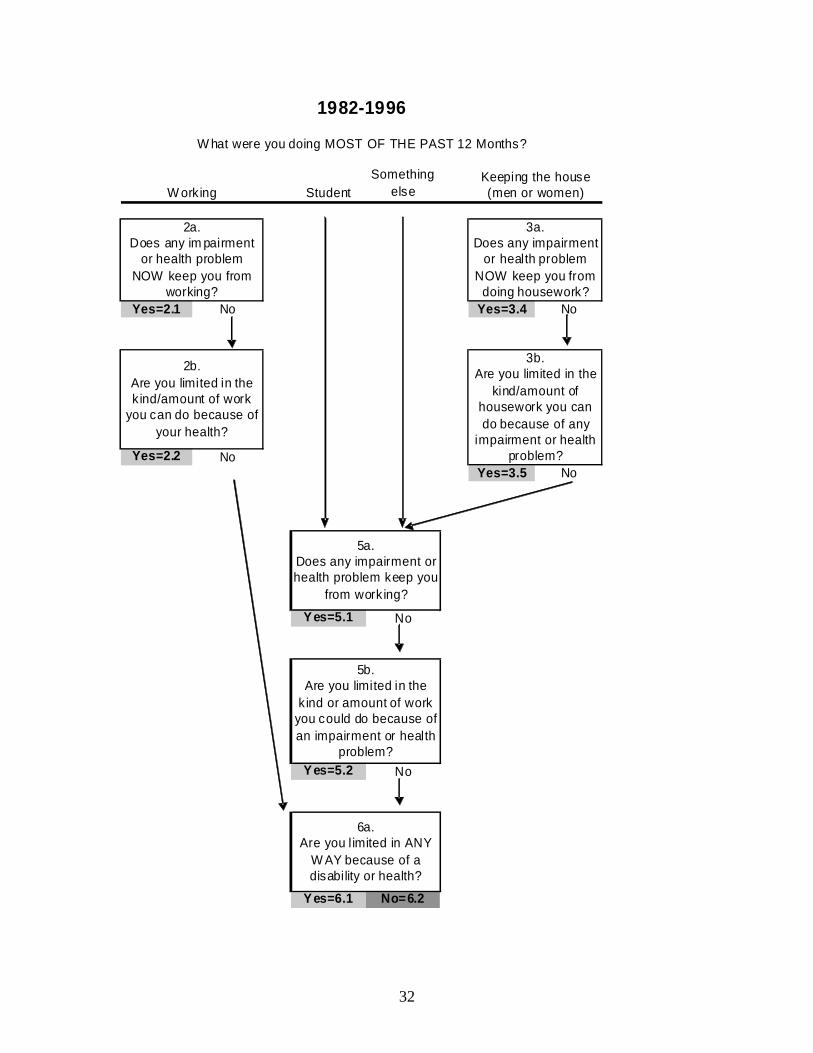
“work,” “keeping the house,” or “something else.”6 Before 1982, only women could
select “keeping the house” as a major activity. After 1982, men as well as women could
select “keeping the house” as a major activity, and individuals who reported this activity
were further asked whether health problems limited their ability to do work “at a job or
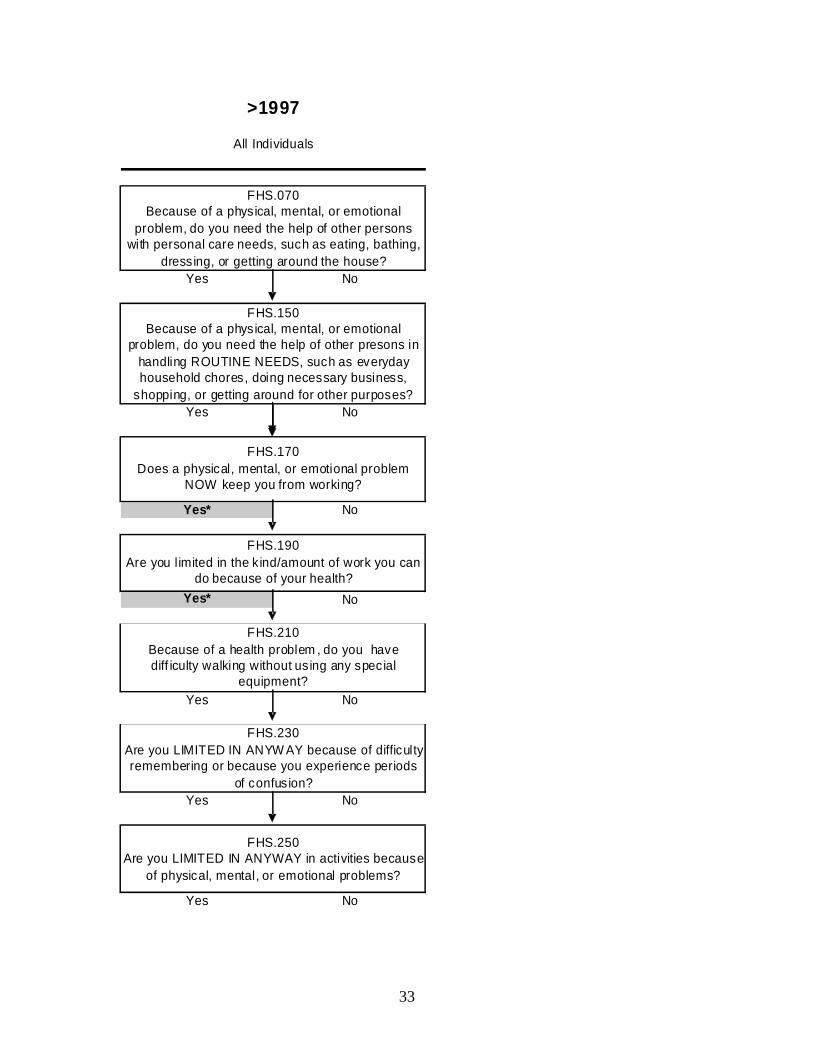
business.”7 Beginning in 1997 the “major” or “usual” activity question was eliminated
and all individuals are asked only about their ability to do work “at a job or business.”
Because this paper focuses on men 50-64, where only a tiny fraction ever reported
“keeping the house” as a major activity, these changes in the survey are not significant.8
The 1997 redesign of the survey affected both the wording and the sequence of
the questions in the “limitations of activity” section. The following boxes show the
changes in the wording of the questions before and after 1997:
Activity Limitation Questions:1982-1996
1. Does any impairment or health problem now keep you from working?
2. Are you limited in the kind/amount of work you can do because of your health?
3. Are you limited in any way because of disability or health?
5 Before 1982, the wording of the questions was “In terms of health, are you able to work (keep the house)
at all?” and “are you limited in the kind/amount of work (housework) you can do because of health?”
Between 1982 and 1996, the wording of the questions changed to “does any impairment or health problem
keeps you from working at a job or business (doing any housework) at all?” and “are you limited in the
kind or amount of work (housework) you can do because of any impairment or health problem?” Before
1996, the questions for the individuals who reported work as a major activity were specific about the
limitation preventing work “now.” 6 People were then asked whether because of health they were able to do their major activity or whether
they were limited in the “kind or amount of the activity.” If they report no limitation in their major activity,
they were asked whether they were limited in any way because of health. 7 Women who reported this activity were asked only whether health problems limited their ability to do
“housework.” 8 Other changes in 1982 affected primarily school age children and older persons. Questions about ability
to attend school were asked for those aged 5-17 instead of 6-16. In addition, the question was changed to
include special schools and special classes. Individuals 71 and over were asked about the ability to perform
“personal care and routine needs” rather than the normal activities of house keeping and working in early
surveys. The only change for non-aged adults was that men could identify housekeeping as their major
activity, which had not been possible previously.
5
Activity Limitation Questions:1997 to the present
1’. Does a physical, mental, or emotional problem now keep you from working?
2’. Are you limited in the kind/amount of work you can do because of your health?
3’. Are you limited in any way because of physical, mental, or emotional problems?
In addition to the change of wording, the sequence changed. Before 1997,
respondents were asked questions (1) and (2), and if the response was negative, then
asked question (3). Beginning in 1997, respondents were asked two questions before
they got to the activity limitation questions: “Because of a physical, mental, or emotional
problem, do you need the help of other persons with personal care needs …?”and
“Because of a physical, mental, or emotional problem, do you need the help of other
persons in handling routine needs …?” Then they were asked questions (1’) and (2’)
described above. After questions (1’) and (2’), they were asked an additional two
questions: “Because of a health problem, do you have difficulty walking...?” and “Are
you limited in any way because if difficulty remembering or … confusion?” Finally,
they were asked question (3’).
Respondents are classified as limited if they answer “yes” to any one of the three
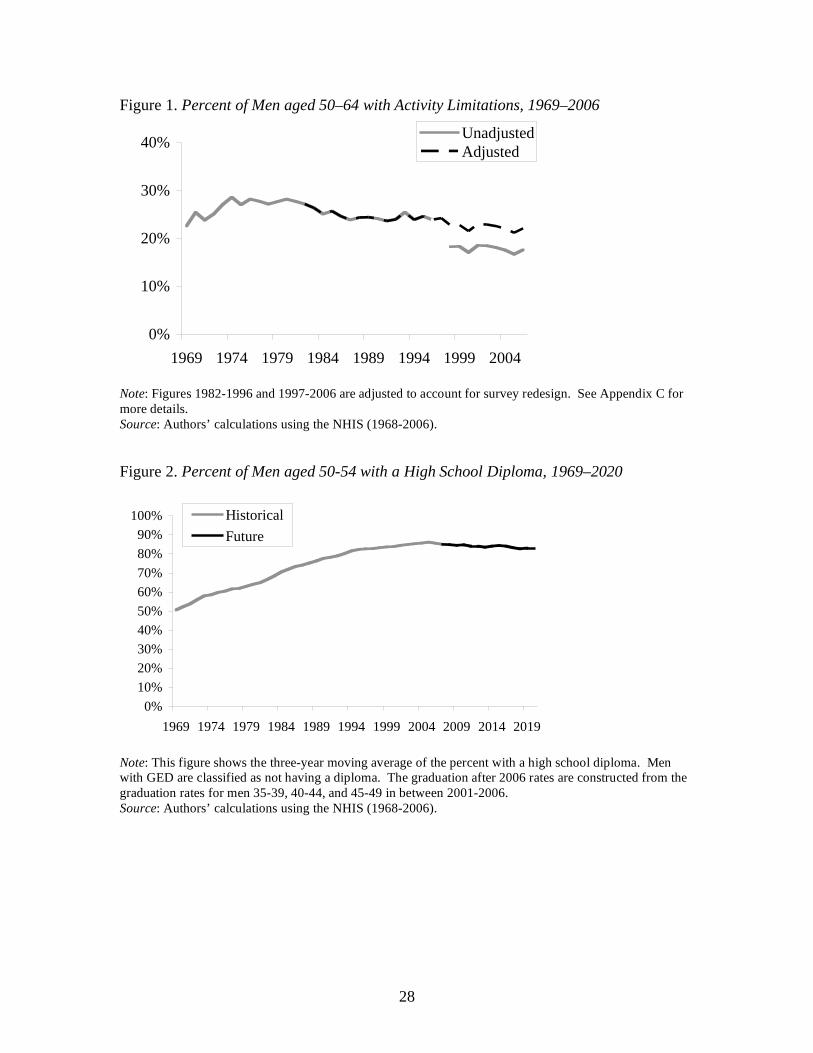
core questions.9 The changes in questions and sequence in 1997 appear to have produced
a discontinuity in the activity limitation series (see Figure 1). The sponsors of the NHIS
at the National Center for Health Statistics have not been able to explain the decrease in
activity limitation beginning in 1997.10
Several hypotheses are possible. One possibility
is that additional questions before the core questions increased the respondents’ burden
and made their responses less accurate.11
Another is that respondents’ conclusion that
they did not need help with the relatively minimal tasks of personal care and routine
needs left them with a positive feeling about their ability to work. Another is that the
replacement of “impairment and health problem” by “physical, mental, or emotional
problem” altered responses. That is, those with a bad back might have responded
9 This definition follows Crimmins, Saito, and Ingegneri (1997). Excluding the third core question –
“limited in any way” does not change the results because most of the individuals identified as limited
respond positively to 1’ or 2’. 10
Email correspondence with Susan S. Jack at the Division of Health Interview Statistics of the National
Center for Health Statistics. 11
This hypothesis was suggested by Susan S. Jack at the Division of Health Interview Statistics of the
National Center for Health Statistics.
6
affirmatively before the change but might be reluctant to give an affirmative response
that suggests that they might have a mental or emotional problem. On the other hand,
respondents who did have an emotional or mental problem might be more willing to
acknowledge a disability once this type of ailment was identified explicitly.
One indication that the historical incidence of activity limitation is more accurate
than the series that began in 1997 is that a comprehensive measure of limitations changes
very little before and after the 1997 revision. If “functional limitations,” which are asked
about elsewhere in the survey, are added to “activity limitations,” the percent of the male
population aged 50-64 with a problem is 25.7 percent in 1995 and 24.4 in 1997 after the
redesign.12
Thus, it seems reasonable to adjust the data beginning in 1997 following
Crimmins, Saito, and Ingegneri (1997) to make estimates of activity limitation for 1999,
2000, and 2001 comparable to those in earlier years. The results are shown in Figure 1
and Table 3.13
The final step is to estimate years of disability-free life. This involves the
following procedure. The period life tables are used to determine the number of years
individuals age 50 are expected to be alive in five age ranges: 50-54, 55-59, 60-64, 65-
69, and 70 and older.14
The sum of these values is the life expectancy at age 50. The
values for each age category are multiplied by the percent non-institutionalized from
Table 2. The resulting values are the years individuals age 50 are expected to be alive in
the community in each of the age ranges. These figures are multiplied by one minus the
disability rates in Table 3. The result is the number years individuals age 50 are expected
12
The functional limitation questions introduced in 1997 are comparable to those from the Disability
Supplement of the NHIS administered in 1994 and 1995. In these supplements, all individuals were first
asked if they had a particular functional limitation and then asked to what degree they were limited. In
1997, for each functional limitation, the individual was simply asked to what degree they were limited. We
based our functional limitation measure on only those who answered either “A lot of difficulty” or
“Completely unable” in 1995 and either “Very Difficult” or “Can’t do at all” in 1997. We limited our
analysis to the functional limitations that appeared both in the Disability Supplements and in the 1997
NHIS. See Appendix D for the list of functional limitations used in the calculation. 13
This paper connects the activity limitation questions before and after 1997. It might not be possible,
however, to connect other questions related to disability. For example, questions about the incidence of
ADLs or IADLs were originally asked only to individuals who reported an activity limitation or were over
age 60. Starting in 1997, these questions were asked to all respondents. See Lakdawalla, Bhattacharya and
Goldman (2004). 14
After the 1982 redesign, individuals 71 and over were asked about the ability to perform “personal care
and routine needs” even if they reported no activity limitation. Thus, the data for the 70+ group are
adjusted to account for the survey redesign. The results, however, are roughly equivalent when the analysis
is restricted to the age 50-70 group.
7
to be alive in the community with no disabilities in each age range. The sum of these
values is the years of disability-free life expectancy at age 50.
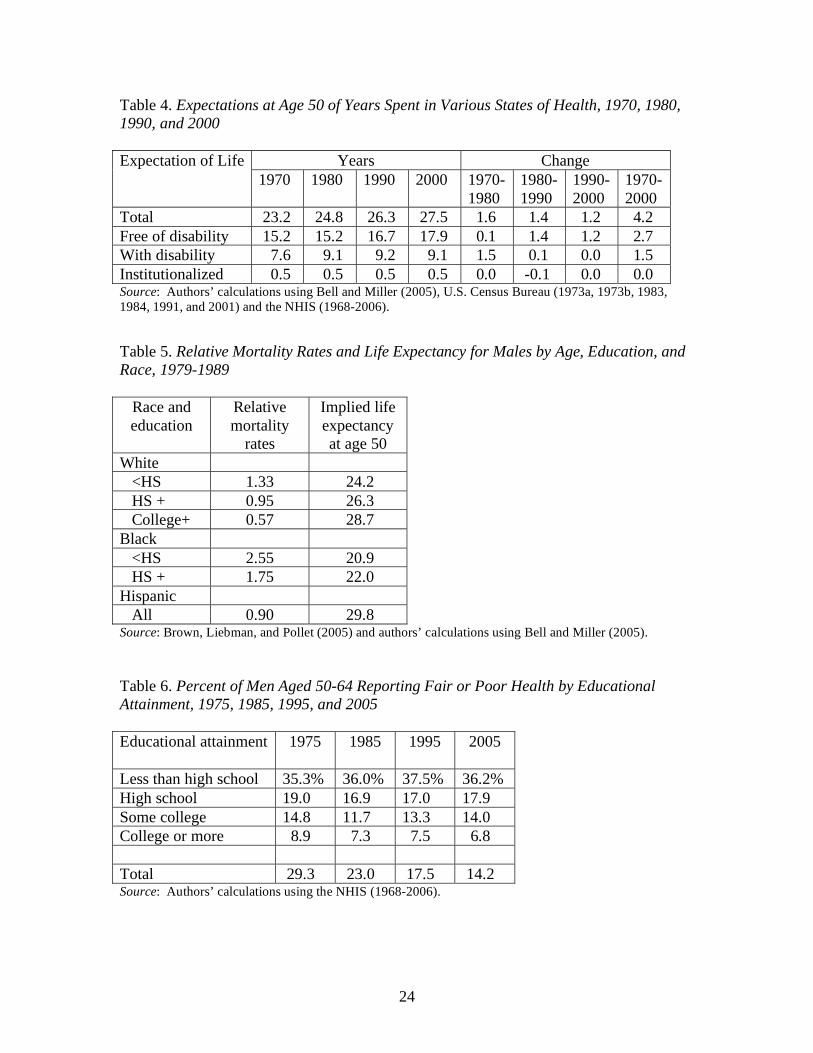
The results for total life expectancy, life expectancy free of disability, and
disabled life in the community and in institutions at age 50 for four time periods are
shown in Table 4. The net result looking over 1970-2000 is that life expectancy at age 50
increased by about four years for men, nearly three of which are disability-free. The
pattern was one of virtually no gains in disability-free years in the 1970s, and roughly
equivalent gains in the 1980s and 1990s. The overall conclusion is that men, on average,
can expect more disability free years than they could in the 1960s when the average
retirement age was 66. But averages may not tell the whole story because health status
and life expectancy both vary by socioeconomic status. Thus, while the population as a
whole has more years of disability-free life expectancy than in 1970, a portion of the
population may actually be worse off. The next section summarizes the existing evidence
on the link between health/mortality and socioeconomic status.
II. The Relationship between Health/Mortality and Socioeconomic Status
Numerous studies have documented a strong link between health and mortality
and socioeconomic status. Education, occupation, and income are the most widely used
measures. Education has become the most popular measure of socioeconomic position
for two reasons. First, education level can be determined for all individuals, whereas not
everyone, for example retired persons and homemakers, has an income or occupation.
Second, education avoids the possibility of reverse causation – for example, poor health
may lead to low income. Most people complete their education by their early adult years,
so educational attainment is unlikely to be affected by the health impairments that occur
later in life. This section summarizes the impact of education and other socioeconomic
variables on health and mortality and how differences in health and mortality between
high status and low status groups have changed over time.
8
Evidence on socioeconomic status and health
More educated people are likely to have lower morbidity from the most common
acute and chronic diseases. Cutler and Lleras-Muney (2006), using the NHIS and
extensive controls, report a significant negative relationship between years of school and
heart condition, hypertension, diabetes, emphysema, diabetes and a host of other
diseases.15
They also show that better educated people have fewer functional limitations
and spend fewer days sick in bed or not at work. The effects of education on health are
generally large. For example, four more years of school reduce the risk of diabetes by
1.3 percentage points, compared to a base of 7 percent.
About one third of the relationship between health and education can be explained
by differences in behaviors.16
Those with more years of schooling are less likely to
smoke, to drink excessively, to be overweight or obese, or to use illegal drugs. They are
also more likely to exercise, to get preventative care (vaccines, mammograms, pap
smears and colonoscopies), and to use seat belts.17
But a substantial portion of the
gradient between health and education remains unexplained. A relationship between
health and education also shows up across countries and within other countries, as well.
Since we are interested in older workers, it is important to note that the effect of
education on health diminishes with age. The behavior differentials tend to fall
continuously with age; others dimensions, such as functional limitations and depression,
rise until middle age and then start to fall. Other studies have also found that health
differences associated with income also decline after middle age (Smith 2004).
Finally, some evidence suggests that health gradients have increased over time.
Goesling (2005) reports that the effect of education on self-reported health has risen since
1982. Over the same period, Freedman et al. (2004) find that disability rates have fallen
much faster for the educated than the uneducated. And the gradients in some health-
related behaviors have also increased. For example, the differences in smoking by
15
The exceptions are cancer, chicken pox, and hay fever. 16
Cutler and Lleras-Muney (2006) find that the relationship between education and mortality is reduced by
about 30 percent when controlling for behavior. A famous study of British civil servants concluded that
differences in smoking, drinking and other health behavior explained about one-third of the differences in
mortality between those of higher rank and those of lower rank (Marmot and Smith 1997). 17
Waiddmann, Bound, and Schoenbaum (1995) suggests that socioeconomic factors influencing the
response to health problems, in addition to earlier detection of disease are responsible for the improved
health experienced by older Americans between the 1970s and 1980s.
9
education were small prior to the 1964 Surgeon General Report, but are very large today
(Pamuk et al. 1998). In short, now that the huge disparities between rich and poor in
terms of exposure to infectious diseases and even in terms of food and shelter have been
eliminated, the impact of education on health has become increasingly important.18
Evidence on socioeconomic status and mortality
Numerous studies have examined the relationship between socioeconomic status
and mortality. They consistently show that people with lower status have lower life
expectancy than those with high status.19
Using data from the National Longitudinal Mortality Study (NLMS), Brown,
Liebman and Poller (2005) estimate mortality rates by age, education, and race.20
As
shown in Table 5, where the subgroup mortality rates are reported relative to the
aggregate mortality rate for males, the disparities are stunning. Among whites, those
with less than high school educations have mortality rates more than twice as high as
those with a college degree. Blacks with more than a high school degree have mortality
rates in excess of whites who have not graduated from high school.
Not only are the mortality differentials enormous, but the gap between the top and
the bottom has changed over time. While a series of studies suggest that mortality
differences narrowed between 1900 and 1940,21
the consensus appears to be that since the
18
Insight from correspondence with Dora Costa. 19
Kitagawa and Hauser (1973) match a sample of death certificates for persons age 25 and older who had
died from May through August of 1960 with persons identified in the 1960 Census. They find that
mortality varied inversely with education and other measures of socioeconomic status. Winkleby et al.
(1992) explore the contribution of income, education, and occupation to a set of cardiovascular disease
including smoking, high blood pressure, and high cholesterol. They find that the association between
socioeconomic measures and risk factors was strongest and most consistent for education. Elo and Preston
(1996) use the National Longitudinal Mortality Study and show an inverse relationship between mortality
and both education and income, as well as correlations with race, urban/rural residence and other factors.
Cutler and Lleras-Muney (2006), using the NHIS, show that years of education had a significant negative
effect on the probability of dying within five years, even after controlling for race, gender, family income,
family size, major activity, marital status, and health insurance coverage. Most recently, Murray et al.
(2006) examines mortality between eight cross sections of the American population and finds large
disparities across the socioeconomic sub-groups. See also Christenson and Johnson (1995), Deaton and
Paxton (2001), and Rogers, Hummer, and Nam (2000). 20
The NMLS was created by matching individuals who were in the current population survey between
1979 and 1985 to death records from the national death index. Since the match occurred in 1989 and the
earliest data are from 1979, each person was in the sample for a maximum of ten years. 21
Antonovsky (1967) concluded from an extensive review of the literature that the differential between the
lowest and highest economic class fell from two to one in the late 1800s to about 1.3 to one by the 1940s.
10
1960s, mortality differentials have widened both in the United States and in other
countries.22
A recent study shows that if the differentials in life expectancies observed over
the last 30 years of the 20th century continue for the first 30 years of the 21
st century, the
gap in life expectancy between low and high status men will be significant (Waldron
2007). Specifically, males born in 1941 who survive to age 60 and are in the top half of
the earnings distribution would be expected to live nearly 6 years longer than their
counterparts in the bottom half.23
In contrast, for males born in 1912, those in the top
half would be expected to live only about one year more than those in the bottom.
In short, life expectancy is related to socioeconomic status and the discrepancy in
mortality rates between high and low status appears to have increased since the 1960s. It
appears that when medical breakthroughs occur, high status people benefit most from the
innovation (Preston 1996) and when harmful behaviors, such as smoking, are identified
high status groups respond the most to the new information (Pampel 2002).
Possible reasons for the link between education and health
Researchers have offered a host of reasons why education affects health, and they
are summarized in Cutler and Lleras-Muney (2006). The most obvious is that education
produces income and access to health care. But this cannot be the whole story because
even when controlling for income and health insurance education remains important.
Education provides access to “good jobs” with safer work environments. Controlling for
Kitagawa and Hauser (1973) in their Chicago area study that differences under age 65 narrowed from 1930
to 1940 and then widened to 1960. A study of class inequality in mortality among males in England and
Wales concluded that it declined in the 1920s but then began increasing again during the 1950s and 1960s
(Pamuk 1985). 22
Feldman et al (1989), using the first NHANES and the Epidemiologic Follow-up Study (NHEFS), found
that while mortality differences by education were modest in 1960, they had widened substantially by the
1971-1984 period. These differences remained even after adjusting for smoking, high blood pressure, and
high cholesterol, and obesity. The explanation appears to have been a rapid decline in the probability of
death – particularly from heart disease – for highly educated individuals. The same pattern of steeper
declines in mortality rates for those with more education was also reported among white men aged 25-64
by Pappas et al. (1993), using the National Longitudinal Mortality Survey. Preston and Elo (1995) also
found that mortality differentials by education widened for white men from 1960 to 1979. See Waldron
(2007) for a summary of international results. 23
Earnings were measured between ages 45 and 55 for those who had Social Security covered earnings.
The sample is probably healthier than the population as a whole since it is limited to those men with
positive earnings.
11
occupation, however, has little effect on the relationship between health and education.
Education may also affect health by improving critical thinking and access to
information. Information alone, however, cannot be the explanation; today everyone
knows that smoking is bad for one’s health but those with less education continue to
smoke. More educated people are more likely to trust science and to follow what can be
complicated regimens and better manage their diseases.24
The differential use of health
knowledge and technology is almost certainly an important factor.25
Education could alter preferences by making people more risk averse, by
improving their understanding of how current actions affect future events, and by
reducing their discount rate. But the fact health behaviors are not correlated with one
another across people suggests that these factors are not the drivers in the relationship of
education to health (Cutler and Glaeser 2005). Education also is likely to increase a
person’s rank in society, which gives them more control over their lives and thereby
reduces stress. Finally, education can provide greater financial, physical, and emotional
support systems that are both desirable in their own right but also encourage good
behavior and discourage bad. Researchers have not settled on which of these plausible
explanations are the most important.
What is important for this paper is that health and mortality vary dramatically by
education and that these gradients have increased over time. Thus, it is not enough to
assert that because life expectancy and even years of healthy life have increased on
average since the 1960s that everyone can work at 1960s levels. The following section
investigates long-term trends in health and healthy life expectancy by race and education.
III. Trends in Socioeconomic Status and Health
The NHIS is a valuable data set for looking at the relationship between health and
socioeconomic status over a long period of time. It provides data on the straightforward
response to how people rate their own health and to the more complicated set of
questions that lay behind the calculation of disability-free years remaining. This section
reports on both these measures.
24
Goldman and Smith (2002) found that in a randomized trial where one group of diabetics was placed in a
group with enforced treatment, the biggest beneficiaries were those with the least education. 25
See discussion in Cutler, Deaton and Lleras-Muney (2006).
12
Those reporting health as fair or poor
One direct way to assess disability over time is how respondents rate their health
– excellent, very good, good, fair, or poor.26
Idler and Kasl (1994) report that self-
reported health reports predict mortality more accurately than indices based on the
presence of health problems, physical disabilities, and biological or life-style risk factors.
Table 6 tabulates those responses by educational attainment over the period 1975 -2005.27
Two salient points emerge from this table. First, those with a high school education are
more than five times more likely today to classify their health as fair to poor than those
with a college education. Second, those with less than a college education have seen
almost no improvement in their health over the last 30 years. The overall percentage
reporting fair or poor health has declined over the last 30 years because educational
attainment has increased. Figures from the NHIS show that the percentage of those 50-
64 with less than high school has declined from 45 percent of the population in 1975 to
16 percent in 2005; whereas those with college or more have increased from 13 percent
in 1975 to 32 percent today.
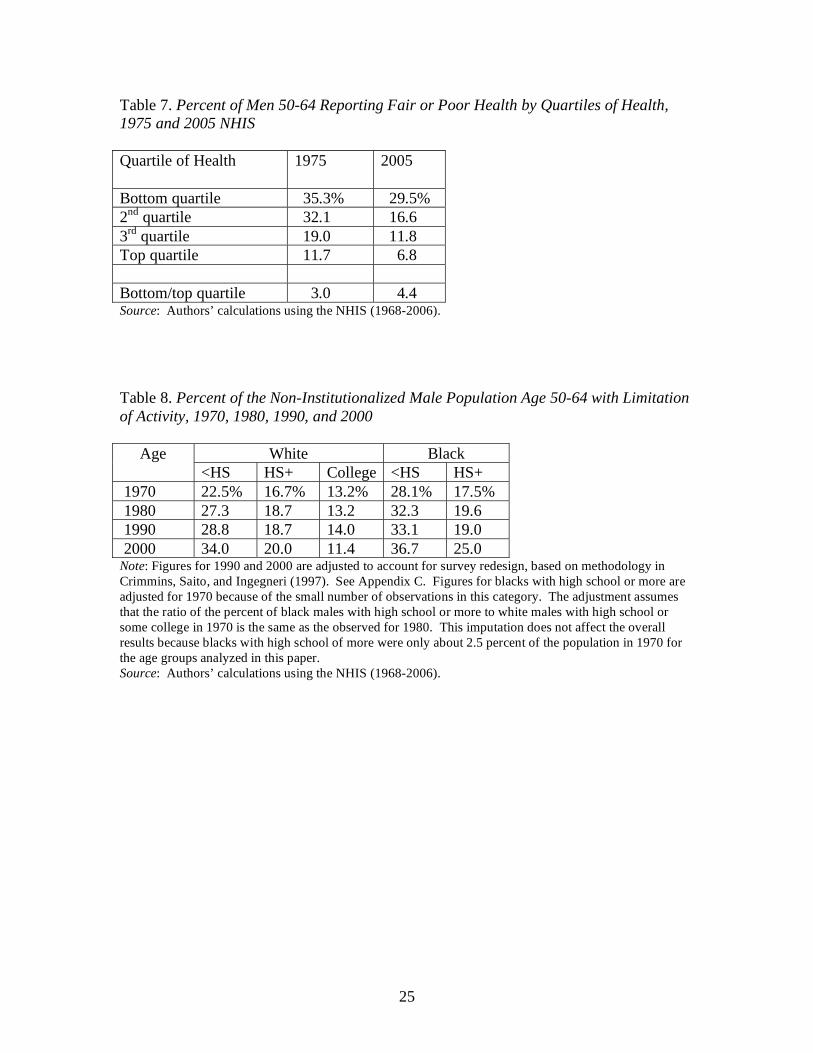
It is possible to combine at each point in time the information on the distribution
of the population by educational attainment with the data on the percent of those
classifying their health as fair to poor to estimate averages for each quartile of the health
distribution. The results of this exercise are shown in Table 7. At each quartile, the
percent reporting their health as fair to poor has declined over time. But decline for the
bottom quartile has been much less than the top quartiles. Thus, it is not surprising that
the difference between the bottom and top quartiles has increased over time. In 1975,
26
Prior to 1982, there were 4 possible responses to the self-reported health status: excellent, good, fair, and
poor. Beginning in 1982, however, respondents were also allowed to answer “very good”. We assume that
the percent reporting “fair” or “poor” health is unaffected by the inclusion of the new category. In fact, the
percent of men 50-64 who report “fair” or “poor” health goes from 23.7 in 1981 to 23.2 in 1982. 27
Beginning in 1997, the NHIS includes data on both number of years of education and credentials. This
raises the question of how to classify individuals who receive a GED. The analysis presented above
includes those with a GED in the ‘less than high school” category for two reasons. First, our sense is that
someone who had completed only ten years of school but who had earned a GED would probably have
reported ten years of education in the earlier surveys. Thus, ignoring the GED would make the data more
consistent over time. Second, recent work in the education area suggests that most participants do not
benefit from the GED program, and that those with a GED perform at the same level as dropouts in the
labor market. .See Heckman and LaFountaine (2008 and forthcoming).
13
three times more respondents in the bottom quartile reported having poor or fair health
than in the top quartile; by 2005, this ratio had increased to 4.4.
Health life expectancy by race and education
The following analysis repeats the process described in the first section to
estimate disability-free life expectancy, but looks at trends by race and education. The
first step involves estimating life tables for each education and race group. The
calculations use Brown et al. (2002) relative mortality tables as a starting point. These
tables present the ratios of the mortality of each education-race group relative to the
general population mortality for 1990.28
But the literature and the data on self-reported
health measures indicate that the dispersion of mortality by education has changed over
time.29
Therefore, the relative mortality tables for 1990 are adjusted using the changes in
the 10-year death rates by education and race from the decennial censuses.30
The result is
a set of relative mortality ratios for 1970, 1980, 1990, and 2000 for each education-race
group. These ratios are applied to the period life tables from Bell and Miller (2005) to
obtain life tables by education and race group.
The second step is to determine the percent of each subgroup that is
institutionalized. Because the institutionalized population is such a small percent age of
the total, we assume that the proportion for each age group from Table 2 applies to each
age-race-education subgroup.
28
These tables were estimated from the National Longitudinal Mortality Survey, which matched the
Current Population Survey 1979-1985 to death records from the 1989 National Death Index. 29
See Crimmins and Saito (2001). 30
We calculated the 10-year death rates for men 50 and over from the IPUMS-Census data for each four
education groups (less than college and college or more) and estimate the ratio of these death rates to the
death rate of the general population. The ratio of the 10-year death rate to the general population goes from
1.02 in 1960 to 1.06 in 1990 and to 1.09 in 2000 for those with less than high school and from 0.71 in 1960
to 0.67 in 1990 and to 0.64 in 2000 for those with college or more. We apply the changes in these ratios
over time to the 1990 relative mortality tables. For example, in 1990, the mortality rate for a white male
with less than high school at age 50 is 1.33 times the mortality of the general population (Brown et al.
2002). The adjustment means that this ratio decreases to 1.27 (1.33*1.02/1.06) in 1960 and increases to
1.36 (1.33*1.09/1.06) in 2000. We used the Census calculations as a conservative measure of the growing
disparities in mortality. An alternative specification used the data on self-reported health instead of the 10-
year death rates from the Census generates qualitatively equivalent results, although the implied speed of
growth of the disparities in health across education groups is much larger.
14
The third step involves determining for each age-race-education group, the
percent of the non-institutional population with a limitation in activity. The percentages
are shown in Table 8 for the age group 50-54.
The final step is to estimate years of disability-free life for each group. As before,
the period life tables are used to estimate the number of years individuals age 50 in each
race-education group are expected to be alive in five age ranges: 50-54, 55-59, 60-64,
65-69, and 70 and older. The sum of these values is the life expectancy at age 50. The
values for each age category are multiplied by the percent non-institutionalized from
Table 2. The resulting values are the years individuals age 50 are expected to be alive in
the community in each of the age ranges and race-education groups. These figures are
multiplied by the one minus the disability rates for each race-education-age category (See
Table 8). The result is the number years individuals age 50 are expected to be alive in the
community with no disabilities in each age range for each race-education group. The
sum of these values is the years of disability-free life expectancy at age 50. The results
are shown in Table 9.
Of course, educational attainment has increased over the last 30 years, so
information by sub-group does not give a comprehensive picture of what has happened to
healthy life expectancy for different quartiles of the population. It is possible to combine
at each point in time the information on the distribution of the population by educational
attainment and race with the data on healthy life expectancy to estimate average healthy
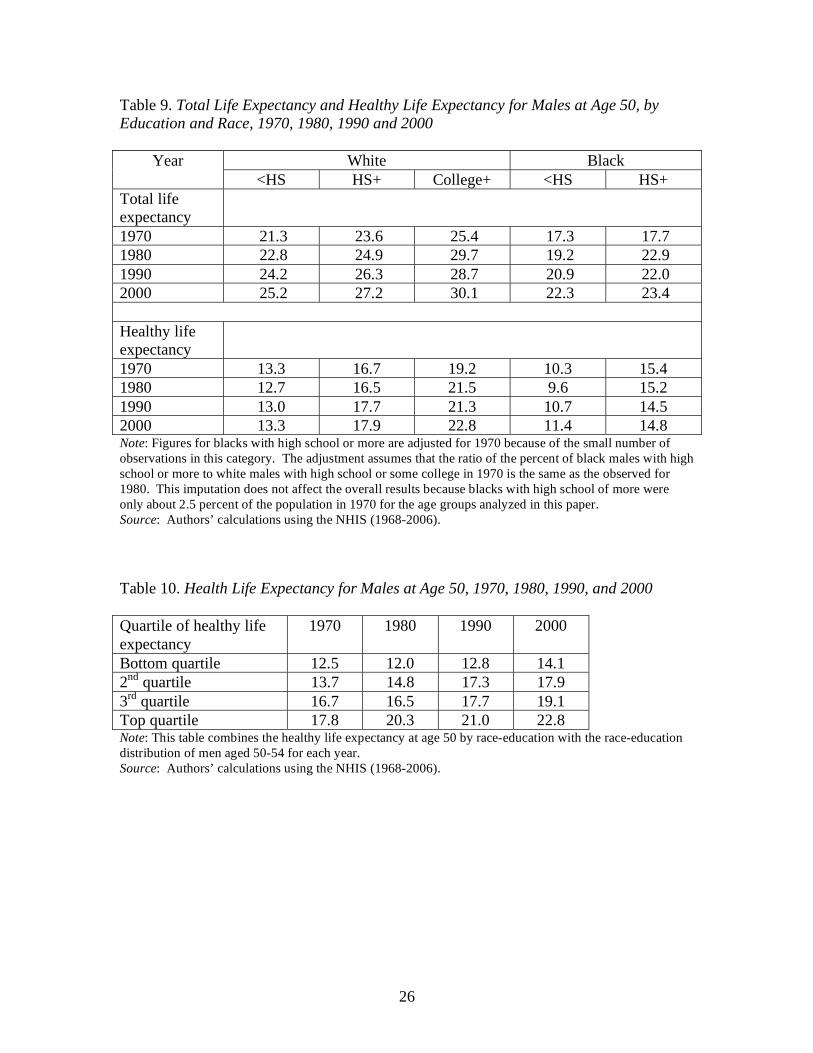
life expectancy for each quartile of the population. These results are shown in Table 10.
Two important points emerge from this analysis. First, relatively little
improvement has occurred in healthy life expectancy within individual race and
educational groups; most of the overall improvement has occurred because people have
moved up in terms of educational attainment. Second, enormous disparities exist in
healthy life expectancy between those of the bottom and the top of quartiles of the
population. Thus, plans to extend the retirement age must accommodate those with very
different abilities to continue working.
15
IV. A Look to the Future
An important question is how healthy life expectancy will change over time. The
outcome depends on two factors – the general health of the population and changing
patterns of educational attainment. Recent developments suggest some concern on both
fronts.
Recent health trends
A number of recent studies suggest that continued improvement in the health of
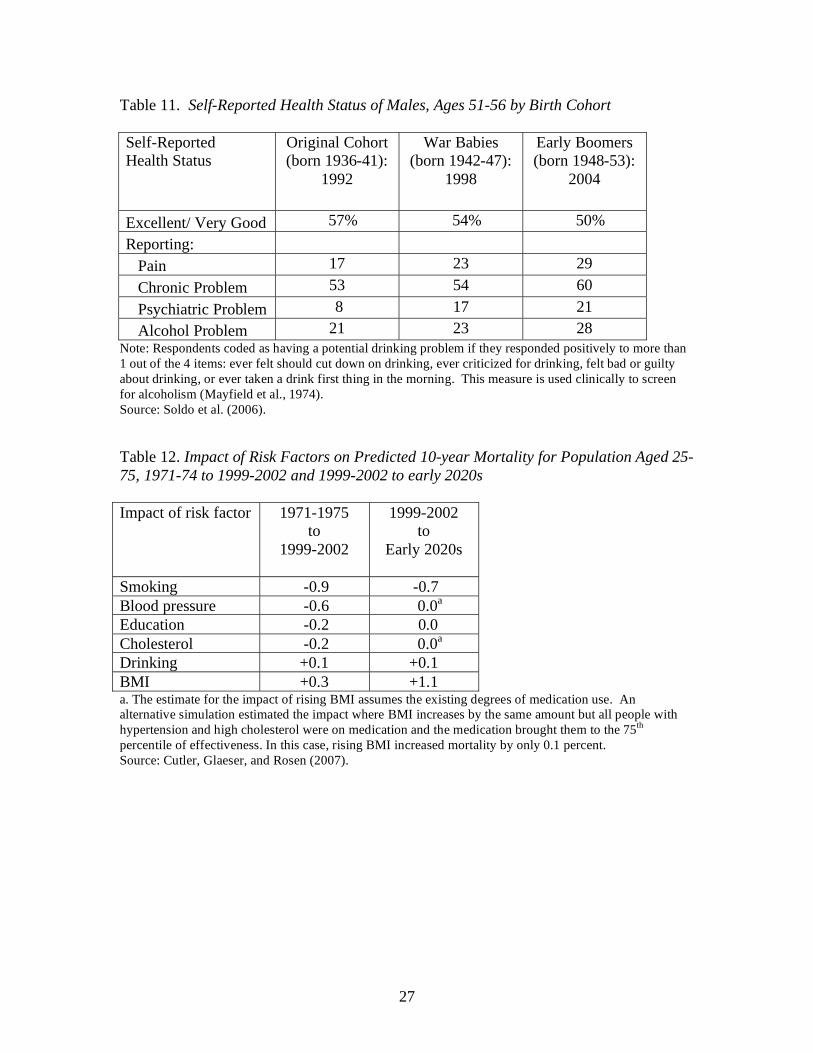
the older working-age population may not continue. Soldo et al. (2006), for example,
report data from the Health and Retirement Study (HRS) on the health status of those age
51-56 from three different cohorts: the original HRS cohort born 1936-41; the so-called
War Babies born 1942-47; and the Early Baby Boomers born 1948-53. Despite
enormous advances in diagnosis and treatment, Early Baby Boomers and War Babies are
much less likely to assess their overall health as “excellent or very good.” These cohorts
also suffer more than the original HRS sample from pain, chronic diseases, psychiatric
problems, and alcohol issues. And the deterioration appears to be increasing with each
cohort (see Table 11).31
In addition, the reductions in risk factors that have contributed to the decline in
mortality (and presumably improved health) over the last 30 years may well be offset by
the increase in obesity going forward. Cutler, Glaeser, and Rosen (2007) estimate that
for the population age-adjusted probability of dying in ten years declined from 9.8
percent to 8.4 percent between the 1970s and the 2000s.32
The largest contributors to this
reduction were the decline in smoking and better control of blood pressure. But the
31
Another suggestion that middle-aged people in the United States are facing serious health problems
comes from a study that compares the self-reported rates of several chronic diseases related to diabetes and
heart disease, adjusted for age and health behavior risk factors, of non-Hispanic white individuals 55-64 in
the United States and the United Kingdom (Banks et al., 2006). The results showed that the U.S.
population in late middle age is less healthy than the equivalent U.K. population for diabetes, hypertension,
heart disease, myocardial infarction, stroke, lung disease, and cancer. These results hold even controlling
for behavioral risk, including smoking, overweight, obesity, and alcohol drinking, which explain very little
of these health differences. These differences are not due to biases in self-reporting disease because
biological markers of disease exhibit exactly the same patterns. And they are not solely driven by the
bottom of the socioeconomic distribution; in many diseases, the top of the distribution is less healthy in the
United States as well. 32
Cutler, Glaeser, and Rosen (2007) use the 1971-75 and 1999-2002 National Health and Nutrition
Examination Survey (NHANES).
16
authors project that, by the early 2020s, rising Body Mass Index (BMI) would more than
offset any continued reduction in smoking (see Table 12). With two-thirds of the
population overweight or obese, the authors suggest caution about expecting continued
improvement in health.33
It is not clear whether these studies reflect a real deterioration in health or simply
the fact that people are becoming more sensitized to even minor health problems as they
are barraged by ads for prescription medications and as standards of good health increase.
These new patterns could also reflect the “failure of success.”34
That is, technological
advances in medicine have postponed death for frail individuals, lowering the proportion
of deceased people in a cohort but raising the proportion of disabled. In this case,
increased disability could be consistent with overall improvements in health and welfare.
Trends in educational attainment
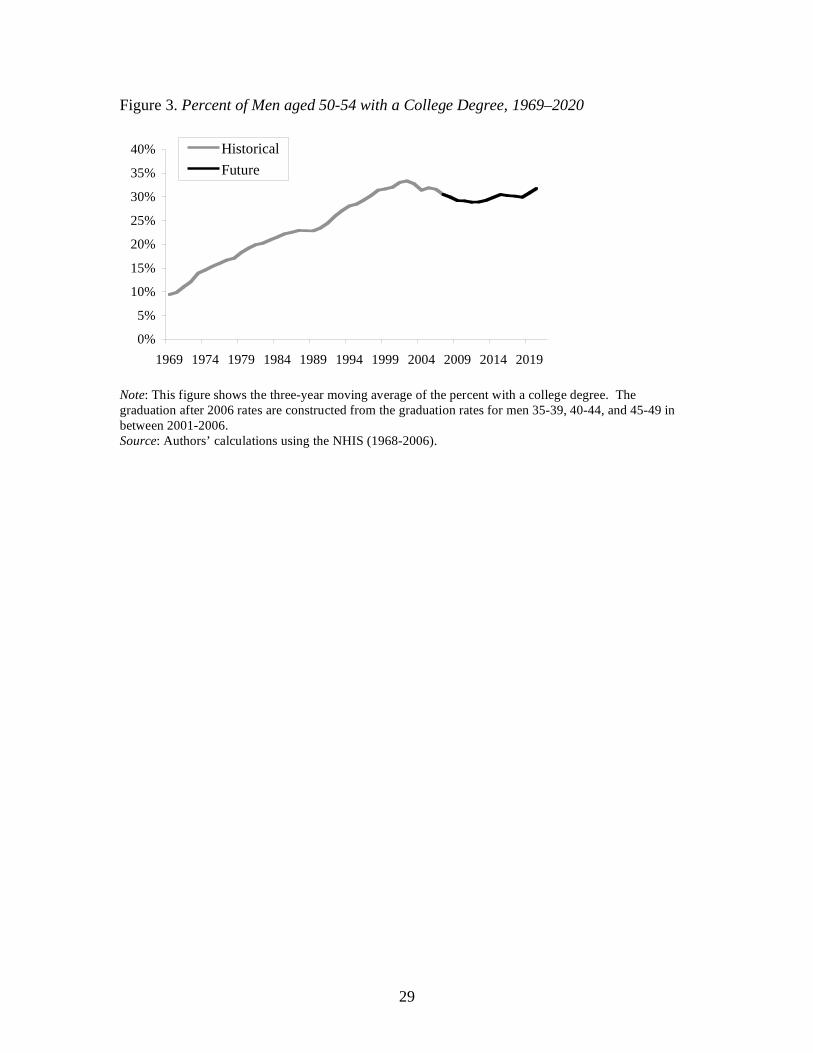
Increases in healthy life expectancy over 1970-2000 coincided with large
increases in educational attainment. Between 1970 and 2000, the percent of men 50-54
with a high school degree went from 55 to about 84 percent and the percent with a
college degree increased from 13 percent to about 32 percent.
Improvements in educational attainment, however, have recently plateaued. Men
in their 30s and 40s today have similar levels of education as those 50-54. These trends
imply that the education achievement of men 50-54 in the future will not be better than it
is today. In fact, for the next 20 years, the percent of men 50-54 with a high school and
college degrees will remain around 85 percent and 30 percent respectively (See Figures 2
and 3).
A large part of the improvement in health over the last 30 years has been
attributed to increases in education. Looking forward, the lack of continued increases in
educational attainment might slow down improvements in health.
33
If everyone took medication for hypertension and high cholesterol, the impact of rising obesity as
measured by Body Mass Index (BMI) could be almost eliminated, but it is not clear that will happen. 34
See Gruenberg (1977).
17
IV. Conclusion
A series of conclusions emerge from the foregoing analysis. First, on average, a
50-year-old man could expect almost three more years of healthy life in 2000 than in
1970. Second, healthy life expectancy varies significantly by race and education. In
2000, a white with less than high school could expect another 13 years and a white
college graduate 23 years. Third, – with the exception of college graduates – little
improvement has occurred within each race-education group. The overall increase in
years of healthy life is the result of men moving up the education ladder, most
particularly graduating from high school. Fourth, when collapsing the race and
educational groups into quartiles of the population, healthy life expectancy averages 14
years for the lowest quartile, 18 to 19 years for quartile two and three, and 23 years for
the highest quartile. Finally, healthy life expectancy may not continue to improve in the
future, given that the percent of men graduating from high school and from college
appears to have leveled off and that obesity may slow or reverse health gains.
These conclusions have implications for policymakers. First, physical limitations
should not inhibit the bulk of older Americans to work at least until their mid-sixties.
This finding is important because the retirement income system is contracting, and
workers need to remain employed longer to gain the same level of retirement income
security. Second, many of those who need to work longer – low-wage workers
dependent on Social Security – are precisely the individuals who have onerous jobs that
stress their health and lack the education to manage their care. These workers, who most
likely fall in the lowest quartile, will not be able to work until Social Security’s current
retirement age of 66. Thus, the working longer prescription must be administered with
care. Finally, policymakers should be cautious about expecting continued gains in
healthy life expectancy, since these gains are due primarily from movement up the
education ladder, and that movement has stalled. Changes that affect the retirement age
should be based on the notion that the level and dispersion in healthy life expectancy that
we have today may be with us for a long time to come.
18
References
Antonovsky, Aaron. 1967. “Social Class, Life Expectancy and Overall Mortality.” The
Milbank Memorial Fund Quarterly 45(2): 31-73.
Banks, James, Michael Marmot, Zoe Oldfield, and James P. Smith. 2006. "Disease and
Disadvantage in the United States and in England." Journal of the American
Medical Association 295(17): 2037-45.
Bell, Felicitie C. and Michael L. Miller. 2005. “Life Tables for the United States Social
Security Area 1900-2100.” Actuarial Study No. 116. Office of the Chief Actuary.
Social Security Administration.
Brown, Jeffrey R., Jeffrey B. Liebman, and Joshua Pollet. 2002. "Estimating Life Tables
that Reflect Socioeconomic Differences in Mortality." In The Distributional
Effects of Social Security Reform, eds. M. Feldstein and J. Liebman. University of
Chicago Press: Chicago, IL.
Burkhauser, Richard V., Mary C. Daly, Andrew J. Houtenville, and Nigar Nargis. 2002.
“Self-Reported Work-Limitation Data: What They Can and Cannot Tell Us.”
Demography 39(3): 541-555.
Christenson, B. and N. E. Johnson. 1995. Educational Inequality in Adult Mortality: An
Assessment with Death Certificate Data from Michigan.” Demography. Vol. 32,
May.
Crimmins, Eileen M., Yasuhiko Saito, Dominique Ingegneri. 1989. “Changes in Life
expectancy and Disability-Free Life Expectancy in the United States.” Population
and Development Review 15(2): 235-267.
Crimmins, Eileen M., Yasuhiko Saito, Dominique Ingegneri. 1997. “Trends in Disability-
Free Life Expectancy in the United States, 1970-90.” Population and
Development Review 23(3): 555-572.
Crimmins, Eileen M. and Yasuhiko Saito. 2001. “Trends in Healthy Life Expectancy in
the United States, 1970-90: Gender, Racial, and Educational Differences.” Social
Science and Medicine 52: 1629-1641.
Currie, Janet, and Brigitte C. Madrian. 1999. “Health, Health Insurance, and the Labor
Market.” In Handbook of Labor Economics, eds. Orley C. Ashenfelter and David
Card. Volume 3C. Amsterdam: Elsevier Science Publishers BV.
Cutler, David and Edward Glaeser and Allison Rosen. 2007. “Is the US Population
Behaving Healthier?” Working Paper 13013. Cambridge, MA: National Bureau of
Economic Research.
19
Cutler, David and Edward Glaeser. 2005. “What Explains Differences in Smoking,
Drinking, and Other Health-Related Behaviors?” Working Paper 11100.
Cambridge, MA: National Bureau of Economic Research.
Cutler, David, and Adriana Lleras-Muney. 2006. “Education and Health: Evaluating the
Theories and Evidence.” Working Paper 12352. Cambridge, MA: National Bureau
of Economic Research.
Cutler, David, Angus Deaton, and Adriana Lleras-Muney. 2006. “The Determinants of
Mortality.” Working Paper 11963. Cambridge, MA: National Bureau of Economic
Research.
Deaton, Angus and C. Paxson. 2001. “Mortality, Education, Income and Inequality
among American Cohorts.” In Themes in the Economics of Aging, ed. David
Wise. Chicago, IL: Chicago University Press.
Deschryvere, Matthias. 2005. “Health and Retirement Decisions: An Update of the
Literature.” Research Report. European Network of Economic Policy Research
Institutes.
Elo, Irma T. and Samuel H. Preston. 1996. “Educational Differences In Mortality: United
States, 1979-85.” Social Science and Medicine 42(1).
Feldman, Jacob J., Deane M. Makuc, Joel C. Kleinman, and Joan Cornoni-Huntley. 1989.
“National Trends in Education Differentials in Mortality.” American Journal of
Epidemiology 125(5): 919-933.
Freedman, Vicki, Eileen Crimmins, Robert Schoeni, Brenda Spillman, Hakan Aykan,
Ellen Kramarow, Kenneth Land, James Lubitz, Kenneth Manton, Linda Martin,
Diane Shinberg, Timothy Waidmann. 2004. “Resolving Inconsistencies in Trends
in Old-Age Disability: Report from a Technical Working Group.” Demography
41(3): 417-441.
Fries, James F. 1983. “The Compression of Morbidity.” Milbank Memorial
Fund/Quarterly /Health and Society 61(3): 397-419.
Fries, James F., Catherine A. Williams, Dianne Morfeld, Gurkirpal Singh, and John
Sibley. 1996. “Reduction in Long-Term Disability in Patients With Rheumatoid
Arthritis by Disease-Modifying Antirheumatic Drug-Based Treatment Strategies.”
Arthritis and Rheumatism 39(4):616-622.
Goesling, Brian. 2005. “The Rising Significance of education for health?” Paper
presented at the Annual Meeting of the Population Association of America in
Philadelphia, PA.
20
Heckman, James J. and Paul A. Lafountaine. Forthcoming. “The GED and the Problem
of Non- Cognitive Skills in America.” Chicago, IL: University of Chicago Press.
Heckman, James J. and Paul A. Lafountaine. 2008. “The Declining American High
School Graduation Rate: Evidence, Sources, and Consequences.” NBER Reporter.
Cambridge, MA: National Bureau of Economic Research.
Goldman, Dana P. and James P. Smith. 2002. “Can Patient Self-Management Help
Explain the SES Health Gradient?” Proceedings of the National Academy of
Sciences USA 99(16): 10929-10934.
Gruenberg, E.M. 1977. “The Failure of Success.” Milbank Memorial Fund Quarterly.
Health and Society 55(1): 3-24.
Idler, Ellen and Stanislav Kasl. 1991. “Health Perceptions and Survival: Do Global
Evaluations of Health Status Really Predict Mortality?” Journal of Gerontology
46: S55-S65
Kitagawa, E. M. and P.M. Hauser. 1973. Differential Mortality in the United States: A
Study of Socioeconomic Epidemiology. Cambridge, MA: Harvard University
Press.
Lakdawalla, Darius, Jayanta Bhattacharya, and Dana Goldman. 2004. “Are the Young
Becoming More Disabled?” Health Affairs 23(1): 168-176.
Manton, Kenneth, XiLiang Gu, and Vicki Lamb. 2006. “Change in Chronic Disability
from 1982 to 2004/2005 as Measured By Long-Term Changes in Function and
Health in the U.S. Elderly Population.” Proceedings of the National Academy of
Sciences USA 103(48): 18374-18379.
Marmot, Michael, G. and George D. Smith. 1997. “Socio-Economic Differentials in
Health.” Journal of Health Psychology 2(3): 283-296.
Mayfield, Demmie, Gail McLeod, and Patricia Hall. 1974. "The CAGE Questionnaire:
Validation of a New Alcoholism Screening Instrument." American Journal of
Psychiatry 131(10): 1131-23.
Murray, Christopher J. L., Sandeep C. Kulkarni, Catherine Michaud, Niels Tomijima,
Maria T. Bulzacchelli, Terrel J.Iandiorio, and Majid Ezzati. 2006. “Eight
Americas: Investigating Mortality Disparities across Races, Counties, and Race-
Counties in the United States.” PLoS Medicine 3(9): 1513-24.
Pampel, Fred. 2002. Inequality, Diffusion, and the Status Gradient in Smoking. Social
Problems 49(1): 35-57.
21
Pamuk, E., D. Makuc, K. Heck, C. Reuben, and K. Lochner. 1998. Socioeconomic Status
and Health Chartbook. Health United States, 1998. Hyattsville, MD: National
Center for Health Statistics.
Pappas, Gregory, Susan Queen, Wilbur Hadden, and Gail Fisher. 1993. “The Increasing
Disparity in Mortality between Socioeconomic Groups in the United States, 1960
and 1986.” New England Journal of Medicine 329(2): 103-109.
Preston, Samuel H. 1996. “American Longevity: Past, Present and Future.” Syracuse
University Policy Brief No. 7. Maxwell Scholl, Center for Policy Research.
Preston, Samuel H. and Irma T. Elo. 1995. “Are Educational Differentials in Adult
Mortality Increasing in the United States?” Journal of Aging and Health 7(4):
476-496.
Rogers, Richard G., Robert A. Hummer, and Charles B. Nam. 2001. Living and Dying in
the USA: Behavioral Health and Social Differences in Adult Mortality. New
York, NY: Academic Press.
Smith, James P. 2004. “Unraveling the SES Health Connection.” In Aging, Health, and
Public Policy: Demographic and Economic Perspectives,” Supplement to
Population and Development Review 30: 108-132.
Soldo, Beth, Olivia S. Mitchell, Rania Tfaily, and John F. McCabe. 2006. “Cross-Cohort
Differences in Health on the Verge of Retirement.” Working Paper 12762.
Cambridge, MA: National Bureau of Economic Research.
Steuerle, Eugene, Christopher Spiro, and Richard W. Johnson. 1999. “Can Americans
Work Longer?” Straight Talk on Social Security and Retirement Policy.
Washington, DC: The Urban Institute.
Taeuber, Cynthia.1993. Nursing Home Population: 1990 (CPH-L0137). 1990 Census of
Population, prepared from the Census Analysis System. Washington, DC: US
Bureau of the Census.
U.S. Bureau of the Census. 1973a. Census of Population: 1970. Vol. I. Washington,
DC: Government Printing Office.
U.S. Bureau of the Census. 1973b. Census of Population: 1970. Vol. II. Washington,
DC: Government Printing Office.
U.S. Bureau of the Census. 1983. Census of Population: 1980, Vol. I. Characteristics
of the Population. Washington, DC: Government Printing Office.
U.S. Bureau of the Census. 1984. Census of Population: 1980. Vol. II. Subject
Reports. Washington, DC: Government Printing Office.
22
U.S. Bureau of the Census. 1991. Census of Population and Housing, 1990: Summary
Tape File 1. Prepared by the U.S. Census Bureau. Washington, DC: Government
Printing Office.
U.S. Bureau of the Census. 2001. Census 2000 Summary File 1. Prepared by the U.S.
Census Bureau. Washington, DC: Government Printing Office.
U.S. Department of Health and Human Services. 1967-2006. National Health Interview
Survey, 1967-2006. Public Use Sample, Documentation, and Codebook.
Hyattsville, MD: National Center for Health Statistics.
Waidmann, Timothy A., John Bound, and Michael Schoenbaum. 1995. “The Illusion of
Failure: Trends in the Self-Reported Health of the U.S. Elderly.” Milbank
Quarterly 73(2): 253-287.
Waldron, Hilary. 2007. “Trends in Mortality Differentials and Life Expectancy for Male
Social Security-Covered Workers, by Socioeconomic Status.” Social Security
Bulletin 67(3): 1-28.
Winkleby, MA, DE Jatulis, E Frank and SP Fortmann. 1997. “Socioeconomic Status and
Health: How Education, Income, and Occupation Contribute to Risk Factors for
Cardiovascular Disease.” American Journal of Public Health 82(6): 816-820.
23
Table 1. Period and Cohort Life Expectancy at Age 50 for Males, 1960-2010
Year
Period
Cohort
1960 22.9 30.1
1970 23.2 30.9
1980 24.9 31.7
1990 26.3 32.4
2000 27.5 33.1
2010 28.4 34.2 Note: The cohort life expectancy at age 50 for 2010 is imputed assuming the ratio of cohort life expectancy
to period life expectancy remains constant between 2000 and 2010.
Source: Bell and Miller (2005) and authors’ calculations.
Table 2. Percent of the Male Population Institutionalized, 1970, 1980, 1990, and 2000
Age group
1970 1980 1990 2000
50-54 0.78 0.55 0.39 0.30
55-59 0.98 0.72 0.54 0.40
60-64 1.26 0.93 0.77 0.59 Note: For a description of the methodology, see Appendix A.
Source: Authors’ calculations using the U.S. Census Bureau (1973a, 1973b, 1983, 1984, 1991, and 2001).
Table 3. Percent of the Non-Institutionalized Male Population with Limitation of Activity,
1970, 1980, 1990, and 2000
Age
1970 1980 1990 2000
50-54 18.7 20.9 21.4 21.2
55-59 23.3 28.1 23.4 24.3
60-64 30.8 36.1 31.8 29.3
65-69 37.9 43.0 36.8 33.1 Note: Figures for 1990 and 2000 are adjusted to account for survey redesign. See Appendix C for more
details.
Source: Authors’ calculations using the NHIS (1968-2006).
24
Table 4. Expectations at Age 50 of Years Spent in Various States of Health, 1970, 1980,
1990, and 2000
Years Change Expectation of Life
1970 1980 1990 2000 1970-
1980
1980-
1990
1990-
2000
1970-
2000
Total 23.2 24.8 26.3 27.5 1.6 1.4 1.2 4.2
Free of disability 15.2 15.2 16.7 17.9 0.1 1.4 1.2 2.7
With disability 7.6 9.1 9.2 9.1 1.5 0.1 0.0 1.5
Institutionalized 0.5 0.5 0.5 0.5 0.0 -0.1 0.0 0.0 Source: Authors’ calculations using Bell and Miller (2005), U.S. Census Bureau (1973a, 1973b, 1983,
1984, 1991, and 2001) and the NHIS (1968-2006).
Table 5. Relative Mortality Rates and Life Expectancy for Males by Age, Education, and
Race, 1979-1989
Race and
education
Relative
mortality
rates
Implied life
expectancy
at age 50
White
<HS 1.33 24.2
HS + 0.95 26.3
College+ 0.57 28.7
Black
<HS 2.55 20.9
HS + 1.75 22.0
Hispanic
All 0.90 29.8 Source: Brown, Liebman, and Pollet (2005) and authors’ calculations using Bell and Miller (2005).
Table 6. Percent of Men Aged 50-64 Reporting Fair or Poor Health by Educational
Attainment, 1975, 1985, 1995, and 2005
Educational attainment
1975 1985 1995 2005
Less than high school 35.3% 36.0% 37.5% 36.2%
High school 19.0 16.9 17.0 17.9
Some college 14.8 11.7 13.3 14.0
College or more 8.9 7.3 7.5 6.8
Total 29.3 23.0 17.5 14.2 Source: Authors’ calculations using the NHIS (1968-2006).
25
Table 7. Percent of Men 50-64 Reporting Fair or Poor Health by Quartiles of Health,
1975 and 2005 NHIS
Quartile of Health
1975 2005
Bottom quartile 35.3% 29.5%
2nd
quartile 32.1 16.6
3rd
quartile 19.0 11.8
Top quartile 11.7 6.8
Bottom/top quartile 3.0 4.4 Source: Authors’ calculations using the NHIS (1968-2006).
Table 8. Percent of the Non-Institutionalized Male Population Age 50-64 with Limitation
of Activity, 1970, 1980, 1990, and 2000
White Black Age
<HS HS+ College <HS HS+
1970 22.5% 16.7% 13.2% 28.1% 17.5%
1980 27.3 18.7 13.2 32.3 19.6
1990 28.8 18.7 14.0 33.1 19.0
2000 34.0 20.0 11.4 36.7 25.0 Note: Figures for 1990 and 2000 are adjusted to account for survey redesign, based on methodology in
Crimmins, Saito, and Ingegneri (1997). See Appendix C. Figures for blacks with high school or more are
adjusted for 1970 because of the small number of observations in this category. The adjustment assumes
that the ratio of the percent of black males with high school or more to white males with high school or
some college in 1970 is the same as the observed for 1980. This imputation does not affect the overall
results because blacks with high school of more were only about 2.5 percent of the population in 1970 for
the age groups analyzed in this paper.
Source: Authors’ calculations using the NHIS (1968-2006).
26
Table 9. Total Life Expectancy and Healthy Life Expectancy for Males at Age 50, by
Education and Race, 1970, 1980, 1990 and 2000
White Black Year
<HS HS+ College+ <HS HS+
Total life
expectancy
1970 21.3 23.6 25.4 17.3 17.7
1980 22.8 24.9 29.7 19.2 22.9
1990 24.2 26.3 28.7 20.9 22.0
2000 25.2 27.2 30.1 22.3 23.4
Healthy life
expectancy
1970 13.3 16.7 19.2 10.3 15.4
1980 12.7 16.5 21.5 9.6 15.2
1990 13.0 17.7 21.3 10.7 14.5
2000 13.3 17.9 22.8 11.4 14.8 Note: Figures for blacks with high school or more are adjusted for 1970 because of the small number of
observations in this category. The adjustment assumes that the ratio of the percent of black males with high
school or more to white males with high school or some college in 1970 is the same as the observed for
1980. This imputation does not affect the overall results because blacks with high school of more were
only about 2.5 percent of the population in 1970 for the age groups analyzed in this paper.
Source: Authors’ calculations using the NHIS (1968-2006).
Table 10. Health Life Expectancy for Males at Age 50, 1970, 1980, 1990, and 2000
Quartile of healthy life
expectancy
1970 1980 1990 2000
Bottom quartile 12.5 12.0 12.8 14.1
2nd
quartile 13.7 14.8 17.3 17.9
3rd
quartile 16.7 16.5 17.7 19.1
Top quartile 17.8 20.3 21.0 22.8 Note: This table combines the healthy life expectancy at age 50 by race-education with the race-education
distribution of men aged 50-54 for each year.
Source: Authors’ calculations using the NHIS (1968-2006).
27
Table 11. Self-Reported Health Status of Males, Ages 51-56 by Birth Cohort
Self-Reported
Health Status
Original Cohort
(born 1936-41):
1992
War Babies
(born 1942-47):
1998
Early Boomers
(born 1948-53):
2004
Excellent/ Very Good 57% 54% 50%
Reporting:
Pain 17 23 29
Chronic Problem 53 54 60
Psychiatric Problem 8 17 21
Alcohol Problem 21 23 28
Note: Respondents coded as having a potential drinking problem if they responded positively to more than
1 out of the 4 items: ever felt should cut down on drinking, ever criticized for drinking, felt bad or guilty
about drinking, or ever taken a drink first thing in the morning. This measure is used clinically to screen
for alcoholism (Mayfield et al., 1974).
Source: Soldo et al. (2006).
Table 12. Impact of Risk Factors on Predicted 10-year Mortality for Population Aged 25-
75, 1971-74 to 1999-2002 and 1999-2002 to early 2020s
Impact of risk factor 1971-1975
to
1999-2002
1999-2002
to
Early 2020s
Smoking -0.9 -0.7
Blood pressure -0.6 0.0a
Education -0.2 0.0
Cholesterol -0.2 0.0a
Drinking +0.1 +0.1
BMI +0.3 +1.1 a. The estimate for the impact of rising BMI assumes the existing degrees of medication use. An
alternative simulation estimated the impact where BMI increases by the same amount but all people with
hypertension and high cholesterol were on medication and the medication brought them to the 75th
percentile of effectiveness. In this case, rising BMI increased mortality by only 0.1 percent.
Source: Cutler, Glaeser, and Rosen (2007).
28
Figure 1. Percent of Men aged 50–64 with Activity Limitations, 1969–2006
0%
10%
20%
30%
40%
1969 1974 1979 1984 1989 1994 1999 2004
Unadjusted
Adjusted
Note: Figures 1982-1996 and 1997-2006 are adjusted to account for survey redesign. See Appendix C for
more details.
Source: Authors’ calculations using the NHIS (1968-2006).
Figure 2. Percent of Men aged 50-54 with a High School Diploma, 1969–2020
0%
10%
20%
30%
40%
50%
60%
70%
80%
90%
100%
1969 1974 1979 1984 1989 1994 1999 2004 2009 2014 2019
Historical
Future
Note: This figure shows the three-year moving average of the percent with a high school diploma. Men
with GED are classified as not having a diploma. The graduation after 2006 rates are constructed from the
graduation rates for men 35-39, 40-44, and 45-49 in between 2001-2006.
Source: Authors’ calculations using the NHIS (1968-2006).
29
Figure 3. Percent of Men aged 50-54 with a College Degree, 1969–2020
0%
5%
10%
15%
20%
25%
30%
35%
40%
1969 1974 1979 1984 1989 1994 1999 2004 2009 2014 2019
Historical
Future
Note: This figure shows the three-year moving average of the percent with a college degree. The
graduation after 2006 rates are constructed from the graduation rates for men 35-39, 40-44, and 45-49 in
between 2001-2006.
Source: Authors’ calculations using the NHIS (1968-2006).
30
Appendix A. Percent of the Male Population Institutionalized
For 1970-1980 the population institutionalized was calculated by adding those in mental
hospitals and residential treatment centers, tuberculosis hospitals, chronic disease
hospitals (except tuberculosis and mental hospitals), homes for the aged, homes and
schools for the mentally handicapped, and homes and schools for the physically
handicapped. In some tables the data were not broken down into five-year age groups.
We therefore estimated data for five-year age groups using the distribution of “other
inmates” (table 205 for 1970 and table 266 for 1980), after subtracting from the “other”
category those in prison (this applies only to 1970, as prison inmates were already
subtracted out of other inmates in 1980) and mental hospital inmates. This methodology
follows Crimmins, Saito and Ingegneri (1989).
For 1990 and 2000, data were estimated using the total population of the United States
and group quarters data found in the Decennial Census reports published by the US
Census Bureau. Institutionalized group quarters data were split only into four categories
(correctional institutions, nursing homes, juvenile institutions, and other institutions.)
Since punitive inmates have already been factored out, further refinement of the data,
such as in 1970 and 1980, was not necessary. We calculated the institutionalized
population as the sum of those in nursing homes and other institutions. Also, in 1990 and
2000, when age groups given in the group quarters data were not tabulated in five-year
age groups, we constructed these five year groups as a weighted average of the data from
different age groups. For example, where group quarters data in 1990 was given in the
age groups 49-51 and 52-54, the percent institutionalized for the 50-54 group was
assumed to be the weighted average of the percent institutionalized in the groups 49-51
and 52-54 – the weights being 2/5 for the group 49-51 and 3/5 for the group 52-54.
31
Appendix B. Flow Charts of NHIS Activity Limitation Questions
Retired
Something
else
Yes No
Yes No* Yes* No Yes No* Yes* No
Yes* No
Yes* No Yes* No
Yes* No
Yes No
*= Limited
+=No limitations
24b.
In terms of health, are
you NOW able to
keep the house?
24a.
Do you NOW have a job?
24b.
In terms of health, are
you NOW able to
work?
23a.
Do your health NOW
keep you from
working?
24c/d, 23b/c.
Are you limited in the
kind/amount of work
you can do because of
your health?
26c.
Are you limited in the
k ind or amount of
other activities
because of your
health?
26a.
Do you have to go to
a certain type of
school because of
your health?
24c/d.
Are you limited in the
kind/amount of
housework you can
do because of your
health?
26b.
Are you limited in
school attendance
because of your
health?
24e, 23d.
Are you limited in the
kind or amount of
other activities
because of your
health?
27a.
Are you limited in ANY
W AY because of a
disability or health?
Before 1982
What were you doing most of the past 12 months?
Going to school
Keeping the house
(only women)Working
32
Student
Something
else
Yes=2.1 No Yes=3.4 No
Yes=2.2 No
Yes=3.5 No
Yes=5.1 No
Yes=5.2 No
Yes=6.1 No=6.2
1982-1996
W hat were you doing MOST OF THE PAST 12 Months?
W orking
Keeping the house
(men or women)
2a.
Does any im pairment
or health problem
NOW keep you from
working?
3a.
Does any impairment
or health problem
NOW keep you from
doing housework?
2b.
Are you limited in the
k ind/amount of work
you can do because of
your health?
5a.
Does any impairment or
health problem keep you
from working?
3b.
Are you limited in the
kind/amount of
housework you can
do because of any
impairment or health
problem?
6a.
Are you limited in ANY
W AY because of a
disability or health?
5b.
Are you limited in the
k ind or amount of work
you could do because of
an impairment or health
problem?
33
Yes No
Yes No
Yes* No
Yes* No
Yes No
Yes No
Yes No
FHS.250
Are you LIMITED IN ANYWAY in activities because
of physical, mental, or emotional problems?
FHS.170
Does a physical, mental, or emotional problem
NOW keep you from working?
FHS.190
Are you limited in the k ind/amount of work you can
do because of your health?
FHS.210
Because of a health problem , do you have
diff iculty walking without using any special
equipment?
FHS.230
Are you LIMITED IN ANYW AY because of difficulty
remembering or because you experience periods
of confusion?
>1997
All Individuals
FHS.070
Because of a physical, mental, or emotional
problem, do you need the help of other persons
with personal care needs, such as eating, bathing,
dressing, or getting around the house?
FHS.150
Because of a physical, mental, or emotional
problem, do you need the help of other presons in
handling ROUTINE NEEDS, such as everyday
household chores, doing necessary business,
shopping, or getting around for other purposes?
34
Appendix C. Adjustments to NHIS Data on Activity Limitations
The NHIS experienced two major redesigns over the last 50 years, first in 1982 and then
in 1997. These redesigns introduced breaks to the activity limitation series (See figure 1).
This appendix explains the adjustments made to the data from the NHIS to produce one
consistent series from 1969 to 2006.
The 1982 redesign left the wording and order of the “activity limitation” questions
virtually unchanged. But this redesign introduced two important changes for men 50 and
over. First, it allowed men to select “keeping the house” as a major activity, which had
not been possible before 1982. Second, men 71 and over were asked about the ability to
perform “personal care and routine needs” rather than the normal activities of house
keeping and working in early surveys. Before 1982, only those who reported a limitation
were asked about the “personal care and routine needs” questions.
The 1997 redesign of the survey affected both the wording and the sequence of the
questions in the “limitations of activity” section. Also, until 1996, the NHIS was
generally conducted by pencil and paper. Starting in 1997, the NHIS is administered
using a computer assisted personal interviewing system (CAPI). The interview is
conducted using a laptop computer. These changes introduced discontinuity in the
activity limitation series (see Figure 1).
The strategy used to connect the activity limitation series over time follows Crimmins,
Saito, and Ingegneri (1989 and 1997). The main assumption is that changes due to each
redesign affect the levels but not the trend of the activity limitations series.
The adjustments are made for each race (white / black), education (less than high school,
high school or some college, college plus), and age (50-54, 55-59, 60-64, 65-69, 70+)
group. There are a total of 25 groups. The procedure to connect the series as follows:
First, we run two regressions with the percent with activity limitations as a dependent
variable and a time trend as explanatory variable. One regression uses the 10 years
before the break and the other uses the 10 years after the break (9 years for the 1997
break). Then we run an third regression with the 10 years before and after the break,
which uses the percent with activity limitations as dependent and a time trend and a
dummy for the years after the break as explanatory variables.
Second, we classify the series in four categories depending on the regression results of
the first two regressions: 1) trends in both periods are not significantly different from zero
(no trends); 2) trend in the first period is not significantly different from zero, but trend in
the second period is (no trend, trend); 3) trend in the second period is significantly
different from zero, but trend in the first period is not (trend, no trend); 4) trends in both
periods are significantly different from zero, and trends are not significantly different
from each other (same trends); 5) trends in both periods are significantly different from
zero, and trend are significantly different from each other (different trends).
35
Third, we use the regression results to adjust the second period. The adjustments are
different for each category:
For category 1 (no trends), the adjustment is simply to subtract the coefficient of the
dummy in the third regression (if this coefficient is different than zero) from the values in
the second period.
For category 2 (no trend, trend), we use the second regression to predict the value in the
period before the break occurred. For example, for the 1997 redesign, we use the second
regression to predict the 1996 value. Then, the adjustment factor is the difference
between this prediction and the coefficient of the dummy from the first regression. This
factor is subtracted from the values in the second period.
For category 3 (trend, no trend), we use the first regression to predict the value in the
period after the break occurred. For example, for the 1997 redesign, we use the first
regression to predict the 1997 value. Then, the adjustment factor is the difference
between the coefficient of the dummy from the second regression and the predicted
value. This factor is subtracted from the values in the second period.
For category 4 (same trends), the adjustment is to subtract the coefficient of the dummy
in the third regression (if this coefficient is different than zero) from the values in the
second period.
For category 5 (different trends), we use the first regression to predict the value in the
period after the break occurred and the second regression to predict the value in the
period before the break occurred. For example, for the 1997 redesign, we use first
regression to predict the 1997 value and the second regression to predict the 1996 value.
The adjustment factor is the mean of the differences between the two predictions and the
actual values. This factor is subtracted from the values in the second period.
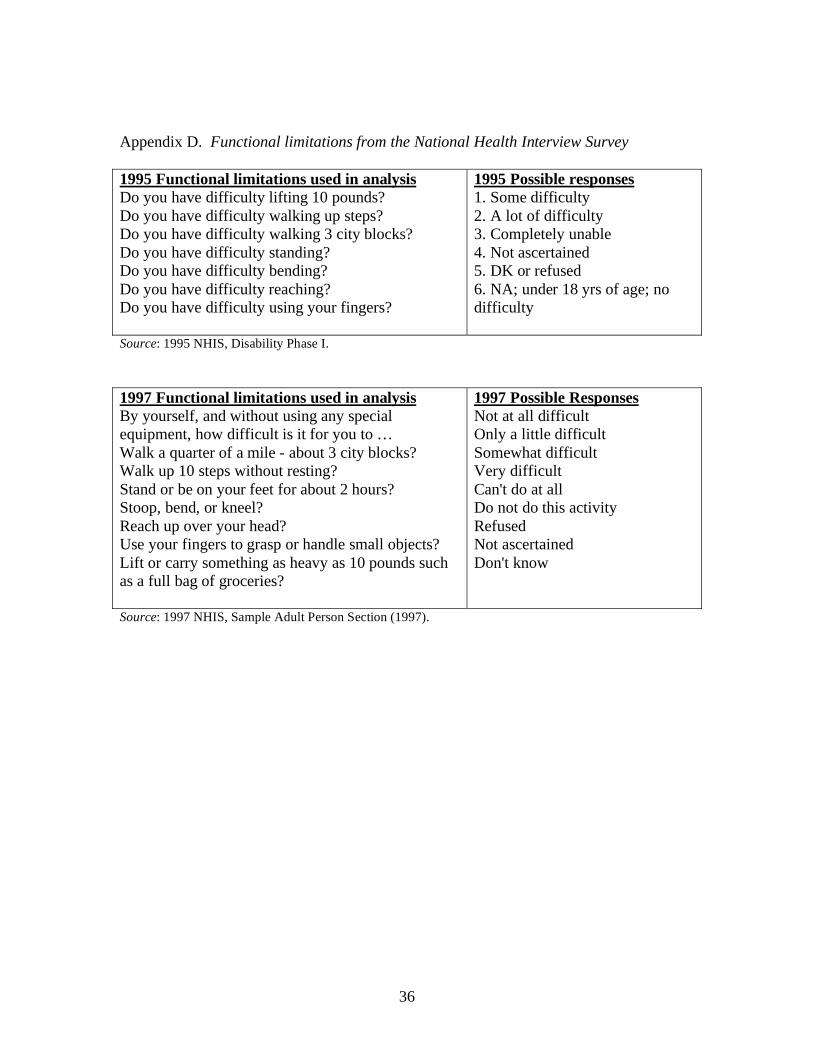
36
Appendix D. Functional limitations from the National Health Interview Survey
1995 Functional limitations used in analysis
Do you have difficulty lifting 10 pounds?
Do you have difficulty walking up steps?
Do you have difficulty walking 3 city blocks?
Do you have difficulty standing?
Do you have difficulty bending?
Do you have difficulty reaching?
Do you have difficulty using your fingers?
1995 Possible responses
1. Some difficulty
2. A lot of difficulty
3. Completely unable
4. Not ascertained
5. DK or refused
6. NA; under 18 yrs of age; no
difficulty
Source: 1995 NHIS, Disability Phase I.
1997 Functional limitations used in analysis
By yourself, and without using any special
equipment, how difficult is it for you to …
Walk a quarter of a mile - about 3 city blocks?
Walk up 10 steps without resting?
Stand or be on your feet for about 2 hours?
Stoop, bend, or kneel?
Reach up over your head?
Use your fingers to grasp or handle small objects?
Lift or carry something as heavy as 10 pounds such
as a full bag of groceries?
1997 Possible Responses
Not at all difficult
Only a little difficult
Somewhat difficult
Very difficult
Can't do at all
Do not do this activity
Refused
Not ascertained
Don't know
Source: 1997 NHIS, Sample Adult Person Section (1997).
RECENT WORKING PAPERS FROM THE
CENTER FOR RETIREMENT RESEARCH AT BOSTON COLLEGE
An Assessment of Life-Cycle Funds
Mauricio Soto, Robert K. Triest, Alex Golub-Sass, and Francesca Golub-Sass, May 2008
Participant Perceptions and Decision-Making Concerning Retirement Benefits
Colleen E. Medill, February 2008
A Micro-Level Analysis of Recent Increases in Labor Participation Among Older
Workers
Kevin E. Cahill, Michael D. Giandrea, and Joseph F. Quinn, February 2008
The Trajectory of Wealth in Retirement
David A. Love, Michael G. Palumbo, and Paul A. Smith, February 2008
The Rising Age at Retirement in Industrial Countries
Gary Burtless, February 2008
The Implications of Career Lengths for Social Security
Melissa M. Favreault and C. Eugene Steuerle, February 2008
Do Out-of-Pocket Health Care Costs Delay Retirement?
Richard W. Johnson, Rudolph G. Penner, and Desmond Toohey, February 2008
How the Income and Tax Treatment of Saving and Social Security Benefits May
Affect Boomers’ Retirement Incomes
Barbara A. Butrica, Karen E. Smith, and Eric J. Toder, February 2008
Saving and Wealth Accumulation in the PSID, 1984-2005
Barry P. Bosworth and Sarah Anders, February 2008
Older Women’s Income and Wealth Packages in Cross-National Perspective
Timothy M. Smeeding, Janet C. Gornick, Eva Sierminska, and Maurice Leach, Feb. 2008
How Many Struggle to Get By in Retirement?
Barbara A. Butrica, Daniel Murphy, and Sheila R. Zedlewski, January 2008
All working papers are available on the Center for Retirement Research website
(http://www.bc.edu/crr) and can be requested by e-mail ([email protected]) or phone (617-552-1762).


