Embed Size (px)
Citation preview

Improved measurement of the B0 and B+ meson lifetimes
D. Buskulic, I. De Bonis, D. Decamp, P. Ghez, C. Goy, J.P. Lees, A. Lucotte,
M.N. Minard, P. Odier, B. Pietrzyk, et al.
To cite this version:
D. Buskulic, I. De Bonis, D. Decamp, P. Ghez, C. Goy, et al.. Improved measurement of theB0 and B+ meson lifetimes. Zeitschrift fur Physik C, 1996, 71, pp.31-44. <in2p3-00009625>
HAL Id: in2p3-00009625
http://hal.in2p3.fr/in2p3-00009625
Submitted on 8 Apr 1999
HAL is a multi-disciplinary open accessarchive for the deposit and dissemination of sci-entific research documents, whether they are pub-lished or not. The documents may come fromteaching and research institutions in France orabroad, or from public or private research centers.
L’archive ouverte pluridisciplinaire HAL, estdestinee au depot et a la diffusion de documentsscientifiques de niveau recherche, publies ou non,emanant des etablissements d’enseignement et derecherche francais ou etrangers, des laboratoirespublics ou prives.

EUROPEAN LABORATORY FOR PARTICLE PHYSICS
CERN-PPE/96-14
2 February 1996
Improved Measurement of the B0and
B� Meson Lifetimes
The ALEPH Collaboration
Abstract
The lifetimes of the B0and B� mesons have been measured with the Aleph
detector at LEP, using approximately 3 million hadronic Z decays collected in
the period 1991{1994. In the �rst of three methods, semileptonic decays of B0
and B� mesons were partially reconstructed by identifying events containinga lepton with an associated D�+ or D0 meson. The second method used fully
reconstructed B0and B� mesons. The third method, used to measure the
B0lifetime, employed a partial reconstruction technique to identify B
0!
D�+��X decays.
The combined results are
�0 = 1:55� 0:06 � 0:03 ps;
�� = 1:58� 0:09 � 0:03 ps;���0
= 1:03� 0:08 � 0:02:
(Submitted to Zeitschrift f�ur Physik C)

The ALEPH Collaboration
D. Buskulic, I. De Bonis, D. Decamp, P. Ghez, C. Goy, J.-P. Lees, A. Lucotte, M.-N. Minard, P. Odier,
B. Pietrzyk
Laboratoire de Physique des Particules (LAPP), IN2P3-CNRS, 74019 Annecy-le-Vieux Cedex, France
M.P. Casado, M. Chmeissani, J.M. Crespo, M. Del�no,12 I. Efthymiopoulos,1 E. Fernandez,
M. Fernandez-Bosman, Ll. Garrido,15 A. Juste, M. Martinez, S. Orteu, A. Pacheco, C. Padilla, A. Pascual,
J.A. Perlas, I. Riu, F. Sanchez, F. Teubert
Institut de Fisica d'Altes Energies, Universitat Autonoma de Barcelona, 08193 Bellaterra (Barcelona),Spain7
A. Colaleo, D. Creanza, M. de Palma, G. Gelao, M. Girone, G. Iaselli, G. Maggi,3 M. Maggi, N. Marinelli,
S. Nuzzo, A. Ranieri, G. Raso, F. Ruggieri, G. Selvaggi, L. Silvestris, P. Tempesta, G. Zito
Dipartimento di Fisica, INFN Sezione di Bari, 70126 Bari, Italy
X. Huang, J. Lin, Q. Ouyang, T. Wang, Y. Xie, R. Xu, S. Xue, J. Zhang, L. Zhang, W. Zhao
Institute of High-Energy Physics, Academia Sinica, Beijing, The People's Republic of China8
R. Alemany, A.O. Bazarko, G. Bonvicini,23 M. Cattaneo, P. Comas, P. Coyle, H. Drevermann, R.W. Forty,
M. Frank, R. Hagelberg, J. Harvey, P. Janot, B. Jost, E. Kneringer, J. Knobloch, I. Lehraus, E.B. Martin,
P. Mato, A. Minten, R. Miquel, Ll.M. Mir,2 L. Moneta, T. Oest,20 F. Palla, J.R. Pater,27 J.-F. Pusztaszeri,
F. Ranjard, P. Rensing, L. Rolandi, D. Schlatter, M. Schmelling,24 O. Schneider, W. Tejessy, I.R. Tomalin,
A. Venturi, H. Wachsmuth, A. Wagner, T. Wildish
European Laboratory for Particle Physics (CERN), 1211 Geneva 23, Switzerland
Z. Ajaltouni, A. Barr�es, C. Boyer, A. Falvard, P. Gay, C . Guicheney, P. Henrard, J. Jousset, B. Michel,
S. Monteil, J-C. Montret, D. Pallin, P. Perret, F. Podlyski, J. Proriol, J.-M. Rossignol
Laboratoire de Physique Corpusculaire, Universit�e Blaise Pascal, IN2P3-CNRS, Clermont-Ferrand,63177 Aubi�ere, France
T. Fearnley, J.B. Hansen, J.D. Hansen, J.R. Hansen, P.H. Hansen, B.S. Nilsson, A. W�a�an�anen
Niels Bohr Institute, 2100 Copenhagen, Denmark9
A. Kyriakis, C. Markou, E. Simopoulou, I. Siotis, A. Vayaki, K. Zachariadou
Nuclear Research Center Demokritos (NRCD), Athens, Greece
A. Blondel, G. Bonneaud, J.C. Brient, P. Bourdon, A. Roug�e, M. Rumpf, A. Valassi,6 M. Verderi,
H. Videau21
Laboratoire de Physique Nucl�eaire et des Hautes Energies, Ecole Polytechnique, IN2P3-CNRS, 91128Palaiseau Cedex, France
D.J. Candlin, M.I. Parsons
Department of Physics, University of Edinburgh, Edinburgh EH9 3JZ, United Kingdom10
E. Focardi,21 G. Parrini
Dipartimento di Fisica, Universit�a di Firenze, INFN Sezione di Firenze, 50125 Firenze, Italy
M. Corden, C. Georgiopoulos, D.E. Ja�e
Supercomputer Computations Research Institute, Florida State University, Tallahassee, FL 32306-4052, USA 13;14
A. Antonelli, G. Bencivenni, G. Bologna,4 F. Bossi, P. Campana, G. Capon, D. Casper, V. Chiarella,
G. Felici, P. Laurelli, G. Mannocchi,5 F. Murtas, G.P. Murtas, L. Passalacqua, M. Pepe-Altarelli
Laboratori Nazionali dell'INFN (LNF-INFN), 00044 Frascati, Italy
L. Curtis, S.J. Dorris, A.W. Halley, I.G. Knowles, J.G. Lynch, V. O'Shea, C. Raine, P. Reeves, J.M. Scarr,
K. Smith, A.S. Thompson, F. Thomson, S. Thorn, R.M. Turnbull
Department of Physics and Astronomy, University of Glasgow, Glasgow G12 8QQ,United Kingdom10

U. Becker, C. Geweniger, G. Graefe, P. Hanke, G. Hansper, V. Hepp, E.E. Kluge, A. Putzer, B. Rensch,
M. Schmidt, J. Sommer, H. Stenzel, K. Tittel, S. Werner, M. Wunsch
Institut f�ur Hochenergiephysik, Universit�at Heidelberg, 69120 Heidelberg, Fed. Rep. of Germany16
D. Abbaneo, R. Beuselinck, D.M. Binnie, W. Cameron, P.J. Dornan, A. Moutoussi, J. Nash,
J.K. Sedgbeer, A.M. Stacey, M.D. Williams
Department of Physics, Imperial College, London SW7 2BZ, United Kingdom10
G. Dissertori, P. Girtler, D. Kuhn, G. Rudolph
Institut f�ur Experimentalphysik, Universit�at Innsbruck, 6020 Innsbruck, Austria18
A.P. Betteridge, C.K. Bowdery, P. Colrain, G. Crawford, A.J. Finch, F. Foster, G. Hughes, T. Sloan,
M.I. Williams
Department of Physics, University of Lancaster, Lancaster LA1 4YB, United Kingdom10
A. Galla, A.M. Greene, K. Kleinknecht, G. Quast, B. Renk, E. Rohne, H.-G. Sander, P. van Gemmeren
C. Zeitnitz
Institut f�ur Physik, Universit�at Mainz, 55099 Mainz, Fed. Rep. of Germany16
J.J. Aubert,21 A.M. Bencheikh, C. Benchouk, A. Bonissent,21 G. Bujosa, D. Calvet, J. Carr, C. Diaconu,
F. Etienne, N. Konstantinidis, P. Payre, D. Rousseau, M. Talby, A. Sadouki, M. Thulasidas, K. Trabelsi
Centre de Physique des Particules, Facult�e des Sciences de Luminy, IN2P3-CNRS, 13288 Marseille,France
M. Aleppo, F. Ragusa21
Dipartimento di Fisica, Universit�a di Milano e INFN Sezione di Milano, 20133 Milano, Italy
I. Abt, R. Assmann, C. Bauer, W. Blum, H. Dietl, F. Dydak,21 G. Ganis, C. Gotzhein, K. Jakobs,
H. Kroha, G. L�utjens, G. Lutz, W. M�anner, H.-G. Moser, R. Richter, A. Rosado-Schlosser, S. Schael,
R. Settles, H. Seywerd, R. St. Denis, W. Wiedenmann, G. Wolf
Max-Planck-Institut f�ur Physik, Werner-Heisenberg-Institut, 80805 M�unchen, Fed. Rep. of Germany16
J. Boucrot, O. Callot, A. Cordier, M. Davier, L. Du ot, J.-F. Grivaz, Ph. Heusse, M. Jacquet, D.W. Kim,19
F. Le Diberder, J. Lefran�cois, A.-M. Lutz, I. Nikolic, H.J. Park,19 I.C. Park,19 M.-H. Schune, S. Simion,
J.-J. Veillet, I. Videau
Laboratoire de l'Acc�el�erateur Lin�eaire, Universit�e de Paris-Sud, IN2P3-CNRS, 91405 Orsay Cedex,France
P. Azzurri, G. Bagliesi, G. Batignani, S. Bettarini, C. Bozzi, G. Calderini, M. Carpinelli, M.A. Ciocci,
V. Ciulli, R. Dell'Orso, R. Fantechi, I. Ferrante, L. Fo�a,1 F. Forti, A. Giassi, M.A. Giorgi, A. Gregorio,
F. Ligabue, A. Lusiani, P.S. Marrocchesi, A. Messineo, G. Rizzo, G. Sanguinetti, A. Sciab�a, P. Spagnolo,
J. Steinberger, R. Tenchini, G. Tonelli,26 C. Vannini, P.G. Verdini, J. Walsh
Dipartimento di Fisica dell'Universit�a, INFN Sezione di Pisa, e Scuola Normale Superiore, 56010 Pisa,Italy
G.A. Blair, L.M. Bryant, F. Cerutti, J.T. Chambers, Y. Gao, M.G. Green, T. Medcalf, P. Perrodo,
J.A. Strong, J.H. von Wimmersperg-Toeller
Department of Physics, Royal Holloway & Bedford New College, University of London, Surrey TW20OEX, United Kingdom10
D.R. Botterill, R.W. Cli�t, T.R. Edgecock, S. Haywood, P. Maley, P.R. Norton, J.C. Thompson,
A.E. Wright
Particle Physics Dept., Rutherford Appleton Laboratory, Chilton, Didcot, Oxon OX11 OQX, UnitedKingdom10
B. Bloch-Devaux, P. Colas, S. Emery, W. Kozanecki, E. Lan�con, M.C. Lemaire, E. Locci, B. Marx,
P. Perez, J. Rander, J.-F. Renardy, A. Roussarie, J.-P. Schuller, J. Schwindling, A. Trabelsi, B. Vallage
CEA, DAPNIA/Service de Physique des Particules, CE-Saclay, 91191 Gif-sur-Yvette Cedex, France17
S.N. Black, J.H. Dann, R.P. Johnson, H.Y. Kim, A.M. Litke, M.A. McNeil, G. Taylor
Institute for Particle Physics, University of California at Santa Cruz, Santa Cruz, CA 95064, USA22

C.N. Booth, R. Boswell, C.A.J. Brew, S. Cartwright, F. Combley, A. Koksal, M. Letho, W.M. Newton,
J. Reeve, L.F. Thompson
Department of Physics, University of She�eld, She�eld S3 7RH, United Kingdom10
A. B�ohrer, S. Brandt, V. B�uscher, G. Cowan, C. Grupen, G. Lutters, J. Minguet-Rodriguez, F. Rivera,25
P. Saraiva, L. Smolik, F. Stephan,
Fachbereich Physik, Universit�at Siegen, 57068 Siegen, Fed. Rep. of Germany16
M. Apollonio, L. Bosisio, R. Della Marina, G. Giannini, B. Gobbo, G. Musolino,
Dipartimento di Fisica, Universit�a di Trieste e INFN Sezione di Trieste, 34127 Trieste, Italy
J. Rothberg, S. Wasserbaech
Experimental Elementary Particle Physics, University of Washington, WA 98195 Seattle, U.S.A.
S.R. Armstrong, L. Bellantoni,30 P. Elmer, Z. Feng,31 D.P.S. Ferguson, Y.S. Gao,32 S. Gonz�alez,
J. Grahl, T.C. Greening, J.L. Harton,28 O.J. Hayes, H. Hu, P.A. McNamara III, J.M. Nachtman,
W. Orejudos, Y.B. Pan, Y. Saadi, M. Schmitt, I.J. Scott, V. Sharma,29 A.M. Walsh,33 Sau Lan Wu,
X. Wu, J.M. Yamartino, M. Zheng, G. Zobernig
Department of Physics, University of Wisconsin, Madison, WI 53706, USA11
1Now at CERN, 1211 Geneva 23, Switzerland.2Supported by Direcci�on General de Investigaci�on Cient�i�ca y T�ecnica, Spain.3Now at Dipartimento di Fisica, Universit�a di Lecce, 73100 Lecce, Italy.4Also Istituto di Fisica Generale, Universit�a di Torino, Torino, Italy.5Also Istituto di Cosmo-Geo�sica del C.N.R., Torino, Italy.6Supported by the Commission of the European Communities, contract ERBCHBICT941234.7Supported by CICYT, Spain.8Supported by the National Science Foundation of China.9Supported by the Danish Natural Science Research Council.10Supported by the UK Particle Physics and Astronomy Research Council.11Supported by the US Department of Energy, grant DE-FG0295-ER40896.12Also at Supercomputations Research Institute, Florida State University, Tallahassee, U.S.A.13Supported by the US Department of Energy, contract DE-FG05-92ER40742.14Supported by the US Department of Energy, contract DE-FC05-85ER250000.15Permanent address: Universitat de Barcelona, 08208 Barcelona, Spain.16Supported by the Bundesministerium f�ur Forschung und Technologie, Fed. Rep. of Germany.17Supported by the Direction des Sciences de la Mati�ere, C.E.A.18Supported by Fonds zur F�orderung der wissenschaftlichen Forschung, Austria.19Permanent address: Kangnung National University, Kangnung, Korea.20Now at DESY, Hamburg, Germany.21Also at CERN, 1211 Geneva 23, Switzerland.22Supported by the US Department of Energy, grant DE-FG03-92ER40689.23Now at Wayne State University, Detroit, MI 48202, USA.24Now at Max-Plank-Instit�ut f�ur Kernphysik, Heidelberg, Germany.25Partially supported by Colciencias, Colombia.26Also at Istituto di Matematica e Fisica, Universit�a di Sassari, Sassari, Italy.27Now at Schuster Laboratory, University of Manchester, Manchester M13 9PL, UK.28Now at Colorado State University, Fort Collins, CO 80523, USA.29Now at University of California at San Diego, La Jolla, CA 92093, USA.30Now at Fermi National Accelerator Laboratory, Batavia, IL 60510, USA.31Now at The Johns Hopkins University, Baltimore, MD 21218, U.S.A.32Now at Harvard University, Cambridge, MA 02138, U.S.A.33Now at Rutgers University, Piscataway, NJ 08855-0849, U.S.A.

1 Introduction
Measurements of the individual b hadron lifetimes represent a quantitative test of the
present understanding of b hadron decay dynamics, where non-spectator e�ects such
as Pauli interference and W -exchange may lead to di�erent lifetimes for the di�erent
b hadrons [1]. The individual lifetimes are also necessary inputs when determining other
quantities of interest in heavy avour physics, such as the B0Smixing parameter xS and
the CKM matrix element jVcbj. Measurement precision on the order of a few percent is
required because the predicted di�erences among the B meson lifetimes are approximately
5%.
This paper reports measurements of theB0andB� lifetimes obtained using theAleph
detector at LEP. Previous measurements of these lifetimes are reported in [2, 3]. Here,
three di�erent techniques, all based on the same general method, have been used, yielding
the most precise measurements to date. The decay length of each B candidate was
measured using the reconstructed interaction point and B decay vertex. These vertices
are reconstructed in three dimensions with good precision. Then, the distributions of
the individual proper times, calculated using the measured decay length, mass, andmomentum of each candidate, were �tted to extract the mean lifetime of the sample. Thethree analyses di�er in the method used to reconstruct theB decay vertex and momentum.
Fig. 1 shows a generic decay1 B0! D�+X� followed by D�+ ! D0�+
D. To reconstruct
D
π+D
B 0-πB
- l
0
-Interaction point or
Figure 1: Schematic representation of B decay topologies reconstructed with the threemethods described in this article.
such a candidate, the �rst analysis, which follows closely the method of [2], consideredthe semileptonic decay where X� was `��. With this technique, the D0 candidate wasfully reconstructed and combined with the pion candidate �+
Dand the lepton candidate
`� to identify the B meson candidate and determine its decay vertex. The B mesonmomentum was reconstructed using the charged track momenta and an estimate of theneutrino energy from the missing energy in the event. The second analysis used several
fully reconstructed hadronic decay modes. An example of such a decay B0! D�+��
B
is depicted in Fig. 1. Complete reconstruction of the B decay products allowed a directdetermination of its decay vertex and momentum. The technique employed in the third
analysis did not reconstruct the D0 meson, but relied only on the two pions ��Band �+
D
to identify the B candidate and to measure its momentum. The candidate decay lengthwas measured by using these two pions and the jet direction.
1Charge conjugate modes are implied throughout this paper.
1

2 The Aleph detector
The Aleph detector is described in detail elsewhere [4]. A high resolution vertex detector
(VDET) [5] consisting of two layers of silicon with double-sided readout provides precision
tracking near the interaction region. It provides measurements in the r� and z directions
at average radii of 6.5 cm and 11.3 cm, with approximately 12 �m precision. The VDET
provides full azimuthal coverage and polar angle coverage in the region j cos �j < 0:85
for the inner layer only and j cos �j < 0:69 for both layers. Outside the VDET particles
traverse the inner tracking chamber (ITC) and the time projection chamber (TPC). The
ITC is a cylindrical drift chamber with eight axial wire layers at radii between 16 and
26 cm. The TPC measures up to 21 space points per track at radii between 40 and
171 cm, and also provides up to 338 measurements of the speci�c energy loss (dE/dx)
of each charged track. A K=� separation of approximately 2� is achieved for charged
tracks with momenta greater than 3 GeV/c. The quantity �H (H = �, K, etc.), used
in the dE/dx selection criteria, is de�ned as the di�erence between the measured and
expected speci�c energy loss expressed in terms of standard deviations for the mass
hypothesis H. Studies on simulated events have shown that the criterion �K + �� < 1is more e�ective in selecting kaons and rejecting pions than a simple one-dimensionalrequirement on �K or ��. Tracking is performed in a 1.5 T magnetic �eld provided by a
superconducting solenoid. The combined tracking system yields a momentum resolutionof �(pT )=pT = 0:6� 10�3pT � 0:005 (pT in GeV/c) and the impact parameter resolutionis given by �(�) = 25 + 95=p �m (p in GeV/c) for both the r� and z projections [6].
The electromagnetic calorimeter (ECAL) is a lead/wire-chamber sandwich operatedin proportional mode. The calorimeter is read out in projective towers that subtendtypically 0:9� � 0:9� in solid angle and that are segmented in three longitudinal sections.The hadron calorimeter (HCAL) uses the iron return yoke as the absorber. Hadronic
showers are sampled by 23 planes of streamer tubes, with analog projective tower anddigital hit pattern readout. The HCAL is used in combination with two layers of muonchambers outside the magnet for muon identi�cation.
The data samples used correspond to approximately 3 million hadronic decays of theZ boson, collected in the period 1991{1994. The charged track selection, common to allthree analyses, required tracks to intersect an imaginary cylinder of radius 2 cm and half-length 4 cm centered on the nominal interaction point, have at least four TPC coordinates,
have polar angles � such that j cos �j < 0:95 and have momenta greater than 200 MeV/c.
3 Measurements using D(�)` combinations
The method based on D(�)` combinations is able to measure separately the B� and B0
lifetimes by exploiting the fact that B� and B0mesons can be selected with purities
between 70% and 80% by identifying events containing a D0-lepton pair (D0`�) or D�+-
lepton pair (D�+`�), respectively.
2

3.1 Candidate selection
The D�+`� and D0`� event samples consist of an identi�ed lepton (e or �) associated
with a D�+ or D0 candidate. The selection of muons and electrons is described in detail
in ref. [7]. For this analysis, lepton candidates were required to have momenta of at least
3 GeV/c. D�+ and D0 candidates were reconstructed from charged tracks that formed an
angle of less than 45� with the lepton candidate.
The D�+ candidates were identi�ed via the decay D�+ ! D0�+, followed by either
D0 ! K��+, D0 ! K��+���+ or D0 ! K��+�0. The di�erence in mass between
the D�+ and D0 candidates was required to lie within 1.5 MeV/c2 (approximately
two standard deviations of the experimental resolution) of the world average value of
145.6 MeV/c2 [8].
The three D�+`� subsamples su�er from varying amounts of background, so di�erent
selection criteria have been chosen for each channel. For the subsample where
D0 ! K��+, the momentum of the D0 was required to be greater than 5 GeV/c.
The other two D�+`� subsamples su�er from greater combinatorial background andtherefore more stringent selection criteria were applied. For the D0 ! K��+���+
channel, the D0 momentum had to be greater than 8 GeV/c. When dE/dx informationwas available for the K track (at least 50 wire measurements), it was required to satisfy�K+�� < 1 (Sect. 2). At least two of theD0 decay tracks had to have momentum greater
than 1 GeV/c. If, for a given detected lepton, more than one combination satis�ed theseselection criteria, the best combination was selected, based on the value of the �2 of theB vertex �t (discussed below).
For the D0 ! K��+�0 channel, �0's were reconstructed from pairs of photonsidenti�ed in ECAL. The momenta of the �0 candidates were corrected by performinga �t which constrained the candidate mass to the �0 mass. Neutral pion candidateswith momenta greater than 2 GeV/c were used to form D0 candidates. The momentaof the D0 candidates were required to be greater than 10 GeV/c, while the two charged
tracks in the decay were required to have at least 0.5 GeV/c of momentum. The samedE/dx criterion was applied to this channel as to the D0 ! K��+���+ channel above.Furthermore the decay kinematics were required to be consistent with at least one ofthree possible resonant �nal states, which nearly saturate the total K��+�0 rate: K��+,
K���+ or K�0�0. For each decay hypothesis the mass of the resonant particle and the
cosine of the helicity angle, de�ned as the angle between the scalar particle and one of thedecay products of the vector particle calculated in the rest frame of the vector particle,
were calculated. The helicity angle is distributed as cos2 �H for the resonant states listed
above. If the mass was within two standard deviations of the expected value (both the
natural widths of the resonances and the mass resolution were taken into account) and the
absolute value of the cosine of the helicity angle was greater than 0.4, the candidate wasconsidered consistent with the resonant decay hypothesis. In the case of more than one
D0 candidate per identi�ed lepton, the candidate with the measured value ofMD0� �MD0
that is closest to the expected mass di�erence was chosen. For this channel it was not
possible to use the B vertex �2 criterion, as in the D0! K��+���+ case, because here
multiple D0 candidates arise from more than one �0 candidate with the same charged
track pair. The B vertex �t �2 is nearly identical for such multiple candidates since itdepends almost entirely on the two charged tracks.
3

Table 1: Fitted D0 mass and width and number of D0 candidates and combinatorial
background events falling within two standard deviations of the �tted mass. The
uncertainties are statistical only.
Subsample Mass Width Signal Background
(MeV/c2) (MeV/c2) Events Events
D�+`� D0 ! K��+ 1863:7 � 0:7 7:9� 0:6 324 � 19 27 � 6
D0 ! K��+���+ 1862:6 � 0:7 6:5� 0:7 290 � 18 37 � 7
D0 ! K��+�0 1862:4 � 2:7 32:3� 2:5 251 � 17 38 � 11
D0`� D0 ! K��+ 1863:6 � 0:5 8:7� 0:5 672 � 29 111 � 26
The D0`� sample consists of events with a lepton and a D0 candidate, where the
D0 was not the decay product of a D�+. D0 candidates were identi�ed via the decayD0 ! K��+. For this sample, the powerful selection criterion involving the D�+-D0 massdi�erence was not applicable, making it necessary to apply stricter D0 selection criteria.The D0 candidates were required to have D0, kaon and pion candidate momenta greaterthan 8 GeV/c, 2 GeV/c and 1.5 GeV/c, respectively. Furthermore, both tracks were
required to have speci�c ionization compatible with the particular particle hypothesis.To reject D0 candidates coming from D�+ ! D0�+, a search for the additional pion wasperformed. If a pion candidate yielding a D�+-D0 mass di�erence within 1.5 MeV/c2
of the expected value was found, the D0`� candidate was rejected. The e�ciency forreconstructing the additional pion and rejecting D0's coming from D�+ decays was found
to be 84 � 3%.
To improve the signal to background ratio and to ensure well-measured decay lengths,additional selection criteria were placed on all the subsamples. The invariant mass of the
D(�)` (where D(�) can be D�+ or D0) system was required to be greater than 3 GeV/c2.To exploit the high precision of the silicon vertex detector, the lepton track and at leasttwo of the D0 decay product tracks were required to have at least one VDET hit in boththe r� and z projections. Also, the D and B decay vertices were reconstructed (as willbe discussed in Sect. 3.2) and the �2 probability for each vertex �t was required to be
greater than 1%.
The D0 candidate mass spectra for the four subsamples are shown in Fig. 2. The �tted
curves consist of a Gaussian for the signal plus a linear background. The �tted D0 mass
and the �tted number of signal and background events within a window of �2�, where �is the �tted width, around the �tted mass for the four subsamples are shown in Table 1.
3.2 B proper time reconstruction
Events reconstructed with a D0 mass within two standard deviations of the �ttedD0 mass
were selected for the lifetime analysis, resulting in 948 D�+`� and 778 D0`� candidates.
One event was removed from theD�+`� sample because it was also selected in the hadronic
decay analysis (Sect. 4). The proper time t was obtained from the measured decay lengthand B momentum and the nominal B mass.
4

Figure 2: The invariant mass of D0 candidates for the four subsamples: a) D�+`�,D0 ! K�, b) D�+`�, D0 ! K���, c) D�+`�, D0 ! K��0, d) D0`�, D0 ! K�.The smooth curves are results of the �t described in the text.
The decay length has been calculated by reconstructing the primary and B decayvertices in three dimensions. The primary vertex reconstruction algorithm [9], appliedto simulated bb events, yields an average resolution of 50�m � 10�m � 60�m (horizontal� vertical � beam direction). The B decay vertex was obtained by �rst reconstructing
the D0 decay vertex using its known decay tracks and then extrapolating the neutral D0
track backwards where it was combined with the lepton to form the B decay vertex. For
the D0 ! K��+�0 channel, the D0 vertex was constructed using only the charged tracks,
but the �0 momentum was included when extrapolating the neutral D0 track backwardsto form the B vertex. In the case of D�+`� events, the soft pion from the D�+ decaydoes not improve the resolution on the B decay length and was therefore not used in the
reconstruction of the B vertex.
An estimate of the B decay length was obtained by projecting the distance between
the primary and B decay vertices onto the direction de�ned by the D(�)` system. The
uncertainty on the ight direction due to the missing neutrino induces a negligible error
on the decay length. The resolution on the B decay length is typically 300 �m, comparedwith an average B decay length of approximately 2.5 mm. Monte Carlo studies showed
5

that the distribution of the decay length divided by its error (calcuated for each candidate)
is well parametrized by the sum of two Gaussian functions. The values of the parameters
that de�ne this resolution function, the two widths and the fractional area of the wider
Gaussian, were found to be 1:10 � 0:07, 2:76 � 0:35 and 0:16 � 0:05, respectively, where
the uncertainties are statistical.
The B momentum is reconstructed using an energy ow technique as described in [10].
The momentum resolution obtained using this technique depends on the selection criteria
and varies between 10% and 15%, depending on the decay channel.
3.3 B0and B� lifetime measurement
Both the D�+`� and D0`� samples contain a mixture of B0and B� decays and the
B�/B0mixture in the samples depends on the ratio of the lifetimes, as will be discussed
below. Therefore, to measure the B0and B� lifetimes a simultaneous unbinned maximum
likelihood �t to all the events was performed. The likelihood function contains three
components for each sample and is written as
L =ND�`Yi=1
hf��P(ti; �i; ��) + f�0P(ti; �i; �0) + f�BGP
�
BG(ti)i
�
ND0`Yi=1
hf0�P(ti; �i; ��) + f00P(ti; �i; �0) + f0BGP
0BG(ti)
i; (1)
where P(t; �; � ) is the probability function for the signal, consisting of an exponentialfunction convolved with momentum and decay length resolution functions. The
coe�cients f��and f�0 are the fractions of the D�+`� sample arising from B� and B
0
decays, respectively. Similarly, f0�and f00 are the fractions of the D0`� sample coming
from B� and B0decays. The coe�cients f�BG and f0BG are the background fractions
of the samples, while the functions P�
BG(t) and P0BG(t) are the normalised proper time
distributions of the background.
3.3.1 Signal composition
The composition of the signal (speci�ed by the coe�cients f��, f�0 , f
0�and f00 of Eq. 1)
must be calculated to complete the speci�cation of the likelihood function. The di�culty
in evaluating the signal composition arises from incomplete knowledge of the branching
ratios of certain decay modes that contribute to the two samples.
The B0and B� content of the two samples were calculated as follows. The relevant
semileptonic branching ratios for B0mesons were taken from measurements at the �(4S)
energy. Where measurements were incomplete, isospin conservation was applied, as well as
the constraint that the sum of the exclusive channels equals the inclusive B0semileptonic
branching ratio. The B� branching fractions were then obtained from
B(B� ! `�X) =��
�0B(B
0! `�X 0); (2)
which derives from the expectation that the partial semileptonic decay widths are equal.
The sample coe�cients were then calculated by considering the B0and B� decay channels
6

that contribute to the D�+`� and D0`� samples. As a consequence of this procedure, the
coe�cients f��, f�0 , f
0�and f00 appearing in the likelihood function (Eq. 1) depend on
the lifetime ratio. The full calculation, reported in the Appendix, shows that, for equal
lifetimes, 87�4% of the B decays in theD�+`� sample are attributed to B0, while 75�5%
of the D0`� sample B decays come from B�.
3.3.2 Backgrounds
Background contamination arises from the following sources:
(1) combinatorial background, i.e. candidates with a misidenti�ed D(�);
(2) the processesB ! D�
sD(�)X, followed byD�
s! `�X; andB ! D(�)����X, followed
by �� ! `����, give rise to a real D(�) and a real lepton;
(3) a real D(�) meson accompanied by a misidenti�ed hadron (fake lepton) or non-
prompt lepton, from Z ! bb or Z ! cc events.
Source (1) is the dominant background and its contribution is determined from a�t to the D0 mass distributions. Its magnitude is given in Table 1 for the various
subsamples. The proper time distribution for this source has been determined from thedata by selecting events from the upper sideband of the D0 peak. The same selectioncriteria described in Sect. 3.1 have been applied to the background samples, except thatthe requirement on the D�+{D0 mass di�erence in the case of the D�+`� events has beenremoved to increase the statistics. A function consisting of a Gaussian plus two positive
and two negative exponential tails was used to describe the temporal behaviour of thesedata.
The contribution from source (2) was calculated from the measured branching ratios
for these process [8, 11, 12] plus a Monte Carlo simulation to determine the detectione�ciency. This background accounts for 3{4% of the samples, depending on the channel.
The background from source (3) was estimated by considering wrong-sign (D�+`+ orD0`+) combinations and was found to contribute 3:0 � 1:5% to the samples. Simulatedevents were used to determine the proper time distribution for sources (2) and (3).
3.3.3 Fit results
An unbinned maximum likelihood �t to the proper time distributions of the D�+`� andD0`� events was performed to determine the two free parameters �0 and ��. The values
obtained are
�0 = 1:61 � 0:07 ps;
�� = 1:58 � 0:09 ps;
where the uncertainties are statistical only. The correlation coe�cient is �0:35. The ratioof the lifetimes is
���0
= 0:98 � 0:08;
taking into account the correlation between the lifetimes.
7

Figure 3: Proper time distributions with result of the �t overlaid for the two samples. a)D�+`� events; b) D0`� events; the dashed curves represent the background contributionto the �t, and the solid curves show the total �t. Not shown on the plots are a total ofthree candidates with measured proper times greater than 10 ps.
The proper time distributions of the two samples are shown in Fig. 3, with the results
of the �t overlaid.
As a check on the procedure, a measurement of the D0 lifetime has been performed.
The D0 ight distance is calculated as the distance between the B and D0 decay vertices,projected onto the D0 direction. An unbinned likelihood �t to the 1727 events yields
�D0 = 0:404 � 0:012 (stat) ps;
in agreement with the world average value �D0 = 0:415 � 0:004 ps [8].
3.3.4 Systematic uncertainties
Several sources of systematic uncertainty have been considered and are summarized in
Table 2.
The systematic uncertainty in the B momentum resolution comes mainly from the
uncertainty in the D�� content of semileptonic B decays. There is approximately a 2%
8

Table 2: Systematic uncertainties on the �tted lifetimes from the D(�)` analysis.
Source of uncertainty �0 (ps) �� (ps) ��=�0
B momentum reconstruction +0:030�0:027
+0:030�0:027 �0:010
Background treatment �0:025 �0:023 �0:014
Signal composition �0:013 �0:018 �0:015
Decay length resolution �0:010 �0:010 �0:010
D(�)�`�� relative e�ciency �0:008 �0:007 �0:008
Total +0:043�0:041
+0:044�0:042 �0:026
uncertainty on the B momentum resolution function [10].
Uncertainties in the background fractions and proper time distributions have beenconsidered. Di�erent background samples have been selected by varying the sidebandregions (for example, adding events from the lower sideband, which were excluded whendetermining the lifetime) and by using events with wrong-sign correlations. Additionally,an alternative parametrization of the proper time distributions (Gaussian plus one positive
and one negative exponential tail) was tried and the resulting di�erences in the �ttedlifetimes were taken as a systematic uncertainty.
The systematic uncertainty due to the signal composition was determined by varyingthe independent branching fractions within their uncertainties (Appendix). In principle,the �tted number ofD�+`� candidates could be overestimated due to the possible presenceof a real D0 combined with a random track such that the value of MD0� �MD0 fallswithin the signal region. The level of such an e�ect was found to be less than 1%
by considering the sidebands of the MD0� �MD0 distribution. The uncertainty on thelifetime measurement due to this e�ect is included.
Although the signal composition coe�cients are independent of the nominal
reconstruction e�ciencies, the relative e�ciencies
��� =�(B ! D(�)�`�)
�(B ! D(�)`�)
enter into the calculation and this uncertainty has been propagated to the systematic
uncertainty on the lifetimes. The values of ��� and their uncertainties are given in theAppendix.
The uncertainty due to the decay length resolution function was estimated by allowinga variation of its parameters consistent with their statistical error plus a systematic e�ect
due to uncertainties in the Monte Carlo model of the decay length resolution.
9

4 Measurements using fully reconstructed hadronic
decays
In the second method, the B� and B0candidates were fully reconstructed using some
of their hadronic decay modes B ! DX and B ! X (Table 3). This method leads
to the reconstruction of the B decay length with a resolution of about 200 �m and of
the B boost with a resolution better than 1%. The resolution on the boost is better
than that obtained on the momentum due to correlations between the reconstructed mass
and momentum of the B candidate. Moreover, the B� and B0samples are very well
separated. Nevertheless, the number of candidates which can be reconstructed with such
a method is small, due to the small branching fractions of hadronic decays and to their
low selection e�ciency.
Table 3: List of B decay channels and their sub-channels with the number of candidates
(D�+ decays to D0�+).
B �! DX D0 �! D+ �!
decay channels K��+ K��+�0 K��+�+�� K0S�+�� K��+�+
B� ! D0�� 16 13 35 1
B� ! D0a�1 (! �+����) 8 3
B0! D+�� 29
B0! D�+�� 14 13 19 2
B0! D�+��(! ���0) 0 10 2
B0! D�+a�1 (! �+����) 8 8 2
B �! X J= �! (2S) �!
decay channels e+e�, �+�� e+e�, �+�� J= �+��
B� ! K� 13 3 1
B� ! K��(! K0S��) 1 0
B0! K0
S3 1 0
B0! K
�0(! K��+) 10 0
4.1 Candidate selection
Electrons and muons with momenta greater than 1 GeV/c and 2.5 GeV/c, respectively,
were selected for this analysis. Charged kaon candidates were required to have momentagreater than 2 GeV/c and speci�c energy loss such that �K > �2:5 and �K + �� < 1.
For charged pion candidates j��j < 3 was required. Neutral kaons were reconstructed in
the decay mode K0S! �+��.
10

Table 4: Mass windows used for the D candidates, minimum values of pD, pX and XB
required (or range of values when di�erent criteria were applied for di�erent sub-channels),
and backgrounds rejected in the B ! DX channels selection.
B decay m�mD pD pX XB Rejection
(MeV/c2 ) (GeV/c) (GeV/c)
B� ! D0X� �15! �30 4! 9 6 0.7 D0 from D�+
B0! D+�� �25 8 6 0.65 D+
s, �+
c
B0! D�+X� �30 4 5 ! 9 0.5
To reconstruct the B ! DX channels, cuts were applied on the D candidate
momentum (pD), the X particle momentum (pX) and the B candidate energy
(XB = EB=Ebeam), as shown in Table 4. With the exception of the K��+ channel, the D0
�nal states were required to be consistent with the presence of a vector meson (� or K�).In particular, the D0 ! K0
S�+�� candidates had to be consistent with either K���+ or
K�+��. This requirement was necessary to distinguish betweenD0 andD0. The di�erence
in mass between the D�+ and D0 candidate was required to be within 2 MeV/c2 of theexpected value. Cuts were also applied on cos �� (�� is the angle between the D and B
meson ight directions in the B rest frame) for two channels: �0:7 < cos �� < 0:4 for
B� ! D0a�1 and cos �� > �0:5 for B0! D+��. Care was taken to reduce possible
contamination from other b hadrons. In particular, particle misidenti�cation can lead toD+sor �+
cbeing identi�ed as a D+. Therefore, D+ candidates consistent with D+
sor �+
c,
under appropriate particle mass assignments, were rejected. The mass windows used to
select the candidates were �100 MeV/c2 for decaying directly to two leptons and�200 MeV/c2 for (2S)! J= �+��. For this last channel the �+�� mass was requiredto be greater than 0.4 GeV/c2.
At least two tracks with vertex detector hits in both the r� and z views were requiredfor the D and X vertices. For the B ! DX decay vertex, one additional track fromthe X candidate had to have vertex detector hits. Each secondary vertex was requiredto have a probability greater than 0.5%. In events with more than one B candidate in
a mass window of � 1 GeV/c2 around the nominal B mass, only the candidate with thebest vertex probability was retained.
4.2 B� and B
0signal
The mass spectra of the candidates obtained after all selection cuts are shown in Fig. 4. A
total of 94 B� and 121 B0candidates were selected, within a mass window of �60 MeV/c2
around the B meson mass.
A fraction of the signal events (11:3�2:1%) were mis-reconstructed using particles from
fragmentation. These candidates have correct decay lengths but degraded measurement
of the boost, the boost resolution being about 1% for half of them and around 20%for the remaining half. These mis-reconstructed candidates can be separated into two
components. The �rst component (called corrupted signal) occurs when a soft pion
11

0
5
10
15
20
25
30
4.4 4.6 4.8 5 5.2 5.4 5.6 5.8 6 6.2
05
101520253035
4.4 4.6 4.8 5 5.2 5.4 5.6 5.8 6 6.2
Figure 4: a) Mass spectrum of the reconstructed B� candidates; b) the mass spectrum
for the B0candidates. Selected candidates are shaded. The peak near 5.1 GeV/c2 in
the B� mass spectrum is due mainly to B� ! D�0(! D0�0)X� and secondarily to
B0! D�+(! D0�+)X�, when the soft pion is not identi�ed.
from the B decay products goes undetected or when a low momentum neutral orcharged particle from fragmentation is included among the B candidate decay products.The e�ciency for this component does not depend on proper time. The proper timedistribution of such candidates found in a bb simulation was �tted with an exponential,yielding a lifetime in good agreement with the generated lifetime and so these candidates
were taken as signal in the �nal �t. The second component (called physical background)contains candidates which were reconstructed using one high momentum or a few charged
particles from fragmentation. These candidates can only be reconstructed if their decay
length is very short, allowing charged particles from the primary vertex to be associatedwith their decay vertex, leading to a selection e�ciency which decreases quickly at high
decay length. The proper time distribution of these candidates found in a bb simulationhas been �tted, yielding a lifetime of �phys = 0:31+0:13
�0:09 ps for this sample which represents
f�phys = 3:4% of the B� signal sample and f�phys = 5:6% of the B0signal sample. Separate
�ts of �phys to the distributions of B� and B
0samples give results in good agreement. This
small low-lifetime component was taken into account in the �nal �t. The selected samples
also contain a small contamination from other b hadrons which represents about 2% ofthe signal. This contamination was taken into account when evaluating the systematic
uncertainties. Finally, the samples selected contain combinatorial background candidates
originating from non-bb events with zero lifetime and a small component of combinatorial
background events with non-zero lifetime from cc events and bb events.
12

4.3 B0and B� lifetime measurements
The position of the B decay vertex was reconstructed in three dimensions. The decay
length was obtained by projecting the vector joining the interaction point and the B decay
vertex onto the B momentum vector. The proper time t of each candidate was calculated
from the reconstructed decay length, mass and momentum. The uncertainty on the proper
time was calculated for each candidate using the uncertainty on the reconstructed decay
length calculated event by event.
The proper time distribution of the combinatorial background was studied on the
data using three background samples. For the B ! DX channels, the wrong sign
candidates were selected as, for example, D�+X+, D+�+ or D0X+. For the B ! X
channels, wrong sign candidates were selected using \ "! `�`�. The second background
sample, containing the sideband candidates, was constructed using fakeD or candidates
extracted from their mass spectrum sidebands. The \wrong sign sideband" candidates,
constructed combining the previous two techniques, comprised the third background
sample. Candidates for all background samples were required to have a mass the B
sideband region, 5.4 GeV/c2 to 6.3 GeV/c2.
The calculated uncertainty on the decay length was checked on the background sample
(removing theB sideband requirement to increase the statistics) by �tting the distributionof decay length divided by its uncertainty with a function comprised of a Gaussian andan exponential. The width of the Gaussian part was found to be S = 1:27� 0:03, insteadof unity, as would be expected if the decay length uncertainty were accurately estimated.Therefore, the calculated decay length uncertainty of each candidate was corrected by
multiplying by the factor S.
The fraction of combinatorial background with non-zero lifetime (f ;D�comb
) and its
lifetime (�comb) were measured in the data using these three background samples,separately for the B ! DX and B ! X channels. The proper time distribution ofthe B ! X background candidates from the three background samples plus eventssatisfying the standard selection but falling above the B mass region was �tted with aGaussian centered at zero plus an exponential convolved with a Gaussian; the result ofthis �t is f
�comb= 50 � 11% and �comb = 0:72 � 0:03 ps. The proper time distribution of
the B ! DX background candidates from the three background samples was �tted withthe previous background proper time function. Using the value for �comb from B ! X
channels, the result of the �t is fD�comb
= 3:9 � 1:5%. Since this non-zero lifetime fraction
is so small, a �t with both �comb and fD�comb
free does not converge in this channel, andthus the same value of �comb was used for both channels.
The proper time distributions of the B� and B0samples were �tted separately by
maximizing a likelihood function simultaneously on the B ! DX and B ! X samples,
with two di�erent signal fractions fDsig and f
sig:
L(�B; fD
sig; f
sig) =Y
B!DX
P(t; �t; �B; fD
sig)�Y
B! X
P(t; �t; �B; f
sig);
with P(t; �t; �B; fsig) = fsigPsig(t; �t; �B) + fphysPphys(t; �t) + fcombPcomb(t; �t). The signal
proper time distribution Psig was an exponential convolved with a Gaussian. Thephysical background function Pphys was an exponential with a lifetime of �phys convolved
with a Gaussian and its fraction was de�ned as fphys =fsigf�phys
1�f�phys. The combinatorial
13

0
5
10
15
20
25
-4 -2 0 2 4 6 8 10 12 14
05
101520253035
-4 -2 0 2 4 6 8 10 12 14
Figure 5: Proper time distributions for a) the B� candidates, and b) the B0candidates.
The points represent the data, the solid line the result of the full �t and the dashed linethe background component of the �t.
background proper time distribution Pcomb was a Gaussian centered at zero plus anexponential convolved with a Gaussian with a lifetime of �comb and its fraction wasfcomb = 1 � fsig � fphys. Thus, there were only three free parameters in the �t: the
two signal fractions fDsig and f
sig, and the signal lifetime �B.
The �tted lifetime of the 94 B� candidates is
�� = 1:58+0:21�0:18 ps;
with fDsig = 83:9+4:8�5:5% and f sig = 87:6+12:4
�20:7%. For the 121 B0candidates, the �tted lifetime
is
�0 = 1:25+0:15�0:13 ps;
with fDsig = 78:0+5:1�5:5% and f sig = 93:5+6:5
�20:7%. The proper time distributions together with
the �t results are shown in Fig. 5. Fitting the two distributions simultaneously yields
���0
= 1:27+0:23�0:19:
4.4 Systematic uncertainties and checks
Systematic uncertainties from various sources were estimated and are summarized in Table
5.
It was mentioned in Sect. 4.2 that about 5% of the signal has a degraded boost
resolution (corrupted signal) and taking this e�ect into account decreases slightly the
14
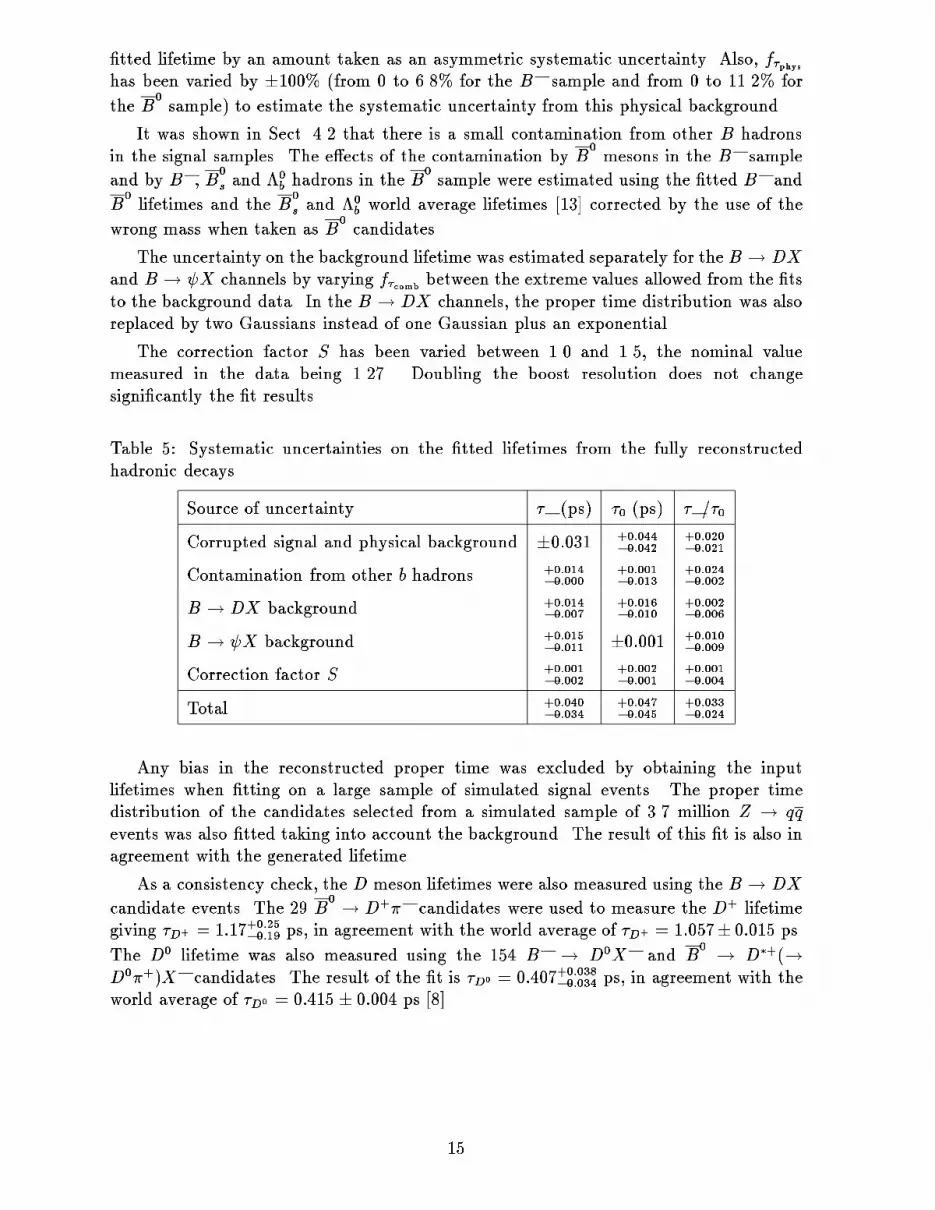
�tted lifetime by an amount taken as an asymmetric systematic uncertainty. Also, f�physhas been varied by �100% (from 0 to 6.8% for the B� sample and from 0 to 11.2% for
the B0sample) to estimate the systematic uncertainty from this physical background.
It was shown in Sect. 4.2 that there is a small contamination from other B hadrons
in the signal samples. The e�ects of the contamination by B0mesons in the B� sample
and by B�, B0
sand �0
bhadrons in the B
0sample were estimated using the �tted B� and
B0lifetimes and the B
0
sand �0
bworld average lifetimes [13] corrected by the use of the
wrong mass when taken as B0candidates.
The uncertainty on the background lifetime was estimated separately for the B ! DX
and B ! X channels by varying f�comb between the extreme values allowed from the �ts
to the background data. In the B ! DX channels, the proper time distribution was also
replaced by two Gaussians instead of one Gaussian plus an exponential.
The correction factor S has been varied between 1.0 and 1.5, the nominal value
measured in the data being 1.27. Doubling the boost resolution does not change
signi�cantly the �t results.
Table 5: Systematic uncertainties on the �tted lifetimes from the fully reconstructedhadronic decays.
Source of uncertainty �� (ps) �0 (ps) ��=�0
Corrupted signal and physical background �0:031 +0:044�0:042
+0:020�0:021
Contamination from other b hadrons +0:014�0:000
+0:001�0:013
+0:024�0:002
B ! DX background +0:014�0:007
+0:016�0:010
+0:002�0:006
B ! X background +0:015�0:011 �0:001 +0:010
�0:009
Correction factor S +0:001�0:002
+0:002�0:001
+0:001�0:004
Total +0:040�0:034
+0:047�0:045
+0:033�0:024
Any bias in the reconstructed proper time was excluded by obtaining the inputlifetimes when �tting on a large sample of simulated signal events. The proper time
distribution of the candidates selected from a simulated sample of 3.7 million Z ! qq
events was also �tted taking into account the background. The result of this �t is also inagreement with the generated lifetime.
As a consistency check, the D meson lifetimes were also measured using the B ! DX
candidate events. The 29 B0! D+�� candidates were used to measure the D+ lifetime
giving �D+ = 1:17+0:25�0:19 ps, in agreement with the world average of �D+ = 1:057� 0:015 ps.
The D0 lifetime was also measured using the 154 B� ! D0X� and B0! D�+(!
D0�+)X� candidates. The result of the �t is �D0 = 0:407+0:038�0:034 ps, in agreement with the
world average of �D0 = 0:415 � 0:004 ps [8].
15

5 Measurement using partially reconstructed
hadronic B0decays
To increase the reconstruction e�ciency for the hadronic B0decay modes
B0! ��
BX D�+
j! �+
DD0,
(3)
B0mesons were partially reconstructed by using the correlation between the ��
Band �+
D.
The D�+ momentum can be approximated from the �+Dmomentum alone with a precision
of about 15% due to the small momentum transfer in the D�+ decay. This is not su�cient
to distinguish between two body decays like B0! ��D�+ and B
0! ��D�+ with a
missing soft �0 from the �� decay. It does, however, allow an inclusive reconstruction of
decays of the type (3) if the system X has low energy. The problem of approximating
the B0three-momentum from the ��
Band �+
Dmomenta can be solved in the ��
B�+Drest
frame. Assuming a given XD0 mass the B0energy in this frame is
E�
B=M2
B+M2
�B�D�M2
XD0
2M�B�D
: (4)
The XD0 mass was set to MXD0 = 2:1 GeV=c2 to achieve the best momentum direction
resolution (12 mrad in the laboratory frame) for a mixture of B0! ��(��)D�+ decays,
the two decay modes for which the selection was optimized. For decays where the true
missing mass is close to this value, the B0 ight direction in the ��
B�+D
rest frame is
approximately the direction of the slow pion:
~p �
B�
q(E�
B)2 �M2
B�~p �
�D
j~p �
�Dj: (5)
The B0momentum in the laboratory frame is obtained after a transformation from the
��B�+Drest frame to the laboratory frame. The momentum resolution is 2 GeV/c for
B0! ��(��)D�+ decays and 8 GeV/c for the remaining decays contributing to the
signal.
The calculation of the B0momentum implicitly requires M�� < MB � MXD0 �
3:2 GeV=c2, while the kinematic limit for pions from reaction (3) is such that M�B�D
is less than 1.5 GeV/c2. Reconstructed B0mesons are identi�ed as an excess in the ��
B�+D
mass distribution below 1:5 GeV=c2.
5.1 Candidate selection
Oppositely charged pion pairs ��B�+D, consistent with coming from a common vertex within
3 standard deviations, were selected. The B0momentum ~pB was determined using the
technique described above. Selecting events with high B0momenta, 30 GeV=c < j~pBj <
45 GeV=c, and B0decay angles such that j cos ��
B;��
B
j < 0:8 suppressed background and
improved the determination of the B0 ight direction. Information from both the B
0
16

production and decay vertices as well as the reconstructed jet direction were used to
determine the quantity ~B (specifying both the B
0 ight direction and decay length).
The vector pointing from the primary vertex to the ��B�+Dvertex was combined with the
jet direction using a �2 minimization. Jets were reconstructed with the JADE cluster
algorithm [14] using ycut = 0:008, which gives the best approximation of the B0 ight
direction. The angular resolution obtained on ~B with this method is about 20 mrad.
The B0decay length ~B and the B
0momentum are independent measurements of the B
0
ight direction. The angle between ~B and ~pB was required to be less than 25 mrad. This
cut decreases the e�ciency slightly at small decay lengths, and this e�ect is taken into
account in the lifetime �t.
Background candidates from B� ! ����XD�+ decays were identi�ed and rejected.
These candidates were selected by requiring an additional �� coming from the secondary
��B�+Dvertex. The B� momentum can be approximated from equation (5), replacing
MXD0 with MD
0 and the two-pion mass with the three-pion mass in formula (4). The
angle between the B� momentum and the ight direction was required to be smaller than
20 mrad. Excluding these events rejected 60% of B� ! ����XD�+ decays while only
20% of the B0decays were lost.
The B0lifetime was measured from candidates with a proper decay time
1 ps < t =j~BjMB
j~pBj< 20 ps:
At small decay lengths, background from light quark production is dominant. Theresolution of the decay time is dominated by the uncertainty on the decay length. Theresolution function, which enters in the lifetime �t, can be described by a sum of three
Gaussians with widths of 260 �m, 780 �m and 4.9 mm, with relative fractions 0.71, 0.25and 0.04, respectively. In this analysis, the distortion of the exponential decay distributionis mainly due to the third Gaussian since the cut on the decay time at 1 ps corresponds
to a decay length of approximately 2 mm. The systematic uncertainty on the B0lifetime
was estimated by neglecting the third Gaussian (Table 7).
Fig. 6 shows the invariant ��B�+Dmass for the selected candidates. The lifetime was
determined from candidates in the mass region 1 GeV=c2 < M��
B�+D
< 1:5 GeV=c2. The
sample consists of events where the �+D
and ��B
originate from a B ! ��BXD�+ !
��BX(�+
DD0)D�+ decay and of combinatorial background.
� B0! ��
BX(�+
DD0)D�+ signal events:
The expected composition of the B0! ��
BXD�+ ! ��
BX(�+
DD0)D�+ sample in the
signal mass region 1 GeV=c2 < M��
B�+D
< 1:5 GeV=c2 is given in Table 6. Branching
ratios were taken from [15].
� B� ! ��BX(�+
DD0)D�+ background events:
The amount of background from B� ! ��BXD�+ decays was estimated from
a Monte Carlo simulation to be r� � B�=(B� +B0) = (8:3� 2:4)% (Table 6).
B� ! ��; ��D��0 decays were simulated with relative rates according to [16]
and normalized to the measured B� ! ����D�+ branching ratio [15]. Theratio r� can be determined as well from the number of rejected B� candidates
(r� = 3:2 � 5:6%). For the lifetime �t the ratio from the Monte Carlo simulation
17

0
10
20
30
40
50
60
70
0 0.5 1 1.5 2 2.5 3 3.5
Figure 6: ��B�+Dmass distributions. Shown are the data (with error bars) and the Monte
Carlo simulation (histograms). The contributions from light quark background (hatched),
bb background (dashed), B� ! ��BXD�+ (dotted) and the B
0! ��
BXD�+ signal (full)
are added.
was taken with a systematic uncertainty given by the di�erence of the two estimates:r� = (8:3� 2:4 � 5:1)%.
� Combinatorial background:
The shape of the combinatorial background was estimated from a Monte Carlosimulation. Fig. 6 shows the ��
B�+Dmass spectrum for this background in Monte
Carlo events. The background spectrum was normalized to the data in theregion M�� > 1:5 GeV=c2, where B ! ��
BXD�+ ! ��
BX�+
DD0 events cannot
contribute. The number of background events Nb = 94:0 � 9:6 was obtained froman extrapolation to the signal mass region, 1 GeV=c2 < M
��
B�+D
< 1:5 GeV=c2.
A background sample, consisting of three subsamples, was selected from data to
describe the combinatorial background time distribution. The �rst subsample was selected
from wrong charge combinations ��B��Dapplying the same selection criteria as for the
signal sample. The fact that slow pions are distributed isotropically around the jetaxis motivates the selection of the second subsample with opposite signed pions. The
momentum of the slow pion was �rst rotated around the jet axis ~p�D ! ~p 0
�Dso that the
momentum di�erence j~p�D � ~p 0
�Dj is 200 MeV=c with a maximal rotation angle of �90�.
Then the normal selection was applied. Real B ! ��BX(�+
DD0)D�+ decays do not pass
the cut on the angle between ~B and ~pB since the ~p�D rotation changes the reconstructedB momentum. The third subsample consists of wrong sign combinations with a rotation
of the slow pion.
18

Table 6: Expected number of events in the signal mass region, 1 GeV=c2 < M��
B�+
D
<
1:5 GeV=c2. A total of 275 events were observed in the data.
events expected
B0! �� D�+
�� D�+
�� D��; �� D��
other two body decays with a D�+
(�� �0)non-resonant D�+
(� �)non-resonant D�+
e� � D�+; �� � D�+
other three body decays with a D�+
four body decays with a D�+
57:3
44:5
7:2
3:2
18:9
6:3
9:5
13:3
3:1
9>>>>>>>>>>>>>>>>>>>>>>>>>>=>>>>>>>>>>>>>>>>>>>>>>>>>>;
163 � 17
B� ! �� D��
�� D��
other decays with a D�+
10:2
2:2
2:3
9>>>>>=>>>>>;
14:7+3:9�4:0
bb background 83:4 � 9:2
qq background 10:6 � 3:3
Sum 272 � 20
5.2 B0lifetime measurement
The lifetime was determined with a simultaneous unbinned maximum likelihood �t tothe signal and background samples. Six events included in the analysis with fully
reconstructed B0decays and one event reconstructed as a semileptonic B
0decay were
rejected. The likelihood function, which depends on eight �t parameters (�0, Ns, N�, Nb,
� e��, rb, �b1, �b2), can be written
L = exp(�1
2(Nb � hNbi)
2=�2Nb) exp(�
1
2(r� � hr�i)
2=�2r�
)
� exp(�1
2(�� � h��i)
2=�2��
) exp(�Ns �N� �Nb)
�
signal sampleYi
hNsPs(ti; �0) +N�P�(ti; �
e��) +NbPb(ti; rb; �b1; �b2)
i
�
backg: sampleYi
Pb(ti; rb; �b1; �b2);
where Ns, N� and Nb are the number of signal events, the number of B� ! ��BXD�+
background events and the amount of combinatorial background, respectively.
19

The time distribution for the B0signal events Ps is an exponential folded with the
momentum and decay length resolution functions, taking into account the momentum and
decay length dependent reconstruction e�ciency and the momentum distribution. The
resolution functions, e�ciency and momentum distribution were taken from simulated
events.
A normalized exponential with an e�ective lifetime � e��
was taken for the B� !
��BXD�+ background time distribution P�(t; �
e��).
The time distribution Pb for the combinatorial background was described by the sum
of two normalized exponentials with lifetimes �b1 and �b2 with relative contributions of rband (1� rb).
Three constraints are included in the likelihood function. The amount of combinatorial
background Nb was determined from the ��B�+Dmass spectrum to be hNbi = 94:0�9:6. The
ratio r� = N�=(Ns+N�) of B� ! ��
BXD�+ to B ! ��
BXD�+ events in the signal sample
was estimated to be hr�i = 8:3�5:6%. The e�ective B� lifetime of h� e��i = 1:04�0:17 ps
was obtained from a simulation using the world average B� lifetime �� = 1:617�0:046 ps
[13]. The uncertainty on � e��
is the statistical uncertainty from the simulation. The biasto a smaller e�ective B� lifetime is due to the rejection of B� decays, identi�ed with anadditional pion, which is more e�cient for long decay lengths.
Fig. 7 shows the proper time spectrum for the signal and background samples togetherwith the �t result. The lifetime was determined to be
�0 = 1:49 +0:17�0:15(stat)
+0:08�0:06(syst) ps:
The sources of systematic uncertainties are given in Table 7. The largest contribution
comes from the uncertainty on the background time distribution. The assumption that thebackground sample describes the real background in the signal sample has been checkedwith Monte Carlo events and was found to be valid within the statistical uncertainties.The corresponding systematic uncertainty is the statistical uncertainty from the MonteCarlo simulation.
Table 7: Systematic uncertainties on the �tted lifetime from the partially reconstructed
hadronic B0decays.
Source of uncertainty �0 (ps)
Background time distribution +0:057�0:044
E�ciency (MC statistics) +0:037�0:020
E�ciency (parametrization, signal composition) �0:019
Momentum and decay length resolution �0:024
Parametrization of P�(t) and Pb(t) �0:011
Fragmentation function (�b = 0:0032 � 0:0017) [17] +0:006�0:008
B� lifetime (�B� = 1:617 � 0:046 ps) �0:002
Total +0:076�0:059
20

1
10
10 2
10 3
0 5 10 15 20
1
10
10 210 310 4
0 5 10 15 20
fit region
Figure 7: Fit results for the signal and the background sample (inset). For the signalsample the dashed and dotted curves are the combinatorial background contribution andthe total background, including B� ! ��XD�+ decays, respectively.
6 Conclusions
The lifetimes of the B0and B� mesons have been measured with the Aleph detector at
LEP, using three di�erent methods. The method using D(�)` correlations yielded
�0 = 1:61� 0:07 � 0:04 ps;
�� = 1:58� 0:09 � 0:04 ps;���0
= 0:98� 0:08 � 0:03:
A second method, using fully reconstructed hadronic B0and B� decays, obtained
�0 = 1:25+0:15�0:13 � 0:05 ps;
�� = 1:58+0:21�0:18
+0:04�0:03 ps;
���0
= 1:27+0:23�0:19
+0:03�0:02:
Finally, a method that uses a partial reconstruction technique to identify B0! D�+��X
decays gave the result
�0 = 1:49+0:17�0:15
+0:08�0:06 ps:
Events that were selected by more than one analysis were retained only once, such that
the three measurements are statistically independent. A total of eight events were removed
in this way. Combined results were obtained by summing the log-likelihood functions of
the analyses. In this way the means and statistical uncertainties were obtained. The
di�erent nature of the analyses leads to independent systematic uncertainties, permitting
the use of a simple weighted average for the combined systematic uncertainties.
21

The combined results, which supersede previous Aleph measurements of the B0and
B� lifetimes [2], are
�0 = 1:55� 0:06 � 0:03 ps;
�� = 1:58� 0:09 � 0:03 ps;���0
= 1:03� 0:08 � 0:02:
These combined results represent the most precise measurements to date of the B0
and B� lifetimes and their ratio [2, 3]. They are consistent with theoretical expectations;
however, the current precision of the measurements does not yet probe lifetime di�erences
below the 5% level, which is the region of theoretical interest. The current precision
is su�cient for other purposes, for example in the extraction of jVcbj using the decay
B0! D�+`��` [18, 19].
7 Appendix - Determination of sample compositions
for the D(�)` analysis
Table 8 shows the six B0decay channels considered in the determination of the sample
composition coe�cients. Possible modes with two or more non-resonant pions in the �nal
state or with D�� decaying into D(�) plus two or more pions were assumed negligible. Thebranching ratios of the modes considered have been determined in the following way:
1. B1 and B2 have been taken from measurements at Cleo and Argus [8, 19, 20, 21].
2. It was assumed that the inclusive semileptonic branching ratio of B0mesons is given
by the sum of the exclusive channels considered,
B` � B(B0! `�X) =
6Xi=1
Bi:
This quantity has also been measured at Cleo and Argus [22].
3. The Aleph measurement [23] of
B(b! D�+��`��X) = (3:6 � 1:2) � 10�3
has been used to determine B�
4 . It has been assumed that this �nal state comes
from B� decays. Thus, dividing by the fraction of b quarks hadronizing into B�
(fd = 0:388 � 0:025 [18, 24]) one obtains
B�
4 = B(B� ! D�+��`��) = (9:3� 3:2)� 10�3:
4. In decays of the type B ! D(�)�`�, it was assumed that the D(�)� states are
produced with a �xed value of isospin, I = 1=2 (as is the case if the decay proceeds
via D��). Then isospin conservation implies
n �B4
B3
=B6
B5
= 2:
22

Table 8: B0semileptonic branching ratios for �0 = ��. The corresponding B� decay
channels are also listed. The uncertainties on B3{B6 are large and highly correlated and
are therefore not shown. Quantities with uncertainties shown are independent.
B0BR (%) Corresponding B� Decay
B1 = B(B0! D�+`��) = 4:50� 0:45 B�
1 = B(B� ! D�0`��)
B2 = B(B0! D+`��) = 1:9� 0:5 B�
2 = B(B� ! D0`��)
B3 = B(B0! D�+�0`��) = 0:49 B�
3 = B(B� ! D�0�0`��)
B4 = B(B0! D�0�+`��) = 0:93 B�
4 = B(B� ! D�+��`��) = 0:93 � 0:32
B5 = B(B0! D+�0`��) = 0:95 B�
5 = B(B� ! D0�0`��)
B6 = B(B0! D0�+`��) = 1:90 B�
6 = B(B� ! D+��`��)
B` = B(B0! `X) = 10:4� 1:1
Table 9: Contributions of B0and B� decays to the D�+`� and D0`� event samples.
D�+`� D0`�
B0
B�B1 + ���+B�B3 ��m(B�B1 + ���0 B�B3) + ���0 (B4 +B6)
B� ���0
h���+B�B4
i���0
[B1 +B2 + ���0 (B3 + B5) + ���0 ��mB�B4)]
These conditions along with Eq. 2 permit the calculation of all the necessary B0and
B� branching ratios. The uncertainties on these branching ratios are large and highlycorrelated and thus not very meaningful. The quantities B`, B1, B2 and B�
4 are the
independent quantities used to calculate the B0semileptonic branching fractions. They
have been varied independently for the evaluation of the systematic uncertainty on the�tted lifetimes.
The contributions to the D�+`� and D0`� samples were calculated using thesebranching ratios, the branching ratio for D�+ ! D0�+ (B� = 0:68 � 0:03 [8]), and
the relative e�ciency for detecting channels B3{B6 (���+ = 0:75 � 0:10 for D�+`� and���0 = 0:62� 0:10 for D0`�, determined using a Monte Carlo simulation). The probability
that a D�+`� event is mistakenly reconstructed as a D0`� event (��m = 0:16 � 0:03) was
also taken into account. Table 9 shows the B0and B� contributions to the D�+`� and
D0`� samples.
Acknowledgments
We thank our colleagues in the accelerator divisions for the continued good performance
of LEP. Thanks also to the many engineering and technical personnel at CERN and atthe home institutes for their contributions to the performance of the Aleph detector.
Those of us from non-member states thank CERN for its hospitality.
23

References
[1] I. Bigi et al., \Non-leptonic Decays of Beauty Hadrons - From Phenomenology to
Theory," (CERN-TH.7132/94) from the second edition of the book \B Decays",
S. Stone (ed.) World Scienti�c.
[2] D. Buskulic et al., (Aleph Collaboration), Phys. Lett. B307 (1993) 194.
[3] P. Abreu et al., (Delphi Collaboration), Z. Phys. C68 (1995) 13;
P. Abreu et al., (Delphi Collaboration), \Lifetimes of Charged and Neutral B
Hadrons Using Event Topology," CERN-PPE/95-59, submitted to Z. Phys. C;
R. Akers et al., (Opal Collaboration), Z. Phys. C67 (1995) 379;
F. Abe et al., (CDF Collaboration), Phys. Rev. Lett. 72 (1994) 3456.
[4] D. Decamp et al., (Aleph Collaboration), Nuc. Instr. Meth. A294 (1990) 121.
[5] G. Batignani et al., \Recent Results and Running Experience of the New Aleph
Vertex Detector", Conference Record of the 1991 IEEE Nuclear Science Symposium,November 2-9, 1991, Santa Fe, New Mexico, USA.
[6] D. Buskulic et al., (Aleph Collaboration), Nucl. Instr. Meth. A360 (1995) 481.
[7] D. Buskulic et al., (Aleph Collaboration), Nucl. Instr. Meth. A346 (1994) 461.
[8] Particle Data Group, Phys. Rev. D50 (1994) 1173.
[9] D. Buskulic et al., (Aleph Collaboration), Phys. Lett. B313 (1993) 535.
[10] D. Buskulic et al., (Aleph Collaboration), Phys. Lett. B357 (1995) 699.
[11] D. Bortoletto et al., (Cleo Collaboration), Phys. Rev. Lett. 64 (1990) 2117;H. Albrecht et al., (Argus Collaboration), Z. Phys. C54 (1992) 1.
[12] D. Buskulic et al., (Aleph Collaboration), Phys. Lett. B343 (1995) 444;M. Acciarri et al., (L3 Collaboration), Phys. Lett. B332 (1995) 201.
[13] H.-G. Moser, \LEP B-Lifetimes", to be published in the proceedings of the
International Europhysics Conference on High Energy Physics, July/August 1995,
Brussels, Belgium.
[14] S. Bethke et al., (Jade Collaboration), Phys. Lett. B213 (1988) 235.
[15] M.S. Alam et al., (Cleo Collaboration), Phys. Rev. D50 (1994) 43;
C. Bebek et al., (Cleo Collaboration), Phys. Rev. D36 (1987) 1289;
A.Albrecht et al., (Argus Collaboration), Z. Phys. C48 (1990) 543;
D. Bortoletto et al., (Cleo Collaboration), Phys. Rev. D45 (1992) 21.
[16] P. Colangelo, F. De Fazio, G. Nardulli, Phys. Lett. B303 (1993) 152. a1 and a2 were
set to 1:15 and 0:26, respectively.
[17] D. Buskulic et al., (Aleph Collaboration), Z. Phys. C62 (1994) 179.
[18] D. Buskulic et al., (Aleph Collaboration), Phys. Lett. B359 (1995) 236.
24

[19] B. Barish et al., (Cleo Collaboration), Phys. Rev. D51 (1995) 1014.
[20] H. Albrecht et al., (Argus Collaboration), Phys. Lett. B324 (1994) 249.
[21] H. Albrecht et al., (Argus Collaboration), Z. Phys. C57 (1993) 533.
[22] M. Athanas et al., (Cleo Collaboration), Phys. Rev. Lett. 73 (1994) 3503.
[23] D. Buskulic et al., (Aleph Collaboration), Phys. Lett. B345 (1994) 103.
[24] D. Buskulic et al., (Aleph Collaboration), Phys. Lett. B361 (1995) 221.
25


