Embed Size (px)
Citation preview

Tourism Expenditures of Taiwaneseand Slovenes: A ComparativeAnalysisnataša slak valek
I-Shou University, Taiwan
tai-chi wu
I-Shou University, Taiwan
Slovenia and Taiwan have many similarities. Both countries havea mountainous landscape, seaside, countryside and two majorbig cities. In 2011 the average annual income was 28,500 usd inTaiwan, but slightly higher in Slovenia at 29,500 usd. The aver-age monthly net earnings amounted to 1,328 usd in Slovenia and1,541 usd in Taiwan over the same period. Both countries areemerging tourism destinations; 6,087,484 arrivals were recordedon entry into Taiwan in 2011 compared to 3,218,000 tourist ar-rivals registered in tourist accommodation in Slovenia for the sameperiod. Based on the similarities between these countries the presentstudy was designed to compare expenditures of outbound touristsdeparting from Slovenia and Taiwan.
Key words: tourism population, economic comparison, tourismexpenditure, gdp, Taiwan roc, Slovenia
Introduction
The recent paper by Hung, Shang and Wang (2012, 495) starts withthe claim ‘It is essential to understand the determinants of tourismexpenditure since the revenue has become a major source of incomein many countries’ and finishes with the recommendation that ‘Fur-ther detailed investigation and a comparison of tourism expendituredeterminants among different countries are still needed.’ Followingfrom this recommendation the present study provides a compari-son between Slovenia and Taiwan that focuses on secondary datafor tourist behavior that is available for the two countries.
The choice of Slovenia and Taiwan was taken due to similaritiesbetween the two countries, not only in geographical characteristicsbut also on key economic statistics and demographic profiles. Slove-nia is one of the smallest European countries and Taiwan (Republicof China) is one of the smallest Asian countries. The size of terri-tory of Taiwan is approximately 36,000 square kilometers, but Slove-nian measures even less, which is 20,273 square kilometers. The ge-
management 8 (1): 21–35 21

Nataša Slak Valek and Tai-Chi Wu
ographic relief of both countries is similar; each has mountains, sea-side, countryside and two major cities. The average income of thepopulations are comparable; for income in Taiwan is 843,030 twd
(28,500 usd or 20,492 eur), according to 2011/2012 salary survey, onthe other hand average annual income in Slovenia is 21,830 eur
(29,500 usd), according to the same survey. According to the data ofthe Statistical office of the Republic of Slovenia (sors) the averagemonthly net earnings in Slovenia amounted to eur 987.39 (1,328.12usd) in 2011. For Taiwan the average monthly earnings in 2011 wastwd 45,642 (1,541.84 usd = 1,108.61 eur), according to data fromNational Statistics Taiwan roc. Interestingly, both countries are wellestablished as emerging tourism destinations. There were 6,087,484arrivals recorded in Taiwan in 2011 (9.3% more than in 2010), com-pared to 3,218,000 tourist arrivals registered in tourist accommoda-tion establishments in Slovenia (7% more than in 2010). The num-ber of foreign arrivals in Taiwan is 3,588,727, which represent anincrease of 10.9% comparing it with 2010, but 2,036,652 foreignersvisited Slovenia, which is an increase of 9.0% (sors 2010; TourismBureau 2010). Based on these similarities between the two countriesour interest focuses on the tourism differences. In other words thisinvestigation examines whether tourists from two economically sim-ilar countries but dramatically difference cultural backgrounds be-have differently in terms of their expenditure and behavior.
From the inbound tourism point of view both Taiwan and Slove-nia are emerging destinations, which attract more and more foreigntourists. In this context, both countries are using all their effort tobuild their image abroad and to be recognized as interesting destina-tions by foreign tourists. In fact, exporting tourism has a lot in com-mon with the country image. Over three decades ago Hunt (1975, 17),among others, was one of the first to demonstrate the importance ofthe country image in increasing the number of tourists visiting des-tinations, subsequently destination image has been the subject ofmuch attention in the related academic literature. Kim and Chung(1997, 386) argued that effects of country image arise from a cus-tomer’s beliefs that there is something ‘special’ about the labor, tech-nology, or manufacturing processes within a particular country. In-deed, attitudes are argued to be the most appropriate means to rep-resent understandings of place and its impact on decision-making.However, those economic factors that are known to influence coun-try image do not include all that a country has to offer to foreigntourists, such as natural and cultural resources. Beerli and Martin(2004, 681) stated that many professional and academic papers have
22 management · volume 8

Tourism Expenditures of Taiwanese and Slovenes
proposed a variety of scales that include the different attributes rel-evant to measuring perceived image, however these reveal a lack ofhomogeneity with respect to the attributes that define an individual’sperceptions. In addition, many studies forget to count economic fac-tors when analyzing a destination image. As Beerli and Marti (2004,681) have shown, two of the nine dimensions that influence a coun-try’s image are political and economic factors, which amongst others,include social factor such as the characterizes of the local residentsand their quality of life as well economic development of the coun-try. In other words, when marketing the tourism destination in a for-eign country those responsible should be aware of the uniqueness ofits own population and economic development since in part both ofthose factors contribute to a country’s image. Following from this, ourresearch purpose is based on the measurement of expenditures fortravel purpose – traveling within the country and abroad. Tourists,by virtue of their nationality show aspects of their country’s imageas well, mainly through their unique travel habits and their expen-diture on traveling.
The purpose of this study is to present comprehensive economicdata for tourists from Slovenia and Taiwan and to provide data nec-essary to understand both populations’ expenditure for tourism inthe international and domestic markets. Furthermore, the image ofa country established through the touristic experience is can beshown to have a positive effect on the export of products and services(Gnoth 2002, 270–271), which means that both countries, with theirhigh reputation of their respective populations and good tourismimage, can influence the export of products and services, includingtourism.
From a broad economic perspective, the importance of tourism forany country, on the other hand, influences the number of touristsand in consequence the impact of tourism. Different ‘formulas’ wereused in past to evaluate tourism impact and recently some authorshave proposed the tourism-led growth hypothesis (tlgh) which con-tends that international tourism is a strategic factor for long-runeconomic growth (Brida and Risso 2009, 179–80). The importanceof tourism for the economies is well recognized, but academics havemainly researched, evaluated and estimated tourism impact as aneconomic input for a country or tourism destination. In this view, theTourism Satellite Account (tsa) suggested by unwto in March 2000was recommended using a common methodology for measuring thecontribution of tourism in their economy. In this way, the compari-son of the tourism economy between different countries can be made
number 1 · spring 2013 23

Nataša Slak Valek and Tai-Chi Wu
and more significantly, tsa allows valid comparisons with other in-dustries, and even from country to country or between groups ofcountries (unwto 2011). It comprises a unique set of inter-relatedtables that show the size and distribution of the different forms oftourism consumption in a country and contributions to gross domes-tic product (gdp), national income, employment and other macroe-conomic measures of a national economy (Frechtling 2010, 151). tsa,with the standard international methodology and complete tablesthat allow a comparison were published in Slovenia from 2003 and in2007 in Taiwan. Next tsa for Slovenia are planned to be published atthe end of the year 2012 with the data for 2009 (all tables from 1–7).Using the data of tsa our research is not aimed at measuring the im-portance of tourism in Taiwan and Slovenia, but will focus on thoseresidents of Taiwan and Slovenia and their tourist behavior at thesame time, what is not possible to find in the tsa. Our special inter-est is being in comparing the tourist populations (traveling abroadand domestically) of two small but similar countries, one from Eu-rope and one from Asia.
The data presented shows the situation in 2010. However, not ev-eryone travelled for pleasure or business during a given year thatmeans that not every resident is necessarily a tourist. Even thoughtravel today is seen as an affordable commodity to be enjoyed by allwho choose to do so (Singh 1997, 95), part of population does nottravel due a variety of reasons. Pleasure travel propensity in the de-veloped world seems to be capped at about 75% of the adult popula-tion, which means that one in four adults does not take an overnightpleasure trip in any given year, (McKercher 2009, 510). While thepreponderance of the studies have focused on understanding themotives (Lo and Lee 2011; Ryan 2003; Slak-Valek et al. 2008) anddecision-making of tourists (Wong and Yeh 2009), there remainsmuch to explore to help us to better understand the motives of non-tourists. Caldow (1997) noted that the two primary reasons providedfor not having traveled were work commitments and a lack of money.Supporting that discussion, Paptheodorou, Rossello, and Xiao (2010,40) warned that the global tourism has been severely affected by thecurrent financial and economic downturn, which means that peo-ple will work even more for less money. This is a serious issue fortourism sector, since ‘more work, but less money’ is becoming theprimary reason for non-traveling. Although leisure constraints the-ory can be valuable in a travel and tourism context, it needs furtherexamination within the broader body of travel and tourism behaviorresearch (Gilbert and Hudson 2000, 921–2), which shows that the de-
24 management · volume 8

Tourism Expenditures of Taiwanese and Slovenes
sire to travel is still strong, but financial limitations and higher priceswill make people postpone their travel behavior. Thus, for a betterunderstanding of why people do not travel, a deeper understandingtourists’ behavior is needed first. Furthermore, for Slovenes that didnot travel in 2010, nearly half (44%) stated financial reasons as themain obstacle (sors 2010), hence our proposal that tourism expen-diture research is a first priority.
Many papers have been published analyzing tourism’s contri-bution to a country’s gdp. In this context, the expenditure of alltourists in a country is counted (both domestic and foreign). How-ever, tourists who travel abroad spend their travel budget in anothercountry, which makes only minor contributions to domestic gdp. Do-mestic travel, however, is very important (Nyaupane and Andereck2008, 433) especially in times of economic crisis. One would expectthe tourism population of a country would have attracted greaterinterest among academics. In this context, the present study is pre-pared. Our research focuses on the travel propensity and expendi-tures of Slovenes and Taiwanese tourism population. Gross travelpropensity equates to the total number of trips made by a popula-tion in a given period and is reported as the number of trips per 100head of population. It provides a useful indicator of travel intensity.The length of stay, as one of the effects of the tourism expenditureand the expenditure per gdp and trips made per capita were furtherresearched and compared. The objective of our study is to providean integrated view on the consequences and future perspectives ofTaiwanese and Slovene tourists.
Methodology and Data
The research methodology was based on quantitative survey datausing a comparison of two national tourism databases. Surveys fromSlovenia and Taiwan were used and the comparisons between themwere made in the context of residential tourism and travel. They in-vestigated travel habits of the all residents in these two countries.
The surveys were:
1. Survey of Tourism Travels of Domestic Population in 2010, thesample represents Slovenian residents.
2. Survey of travel by roc Citizens in 2010, the sample representsCitizens of Taiwan roc.
The Survey of Tourism Travels of Domestic Population is an an-nually survey prepared by Statistical Office of the Republic of Slove-nia (sors), with the aim of collecting data on travel behavior and
number 1 · spring 2013 25

Nataša Slak Valek and Tai-Chi Wu
attitudes of the Slovenian population: why, when, where, how longand how much they spend. In addition, the survey also determineswhy some people never leave their homes for the purpose of tourismtravel. The survey is carried out quarterly, but merged in one singlereport on the annual basis and is collected by a computer assistedtelephone survey (cati). The sampling frame is the directory of pri-vate telephone subscribers in Slovenia. The sample is selected bysystematic stratified approach. Strata are defined for the twelve sta-tistical regions and the type of urban/rural settlement within the re-gion (6 types). Amongst household members, the respondent is se-lected randomly using to the ‘first birthday method’ for those over15+ years old. For 2010, the initial sample size was 15,000, with anoverall response rate of 58.6%. The data are weighted according tothe sors recommendations. Besides this basic weighting, additionalweighting (calibration) is used, which adjusts the distribution of con-trol variables to the known population structure. For adjustment, thefollowing variables are used: sex, age, level of education, householdsize, statistical region and size of settlement. As the survey includesboth leisure and business travel activities the questionnaire is di-vided into two parts: with questions about business trips and ques-tions about private trips. For the present study, only informationfrom second part (private trips) was used. Data presented in thisstudy represent the results for the most recent survey year availablefrom sors (2010).
Survey of tourists by roc citizens is a research conducted byTourism Bureau of Taiwan with the objective of understanding citi-zens’ business and private travel activities, degree of satisfaction andamounts spent on different types of vacation expenses on each tripand to learn the mutual effects of domestic tourism and outboundtravels. It also provides estimates on domestic tourism expendituresand foreign exchange spent on overseas travel. The survey inter-views were also conducted by telephone (cati). A stratified randomsampling was used to select the sample. The population of this sur-vey includes all roc citizens who were 12 years or older in 2010.The total initial sample was divided into four panels; and a rota-tion scheme was instituted so that each respondent was interviewedonce every quarter for four consecutive quarters. However, sam-ple for each quarter is selected from four panels so that first panelwas interviewed the first time; second panel was interviewed thesecond time; third panel was interviewed the third time; and thefourth panel was interviewed the fourth time. The present studyalso uses data for travel behavior in 2010, the numbers of completed
26 management · volume 8

Tourism Expenditures of Taiwanese and Slovenes
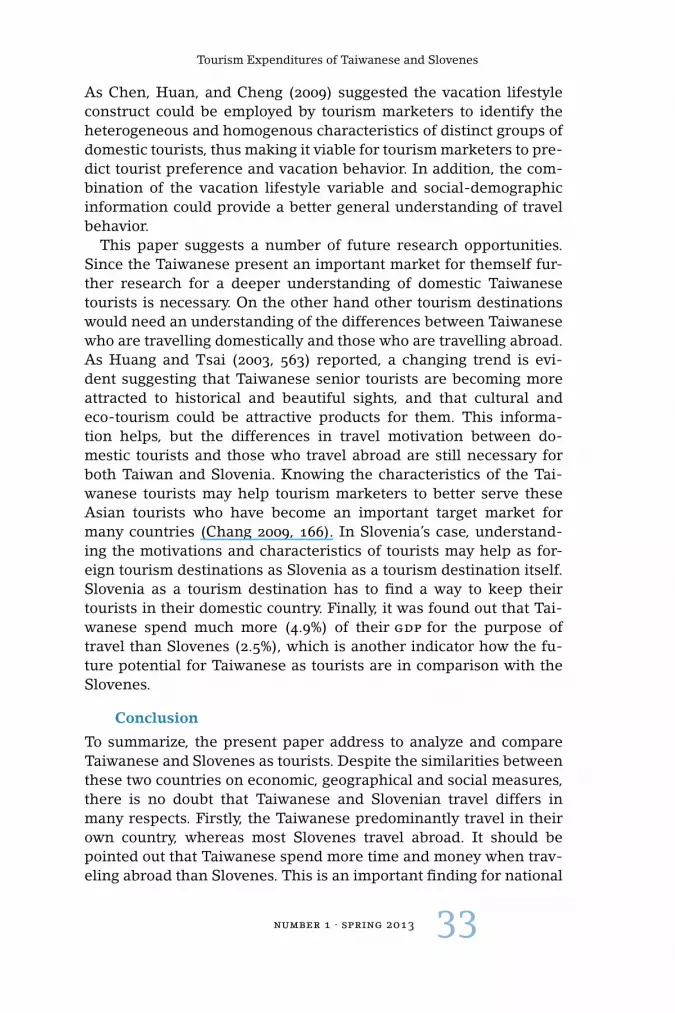
Abroad 7.1 %Domestic country 92.9 %
figure 1 Private trips made by Taiwanese in 2010(adapted from Tourism Bureau 2010)
Abroad 55.8 %Domestic country 44.2 %
figure 2 Private trips made by Slovenes in 2010(adapted from sors 2012)
domestic tourism interviews were as follows: first quarter 5,567 per-sons, second quarter 5,572 persons, third quarter 5,559 persons andfourth quarter 5,572 persons. The completed outbound interviewswere fewer: first quarter 380 persons, second quarter 414 persons,third quarter 471 persons and fourth quarter 401 persons (TourismBureau 2010).
Using the data from both these surveys the analyses of Slovenesand Taiwanese vacation expenditure in 2010 has been carried out.Economic data from the same period has been used when compar-ing the expenditure per capita and the percentage that travel expen-diture represents of the country’s gdp.
Results
In total, 1,026,000 Slovenes or 58% of the Slovenian population wenton tourism trips in 2010, of which 44% were private trips made inSlovenia and 56% were abroad. On the other hand, we find 93%of Taiwanese travelled within their country in 2010 and 7% of Tai-wanese undertook outbound travel in 2010. Taiwanese clearly travelmore in their own country than Slovenes do (see figure 1 and figure2.)
In addition, length of travel made by Slovenian and Taiwanesein own country and abroad in 2010 shows some large differencesbetween average number of nights per trip made when travelingabroad; Taiwanese, on average made 9.3 nights per trip in a foreigncountry, but Slovenes stayed only 5.6 nights. In contrast, trips madeby Slovenes domestically are considerably longer than those madeby Taiwanese. The results are shown in the table 1.
Analysis of daily average expenditure data showed that Slovenesspend 38 Euro per person and Taiwanese tourist spends the equiva-lent to 33 Euro while traveling domestically. Greater differences arenoted comparing the expenditure when traveling abroad; Taiwanese
number 1 · spring 2013 27

Nataša Slak Valek and Tai-Chi Wu
table 1 Average number of nights per trip made by Taiwanese and Slovenesin 2010
Average number of nights per trip Slovenes Taiwanese
Domestic 2.9 1.5
Outbound 5.6 9.3
notes Adapted from Tourism Bureau (2010) and sors (2010).
table 2 Average daily expenditure per person in Euro in 2010
Average daily expenditure per person (C) Slovenes Taiwanese
Domestic 37.8 33.2
Outbound 50.7 128.5
notes Adapted from Tourism Bureau (2010) and sors (2010).
spend more than twice than Slovenes do. In fact, the results showsTaiwanese spend 128 Euros per person compared to only 51 Eurosby Slovenes.
Expanding our interest on to expenditures per trip one sees thatmultiplication of an average length of stay (number of nights pertrip) and the average daily expenditure per person can be made. Theresults for both Taiwanese and Slovenes in Euro are shown below(see table 3). Taiwanese tourists spend almost 1,200 Euro per tripabroad, but only around 50 Euro per trip in Taiwan, or 24 times lessthan the expenditure for the average outbound trip. The results be-comes even more interesting when looking at the expenditure of aSlovenian tourist who spends 110 Euro per trip made in Slovenia,but more than twice as much when travelling abroad (284 Euro).These large differences between Slovenes and Taiwanese suggestsome major factors are affecting travel behavior between the respec-tive populations.
Based on the data on per trip expenditure the total Slovenes andTaiwanese trips expenditures can also be calculated. For getting thisdata, the multiplication of average expenditure per person per tripand the total number of trips provides a gross measure of expen-diture. It was found out that Slovenes gross trip expenditure in to-tal is 878.5 million Euros, compared to Taiwanese who spend more
table 3 Average expenditure per person per trip in euro in 2010
Average expenditure per person per trip (C) Slovenes Taiwanese
Domestic 109.7 49.4
Outbound 284.0 1,194
notes Adapted from Tourism Bureau (2010) and sors (2010).
28 management · volume 8

Tourism Expenditures of Taiwanese and Slovenes
table 4 Total expenditure on travel made by Slovenes and Taiwanese in 2010
Total expenditure on travels (C) Slovenes Taiwanese
Domestic travel 205,755,000 6,122,487,800
Outbound travel 672,739,144 11,241,598,356
Total 878,494,144 17,364,086,156
notes Adapted from Tourism Bureau (2010) and sors (2010).
table 5 Number of Taiwanese and Slovenes trips per capita in 2010
Number of trips per capita Slovenes Taiwanese
Domestic travel 0.9 5.3
Outbound travel 1.1 0.4
notes Adapted from Tourism Bureau (2010) and sors (2010).
than twice as much, at 17,364 million Euros. Both, Slovenian andTaiwanese populations, spend more for outbound trips than for do-mestic trips as shown in the results in table 4.
From the calculation of the trip expenditures in this study, it ispossible to estimate data about the number of trips made per capitain 2010, for both tourist populations (Taiwanese tourists and Slovenetourists). The number of all trips made by Slovenes and Taiwanesewere divided by the number of residents for each country separately.Doing that, the results show Taiwanese made 5.3 trips per capita do-mestically while Slovenes made only 0.9 trips while traveling in theirown country. On the other hand the outbound trips shows oppositeresults, but with some minor differences; Slovenes traveling abroadmake 1.15 trip per person, but Taiwanese make only 0.41 outboundtrips per person on average. These results are shown in the table 5.
Finally, proportion that expenditure on tourist travel (both domes-tic and outbound) represents of total country Gross Domestic Prod-uct (in continuing: gdp) in Slovenia and Taiwan was analyzed. Usingthe data in table 4 the total expenditure of Slovene and Taiwanesetourists has been divided by the gdp in 2010 for each country to cal-culate the percentages shown in table 6.
It is noted that total travel expenditure (counting all private tripsmade by those who travelled in 2010) represents 2.5% of Slovenia’s
table 6 Total expenditure on travel as a percentage of gdp
Travel Expenditure/gdp Slovenia Taiwan
Total trips 2.5% 4.9%
Outbound trips 1.9% 3.2%
notes Adapted from Tourism Bureau (2010) and sors (2010).
number 1 · spring 2013 29

Nataša Slak Valek and Tai-Chi Wu
and 4.9% of Taiwan’s gdp. This means Taiwanese spend two timesmore than Slovenes when allowing for differences in gdp. Whentraveling abroad Slovenes expenditure represent 1.9% of the coun-try’s gdp, compared to Taiwanese outbound travel expenditure thatrepresents 3.2% of Taiwanese gdp. But domestic travel is a greaterproportion for Taiwan compared to Slovenia. As this much of thisexpenditure is made in overseas countries the effect on the econ-omy through balance of trade figures is significantly more for Taiwanthan Slovenia.
Interpretation and Implication
Based on the results presented here the differences in travel behav-ior between Taiwanese and Slovenes are significant. Without doubt,Taiwanese travel more than Slovenes; only 6% of Taiwanese did nottake any domestic travel compared almost half of Slovenes who didnot take any trips in 2010 although the remainder, who travelled,typically made a trip abroad.
The explanation for this is partly in the geographical and culturalmakeup of the two countries. Taiwan is a small island, with lim-ited resources and isolated geographical location (Chang 2009 165),and due to its contentious political history is not recognized by theun as a sovereign and independent country, which is possibly oneof the main reasons that Taiwanese do not travel abroad. However,many other reasons could be suggested which stem from the uniqueTaiwanese history and culture. The history of Taiwan is a story ofboth frustration and miracles. Until the early years of seventeenthcentury, aboriginals and some limited number of Chinese migrantsfrom mainland China populated the island (Rubinstein 2007). Por-tuguese (who named it Ilhas Formosas – Beautiful Island), Spanish,Dutch, Chinese and Japanese, who colonized Taiwan, each had aninfluence on Taiwan’s development. In 1979, Taiwan’s governmentrelaxed its ban on overseas travel, and by 1987 even permitted resi-dents to travel to mainland China for the purpose of visiting relatives(Huang et al. 1996, 223). Consequential, Taiwanese started to travelabroad in numbers only just recently, which explain a relatively lowshare of Taiwanese who travel abroad today. Further growth in out-bound travel remains constrained by the uneasy political relation-ships with mainland China, as well as the relatively small size of thepopulation in terms of generating increased demand (Bailey 1996).However, travel is an increasingly important aspiration for youngTaiwanese. Work and travel overseas combines three fundamentalelements: traveling, learning, and experiencing (Lin, Lee, and Wang
30 management · volume 8

Tourism Expenditures of Taiwanese and Slovenes
2012). It not only offers the Taiwanese some leisure and vacation, buttraveling abroad can ‘improve their language skills, expand their in-ternational viewpoints and experience different cultures’ (Lin, Lee,and Wang 2012). With more and more residents traveling abroadpeople expand their horizons and develop new ideas that may con-tribute to a country’s development. With increased exposure to in-ternational information, the opportunities to form organized men-tal representations of countries are frequent (d’Astous and Boujbel2007). Consequential, Taiwan’s outbound market still has plenty ofgrowth potential and its economic prospects look good (Bailey 1996).
Slovenes travel abroad more frequently than they do in their owncountry. Although Slovenia has a complicate history, too, the devel-opment of outbound travel of Slovenes was faster than Taiwanese.Slovenia was part of a former Yugoslavia and gained its indepen-dence in 1991. From that moment on, although there are still dif-ficulties (Bokros 2002), Slovenia has developed dramatically and ismodernizing at a fast pace. Here, traveling abroad could be eithera reason or a result. However, it cannot be ignored that Slovenesmainly travel to Croatia, a neighbor country to Slovenia and a for-mer Yugoslavian country as well, which is now independent. It is acountry with strong inbound tourism potential with a fairly well rec-ognized and beautiful coastline. Although Slovenian has a uniquecoastline of 46 km and many Slovenes still travel to Croatia for theirsummer vacation, which is now counted as travel abroad. Of course,it has to be pointed out, that traveling abroad is easier and faster forSlovenes than for Taiwanese for many reasons, but most important isthat Taiwan is an island. Travelling abroad from Slovenia is possibleby land transport (car, train, bus).
Perhaps as a logical consequence of these geographical issues itwas found that Taiwanese travel abroad for a relatively long trip (9.3nights in average), whereas Slovenes travel abroad for 5.6 nights onaverage. In contrast, Slovenes trips in domestically are longer (2.9nights) than Taiwanese (1.5 nights). The reason for the length ofstay differences may be found in the reason and purpose given fortraveling. People who traveled abroad easily define the purpose fortraveling and travel with the active content (activity, shopping, etc.)is usually longer, since people are doing exactly what they like (pushmotivation). Ryan (2003) also affirms that there is a link betweenincome and motivation for traveling; when material needs are satis-fied, experiential needs become important. Residents from Taiwanand Slovenia at the beginning of the ‘independent’ period neededto establish their normal life, but nowadays they can afford to fi-
number 1 · spring 2013 31

Nataša Slak Valek and Tai-Chi Wu
nance themselves for relatively long trip abroad. Continuing withthat theme our findings shows that both Taiwanese and Sloveneshave a relatively low budget when traveling in their own country(33.2 and 37.8 eur per person per day), but an extreme different po-sition is noted in the budget Taiwanese (1,194 eur per trip per per-son) and Slovenes (284 eur per trip per person) allow when trav-eling abroad. Because of long period of isolation is understandablethat Taiwanese afford longer trips to themselves when travel abroad.On the other hand being isolated has allowed the potential touriststo get older and hence accumulate more money for the future gen-erations. In the 1979 there were only 312,446 outbound departuresof Taiwanese, in 1994 this number increase to 4.7 million (Huang,Yung, and Huang 1996, 225), but in 2010 we find 9.4 million of tripsmade by Taiwanese abroad and has the potential to grow much more(Bailey 1996). As a result of Taiwan’s rapid economic growth and theincreasing amounts of disposable personal income (Huang, Yung,and Huang 1996, 223) the number of Taiwanese traveling abroad isincreasing dramatically. Even if the average expenditure per trip of aTaiwanese were to remain at the same level as it was in 2010 (it prob-ably that is actually growing) then the number of Taiwanese tripsabroad will continue to increase, which makes obvious how impor-tant the Taiwanese are as a tourism market.
It is the opposite situation when we consider Slovenia. Slove-nia is a small market with an average expenditure for trips madeabroad that is four times less, when looking at expenditure per per-son, than Taiwan. The results of Novakovic (2009) study revealsthat real Slovenian outbound tourism expenditures have not ex-ceeded growth in real gdp in the period 1995–2005. Although muchhigher percentage of Slovenian residents travelled abroad (55.8%)economic comparison between Taiwanese residents and Slovenesshows higher average annual income for the Taiwanese populationas well as higher potential. This is an important finding for tourismdestinations that are trying to attract tourists (especially those fromsmall countries); and deciding which marketing campaign will besuccessful, Taiwan or Slovenia, the answer is clear.
Taking into the consideration the number of residents in eachcountry a greater number of trips per capita was for the Taiwanesewhose travel in their home country (5.3), is greater than Slovenes(1.9%). Our conclusion is that Taiwanese probably travel mainly bythe weekends, taking short trips between the major cities on theisland. This could be also related to what some call ‘a Taiwaneselifestyle’, since they do not treat this local travel as serious travel.
32 management · volume 8
Tourism Expenditures of Taiwanese and Slovenes
As Chen, Huan, and Cheng (2009) suggested the vacation lifestyleconstruct could be employed by tourism marketers to identify theheterogeneous and homogenous characteristics of distinct groups ofdomestic tourists, thus making it viable for tourism marketers to pre-dict tourist preference and vacation behavior. In addition, the com-bination of the vacation lifestyle variable and social-demographicinformation could provide a better general understanding of travelbehavior.
This paper suggests a number of future research opportunities.Since the Taiwanese present an important market for themself fur-ther research for a deeper understanding of domestic Taiwanesetourists is necessary. On the other hand other tourism destinationswould need an understanding of the differences between Taiwanesewho are travelling domestically and those who are travelling abroad.As Huang and Tsai (2003, 563) reported, a changing trend is evi-dent suggesting that Taiwanese senior tourists are becoming moreattracted to historical and beautiful sights, and that cultural andeco-tourism could be attractive products for them. This informa-tion helps, but the differences in travel motivation between do-mestic tourists and those who travel abroad are still necessary forboth Taiwan and Slovenia. Knowing the characteristics of the Tai-wanese tourists may help tourism marketers to better serve theseAsian tourists who have become an important target market formany countries (Chang 2009, 166). In Slovenia’s case, understand-ing the motivations and characteristics of tourists may help as for-eign tourism destinations as Slovenia as a tourism destination itself.Slovenia as a tourism destination has to find a way to keep theirtourists in their domestic country. Finally, it was found out that Tai-wanese spend much more (4.9%) of their gdp for the purpose oftravel than Slovenes (2.5%), which is another indicator how the fu-ture potential for Taiwanese as tourists are in comparison with theSlovenes.
Conclusion
To summarize, the present paper address to analyze and compareTaiwanese and Slovenes as tourists. Despite the similarities betweenthese two countries on economic, geographical and social measures,there is no doubt that Taiwanese and Slovenian travel differs inmany respects. Firstly, the Taiwanese predominantly travel in theirown country, whereas most Slovenes travel abroad. It should bepointed out that Taiwanese spend more time and money when trav-eling abroad than Slovenes. This is an important finding for national
number 1 · spring 2013 33

Nataša Slak Valek and Tai-Chi Wu
tourism promoters, which are trying to attract tourists (from smallcountries); or perhaps deciding between a marketing campaign inTaiwan or in Slovenia. However, in the conclusion of the presentstudy has also demonstrated that much more literature about Tai-wan and Taiwanese outbound tourism can be found and researchliterature about Slovenian outbound tourism remains scarce. This,to some degree, confirms our conclusion that Slovenes are not aninteresting target group or market, when researching potential foroutbound tourism. Taking into consideration the results of this re-search future research on Slovenes traveling abroad is strongly en-couraged where comparisons should be made with countries that areof similar size and economic activity.
References
Bailey, M. 1996. ‘Taiwan Outbound.’ Travel and Tourism Analyst 3:20–43.Bokros, L. 2002. ‘Experience and Perspectives of Financial Sector De-
velopment in Central and Eastern Europe.’ In Completing Transition:The Main Challenges, edited by G. Tumpel-Gugerell et al., 108–12.Berlin: Springer.
Beerli, A., and J. D. Martin. 2004. ‘Factors Influencing Destination Im-age.’ Annals of Tourism Research 31 (3): 657–81,
Brida, J. G., and W. A. Risso. 2009. ‘Tourism as a Factor of Long-RunEconomic Growth: An Empirical Analysis for Chile.’ European Jour-nal of Tourism Research 2 (2): 178–85.
Caldow, D. 1997. ‘Non-Participation: The Other Side of Motivation: AnExploration.’ Paper presented at the Australian Tourism and Hospi-tality Research Conference, Sydney, 6–9 July.
Chang, J. C. 2009. ‘Taiwanese Tourists’ Perceptions of Service Quality onOutbound Guided Package Tours: A Qualitative Examination of theservqual Dimensions.’ Journal of Vacation Marketing 15 (2): 165–78.
Chen, J. S., Y. C. Huang, and J. S. Cheng. 2009. ‘Vacation Lifestyle andTravel Behaviors.’ Journal of Travel & Tourism Marketing 26 (5–6):494–506.
d’Astous, A., and L. Boujbel. 2007. ‘Positioning Countries on Person-ality Dimensions: Scale Development and Implications for CountryMarketing.’ Journal of Business Research 60 (3): 231–39
Frechtling, D. C. 2010. ‘The Tourism Satellite Account: A primer.’ Annalsof Tourism Research 37 (1): 136–53.
Gilbert, D., and S. Hudson. 2000. ‘Tourism Demand Constraints: A Ski-ing Participation.’ Annals of Tourism Research 27 (4): 906–25.
Gnoth, J. 2002. ‘Leveraging Export Brands Through a Tourism Destina-tion Brand.’ Journal of Brand Management 9 (4): 262–80.
Huang, C. T., C. Y. Yung, and J. H. Huang. 1996. ‘Trends in OutboundTourism from Taiwan.’ Tourism Management 17 (3): 223–28.
34 management · volume 8

Tourism Expenditures of Taiwanese and Slovenes
Huang, L., and H. Tsai. 2003. ‘The Study of Senior Traveler Behavior inTaiwan.’ Tourism Management 24 (5): 561–74.
Hung, W. T., J. K. Shang, and F. C. Wang. 2012. ‘Another Look at theDeterminants of Tourism Expenditure.’ Annals of Tourism Research39 (1): 495–598.
Hunt, J. 1975. ‘Image as a Factor in Tourism Development.’ Journal ofTravel Research 13 (3): 1–17.
Kim, C. K., and J. Y. Chung. 1997. ‘Brand Popularity, Country Image andMarket Share: An Empirical Study.’ Journal of International BusinessStudies 28 (2): 361–86.
Lin, Y. H., Y. C. Lee, and S. C. Wang. 2012. ‘Analysis of Motivation, TravelRisk, and Travel Satisfaction of Taiwan Undergraduates on Workand Travel Overseas Programs: Developing Measurement Scales.’Tourism Management Perspectives 2 (3): 35–46
Lo, A. S., and Y. S. C. Lee. 2011. ‘Motivations and Perceived Value ofVolunteer Tourists from Hong Kong.’ Tourism Management 32 (2):326–34.
McKercher, B. 2009. ‘Non-travel by Hong Kong Residents.’ InternationalJournal of Tourism Research 11 (6): 507–19.
Novakovic, S. 2009. ‘Analysis of Slovenian Outbound Tourism Expendi-tures in the Period 1995–2005.’ Academica Turistica 2 (1–2): 63–9.
Nyaupane, G. P., and K. L. Anderec. 2008. ‘Understanding Travel Con-straints: Application and Extension of a Leisure Constraints Model.’Journal of Travel Research 46 (4): 433–9.
Paptheodorou, A., J. Rossello, and H. Xiao. 2010. ‘Global Economic Cri-sis and Tourism: Consequences and Perspectives.’ Journal of TravelResearch 49 (1): 39–45.
Rubinstein, M. A. 2007. ‘Taiwan: A New History.’ Armonk, ny: Sharpe.Ryan, C. 2003. Recreational Tourism: Demand and Impact. Clevedon:
Channel View Publications.Singh, A. 1997. ‘Asia Pacific Tourism Industry: Current Trends and Fu-
ture Outlook.’ Asia Pacific Journal of Travel Research 2 (1): 89–99.Slak-Valek, N., E. Kolar, G. Jurak, and J. Bednarik. 2008. ‘Differences Be-
tween Physical Active Tourists and Tourists with Other Travel Mo-tives.’ Sport 56 (3–4): 13–9.
Statistical Office of the Republic of Slovenia (sors). 2010. ‘TourismTravels of Domestic Population, Slovenia 2010 – final data.’ Statisti-cal Office of the Republic of Slovenia, Ljubljana.
Tourism Bureau. 2010. ‘Survey of Travel by roc Citizens.’ Tourism Bu-reau, Taipei.
unwto. 2011. Compendium of Tourism Statistics 2005–2009. [Please pro-vide facts of publication or the web page]
Wong, J.-Y., and C. Yeh. 2009. ‘Tourist hesitation in destination decisionmaking.’ Annals of Tourism Research 36 (1): 6–23.
number 1 · spring 2013 35