Embed Size (px)
Citation preview
Emerging E-Commerce Development Model for Taiwan Travel Agencies
Hsien-Tang Tsai Leo Huang Department of Business Management Department of Travel Management
National Sun Yat-Sen University National Kaohsiung Hospitality College Kaohsiung, TAIWAN Kaohsiung, TAIWAN
[email protected] [email protected]
Abstract The electronic commerce model has made an impact on the Taiwan travel industry. There are
multiple distribution channels in the Internet. New technology customers have already begun to buy straight from the supplier’s Web site. Price-sensitive customers that love to shop around will become natural constituents of on-line travel agencies. This study uses multiple methods to collect data from multiple sources to improve the study validity using qualitative and quantitative surveys. A longitudinal survey and three-stage research design were also adopted. Effective mechanisms for maintaining competitive advantages are explored in this study. The results will provide an in-depth understanding of the e-commerce impact on travel agency performance. The development of e-commerce has had revolutionary effect on the Taiwan travel industry. An optimal e-commerce business model and e-commerce development strategies for travel agency business management are proposed.
keywords:Internet marketing, E-commerce, Strategy, Travel Industry 1. Introduction
In the past 4 years, e-commerce has significantly changed the distribution channels of the travel industry. Since the 1970s, the distribution channel was performed by traditional travel agencies and supported using Computer Reservation Systems (CRSs) and a Global Distribution System (GDSs). Developing and maintaining a powerful CRS was the important electronic distribution issue for the future (O’Connor & Frew, 2002). However, the role of the traditional intermediaries has changed in recent years due to the introduction of the Internet and e-commerce technologies. Travel agencies are looking out for the consumer’s best interest through by using IT to help them find the best products. The suppliers believe that they no longer need an intermediary to sell their products. Direct marketing on the Internet is cutting into the traditional intermediaries’ business.
Using information technology to develop and tighten supply chain relationships can reduce costs and bring higher quality travel products to the market. Furthermore, this technology can contribute to minimizing transaction costs and lowering uncertainty, sharing market information and aiding distribution channel efficiency. Providing computer systems that integrate travel businesses with suppliers, distributors and retailers is the crucial first step toward developing a successful e-commerce business model. The goal of this research is to investigate how IT and e-commerce has been used to develop e-commerce development strategies for travel agencies in Taiwan. This pioneer survey allows for real-time inventory management and efficient customer travel services. E-commerce can enable more efficient transactions and help travel related suppliers obtain better customer services. An e-commerce development model for travel agencies is proposed.
2. Literature Review
The rapid growth of on-line travel agencies has caused the traditional indirect distribution channels through tourism intermediaries to decline. More direct channels are evolving (Walle, 1996; Williams & Palmer, 1999). The causes for this change includes the airline drive to reduce costs; airlines seeking more direct contact with their clients; technology providing the possibility for a direct channel between the airlines and their customers (Alamdari, 2002). The retail business premise involves wholesalers, suppliers and other intermediaries in the travel distribution system reducing costs at all accessible levels in the distribution system through disintermediation and direct compensation or commission cuts where these cuts can be rationalized. This has led to increasing intermediary elimination at all levels. Suppliers strive to get closer to their customers and rebel against the insulation imposed by distributors (Wardell, 1998; Law, Law, & Wai, 2001; Park, 2002; Law & Wong, 2003). Disintermediation seems to be inevitable. Information technology provides the means and the rationale for eliminating intermediaries. According to the Online Travel Marketplace, roughly 51% of the market is generated from supplier Web sites. Online agencies, consolidators, wholesalers and other intermediaries make up the remaining 49% (Sileo, 2001). A vast, new, horizontal set of mergers, acquisitions and alliances has, therefore, occurred to achieve global scale. Firms have an extraordinary opportunity to seize advantages in efficiency and
98
Proceedings of the First Workshop on Knowledge Economy and Electronic Commerce
profitability (Zonis, 1999). Airlines are attacking distribution costs in other ways. Distribution costs are being reduced in
parallel with slicing commissions, rewriting productivity incentives and creating new payment forms. Big travel agencies are also reducing distribution costs (Feldman, 1999). Airlines continue to recognize that online agencies are efficient channels for moving discounted inventory while allowing them to maintain some brand or price integrity (Sileo, 2001). Travel agencies continue to upgrade on-line business systems and work with travel related suppliers to ensure that distribution costs are kept low, thus enhancing the value to customers (Gilbert & Bacheldor, 2000). According to the above viewpoints, airlines should not absolutely adopt a disintermediation policy.
The disintermediation of travel agencies has not occurred as forecast. We are seeing the small agencies in local markets using the Internet as a tool and doing very well in that environment (Marino, 1999; Maselli, 2002). Although many observers have predicted the demise of the agency distribution system, there are still plenty of agencies out there with thriving businesses. The number of agency locations is decreasing, but not on a massive scale (Anderson, 2000). In the future, these intermediaries could play four key roles: (1) act as information brokers, passing information between guests and managers; (2) processing transactions by booking rooms and transferring money; (3) providing advice to customers, be they individual guests or members of an association attending a convention; and (4) providing value-added services by integrating customer requirements for hotels with other travel needs, while juggling the options, constraints, rules and policies offered by each provider. Travel agencies and meeting planners remain important to hotel distribution, even as most hotel chains experiment with electronic distribution methods (Dube & Renaghan, 2000).
The role of agents has been changing from reservation to advice and consultancy services for corporations (Chu, 2001; Alamdari, 2002). Despite the doom and gloom about the airline and travel agent industries, the agent’s role will increase, not decrease (Bush, 2000; 2001). Resource advantages involve the travel agencies’ relationship with their suppliers and include product sourcing, purchasing process management and accounts payable management. Due to the increase in applied IT in the travel industry; more traditional travel intermediaries are adopting IT to provide added value to travel consumers. IT has become a vital competitive advantage for travel agencies. Travel agencies use e-commerce development strategies to retain performance advantages. Therefore, e-commerce creates opportunities for on-line travel agency reintermediation. Mahadevan (2000) proposed several business models for Internet-Based e-commerce; however, his study lacked empirical evidence. Although, Chu (2001) found that adopting e-commerce to transform traditional ways of doing business means more than just increasing efficiency and effectiveness, he did not offer practical suggestions for travel agencies. Siebenaler and Groves (2002) provided four types of adaptation/adjustment strategies used by agencies and responded to the e-commerce impact. Still, their study adopted the Q sort methodology and did not provide quantitative analysis. In a word, the existing articles in the travel and tourism literature have emphasized the importance of e-commerce and the concept effects of the Internet on the travel industry. The empirical evidence and realistic suggestions, thus far, have been insufficient.
Therefore, the goal of this study is to explore the impact of e-commerce on Taiwan’s travel agencies and possible development strategies. We attempted to examine the effect of various IT applications on the travel agency structure and IT values for travel intermediaries in Taiwan. Travel agencies in Taiwan are divided into three categories; General Travel Agencies (GTAs), Tour Operator Travel Agencies (TOTAs) and Domestic Travel Agencies (DTAs). The development of e-commerce has generated a revolutionary effect in the travel industry, especially among travel agencies. This research will focus on whether two of three types of travel agencies in Taiwan differ in their use of IT applications and investigate whether an optimal business model for e-commerce applications exists.
In the past, we investigated the e-commerce strategies of travel agencies. There is also a framework for the resource, competitive and performance advantages. This is the major issue in the first-stage of this research. Our study issues were built on a framework to uncover the in-depth resource, competitive and performance advantage relationships by conducting a large-scale survey. We found a mature framework and complete resource, competitive and performance advantage indicators. 3. Objectives of this Study
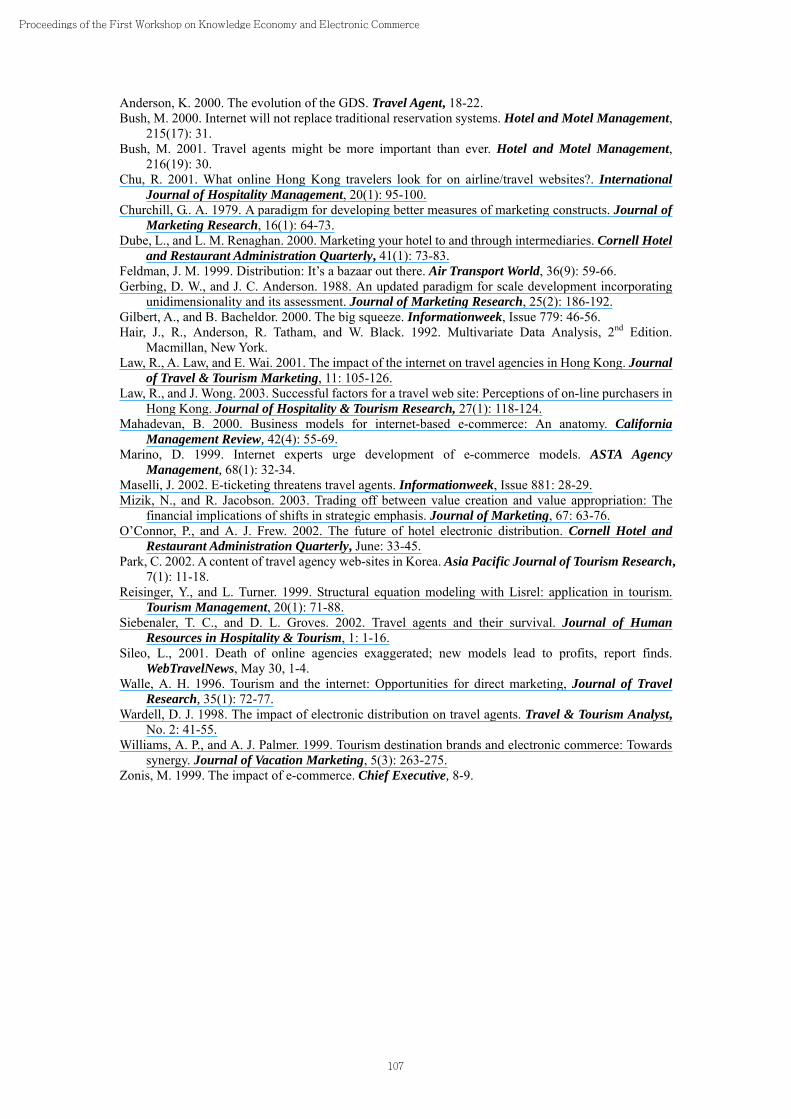
The existing literature on e-commerce applications indicates that few studies have investigated the impact of e-commerce on the productivity of the travel industry. Therefore, an exploratory survey will be conducted first to obtain data on the existing applications. Research that is more comprehensive will be used to identify the critical issues. In this study, both qualitative interviews and quantitative analysis will be adopted. Qualitative interviews will focus on primary on-line travel agencies to obtain more in-depth information and identify the important factors. A survey will then be conducted on 1,885 travel agencies. The conceptual framework for this study is divided into resource, competitive and performance advantages (see Figure 1). With this information, travel agencies can tailor appropriate marketing
99
Proceedings of the First Workshop on Knowledge Economy and Electronic Commerce
strategies to cater to their travel market. Five specific objectives of this study are: 3.1 Examine the characteristics and industrial structure of the travel industry. Qualitative research
constituted using a set of follow up interviews with travel industry experts, through which more in-depth opinions and comments on the subject can be obtained.
3.2 A large-scale survey will be conducted on the target population, including General Travel Agencies (GTAs), and Tour Operator Travel Agencies (TOTAs), which are the prominent travel agencies in Taiwan. Their responses will provide much insight into the e-commerce development of travel agencies.
3.3 Discern the variables relating to the resource, competitive and performance advantages of developing e-commerce travel agencies.
3.4 Provide suggestions for travel agencies to adopt e-commerce strategies, thereby achieving profits.
3.5 The data collected from the survey and case study will allow us to build a model for the e-commerce impact on the travel industry structure and firm productivity and discover better practices for adopting this new technology.
Overall, this study will use multiple methods to collect data from multiple sources to improve the study validity. A 3-year longitudinal field study that investigated the e-commerce development strategy for travel agencies is presented. These results will provide us with an in-depth understanding of the e-commerce impact on travel industry firm performance. Effective mechanisms for maintaining firm competitive advantages will also be explored.
----------------------------------------------------------- Figure 1
----------------------------------------------------------- 4.Methods
This study used multiple methods to collect data from multiple sources including qualitative and quantitative surveys to improve its validity. A longitudinal survey and three-stage research design were adopted. The first stage included qualitative interviews that focus on primary on-line travel agencies to obtain more in-depth information and identify important factors. The second stage involves a quantitative survey to discern the variables relating to resource, competitive and performance advantage dimensions of developing on-line travel agencies. The third stage involves a second quantitative survey used to build a model for the e-commerce impact on the travel industry and travel agency structure. An attempt was made to discover better practices for adopting this new technology in on-line travel agency development. 4.1 First stage
The first stage examines the travel agency characteristics and e-commerce development structure. Qualitative research constituted using a set of follow up interviews with travel industry experts, including 26 CEO level experts among 23 on-line travel related businesses were conducted to obtain in-depth opinions and comments on the subject. The survey period was from December 2000 to May 2001. 4.2 Second stage
The second stage questionnaire instrument, consisting of four parts, was developed according to the first stage results. The first stage was designed to gather resource advantages including 12 attributes. The second part was the competitive advantages including 12 attributes; travel product, brand, service, and tour price. The third part was 6 attributes that covered various performance advantage aspects, including market share, sales growth, public relationship, employees training, running cost, and ROI. The final part dealt with the demographic backgrounds of the travel agency managerial level respondents. They were asked to rate the importance of each attribute in the competitive and performance advantages. The 12 and 6 attributes were rated on a 5- point Likert-type scale, ranging from 1 (extremely unimportant) to 5 (extremely important). The resource attributes were based on multiple choice questions. All of these attributes were developed from information in the literature review and personal interviews with travel related business CEO’s. A pilot test was conducted to assess the reliability of the 12 and 6 attributes. Thirty travel agents from the Kaohsiung area were interviewed. Some question wording was rephrased after the pilot test to better clarify the text. This survey period was from May 2001 to July 2001. 4.3 Third stage
This stage questionnaire instrument also consisted of four parts. The questionnaire design was similar to and linked to the second stage. The only difference was the resource attributes were revised and rated on a 5- point Likert-type scale to see if there were any significant differences between the two quantitative surveys. The survey period was from January 2003 to March 2003. 5. Sampling
The first stage of this study adopted snowball sampling. The second stage included members from the Taipei, Taichung, Tainan and Kaohsiung areas. The survey was carried out over a three-month survey
100
Proceedings of the First Workshop on Knowledge Economy and Electronic Commerce
period from May 2001 to July 2001. The sample population size was 1,481 in Taiwan. Because this survey was based on respondents with e-commerce business model experience, random data collection sampling techniques could not be used. Convenience sampling techniques were used instead. Cooperation and assistance from the travel agencies was used to improve the sample generality. Although convenience sampling was adopted, several criteria were in place. First, the respondents included Travel Quality Assurance Association members, R.O.C. Second, the respondents were managerial level a required condition for being directly responsible for e-commerce or the sales department. Third, only members that are General Travel Agencies (GTAs) or Tour Operator Travel Agencies (TOTAs) were chosen for this survey. If the chosen respondent did not match any one on the above criteria, or was unwilling to participate in the survey, the next immediate convenient sampling unit was approached and interviewed. Two hundred seventy travel agencies were selected from the population. Ninety five General Travel Agencies and one hundred seventy five Tour Operator Travel Agencies were chosen, constituting a total sample size of 270 travel agencies, representing about 18.23 percent of the target population. The third stage expanded the target population and included members from the Taipei, Taoyuan, Hsinchu, Taichung, Tainan, Kaohsiung, and Hualien areas all primary cities in Taiwan. The survey was carried out over a three-month period from January to March 2003. The sample population size was 1,572. Two hundred seventy travel agencies were selected from the population. One hundred five General Travel Agencies and Two hundred thirty five Tour Operator Travel Agencies were chosen, constituting a total sample size of 340 travel agencies, representing about 21.63 percent of the target population.
6. Data Analysis
First stage adopted the qualitative survey to explore the e-commerce development strategy dimensions. More in-depth information and important e-commerce strategy factors were identified and obtained. This survey stage occurred over 6 months. Each target respondent was interviewed more than 2 times. The second stage was a quantitative survey that discerned the dimension variables. Data were analyzed initially using univariate descriptive statistics including the frequencies and mean ratings and factor analysis condensed the 12 resource advantage attributes. Furthermore, 12 competitive advantage attributes and 6 performance advantage attributes were used. The competitive and performance attributes were factor analyzed to determine whether any underlying dimensions or factors existed. Principal Component Factor Analysis with varimax rotation was then applied. Reliability analysis was also used to assess the interval consistency of the variables retained in each dimension. The linear structural relationship (LISREL) was adopted to build the e-commerce development model using the resource, competitive and performance advantage dimensions attribute correlation’s’ (derived from factor analysis).
7. Results 7.1 E-commerce development strategy
E-commerce has changed the business environment and produced a dramatic impact on the future of the travel industry. More travel agencies have set up their own corporate Web sites using the Internet to work collaboratively with travel consumers, related travel suppliers and partners. On-line travel agencies that effectively market themselves using e-commerce development have a distinct advantage. This study found three e-commerce development strategy dimensions for gaining those advantages. 7.1.1 Resource advantage
The strong pressure to seize resource advantages, acquire greater competitive advantages and retain performance advantages has prompted travel agencies to act. Qualitative interviews with a pool of expert respondents helped to obtain resource advantages and clarify the points of each advantage. Qualitative research was required to explore and produce potential e-commerce development models. Table 1 shows that 12 items were deemed resource advantages of the important elements that classify the three dimensions; enterprise reputation, travel professionals, and selling capability advantages. Factor One: Enterprise reputation dimension
69.5 percent GTAs, and 66.3 percent TOTAs popular option was the reputation and brand of the on-line travel agencies or alliance enterprises. Related items included contracts with related businesses and the organizational culture. Because travel products are intangible and quality is unstable, one of the keys to e-commerce transactional model development success is the enterprise reputation. In other words, enterprise reputation also enhances customer transaction safety, brand awareness and therefore the customers’ trust. Factor Two: Travel professional capability dimension
Offering the right product to the right customer is the travel professional’s ability in on-line travel agencies. This is also an essential factor in seizing resource advantages. Fifty-three percent of the GTAs, and 48.0 percent of the TOTAs revealed that travel professional capability is the main travel agency
101
Proceedings of the First Workshop on Knowledge Economy and Electronic Commerce
factor that new entrants cannot replace. Therefore, the disintermediary policy is not appropriate for the Taiwan travel industry. Other travel professional capabilities are travel information database, management capability, tour planning capability and innovation capability. Factor Three: Travel selling capability dimension
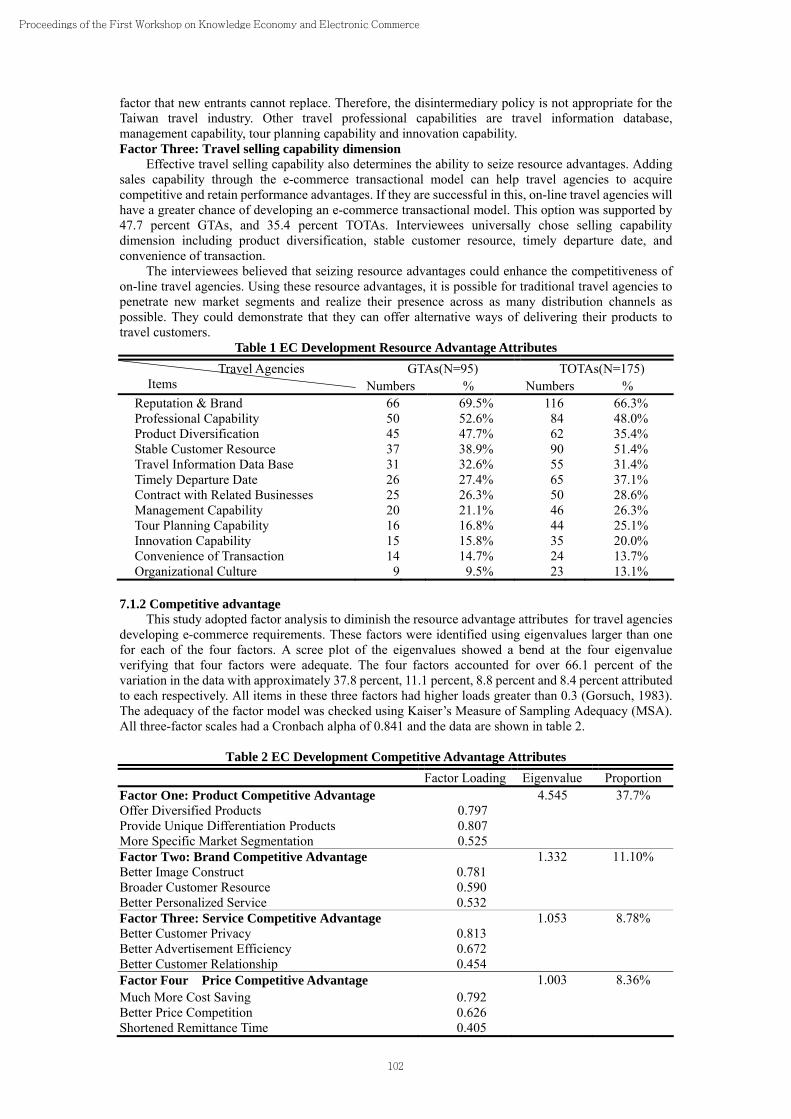
Effective travel selling capability also determines the ability to seize resource advantages. Adding sales capability through the e-commerce transactional model can help travel agencies to acquire competitive and retain performance advantages. If they are successful in this, on-line travel agencies will have a greater chance of developing an e-commerce transactional model. This option was supported by 47.7 percent GTAs, and 35.4 percent TOTAs. Interviewees universally chose selling capability dimension including product diversification, stable customer resource, timely departure date, and convenience of transaction.
The interviewees believed that seizing resource advantages could enhance the competitiveness of on-line travel agencies. Using these resource advantages, it is possible for traditional travel agencies to penetrate new market segments and realize their presence across as many distribution channels as possible. They could demonstrate that they can offer alternative ways of delivering their products to travel customers.
Table 1 EC Development Resource Advantage Attributes GTAs(N=95) TOTAs(N=175) Travel Agencies
Items Numbers % Numbers % Reputation & Brand 66 69.5% 116 66.3% Professional Capability 50 52.6% 84 48.0% Product Diversification 45 47.7% 62 35.4% Stable Customer Resource 37 38.9% 90 51.4% Travel Information Data Base 31 32.6% 55 31.4% Timely Departure Date 26 27.4% 65 37.1% Contract with Related Businesses 25 26.3% 50 28.6% Management Capability 20 21.1% 46 26.3% Tour Planning Capability 16 16.8% 44 25.1% Innovation Capability 15 15.8% 35 20.0% Convenience of Transaction 14 14.7% 24 13.7% Organizational Culture 9 9.5% 23 13.1%
7.1.2 Competitive advantage
This study adopted factor analysis to diminish the resource advantage attributes for travel agencies developing e-commerce requirements. These factors were identified using eigenvalues larger than one for each of the four factors. A scree plot of the eigenvalues showed a bend at the four eigenvalue verifying that four factors were adequate. The four factors accounted for over 66.1 percent of the variation in the data with approximately 37.8 percent, 11.1 percent, 8.8 percent and 8.4 percent attributed to each respectively. All items in these three factors had higher loads greater than 0.3 (Gorsuch, 1983). The adequacy of the factor model was checked using Kaiser’s Measure of Sampling Adequacy (MSA). All three-factor scales had a Cronbach alpha of 0.841 and the data are shown in table 2.
Table 2 EC Development Competitive Advantage Attributes
Factor Loading Eigenvalue Proportion Factor One: Product Competitive Advantage 4.545 37.7% Offer Diversified Products 0.797 Provide Unique Differentiation Products 0.807 More Specific Market Segmentation 0.525 Factor Two: Brand Competitive Advantage 1.332 11.10% Better Image Construct 0.781 Broader Customer Resource 0.590 Better Personalized Service 0.532 Factor Three: Service Competitive Advantage 1.053 8.78% Better Customer Privacy 0.813 Better Advertisement Efficiency 0.672 Better Customer Relationship 0.454 Factor Four:Price Competitive Advantage 1.003 8.36% Much More Cost Saving 0.792 Better Price Competition 0.626 Shortened Remittance Time 0.405
102
Proceedings of the First Workshop on Knowledge Economy and Electronic Commerce
Factor One:Product competitive advantage dimension
The first factor contains three items that were related to product competitive advantage attributes. The three items with the highest loads in this factor offered diversified products, providing unique differentiation products, and more specific market segmentation. These items were included in factor one as the product competitive advantage dimension. Factor Two:Brand competitive advantage dimension
Factor two clearly relates to brand competitive advantage. The related attributes were better image construct, broader customer resources and better customer relationships. Factor Three:Service competitive advantage dimension
Items representing the service competitive advantage attributes were predominant in the third factor, consisting of three items; better customer privacy, better advertisement efficiency and better customer relationship. Factor Four:Price competitive advantage dimension
Items representing price competitive advantage attributes were predominant in the fourth factor, consisting of three items; more cost savings, better price competition and shortened remittance time.
In today’s hypercompetitive environment, new product and process innovation sources are continually being sought to reinforce companies’ competitive advantages. Travel related suppliers began selling their own products or services on the web to make use of a cheaper distribution channel than the standard computer reservation systems or travel agencies. In the meantime, e-commerce development permitted travel agencies to acquire significant competitive advantages; including: product, brand, service and price competitive advantage dimensions. Travel agencies exploited the differentiation strategy and significant cost savings strategy in their e-commerce development plans. 7.1.3 Performance advantage
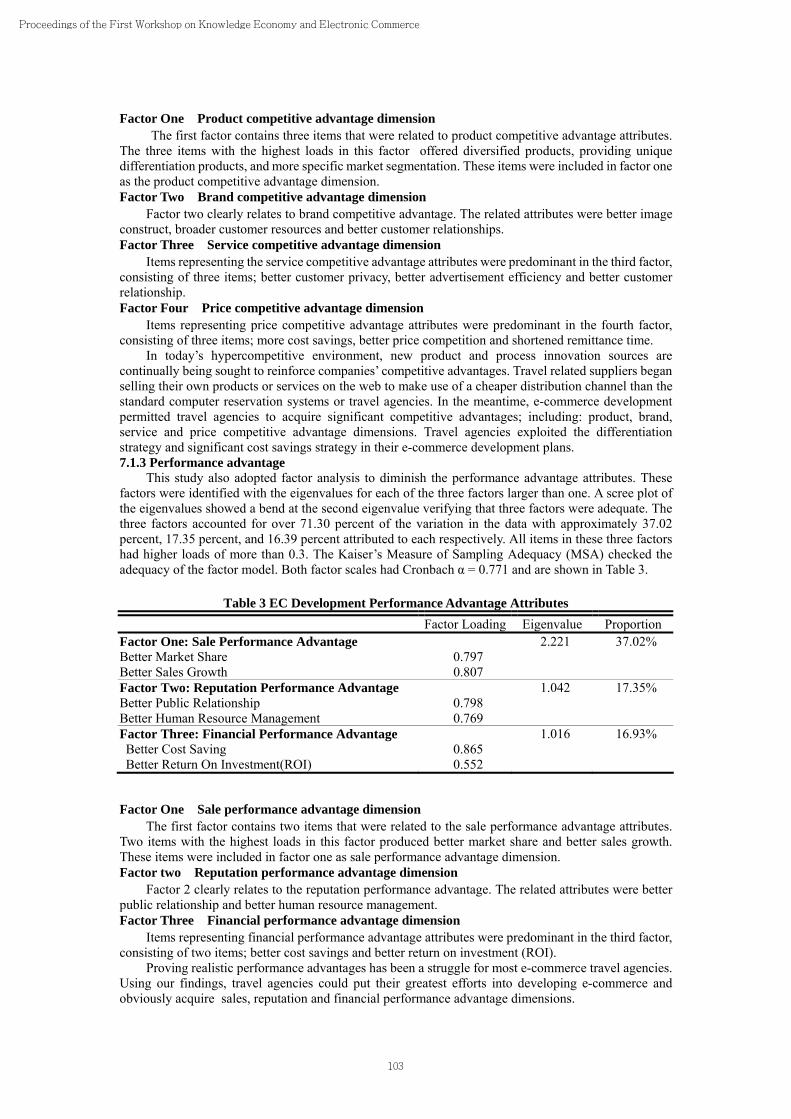
This study also adopted factor analysis to diminish the performance advantage attributes. These factors were identified with the eigenvalues for each of the three factors larger than one. A scree plot of the eigenvalues showed a bend at the second eigenvalue verifying that three factors were adequate. The three factors accounted for over 71.30 percent of the variation in the data with approximately 37.02 percent, 17.35 percent, and 16.39 percent attributed to each respectively. All items in these three factors had higher loads of more than 0.3. The Kaiser’s Measure of Sampling Adequacy (MSA) checked the adequacy of the factor model. Both factor scales had Cronbach α = 0.771 and are shown in Table 3.
Table 3 EC Development Performance Advantage Attributes Factor Loading Eigenvalue Proportion Factor One: Sale Performance Advantage 2.221 37.02% Better Market Share 0.797 Better Sales Growth 0.807 Factor Two: Reputation Performance Advantage 1.042 17.35% Better Public Relationship 0.798 Better Human Resource Management 0.769 Factor Three: Financial Performance Advantage 1.016 16.93% Better Cost Saving 0.865 Better Return On Investment(ROI) 0.552
Factor One:Sale performance advantage dimension
The first factor contains two items that were related to the sale performance advantage attributes. Two items with the highest loads in this factor produced better market share and better sales growth. These items were included in factor one as sale performance advantage dimension. Factor two:Reputation performance advantage dimension
Factor 2 clearly relates to the reputation performance advantage. The related attributes were better public relationship and better human resource management. Factor Three:Financial performance advantage dimension
Items representing financial performance advantage attributes were predominant in the third factor, consisting of two items; better cost savings and better return on investment (ROI).
Proving realistic performance advantages has been a struggle for most e-commerce travel agencies. Using our findings, travel agencies could put their greatest efforts into developing e-commerce and obviously acquire sales, reputation and financial performance advantage dimensions.
103
Proceedings of the First Workshop on Knowledge Economy and Electronic Commerce
7.2 E-commerce Development Model 7.2.1 Development of measures
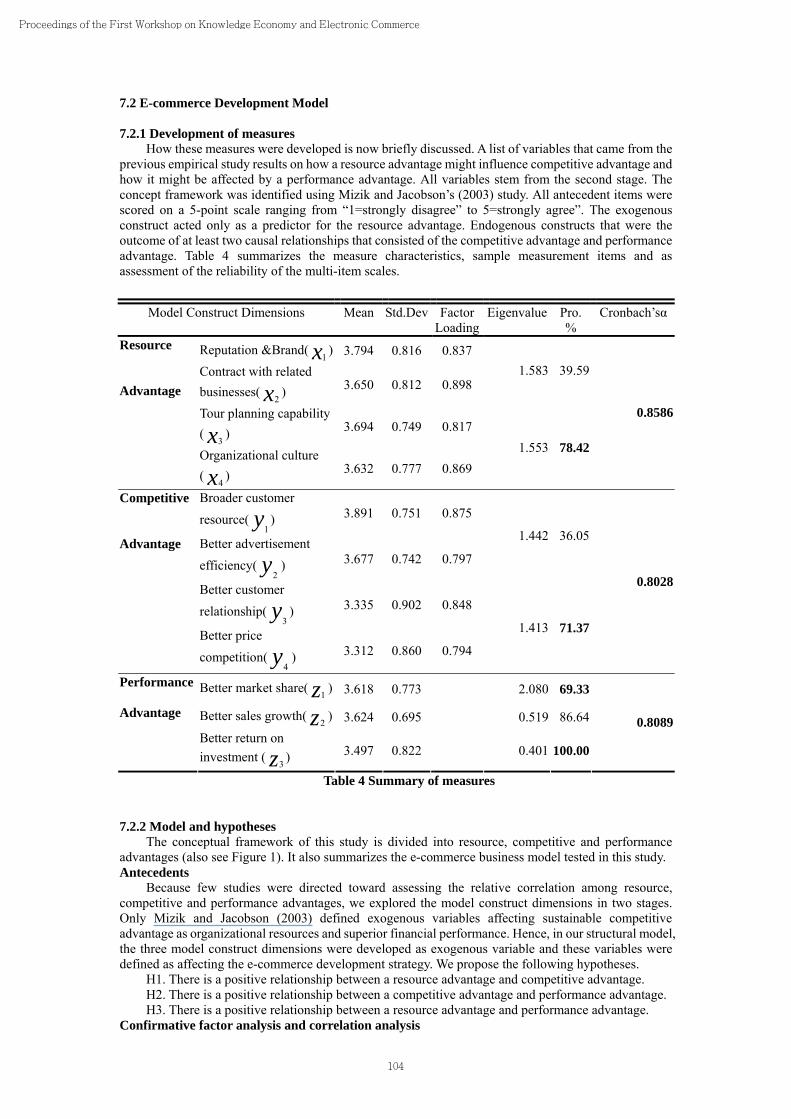
How these measures were developed is now briefly discussed. A list of variables that came from the previous empirical study results on how a resource advantage might influence competitive advantage and how it might be affected by a performance advantage. All variables stem from the second stage. The concept framework was identified using Mizik and Jacobson’s (2003) study. All antecedent items were scored on a 5-point scale ranging from “1=strongly disagree” to 5=strongly agree”. The exogenous construct acted only as a predictor for the resource advantage. Endogenous constructs that were the outcome of at least two causal relationships that consisted of the competitive advantage and performance advantage. Table 4 summarizes the measure characteristics, sample measurement items and as assessment of the reliability of the multi-item scales.
Table 4 Summary of measures 7.2.2 Model and hypotheses
The conceptual framework of this study is divided into resource, competitive and performance advantages (also see Figure 1). It also summarizes the e-commerce business model tested in this study. Antecedents
Because few studies were directed toward assessing the relative correlation among resource, competitive and performance advantages, we explored the model construct dimensions in two stages. Only Mizik and Jacobson (2003) defined exogenous variables affecting sustainable competitive advantage as organizational resources and superior financial performance. Hence, in our structural model, the three model construct dimensions were developed as exogenous variable and these variables were defined as affecting the e-commerce development strategy. We propose the following hypotheses.
H1. There is a positive relationship between a resource advantage and competitive advantage. H2. There is a positive relationship between a competitive advantage and performance advantage. H3. There is a positive relationship between a resource advantage and performance advantage.
Confirmative factor analysis and correlation analysis
Model Construct Dimensions Mean Std.Dev FactorLoading
Eigenvalue Pro. %
Cronbach’sα
Reputation &Brand( x1) 3.794 0.816 0.837
Contract with related businesses( x2
) 3.650 0.812 0.8981.583 39.59
Tour planning capability ( x3
) 3.694 0.749 0.817
Resource Advantage
Organizational culture ( x4
) 3.632 0.777 0.8691.553 78.42
0.8586
Broader customer resource( y1
) 3.891 0.751 0.875
Better advertisement efficiency( y2
) 3.677 0.742 0.797
1.442 36.05
Better customer relationship( y3
) 3.335 0.902 0.848
Competitive Advantage
Better price competition( y4
) 3.312 0.860 0.794
1.413 71.37
0.8028
Better market share( z1 ) 3.618 0.773 ※ 2.080 69.33
Better sales growth( z2 ) 3.624 0.695 ※ 0.519 86.64
Performance Advantage
Better return on investment ( z3 ) 3.497 0.822 ※ 0.401 100.00
0.8089
104
Proceedings of the First Workshop on Knowledge Economy and Electronic Commerce
This study used several statistical techniques including an exploratory, confirmatory factor analysis, correlation analysis and linear structural relationship (LISREL). A structural equation was used to test the model and hypotheses previously stated.
Initially, the set of items corresponding to each theoretical construct was subjected to examining the item-to-total correlation and exploratory factor analysis (Churchill, 1979; Reisinger & Turner, 1999) (see table 5). After the third stage analysis, the entire set of items were subjected to confirmatory factor analysis to verify uni-dimensionality. Specifically, a measurement model was estimated in which every item was restricted to load in it’s a priori specified factor. The factors themselves were allowed to correlate (Gerbing & Anderson, 1988). A confirmatory factor analysis was conducted for all three constructs and their indicators. An adequate degree of model fit was obtained ( Normed Chi-square=2.2, GFI=0.96, AGFI=0.93, RMR=0.04, IFI=0.97, CFI=0.97, RMSEA=0.06, NFI=0.95).
Table 5 Item Purification Constructs
Research Design Resource Advantage Competitive
Advantage Performance Advantage
First Stage 4 6 5 Second Stage 12 12 6 Third Stage 4 4 3
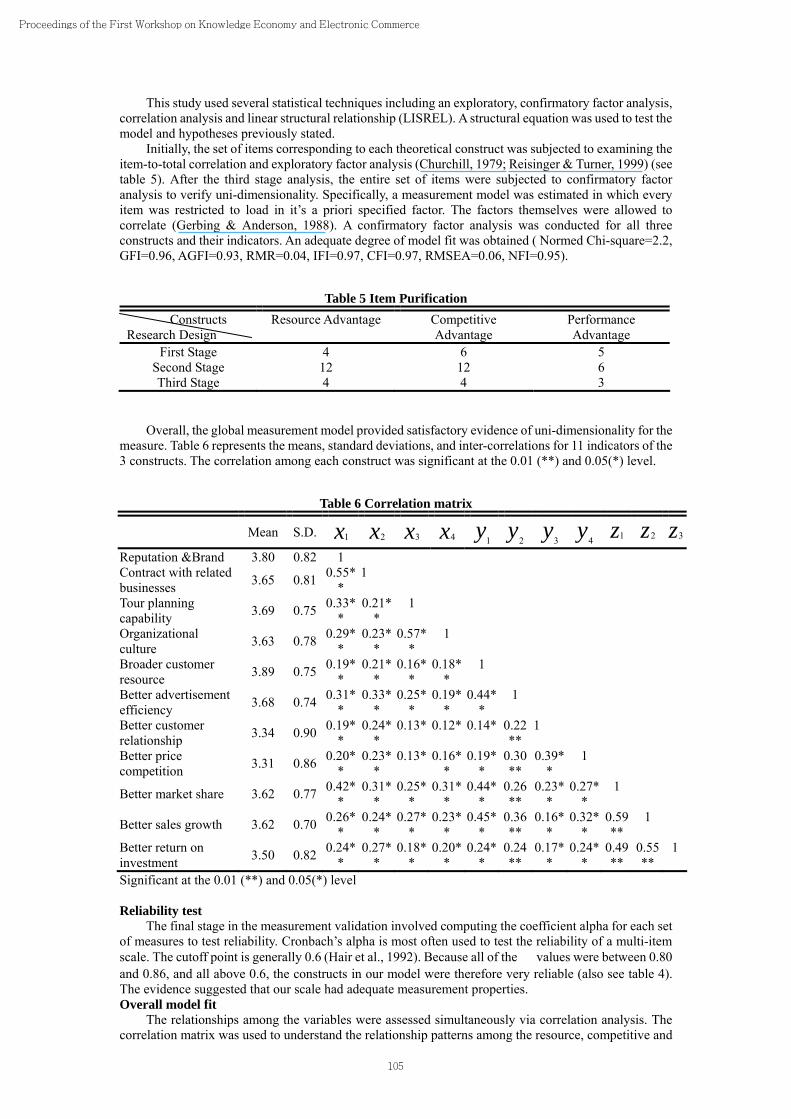
Overall, the global measurement model provided satisfactory evidence of uni-dimensionality for the
measure. Table 6 represents the means, standard deviations, and inter-correlations for 11 indicators of the 3 constructs. The correlation among each construct was significant at the 0.01 (**) and 0.05(*) level.
Table 6 Correlation matrix Mean S.D. x1 x2 x3 x4 y1 y2 y3
y4 z1 z2 z3
Reputation &Brand 3.80 0.82 1 Contract with related businesses 3.65 0.81 0.55*
* 1
Tour planning capability 3.69 0.75 0.33*
* 0.21*
* 1
Organizational culture 3.63 0.78 0.29*
* 0.23*
* 0.57*
* 1
Broader customer resource 3.89 0.75 0.19*
* 0.21*
* 0.16*
* 0.18*
* 1
Better advertisement efficiency 3.68 0.74 0.31*
* 0.33*
* 0.25*
* 0.19*
* 0.44*
* 1
Better customer relationship 3.34 0.90 0.19*
* 0.24*
* 0.13* 0.12* 0.14* 0.22
**1
Better price competition 3.31 0.86 0.20*
* 0.23*
* 0.13* 0.16*
* 0.19*
* 0.30**
0.39**
1
Better market share 3.62 0.77 0.42**
0.31**
0.25**
0.31**
0.44**
0.26**
0.23**
0.27**
1
Better sales growth 3.62 0.70 0.26**
0.24**
0.27**
0.23**
0.45**
0.36**
0.16**
0.32**
0.59**
1
Better return on investment 3.50 0.82 0.24*
* 0.27*
* 0.18*
* 0.20*
* 0.24*
* 0.24**
0.17**
0.24**
0.49**
0.55**
1
Significant at the 0.01 (**) and 0.05(*) level Reliability test
The final stage in the measurement validation involved computing the coefficient alpha for each set of measures to test reliability. Cronbach’s alpha is most often used to test the reliability of a multi-item scale. The cutoff point is generally 0.6 (Hair et al., 1992). Because all of the α values were between 0.80 and 0.86, and all above 0.6, the constructs in our model were therefore very reliable (also see table 4). The evidence suggested that our scale had adequate measurement properties. Overall model fit
The relationships among the variables were assessed simultaneously via correlation analysis. The correlation matrix was used to understand the relationship patterns among the resource, competitive and
105
Proceedings of the First Workshop on Knowledge Economy and Electronic Commerce
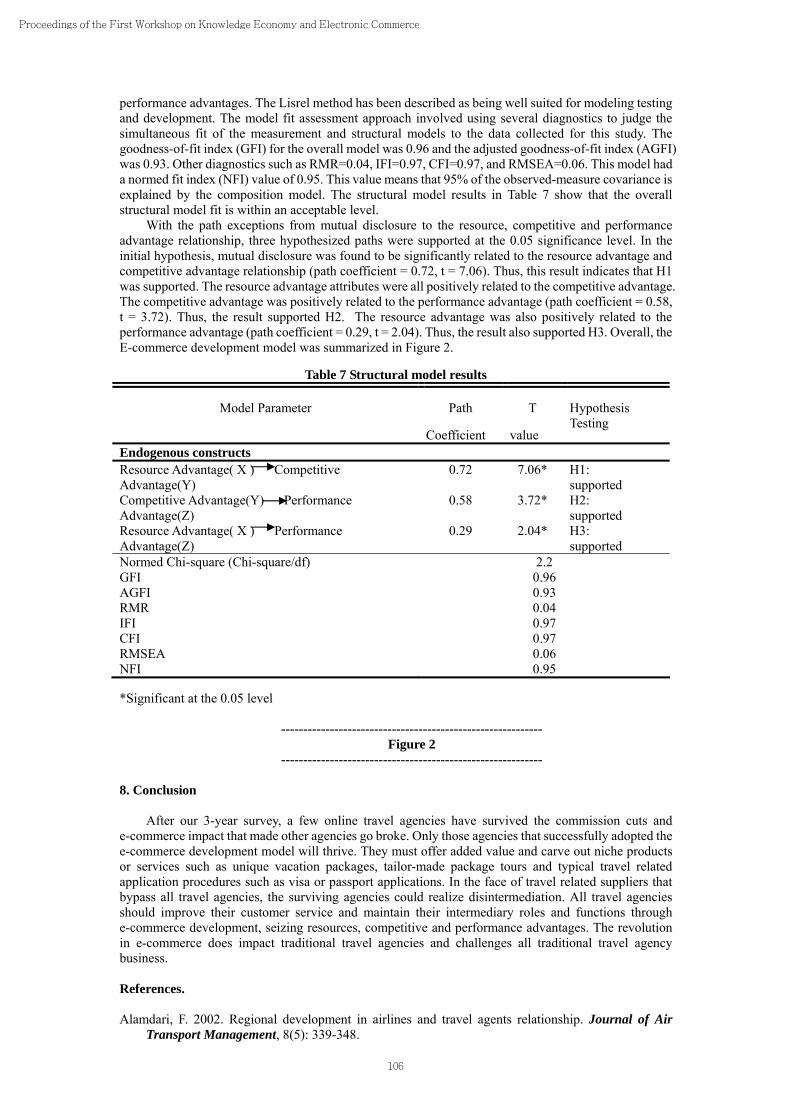
performance advantages. The Lisrel method has been described as being well suited for modeling testing and development. The model fit assessment approach involved using several diagnostics to judge the simultaneous fit of the measurement and structural models to the data collected for this study. The goodness-of-fit index (GFI) for the overall model was 0.96 and the adjusted goodness-of-fit index (AGFI) was 0.93. Other diagnostics such as RMR=0.04, IFI=0.97, CFI=0.97, and RMSEA=0.06. This model had a normed fit index (NFI) value of 0.95. This value means that 95% of the observed-measure covariance is explained by the composition model. The structural model results in Table 7 show that the overall structural model fit is within an acceptable level.
With the path exceptions from mutual disclosure to the resource, competitive and performance advantage relationship, three hypothesized paths were supported at the 0.05 significance level. In the initial hypothesis, mutual disclosure was found to be significantly related to the resource advantage and competitive advantage relationship (path coefficient = 0.72, t = 7.06). Thus, this result indicates that H1 was supported. The resource advantage attributes were all positively related to the competitive advantage. The competitive advantage was positively related to the performance advantage (path coefficient = 0.58, t = 3.72). Thus, the result supported H2. The resource advantage was also positively related to the performance advantage (path coefficient = 0.29, t = 2.04). Thus, the result also supported H3. Overall, the E-commerce development model was summarized in Figure 2.
Table 7 Structural model results
Model Parameter Path
Coefficient
T
value
Hypothesis Testing
Endogenous constructs Resource Advantage( X ) Competitive Advantage(Y)
0.72 7.06* H1: supported
Competitive Advantage(Y) Performance Advantage(Z)
0.58 3.72* H2: supported
Resource Advantage( X ) Performance Advantage(Z)
0.29 2.04* H3: supported
Normed Chi-square (Chi-square/df) 2.2 GFI 0.96 AGFI 0.93 RMR 0.04 IFI 0.97 CFI 0.97 RMSEA 0.06 NFI 0.95
*Significant at the 0.05 level
----------------------------------------------------------- Figure 2
----------------------------------------------------------- 8. Conclusion
After our 3-year survey, a few online travel agencies have survived the commission cuts and e-commerce impact that made other agencies go broke. Only those agencies that successfully adopted the e-commerce development model will thrive. They must offer added value and carve out niche products or services such as unique vacation packages, tailor-made package tours and typical travel related application procedures such as visa or passport applications. In the face of travel related suppliers that bypass all travel agencies, the surviving agencies could realize disintermediation. All travel agencies should improve their customer service and maintain their intermediary roles and functions through e-commerce development, seizing resources, competitive and performance advantages. The revolution in e-commerce does impact traditional travel agencies and challenges all traditional travel agency business.
References. Alamdari, F. 2002. Regional development in airlines and travel agents relationship. Journal of Air
Transport Management, 8(5): 339-348.
106
Proceedings of the First Workshop on Knowledge Economy and Electronic Commerce
Anderson, K. 2000. The evolution of the GDS. Travel Agent, 18-22. Bush, M. 2000. Internet will not replace traditional reservation systems. Hotel and Motel Management,
215(17): 31. Bush, M. 2001. Travel agents might be more important than ever. Hotel and Motel Management,
216(19): 30. Chu, R. 2001. What online Hong Kong travelers look for on airline/travel websites?. International
Journal of Hospitality Management, 20(1): 95-100. Churchill, G.. A. 1979. A paradigm for developing better measures of marketing constructs. Journal of
Marketing Research, 16(1): 64-73. Dube, L., and L. M. Renaghan. 2000. Marketing your hotel to and through intermediaries. Cornell Hotel
and Restaurant Administration Quarterly, 41(1): 73-83. Feldman, J. M. 1999. Distribution: It’s a bazaar out there. Air Transport World, 36(9): 59-66. Gerbing, D. W., and J. C. Anderson. 1988. An updated paradigm for scale development incorporating
unidimensionality and its assessment. Journal of Marketing Research, 25(2): 186-192. Gilbert, A., and B. Bacheldor. 2000. The big squeeze. Informationweek, Issue 779: 46-56. Hair, J., R., Anderson, R. Tatham, and W. Black. 1992. Multivariate Data Analysis, 2nd Edition.
Macmillan, New York. Law, R., A. Law, and E. Wai. 2001. The impact of the internet on travel agencies in Hong Kong. Journal
of Travel & Tourism Marketing, 11: 105-126. Law, R., and J. Wong. 2003. Successful factors for a travel web site: Perceptions of on-line purchasers in
Hong Kong. Journal of Hospitality & Tourism Research, 27(1): 118-124. Mahadevan, B. 2000. Business models for internet-based e-commerce: An anatomy. California
Management Review, 42(4): 55-69. Marino, D. 1999. Internet experts urge development of e-commerce models. ASTA Agency
Management, 68(1): 32-34. Maselli, J. 2002. E-ticketing threatens travel agents. Informationweek, Issue 881: 28-29. Mizik, N., and R. Jacobson. 2003. Trading off between value creation and value appropriation: The
financial implications of shifts in strategic emphasis. Journal of Marketing, 67: 63-76. O’Connor, P., and A. J. Frew. 2002. The future of hotel electronic distribution. Cornell Hotel and
Restaurant Administration Quarterly, June: 33-45. Park, C. 2002. A content of travel agency web-sites in Korea. Asia Pacific Journal of Tourism Research,
7(1): 11-18. Reisinger, Y., and L. Turner. 1999. Structural equation modeling with Lisrel: application in tourism.
Tourism Management, 20(1): 71-88. Siebenaler, T. C., and D. L. Groves. 2002. Travel agents and their survival. Journal of Human
Resources in Hospitality & Tourism, 1: 1-16. Sileo, L., 2001. Death of online agencies exaggerated; new models lead to profits, report finds.
WebTravelNews, May 30, 1-4. Walle, A. H. 1996. Tourism and the internet: Opportunities for direct marketing, Journal of Travel
Research, 35(1): 72-77. Wardell, D. J. 1998. The impact of electronic distribution on travel agents. Travel & Tourism Analyst,
No. 2: 41-55. Williams, A. P., and A. J. Palmer. 1999. Tourism destination brands and electronic commerce: Towards
synergy. Journal of Vacation Marketing, 5(3): 263-275. Zonis, M. 1999. The impact of e-commerce. Chief Executive, 8-9.
107
Proceedings of the First Workshop on Knowledge Economy and Electronic Commerce
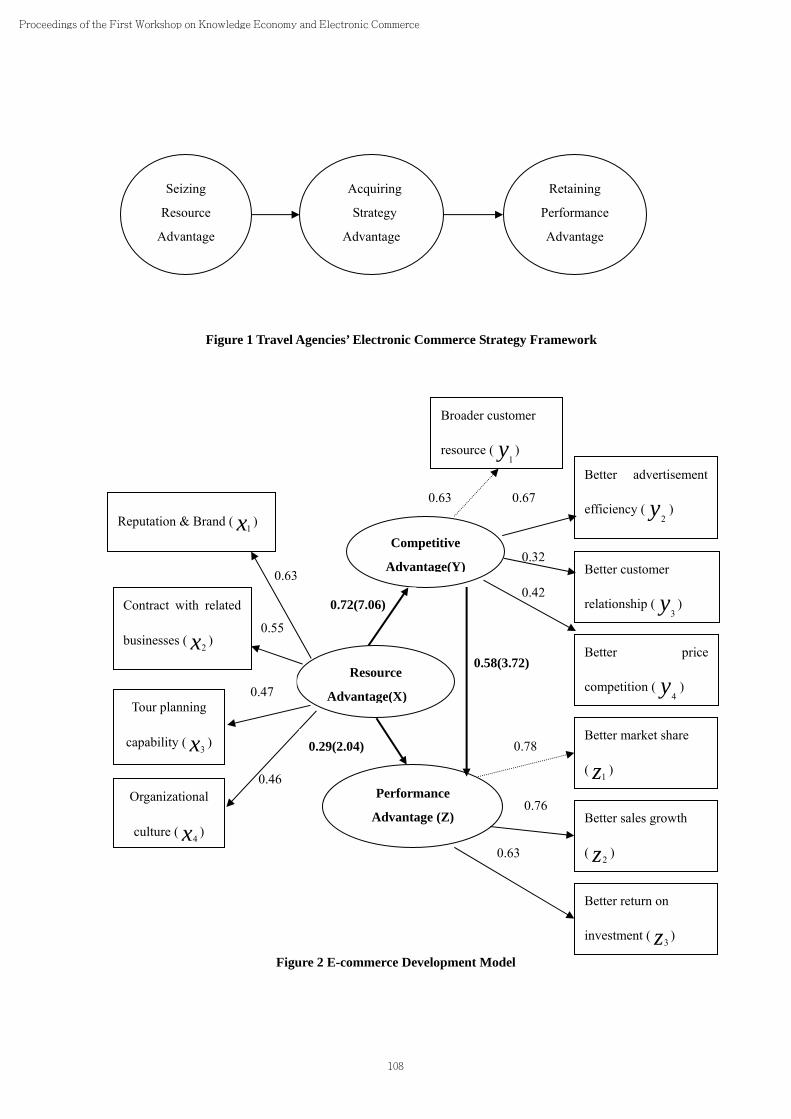
Figure 2 E-commerce Development Model
Seizing
Resource
Advantage
Acquiring
Strategy
Advantage
Retaining
Performance
Advantage
Figure 1 Travel Agencies’ Electronic Commerce Strategy Framework
Better return on
investment ( z3 )
0.63
Resource
Advantage(X)
Competitive
Advantage(Y)
Performance
Advantage (Z)
0.63
0.55
0.47
0.46
Reputation & Brand ( x1)
Contract with related
businesses ( x2)
Tour planning
capability ( x3)
Organizational
culture ( x4 )
Broader customer
resource ( y1)
Better advertisement
efficiency ( y2)
Better customer
relationship ( y3)
Better price
competition ( y4)
Better market share
( z1 )
Better sales growth
( z2 )
0.72(7.06)
0.29(2.04)
0.58(3.72)
0.63 0.67
0.32
0.42
0.78
0.76
108
Proceedings of the First Workshop on Knowledge Economy and Electronic Commerce