Embed Size (px)
Citation preview

Djamel Medjahed1, 4
Brian T. Luke2, 5
Tawady S. Tontesh1
Gary W. Smythers2, 5
David J. Munroe1, 4
Peter F. Lemkin3
1Laboratory of MolecularTechnology
2Advanced BiomedicalComputing Center
3Laboratory of Computationaland Experimental Biology,CCR, National CancerInstitute at Frederick,MD, USA
4Scientific ApplicationsInternational,Frederick, MD, USA
Tissue Molecular Anatomy Project (TMAP):An expression database for comparative cancerproteomics
By mining publicly accessible databases, we have developed a collection of tissue-specific predictive protein expression maps as a function of cancer histological state.Data analysis is applied to the differential expression of gene products in pooledlibraries from the normal to the altered state(s). We wish to report the initial results ofour survey across different tissues and explore the extent to which this comparativeapproach may help uncover panels of potential biomarkers of tumorigenesis whichwould warrant further examination in the laboratory.
Keywords: Expressed sequence tags / Protein expression map / Tissue Molecular AnatomyProject / Two-dimensional gel electrophoresis / VIRTUAL2D PRO 0488
1 Introduction
The advent of the human genome sequence and subse-quently of exquisitely curated proteome datasets pro-vided the initial motivation to build interactive, web-ablereference pI/Mr charts to facilitate the putative assign-ment of proteins to spots in experimental 2-D PAGEmaps. The fruit of this effort known as VIRTUAL2D [1]has largely mirrored that of the European BioinformaticsInstitute and has grown to comprise interactive web-ablemaps for ninety-two organisms and associated java-based graphics software. Molecular mass and isoelectricfocusing points are not the only varying attributes predict-able from the primary sequence of the gene product (e.g.,hydrophobicity, well characterized putative post-transla-tional modifications, etc.).
For the third dimension, we computed inferred genepro-duct translational expression levels from the transcrip-tional levels reported in the public databases. A numberof studies [2, 3] have explored the feasibility of molecularcharacterization of the histopathological state from themRNA abundance reported in public databases. Manypotential tissue-specific cancer biomarkers were tenta-tively identified as a result of mining expression databases.Thus arose the motivation to explore and catalog correla-tions across different tissues as a first step towards com-
parative cancer proteomics of normal versus diseasedstate. One potential clinical application is uncoveringthreads of biomarkers and therapeutic targets for multiplecancers. For each expression sequence tag (EST), thenumber of hits detected in each tissue and state-specificlibrary provides a third dimension, expression to thesemaps. They in turn can be thought of as snapshots of theprofile at different states (drug-induced, diseased, etc.).
Cancer is a result of multiple pathways involving a suc-cession of molecular alterations at the cellular level.These transformations may take place over an extendedperiod of time and only after the cell has accumulated acritical number of these changes does it become cancer-ous. The Cancer Genome Anatomy Project (CGAP) [4] is aprogram launched by the US National Cancer Institute(NCI) to keep track of the gradual molecular alterationsthat occur throughout this transformation process. Notall genes are switched on for any given tissue. Theexpression profile can therefore be used to uniquely char-acterize each tissue, much like a fingerprint. Furthermorewhen a normal tissue is transformed into the cancerousstate, the expression profile changes. These alterationsin gene expression drastically affect the nature andamounts of proteins produced, disrupting their interactionnetworks. Many different scenarios of gene changes andprotein interactions are observed in cancerous tissue.
2 Materials and methods
For each tissue, the CGAP database can be queried bypossible histological state, source, extraction and cloningmethod. In the initial construction of queries, selecting the
Correspondence: Dr. Djamel Medjahed, National CancerInstitute at Frederick, P.O. Box B, Frederick, MD 21702-1201,USAE-mail: [email protected]: +1-301-846-6827
Abbreviation: CGAP, cancer genome anatomy project
Proteomics 2003, 3, 1445–1453 1445DOI 10.1002/pmic.200300488
2003 WILEY-VCH Verlag GmbH & Co. KGaA, Weinheim
1446 D. Medjahed et al. Proteomics 2003, 3, 1445–1453
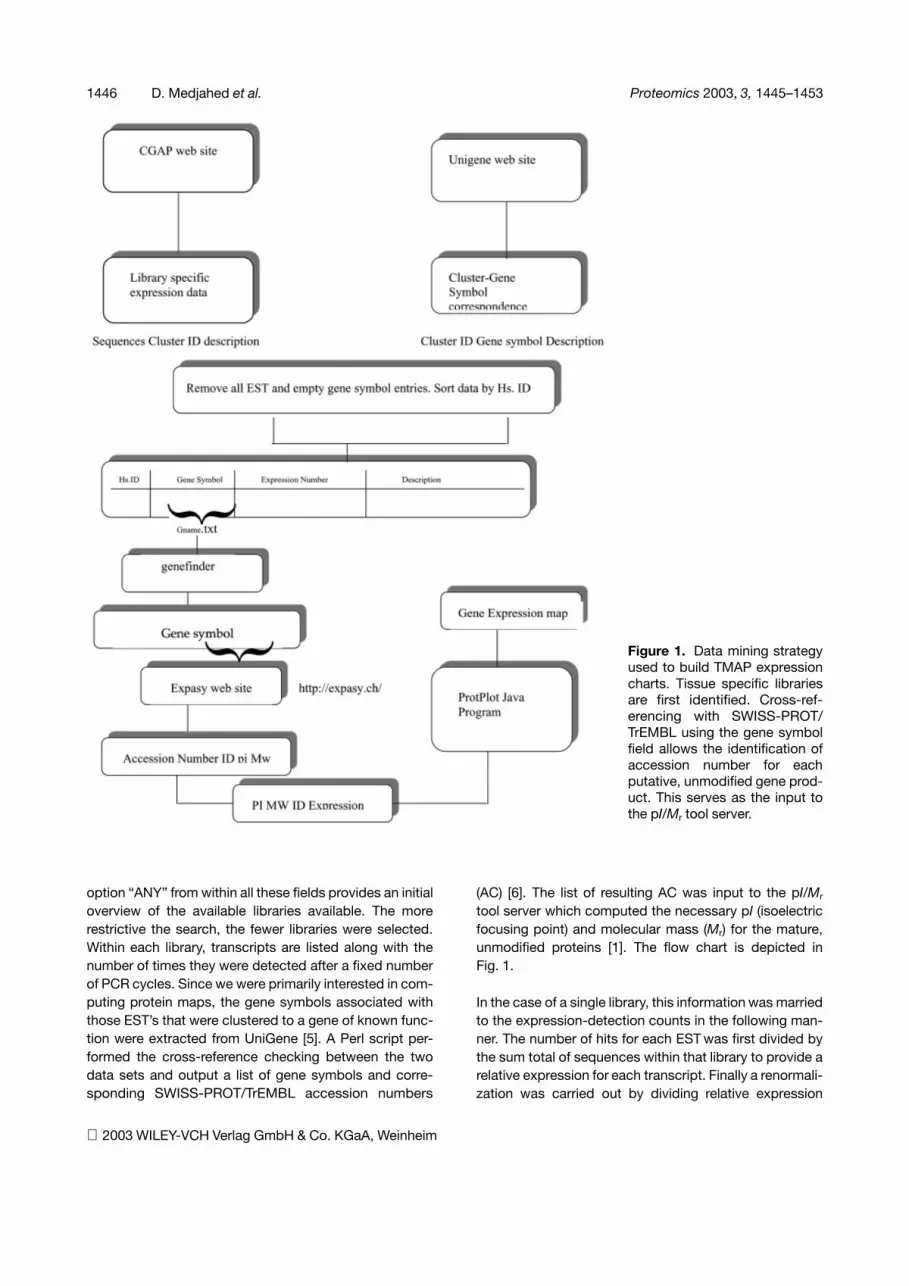
Figure 1. Data mining strategyused to build TMAP expressioncharts. Tissue specific librariesare first identified. Cross-ref-erencing with SWISS-PROT/TrEMBL using the gene symbolfield allows the identification ofaccession number for eachputative, unmodified gene prod-uct. This serves as the input tothe pI/Mr tool server.
option “ANY” from within all these fields provides an initialoverview of the available libraries available. The morerestrictive the search, the fewer libraries were selected.Within each library, transcripts are listed along with thenumber of times they were detected after a fixed numberof PCR cycles. Since we were primarily interested in com-puting protein maps, the gene symbols associated withthose EST’s that were clustered to a gene of known func-tion were extracted from UniGene [5]. A Perl script per-formed the cross-reference checking between the twodata sets and output a list of gene symbols and corre-sponding SWISS-PROT/TrEMBL accession numbers
(AC) [6]. The list of resulting AC was input to the pI/Mr
tool server which computed the necessary pI (isoelectricfocusing point) and molecular mass (Mr) for the mature,unmodified proteins [1]. The flow chart is depicted inFig. 1.
In the case of a single library, this information was marriedto the expression-detection counts in the following man-ner. The number of hits for each EST was first divided bythe sum total of sequences within that library to provide arelative expression for each transcript. Finally a renormali-zation was carried out by dividing relative expression
2003 WILEY-VCH Verlag GmbH & Co. KGaA, Weinheim

Proteomics 2003, 3, 1445–1453 Predictive expression database 1447
Figure 2. Dataflow to compute relative expression levelsfrom CGAP libraries. Nonredundant lists are computed forpooled datasets.
levels by the maximum relative expression level. In theevent a tissue search revealed several libraries fulfillingthe requirements of the initial query, to improve the sig-nal-to-noise ratio (S/N), the results are first pooled so asto generate a nonredundant list of entries and a morecomprehensive expression map for that tissue and corre-sponding to that histological state (Fig. 2).
The final result is a tab-delimited file ‘prp’ format that con-tains expression levels ranging from 0 (undetected) to 1(most abundant). The data that is read by ProtPlot whenlaunched loads the set of prp files, creates a master pro-tein index and provides a graphical user interface to per-form data mining. ProtPlot is a Java program written byPeter Lemkin and is based largely on Java code fromthe open-source MAExplorer [7] (maexplorer.sourceforge.net).
The protein data for each tissue is used in constructingthe master protein index where proteins will be presentfor some tissues and not for others. Data is presented asa pseudo 2-D gel image with the isoelectric point (pI) onthe horizontal axis and the molecular mass (Mr) on the ver-tical axis. Sliders on each of these axes allow zooming a
subregion of interest by restricting the data between theminimum and maximum values of the attributes dis-played. By clicking on any of the hyperlinked spots in thescatter plot, information relevant to that protein is dis-played. If the genomic-ID web browser is enabled andone is connected to the internet, a web page from theselected genomic database for that protein will pop up.
Samples can be viewed in the pseudo 2-D gel using oneof several options. The tissue and histology can beselected using the (File menu � Select Current PRP sam-ple). Two types of scatter plot displays are available:expression data for a single sample (current PRP sample)or the ratio of an X and Y sample (i.e., exprX /exprY). TheX (Y) data is selected using (File menu � Select X (Y) PRPsample). An alternative display called the Expression Pro-file (EP) is a list of a subset of PRP samples. The EP sam-ples can be grouped by histological state, the choice canbe specified using the (File menu � Select Expression Listof samples) command.
The data is passed through a data filter consisting of theintersection of several tests including: pI range, Mr range,sample expression range, expression ratio (X/Y) range(either inside or outside the range), tissue type filter, pro-tein family filter, and clustering. Most of these features arecurrently available while a few clustering and family clas-sification methods will be implemented in future versions.
At the end of a session, all current settings of data miningstrategies can be saved for future use. In addition, toenable information exchange in collaborative efforts,ProtPlot can generate tab-delimited reports as well aspop-up (expression profile) plots and scatter plot (as .gifimage files) of proteins satisfying specific search criteria.These can be saved into the project’s /Report directory.
3 Results
3.1 Statistical analysis: Prostate, a case study
Prostate is one of the better represented tissues in theCGAP database, offering several libraries spanning nor-mal, precancer as well as cancer states. The availabilityof these multiple, independent data sets drasticallyenhances overall quality of the statistical analysis byimproving the S/N. Therefore it was selected as the “test-ing” ground for a number of approaches used to analyzethe data.
Thirteen CGAP microdissected prostate libraries encom-passing normal, precancer and cancer were found(Table 1). After being grouped according to their histologi-cal states, nonredundant lists of the gene-products foundwithin each one was used to compute the pI/Mr charts.
2003 WILEY-VCH Verlag GmbH & Co. KGaA, Weinheim

1448 D. Medjahed et al. Proteomics 2003, 3, 1445–1453
Table 1. Microdissected prostate CGAP libraries used to construct an overall pI/Mr map for each histopathological state.Normal (N1–N4), precancer (P5–P9) and cancer (C10–C13). The last column represents the list of gene productsused to construct each chart.
Dataset UniGene ID CGAP Library ID Patient Sample type Gene products
N1 281 NCI_CGAP_Pr1 1 Normal epithelium 3034N2 515 NCI_CGAP_Pr5 2 Normal epithelium 940N3 526 NCI_CGAP_Pr9 3 Normal epithelium 1218N4 529 NCI_CGAP_Pr11 4 Normal epithelium 1354P5 282 NCI_CGAP_Pr2 1 Premalignant lesion 3303P6 511 NCI_CGAP_Pr6 2 Premalignant lesion 1343P7 538 NCI_CGAP_Pr7 2 Premalignant lesion 723P8 544 NCI_CGAP_Pr4 1 Premalignant lesion 834P9 545 NCI_CGAP_Pr4.1 1 Premalignant lesion 1132C10 283 NCI_CGAP_Pr3 1 Adenocarcinoma 2442C11 513 NCI_CGAP_Pr8 2 Adenocarcinoma 625C12 523 NCI_CGAP_Pr12 5 Adenocarcinoma 2362C13 527 NCI_CGAP_Pr10 3 Metastatic adenocarcinoma 747
In addition, using ProtPlot one can compute the ratio ofany two maps, which will obviously be carried out overthose entries found in both charts. Finally interactiveexpression profiles across all preselected samples (inthis case, cancer only) can be displayed on the fly. Usingthese tools, one can readily flag gene products with a sig-nificant differential expression for postanalysis experi-mental verification.
One such example is the 60S ribosomal protein L41(SWISS-PROT ID RL41-HUMAN) whose relative expres-sion appears to steadily increase from the normal to thecancerous state as shown Fig. 3. Additional informationregarding this protein, obtained by clicking the corre-sponding spot which is hyper-linked to a database ofchoice (e.g., SWISS-PROT) reveals it to be a modulatorof cyclin-dependent kinase II, one of the major elementsof cell cycle and cell proliferation [10].
When multiple libraries are pooled, the basic assumptionis that the individual libraries represent unbiased samplesfrom a “true” dataset that contains all of the expressionlevels for a particular tissue in a given histological state.This basic assumption can be tested using the FisherExact Test to determine the probability that the expres-sion level of a given gene is the same in two datasets.For any given pair of pool sizes (N, M) and gene counts(c and C) the probability p of the table being generatedby chance is calculated (see table 2) where:
p � �N! M! c! C!���N � M�! a! b! A! B!� (1)
The null hypothesis of a gene being equally represented intwo pools is rejected when probability p �= 0.05, where0.05 is the level of statistical certainty (95% confidence
level). Furthermore if � denotes the number of observa-tions of a specific gene in a given library, where the totalnumber of observations of all genes is represented by n,the probability of detecting that particular gene product issimply the ratio:
� � �n
(2)
An obvious normalization condition is:
� � = 1 (3)
An estimate of the uncertainty in this probability at the95% confidence level is given by [9]
�� = 1.96 [�–�2/n]1/2 (4)
This can be used to place 95% confidence limits on thenumber of observations of a specific gene.
Probability of observation = � � 1.96 [�–�2/n]1/2 (5)
= {� � 1.96 [� (1 –�/n)]1/2}/n
For small numbers of observations, �/n will be muchsmaller than one and can be removed from the equationabove. This produces:
Number of observations � �� 1.96 [�]1/2 (6)
The following table depicts how this translates for low-abundance gene products.
2003 WILEY-VCH Verlag GmbH & Co. KGaA, Weinheim

Proteomics 2003, 3, 1445–1453 Predictive expression database 1449
Figure 3. TMAP screenshots for prostate through (a) normal; (b) precancer; and (c) cancer histological states. The respec-tive ranges for the isoelectric focusing point (pI) on the horizontal axis and molecular weight (Mr) on the vertical axis corre-spond to the boundaries of the dataset. The relative expressions of the gene products computed as described in the textare grouped and color-coded as follows: �� 1.0 ��0.721 ��0.514 ��0.365 ��0.248 ��0.163 ��0.098 ��0.054;(d) represents the ratio cancer over normal for those gene products detected in both states; (e) Through this panel theuser is able to select both tissue and state (here, set for all); (f) expression profiles across all set tissues.
� ��
1 1.962 2.773 3.394 3.925 4.38
This clearly demonstrates that for any gene product, if thenumber of times it has been detected is less than 5 (in anappropriately sized pool of transcripts), the uncertainty inthat measurement is of the same magnitude as the meas-urement. This can be summarized as follows: low abun-
dance (detected less than five times) or even undetectedare approximately equally unreliable and therefore oughtnot to be included in any statistical analysis.
3.2 Cluster analysis
Another way to obtain this result is to use the Fisher for-mula and determine the probability that “a” observationsof a gene is statistically (95%) the same as not observingit at all, in the same dataset. Therefore, if b = 0, B = M = N,c = a, C = 2N – a, the preceding formula for the probabilityof “a” and “0” representing the same result is
p = (N!/(N – a)!) ((2N – a)!/(2N)!) (7)
2003 WILEY-VCH Verlag GmbH & Co. KGaA, Weinheim

1450 D. Medjahed et al. Proteomics 2003, 3, 1445–1453
Table 2. Definition [4] of the terms used in equations (1–6). Given two pools (A, B) containing respectively N, M sequencesin total.
Pool A a = Number of sequences in poolA assigned to Gene 1
A = Number of sequences in PoolA NOT assigned to Gene 1
N = a + A
Pool B b = Number of sequences in poolB assigned to Gene 1
B = Number of sequences in PoolB NOT assigned to Gene 1
M = b + B
Total c = a + b C = A + B N + M = c + C
Figure 4. Clustering dendogram of microdissected pros-tate libraries according to the average p-value amonggene products detected five or more times.
which reduces to
p = [(N)(N – 1). . .(N – a + 1)]/[(2N)(2N – 1). . .(2N – a + 1)] (8)
For reasonably large N, this result is very close to
p = (1/2)^a (9)
If p has to be less than 0.05, then “a” must be 5 or more.
This “minimum of five observations” rule can be used in thecomparison of two datasets. For example, the compiledresults for prostate generated 13 datasets; four representinggene expression in normal cells (N1 through N4), five repre-senting gene expression in precancer cells (P5 through P9),and four representing gene expression for cancer cells (C10through C13). The Fisher Exact Test can be used to deter-mine whether these 13 datasets are sampled from thesame or different “true” expression datasets.
In particular, two datasets are compared on a gene-by-gene basis. If the observation level is less than 5 for a par-ticular gene in both datasets, that gene is ignored since astatistically significant difference does not exist. Other-wise, the Fisher p-value is calculated. The average ofthese p-values represents the average probability thatthese libraries are statistically similar for the set of genes
Table 3. Pairwise comparison of the expression foreach gene product expressed more than fivetimes in any dataset for all libraries. (Set 1denotes Normal 1 (N1), set 2 denotes Nor-mal 2 (N2), etc.).
Set Set AVG(P) Number
1 2.3 3385 1161 3.2 3867 1161 4.1 8101 1211 5.0 7700 1871 6.1 9752 1171 7.5 3119 1121 8.4 0839 1131 9.2 6353 1141 10.0 1336 2311 11.1 9340 1301 12.0 1357 2071 13.1 5596 139
2 3.0 9598 192 4.1 0614 272 5.3 7594 1372 6.0 6117 172 7.1 7255 92 8.0 7436 112 9.0 9380 162 10.3 3458 1282 11.0 3681 272 12.2 6915 1042 13.0 4470 36
3 4.0 9349 283 5.2 6347 1373 6.0 5776 213 7.2 2508 143 8.1 2551 173 9.0 9850 223 10.2 0063 1333 11.0 1553 323 12.1 4508 1093 13.0 1593 41
4 5.2 2017 1394 6.0 5583 284 7.2 6219 194 8.1 7250 224 9.0 9973 27
2003 WILEY-VCH Verlag GmbH & Co. KGaA, Weinheim

Proteomics 2003, 3, 1445–1453 Predictive expression database 1451
Table 4. Interlibrary similarity can be evaluated by computing the distance matrix displaying the average p-values of allthirteen prostate datasets when compiled over all gene products expressed five or more times in each library.
N1 N2 N3 N4 P5 P6 P7 P8 P9 C10 C11 C12 C13
N1 1.00000 .09262 .06673 .07534 .10599 .08484 .00000 .00658 .06775 .00000 .00000 .00000 .00000N2 .09262 1.00000 .16833 .17918 .05304 .01647 .00000 .08186 .10440 .00000 .00000 .00000 .00000N3 .06673 .16833 1.00000 .16959 .06946 .07344 .00000 .00000 .10135 .00000 .00000 .00000 .00000N4 .07534 .17918 .16959 1.00000 .05743 .11575 .00000 .00000 .18116 .00000 .00000 .00000 .00000
P5 .10599 .05304 .06946 .05743 1.00000 .06729 .00000 .00188 .06813 .00000 .00000 .00000 .04098P6 .08484 .01647 .07344 .11575 .06729 1.00000 .00000 .00000 .00070 .00000 .00000 .00000 .00000P7 .00000 .00000 .00000 .00000 .00000 .00000 1.00000 .00000 .00000 .00000 .00000 .00000 .00000P8 .00658 .08186 .00000 .00000 .00188 .00000 .00000 1.00000 .15987 .00000 .00000 .00000 .00000P9 .06775 .10440 .10135 .18116 .06813 .00070 .00000 .15987 1.00000 .00000 .00000 .00000 .00000
C10 .00000 .00000 .00000 .00000 .00000 .00000 .00000 .00000 .00000 1.00000 .09014 .12158 .07215C11 .00000 .00000 .00000 .00000 .00000 .00000 .00000 .00000 .00000 .09014 1.00000 .09398 .16075C12 .00000 .00000 .00000 .00000 .00000 .00000 .00000 .00000 .00000 .12158 .09398 1.00000 .06478C13 .00000 .00000 .00000 .00000 .04098 .00000 .00000 .00000 .00000 .07215 .16075 .06478 1.00000
that have five or more observations in at least one of thetwo datasets. These average p-values can be used todetermine a pseudo-distance between the 13 datasets,which can then be used in a clustering algorithm. Thispseudo-distance, D, between two datasets is obtainedfrom their average p-value, �, using the expression
D = [(1 + �)/(� + �)] – 1 (10)
In this expression � is a constant so that when � = 0,D = 1/�. With values of D for all pairs of datasets, anagglomerative clustering can be performed. A dendo-gram showing the results from single linkage clusteringof the 13 datasets is presented in Fig. 4. This dendogramuses � = 0.04 in the above distance equation, so the max-imum separation between datasets that have no chanceof representing the same results is 25.0.
Table 3 compares all pairs of datasets to determine theextent to which they are statistically similar. This is doneby looking at all genes that are expressed in the two data-sets (five or more observations) and by determining theaverage p-value for this set of expressed genes. The listat the top of the file gives the number of the first dataset,the number of the second dataset, the average p-valuefor the genes that are expressed in each set, and the num-ber of genes used for this average. In Table 4 we computethe average p-value matrix for these 13 datasets. Theseresults show that the normal datasets (first four) agreewith each other with an average probability of 6.67%or higher. Similarly, the cancer datasets (last four) agreewith each other with an average probability of 6.48% orhigher. There is a 0.0 probability that a normal datasetand a cancer dataset are samples of the same, large data-set. In other words, these samples came from differentpools. A closer examination of the top part of the output
shows that no gene is significantly expressed in both anormal (sets 1–4) and a cancer (sets 10–13) dataset.Every precancer dataset (5–9) but #7 has a significantagreement with at least one normal dataset, and noagreement with any cancer dataset. Dataset 7 either hasno significantly expressed genes, or has no significantlyexpressed gene that is not significantly expressed in anyother dataset (the union of expressed genes from 7 andany other dataset is the empty set).
4 Discussion
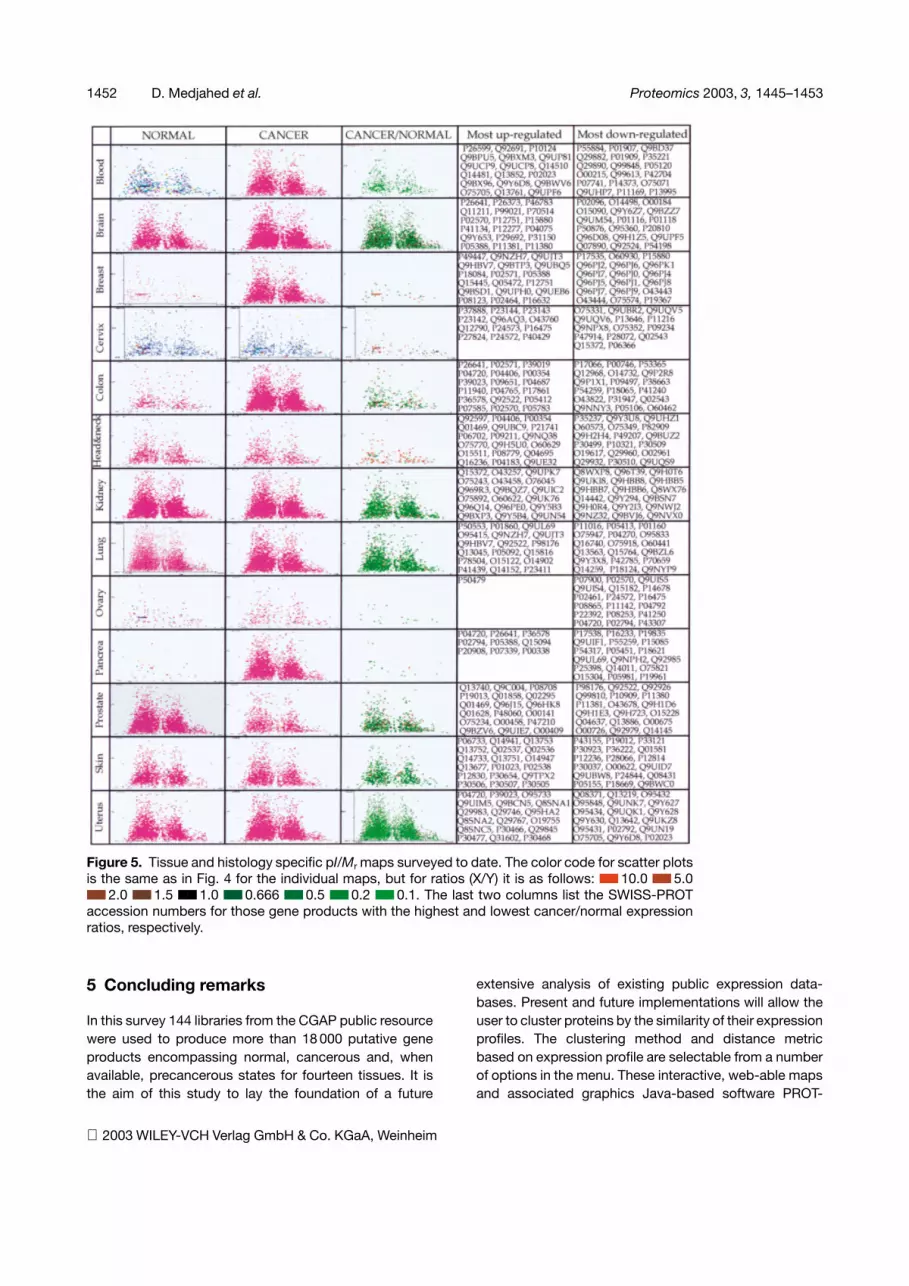
Figure 5 depicts the pI/Mr maps computed by ourapproach for a number of these tissues. They all displaythe characteristic bimodal distribution that was explainedpreviously as the statistical outcome of a limited, pK-seg-regated proteomic alphabet [1]. In addition one canquickly obtain the most significantly differentially ex-pressed gene proteins by computing the tissue-specificcharts of the ratios between normal and cancer states.
Finally, given a reduced number of histological states, thenumber of possible scenarios for the behavior of expres-sion of any gene product is finite. If normal and cancerstates are the only options, then there are only three pos-sible cases in going from one to the other: (1) remain at thesame level, (2) up-regulated; (3) down-regulated. If thereare three histological states to consider (normal, precan-cer and cancer), the number of possible scenarios jumpsto nine as can be attested in Fig. 6. One possible applica-tion of this approach is that one is able to cluster thosegene products that are potentially inversely correlated.One such example is provided by p27, down-regulatedin prostate cancer as a result of proteolitic cleavage byan overexpressed enzyme, Skp2.
2003 WILEY-VCH Verlag GmbH & Co. KGaA, Weinheim
1452 D. Medjahed et al. Proteomics 2003, 3, 1445–1453
Figure 5. Tissue and histology specific pI/Mr maps surveyed to date. The color code for scatter plotsis the same as in Fig. 4 for the individual maps, but for ratios (X/Y) it is as follows: �� 10.0 �� 5.0�� 2.0 �� 1.5 �� 1.0 �� 0.666 ��0.5 ��0.2 �� 0.1. The last two columns list the SWISS-PROTaccession numbers for those gene products with the highest and lowest cancer/normal expressionratios, respectively.
5 Concluding remarks
In this survey 144 libraries from the CGAP public resourcewere used to produce more than 18 000 putative geneproducts encompassing normal, cancerous and, whenavailable, precancerous states for fourteen tissues. It isthe aim of this study to lay the foundation of a future
extensive analysis of existing public expression data-bases. Present and future implementations will allow theuser to cluster proteins by the similarity of their expressionprofiles. The clustering method and distance metricbased on expression profile are selectable from a numberof options in the menu. These interactive, web-able mapsand associated graphics Java-based software PROT-
2003 WILEY-VCH Verlag GmbH & Co. KGaA, Weinheim

Proteomics 2003, 3, 1445–1453 Predictive expression database 1453
Figure 6. (a) Color-coded symbolic representation of all possible scenarios of expression profile through three histologicalstates N = P = C, N = P � C, N = P � C, N � P � C, N � P � C, N � P = C, N � P = C, N � P � C, N � P � C; (b) color-codedclustering for entries found in all three histological states (intersection); (c) color clustering of non-redundant list found in anyof the three histological states.
PLOT collectively known as VIRTUAL2D [1] and TMAPare available to the nonprofit research community uponrequest.
Received January 10, 2003
6 References
[1] Medjahed, D., Smythers, G. W., Stephens, R. M., Powell, A. D.et al., Proteomics 2003, 3, 129–138.
[2] Grouse, L. H., Munson, P. J., Nelson, P. S., Urology 2001, 57,(Suppl. 1), 154–159.
[3] Ryu, B., Jones, J., Hollingsworth, M. A., Hruban, R. H., Kern,S. E., Cancer Res. 2001, 61, 1833–1838.
[4] Cancer genome anatomy project at http://CGAP.nci.nih.gov/
[5] UniGene at http://www.ncbi.nlm.nih.gov/
[6] SWISS-PROTat http://www.expasy.ch
[7] Lemkin, P. F., Thornwall, G. C., Walton, K. D., Hennighausen,L., Nucleic Acid Res. 2000, 28, 4452–4459.
[8] Lee, J.-H., Kim, J.-M., Kim, M.-S., Lee, Y.-T. et al., Biochem.Biophys. Res. Commun. 1997, 238, 462–467.
[9] Gillespie, J. H. in: Population Genetics: A Concise Guide,The Johns Hopkins University Press, Baltimore 1998 p. 8.
[10] http://us.expasy.org/cgi-bin/niceprot.p1?P28751
2003 WILEY-VCH Verlag GmbH & Co. KGaA, Weinheim


