Embed Size (px)
Citation preview

J . Phys. Chem. 1991,95, 8975-8982 8975
Since our search proved negative, we can say nothing about the thermochemistry of the negative ion HC03- or about the energetics of reaction 1. The species H2C03(g) has recently been identified" as a product of the decomposition of NH4HC03(s) a t 400 K, but as noted above, equilibrium calculations indicate that this species should be completely negligible under our ex- perimental conditions.
Appendix Thermodynamic data for Na2C03(s), H20(g), and COz(g) were
taken from the JANAF tables,I5 while values for NaOH(g) and Na20(g) were taken from the compilation of Glushko et a1.I2 Thermal functions for NaHC03(g) and Na2C03(g) were calcu- lated from molecular constants estimated as follows.
Na2C03(g). The moments of inertia were estimated from corresponding values in NaZSO4, K2C03, and K2SO4,I2 while the fundamental frequencies were selected by analogy with those tabulated for K2C03.'2
NaHC03(g). A planar structure was assumed, with structural parameters for the H C 0 3 group as given by the calculations of Jonsson et al? the Na-O distance was taken to be 0.23 nm, with the Na located along an Na-C-0-H axis. The COONa fre-
(13) Lau, K. H.; Brittain, R. D.; Lamoreaux, R. H.; Hildenbrand, D. L. J . Electrochem. Soc. 1985, 132, 3041.
(14) Terlouw, J. K . ; Lebrilla, C. B.; Schwarz, H. Angew. Chem. Int . Ed. Engl. 1987, 26, 354.
(15) Chase, M. W.; Davies, C. A.; Downey, J . R.; F ~ r i p , D. J.; McDonald, R. A.; Syverud, A. N. J . Phys. Chem. Ref. Data 1985, 14, Suppl. No. I .
quencies were taken from those estimated above for Na2C03, while those for the COH group were estimated by analogy with those of LiOH and NaOH.I2 The estimated frequencies associated with the overall HC03 group are consistent with the HCOY funda- mentals assigned from the infrared spectra of decomposed bi- carbonate salts in alkali halide matrices.I6
A summary of the estimated molecular constants of Na2C03 and N a H C 0 3 are listed in Table I1 in terms of the moments of inertia ( I ) , fundamental frequencies (a), rotational symmetry number (a), and electronic ground state statistical weight (g). Tables of thermal functions calculated from these constants are given in Tables 111 and IV, based on a standard-state pressure of 1 atm. Uncertainties in the entropies and Gibbs energy functions are estimated to be on the order of 2 kcal K-' mol-' a t 298 K and 3 cal K-' mol-' a t 1000 K. For the sake of internal consistency, more significant figures are included than are war- ranted by the accuracy of the calculated functions.
Acknowledgment. This work was supported by the Geophysics Laboratory, Air Force Systems Command, Hanscom AFB, MA. We are grateful for stimulating discussions with Dr. E. Murad of that organization.
Registry No. Na2C03, 497-19-8; NaOH, 13 10-73-2; C 0 2 , 124-38-9; H20, 7732-18-5; H2. 1333-74-0; NaHCO,, 144-55-8; 0,7782-44-7; Na, 1440-23-5.
(16) Bernitt, D. L.; Hartman, K. 0.; Hisatsune, I. C. J. Chem. Phys. 1965, 42. 3553.
Time-Resolved Fluorescence and Self-Diff usion Studies in Systems of a Cationic Surfactant and an Anionic Polyelectrolyte
Kyrre Thalberg; Jan van Stam,*** Cecilia Lindblad,t Mats Almgren,* and Bjorn Lindmant Physical Chemistry I , Chemical Center, University of Lund, POB 124, S-221 00 Lund, Sweden, and Department of Physical Chemistry, Uppsala University, POB 532, S-751 21 Uppsala, Sweden (Received: February 8, 1991)
The interaction between the anionic polysaccharide hyaluronan (Hy) and the cationic surfactants decyl-(CloTAB) and dodecyl-(C12TAB) trimethylammonium bromide has been investigated by 'H NMR self-diffusion measurements and by time-resolved fluorescence measurements with pyrene as the probe and dimethylbenzophenone as the quencher. The critical aggregation concentration (cac) was found to be slightly lower than the cmc and about half of the cmc, for CloTAB and C12TAB, respectively. The cac is furthermore seen to depend on the Hy concentration. The steady-state spectra for pyrene in surfactant solutions with and without Hy are almost identical, which indicates a structure of surfactant micelles in the presence of Hy. The fluorescence lifetime, T ~ , for pyrene is increased by the interaction between the surfactants and the polyelectrolyte, due to the ability of the polyelectrolyte to displace the bromide ions from the micellar surface. The increase is considerably larger for the longer surfactant. The r0 value furthermore depends on the quotient between Hy and surfactant in the sample. The fluorescence decay curves obtained in the presence of quencher are of the same type as for ordinary micelles, in the presence of Hy, and are well described by the model proposed by Infelta et al. The aggregation numbers for the micelles are relatively unaffected by the presence of Hy.
Introduction The field of polymer-surfactant interactions in aqueous solution
has been studied for more than 20 years, and several reviews have appeared.I4 More recently, an increasing interest has been directed toward the structure of polymer-surfactant aggregates which spontaneously are formed in many systems of this type, and a variety of methods have been used to examine polymer-sur- factant systems. Among the most successful methods are small-angle neutron scattering (SANS) studies,5v6 different nuclear magnetic resonance (NMR) and photophysical
'To whom correspondence should be addressed. 'University of Lund. tuppsala University.
methods, such as fluorescence quenching techniques.e14 The general picture emerging from these studies is that the surfactant
(1) Robb, 1. D. Anionic surfactants in physical chemistry of surfactant action; Lucassen-Reynders, E., Ed.; Marcel Dekker: New York, 1981; Chapter 3.
(2) (a) Goddard, E. D. Colloids Surj. 1986, 19, 255. (b) Goddard, E. D. Colloids SurJ 1986, 19, 301.
(3) Saito, S. Nonionic surfactant, Physical Chemistry; M. J. Schick, Ed.; Surfactant Science Series 23; Marcel Dekker: New York, 1987; Chapter IS.
(4) Hayakawa, K.; Kwak, J . Cationic surfactants: Physical Chemistry; Rubingh, D., Holland, P. M., Eds.; Surfactant Science Series 37; Marcel Dekker: New York, 1991; Chapter 5.
(5) (a) Cabane, B.; Duplessix, R. J . Phys. 1982, 43, 1529. (b) Cabane, B.; Duplessix, R. Colloids Surf. 1985, 13, 19. (c) Cabane, B.; Duplessix, R. J . Phys. 1987, 48, 651.
0022-3654/91/2095-8975%02.50/0 0 1991 American Chemical Society
8976 The Journal of Physical Chemistry, Vol. 95, No. 22, IF
molecules adsorb to the polymer chains as micellar or micellar-like clusters. This seems to be the case for systems of uncharged polymers and ionic ~urfactants"~ as well as for systems of charged polymers (Le., polyelectrolytes) and oppositely charged surfac- t a n t ~ . ~ ~ , ' The surfactant concentration required to induce sur- factant binding to the polyelectrolyte is termed the critical ag- gregation concentration, denoted cac. Cac is always lower than its analogue in polymer-free solution, the critical micelle con- centration (cmc), and the lowering is particularly pronounced for polyelectrolytes with opposite charge to that of the surfactant and with a high linear charge density.
The fluorescence quenching method makes use of the fact that a probe molecule, which is excited by light of suitable wavelength, can relax to its ground state by either fluorescence or other, radiative or nonradiative, processes. One way to deactivate the probe molecule is to introduce another molecule which can take over the excitation energy from the probe and thereby quench the fluorescence. From the fluorescence decay after excitation with a brief pulse of light, it is possible to extract information about both static properties and dynamic events that occur in the system on the time scale determined by the choice of probe and quencher. The time-resolved fluorescence quenching method has proved to be a powerful tool for the determination of different parameters in micellar systems and is well described in the l i t e r a t ~ r e . ' ~ . ~ ~ The parameters most commonly determined are the aggregation number and the rate constants for the natural decay of the probe and the enhanced decay mediated by the quencher molecule. These parameters are also of fundamental importance for the understanding of the interaction between micelles and polymers.
For systems containing uncharged polymers, the aggregation number for the polymer-bound surfactant aggregates is seen to be smaller than for the free micelles," as is also predicted by theory.'* [However, the theories predict a much smaller effect on the micellar size than what is found experimentally in the system sodium dodecayl sulfate-poly(ethy1ene o~ide)-water. '~] For systems containing polyelectrolytes, no clear picture of how the aggregation number is influenced has been obtained, which partly is due to the scarcity of data. The few studies performed in these types of systems give a rather scattered picture. Abuin and ScaianoI2 found micellar clusters of only 7-10 surfactant molecules in the system of dodecyltrimethylammonium bromide (C12TAB) and poly(styrene sulfonate) (PSS), which can be
(6) Leung, P. S.; Goddard, E. D.; Han. C.; Glinka, C. J. Colloids Surf. 1985, 1 3 , 4 i .
(7) Cabane, B. J . Phys. Chem. 1977,81, 1639. 181 Ia) Ciao. 2 . : Wasvlishen. R. E.: Kwak. J. C. T. J . Colloid Interface . I , ,
Sci. 1988. 126,3711 (b) Gao, 2:; Wasylishen,'R. E.; Kwak, J. C. T. J. $hys. Chem. 1990.94,773.
(9) Almgren. M.; van Stam, J.; Lindblad, C.; Li, P.; Stilbs, P.; Bahadur, P. J . Phys. Chem. 1991, 95, 5677.
(IO) (a) Zana, R.; Lang, J.; Lianos, P. Polym. Prepr. (Am. Chem. Soc., Diu. Polym. Chem.) 1982.23.39. (b) Binana-Limbele, W.; Zana, R. Mac- romolecules 1990,23,2731. (c) a n a , R.; Lianas, P.; Lang, J. J . Phys. Chem. 1985.89, 41.
(1 1) Chandar, P.; Somasundaram, P.; Turro, N . Macromolecules 1988, 21. 950.
(12) Abuin, E. B.; Scaiano, J. C. J . Am. Chem. SOC. 1984, 106, 6274. (13) (a) Chu, D.; Thomas, J. K. J. Am. Chem. Soc. 1986,108,6270. (b)
Chu, D.; Thomas, J. K. Polymers in Aqueous Media. Performance Through Association; Glass, E., Ed.; Advances in Chemistry Series 223; American Chemical Society: Washington, DC, 1989; Chapter 17. (c) Chu, D.; Thomas, J. K. Photophysics of Polymers; Hoyle, C. E., Torkelson, J . M., Eds.; ACS Symposium Series 358; American Chemical Society: Washington. DC, 1987; Chapter 32.
(1 4) (a) Zhao, C.; Winnik, M. A.; Ries, G.; Croucher, M. Langmuir 1990, 6,514. (b) Hu, Y.; Zhao, C.; Winnik, M. A.; Sundarajan, P. Langmuir 1990, 6, 880.
(1 5) Zana, R. Surfactant Solutions. New Methods of Investigations; a n a , R., Ed.; Surfactant Science Series 22; Marcel Dekker: New York and Basel, 1987; Chapter 5.
( 16) Almgren. M. Kinetics and Catalysis in Microhererogenous Systems; Grgtzel, M., Kalyanasundaram, K., Eds.; Marcel Dekker: New York, in pres.
( 1 7) Francois, J.; Dayantis, J.; Sabbadin, J. Eur. Polym. J . 1985, 21 (2). 165.
(18) Nagarajan, R. Colloids Surf. 1985. 13, 1 . (19) van Stam, J.; Almgren, M.; Lindblad, C. Progress in Colloid &
Polymer Sciene; Corti, M., Mallamace, F., Eds.; Steinkopff Darmstadt, in press; Vol. 84.
191 Thalberg et al.
compared to the aggregation number of free CI2TAB micelles of about 45.20 Chu and found an aggregation number of 105 f 10 in a system with decyltrimethylammonium bromide (CloTAB) and poly(methy1 acrylate) (PMA) at pH = 8. For this surfactant, the aggregation number for free micelles is only about 35 (see below), indicating that the presence of the polyelectrolyte induces a considerable growth in micellar size. It should be noted here that the value 105 seems to be an overestimation, as also the free surfactant monomers were i d u d e d in the calculation.'" If the aggregation number is corrected, it will be approximately 60, still indicating growth in micellar size.
Our intention is to carry out a systematic study in systems of a polyelectrolyte and an oppositely charged surfactant, and to try to relate the obtained information about the surfactant aggregates to the phase behavior. We have chosen to study the polysaccharide hyaluronan, abbreviated Hy, which is used as a sodium salt a t pH 7, and cationic surfactants of the alkyltrimethylammonium bromide type with IO and 12 carbon atoms in the alkyl chain (denoted CloTAB and C12TAB, respectively). The phase behavior is fairly well understood for this kind of system,2' and phase diagrams have been worked out22 (see also Figures 1 and 2). In essence, these contain a droplet-shaped two-phase region which is located close to the water corner and is totally enclosed by isotropic solution. Fluorescence quenching studies have been performed both in one-phase samples containing polyelectro- lyte-bound surfactant and in the dilute and concentrated phases of phase-separating samples. The fluorescence lifetime for pyrene, T ~ , and the aggregation number of the surfactant aggregates, as obtained from quenching by dimethylbenzophenone (DMBP), are the main parameters studied.
In order to obtain aggregation numbers for the surfactant aggregates, the concentration of surfactant molecules that par- ticipate in the aggregates, or equivalently, the free surfactant monomer concentration in the sample, has to be known. We have determined this by means of surfactant self-diffusion studies in the samples prior to the fluroescence measurements.
Experimental Section Materials. Sodium hyaluronate (NaHy) was obtained from
Pharmacia AB, Uppsala, Sweden. The molecular weight was reduced by acid hydrolysis (0.1 M HCI, 70 "C), followed by neutralization and dialysis of excess salt. The weight-average molecular weight, M,, thus obtained was about 80000 in a preparation used for ordinary samples and about 23000 in a preparation used for phase-separating samples (results from viscometry and light scattering). All Hy solutions were extensively dialyzed against pure water and then freeze-dried, prior to the preparation of stock solutions. The linear charge density for Hy at neutral pH is about 1 charge per nanometer (Le., one charged group per repeating disaccharide unit), which means that 1 .O% w/v of NaHy corresponds to 25 mM polyelectrolyte charge units.
The surfactants, decyl- and dodecyltrimethylammonium bromide (CloTAB and CI2TAB, respectively), were purchased from Tokyo Kasei Inc., Japan, and were used without further purification. Pyrene (Aldrich) and dimethylbenzophenone (DMBP) (Aldrich 99%) were recrystallized twice from ethanol.
Sample Preparation, (A) Ordinary Samples. A certain amount of a stock solution of pyrene in methyl chloride was introduced into an empty sample tube, and the solvent was evaporated. A stock solution of NaHy, water (D20), and surfactant was then introduced directly into the tube in this order, followed by equilibration end over end for a couple of days. The pyrene concentration was always low enough to prevent excimer for- mation.
(20) (a) Ben, S. S. J . Phys. Chem. 1987.91,4760. (b) Reekmans, S.; Luo, H.; van der Auweraer, M.; de Schrijver, F. Lungmuir 1990, 6, 628. (c) Almgren, M.; Hansson, P.; Mukhtar, E.; van Stam, J. Langmuir, submitted for publication.
(21) Thalberg, K.; Lindman, B.; KarlstrBm, G . J . Phys. Chem. 1990, 94, 4289.
(22) Thalberg, K.; Lindman, B.; KarlstrBm, G. J . Phys. Chem. 1991, 95, 3370.

Time-Resolved Fluorescence and Self-Diffusion Studies The Journal of Physical Chemistry, Vol. 95, No. 22. 1991 8977
a
Water' \ 5 10 l b 2b
b
% NaHy - NaHy
H~O-~---NIHY
Figure 1. Phase diagram for NaHy and CloTAB in D20 (a) and in H20 (b) (from ref 22). (In the case of D20, correction for the difference in molar mass has been made when drawing the diagram.) Squares refer to samples used for fluorescence measurements, and crosses refer to samples used for self-diffusion measurements solely. With regard to the two-phase region, filled circles connected by tie lines refer to dilute and concentrated phases in equilibrium. The dashed part of the phase boundary indicates larger uncertainty. In panel a, the cmc for the sur- factant is indicated and the cac behavior of the system is outlined.
(B) Phase-Separating Samples. The preparation of phase- separating samples was similar, except that ordinary water was used instead of D20. Equilibration was carried out more thor- oughly including centrifugation of the samples (30 min at ap- proximately lOOOg), in order to promote the macroscopic phase separation. Finally, two clear and isotropic phases in equilibrium were obtained; the dilute phase (the supernatant), containing almost no polyelectrolyte, and the concentrated phase, which is rich in both polyelectrolyte and surfactant. The concentrated phase may often display a gel-like behavior, and its properties have been described elsewhere.23 It should be noted that, due to the very low M, of NaHy used in this study, the concentrated phase is not highly viscous. The two phases of each sample were physically separated and weighed. The dilute phase was analyzed for Hy-, Br-, Na+, and C,TA+ as previously described,2' and from the results, the composition of the corresponding concentrated phase is obtained.
(C) Addition of Quencher. The quencher, DMBP, was added as a stock solution in ethanol. After evaporation, DMBP was dissolved in the pyrene-containing polyelectrolyte-surfactant so- lution and the solutions were allowed to stand for least 2 days, in order to ensure equilibrium conditions. Probe solutions without DMBP were used for measurement of the natural lifetime, T,,, and solutions containing quencher were used in the determination of aggregation numbers. The maximum quencher concentration was always less than one quencher molecule per micelle or cluster. The solutions were not deoxygenated-therefore, oxygen con- tributes to the observed quenching in the samples. This affects T~ but not the use of the Infelta model (see Methods below). The effect of oxygen on 70 was measured separately.
30 % NaHy -
9 z t.
0.0 1 0 1 2 3 4 5 6 7
Hy concentration (wt96)
b
10 20 30 40 H20
-I
a
-- NaHy
XNaHy - Figure 2. Phase diagrams for NaHy and CI2TAB in D20 (a) and in H,O (b) (from ref 22). Symbols are as in Figure 1. Panel a, which shows only a minor part of the phase diagrams, focuses on the lower phase boundary and the cac behavior. The circles indicate the appearance of turbidity due to phase separation, as determined by direct mixing of NaHy and surfactant.
(D) Location of the Samples in the Phase Diagrams. The compositions of the samples used in this study are indicated in the phase diagrams of Figures 1 and 2. As we have prepared samples with both D 2 0 and H 2 0 and, moreover, the molecular weight of Hy differs in the two solvents, two-phase diagrams are shown for each surfactant. In Figure la, the NaHy-CloTAB-D20 system is shown. The squares indicate samples used for fluorescence measurements (samples Dl-D6 in Tables I1 and IV), and the crosses indicate samples used for self-diffusion mea- surements only. In addition, the cmc and a curve describing the cac behavior are included (dotted line) and will be discussed below. In Figure 1 b, the corresponding phase diagram with H20 is given (from ref 22). The pyrene-containing samples used in this study (squares) are seen to fall well into the picture traced out by the other samples, indicating that the pyrene does not significantly perturb the phase behavior of the system.
The water-rich part of the NaHy-C12TAB-D20 system is shown in Figure 2a, including samples used for fluorescence and self-diffusion measurements, and the cac behavior is outlined (dotted line). The entire two-phase region of this system (with H 2 0 ) is shown in Figure 2b (from ref 22). The two-phase region is similar in shape but considerably larger than in the CloTAB system. Again, the pyrene-containing samples are seen to agree with the phase boundary as determined by pyrene-free samples.
Methods. (A) 'H NMR Self-Diffusion Measurements. Self- diffusion coefficients for the surfactant cation were determined by IH NMR on a JEOL FX-60 spectrometer using the FT PGSE (Fourier transform pulsed-gradient spin-echo) technique. The method has been extensively described by Stilbs," and it has been applied to polymer-surfactant system^.^'^^^ The N-methyl proton
~~
(24) Stilbs, P . Prog. Nucl. Magn. Reson. Spectrosc. 1987, 19, 1. ( 2 5 ) Thalberg, K.; Lindman, B. J. Phys. Chem. 1989, 93, 1478.

8978 The Journal of Physical Chemistry, Vol. 95, No. 22, 1991 Thalberg et al.
peak was selected, and from the decrease in peak height with increasing pulse gradient duration time, the surfactant self-dif- fusion coefficient could be obtained.
When applied to the binding of surfactant molecules to poly- mers, this method takes advantage of the large difference in self-diffusion between the free and the polymer-bound states. Due to the rapid exchange between the two states, which is faster than the time scale of the NMR experiment, the observed self-diffusion coefficient is the population-averaged mean of the self-diffusion coefficients for the two states, i.e.
Dobsd = p f D f + PbDb ( 1 )
where the index "f" denotes free and "b" polyelectrolyte-bound surfactant molecules and p i is the fraction of surfactant in the respective state. If Df and Db are known, the amounts of free and polyelectrolyte-bound surfactant can be obtained, and from a series of samples of increasing surfactant concentration, a binding iso- therm for the interaction between the surfactant molecules and the polyelectrolyte can be obtained. In order to improve the accuracy in the determinations, D 2 0 was used instead of HzO.
(B) Fluorescence Measurements. Time-resolved fluorescence decay data were collected as described earlier.27 The setup uses a mode-locked Nd-YAG laser (Spectra Physics, Model 3800) to synchronously pump a cavity-dumped dye laser (Spectra Physics Models 375,3448) for the excitation, using the dye DCM and frequency doubling in a KDP crystal. The excitation wavelength was 320 nm, and the pyrene monomer emission was measured at 395 nm. The single-photon count rate was kept low enough to prevent two-photon excitation. Temperature was held constant by thermostating the cuvettes and cuvette holder by the same standard water bath.
All data were analyzed on a Digital Equipment VAXstation 2000, by the method previously described.28
The natural lifetime, 70 = l/ko, was determined from solutions without DMBP, where a single-exponential decay was obtained:
F ( t ) = Fo exp(-kor) (2) where Fo is the fluorescence intensity a t time t = 0.
To evalute the data from time-resolved fluorescence quenching the model of Infelta-Ta~hiya~~ was used in a generalized version:30
(3)
(4)
( 5 )
(6)
where k, is the first-order quenching rate constant, (n) is the mean number of quenchers in a micelle, and (x), is the average number of quenchers in micelles with an excited probe during the stationary stage of the fluorescence decay, Le., for the exponential tail.
F ( t ) = Fo exp[-A2t + A31exp(-A4r) - I}]
A2 = kq(x), + ko
A3 = ( n ) ( l - ( x ) , / ( n ) ) '
A4 = kq(1 - (x)S/(n))
with
If (x), is close to zero, eqs 4-6 can be rewritten as
A2 = ko (4a)
A3 = (n) (5a) A4 = k , (6a)
(4b) It is also possible to rewrite eq 4 as
A2 = ko + k+[Qlr
(26) Carlsson, A,; Karlstrijm, G.; Lindman, B. J. Phys. Chem. 1989, 93, 3673.
(27) Almgren, M.; Alsins, J.; van Stam, J.; Mukhtar, E. Prog. Colloid Polym. Sei. 1988, 76, 68.
(28) Almgren, M.; Alsins, J.; Mukhtar, E.; van Stam, J. Reacrions in Compartimentalired Liquids; Knoche, W . , Schomicker, R., Eds.; Springer Verlag: Berlin, 1989; p 61.
(29) (a) Infelta, P. P.; Gratzel, M.; Thomas, J. K. J . Phys. Chem. 1974, 78, 190. (b) Tachiya, M. Chem. Phys. Letr. 1975, 33, 289.
(30) Almgren, M.; Lofroth, J.-E.; van Stam, J. J . Phys. Chem. 1986, 90, 443 1 .
t 1 a
a
a i* 1 C, (mM)
Figure 3. Binding isotherm for the interaction of CloTA+ with NaHy as determined by IH N M R self-diffusion measurements in solutions of 3.8% w/v NaHy. The cmc is indicated by the arrow.
v 8 15 L
0
0
0 cmc
0
0 l i 0 1 . "-' 5 ' ' e ' ' 10 I " ' . $ . 15 " A 20
C, (mM) Figure 4. Binding isotherm for the interaction of C12TA+ with N a H y in solutions of 4.75% w/v NaHy. The cmc is indicated by the arrow.
where k+ is the second-order entrance-rate constant for the quencher and [Qlf is the concentration of quencher molecules not dissolved in the micelles.
From eq 6a the aggregation number, ( a ) , can easily be cal- culated from A3 as
(n) = [quencher],/[micelles] (7)
(8)
where the index m denotes the micellar phase, c, the total sur- factant monomer concentration, and cf the concentration of free surfactant monomers.
Fluorescence steady-state spectra were recorded on a SPEX Fluorolog 1680 combined with a SPEX Spectroscopy Laboratory Coordinator DM 1 B. All fluorescence measurements, time resolved as well as steady state, were performed at 25 OC.
Results and Discussion Binding Isotherms. By applying eq 1 to self-diffusion data,
binding isotherms, which relate the amount of bound surfactant to the concentration of free surfactant inthe system, have been obtained. As the diffusion of the polyelectrolyte, and thus of the polyelectrolyte-bound surfactant, is very slow as compared to the diffusion of free surfactant monomers, Db is much smaller than Df, and the second term in eq 1 may be neglected. The only difficulty is to determine Df, the self-diffusion coefficient for free surfactant monomers, which certainly is lowered by the presence of p ~ l y e l e c t r o l y t e . ~ ' ~ ~ ~ This has been done by measurements in solutions at a very low surfactant concentration, where the con- centration of polyelectrolyte-bound surfactant is negligible (the
and
[micelles] = (ct - c f ) / < a >
~~
(31) Nilsson, L. G.; Nordenskiold, L.; Stilbs, P.; Braunlin, W. H. J . Phys.
(32) Rymden, R.; Stilbs, P. J . Phys. Chem. 1985, 89, 3502. Chem. 1985.89, 3385.
Time-Resolved Fluorescence and Self-Diffusion Studies The Journal of Physical Chemistry, Vol. 95, No. 22, 1991 8919
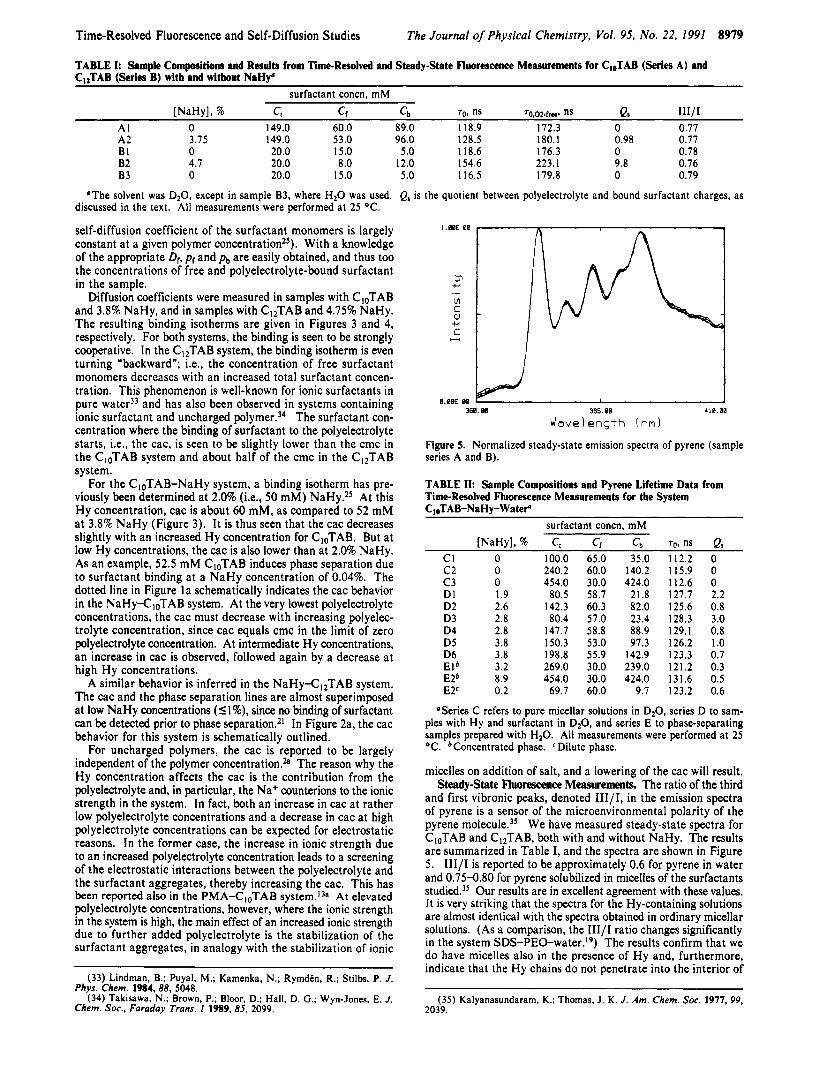
TABLE I: Sample Compositions and Results from Time-Resolved and Steady-State Fluorescence Measurements for CloTAB (Series A) and CI,TAB (Series B) with and without NaHy’
surfactant concn. mM [NaHyl, 76 c, Cf cb 70, ns 70,02.frec. ns QS I I I / I
A1 0 149.0 60.0 89.0 118.9 172.3 0 0.77 A2 3.75 149.0 53.0 96.0 128.5 180.1 0.98 0.77 BI 0 20.0 15.0 5.0 118.6 176.3 0 0.78 B2 4.7 20.0 8.0 12.0 154.6 223.1 9.8 0.76 B3 0 20.0 15.0 5.0 116.5 179.8 0 0.79
’The solvent was D20, except in sample B3, where H 2 0 was used. Q, is the quotient between polyelectrolyte and bound surfactant charges, as discussed in the text. All measurements were performed at 25 O C .
self-diffusion coefficient of the surfactant monomers is largely constant at a given polymer concentration25). With a knowledge of the appropriate DR pr and pb are easily obtained, and thus too the concentrations of free and polyelectrolyte-bound surfactant in the sample.
Diffusion coefficients were measured in samples with CloTAB and 3.8% NaHy, and in samples with C12TAB and 4.75% NaHy. The resulting binding isotherms are given in Figures 3 and 4, respectively. For both systems, the binding is seen to be strongly cooperative. In the C12TAB system, the binding isotherm is even turning “backward”; i.e., the concentration of free surfactant monomers decreases with an increased total surfactant concen- tration. This phenomenon is well-known for ionic surfactants in pure waterjj and has also been observed in systems containing ionic surfactant and uncharged polymer.34 The surfactant con- centration where the binding of surfactant to the polyelectrolyte starts, Le., the cac, is seen to be slightly lower than the cmc in the CloTAB system and about half of the cmc in the C12TAB system.
For the CloTAB-NaHy system, a binding isotherm has pre- viously been determined at 2.0% (Le., 50 mM) N ~ H Y . ~ ~ At this Hy concentration, cac is about 60 mM, as compared to 52 mM at 3.8% NaHy (Figure 3). It is thus seen that the cac decreases slightly with an increased Hy concentration for CloTAB. But at low Hy concentrations, the cac is also lower than at 2.0% NaHy. As an example, 52.5 mM CloTAB induces phase separation due to surfactant binding at a NaHy concentration of 0.04%. The dotted line in Figure l a schematically indicates the cac behavior in the NaHy-CloTAB system. At the very lowest polyelectrolyte concentrations, the cac must decrease with increasing polyelec- trolyte concentration, since cac equals cmc in the limit of zero polyelectrolyte concentration. At intermediate Hy concentrations, an increase in cac is observed, followed again by a decrease at high Hy concentrations.
A similar behavior is inferred in the NaHy-CI2TAB system. The cac and the phase separation lines are almost superimposed at low NaHy concentrations (SI%), since no binding of surfactant can be detected prior to phase separation.21 In Figure 2a, the cac behavior for this system is schematically outlined.
For uncharged polymers, the cac is reported to be largely independent of the polymer concentration.b The reason why the Hy concentration affects the cac is the contribution from the polyelectrolyte and, in particular, the Na+ counterions to the ionic strength in the system. In fact, both an increase in cac at rather low polyelectrolyte concentrations and a decrease in cac at high polyelectrolyte concentrations can be expected for electrostatic reasons. In the former case, the increase in ionic strength due to an increased polyelectrolyte concentration leads to a screening of the electrostatic interactions between the polyelectrolyte and the surfactant aggregates, thereby increasing the cac. This has been reported also in the PMA-CloTAB At elevated polyelectrolyte concentrations, however, where the ionic strength in the system is high, the main effect of an increased ionic strength due to further added polyelectrolyte is the stabilization of the surfactant aggregates, in analogy with the stabilization of ionic
(33) Lindman, B.; Puyal, M.; Kamenka, N.; Rymdh, R.; Stilbs, P. J. (34) Takisawa, N.; Brown, P.; Bloor, D.; Hall, D. G.; Wyn-Jones, E. J .
Phys. Chem. 1984.88, 5048.
Chem. SOC., Faraday Trans. I 1989, 85, 2099.
m . m 385. 08 410.00
Wavelength (nml
Figure 5. Normalized steady-state emission spectra of pyrene (sample series A and B).
TABLE II: Sample Compositions and Pyrene Lifetime Data from Time-Resolved Fluorescence Measurements for the System Cl0TAB-NaHy-WateP
surfactant concn, mM
c2 0 c3 0 DI 1.9 D2 2.6 D3 2.8 D4 2.8 D5 3.8 D6 3.8 E lb 3.2 E26 8.9 E2c 0.2
240.2 454.0
80.5 142.3 80.4
147.7 150.3 198.8 269.0 454.0
69.7
60.0 30.0 58.7 60.3 57.0 58.8 53.0 55.9 30.0 30.0 60.0
140.2 424.0
21.8 82.0 23.4 88.9 97.3
142.9 239.0 424.0
9.7
115.9 0 112.6 0 127.7 2.2 125.6 0.8 128.3 3.0 129.1 0.8 126.2 1.0 123.3 0.7 121.2 0.3 131.6 0.5 123.2 0.6
Series C refers to pure micellar solutions in DzO, series D to sam- ples with Hy and surfactant in D20, and series E to phase-separating samples prepared with H20. All measurements were performed at 25 OC. bConcentrated phase. Dilute phase.
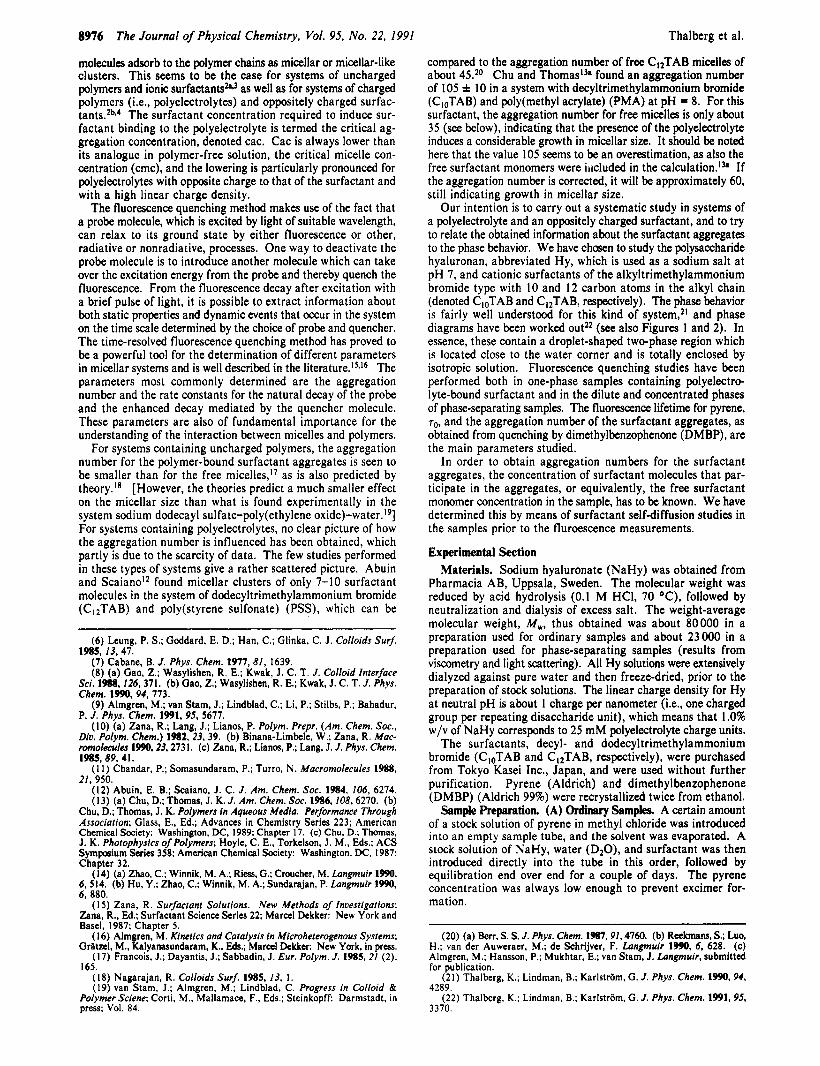
micelles on addition of salt, and a lowering of the cac will result. Steady-State Fluorescence Measurements. The ratio of the third
and first vibronic peaks, denoted III/I, in the emission spectra of pyrene is a sensor of the microenvironmental polarity of the pyrene molecule.35 We have measured steady-state spectra for CloTAB and C12TAB, both with and without NaHy. The results are summarized in Table I, and the spectra are shown in Figure 5 . III/I is reported to be approximately 0.6 for pyrene in water and 0.75-0.80 for pyrene solubilized in micelles of the surfactants studied.35 Our results are in excellent agreement with these values. It is very striking that the spectra for the Hy-containing solutions are almost identical with the spectra obtained in ordinary micellar solutions. (As a comparison, the III/I ratio changes significantly in the system SDS-PEO-water.”) The results confirm that we do have micelles also in the presence of Hy and, furthermore, indicate that the Hy chains do not penetrate into the interior of
(35) Kalyanasundararn, K.; Thomas, J. K. J . Am. Chem. SOC. 1977, 99, 2039.

8980 The Journal of Physical Chemistry, Vol. 95, No. 22, 1991 Thalberg et al.
TABLE 111: Sample Compositions and Pyrene Lifetime Data from Time-Resolved Fluorescence Measurements for the System C,2TAB-NaHy-WateP
surfactent concn. mM
FI F2 F3 GI G2 G 3 G4 G5 HIb H2b HI'
[NaHyl, 5% 0 0 0 4.75 4.75 4.75 4.75 4.75 5 . 5
11.6 0.4
c, 30.0
100.0 602.0
12.0 16.1 19.8 25.0 30.1
553.0 6 19.0 142.0
Cr - 15.0 15.0 4.0 8.9 8.9 8.2 8.0 8.0 4.0 4.0 8.0
cb 15.0 85.0
598.0 3.1 7.2
11.6 17.0 22.1
549 615 138
ro. ns - 116.3 116.8 111.0 155.9 152.8 152.6 147.8 144.9 1 18.9 132.3 116.1
Q, 0 0 0
38.3 16.5 10.2 7.0 5 .3 0.25 0.5 0. I
"Series F refers to pure micellar solutions in D20, series G to sam- ples with Hy and surfactant in D20, and series H to phase-separating samples prepared with H 2 0 . All measurements were performed at 25 OC. bConcentrated phase. 'Dilute phase.
250 I 1
Figure 6. Diagram showing the influence of oxygen quenching on ro. Sample indices refer to Table I, where the composition of each sample is given. Black bars refer to deoxygenated samples.
the micelles. We are thus left with a picture of micelle-like surfactant aggregates adsorbed to the polyelectrolyte chains for electrostatic reasons; i.e., the charged polyelectrolyte groups act as counterions to the micellar aggregate.
Pyrene Fluorescence Lifetime. By fitting eq 2 to data from time-resolved fluorescence data for samples without DMBP, the natural lifetime, 70, for pyrene in the sample is obtained. The compositions of the samples and the results from these fittings for CloTAB and CI2TAB are summarized in Tables I1 and 111, respectively. It turns out that, for both systems, the pyrene lifetime increases in the presence of Hy. The reason for this is a com- bination of two different effects. First, the polyelectrolyte interacts electrostatically with the oppositely charged micelles, which leads to a displacement of the ordinary counterions, in this case bromide ions. Bromide is known to quench pyrene f luore~cence ,~~ so the displacement of these ions from the micellar surface leads to an increased pyrene lifetime. This phenomenon is similar to that presented by Chu and Thomaslsa and has also been found in aqueous systems of poly(styrenesu1fonate) and C12TAB or CI6- TABS2@
Second, it is found that the lifetime increases with increasing amount o f polymer also in the system SDS-PE&water.19 In this case there is no displacement of an ionic quencher, but the shell of polymer around the aggregates shields the pyrene molecule from quenching by oxygen. This is confirmed by observations in de- oxygenated solutions, where the lifetime is about the same with and without p01ymer.I~
To check the importance of oxygen quenching in the present systems, ro values for the samples of Table I were measured in deoxygenated solutions. The results are presented in Table I and in Figure 6. A considerable increase in T~ results as compared to the values in equilibrium with air. The difference between
140 I 130 c . 120 1.
110 0 1 2 3 4
?
160 1 0
130
120 110 L 0 10 20 30 4 0
Q.
F m 7. F'yrene lifetime, r* versus Q, (as defined in the text), in systems of NaHy and CloTAB (a) or CI2TAB (b). Filled symbols denote the concentrated phase.
Hy-free and Hy-containing samples, however, remains rather unaffected by the removal of oxygen. This means that the con- tribution from oxygen quenching to r0 is of similar magnitude in Hy-free and Hy-containing samples and that the observed differences are mainly due to differences in bromide quenching between the samples. We may therefore interpret changes in r0 as due to changes in the Br- concentration at the micellar surface.
From Table I, it is also seen that exchange of D20 with H20 (samples BI and B3) does not cause any significant change in the photophysics of the studied systems. This means that results for samples prepared with H 2 0 and D 2 0 may be compared directly.
In order to compare the ro results for the two systems, we want to define a parameter applicable to all polyelectrolytesurfactant systems. One such parameter is the quotient between polymer charges and bound surfactant charges, which we will denote by Q,. (Q, is the inverse of the ratio Rb, used in ref 22.) In Figure 7, r0 is given as a function of Q,. The change in ro at addition of Hy are much larger for C12TAB than for Cl0TAB, which implies a higher degree of coverage of the C12TAB micelles with Hy segments. This is in line with our findings that the interaction between polyelectrolyte and oppositely charged surfactant is en- hanced by an increased surfactant chain length.22*25 In the case of CloTAB, the interaction was found to be markedly reduced, due to the high surfactant monomer concentration, which con- tributes to the screening of the electrostatic interactions.22
The shapes o f the curves in Figure 7 are similar for the two surfactants; after an initial rise at low Q,, a leveling out to a largely constant plateau is seen. This prompts us to assume that the degree of replacement of Br- ions with Hy is not considerably enhanced by a further increase in the Hy concentration. The plateau is reached at a higher Qs value for CllTAB than for CloTAB, in agreement with the higher degree of Hy coverage for the CI2TAB micelles.
The natural lifetime, T ~ , for pyrene in dodecyltrimethyl- ammonium chloride (CI2TAC) micelles a t 25 OC is reported to be 184 ns2OC and 325 ns3' in equilibrium with air and in a deox-
~ ~~~~ ~ ~
(36) Gratzel, M.; Kalyanasundaram, K.; Thomas, J. K. J. Am. Chem. Soc. 1974, 96, 1869
(37) Malliaris, A.; Lang, J.; Sturm, J.; Zana, R. J. fhys. Chem. 1987. 91, 1475.

Time-Resolved Fluorescence and Self-Diffusion Studies The Journal of Physical Chemistry, Vol. 95, No. 22, 1991 8981
4k iN im 3
2 0 500 0 500 0 5w
aa 4
2
a
2 2 - 0 500 0 500 0 500
Figure 8. Time-resolved fluorescence measurements with pyrene as probe and dimethylbenzophenone as quencher for CloTAB (C-E) and C12TAB (F-H) micelles. Indices refer to Tables I1 and 111 where the composition of each sample is given. (El and H1 are from the concentrated phase.) The vertical scale gives the logarithm of the number of counts, and the horizontal scale gives the time in nanoseconds. All measurements were performed at 25 OC.
ygenated sample, respectively. When compared to the r0 data for C12TAB obtained in this study (Tables I and 111), it again turns out that quenching due to the presence of bromide ions overrules the quenching due to oxygen. As chloride does not quench pyrene fluorescence, the CI2TAC values may be regarded as the maxi- mum ro values accessible in the C12TAB system, Le., when all Br- ions are displaced from the micellar surface. On the basis of this assumption, it is possible to estimate the fraction of Br- ions that are displaced from the micelles, due to the presence of polyelectrolyte. In deoxygenated solution, we may assume that
( 9 ) where rCl is the r0 value for CI2TAC micelles and 8Br is the degree of bromide counterion binding to the micelle. With OBr = 0.75 for ordinary CI2TAB micelles, we obtain k = 3.46 X 10⁶ s-l (from sample B1 in Table I ) , and for sample B2 containing 4.7% fiy, we obtain OBr = 0.41; Le., about 45% of the bromide counterions are displaced from the micellar surface. The calculations can also be applied in the CloTAB-NaHy system. Assuming the same rCI and ear as above, sample AI gives k = 3.63 X lo6 s-I, and for sample A2 containing 3.75% Hy, we obtain OBr = 0.68; Le., only about 10% of the bromide counterions are displaced from the micellar surface in this sample. As samples A2 and B2 both are located at the plateau level, the obtained results reflect the maximum amount of Br- ions that Hy can displace from the micelles a t the studied polyelectrolyte concentrations.
With regard to the phase-separating samples, the results ob- tained in the concentrated phase are indicated by filled squares in Figure 7. The pyrene lifetime in concentrated solution is seen to be higher than or equal to the 70 value in a one-phase solution of the same Q, value. The increase is most pronounced for the samples located in the upper right corner of the two-phase region (samples E2 and H2). Indeed, the polyelectrolyte segment density is expected to be high around the micelles in these samples, due to their high Hy content. Aggregation Numbers. Some typical fluorescence decay curves
are shown in Figure 8. The decay curves are well described by the Infelta model, eq 3. This indicates that the probe is located in relatively small aggregates. From fittings to the data, infor- mation about the size of the aggregates and the photophysical kinetics of the system has been obtained. From each decay curve, a quencher average aggregation number for the micelles, (u) , , is obtained. (a ) , values obtained a t different quencher concen- trations are then used to calculate the weight-average aggregation number, These are presented in Tables IV and V. With regard to the polyelectrolyte-free solutions, both surfactants follow the same trend; Le., ( a ) , increases slightly with increasing sur- factant concentration. For C12TAB, the aggregation number in a 100 mM solution was determined to about 48 in a SANS study,2q in good agreement with our results, indicating that the
1 / 7 0 ~ = 1/7Cl -k keBr
TABLE I V Results from Time-Resolved Fluorescence Quenching Measurements for the System C,JAB-NaHy-WateP
[NaHy], 7% C,, mM ( a ) w k,, 10's-I c1 0 100.0 31.0 0.56 8.1 c2 0 240.2 40.2 0.33 7.5 c3 0 454.0 68.1 0.79 9.8 D1 1.9 80.5 36.8 0.72 7.3 D2 2.6 142.3 39.0 0.53 7.7 D3 2.8 80.4 46.4 0.73 7.2 D4 2.8 147.7 31.8 0.55 7.7 D5 3.8 150.3 32.0 0.24 6.9 D6 3.8 198.8 40.5 0.74 7.0 Dl' 3.2 269.0 63.7 0.51 10.2 E2b 8.9 454.0 83.1 0.63 9.6 E2' 0.2 69.7 39.1d 1 1 . 1
'All measurements were performed at 25 OC. 'Concentrated phase. Dilute phase. (u), .
TABLE V Results from Time-Resolved Fluorescence Quenching Measurements for the System CI2TAB-NaHy-WnteP
[NaHyl, 7% C,, mM (a ) , u / ( a ) , k., 10' s-I
FI F2 F3 GI G2 G3 G4 G5 Hlb H2' HI'
0 0 0 4.75 4.75 4.75 4.75 4.75 5.5
11.6 0.4
30.0 100.0 602.0
12.0 16.1 19.8 25.0 30.1
553.0 619.0 142.0
50.7 0.46 65.5 0.38
116.9 0.75 104.Sd 0.70 63.5 0.62 41.0 0.66 48.3 0.32 64.2 0.66
188.8 0.60 119.4 0.59 71.2'
3.4 3.2 3.2 3.1 3.3 3.9 3.6 3.2 3.2 3.5 3.5
'All measurements were performed at 25 OC. 'Concentrated phase. <Dilute phase. dThis value is unexpectably high, probably due to the uncertainty in [DMBPIb, as commented on in the text. ' ( a ) , .
presence of pyrene and quencher does not change the size of the micellar aggregates.
The aggregation numbers are seen not to change significantly when NaHy is present. The micelles stay relatively small a t low surfactant concentrations, but are not significantly smaller than in the Hy-free systems. In the concentrated phase, which has a higher surfactant concentration, the aggregation numbers are seen to be similar or even somewhat larger than in the corresponding Hy-free samples. If we examine the aggregation numbers for micelles in coexisting dilute and concentrated phases (samples E2 and HI), it is found that the aggregation numbers are larger in the more concentrated phase.
In conclusion, the interaction between the studied surfactants and NaHy does not affect the surfactant self-assembly to any

8982 The Journal of Physical Chemistry, Vol. 95, No. 22, 1991 Thalberg et al.
major extent. The effect of Hy is thus different from that observed for PSS and PMA, as discussed above.12*13a*20e Reasons for this may be the rather low linear charge density of Hy and its relatively high stiffness.3s In a rheological study of concentrated solutions of NaHy and C14TAB,39 only small differences in viscoelastic properties were detected, as compared to a solution of Hy of the same concentration and molecular weight. This suggests that the Hy chains are only slightly affected by the presence of the micelles; Le., a structure with the Hy chains wrapped up around the micelles seems unlikely.
Photophysical Kinetics. The quenching rate constants, k,, given in Tables IV and V allow us to discuss the interaction between Hy and surfactant from the point of view of photophysical kinetics. The initial decay rate of the quenching process, as described by k,, is affected by the size of the aggregate that serves as host for the probe and the quencher; k, is assumed to be roughly pro- portional to the inverse of the micellar size, i.e., the aggregation number. This is also verified if one compares the two surfactants, as the quenching rate is twice as high for CloTAB as for C12TAB, which has aggregates of approximately half the size. If we compare the rate constants within each system, a different picture arises. I t is seen that k , remains rather constant regardless of the size of the aggregates. This may indicate that the kinetic quenching process depends on the environment outside the micelle. Instead of an expected decrease in the quenching rate when the size increases, the rate constants remain surprisingly constant, even when the aggregation number increases by a factor of 3. The interaction with polymer seems to slow down the quenching process, as is also found in other system^.'^^^^
Polydispersity. From the change of the quencher average aggregation numbers with the quencher concentration, it is possible to calculate the parameter U / ( U ) , , ~ ~ which is a measure of the polydispersity in micellar size. From Tables IV and V, it is found that the presence of NaHy does not induce any notable change in this respect. Since u is estimated from only two, or in some cases three, quencher concentrations, there is a large uncertainty in each particular case. The uncertainty is further enhanced by the fact that DMBP is slightly soluble in waterM and thus dis- tributes between the bulk phase and the micellar phase. If k+ is given a reasonable value in eq 4b (e.g., k+ = 5 X lo9 M-’ S - I ) , ~ ’ it is possible to calculate [Qlr from experimental values of A2 and ko. Such calculations indicate that almost all DMBP is in the micellar phase in the CloTAB-Hy system, but that there is a significant uncertainty for the CI2TAB-Hy system, in particular a t low C12TAB concentrations. The fact that u / ( u ) , for all samples with Hy is close to that obtained for free micelles” again
(38) (a) Gibbs, D. A.; Merrill, E. W.; Smith, K. A.; Balas, E. A. Bio- polymers 1968, 6, 777. (b) Darke, A.; Finer, E. G.; Moorhouse, R.; Rees, D. A. J . Mol. Biol. 1975,99,477. (c) Morris, E. R.; Rees, D. A.; Welsh, E. J. J . Mol. Biol. 1980, 138, 383.
(39) Thalberg, K.; Edsman, K. Unpublished results. (40) Alsins, J . Private communication.
implies a weak interaction between Hy and the surfactants in- vestigated.
Conclusions The polyelectrolyte hyaluronan (Hy), Na+ salt, interacts with
micelles of the cationic surfactants CIoTAB and CI2TAB. The presence of Hy induces surfactant aggregation at a critical ag- gregation concentration (cac) lower than the cmc. The interaction is stronger for C12TAB, which is seen by a lowering of the cac to about half of the cmc, while in the CloTAB system, the lowering is much less. The lowering of cac induced by Hy is much smaller than for polyelectrolytes of a high charge density.12
From the obtained cac values, in combination with previously determined cac data, the cac behavior as a function of the Hy concentration is obtained. Addition of NaHy first leads to a decrease in the cac from the cmc value, followed by an increase at intermediate NaHy concentrations, and again a decrease at high NaHy concentrations. The observed cac behavior is due to the contribution from the polyelectrolyte and its counterions to the ionic strength in the system and can be rationalized on the basis of electrostatic considerations. The observed cac behavior is therefore believed to be of a wide generality.
The steady-state spectra of pyrene, the pyrene lifetime data, and the quenching results all indicate that micelle-like surfactant clusters are formed in the presence of Hy. The Hy chains do not penetrate into the micellar core, but are located at the surface of the micelles. We are thus left with a picture of quite unaltered surfactant micelles, which associate to the Hy chains for pure electrostatic reasons. This structure applies also for the con- centrated phase of phase-separating samples.
The lifetime, ro, for excited pyrene molecules located in the micelles is enhanced by the presence of Hy, mainly due to dis- placement of bromide counterions from the micellar surface. Above a certain quotient between polyelectrolyte and surfactant in the sample, a plateau level in r0 is reached, a t which bromide ions still have access to the micellar surface. At the plateau level, approximately 45% of the Br- counterions are displaced for C12TAB micelles, while only about 10% for CloTAB micelles.
The aggregation numbers for the surfactant micelles are rather unaffected by the interaction with Hy. Reasons for this may be the rather low linear charge density of Hy and its relatively high stiffness.
Acknowledgment. Mrs. Ingegerd Lind and Mr. Goran Karlsson are acknowledged for their technical assistance and for help with the figures. This work has been supported by grants from the Swedish Natural Science Research Council, from The Swedish National Board for Technical Development, and from Pharmacia AB, Uppsala, Sweden.
Registry No. Decyltrimethylammonium bromide, 2082-84-0; do- decyltrimethylammonium bromide, 1 1 19-94-4; sodium hyaluronate, 9067-32-7; pyrene, 129-00-0; dimethylbenzophenone, 54323-3 1-8.


