Embed Size (px)
Citation preview
[Elouardi, 3(12): December, 2014] ISSN: 2277-9655
Scientific Journal Impact Factor: 3.449
(ISRA), Impact Factor: 2.114
http: // www.ijesrt.com © International Journal of Engineering Sciences & Research Technology
[72]
IJESRT INTERNATIONAL JOURNAL OF ENGINEERING SCIENCES & RESEARCH
TECHNOLOGY
Agadir Clay Materials as a New Adsorbent to Remove Cationic and Anionic Dyes from
Aqueous Solutions M. El ouardi*, S. Qourzal, S. Alahiane, F. Sakr, A. Assabbane, J. Douch
Physical Chemistry Laboratory, Photocatalysis and Environment Team, Department of Chemistry,
Faculty of Science, Ibn Zohr University, Agadir, Morocc
Abstract This study investigated the potential use of clay minerals originated from barrage situated in Agadir (Morocco), as a
low-cost, natural, eco-friendly and alternative adsorbent for removal of Methylene Blue (MB) and Congo Red (CR),
respectively a basic and an acid dye, from aqueous solution within a batch process. The adsorbent was characterized
by X-ray diffraction, BET surface area, scanning electron microscopy (SEM) and dispersive energy of spectroscopy
(EDS). The effects of various experimental parameters were examined such as contact time, initial dye
concentration, adsorbent concentration, solution pH, and temperature. In order to determine the best-fit-isotherm, the
experimental data were analyzed by the Freundlich and Langmuir equations. The adsorption equilibrium was well
described by the Langmuir isotherm model with maximum adsorption capacity of 125mg.g−1 for MB and 91mg.g−1
for CR, at room temperature. The kinetic data were analyzed using pseudo-first-order and pseudo-second-order
models. The pH heavily affects the adsorption capacity, the removal percentage reached 99.22% for MB at pH=10,
and 98.97% for CR at pH=2. The values of activation parameters such as free energy (ΔG), enthalpy (ΔH) and
entropy (ΔS) were also determined. However, the results pointed to the effectiveness of this Agadir Clay (AC) as an
interesting alternative material with respect to more costly adsorbent used, for removing basic and acid dyes from
aqueous solutions.
Keywords: Methylene Blue, Congo Red, Agadir Clay, Adsorption, Low-cost adsorbent.
Introduction Controlling pollution is the main concern of society
today. Large amounts of dyes are annually produced
and used in textile, cosmetics, paper, rubber, plastics,
leather, pharmaceutical, food and other industries.
Today over 100,000 commercially available dyes
exist, and more than 7×10⁵ tons are produced
annually, with a considerable fraction being
discharged directly in aqueous effluent [1]. Dyes,
which usually have a synthetic origin, are generally
characterized by complex aromatic molecular
structures which afford physicochemical, thermal,
and optical stability [2].
The extensive use of dyes often poses pollution
problems in the form of colored wastewater
discharged into environmental water bodies. Most of
the dyes are toxic and carcinogenic compounds; they
are also recalcitrant and thus stable in the receiving
environment, posing a serious threat to human and
environmental health [3]. Not only do they harm the
aesthetic nature of the environment, they are
commonly toxic to aquatic life [4], by diminishing
the transparency of the water, dyes modify the
penetration of solar radiation, and affecting the
aquatic life and food web [5]. Therefore, the removal
of such colored agents from aqueous effluents is of
significant environmental, technical, and commercial
importance [6, 7].
Various physical, chemical and biological methods,
including coagulation/flocculation, ozonation,
membrane filtration and liquid–liquid extraction have
been widely used for the treatment of dye-bearing
wastewater. The advantages and disadvantages of
every removal technique have been extensively
reviewed [8, 9]. Adsorption of various dyes from
aqueous solution has proven to be an excellent way to
treat effluent also a cost effective technique.
Adsorption is a very effective separation technique in
terms of initial cost, simplicity of design, ease of
operation and insensitive to toxic substances, and the
use of clays as alternative adsorbents has been
receiving attention for the removal of dyes from
wastewater in recent years [10, 11]. They have
advantages over commercially available adsorbents
in terms of low-cost, abundant availability, high
adsorption properties, non-toxicity and large potential
[Elouardi, 3(12): December, 2014] ISSN: 2277-9655
Scientific Journal Impact Factor: 3.449
(ISRA), Impact Factor: 2.114
http: // www.ijesrt.com © International Journal of Engineering Sciences & Research Technology
[73]
for ion exchange, resulting from a net negative
charge on the structure of the minerals. Utilization of
clays could bring massive economic and
environmental benefits to wastewater industries.
The main purpose of this study is to evaluate the
adsorption capacity of locally available clay materials
originated from barrage situated in Agadir (AC), to
remove Methylene Blue (MB) and Congo Red (CR)
fromaqueous solutions. MB and CR are, respectively,
basic and acid dye molecules and therefore release
negative and positive charged colored moieties in
aqueous solution, allowing the assessment of any
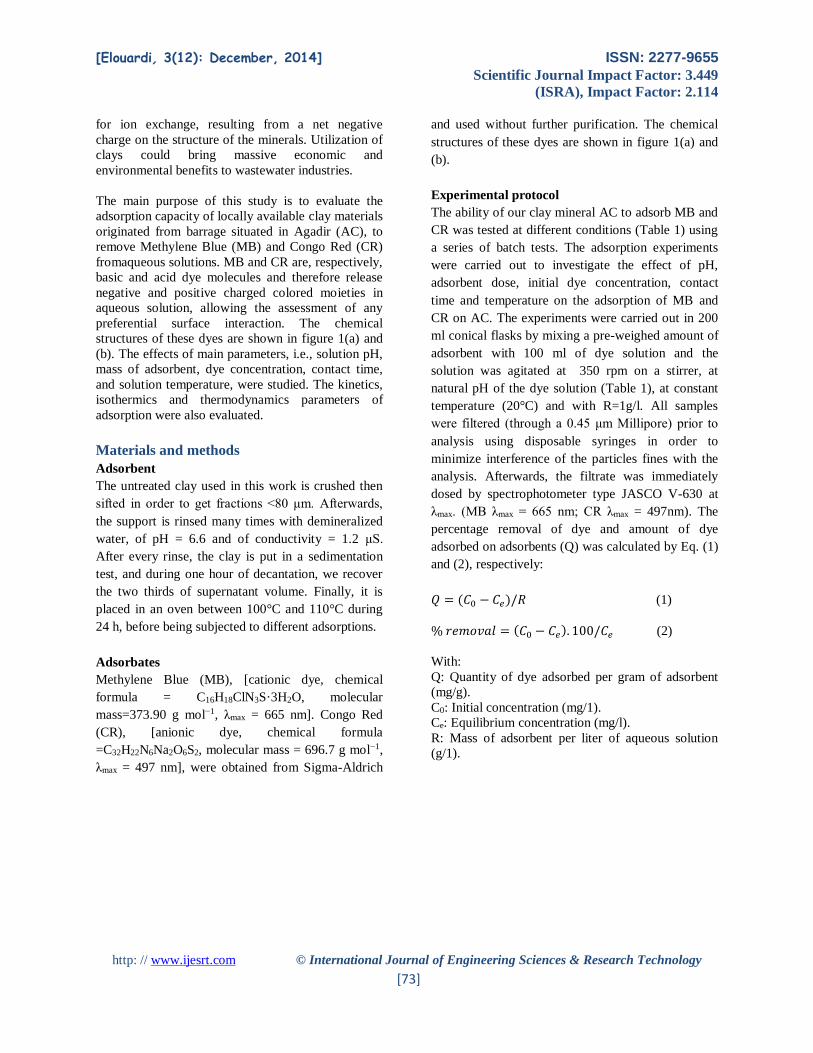
preferential surface interaction. The chemical
structures of these dyes are shown in figure 1(a) and
(b). The effects of main parameters, i.e., solution pH,
mass of adsorbent, dye concentration, contact time,
and solution temperature, were studied. The kinetics,
isothermics and thermodynamics parameters of
adsorption were also evaluated.
Materials and methods
Adsorbent
The untreated clay used in this work is crushed then
sifted in order to get fractions <80 μm. Afterwards,
the support is rinsed many times with demineralized
water, of pH = 6.6 and of conductivity = 1.2 μS.
After every rinse, the clay is put in a sedimentation
test, and during one hour of decantation, we recover
the two thirds of supernatant volume. Finally, it is
placed in an oven between 100°C and 110°C during
24 h, before being subjected to different adsorptions.
Adsorbates
Methylene Blue (MB), [cationic dye, chemical
formula = C16H18ClN3S·3H2O, molecular
mass=373.90 g mol−1, λmax = 665 nm]. Congo Red
(CR), [anionic dye, chemical formula
=C32H22N6Na2O6S2, molecular mass = 696.7 g mol−1,
λmax = 497 nm], were obtained from Sigma-Aldrich
and used without further purification. The chemical
structures of these dyes are shown in figure 1(a) and
(b).
Experimental protocol
The ability of our clay mineral AC to adsorb MB and
CR was tested at different conditions (Table 1) using
a series of batch tests. The adsorption experiments
were carried out to investigate the effect of pH,
adsorbent dose, initial dye concentration, contact
time and temperature on the adsorption of MB and
CR on AC. The experiments were carried out in 200
ml conical flasks by mixing a pre-weighed amount of
adsorbent with 100 ml of dye solution and the
solution was agitated at 350 rpm on a stirrer, at
natural pH of the dye solution (Table 1), at constant
temperature (20°C) and with R=1g/l. All samples
were filtered (through a 0.45 μm Millipore) prior to
analysis using disposable syringes in order to
minimize interference of the particles fines with the
analysis. Afterwards, the filtrate was immediately
dosed by spectrophotometer type JASCO V-630 at
λmax. (MB λmax = 665 nm; CR λmax = 497nm). The
percentage removal of dye and amount of dye
adsorbed on adsorbents (Q) was calculated by Eq. (1)
and (2), respectively:
𝑄 = (𝐶0 − 𝐶𝑒)/𝑅 (1)
% 𝑟𝑒𝑚𝑜𝑣𝑎𝑙 = (𝐶0 − 𝐶𝑒). 100/𝐶𝑒 (2)
With: Q: Quantity of dye adsorbed per gram of adsorbent
(mg/g). C0: Initial concentration (mg/1).
Ce: Equilibrium concentration (mg/l).
R: Mass of adsorbent per liter of aqueous solution
(g/1).
[Elouardi, 3(12): December, 2014] ISSN: 2277-9655
Scientific Journal Impact Factor: 3.449
(ISRA), Impact Factor: 2.114
http: // www.ijesrt.com © International Journal of Engineering Sciences & Research Technology
[74]
(a)
(b)
Figure 1: Chemical structures of (a) Methylene Blue (MB) and (b) Congo Red (CR)
Table 1. Experimental conditions
Experiment
Conditions
Solution pH
AC
dose
(g/l)
Concentration
(mg/l)
Temperature
(°C)
Mixing
Time
(min)
Volume
(ml)
Effect of
contact time
pHnatural=5.9 (MB)
pHnatural=6.2 (CR) 1 100 20 180 500
Effect of
solution pH
2-10 1 100 20
120 for
MB
180 for
CR
100
Effect of
sorbent dose
pHnatural=5.9 (MB)
pHnatural=6.2 (CR) 0,2-3 100 20
120 for
MB
180 for
CR
100
Effect of
temperature
pHnatural=5.9 (MB)
pHnatural=6.2 (CR) 1 100 20-60
120 for
MB
180 for
CR
100
Effet of initial
dye
concentration
pHnatural=5.9 (MB)
pHnatural=6.2 (CR) 1 20-200 20
120 for
MB
180 for
CR
100
[Elouardi, 3(12): December, 2014] ISSN: 2277-9655
Scientific Journal Impact Factor: 3.449
(ISRA), Impact Factor: 2.114
http: // www.ijesrt.com © International Journal of Engineering Sciences & Research Technology
[75]
Characterization of the adsorbent
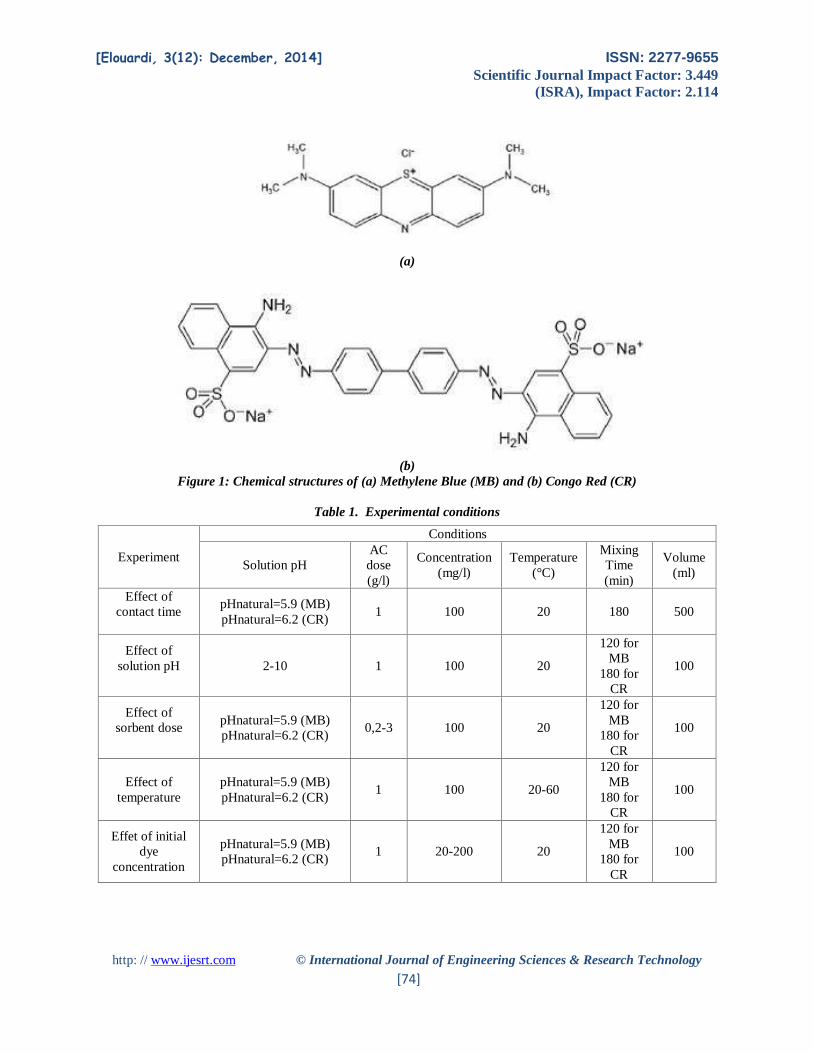
The clay was characterized by diffraction of X-rays
(XRD), using the diffract meter XPERT-PRO type
PW3064, with copper anticathode. The spectrum of
XRD shows that the untreated clay contains a large
amount of the Kaolinite and Illite followed by Quartz
and Calcite (Figure 2).
The specific surface area was measured using the
Brunauer–Emmet–Teller (BET) method. Result was
obtained by nitrogen (N2) adsorption-desorption
isotherms at (77K) using an automated gas sorption
system (Micromeritics, QUANTACHROME
instrument). It is equal to 53.47 m2/g.
Figure 2: X-rays diffraction of the AC
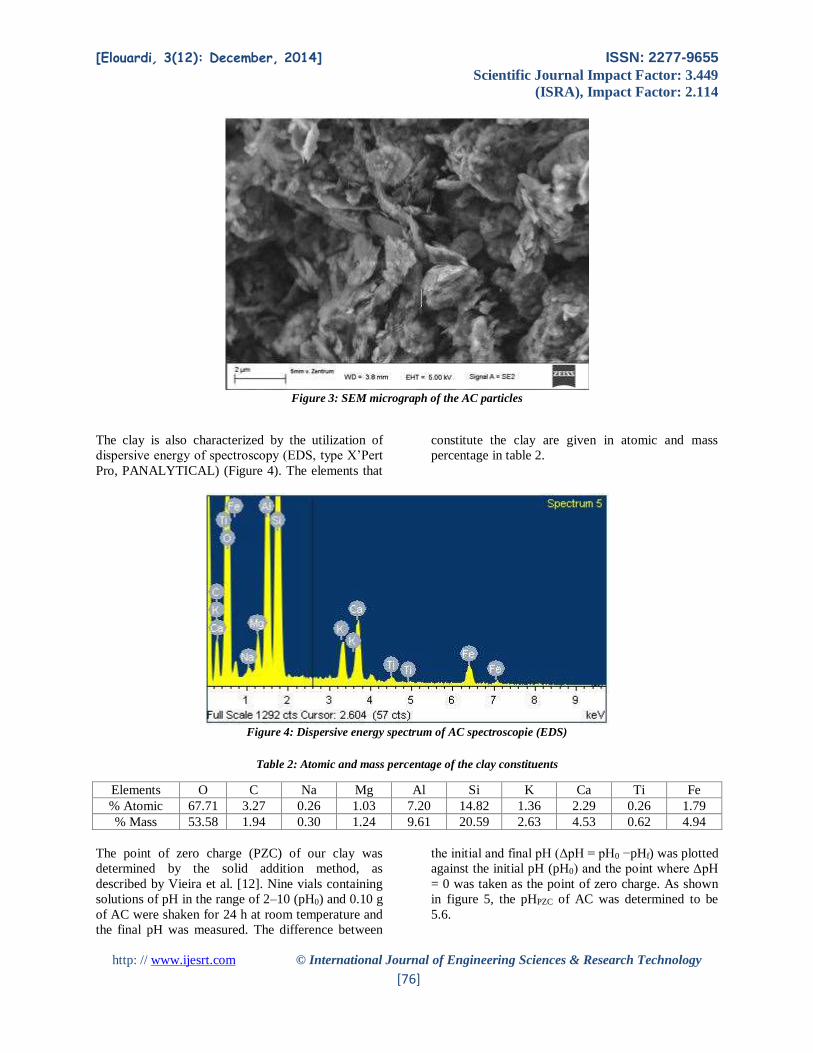
The surface morphology of the clay was observed by
Scanning Electron Microscopy (SEM, using ZEISS
ULTRA PLUS) with a coupled Energy Dispersive
Spectroscopy (EDS), at 5 kV, after gold coating
(Figure 3). The SEM of this figure shows the
scattering of flaky shaped particles with consistent
distribution of deep and apparent micropores that
formed noticeable cage-like cavities. These cavities
provide suitable binding sites for dyes molecules. On
the basis of this fact, it can be concluded that AC
presents an adequate morphology for MB and CR
adsorption.
[Elouardi, 3(12): December, 2014] ISSN: 2277-9655
Scientific Journal Impact Factor: 3.449
(ISRA), Impact Factor: 2.114
http: // www.ijesrt.com © International Journal of Engineering Sciences & Research Technology
[76]
Figure 3: SEM micrograph of the AC particles
The clay is also characterized by the utilization of
dispersive energy of spectroscopy (EDS, type X’Pert
Pro, PANALYTICAL) (Figure 4). The elements that
constitute the clay are given in atomic and mass
percentage in table 2.
Figure 4: Dispersive energy spectrum of AC spectroscopie (EDS)
Table 2: Atomic and mass percentage of the clay constituents
The point of zero charge (PZC) of our clay was
determined by the solid addition method, as
described by Vieira et al. [12]. Nine vials containing
solutions of pH in the range of 2–10 (pH0) and 0.10 g
of AC were shaken for 24 h at room temperature and
the final pH was measured. The difference between
the initial and final pH (ΔpH = pH0 −pHf) was plotted
against the initial pH (pH0) and the point where ΔpH
= 0 was taken as the point of zero charge. As shown
in figure 5, the pHPZC of AC was determined to be
5.6.
Elements O C Na Mg Al Si K Ca Ti Fe
% Atomic 67.71 3.27 0.26 1.03 7.20 14.82 1.36 2.29 0.26 1.79
% Mass 53.58 1.94 0.30 1.24 9.61 20.59 2.63 4.53 0.62 4.94
[Elouardi, 3(12): December, 2014] ISSN: 2277-9655
Scientific Journal Impact Factor: 3.449
(ISRA), Impact Factor: 2.114
http: // www.ijesrt.com © International Journal of Engineering Sciences & Research Technology
[77]
Figure 5: Point of zero charge of AC
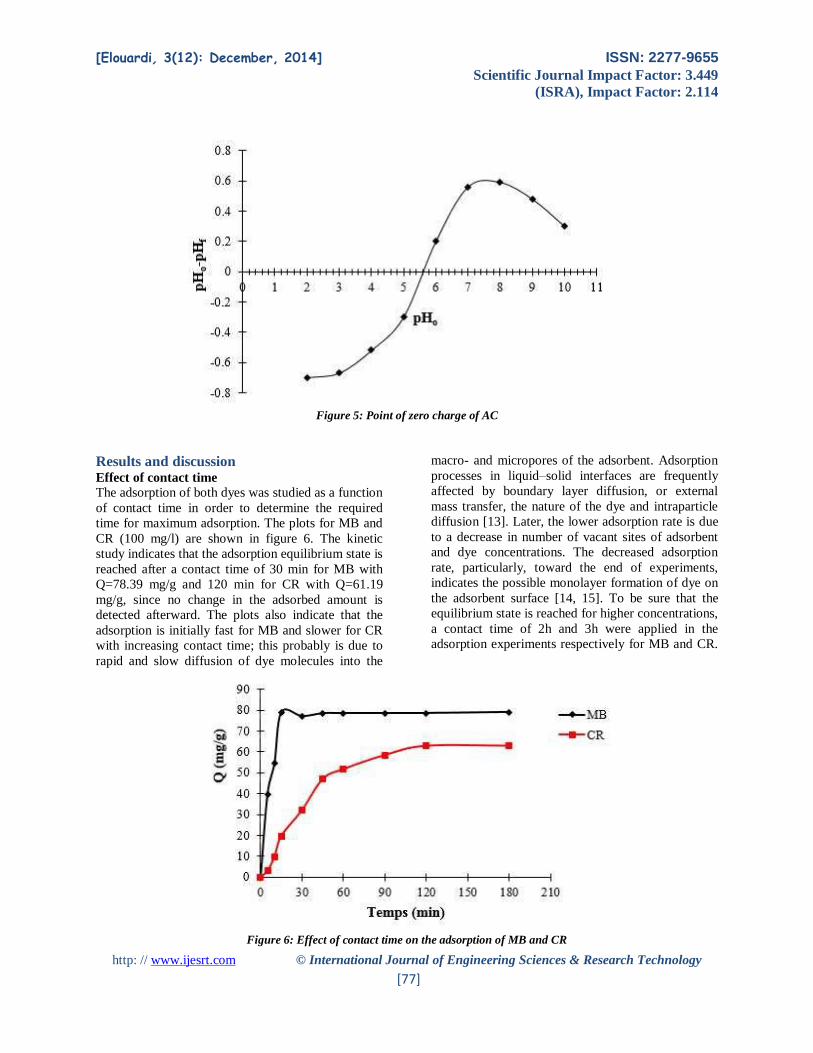
Results and discussion Effect of contact time
The adsorption of both dyes was studied as a function
of contact time in order to determine the required
time for maximum adsorption. The plots for MB and
CR (100 mg/l) are shown in figure 6. The kinetic
study indicates that the adsorption equilibrium state is
reached after a contact time of 30 min for MB with
Q=78.39 mg/g and 120 min for CR with Q=61.19
mg/g, since no change in the adsorbed amount is
detected afterward. The plots also indicate that the
adsorption is initially fast for MB and slower for CR
with increasing contact time; this probably is due to
rapid and slow diffusion of dye molecules into the
macro- and micropores of the adsorbent. Adsorption
processes in liquid–solid interfaces are frequently
affected by boundary layer diffusion, or external
mass transfer, the nature of the dye and intraparticle
diffusion [13]. Later, the lower adsorption rate is due
to a decrease in number of vacant sites of adsorbent
and dye concentrations. The decreased adsorption
rate, particularly, toward the end of experiments,
indicates the possible monolayer formation of dye on
the adsorbent surface [14, 15]. To be sure that the
equilibrium state is reached for higher concentrations,
a contact time of 2h and 3h were applied in the
adsorption experiments respectively for MB and CR.
Figure 6: Effect of contact time on the adsorption of MB and CR
[Elouardi, 3(12): December, 2014] ISSN: 2277-9655
Scientific Journal Impact Factor: 3.449
(ISRA), Impact Factor: 2.114
http: // www.ijesrt.com © International Journal of Engineering Sciences & Research Technology
[78]
Adsorption kinetics The kinetics of adsorption data was processed to
understand the dynamics of adsorption process in
terms of the order of rate constant. Two kinetic
models were applied to the adsorption kinetic data in
order to investigate the behavior of adsorption
process of dyes onto our clay. These models are the
pseudo-first-order and pseudo-second order models.
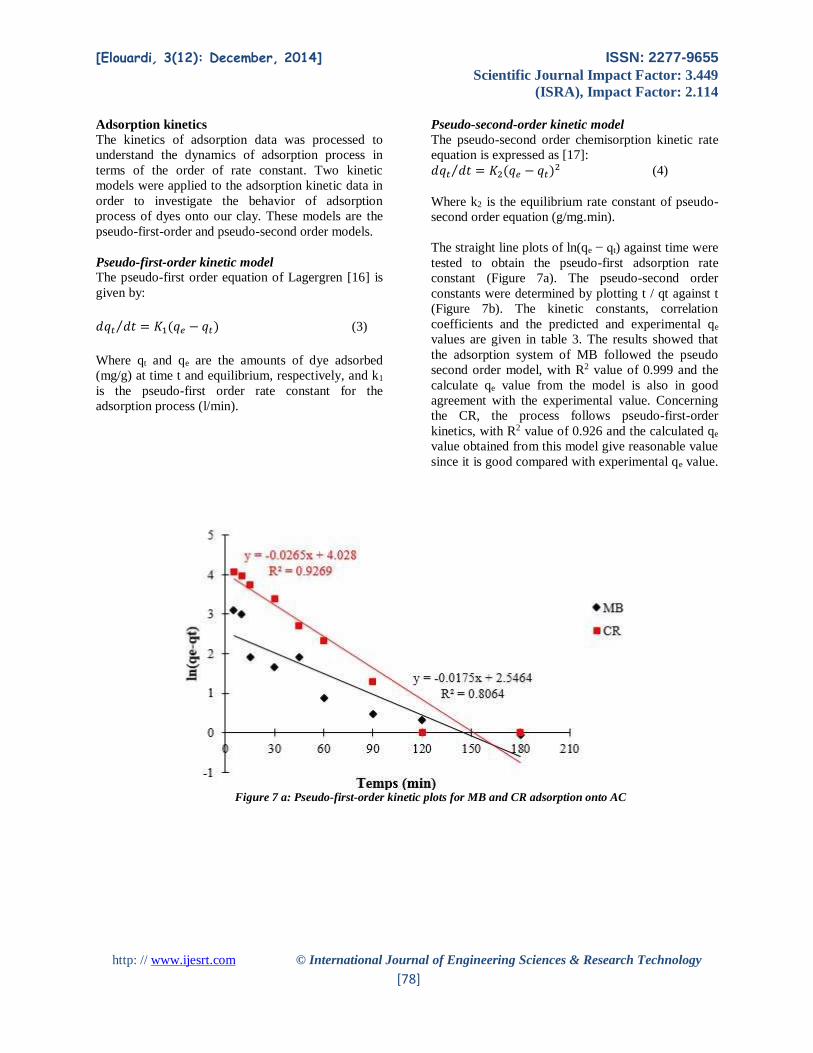
Pseudo-first-order kinetic model
The pseudo-first order equation of Lagergren [16] is
given by:
𝑑𝑞𝑡 𝑑𝑡⁄ = 𝐾1(𝑞𝑒 − 𝑞𝑡) (3) Where qt and qe are the amounts of dye adsorbed
(mg/g) at time t and equilibrium, respectively, and k1
is the pseudo-first order rate constant for the
adsorption process (l/min).
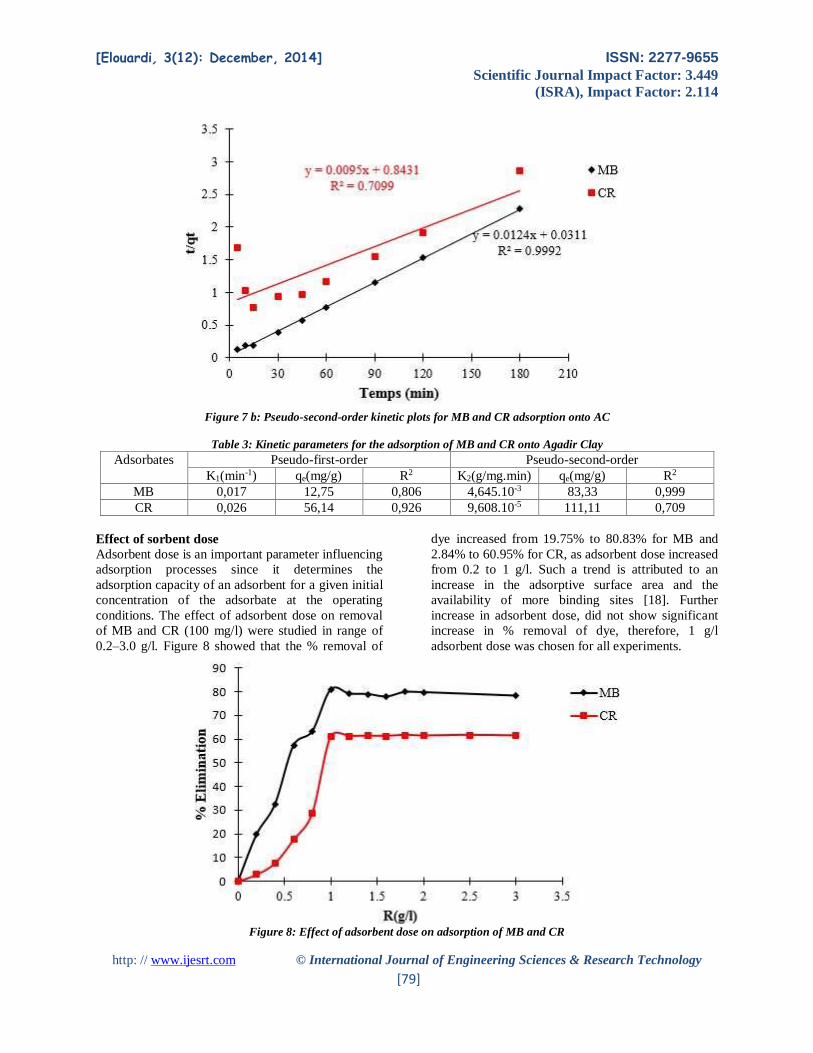
Pseudo-second-order kinetic model
The pseudo-second order chemisorption kinetic rate
equation is expressed as [17]:
𝑑𝑞𝑡 𝑑𝑡⁄ = 𝐾2(𝑞𝑒 − 𝑞𝑡)2 (4)
Where k2 is the equilibrium rate constant of pseudo-
second order equation (g/mg.min).
The straight line plots of ln(qe − qt) against time were
tested to obtain the pseudo-first adsorption rate
constant (Figure 7a). The pseudo-second order
constants were determined by plotting t / qt against t
(Figure 7b). The kinetic constants, correlation
coefficients and the predicted and experimental qe
values are given in table 3. The results showed that
the adsorption system of MB followed the pseudo
second order model, with R2 value of 0.999 and the
calculate qe value from the model is also in good
agreement with the experimental value. Concerning
the CR, the process follows pseudo-first-order
kinetics, with R2 value of 0.926 and the calculated qe
value obtained from this model give reasonable value
since it is good compared with experimental qe value.
Figure 7 a: Pseudo-first-order kinetic plots for MB and CR adsorption onto AC
[Elouardi, 3(12): December, 2014] ISSN: 2277-9655
Scientific Journal Impact Factor: 3.449
(ISRA), Impact Factor: 2.114
http: // www.ijesrt.com © International Journal of Engineering Sciences & Research Technology
[79]
Figure 7 b: Pseudo-second-order kinetic plots for MB and CR adsorption onto AC
Table 3: Kinetic parameters for the adsorption of MB and CR onto Agadir Clay
Adsorbates Pseudo-first-order Pseudo-second-order
K1(min-1) qe(mg/g) R2 K2(g/mg.min) qe(mg/g) R2
MB 0,017 12,75 0,806 4,645.10-3 83,33 0,999
CR 0,026 56,14 0,926 9,608.10-5 111,11 0,709
Effect of sorbent dose
Adsorbent dose is an important parameter influencing
adsorption processes since it determines the
adsorption capacity of an adsorbent for a given initial
concentration of the adsorbate at the operating
conditions. The effect of adsorbent dose on removal
of MB and CR (100 mg/l) were studied in range of
0.2–3.0 g/l. Figure 8 showed that the % removal of
dye increased from 19.75% to 80.83% for MB and
2.84% to 60.95% for CR, as adsorbent dose increased
from 0.2 to 1 g/l. Such a trend is attributed to an
increase in the adsorptive surface area and the
availability of more binding sites [18]. Further
increase in adsorbent dose, did not show significant
increase in % removal of dye, therefore, 1 g/l
adsorbent dose was chosen for all experiments.
Figure 8: Effect of adsorbent dose on adsorption of MB and CR
[Elouardi, 3(12): December, 2014] ISSN: 2277-9655
Scientific Journal Impact Factor: 3.449
(ISRA), Impact Factor: 2.114
http: // www.ijesrt.com © International Journal of Engineering Sciences & Research Technology
[80]
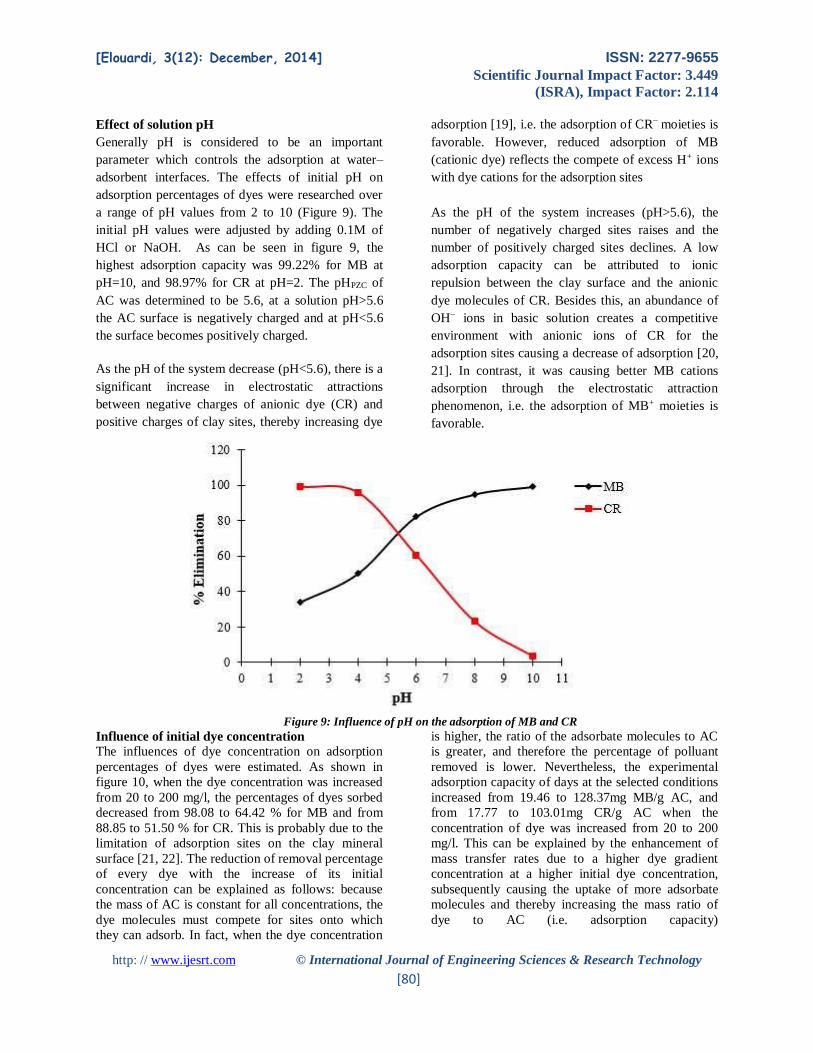
Effect of solution pH
Generally pH is considered to be an important
parameter which controls the adsorption at water–
adsorbent interfaces. The effects of initial pH on
adsorption percentages of dyes were researched over
a range of pH values from 2 to 10 (Figure 9). The
initial pH values were adjusted by adding 0.1M of
HCl or NaOH. As can be seen in figure 9, the
highest adsorption capacity was 99.22% for MB at
pH=10, and 98.97% for CR at pH=2. The pHPZC of
AC was determined to be 5.6, at a solution pH>5.6
the AC surface is negatively charged and at pH<5.6
the surface becomes positively charged.
As the pH of the system decrease (pH<5.6), there is a
significant increase in electrostatic attractions
between negative charges of anionic dye (CR) and
positive charges of clay sites, thereby increasing dye
adsorption [19], i.e. the adsorption of CR− moieties is
favorable. However, reduced adsorption of MB
(cationic dye) reflects the compete of excess H+ ions
with dye cations for the adsorption sites
As the pH of the system increases (pH>5.6), the
number of negatively charged sites raises and the
number of positively charged sites declines. A low
adsorption capacity can be attributed to ionic
repulsion between the clay surface and the anionic
dye molecules of CR. Besides this, an abundance of
OH− ions in basic solution creates a competitive
environment with anionic ions of CR for the
adsorption sites causing a decrease of adsorption [20,
21]. In contrast, it was causing better MB cations
adsorption through the electrostatic attraction
phenomenon, i.e. the adsorption of MB+ moieties is
favorable.
Figure 9: Influence of pH on the adsorption of MB and CR
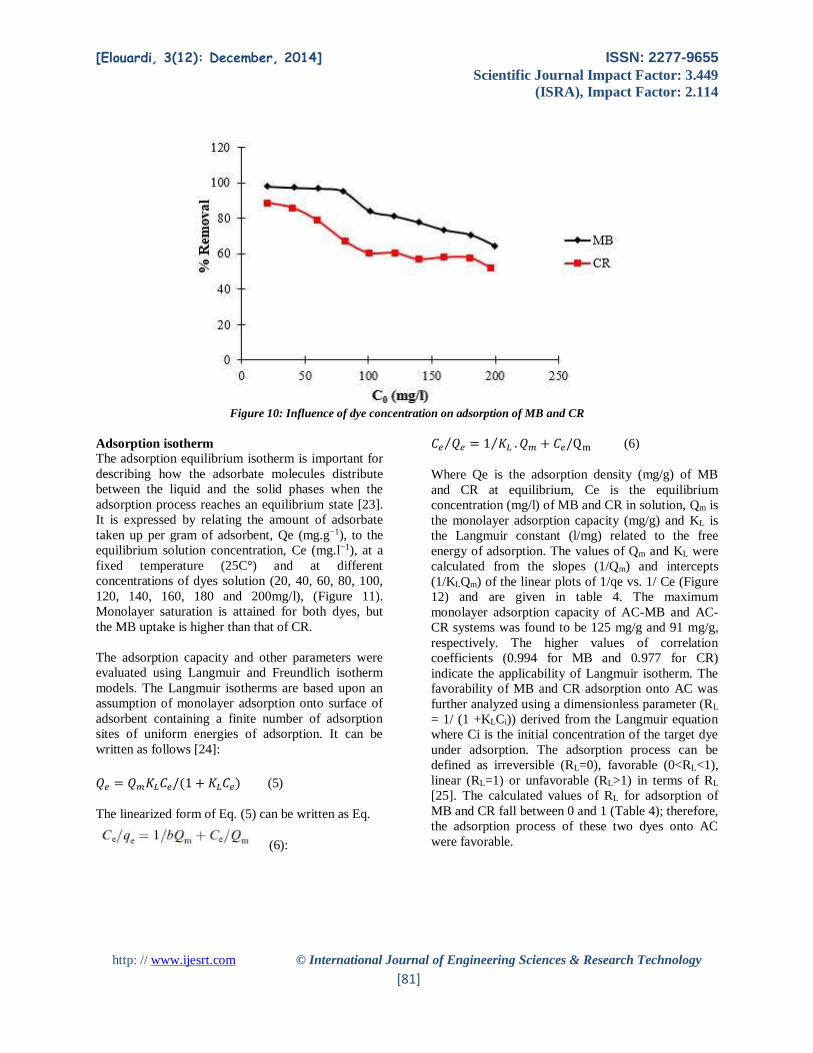
Influence of initial dye concentration
The influences of dye concentration on adsorption
percentages of dyes were estimated. As shown in
figure 10, when the dye concentration was increased
from 20 to 200 mg/l, the percentages of dyes sorbed
decreased from 98.08 to 64.42 % for MB and from
88.85 to 51.50 % for CR. This is probably due to the
limitation of adsorption sites on the clay mineral
surface [21, 22]. The reduction of removal percentage
of every dye with the increase of its initial
concentration can be explained as follows: because
the mass of AC is constant for all concentrations, the
dye molecules must compete for sites onto which
they can adsorb. In fact, when the dye concentration
is higher, the ratio of the adsorbate molecules to AC
is greater, and therefore the percentage of polluant
removed is lower. Nevertheless, the experimental
adsorption capacity of days at the selected conditions
increased from 19.46 to 128.37mg MB/g AC, and
from 17.77 to 103.01mg CR/g AC when the
concentration of dye was increased from 20 to 200
mg/l. This can be explained by the enhancement of
mass transfer rates due to a higher dye gradient
concentration at a higher initial dye concentration,
subsequently causing the uptake of more adsorbate
molecules and thereby increasing the mass ratio of
dye to AC (i.e. adsorption capacity)
[Elouardi, 3(12): December, 2014] ISSN: 2277-9655
Scientific Journal Impact Factor: 3.449
(ISRA), Impact Factor: 2.114
http: // www.ijesrt.com © International Journal of Engineering Sciences & Research Technology
[81]
Figure 10: Influence of dye concentration on adsorption of MB and CR
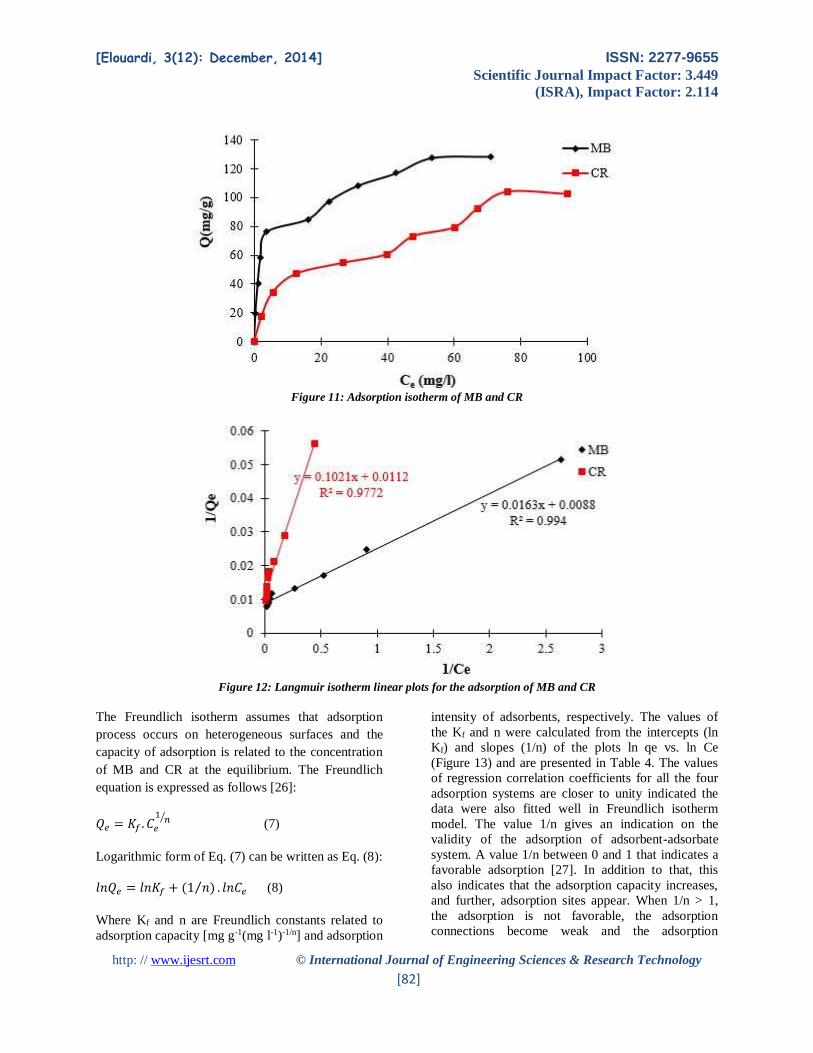
Adsorption isotherm
The adsorption equilibrium isotherm is important for
describing how the adsorbate molecules distribute
between the liquid and the solid phases when the
adsorption process reaches an equilibrium state [23].
It is expressed by relating the amount of adsorbate
taken up per gram of adsorbent, Qe (mg.g−1), to the
equilibrium solution concentration, Ce (mg.l−1), at a
fixed temperature (25C°) and at different
concentrations of dyes solution (20, 40, 60, 80, 100,
120, 140, 160, 180 and 200mg/l), (Figure 11).
Monolayer saturation is attained for both dyes, but
the MB uptake is higher than that of CR.
The adsorption capacity and other parameters were
evaluated using Langmuir and Freundlich isotherm
models. The Langmuir isotherms are based upon an
assumption of monolayer adsorption onto surface of
adsorbent containing a finite number of adsorption
sites of uniform energies of adsorption. It can be
written as follows [24]:
𝑄𝑒 = 𝑄𝑚𝐾𝐿𝐶𝑒/(1 + 𝐾𝐿𝐶𝑒) (5)
The linearized form of Eq. (5) can be written as Eq.
(6):
𝐶𝑒 𝑄𝑒⁄ = 1 𝐾𝐿⁄ . 𝑄𝑚 + 𝐶𝑒/Qm (6)
Where Qe is the adsorption density (mg/g) of MB
and CR at equilibrium, Ce is the equilibrium
concentration (mg/l) of MB and CR in solution, Qm is
the monolayer adsorption capacity (mg/g) and KL is
the Langmuir constant (l/mg) related to the free
energy of adsorption. The values of Qm and KL were
calculated from the slopes (1/Qm) and intercepts
(1/KLQm) of the linear plots of 1/qe vs. 1/ Ce (Figure
12) and are given in table 4. The maximum
monolayer adsorption capacity of AC-MB and AC-
CR systems was found to be 125 mg/g and 91 mg/g,
respectively. The higher values of correlation
coefficients (0.994 for MB and 0.977 for CR)
indicate the applicability of Langmuir isotherm. The
favorability of MB and CR adsorption onto AC was
further analyzed using a dimensionless parameter (RL
= 1/ (1 +KLCi)) derived from the Langmuir equation
where Ci is the initial concentration of the target dye
under adsorption. The adsorption process can be
defined as irreversible (RL=0), favorable (0<RL<1),
linear (RL=1) or unfavorable (RL>1) in terms of RL
[25]. The calculated values of RL for adsorption of
MB and CR fall between 0 and 1 (Table 4); therefore,
the adsorption process of these two dyes onto AC
were favorable.
[Elouardi, 3(12): December, 2014] ISSN: 2277-9655
Scientific Journal Impact Factor: 3.449
(ISRA), Impact Factor: 2.114
http: // www.ijesrt.com © International Journal of Engineering Sciences & Research Technology
[82]
Figure 11: Adsorption isotherm of MB and CR
Figure 12: Langmuir isotherm linear plots for the adsorption of MB and CR
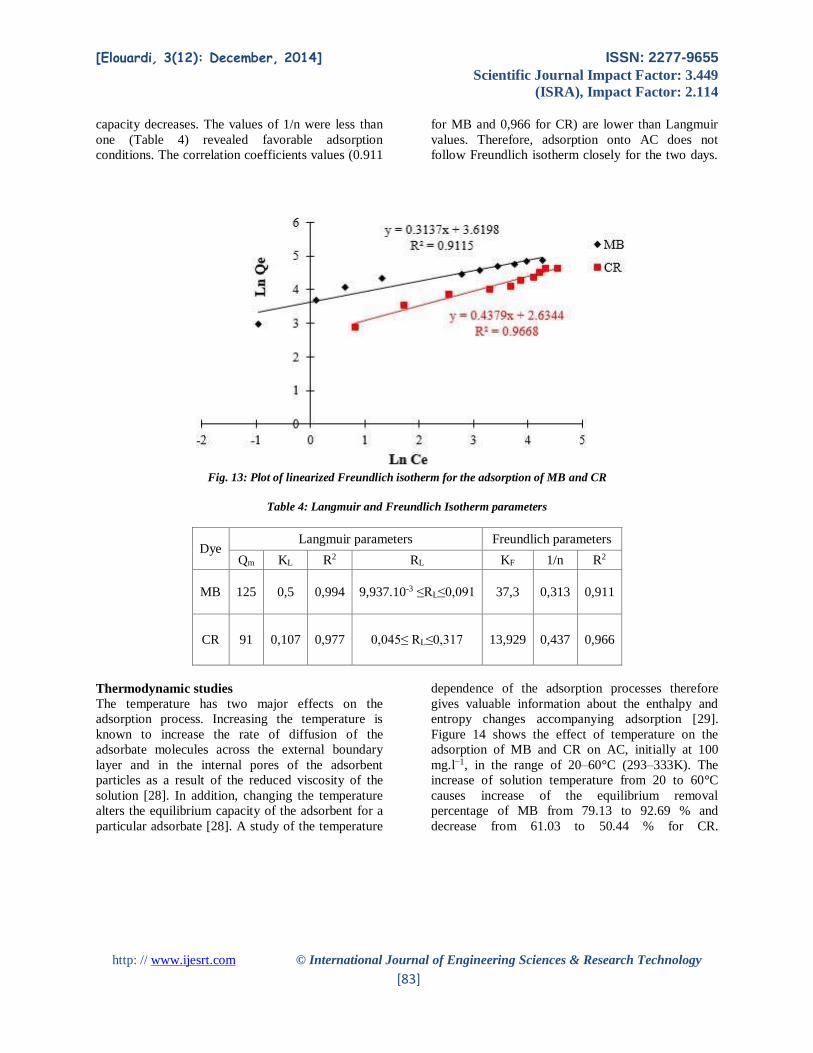
The Freundlich isotherm assumes that adsorption
process occurs on heterogeneous surfaces and the
capacity of adsorption is related to the concentration
of MB and CR at the equilibrium. The Freundlich
equation is expressed as follows [26]:
𝑄𝑒 = 𝐾𝑓 . 𝐶𝑒
1𝑛⁄
(7)
Logarithmic form of Eq. (7) can be written as Eq. (8):
𝑙𝑛𝑄𝑒 = 𝑙𝑛𝐾𝑓 + (1 𝑛)⁄ . 𝑙𝑛𝐶𝑒 (8)
Where Kf and n are Freundlich constants related to
adsorption capacity [mg g-1(mg l-1)-1/n] and adsorption
intensity of adsorbents, respectively. The values of
the Kf and n were calculated from the intercepts (ln
Kf) and slopes (1/n) of the plots ln qe vs. ln Ce
(Figure 13) and are presented in Table 4. The values
of regression correlation coefficients for all the four
adsorption systems are closer to unity indicated the
data were also fitted well in Freundlich isotherm
model. The value 1/n gives an indication on the
validity of the adsorption of adsorbent-adsorbate
system. A value 1/n between 0 and 1 that indicates a
favorable adsorption [27]. In addition to that, this
also indicates that the adsorption capacity increases,
and further, adsorption sites appear. When 1/n > 1,
the adsorption is not favorable, the adsorption
connections become weak and the adsorption
[Elouardi, 3(12): December, 2014] ISSN: 2277-9655
Scientific Journal Impact Factor: 3.449
(ISRA), Impact Factor: 2.114
http: // www.ijesrt.com © International Journal of Engineering Sciences & Research Technology
[83]
capacity decreases. The values of 1/n were less than
one (Table 4) revealed favorable adsorption
conditions. The correlation coefficients values (0.911
for MB and 0,966 for CR) are lower than Langmuir
values. Therefore, adsorption onto AC does not
follow Freundlich isotherm closely for the two days.
Fig. 13: Plot of linearized Freundlich isotherm for the adsorption of MB and CR
Table 4: Langmuir and Freundlich Isotherm parameters
Dye Langmuir parameters Freundlich parameters
Qm KL R2 RL KF 1/n R2
MB 125 0,5 0,994 9,937.10-3 ≤RL≤0,091 37,3 0,313 0,911
CR 91 0,107 0,977 0,045≤ RL≤0,317 13,929 0,437 0,966
Thermodynamic studies
The temperature has two major effects on the
adsorption process. Increasing the temperature is
known to increase the rate of diffusion of the
adsorbate molecules across the external boundary
layer and in the internal pores of the adsorbent
particles as a result of the reduced viscosity of the
solution [28]. In addition, changing the temperature
alters the equilibrium capacity of the adsorbent for a
particular adsorbate [28]. A study of the temperature
dependence of the adsorption processes therefore
gives valuable information about the enthalpy and
entropy changes accompanying adsorption [29].
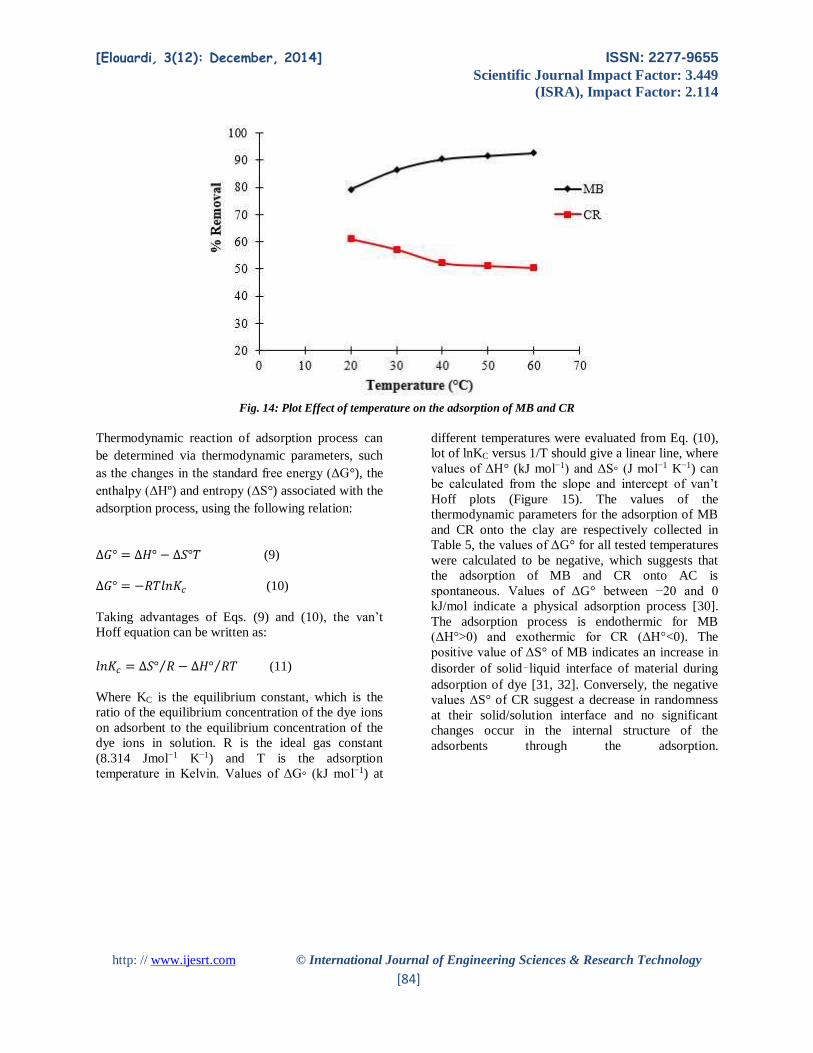
Figure 14 shows the effect of temperature on the
adsorption of MB and CR on AC, initially at 100
mg.l−1, in the range of 20–60°C (293–333K). The
increase of solution temperature from 20 to 60°C
causes increase of the equilibrium removal
percentage of MB from 79.13 to 92.69 % and
decrease from 61.03 to 50.44 % for CR.
[Elouardi, 3(12): December, 2014] ISSN: 2277-9655
Scientific Journal Impact Factor: 3.449
(ISRA), Impact Factor: 2.114
http: // www.ijesrt.com © International Journal of Engineering Sciences & Research Technology
[84]
Fig. 14: Plot Effect of temperature on the adsorption of MB and CR
Thermodynamic reaction of adsorption process can
be determined via thermodynamic parameters, such
as the changes in the standard free energy (ΔG°), the
enthalpy (ΔHº) and entropy (ΔS°) associated with the
adsorption process, using the following relation:
∆𝐺° = ∆𝐻° − ∆𝑆°𝑇 (9)
∆𝐺° = −𝑅𝑇𝑙𝑛𝐾𝑐 (10)
Taking advantages of Eqs. (9) and (10), the van’t
Hoff equation can be written as:
𝑙𝑛𝐾𝑐 = ∆𝑆° 𝑅⁄ − ∆𝐻° 𝑅𝑇⁄ (11)
Where KC is the equilibrium constant, which is the
ratio of the equilibrium concentration of the dye ions
on adsorbent to the equilibrium concentration of the
dye ions in solution. R is the ideal gas constant
(8.314 Jmol−1 K−1) and T is the adsorption
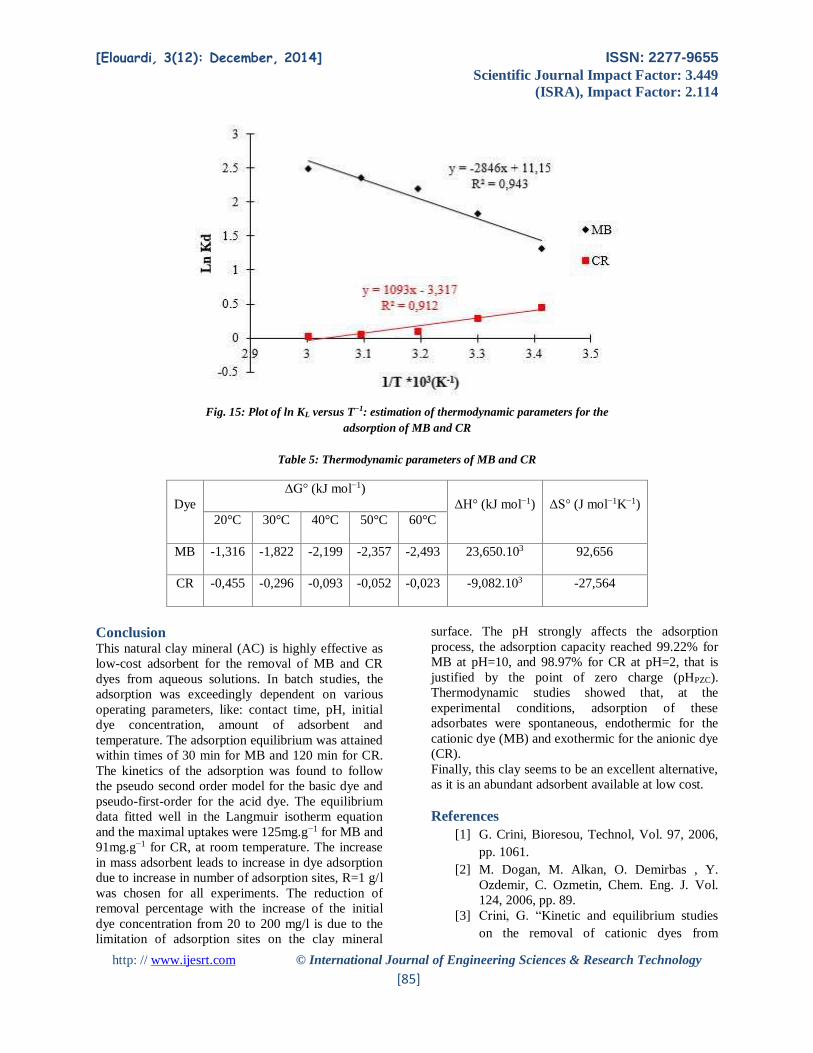
temperature in Kelvin. Values of ΔG◦ (kJ mol−1) at
different temperatures were evaluated from Eq. (10),
lot of lnKC versus 1/T should give a linear line, where
values of ΔH° (kJ mol−1) and ΔS◦ (J mol−1 K−1) can
be calculated from the slope and intercept of van’t
Hoff plots (Figure 15). The values of the
thermodynamic parameters for the adsorption of MB
and CR onto the clay are respectively collected in
Table 5, the values of ΔG° for all tested temperatures
were calculated to be negative, which suggests that
the adsorption of MB and CR onto AC is
spontaneous. Values of ΔG° between −20 and 0
kJ/mol indicate a physical adsorption process [30].
The adsorption process is endothermic for MB
(ΔH°>0) and exothermic for CR (ΔH°<0). The
positive value of ΔS° of MB indicates an increase in
disorder of solid–liquid interface of material during
adsorption of dye [31, 32]. Conversely, the negative
values ΔS° of CR suggest a decrease in randomness
at their solid/solution interface and no significant
changes occur in the internal structure of the
adsorbents through the adsorption.
[Elouardi, 3(12): December, 2014] ISSN: 2277-9655
Scientific Journal Impact Factor: 3.449
(ISRA), Impact Factor: 2.114
http: // www.ijesrt.com © International Journal of Engineering Sciences & Research Technology
[85]
Fig. 15: Plot of ln KL versus T−1: estimation of thermodynamic parameters for the
adsorption of MB and CR
Table 5: Thermodynamic parameters of MB and CR
Dye
ΔG° (kJ mol−1)
ΔH° (kJ mol−1) ΔS° (J mol−1K−1)
20°C 30°C 40°C 50°C 60°C
MB -1,316 -1,822 -2,199 -2,357 -2,493 23,650.103 92,656
CR -0,455 -0,296 -0,093 -0,052 -0,023 -9,082.103 -27,564
Conclusion This natural clay mineral (AC) is highly effective as
low-cost adsorbent for the removal of MB and CR
dyes from aqueous solutions. In batch studies, the
adsorption was exceedingly dependent on various
operating parameters, like: contact time, pH, initial
dye concentration, amount of adsorbent and
temperature. The adsorption equilibrium was attained
within times of 30 min for MB and 120 min for CR.
The kinetics of the adsorption was found to follow
the pseudo second order model for the basic dye and
pseudo-first-order for the acid dye. The equilibrium
data fitted well in the Langmuir isotherm equation
and the maximal uptakes were 125mg.g−1 for MB and
91mg.g−1 for CR, at room temperature. The increase
in mass adsorbent leads to increase in dye adsorption
due to increase in number of adsorption sites, R=1 g/l
was chosen for all experiments. The reduction of
removal percentage with the increase of the initial
dye concentration from 20 to 200 mg/l is due to the
limitation of adsorption sites on the clay mineral
surface. The pH strongly affects the adsorption
process, the adsorption capacity reached 99.22% for
MB at pH=10, and 98.97% for CR at pH=2, that is
justified by the point of zero charge (pHPZC).
Thermodynamic studies showed that, at the
experimental conditions, adsorption of these
adsorbates were spontaneous, endothermic for the
cationic dye (MB) and exothermic for the anionic dye
(CR). Finally, this clay seems to be an excellent alternative,
as it is an abundant adsorbent available at low cost.
References
[1] G. Crini, Bioresou, Technol, Vol. 97, 2006,
pp. 1061.
[2] M. Dogan, M. Alkan, O. Demirbas , Y.
Ozdemir, C. Ozmetin, Chem. Eng. J. Vol.
124, 2006, pp. 89.
[3] Crini, G. “Kinetic and equilibrium studies
on the removal of cationic dyes from
[Elouardi, 3(12): December, 2014] ISSN: 2277-9655
Scientific Journal Impact Factor: 3.449
(ISRA), Impact Factor: 2.114
http: // www.ijesrt.com © International Journal of Engineering Sciences & Research Technology
[86]
aqueous solution by adsorption onto a
cyclodextrin polymer” Dyes Pigments, Vol.
77, 2008, pp. 415–426.
[4] T. Akar, T.A. Demir, I. Kiran, A. Ozcan,
A.S. Ozcan, S. Tunali, J. Chem. Technol.
Biotechnol. Vol. 81, 2006, pp. 1100.
[5] K. Mohanty, J.T. Naidu, B.C. Meikap, M.N.
Biswas, Ind. Eng. Chem. Res. Vol. 45, 2006,
pp. 5165.
[6] S.J. Allen, G. McKay, J.F. Porter,
“Adsorption isotherm models for basic dye
adsorption by peat in single and binary
component systems” J. Colloid Interface
Sci. Vol. 280, 2004, pp. 322–333.
[7] M. Ozacar, I.A.S¸ engil, “Equilibrium data
and process design for adsorption of
disperse dyes onto alunite” Environ. Geol.
Vol. 45, 2004, pp. 762–768.
[8] Hameed, B.H., “Spent tea leaves: a new
non-conventional and low-cost adsorbent for
removal of basic dye from aqueous
solutions” J. Hazard. Mater. Vol. 161, 2009,
pp. 753–759.
[9] Salleh, M.A.M., Mahmoud, D.K., Karim,
W.A.W.A., Idris, A., “Cationic and anionic
dye adsorption by agricultural solid wastes:
a comprehensive review” Desalination, Vol.
280, 2011, pp. 1–13.
[10] Alkan, M., Demirbaş, Ö., Doğan, M.,“
Adsorption kinetics and thermodynamics of
an anionic dye onto sepiolite” Microporous
Mesoporous Mater. Vol. 101, 2007, pp.
388–396.
[11] Vimonses, V., Lei, S., Jin, B., Chow,
C.W.K., Saint, C., “Kinetic study and
equilibrium isotherm analysis of congo red
adsorption by clay materials” Chem. Eng. J.
available on line, 2008.
[12] A.P. Vieira, S.A.A. Santana, C.W.B.
Bezerra, H.A.S. Silva, J.A.P. Chaves, J.C.P.
de Melo, E.C. da Silva Filho, C. Airoldi,
“Kinetics and thermodynamics of textile dye
adsorption from aqueous solutions using
babassu coconut mesocarp” J. Hazard.
Mater. Vol. 166, 2009, pp. 1272–1278.
[13] R.M. Gong, S.X. Zhu, D.M. Zhang, J. Chen,
S.J. Ni, R. Guan, “Adsorption behavior of
cationic dyes on citric acid esterified wheat
straw: kinetic and thermodynamic profile”
Desalination, Vol. 230, 2008, pp. 220–228.
[14] Abd, E.L., Latif, M.M., Ibrahim, A.M.,“
Adsorption, kinetic and equilibrium studies
on removal of basic dye from aqueous
solutions using hydrolyzed oak sawdust”
Desalin. Water Treat. Vol. 6, 2009, pp. 252–
268.
[15] Nemr, A.E., Abdel, W.O., Amany, E.S.,
Khaled, A.,“Removal of direct blue-86 from
aqueous solution by new activated carbon
developed from orange peel” J. Hazard.
Mater. Vol. 161, 2009, pp. 102–110.
[16] Ho, Y.S., “Citation review of Lagergren
kinetic rate equation on adsorption
reactions” Scientometrics, Vol. 59, 2004, pp.
71–177.
[17] Ho, Y.S., Mckay, G.,“Pseudo-second order
model for sorption processes” Process
Biochem. Vol. 34, 1999, pp. 451–465.
[18] I.D. Mall, V.C. Srivastava, N.K. Agarwal,
I.M. Mishra, “Removal of congo red from
aqueous solution by bagasse fly ash and
activated carbon: Kinetic study and
equilibrium isotherm analyses”
Chemosphere, Vol. 61, 2005, pp. 492–501.
[19] A.S. Ozcan, B. Erdem, A. Ozcan,
“Adsorption of Acid Blue 193 fromaqueous
solutions onto Na-bentonite and DTMA-
bentonite” J. Colloid Interf. Sci. Vol. 280,
2004, pp. 44–54.
[20] Vipasiri Vimonses, Shaomin Lei, Bo Jin,
ChrisW.K. Chow, Chris Saint, “Kinetic
study and equilibrium isotherm analysis of
Congo Red adsorption by clay materials”
Chemical Engineering Journal, Vol. 148,
2009, pp. 354–364.
[21] Gholamreza Moussavi, Rasoul Khosravi
“The removal of cationic dyes from aqueous
solutions by adsorption onto pistachio hull
waste” chemical engineering research and
design, Vol. 89, 2011, pp. 2182–2189.
[22] Vipasiri Vimonses, Shaomin Lei, Bo Jin,
Chris W.K. Chow, Chris Saint “Adsorption
of congo red by three Australian kaolins”
Applied Clay Science, Vol. 43, 2009, pp.
465–472.
[23] M. Dogan, M. Alkan, O. Demirbas, Y.
Ozdemir, C. Ozmetin, Chem. Eng. J., Vol.
124, 2006, pp. 89.
[24] I.Langmuir, “Adsorption of gases on plain
surfaces of glass mica platinum” J. Am.
Chem. Soc. Vol. 40, 1918, pp. 136–403.
[25] Sivaraj, R., Namasivayam, C., Kadirvelu,
K., “Orange peel as an adsorbent in the
removal of acid violet 17 (acid dye) from
[Elouardi, 3(12): December, 2014] ISSN: 2277-9655
Scientific Journal Impact Factor: 3.449
(ISRA), Impact Factor: 2.114
http: // www.ijesrt.com © International Journal of Engineering Sciences & Research Technology
[87]
aqueous solutions” Waste Manage, Vol. 21,
2001, pp. 105–110.
[26] H.M.F. Freundlich, “Uber die adsorption in
losungen” J. Phys. Chem., Vol. 57, 1906,
pp. 385–470.
[27] W. T. Tsai, Y. M. Chang, C. W. Lai and C.
C. Lo, “Adsorption of Basic Dyes in
Aqueous Solution by Clay Adsorbent from
Regenerated Bleaching Earth” Applied Clay
Science, Vol. 29, 2005, pp. 149-154.
[28] M. Dogan, M. Alkan, A. Turkyilmaz, Y.
Ozdemir, J. Hazard. Mater., Vol. 109, 2004,
pp. 141.
[29] M. Alkan, O. Demirbas, , S. Celikcapa, M.
Dog˘an, J. Hazard. Mater., Vol. 116, 2004,
pp. 135.
[30] Almeida, C.A.P., Debacher, N.A., Downs,
A.J., Cottet, L.C., Mello, A.D., “Removal of
methylene blue from colored effluents by
adsorption on montmorillonite clay” J.
Colloid Interface Sci., Vol. 332, 2009, pp.
46–53.
[31] M. Alkan, O. Demirbas, M. Dogan,
“Adsorption kinetics and thermodynamics of
an anionic dye onto sepiolite” Micropor.
Mesopor. Mater., Vol. 101, 2007, pp. 388–
396.
[32] D.G. Krishna, G. Bhattacharyya,
“Adsorption of methylene blue on kaolinite,
Appl. Clay Sci., Vol. 20, 2002, pp. 295–300.


