Embed Size (px)
Citation preview
Full Terms & Conditions of access and use can be found athttp://www.tandfonline.com/action/journalInformation?journalCode=ldis20
Journal of Dispersion Science and Technology
ISSN: 0193-2691 (Print) 1532-2351 (Online) Journal homepage: http://www.tandfonline.com/loi/ldis20
Time-dependent structural breakdown ofmicroencapsulated phase change materialssuspensions
Vinh Duy Cao, Carlos Salas-Bringas, Reidar Barfod Schüller, Anna M.Szczotok & Anna-Lena Kjøniksen
To cite this article: Vinh Duy Cao, Carlos Salas-Bringas, Reidar Barfod Schüller, AnnaM. Szczotok & Anna-Lena Kjøniksen (2018): Time-dependent structural breakdown ofmicroencapsulated phase change materials suspensions, Journal of Dispersion Science andTechnology, DOI: 10.1080/01932691.2018.1462194
To link to this article: https://doi.org/10.1080/01932691.2018.1462194
Published with license by Taylor & Francis©Vinh Duy Cao, Carlos Salas-Bringas, ReidarBarfod Schüller, Anna M. Szczotok, andAnna-Lena Kjøniksen
Published online: 27 Oct 2018.
Submit your article to this journal
Article views: 182
View Crossmark data

Time-dependent structural breakdown of microencapsulated phase changematerials suspensions
Vinh Duy Caoa,b, Carlos Salas-Bringasb, Reidar Barfod Sch€ullerc, Anna M. Szczotoka,d, and Anna-Lena Kjøniksena
aFaculty of Engineering, Østfold University College, Halden, Norway; bDepartment of Mathematical Sciences and Technology, NorwegianUniversity of Life Sciences, Ås, Norway; cDepartment of Chemistry, Biotechnology and Food Science, Norwegian University of Life Sciences,Ås, Norway; dDepartment of Chemical Engineering, University of Castilla – La Mancha,Ciudad Real, Spain
ABSTRACTMicroencapsulated phase change materials (MPCM) suspensions are multi-phase heat transfer flu-ids which exploit the latent heat of phase change materials. The effect of MPCM on the rheo-logical properties of suspensions of microcapsules in glycerol were investigated to explore thesuitability of the suspensions as a pumpable heat transfer fluid. Three different rheological modelswere utilized to characterize the time-dependent structural breakdown of the suspensions, andthe second-order structural kinetic model was found to give a better fit to the experimental datathan the Weltman and Figoni-Shoemaker models. The MPCM form agglomerates, which are dis-rupted by shear forces. The breakdown of the agglomerated structures was most pronounced athigh shear rates where the microcapsules are subjected to stronger disruptive forces. Moreagglomerates are present at higher concentrations, which causes a stronger breakdown of theagglomerated structures when the concentration is raised. The time-dependent structural break-down of MPCM suspensions plays an important role for improving the efficiency of heat transferliquids based on such materials.
GRAPHICAL ABSTRACT
ARTICLE HISTORYReceived 2 February 2018Accepted 24 March 2018
KEYWORDSMicroencapsulated phasechange materials; rheology;the second-order structuralkinetic model;time-dependent behaviour
Introduction
Suspensions of microcapsules in heat transfer fluids havegreat potential for thermal energy storage and heat transferfluid applications.[1–6] Microencapsulated phase changematerials (MPCM) suspensions are multi-phase heat transferfluids which exploit the latent heat of phase change materi-als. They are more efficient heat carriers than single-phasefluids. An increase in MPCM concentration improves theheat capacity and energy storage density during the phase
change temperature range. Accordingly, reduced suspensionflow rates can be utilized, leading to a lower pumping powerconsumption. However, this is counteracted by the MPCMinduced viscosity increase of the suspensions, which raises thepower consumption for pumping. It is therefore important toexamine the rheological properties of the MPCM suspensions.Most studies of MPCM suspensions are only consideringNewtonian liquids.[2–5] However, many such systems exhibitnon-Newtonian and time-dependent behavior.
CONTACT Anna-Lena Kjøniksen [email protected] versions of one or more of the figures in the article can be found online at www.tandfonline.com/ldis.Published with license by Taylor & Francis. � Vinh Duy Cao, Carlos Salas-Bringas, Reidar Barfod Sch€uller, Anna M. Szczotok, and Anna-Lena Kjøniksen.This is an Open Access article distributed under the terms of the Creative Commons Attribution-NonCommercial-NoDerivatives License (http://creativecommons.org/licenses/by-nc-nd/4.0/), which permits non-commercial re-use, distribution, and reproduction in any medium, provided the original work is properly cited, and is not altered, transformed, or built upon inany way.
JOURNAL OF DISPERSION SCIENCE AND TECHNOLOGYhttps://doi.org/10.1080/01932691.2018.1462194
Water is the most utilized fluid for microcapsule suspen-sions due to its availability, cheap price, high thermal con-ductivity and large specific heat capacity.[2–7] The mainproblems of water based MPCM suspensions are the highfloatation rate and the restricted usable temperature range.In addition, agglomeration of the microcapsules can causeproblems such as increased viscosities. The agglomeration ofthe microcapsules can be reduced by utilizing a reasonablemicrocapsule concentration[8] and by using surfactants.[3,6]
Flotation can be adverted by using smaller microcapsules[8]
and by balancing the density of the microcapsules and thecarrier medium. In addition, a fluid with a higher viscosity,such as glycerol, can also reduce flotation. Glycerol exhibitsa high thermal conductivity and large specific heat capacity,and a lower freezing point and higher boiling point thanwater. This can extend the usable temperature range.However, the main drawback of utilizing glycerol as a car-rier fluid is the higher viscosity, which increases the powerconsumption of the pumping process. It is therefore inter-esting to investigate the effect of MPCM on the rheologicalproperties of glycerol suspensions.
In this study, the time-dependent structural breakdownof microcapsule suspensions in glycerol under the influenceof a steady shear rate was investigated. The time-dependentbehaviour of the MPCM suspensions were fitted to threedifferent models in order to find which model is best suitedto describe the experimental data (the Weltman model,[9]
the Figoni & Shoemaker model[10] and the second-orderstructural kinetic model).[11,12] The investigation providevaluable rheological information which can be used to min-imize the effect of MPCM on the viscosity increase of thesuspensions. This can help enhancing the energy efficiencyof this new type MPCM suspension.
Materials and methods
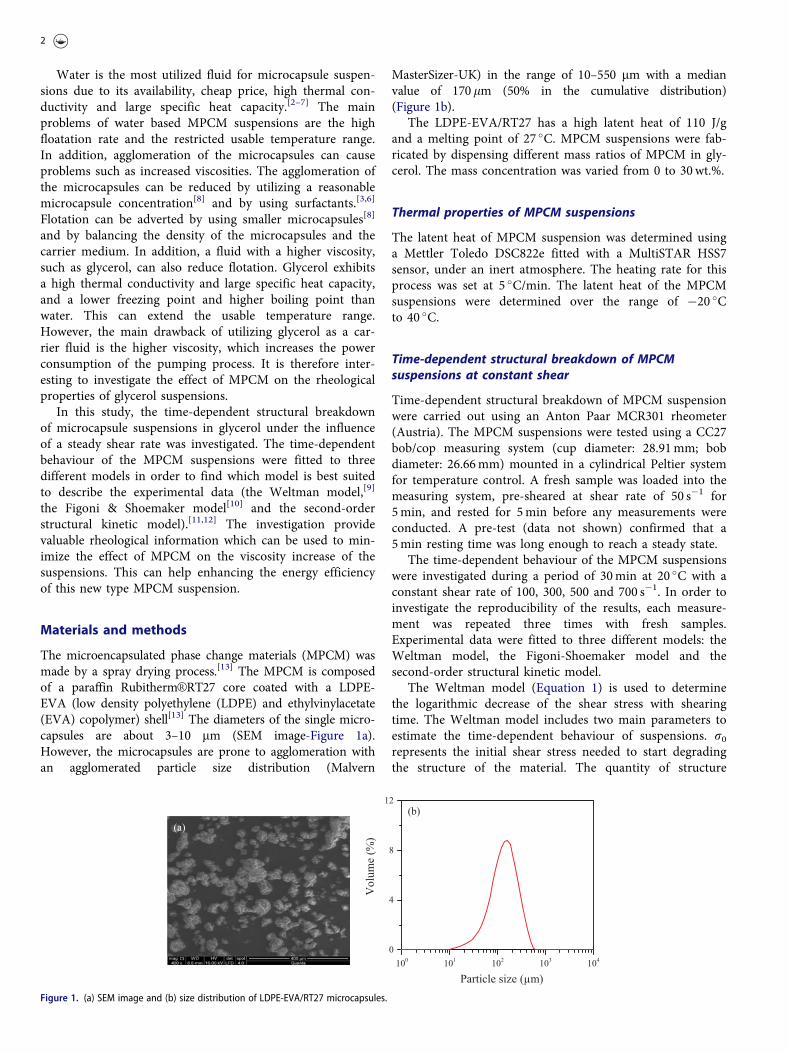
The microencapsulated phase change materials (MPCM) wasmade by a spray drying process.[13] The MPCM is composedof a paraffin RubithermVR RT27 core coated with a LDPE-EVA (low density polyethylene (LDPE) and ethylvinylacetate(EVA) copolymer) shell[13] The diameters of the single micro-capsules are about 3–10 mm (SEM image-Figure 1a).However, the microcapsules are prone to agglomeration withan agglomerated particle size distribution (Malvern
MasterSizer-UK) in the range of 10–550 mm with a medianvalue of 170lm (50% in the cumulative distribution)(Figure 1b).
The LDPE-EVA/RT27 has a high latent heat of 110 J/gand a melting point of 27 �C. MPCM suspensions were fab-ricated by dispensing different mass ratios of MPCM in gly-cerol. The mass concentration was varied from 0 to 30wt.%.
Thermal properties of MPCM suspensions
The latent heat of MPCM suspension was determined usinga Mettler Toledo DSC822e fitted with a MultiSTAR HSS7sensor, under an inert atmosphere. The heating rate for thisprocess was set at 5 �C/min. The latent heat of the MPCMsuspensions were determined over the range of �20 �Cto 40 �C.
Time-dependent structural breakdown of MPCMsuspensions at constant shear
Time-dependent structural breakdown of MPCM suspensionwere carried out using an Anton Paar MCR301 rheometer(Austria). The MPCM suspensions were tested using a CC27bob/cop measuring system (cup diameter: 28.91mm; bobdiameter: 26.66mm) mounted in a cylindrical Peltier systemfor temperature control. A fresh sample was loaded into themeasuring system, pre-sheared at shear rate of 50 s�1 for5min, and rested for 5min before any measurements wereconducted. A pre-test (data not shown) confirmed that a5min resting time was long enough to reach a steady state.
The time-dependent behaviour of the MPCM suspensionswere investigated during a period of 30min at 20 �C with aconstant shear rate of 100, 300, 500 and 700 s�1. In order toinvestigate the reproducibility of the results, each measure-ment was repeated three times with fresh samples.Experimental data were fitted to three different models: theWeltman model, the Figoni-Shoemaker model and thesecond-order structural kinetic model.
The Weltman model (Equation 1) is used to determinethe logarithmic decrease of the shear stress with shearingtime. The Weltman model includes two main parameters toestimate the time-dependent behaviour of suspensions. r0represents the initial shear stress needed to start degradingthe structure of the material. The quantity of structure
100
101
102
103
104
0
4
8
12
(b)
Volu
me
(%)
Particle size (µm)
(a)
Figure 1. (a) SEM image and (b) size distribution of LDPE-EVA/RT27 microcapsules.
2

degradation during shearing is estimated by the time coeffi-cient of breakdown (B). This also indicates the reduced rateof shear stress from the initial value to the final equilibriumvalue.[14]
r tð Þ ¼ r0�Bln tð Þ [1]
The Figoni-Shoemaker model (Equation 2) describes thetime-dependent behavior in a kinetic constant of breakdownof the internal structure of the MPCM suspensions. Thismodel allows the quantification of the remaining structureand the structure breakdown by the parameters re and (r0 –re), respectively.
rt ¼ re þ r0�reð Þexp �ktð Þ [2]
where k is the kinetic constant of structural breakdown.Finally, the second-order structural kinetic model
assumes that the change of structure is associated withbreakdown of the internal fluid structure during the shear-ing process. The kinetics of the structured state to non-structured state process will define the structural breakdownrate during shearing process.[12,15]
g�geg0 � ge
� �1�m
¼ m�1ð Þks þ 1 [3]
where g0 is the initial viscosity at t¼ 0 (structured state), geis the equilibrium viscosity as t!1 (non-structured state),m is the order of the structure breakdown reaction, m¼ 2for second-order structural kinetic model.[12]
The model selection for characterizing the time-depend-ent behaviour of the MPCM suspensions was evaluatedusing the determination coefficient R2 and the normalizedroot mean squared error (NRMSE).
Results and Discussion
Figure 2 shows the DSC thermograms of the MPCM sus-pensions at different concentrations of MPCM. There aretwo distinct DSC peaks in Figure 3a: the main peak (10-40 �C) which represents the melting range of the paraffinRubithermVR RT27 core, and a minor peak (0–5 �C) whichcorresponds to the melting of water. Figure 2b illustrates thelatent heat of the MPCM suspensions. As expected, thelatent heat of the suspensions is directly proportional to the
MPCM concentration. After adding 30wt.% of MPCM, thelatent heat is approximately 27 J/g.
The time-dependent behaviour of the MPCM suspensionswere studied at constant shear rates of 100, 300, 500 and700 s�1 at 20 �C for a period of 30min at different micro-capsule concentrations. The experimental data was fitted tothree commonly used models (the second-order structuralkinetic model, the Weltman model and the Figoni-Shoemaker model) to investigate which of these modelsdescribes the time-dependent behaviour of the MPCM sus-pensions best.
Figure 3 illustrates that the experimental data fits reason-ably well to the Weltman and Figoni-Shoemaker models,although there are some clear deviations at short times forsome of the samples, especially for high concentrations andat high shear rates. As can be seen from Figure 4, theparameters r0 and B from the Weltman model exhibithigher values with increasing shear rates and concentrations.r0 is related to the shear stress at zero time, and becomeshigher as the concentration is increased due to the higherviscosity of the samples, and will naturally increase at highershear rates. When the microcapsule suspensions are sub-jected to a constant shear rate during the 30min rheologicalexperiment, the microcapsule agglomerates are graduallybroken down by the shear forces. This structure break-downis quantified by the parameter B. As expected, more of theagglomerates are broken down when the samples are sub-jected to higher shear rates (higher values of B). In addition,B increases when the microcapsule concentration is raised.This is due to the enhanced tendency to form aggregates athigher concentrations, Accordingly, there are more agglom-erates to break down, which causes higher values of B.Similar trends were also reported by Durairaj et al. [16].
Figure 5 shows the parameters from the fits to theFigoni-Shoemaker model, where all parameters increasewhen the shear rates and concentrations are raised. The ini-tial shear stress (r0) (Figure 5a) have values close to thatobtained from the Weltman model (Figure 4a). The equilib-rium shear stress (re) (Figure 5b) increases with concentra-tion due to the viscosity increase caused by moremicrocapsules in the suspension. The quantity of structurebreakdown (r0 – re) (Figure 5c) becomes higher whenthe microcapsule concentration is raised, since there aremore aggregates present that can be broken down by the
-20 -10 0 10 20 30 40-1.5
-1.0
-0.5
0.0
0 20 40 60 80 1000
20
40
60
80
100
120(a)
Concentration (wt.%)
Late
nt h
eat (
J/g)
(b)
Hea
t flo
w (W
/g)
Temperature (oC)
MPCM concentration 0 wt.% 5 wt.% 10 wt.% 20 wt.% 30 wt.% 100 wt.%
Figure 2. (a) The heat flow as function of temperature and (b) the latent heat of the MPCM suspensions at different concentrations of microcapsules.
JOURNAL OF DISPERSION SCIENCE AND TECHNOLOGY 3

shear stress. In addition, higher shear rates breaks downmore of the aggregates. The kinetic constant of structuralbreakdown (k) illustrates how fast the stress of the MPCMsuspensions reaches equilibrium under a constant shear. Ascan be seen from Figure 5d, the systems are approachingequilibrium conditions faster at higher shear rates, wherethe agglomerates are broken down more quickly. This effecthas also been reported previously for other systems.[14] It isinteresting that an increasing concentration of the microcap-sules also causes a faster approach to the equilibrium values.It is possible that the closer proximity of the agglomeratesto each other speed up the process due to more frequentcollisions between the agglomerated structures.
The rate constant (ks), of the second-order structural kin-etic model (Equation 3) probes the kinetics of the break-down of structures in the liquid, while the ratio of initial toequilibrium viscosity (g0/ge) is related to the extent of struc-tural decay due to the shear forces.[12,15,17] Figure 6 showsthe fitted data curves of the MPCM suspensions using thesecond-order structural kinetic model. The model seems tofit well with the experimental data at all conditions. At aconstant shear rate, the viscosity decreases drastically withtime in the first 5min, before approaching a plateau regionafter approximately 15min. This illustrates that the MPCMagglomerates are disrupted by the shear forces. Hammadiet al.[18] and Mallik et al.[19] observed similar trends forclays suspension and solder paste suspensions, respectively.
The viscosity decays more rapidly toward an equilibriumviscosity when the shear rates is raised (Figure 6a), illustrat-ing that high shear rates accelerate the breakdown of theMPCM agglomerates. In addition, the rate constant (ks)becomes higher with increasing shear rate and concentration(Figure 7c), revealing that the degradation rate of MPCMsuspensions increases with increasing shear rates and con-centrations. This is analogous to what was observed for hekinetic constant of structural breakdown (k) in the Figoni-Shoemaker model (Figure 5d).
The equilibrium viscosity (ge) in Figure 7a illustrates theviscosity at long times where the agglomerates are brokendown by the applied shear rate. As expected, the equilibriumviscosity becomes higher when the MPCM concentration
Figure 4. Rheological parameters of MPCM suspensions as a function of shearrates and concentration obtained by the Weltman model (Equation 1) at 20 �C,(a) r0 and (b) B.
Figure 5. Rheological parameters of MPCM suspensions as a function of shearrates and concentration obtained by the Figoni-Shoemaker Model (Equation 2)at 20 �C, (a) r0, (b) re, (c) [r0 – re] and (d) k.
0 5 10 15 20 25 30500
1000
1500
2000
2500
0 5 10 15 20 25 300
500
1000
1500
2000
2500
3000
5 wt.% 10 wt.% 20 wt.% 30 wt.% Weltman model Figoni-Shoemaker model
She
ar s
tress
(Pa)
Time (min)
(b) Shear rate 700 s-1
100 s-1
300 s-1
500 s-1
700 s-1
Weltman model Figoni-Shoemaker model
She
ar s
tress
(Pa)
Time (min)
(a) 20 wt.% microcapsules
Figure 3. Shear stress at (a) different shear rates, MPCM concentration 20wt.%,and (b) different concentrations, shear rate 700 s�1 as a function of shearingtime at 20 �C. The points are experimental values. The solid and dashed linesshow the fitted values according to the Weltman model (Equation 1) and theFigoni-Shoemaker model (Equation 2), respectively.
4

increases due to the presence of more particles. When theshear rate is raised, ge decreases since higher shear forcescan break the agglomerates down to smaller structures. Thisillustrates the importance of avoiding large agglomerates forapplications where a low viscosity fluid is preferred.
Figure 7b shows that the amount of structural breakdown(g0/ge) rises when the shear rate and the concentration are
increased. Breakdown of flocculates/agglomerates and orien-tation or deformation of suspended solid structures duringthe shearing process can cause a structural breakdown ofsuspensions.[16,20] When shear forces are applied to the sus-pensions, the agglomerates can be broken apart by hydro-dynamic shear stresses (deflocculating effect), and structurescan be built up by the increased amount of collisionsinduced by the shear (flocculating effect).[21] A balance ofthese two effects governs the breakdown process. At lowshear rates, the forces are not large enough to break apartthe agglomerated structures, and the flocculating effect dom-inates. At high shear rates the deflocculating effect is strongwhile the re-association rate is expected to be low, resultingin a significant viscosity decrease[19,22] As can be seen fromFigure 3 and Figure 6, the agglomerated microcapsulesbreaks down to smaller sizes during the initial stage ofapplied shear forces. The deflocculating effect is dominantin this stage, resulting in a sharp decrease in the shear stressand the viscosity. At longer times, the agglomerates becomesmaller, and the shear forces do not have any significanteffect on the overall size of the agglomerates.
The distance between the microcapsules becomes shorterat higher concentrations, leading to an increased interactionbetween the particles and the formation of larger agglomer-ates. When a shear force is applied, these large agglomeratesare continuously sheared to smaller pieces. According toFigoni-Shoemaker,[10] the extent of the attractive forcesbetween agglomerates depend on the size of the agglomer-ates. They predicted that the breakdown rate of largeagglomerates is higher than for the smaller ones.
If the deflocculation rate is higher than the flocculationrate, a decrease of the viscosity and shear stress occurs over
0 5 10 15 20 25 300.5
1.0
1.5
2.0
2.5
3.0
3.5
4.00 5 10 15 20 25 30
1.5
2.0
2.5
3.0
3.5
4.0
4.5
5 wt.% 10 wt.% 20 wt.% 30 wt.% Second-order
structural kinetic model
(b) Shear rate 700 s-1
Visc
osity
(Pa.
s)
Time (min)
(a) 20 wt.% microcapsules
100 s-1
300 s-1
500 s-1
700 s-1
Second-order structural kinetic model
Visc
osity
(Pa.
s)
Figure 6. Viscosity at (a) different shear rates, MPCM concentration 20wt.%,and (b) different concentration, shear rate 700 s�1 as a function of shearingtime at 20 �C. The points are experimental values. The solid lines show the fit-ted values according to the second-order structural kinetic model (Equation 3).
Figure 7. Rheological parameters of MPCM suspensions as the function of shear rates and concentration obtained by the Second-order structural kinetic model(Equation 3) at 20 �C, (a) Equilibrium viscosity ge, (b) [g0/ge] and (c) ks.
JOURNAL OF DISPERSION SCIENCE AND TECHNOLOGY 5
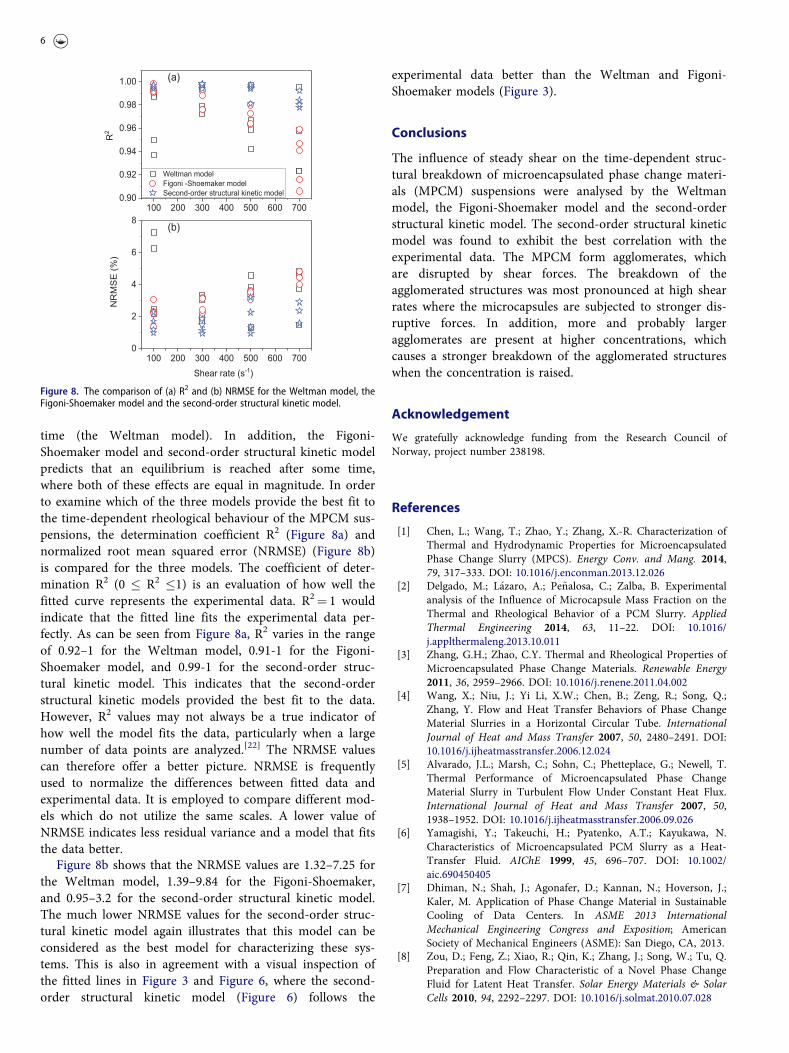
time (the Weltman model). In addition, the Figoni-Shoemaker model and second-order structural kinetic modelpredicts that an equilibrium is reached after some time,where both of these effects are equal in magnitude. In orderto examine which of the three models provide the best fit tothe time-dependent rheological behaviour of the MPCM sus-pensions, the determination coefficient R2 (Figure 8a) andnormalized root mean squared error (NRMSE) (Figure 8b)is compared for the three models. The coefficient of deter-mination R2 (0 � R2 �1) is an evaluation of how well thefitted curve represents the experimental data. R2¼ 1 wouldindicate that the fitted line fits the experimental data per-fectly. As can be seen from Figure 8a, R2 varies in the rangeof 0.92–1 for the Weltman model, 0.91-1 for the Figoni-Shoemaker model, and 0.99-1 for the second-order struc-tural kinetic model. This indicates that the second-orderstructural kinetic models provided the best fit to the data.However, R2 values may not always be a true indicator ofhow well the model fits the data, particularly when a largenumber of data points are analyzed.[22] The NRMSE valuescan therefore offer a better picture. NRMSE is frequentlyused to normalize the differences between fitted data andexperimental data. It is employed to compare different mod-els which do not utilize the same scales. A lower value ofNRMSE indicates less residual variance and a model that fitsthe data better.
Figure 8b shows that the NRMSE values are 1.32–7.25 forthe Weltman model, 1.39–9.84 for the Figoni-Shoemaker,and 0.95–3.2 for the second-order structural kinetic model.The much lower NRMSE values for the second-order struc-tural kinetic model again illustrates that this model can beconsidered as the best model for characterizing these sys-tems. This is also in agreement with a visual inspection ofthe fitted lines in Figure 3 and Figure 6, where the second-order structural kinetic model (Figure 6) follows the
experimental data better than the Weltman and Figoni-Shoemaker models (Figure 3).
Conclusions
The influence of steady shear on the time-dependent struc-tural breakdown of microencapsulated phase change materi-als (MPCM) suspensions were analysed by the Weltmanmodel, the Figoni-Shoemaker model and the second-orderstructural kinetic model. The second-order structural kineticmodel was found to exhibit the best correlation with theexperimental data. The MPCM form agglomerates, whichare disrupted by shear forces. The breakdown of theagglomerated structures was most pronounced at high shearrates where the microcapsules are subjected to stronger dis-ruptive forces. In addition, more and probably largeragglomerates are present at higher concentrations, whichcauses a stronger breakdown of the agglomerated structureswhen the concentration is raised.
Acknowledgement
We gratefully acknowledge funding from the Research Council ofNorway, project number 238198.
References
[1] Chen, L.; Wang, T.; Zhao, Y.; Zhang, X.-R. Characterization ofThermal and Hydrodynamic Properties for MicroencapsulatedPhase Change Slurry (MPCS). Energy Conv. and Mang. 2014,79, 317–333. DOI: 10.1016/j.enconman.2013.12.026
[2] Delgado, M.; L�azaro, A.; Pe~nalosa, C.; Zalba, B. Experimentalanalysis of the Influence of Microcapsule Mass Fraction on theThermal and Rheological Behavior of a PCM Slurry. AppliedThermal Engineering 2014, 63, 11–22. DOI: 10.1016/j.applthermaleng.2013.10.011
[3] Zhang, G.H.; Zhao, C.Y. Thermal and Rheological Properties ofMicroencapsulated Phase Change Materials. Renewable Energy2011, 36, 2959–2966. DOI: 10.1016/j.renene.2011.04.002
[4] Wang, X.; Niu, J.; Yi Li, X.W.; Chen, B.; Zeng, R.; Song, Q.;Zhang, Y. Flow and Heat Transfer Behaviors of Phase ChangeMaterial Slurries in a Horizontal Circular Tube. InternationalJournal of Heat and Mass Transfer 2007, 50, 2480–2491. DOI:10.1016/j.ijheatmasstransfer.2006.12.024
[5] Alvarado, J.L.; Marsh, C.; Sohn, C.; Phetteplace, G.; Newell, T.Thermal Performance of Microencapsulated Phase ChangeMaterial Slurry in Turbulent Flow Under Constant Heat Flux.International Journal of Heat and Mass Transfer 2007, 50,1938–1952. DOI: 10.1016/j.ijheatmasstransfer.2006.09.026
[6] Yamagishi, Y.; Takeuchi, H.; Pyatenko, A.T.; Kayukawa, N.Characteristics of Microencapsulated PCM Slurry as a Heat-Transfer Fluid. AIChE 1999, 45, 696–707. DOI: 10.1002/aic.690450405
[7] Dhiman, N.; Shah, J.; Agonafer, D.; Kannan, N.; Hoverson, J.;Kaler, M. Application of Phase Change Material in SustainableCooling of Data Centers. In ASME 2013 InternationalMechanical Engineering Congress and Exposition; AmericanSociety of Mechanical Engineers (ASME): San Diego, CA, 2013.
[8] Zou, D.; Feng, Z.; Xiao, R.; Qin, K.; Zhang, J.; Song, W.; Tu, Q.Preparation and Flow Characteristic of a Novel Phase ChangeFluid for Latent Heat Transfer. Solar Energy Materials & SolarCells 2010, 94, 2292–2297. DOI: 10.1016/j.solmat.2010.07.028
100 200 300 400 500 600 7000.90
0.92
0.94
0.96
0.98
1.00
100 200 300 400 500 600 7000
2
4
6
8
Weltman model Figoni -Shoemaker model Second-order structural kinetic model
R2
(a)
NR
MS
E (%
)
Shear rate (s-1)
(b)
Figure 8. The comparison of (a) R2 and (b) NRMSE for the Weltman model, theFigoni-Shoemaker model and the second-order structural kinetic model.
6
[9] Weltmann, R.N. Breakdown of Thixotropic Structure asFunction of Time. Journal of Applied Physics 1943, 14, 343–350.DOI: 10.1063/1.1714996
[10] Figoni, P.I.; Shoemaker, C.F. Characterization of TimeDependent Flow Properties of Mayonnaise Under Steady Shear.Journal of Texture Studies 1983, 14, 431–442. DOI: 10.1111/j.1745-4603.1983.tb00360.x
[11] Nguyen, Q.D.; Jensen, C.T.B.; Kristensen, P.G. Experimentaland Modelling Studies of the Flow Properties of Maize andWaxy Maize Starch pastes. Chemical Engineering Journal 1998,7, 165–171. DOI: 10.1016/S1385-8947(98)00081-3
[12] Abu-Jdayil, B. Modelling the Time-Dependent RheologicalBehavior of Semisolid Foodstuffs. Journal of Food Engineering2003, 57, 97–102. DOI: 10.1016/S0260-8774(02)00277-7
[13] Borreguero, A.M.; Valverde, J.L.; Rodr�ıguez, J.F.; Barber, A.H.;Cubillo, J.J.; Carmona, M. Synthesis and Characterization ofMicrocapsules Containing RubithermVR RT27 Obtained by SprayDrying. Chemical Engineering Journal 2011, 166, 384–390. DOI:10.1016/j.cej.2010.10.055
[14] Koocheki, A.; Razavi, S.M.A. Effect of Concentration andTemperature on Flow Properties of Alyssum homolocarpumSeed Gum Solutions: Assessment of Time Dependency andThixotropy. Food Biophysics 2009, 4, 353–364. DOI: 10.1007/s11483-009-9134-7
[15] T�arrega, A.; Dur�an, L.; Costell, E. Flor Behaviour of Semi-SolidDairy Desserts. Effect of temperature. International DairyJournal 2004, 14, 345–353. DOI: 10.1016/j.idairyj.2003.12.004
[16] R.Durairaj; N.N.Ekere; B.Salam. Thixotropy Flow Behaviour ofSolder and Conductive Adhessive Pastes. J Mater Sci: MaterElectron 2004, 15, 677–683. DOI: 10.1023/B:JMSE.0000038923.62923.1e
[17] Abu-Jdayil, B. Flow Properties of Sweetened Sesame Paste(Halawa Tehineh). European Food Research & Technology 2004,219, 265–272.
[18] Hammadi, L.; Boudjenane, N.; Houdjedje, R.; Reffis, R.;Belhadri, M. Modeling the Time-Dependent RheologicalBehavior of Clays Used in Fabrication of Ceramic. InternationalJournal of Mechanical, Aerospace, Industrial, Mechatronic andManufacturing Engineering 2015, 9, 1377–1380.
[19] Mallik, S.; Ekere, N.N.; Marks, A.E.; Seman, A.; Durairaj, R.Modeling the Structural Breakdown of Solder Paste Using theStructural Kinetic Model. Journal of Materials Engineering andPerformance 2009, 19, 40–45.
[20] Bhattacharya, S. Yield Stress and Time-Dependent RheologicalProperties of Mango Pulp. Journal of food science 1999, 64,1029–1033. DOI: 10.1111/j.1365-2621.1999.tb12275.x
[21] Barnes, H.A. Thixotropy a review. Journal of Non-NewtonianFluid Mechanics 1997, 70, 1–33. DOI: 10.1016/S0377-0257(97)00004-9
[22] Ravi, R.; Bhattacharya, S. The Time-Dependent RheologicalCharacteristics of a Chickpea Flour Dispersion as a Function ofTemperature and Shear Rate. International Journal of FoodScience and Technology 2006, 41, 751–756. DOI: 10.1111/j.1365-2621.2006.01040.x
JOURNAL OF DISPERSION SCIENCE AND TECHNOLOGY 7


