Embed Size (px)
Citation preview
i
Hira Shakeel
2019
Department of Physics and Applied Mathematics
Pakistan Institute of Engineering and Applied Sciences
Nilore, Islamabad, Pakistan
Calibration Free Laser Induced Breakdown
Spectroscopy of Silicon, Germanium and their
Alloys

i
This page intentionally left blank
i
Reviewers and Examiners
Foreign Reviewers
1. Prof. Dr. Jin YU
2. Dr. Tariq Hasan Gilani
3. Dr. Massimo F. Bertino
Thesis Examiners
1. Prof. Dr. Aslam Baig
2. Dr. Shahid Ali
3. Dr. Muhammad Nawaz
Head of the Department (Name): ___Dr. Muhammad Yousaf Hamza____
Signature with Date: _________________________________
i
Certificate of Approval
This is to certify that research work presented in this thesis titled “Calibration free laser
induced Breakdown Spectroscopy of silicon, germanium and their alloys” was conducted by
Ms. Hira Shakeel under the supervision of Dr. Sami ul Haq.
No part of this thesis has been submitted anywhere else for any other degree. This thesis is
submitted to Department of Physics and Applied Mathematics in partial fulfillment of the
requirements for the degree of Doctor of Philosophy in the field of Physics.
Student Name: Hira Shakeel Signature:----------------------------
Examination Committee:
Examiners Name, Designation & Address Signature
Internal Examiner 1
Internal Examiner 2
Internal Examiner 3
Supervisor Dr. Sami ul Haq, PS, NILOP, Islamabad.
Co-Supervisor Dr. Masroor Ikram, CS, PIEAS, Islamabad.
Department Head Dr. Muhammad Yousaf Hamza, DCE,
PIEAS, Islamabad.
Dean Research PIEAS Prof. Dr. Naeem Iqbal, DCE, PIEAS,
Islamabad.
i
Thesis Submission Approval
This is to certify that the work contained in this thesis entitled “Calibration free laser induced
Breakdown Spectroscopy of silicon, germanium and their alloys”, was carried out by Hira
Shakeel and in my opinion, it is fully adequate, in scope and quality, for the degree of Ph.D.
Furthermore, it is hereby approved for submission for review and thesis defense.
Supervisor: _____________________
Name: Dr. Sami ul Haq
Date:
Place: NILOP, Islamabad.
Co-Supervisor: __________________
Name: Dr. Masroor Ikram
Date:
Place: PIEAS, Islamabad.
Head, Department of Physics and Applied Mathematics: ___________________
Name: Dr. M. Yousaf Hamza
Date:
Place: PIEAS, Islamabad.
i
Hira Shakeel
Submitted in partial fulfillment of the requirements
for the degree of Ph.D.
2019
Department of Physics and Applied Mathematics
Pakistan Institute of Engineering and Applied Sciences
Nilore, Islamabad, Pakistan
Calibration Free Laser Induced Breakdown
Spectroscopy of Silicon, Germanium and their
Alloys
ii
Dedication
To
My Loving Parents
iii
Author’s Declaration
I Hira Shakeel hereby declare that my PhD Thesis Titled “Calibration free laser induced
Breakdown Spectroscopy of silicon, germanium and their alloys” is my own work and has
not been submitted previously by me or anybody else for taking any degree from Pakistan
Institute of Engineering and Applied Sciences (PIEAS) or any other university/institute in the
country/world.
At any time if my statement is found to be incorrect (even after my graduation), the university
has the right to withdraw my PhD degree.
_____________
(Hira Shakeel)
Date:
PIEAS, Islamabad.
iv
Plagiarism Undertaking
I Hira Shakeel solemnly declare that research work presented in the thesis titled “Calibration
free laser induced Breakdown Spectroscopy of silicon, germanium and their alloys” is
solely my research work with no significant contribution from any other person. Small
contribution/help wherever taken has been duly acknowledged or referred and that complete
thesis has been written by me.
I understand the zero tolerance policy of the HEC and Pakistan Institute of Engineering and
Applied Sciences (PIEAS) towards plagiarism. Therefore, I as an author of the thesis titled above
declare that no portion of my thesis has been plagiarized and any material used as reference is
properly referred/cited.
I undertake that if I am found guilty of any formal plagiarism in the thesis titled above even after
the award of my PhD degree, PIEAS reserves the rights to withdraw/revoke my PhD degree and
that HEC and PIEAS has the right to publish my name on the HEC/PIEAS Website on which
name of students are placed who submitted plagiarized thesis.
_____________
(Hira Shakeel)
Date:
PIEAS, Islamabad.
v
Copyrights Statement
The entire contents of this thesis entitled “Calibration free laser induced Breakdown
Spectroscopy of silicon, germanium and their alloys” by Hira Shakeel are an intellectual
property of Pakistan Institute of Engineering and Applied Sciences (PIEAS). No portion of the
thesis should be reproduced without obtaining explicit permission from PIEAS.
vi
Table of Contents
Dedication ........................................................................................................................... ii
Author’s Declaration .......................................................................................................... iii
Plagiarism Undertaking ..................................................................................................... iv
Copyrights Statement .......................................................................................................... v
Table of Contents ............................................................................................................... vi
List of Tables ...................................................................................................................... x
Abstract .............................................................................................................................. xi
List of Publications ........................................................................................................... xii
List of Abbreviations ....................................................................................................... xiii
Acknowledgement ........................................................................................................... xiv
Introduction to LIBS ..................................................................................................... 1 1
1.1 Laser Induced Breakdown Spectroscopy (LIBS) .................................................. 1
1.2 Laser Induced Plasma............................................................................................ 1
1.3 Local Thermodynamic Equilibrium (LTE) ........................................................... 3
1.4 Stoichiometric Ablation ........................................................................................ 5
1.5 Plasma Opacity ...................................................................................................... 5
1.6 Self-Absorption ..................................................................................................... 6
1.7 Determination of Plasma Temperature ................................................................. 8
1.7.1 Boltzmann Plot Method ..................................................................................... 8
1.7.2 Saha Boltzmann Plot Method .......................................................................... 10
1.8 Electron Number Density .................................................................................... 11
1.9 Quantitative Analysis using LIBS ....................................................................... 14
1.9.1 Calibration Free LIBS (CF-LIBS) Technique ................................................. 14
1.9.2 Variants of Calibration Free LIBS................................................................... 16
1.10 LIBS Configurations ........................................................................................... 17
1.10.1 Single Pulse LIBS ............................................................................................ 17
1.10.2 Double Pulse LIBS .......................................................................................... 18
1.11 Layout.................................................................................................................. 21
Instrumentation and Experimental Procedure ............................................................. 22 2
2.1 Laser System ....................................................................................................... 22
2.2 Spectrometer........................................................................................................ 23
vii
2.3 Spectrometer Calibration..................................................................................... 25
2.4 Sample Chamber ................................................................................................. 27
2.5 Optical Systems ................................................................................................... 28
2.6 Optimization of Experimental Parameters .......................................................... 29
2.7 Spectral Data Analysis ........................................................................................ 30
2.8 Experimental Procedure ...................................................................................... 31
2.8.1 Single Pulse LIBS Setup.................................................................................. 31
2.8.2 Double Pulse LIBS Setup ................................................................................ 32
Spectroscopic Characterization of Laser Induced Plasma .......................................... 34 3
3.1 Introduction ......................................................................................................... 34
3.2 Experimental Arrangement ................................................................................. 35
3.3 Results and Discussion ........................................................................................ 35
3.3.1 The Emission Spectra ...................................................................................... 35
3.3.2 Laser Irradiance Dependence of Plasma Parameters ....................................... 39
3.3.3 Spatial Dependence of Plasma Parameters ...................................................... 43
3.3.4 Pressure Dependence of Plasma Parameters ................................................... 44
Calibration Free Laser Induced Breakdown Spectroscopy of Al-Si Alloy ................. 48 4
4.1 Introduction ......................................................................................................... 48
4.2 Experimental Details ........................................................................................... 50
4.3 Results and Discussion ........................................................................................ 50
4.3.1 Optimization of the Experimental Parameters................................................. 50
4.3.2 Analysis of the Emission Spectra .................................................................... 51
4.3.3 Self-Absorption Correction in Emission Spectra ............................................ 54
4.3.4 Quantitative Analysis of Al-Si Alloy .............................................................. 56
Double Pulse Calibration-Free LIBS: Quantitative Analysis of Ge/Si Alloys and Solar 5
Cells ............................................................................................................................ 62
5.1 Introduction ......................................................................................................... 62
5.2 Experimental Setup ............................................................................................. 64
5.3 Results and Discussion ........................................................................................ 65
5.3.1 Effect of Inter-Pulse Delay and Energy Ratio on the Emission Spectra ......... 65
5.3.2 Analysis of LIBS Spectra ................................................................................ 67
5.3.3 Plasma Temperature and Electron Number Density ....................................... 69
5.3.4 Elemental Concentration of Ge Alloys ............................................................ 73
Conclusion and Future Plan ........................................................................................ 79 6
7 References……………………………………………………………………………80
viii
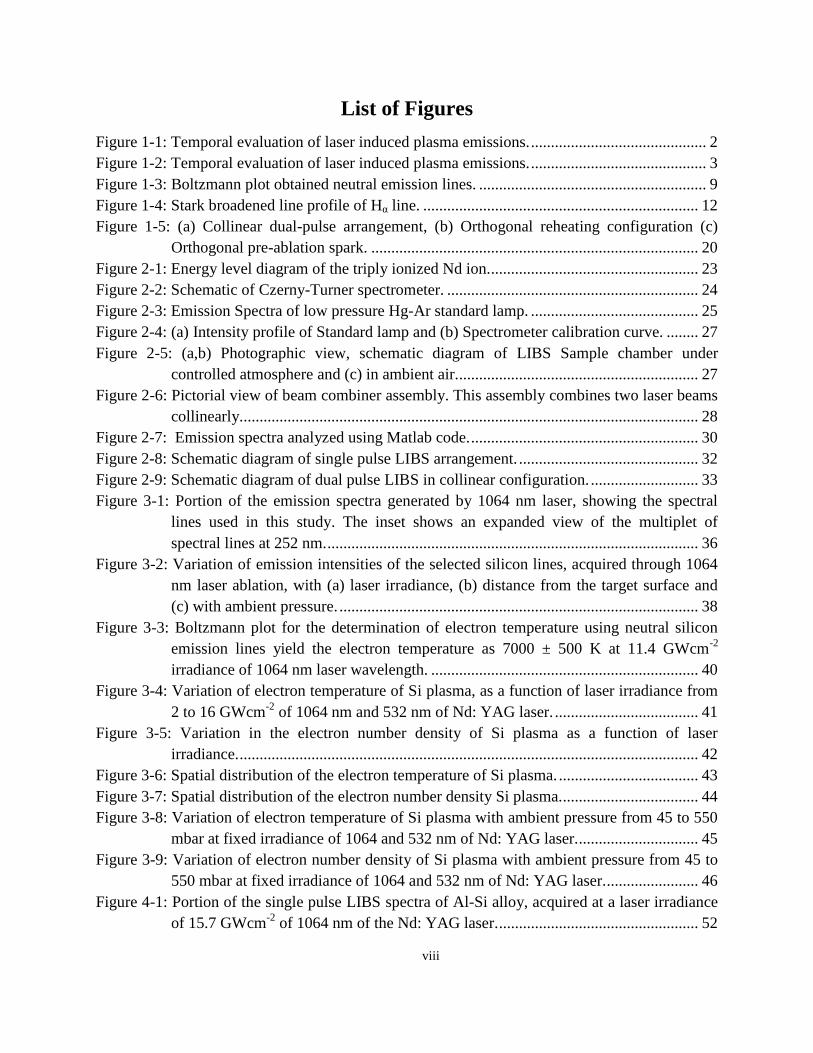
List of Figures
Figure 1-1: Temporal evaluation of laser induced plasma emissions. ............................................ 2
Figure 1-2: Temporal evaluation of laser induced plasma emissions. ............................................ 3
Figure 1-3: Boltzmann plot obtained neutral emission lines. ......................................................... 9
Figure 1-4: Stark broadened line profile of Hα line. ..................................................................... 12
Figure 1-5: (a) Collinear dual-pulse arrangement, (b) Orthogonal reheating configuration (c)
Orthogonal pre-ablation spark. .................................................................................. 20
Figure 2-1: Energy level diagram of the triply ionized Nd ion. .................................................... 23
Figure 2-2: Schematic of Czerny-Turner spectrometer. ............................................................... 24
Figure 2-3: Emission Spectra of low pressure Hg-Ar standard lamp. .......................................... 25
Figure 2-4: (a) Intensity profile of Standard lamp and (b) Spectrometer calibration curve. ........ 27
Figure 2-5: (a,b) Photographic view, schematic diagram of LIBS Sample chamber under
controlled atmosphere and (c) in ambient air. ............................................................ 27
Figure 2-6: Pictorial view of beam combiner assembly. This assembly combines two laser beams
collinearly................................................................................................................... 28
Figure 2-7: Emission spectra analyzed using Matlab code. ......................................................... 30
Figure 2-8: Schematic diagram of single pulse LIBS arrangement. ............................................. 32
Figure 2-9: Schematic diagram of dual pulse LIBS in collinear configuration. ........................... 33
Figure 3-1: Portion of the emission spectra generated by 1064 nm laser, showing the spectral
lines used in this study. The inset shows an expanded view of the multiplet of
spectral lines at 252 nm. ............................................................................................. 36
Figure 3-2: Variation of emission intensities of the selected silicon lines, acquired through 1064
nm laser ablation, with (a) laser irradiance, (b) distance from the target surface and
(c) with ambient pressure. .......................................................................................... 38
Figure 3-3: Boltzmann plot for the determination of electron temperature using neutral silicon
emission lines yield the electron temperature as 7000 ± 500 K at 11.4 GWcm-2
irradiance of 1064 nm laser wavelength. ................................................................... 40
Figure 3-4: Variation of electron temperature of Si plasma, as a function of laser irradiance from
2 to 16 GWcm-2
of 1064 nm and 532 nm of Nd: YAG laser. .................................... 41
Figure 3-5: Variation in the electron number density of Si plasma as a function of laser
irradiance. ................................................................................................................... 42
Figure 3-6: Spatial distribution of the electron temperature of Si plasma. ................................... 43
Figure 3-7: Spatial distribution of the electron number density Si plasma................................... 44
Figure 3-8: Variation of electron temperature of Si plasma with ambient pressure from 45 to 550
mbar at fixed irradiance of 1064 and 532 nm of Nd: YAG laser. .............................. 45
Figure 3-9: Variation of electron number density of Si plasma with ambient pressure from 45 to
550 mbar at fixed irradiance of 1064 and 532 nm of Nd: YAG laser. ....................... 46
Figure 4-1: Portion of the single pulse LIBS spectra of Al-Si alloy, acquired at a laser irradiance
of 15.7 GWcm-2
of 1064 nm of the Nd: YAG laser. .................................................. 52
ix
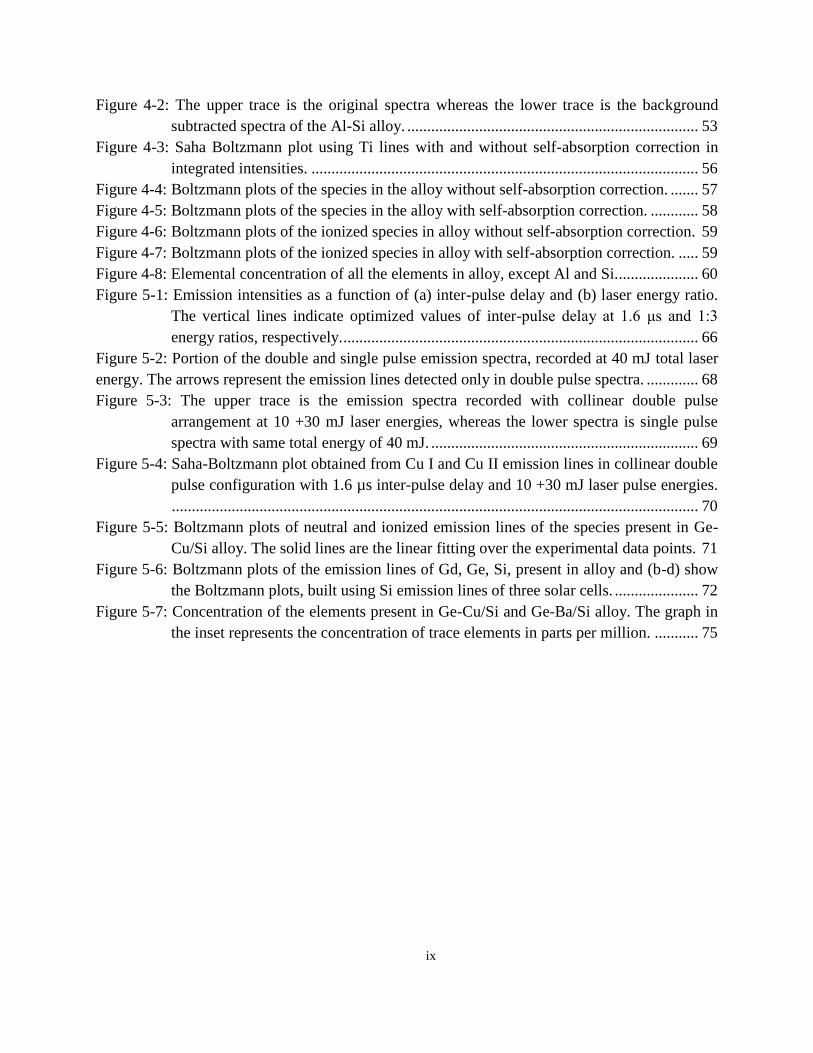
Figure 4-2: The upper trace is the original spectra whereas the lower trace is the background
subtracted spectra of the Al-Si alloy. ......................................................................... 53
Figure 4-3: Saha Boltzmann plot using Ti lines with and without self-absorption correction in
integrated intensities. ................................................................................................. 56
Figure 4-4: Boltzmann plots of the species in the alloy without self-absorption correction. ....... 57
Figure 4-5: Boltzmann plots of the species in the alloy with self-absorption correction. ............ 58
Figure 4-6: Boltzmann plots of the ionized species in alloy without self-absorption correction. 59
Figure 4-7: Boltzmann plots of the ionized species in alloy with self-absorption correction. ..... 59
Figure 4-8: Elemental concentration of all the elements in alloy, except Al and Si..................... 60
Figure 5-1: Emission intensities as a function of (a) inter-pulse delay and (b) laser energy ratio.
The vertical lines indicate optimized values of inter-pulse delay at 1.6 μs and 1:3
energy ratios, respectively. ......................................................................................... 66
Figure 5-2: Portion of the double and single pulse emission spectra, recorded at 40 mJ total laser
energy. The arrows represent the emission lines detected only in double pulse spectra. ............. 68
Figure 5-3: The upper trace is the emission spectra recorded with collinear double pulse
arrangement at 10 +30 mJ laser energies, whereas the lower spectra is single pulse
spectra with same total energy of 40 mJ. ................................................................... 69
Figure 5-4: Saha-Boltzmann plot obtained from Cu I and Cu II emission lines in collinear double
pulse configuration with 1.6 µs inter-pulse delay and 10 +30 mJ laser pulse energies.
.................................................................................................................................... 70
Figure 5-5: Boltzmann plots of neutral and ionized emission lines of the species present in Ge-
Cu/Si alloy. The solid lines are the linear fitting over the experimental data points. 71
Figure 5-6: Boltzmann plots of the emission lines of Gd, Ge, Si, present in alloy and (b-d) show
the Boltzmann plots, built using Si emission lines of three solar cells. ..................... 72
Figure 5-7: Concentration of the elements present in Ge-Cu/Si and Ge-Ba/Si alloy. The graph in
the inset represents the concentration of trace elements in parts per million. ........... 75
x
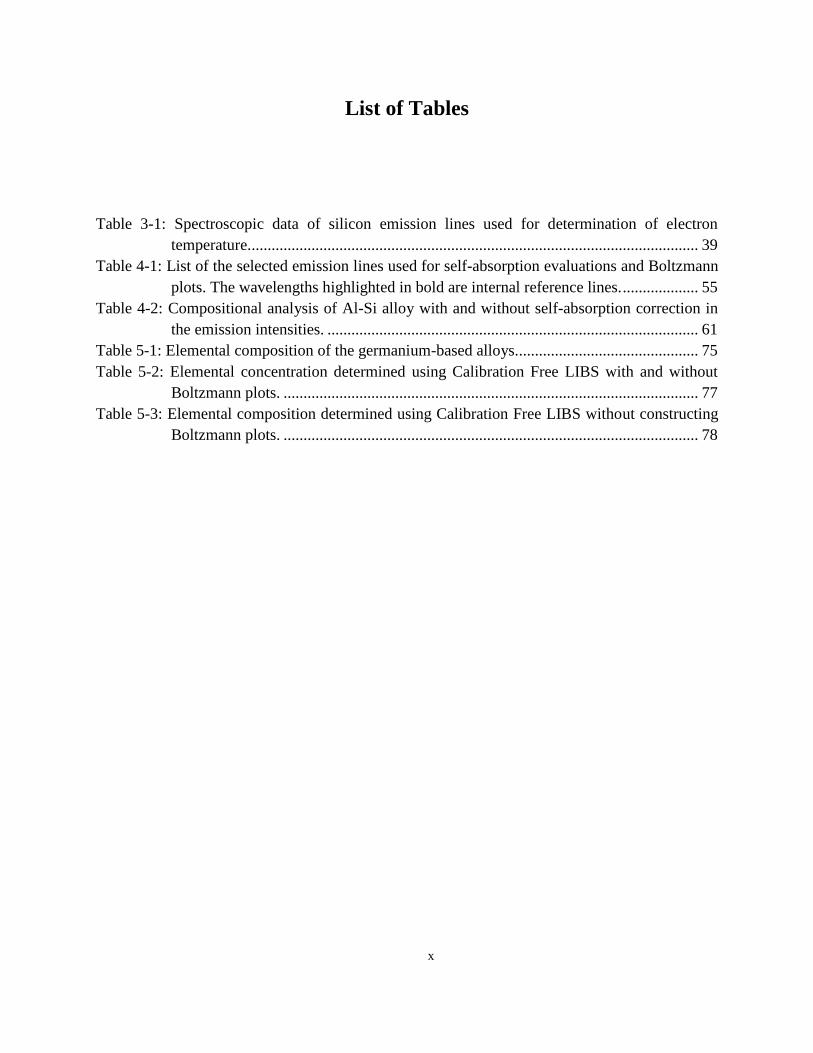
List of Tables
Table 3-1: Spectroscopic data of silicon emission lines used for determination of electron
temperature................................................................................................................. 39
Table 4-1: List of the selected emission lines used for self-absorption evaluations and Boltzmann
plots. The wavelengths highlighted in bold are internal reference lines. ................... 55
Table 4-2: Compositional analysis of Al-Si alloy with and without self-absorption correction in
the emission intensities. ............................................................................................. 61
Table 5-1: Elemental composition of the germanium-based alloys.............................................. 75
Table 5-2: Elemental concentration determined using Calibration Free LIBS with and without
Boltzmann plots. ........................................................................................................ 77
Table 5-3: Elemental composition determined using Calibration Free LIBS without constructing
Boltzmann plots. ........................................................................................................ 78
xi
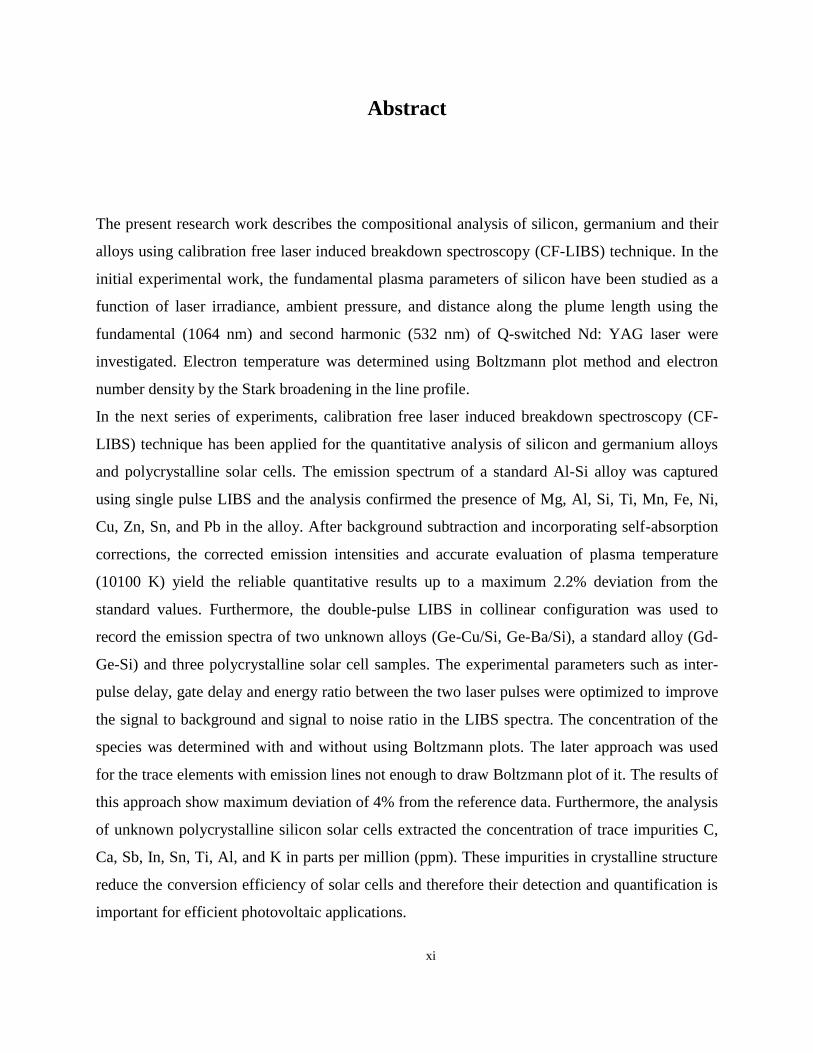
Abstract
The present research work describes the compositional analysis of silicon, germanium and their
alloys using calibration free laser induced breakdown spectroscopy (CF-LIBS) technique. In the
initial experimental work, the fundamental plasma parameters of silicon have been studied as a
function of laser irradiance, ambient pressure, and distance along the plume length using the
fundamental (1064 nm) and second harmonic (532 nm) of Q-switched Nd: YAG laser were
investigated. Electron temperature was determined using Boltzmann plot method and electron
number density by the Stark broadening in the line profile.
In the next series of experiments, calibration free laser induced breakdown spectroscopy (CF-
LIBS) technique has been applied for the quantitative analysis of silicon and germanium alloys
and polycrystalline solar cells. The emission spectrum of a standard Al-Si alloy was captured
using single pulse LIBS and the analysis confirmed the presence of Mg, Al, Si, Ti, Mn, Fe, Ni,
Cu, Zn, Sn, and Pb in the alloy. After background subtraction and incorporating self-absorption
corrections, the corrected emission intensities and accurate evaluation of plasma temperature
(10100 K) yield the reliable quantitative results up to a maximum 2.2% deviation from the
standard values. Furthermore, the double-pulse LIBS in collinear configuration was used to
record the emission spectra of two unknown alloys (Ge-Cu/Si, Ge-Ba/Si), a standard alloy (Gd-
Ge-Si) and three polycrystalline solar cell samples. The experimental parameters such as inter-
pulse delay, gate delay and energy ratio between the two laser pulses were optimized to improve
the signal to background and signal to noise ratio in the LIBS spectra. The concentration of the
species was determined with and without using Boltzmann plots. The later approach was used
for the trace elements with emission lines not enough to draw Boltzmann plot of it. The results of
this approach show maximum deviation of 4% from the reference data. Furthermore, the analysis
of unknown polycrystalline silicon solar cells extracted the concentration of trace impurities C,
Ca, Sb, In, Sn, Ti, Al, and K in parts per million (ppm). These impurities in crystalline structure
reduce the conversion efficiency of solar cells and therefore their detection and quantification is
important for efficient photovoltaic applications.
xii
List of Publications
1. Hira Shakeel, S.U. Haq, Qamar Abbas, Ali Nadeem, V. Palleschi, “Quantitative analysis
of Ge/Si alloys using double-pulse calibration-free laser-induced breakdown
spectroscopy”, Spectrochimica Acta Part B 146 (2018) 101-105.
2. Hira Shakeel, S. U. Haq, Ghulam Aisha, Ali Nadeem , “Quantitative analysis of Al-Si
alloy using calibration free laser induced breakdown spectroscopy (CF-LIBS)”, Phys. of
Plasmas 24 (2017) 02463516.
3. Hira Shakeel, Saboohi Arshad, S. U. Haq, and Ali Nadeem, “Electron temperature and
density measurements of laser induced germanium plasma”, Phys. of Plasmas 23 (2016)
053504.
4. Hira Shakeel, M Mumtaz, S Shahzada, A Nadeem and S. U. Haq, “Spectroscopic
characterization of laser ablated silicon plasma”, Plasma Sources Science and
Technology 23 (2014) 035006.
5. Hira Shakeel, S. U. Haq, Qamar Abbas and Ali Nadeem, “Double-pulse Calibration-free
Laser-induced Breakdown Spectroscopy: A step towards quantitative real time analysis",
Appl. Spectrosc. (2019) Submitted.
6. G. Aisha, M. Shah, Shaista Shahzada, S.U. Haq, H. Shakeel, Ali Nadeem, “Investigation
of the 4snf 1F3 Rydberg states of zinc and determination of the dipole polarizability of
the Zn+ ion”, Spectrochimica Acta Part B 142 (2018) 85–90.
7. S. U. Haq, L. Ahmat, M. Mumtaz, Hira Shakeel, S. Mahmood and A. Nadeem,
“Spectroscopic studies of magnesium plasma produced by fundamental and second
harmonics of Nd:YAG laser”, Phys. of Plasmas 22, (2015) 083504.
* Publications 1-5 are included in the thesis.
xiii
List of Abbreviations
AES Atomic Emission Spectroscopy
CCD Charged Coupled Device
CF Calibration Free
DP Double Pulse
FWHM Full Width at Half Maximum
LIBS Laser Induced Breakdown Spectroscopy
LTE Local Thermodynamic Equilibrium
Nd:YAG Neodymium Yttrium Aluminum Garnet
Ne Electron Number Density
PPM Parts Per Million
RSD Relative Standard Deviation
SNR Signal-to-Noise Ratio
SP Single Pulse
xiv
Acknowledgement
All the praises for Almighty ALLAH, who enabled me to initiate, continue and complete the
research work successfully. I would like to express my sincere gratitude to my advisor, Dr.
Sami-ul-Haq for giving me the opportunity to join their group and gave access to the
research facilities in Laser Spectroscopy laboratory NILOP. I am grateful for his continuous
support at every stage of this research, right from beginning to the end. It has been an honor
for me to be his first PhD student. I am also thankful to my co-supervisor, Dr. Masroor Ikram
for all his suggestions during my course work and crucial days of qualifying examination at
PIEAS. My sincere thanks also go to Dr. Ali Nadeem for his professional valuable guidance
throughout my research work particularly during thesis write-up. I would like to thank my
thesis defense committee: Prof. Dr. Muhammad. Aslam Baig, Dr. Muhammad Nawaz, and
Dr. Shahid Ali for their insightful comments and encouragement, but also for the hard
questions which incented me to widen my research from various perspectives. I also owe my
thanks to Dr. Victor Contreras of UNM, Mexico for providing the computer code for the
analysis of emission spectra as well as for the calibration free calculations. I am especially
grateful to my beloved husband Mr. Osama Ahmed Rana and his head Mr. Nasir Mahmood
from Optics Lab for providing me germanium alloy sample.
I thank my fellow lab mates Mr. Qamar Abbas and Amir Israr for the stimulating discussions
and support during the experiments. I enjoyed a lot during my studies at PIEAS due to some
very good friends for our memorable sudden trips and gossips.
I am also thankful to my parents, husband and siblings who provided me through moral and
emotional support in all my pursuits. Finally, I would like to thank my loving daughter
Zainab for the cute things to make me laugh during the stressful time.
1
Chapter 1
Introduction to LIBS 1
1.1 Laser Induced Breakdown Spectroscopy (LIBS)
Laser Induced Breakdown Spectroscopy (LIBS) is the most promising elemental analysis
technique for solids, liquids and gaseous samples, additionally; it requires little or no sample
preparation. Therefore, LIBS has been used in wide variety of applications with reasonable
accuracy such as elemental analysis [1-4], energy field [5], biological sciences [6, 7], nuclear
industry [8], and in environmental sciences [9, 10]. LIBS involves a high energy laser pulse
focused on the sample surface, as a result, it produces a plasma plume due to rapid melting or
vaporization. The plasma depends on the laser parameters such as irradiance, pulse duration,
wavelength as well as on the interaction volume, nature of a target and ambient environment.
The supersonic expansion of plasma normal to the sample surface produces shock waves and
compresses the ambient air. Consequently, energy is transferred to the surrounding atmosphere
via radiative transfer, thermal conduction, and shock waves. The atomic emission from LIBS
plasma is used to identify sample constituents, their quantitative analyses and for the
determination of plasma temperature. Normally, LIBS data are recorded by directing the plasma
emissions on the entrance slit of broadband high-resolution spectrometer. Moreover, it has been
observed that the plasma parameters such as plasma temperature, electron number density,
radiative transfer, and plasma velocity are strongly dependent on the nature of plasma.
1.2 Laser Induced Plasma
Shortly after the invention of laser in 1960s, the laser induced plasma was produced and reported
[11, 12], which consist of neutrals species, ions, electrons and clusters. LIBS plasma is
characterized as weakly ionized plasma with the ratio of electrons to other species is typically
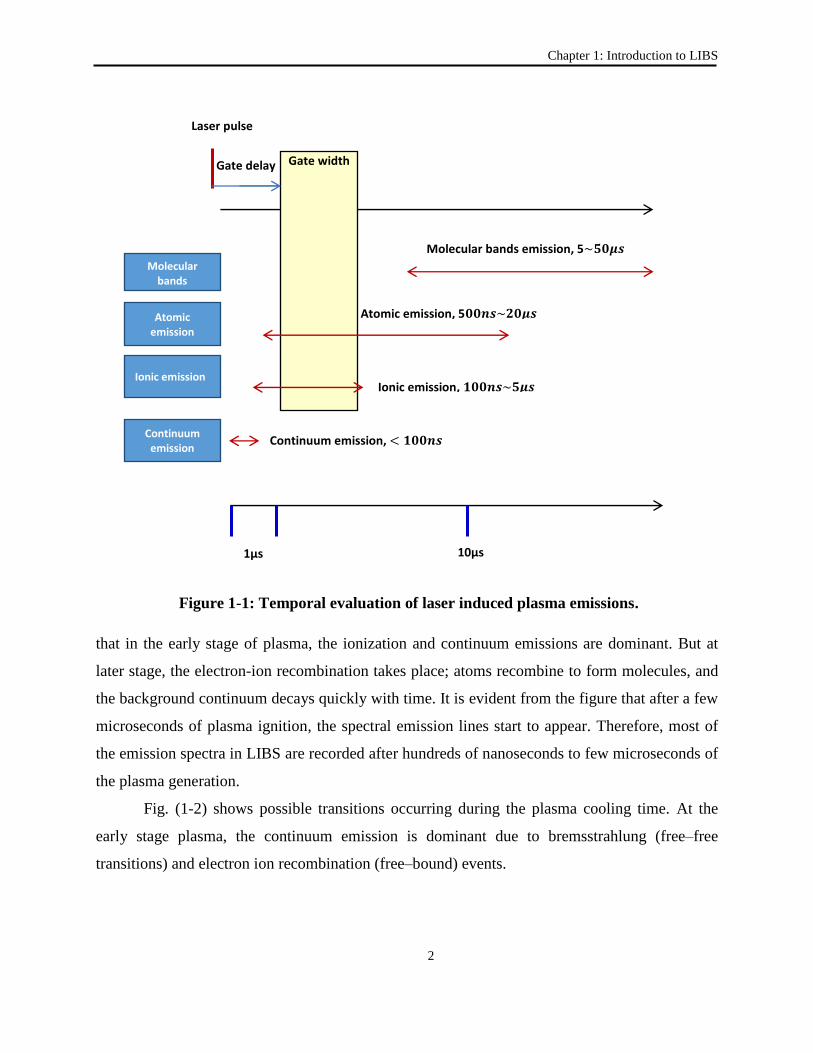
less than 10%. From the temporal behavior of a LIBS plasma (See Fig. 1-1), it is obvious
Chapter 1: Introduction to LIBS
2
that in the early stage of plasma, the ionization and continuum emissions are dominant. But at
later stage, the electron-ion recombination takes place; atoms recombine to form molecules, and
the background continuum decays quickly with time. It is evident from the figure that after a few
microseconds of plasma ignition, the spectral emission lines start to appear. Therefore, most of
the emission spectra in LIBS are recorded after hundreds of nanoseconds to few microseconds of
the plasma generation.
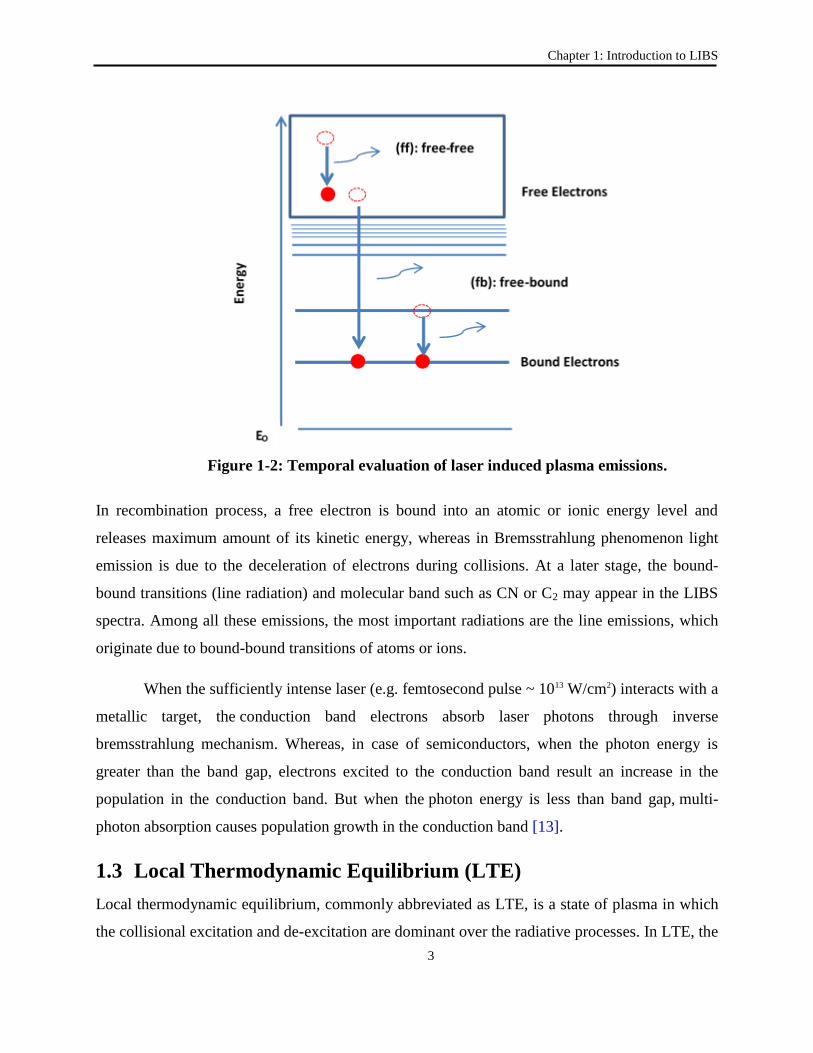
Fig. (1-2) shows possible transitions occurring during the plasma cooling time. At the
early stage plasma, the continuum emission is dominant due to bremsstrahlung (free–free
transitions) and electron ion recombination (free–bound) events.
0μss Continuum emission, < 𝟏𝟎𝟎𝒏𝒔
Ionic emission, 𝟏𝟎𝟎𝒏𝒔~𝟓𝝁𝒔
Atomic emission, 5𝟎𝟎𝒏𝒔~𝟐𝟎𝝁𝒔
Molecular bands emission, 5~𝟓𝟎𝝁𝒔
1μs 10μs
Molecular bands
Atomic emission
Ionic emission
Continuum emission
Laser pulse
Gate delay Gate width
Figure 1-1: Temporal evaluation of laser induced plasma emissions.
Chapter 1: Introduction to LIBS
3
In recombination process, a free electron is bound into an atomic or ionic energy level and
releases maximum amount of its kinetic energy, whereas in Bremsstrahlung phenomenon light
emission is due to the deceleration of electrons during collisions. At a later stage, the bound-
bound transitions (line radiation) and molecular band such as CN or C2 may appear in the LIBS
spectra. Among all these emissions, the most important radiations are the line emissions, which
originate due to bound-bound transitions of atoms or ions.
When the sufficiently intense laser (e.g. femtosecond pulse ~ 1013 W/cm2) interacts with a
metallic target, the conduction band electrons absorb laser photons through inverse
bremsstrahlung mechanism. Whereas, in case of semiconductors, when the photon energy is
greater than the band gap, electrons excited to the conduction band result an increase in the
population in the conduction band. But when the photon energy is less than band gap, multi-
photon absorption causes population growth in the conduction band [13].
1.3 Local Thermodynamic Equilibrium (LTE)
Local thermodynamic equilibrium, commonly abbreviated as LTE, is a state of plasma in which
the collisional excitation and de-excitation are dominant over the radiative processes. In LTE, the
Figure 1-2: Temporal evaluation of laser induced plasma emissions.
Chapter 1: Introduction to LIBS
4
probability of de-excitation from an excited state through inelastic collision should be large
compared to the spontaneous emission, which is possible at high plasma densities. The minimum
requirement of this assumption is determined by the electron number density eN , which is
defamed by the following McWhirter criterion: [14, 15]
332/114104.1 cmETN ee (1-1)
Where Ne (cm-3
) represents the electron number density, ∆E (eV) is the energy difference
between the upper and lower energy levels and Te is the plasma temperature in eV. Since the
McWhirter criterion is derived for stationary homogenous plasmas, therefore this condition is
necessary but not sufficient for plasma to fulfill LTE. In laser induced breakdown spectroscopy
(LIBS), the existence of local thermodynamic equilibrium (LTE) is essentially required,
therefore, Cristoforetti et al. [16] reported a detailed study on LTE beyond the McWhirter
criterion. They proposed another criterion for the existence of LTE, in which the relaxation time
of the plasma, i.e., the time needed to establish the excitation and ionization equilibrium, is much
shorter than the time required for the variation of thermodynamic parameters. Griem and Drawin
[17, 18] described that among all the processes involving the ground state, the coefficient of
collisional excitation to the first excited state of the resonance series is the lowest and can
therefore be considered for an estimation of relaxation time ( ) as follows.
kT
EkTE
gfn
ji
ji
ije
relax exp103.6 21
4
, (1-2)
As mentioned earlier, LTE plasmas can be characterized by the same temperature,
therefore, the excitation temperature which determines the population of the atomic and ionic
levels should be similar to the ionization temperature, which controls the distribution of atoms of
the same element among different ionization states.
Laser induced plasma also show spatial gradients in temperature and electron number
density due to the dissipation of heat at the plasma edges via conduction and radiative processes.
These gradients may disturb the plasma LTE, therefore, Cristoferetti et al. [16], proposed a
Chapter 1: Introduction to LIBS
5
criterion in which the diffusion length of atoms or ions (during the relaxation time) must be
shorter than the variation length of temperature and electron number density in the plasma as:
kT
E
gfM
E
gfn
lji
ijA
ji
ije
diff2
exp104.1
21
12
(1-3)
Where 3cmne is the electron density, ijf (dimensionless) is the oscillator strength, jiE
(eV) is the energy difference of the participating levels,
g is the effective Gaunt factor and kT
(eV) is the plasma temperature.
1.4 Stoichiometric Ablation
Laser ablation is a nonlinear process in which laser interacts with the sample, resulting mass
removal and plasma formation. Laser induced plasma consists of excited species, neutral atoms,
electrons, ions, molecules, particles and clusters. In stoichiometric condition, the chemical
composition of the plasma must be the representative of the sample constituents. Therefore,
understanding of laser-material interaction is very important to achieve the condition of
stoichiometric ablation and to produce plasma at optimized experimental conditions for best
LIBS performance. In 1991, Chan and Russo [19] reported for the first time that stoichiometric
ablation can only be achieved at high power density 109 W/ cm
2. These high powers can be
easily achieved with a pulsed laser. Subsequently, Russo and co-workers [20] reported further
understanding of the phenomenon along with detailed explanation of the processes which result
in the establishment of stoichiometric ablation. As calibration-free technique accounts for all
species present in a sample, therefore, stoichiometric ablation is the pre-requisite for the
quantitative analysis.
1.5 Plasma Opacity
The laser induced plasma is optically thin when all the emitted photons escape out of the plasma,
without being scattered or re-absorbed. The radiation emitted out of plasma is governed by the
following expression:
Chapter 1: Introduction to LIBS
6
L
eI
(exp1
)(
)()( ,
(1-4)
The parameters e , and L are the emissivity, absorption coefficient and plasma length,
respectively. For small values of , the condition for optically thin plasma is achieved:
LeL
eI
(
)(
)()( . (1-5)
The optical thickness of the plasma can be checked by inspecting the emission spectra.
When the observed relative intensities of the spectral lines do not follow intensity selection rules
and the strong emission lines saturate, the plasma is said to be optically thick. The resonance
lines will effectively saturate and become flat-topped indicating self-absorption. In extreme
cases, emission lines are observed with a dip at the central frequency; this is due to the self-
reversed effect.
1.6 Self-Absorption
In LIBS, the emission line intensities are used to determine sample composition,
therefore, one must be confident that the plasma is optically thin i.e. the radiation emitted is not
reabsorbed along the optical path length of the plasma volume. However, when the plasma
density is high enough, the plasma emissions are reabsorbed in the plasma volume. This
absorption distorts the emission profile and the phenomenon is referred as self-absorption. It is
more dominant in resonance lines, but weak transitions may suffer from self-absorption. The
effect of self-absorption is to reduce the peak intensity and increase the full width at half
maximum (FWHM) of the emission line profile, resulting flat topped line profile or in extreme
case dip is appeared in the line center.
The evaluation and correction of self-absorption in the emission line profile is necessary for the
accurate determination of plasma parameters and compositional analysis. Consequently many
experimental and theoretical procedures are introduced for the self-absorption correction in LIBS
spectra [21-24]. However, in the present work, we have used the self-absorption correction
technique reported by Sun and Yu [25]. In this method, an internal reference line for each species
with lower transition probability and higher excitation energy is used to extract the self-
Chapter 1: Introduction to LIBS
7
absorption coefficient from the ratio with the line to be corrected for self-absorption. The
measured line integral intensity with self-absorption is given by the following relation;
kT
Ee
TU
gAFCfI i
S
i
ijS
bij
, (1-6)
Where ijI is the line integrated intensity, bf is the coefficient of self-absorption, F is a
constant representing the optical efficiency of the system, SC is the species concentration, ijA is
the transition probability for the given line, ig is the level degeneracy, TUS is the partition
function for the emitting species, iE represents the energy of the upper state, k is the Boltzmann
constant and T is the plasma temperature. The limiting value of bf is between 0 and 1, 0bf
means the spectral line is extremely self-absorbed, whereas the value 1 shows that the spectral
line is not affected by self-absorption. As self-absorption is weak for the emission lines with low
transition probabilities and higher excitation energies, therefore considering the intensity ratios
of other emission lines to an internal reference line yield the self-absorption coefficient as
follows;
kT
EEe
gA
gA
I
I
f
f im
iij
mmn
mn
ij
b
R
b
, (1-7)
Where the subscripts R represent the internal reference and m and i are the upper and
lower states of reference transition. Assuming negligible self-absorption in reference line b
Rf , the
self-absorption in any other line of the same species can be evaluated as;
kT
EEe
gA
gA
I
If im
iij
mmn
mn
R
ijb
, (1-8)
To eliminate the self-absorption in the integrated intensity of the emission line under
consideration, the observed integrated intensity is divided by the above self-absorption
coefficient.
kT
EEe
gA
gAI
f
II im
mmn
iij
mn
R
b
ijij
corr
. (1-9)
The corrected integrated intensities can now be used in Boltzmann, Saha Boltzmann plots
and in the compositional analysis using both the calibration curve and in the calibration free
LIBS procedure.
Chapter 1: Introduction to LIBS
8
1.7 Determination of Plasma Temperature
The spectroscopic determination of plasma electron temperature is carried out using the absolute
or relative emission intensities such as line pair ratio or Boltzmann plot, and the ratio of line to
continuum intensity, etc. provided that the local thermodynamic equilibrium conditions must
satisfy in small measurement volume. In the following sections, two commonly used methods for
the estimation of plasma temperature are described.
1.7.1 Boltzmann Plot Method
The most widely used spectroscopic technique for the determination of plasma electron
temperature is the Boltzmann plot method. The relative emission intensities of atomic or ionic
lines corresponding to each species can be used to evaluate the electron temperature provided the
main contribution to the excitation and de-excitation mechanisms comes from electron impact.
Assuming the local thermodynamic equilibrium is established within the plasma, the population
in the excited states follows the Boltzmann distribution [26] , as given by the following
expression:
kT
EE
g
g
N
N 12
2
1
1
2 exp , (1-10)
Here N1 and N2 represent the level population densities and rest of the parameters is the
same as described earlier. Using Eq. (1-9), the total number density N of the species can be
expressed as follows;
3210 NNNNN
...2
21
10
0
0
kT
Eg
kT
Egg
g
NN , (1-11)
Where 0N represent the ground state population density and 0g is the statistical weight.
Rearranging the above equation yield the following expression;
TUg
N
kT
Eg
g
NN
K
KK
0
0
00
0 exp
, (1-12)
Partition function TU is stated as follows;
Chapter 1: Introduction to LIBS
9
0exp
K
KK
kT
EgTU , (1-13)
Hence the population of level is given as follows;
kT
Eg
TU
NN K
KK exp , (1-14)
The relative population of the energy levels is given as;
kT
EE
g
g
N
N iK
i
K
i
K exp (1-15)
The emission line radiant intensity (W/sr), incorporating the number density and the
transition probability A is expressed as [27] ;
kT
EUgAhcNI exp40 , (1-16)
UhcNE
kTgAI 4ln
1ln 0 , (1-17)
39000 42000 45000 48000 51000 54000
-12.5
-12.0
-11.5
-11.0
-10.5
-10.0
-9.5
-9.0
-8.5
-8.0
-7.5
-7.0
-6.5
ln(
g)
Eupper state
(cm-1
)
Slope = -2.058x10⁻⁴
Te = 7000 K
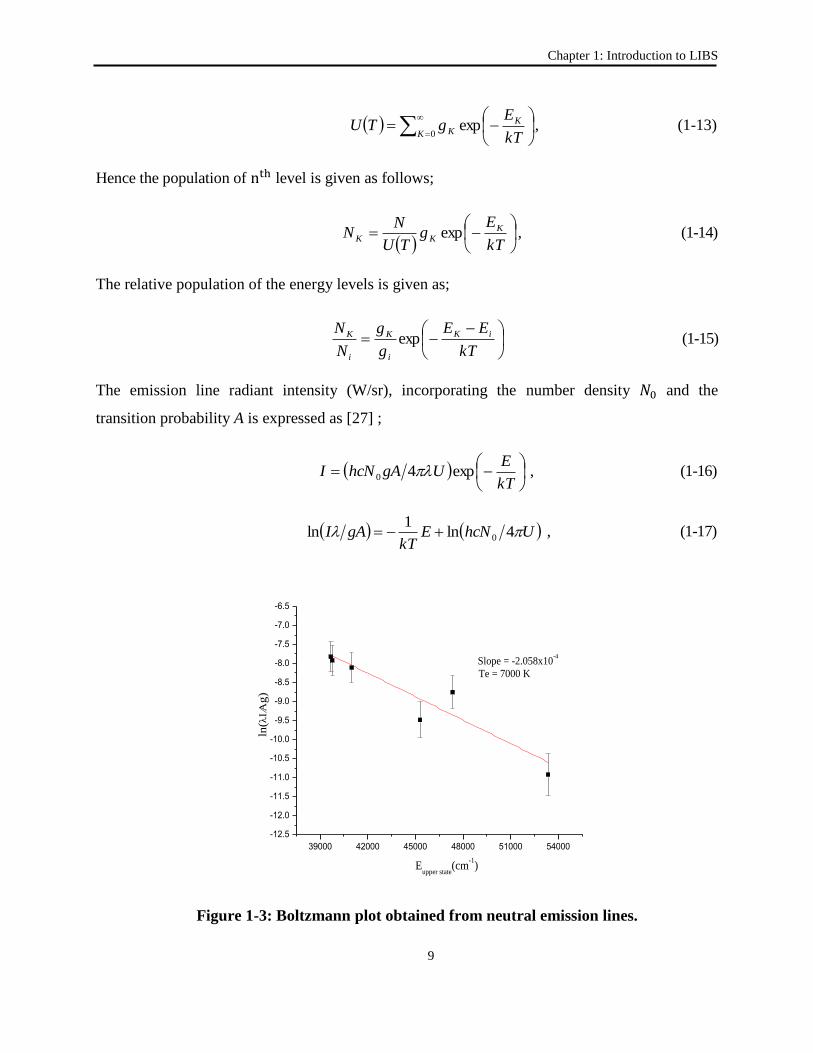
Figure 1-3: Boltzmann plot obtained from neutral emission lines.
Chapter 1: Introduction to LIBS
10
Eq. (1-17) is a linear equation with slope kT1 , which is used to extract the plasma temperature.
A typical Boltzmann plot as illustrated in Fig. (1-3), is built using gAIln versus upper state
energy. Since many emission lines from the same ionization state of a species are used in
Boltzmann plot, therefore, it gives reliable plasma temperature. The key factors that need to be
considered are accurate values of emission line intensities as well as reliable spectroscopic data
of the emission lines used in the plot.
1.7.2 Saha Boltzmann Plot Method
The Saha Boltzmann plot method produces more accurate plasma temperature due to the use of
spectral lines from different ionization stages [28-31]. As the emission lines corresponds to both
neutral and ionic species, a combination of Boltzmann excitation and Saha ionization
distributions are used to get Saha Boltzmann plot with extend the range of energies.
kT
EE
h
mkT
TU
TU
N
Nn zz
z
z
z
z
e112/3
211exp
2
)(
)(2 , (1-18)
Where 3cmne is the electron number density, 3cmN Z and 31 cmN Z
are the
number densities of any two consecutive ionization stages. The parameters gm , 1zE and
1 zE are the electron mass, the first ionization potential and correction in the ionization
potential respectively [32]. The expressions for the Saha–Boltzmann plot method is given by the
following equation. [27, 32, 33].
tQhcNkT
E
gA
IZ
j
Z
j
Z
ji
ji
Z
ji lnln
, (1-19)
Where
e
Z
j
Z
ji
ji
Z
ji
Z
j
Z
ji
ji
Z
ji
n
T
h
mkz
gA
I
gA
I 2323
2
22lnlnln
,
(1-20)
and
1
0
Z
K
KKZ
j
Z
j EEEE . (1-21)
Chapter 1: Introduction to LIBS
11
In this expression, Z represents the ionization stage, i.e. 0Z correspond to bound
stage, whereas 1Z represents the first ionization stage. In Eq. (1-19), the correction term
varies as 23ln T , which is slowly varying compared to T1 term. Therefore, the temperature is
obtained using an iterative procedure, for which the initial value of temperature is obtained from
Boltzmann plot method. A new value of temperature is obtained which is plugged in again to get
new value of plasma temperature. This iterative procedure continues until temperature
converges.
The use of emission lines from different ion stages of the same species increases the
energy spread between the levels when compared with the Boltzmann plot. Consequently, the
slope obtained by a linear regression is less affected from measurement noise, which results
accurate plasma temperature. Moreover, the electron number density can now be determined
from the intercept [34].
1.8 Electron Number Density
The spectroscopic technique which is used for the determination of electron number density is
the Stark broadening in the emission line profile. As the line profile is the consequence of many
broadening effects such as Doppler, pressure and instrumental etc., nevertheless the main
contribution comes from the Stark effect [35]. The Stark broadening is due to the coulomb
interactions between the emitter atoms and the charged particles in the plasma. Therefore the
Stark broadening of an isolated line is a useful parameter for determination of the electron
number density, provided the Stark broadening parameter is known. The full width at half
maximum (FWHM) of a Stark broadened line profile can be expressed as [36-38];
163
14
1
1616
2
110
2.1110
5.310
2 eD
ee NN
NA
N , (1-22)
Where nm and nmA are the electron and ion impact parameters, the values can be
found in the literature [39]. 3cmNe and 3
cmND are the electron and particle density in
Debye sphere. As the ions are much heavier than electrons, the ionic contribution can therefore
be neglected and the above equation is modified as follows;
Chapter 1: Introduction to LIBS
12
16
2
110
2 eN . (1-23)
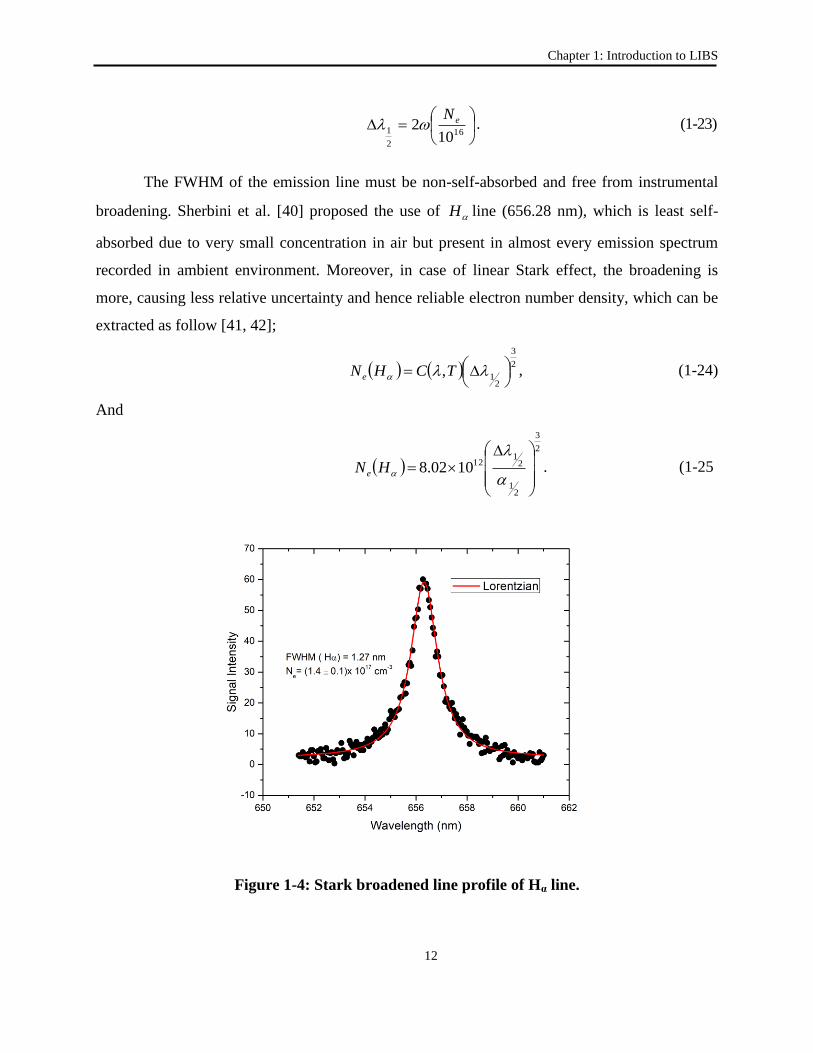
The FWHM of the emission line must be non-self-absorbed and free from instrumental
broadening. Sherbini et al. [40] proposed the use of H line (656.28 nm), which is least self-
absorbed due to very small concentration in air but present in almost every emission spectrum
recorded in ambient environment. Moreover, in case of linear Stark effect, the broadening is
more, causing less relative uncertainty and hence reliable electron number density, which can be
extracted as follow [41, 42];
2
3
21,
TCHNe
, (1-24)
And
2
3
21
21
121002.8
HNe. (1-25
Figure 1-4: Stark broadened line profile of Hα line.
Chapter 1: Introduction to LIBS
13
The FWHM
21 is obtained by fitting Voigt function over the line profile as shown in
Fig. (1-4) and the coefficient TC , is reported in Griem [39], whereas, the empirical
coefficient 2
1 can be obtained in ref [43].
Two different approaches are used for the instrumental function. In the first approach both
Stark and instrumental broadening are considered Lorentzian and therefore both are subtracted
linearly as follows;
instmeasStark
In the second approach, the instrumental broadening is described by a Gaussian profile,
which is subtracted in quadrature from the measured profile to get Stark broadened line profile.
The approximated formula which connects the width of a Voigt profile to its
Lorentzian and Gaussian components is:
22
42G
LL
In our case, the Gaussian width is given by the instrumental broadening, if, as it should,
1
L
G
and, consequently
L we can further approximate the previous expression
obtaining:
2
22
L
GLL
i.e.
222
GLL
And
22
a instrkSt (1-26)
Chapter 1: Introduction to LIBS
14
1.9 Quantitative Analysis using LIBS
The two most common LIBS methods for the quantitative analysis are calibration curve and
calibration free methods. In calibration curve method, the reference samples are used and
calibration curves are constructed between the emission intensity and the known concentration
using reference samples. The concentration of unknown sample can be determined by fitting
emission intensity on the standard calibration curves. This method requires the matrix matched
standard samples which in most cases are not available.
1.9.1 Calibration Free LIBS (CF-LIBS) Technique
The calibration free LIBS (CF-LIBS) technique has been extensively used for the
quantitative analysis, after its introduction in 1999 by Ciucci et al. [44]. The standard-less LIBS
technique has lots of potential applications for the quantitative analysis in research and industry,
therefore, the analysis of alloys, coal, soil, geological and biological samples etc. are reported in
literature [45-47]. This method is based on the fundamental assumptions of plasma being
homogeneous and satisfy LTE conditions, the spectral lines are optically thin and the
stoichiometric condition must be fulfilled [48, 49].
For the LTE plasma, the population of an excited level can be related to the total
concentration of neutral atoms or ions using the Boltzmann relation. According to the Boltzmann
relation the measured emission line intensity is represented using the following relation:
kTE
eS
S eTU
gFCI
, (1-27)
Here I is the line integrated intensity, the experimental factor F describes the optical
efficiency of the setup, SC is the species concentration, eS TU is the partition function, E is the
upper state energy of a transition, eT represents the plasma temperature which must be same
under LTE assumption and BK is the Boltzmann constant. The values of F , eT and SC are
determined from the experimental data.
By taking the logarithm of Eq. (1-27), we obtain
Chapter 1: Introduction to LIBS
15
eS
S
e
j
jji
ji
TU
FC
kT
E
gA
Ilnln , (1-28)
Rearranging the above equation in linear form:
Sqmxy ,
Where
jji
ji
gA
Iy ln , jEx ,
ekTm
1 ,
eS
SS
TU
FCq ln
Similar expressions can be defined for each plasma species. The integrated intensity for
each transition is represented as a point in the Boltzmann plot. Under LTE assumption, all plots
will give same value of slope (m) but different intercepts ( Sq ). The experimental factor F can be
evaluated using normalization condition.
S
SC 1
S
q
e
II
S
q
e
I
S
IIS
IS eTUeTUF , (1-29)
Where I
Sq and II
Sq are the intercepts from the Boltzmann plot and e
I
S TU , e
II
S TU are the
partition functions of neutral and singly ionized species respectively. The partition function is
calculated as;
i
kTE
ieSeegTU ,
After determination of plasma electron temperature, the elemental concentration can be
obtained using the following expression;
F
eTUeTUC
IIS
IS q
e
II
S
q
e
I
SS
. (1-30)
Chapter 1: Introduction to LIBS
16
However, in some particular situations, the emission spectrum exhibits lines that
correspond to only single species of a certain element. In such cases, to include the contribution
of ionic species in overall elemental concentrations, the Saha equation can be used [27] which
relates the concentrations of species with successive ionization states of same element.
kT
EE
h
kT
TU
TU
N
Nn zz
z
z
z
z
e
112/3
211exp
2
)(
)(2 . (1-31)
The electron density en is extracted using Stark broadening in the line profile. Otherwise,
the electron density can also be measured through the Saha equation itself, if the concentration
ratio of two successive ionization stages has been evaluated for at least one element. In principle,
the information regarding just one element is enough for the complete evaluation of the species
concentration because the electron density will be same for all the elements like plasma
temperature. However, for more precise results the contribution of more spectral lines can be
used to average out the effects of the uncertainties on the transition probabilities.
1.9.2 Variants of Calibration Free LIBS
Since 1999, when Ciucci for the first time proposed and implemented the calibration free
analysis technique, many variants of this technique are reported in literature. Initially, efforts
have been made to correct self-absorption issues in the emission spectra. Many resonance lines
from the major elements often suspect for self-absorption were excluded from the analyses. In its
new formulation, Bulajic et al. [21] implemented a self-absorption correction scheme in the CF-
LIBS technique via curve of growth (COG) method. The recursive algorithm calculates the
density of species using input parameters, evaluates self-absorption, and recalculates the
densities. Sun and Yu [25] proposed a self-absorption correction procedure in the emission lines
and improved the accuracy of CF-LIBS results. Recently Pisa group published a comprehensive
discussion on three variants of calibration free technique, namely one-point calibration,
calibration free inverse method and C-sigma approach [50]. They concluded that one-point-
calibration method is the most appropriate against self-absorption and matrix effect. Burakov et
al. [45] proposed a variant in which known concentration of one of the basic components is used
to correct all other components of the sample. De Giacomo et al. [51] proposed self-calibrated
Chapter 1: Introduction to LIBS
17
LIBS (SC-LIBS) approach, in which they relaxed the LTE condition to some extent and instead
internal normalization was achieved using plasma continuum emission and neutral species. In
subsequent years, Wang et al. [52] used the internal standard concentration for the determination
of number density of rest of the sample constituents. In literature, some variants are reported,
which are not directly the variants of CF-LIBS, however, improve the accuracy of this technique.
For example, Aguilera et al.[53] used Saha–Boltzmann plot for the determination of plasma
temperature and relative number densities of the elements from the corresponding intercepts,
which is more accurate than Boltzmann plot method.
In the present work, we have used the internal reference method [23, 25] to quantify and
eliminate the self-absorption in the selected emission lines. Typically, the trace elements in a
sample appear with few emission lines which are not sufficient to build Boltzmann plot and get
intercept, but their contribution to overall elemental concentration should be incorporated. In
order to overcome this issue, we have used the variant of CF-LIBS, proposed by Diaz Pace et al.
[54], according to which the plasma temperature is estimated using the emission lines of any one
element and the intercepts for the rest of species is determined using the modified form of Eq. (1-
27).
eS
S
e
j
jji
ji
TU
FC
kT
E
gA
Ilnln .
(1-32)
1.10 LIBS Configurations
1.10.1 Single Pulse LIBS
The unusual advantages of LIBS, including lack of sample pre-treatment, small measurement
times, and the ability of real-time multi-element detection tempt the researchers to focus their
efforts to establish new techniques for reliable LIBS-based quantitative analysis. These
advantages make the LIBS technique preferable over other conventional analytical techniques
such as inductively coupled plasma optical emission spectroscopy (ICP-OES), inductively
coupled plasma mass spectroscopy (ICP-MS), and atomic absorption spectroscopy (AAS) [55].
In LIBS, conventionally single pulse is used to produce plasma on the sample surface, the
associated optical emissions are analyzed for the determination of plasma parameters,
Chapter 1: Introduction to LIBS
18
compositional analysis and other applications. LIBS is a powerful analytical tool in closed
contact and standoff arrangement. The performance of single pulse LIBS depends on the laser
pulse energy, laser wavelength, pulse duration of the laser and the time delay between plasma
formation and spectral acquisition. Many groups investigated the dependence of plasma on these
laser parameters and experimental conditions. Now LIBS has been successfully demonstrated for
a quick qualitative sample analysis. In the SP-LIBS, a few micro-grams of the sample is required
to produce plasma, therefore, it can be termed as a non-destructive technique [56]. Due to non-
destructive feature, the technique finds its applications in the analysis of precious samples like
antique artifacts [57]. In subsequent years, single pulse LIBS has been applied for the
quantitative analyses of metallic alloys [2, 58], non-metallic alloys [45], and soil samples [59,
60]. The key feature about LIBS is its great analytical capability to carry online, in-situ and
remote analysis of the samples placed in harsh, inaccessible, and contaminated environment.
Despite the above mentioned capabilities, the conventional single pulse technique suffers
from significant matrix effects and high background signals [35]. SP-LIBS also undergo shot-to-
shot signal fluctuations. The main factors contributing the fluctuations in the measurements are
the variations in plasma temperature and coupling of laser energy with the target surface [56].
Moreover low sensitivity and relatively poor limits of detection ppm) are the main drawbacks
of SP-LIBS when compared with other analytical techniques [61, 62].
1.10.2 Double Pulse LIBS
Various strategies are adopted to increase the sensitivity and accuracy of LIBS technique [63-
66]. These studies were aimed to investigate the use of multiple pulses on different samples and
matrices [67-71] and reported enhanced emission line intensities and improved signal to
background ratio [72]. Irradiating second pulse to the plasma, results in enhanced sensitivity due
to various factors, such as re-excitation, increased mass ablation and reduced plasma shielding of
the incident laser beams. In this configuration, it is possible to improve the analytical capabilities
without dropping the LIBS features [67]. Evtushenko et al. [73, 74] were the first to investigate
laser induced spectra in air using two synchronised lasers. Subsequently, Piepmeier and
Malmstadt [75] and Scott and Strasheim [76] studied the laser absorption in plasma of aluminum
alloy and examined many laser plasma plumes as a spectrochemical source for quantitative
Chapter 1: Introduction to LIBS
19
analysis. In double pulse LIBS (DP-LIBS), the signal enhancement depends on the target
material, laser pulse energies, inter pulse delay, combination of pulses with different
wavelengths [67, 77] and geometrical configurations of the laser beams [78-80]. Cremers et al.
[81] in 1984 and several other groups performed double pulse LIBS experiments in various
configurations, such as collinear, orthogonal, and parallel geometry [82-88].
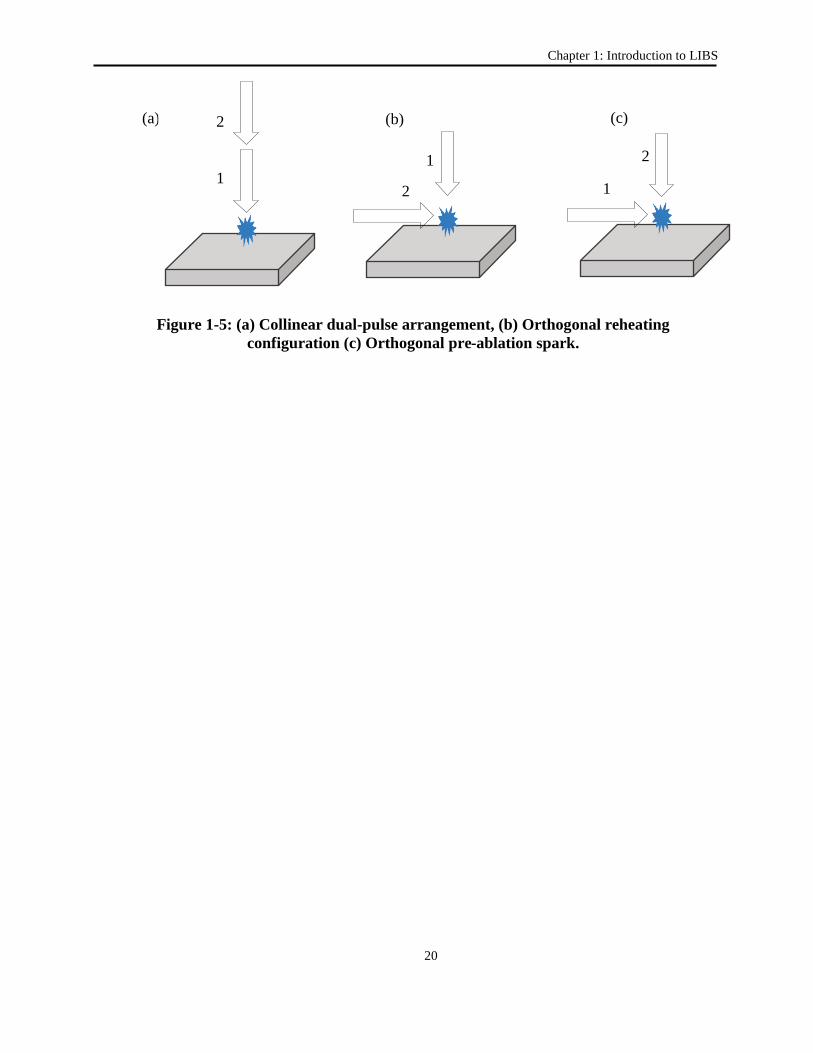
Fig. (1-5) illustrates the schematics of collinear and orthogonal beam geometries for double pulse
LIBS. The arrows represent the direction of laser beam propagation and the labeling on these
arrows show their temporal sequence. Fig. (1-5a) refers to collinear geometry, in which the first
laser produces plasma, whereas the suitably delayed second laser interacts with the plasma
produced by the first laser. Consequently, an increased sample ablation, more plasma volume,
enhanced collisions and more hot plasma is produced as compared to single pulse with same
total energy for both lasers [89]. Cremers et al. [81], for the first time used orthogonal and
collinear beam geometries on aqueous solution and observed that collinear geometry yield
maximum signal enhancement. In orthogonal reheating arrangement as shown in Fig. (1-5b), the
first laser pulse directed perpendicular to the sample resulting in plasma generation, whereas, the
second delayed pulse travelling parallel to the sample surface re-heats the plasma. In this
configuration, the signal enhancement is due to energy absorption in the plasma during the re-
heating pulse. Gonzalez et al. [90] proposed that in the re-heating arrangement second pulse
causes an efficient increase in emitting species due to the vaporization induced from the first
pulse.
In case of orthogonal pre-ablation case [91], the first laser pulse travelling parallel to the
sample surface rarefying the ambient air in front of sample depicted as shown in Fig. (1-5c). The
second delayed pulse hits the sample surface orthogonally and produces plasma. Sanginés. et al.
[92] employed the orthogonal DP-LIBS in reheating and pre-ablative configurations at different
inter-pulse delays. For both schemes, the signal enhancement was achieved when compared with
corresponding SP-LIBS.
Chapter 1: Introduction to LIBS
20
Figure 1-5: (a) Collinear dual-pulse arrangement, (b) Orthogonal reheating
configuration (c) Orthogonal pre-ablation spark.
(a)
2
1
(b) (c)
1
2
1
2 1
2
Chapter 1: Introduction to LIBS
21
1.11 Layout
In this research project we applied the calibration-free LIBS for the quantitative analysis of
silicon and germanium alloys. The first chapter deals with the brief description of the theoretical
background of laser induced plasma, plasma temperature, number density, and the core topic of
the research calibration free LIBS technique using single and double pulse configurations. The
second chapter describes the details of the instruments used in the experiments and the
experimental procedure both for single and double pulse LIBS.
Chapter three is based on the detail investigation of plasma parameters of silicon, their
dependence on the laser irradiance, laser wavelength, distance from the target surface, ambient
pressure. This chapter also has brief overview of the same studies on germanium target. In
chapter four, the quantitative analysis of the standard aluminum-silicon alloy is presented. The
plasma was produced using the fundamental harmonic (1064 nm) of the Nd: YAG laser. The
self-absorption corrected emission spectra have been used for the qualitative and quantitative
analyses.
In chapter five, the research work was further extended to the quantitative analysis of two
unknown alloys (Ge-Cu/Si and Ge-Ba/Si) using double pulse calibration free LIBS technique.
The plasma was produced using two collinear Nd: YAG lasers, operating at 1064 nm. The
experimental parameters were optimized to maximize the signal to background ratio.
Stoichiometric ratio of Ge-Cu/Si and Ge-Ba/Si alloys is first determined using double pulse
technique. Further, the quantitative analysis of standard Gd-Ge-Si alloy was performed using
variant of double pulse calibration free LIBS technique. In this variant the Boltzmann plot for
one species was built for plasma temperature and the concentration of all the elements were
determined without Boltzmann plots. In addition, three polycrystalline silicon solar cells were
investigated that yields the concentration of silicon as 99.78, 98.09 and 99.45% respectively, and
trace impurities were detected in parts per million (ppm). The impurities in crystalline structure
reduce the conversion efficiency of solar cells and therefore their detection and quantification is
important for efficient photovoltaic applications.
22
Chapter 2
Instrumentation and Experimental Procedure 2
The research work presented in this thesis, was performed using Q-switched Nd: YAG laser
systems, LIBS sample chamber, optical components, and high resolution broadband
spectrometer. In the following sections, all the apparatus has been described in detail.
2.1 Laser System
The commonly used laser in majority of LIBS experiments is the Q-switched Nd:YAG laser
system, which is a flash lamp pumped with pulse duration in the range between 6–10 ns. It is a
four level solid state laser that emits light in the infrared region (1064 nm) of the spectrum.
Furthermore, by frequency doubling and mixing the second (532 nm) and third (355 nm)
harmonics are produced. A small number of Yttrium ions (Y3+
), 0.2 to 1.4% are replaced by the
Neodymium (Nd3+
) ions in the active medium of Nd:YAG crystal. The active media is in the
shape of a cylindrical rod, pumped by flash lamps and placed inside a highly reflecting optical
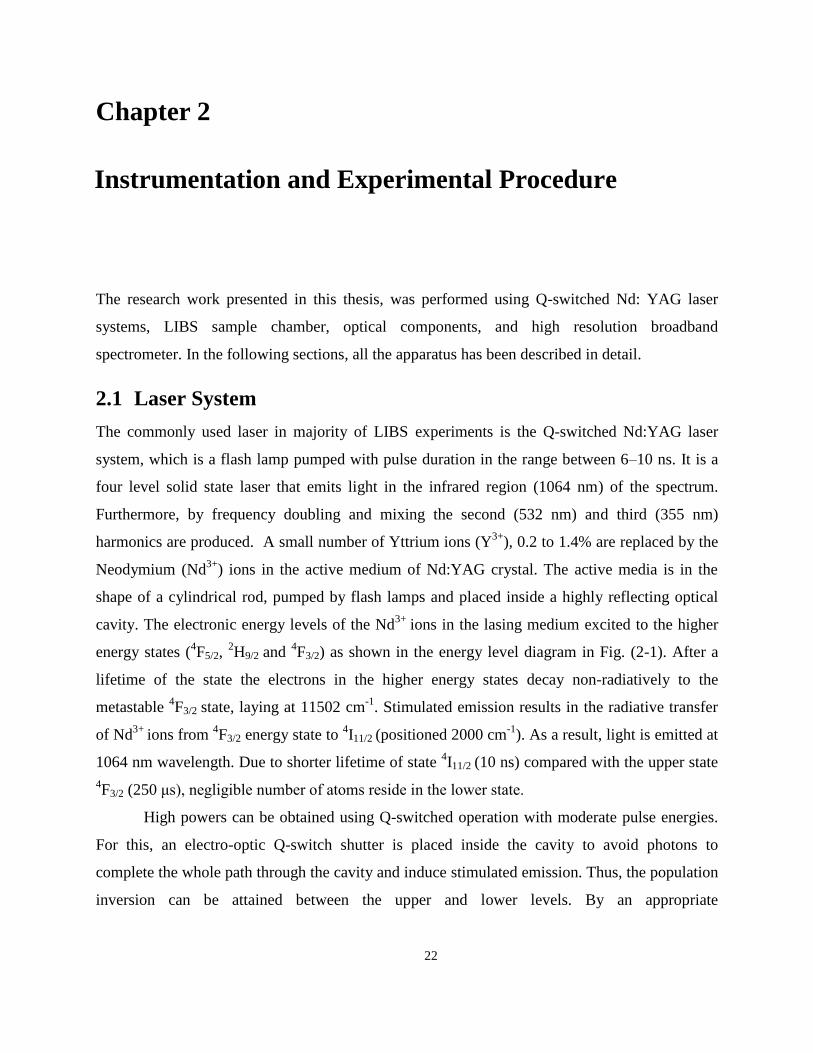
cavity. The electronic energy levels of the Nd3+
ions in the lasing medium excited to the higher
energy states (4F5/2,
2H9/2 and
4F3/2) as shown in the energy level diagram in Fig. (2-1). After a
lifetime of the state the electrons in the higher energy states decay non-radiatively to the
metastable 4F3/2 state, laying at 11502 cm
-1. Stimulated emission results in the radiative transfer
of Nd3+
ions from 4F3/2 energy state to
4I11/2 (positioned 2000 cm
-1). As a result, light is emitted at
1064 nm wavelength. Due to shorter lifetime of state 4I11/2 (10 ns) compared with the upper state
4F3/2 (250 μs), negligible number of atoms reside in the lower state.
High powers can be obtained using Q-switched operation with moderate pulse energies.
For this, an electro-optic Q-switch shutter is placed inside the cavity to avoid photons to
complete the whole path through the cavity and induce stimulated emission. Thus, the population
inversion can be attained between the upper and lower levels. By an appropriate
Chapter 2: Instrumentation and Experimental Procedure
23
timed gate pulse, the Q-switch is triggered allowing photons to make many traverses of the laser
cavity and results in a high-power short duration laser pulse.
In the present work, we used a Q-switched Nd:YAG laser (Brilliant from Quantel) with a
pulse duration of 6 ns and repetition rate of 10 Hz to perform single pulse LIBS experiments.
The pulse to pulse fluctuations in the output pulse energy was less than 5%, which is appreciable
for the laser induced plasma experiments where accuracy and precision are much required. In
dual pulse LIBS (DP-LIBS) experiments, laser pulses from two different lasers were used to
produce and re-heat the plasma in collinear configuration. The lasers were operating at
fundamental wavelength of 1064 nm for both SP-LIBS and DP-LIBS experiments.
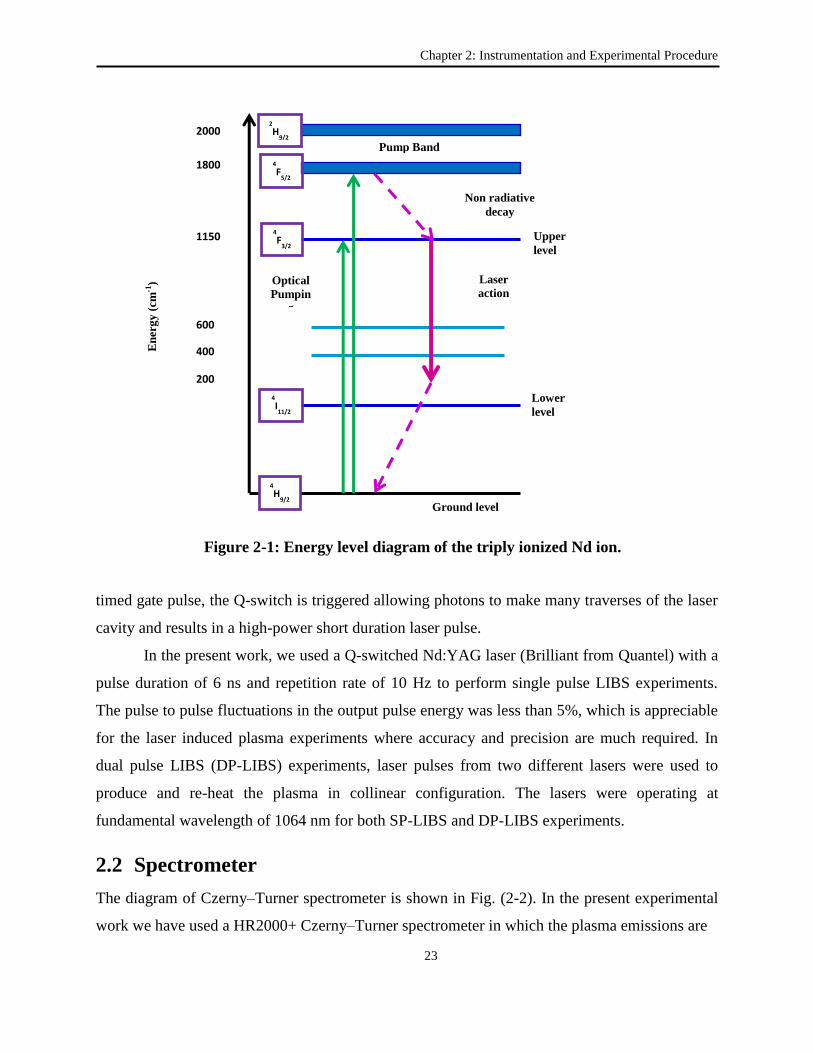
2.2 Spectrometer
The diagram of Czerny–Turner spectrometer is shown in Fig. (2-2). In the present experimental
work we have used a HR2000+ Czerny–Turner spectrometer in which the plasma emissions are
4
H9/2
2
H9/2
4
F5/2
4
F3/2
4
I11/2
2000
0 1800
0
1150
2
600
0
200
0
400
0
Pump Band
Non radiative
decay
Upper
level
Laser
action 1064 nm
Lower
level
Ground level
Optical
Pumpin
g
Figure 2-1: Energy level diagram of the triply ionized Nd ion.
En
erg
y (
cm
-1)
Chapter 2: Instrumentation and Experimental Procedure
24
Figure 2-2: Schematic of Czerny-Turner spectrometer.
imaged onto the entrance slit and reach the first mirror that collimates the light and direct it onto
the grating. Light dispersed at different angles strikes a mirror that focuses the light on the
detector array in the form of a spectrum. The fundamental grating equation is described as
follows:
,sinsin nd
(2-1)
Where d is the grating period, is the angle of incidence, is the diffraction angle, n is
diffraction order, and is the wavelength of the incident light. The linear dispersion can be
expressed as;
,cos
nf
d
dx
d
(2-2)
Here x is the coordinate in the detector plane and f is the focal length of the exit mirror.
The CCD detector has 1024×1024 pixels. The resolving power of a spectrometer is given as;
,NnR
(2-3)
In the above expression n is the diffraction order and N is the total number of grooves on
the grating irradiated by the light and is the spectral separation of the two emission lines. The
resolving power depends on the wavelength and increases with the spectral order but
independent of the size and spacing of the grating. However, different ruling are used in
spectrometer depending on the wavelength.
Chapter 2: Instrumentation and Experimental Procedure
25
.
# D
ff
(2-4)
Here, D and f are the diameter and focal length of the mirror respectively from the
entrance slit to the first mirror. The resolution of the spectrometer can be improved by increasing
the number of grooves in grating but at the expense of the spectral range. Furthermore, the
resolution also depends on entrance slit, and again this is done at the cost of the signal strength.
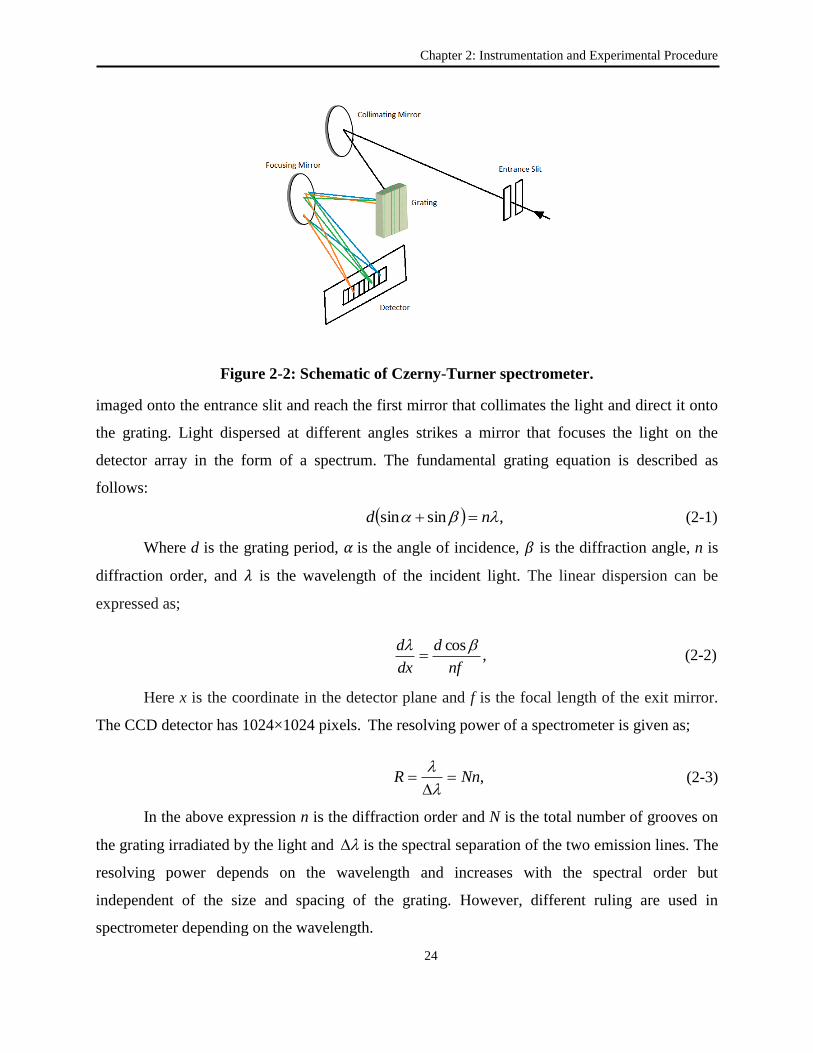
2.3 Spectrometer Calibration
The wavelength and spectral response calibration of a spectrometer is necessary to validate the
recorded spectrum. The calibration of a spectrometer is the basis of quantitative applications of
the emission spectra. To assign a spectral line to a particular element, the recorded emission
spectrum must have wavelengths with certain accuracy. The wavelength calibration uses a
standard lamp such as a “Hg-Ar low pressure lamp”. The Hg-Ar lamp provides good spectral
coverage for different regions of the LIBS emission spectrum.
Figure 2-3: Emission Spectra of low pressure Hg-Ar standard lamp.
Chapter 2: Instrumentation and Experimental Procedure
26
The following third order polynomial expression is used, which relates the pixel number with
wavelength from the NIST atomic database [93].
3
3
2
21 pCpCpCIp (2-5)
Where p is the wavelength at pixel p, I is the wavelength at 0 pixel and C1, C2, C3 are the
first, second and third coefficients (nm/pixel) respectively. The emission spectrum of Hg-Ar
lamp as depicted from Fig. 2-3 was recorded with suitable integration time and the pixel no. and
corresponding wavelength from literature was tabulated. The square and cube of the pixel
number were calculated to find out C2, and C3 coefficients. The spread sheet program (Excel,
Microsoft) used to perform the linear regression analysis yield all the three coefficients and
intercept. The R-squared values in the outcome of regression analysis must be close to unity,
indicating the best regression analysis. In the spectrometer setting, the values of coefficients
were updated and the procedure was repeated for each channel.
Each component in LIBS setup, particularly the spectrometer has a certain spectral
response, which depends on the wavelength. Moreover, the detector used to record the emitted
light has a response function that varies with wavelength. In order to radiometrically calibrate the
LIBS setup, standard intensity lamps are used, which require re-calibration after their lifetime
[94].
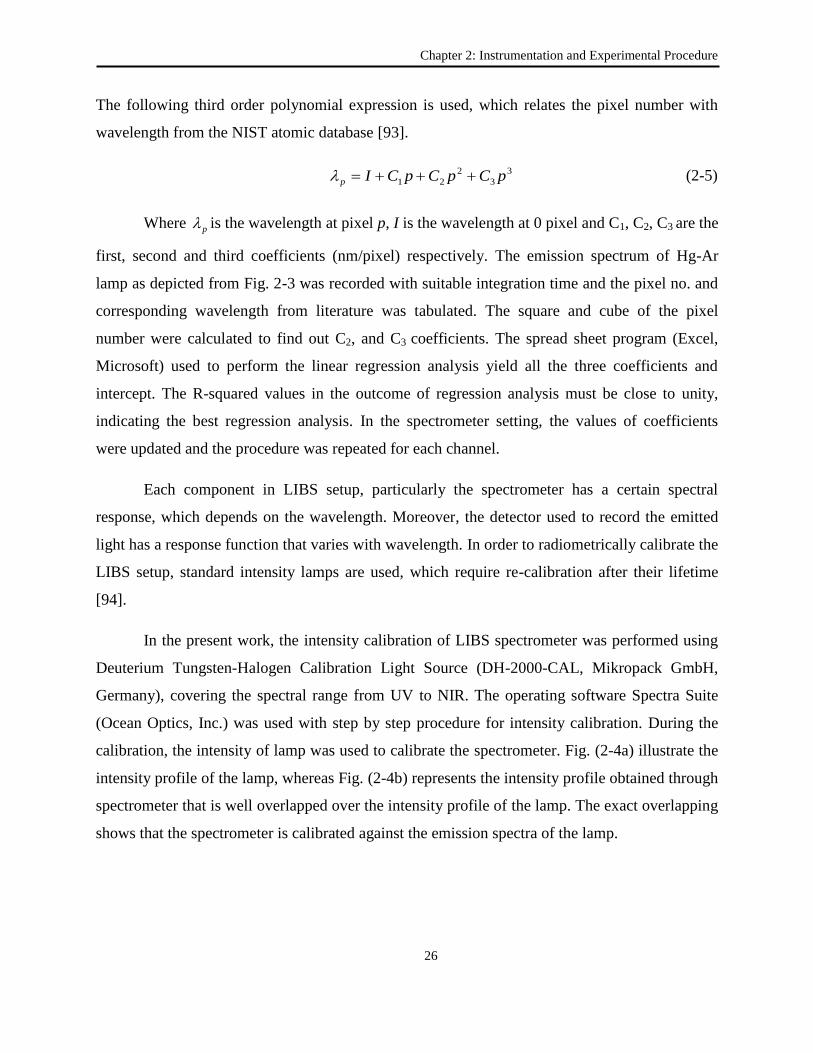
In the present work, the intensity calibration of LIBS spectrometer was performed using
Deuterium Tungsten-Halogen Calibration Light Source (DH-2000-CAL, Mikropack GmbH,
Germany), covering the spectral range from UV to NIR. The operating software Spectra Suite
(Ocean Optics, Inc.) was used with step by step procedure for intensity calibration. During the
calibration, the intensity of lamp was used to calibrate the spectrometer. Fig. (2-4a) illustrate the
intensity profile of the lamp, whereas Fig. (2-4b) represents the intensity profile obtained through
spectrometer that is well overlapped over the intensity profile of the lamp. The exact overlapping
shows that the spectrometer is calibrated against the emission spectra of the lamp.
Chapter 2: Instrumentation and Experimental Procedure
27
Figure 2-4: (a) Intensity profile of Standard lamp and (b) Spectrometer calibration curve.
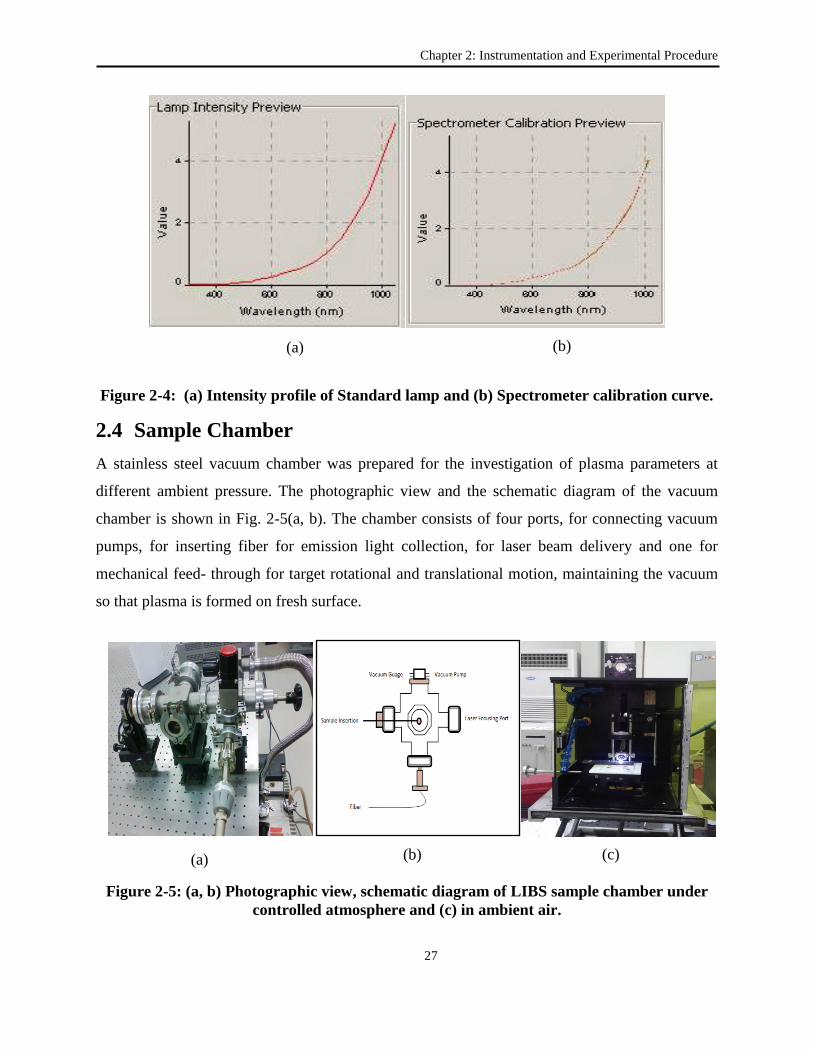
2.4 Sample Chamber
A stainless steel vacuum chamber was prepared for the investigation of plasma parameters at
different ambient pressure. The photographic view and the schematic diagram of the vacuum
chamber is shown in Fig. 2-5(a, b). The chamber consists of four ports, for connecting vacuum
pumps, for inserting fiber for emission light collection, for laser beam delivery and one for
mechanical feed- through for target rotational and translational motion, maintaining the vacuum
so that plasma is formed on fresh surface.
Figure 2-5: (a, b) Photographic view, schematic diagram of LIBS sample chamber under
controlled atmosphere and (c) in ambient air.
(c) (b) (a)
(a) (b)
Chapter 2: Instrumentation and Experimental Procedure
28
The experimental work in ambient air was performed in a commercially available LIBS
sample chamber (Ocean Optics Inc.) as shown in Fig. (2-5c), using single pulse. The inside
platform can be manually controlled by x-y stage. The laser beam focusing lens and fiber probe
are mounted on the same railing, and can be adjusted easily.
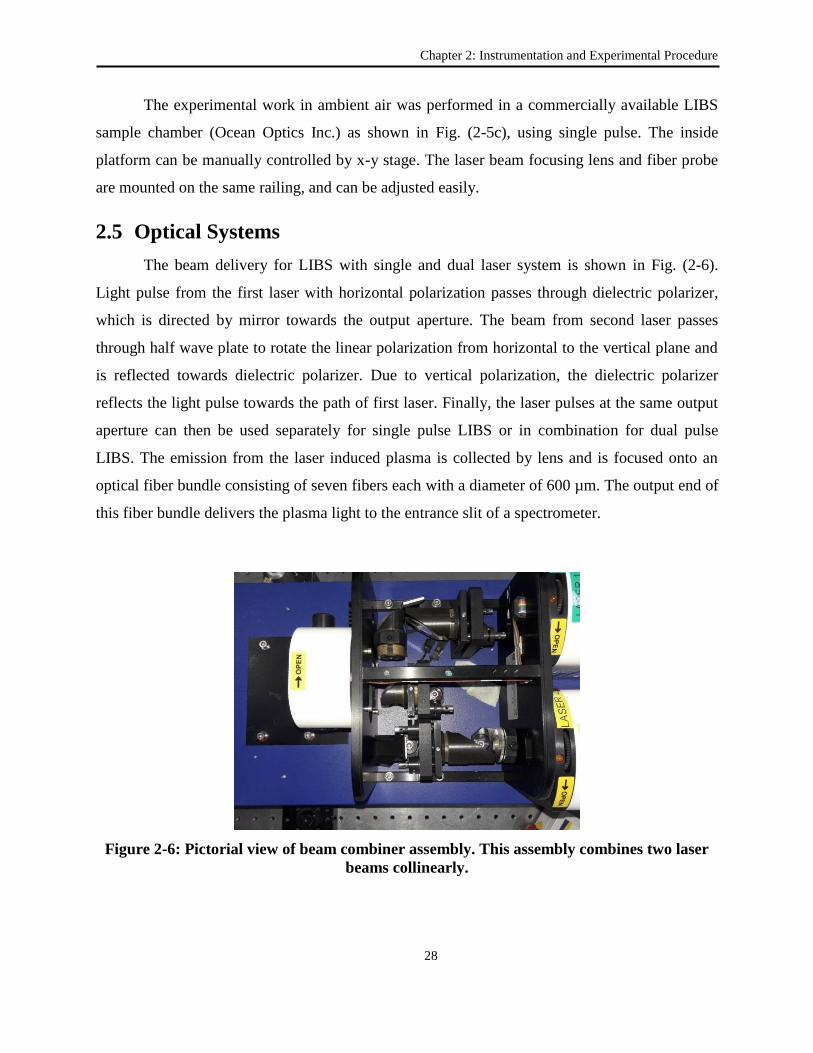
2.5 Optical Systems
The beam delivery for LIBS with single and dual laser system is shown in Fig. (2-6).
Light pulse from the first laser with horizontal polarization passes through dielectric polarizer,
which is directed by mirror towards the output aperture. The beam from second laser passes
through half wave plate to rotate the linear polarization from horizontal to the vertical plane and
is reflected towards dielectric polarizer. Due to vertical polarization, the dielectric polarizer
reflects the light pulse towards the path of first laser. Finally, the laser pulses at the same output
aperture can then be used separately for single pulse LIBS or in combination for dual pulse
LIBS. The emission from the laser induced plasma is collected by lens and is focused onto an
optical fiber bundle consisting of seven fibers each with a diameter of 600 µm. The output end of
this fiber bundle delivers the plasma light to the entrance slit of a spectrometer.
Figure 2-6: Pictorial view of beam combiner assembly. This assembly combines two laser
beams collinearly.
Chapter 2: Instrumentation and Experimental Procedure
29
2.6 Optimization of Experimental Parameters
For the quantitative measurements, the emission line intensities are directly related to the
absolute or relative concentration of a sample. Several parameters affect the precision of LIBS
measurements include laser energy, lens to sample distance (LTSD), gate delay time and the gate
width. At low laser fluence, usually, the strong emission lines of major species and resonance
transitions from the trace elements are detected, but weak emission lines are not detected. On the
other hand, at high laser irradiance the emission lines of major constituents get saturated and
strong continuum appears. To get LIBS spectra, a true representation of the sample and to avoid
saturating emission lines, the optimum laser irradiance was used in the present experiments. At
this irradiance, the trace elements were detected with good signal to noise (S/N) ratio and major
elements were identified with sharp transitions and were free from saturation. It was observed
that by varying gate delay the intensity of atomic emission lines and continuum background was
changed. Background emissions were prominent in the early stage of the plasma but its rate of
decay is much faster than the atomic emission lines. Continuum (Bremsstrahlung) depends on
the plasma temperature and decay faster. After the plasma expansion (lower temperature) the
emission line signal dominates due to the recombination of the charged species in the plasma.
Because of different decay rates of the emission lines and the background continuum it became
easy to get the optimized conditions by adjusting the time window of the detector. Similarly, any
small change in lens-to-sample-distance (LTSD) causes a significant change in the intensity of
the emission lines from the trace elements. Hence, for accurate and reproducible results, the
LTSD should be fixed. In the present experiments, this parameter was optimized by taking a
burn pattern at different positions close to sample surface and the lens was fixed at optimized
position. The spectral response of the spectrometer was corrected using intensity calibrated lamp.
The wavelength calibration was performed with a standard Hg-Ar lamp and through regression
analysis the coefficients were updated. Pulse energies were calibrated by Scientech thermopile
and monitored by directing a small fraction of the laser pulses to a photodiode coupled with a
digital oscilloscope. Under these optimized conditions, the emission spectra of alloys were
recorded for the qualitative and quantitative analysis.
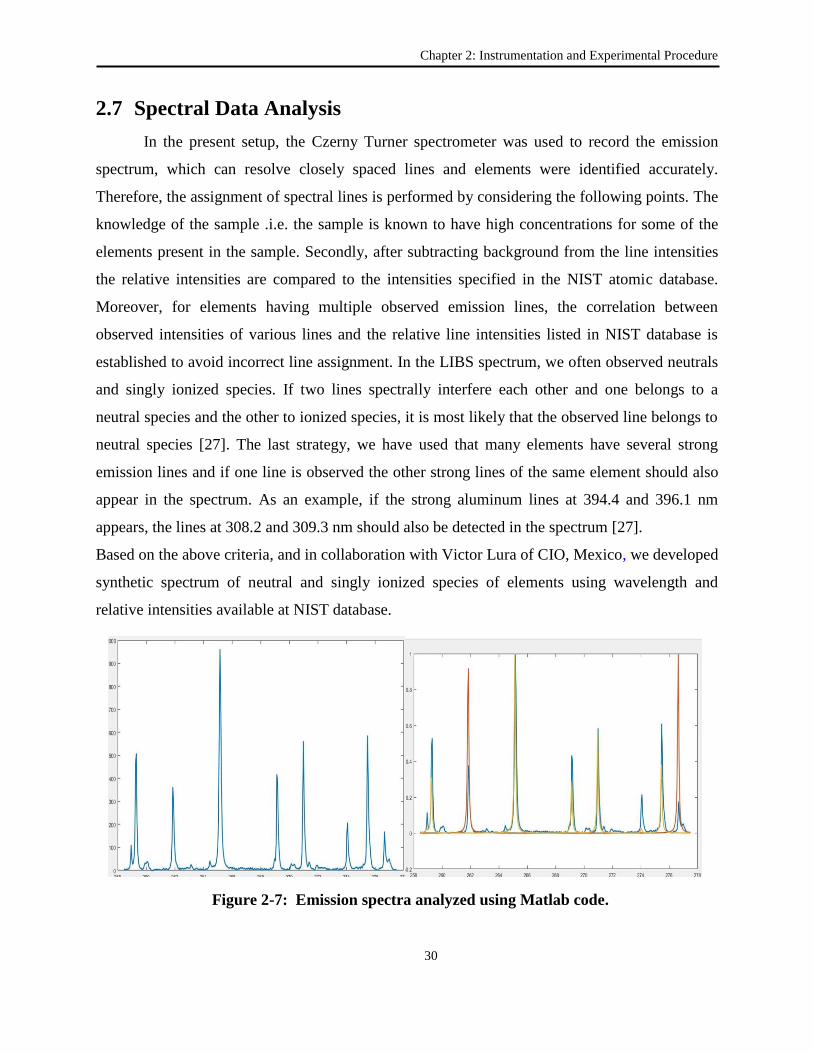
Chapter 2: Instrumentation and Experimental Procedure
30
2.7 Spectral Data Analysis
In the present setup, the Czerny Turner spectrometer was used to record the emission
spectrum, which can resolve closely spaced lines and elements were identified accurately.
Therefore, the assignment of spectral lines is performed by considering the following points. The
knowledge of the sample .i.e. the sample is known to have high concentrations for some of the
elements present in the sample. Secondly, after subtracting background from the line intensities
the relative intensities are compared to the intensities specified in the NIST atomic database.
Moreover, for elements having multiple observed emission lines, the correlation between
observed intensities of various lines and the relative line intensities listed in NIST database is
established to avoid incorrect line assignment. In the LIBS spectrum, we often observed neutrals
and singly ionized species. If two lines spectrally interfere each other and one belongs to a
neutral species and the other to ionized species, it is most likely that the observed line belongs to
neutral species [27]. The last strategy, we have used that many elements have several strong
emission lines and if one line is observed the other strong lines of the same element should also
appear in the spectrum. As an example, if the strong aluminum lines at 394.4 and 396.1 nm
appears, the lines at 308.2 and 309.3 nm should also be detected in the spectrum [27].
Based on the above criteria, and in collaboration with Victor Lura of CIO, Mexico, we developed
synthetic spectrum of neutral and singly ionized species of elements using wavelength and
relative intensities available at NIST database.
Figure 2-7: Emission spectra analyzed using Matlab code.
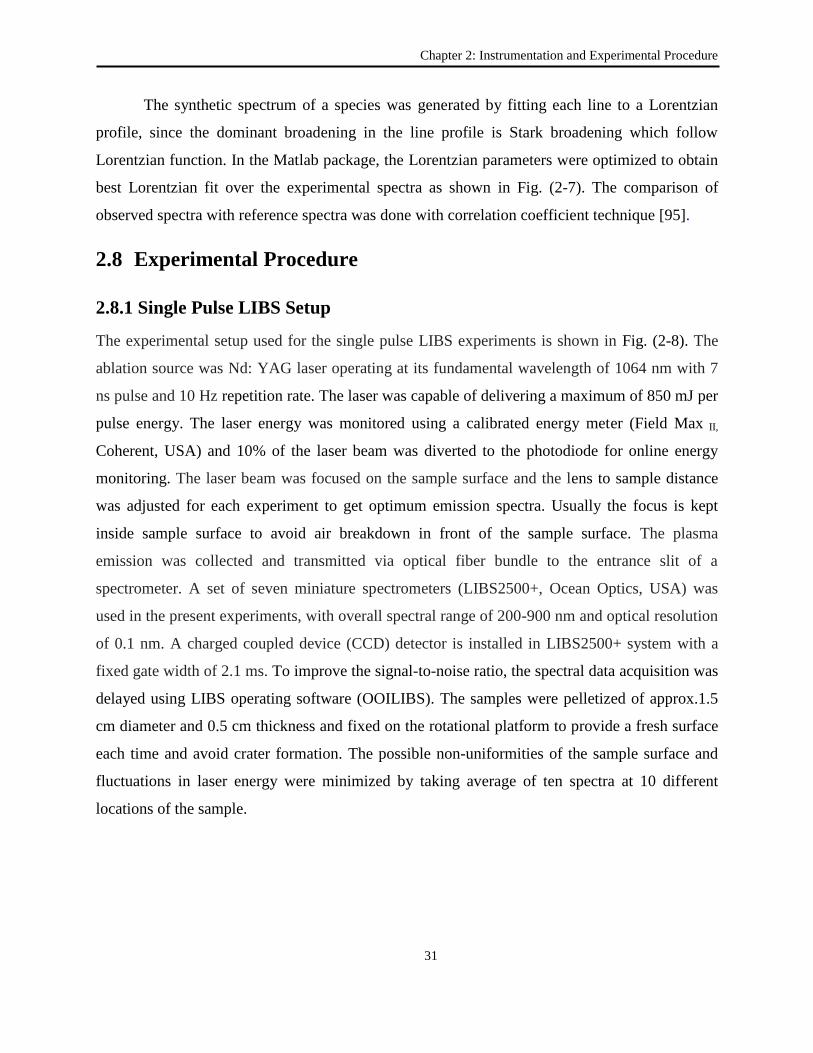
Chapter 2: Instrumentation and Experimental Procedure
31
The synthetic spectrum of a species was generated by fitting each line to a Lorentzian
profile, since the dominant broadening in the line profile is Stark broadening which follow
Lorentzian function. In the Matlab package, the Lorentzian parameters were optimized to obtain
best Lorentzian fit over the experimental spectra as shown in Fig. (2-7). The comparison of
observed spectra with reference spectra was done with correlation coefficient technique [95].
2.8 Experimental Procedure
2.8.1 Single Pulse LIBS Setup
The experimental setup used for the single pulse LIBS experiments is shown in Fig. (2-8). The
ablation source was Nd: YAG laser operating at its fundamental wavelength of 1064 nm with 7
ns pulse and 10 Hz repetition rate. The laser was capable of delivering a maximum of 850 mJ per
pulse energy. The laser energy was monitored using a calibrated energy meter (Field Max II,
Coherent, USA) and 10% of the laser beam was diverted to the photodiode for online energy
monitoring. The laser beam was focused on the sample surface and the lens to sample distance
was adjusted for each experiment to get optimum emission spectra. Usually the focus is kept
inside sample surface to avoid air breakdown in front of the sample surface. The plasma
emission was collected and transmitted via optical fiber bundle to the entrance slit of a
spectrometer. A set of seven miniature spectrometers (LIBS2500+, Ocean Optics, USA) was
used in the present experiments, with overall spectral range of 200-900 nm and optical resolution
of 0.1 nm. A charged coupled device (CCD) detector is installed in LIBS2500+ system with a
fixed gate width of 2.1 ms. To improve the signal-to-noise ratio, the spectral data acquisition was
delayed using LIBS operating software (OOILIBS). The samples were pelletized of approx.1.5
cm diameter and 0.5 cm thickness and fixed on the rotational platform to provide a fresh surface
each time and avoid crater formation. The possible non-uniformities of the sample surface and
fluctuations in laser energy were minimized by taking average of ten spectra at 10 different
locations of the sample.
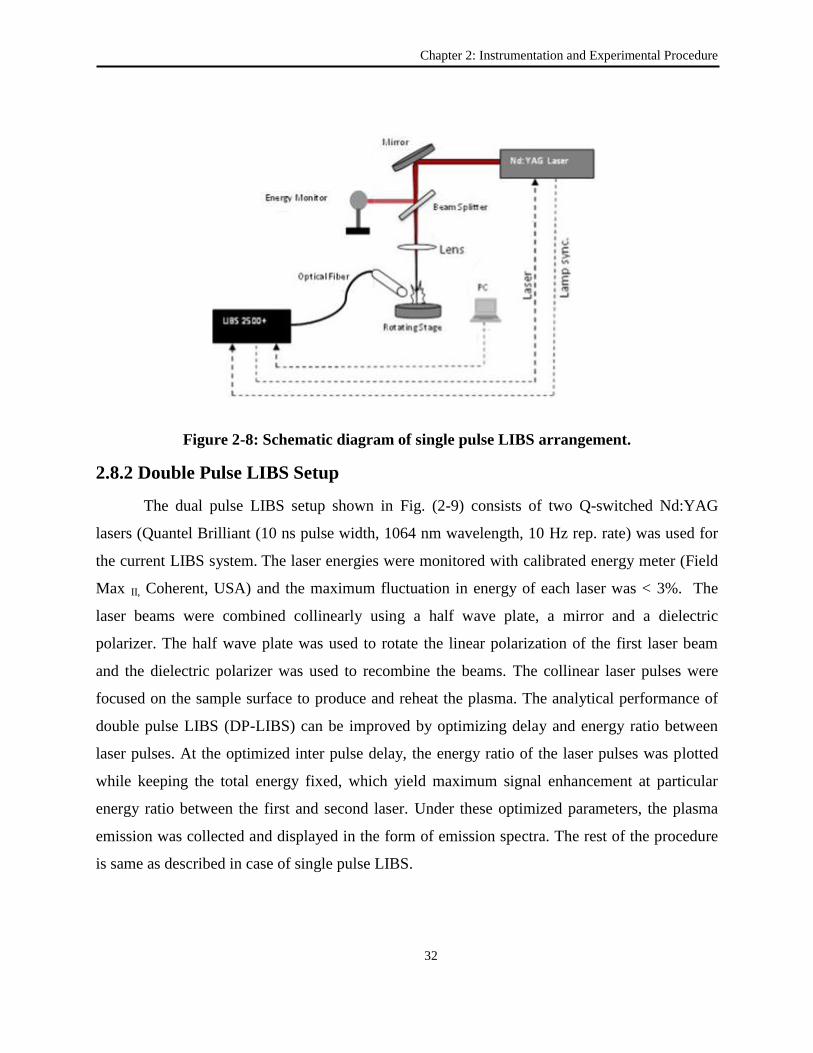
Chapter 2: Instrumentation and Experimental Procedure
32
Figure 2-8: Schematic diagram of single pulse LIBS arrangement.
2.8.2 Double Pulse LIBS Setup
The dual pulse LIBS setup shown in Fig. (2-9) consists of two Q-switched Nd:YAG
lasers (Quantel Brilliant (10 ns pulse width, 1064 nm wavelength, 10 Hz rep. rate) was used for
the current LIBS system. The laser energies were monitored with calibrated energy meter (Field
Max II, Coherent, USA) and the maximum fluctuation in energy of each laser was < 3%. The
laser beams were combined collinearly using a half wave plate, a mirror and a dielectric
polarizer. The half wave plate was used to rotate the linear polarization of the first laser beam
and the dielectric polarizer was used to recombine the beams. The collinear laser pulses were
focused on the sample surface to produce and reheat the plasma. The analytical performance of
double pulse LIBS (DP-LIBS) can be improved by optimizing delay and energy ratio between
laser pulses. At the optimized inter pulse delay, the energy ratio of the laser pulses was plotted
while keeping the total energy fixed, which yield maximum signal enhancement at particular
energy ratio between the first and second laser. Under these optimized parameters, the plasma
emission was collected and displayed in the form of emission spectra. The rest of the procedure
is same as described in case of single pulse LIBS.
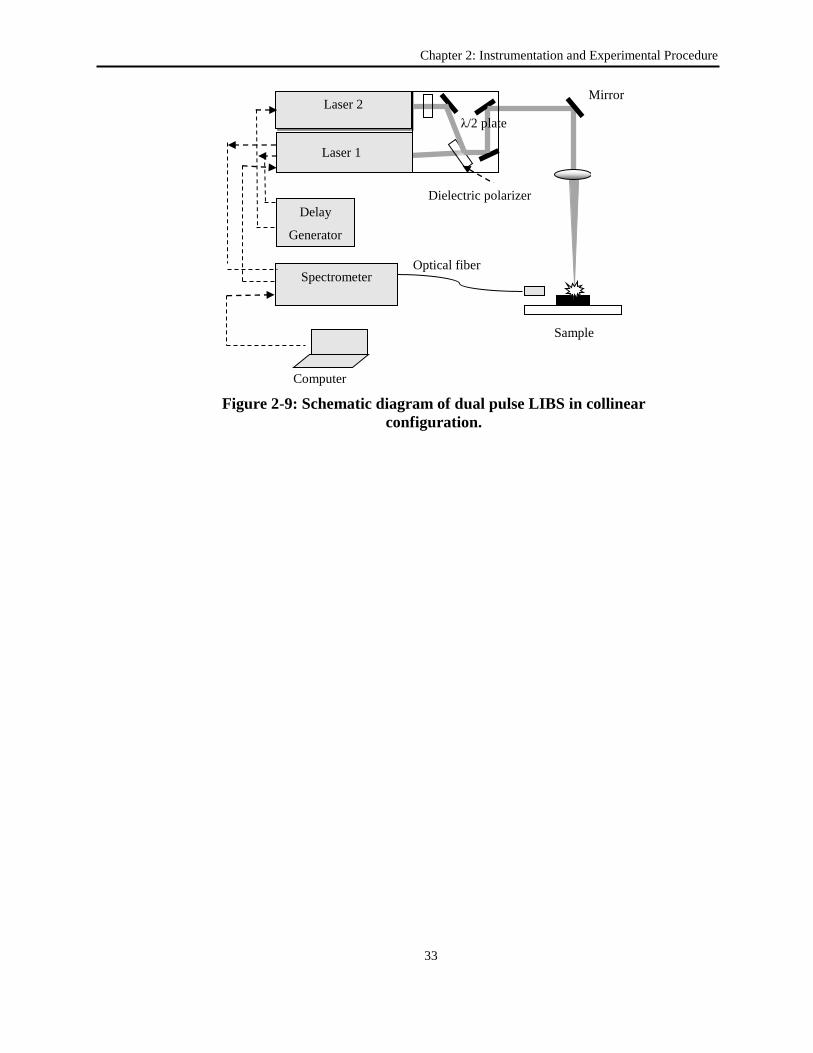
Chapter 2: Instrumentation and Experimental Procedure
33
Laser 2
λ/2 plate
Laser 1
Dielectric polarizer
Mirror
Optical fiber
L
Sample
Spectrometer
Computer
Delay
Generator
Figure 2-9: Schematic diagram of dual pulse LIBS in collinear
configuration.
34
Chapter 3
Spectroscopic Characterization of Laser Induced 3
Plasma
3.1 Introduction
The dynamics of laser produced plasma with respect to the experimental conditions is of great
importance in understanding plasma dynamics and in setting up the experimental conditions for
optimum performance [96]. These conditions can best be evaluated by determining electron
temperature and number density. Silicon has important application as a solar cell and the
polycrystalline silicon ingot are directly used to grow single crystals for photovoltaic
applications. The interaction of laser with semiconductor material is a complex phenomenon and
many research papers and review articles are available on this topic [97-99]. The plasma
parameters of silicon are investigated by many groups exploiting different conditions, e.g. Liu et
al. [100] investigated the plasma parameters at the early stage of a plasma (<300 ns) at 2–80
GWcm−2
laser irradiance and observed fast increase in electron temperature, number density and
degree of ionization beyond 20 GWcm−2
. Milan and Laserna [31] characterized the silicon
plasma, spatially and temporally by estimating the electron temperatures from 6000 to 9000 K,
ionic temperatures from 12000 to 17000 K with irradiance from 0.2 to 45 GWcm−2
and electron
number density reported as ≈1018
cm−3
. Pledif and Andreif [101] reported the electron
temperature as 1.5 eV and number density 1018
cm−3
, using a nitrogen laser at 337.1 nm and
Samek et al. [102] investigated spatially and temporally the plasma produced by femtosecond
laser (775 nm, pulse duration of 170–200 fs). A more acute pulsed laser (Ti : sapphire, 100 fs
pulse duration) and Nd :YAG laser (266 nm, 3 ns pulse duration) were used to compare the
ablation efficiency via crater depth [103] and observed that fs-ablated crater was about twice as
Chapter 3: Spectroscopic Characterization of Laser Induced Plasma
35
deep as the ns-crater. Amal et al. [104] compared the plasmas of single and double pulses
produced on the surface of silicon (1 1 1). They also performed experiments at various pressure
values, but could not find any appreciable change in the electron temperature and number
density. However, the signal enhancement was observed at shorter inter-pulse delay in
comparison with single-pulse LIBS. Cowpe et al. [105] studied the temporal dynamics of silicon
plasma, produced at different values of ambient pressure and reported the electron temperature
and electron number density as 9000–21000 K and 2.79 × 10¹⁶–5.59 × 10
19 cm
−3 respectively.
3.2 Experimental Arrangement
The details of the experimental procedure to produce silicon plasma and to record the emission
spectra is described in chapter 2 and shown in Fig. (2-8). Here only the specific details of
experiment are presented. In order to produce silicon plasma, 30-200 mJ energy of the 1064 nm
of Nd: YAG laser was focused on the sample surface with a convex lens of 10 cm focal length.
The spot size at focus is approx. 300 µm which produce area of 7.1x10⁻⁴
cm2 on the sample
surface. The optical emissions were recorded using LIBS2000 spectrometer with 2.1 ms gate
width and 3.5µs detector gate delay.
The plasma parameters were investigated with laser irradiance from 9 to 33 GWcm-2
and
their spatial distribution was inferred from the emission spectra recorded at fixed laser irradiance
along the plume length up to 5 mm. In addition, the plasma parameters were also investigated at
different ambient pressure. A stainless steel vacuum chamber was fabricated having ports for
beam delivery, light collection, sample insertion and to connect with vacuum pump. All the ports
were sealed with quartz windows and the chamber was evacuated down to 10-3
mbar. The
ambient pressure inside chamber was varied in the range 8-250 mbar and the emission spectrum
of silicon was recorded.
3.3 Results and Discussion
3.3.1 The Emission Spectra
Emission spectrum of silicon shown in Fig. (3-1) was recorded using 1064 nm of a Nd: YAG
laser at 10 GWcm−2
laser irradiance. This portion of the spectra shows well-resolved silicon lines
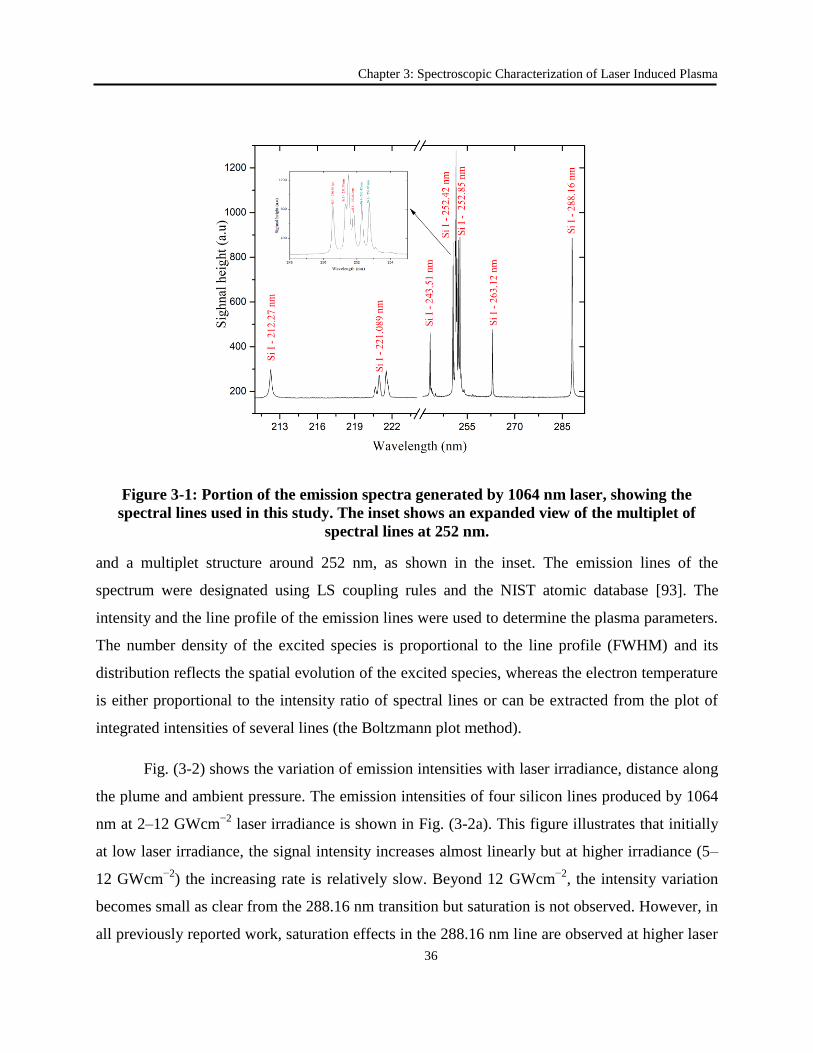
Chapter 3: Spectroscopic Characterization of Laser Induced Plasma
36
Figure 3-1: Portion of the emission spectra generated by 1064 nm laser, showing the
spectral lines used in this study. The inset shows an expanded view of the multiplet of
spectral lines at 252 nm.
and a multiplet structure around 252 nm, as shown in the inset. The emission lines of the
spectrum were designated using LS coupling rules and the NIST atomic database [93]. The
intensity and the line profile of the emission lines were used to determine the plasma parameters.
The number density of the excited species is proportional to the line profile (FWHM) and its
distribution reflects the spatial evolution of the excited species, whereas the electron temperature
is either proportional to the intensity ratio of spectral lines or can be extracted from the plot of
integrated intensities of several lines (the Boltzmann plot method).
Fig. (3-2) shows the variation of emission intensities with laser irradiance, distance along
the plume and ambient pressure. The emission intensities of four silicon lines produced by 1064
nm at 2–12 GWcm−2
laser irradiance is shown in Fig. (3-2a). This figure illustrates that initially
at low laser irradiance, the signal intensity increases almost linearly but at higher irradiance (5–
12 GWcm−2
) the increasing rate is relatively slow. Beyond 12 GWcm−2
, the intensity variation
becomes small as clear from the 288.16 nm transition but saturation is not observed. However, in
all previously reported work, saturation effects in the 288.16 nm line are observed at higher laser
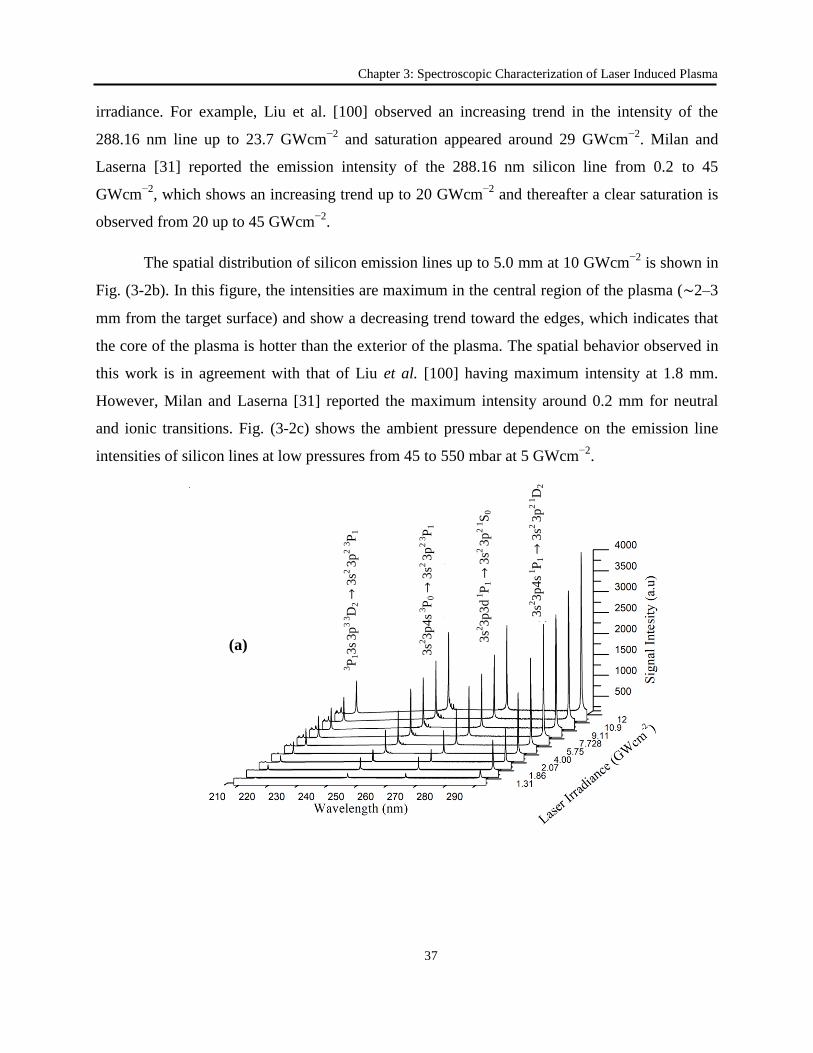
Chapter 3: Spectroscopic Characterization of Laser Induced Plasma
37
irradiance. For example, Liu et al. [100] observed an increasing trend in the intensity of the
288.16 nm line up to 23.7 GWcm−2
and saturation appeared around 29 GWcm−2
. Milan and
Laserna [31] reported the emission intensity of the 288.16 nm silicon line from 0.2 to 45
GWcm−2
, which shows an increasing trend up to 20 GWcm−2
and thereafter a clear saturation is
observed from 20 up to 45 GWcm−2
.
The spatial distribution of silicon emission lines up to 5.0 mm at 10 GWcm−2
is shown in
Fig. (3-2b). In this figure, the intensities are maximum in the central region of the plasma (∼2–3
mm from the target surface) and show a decreasing trend toward the edges, which indicates that
the core of the plasma is hotter than the exterior of the plasma. The spatial behavior observed in
this work is in agreement with that of Liu et al. [100] having maximum intensity at 1.8 mm.
However, Milan and Laserna [31] reported the maximum intensity around 0.2 mm for neutral
and ionic transitions. Fig. (3-2c) shows the ambient pressure dependence on the emission line
intensities of silicon lines at low pressures from 45 to 550 mbar at 5 GWcm−2
.
(a)
3P
13
s 3p
3 3D
2 →
3s2
3p
2 3
P1
3s2
3p
4s 3
P0 →
3s2
3p
2 3P
1
3s2
3p
4s 1
P1 →
3s2
3p
2 1D
2
3s2
3p
3d
1P
1 →
3s2
3p
2 1S
0
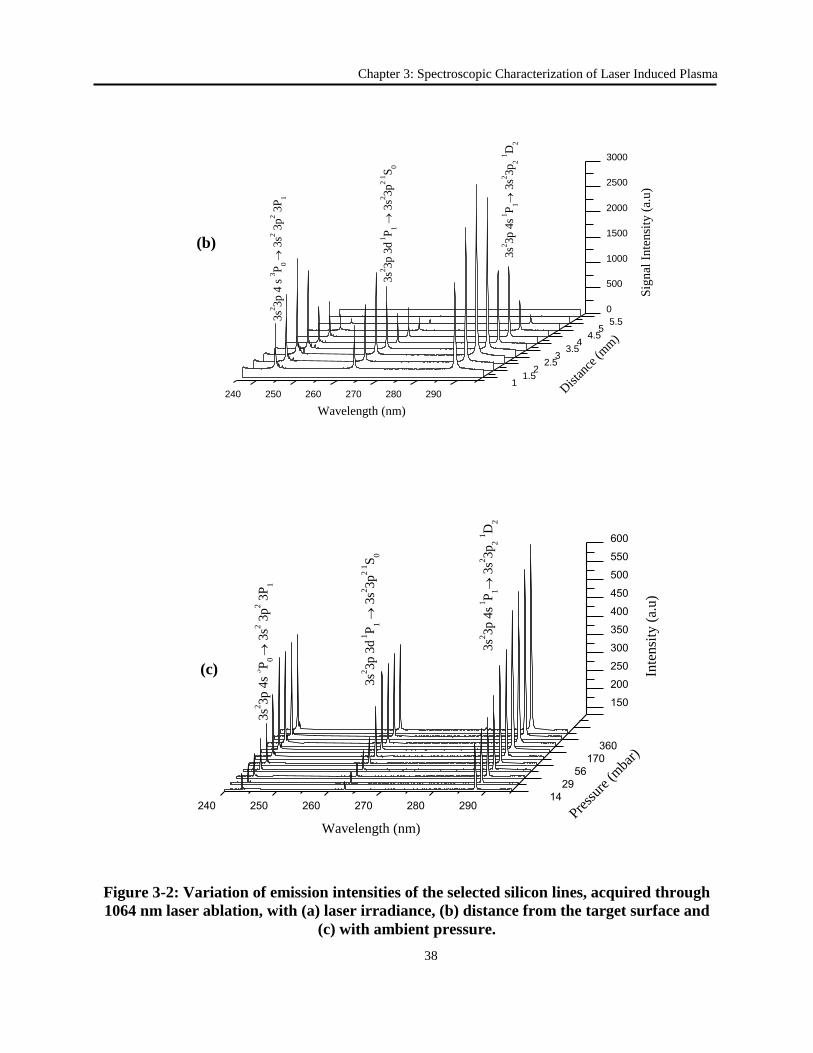
Chapter 3: Spectroscopic Characterization of Laser Induced Plasma
38
240 250 260 270 280 290
0
500
1000
1500
2000
2500
3000
5.55
4.54
3.53
2.52
1.51
3s2
3p 4
s 3
P0
3
s2 3
p2 3
P1
3s2
3p 3
d 1P
1
3s2
3p
2 1S
0
3s2
3p 4
s 1P
1
3s2
3p
2 1
D2
Sig
nal
In
ten
sity
(a.
u)
Dista
nce (m
m)
Wavelength (nm)
240 250 260 270 280 290
150
200
250
300
350
400
450
500
550
600
360
170
56
29
14
3s2
3p 4
s 3P
0
3s2
3p
2 3
P1
3s2
3p 4
s 1P
1
3s2
3p
2 1
D2
3s2
3p 3
d 1P
1
3s2
3p
2 1S
0
Press
ure (m
bar)
Wavelength (nm)
Inte
nsi
ty (
a.u)
Figure 3-2: Variation of emission intensities of the selected silicon lines, acquired through
1064 nm laser ablation, with (a) laser irradiance, (b) distance from the target surface and
(c) with ambient pressure.
(c)
(b)
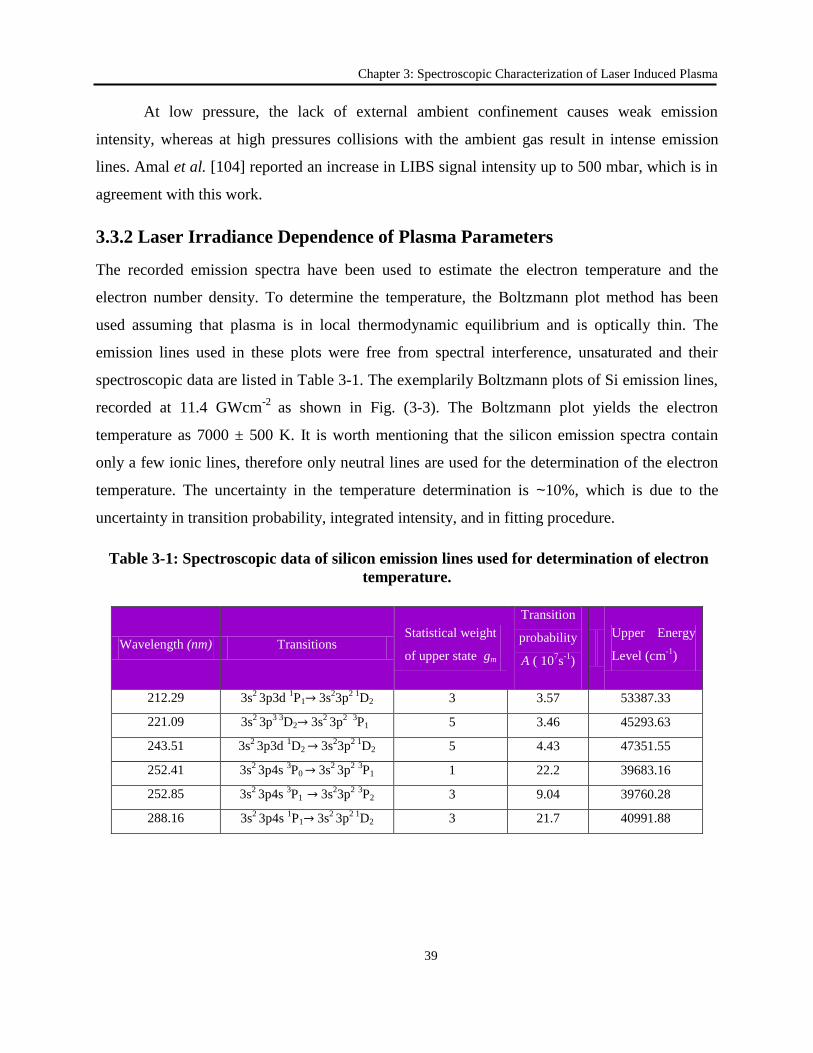
Chapter 3: Spectroscopic Characterization of Laser Induced Plasma
39
At low pressure, the lack of external ambient confinement causes weak emission
intensity, whereas at high pressures collisions with the ambient gas result in intense emission
lines. Amal et al. [104] reported an increase in LIBS signal intensity up to 500 mbar, which is in
agreement with this work.
3.3.2 Laser Irradiance Dependence of Plasma Parameters
The recorded emission spectra have been used to estimate the electron temperature and the
electron number density. To determine the temperature, the Boltzmann plot method has been
used assuming that plasma is in local thermodynamic equilibrium and is optically thin. The
emission lines used in these plots were free from spectral interference, unsaturated and their
spectroscopic data are listed in Table 3-1. The exemplarily Boltzmann plots of Si emission lines,
recorded at 11.4 GWcm-2
as shown in Fig. (3-3). The Boltzmann plot yields the electron
temperature as 7000 ± 500 K. It is worth mentioning that the silicon emission spectra contain
only a few ionic lines, therefore only neutral lines are used for the determination of the electron
temperature. The uncertainty in the temperature determination is ~10%, which is due to the
uncertainty in transition probability, integrated intensity, and in fitting procedure.
Table 3-1: Spectroscopic data of silicon emission lines used for determination of electron
temperature.
Wavelength (nm) Transitions Statistical weight
of upper state gm
Transition
probability
A ( 107s
-1)
Upper Energy
Level (cm-1
)
212.29 3s2 3p3d
1P1→ 3s
23p
2 1D2 3 3.57 53387.33
221.09 3s2 3p
3 3D2→ 3s
2 3p
2 3P1 5 3.46 45293.63
243.51 3s2 3p3d
1D2 → 3s
23p
2 1D2 5 4.43 47351.55
252.41 3s2 3p4s
3P0 → 3s
2 3p
2 3P1 1 22.2 39683.16
252.85 3s2 3p4s
3P1 → 3s
23p
2 3P2 3 9.04 39760.28
288.16 3s2 3p4s
1P1→ 3s
2 3p
2 1D2 3 21.7 40991.88
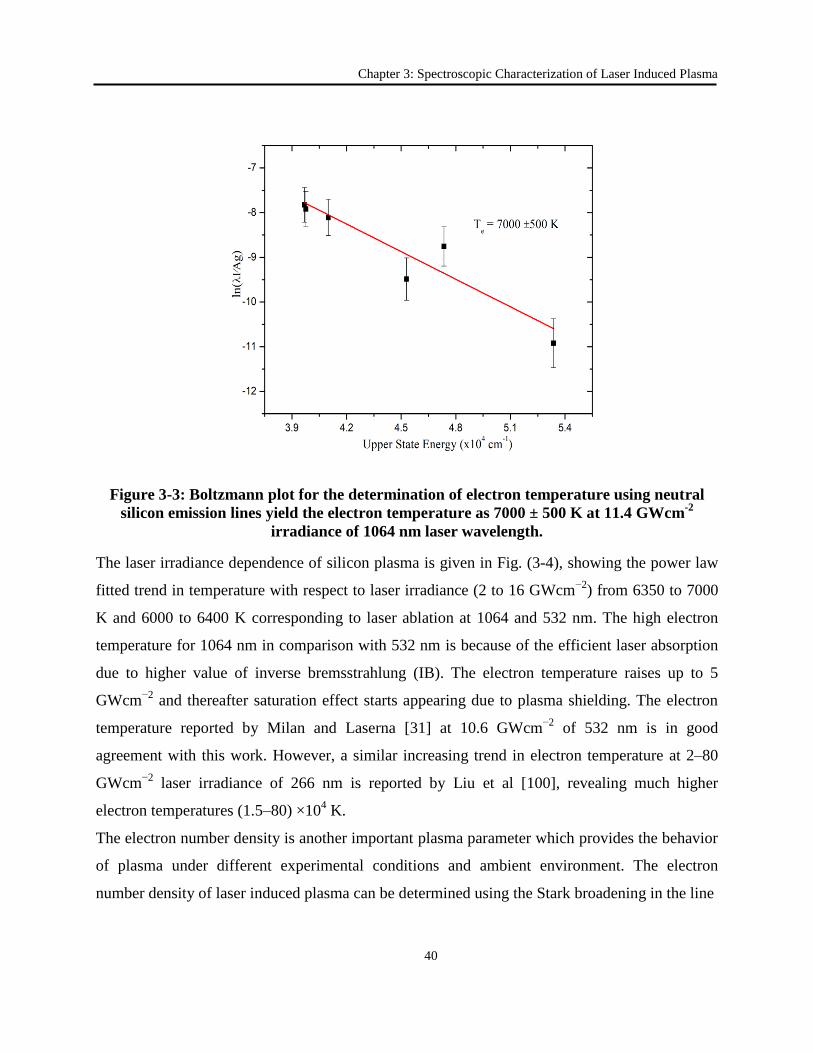
Chapter 3: Spectroscopic Characterization of Laser Induced Plasma
40
Figure 3-3: Boltzmann plot for the determination of electron temperature using neutral
silicon emission lines yield the electron temperature as 7000 ± 500 K at 11.4 GWcm-2
irradiance of 1064 nm laser wavelength.
The laser irradiance dependence of silicon plasma is given in Fig. (3-4), showing the power law
fitted trend in temperature with respect to laser irradiance (2 to 16 GWcm−2
) from 6350 to 7000
K and 6000 to 6400 K corresponding to laser ablation at 1064 and 532 nm. The high electron
temperature for 1064 nm in comparison with 532 nm is because of the efficient laser absorption
due to higher value of inverse bremsstrahlung (IB). The electron temperature raises up to 5
GWcm−2
and thereafter saturation effect starts appearing due to plasma shielding. The electron
temperature reported by Milan and Laserna [31] at 10.6 GWcm−2
of 532 nm is in good
agreement with this work. However, a similar increasing trend in electron temperature at 2–80
GWcm−2
laser irradiance of 266 nm is reported by Liu et al [100], revealing much higher
electron temperatures (1.5–80) ×104 K.
The electron number density is another important plasma parameter which provides the behavior
of plasma under different experimental conditions and ambient environment. The electron
number density of laser induced plasma can be determined using the Stark broadening in the line
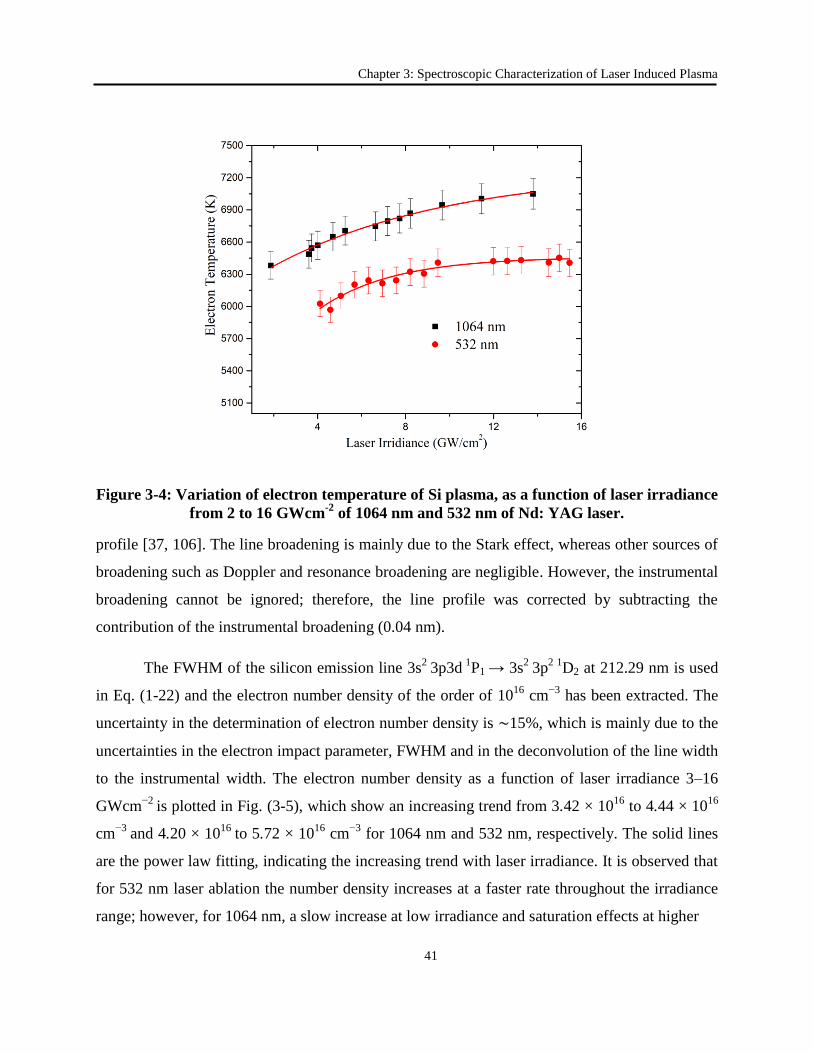
Chapter 3: Spectroscopic Characterization of Laser Induced Plasma
41
Figure 3-4: Variation of electron temperature of Si plasma, as a function of laser irradiance
from 2 to 16 GWcm-2
of 1064 nm and 532 nm of Nd: YAG laser.
profile [37, 106]. The line broadening is mainly due to the Stark effect, whereas other sources of
broadening such as Doppler and resonance broadening are negligible. However, the instrumental
broadening cannot be ignored; therefore, the line profile was corrected by subtracting the
contribution of the instrumental broadening (0.04 nm).
The FWHM of the silicon emission line 3s2
3p3d 1
P1 → 3s2
3p2 1
D2 at 212.29 nm is used
in Eq. (1-22) and the electron number density of the order of 1016
cm−3
has been extracted. The
uncertainty in the determination of electron number density is ∼15%, which is mainly due to the
uncertainties in the electron impact parameter, FWHM and in the deconvolution of the line width
to the instrumental width. The electron number density as a function of laser irradiance 3–16
GWcm−2
is plotted in Fig. (3-5), which show an increasing trend from 3.42 × 10¹⁶
to 4.44 × 10¹⁶
cm−3
and 4.20 × 10¹⁶
to 5.72 × 10¹⁶
cm−3
for 1064 nm and 532 nm, respectively. The solid lines
are the power law fitting, indicating the increasing trend with laser irradiance. It is observed that
for 532 nm laser ablation the number density increases at a faster rate throughout the irradiance
range; however, for 1064 nm, a slow increase at low irradiance and saturation effects at higher
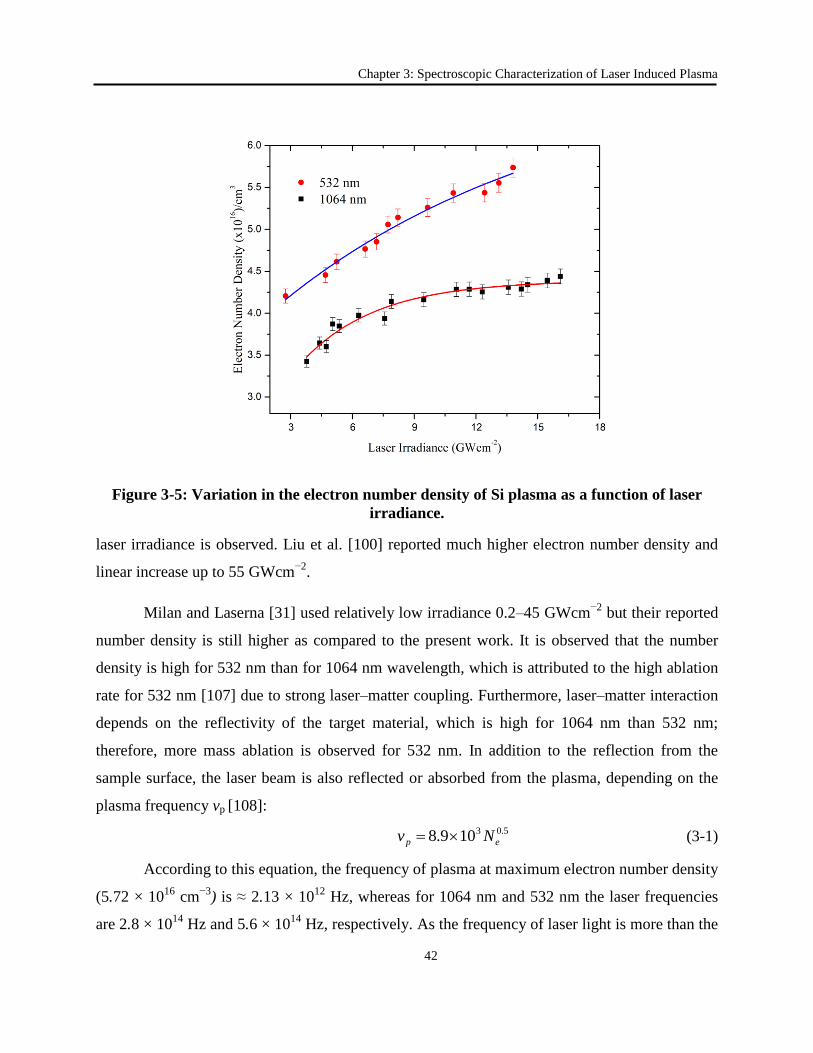
Chapter 3: Spectroscopic Characterization of Laser Induced Plasma
42
Figure 3-5: Variation in the electron number density of Si plasma as a function of laser
irradiance.
laser irradiance is observed. Liu et al. [100] reported much higher electron number density and
linear increase up to 55 GWcm−2
.
Milan and Laserna [31] used relatively low irradiance 0.2–45 GWcm−2
but their reported
number density is still higher as compared to the present work. It is observed that the number
density is high for 532 nm than for 1064 nm wavelength, which is attributed to the high ablation
rate for 532 nm [107] due to strong laser–matter coupling. Furthermore, laser–matter interaction
depends on the reflectivity of the target material, which is high for 1064 nm than 532 nm;
therefore, more mass ablation is observed for 532 nm. In addition to the reflection from the
sample surface, the laser beam is also reflected or absorbed from the plasma, depending on the
plasma frequency vp [108]:
5.03109.8 ep Nv
(3-1)
According to this equation, the frequency of plasma at maximum electron number density
(5.72 × 10¹⁶
cm−3
) is ≈ 2.13 × 10¹²
Hz, whereas for 1064 nm and 532 nm the laser frequencies
are 2.8 × 10¹⁴
Hz and 5.6 × 10¹⁴
Hz, respectively. As the frequency of laser light is more than the
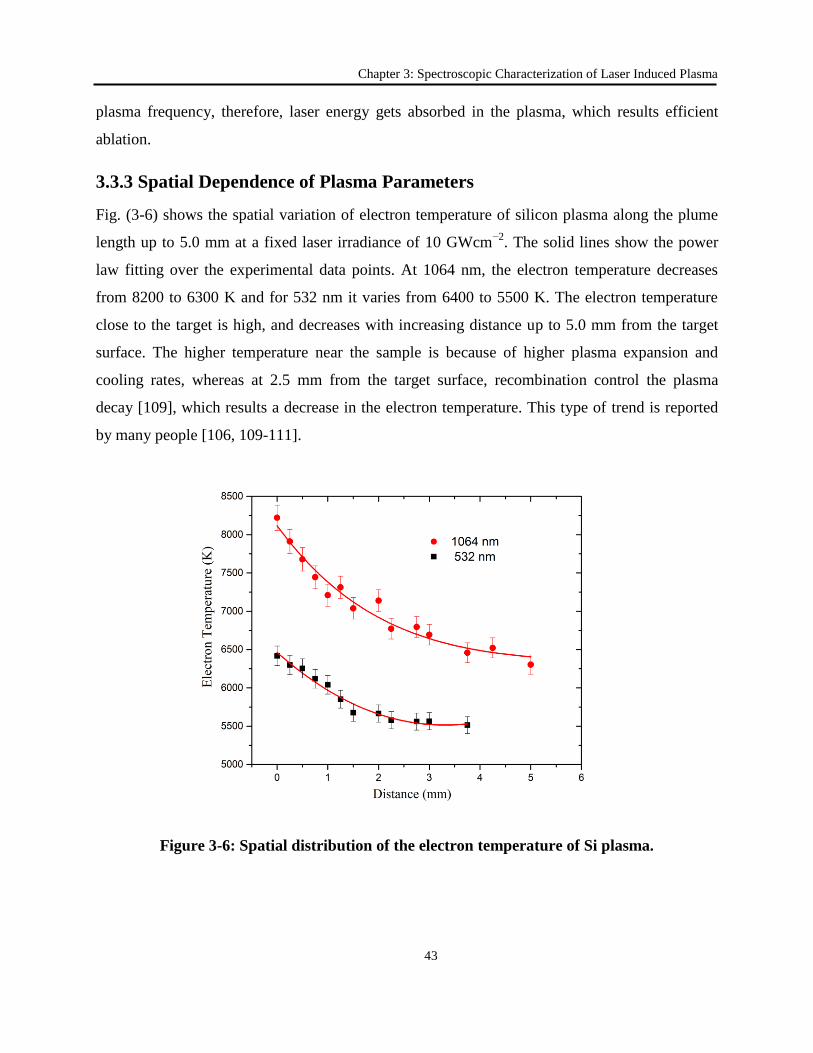
Chapter 3: Spectroscopic Characterization of Laser Induced Plasma
43
plasma frequency, therefore, laser energy gets absorbed in the plasma, which results efficient
ablation.
3.3.3 Spatial Dependence of Plasma Parameters
Fig. (3-6) shows the spatial variation of electron temperature of silicon plasma along the plume
length up to 5.0 mm at a fixed laser irradiance of 10 GWcm−2
. The solid lines show the power
law fitting over the experimental data points. At 1064 nm, the electron temperature decreases
from 8200 to 6300 K and for 532 nm it varies from 6400 to 5500 K. The electron temperature
close to the target is high, and decreases with increasing distance up to 5.0 mm from the target
surface. The higher temperature near the sample is because of higher plasma expansion and
cooling rates, whereas at 2.5 mm from the target surface, recombination control the plasma
decay [109], which results a decrease in the electron temperature. This type of trend is reported
by many people [106, 109-111].
Figure 3-6: Spatial distribution of the electron temperature of Si plasma.
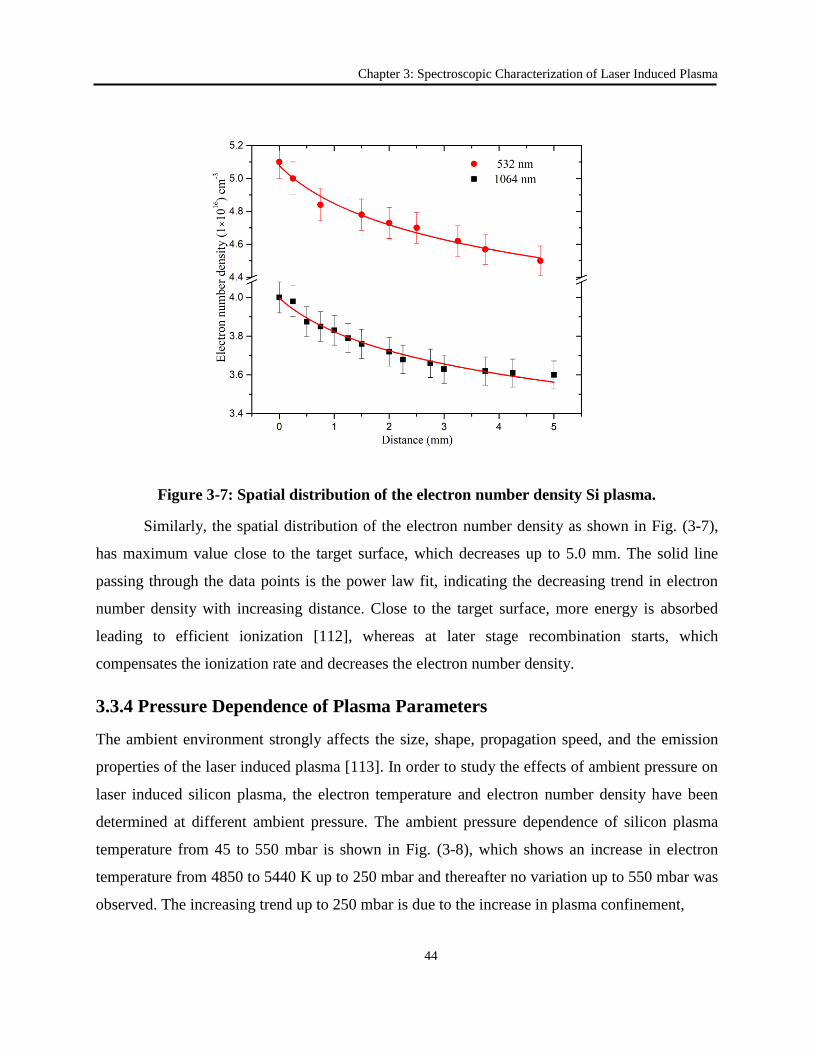
Chapter 3: Spectroscopic Characterization of Laser Induced Plasma
44
Figure 3-7: Spatial distribution of the electron number density Si plasma.
Similarly, the spatial distribution of the electron number density as shown in Fig. (3-7),
has maximum value close to the target surface, which decreases up to 5.0 mm. The solid line
passing through the data points is the power law fit, indicating the decreasing trend in electron
number density with increasing distance. Close to the target surface, more energy is absorbed
leading to efficient ionization [112], whereas at later stage recombination starts, which
compensates the ionization rate and decreases the electron number density.
3.3.4 Pressure Dependence of Plasma Parameters
The ambient environment strongly affects the size, shape, propagation speed, and the emission
properties of the laser induced plasma [113]. In order to study the effects of ambient pressure on
laser induced silicon plasma, the electron temperature and electron number density have been
determined at different ambient pressure. The ambient pressure dependence of silicon plasma
temperature from 45 to 550 mbar is shown in Fig. (3-8), which shows an increase in electron
temperature from 4850 to 5440 K up to 250 mbar and thereafter no variation up to 550 mbar was
observed. The increasing trend up to 250 mbar is due to the increase in plasma confinement,
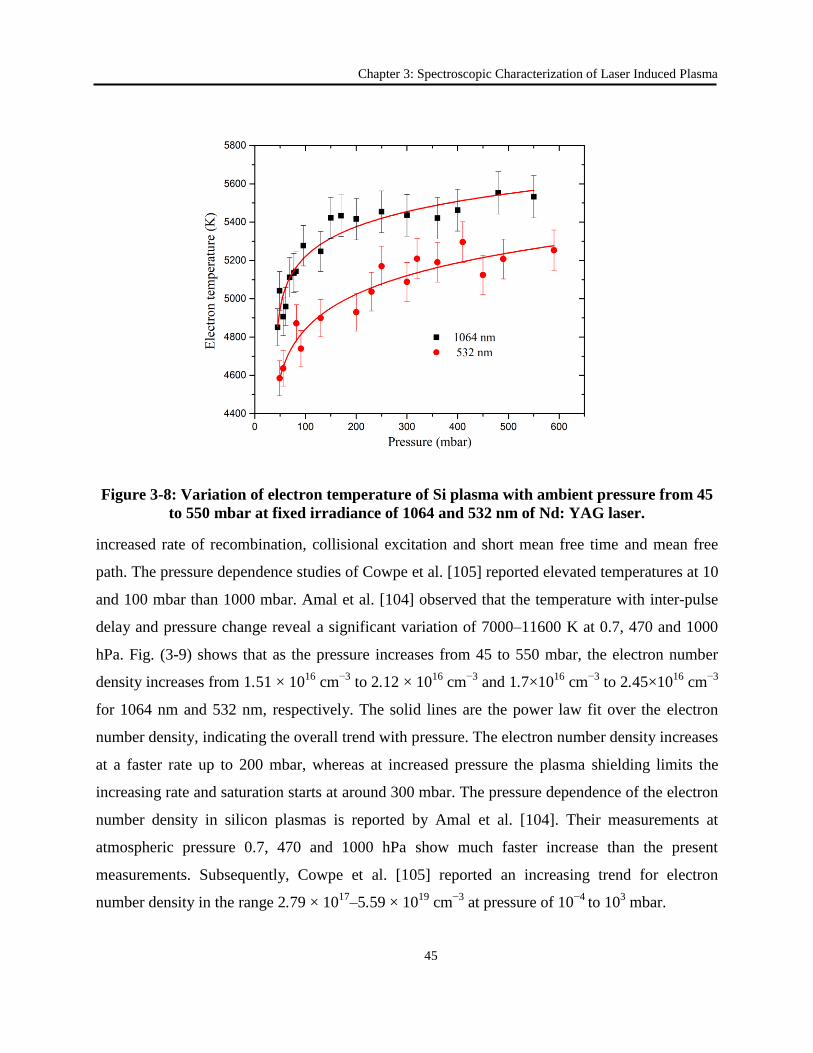
Chapter 3: Spectroscopic Characterization of Laser Induced Plasma
45
Figure 3-8: Variation of electron temperature of Si plasma with ambient pressure from 45
to 550 mbar at fixed irradiance of 1064 and 532 nm of Nd: YAG laser.
increased rate of recombination, collisional excitation and short mean free time and mean free
path. The pressure dependence studies of Cowpe et al. [105] reported elevated temperatures at 10
and 100 mbar than 1000 mbar. Amal et al. [104] observed that the temperature with inter-pulse
delay and pressure change reveal a significant variation of 7000–11600 K at 0.7, 470 and 1000
hPa. Fig. (3-9) shows that as the pressure increases from 45 to 550 mbar, the electron number
density increases from 1.51 × 10¹⁶
cm−3
to 2.12 × 10¹⁶
cm−3
and 1.7×10¹⁶
cm−3
to 2.45×10¹⁶
cm−3
for 1064 nm and 532 nm, respectively. The solid lines are the power law fit over the electron
number density, indicating the overall trend with pressure. The electron number density increases
at a faster rate up to 200 mbar, whereas at increased pressure the plasma shielding limits the
increasing rate and saturation starts at around 300 mbar. The pressure dependence of the electron
number density in silicon plasmas is reported by Amal et al. [104]. Their measurements at
atmospheric pressure 0.7, 470 and 1000 hPa show much faster increase than the present
measurements. Subsequently, Cowpe et al. [105] reported an increasing trend for electron
number density in the range 2.79 × 10¹⁷–5.59 × 10
19 cm
−3 at pressure of 10
−4 to 10
3 mbar.
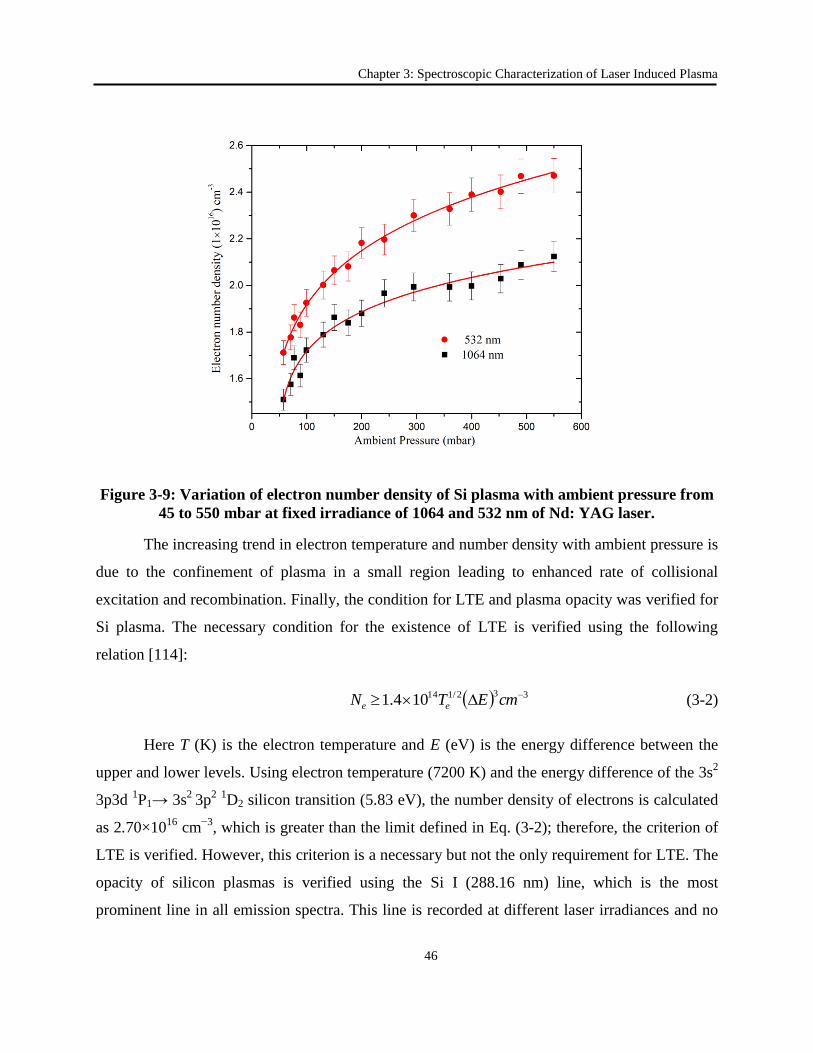
Chapter 3: Spectroscopic Characterization of Laser Induced Plasma
46
Figure 3-9: Variation of electron number density of Si plasma with ambient pressure from
45 to 550 mbar at fixed irradiance of 1064 and 532 nm of Nd: YAG laser.
The increasing trend in electron temperature and number density with ambient pressure is
due to the confinement of plasma in a small region leading to enhanced rate of collisional
excitation and recombination. Finally, the condition for LTE and plasma opacity was verified for
Si plasma. The necessary condition for the existence of LTE is verified using the following
relation [114]:
332/114104.1 cmETN ee
(3-2)
Here T (K) is the electron temperature and E (eV) is the energy difference between the
upper and lower levels. Using electron temperature (7200 K) and the energy difference of the 3s2
3p3d 1P1→ 3s
2 3p
2 1D2 silicon transition (5.83 eV), the number density of electrons is calculated
as 2.70×10¹⁶
cm−3
, which is greater than the limit defined in Eq. (3-2); therefore, the criterion of
LTE is verified. However, this criterion is a necessary but not the only requirement for LTE. The
opacity of silicon plasmas is verified using the Si I (288.16 nm) line, which is the most
prominent line in all emission spectra. This line is recorded at different laser irradiances and no
Chapter 3: Spectroscopic Characterization of Laser Induced Plasma
47
saturation effects are observed even at maximum irradiance, which confirms that the plasma
recorded in this work, is optically thin.
Germanium is also a very important semi-conductor material having various applications
as an alloying agent to enhance the refractive index of glasses and as a substrate wafers for
efficient solar cells production [115]. The laser induced germanium plasma has been produced
using 1064 of Nd: YAG laser and the emission spectra have been characterized as function of
various experimental parameters such as laser irradiance, distance from the target surface and
ambient pressure.
As the core work in the thesis is on the calibration free LIBS (CF-LIBS) analysis of
various alloys which contains silicon and germanium as major constituents. The CF-LIBS
technique requires emission line intensity and plasma parameters (plasma temperature and
electron number density) for the quantitative analysis of all species present in a sample.
Therefore, the understanding, determination and the dynamics of plasma parameters with laser
irradiance, ambient pressure and distance from the target surface are useful for CF-LIBS
analysis.
48
Chapter 4
Calibration Free Laser Induced Breakdown 4
Spectroscopy of Al-Si Alloy
4.1 Introduction
Laser induced breakdown spectroscopy (LIBS) is a well-established atomic spectroscopy
based analytical approach of all kind of samples. LIBS is considered an effective approach for
reliable multi- elemental analysis in closed contact and standoff arrangement. The quantitative
analysis is carried out either through calibration curves, constructed using standard reference
material or plasma parameters and line integrated intensities. To build calibration curves, the
matrix matching of the target and reference samples is mandatory. However, there may be
situations when matrix matching does not exist between reference samples and the sample under
study [116]. To overcome the matrix matching issue, different approaches were adopted [117-
120]. As an alternative of using reference samples and calibration curves, Ciccu et al. [121]
introduced the calibration free LIBS (CF-LIBS) technique, in which line intensity and plasma
parameters are used for the quantitative analysis of all species present in a sample. In subsequent
years, this was used for the quantitative analysis of precious alloys [122], metallic alloys [123-
126], non-metallic alloys, and soil samples [116, 124, 127]. Tognoni et al. [128]
comprehensively reviewed the basic idea of calibration free LIBS and its application in various
fields and suggested that CF-LIBS is more accurate in analyzing metallic alloys than dielectrics.
CF-LIBS has some limitations and approximations such as stoichiometric ablation, validity of
locally in thermodynamic equilibrium (LTE), plasma thickness, and plasma spatial homogeneity,
which have also been discussed in this review. In order to improve the accuracy, many variants
of this technique are reported in literature [129, 130], including the use of numerical procedure
[125, 131], double pulse LIBS [132], and eliminating self-absorption in the spectra, leading to
Chapter 4: Calibration Free Laser Induced Breakdown…
49
more accurate plasma temperature [133]. Unnikrishan et al. [134] used appropriate time delay
where the LTE condition is fulfilled, resulting more accurate plasma parameters and hence
accurate quantitative analysis. These efforts made the CF-LIBS approach a sufficiently reliable
quantitative analysis technique; however, more attention is needed to make it reliable than
existing analytical techniques.
The CF-LIBS technique utilizes plasma temperature and line emission intensities for the
compositional analysis of samples. The plasma parameters, particularly the temperature, provide
better understanding of the laser matter interaction and can be used for the compositional
analysis. To get accurate plasma temperature, background subtraction and self-absorption
correction in emission lines have important role. Therefore, in order to remove the self-
absorption in emission line intensities, different approaches were used, as described in first
chapter. In addition to self-absorption correction, some other experimental factors such as laser
energy, acquisition delay, and background subtraction need to be optimized for reliable
quantitative analysis. In the present work, we have used the standard Al-Si alloy for the
quantitative analysis of all the major and trace elements in a sample. The trace impurities in
silicon based alloys are important because several impurities like Fe, Cr, Ni, and Cu even at ppm
level can significantly affect the solar cell performance [135]. In 2011, Sabatino et al. [136]
determined the impurities in the metallurgical grade silicon (Mg-Si) alloy using glow discharge
mass spectrometry (GDMS). Hornackova et al. [137] determined the Si to Al molar ratio in
microporous zeolites using calibration free LIBS laser induced breakdown spectroscopy (CF-
LIBS).
The objective of the present work was to make the calibration free LIBS a more accurate
and reliable quantitative analysis technique. For this purpose, the plasma was produced at
different laser irradiance values; distance along plume length, at different delay times and the
optimized experimental conditions were deduced. Furthermore, the emission intensities of the
sample constituents were background subtracted and corrected for self-absorption. The
improvement in accuracy of CF-LIBS results due to these optimization and corrections was
investigated. The results of quantitative analysis before and after self-absorption correction were
reported with 0.3–2.2% deviation from the reference data.
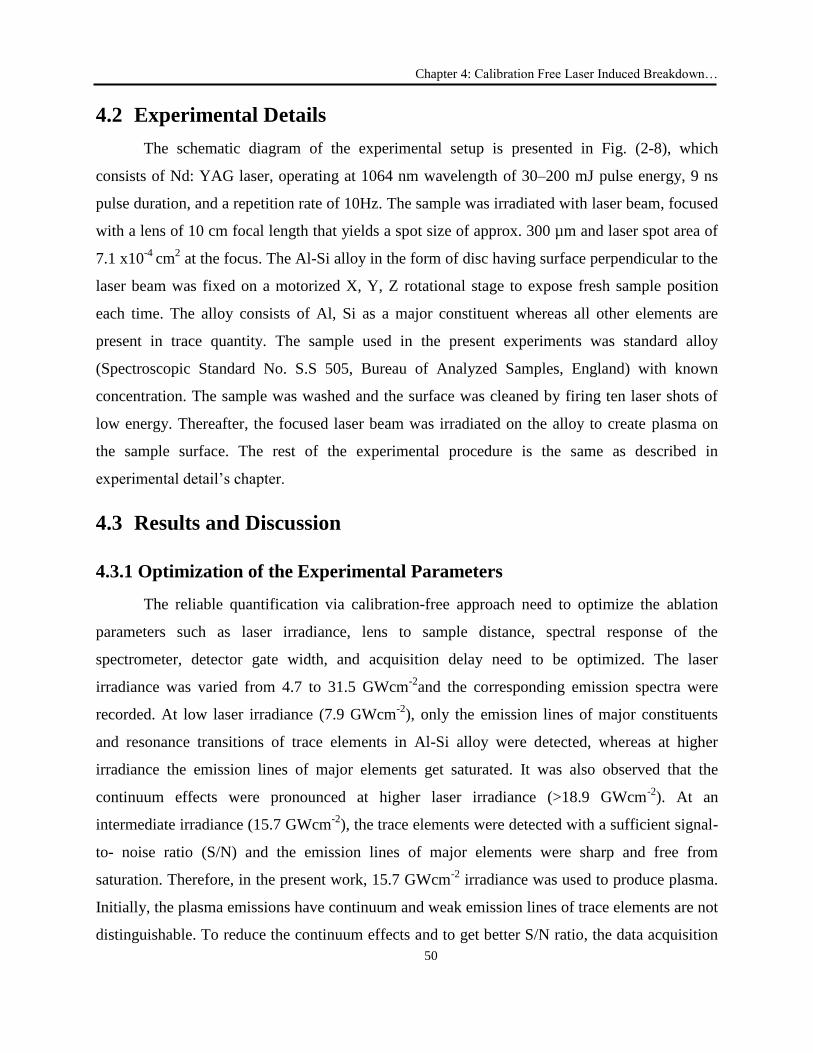
Chapter 4: Calibration Free Laser Induced Breakdown…
50
4.2 Experimental Details
The schematic diagram of the experimental setup is presented in Fig. (2-8), which
consists of Nd: YAG laser, operating at 1064 nm wavelength of 30–200 mJ pulse energy, 9 ns
pulse duration, and a repetition rate of 10Hz. The sample was irradiated with laser beam, focused
with a lens of 10 cm focal length that yields a spot size of approx. 300 µm and laser spot area of
7.1 x10⁻⁴
cm2 at the focus. The Al-Si alloy in the form of disc having surface perpendicular to the
laser beam was fixed on a motorized X, Y, Z rotational stage to expose fresh sample position
each time. The alloy consists of Al, Si as a major constituent whereas all other elements are
present in trace quantity. The sample used in the present experiments was standard alloy
(Spectroscopic Standard No. S.S 505, Bureau of Analyzed Samples, England) with known
concentration. The sample was washed and the surface was cleaned by firing ten laser shots of
low energy. Thereafter, the focused laser beam was irradiated on the alloy to create plasma on
the sample surface. The rest of the experimental procedure is the same as described in
experimental detail’s chapter.
4.3 Results and Discussion
4.3.1 Optimization of the Experimental Parameters
The reliable quantification via calibration-free approach need to optimize the ablation
parameters such as laser irradiance, lens to sample distance, spectral response of the
spectrometer, detector gate width, and acquisition delay need to be optimized. The laser
irradiance was varied from 4.7 to 31.5 GWcm-2
and the corresponding emission spectra were
recorded. At low laser irradiance (7.9 GWcm-2
), only the emission lines of major constituents
and resonance transitions of trace elements in Al-Si alloy were detected, whereas at higher
irradiance the emission lines of major elements get saturated. It was also observed that the
continuum effects were pronounced at higher laser irradiance (>18.9 GWcm-2
). At an
intermediate irradiance (15.7 GWcm-2
), the trace elements were detected with a sufficient signal-
to- noise ratio (S/N) and the emission lines of major elements were sharp and free from
saturation. Therefore, in the present work, 15.7 GWcm-2
irradiance was used to produce plasma.
Initially, the plasma emissions have continuum and weak emission lines of trace elements are not
distinguishable. To reduce the continuum effects and to get better S/N ratio, the data acquisition
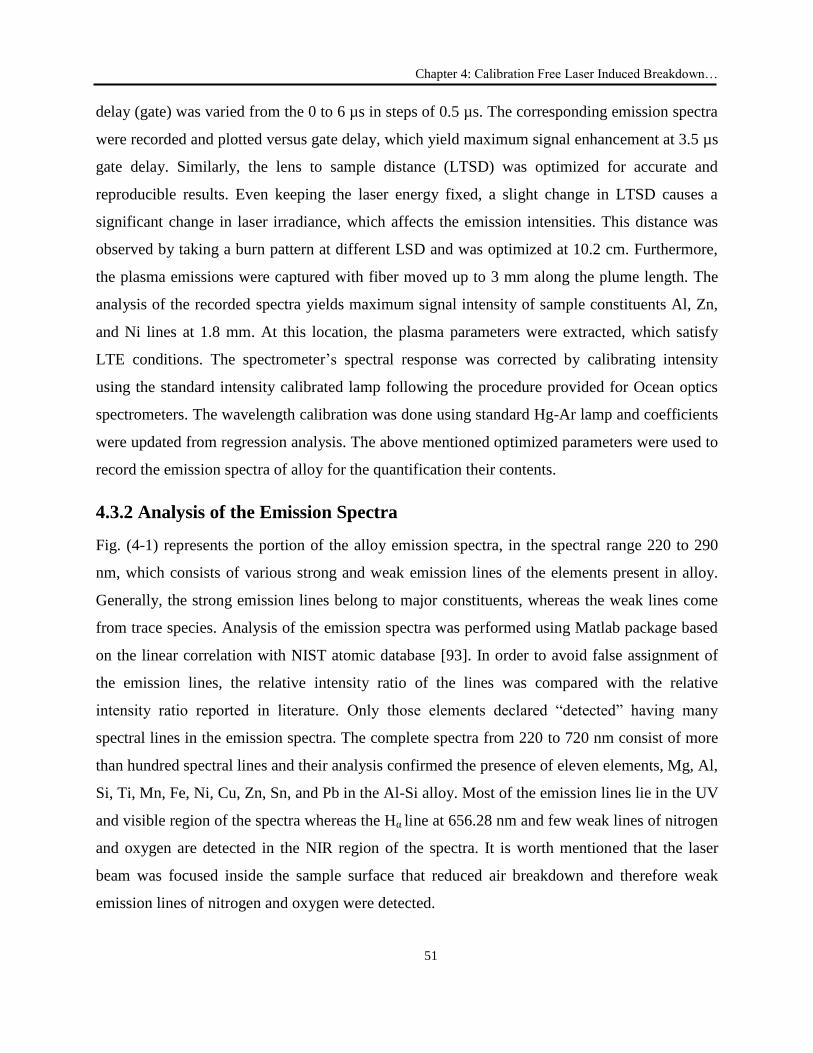
Chapter 4: Calibration Free Laser Induced Breakdown…
51
delay (gate) was varied from the 0 to 6 µs in steps of 0.5 µs. The corresponding emission spectra
were recorded and plotted versus gate delay, which yield maximum signal enhancement at 3.5 µs
gate delay. Similarly, the lens to sample distance (LTSD) was optimized for accurate and
reproducible results. Even keeping the laser energy fixed, a slight change in LTSD causes a
significant change in laser irradiance, which affects the emission intensities. This distance was
observed by taking a burn pattern at different LSD and was optimized at 10.2 cm. Furthermore,
the plasma emissions were captured with fiber moved up to 3 mm along the plume length. The
analysis of the recorded spectra yields maximum signal intensity of sample constituents Al, Zn,
and Ni lines at 1.8 mm. At this location, the plasma parameters were extracted, which satisfy
LTE conditions. The spectrometer’s spectral response was corrected by calibrating intensity
using the standard intensity calibrated lamp following the procedure provided for Ocean optics
spectrometers. The wavelength calibration was done using standard Hg-Ar lamp and coefficients
were updated from regression analysis. The above mentioned optimized parameters were used to
record the emission spectra of alloy for the quantification their contents.
4.3.2 Analysis of the Emission Spectra
Fig. (4-1) represents the portion of the alloy emission spectra, in the spectral range 220 to 290
nm, which consists of various strong and weak emission lines of the elements present in alloy.
Generally, the strong emission lines belong to major constituents, whereas the weak lines come
from trace species. Analysis of the emission spectra was performed using Matlab package based
on the linear correlation with NIST atomic database [93]. In order to avoid false assignment of
the emission lines, the relative intensity ratio of the lines was compared with the relative
intensity ratio reported in literature. Only those elements declared “detected” having many
spectral lines in the emission spectra. The complete spectra from 220 to 720 nm consist of more
than hundred spectral lines and their analysis confirmed the presence of eleven elements, Mg, Al,
Si, Ti, Mn, Fe, Ni, Cu, Zn, Sn, and Pb in the Al-Si alloy. Most of the emission lines lie in the UV
and visible region of the spectra whereas the Hα line at 656.28 nm and few weak lines of nitrogen
and oxygen are detected in the NIR region of the spectra. It is worth mentioned that the laser
beam was focused inside the sample surface that reduced air breakdown and therefore weak
emission lines of nitrogen and oxygen were detected.
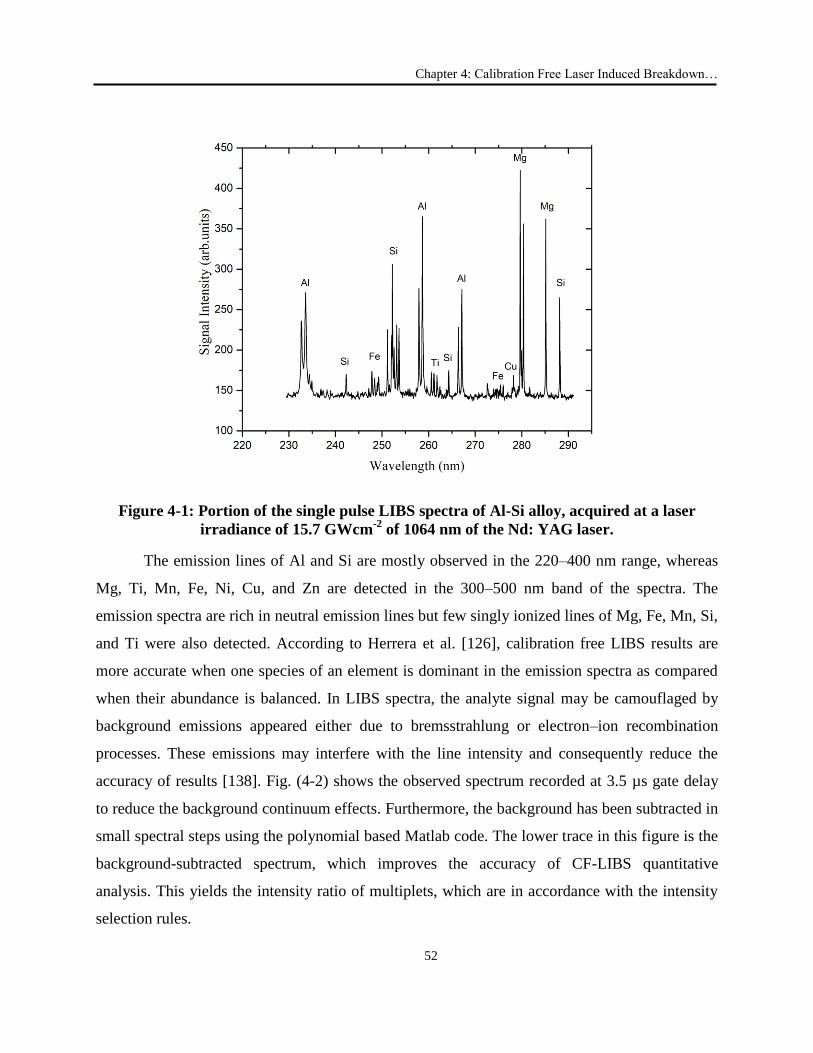
Chapter 4: Calibration Free Laser Induced Breakdown…
52
Figure 4-1: Portion of the single pulse LIBS spectra of Al-Si alloy, acquired at a laser
irradiance of 15.7 GWcm-2
of 1064 nm of the Nd: YAG laser.
The emission lines of Al and Si are mostly observed in the 220–400 nm range, whereas
Mg, Ti, Mn, Fe, Ni, Cu, and Zn are detected in the 300–500 nm band of the spectra. The
emission spectra are rich in neutral emission lines but few singly ionized lines of Mg, Fe, Mn, Si,
and Ti were also detected. According to Herrera et al. [126], calibration free LIBS results are
more accurate when one species of an element is dominant in the emission spectra as compared
when their abundance is balanced. In LIBS spectra, the analyte signal may be camouflaged by
background emissions appeared either due to bremsstrahlung or electron–ion recombination
processes. These emissions may interfere with the line intensity and consequently reduce the
accuracy of results [138]. Fig. (4-2) shows the observed spectrum recorded at 3.5 µs gate delay
to reduce the background continuum effects. Furthermore, the background has been subtracted in
small spectral steps using the polynomial based Matlab code. The lower trace in this figure is the
background-subtracted spectrum, which improves the accuracy of CF-LIBS quantitative
analysis. This yields the intensity ratio of multiplets, which are in accordance with the intensity
selection rules.
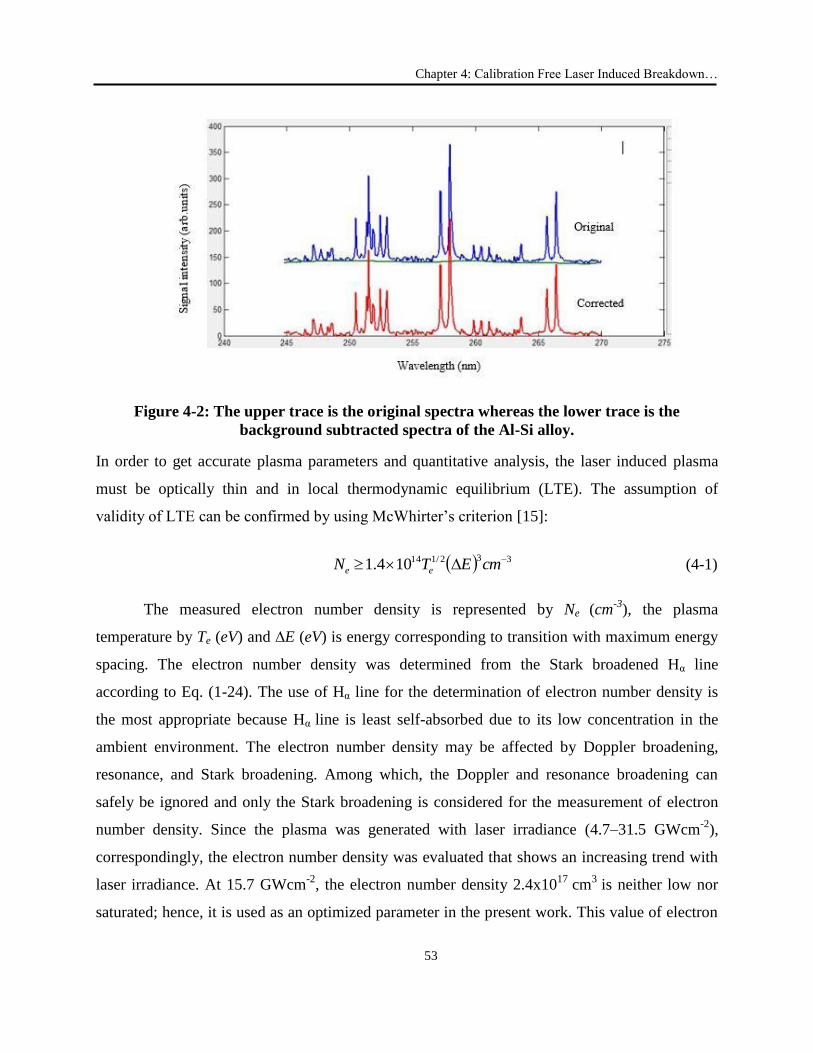
Chapter 4: Calibration Free Laser Induced Breakdown…
53
Figure 4-2: The upper trace is the original spectra whereas the lower trace is the
background subtracted spectra of the Al-Si alloy.
In order to get accurate plasma parameters and quantitative analysis, the laser induced plasma
must be optically thin and in local thermodynamic equilibrium (LTE). The assumption of
validity of LTE can be confirmed by using McWhirter’s criterion [15]:
332/114104.1 cmETN ee
(4-1)
The measured electron number density is represented by Ne (cm-3
), the plasma
temperature by Te (eV) and ∆E (eV) is energy corresponding to transition with maximum energy
spacing. The electron number density was determined from the Stark broadened Hα line
according to Eq. (1-24). The use of Hα line for the determination of electron number density is
the most appropriate because Hα line is least self-absorbed due to its low concentration in the
ambient environment. The electron number density may be affected by Doppler broadening,
resonance, and Stark broadening. Among which, the Doppler and resonance broadening can
safely be ignored and only the Stark broadening is considered for the measurement of electron
number density. Since the plasma was generated with laser irradiance (4.7–31.5 GWcm-2
),
correspondingly, the electron number density was evaluated that shows an increasing trend with
laser irradiance. At 15.7 GWcm-2
, the electron number density 2.4x10¹⁷
cm3
is neither low nor
saturated; hence, it is used as an optimized parameter in the present work. This value of electron
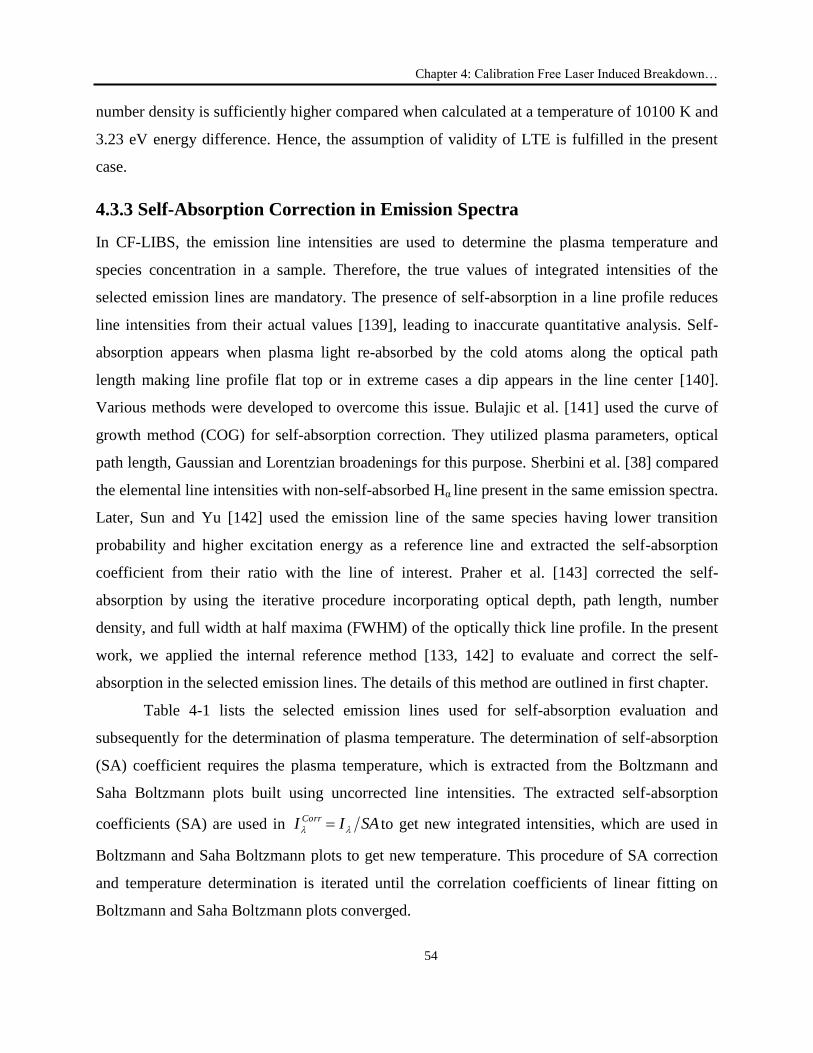
Chapter 4: Calibration Free Laser Induced Breakdown…
54
number density is sufficiently higher compared when calculated at a temperature of 10100 K and
3.23 eV energy difference. Hence, the assumption of validity of LTE is fulfilled in the present
case.
4.3.3 Self-Absorption Correction in Emission Spectra
In CF-LIBS, the emission line intensities are used to determine the plasma temperature and
species concentration in a sample. Therefore, the true values of integrated intensities of the
selected emission lines are mandatory. The presence of self-absorption in a line profile reduces
line intensities from their actual values [139], leading to inaccurate quantitative analysis. Self-
absorption appears when plasma light re-absorbed by the cold atoms along the optical path
length making line profile flat top or in extreme cases a dip appears in the line center [140].
Various methods were developed to overcome this issue. Bulajic et al. [141] used the curve of
growth method (COG) for self-absorption correction. They utilized plasma parameters, optical
path length, Gaussian and Lorentzian broadenings for this purpose. Sherbini et al. [38] compared
the elemental line intensities with non-self-absorbed Hα line present in the same emission spectra.
Later, Sun and Yu [142] used the emission line of the same species having lower transition
probability and higher excitation energy as a reference line and extracted the self-absorption
coefficient from their ratio with the line of interest. Praher et al. [143] corrected the self-
absorption by using the iterative procedure incorporating optical depth, path length, number
density, and full width at half maxima (FWHM) of the optically thick line profile. In the present
work, we applied the internal reference method [133, 142] to evaluate and correct the self-
absorption in the selected emission lines. The details of this method are outlined in first chapter.
Table 4-1 lists the selected emission lines used for self-absorption evaluation and
subsequently for the determination of plasma temperature. The determination of self-absorption
(SA) coefficient requires the plasma temperature, which is extracted from the Boltzmann and
Saha Boltzmann plots built using uncorrected line intensities. The extracted self-absorption
coefficients (SA) are used in SAII Corr
to get new integrated intensities, which are used in
Boltzmann and Saha Boltzmann plots to get new temperature. This procedure of SA correction
and temperature determination is iterated until the correlation coefficients of linear fitting on
Boltzmann and Saha Boltzmann plots converged.
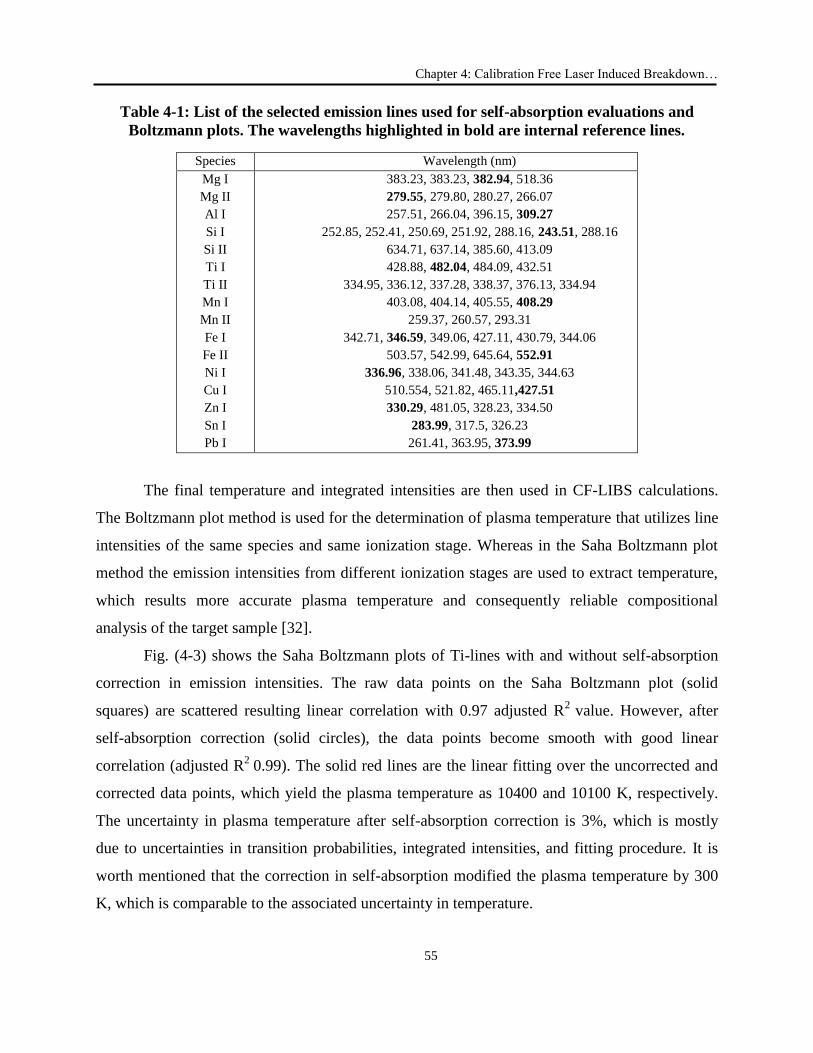
Chapter 4: Calibration Free Laser Induced Breakdown…
55
Table 4-1: List of the selected emission lines used for self-absorption evaluations and
Boltzmann plots. The wavelengths highlighted in bold are internal reference lines.
Species Wavelength (nm)
Mg I
Mg II
Al I
Si I
Si II
Ti I
Ti II
Mn I
Mn II
Fe I
Fe II
Ni I
Cu I
Zn I
Sn I
Pb I
383.23, 383.23, 382.94, 518.36
279.55, 279.80, 280.27, 266.07
257.51, 266.04, 396.15, 309.27
252.85, 252.41, 250.69, 251.92, 288.16, 243.51, 288.16
634.71, 637.14, 385.60, 413.09
428.88, 482.04, 484.09, 432.51
334.95, 336.12, 337.28, 338.37, 376.13, 334.94
403.08, 404.14, 405.55, 408.29
259.37, 260.57, 293.31
342.71, 346.59, 349.06, 427.11, 430.79, 344.06
503.57, 542.99, 645.64, 552.91
336.96, 338.06, 341.48, 343.35, 344.63
510.554, 521.82, 465.11,427.51
330.29, 481.05, 328.23, 334.50
283.99, 317.5, 326.23
261.41, 363.95, 373.99
The final temperature and integrated intensities are then used in CF-LIBS calculations.
The Boltzmann plot method is used for the determination of plasma temperature that utilizes line
intensities of the same species and same ionization stage. Whereas in the Saha Boltzmann plot
method the emission intensities from different ionization stages are used to extract temperature,
which results more accurate plasma temperature and consequently reliable compositional
analysis of the target sample [32].
Fig. (4-3) shows the Saha Boltzmann plots of Ti-lines with and without self-absorption
correction in emission intensities. The raw data points on the Saha Boltzmann plot (solid
squares) are scattered resulting linear correlation with 0.97 adjusted R2
value. However, after
self-absorption correction (solid circles), the data points become smooth with good linear
correlation (adjusted R2
0.99). The solid red lines are the linear fitting over the uncorrected and
corrected data points, which yield the plasma temperature as 10400 and 10100 K, respectively.
The uncertainty in plasma temperature after self-absorption correction is 3%, which is mostly
due to uncertainties in transition probabilities, integrated intensities, and fitting procedure. It is
worth mentioned that the correction in self-absorption modified the plasma temperature by 300
K, which is comparable to the associated uncertainty in temperature.
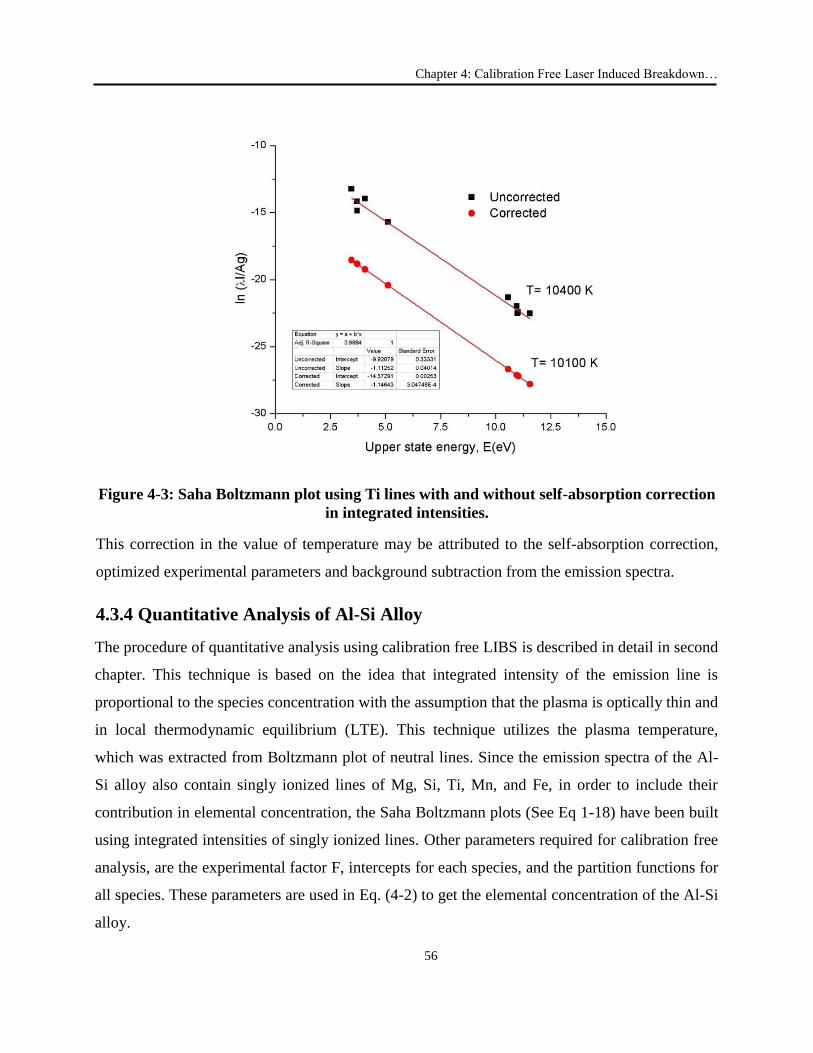
Chapter 4: Calibration Free Laser Induced Breakdown…
56
Figure 4-3: Saha Boltzmann plot using Ti lines with and without self-absorption correction
in integrated intensities.
This correction in the value of temperature may be attributed to the self-absorption correction,
optimized experimental parameters and background subtraction from the emission spectra.
4.3.4 Quantitative Analysis of Al-Si Alloy
The procedure of quantitative analysis using calibration free LIBS is described in detail in second
chapter. This technique is based on the idea that integrated intensity of the emission line is
proportional to the species concentration with the assumption that the plasma is optically thin and
in local thermodynamic equilibrium (LTE). This technique utilizes the plasma temperature,
which was extracted from Boltzmann plot of neutral lines. Since the emission spectra of the Al-
Si alloy also contain singly ionized lines of Mg, Si, Ti, Mn, and Fe, in order to include their
contribution in elemental concentration, the Saha Boltzmann plots (See Eq 1-18) have been built
using integrated intensities of singly ionized lines. Other parameters required for calibration free
analysis, are the experimental factor F, intercepts for each species, and the partition functions for
all species. These parameters are used in Eq. (4-2) to get the elemental concentration of the Al-Si
alloy.
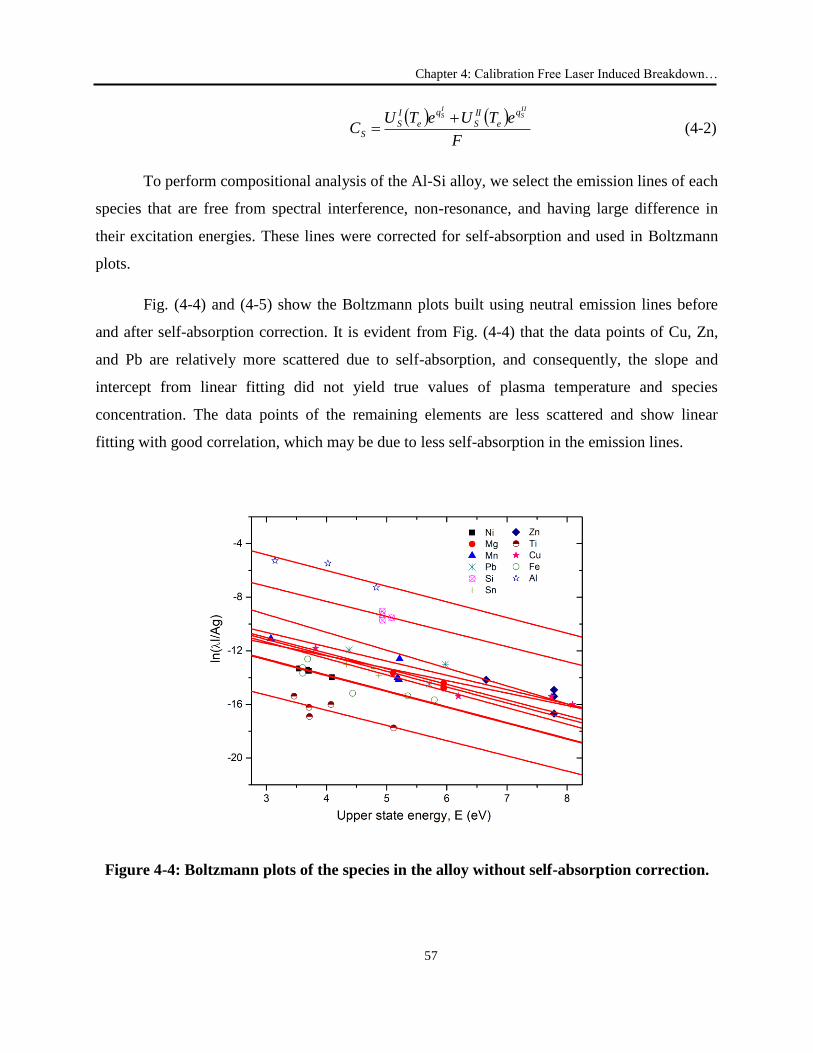
Chapter 4: Calibration Free Laser Induced Breakdown…
57
F
eTUeTUC
IIS
IS q
e
II
S
q
e
I
SS
(4-2)
To perform compositional analysis of the Al-Si alloy, we select the emission lines of each
species that are free from spectral interference, non-resonance, and having large difference in
their excitation energies. These lines were corrected for self-absorption and used in Boltzmann
plots.
Fig. (4-4) and (4-5) show the Boltzmann plots built using neutral emission lines before
and after self-absorption correction. It is evident from Fig. (4-4) that the data points of Cu, Zn,
and Pb are relatively more scattered due to self-absorption, and consequently, the slope and
intercept from linear fitting did not yield true values of plasma temperature and species
concentration. The data points of the remaining elements are less scattered and show linear
fitting with good correlation, which may be due to less self-absorption in the emission lines.
Figure 4-4: Boltzmann plots of the species in the alloy without self-absorption correction.
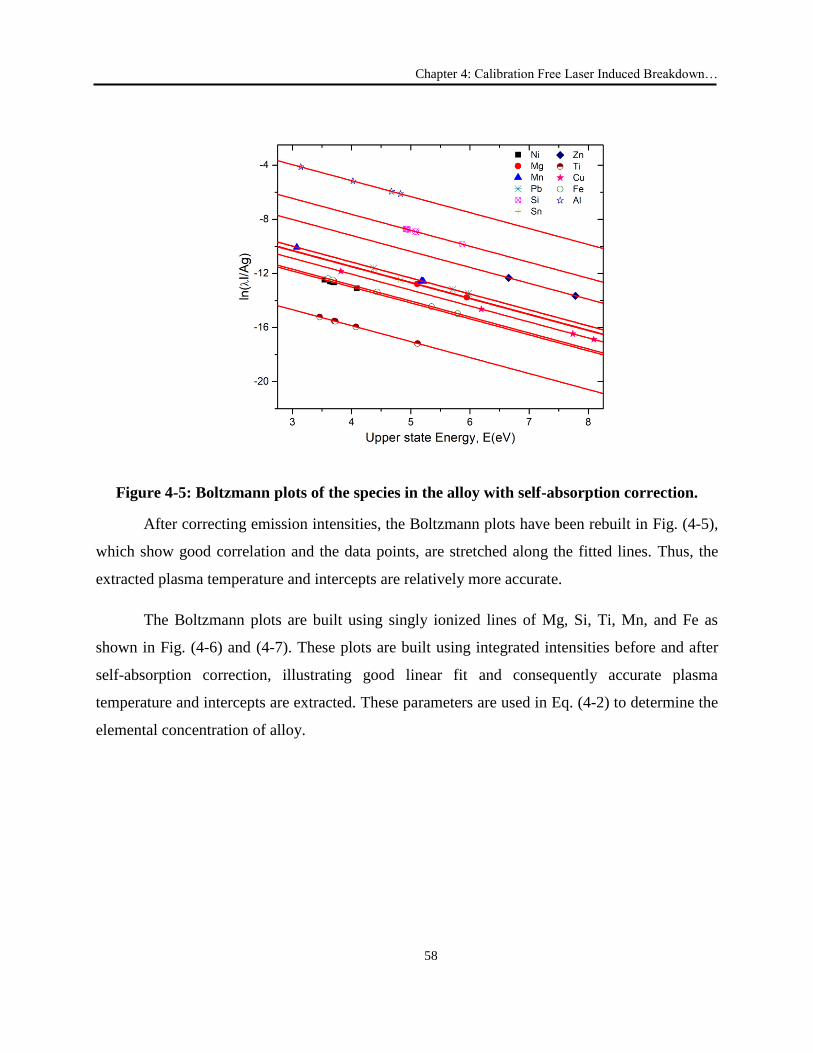
Chapter 4: Calibration Free Laser Induced Breakdown…
58
Figure 4-5: Boltzmann plots of the species in the alloy with self-absorption correction.
After correcting emission intensities, the Boltzmann plots have been rebuilt in Fig. (4-5),
which show good correlation and the data points, are stretched along the fitted lines. Thus, the
extracted plasma temperature and intercepts are relatively more accurate.
The Boltzmann plots are built using singly ionized lines of Mg, Si, Ti, Mn, and Fe as
shown in Fig. (4-6) and (4-7). These plots are built using integrated intensities before and after
self-absorption correction, illustrating good linear fit and consequently accurate plasma
temperature and intercepts are extracted. These parameters are used in Eq. (4-2) to determine the
elemental concentration of alloy.
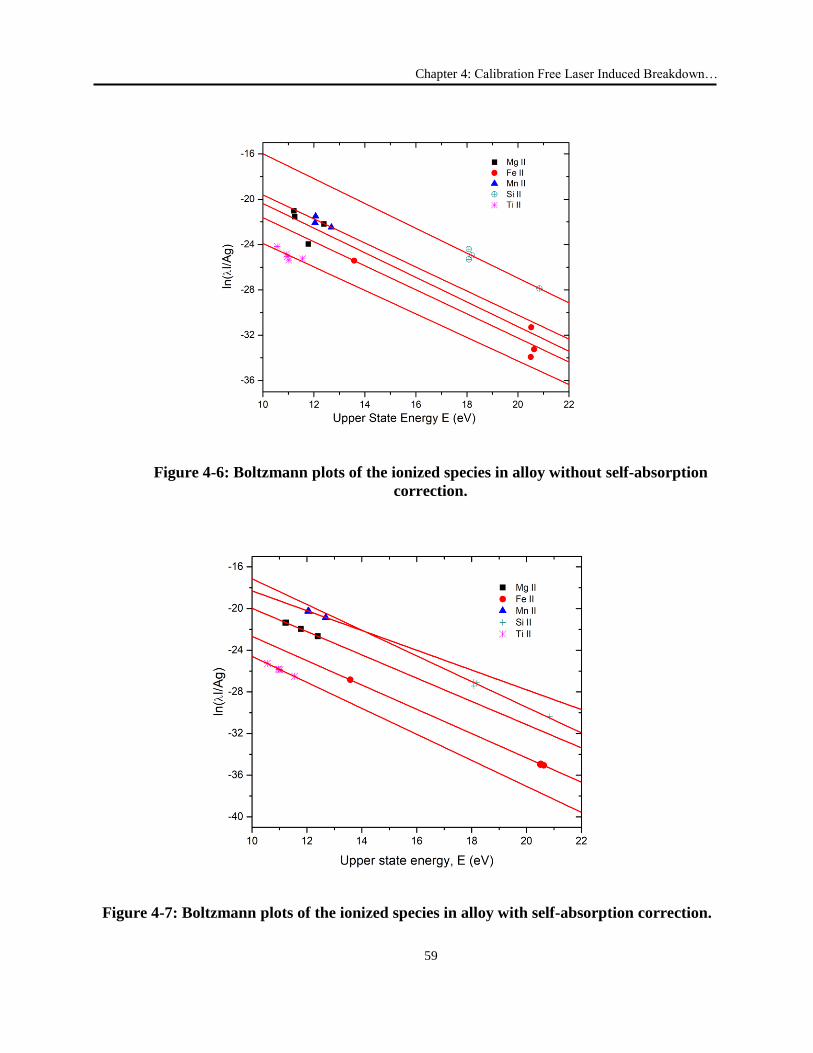
Chapter 4: Calibration Free Laser Induced Breakdown…
59
Figure 4-6: Boltzmann plots of the ionized species in alloy without self-absorption
correction.
Figure 4-7: Boltzmann plots of the ionized species in alloy with self-absorption correction.
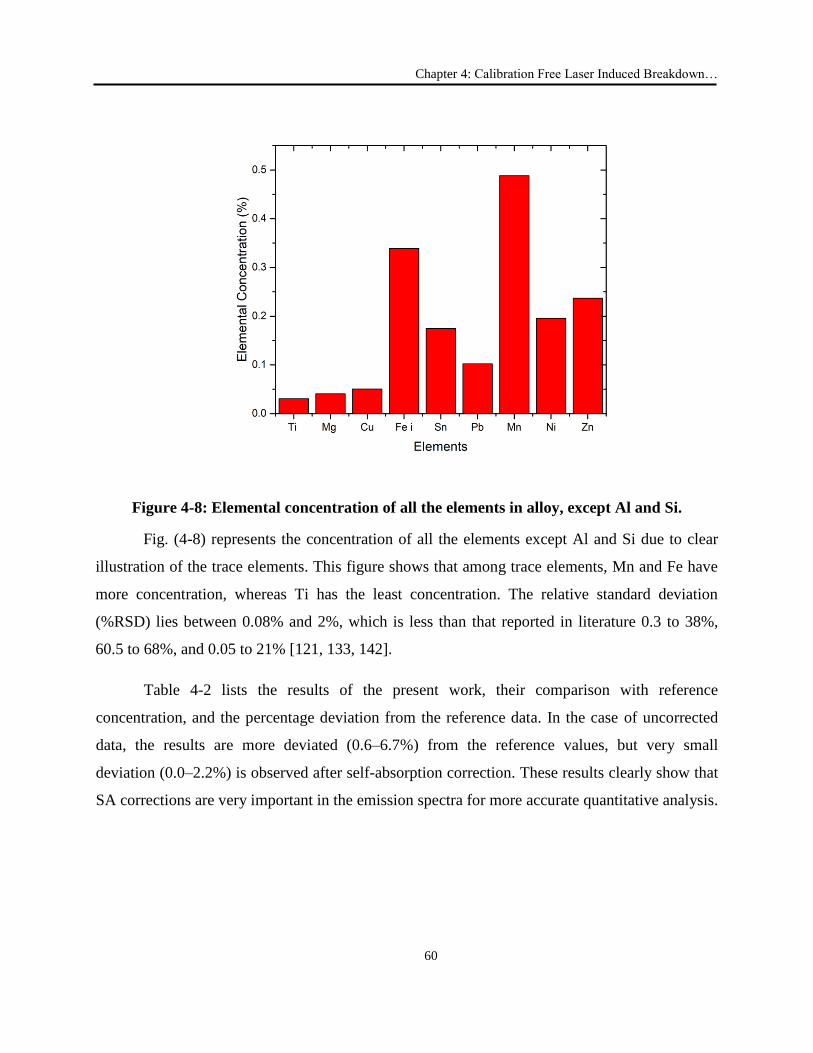
Chapter 4: Calibration Free Laser Induced Breakdown…
60
Figure 4-8: Elemental concentration of all the elements in alloy, except Al and Si.
Fig. (4-8) represents the concentration of all the elements except Al and Si due to clear
illustration of the trace elements. This figure shows that among trace elements, Mn and Fe have
more concentration, whereas Ti has the least concentration. The relative standard deviation
(%RSD) lies between 0.08% and 2%, which is less than that reported in literature 0.3 to 38%,
60.5 to 68%, and 0.05 to 21% [121, 133, 142].
Table 4-2 lists the results of the present work, their comparison with reference
concentration, and the percentage deviation from the reference data. In the case of uncorrected
data, the results are more deviated (0.6–6.7%) from the reference values, but very small
deviation (0.0–2.2%) is observed after self-absorption correction. These results clearly show that
SA corrections are very important in the emission spectra for more accurate quantitative analysis.
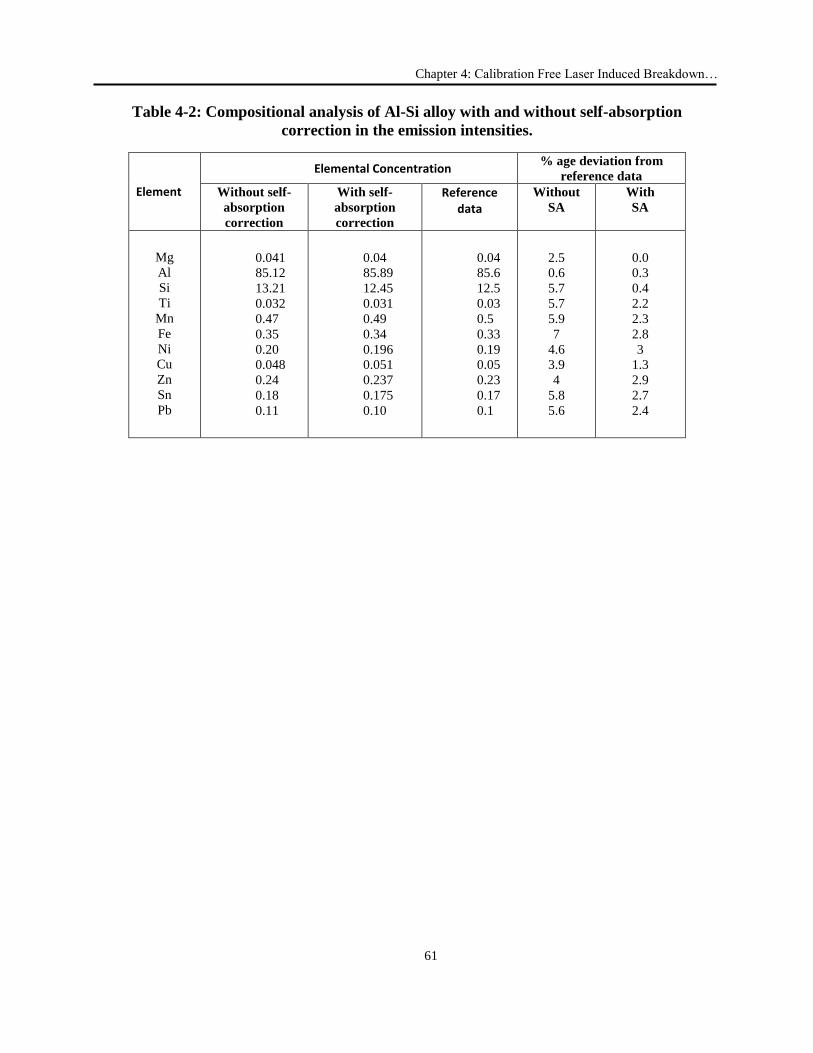
Chapter 4: Calibration Free Laser Induced Breakdown…
61
Table 4-2: Compositional analysis of Al-Si alloy with and without self-absorption
correction in the emission intensities.
Element
Elemental Concentration % age deviation from
reference data
Without self-
absorption
correction
With self-
absorption
correction
Reference data
Without
SA
With
SA
Mg
Al
Si
Ti
Mn
Fe
Ni
Cu
Zn
Sn
Pb
0.041
85.12
13.21
0.032
0.47
0.35
0.20
0.048
0.24
0.18
0.11
0.04
85.89
12.45
0.031
0.49
0.34
0.196
0.051
0.237
0.175
0.10
0.04
85.6
12.5
0.03
0.5
0.33
0.19
0.05
0.23
0.17
0.1
2.5
0.6
5.7
5.7
5.9
7
4.6
3.9
4
5.8
5.6
0.0
0.3
0.4
2.2
2.3
2.8
3
1.3
2.9
2.7
2.4
5
62
Chapter 5
Double Pulse Calibration-Free LIBS: Quantitative 5
Analysis of Ge/Si Alloys and Solar Cells
5.1 Introduction
The quantitative elemental analysis of industrial metallic and non-metallic alloys is routinely
carried out using analytical techniques such as Inductively Coupled Plasma Optical Emission
Spectroscopy (ICP-OES), Inductively Coupled Plasma Mass Spectroscopy (ICP-MS), Spark
Optical Emission Spectroscopy (Spark-OES), X-Ray Fluorescence (XRF) and Atomic
Absorption Spectroscopy (AAS) [144]. The above mentioned techniques are time taking, need
sample preparation, risk of sample contamination and analysis of light elements is often difficult.
Furthermore, these techniques are usually implemented in the laboratory; therefore, real time
analysis is not possible. However, Laser-Induced Breakdown Spectroscopy (LIBS) requires no
or very little sample preparation and experiments can be performed in situ [145]. In the first
chapter, the LIBS-based quantitative analysis techniques and its variants have been described in
detail. The calibration free technique is applied to analyze the precious alloys [122], to dielectric
and conducting materials [146] and bronze, brass, gold alloys, glass and archaeological samples
[124]. Most of the cited work used single pulse laser for the acquisition of emission spectra.
However, single pulse LIBS suffers from relatively low sensitivity and accuracy as compared to
the existing analytical techniques [104]. Therefore, dual pulse is used to improve the sensitivity,
selectivity and accuracy of the CF-LIBS results. Applied Laser Spectroscopy Laboratory in Pisa
developed a Mobile Dual-pulse LIBS instrument (MODI) [88], which has been used for the CF-
LIBS analysis of soil sample, synthetic emeralds grown by Biron hydrothermal method and for
the analysis of industrial waste molding and core sands [132, 147, 148]. To best of our
Chapter 5: Double Pulse Calibration Free LIBS: Quantitative…
63
knowledge, only few groups used double pulse calibration-free LIBS for the analysis of alloys.
Contreras et al. [149] used the Calibration-Free technique with orthogonal double pulse LIBS at
low ablative energies (0.25 & 7 mJ) for quantitative analysis of steel samples. Duan et al. [150]
performed a Calibration-Free quantitative analysis of copper alloy, using two pulses by splitting
single laser pulse with 1:1 ratio. The results agreed with certified compositions with accuracy of
± 15%.
The research presented here is the extension of our previous work performed on the
analysis of Al-Si alloy with single pulse calibration free LIBS, as discussed in the previous
chapter. The aim of the present work is to exploit and further improve the analytical capabilities
of DP-CF-LIBS by performing elemental analysis of Ge-Cu/Si and Ge-Ba/Si alloys. Germanium
and silicon are the major constituents of these alloys. Germanium was discovered at the end of
nineteenth century, although most of its industrial applications are much more recent, being
related to the production of optical fibers and semiconductors. Germanium and silicon have
similar chemical properties; therefore, they can substitute each other in a crystal lattice site with
perfect miscibility at all the concentrations [151]. Varying the stoichiometric ratio between Ge
and Si, the energy band gap between the valence and conduction band can be finely adjusted
[152]; therefore, the knowledge of this ratio is particularly important for industrial quality control
and for fundamental studies.
From the above work, we learnt that calibration free LIBS technique suffers from a
drawback, for example, the neutral emission lines of trace elements and lines of singly ionized
species are not enough to draw Boltzmann plots and get intercept for CF-LIBS analysis. Even if
sufficient emission lines are present in the spectra, it is time taking to select suitable emission
lines and draw Boltzmann plots. To overcome these drawbacks and to speed up the analysis
procedure, Pace et al. [147] determined the species concentration in waste foundry sands using
intercepts extracted from the Boltzmann plots. But the species of which one or two emission
lines were detected; their intercepts were extracted from the expression of line intensity and
subsequently determined the concentration of elements present in a sample. Later on, Fu et al.
[153] extracted the relative concentration of neutral species from line intensity rather than from
the intercept of Boltzmann plot, whereas the relative concentration of ionized species was
extracted from the Saha equation, which utilizes the concentration of neutral species and the
electron number density. The Saha Boltzmann plot was only used for the determination of
Chapter 5: Double Pulse Calibration Free LIBS: Quantitative…
64
Plasma temperature. Recently, the same group published the comparative study of standard
reference line method (SRL), combination of one point calibration free LIBS (OPC) with SRL
and intercept method with OPC approach. To reduce the sources of error and to speed up the
analysis procedure, a series of experiments were performed on Gd/Ge/Si alloy using double
pulse in collinear configuration. The plasma temperature is extracted from Saha Boltzmann plot
and the intercepts corresponding to neutral species were calculated using line intensity
expression. To circumvent the error associated with determination of electron number density,
we used the intercepts for ionized species directly from the line intensity expression rather than
the Saha equation. This brings accuracy in results as well as speeds up the calibration free
procedure with a step towards online analysis in real environment. To compare the results, the
elemental concentration has been determined using intercepts and electron number density
obtained from Saha equation. Moreover, the calibration free quantitative analysis technique has
been extended to the analysis of solar cells with the aim to measure the concentration of trace
elements B, Al, Ti and Fe required in PV-Si [154]. This may be the route to online monitoring of
Upgraded Metallurgical Silicon (UMG-Si) refining process. In order to maintain the quality of
thin film solar cell, together with morphological and electrical characteristics, the chemical
composition of the products have to be monitored [155]. The impurities in solar cell are both
metallic and non-metallic and usually appeared when the polycrystalline ingot is used directly or
used to grow the single crystals [156].
5.2 Experimental Setup
The diagram of double-pulse experimental arrangement is presented in Fig. (2-9), consisting of
two Nd:YAG lasers operating at 1064 nm with total laser energy of both laser was set at 40 mJ.
The laser pulses were directed and focused on the sample surface with plano-convex lens of 5 cm
focal length, resulting spot size of 300-350 µm in diameter. These pulses were used in collinear
configuration, which produce and re-heat the plasma. The plasma emissions were received with
optical fiber and transmitted to LIBS 2500+ (Ocean Optics, USA) spectrometer. The samples
used in this study were Ge/Cu/Si, Ge/Ba/Si, Gd/Ge/Si alloys and solar cells. The alloys were
pelletized of approx. 1 to 1.5 cm in diameter and 0.3 to 0.5 cm thick and the solar cell pieces
were used in the dimension of 10x10 mm. The silicon solar cells from three different
manufactures were used and care was taken to avoid any contamination. The emission spectra
Chapter 5: Double Pulse Calibration Free LIBS: Quantitative…
65
were recorded with 2.1 ms fixed gate width and 0.8 µs gate delay and twenty single shot spectra
were averaged to obtain the experimental data. The emission spectra were corrected by
subtracting dark spectra, which was recorded independently. In order to get the laser energies,
free from fluctuations, a small portion of laser beam was incident on the energy meter and only
those data sets were used having minimum energy variation.
5.3 Results and Discussion
5.3.1 Effect of Inter-Pulse Delay and Energy Ratio on the Emission Spectra
The analytical capability of double pulse LIBS could be improved by optimizing inter-pulse
delay and energy ratio between laser pulses. Fig. (5-1) shows the variation of line emission
intensities at different inter-pulse delays and energy ratio in collinear double pulse arrangement.
The intensities of spectral lines of neutral atoms of Ge at 265.12 nm, Cu at 327.39 nm and Cu at
529.25 nm show maximum signal enhancement at about 1.6 µs inter-pulse delay; thereafter, a
decreasing trend was observed up to 10 µs as shown in Fig. (5-1a). Similarly, the energy ratio of
the laser pulses was plotted by trying 1:1, 1:3, 3:5 and 1:7 ratios, while keeping the total energy
fixed at 40 mJ and inter-pulse delay at 1.6 µs. The results found in Fig. (5-1b) show maximum
signal enhancement at 1:3 energy ratios between the first and second laser pulses. Benedetti et al.
[157] used an Al-target to study the effect of laser pulse energy on the emission intensities of
double-pulse LIBS from 1:6 to 1:1 energy ratio and observed maximum signal enhancement at
an energy ratio of 1:3, which is consistent to our work. Using the optimized values of these
parameters, about three to five times signal enhancement has been achieved as compared to the
single pulse spectra recorded at 40 mJ laser energy.
Similarly, the inter pulse delay and energy ratio optimization in case of Gd/Ge/Si alloy
and solar cells have been evaluated. The optimum signal to noise ratio was achieved at 1.7 µs for
alloy and 0.83 µs for the solar cells. At these inter pulse delays; the optimized energy ratio was
1:5 for alloy and 1:3 for rest of the samples. The emission spectra recorded under these
optimized conditions show five times signal enhancement than single pulse spectra, produced at
same total energy.
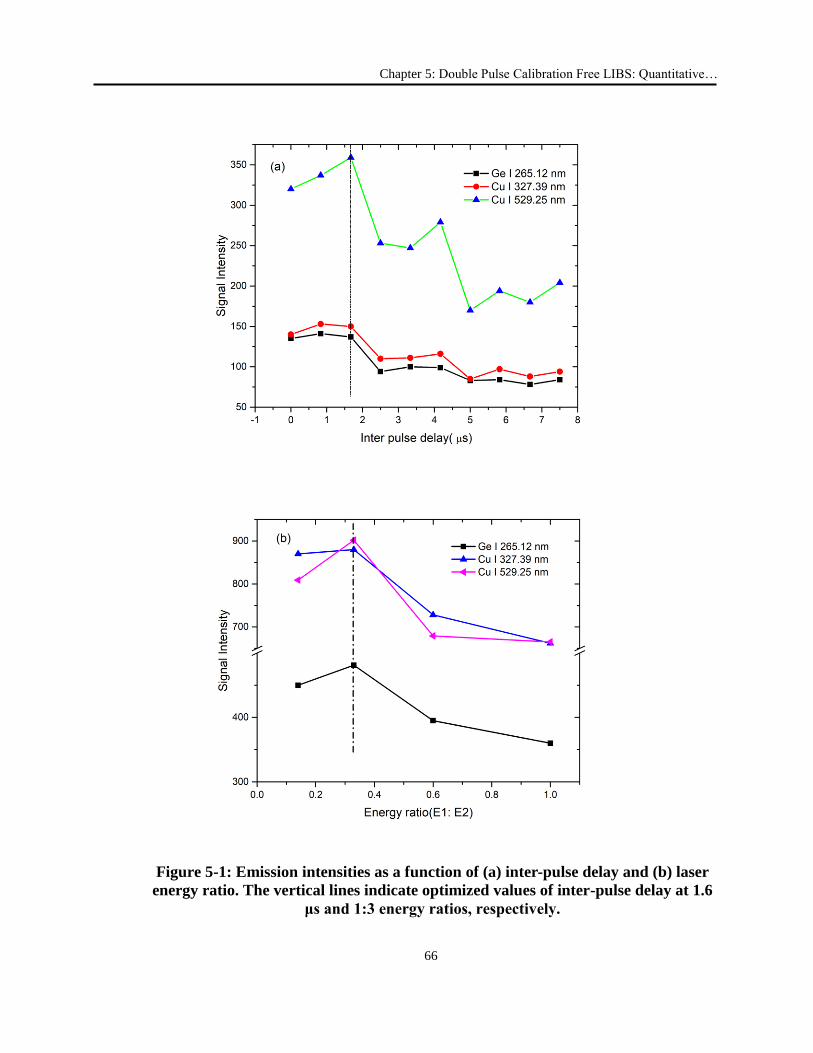
Chapter 5: Double Pulse Calibration Free LIBS: Quantitative…
66
Figure 5-1: Emission intensities as a function of (a) inter-pulse delay and (b) laser
energy ratio. The vertical lines indicate optimized values of inter-pulse delay at 1.6
μs and 1:3 energy ratios, respectively.
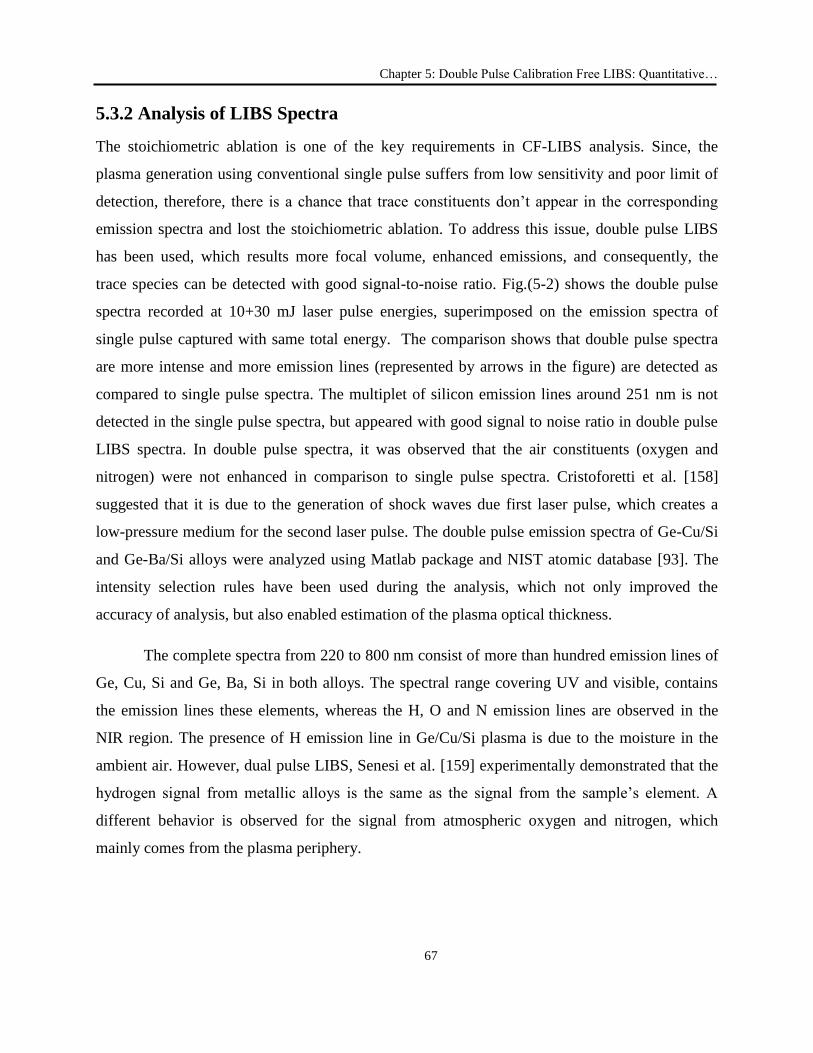
Chapter 5: Double Pulse Calibration Free LIBS: Quantitative…
67
5.3.2 Analysis of LIBS Spectra
The stoichiometric ablation is one of the key requirements in CF-LIBS analysis. Since, the
plasma generation using conventional single pulse suffers from low sensitivity and poor limit of
detection, therefore, there is a chance that trace constituents don’t appear in the corresponding
emission spectra and lost the stoichiometric ablation. To address this issue, double pulse LIBS
has been used, which results more focal volume, enhanced emissions, and consequently, the
trace species can be detected with good signal-to-noise ratio. Fig.(5-2) shows the double pulse
spectra recorded at 10+30 mJ laser pulse energies, superimposed on the emission spectra of
single pulse captured with same total energy. The comparison shows that double pulse spectra
are more intense and more emission lines (represented by arrows in the figure) are detected as
compared to single pulse spectra. The multiplet of silicon emission lines around 251 nm is not
detected in the single pulse spectra, but appeared with good signal to noise ratio in double pulse
LIBS spectra. In double pulse spectra, it was observed that the air constituents (oxygen and
nitrogen) were not enhanced in comparison to single pulse spectra. Cristoforetti et al. [158]
suggested that it is due to the generation of shock waves due first laser pulse, which creates a
low-pressure medium for the second laser pulse. The double pulse emission spectra of Ge-Cu/Si
and Ge-Ba/Si alloys were analyzed using Matlab package and NIST atomic database [93]. The
intensity selection rules have been used during the analysis, which not only improved the
accuracy of analysis, but also enabled estimation of the plasma optical thickness.
The complete spectra from 220 to 800 nm consist of more than hundred emission lines of
Ge, Cu, Si and Ge, Ba, Si in both alloys. The spectral range covering UV and visible, contains
the emission lines these elements, whereas the H, O and N emission lines are observed in the
NIR region. The presence of H emission line in Ge/Cu/Si plasma is due to the moisture in the
ambient air. However, dual pulse LIBS, Senesi et al. [159] experimentally demonstrated that the
hydrogen signal from metallic alloys is the same as the signal from the sample’s element. A
different behavior is observed for the signal from atmospheric oxygen and nitrogen, which
mainly comes from the plasma periphery.
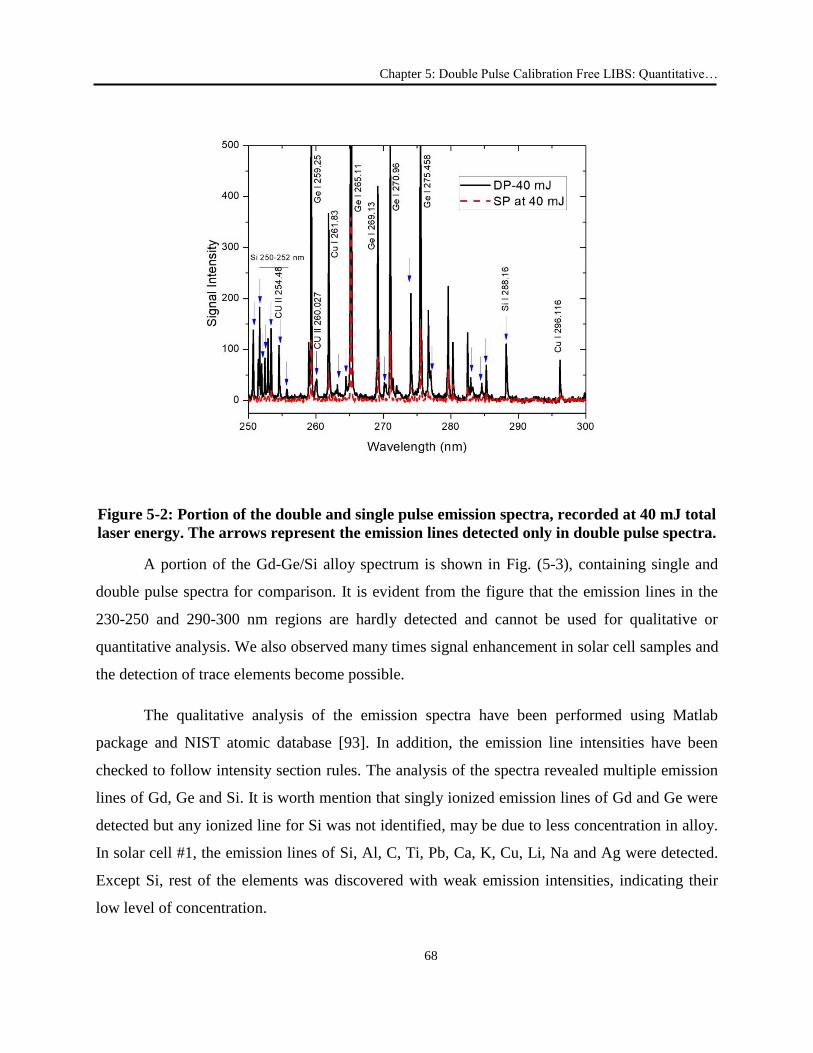
Chapter 5: Double Pulse Calibration Free LIBS: Quantitative…
68
Figure 5-2: Portion of the double and single pulse emission spectra, recorded at 40 mJ total
laser energy. The arrows represent the emission lines detected only in double pulse spectra.
A portion of the Gd-Ge/Si alloy spectrum is shown in Fig. (5-3), containing single and
double pulse spectra for comparison. It is evident from the figure that the emission lines in the
230-250 and 290-300 nm regions are hardly detected and cannot be used for qualitative or
quantitative analysis. We also observed many times signal enhancement in solar cell samples and
the detection of trace elements become possible.
The qualitative analysis of the emission spectra have been performed using Matlab
package and NIST atomic database [93]. In addition, the emission line intensities have been
checked to follow intensity section rules. The analysis of the spectra revealed multiple emission
lines of Gd, Ge and Si. It is worth mention that singly ionized emission lines of Gd and Ge were
detected but any ionized line for Si was not identified, may be due to less concentration in alloy.
In solar cell #1, the emission lines of Si, Al, C, Ti, Pb, Ca, K, Cu, Li, Na and Ag were detected.
Except Si, rest of the elements was discovered with weak emission intensities, indicating their
low level of concentration.
Chapter 5: Double Pulse Calibration Free LIBS: Quantitative…
69
Figure 5-3: The upper trace is the emission spectra recorded with collinear double pulse
arrangement at 10 +30 mJ laser energies, whereas the lower spectra is single pulse spectra
with same total energy of 40 mJ.
In Solar cell #2 and #3, Si, Al, C, Li, Ag, Pb, Ti, Ca, K, C, Ti, Na) and Si, Al, Pb, Ca, Cr,
Li, K, In, Fe, Sn, Sb, Na, Ti, Cu, Na, Sr and Ba have been detected respectively. In the emission
spectra of solar cell samples, many strong lines of Si were observed which show their higher
concentration in the solar cells, whereas, other elements with few weak emission lines indicating
their low concentration. Only those emission lines have been selected which were free from
spectral interference, non-self-absorbed and the necessary spectroscopic data are available in
literature [93, 160]. These emission lines were then used for the estimation of plasma
temperature, electron number density and for the compositional analysis using CF-LIBS.
5.3.3 Plasma Temperature and Electron Number Density
The plasma temperature and electron density are the main parameters for compositional analysis
using calibration free LIBS. Due to the transient nature of the laser-induced plasma, these
parameters vary within the plasma lifetime and therefore their determination with time-integrated
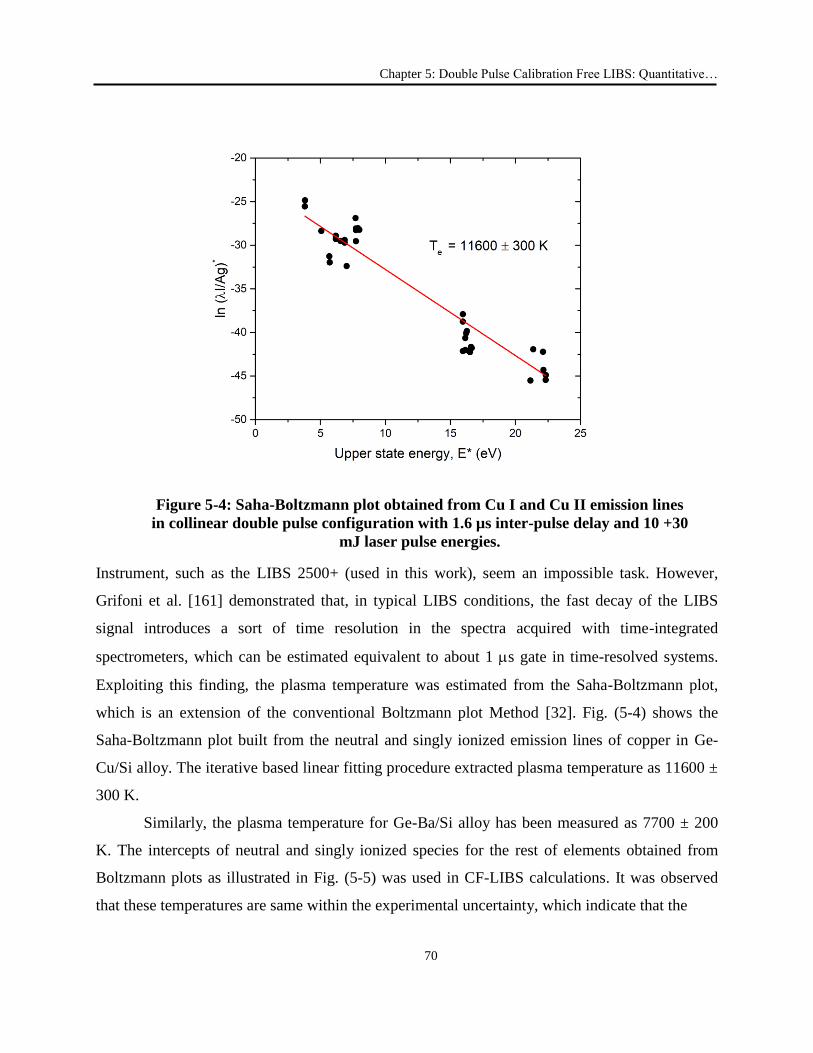
Chapter 5: Double Pulse Calibration Free LIBS: Quantitative…
70
Instrument, such as the LIBS 2500+ (used in this work), seem an impossible task. However,
Grifoni et al. [161] demonstrated that, in typical LIBS conditions, the fast decay of the LIBS
signal introduces a sort of time resolution in the spectra acquired with time-integrated
spectrometers, which can be estimated equivalent to about 1 s gate in time-resolved systems.
Exploiting this finding, the plasma temperature was estimated from the Saha-Boltzmann plot,
which is an extension of the conventional Boltzmann plot Method [32]. Fig. (5-4) shows the
Saha-Boltzmann plot built from the neutral and singly ionized emission lines of copper in Ge-
Cu/Si alloy. The iterative based linear fitting procedure extracted plasma temperature as 11600 ±
300 K.
Similarly, the plasma temperature for Ge-Ba/Si alloy has been measured as 7700 ± 200
K. The intercepts of neutral and singly ionized species for the rest of elements obtained from
Boltzmann plots as illustrated in Fig. (5-5) was used in CF-LIBS calculations. It was observed
that these temperatures are same within the experimental uncertainty, which indicate that the
Figure 5-4: Saha-Boltzmann plot obtained from Cu I and Cu II emission lines
in collinear double pulse configuration with 1.6 µs inter-pulse delay and 10 +30
mJ laser pulse energies.
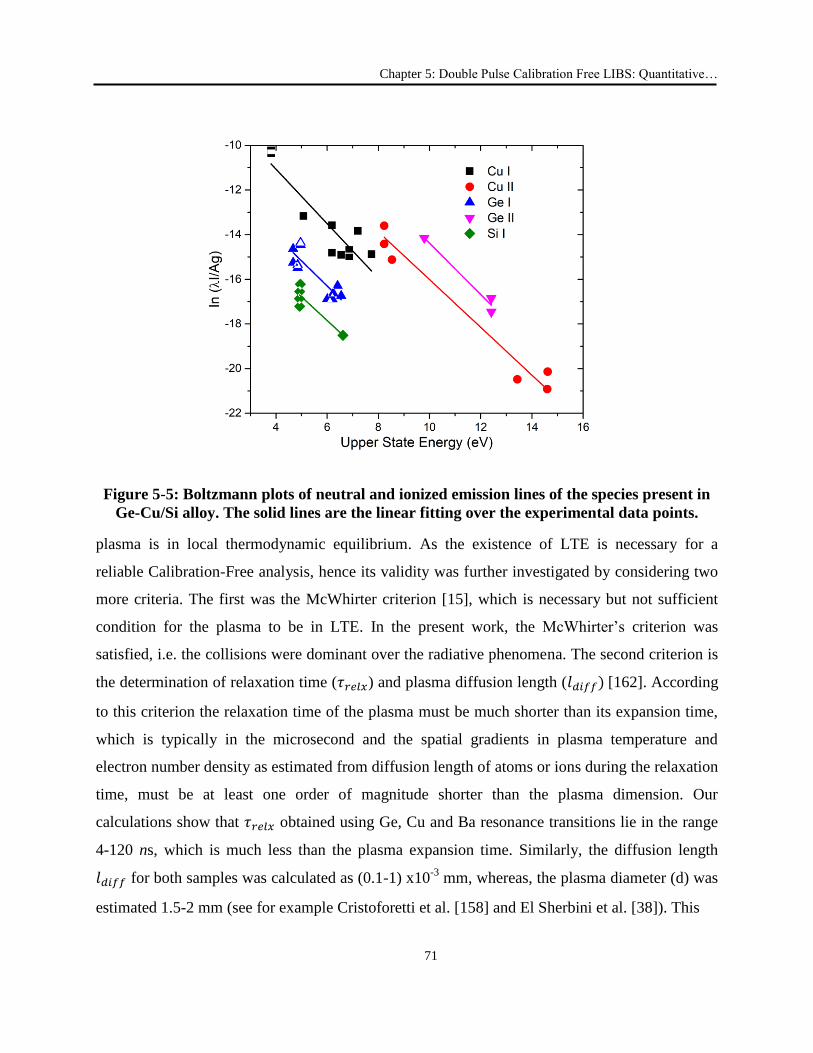
Chapter 5: Double Pulse Calibration Free LIBS: Quantitative…
71
Figure 5-5: Boltzmann plots of neutral and ionized emission lines of the species present in
Ge-Cu/Si alloy. The solid lines are the linear fitting over the experimental data points.
plasma is in local thermodynamic equilibrium. As the existence of LTE is necessary for a
reliable Calibration-Free analysis, hence its validity was further investigated by considering two
more criteria. The first was the McWhirter criterion [15], which is necessary but not sufficient
condition for the plasma to be in LTE. In the present work, the McWhirter’s criterion was
satisfied, i.e. the collisions were dominant over the radiative phenomena. The second criterion is
the determination of relaxation time ( ) and plasma diffusion length ( [162]. According
to this criterion the relaxation time of the plasma must be much shorter than its expansion time,
which is typically in the microsecond and the spatial gradients in plasma temperature and
electron number density as estimated from diffusion length of atoms or ions during the relaxation
time, must be at least one order of magnitude shorter than the plasma dimension. Our
calculations show that obtained using Ge, Cu and Ba resonance transitions lie in the range
4-120 ns, which is much less than the plasma expansion time. Similarly, the diffusion length
for both samples was calculated as (0.1-1) x10-3
mm, whereas, the plasma diameter (d) was
estimated 1.5-2 mm (see for example Cristoforetti et al. [158] and El Sherbini et al. [38]). This
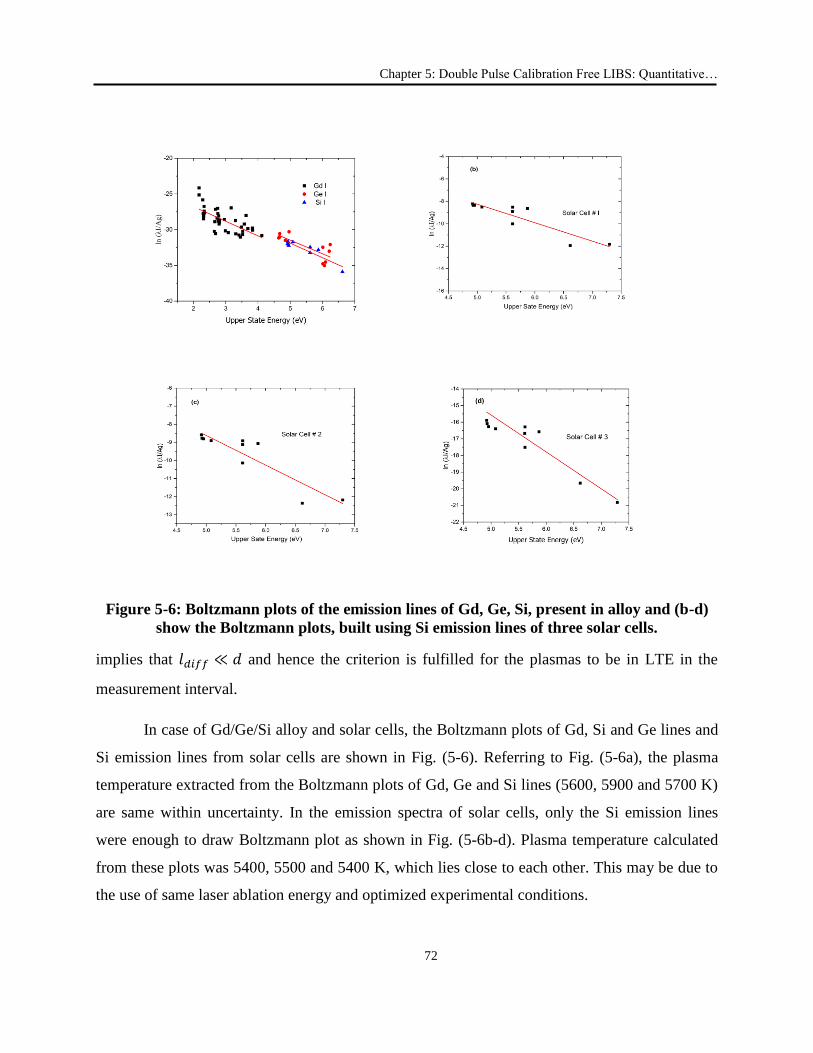
Chapter 5: Double Pulse Calibration Free LIBS: Quantitative…
72
Figure 5-6: Boltzmann plots of the emission lines of Gd, Ge, Si, present in alloy and (b-d)
show the Boltzmann plots, built using Si emission lines of three solar cells.
implies that and hence the criterion is fulfilled for the plasmas to be in LTE in the
measurement interval.
In case of Gd/Ge/Si alloy and solar cells, the Boltzmann plots of Gd, Si and Ge lines and
Si emission lines from solar cells are shown in Fig. (5-6). Referring to Fig. (5-6a), the plasma
temperature extracted from the Boltzmann plots of Gd, Ge and Si lines (5600, 5900 and 5700 K)
are same within uncertainty. In the emission spectra of solar cells, only the Si emission lines
were enough to draw Boltzmann plot as shown in Fig. (5-6b-d). Plasma temperature calculated
from these plots was 5400, 5500 and 5400 K, which lies close to each other. This may be due to
the use of same laser ablation energy and optimized experimental conditions.
Chapter 5: Double Pulse Calibration Free LIBS: Quantitative…
73
The electron number density in the plasma is required for LTE assessment and used in
Saha equation for concentration of ionic species. In the present work, we estimated the electron
number density in the temporal window of the measurements (1.6 s delay with 1 s equivalent
gate) from the Stark broadening of the Hα line. The Hα line and other emission lines have been
de-convoluted for instrumental broadening using several narrow emission lines emitted by a low-
pressure mercury argon lamp. The instrumental broadening 0.05 nm was subtracted from the
observed line profile as follows;
22
instrmeas
The electron number density in the Ge-Cu/Si alloy plasma has been evaluated from the
FWHM of Hα line as (1.44 ± 0.1) x1017
cm-3
. The electron number density was also determined
using various emission lines of Cu and Ge which lie in the range 1.3 ± 0.1 x10¹⁷
to 1.4 ± 0.1 x
1017
. Same electron number density values from Hα line and other emission lines implies that
self-absorption in the emission spectra is negligible [38]. Similarly, the electron number density
for the Ge-Ba/Si alloy was estimated using FWHM of Ge and Ba lines as (1.3 ± 0.1) x1017
and
that of Gd/Ge/Si alloy and solar cells were extracted as (1.24 ± 0.1) x1017
cm-3
, and (1.74 ± 0.1,
1.73 ± 0.1, 1.14 ± 0.1) x1017
cm-3
respectively. The validity of local thermodynamic equilibrium
for these plasmas has been verified using McWhirter criterion, relaxation time and plasma
diffusion length.
5.3.4 Elemental Concentration of Ge Alloys
The quantitative analysis of sample constituents has been carried out using calibration
free LIBS. The procedure of calibration free method for the quantitative analysis is described in
detail in first chapter. Briefly, the emitted line intensity from the optically thin and LTE plasma
can be expressed as follows:
eBline
eS
lineline
line TkEeTU
gAFCI
(5-1)
Here is the line integrated intensity, Cs is the species concentration, F is the
efficiency of the experimental setup. The spectroscopic parameters such as transition probability
Chapter 5: Double Pulse Calibration Free LIBS: Quantitative…
74
( statistical weight ( , the partition function ( and the upper level energy of a
transition ( ) can be obtained from literature. Re-arranging Eq. (5-1) in the linear form as:
eSe
line
e
line
TUFC
kT
E
kTI
lnln
(5-2)
The intercept for each species is obtained from the linear fitting of data points in the
corresponding Boltzmann plot.
The elemental concentration of Ge/Cu/Si and Ge/Ba/Si alloys has been calculated using the
Calibration Free LIBS technique. The details of this technique are available in first chapter.
Referring to our previous work [163], the quantitative analysis using CF-LIBS technique require
plasma temperature and intercepts of all sample species extracted from Boltzmann plots. As an
example, the Boltzmann plots of Cu I, Cu II, Ge I, Ge II and Si I emission lines of Ge-Cu/Si
alloy are shown in Fig. (5-5). Similarly, the Boltzmann plots for the species in Ge-Ba/Si alloy
have been built and intercepts are obtained. The intercepts and plasma temperature are used to
get the concentration of all elements in both samples. In the present work, the concentration of
all detected elements in the emission spectra i.e. Ge, Cu, Si, Ge and Ba, have been determined as
listed in Table 5-1. Besides the major elements of the alloys, Li, Na, K and air constituents were
detected in trace quantity. Table 5-1 contains the elemental concentration of Ge-Cu/Si and Ge-
Ba/Si alloys in both weight and number percent.
The elemental concentration is also illustrated in Fig. (5-7), showing low concentration of Si in
the Ge-Cu/Si alloy, while much higher in the Ge-Ba/Si alloy. The inset in Fig. (5-7) represents
the concentration of air constituents and that of Li, K and Na in parts per million (ppm). In the
present work, we could not compare our results with any other technique. However, in our
recently published work on CF-LIBS analysis of Al-Si alloy [163], we used a reference sample
and the maximum deviation 2-3% of CF LIBS results from reference data was observed.
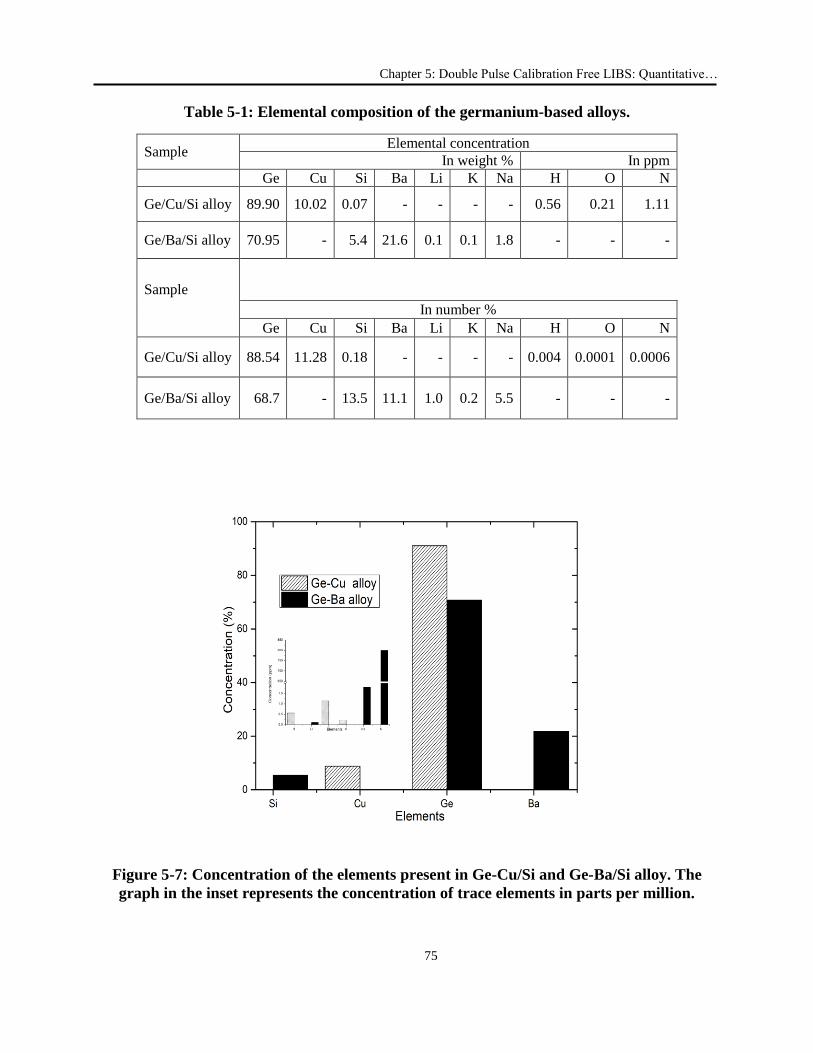
Chapter 5: Double Pulse Calibration Free LIBS: Quantitative…
75
Table 5-1: Elemental composition of the germanium-based alloys.
Sample Elemental concentration
In weight % In ppm
Ge Cu Si Ba Li K Na H O N
Ge/Cu/Si alloy 89.90 10.02 0.07 - - - - 0.56 0.21 1.11
Ge/Ba/Si alloy 70.95 - 5.4 21.6 0.1 0.1 1.8 - - -
Sample
In number %
Ge Cu Si Ba Li K Na H O N
Ge/Cu/Si alloy 88.54 11.28 0.18 - - - - 0.004 0.0001 0.0006
Ge/Ba/Si alloy 68.7 - 13.5 11.1 1.0 0.2 5.5 - - -
Figure 5-7: Concentration of the elements present in Ge-Cu/Si and Ge-Ba/Si alloy. The
graph in the inset represents the concentration of trace elements in parts per million.
Chapter 5: Double Pulse Calibration Free LIBS: Quantitative…
76
In other set of experiments, the elemental concentration of known Gd-Ge-Si alloy and three
unknown solar cells was determined by estimating plasma temperature (5700 K) and intercepts
of corresponding species from the linear fit of Boltzmann plots. However, the trace elements in a
sample usually have very few emissions line not enough to draw Boltzmann plots. To handle this
situation, a variant of CF-LIBS [147] could be used, which extract the intercepts from the basic
line intensity expression Eq. (1-27), rather than from the Boltzmann plot, provided that the
plasma temperature is known. Moreover, in CF-LIBS the ionic concentration is determined using
Saha equation, which requires the electron number density and concentration of neutral species.
The electron number density carries large uncertainty due to use of Stark broadening parameter.
Therefore, in order to improve the accuracy of CF-results, we proposed to extract intercept from
the ionic line using Eq. (1-27) and calculate the ionic concentration using Eq. (1-29).
With these strategies, the elemental concentration of Gd-Ge-Si alloy was determined by
estimating plasma temperature (5700 K) and intercepts of corresponding species from the linear
fit of Boltzmann plots. Since alloy spectra contain singly ionized lines of Ge and Si, therefore, its
contribution to overall elemental concentration was determined using Saha equation [32];
It is worth mention that in case of alloy the emission lines of Gd, Ge and Si were enough
to draw Boltzmann plots and get intercepts (see Fig. (5-6a). The elemental concentration of alloy
extracted “using intercepts from Boltzmann plots” was compared with the elemental
concentration determined “without using Boltzmann plots”. The comparison in Table 5-2 shows
that results of both approaches are almost comparable with some relative error. It is therefore
suggested that this approach is more suitable and that’s why it is extended to the analyses of
solar cells. In solar cells, only the emission lines of Si were sufficient to draw Boltzmann plot as
illustrated in Fig. (5-6b-d). However, the intercepts of rest of the elements in solar cells were
obtained using Eq. (1-27) and subsequently used for the determination of elemental
concentration. The inspection of table shows that silicon is the major constituent of all the solar
cell samples, because these solar cells are made of polycrystalline silicon, whereas other
elements are in trace quantity. These trace elements are divided into two groups, the dopants and
the contaminants. Dopants such as Phosphorous and Boron are added intentionally in solar cells,
as required to make the sunlight efficiently converted to electrical current, whereas, other
impurities such as Al, Fe, Ti, Ca, C and Cu etc. may come from raw materials or added during
Chapter 5: Double Pulse Calibration Free LIBS: Quantitative…
77
the fabrication process. Sabation et al. [164] detected these impurities (B, Al, P. Ca, Ti, Cr, Mn,
Fe, Ni, Cu, Zn, Mo, Sn, W and P) in parts per million in MG-Si using XRF and ICP-MS. In
sample #1 and #2, the C and Ca were observed with reasonable concentration, however, in
sample # 3, Ca was in parts per million (ppm) but C was not present. The impurities In, Sn, Fe
and Pb were 4-50 ppm in sample # 3, but could not detected in Sample # 1 and 2. The
quantitative results for the three solar cell samples are listed in Table 5-3. Some other impurities
like K, Na, LI, Cu, Sr, Ag and Ba were identified in ultra-trace quantity. These impurities, in
crystalline structure decrease the conversion efficiency of solar cells and therefore their detection
and quantification is very much required for photovoltaic applications.
In CF-LIBS the ionic concentration is usually determined using Saha equation, which requires
the electron number density, carrying large uncertainty due to use of Stark broadening parameter.
Therefore, in the present work, the ionic concentration was directly determined using intercept,
extracted from the ionic line profile.
Results in Table 5-2 shows that the use of Boltzmann plot approach is more accurate, but
could not be applied to trace elements with less number of emission lines therefore impossible to
get the concentration of H, O, N and other trace elements. The “without Boltzmann plot”
approach was extended to the analysis of solar cells because in the emission spectra, very few
lines of trace impurities were detected and were insufficient to build Boltzmann plots.
Table 5-2: Elemental concentration determined using Calibration Free LIBS with and
without Boltzmann plots.
(Gd/Ge/Si
alloy)
Calibration Free Results (wt %)
Reference
values
% deviation
With
Boltzmann
plots
Without
Boltzmann plots
With
Boltzmann
plots
without
Boltzmann
plots
Gd 78.75 78.80 79.5 1 1
Ge 15.32 15.24 14.8 3.5 3
Si 5.92 5.95 5.7 3.8 4.4
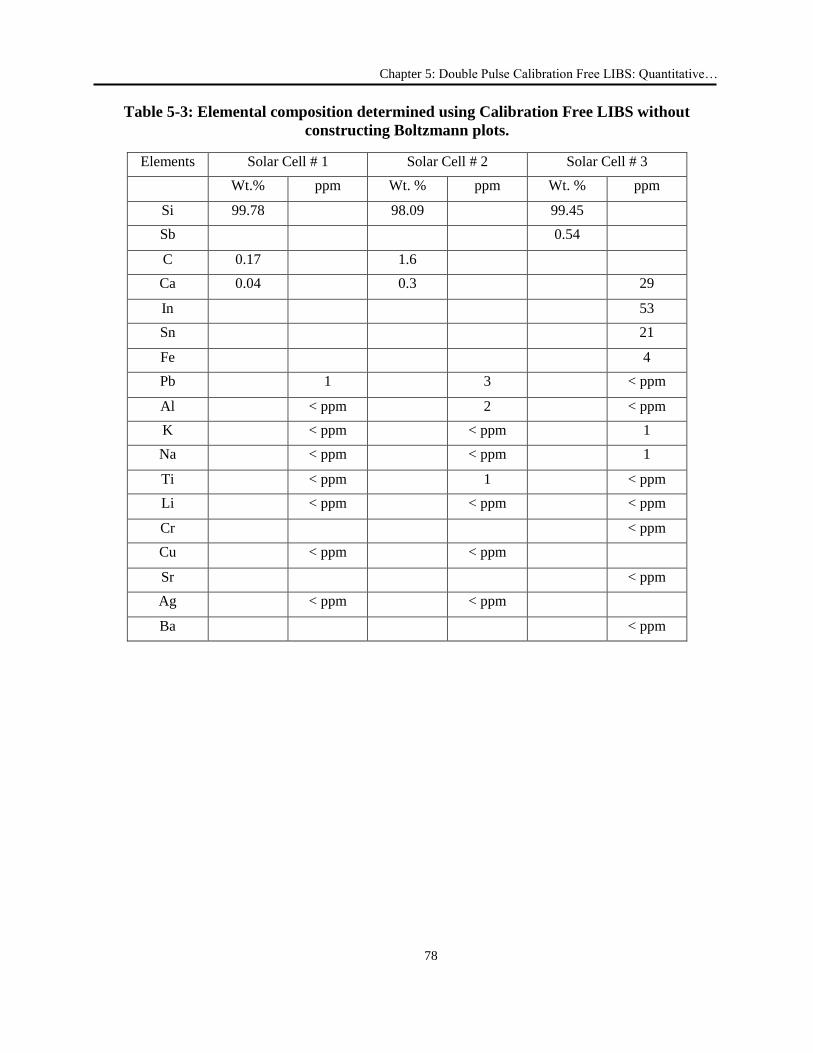
Chapter 5: Double Pulse Calibration Free LIBS: Quantitative…
78
Table 5-3: Elemental composition determined using Calibration Free LIBS without
constructing Boltzmann plots.
Elements Solar Cell # 1 Solar Cell # 2 Solar Cell # 3
Wt.% ppm Wt. % ppm Wt. % ppm
Si 99.78 98.09 99.45
Sb 0.54
C 0.17 1.6
Ca 0.04 0.3 29
In 53
Sn 21
Fe 4
Pb 1 3 < ppm
Al < ppm 2 < ppm
K < ppm < ppm 1
Na < ppm < ppm 1
Ti < ppm 1 < ppm
Li < ppm < ppm < ppm
Cr < ppm
Cu < ppm < ppm
Sr < ppm
Ag < ppm < ppm
Ba < ppm
79
Chapter 6
Conclusion and Future Plan 6
In this work, the capability of double pulse calibration free LIBS (DP-CF-LIBS) for
compositional analysis of alloys and solar cell samples have been studied, using the Q-switch
Nd:YAG laser and high resolution spectrometer.
In the initial part of the research work, the plasma of pure silicon was studied with the
help of plasma parameters at two wavelengths (1064 and 532 nm). Plasma temperature and
electron number density were studied as a function of laser irradiance, ambient pressure and
distance from the target surface. The results demonstrate higher values of electron temperature in
case of 1064 nm laser ablation, whereas, reversed behavior is observed for electron number
density. In the next set of experiments, CF-LIBS technique was employed for the quantitative
analysis of silicon, germanium and their alloys. The optimization of experimental parameters
such as laser energies, LTSD and gate delay time were very important for the accurate analysis.
For Al-Si alloy, at optimal conditions, the emission spectra was recorded and corrected for self-
absorption. The corrected emission intensities were used in Boltzmann and Saha Boltzmann
plots to calculate electron temperature. The fitting parameters extracted from the plots help to
determine the concentration of the species in the alloy. The results are obtained with 0.08-2%
relative standard deviation and up to 2.2% deviation from the reference data. In the next
experiment, double pulse plasma and CF-LIBS was incorporated to determine the stoichiometric
ratio of Ge-Cu/Si and Ge-Ba/Si alloys. The experimental parameters such as energy ratios, inter-
pulse separation and gate delay were optimized. LTE approximation was verified using
McWhirter criterion, excitation and ionization temperatures and by comparing the relaxation
time and diffusion length with plasma expansion time and plasma dimensions, respectively. The
plasma temperature was determined using Saha Boltzmann plot and electron number density was
Chapter 6: Conclusion and Future Plan
80
evaluated from the Stark broadened line profile of Hα line. Double-pulse measurement provides
higher sensitivity and allowed the detection of trace elements with improved limit of detection.
The conventional CF-LIBS technique requires Boltzmann plots for the elemental
concentration of all species in a sample; however, due to insufficient number of lines it is
difficult to build Boltzmann plot for trace elements and singly ionized species. A variant of CF-
LIBS technique was applied in which plasma temperature was determined with Boltzmann plot
of one species and the species concentration was determined without Boltzmann plots. The
concentration analysis of standard Gd-Ge-Si alloy of conventional and variant of CF-LIBS yield
same results with in uncertainty. The analysis has been further extended to three unknown
polycrystalline silicon solar cells using variant of CF-LIBS. The analysis yield silicon as 99.78,
98.09 and 99.45%, and trace impurities C, Ca, Sb, In, Sn, Ti, Al, and K were detected in parts
per million (ppm). The impurities in crystalline structure reduce the conversion efficiency of
solar cells and therefore their detection and quantification is very important for efficient
photovoltaic applications.
In future, we suggest the following work that can improve the scope of the work
presented in this thesis.
Double Pulse Orthogonal configuration could be used to improve the sensitivity and limit
of detection.
Portable system can be developed for the online qualitative and quantitative monitoring
of various samples.
Chemometrics analysis method for CF-LIBS can be established.
81
References
[1] A. Bertolini, G. Carelli, F. Francesconi, M. Francesconi, L. Marchesini, P. Marsili, et al.,
"Modì: a new mobile instrument for in situ double-pulse LIBS analysis," Analytical and
bioanalytical chemistry, vol. 385, pp. 240-247, 2006.
[2] L. Fornarini, F. Colao, R. Fantoni, V. Lazic, and V. Spizzicchino, "Calibration analysis of
bronze samples by nanosecond laser induced breakdown spectroscopy: a theoretical and
experimental approach," Spectrochimica Acta Part B: Atomic Spectroscopy, vol. 60, pp.
1186-1201, 2005.
[3] A. Pichahchy, D. Cremers, and M. Ferris, "Elemental analysis of metals under water
using laser-induced breakdown spectroscopy," Spectrochimica Acta Part B: Atomic
Spectroscopy, vol. 52, pp. 25-39, 1997.
[4] V. Lazic, F. Colao, R. Fantoni, and V. Spizzicchino, "Recognition of archeological
materials underwater by laser induced breakdown spectroscopy," Spectrochimica Acta
Part B: Atomic Spectroscopy, vol. 60, pp. 1014-1024, 2005.
[5] S. H. Lee, H. S. Shim, C. K. Kim, J. H. Yoo, R. E. Russo, and S. Jeong, "Analysis of the
absorption layer of CIGS solar cell by laser-induced breakdown spectroscopy," Applied
optics, vol. 51, pp. B115-B120, 2012.
[6] J. Kaiser, K. Novotný, M. Z. Martin, A. Hrdlička, R. Malina, M. Hartl, et al., "Trace
elemental analysis by laser-induced breakdown spectroscopy-biological applications,"
Surface Science Reports, vol. 67, pp. 233-243, 2012.
[7] S. J. Rehse, H. Salimnia, and A. Miziolek, "Laser-induced breakdown spectroscopy
(LIBS): an overview of recent progress and future potential for biomedical applications,"
Journal of medical engineering & technology, vol. 36, pp. 77-89, 2012.
[8] A. Whitehouse, J. Young, I. Botheroyd, S. Lawson, C. Evans, and J. Wright, "Remote
material analysis of nuclear power station steam generator tubes by laser-induced
breakdown spectroscopy," Spectrochimica Acta Part B: Atomic Spectroscopy, vol. 56,
pp.821-830,2001.
References
82
[9] P. Mukhono, K. Angeyo, A. Dehayem-Kamadjeu, and K. Kaduki, "Laser induced
breakdown spectroscopy and characterization of environmental matrices utilizing
multivariate chemometrics," Spectrochimica Acta Part B: Atomic Spectroscopy, vol. 87,
pp. 81-85, 2013.
[10] R. S. Harmon, R. E. Russo, and R. R. Hark, "Applications of laser-induced breakdown
spectroscopy for geochemical and environmental analysis: A comprehensive review,"
Spectrochimica Acta Part B: Atomic Spectroscopy, vol. 87, pp. 11-26, 2013.
[11] F. Brech and L. Cross, "Abstracts of Xth Colloquium Spectroscopicum Internationale and
First Meeting of the Society for Applied Spectroscopy," Appl. Spectrosc., vol. 16, pp. 59,
1962.
[12] J. Debras-Guédon and N. Liodec, "The use of a ruby laser as an excitation source in
emission spectroscopy," Comptes Rendus de l’Académie des Sciences, vol. 257, pp.
3336-3339, 1963.
[13] A. Bogaerts, Z. Chen, R. Gijbels, and A. Vertes, "Laser ablation for analytical sampling:
what can we learn from modeling?," Spectrochimica Acta Part B: Atomic Spectroscopy,
vol. 58, pp. 1867-1893, 2003.
[14] H. R. Griem, Principles of plasma spectroscopy vol. 2: Cambridge University Press,
2005.
[15] R. W. P. I. H. R.W.P. McWhirter, R.H. and Leonard, S.L., Eds., , Chap. 5, , New York,
206. , "Plasma Diagnostics Techniques," in Plasma Diagnostics Techniques, R. H.
Huddleston and S. L. Leonard, Eds., ed New York: Academic Press, 1965.
[16] G. Cristoforetti, A. De Giacomo, M. Dell'Aglio, S. Legnaioli, E. Tognoni, V. Palleschi, et
al., "Local thermodynamic equilibrium in laser-induced breakdown spectroscopy: beyond
the McWhirter criterion," Spectrochimica Acta Part B: Atomic Spectroscopy, vol. 65, pp.
86-95, 2010.
[17] H. R. Griem and H. W. Drawin, "Validity conditions for Local Thermodynamic
Equilibrium," Z. Phys. , vol. 228, pp. 99-119, 1969.
[18] H. R. Griem, "Validity of local thermal equilibrium in plasma spectroscopy,," Phys. Rev.,
vol. 131, pp. 1170-1176, 1963.
References
83
[19] W. T. Chan and R. E. Russo, "Study of laser-material interactions using inductively
coupled plasma-atomic emission spectrometry," Spectrochimica Acta Part B: Atomic
Spectroscopy, vol. 46, pp. 1471-1486, 1991.
[20] R. E. Russo, "Laser ablation," Applied Spectroscopy, vol. 49, pp. 14A-28A, 1995.
[21] D. Bulajic, M. Corsi, G. Cristoforetti, S. Legnaioli, V. Palleschi, A. Salvetti, et al., "A
procedure for correcting self-absorption in calibration free-laser induced breakdown
spectroscopy," Spectrochimica Acta Part B: Atomic Spectroscopy, vol. 57, pp. 339-353,
2002.
[22] A. El Sherbini, T. M. El Sherbini, H. Hegazy, G. Cristoforetti, S. Legnaioli, V. Palleschi,
et al., "Evaluation of self-absorption coefficients of aluminum emission lines in laser-
induced breakdown spectroscopy measurements," Spectrochimica Acta Part B: Atomic
Spectroscopy, vol. 60, pp. 1573-1579, 2005.
[23] J. Dong, L. Liang, J. Wei, H. Tang, T. Zhang, X. Yang, et al., "A method for improving
the accuracy of calibration-free laser-induced breakdown spectroscopy (CF-LIBS) using
determined plasma temperature by genetic algorithm (GA)," Journal of Analytical Atomic
Spectrometry, vol. 30, pp. 1336-1344, 2015.
[24] I. B .Gornushkin, J. M.Anzano, L. A. King., W. Smith, N.Omenetto, and J. D. "Curve of
growth methodology applied to laser-induced plasma emission spectroscopy,"
Spectrochimica Acta Part B: Atomic Spectroscopy, vol. 54, pp. 491-503, 1999.
[25] L. Sun and H. Yu, "Correction of self-absorption effect in calibration-free laser-induced
breakdown spectroscopy by an internal reference method," Talanta, vol. 79, pp. 388-395,
2009.
[26] A. Thorne, U. Litzén, and S. Johansson, Spectrophysics: principles and applications:
Springer Science & Business Media, 1999.
[27] D. A. Cremers and L. J. Radziemski, Handbook of Laser-Induced Breakdown
Spectroscopy: John Wiley & Sons, Ltd, 2006.
[28] J. A. Aguilera and C. Aragón, "Characterization of a laser-induced plasma by spatially
resolved spectroscopy of neutral atom and ion emissions.: Comparison of local and
spatially integrated measurements," Spectrochimica Acta Part B: Atomic Spectroscopy,
vol. 59, pp. 1861-1876, 2004.
References
84
[29] L. J. Radziemski, T. R. Loree, D. A. Cremers, and N. M. Hoffman, "Time-resolved laser-
induced breakdown spectrometry of aerosols," Analytical chemistry, vol. 55, pp. 1246-
1252, 1983.
[30] J. B. Simeonsson and A. W. Miziolek, "Time-resolved emission studies of ArF-laser-
produced microplasmas," Applied optics, vol. 32, pp. 939-947, 1993.
[31] M.Milan and J. J. Laserna, "Diagnostics of silicon plasmas produced by visible
nanosecond laser ablation," Spectrochimica Acta Part B: Atomic Spectroscopy, vol. 56
pp. 275–88, 2001.
[32] J. A. Aguilera and C. Aragon, "Characterization of a laser-induced plasma by spatially
resolved spectroscopy of neutral atom and ion emissions. Comparison of local and
spatially integrated measurements," Spectrochimica Acta Part B: Atomic Spectroscopy
vol. 59, pp. 1861-1876, 2004.
[33] X. Yalcin, D. R. Crosley, G. P. Smith, and G. W. Faris, "Influence of ambient conditions
on the laser air spark," Appl. Phys. B, vol. 68, pp. 121-130, 1999.
[34] C. A. Bye and A. Scheeline, "Saha-Boltzmann statistics for determination of electron
temperature and density in spark discharges using an Echelle/CCD system," Applied
spectroscopy, vol. 47, pp. 2022-2030, 1993.
[35] L. J. Radziemski and D. A. Cremers, "Handbook of laser induced breakdown
spectroscopy," John Wiley & Sons, vol. 1, pp. 1-4, 2006.
[36] I. B. Gornushkin, L. A. King, B. W. Smith, N. Omenetto, and J. D. Winefordner, "Line
broadening mechanisms in the low pressure laser-induced plasma," Spectrochimica Acta
Part B: Atomic Spectroscopy, vol. 54, pp. 1207-1217, 1999.
[37] I. B. Gornushkin, L. A. King, B. W. Smith, N. Omenetto, and J. D. Winefordner,
Spectrochimica Acta Part B: Atomic Spectroscopy, vol. 54, pp. 381-626, 1999.
[38] A. M. E. Sherbini, T. M. E. Sherbini, H. Hegazy, G. Cristoforetti, S. Legnaioli, V.
Palleschi, et al., "Evaluation of self-absorption coefficients of aluminum emission lines in
laser-induced breakdown spectroscopy measurements," Spectrochimica Acta Part B:
Atomic Spectroscopy, vol. 60, pp. 1573-1579, 2005.
[39] H. Griem, "Plasma Spectroscopy (1964), Chapter 14," ed: McGraw-Hill, New York.
References
85
[40] A. E. Sherbini, "Measurement of electron density utilizing the Ha line from laser
produced plasma in air," presented at the Fifth International Conference on Laser
Applications (ICLA)10–14 Cairo, Egypt, 2005.
[41] J. Ashkenazy, R. Kipper, and M. Caner, "Spectroscopic measurements of electron density
of capillary plasma based on Stark broadening of hydrogen lines," Phys. Rev., A, vol. 43,
pp. 5568-5574, 1991.
[42] L. Pardini, S. Legnaioli, G. Lorenzetti, V. Palleschi, R. Gaudiuso, A. D. Giacomo, et al.,
"On the determination of plasma electron number density from Stark broadened hydrogen
Balmer series lines in Laser-Induced Breakdown Spectroscopy experiments,"
Spectrochimica Acta Part B: Atomic Spectroscopy, vol. 88, pp. 98-103, 2013.
[43] P. Kepple and H. R. Griem, "Improved stark profile calculations for the hydrogen lines H
α, H β, H γ, and H δ," Physical Review, vol. 173, p. 317, 1968.
[44] A. Ciucci, M. Corsi, V. Palleschi, S. Rastelli, A. Salvetti, and E. Tognoni, "New
procedure for quantitative elemental analysis by laser-induced plasma spectroscopy,"
Applied spectroscopy, vol. 53, pp. 960-964, 1999.
[45] V. Burakov, V. Kiris, P. Naumenkov, and S. Raikov, "Calibration-free laser spectral
analysis of glasses and copper alloys," Journal of Applied Spectroscopy, vol. 71, pp. 740-
746, 2004.
[46] M. Bel'Kov, V. Burakov, V. Kiris, N. Kozhukh, and S. Raikov, "Spectral standard-free
laser microanalysis of gold alloys," Journal of Applied Spectroscopy, vol. 72, pp. 376-
381, 2005.
[47] M. Corsi, G. Cristoforetti, M. Hidalgo, S. Legnaioli, V. Palleschi, A. Salvetti, et al.,
"Double pulse, calibration-free laser-induced breakdown spectroscopy: a new technique
for in situ standard-less analysis of polluted soils," Applied Geochemistry, vol. 21, pp.
748-755, 2006.
[48] E. Tognoni, G. Cristoforetti, S. Legnaioli, and V. Palleschi, "Calibration-free laser-
induced breakdown spectroscopy: state of the art," Spectrochimica Acta Part B: Atomic
Spectroscopy, vol. 65, pp. 1-14, 2010.
[49] K. K. Herrera, E. Tognoni, N. Omenetto, B. W. Smith, and J. D. Winefordner, "Semi-
quantitative analysis of metal alloys, brass and soil samples by calibration-free laser-
References
86
induced breakdown spectroscopy: recent results and considerations," Journal of
Analytical Atomic Spectrometry, vol. 24, pp. 413-425, 2009.
[50] E. Grifoni, S. Legnaioli, G. Lorenzetti, S. Pagnotta, F. Poggialini, and V. Palleschi,
"From Calibration-Free to Fundamental Parameters Analysis: A comparison of three
recently proposed approaches," Spectrochimica Acta Part B: Atomic Spectroscopy, vol.
124, pp. 40-46, 2016.
[51] A. De Giacomo, M. Dell’Aglio, O. De Pascale, R. Gaudiuso, R. Teghil, A. Santagata, et
al., "ns-and fs-LIBS of copper-based-alloys: A different approach," Applied surface
science, vol. 253, pp. 7677-7681, 2007.
[52] L. Wang, C. Zhang, and Y. Feng, "Controlled calibration method for laser induced
breakdown spectroscopy," Chinese Optics Letters, vol. 6, pp. 5-8, 2008.
[53] J. A. Aguilera, C. Aragón, G. Cristoforetti, and E. Tognoni, "Application of calibration-
free laser-induced breakdown spectroscopy to radially resolved spectra from a copper-
based alloy laser-induced plasma," Spectrochimica Acta Part B: Atomic Spectroscopy,
vol. 64, pp. 685-689, 2009.
[54] D. D. Pace, R. Miguel, H. Di Rocco, F. A. García, L. Pardini, S. Legnaioli, et al.,
"Quantitative analysis of metals in waste foundry sands by calibration free-laser induced
breakdown spectroscopy," Spectrochimica Acta Part B: Atomic Spectroscopy, vol. 131,
pp. 58-65, 2017.
[55] J.-h. Kwak, C. Lenth, C. Salb, E.-J. Ko, K.-W. Kim, and K. Park, "Quantitative analysis
of arsenic in mine tailing soils using double pulse-laser induced breakdown
spectroscopy," Spectrochimica Acta Part B: Atomic Spectroscopy, vol. 64, pp. 1105-
1110, 2009.
[56] A. P. Michel, "Applications of single-shot laser-induced breakdown spectroscopy,"
Spectrochimica Acta Part B: Atomic Spectroscopy, vol. 65, pp. 185-191, 2010.
[57] M. Corsi, G. Cristoforetti, V. Palleschi, A. Salvetti, and E. Tognoni, "A fast and accurate
method for the determination of precious alloys caratage by Laser Induced Plasma
Spectroscopy," The European Physical Journal D-Atomic, Molecular, Optical and
Plasma Physics, vol. 13, pp. 373-377, 2001.
[58] M. Xu, Q. Lin, G. Yang, T. Xu, T. Zhang, X. Wang, et al., "A single-beam-splitting
technique combined with a calibration-free method for field-deployable applications
References
87
using laser-induced breakdown spectroscopy," Rsc Advances, vol. 5, pp. 4537-4546,
2015.
[59] F. Colao, R. Fantoni, V. Lazic, A. Paolini, F. Fabbri, G. Ori, et al., "Investigation of
LIBS feasibility for in situ planetary exploration: an analysis on Martian rock analogues,"
Planetary and Space Science, vol. 52, pp. 117-123, 2004.
[60] B. Sallé, J.-L. Lacour, P. Mauchien, P. Fichet, S. Maurice, and G. Manhes, "Comparative
study of different methodologies for quantitative rock analysis by laser-induced
breakdown spectroscopy in a simulated Martian atmosphere," Spectrochimica Acta Part
B: Atomic Spectroscopy, vol. 61, pp. 301-313, 2006.
[61] J.-B. Sirven, B. Bousquet, L. Canioni, L. Sarger, S. Tellier, M. Potin-Gautier, et al.,
"Qualitative and quantitative investigation of chromium-polluted soils by laser-induced
breakdown spectroscopy combined with neural networks analysis," Analytical and
bioanalytical chemistry, vol. 385, pp. 256-262, 2006.
[62] C. Gautier, P. Fichet, D. Menut, J.-L. Lacour, D. L'Hermite, and J. Dubessy, "Study of
the double-pulse setup with an orthogonal beam geometry for laser-induced breakdown
spectroscopy," Spectrochimica Acta Part B: Atomic Spectroscopy, vol. 59, pp. 975-986,
2004.
[63] J. Amador-Hernández, J. Fernández-Romero, and M. L. de Castro, "Three-dimensional
analysis of screen-printed electrodes by laser induced breakdown spectrometry and
pattern recognition," Analytica chimica acta, vol. 435, pp. 227-238, 2001.
[64] G. Colonna, A. Casavola, and M. Capitelli, "Modelling of LIBS plasma expansion,"
Spectrochimica Acta Part B: Atomic Spectroscopy, vol. 56, pp. 567-586, 2001.
[65] A. Ciucci, V. Palleschi, S. Rastelli, A. Salvetti, D. Singh, and E. Tognoni, "CF-LIPS: A
new approach to LIPS spectra analysis," Laser and Particle Beams, vol. 17, pp. 793-797,
1999.
[66] I. Gornushkin, A. Ruiz-Medina, J. Anzano, B. Smith, and J. Winefordner, "Identification
of particulate materials by correlation analysis using a microscopic laser induced
breakdown spectrometer," Journal of analytical atomic spectrometry, vol. 15, pp. 581-
586, 2000.
References
88
[67] L. St-Onge, V. Detalle, and M. Sabsabi, "Enhanced laser-induced breakdown
spectroscopy using the combination of fourth-harmonic and fundamental Nd: YAG laser
pulses," Spectrochimica Acta Part B: Atomic Spectroscopy, vol. 57, pp. 121-135, 2002.
[68] D. N. Stratis, K. L. Eland, and S. M. Angel, "Enhancement of aluminum, titanium, and
iron in glass using pre-ablation spark dual-pulse LIBS," Applied Spectroscopy, vol. 54,
pp. 1719-1726, 2000.
[69] D. N. Stratis, K. L. Eland, and S. M. Angel, "Effect of pulse delay time on a pre-ablation
dual-pulse LIBS plasma," Applied Spectroscopy, vol. 55, pp. 1297-1303, 2001.
[70] S. Nakamura, Y. Ito, K. Sone, H. Hiraga, and K.-i. Kaneko, "Determination of an iron
suspension in water by laser-induced breakdown spectroscopy with two sequential laser
pulses," Analytical Chemistry, vol. 68, pp. 2981-2986, 1996.
[71] R. Sattmann, V. Sturm, and R. Noll, "Laser-induced breakdown spectroscopy of steel
samples using multiple Q-switch Nd: YAG laser pulses," Journal of Physics D: Applied
Physics, vol. 28, pp. 2181, 1995.
[72] S. M. Angel, D. N. Stratis, K. L. Eland, T. Lai, M. A. Berg, and D. M. Gold, "LIBS using
dual-and ultra-short laser pulses," Fresenius' journal of analytical chemistry, vol. 369,
pp. 320-327, 2001.
[73] T. P. Evtushenko, "Investigation of air sparks by two synchronized lasers," Sov. Phys.
Tech.Phys-USSR, vol. 11, pp. 818-822, 1966.
[74] T. Evtushenko, G. Malyshev, G. Ostrovskaya, V. Semenov, and T. Y. Chelidze, "Study
of sparks in air by means of two synchronized lasers," Zh. Tekh. Fiz, vol. 36, pp. 1115,
1966.
[75] E. H. Piepmeier and H. V. Malmstadt, "Q-switched laser energy absorption in the plume
of an aluminum alloy," Anal. Chem., vol. 41, pp. 700-707, 1969.
[76] R. H. Scott and A. Strasheim, "Laser-induced plasmas for analytical spectroscopy,"
Spectrochim. Acta B, vol. 25, pp. 311-332, 1970.
[77] J. Scaffidi, J. Pender, W. Pearman, S. R. Goode, B. W. Colston, J. C. Carter, et al.,
"Dual-pulse laser-induced breakdown spectroscopy with combinations of femtosecond
and nanosecond laser pulses," Applied optics, vol. 42, pp. 6099-6106, 2003.
[78] C. Gautier, P. Fichet, D. Menut, and J. Dubessy, "Applications of double-pulse laser
induced breakdown spectroscopy (LIBS) in the collinear beam geometry to the elemental
References
89
analysis of different materials," Spectrochimica Acta Part B: Atomic Spectroscopy, vol.
61, pp. 210-219, 2006.
[79] C. Gautier, P. Fichet, D. Menut, J. L. Lacour, D. L. Hermite, and J. Dubessy, "Study of
the double-pulse setup with orthogonal beam geometry for laser-induced breakdown
spectroscopy," Spectrochimica Acta Part B: Atomic Spectroscopy, vol. 59, pp. 975-986,
2004.
[80] R. Ahmed and M. A. Baig, "A comparative study of single and double pulse laser
induced breakdown spectroscopy," Journal of applied physics". 106, pp. 033307, 2009.
[81] D. A. Cremers, L. J. Radziemski, and T. R. Loree, "Spectrochemical Analysis of Liquids
Using the Laser Spark," Applied Spectroscopy, vol. 38, pp. 721-729, 1984.
[82] D. Menut, P. Fichet, J. Lacour, A. Rivoallan, and P. Mauchien, "Micro-laser-induced
breakdown spectroscopy technique: a powerful method for performing quantitative
surface mapping on conductive and nonconductive samples " Appl. Optics, vol. 42, pp.
6063-6071, 2003.
[83] C. Gautier, P. Fichet, D. Menut, J. L. Lacour, D. L. Hermite, and H. Dubessy, "Main
parameters influencing the double-pulse laser-induced breakdown spectroscopy in the
collinear beam geometry," Spectrochimica Acta Part B: Atomic Spectroscopy, vol. 60,
pp. 792-804, 2005.
[84] J. Scaffidi, S. M. Angel, and D. A. Cremers, "Emission Enhancement Mechanisms in
Dual-Pulse LIBS," Anal. Chem., vol. 78, pp. 24-32, 2006.
[85] G. Cristoforetti, G. Lorenzetti, P. A. Benedetti, E. Tognoni, S. Legnaioli, and V.
Palleschi, "Effect of laser parameters on plasma shielding in single and double pulse
configurations during the ablation of an aluminium target.," J. Phys. D: Appl. Phys., vol.
42, pp. 225207, 2009.
[86] G. Cristoforetti, S. Legnaioli, V. Palleschi, E. Tognoni, and P. A. Benedetti, "Crater
drilling enhancement obtained in parallel non-collinear double-pulse laser ablation,"
Applied Physics A: Materials Science & Processing, vol. 98, pp. 219-225, 2010.
[87] Rhodes and T.William, Eds., Springer Series in Optical Sciences, 2014.
[88] A. Bertolini, G. Carelli, F. Francesconi, et al., "Modì: A new mobile instrument for in situ
double-pulse LIBS analysis," Analytical and Bioanalytical Chemistry, vol. 385, pp. 240-
247, 2006.
References
90
[89] L. St-Onge, M. Sabsabi, and P. Cielo, "Analysis of solids using laser-induced plasma
spectroscopy in double-pulse mode," Spectrochimica Acta Part B: Atomic Spectroscopy,
vol. 53, pp. 407-415, 1998.
[90] J. González, C. Liu, J. Yoo, X. Mao, and R. E. Russo, "Double-pulse laser ablation
inductively coupled plasma mass spectrometry," Spectrochimica Acta Part B: Atomic
Spectroscopy, vol. 60, pp. 27-31, 2005.
[91] D. N. Stratis, K. L. Eland, and S. M. Angel, "Dual-pulse LIBS using a pre-ablation spark
for enhanced ablation and emission," Applied Spectroscopy, vol. 54, pp. 1270-1274,
2000.
[92] R. Sanginés, V. Contreras, H. Sobral, and A. Robledo-Martinez, "Optimal emission
enhancement in orthogonal double-pulse laser-induced breakdown spectroscopy,"
Spectrochimica Acta Part B: Atomic Spectroscopy, vol. 110, pp. 139-145, 2015.
[93] NIST, "NIST atomic database, http://physics.nist.gov," NIST, Ed., ed. USA, 2018.
[94] S. J. Choquette, E. S. Etz, W. S. Hurst, D. H. Blackburn, and S. D. Leigh, "Relative
Intensity Correction of Raman Spectrometers: NIST SRMs 2241 Through 2243 for 785
nm, 532 nm, and 488 nm/514.5 nm Excitation " Applied Spectroscopy vol. 61, pp. 117-
129, 2007.
[95] I. B. Gornushkin, U. Panne, and J. D. Winefordner, "Linear correlation for identification
of materials by laser induced breakdown spectroscopy: Improvement via spectral filtering
and masking," Spectrochim. Acta B, vol. 64, pp. 1040-1047, 2009.
[96] S. U. Haq, L. Ahmat, M. Mumtaz, H. Shakeel, S.Mahmood, and A. Nadeem,
"Spectroscopic studies of magnesium plasma produced by fundamental and second
harmonics of Nd:YAG laser " Phys. of Plasma, vol. 22, pp. 083504, 2015.
[97] H. W. K. Tom, G. D. Aumiller, and C. H. Brito-Cruz, "Time-resolved study of laser-
induced disorder of Si surfaces," Phys. Rev. Lett., vol. 60, pp. 1438-41, 1988.
[98] K. Sokolowski-Tinten, J. Bialkowski, and D. V. D. Linde, "Ultrafast laser-induced order-
disorder transitions in semiconductors," Phys.Rev. B, vol. 51 pp. 14186–98, 1995.
[99] A. Rousse, C. Rischel, S. Fourmaux, I. Uschmann, S. Sebban, G.Grillon, et al., "Non-
thermal melting in semiconductors measured at femtosecond resolution," Nature, vol.
410, pp. 65-80, 2001.
References
91
[100] H. C. Liu, X. L. Mao, J. H. Yoo, R. E. Russo, and S. A. B., "Early phase laser induced
plasma diagnostics and mass removal during single-pulse laser ablation of silicon,"
Spectrochim. Acta B: Atomic Spectroscopy, vol. 54, pp. 1607-24, 1999.
[101] S. Pledif and K. Andrei, "Study of Silicon Plasma Produced by Nitrogen Laser,"
presented at the 17 Int. Conf. on Applied Electromagnetics and Communication,
Dubrovnik, Croatia, 2003.
[102] O. Samek, F. Leis, V. Margetic, R. Malina, K. Niemax, and R.Hergenröder, "Imaging of
the expansion of femtosecond-laser-produced silicon plasma atoms by off-resonant
planar laser-induced fluorescence.," Appl Opt., vol. 42, pp. 6001-5, 2003.
[103] X. Zeng, X. L. Mao, R. Greif, and R. E. Russo, "Experimental investigation of ablation
efficiency and plasma expansion during femtosecond and nanosecond laser ablation of
silicon," Appl.Phys. A, ol. 80, pp. 237-41, 2005.
[104] K. Amal, S. H. Elnaby, V. Palleschi, A. Salvetti, and M. A. Harith, "Comparison between
single- and double-pulse LIBS at different air pressures on silicon target, " Appl. phys. B,
vol. 83, pp. 651, 2006.
[105] J. S. Cowpe, R. D. Pilkington, J. S. Astin, and A. E. Hill, "The effect of ambient pressure
on laser-induced silicon plasma temperature, density and morphology," Journal of
Physics D: Applied Physics, vol. 42, pp. 165202, 2009.
[106] S. S. Harilal, C. V. Bindhu, R. C. Issac, V. P. N. Nampoori, and C. P. G. Vallabhan,
"Electron density and temperature measurements in a laser produced carbon plasma,"
Journal of Applied Physics, vol. 82, pp. 2140-2146, 1997.
[107] S. Hafeez, N. M. Shaikh, and M. A. Baig, "Spectroscopic studies of Ca plasma generated
by the fundamental, second, and third harmonics of a Nd:YAG laser," Laser and Particle
Beams vol. 26, pp. 41-50, 2008.
[108] R. K. Singh, O. W. Holland, and J. Narayan, "Theoretical model for deposition of
superconducting thin films using pulsed laser evaporation technique," Journal of Applied
Physics vol. 68, pp. 233, 1990.
[109] X. Hou, L. Pan, Y. Sun, Y. Li, and Y. He, "Study of the plasma produced from laser
ablation of a LBO crystal," Appl. Surf. Sci. , vol. 227, pp. 325-330, 2004.
[110] M. Ying, Y. Xia, Y. Sun, M. Zhao, Y. Ma, X. Liu, et al., "Plasma properties of a laser-
ablated aluminum target in air," Laser and Particle Beams, vol. 21, pp. 97-101, 2003.
References
92
[111] N. Ying, Y. Xia, Y. Sun, Q. Lu, M. Zho, and X. Liu, "Study of the plasma produced from
laser ablation of a KTP crystal," Appl. Surf. Sci., vol. 207, pp. 227-235, 2003.
[112] M. Khaleeq-ur-Rahman, K. Siraj, M. S. Rafiq, K. A. Bhatti, A. Latif, H. Jamil, et al.,
"Laser Induced Plasma Plume Imaging And Surface Morphology Of Silicon " Nucl.
Instrum. and Methods in Phys. Rev. B, vol. 267, pp. 1085-1088, 2009.
[113] J. A. Aguilera, C. Aragón, and F. Penalba, "Plasma shielding effect in laser ablation of
metallic samples and its influence on LIBS analysis," Appl. Surf. Sci., vol. 127, pp. 309-
314, 1998.
[114] G. Bekefi, Principles of Laser Plasma. New York: Wiley-Inter science, 1976.
[115] D. A. Skoog, D. M. West, F. J. Holler, and S. R. Crouch, Fundamental of Analytical
Chemistry. Holt, London: Saunders College Publishing, 1996.
[116] B. Salle, J. L. Lacour, P. Mauchien, P. Fichet, S. Maurice, and G. Manhes, "Comparative
study of different methodologies for quantitative rock analysis by Laser-Induced
Breakdown Spectroscopy in a simulated Martian atmosphere," Spectrochimica Acta Part
B: Atomic Spectroscopy, vol. 61, pp. 301-313, 2006.
[117] A. C. Chale, P. Mauchien, N. Andre, J. Uebbing, J. L. Lacour, and C. Geertsen,
"Correction of Matrix Effects in Quantitative Elemental AnalysisWith Laser Ablation
Optical Emission Spectrometry," J. Anal. At. Spectrom., vol. 12, pp. 183-188, 1997.
[118] N. Xu, V. Bulatov, V. V. Gridin, and I. Schechter, "Absolute Analysis of Particulate
Materials by Laser-Induced Breakdown Spectroscopy," Anal. Chem., vol. 69, pp. 2103-
2108, 1997.
[119] U. Panne, C. Haisch, M. Clara, and R. Niessner, "Analysis of glass and glass melts during
the vitrification process of fly and bottom ashes by laser-induced plasma spectroscopy.
Part I: Normalization and plasma diagnostics," Spectrochimica Acta Part B: Atomic
Spectroscopy, vol. 53, pp. 1957-1968, 1998.
[120] C. Aragon, J. A. Aguilera, and F. Penalba, "Improvements in Quantitative Analysis of
Steel Composition by Laser-Induced Breakdown Spectroscopy at Atmospheric Pressure
Using an Infrared Nd:YAG Laser," Applied Spectroscopy., vol. 53, pp. 1259-1267, 1999.
[121] A. Ciucci, M. Corsi, V. Palleschi, S. Rastelli, A. Salvetti, and E. Tognoni, "New
Procedure for Quantitative Elemental Analysis by Laser-Induced Plasma Spectroscopy,"
Appl. Spectroscopy, vol. 53, pp. 960-964, 1999.
References
93
[122] M. Corsi, G. Cristoforetti, V. Palleschi, A. Salvetti, and E. Tognoni, "A fast and accurate
method for the determination of precious alloys caratage by Laser Induced Plasma
Spectroscopy," Eur. Phys. J. D, vol. 13, pp. 373-377, 2001.
[123] L. Fornarini, F. Colao, R. Fantoni, V. Lazic, and V. Spizzicchino, "Calibration analysis
of bronze samples by nanosecond laser induced breakdown spectroscopy: A theoretical
and experimental approach," Spectrochimica Acta Part B: Atomic Spectroscopy, vol. 60,
pp. 1186-1201, 2005.
[124] V. S. Burakov and S. N. Raikov, "Quantitative analysis of alloys and glasses by a
calibration-free method using laser-induced breakdown spectroscopy," Spectrochimica
Acta Part B: Atomic Spectroscopy, vol. 62, pp. 217-223, 2007.
[125] E. Tognoni, G. Cristoforetti, S. Legnaioli, V. Palleschi, A. Salvetti, M. Mueller, et al., "A
numerical study of expected accuracy and precision in Calibration-Free Laser-Induced
Breakdown Spectroscopy in the assumption of ideal analytical plasma," Spectrochimica
Acta Part B: Atomic Spectroscopy, vol. 62, pp. 1287-1302, 2007.
[126] K. K. Herrera, E. Tognoni, N. Omenetto, B. W. Smith, and D. Winefordner, "Semi-
quantitative analysis of metal alloys, brass and soil samples by calibration-free laser-
induced breakdown spectroscopy: recent results and considerations " J. Anal. At.
Spectrom., vol. 24, pp. 413-425, 2009.
[127] F. Colao, R. Fantoni, V. Lazic, A. Paolini, F. F. Abbri, G. G. Ori, et al., "Investigation of
LIBS feasibility for in situ planetary exploration: An analysis on Martian rock
analogues," Planet Space Sci. , vol. 52, pp. 117, 2004.
[128] E. Tognoni, G. Cristoforetti, S. Legnaioli, and V. Palleschi, "Calibration-Free Laser-
Induced Breakdown Spectroscopy: State of the art," Spectrochimica Acta Part B: Atomic
Spectroscopy, vol. 65, pp. 1-14, 2010.
[129] A. D. Giacomo, M. Dell'aglio, O. D. Pascale, R. Gaudiuso, R. Teghil, A. Santagata, et al.,
"ns- and Fs-LIBS of copper-based-alloys: a different approach," Appl. Surf. Sci., vol. 253,
pp. 7677-7681, 2007.
[130] J. A. Aguilera, C. Aragón, G. Cristoforetti, and E. Tognoni, "Application of calibration-
free laser-induced breakdown spectroscopy to radially resolved spectra from a copper-
based alloy laser-induced plasma," Spectrochimica Acta Part B: Atomic Spectroscopy,
vol. 64, pp. 685-689, 2009.
References
94
[131] X. H. Zou, L. B. Guo, M. Shen, X. Y. Li, Z. Q. Hao, Q. D. Zeng, et al., "Accuracy
improvement of quantitative analysis in laser-induced breakdown spectroscopy using
modified wavelet transform.," Opt. Express, vol. 22, pp. 10233, 2014.
[132] M. Corsi, G. Cristoforetti, M. Hidalgo, S. Legnaioli, V. Palleschi, A. Salvetti, et al.,
"Application of laser-induced breakdown spectroscopy technique to hair tissue mineral
analysis.," Appl. Opt. , vol. 42, pp. 6133-37, 2003.
[133] J. Dong, L. Liang, J. Wei, H. Tang, T. Zhang, X. Yang, et al., "A method for improving
the accuracy of calibration-free laser-induced breakdown spectroscopy (CF-LIBS) using
determined plasma temperature by genetic algorithm (GA)," J. Anal. At. Spectrom, vol.
30, 2015.
[134] K. Unnikrishnan, K. Mridul, R. Nayak, K. Alti, V. B. Kartha, C. Santhosh, et al.,
"Calibration-free laser-induced breakdown spectroscopy for quantitative elemental
analysis of materials," Pramana - J. Phys., vol. 79, pp. 299-310, 2012.
[135] G. Coletti, D. Macdonald, and D. Yang, Role of impurities in solar silicon. United
Kingdom: John Wiley and Sons, 2012.
[136] M. D. Sabatino, A. L. Dons, J. Hinrichs, and L. Arnberg, "Determination of relative
sensitivity factors for trace element analysis of solar cell silicon by fast-flow glow
discharge mass spectrometry," Spectrochimica Acta Part B: Atomic Spectroscopy, vol.
66, pp. 144-148, 2011.
[137] M. Horňáčková, M. Horňáček, J. Rakovsk, P. Hudec, and P. Veis, "Determination of
Si/Al molar ratios in microporous zeolites using calibration-free laser induced breakdown
spectroscopy," Spectrochimica Acta Part B: Atomic Spectroscopy, vol. 88, pp. 69-74,
2013.
[138] V. Contreras, "Double-Pulse and Calibration-Free Laser-Induced Breakdown
Spectroscopy (LIBS) on quantitative analysis," PhD, Centro de Investigaciones en
Optica AC, CIO, Mexico, 2013.
[139] S. A. M. Mansour, "Self-Absorption Effects on Electron Temperature-Measurements
Utilizing Laser Induced Breakdown Spectroscopy (LIBS)-Techniques," Opt.
Photonics.J, vol. 5, pp. 79-90, 2015.
References
95
[140] C. Aragon, J. Bengoechea, and J. A. Aguilera, "Influence of the optical depth on spectral
line emission from laser-induced plasmas," Spectrochimica Acta Part B: Atomic
Spectroscopy, vol. 56, pp. 619-628, 2001.
[141] D. Bulajic, M. Corsi, G. Cristoforetti, S. Legnaioli, V. Palleschi, A. Salvetti, et al., "A
procedure for correcting self-absorption in calibration free-laser induced breakdown
spectroscopy," Spectrochimica Acta Part B: Atomic Spectroscopy, vol. 57, pp. 339–353,
2002.
[142] L. Sun and H. Yu, "Correction of self-absorption effect in calibration-free laser-induced
breakdown spectroscopy by an internal reference method," Talanta, vol. 79, pp. 388–395,
2009.
[143] B. Praher, V. Palleschi, R. Viskup, J. Heitz, and J. D. Pedarnig, "Calibration free laser-
induced breakdown spectroscopy of oxide materials," Spectrochim. Acta B, vol. 65, pp.
671-679, 2010.
[144] J. P. Singh and S. N. Thakur, Laser-induced breakdown spectroscopy: Elsevier, 2007.
[145] A. K. Rai, V. N. Rai, F. U. Yueh, and J. P. Singh, "Laser-induced breakdown
spectroscopy: a versatile technique for elemental analysis," Recent Trends Appl.
Spectrosc., vol. 4, pp. 165–214, 2003.
[146] V. S. Burakov, V. V. Kiris, P. A. Naumenkov, and S. N. Raikov, "Calibration-free laser
spectral analysis of glasses and copper alloys," Journal of Applied Spectroscopy, vol. 71,
pp. 740-746, 2004.
[147] D. Pace, R.E.Miguel, H. Rocco, F. García, L.Pardini, S.Legnaioli, et al., "Quantitative
analysis of metals in waste foundry sands by calibration free-laser induced breakdown
spectroscopy," Spectrochimica Acta Part B: Atomic Spectroscopy, vol. 131, pp. 58-65,
2017.
[148] G. Agrosi, G. Tempesta, E. Scandale, S. Legnaioli, G. Lorenzetti, S. Pagnotta, et al.,
"Application of laser induced breakdown spectroscopy to the identification of emeralds
from different synthetic processes," Spectrochimica Acta Part B: Atomic Spectroscopy,
vol. 102, pp. 48–51, 2014.
[149] V. Contreras, M. A. M. Nava, O. B. García, J. L. Maldonado, and G. R. Ortiz, "Double-
pulse and calibration-free laser-induced breakdown spectroscopy at low-ablative
energies," Opt. Lett., vol. 37, pp. 4591–4593, 2012.
References
96
[150] Y. Duan, M. Xu, Q. Lin, G. Yang, T. Xu, T. Zhang, et al., "A single-beam-splitting
technique combined with a calibration-free method for fielddeployable applications using
laser-induced breakdown spectroscopy," RSC Adv., vol. 5, pp. 4537–4546, 2015.
[151] C. Claeys and E. Simoen, Germanium-Based Technologies: Elsevier Science,, 2007.
[152] E. Kasper, C. Klingshirn, and K. Mattiensen, Group IV Quantum Structures vol. C34/3:
Springer Verlag, 2007.
[153] H. Fu, F. Dong, Z. Ni, and J. Wang, "The Influence of Acquisition Delay for Calibration-
Free Laser-Induced Breakdown Spectroscopy," Applied Spectroscopy, vol. 70, pp. 405-
415, 2016.
[154] L. Patatut, M. Sérasset, H. Lignier, D. Pelletier, P. Bouchard, M. Sabsabi, et al., "In-situ
chemical analysis of molten photovoltaic silicon by Laser Induced Breakdown
Spectroscopy," presented at the 42nd Photovoltaic Specialist Conference (PVSC), NEW
ORLEANS, LA, 2015.
[155] S. H. Lee, C. K. Kim, J. H. In, and S. H. Jeong, "Rapid composition analysis of
compound semiconductor thin film solar cell by laser induced breakdown spectroscopy,"
in Laser Applications in Microelectronic and Optoelectronic Manufacturing (LAMOM)
XIX, San Francisco, California, 2014.
[156] D. Romero, J. M. F. Romero, and J. J. Romero, "Distribution of metal impurities in
silicon wafers using imaging-mode multi-elemental laser-induced breakdown
spectrometry," J. Anal. At. Spectrom, vol. 14, pp. 199-204, 1999.
[157] P. A. Benedetti, G. Cristoforetti, S. Legnaioli, V. Palleschi, L. Pardini, A. Salvetti, et al.,
"Effect of laser pulse energies in laser induced breakdown spectroscopy in double-pulse
configuration," Spectrochimica Acta Part B: Atomic Spectroscopy, vol. 60, pp. 1392–
1401, 2005.
[158] G. Cristoforetti, G. Lorenzetti, S. Legnaioli, and V. Palleschi, "Investigation on the role
of air in the dynamical evolution and thermodynamic state of a laser-induced aluminum
plasma by spatial and time-resolved spectroscopy," Spectrochimica Acta Part B: Atomic
Spectroscopy, vol. 65, pp. 787–796, 2010.
[159] G. S. Senesi, P. A. Benedetti, G. Cristoforetti, S. Legnaioli, and V. Palleschi, "Hydrogen
Balmer α line behavior in laser-induced breakdown spectroscopy depth scans of Au, Cu,
References
97
Mn, Pb targets in air," Spectrochimica Acta Part B: Atomic Spectroscopy, vol. 65, pp.
557-564, 2010.
[160] kurucz, "kurucz database," pmp.uni-hannover, Ed., ed, 2018.
[161] E. Grifoni, S. Legnaioli, M. Lezzerini, G. Lorenzetti, S. Pagnotta, and V. Palleschi,
"Extracting time-resolved information from time-integrated laser-induced breakdown
spectra," Journal of Spectroscopy vol. 1-5, pp. 849310, 2014.
[162] G. Cristoforetti, A. D. Giacomo, M. Dell'Aglio, S. Legnaioli, E. Tognoni, V. Palleschi, et
al., "Local Thermodynamic Equilibrium in Laser-Induced Breakdown Spectroscopy:
Beyond the McWhirter criterion," Spectrochimica Acta Part B: Atomic Spectroscopy,
vol. 65, pp. 86–95, 2010.
[163] H. Shakeel, S. U. Haq, G. Aisha, and A. Nadeem, "Quantitative analysis of Al-Si alloy
using calibration free laser induced breakdown," Physics of Plasmas, vol. 24, pp. 063516,
2017.
[164] M. D. Sabatino, A. L. Dons, J. Hinrichs, and L. Arnberg, "Determination of relative
sensitivity factors for trace element analysis of solar cell silicon by fast-flow glow
discharge mass spectrometry," Spectrochimica Acta Part B: Atomic Spectroscopy:, vol.
66, pp. 144-148, 2011.