Embed Size (px)
Citation preview

Journal of Food Engineering 9 (1989) 305-320
Thin-Layer Drying of Melon Seed
0.0. Ajibola
Department of Agricultural Engineering, Obafemi Awolowo University, Ile-Ife, Nigeria
(Received 1 October 1988; revised version received 25 February 1989; accepted 31 March 1989)
ABSTRACT
Moisture equilibrium data and thin-layer drying rates for melon seeds at different temperatures (4O”C- 70°C) and relative humidities (ZO%-88%) were determined using static gravimetric methods. A nonlinear least- squares regression program was used to evaluate five desorption isotherm models and three thin-layer drying models. The modified Halsey model gave the least standard error of estimate of 0.4% for equilibrium moisture content and 4.8% for equilibrium relative humidity. None of the three thin-layer drying models used to evaluate the thin-layer drying results was significantly better than the others in predicting drying. The exponential model in which the drying constant is a function of temperature and relative humidity was found adequate for predicting thin-layer drying of melon seed.
NOTATION
A Constant in eqn (6) B Constant in eqn (6) c Constant in eqn (7)
G c2 Constants in eqn (8) D Moisture diffusion coefficient ( m2 h- ’ ) H Relative humidity (Oh)
He_ Equilibrium relative humidity (%) K Constant in eqn (3)
&I Constant in eqn (7)
K, Constant in eqn (4)
K2 Constant in eqn (6) M Moisture content at any time (Ok dry basis)
305 Journal of Food Engineering 0260-8774/89/$03.50 - 0 1989 Elsevier Science Publishers Ltd, England. Printed in Great Britain
306 0. 0. Ajibola
Me Mf Mi
N t T
T,
Equilibrium moisture content (Oh dry basis) Local moisture concentration (kg m-“) Initial moisture content (% dry basis) Constant in eqn (4) Time (h) Temperature (K) Temperature (“C)
INTRODUCTION
Melon seed (Culocynthis citrullus L.) is a common Nigerian oilseed which is gaining popularity because of its high content of good quality oil and the high protein content of the residual cake after oil extraction. It contains approximately 50% by weight of oil, 28.4% protein (60% of the defatted flour), 2.7% fibre, 3.6% ash and 8.2% carbohydrate (Oyenuga & Fetuga, 1975). The seed is a good source of essential amino acids, especially arginine, tryptophan and methionine, vitamins B, and B, and niacin, and minerals such as sulphur, calcium, magnesium, manganese, potassium, phosphorus, iron and zinc (Akobundu et al., 1982). Whole melon seeds are dry-roasted and consumed as a snack or used in several preparations that vary with the food habits of the people. The partially defatted seed meal is made into patties which serve as a meat substitute. The oil contains mostly linoleic (62.8%) and oleic (159%) acids. Its high content of unsaturated fatty acid shows that it can be a good substitute for maize oil in diets intended to reduce high levels of blood cholesterol, thereby increasing demand for the product. This has led to increased production of the seed, and a significant fraction of the production is now processed for vegetable oil.
Efficient processing and storage of melon seed require that its high post-harvest moisture content be reduced considerably. This is normally achieved by sun-drying in small batches. However, increased production has necessitated the mechanization of the drying as well as other post- harvest processes such as decortication. The efficiency of many of these processes depends on the moisture content of the seeds. Proper control of water activity is also essential to prevent mould growth and to main- tain the quality of oil in the seed. It is therefore necessary to design and simulate accurately drying systems for melon seeds. This, however, requires knowledge of such seed properties as their sorption and thin- layer drying characteristics under different conditions. The objective of this study was therefore to determine the desorption isotherm and the thin-layer drying characteristics of melon seeds and to develop models to represent them.

Thin-layer drying of melon seed 307
LITERATURE REVIEW
Much work has been done on the determination of the equilibrium moisture content of agricultural products. Data for many crops are reported in ASAE (1983). Several workers have developed theoretical and empirical models of the form
He =f ‘(My T ) (2) Five such models are presented in Table 1. These models have been tested and their constants evaluated for many agricultural crops (Duggal et al., 1982; White et al., 1985; Ajibola, 1986~; Flood et al., 1987). No data have been found on the water relations of melon seed.
Thin-layer drying characteristics of agricultural products are usually presented in the form of mathematical models with constants related to the drying conditions. Many such models have been published and, while none have been derived from melon seed drying data, it is to be expected that some of the models may be applicable to melon seeds. Three such models are reviewed below.
TABLE 1 Equilibrium Moisture Content - Equilibrium Relative Humidity Models
Name of model Solution for equilibrium moisture contenP
Solution for equilibrium relative humidity”
Henderson M = ln(l-He) ““I
(Henderson, 1952) e [ 1 -aT 1 - H, = exp( - aTM,h)
Chung-Pfost (Chung & Pfost, 1967)
Modified Halsey (Iglesias & Chirife, 1971)
H.=exp[ -exp~~bT)]
Chen-Clayton (Chen & Clayton,
H, = exp[ - aTb exp( - cTdMC)]
1971) -
Henderson-Thompson (Thompson, 1972)
l-H,=exp[-a(T,+b)M:]
‘a, 6, c, d = Constants for the models.

308 0. 0. Ajibola
Exponential model
The exponential model is one of the simplest models used in describing thin-layer drying of agricultural products. The model assumes that the internal resistance to moisture movement is negligible and that the resistance is concentrated at the surface of the material. It is also referred to as the simple ‘lumped’ model, being analogous to Newton’s law of cooling. It is of the form
M-M, M. _M =expkW
1 e
This model has been used by Ross and White (1972) to study the drying characteristics of white and yellow corn; by White et al. (1981) in their study of the drying behaviour of fully exposed popcorn, and by Verma et al. (1985) in describing thin-layer drying of rice. It was selected for the current study because of its simplicity and ease of application. The constant K is usually related to the initial moisture content of the food and the temperature and relative humidity of the drying air.
Page’s model
Page (1949) suggested a two-constant empirical model for describing thin-layer drying of agricultural crops. It is a modified form of eqn (3) and is expressed as
M-M, M. _M =expNW)
1 e
The constants K, and N are determined experimentally. The model has been used by Wang and Singh (1978) to describe the drying charac- teristics of rough rice; by White et al. (1981) in the drying of soya beans; and by Li and Morey (1987) in the study of the thin-layer drying of American ginseng. In these studies K, and N were related to initial moisture content, air temperature and air relative humidity. In studies comparing Page’s model with other commonly used thin-layer models, the model was found to give the best fit for thin-layer drying data are in- shell pecan (Chinnan, 1984) and sunflower seed (Syarief et al., 1984).
Diffusion model
The diffusion model (using Fick’s second law) has been used to describe drying in the falling-rate period. It assumes that the resistance to

Thin-layer drying of melon seed 309
moisture flow is distributed throughout the material and not concentrated at the surface (Crank, 197 5). The model is of the form
The solution to this equation consists of series of negative exponential terms, independent of geometry or boundary conditions (Newman, 1931) or moisture-dependent diffusivity (Chu & Hustrulid, 1968). Sharaf-Eldeen et al. (1980) found that two terms of the general solution form of the equation were sufficient to describe the drying of ear corn. Their equation is of the form
,“-2 =A exp(-K,t)+(l -A)exp(-BK,t) I e
(6)
The model has been used by Graham et al. (1983) to describe the drying of wheat and corn and by Verma et al. (1985) to describe the drying of rice.
EXPERIMENTAL PROCEDURE
The melon seeds used in this study were obtained from the local market. The seeds had an initial moisture content of 21.6% (dry basis) and were of the variety Bara.
Equilibrium moisture content determination
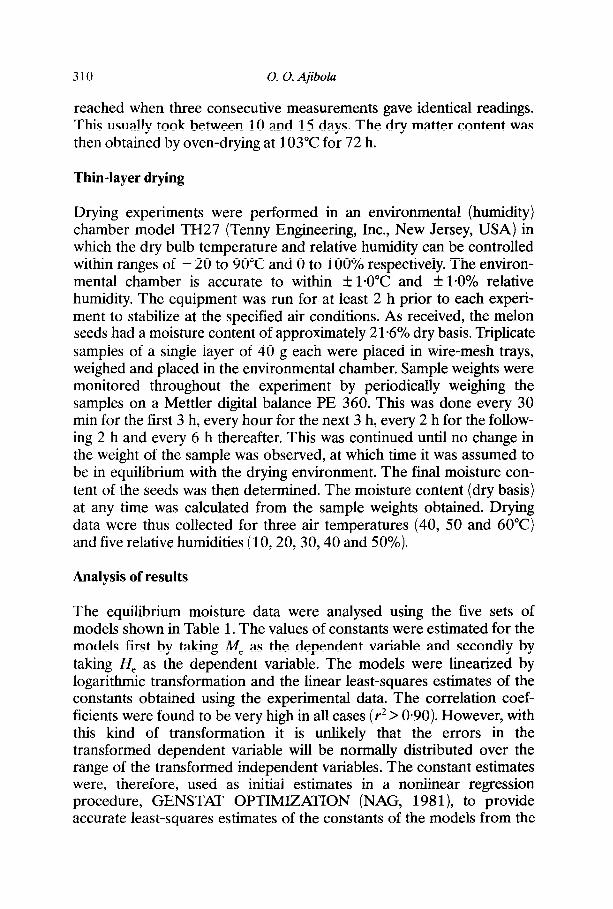
A static gravimetric technique of equilibrium moisture content (MJ determination was used. Duplicate samples each of about 15 g were placed in wire baskets which were placed inside desiccators. Saturated salt solutions were used to maintain the relative humidity inside the desiccator and it was ensured that there was excess salt in the solution throughout the course of the experiment. The desiccators were placed inside temperature-controlled Gallenkamp DV 400 ovens which were set at 40, 50,60 and 70°C. The oven temperatures were monitored and controlled to within + l.O”c. The salts are listed in Table 2, together with literature values for their relative humidities (Young, 1967) at the four different temperatures used.
The samples were weighed daily using a Mettler PC 2000 balance with an accuracy of 0.01 g. Equilibrium was considered to have been
310 0. 0. Ajibola
reached when three consecutive measurements gave identical readings. This usually took between 10 and 15 days. The dry matter content was then obtained by oven-drying at 103°C for 72 h.
Thin-layer drying
Drying experiments were performed in an environmental (humidity) chamber model TH27 (Tenny Engineering, Inc., New Jersey, USA) in which the dry bulb temperature and relative humidity can be controlled within ranges of - 20 to 90°C and 0 to 100% respectively. The environ- mental chamber is accurate to within + l*O”C and f 1.0% relative humidity. The equipment was run for at least 2 h prior to each experi- ment to stabilize at the specified air conditions. As received, the melon seeds had a moisture content of approximately 21.6% dry basis. Triplicate samples of a single layer of 40 g each were placed in wire-mesh trays, weighed and placed in the environmental chamber. Sample weights were monitored throughout the experiment by periodically weighing the samples on a Mettler digital balance PE 360. This was done every 30 min for the first 3 h, every hour for the next 3 h, every 2 h for the follow- ing 2 h and every 6 h thereafter. This was continued until no change in the weight of the sample was observed, at which time it was assumed to be in equilibrium with the drying environment. The final moisture con- tent of the seeds was then determined. The moisture content (dry basis) at any time was calculated from the sample weights obtained. Drying data were thus collected for three air temperatures (40, 50 and 60°C) and five relative humidities (10,20,30,40 and 50%).
Analysis of results
The equilibrium moisture data were analysed using the five sets of models shown in Table 1. The values of constants were estimated for the models first by taking M, as the dependent variable and secondly by taking He as the dependent variable. The models were linearized by logarithmic transformation and the linear least-squares estimates of the constants obtained using the experimental data. The correlation coef- ficients were found to be very high in all cases (r* > 0.90). However, with this kind of transformation it is unlikely that the errors in the transformed dependent variable will be normally distributed over the range of the transformed independent variables. The constant estimates were, therefore, used as initial estimates in a nonlinear regression procedure, GENSTAT OPTIMIZATION (NAG, 198 1 ), to provide accurate least-squares estimates of the constants of the models from the
Thin-layer drying of melon seed 311
TABLE 2 Relative Humidities of the Saturated Salt Solution at the Temperatures Used (Young,
1967)
Salt Temperature (“C)
40 50 60 70
Sodium hydroxide 7.0 7.0 7.0 7.0 Lithium chloride 11.8 11.4 11.2 11.1 Calcium chloride 22 21 21 20 Potassium carbonate 48 47 46 46 Magnesium nitrate 51 50 50 50 Sodium nitrate 61 60 60 60 Sodium nitrite 71 71 69 69 Potassium chloride 82 81 80 80 Barium chloride 89 89 88 88
experimental results. The procedure also calculated the standard error of the predicted value as a percentage of the mean to give a comparison of the relative ‘goodness of fit’ of the resulting models. The smaller the standard error, the better the model was taken to be.
The thin-layer drying results obtained were analysed using the exponential, Page and diffusion models. The first two models were linearized by logarithmic transformations to obtain initial estimates of the constants which were used for non-linear regression in GENSTAT OPTIMIZATION. The initial estimate of the diffusion model was obtained by linearization of the model with only the first term. Thus initial estimates of A and K, were obtained and 1.0 was used as the initial estimate for B. These estimates were then used for non-linear regression in GENSTAT OPTIMIZATION. The ‘goodness of fit’ of the drying models was based on the value of residual mean squares calculated by the optimization procedure. The smaller the residual mean square, the better the model was taken to be.
RESULTS AND DISCUSSION
Equilibrium moisture content
The experimental values of iW, expressed as percent dry basis at the different temperatures and relative humidities are presented in Fig. 1. Averages of duplicates are shown. Conventionally, equilibrium moisture content was found to increase with decrease in temperature at constant

312 0. 0. Ajibola
relative humidity and to increase with increase in relative humidity of air when temperature was kept constant. It was not possible to obtain equilibrium at relative humidities above 90% due to mould growth before equilibrium was reached.
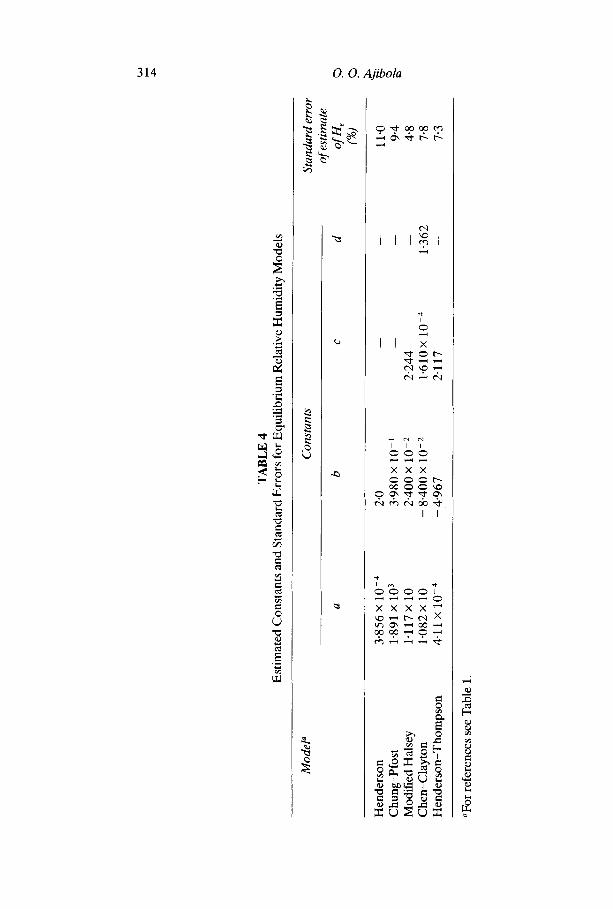
The estimated constants and the corresponding standard errors of estimates for the M, models of Table 1 are presented in Table 3, while the estimated constants with the associated standard error of estimates for the He models are shown in Table 4. The different analyses provide flexibility in that the model and associated constants which best suit a particular situation can be selected. An examination of Tables 3 and 4 indicates that the constants obtained for models representing A4, are not the same as the corresponding constants in the corresponding expres- sions for He. These differences have also been noted for other crops by Duggal et al. (1982) and Ajibola (1986~). The Me models were obtained by logarithmic transformations of the He models and, in the nonlinear regression analysis, the errors were assumed to be normally and independently distributed. These caused some distortions in the models, thereby causing the corresponding model constants to take on different least-square values.
The smallest standard error of estimate of Me (0.4%) was obtained by using the modified Halsey model (Table 3). It is, however, observed that the other four models give low standard errors of estimates, the greatest error being 1.0% for the Chung-Pfost model. This value is still less than the values quoted by ASAE Standard D243.4 (ASAE, 1983) as standard errors of estimate for soya beans using the modified Henderson
10 20 30 40 Relative humdlty P/J
Fig. 1. Experimental equilibrium moisture content results for melon seed and predicted desorption isotherms using modified Halsey model. Temperature: X ,4o"C; 0,
50°C; A, 60°C; 0,7o”C.
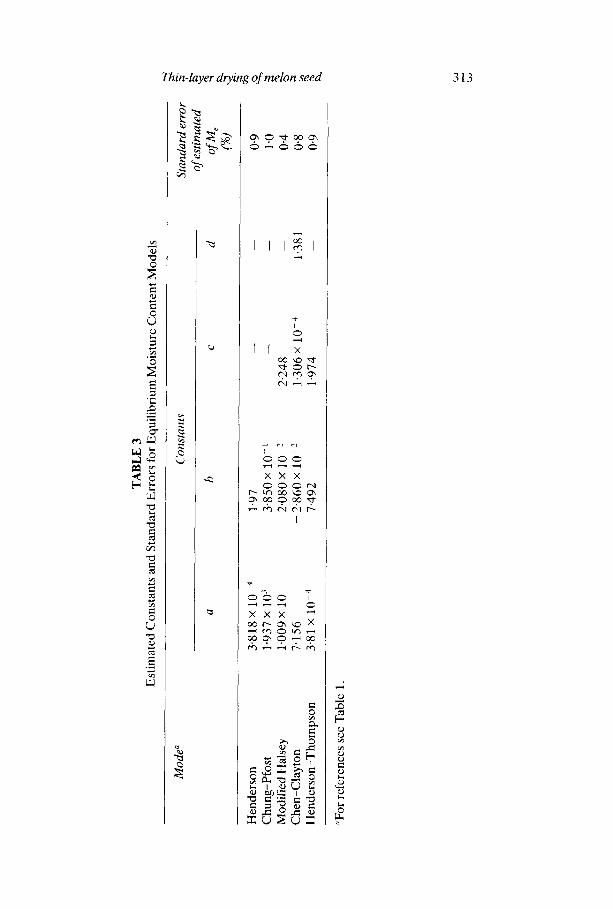
Thin-layer drying of melon seed 313
TA
BL
E
4 E
stim
ated
C
onst
ants
an
d St
anda
rd
Err
ors
for
Equ
ilibr
ium
R
elat
ive
Hum
idity
M
odel
s
Mod
el0
a
Con
stan
ts
Stan
dard
er
ror
of e
stim
ate
b c
d O
fHe
(W
Hen
ders
on
3.85
6 x
1O-4
2.
0 -
- 11
.0
Chu
ng-P
fost
1.
891
x lo
3 3.
980
x 10
-l
- -
9.4
Mod
ifie
d H
alse
y 1.
117
x 10
2.
400
x 1O
-2
2.24
4 -
4.8
Che
n-C
layt
on
1.08
2 x
10
- 8.
400
x lo
-”
1.61
0 x
1O-4
1.
362
7.8
Hen
ders
on-T
hom
pson
4.
11 x
10-
4 -
4.96
7 2.
117
- 7.
3
“For
ref
eren
ces
see
Tab
le
1.
Thin-layer drying of melon seed 315
model (1.7%) and the Chung model (l-9%), and is similar to the standard error obtained for winged bean (0*9%) using the modified Halsey model (Ajibola, 1986b). The smallest standard error of estimate of He (4.8%) was obtained by using the modified Halsey model (Table 3). This is similar to the value of 4.5% obtained when the modified Halsey model was fitted to winged bean data ( Ajibola, 1986 b ).
Figure 1 shows a comparison of the equilibrium moisture data obtained and the isotherm using the modified Halsey (M,) model. The deviations of the data from the model were large at relative humidity values of 20% and 90%. At other relative humidity values the deviations were not more than 1%.
Thin-layer drying
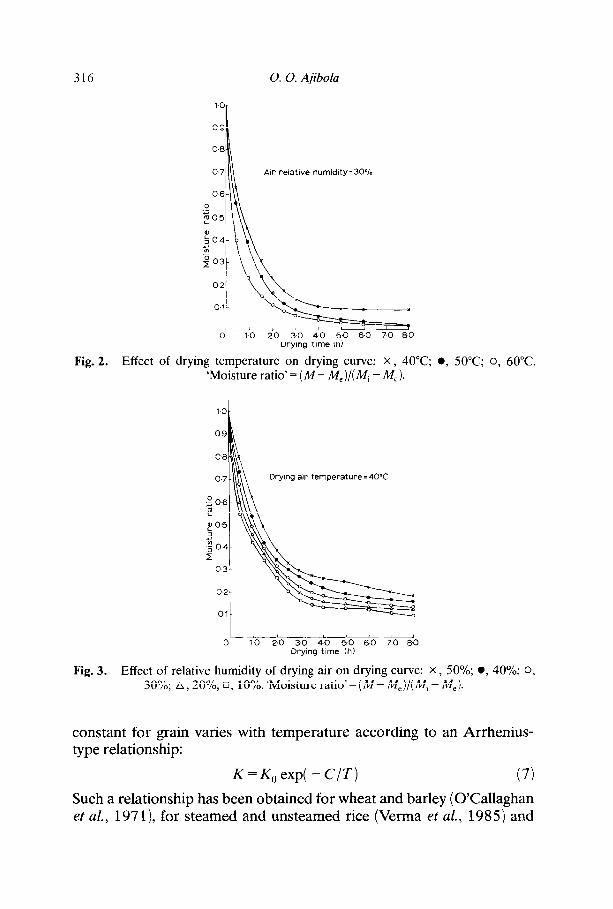
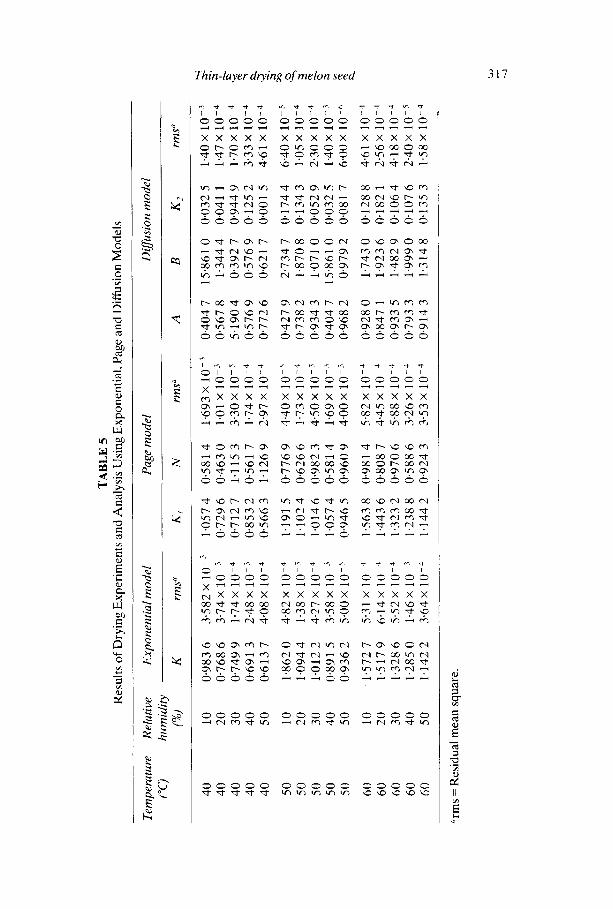
In the analysis of the thin-layer drying data, knowledge of the equili- brium moisture content associated with a given set of drying conditions (drying temperature and relative humidity) is essential for determining the dimensionless moisture ratios, (A4 - M,)]( Mi - hi,), used in the model equations (3), (4) and (6). Equilibrium moisture content was computed based on the final drying weight for each of the experimental conditions. These values were observed to be quite close to the values predicted by the modified Halsey model, the difference being less than 1% for all conditions. An error of 1% has a relatively small effect on the calculated moisture ratio, since the initial moisture contents were significantly greater than the final moisture content. Typical drying curves of moisture ratio versus drying time are shown in Figs 2 and 3. All the normal drying characteristics such as decrease in drying rate with time, temperature decrease and humidity increase were observed. For most experiments equilibrium was reached within about 72 h. The drying results obtained were analysed by means of the exponential, Page and diffusion models. Estimated model constants and the corresponding mean-square devia- tions (sum of squares of deviations between experimental and predicted moisture ratios, divided by degrees of freedom) are presented in Table 5 for the exponential, Page and diffusion models.
Paired t-tests revealed no significant differences in the mean square deviation for all the models at the 5% level. It was therefore concluded that no model appeared to give a significantly better prediction than any other in the thin-layer drying of melon seed. The exponential model is, however, preferred because it is simple and requires the estimation of only one model constant (K).
The effects of drying air temperature and relative humidity on K were evaluated. Henderson and Pabis (196 1) have shown that the drying
316 0. 0. Ajibola
Air relattve humidlty=30%
Fig. 2. Effect of drying temperature on drying curve: X, 40°C; 0, 50°C; 0, 60°C. ‘Moisture ratio’ = (A4 - M,)/( Mi - Me).
08
07
2 0.6
e
fO5 3 ;; 504
Iz
03
Drying air temperature =4O’C
o-2
01
I 1 I I I ,
0 10 2.0 30 40 50 6.0 7-O 80 Drying time (h)
Fig. 3. Effect of relative humidity of drying air on drying curve: x , 50%; l , 40%; 0, 30%; A, 20%; 0, 10%. ‘Moisture ratio’=(M- M,)/(M, -MC).
constant for grain varies with temperature according to an Arrhenius- type relationship:
K =K,, exp( - C/T) (7)
Such a relationship has been obtained for wheat and barley (O’Callaghan et al., 197 1 ), for steamed and unsteamed rice (Verma et al, 1985) and
TA
BL
E
5 R
esu
lts
of D
ryin
g E
xper
imen
ts
and
An
alys
is
Usi
ng
Exp
onen
tial
, P
age
and
Dif
fusi
on
Mod
els
Tem
pera
ture
R
elat
ive
CY)
hu
mid
ity
Exp
onen
tial
mod
el
(%)
K
rms”
K
,
Pag
e m
odel
N
rmso
A
Di#
usio
n m
odel
B
K,
40
40
40
40
40
50
50
50
50
50
60
60
60
60
60
10
20
30
40
50
10
20
30
40
50
10
20
30
40
50
0983
6
0.76
8 6
0749
9
0.69
1 3
0.61
3 7
1.86
2 0
1.09
4 4
1.01
2 2
0.89
1 5
0.93
6 2
1.57
2 7
1.51
7 9
1.32
8 6
1.28
5 0
1.14
2 2
3.58
2 x
lo-”
1.
057
4 3.
74 x
10-
3 0.
723
6 1.
74 x
10-
3 0.
712
7 2.
48 x
10-
j 0.
853
2 4.
08 x
lo-
” 0.
566
3
4.82
x 1
O-J
1.
191
5 1.
38 x
10-
j 1.
102
4 4.
27 x
lo-
” 1.
014
6 3.
58 x
10m
3 1.
057
4 5.
00 x
10-
5 0.
946
5
5.31
x l
o-”
1.56
3 8
6.14
x 1
O-J
1.
443
6 5.
52 x
lo-
1.
323
2 1.
46 x
10-
j 1.
238
8 3.
64 x
1O
-1
1.14
4 2
0,58
1 4
0.46
3 0
1.11
5 3
0.56
1 7
1.12
6 9
0,77
6 9
0.62
6 6
0.98
2 3
0.58
1 4
0.96
0 9
0.98
1 4
0,80
8 7
0.97
0 6
0.58
8 6
0.92
4 3
1.69
3 x
lo-’
0.40
4 7
1.01
x 1
0-j
0.56
7 8
3.30
x 1
0-S
5.
190
4 1.
74 x
lo-
” 0.
576
9 2.
97 x
1O
-J
0.77
2 6
4.40
x
10-5
0.
427
9 1.
73 x
1o-
q 0.
738
2 4.
50x
lo-”
0.
934
3 1.
69 x
1O
-1
0.40
4 7
4.00
x l
o-’
0.96
8 2
5.82
x l
o-
0.92
8 0
4.45
x
10-J
0.
847
1 5.
88 x
lo-
” 0.
933
5 3.
26 x
lo-
” 0.
793
3 3.
53 x
lo-
” 0.
914
3
15.8
61
0 0.
032
5 1.
344
4 0.
041
1 0.
392
7 0.
944
9 0.
576
9 0.
125
2 0.
621
7 0.
001
5
2.73
4 7
0.17
4 4
I.87
0 8
0.13
4 3
1.07
1 0
0.05
2 9
15.8
61
0 0,
032
5 0.
979
2 0.
081
7
1.74
3 0
0.12
8 8
1.92
3 6
0.18
2 1
1.48
2 9
0.10
6 4
1.99
9 0
0.10
7 6
1.31
4 8
0.13
5 3
1.40
x 1
0-j
1.47
x 1
0-j
1.70
x 1
0-4
3.33
x 1
o-a
4.61
x 1
O-4
6.40
x 1
O-5
1.
05 x
10-
4 2.
30 x
lo-
” 1.
40 x
10-
j 6.
00 x
lO
-h
4.61
x l
o-”
2.56
x 1
O-1
4.
18 x
10-
j 2.
40 x
lo-
’ 1.
58 x
10-
j
?ms
= R
esid
ual
mea
n s
quar
e.

318 0. 0. Ajibola
1.5-
14.
13.
1.2
- i
7 5 11
* / 2 lo- m ;; Fj o-9- ”
~0s >,
b 07r
0.6 t
Regression equation I
051 k=2x10⁴ exp~(B*CxRH)/T,]
10 20 30 40 50 Relative humidity W
Fig. 4. Change in value of drying constant with temperature and relative humidity. Temperature: x ,4o”C; 0, 50°C; 0,6O”C.
Drying time (h)
Fig. 5. Comparison of observed and predicted moisture ratio for samples dried at 60°C. Relative humidity: X , 10%; Fi, ‘_9$, 0, 50%. ‘Moisture ratio’ = (M - Me)/
I e .
for in-shell pecan (Chinnan, 1984). The effect of relative humidity on the drying constant has, however, not been clearly established.
The drying constant K obtained was related to the drying temperature for each relative humidity setting using the Arrhenius-type relationship

Thin-layer drying of melon seed 319
in eqn (7). An attempt was made to relate the constants K, and C to rela- tive humidity:
K = 2 X lo4 exp[ -(C, + C,H)/T,] (8)
The standard error of estimate of K is O-05. A comparison of values of K predicted by the model with those calculated from drying results is presented in Fig. 4. The figure shows good agreement between experi- mental data and the model. Experimental values of moisture ratio were compared with values predicted by the use of eqns (3) and (8) for some experimental conditions as in Fig. 5. The results show good prediction of moisture ratio throughout the duration of drying.
REFERENCES
Ajibola, 0. 0. (1986~). Desorption isotherms of gari from 40°C to 70°C. J. Agric. Engng Rex, 35,207-10.
Ajibola, 0. 0. (1986b). Equilibrium moisture properties of winged bean seed. Trans. ASAE, 29 (5), 1485-7.
Akobundu, E. N. T., Cherry, J. P. & Simmons, J. G. (1982). Chemical, functional and nutritional properties of egusi (Colocynthis citrullus) seed protein products. J. Food Sci., 47 (3), 829-35.
ASAE (1983). Moisture relationship of grains ASAE Standards D245.4. t;;ri;$ral Engineers Yearbook, 30th edn. St Joseph, Michigan, USA, pp.
Chinnan, M. S. ( 1984). Evaluation of selected mathematical models for describ- ing thin-layer drying of in-shell pecan. Trans. ASAE, 27 (2), 6 1 O-l 5.
Chen, C. S. & Clayton, J. T. (1971). The effect of temperature on sorption isotherms of biological materials. Trans. ASAE, 14 (5), 927-9.
Chu, S. & Hustrulid, A. (1968). Numerical solution of diffusion equations. Trans. ASAE, 11 (5), 709-10,715.
Chung, D. S. & Pfost, H. B. (1967). Adsorption and desorption of water vapor by cereal grains and their products. Part II. Trans. ASAE, 10 (4), 549-5 1.
Crank, J. ( 1975). The Mathematics ofDif&sion. Clarendon Press, Oxford, UK. Duggal, A. K., Muir, W. E. & Brooker, D. B. (1982). Sorption equilibrium
moisture contents of wheat kernels and chaff. Trans. ASAE, 25 (4), 1086-90. Flood, C. A., Jr, Koon, J. L., Trombul, R. D. & Brower, R. N. (1987). Eauili-
brium moisture relations of pine shavings poultry iitter materials. T&s. ASAE, 30 (3), 848-52.
Graham, V. A., Bilanski, W. K. & Menzies, D. R. (1983). Adsorption grain drying using bentonite. Trans. ASAE, 26 (5), 15 12- 15.
Henderson, S. M. ( 1952). A basic concept of equilibrium moisture content. Agric. Engng, 33 (2), 29-3 1.
Henderson, S. M. & Pabis, S. ( 196 1). Grain drying theory I: temperature of effect in drying coefficient. J. Agric. Engng Res., 6 (3), 169-74.
320 0. 0. Ajibola
Iglesias, H. A. & Chirife, J. ( 1976). Prediction of effect of temperature on water sorption isotherms of food materials. J. Food Technol., 11, 109-16.
Li, Y. & Morey, R. V. (1987). Thin-layer drying rates and quality of cultivated American ginseng. Trans. ASAE, 30 (3), 842-7.
NAG (1981). Genstat Manual. Numerical Algorithm Group, Mayfield House, Oxford, UK.
Newman, A. B. (1931). The drying of porous solids. Trans. AZCHE, 27, 203-20,310-30.
O’Callaghan, J. R., Menzies, D. J. & Bailey, P. H. (1971). Digital simulation of agricultural dryer performance. J. Agric. Engrzg Res., 16,223-4.
Oyenuga, V. A. & Fetuga, B. A. (1975). Some aspects of the biochemistry and nutritional value of the water melon seed. J. Sci FoodAgric., 26 (6), 843-54.
Page, C. (1949). Factors Inj7uencing the Maximum Rates of Air Drying Shelled Corn in Thin Layers. University (Library) Lafayette, Indiana, USA.
Ross, I. J. & White, G. M. (1972). Thin layer drying characteristics of white corn. Trans. ASAE, 15 (l), 175-6.
Sharaf-Eldeen, Y. I., Blaisel, J. L. & Handy, M. Y. (1980). A model for ear corn drying. Trans. ASAE, 23 (5), 1261-5,127l.
Syarief, A. M., Morey, R. V. & Gustafson, R. J. ( 1984). Thin layer drying rates of sunflower seed. Trans. ASAE, 27(l), 195-200.
Thompson, T. L. (1972). Temporary storage of high moisture shelled corn using continuous aeration. Trans. ASAE, 15 (2), 333-7.
Verma, L. R., Bucklin, R. A., Endan, J. B. & Wratten, F. T. (1985). Effects of drying air parameters on rice drying models. Trans. ASAE, 28 (l), 296-301.
Wang, C. Y. & Singh, R. P. (1978). A single layer drying equation for rough rice. ASAE paper No. 78-3001. ASAE, St Joseph, MI, USA.
White, G. M., Ross, 1. J. & Poneleit, C. G. ( 198 1). Fully exposed drying of popcorn. Trans. ASAE, 24 (2), 466-8,475.
White, G. M., Bridges, T. C., McNeill, S. G. & Overhults, D. G. (1985). Equili- brium moisture properties of corn cobs. Trans. ASAE, 28 (l), 280-5.
Young, J. F. ( 1967). Humidity control in the laboratory using salt solutions, a review. J. Appl. Chem., 17,24 l-5.