Embed Size (px)
Citation preview
THE RELATIONSHIP BETWEEN PSYCHOSOCIAL
DEVELOPMENT AND DIVERGENT
PRODUCTION IN OLDER
ADULTS
By
STACEY LYNNE THOMPSON
Bachelor of Arts Oklahoma State University
Stillwater, Oklahoma 1988
Master of Science Oklahoma State University
Stillwater, Oklahoma 1991
Submitted to the Faculty of the Graduate College of the
Oklahoma State University in partial fulfillment of
the requirement for the Degree of
DOCTOR OF PIDLOSOPHY July, 1995
OKLAHOMA STATE UNIVERSITY
THE RELATIONSHIP BETWEEN PSYCHOSOCIAL
DEVELOPMENT AND DIVERGENT
PRODUCTION IN OLDER
ADULTS
Thesis Approved:
Thesis Adviser
~)~.·
11
ACKNOWLEDGEMENTS
In order to conduct a study of this magnitude, much time and energy were required
from others. For instance, Dr. Janice Williams, my doctoral adviser, offered herself
whole-heartedly to this project as well as to my professional career. Even when the whole
doctoral process seemed obtuse, she encouraged me to keep going, and going, and going.
I hold Dr. Williams in the highest regard within the field of educational research and offer
her my warmest tribute for caring so much for me, both professionally and personally.
She will always be statistically significant***· (12<.00I) to me. I would like to thank Dr.
Diane Montgomery for introducing me to the fields of creativity and Eriksonian theory.
Her charisma and compassion energized me through the doctoral program. I would like
to thank Drs. Laura Barnes and Katye Perry for their educational and professional support
throughout the years. Additionally, I thank Dr. Meg Kletke and Dr. Ronald Chaney for
their participation in this research endeavor.
This study could not have been conducted without the participation of many older
adults. I am greatly appreciative of all the older participants. Also, I am extremely
grateful to those who aided in the data collection process such as Mary Leonhardi, Bill
Leonhardi, Leisa Ross, Jennifer Leonhardi, Scott Whitfield, Shane Bainum, and Mrs.
Frank Thompson. Without their support this project would have been all that more
difficult.
I could not have made it through my doctoral program without a little help from
lll
my friends. Namok Bryant has lent an empathetic ear more than once. I need to thank her
for emotionally carrying me through the past several years and for letting me vent when I
felt I had no purpose. Eddie Davis' and Michael Dean's sense of humor kept me
entertained when I needed it most. Also, Terri Smith, my long-time companion, has been
with me from afar, nevertheless, I am eternally grateful. Even though not physically
present, Rick Darlington's spirit, kindness, and unrelenting generosity has been a guiding
force in my educational and personal life.
Finally, I could not have achieved this higher educational goal without the backing
of my family. Many special thanks are sent out to Frank Thompson, my dear grandfather;
Beverly and Lyle Ratner, my aunt and uncle; and Tony Thompson and Robert Kreiger, my
uncles, for their faith in me throughout my college years. My sister, Leisa Ross, has been
inquisitive about the doctoral process even though I know she was rather disinterested. I
thank her for her sense of style and motivational enthusiasm to be the best "we" can be. I
only hope someday I can be as successful as she is. I want to thank my brother, Alex
Willis, for respecting sibling differences. My mother, Mary Leonhardi, and step-father,
Bill Leonhardi, will be grateful not to hear the "d" word any longer. I need to offer my
mother a special thanks! She was a great source of support throughout the doctoral
process. Thankfully, I inherited her fiery spirit, sense of work ethic, and abundance of
discipline which are traits that have propelled me through college and life. Finally, I'd like
to say "Yahoo, there's a doctor in the family".
lV
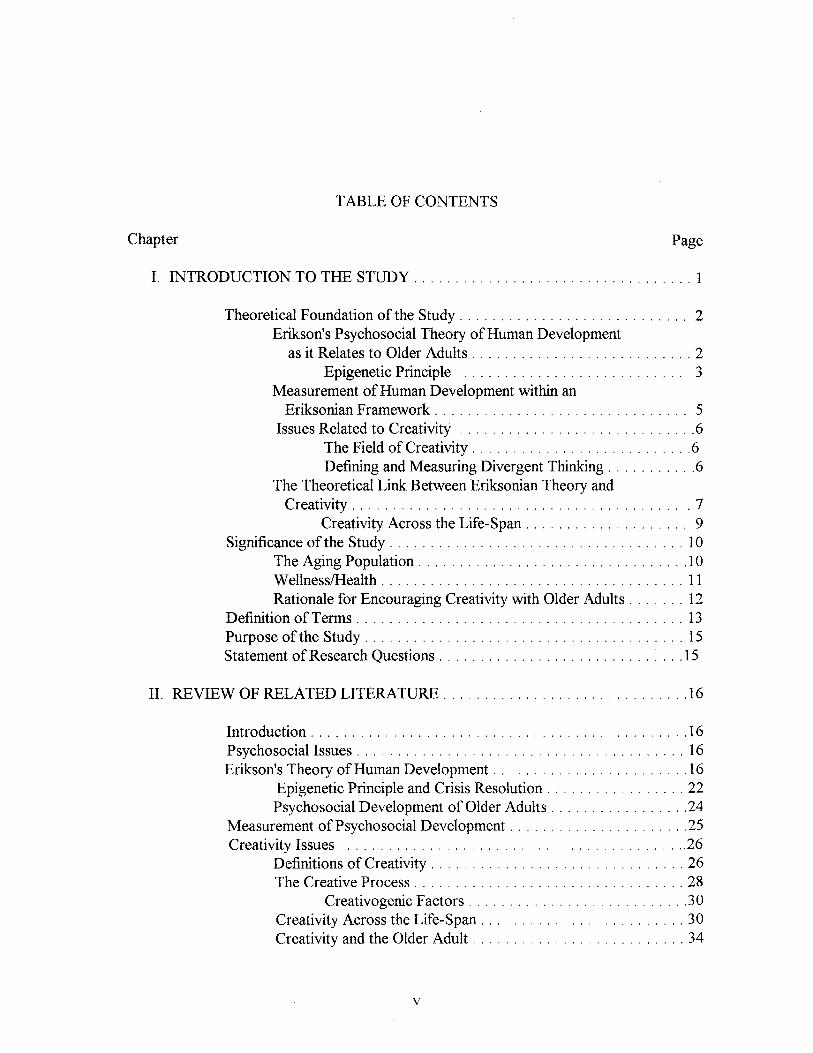
TABLE OF CONTENTS
Chapter Page
I. INTRODUCTION TO THE STUDY .................................. 1
Theoretical Foundation of the Study ............................ 2 Erikson's Psychosocial Theory of Human Development
as it Relates to Older Adults . . . . . . . . . . . . . . . . . . . . . . . . . . . 2 Epigenetic Principle . . . . . . . . . . . . . . . . . . . . . . . . . . . 3
Measurement of Human Development within an Eriksonian Framework . . . . . . . . . . . . . . . . . . . . . . . . . . . . . . . 5
Issues Related to Creativity . . . . . . . . . . . . . . . . . . . . . . . . . . . . . 6 The Field of Creativity . . . . . . . . . . . . . . . . . . . . . . . . . . . 6 Defining and Measuring Divergent Thinking . . . . . . . . . . . 6
The Theoretical Link Between Eriksonian Theory and Creativity . . . . . . . . . . . . . . . . . . . . . . . . . . . . . . . . . . . . . . . . . 7
Creativity Across the Life-Span .................... 9 Significance of the Study . . . . . . . . . . . . . . . . . . . . . . . . . . . . . . . . . . . . 10
The Aging Population . . . . . . . . . . . . . . . . . . . . . . . . . . . . . . . . .10 Wellness/Health . . . . . . . . . . . . . . . . . . . . . . . . . . . . . . . . . . . . . 11 Rationale for Encouraging Creativity with Older Adults ....... 12
Definition of Terms ........................................ 13 Purpose of the Study . . . . . . . . . . . . . . . . . . . . . . . . . . . . . . . . . . . . . . . 15 Statement of Research Questions . . . . . . . . . . . . . . . . . . . . . . . . . . . . . . 15
II. REVIEW OF RELATED LITERATURE .............................. 16
Introduction . . . . . . . . . . . . . . . . . . . . . . . . . . . . . . . . . . . . . . . . . . . . . . 16 Psychosocial Issues . . . . . . . . . . . . . . . . . . . . . . . . . . . . . . . . . . . . . . . . 16 Erikson's Theory of Human Development ........................ 16
Epigenetic Principle and Crisis Resolution . . . . . . . . . . . . . . . . .. 22 Psychosocial Development of Older Adults ................. 24
Measurement of Psychosocial Development ...................... 25 Creativity Issues .......................................... 26
Definitions of Creativity . . . . . . . . . . . . . . . . . . . . . . . . . . . . . . . 26 The Creative Process . . . . . . . . . . . . . . . . . . . . . . . . . . . . . . . . . 28
Creativogenic Factors ........................... 30 Creativity Across the Life-Span ......................... 30 Creativity and the Older Adult .......................... 34
V
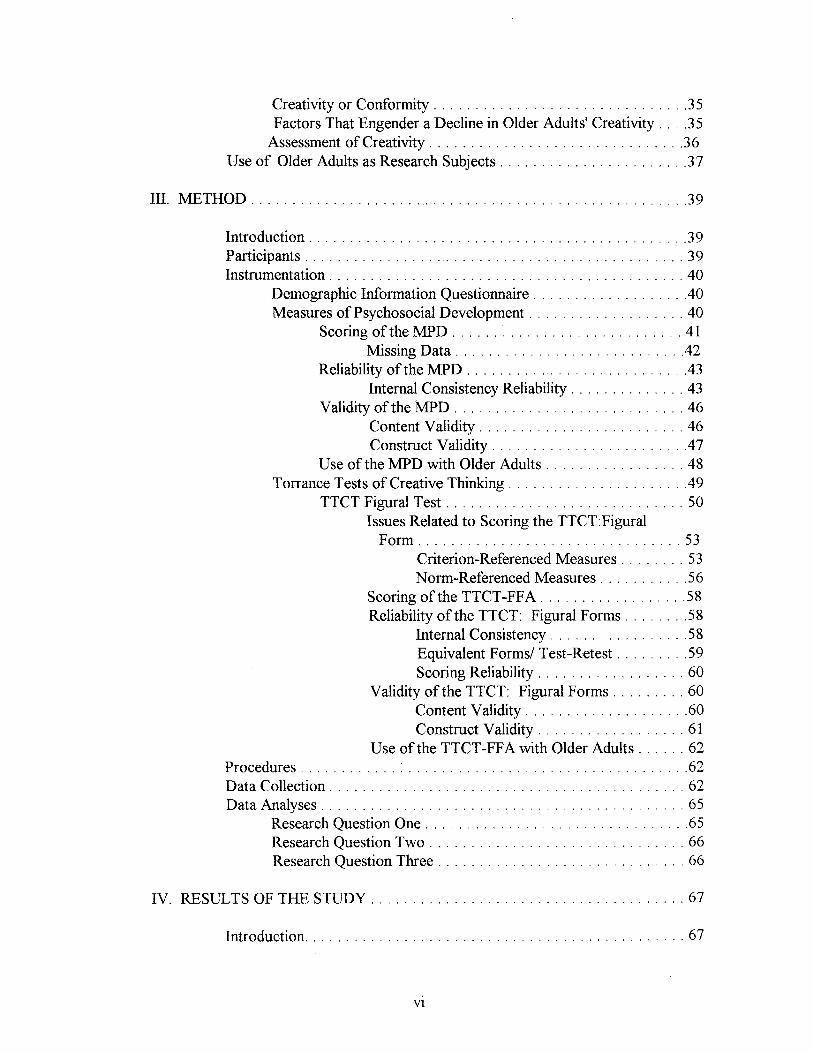
Creativity or Conformity . . . . . . . . . . . . . . . . . . . . . . . . . . . . . . . 3 5 Factors That Engender a Decline in Older Adults' Creativity .... 35
Assessment of Creativity ............................... 36 Use of Older Adults as Research Subjects ....................... 37
III. METHOD ...................................................... 39
Introduction . . . . . . . . . . . . . . . . . . . . . . . . . . . . . . . . . . . . . . . . . . . . . . 3 9 Part1c1pants .............................. , ................ 39 Instrumentation . . . . . . . . . . . . . . . . . . . . . . . . . . . . . . . . . . . . . . . . . . . 40
Demographic Information Questionnaire . . . . . . . . . . . . . . . . . . . 40 Measures of Psychosocial Development . . . . . . . . . . . . . . . . . . . 40
Scoring of the MPD ............................ 41 Missing Data ........................... .42
Reliability of the MPD . . . . . . . . . . . . . . . . . . . . . . . . . . .4 3 Internal Consistency Reliability .............. 43
Validity of the MPD ............................ 46 Content Validity . . . . . . . . . . . . . . . . . . . . . . . . . 46 Construct Validity . . . . . . . . . . . . . . . . . . . . . . . .4 7
Use of the MPD with Older Adults ................. 48 Torrance Tests of Creative Thinking ..................... .49
TTCT Figural Test ............................. 50 Issues Related to Scoring the TTCT:Figural
Form ................................ 53 Criterion-Referenced Measures ........ 53 Norm-Referenced Measures ........... 56
Scoring of the TTCT-FFA .................. 58 Reliability of the TTCT: Figural Forms ........ 58
Internal Consistency . . . . . . . . . . . . . . . . . 5 8 Equivalent Forms/ Test-Retest ......... 59 Scoring Reliability . . . . . . . . . . . . . . . . . . 60
Validity of the TTCT: Figural Forms ......... 60 Content Validity . . . . . . . . . . . . . . . . . . . . 60 Construct Validity . . . . . . . . . . . . . . . . . . 61
Use of the TTCT-FFA with Older Adults ...... 62 Procedures ............ : .................................. 62 Data Collection . . . . . . . . . . . . . . . . . . . . . . . . . . . . . . . . . . . . . . . . . . . 62 Data Analyses ............................................ 65
Research Question One ................................ 65 Research Question Two ............................... 66 Research Question Three . . . . . . . . . . . . . . . . . . . . . . . . . . . . . . 66
IV. RESULTS OF THE STUDY ...................................... 67
I~roductioa ............................................. 67
VI
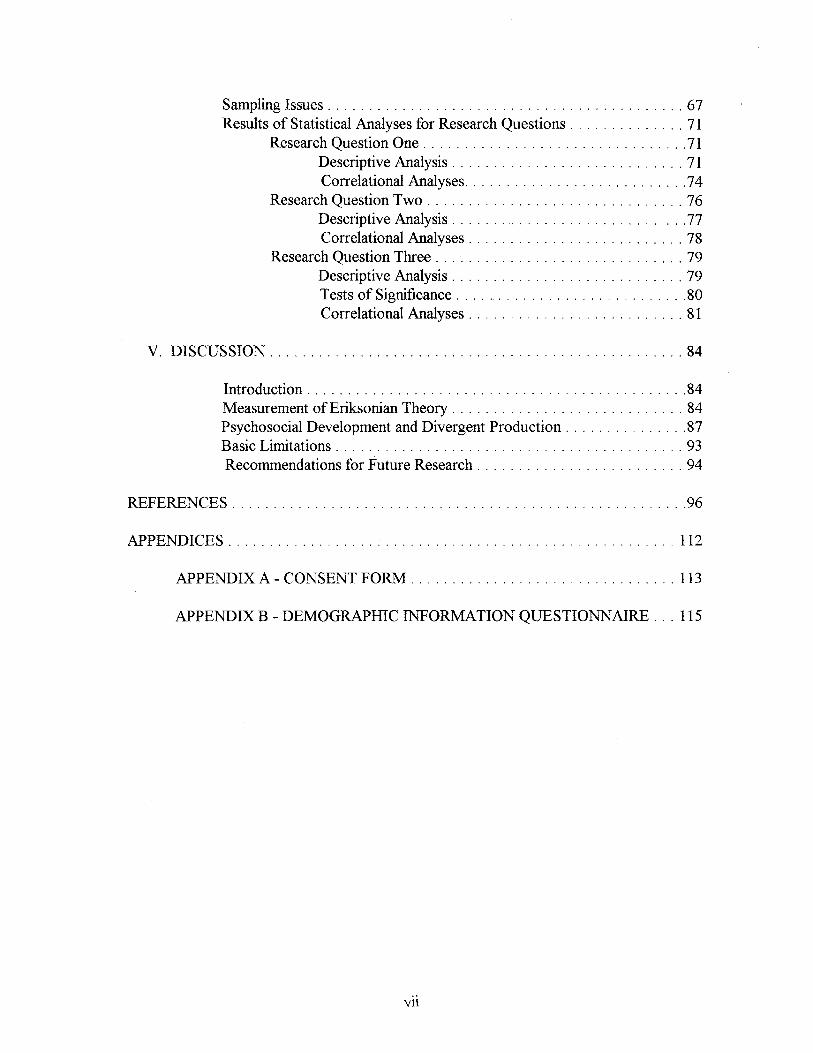
Sampling Issues ........................................... 67 Results of Statistical Analyses for Research Questions . . . . . . . . . . . . . . 71
Research Question One . . . . . . . . . . . . . . . . . . . . . . . . . . . . . . . . 71 Descriptive Analysis . . . . . . . . . . . . . . . . . . . . . . . . . . . . 71 Correlational Analyses ....................... : ... 74
Research Question Two ............................... 76 Descriptive Analysis . . . . . . . . . . . . . . . . . . . . . . . . . . . . 77 Correlational Analyses . . . . . . . . . . . . . . . . . . . . . . . . . . 78
Research Question Three . . . . . . . . . . . . . . . . . . . . . . . . . . . . . . 79 Descriptive Analysis . . . . . . . . . . . . . . . . . . . . . . . . . . . . 79 Tests of Significance ............................ 80 Correlational Analyses . . . . . . . . . . . . . . . . . . . . . . . . . . 81
V. DISCUSSION .................................................. 84
Introduction . . . . . . . . . . . . . . . . . . . . . . . . . . . . . . . . . . . . . . . . . . . . . . 84 Measurement of Eriksonian Theory ............................ 84 Psychosocial Development and Divergent Production ............... 87 Basic Limitations .......................................... 93 Recommendations for Future Research ......................... 94
REFERENCES ....................................................... 96
APPENDICES ...................................................... 112
APPENDIX A - CONSENT FORM ................................ 113
APPENDIX B - DEMOGRAPHIC INFORMATION QUESTIONNAIRE ... 115
Vll
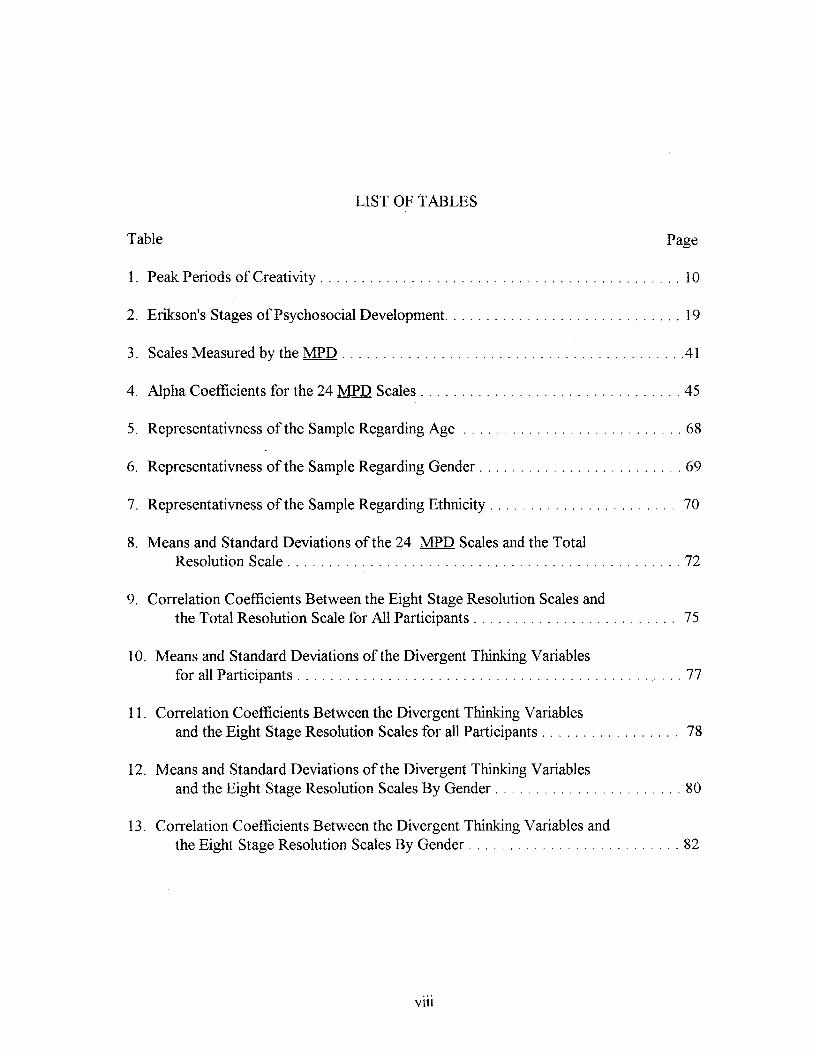
LIST OF TABLES
Table Page
1. Peak Periods of Creativity . . . . . . . . . . . . . . . . . . . . . . . . . . . . . . . . . . . . . . . . . . . . 10
2. Erikson's Stages of Psychosocial Development. ............................ 19
3. Scales Measured by the MPD .......................................... 41
4. Alpha Coefficients for the 24 MPD Scales ................................ 45
5. Representativness of the Sample Regarding Age ........................... 68
6. Representativness of the Sample Regarding Gender ......................... 69
7. Representativness of the Sample Regarding Ethnicity ....................... 70
8. Means and Standard Deviations of the 24 MPD Scales and the Total Resolution Scale ................................................ 72
9. Correlation Coefficients Between the Eight Stage Resolution Scales and the Total Resolution Scale for All Participants ......................... 75
10. Means and Standard Deviations of the Divergent Thinking Variables for all Participants . . . . . . . . . . . . . . . . . . . . . . . . . . . . . . . . . . . . . . . . . . . .. . . . 77
11. Correlation Coefficients Between the Divergent Thinking Variables and the Eight Stage Resolution Scales for all Participants . . . . . . . . . . . . . . . . . 78
12. Means and Standard Deviations of the Divergent Thinking Variables and the Eight Stage Resolution Scales By Gender . . . . . . . . . . . . . . . . . . . . . . . 80
13. Correlation Coefficients Between the Divergent Thinking Variables and the Eight Stage Resolution Scales By Gender .......................... 82
Vlll
LIST OF FIGURES
Figure Page
1. Epigenetic Sequence of Erikson's Eight Psychosocial Stages of Life ............. 4
IX
CHAPTER I
INTRODUCTION TO THE STUDY
The fundamental focus of this study was an examination of the relationship
between Erikson's psychosocial theory of human development and divergent production
in older adults. Erikson's psychodynamic personality theory of psychosocial development
involves eight fixed-stages through which one progresses in a lifetime. Erikson's theory is
one of the few personality theories to encompass the life-span. When researching older
adults, the entire life-span must be taken into consideration to obtain a detailed perspective
of development. That is, the past must be examined in conjunction with the present to
determine the impact on current development. As a result, Erikson's theory was a
justifiable approach to examining development in older adults.
In 1956, J.P. Guilford's factor analytic research in the field of human intelligence
lead him to devise a theoretical structure-of-the-intellect (SI) model. While researching
the SI model, Guilford theorized that the intellect was composed of five mental operations
(i.e., cognition, memory, convergent thinking, divergent thinking, and evaluation). These
mental operations are the intellectual basis for creative production. Even though five
operations are involved in creative thinking to some extent, Guilford believed that
divergent thinking was one of the most important types of productive thinking. Divergent
I
2
thinking is essential in generating a wide range of ideas and producing a variety of
responses. Guilford (1956) maintained that fluency, flexibility, originality, and elaboration
were the underlying processes in divergent thinking. E Paul Torrance developed the
Torrance Tests of Creative Thinking (TTCT), standardized tests based on Guilford's
divergent thinking processes. In the TTCT, Torrance operationalized creativity as a
process leading to divergent production.
Theoretical Foundation of the Study
Erikson's Psychosocial Theory of Human Development as it Relates to Older Adults
The "psychosocial" ideology can be defined as the social influences interacting
with a physically and psychologically maturing organism (Re Ville, 1989). Via
psychosocial development, a connection is made among biological, psychological, and
social dimensions. Equal consideration is given to each of these three dimensions and
requires their collective participation in human development.
Erik Erikson's psychosocial theory of human development is rooted in Sigmund
Freud's psychosexual theory. Both Freud and Erikson believed that man developed
through conflict, but Freud emphasized sexual conflicts and Erikson emphasized conflict
over self-identity. Freud believed the id (collection of unconscious physiological drives)
was the driving force of the personality and, in contrast, Erikson believed the ego
(self-awareness) was the driving force. Erikson's theory is similar to Freud's in that they
are both fixed-stage theories which are linked to age norms. One discrepancy between the
two theories is that Freud's theory of human development ceases at puberty and Erikson's
theory encompasses the entire life cycle. Erikson was the first psychologist to theorize
and study the entire human life cycle. When studying development of older adults, a life
3
cycle theory intuitively appears to be a more sensible approach.
Erikson's life cycle theory consist of eight bipolar fixed-stages. The eight stages or
the "eight ages of man" in chronological order are: (1) Trust versus Mistrust; (2)
Autonomy versus Shame and Doubt; (3) Initiative versus Guilt; (4) Industry versus
Inferiority; (5) Identity versus Identity Confusion; (6) Intimacy versus Isolation; (7)
Generativity versus Stagnation; and (8) Ego Integrity versus Despair. Each stage is
associated with specific ages (refer to Table 2 in Chapter IT), however, all eight bipolar
stages exist throughout life, to varying degrees. Each stage represents the dominant
conflict durip.g that period of life. The stages can be examined individually or collectively.
A collective examination of the stages or the interrelatedness of the stages is the basis of
Erikson's epigenetic principle.
Epigenetic Principle
The term "epigenesis" as defined by Erikson, Erikson, and Kivnick (1986)
connotes the space/time nature of all development (Erikson, 1986). Theoretically,
Erikson's (1959) epigenetic principle implies that "anything that grows has a ground plan,
and that out of this ground plan the parts arise, each part having its time of special
ascendancy, until all parts have risen to form a functioning whole" (p. 52). To Erikson,
the parts were the eight stages and the functioning whole was the cooperative function of
all eight stages.
The epigenetic principle assumes that there is an innate foundation for
development which occurs in a determined sequence until there is a "functioning whole".
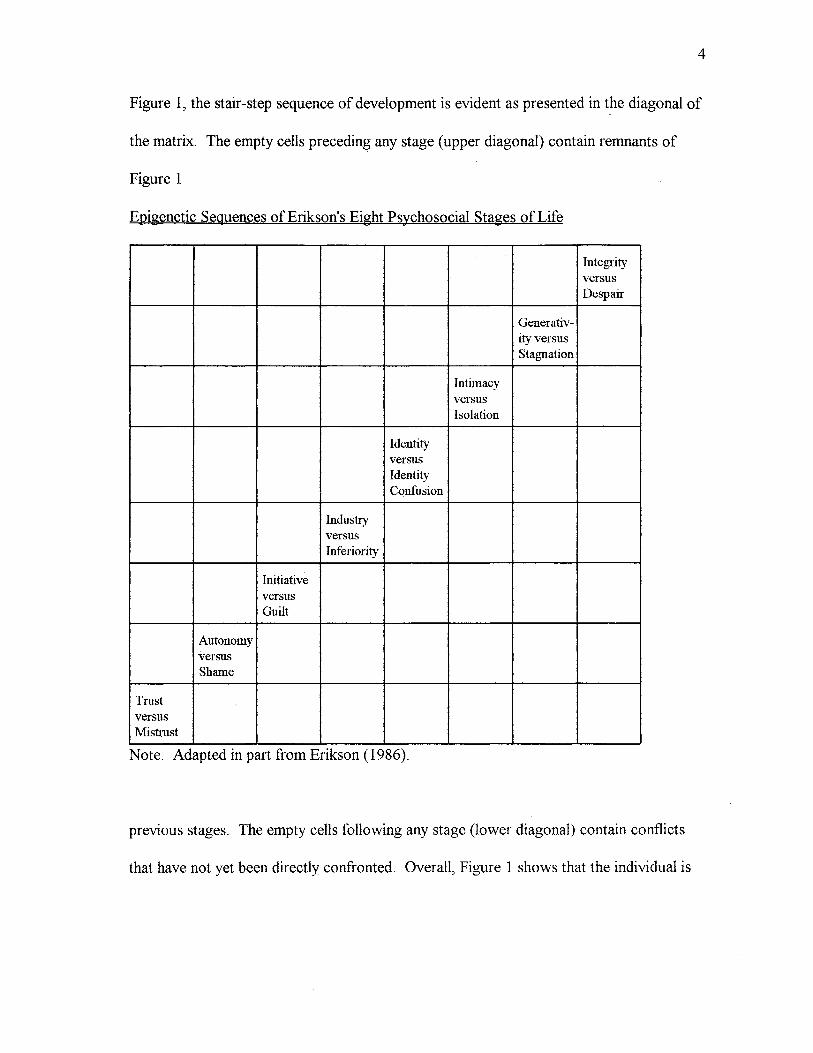
Figure 1 is a matrix consisting of all eight stages in their epigenetic sequence from early
infancy (Trust versus Mistrust) to late adulthood (Ego Integrity versus Despair). In
4
Figure 1, the stair-step sequence of development is evident as presented in t~e diagonal of
the matrix. The empty cells preceding any stage (upper diagonal) contain remnants of
Figure 1
Epigenetic Sequences of Erikson's Eight Psychosocial Stages of Life
Integrity versus Despair
Generativ-ityversus Stagnation
Intimacy versus Isolation
Identity versus Identity Confusion
Industry versus Inferiority
Initiative versus Guilt
Autonomy versus Shame
Trust versus Mistrust
Note. Adapted in part from Erikson (1986).
previous stages. The empty cells following any stage (lower diagonal) contain conflicts
that have not yet been directly confronted. Overall, Figure 1 shows that the individual is
5
In terms of development over time, the overall developmental status of old age
cannot be reevaluated without considering how infancy created the conditions for a
potentially viable old age, and how old age may bring to fruition what each stage of life
may have to contribute to the subsequent ones (Erikson & Erikson, 1978). This
progression reflects the importance of the epigenetic principle as it relates to older adults.
According to Erikson and Erikson (1978), there should be a Three Way Alliance between
the old, the middle aged, and the young. ~ ' '
Measurement of Human Development within an Eriksonian Framework
Eriksonian theory was employed in this study because it is a theory of human
development that covers the entire life-span. There have been numerous attempts to
operationalize and measure Erikson's theory (e.g., Constantinople, 1966; Gordon, 1967;
Marcia, 1964; Wessman and Ricks, 1966). The majority of the instruments developed to
assess psychosocial development within an Eriksonian framework measure either the first
five (e.g., Greun, 1960; Marcia, 1964; Thayer, 1963), six (e.g., Boyd, 1964; Caillet,
1980), or seven (e.g., Prelinger and Zimet, 1964) stages. Whereas a few instruments
measure the latter stages (e.g., Boylin, Gordon, & Nehrke, 1976; Joyce, 1970), very few
measure all eight stages (e.g., Boyd, 1966; Gordon, 1967; Gruen, 1964). Due to the lack
of instrumentation assessing psychosocial development across the life-span, there has been
little quantitative research of Erikson's epigenetic principle. There are few scales
extensively used in research that produce an overall psychosocial development index
which reflects the epigenetic principle. One viable scale appears to be the Measures of
Psychosocial Development (MPD) (Hawley, 1988).
The MPD employs measures ofresolution for all eight bipolar stages (i.e., Rl, R2,
6
R3, R4, RS, R6, R7, and RS) and overall or total resolution (i.e., TR). A resolution score
indicates the degree to which one has successfully or unsuccessfully resolved specific
stages or all the stages. At ~h~ stage leyel, degree of resolution is established based-on
responses to items measuring the construct underlying each stage. Because the stages are
hierarchically ordered, overall psychosocial development is established based on the
degree of resolution across the eight stages. In other words, the resolution of each stage
and the final stage should be contingent upon previous stage( s) resolution. As a result,
regardless of age, when examining psychosocial development all eight bipolar stages
should be considered.
Issues Related to Creativity
The Field of Creativity
Creativity has been of interest to researchers for more than four decades (e.g.,
Alpaugh & Birren, 1977; Guilford, 1959; Isaksen, 1987; Torrance, 1962; Wehner,
Csikszentmihalyi, & Magyari-Beck, 1991 ). The field of creativity began taking shape
when J.P. Guilford presented his Presidential Address to the American Psychological
Association in 1950. This presentation included a report of a survey of the field of
creativity and its problems. Guilford's presentation on the multiple dimensions of
intelligence sparked interest in research on creativity. Guilford's (1950, 1959, 1977)
research interests were in human intelligence which resulted in a model of the structure-of
the-intellect (SI). This model, conceptually, is a broad overview of intellectual abilities
including contents, products, and operations (Isaksen, 1987).
Defining and Measuring Divergent Thinking
The concept of divergent thinking was a result of J.P. Guilford's research and the
7
SI model. While researching creativity, Guilford identified several intellectual abilities
(i.e., fluency, flexibility, originality, and elaboration) which have collectively been labeled
divergent thinking. Divergent thinking is the ability to produce a diversity of responses to
an open-ended problem. Divergent thinking is the most widely used approach to studying
creativity (Hocevar, 1981). As a result of Guilford's research, creativity is often
operationalized as the processes underlying divergent thinking. A myriad of tests have
been developed by Guilford and others (e.g., Christensen, Guilford, Merrifeild, & Wilson,
1960; Torrance, 1974; Wallch & Wing, 1969) to measure divergent thinking. Tests of
divergent thinking require a multitude of responses, rather than a single correct answer.
For instance, on the Torrance Tests of Creative Thinking: Figural Form A (TTCT-FFA)
developed by Torrance and Ball (1984), the subject is asked to make pictures out of a
series of parallel lines. Through the divergent thinking process, one must make as many
pictures as possible out of the parallel lines. There are no "correct answers" to the parallel
lines activity, but there are more or less creative solutions. Guilford (1968) and Torrance
(1974) have suggested that the more creative individual should possess the types of
abilities measured by tests of divergent thinking.
The Theoretical Link between Eriksonian Theory and Creativity
When studying divergent production in older adults, the social impact must be
considered as well. For instance, Csikszentmihalyi ( 1990) noted that creativity or even
measurement of creativity should not be considered without first taking into account the
social aspects that influence creativity. In light of this recommendation, the current study
investigated divergent production and Erikson's psychosocial theory simultaneously.
In Childhood and Society ( 1963 ), Erikson suggested that creativity may be set by
8
the third stage (Initiative versus Guilt) or fourth stage (Industry versus Inferiority);
however, it may be outwardly expressed at various stages throughout the life cycle
depending on one's overall psychosocial development. Thus, by examining the relationship
between creativity and each stage of psychosocial development, it can be determined
which conflicts impact divergent thinking and ip. tum, divergent production. Re Ville
(1989) stated that older adults experience something that younger people cannot: a
personal sense of the entire life cycle. For example, the seventh stage (Generativity versus
Stagnation) is associated with middle adulthood. Erikson and Erikson (in Spicker,
Woodward, & Van Tassel, 1978 p. 4) indicated that Generativity was the commitment to
progeny, production, and creativity. Generativity indicates that something old is passed
on while creativity indicates that something new comes into being. In other words, a
personal sense of the life cycle, as suggested by Re Ville, helps older adults who are at the
seventh stage to create something new to pass on to later generations.
Psychoanalysts (i.e., Freud) tend to emphasize the role of childhood in the
development of creative ability, while minimizing or even entirely overlooking the role that
social factors, including marriage, play in developing the ego in the service of creative
insight (Arasteh & Arasteh, 1976). Arasteh and Arasteh (1976) indicated that one way to
attain the state of creativity is to develop a high degree of maturity in rationality to the
extent that one can realize the role of reason and intelligence in life. Their suggestion
supports the notion creativity exists in older adults. Arasteh and Arasteh also state that as
the ego develops, creative insight is heightened. Therefore, it would make intuitive sense
that adults can be and are creative because they should have a more developed ego than
younger individuals. During the mature years, creativity becomes an expression of life in
that the adult has to combine vocation and avocation in order to create leeway for
themselves while creating leeway for those within their scope of mutuality ( Arasteh &
Arasteh, 1976).
Creativity Across the Life-Span
9
In the literature, there appears to be controversy concerning the issue of creativity
across the life-span. Lehman (1953) theorized that creativity within any field increases
until age 30, then steadily decreases until age 40 when it drastically decreases and
continues to do so through later adulthood. Lehman reported that exceptional lifetime
creativity is linked with aptitude, longevity, and high productivity rates. In other words, it
has been suggested that creativity peaks in early to middle adulthood and then continually
decreases through old age. This does not imply the creative process declines in later
adulthood, only that it is not apparent.
In response to Lehman's life-span theory of creativity, Pruyser (1987) argued that
old age may move some persons toward a late-life creativity. In addition, Smith and van
der Meer (1990) found creativity to be a key factor in aging. They stated that creative
individuals have a less negative attitude toward aging and do not unequivocally close the
door to life after death. In light of the controversy concerning creativity and the aging
process, there is a need for additional research on creativity in later adulthood. When
examining creativity from a personality perspective, Dacey ( 1989) found that there were
peak periods during which evidence of creativity was present. These peak periods are
shown in Table 1. As noted in this table, there are six peak periods during which
creativity may be exhibited from the age of O to 65 for both males and females. Inclusion
of the sixth peak period in Dacey's theory suggests that creative potential is present during
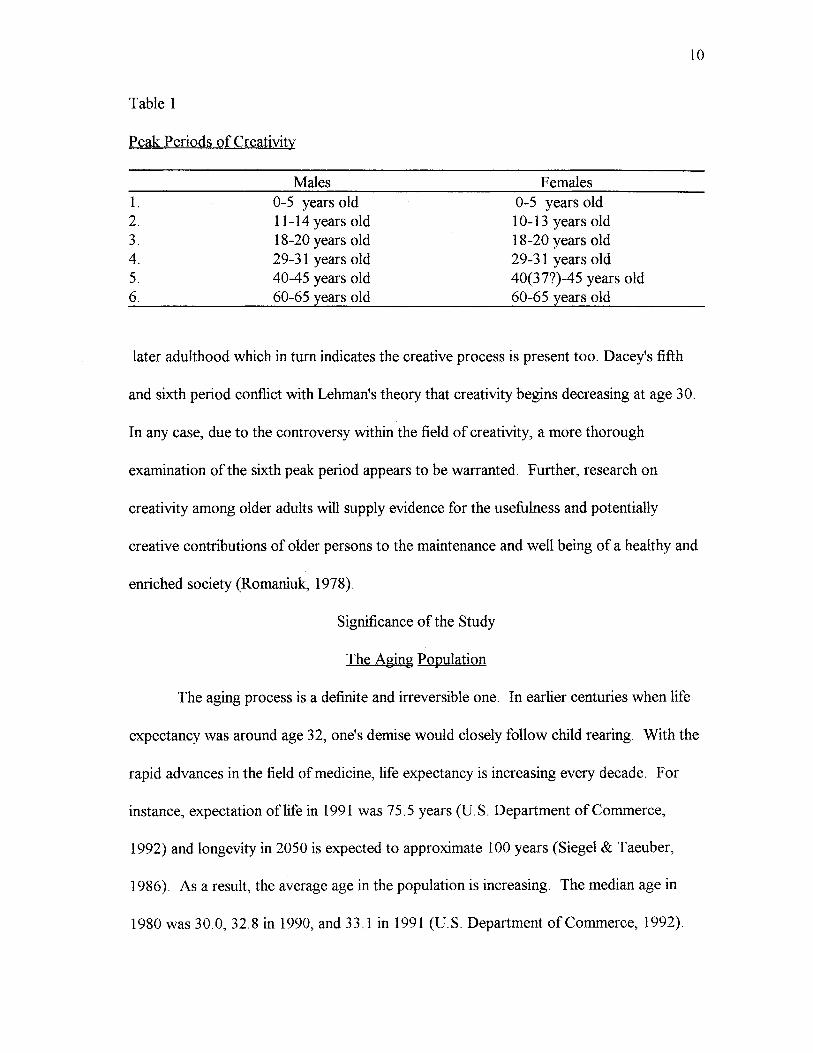
Table 1
Peak Periods of Creativity
1. 2. 3. 4. 5. 6.
Males 0-5 years old 11-14 years old 18-20 years old 29-31 years old 40-45 years old 60-65 years old
Females 0-5 years old 10-13 years old 18-20 years old 29-31 years old 40(37?)-45 years old 60-65 years old
later adulthood which in tum indicates the creative process is present too. Dacey's fifth
10
and sixth period conflict with Lehman's theory that creativity begins decreasing at age 30.
In any case, due to the controversy within the field of creativity, a more thorough
examination of the sixth peak period appears to be warranted. Further, research on
creativity among older adults will supply evidence for the usefulness and potentially
creative contributions of older persons to the maintenance and well being of a healthy and
enriched society (Romaniuk, 1978).
Significance of the Study
The Aging Population
The aging process is a definite and irreversible one. In earlier centuries when life
expectancy was around age 32, one's demise would closely follow child rearing. With the
rapid advances in the field of medicine, life expectancy is increasing every decade. For
instance, expectation oflife in 1991 was 75.5 years (U.S. Department of Commerce,
1992) and longevity in 2050 is expected to approximate 100 years (Siegel & Taeuber,
1986). As a result, the average age in the population is increasing. The median age in
1980 was 30.0, 32.8 in 1990, and 33.1 in 1991 (U.S. Department of Commerce, 1992).
In 1991, 25.4% of the population of the United States was 50 years old or older (U.S.
Department of Commerce, 1992). With approximately one-fourth of the population
working on the eighth and final stage of development, there is definitely a need for
exploring this population more closely.
11
With the "baby-boomers" nearing retirement age, there will be a disproportionate
number of the population dealing with the trials and tribulations of older adulthood. If the
median age continues to increase approximately three years every decade, by the year
2050 the median age of the United States population will be 50.8 years. This median age
would put half of the population in Erikson's seventh (Generativity versus Stagnation) or
eighth (Ego Integrity versus Despair) stage. As a result, with the increasing number of
those in the older adults population, there is now a need to advance knowledge of
development in old age.
Wellness/Heath
The overall wellness of older adults is enhanced if they are allowed to express
themselves creatively. For instance, it has been found that the attitudes of creative. elderly
adults (mean=72 years) toward aging was less negative and their attitudes toward illness
less defensive than their non-creative peers (Smith & van der Meer, 1990). In addition,
Dawson and Baller (1972) found a positive relationship between engagement of elderly
persons in creative endeavors (i.e. oil painting) and their condition of health as they relate
to longevity. Goff & Torrance (1991) found that older adults who participated in a
"Quality of Life" program significantly increased their "quality oflife" when compared to
older adults who had no such program. The purpose of the Quality of Life Program was
to increase the independence of older adults (with and without developmental disabilities),
12
and to integrate them into the community through physical and expressive activities
designed to improve fitness, creativity, and quality oflife. More recently, Goff &
Torrance (in press) stated that valuing and developing the creativity of older adults will
raise their levels of wellness and overall happiness. An older adults' level of wellness may
impact psychosocial development i~ that, if one employs a "healthy" attitude toward life,
crises can be resolved more efficiently and progress toward a healthy psychosocial
development.
According to The Retirement Handbook (Buckley & Schmidt, 1977),
gerontologists point out that the number of years we live is largely tied up with factors
such as heredity and environment. Buckley and Schmidt (1977) suggest that creative
capacities are also tied to longevity. By utilizing creative abilities in the later years, new
skills and interests can be developed. With the development of new skills and interests, a
positive channel will be formed in which strength, energy, and idealism can be guided
during the later years oflife. These factors have also been shown (Buckley & Schmidt,
1977) to increase the life-span. In other words, creativity in any form is essential in
maintaining a sense of purpose and personal value. Buckley and Schmidt (1977) go on to
say that new experiences keep life exciting, helps one stay out of deepening ruts, and
keeps one from the rigidity from which so many older people suffer. The need to study
creativity with older adults is apparent.
Rationale for Encouraging Creativity in Older Adults
It is suggested that the elderly be encouraged to seek their own creative outlet, and to
utilize their vast store of experience in a manner that will enhance their lives and keep
them in more meaningful contact with reality (Parris, 1986). Erikson (1986) states that
13
"an opening up of [the] area of creativity and stimulation can greatly enrich the elder both
intellectually and aesthetically." (p.317). He goes on to state that " ... many people think
they have no creative ability, but this is largely the result of cultural conditioning ... [but]
for the aging, participation in expressions of artistic form can be a welcome source of vital
involvement and exhilaration" (p.318) . Erikson (1986) also pointed out that" ... at the
end of life, when [ older adults] recognize that time to nurture their early-subordinated,
long-stagnant interests is running out, several of [them] have difficulty coming to terms
with the ways they have not expressed their creativity" (p.84). Erikson's statements imply
that encouragement of creative expression can positively aid in the aging process.
Encouraging creative expression in older adults may enhance the quality of life and ease
the common pains associated with the aging process.
Definition of Terms
1. Stage Resolution
In this study, the discussion of hum~ development relies on stages or
progressions, as specified by Erikson. Erikson theorizes that there are stages through
which one must progress in order to develop psychosocially and, perhaps, creatively. In
addition, the crisis at each stage of psychosocial development results in either one
proceeding to the next stage or stagnating at a stage and resolving the crisis. The
resolution of each bipolar stage is not that positive (e.g., Trust) prevails over negative
(e.g., Mistrust) but that a "healthy" ratio exist between the two. Resolution was measured
at each of the eight stages (Rl to RS) and overall or total resolution (TR) from scales on
theMPD.
2. Divergent Production-Divergent Thinking
Divergent production is the intellectual basis for creative production. Creative
production is a result of divergent thinking during the creative process. Therefore,
divergent production and divergent thinking are both directly linked to creativity and the
creative process.
14
Creativity is a term which has no universally agreed upon definition, researchers
typically employ one of the many definitions that already exist in the field of creativity
research. A process definition of creativity was employed in this study in order to
investigate divergent production. The creative process (i.e., divergent thinking) was
assessed by the most widely used and accepted test of divergent thinking (Ball &
Torrance, 1984), the TTCT. In the TTCT, Torrance (1974, p. 8) defined creativity as the
process of
.... becoming sensitive to problems, deficiencies, gaps in knowledge,
missing elements, disharmonies, and so on; identifying the difficulty;
searching for solutions, making guesses, or formulating hypotheses about
the deficiencies: testing and retesting these hypotheses and possibly
modifying and retesting them; and finally communicating the results.
Further creativity definitional issues are presented in Chapter II and rationale for use of the
TTCT is discussed in Chapter III.
3. Older adult
In the current study, this term refers to adults, both male and female, 50 years old
and older. This age group was chosen because according to Erikson's theory,
approximately by age 50 one should be in the final stage of the life cycle. In general, those
15
50 and older should have experienced the entire life cycle or be in the final stages .
Purpose of the Study
The purpose for conducting this study was three-fold. First, to determine if the
MPD total resolution score {TR) or the stage resolution~scale scores (RI through RS) of ., \ .
older adults yielded results in conjunction with Erikson's epigenetic principle. Second, to
find out if there was a relationship between psychosocial development and divergent
production in older adults. Third, to determine if there were gender pattern differences in
the relationship between psychosocial development and divergent production in older
adults.
Statement of Research Questions
The specific research questions addressed in this study sought to determine if:
(1) the total resolution score (TR) or stage resolution scores (RI through RS) of
older adults on the Measures of Psychosocial Development (MPD) were consistent with
Erikson's epigenetic principle. Specifically, were the stages hierarchically related and
were the stages more related to adjacent stages than to non-adjacent stages.
(2) there was a relationship between stage resolution according to Eriksonian
theory and divergent production in older adults; and
(3-) there was- a gender pattern difference in the relationship between stage
resolution according to Eriksonian theory and divergent production in older adults.
CHAPTER II
REVIEW OF RELATED LITERATURE
Introduction
This chapter reviews the literature relevant to the issues pertaining to psychosocial
development and creativity of older adults. Psychosocial issues discussed include
Erikson's theory of human development, the epigenetic principle, crisis res<;>lution,
psychosocial development of the older adult, and measurement of psychosocial
development. Creativity issues discussed include definitional issues, creativity across the
life-span, creativity or conformity, and assessment of creativity. Finally, the use of older
adults as research subjects is discussed.
Psychosocial Issues
Erikson's Theory of Human Development
One of the earliest perspectives of human personality development was that of
Sigmund Freud. Freud viewed human development from a psychosexual-psychoanalytic
perspective. In 1900, Freud (in Strachey, 1963) described the human personality as being
composed of three interacting systems: id, ego, and superego. The id is the part of the
personality structure that seeks immediate gratification, totally unconstrained by reality,
while the ego seeks to gratify the id's impulses in realistic ways that will bring pleasure
rather than pain or destruction. The superego is like the parent striving for perfection and
16

17
judges actions, accompanied by feelings of guilt or pride. According to Freud, the id and
the superego are constantly at struggle while the ego acts as the mediator. Freud's work
as a psychoanalyst lead him to the conclusion that the human personality was shaped in the
first few years of life. As a result, Freud theorized there were five psychosexual stages
which children from birth through puberty pass through. Erik Erikson formulated his
personality theory of psychosocial development out of Freud's theory of the personality
structure. Erikson ( 1968b) stated:
My psycho-social conception of the life cycle was originally based on Freud's
clinical break-through into the early stages of life, in which he found the origin of
neurotic disturbance. I developed some of what I learned, asking: ifwe know
what can go wrong in each stage, can we say what should have gone and can go
right? (p.286)
There are three major differences between Erikson's and Freud's theory. First,
Erikson believed that life's developmental stages encompass the life-span, whereas Freud's
psychosexual stages cease at late puberty. Second, Erikson (1963, 1986) believed the ego
rather than the id related to society. Third, unlike Freud, Erikson focused on the positive
aspects of development.
Erikson's primary contributions to the study of human personality development
are: psychosocial stages of ego development which parallel the psychosexual stages
described by Freud; the theory that personality development continues throughout the
entire life cycle; and that at each stage of development there are positive as well as
negative facets. The stages of psychosocial development that were theorized by Erikson
are listed in Table 2. As noted there, Erikson delineates positive and negative attitudes for
18
each stage. The developmental period associated with each of the eight stages is listed
in this table as well. Three examples of developmental periods are listed in order to
demonstrate the lack of agreement among the specific ages associated with each of the
eight stages. It would be assumed that ages for each stage would vary among individuals
due to the diversity of human development, which may be why Erikson (1963) originally
assigned labels to the stages as opposed to specific ages. In any case, there are often
chronological ages assigned to the stages. For example, in psychology textbooks, the
chronological ages assigned to the stages are often inconsistent as shown in Table 2.
Some stages even have discrepancies of fifteen years! Obviously, certain development
features occur in the younger years of life; however, human development does not
suddenly slow down after puberty. For instance, most physical attributes develop early in
life but, in contrast, social and psychological development continue to occur well into late
adulthood.
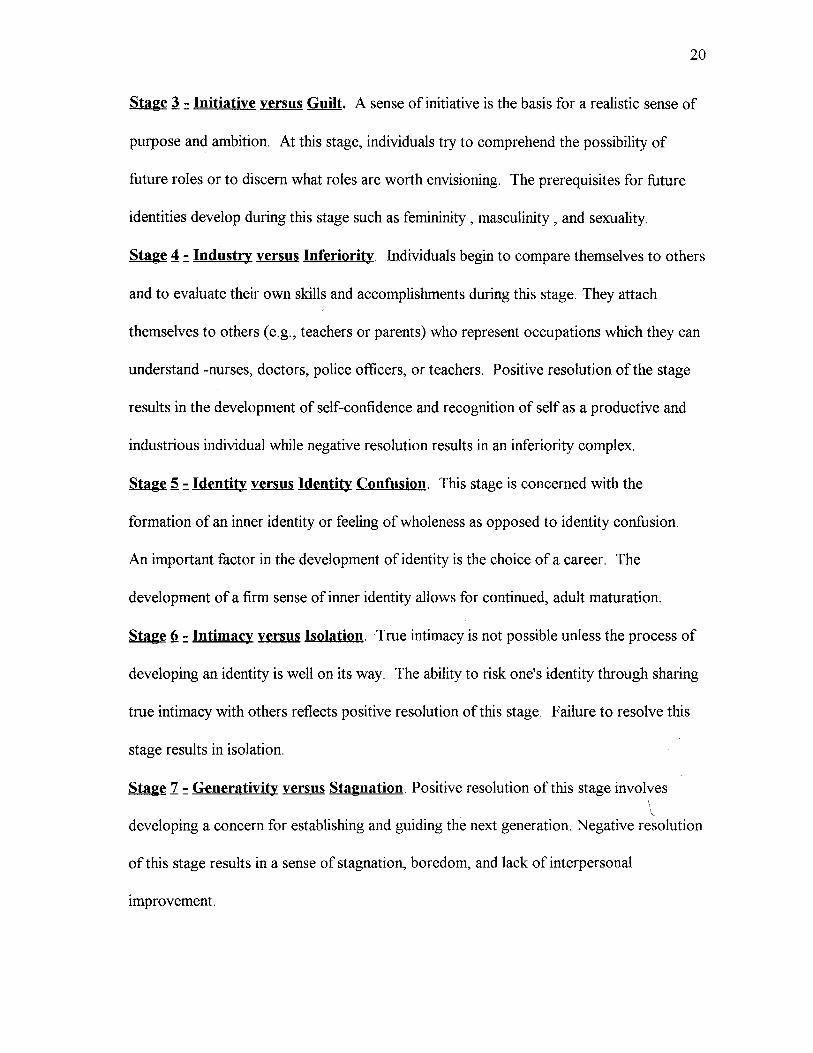
Erikson's stages of human psychosocial development can be described as
follows:
~ 1 = Trust versus Mistrust. Trust is defined as an essential trustfulness of
others and a fundamental sense of one's own trustworthiness. The development
of basic trust is believed to be the cornerstone of vital personality.
~ 1 = Autonomy versus Shame and Doubt. Autonomy is the courage to be an
independent individual able to choose and guide one's own future. It develops out of a
sense of self-control without the loss of self-esteem. Shame and doubt result from the over
control of parents and the feeling that one is losing self-control. The development of
autonomy requires a firmly developed early sense of trust.
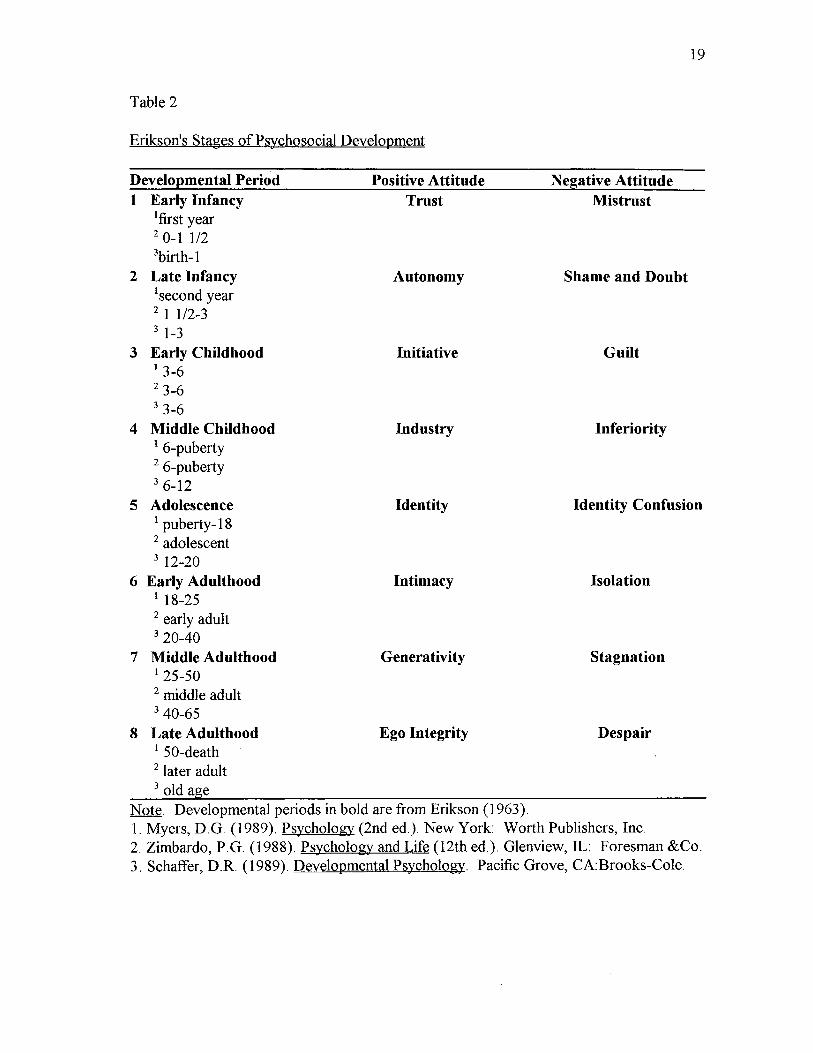
Table 2
Erikson's Stages of Psychosocial Development
Developmental Period 1 Early Infancy
1first year 2 0-1 1/2 3birth-l
2 Late Infancy 1second year 2 1 1/2-3 3 1-3
3 Early Childhood I 3-6 2 3-6 3 3-6
4 Middle Childhood 1 6-puberty 2 6-puberty 3 6-12
Positive Attitude Trust
Autonomy
Initiative
Industry
19
Negative Attitude Mistrust
Shame and Doubt
Guilt
Inferiority
5 Adolescence 1 puberty-18 2 adolescent 3 12-20
Identity Identity Confusion
6 Early Adulthood 1 18-25 2 early adult 3 20-40
7 Middle Adulthood I 25-50 2 middle adult 3 40-65
8 Late Adulthood 1 SO-death 2 later adult 3 old a e
Intimacy
Generativity
Ego Integrity
Note. Developmental periods in bold are from Erikson (1963).
Isolation
Stagnation
Despair
1. Myers, D.G. (1989). Psychology (2nd ed.). New York: Worth Publishers, Inc. 2. Zimbardo, P.G. (1988). Psychology and Life (12th ed.). Glenview, IL: Foresman &Co. 3. Schaffer, D.R. (1989). Developmental Psychology. Pacific Grove, CA:Brooks-Cole.
20
Stage J. = Initiative versus Guilt. A sense of initiative is the basis for a realistic sense of
purpose and ambition. At this stage, individuals try to comprehend the possibility of
future roles or to discern what roles are worth envisioning. The prerequisites for future
identities develop during this stage such as femininity, masculinity, and sexuality.
Stage ~ = Industry versus Inferiority. Individuals begin to compare themselves to others
and to evaluate their own skills and accomplishments during this stage. They attach
themselves to others (e.g., teachers or parents) who represent occupations which they can
understand -nurses, doctors, police officers, or teachers. Positive resolution of the stage
results in the development of self-confidence and recognition of self as a productive and
industrious individual while negative resolution results in an inferiority complex.
Stage S. = Identity versus Identity Confusion. This stage is concerned with the
formation of an inner identity or feeling of wholeness as opposed to identity confusion.
An important factor in the development of identity is the choice of a career. The
development of a firm sense of inner identity allows for continued, adult maturation.
~ §. = Intimacy versus Isolation. True intimacy is not possible unless the process of
developing an identity is well on its way. The ability to risk one's identity through sharing
true intimacy with others reflects positive resolution of this stage. Failure to resolve this
stage results in isolation.
~ 1 = Generativity versus Stagnation. Positive resolution of this stage involves
\ developing a concern for establishing and guiding the next generation. Negative resolution
of this stage results in a sense of stagnation, boredom, and lack of interpersonal
improvement.
21
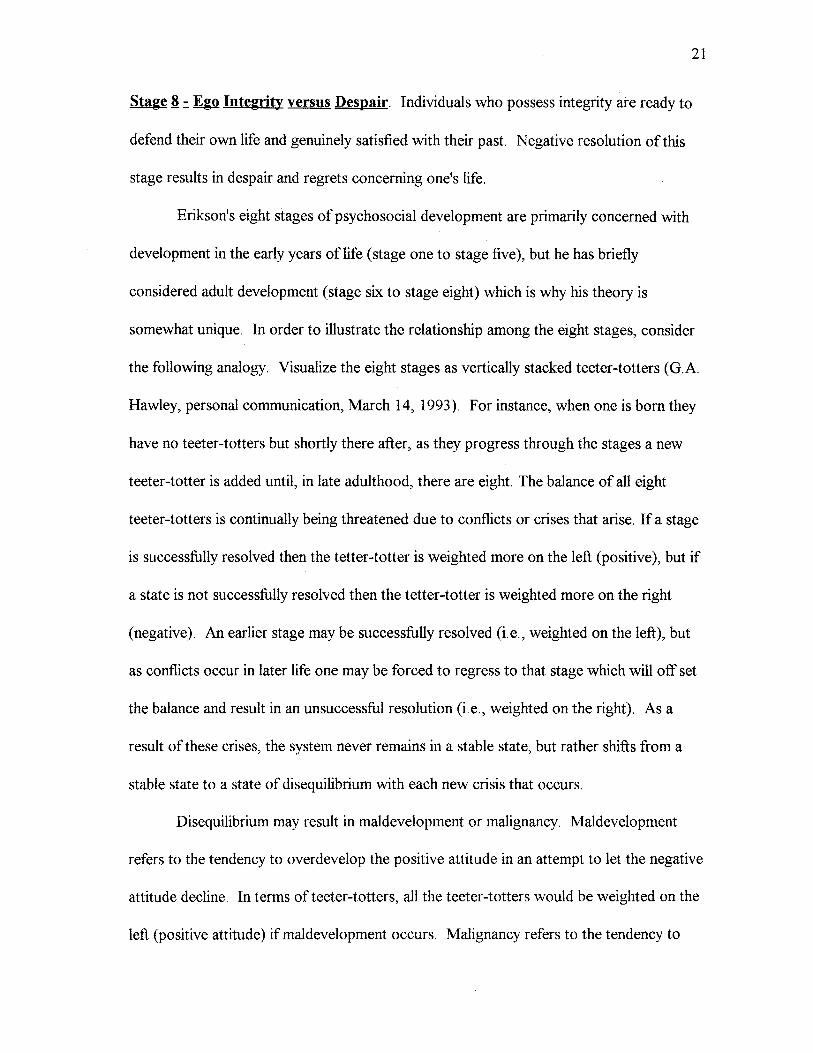
Stage ~ = Ego Integrity versus Despair. Individuals who possess integrity are ready to
defend their own life and genuinely satisfied with their past. Negative resolution ofthis
stage results in despair and regrets concerning one's life.
Erikson's eight stages of psychosocial development are primarily concerned with
development in the early years of life ( stage one to stage five), but he has briefly
considered adult development ( stage six to stage eight) which is why his theory is
somewhat unique. In order to illustrate the relationship among the eight stages, consider
the following analogy. Visualize the eight stages as vertically stacked teeter-totters (G.A.
Hawley, personal communication, March 14, 1993). For instance, when one is born they
have no teeter-totters but shortly there after, as they progress through the stages a new
teeter-totter is added until, in late adulthood, there are eight. The balance of all eight
teeter-totters is continually being threatened due to conflicts or crises that arise. If a stage
is successfully resolved then the tetter-totter is weighted more on the left (positive), but if
a state is not successfully resolved then the tetter-totter is weighted more on the right
(negative). An earlier stage may be successfully resolved (i.e., weighted on the left), but
as conflicts occur in later life one may be forced to regress to that stage which will off set
the balance and result in an unsuccessful resolution (i.e., weighted on the right). As a
result of these crises, the system never remains in a stable state, but rather shifts from a
stable state to a state of disequilibrium with each new crisis that occurs.
Disequilibrium may result in maldevelopment or malignancy. Maldevelopment
refers to the tendency to overdevelop the positive attitude in an attempt to let the negative
attitude decline. In terms of teeter-totters, all the teeter-totters would be weighted on the
left (positive attitude) if maldevelopment occurs. Malignancy refers to the tendency to
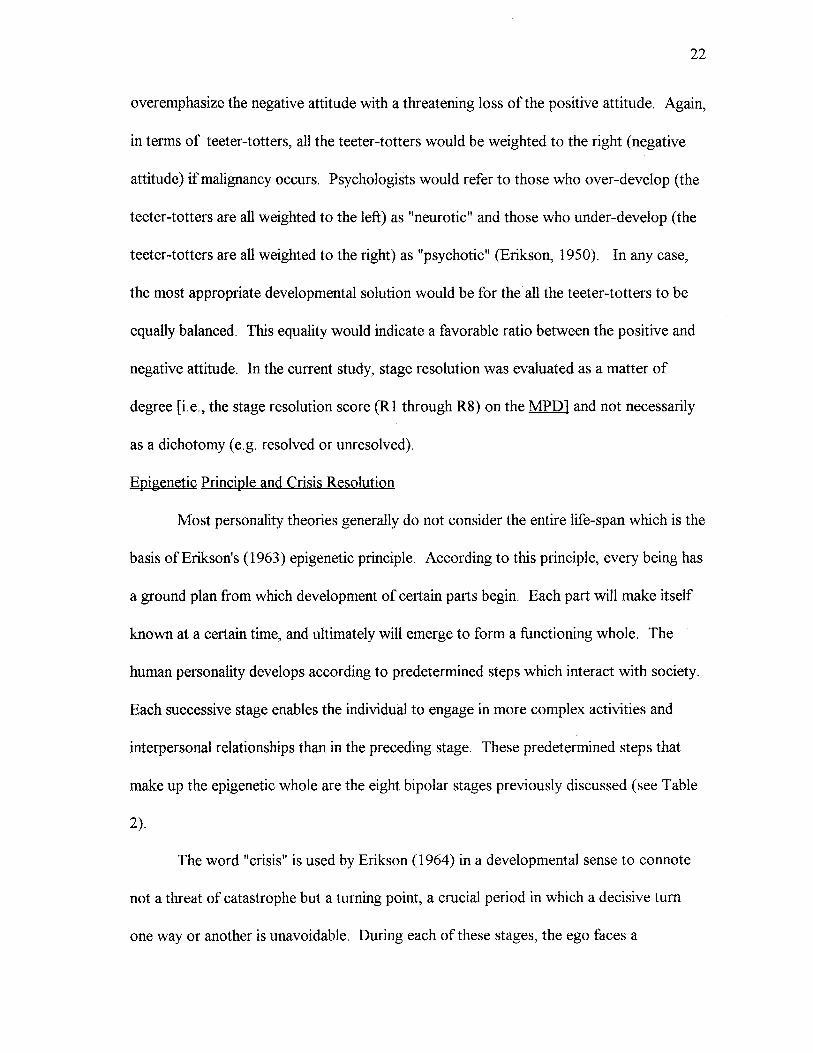
22
overemphasize the negative attitude with a threatening loss of the positive attitude. Again,
in terms of teeter-totters, all the teeter-totters would be weighted to the right (negative
attitude) if malignancy occurs. Psychologists would refer to those who over-develop (the
teeter-totters are all weighted to the left) as "neurotic" and those who under-develop (the
teeter-totters are all weighted to the right) as "psychotic" (Erikson, 1950). In any case,
the most appropriate developmental solution would be for the all the teeter-totters to be
equally balanced. This equality would indicate a favorable ratio between the positive and
negative attitude. In the current study, stage resolution was evaluated as a matter of
degree [i.e., the stage resolution score (RI through R8) on the MPD] and not necessarily
as a dichotomy (e.g. resolved or unresolved).
Epigenetic Principle and Crisis Resolution
Most personality theories generally do not consider the entire life-span which is the
basis of Erikson's (1963) epigenetic principle. According to this principle, every being has
a ground plan from which development of certain parts begin. Each part will make itself
known at a certain time, and ultimately will emerge to form a functioning whole. The
human personality develops according to predetermined steps which interact with society.
Each successive stage enables the individual to engage in more complex activities and
" interpersonal relationships than in the preceding stage. These predetermined steps that
make up the epigenetic whole are the eight bipolar stages previously discussed (see Table
2).
The word "crisis" is used by Erikson (1964) in a developmental sense to connote
not a threat of catastrophe but a turning point, a crucial period in which a decisive turn
one way or another is unavoidable. During each of these stages, the ego faces a
psychosocial crisis which is resolved either more positively (e.g., Autonomy) or more
negatively (e.g., Shame and Doubt) manner which influences subsequent ego
development. At a certain point in time an individual is propelled from the present stage
into the next development stage regardless of resolution at the present stage.
23
Unsuccessful resolution of the crisis generally prevents successful resolution of succeeding
stages. Thus, the resolution of a crisis creates a divorce of the two end points of the scale
and results in progression into the next stage. Furthermore, a more positive resolution at
one stage increases the chances that individuals will be able to resolve crises at later
stages.
Erikson emphasized that for healthy development of the ego, the successful
resolution of a crisis includes remanent of less successful resolutions. Finally, each crisis
exists in some form before it becomes "phase-specific" and the resolution of each crisis
exists as an active dimension of the ego as new crises are met. Therefore, a crisis may
not be resolved once and for all. Erikson optimistically believed that the general tendency
was toward resolving the crisis by establishing a strong self-identity (Erikson, 1950).
Erikson (1968a) believed that
... all such developmental and normative crises differ from imposed, traumatic,
and neurotic crises in that very process of growth provides new energy even as
society offers new and specific opportunities according to its dominant conception
of the phases of life (p.163).
Although Erikson was optimistic that there is an inherent tendency toward successful
resolution of the developmental crises, resolution is greatly influenced by the quality of
previous psychosocial experiences (Erikson, 1968a). He viewed people as actively
attempting to deal with their experience in a constructive manner while acknowledging
that experience can place limits and hindrances on growth (Erikson, 1964).
Psychosocial Development of Older Adults
24
According to Erikson, Erikson, and Kivnick ( 1986), as humans develop
psychosocially they strive for hope, will, purpose, competence, fidelity, love, care, and
wisdom, respectively. By the time one reaches the final stage (Integrity vs. Despair) they
are attempting to reconcile the earlier psychosocial themes and to integrate them into old
age. Older adults are challenged to draw on a life cycle that is far more completed than
yet to be lived, to consolidate a sense of wisdom with which to live out the future, to place
him- or herself in perspective among those now living, and to accept his or her place in an
infinite historical progression (Erikson, 1986). In other words, older adults have to use
wisdom and other virtues earned to confront the future and accept the past.
By the time one reaches old age he\she will have encountered many crises and
resolved these crises in order to progress through the stages. These conflicts are struggles
with specific manifestations of anxiety at each stage and are partial regressions to earlier
conflicts (Erikson & Erikson, in Spicker, Woodward, & Van Tassel, 1978 p. 5). Men and
women can begin to face the issues they may have neglected in their forties and fifties,
realizing that social commitments have been closing in on their choices and chances. In
Identity, Youth and Crisis ( 1968), Erikson conceives of old age as a period for
summarizing one's experiences, primarily one's past experiences, as evidence of one's
ultimate identity and integrity. During middle age one may have been very active in
parenting, working, and preparing the world for the next generation. As age increases,
however, that person may take a more passive or inactive role. This role change may
25
create a psychosocial disequilibrium. Older adults often must relinquish many of their
responsibilities to the younger generation and trust that the world will still function. They
may start living vicariously through their children or grandchildren. Their familial
relationships may change as well. For example, they were once a child who depended on
a parent, then a parent, now a child again with their child acting as the parent. This
process indicates that developmental progression may follow more of a cyclical pattern
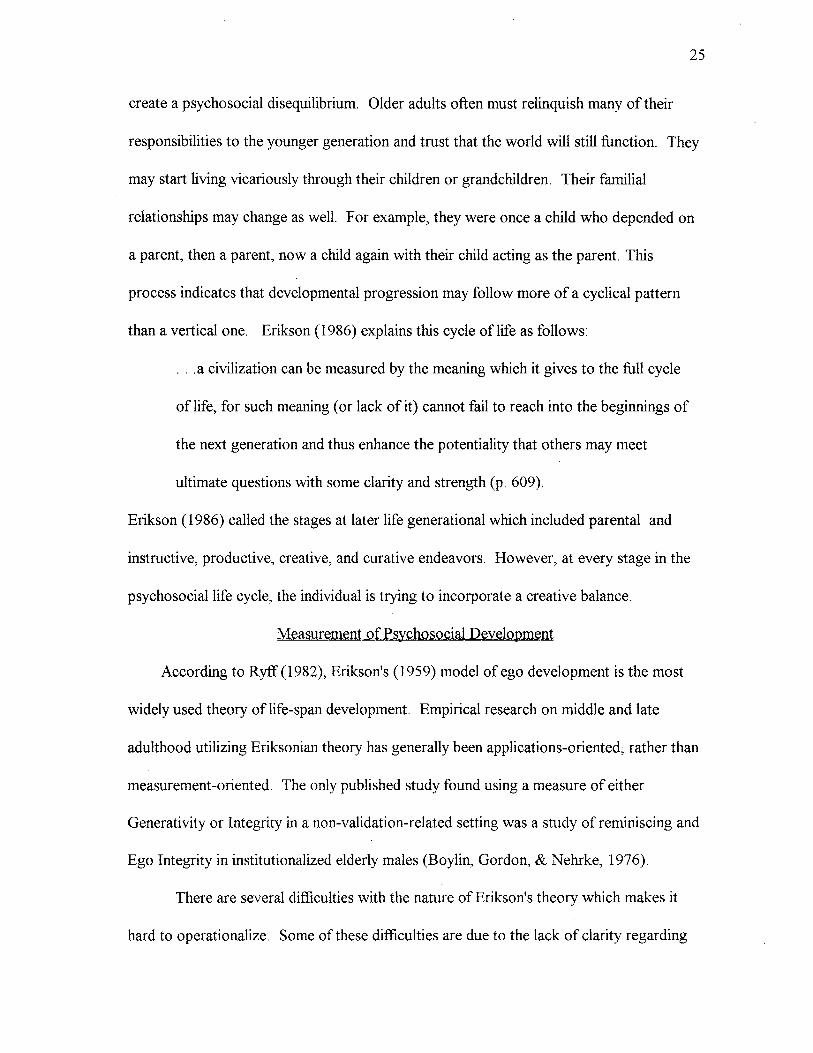
than a vertical one. Erikson (1986) explains this cycle oflife as follows:
... a civilization can be measured by the meaning which it gives to the full cycle
of life, for such meaning ( or lack of it) cannot fail to reach into the beginnings of
the next generation and thus enhance the potentiality that others may meet
ultimate questions with some clarity and strength (p. 609).
Erikson ( 1986) called the stages at later life generational which included parental and
instructive, productive, creative, and curative endeavors. However, at every stage in the
psychosocial life cycle, the individual is trying to incorporate a creative balance.
Measurement of Psychosocial Development
According to Ryff (1982), Erikson's ( 1959) model of ego development is the most
widely used theory of life-span development. Empirical research on middle and late
adulthood utilizing Eriksonian theory has generally been applications-oriented, rather than
measurement-oriented. The only published study found using a measure of either
Generativity or Integrity in a non-validation-related setting was a study of reminiscing and
Ego Integrity in institutionalized elderly males (Boylin, Gordon, & Nehrke, 1976).
There are several difficulties with the nature of Erikson's theory which makes it
hard to operationalize. Some of these difficulties are due to the lack of clarity regarding
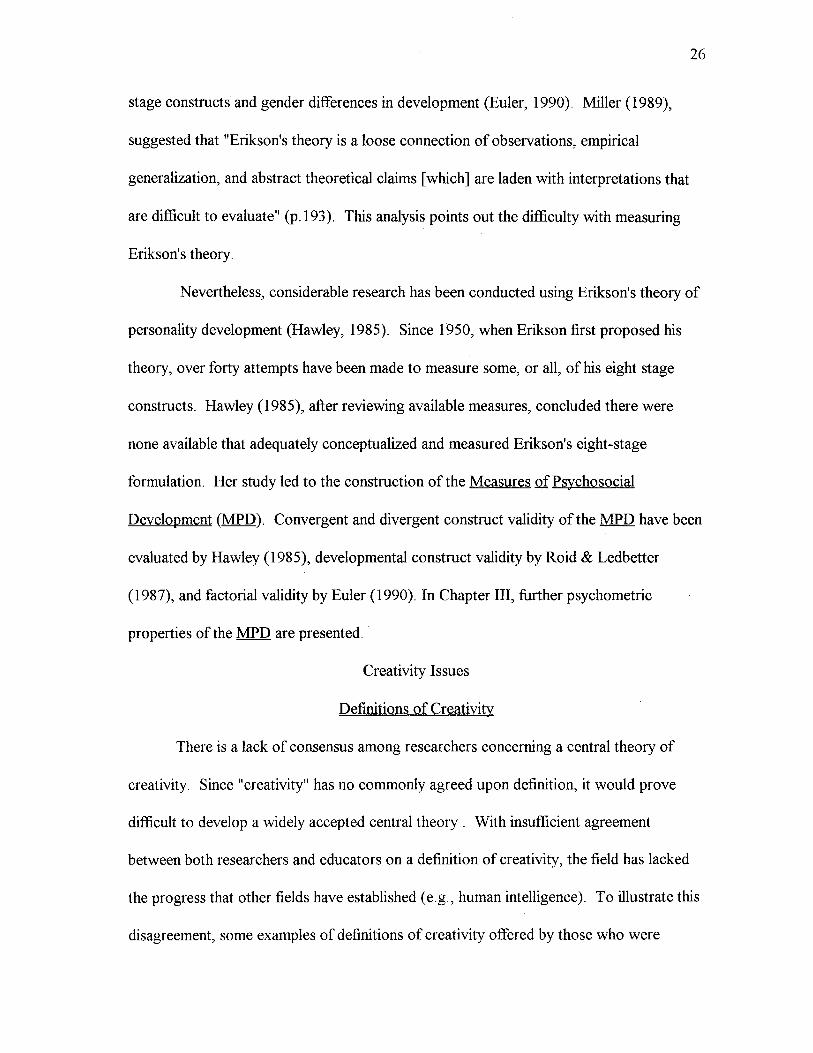
stage constructs and gender differences in development (Euler, 1990). Miller (1989),
suggested that "Erikson's theory is a loose connection of observations, empirical
generalization, and abstract theoretical claims [which] are laden with interpretations that
are difficult to evaluate" (p.193). This analysis points out the difficulty with measuring
Erikson's theory.
26
Nevertheless, considerable research has been conducted using Erikson's theory of
personality development (Hawley, 1985). Since 1950, when Erikson first proposed his
theory, over forty attempts have been made to measure some, or all, of his eight stage
constructs. Hawley (1985), after reviewing available measures, concluded there were
none available that adequately conceptualized and measured Erikson's eight-stage
formulation. Her study led to the construction of the Measures of Psychosocial
Development (MPD). Convergent and divergent construct validity of the MPD have been
evaluated by Hawley ( 1985), developmental construct validity by Roid & Ledbetter
(1987), and factorial validity by Euler (1990). In Chapter III, further psychometric
properties of the MPD are presented.
Creativity Issues
Definitions of Creativity
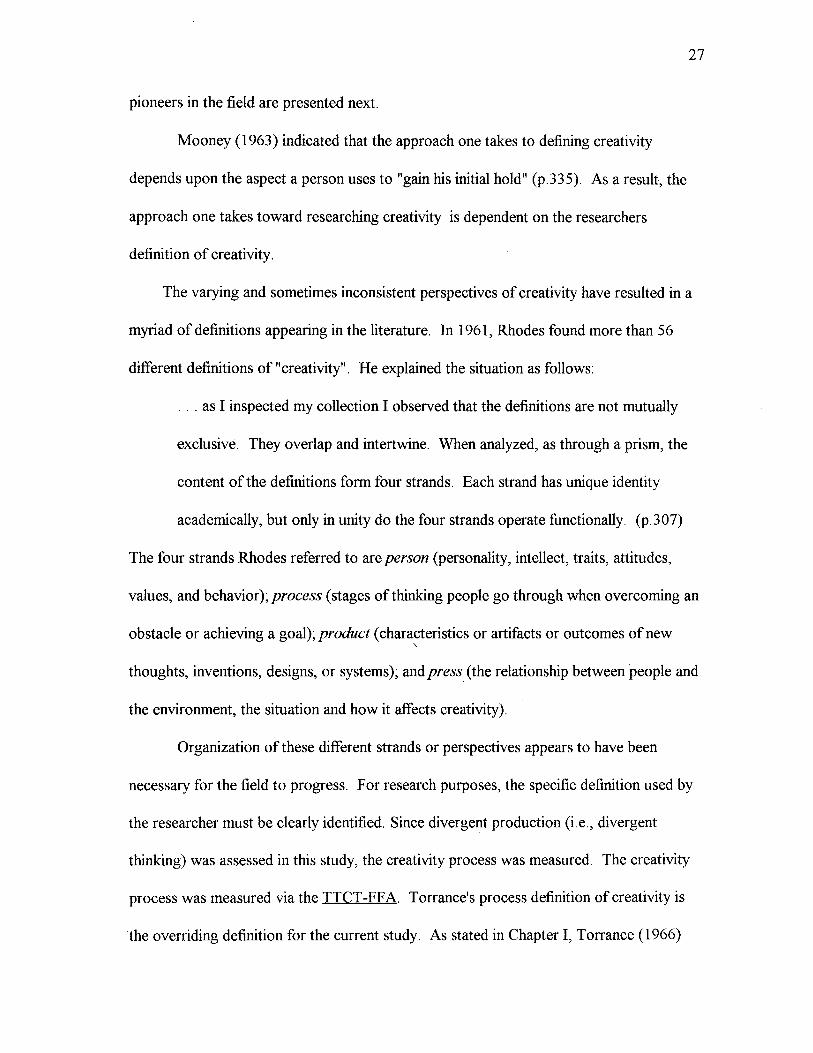
There is a lack of consensus among researchers concerning a central theory of
creativity. Since "creativity" has no commonly agreed upon definition, it would prove
difficult to develop a widely accepted central theory . With insufficient agreement
between both researchers and educators on a definition of creativity, the field has lacked
the progress that other fields have established (e.g., human intelligence). To illustrate this
disagreement, some examples of definitions of creativity offered by those who were
27
pioneers in the field are presented next.
Mooney (1963) indicated that the approach one takes to defining creativity
depends upon the aspect a person uses to "gain his initial hold" (p.335). As a result, the
approach one takes toward researching creativity is dependent on the researchers
definition of creativity.
The varying and sometimes inconsistent perspectives of creativity have resulted in a
myriad of definitions appearing in the literature. In 1961, Rhodes found more than 56
different definitions of "creativity". He explained the situation as follows:
... as I inspected my collection I observed that the definitions are not mutually
exclusive. They overlap and intertwine. When analyzed, as through a prism, the
content of the definitions form four strands. Each strand has unique identity
academically, but only in unity do the four strands operate functionally. (p.307)
The four strands Rhodes referred to are person (personality, intellect, traits, attitudes,
values, and behavior);process (stages of thinking people go through when overcoming an
obstacle or achieving a goal); product ( characteristics or artifacts or outcomes of new '
thoughts, inventions, designs, or systems); and press (the relationship between people and
the environment, the situation and how it affects creativity).
Organization of these different strands or perspectives appears to have been
necessary for the field to progress. For research purposes, the specific definition used by
the researcher must be clearly identified. Since divergent production (i.e., divergent
thinking) was assessed in this study, the creativity process was measured. The creativity
process was measured via the TTCT-FF A Torrance's process definition of creativity is
the overriding definition for the current study. As stated in Chapter I, Torrance (1966)
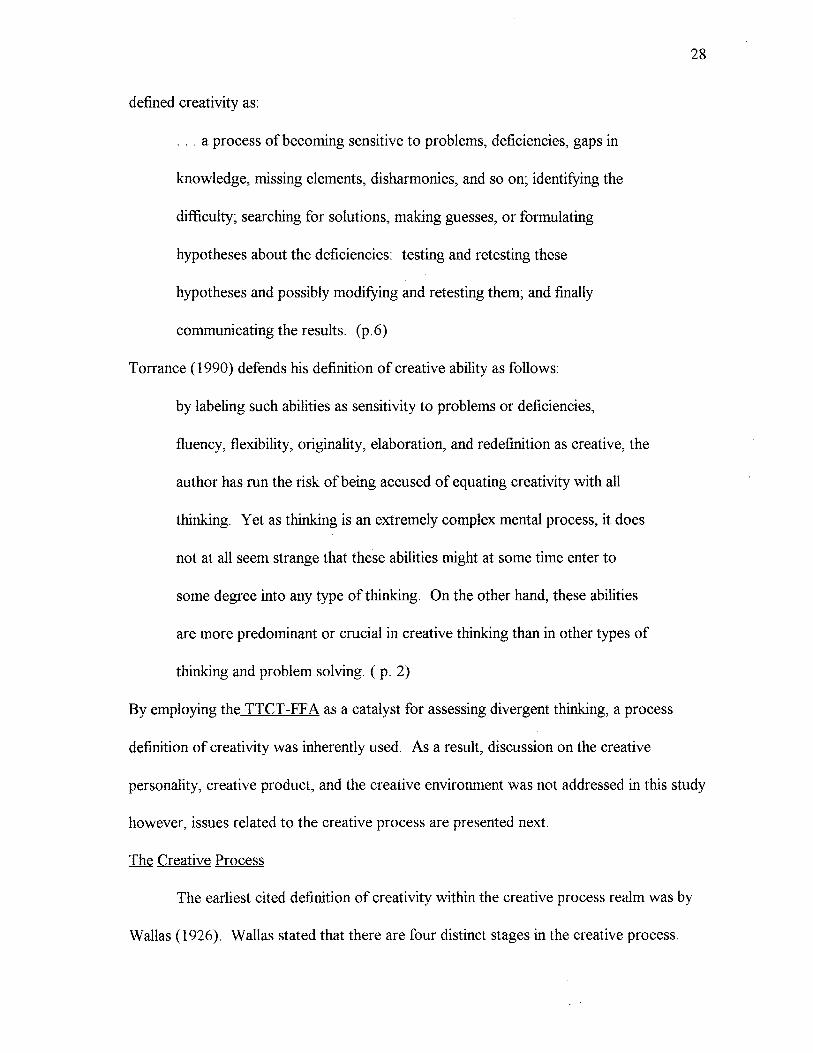
defined creativity as:
. . . a process of becoming sensitive to problems, deficiencies, gaps in
knowledge, missing elements, disharmonies, and so on; identifying the
difficulty; searching for solutions, making guesses, or formulating
hypotheses about the deficiencies: testing and retesting these
hypotheses and possibly modifying and retesting them; and finally
communicating the results. (p. 6)
Torrance (1990) defends his definition of creative ability as follows:
by labeling such abilities as sensitivity to problems or deficiencies,
fluency, flexibility, originality, elaboration, and redefinition as creative, the
author has run the risk of being accused of equating creativity with all
thinking. Yet as thinking is an extremely complex mental process, it does
not at all seem strange that these abilities might at some time enter to
some degree into any type of thinking. On the other hand, these abilities
are more predominant or crucial in creative thinking than in other types of
thinking and problem solving. ( p. 2)
28
By employing the TTCT-FF A as a catalyst for assessing divergent thinking, a process
definition of creativity was inherently used. As a result, discussion on the creative
personality, creative product, and the creative environment was not addressed in this study
however, issues related to the creative process are presented next.
The Creative Process
The earliest cited definition of creativity within the creative process realm was by
Wallas (1926). Wallas stated that there are four distinct stages in the creative process.
29
The first stage is that of preparation, where the problem to be solved is detected and data
relevant to it are identified. The second stage is incubation, where data gathering is
continued, then it is essential to leave the problem alone. Efforts to solve the problem
must be allowed to sink into the unconscious mind. The third stage is that of illumination,
where suddenly the ideas, solution, or new relationship emerges. The fourth stage is
realization that the idea is new and appealing. In 1975, Gowan described Wallas' stages
more clearly as: input, relaxation, output, and product.
The idea that creative process occurs in stages has been accepted by some (i.e.,
Helmholtz, 1896; Stein 1974) and rejected by others (i.e., Vinacke, 1952). In various case
studies, Vinacke (1952) noted the recurrence of some stages during the production of
creative work. Regardless of the disagreement, the creative process is most often defined
as occurring in stages, perhaps because stages can be based on observation. There is
virtually no other way to measure the creative process than via observation.
From a psychoanalytic perspective, Arieti (1976) noted that the creative process
could be defined as the role of incubation of ideas and other unconscious and preconscious
influences as inferred events (Barron, 1963; Freud, 1908; Parnes et al., 1977). Or, the
creative process involves new ways of seeing, obtaining a different point of view, creating
an original idea or a new relationship between ideas (Mccaslin, 1984).
May (1983) defined creativity as the process of bringing something new into being.
Similarly, Davis (1983) described creativity as the process of combining previously
unrelated ideas or perceiving a new relationship from previously unrelated ideas. Knapp
( 1978) viewed creativity as a continuous process which can disappear if analyzed too
meticulously. Ghiselin (1952) defined creativity as an underlying process which is
divergent yet productive. Again, divergent thinking skills were measured as creative
process skills.
30
In review, these theorists suggest that creativity involves a process that occurs in
stages and that the creative process is very much the same across all persons. However,
the researcher defines the creative process, the next step is to select specific behaviors for
observation.
Creativogenic Factors. Melrose (1989) suggested that certain environmental
factors may enhance the probability of the creative process occurring. Some of these
Creativogenic factors may be: availability of cultural means; openness to cultural stimuli;
stress on becoming and not just being; exposure to different and even contrasting cultural
stimuli; tolerance for diverging views; and interaction of significant persons (Areti, 1976).
Arieti (1976) stated that these factors are unlikely to coexist, and that only the availability
of cultural means is essential to the creative process. When assessing the creative process
of older adults, the cultural experiences must be considered as they were in this study by
incorporating a psychosocial development theory.
Creativity Across the Life-Span
The majority of creativity research is conducted.with children or young adults
(Clark, 1983; Fishkin, 1989; Seagoe, 1975). There appears to be a lack of research with
older adults or more specifically, creativity across the adult life-span. Cohen ( 1986) noted
that II generic studies pertaining to the question of life-span creativity development are
scarce" (p. l). In a review of the literature, Dacey (1989) reported the existence of one
theoretical article (Lesner & Hillman, 1983) about the development of creativity across the
life-span. Dacey (1989) goes on to state that there have been studies conducted on the
course of creative output across the life-span and they are usually done by studying the
productivity of groups of people of different ages. For example, most researchers have
studied individuals or groups of individuals such as artists (Lowenfeld, 1941 ), scientists
(Lehman, 1953), classical composers (Simonton, 1977), architects (MacKinnon, 1964),
and independent inventors (Albaum, 1976).
31
Lesner and Hillman (1983) offered three stages that were a "logical sequence of
representing the life cycle of creativity" (p.108). These stages were developed by applying
the developmental theories of Freud, Erikson, and Piaget to the concept of creativity.
That may be the reason why the developmental stages appear to reflect more of a
psychosocial or psychological developmental cycle rather than a creative developmental
cycle. The stages that Lesner and Hillman (1983) suggested were:
1. From birth to 11 years old - "creative internal enrichment." The child
" .. .learns basic life skills and develops his or her own distinctive personality" (p. l 08);
2. From 12 to 60 years old- "creative external enrichment." This stage is marked by " ... a
very gradual transition that reflects that underlying concurrent transition from the self
centered orientation seen in the first stage to a more outward, socially aware, multi
focused orientation which develops gradually as one matures" (p. l 09);
3. From 60 to death- "creative self-evaluation." This stage features
". . . a return to a narcissistic orientation that focuses on creative self-evaluation; it entails a
process of assessment and taking stock of one's life in preparation for eventual death"
(p.110). These three stages appear to be distinct, yet very broad (stage 1-11 years; stage
2-49 years; stage 3-undeterminable number of years). Lesner and Hillman recognize that
creative interest is present throughout the entire human life-span. Examining creativity
32
across the life-span provides one developmental schema for exploring creativity.
One of the forerunners of the study of creativity across the life-span was Schaie
( 1977) who proposed a decrement model of the course of creative ability over the life
cycle. He suggested that the maximum level of creative capacity was reached sometime
during adulthood (approximately 40 years of age), followed by a subsequent, irreversible
decline in succeeding years. There have been several studies to support this theory
(Alpaugh & Birren, 1977; Alpaugh, Parham, Cole, & Birren, 1982; Alpaugh, Renner, &
Birren, 1976; Lehman, 1953, 1956; Simonton, 1975, 1984). For instance, after 20 years
ofresearch, Lehman (1953) concluded that creativity declines with age. However, in
contrast, recent research has been conducted which refutes the decrement theory (Butler,
1967, 1973; Cohen, 1986; Cohen-Shalev, 1989; Hendrucks, 1987; Kogan, 1973;
Mumford, 1984; Pruyser, 1987; Romaniuk & Romaniuk, 1981; and Smith & Kragh,
1975). For example, Jaquish and Ripple (1981) found that while elderly adults (61-84
years old) were generally less fluent and flexible than younger adults ( 18-60 years old) age
did not differentiate the ability to be original.
Schaie's age decrement model is not an age-related creativity curve at all, but
rather an age-related career curve. Only a modest amount of attention has been paid to
creativity across the life-span as a whole for those who are not in "creative" professions.
For example, in 1921, Lewis Terman selected 40 females for his study of intellectually
gifted California school children. Due to their age, Terman's subjects could not have been
chosen on the basis of their career choice. These individuals were interviewed
intermittently from 1921 to 1987 regarding their creative accomplishments. Vaillant and
Vaillant (1990) reported that the women's capacity for creativity (putting something new
33
in the world that was not there before) was assessed by a recorder who examined their
creative ability according to the following criteria: statewide recognition for a creative
product, community recognition for creativity, creative personal hobbies, or sustained
creativity of any kind. The results indicated that 20 of the 40 women were perceived as
creative, usually for literary publication, art, music, or starting an organization. This study
indicates that creative output is not necessarily a function of career age or professional age
but, perhaps, that creative output is related to development.
Schaie's decrement model of creativity, often cited in psychological literature (e.g.,
Cohen-Shalev, 1989; Kogan, 1987; Schaie & Willis, 1986; Simonton, 1990) reflects a
cynical view for those over 40 years of age. In contrast to Schaie's view, several
researchers believe that older adults are and can be creative. For instance, Lindauer
(1992) stated that scholars in the humanities argue that old age is a time when a variety of
positive changes in creativity can occur. Butler (1974), for example, believed that there
were varying degrees of creativity in older adults. He suggests that one could develop
creative abilities throughout life. For instance, one can go from little or no creative ability
to some ability with age.
Another theorist who discusses creativity from a life-span approach is Taylor
(1974). His view of creativity is similar to Butler's (1974) in the sense that different
creative abilities are maximized at different points in the life cycle. He lists five times
during which creative potential occurs: in the earliest years oflife, during the formal years
of educational training, during the middle and late 20s, during the late 20s through the late
30s, and during the late 50s and 60s. Taylor completely disregards the suggestion that
creative ability may be maximized in the elderly (i.e., those over 60). He also suggested
34
that the motivations for creativity vary with the particular stage in which an individual is
currently involved. It is apparent that Taylor recognizes that creative ability is present in
later life (50s and 60s). Consensus has by no means been reached within creativity across
the life-span perspective, but some agreement has been reached on several issues. For
instance, Simonton (1988) indicated that the positive associations among aptitude,
longevity, and production rate have been agreed upon by many theorists.
Creativity and the Older Adult
Creativity in maturity and old age was studied by Smith and Kragh (1975). They
discovered that the creative processes in adults differs from the creative processes in
adolescents and children. Their study indicated that although creativity was present in
older adults, it was not expressed in the same manner by adolescents or children. This
difference in creative expression may be one reason why the life-span theorists conclude
that creativity declines in the later years. An explanation may be that these theorists were
researching creative behaviors that are commonly expressed by children or adolescents,
but not so commonly expressed by older adults.
One explanation of Schaie's (1977) and other life-span theorists' findings
concerning the decline in creativity in older adults may be due to the measurement of
creative ability for this population. Adult creativity, historically, has been measured with
instruments designed for children and young adults. lflife-span theorists are concluding
that creativity is not apparent in older adults, why has it been suggested (e.g.,Dohr &
Forbess, 1986; Romaniuk, 1978) that older adults themselves do not necessarily perceive a
decline in creative capacity with age? Perhaps researchers are not examining creativity
with older adults appropriately.
35
Creativity or Conformity
One issue that must be contemplated in a discussion of the creativity of older
adults is that of conformity. In general, creativity has been seen as contributing original
ideas, different points of view, and new ways of looking at problems and conformity has
been seen as doing what is expected or not disturbing others. Klien and Birren (1973)
found that older adults had a tendency toward conformity rather than creativity. Older
adults in the late 20th century were reared during times when conformity was rewarded
and creativity may have been punished. For instance, in the past, those who conformed
received less social pressure than did those who did not conform or expressed their
individuality. As a result of upbringing, older adults today may not appear as creative on
formal measures due to the instilled social pressure to conform. Additionally, since values
and mores differ across cultures, one's background may impact their creative expression.
Factors That Engender a Decline in Older Adults' Creativity
The literature indicates that there are certain factors that may be related to the
decline of creativity in the later years. Some of these factors are physical illness
(Simonton, 1977), the slowing down of information processing (Alpaugh & Birren, 1977),
and a decrease in the self-esteem among the elderly (Jaquish & Ripple, 1981 ). There are
some indications that older people take longer to learn new things (Botwinick, 1967), are
more cautious (Canestrairi, 1963), are hesitant to take risks (Botwinick, 1973), need more
structure to feel comfortable (Klein, 1972), and need help in raising their level of
self-perceived competence (Klein & Birren, 1973). All of these indications suggest that
older people are not fundamentally less creative than younger persons but that there are
factors that may interfere with older adults' creative ability. Clark and Osgood (1985)
36
have noted that older adults have many qualities necessary for creativity, such as a wealth
of experience, knowledge, skills, wisdom, and time.
In 1953, after 20 years ofresearch on creativity across the life-span, Lehman
concludedthat creativity declines with age. In 1956, Lehman tried to clear up some of the
misconceptions concerning his previous findings. He pointed out that it is not age itself
but the factors that accompany age that bring about a reduction in creativity. Lehman
included 16 factors in his 1956 study which account for the decrement of creativity in
older adults. A few of the factors he suggested are: a decline in physical vigor,
preoccupation with the practical demands of life, serious illness, lack of education, and a
decline in sensory capacity or motor precision. Despite Lehman's 1953 findings other
researchers (e.g., Dennis, 1966; Niederland, 1973; Roe, 1972; Simonton, 1975; Torrance,
1977) have looked for other possible reasons for a decline in creativity in older adults.
For instance, Niederland (1973) noted some possible reasons for the decline in creativity
may be disturbances in body image or the trauma of loss.
Assessment of Creativity
There may be no psychological construct that has proven to be so difficult to
measure as that of creativity and specifically, the creative process. The definitional
problems with creativity contribute to the difficulty of measuring the construct. The
primary concern in creativity assessment research has been lack of clarity regarding the
purposes or goals of creativity assessment. It has been suggested by Crockenberg (1972),
Khatena (1977), Rimm (1984), Torrance (1976, 1979b), and Treffinger (1980) that the
purpose of assessing creativity should extend well beyond the effort to label or isolate
highly creative people from their less creative peers. Treffinger (1987) states several
37
reasons for measuring creativity. A few of these examples are:
1. to advance research progress in understanding the nature, development, and nurture of
creative behavior;
2. to help remove the concept of creativity from the realm of mystery and superstition; and
3. to obtain data, such as pre-or post-test data, for group comparisons for research,
program evaluation, or assessment of change or growth as a function of instruction or
experimental conditions.
The previous reasons serve as rationale for assessing divergent thinking in this
study. This study adds to the literature base of creativity in general and more specifically,
to the divergent thinking or creative process of older adults.
Use of Older Adults as Research Subjects
The present study utilized groups of older adults in order to inspect the relationship
between stage resolution according to Eriksonian theory and divergent production. One
consideration when using older adults as research subjects is that of ensuring cooperation
for participating in research. Aiken (1980) noted that the elderly are frequently reluctant
to be evaluated because they see research as trivial or fear doing badly and appearing
foolish. Kuhlen (1964, per Whitboume, 1976) has alleged that unwillingness among the
elderly to be assessed stems from avoidance of stress. Whitboume (1976) reported that
older adults have higher test anxiety than younger adults which may make them reluctant
to participate in research.
Testing older adults can prove to be challenging, not only for this study but for all
research. Some of the challenges that may affect testing are loss of physical, cognitive,
and sensory abilities that accompany aging. Kuriansky, Gurland, and Cowan (1976) have
38
noted that the elderly frequently have physical problems like poor vision, hearing
difficulty, arthritis, and are quick to fatigue, as well as communication problems, which
make them difficult to test. Aiken (1980) has corroborated these observations, and added
that the aged also frequently have cognitive limitations, such as distractibility and memory
loss, which impair information processing. In addition, he has noted that their slower
motor speed and reactions result in timed tests (i.e., TTCT-FFA) being inherently biased
against them. In short, one must be cognizant of these challenges when assessing this
population and make all possible accommodates such as this study attempted to do.
In addition, older individuals are subject to group pressures and social influence, which
has been demonstrated by Kahana and Coe (1969). Klein (1972), found that in a
conformity situation older adults conformed significantly more often than younger
individuals. The subjects in this study were administered the TTCT-FFA and the MPD in
groups. As a result, some may have felt group pressures during administration which
could have resulted in socially desirable responses.
CHAPTER III
METHOD
Introduction
This chapter details the procedures employed for collecting data relevant to the
purpose of the study presented in Chapter I. Included in this chapter is: (1) a description
of the participants; (2) a discussion of the instrumentation used, including various
psychometric properties; (3) an outline of the procedures; and ( 4) a description of the
data analyses conducted for each research question.
Participants
The full sample in this study consisted of 127 older adults. However, twenty
participants provided incomplete data and were excluded from the study. As a result, the
final sample included 107 subjects, both female (N=76) and male (N=3 l). The
participants ranged in age from 50 to over 85. The sample was predominately Caucasian. '
Twenty-three of the participants were from California and 7 4 were from Oklahoma. The
subjects chosen for participation in this study were those who were living independently or
did not require physical assistance from others for daily tasks. More specific descriptive
characteristics of the participants appear in Chapter IV, along with issues concerning the
generalizability of the subject sample to the accessible population and the size of the
sample.
39
40
Instrumentation
The instruments used to collect data were a demographic information
questionnaire developed by the researcher (see Appendix A), the Measures of
Psychosocial Development (MPD), and the Torrance Tests of Creative Thinking: Figural
Form A (TTCT-FFA).
Demographic Information Questionnaire
Sample characteristics were assessed with an instrument developed by the
researcher. This instrument consisted of seven items. Including items measuring
participant age, gender, and ethnic background. Additional items were included to obtain
data for use beyond the current study.
Measures Qf Psychosocial Development
The Measures Qf Psychosocial Development (MJ!I!) (Hawley, 1988) were
designed to assess Erikson's stages of development as discussed in Chapter II and
presented in Table 2. There are 112 items on this self-report instrument. The items are
statements rated along a five-point Likert scale. For example, one statement is "the
younger generation is going to the dogs". The options on the Likert scale are as follows:
"very much like me" (four points), "like me" (three points), "somewhat like me" (two
points), "not much like me" (one point), and "not at all like me" (zero points).
Respondents are instructed to chose the option which best represents their opinion on
each statement. The 112 MED items assessed 16 scales (i.e., eight positive and eight
negative). Each of the positive and negative scales contain seven items. The individual
scales measured by the MED are listed in Table 3. As noted in Table 3, the positive scales
are labeled Pl through PS, the negative scales are labeled Nl through NS, and the derived
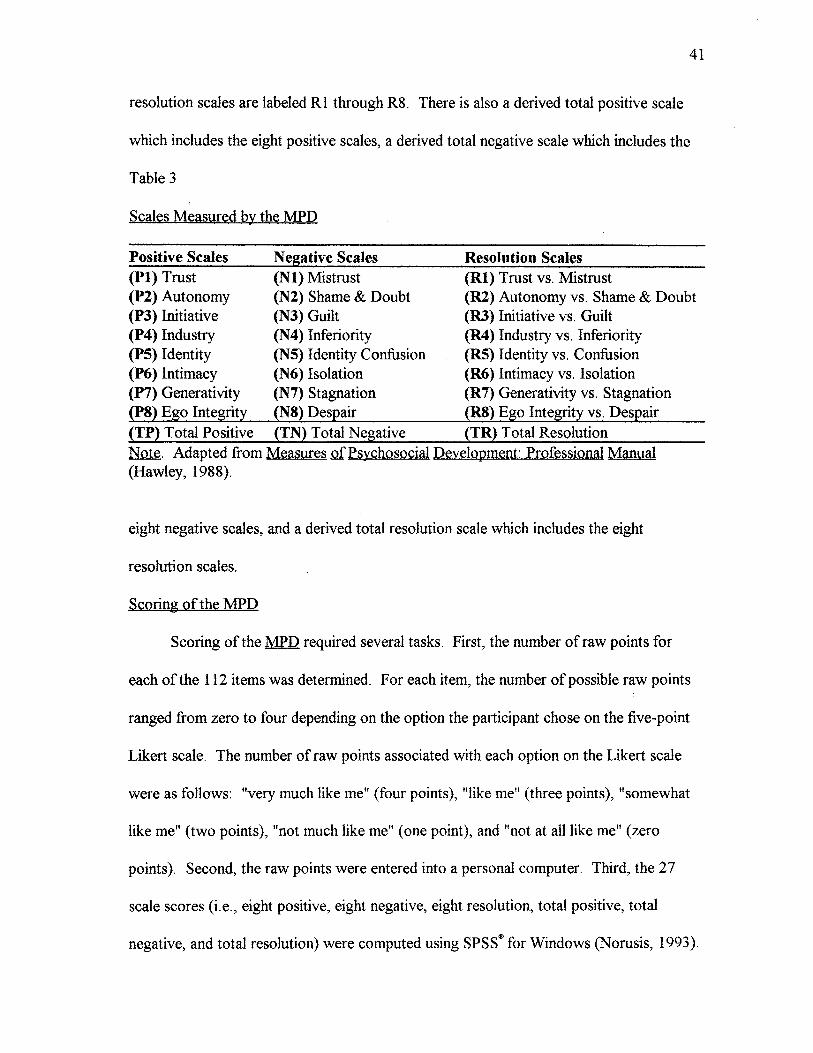
41
resolution scales are labeled RI through R8. There is also a derived total positive scale
which includes the eight positive scales, a derived total negative scale which includes the
Table 3
Scales Measured by the MPD
Positive Scales Negative Scales Resolution Scales (Pl) Trust (Nl) Mistrust . (Rl) Trust vs. Mistrust (P2) Autonomy (N2) Shame & Doubt (R2) Autonomy vs. Shame & Doubt (P3) Initiative (N3) Guilt (R3) Initiative vs. Guilt (P4) Industry (N4) Inferiority (R4) Industry vs. Inferiority (P5) Identity (N5) Identity Confusion (R5) Identity vs. Confusion (P6) Intimacy (N6) Isolation (R6) Intimacy vs. Isolation (P7) Generativity (N7) Stagnation (R7) Generativity vs. Stagnation (PS) Ego Integrity (NS) Despair (RS) Ego Integrity vs. Despair (TP) Total Positive (TN) Total Negative (TR) Total Resolution ~- Adapted from Measures Qf Psychosocial Development: Professional Manual (Hawley, 1988).
eight negative scales, and a derived total resolution scale which includes the eight
resolution scales.
Scoring of the MPD
Scoring of the MPD required several tasks. First, the number of raw points for
each of the 112 items was determined. For each item, the number of possible raw points
ranged from zero to four depending on the option the participant chose on the five-point
Likert scale. The number of raw points associated with each option on the Likert scale
were as follows: "very much like me" (four points), "like me" (three points), "somewhat
like me" (two points), "not much like me" (one point), and "not at all like me" (zero
points). Second, the raw points were entered into a personal computer. Third, the 27
scale scores (i.e., eight positive, eight negative, eight resolution, total positive, total
negative, and total resolution) were computed using SPSS® for Windows (Norusis, 1993).
42
The eight positive and eight negative scale scores (see Table 7) were calculated as a
sum of the number ofraw points associated with the seven items used to measure each of
the 16 scales (eight positive and eight negative). For example, Pl(Trust) was scored by
summing the number of raw points for items 1, 17, 33, 49, 65, 81, and 97 and
Nl(Mistrust) was the sum of points for items 9, 25, 41, 57, 73, 89, and 105. The total
positive score was computed as the sum of Pl, P2, P3, P4, P5, P6, P7, and P8 and the
total negative score was the sum ofNl, N2, N3, N4, N5, N6, N7, and N8. After the
positive and negative scales were computed, the stage resolution scale scores were
derived. The resolution scale scores were derived by subtracting each negative scale score
from its respective positive scale score (e.g., Pl-Nl or P6-N6). Finally, the total
resolution score was obtained by summing the stage resolution scale scores (i.e., Rl + R 2
+ R3 + R4 + R5 + R6 + R7 + RS).
The resolution scale scores (Rl through RS) resulted in a negative value if the
respondent had not resolved that particular stage. Likewise, the total resolution score
resulted in a negative value if the respondent had not resolved a majority of the stages.
For this study, the eight resolution scale scores were used as measures of psychosocial
development.
Missing Data. With any self-report questionnaire, scoring issues such as missing
data warrant discussion. Following Hawley's (1988) recommendation, if more than two
items for any of the eight positive and eight negative scales were missing for any
participant, or more than 10 items for the entire test were missing, that individual's data
were discarded. In the current study, 13 MPD protocols did not meet this
recommendation and were thus, discarded.
· 43
For those protocols with missing data that were not discarded, an average item rating
was generated, as suggested by Hawley (1988). For example, consider a participant with
one missing score on one of the 16 scales. The raw points for the completed items on the
scale were added and then divided by the number of completed items. This resulting value
was substituted for the missing data. The average item ratings replaced the missing data
for no more than two items on any scale. There were ten protocols that required
generating average itein ratings for some scales. As· a result, when the MPD data were
analyzed there were no "truly" missing data, or blanks.
Reliability Qf :the MPD
Internal Consistency Reliability . Internal consistency reliability is estimated by
determining how all items on a test relate to all other items and to the total test (Gay,
1987). With a theory-based instrument, such as the MPD, internal consistency reliability
is of importance because the items on the scales should be somewhat intercorrelated. If
the items are intercorrelated, they function well together and are likely to measure the
construct that is intended to be measured (e.g., Erikson's theory). If the items are
moderately or highly intercorrelated then they may measure a similar trait. For internal
consistency, a high intercorrelation among items is desirable.
One method of estimating internal consistency is via Cronbach's coefficient alpha
(Cronbach, 1951). Coefficient alpha is a lower bound of the proportion of variance in test
scores explained by common factors underlying item performance (Crocker & Algina,
1986). Coefficient alpha (a.) was computed by Hawley (1988) in her reliability study.
She obtained a sample of 372 adolescents and adults (213 females and 159 males; age
range 10-93; mean=26), and obtained a. for the eight positive scales (a range of .75 to .85)
44
and for the eight negative scales (a range of .69 to .83). It should be noted that two
coefficients from the Hawley study were relatively low-Trust (.65) from the positive scale
and Guilt (.69) from the negative scale.
Alpha coefficients similar to those reported by Hawley (1988) were reported by
Swank, Gaa, Harrington, Jennings, and Longano (1991). In this reliability study, an
analysis of over 1,500 MED scores of primarily female subjects, aged 18 to 77 years,
yielded the following a ranges: from .67 to .82 (positive scale), from .67 to .82 (negative
scales), and from .78 to .87 (resolution scales). Again, two of the a coefficients (Trust
.60; Guilt .65) were relatively low.
Internal consistency reliability was assessed in the current study by generating
coefficient a. The a values obtained with the sample of older adults are presented in
Table 4. The a coefficients ranged from .53 to.82 for the positive scales, and from .61 to
. 76 for the negative scales. The a coefficients for the resolution scales ranged from .64 to
.80. Of the positive scales, four (Trust, .66; Autonomy, .53; Intimacy .68; and Ego
Integrity .67) failed to reach Hawley's (1988) recommended .70. Of the negative scales,
again four (Shame & Doubt .69; Guilt .62; Inferiority .61; and Stagnation .67) were below
.70. And, of the resolution scales, the a coefficient (.64) for R2-Autonomy vs. Shame and
Doubt was below . 70. For this study, the relatively low as on the positive and negative
scales, but larger as on the resolution scales may be due to the number of items on the
scales. Each positive and negative scale are made up of seven items whereas the
resolution scales are made up of 14 items ( seven for each positive and negative scale).
Coefficient a for the composite or entire instrument was .95. An a of .95 can be
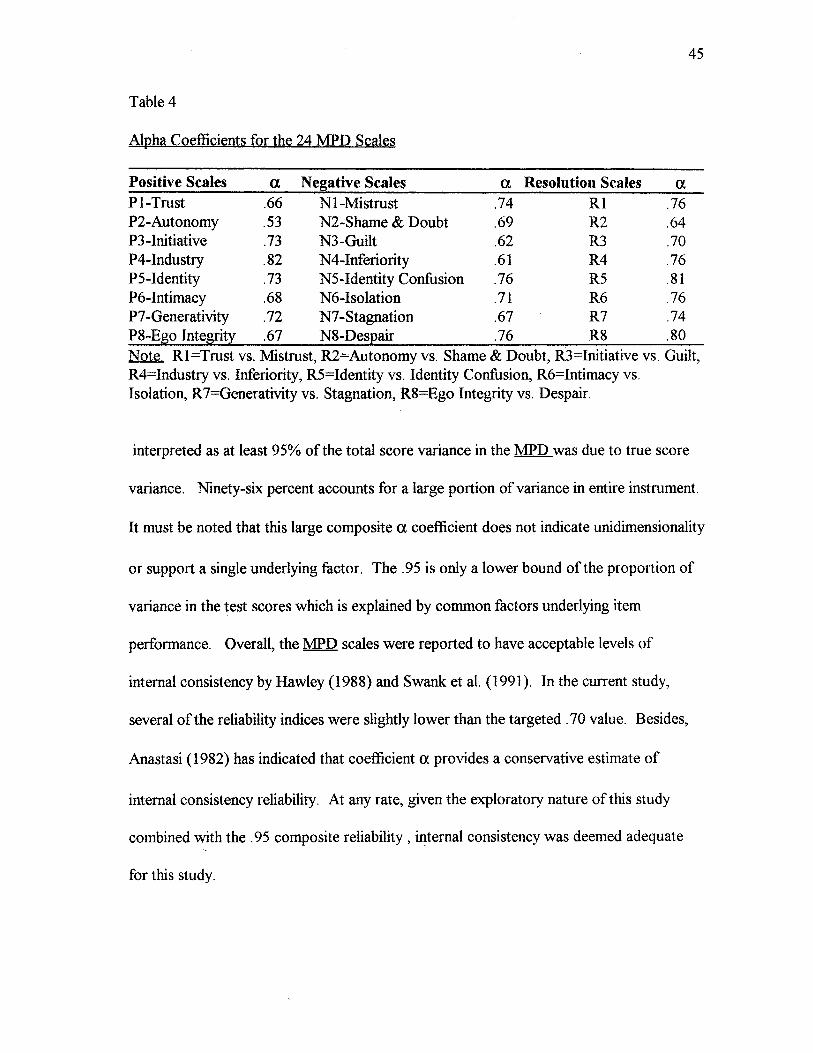
45
Table 4
Alpha Coefficients for the 24 MPD Scales
Positive Scales a Negative Scales a Resolution Scales a Pl-Trust .66 NI-Mistrust .74 Rl .76 P2-Autonomy .53 N2-Shame & Doubt .69 R2 .64 P3-Initiative .73 NJ-Guilt .62 R3 .70 P4-Industry .82 N4-Inferiority .61 R4 .76 PS-Identity .73 NS-Identity Confusion .76 RS .81 P6-Intimacy .68 N 6-Isolation .71 R6 .76 P7-Generativity .72 N7-Stagnation .67 R7 .74 PS-Ego Integriti'.: .67 N8-Des:eair .76 RS .80 Note RI =Trust vs. Mistrust, R2=Autonomy vs. Shame & Doubt, RJ=Initiative vs. Guilt, R4=Industry vs. Inferiority, RS=Identity vs. Identity Confusion, R6=Intimacy vs. Isolation, R 7=Generativity vs. Stagnation, R8=Ego Integrity vs. Despair.
interpreted as at least 95% of the total score variance in the MPD was due to true score
variance. Ninety-six percent accounts for a large portion of variance in entire instrument.
It must be noted that this large composite a coefficient does not indicate unidimensionality
or support a single underlying factor. The .95 is only a lower bound of the proportion of
variance in the test scores which is explained by common factors underlying item
performance. Overall, the MPD scales were reported to have acceptable levels of
internal consistency by Hawley (1988) and Swank et al. (1991). In the current study,
several of the reliability indices were slightly lower than the targeted . 70 value. Besides,
Anastasi ( 1982) has indicated that coefficient a provides a conservative estimate of
internal consistency reliability. At any rate, given the exploratory nature of this study
combined with the . 95 composite reliability , internal consistency was deemed adequate
for this study.
46
Validity of the MPD
Content Validity. Content validity refers to the degree to which a test measures an
intended content area (Gay, 1987). With a theoretically-based instrument, such as the
Mell, content validity is of utmost importance. The instrument must demonstrate that it
is measuring the intended content area (e.g. Eriksonian theory) and not some other area.
The development of the MPD Was based on Erikson's fixed-stage theory of psychosocial
development. Individual items were selected by Hawley (1988) in her review of Erikson's
major works. Once an initial pool of 225 items were selected from the review, they were
sent to five judges who were deemed experts on Eriksonian theory. Indices of agreement
between the items on each scale and the judges' classifications were then calculated. The
percentage of times the judges matched an item keyed to the item designations provided a
measure of content validity for the Mell. That is, if the items were matched appropriately
by the judges, then they were believed to be measuring Erikson's theory. Hawley
indicated that at least seven items were to be included for each scale so that the content
domains of Erikson's theory would be accurately represented. Ninety-four (83.9%) of the
112 Mell items were agreed upon by the majority of judges. Thirteen items ( 11. 6%) were
selected from those agreed upon by less than the majority of judges in order to adequately
cover the content do.mains as defined by Erikson's theory. Five items (4.5%) from the
initial pool, for which there was no consensus, were rewritten and added to the final item
pool to provide an equal number of items for each of the 16 scales. The indices of
agreement by the judges provided support for the content validity of the measure.
Construct Validity. Construct validity is the degree to which a test me~sures an
intended hypothetical construct, or nonobservable trait. (Gay, 1987). The construct
measured by the MPD is Erikson's psychosocial development. Given that the MPD is a
psychological personality measure, construct validity is a very important characteristic it
must possess.
47
One method of assessing construct validity is through factor analysis. Longfellow
(1989) examined the construct validity of the Mell via exploratory factor analysis. His
analysis was conducted for e,ach of the 16 scales using the 1988 normative sample.
Longfellow found two consistent factors which he labeled
"Disintegration/Demoralization" and "Wholeness/ Wholesomeness". He stated that these
two factors were supportive of the two dynamically opposed personality forces proposed
by Erikson. Another factor analytic study of the MPD (Swank et al., 1991) found
support for the unidimensionality of the 112 item measure. In other words, the Men. may
consist of a higher order factor, which is reflective of the epigenetic principle. Overall,
these two factor analytic studies appeared to provide support for the construct validity of
the Mell.
Another method for assessing construct validity is multitrait-multimethod analysis.
Both convergent and discriminant validity (e.g., construct validity) may be estimated with
this analysis. Convergent validity is established when different instruments are able to
measure a similar trait. Discriminant validity is established when instruments discriminate
between different traits. Therefore, one way in which an instrument may possess
construct validity is for that instrument to exhibit high correlations with different measures
of the same trait (convergent validity) and low correlations when the same instrument
measures different traits (discriminant validity).
Hawley (1988) used the multitrait-multimethod technique to assess the construct
48
validity of the MPD. Her analysis allowed for a systematic examination of the convergent
and discriminant validity of the positive and negative scales. She employed the MPD, the
Inventory of Psychosocial Development (IPD) (Constantinople, 1966), and the
Self-Description Questionnaire (SOQ) (Boyd, 1966) as multiple instruments to assess
Eriksonian theory. The multiple traits included the eight negative and positive scales. The
results of the analysis supported both the convergent and discriminant validity , which in
tum supported the construct validity.
In summary, the construct validity of the MPD was supported by both factor
analytic and multitrait-multimethod studies. Therefore, the M.eD. appeared to be a valid
measure of Erikson's fixed-stage personality theory of psychosocial development.
Use of MPD with Older Adults
The norm group used by Hawley (1988) to establish reliability and validity
included older adults. Her norm group consisted of a large sample of 2480 individuals
aged 13 to 86. In further analyzing the norm group data, Roid and Ledbetter (1987)
found large response differences between males and females. As a result, separate norms
were developed for these two gender groups. Evidently, the MPD. may be appropriate
for use with older adults, although gender differences should be taken into consideration.
Although the MPD is a relatively new measure, it is currently being used in
research with older 'adults. The MPD has been utilized with older adults in two doctoral
dissertations (Euler, 1990; Schmidt, 1991). For example, Euler (1990) explored various
types of psychological adjustment among the elderly. He used the MPD to assess
Eriksonian well-being: The results of his study showed that pragmatic and Eriksonian
well-being had only a moderate correlation which led him to state that "gerontologists
49
should cease using superficial indices like life satisfaction, and implement more substantial
psychological tests" (p.202) when assessing the elderly.
Researchers reviewing the MPD have indicated that it is useful with older adults.
For instance, Gable (1992) suggested that the MfJ2 was adequate in meeting the challenge
of measuring affective variables associated with the personality development of older
adults. Carmer (1992) supported the epigenetic principle. He indicated that the conflicts
characterizing each of Erikson's developmental stages are present at all times, regardless
of one's age. This statement would seem to support examination of the stages collectively,
rather than individually, particularly with older adults.
Torrance Tests of Creative Thinking
The Torrance Tum of Creative Thinking (TTCT) (Torrance, 1990) is often used
for research purposes. Treffinger (1985) has noted that in the complex and still evolving
domain of creativity assessment, the II.CI can be recommended as a battery of tests
useful in research. Additionally, Chase (1985) reported that the TTCT was an instrument
best used for research and experimentation, which was Torrance's original intention for the
tests.
The TTCT were created as part of a long-term research program that emphasized
classroom experiences that stimulate creativity. Developed within an educational milieu,
scores are based on factors originally observed (i.e., fluency, flexibility, originality, and
elaboration) observed by Guilford. The TTCT was published in 1966 after nine years of
work by Torrance and his colleagues on the nature of creative behavior and its assessment.
Thus, over time, the TTCT has changed. For instance, a revision of the TTCT was
published in 1974, and in 1984 a streamlined scoring was made available (Torrance &
Ball, 1984). The IICT is a battery which consists of two tests (i.e., verbal and figural)
each with two fonns (A and B).
TTCT FiW1ral Test
50
In this study, the figural test of the TTCT was used to assess the creative process
(e.g., divergent thinking) of older adults. The figural test is comprised of three picture
based scales: picture construction (one item), picture completion (IO items), and parallel
lines (30 items). Each of the three scales consists of pre-printed stimuli. For instance, the
stimulus in the picture construction activity is a solid black shape that resembles a teardrop
or jelly bean. The respondents are told to
. . . think of a picture or an object which you can draw with this shape as a part. . .
when you have completed your picture, think up a name or title for it and write it
at the bottom of the page in the space provided" (Torrance, Ball, & Safier, 1992,
p.2).
For the picture completion activity the stimulus material consists often incomplete figures.
In this activity the respondents are told to
... add lines to the incomplete figures ... so you can sketch some interesting
objects or pictures ... (and) .. try to make it tell as complete and as interesting a
story as you can by adding to and building up your first idea. Make up an
interesting title for each of your drawings, and write it at the bottom of each block.
(Torrance, Ball, & Safier, 1992, p.2)
The stimulus for the parallel lines activity consists of thirty sets of parallel lines. In this
activity the respondents are told to
51
... see how many objects or pictures you can make from the pairs of straight lines
below and on the next two pages. The pairs of straight lines should be the main
part of whatever you make. . . Make as many different pictures or objects as you
can and put as many ideas as you can in each one. Make them tell as complete and
as interesting a story as you can. Add names or titles in the spaces provided.
(Torrance, Ball, & Safier, 1992, p.3)
Administration time for each activity is 10 minutes which results in an overall
administration time of 30 minutes. These activities can be administered to groups or to
individuals. It should be pointed out that although the number of items for each of the
three activities greatly varies, from one to 30, the time limit of 10 minutes for each activity
suggests equality among the activities. That is, the scoring of the activities takes into
consideration the number of items in each activity.
The three activities (i.e., picture construction, picture completion, and parallel
lines) that make up the figural test are multiple-task paper-and-pencil measures of five
aspects of divergent thinking: fluency, originality, elaboration, abstractness of titles, and
resistance to premature closure. Each activity in the figural test does not measure all five
aspects, per se. For instance, picture construction measures originality, abstractness of
titles, and elaboration. Picture completion measures all five, and parallel lines measures
fluency, originality, and elaboration.
The figural test was available in two forms, A and B. The only difference between
the forms are the stimuli used in each activity to elicit responses. For instance, form A has
an activity called parallel lines which requires the examinee to make objects or pictures out
of several pairs of parallel lines. Form B has a similar activity but it employs circles
instead of pairs of parallel lines. All things being equal, form A of the figural test was
chosen for use in this study as determined by the flip of a coin.
52
The figural test only, as opposed to the verbal test or both, was chosen for use in
this study for four primary reasons. First, it is recommended that both the verbal and
figural tests be administered in two different sittings approximately 3 0 minutes apart
(Torrance, 1990). If the entire battery (e.g, verbal and figural) were administered, data
collection would take over two hours. This might contribute to fatigue among the older
adult participants, and attrition in the study.
Second, as Sylcox (1983) noted, the verbal test requires written (sentence)
answers which may be difficult for many older adults due to potential limited manual
dexterity. The responses required for the figural activities do not require as precise
dexterity as the verbal activities. Therefore, the figural test was used to ensure the
comfort of the participants.
Third, Sylcox (1983) maintained that the time limits for the written answers
required by the verbal test would prohibit older adults from answering the questions to the
best of their ability. Although the figural test is timed as well, she indicated that the
drawing activities would not require as much time for the older adults to complete.
Finally, the researcher spoke to researchers in creativity (Dr. Diane Montgomery,
personal communication, March 9, 1993) and gerontology (Dr. Kathy Goff, personal
communication, March 9, 1993) who agreed that the figural test, which requires drawing
only, was the most advantageous to use with older adults. Based upon the four previously
mentioned reasons, the figural test was employed as a measure of divergent thinking of
older adults in this research.
53
Issues Related to Scoring the TTCT: Figural Form
The original 1966 procedure for scoring the figural test was replaced by a
streamlined scoring procedure in 1984 (Torrance, 1990) based on specific criteria
established from previous research. Torrance (1990) took original protocols from a 22-
year predictive validity study which had been scored with the original scoring method and
rescored them using the streamlined method. He then reported a positive correlation
between scoring methods for the criterion-referenced indicators and the creativity index
for adult creativity (Torrance, 1990). More support for the streamlined method of scoring
was demonstrated by Gray (1986). She found that the scoring categories of the
streamlined scoring system assessed.the essential qualities of creativity (see Torrance,
1979a) to a far greater extent than the use of creative process measures alone. Based on
research, the streamlined scoring of the three picture based figural activities yields 13
criterion-referenced measures and five norm-referenced measures which are discussed
next, along with the specific scoring procedures used in this study.
Criterion-Referenced Measures. There are 13 criterion-referenced measures
incorporated in the figural test. The 13 criterion-referenced measures each play a role in
real life creativity and each can be involved and improved with practice (Torrance, Ball, &
Safier, 1992). The criterion-referenced measures are described below. The basic
descriptions were adapted from Torrance, Ball, and Safter's (1992) definitions in the
Torrance Tests of Creative Thinking: Streamlined Scoring Guide Figural A and B. Refer
to this guide for pictorial examples of items in each category.
1. Emotional Expressiveness (in drawings, titles)- feelings and emotions may be
communicated through titles and the drawings themselves in each of the three activities.
2. Storytelling Articulateness (context, environment)- Not only must detail or
elaboration be present in a drawing, some kind of environment must be created for the
object; although an object can tell an articulate story if there are figural and/or verbal
. indicators of the objects history (story).
54
3. Movement or Action- this scale is based on theories of projective psychology,
specifically the Rorschach theory and Torrance's (1992) observations.
4. Expressiveness of Titles- a title must go beyond simple description. It must
communicate a feeling, emotion, or other synthesis and communicate something about the
picture that the graphic cues themselves do not communicate without the title.
5. Synthesis of Incomplete Figures ( combination of two or more)- this shows an
ability to see relationships among rather diverse and otherwise unrelated elements.
6. Synthesis of Lines ( combination of two or more sets)- the creative person sees
possibilities that others assume have been closed, and under restrictive conditions, is able
to use whatever freedom is allowed.
7. Unusual Visualization (above, below, at angle, etc)- the tendency to present
ideas or objects in unusual visual perspective seems to be an especially important indicator
of creative personality. For instance, this is when the test taker draws a picture from a
different perspective.
8. Internal Visualization (inside, cross section, etc.)- According to Torrance
(1992), there are many indications that creative people are better able than others to
visualize beyond exteriors and pay attention to the internal, dynamic workings of things.
Pictures that reflect internal visualization usually include detail about the contents of
objects such as a garbage can or a pregnant woman.
55
9. Extending or Breaking Boundaries- the creative solution of many problems
involves redefinition, getting out of the rut of unsuccessful solutions of the past, and
extending or breaking the boundaries of the problem as currently defined. Examples of
this would be making parallel lines into bodies or trees.
10. Humor (in titles, captions, drawings, etc.)- humor is creative because it
involves unusual combinations and surprise. Titles, captions, and drawings are scored as
humorous if they have the quality of portraying something comical, funny, or amusing.
11. Richness oflmagery (variety, vividness, strength, etc.)- responses are scored
for richness of imagery when they show variety, vividness, liveliness, and intensity. An
example of this would be making parallel lines into an elevator chute, a stack of dimes
turned sideways or a bathtub.
12. Colorfulness oflmagery (excitingness, earthiness, etc.)- this is defined as
exciting in its appeal to the senses of taste, touch, smell, feel, sight, etc.; other descriptives
might be flavor, earthiness, unreal, spooky, emotionally appealing, fantastic, etc.
13. Fantasy (figures in myths, fables, fairy tales, science fiction, etc.)- fantasy
provides an almost inexhaustible supply of analogies that are useful in stating and solving
problems creatively. This is scored if the drawing depicts fairy tales, fables, or fantasy
' childhood experiences.
When scoring the criterion-referenced measures, scorers review each test protocol
for evidence of special creative strengths. A rating of"+" is given for some evidence of a
strength (usually one or two occurrences), a rating of"++" is given for repeated evidence
of a strength ( usually three or more occurrences), and a rating of 11 blank" is given in the
absence of a strength (Torrance, 1991). The ratings on the creative strengths are
56
generated for each of the 13 measures.
Norm-Referenced Measures. Upon development of the streamlined scoring
procedure, Ball and Torrance (1980) decided that Guilford's flexibility factor could best be
assessed via measures of abstractness of titles and resistance to premature closure. As a
result, the norm-referenced measures included in the TTCT: Figural Forms include:
fluency, originality, elaboration, abstractness of titles, and resistance to premature closure.
A general description and the scoring procedure for each of the five norm-referenced
measures is next.
1. Fluency. Fluency represents the test taker's ability to provide a large number of
figural images (Torrance et al., 1992). The more fluent an individual is, the more aware
s/he is of alternative explanations, consequences and solutions. A fluent thinker generates
more than the traditional "yes/no/maybe" or ''right/wrong" solutions to problems and
dilemmas -- a tendency to do more than expected (Torrance, 1987). The activities that the
fluency score is comprised of are picture completion and parallel lines. Obtaining the
streamlined fluency score is done by simply counting the number of ideas a person
expresses through interpretable responses that use the stimulus in a meaningful manner.
2. Originality. Originality is the ability to provide uncommon or unique responses
that require creative strength. Originality denotes breaking the norm or coming up with
less obvious responses. Original thinking involves the production of new, unconventional,
or unique ideas and/or products, such as inventions, patents, and innovative solutions.
The activities that the originality score is comprised of are picture construction, picture
completion, and parallel lines. Originality is scored by comparing responses to specific
criteria. Then the most common responses are assigned a zero and all other responses that

~ Tan, Xiaoyuan ~ TN: 326088 _ Title: The relationship between psychosocial :9 development and divergent production in older ,:: adults I i Due Date: 04111/08 Pieces: 1
~ 1111n11111111mm111111m111 en § ILL Office Hours: Monday - Friday, 10:00am - 4:00pm
Phone: 518-442-3613 ~ htn,://illiad.albany.edu
57
show creative strength as assigned a one {Torrance et al., 1992).
3. Elaboration. Elaboration is the test taker's ability to develop, embroider,
embellish, or carry out ideas (Torrance et al., 1992). The activities that the elaboration
score is comprised of are picture construction, picture completion, and parallel lines.
According to Torrance, Ball, and Safier (1992), there are two assumptions that underlie
the scoring of elaboration. The first is that the minimum and primary response to this
stimulus figure is a single response. For instance, the scorer must determine if the
minimum detail has been given in order for a drawing to be what the title reflects. The
second assumption is that the imagination and exposition of detail is a function of creative
ability. Elaboration is streamlined scored by having the scorer estimate the number of
details within six sets of limits determined by normative data. To explain, credit is given
for each appropriate detail added to the original stimulus figure, its boundaries, and/or its
surrounding space. Overall, the elaboration score is the sum of the scores for all three
activities.
4. Abstractness of Titles. Abstractness of titles is based on the idea that creativity
requires one to perceive the essence of a problem. This perception of essence is reflected
in the level of abstraction given to the title of the pictures drawn (Torrance et al., 1992).
Abstractness of titles is scored with the picture construction and picture completion
activities. The titles given to the drawings in these activities are evaluated on a scale
ranging from O to 3 according to criteria described in Torrance Tests Qf Creative
Thinking: Streamline Scoring .Guide Figural A and B {Torrance et al., 1992). For
instance, each point can be considered as a different stage in the abstracting process or in
capturing the essence of the picture.
58
5. Resistance to Premature Closure. Resistance to premature closure is based on
the generally accepted conclusion that creative behavior requires a person to "keep open"
in processing information and to consider a wide variety of information {Torrance et al.,
1992, p.14). Resistance to premature closure is scored for picture completion activity
only. Each response in the picture completion activity is given a score of zero, one, or
two depending on the amount of resistance to premature closure which is determined by
criteria stated in the manual. For instance, a score of zero is given when the figure is
closed by one of the quickest, easiest, most direct routes with a straight line, simple
curved line, solid shading, or coloring. Letters of the alphabet and numerals are also
scored zero. The maximum score is 20 and can be attained only when all ten figures are
used.
Scoring of the TTCT-FFA
For this study, the TTCT-FFA protocols were scored by experts employed by
Scholastic Testing Services (STS). These experts used the streamlined scoring method
previously discussed and presented in the Torrance Tests of Creative Thinking;
Streamlined Scoring Guide Figural A and B {Torrance, Ball, & Safier, 1992).
Specifically, raw scores were calculated for all five norm-referenced measures and for the
13 criterion-referenced indicators of creative strengths based on the previously mentioned
criteria. The five norm-referenced raw scores and the sum of the 13 criterion-referenced
indicators of creative strengths were used as measures of divergent thinking.
Reliability of the TTCT: Figural Form
Internal Consistency. Measures of internal consistency such as split-half or
coefficient a generally assume that the performance on one part of a test should not differ
greatly from performance on other parts. Internal consistency measures further assume
that the test score reflects a unidimensional trait or behavior.
59
Treffinger and Poggio (1972) noted that it is not appropriate to assess reliability
via internal consistency with instruments which yield open-ended responses. The
TTCT-FFA is such a measure. The TTCT-FFA is comprised of open-ended items which
represent a range of distinctly different abilities and performances. Performance
throughout the test varies greatly and the test scores reflect multidimensional traits rather
than a unidimensional trait. Thus, the discussion of reliability for the TTCT-FF A is limited
to the following issues.
Equivalent Forms/Test-Retest. Equivalence, or alternate forms, refers to
comparing two forms of the same instrument determine across-measure consistency. The
TTCT figural test is available in two forms (form A and B). In reviewing the equivalent
forms reliability, Treffinger (1985) reported reliability coefficients ranging from .50 to .93
for the two figural test forms. Additionally, two studies of counterbalanced design to
assess alternate forms reliability were cited for the original scoring (Torrance, 197 4b).
One study, which had two weeks between testing sessions, obtained alternate forms
coefficients of .71 to .85 for the figural scores. The other study had an eight-month time
interval between testing sessions and an experimental creative writing treatment for half of
the subjects. Alternate forms reliability in the counterbalanced design with a longer time
interval yielded equivalency of forms reliability of . 60 to . 80 for the figural tests, with one
of the coefficients, fluency (r=.50) not being adequate reliability level for research
purposes. Evidence of alternate forms or test-retest reliability was not presented in the
manual for the streamlined version (Torrance & Ball, 1984). However, either figural form
60
of the TTCT is adequate for research {Treffinger, 1985) and for use with groups (Swartz
& Cooper, 1990).
Scoring Reliability. Reliability of the scoring procedure is important due to the
subjective nature of the task. In other words, different individuals could allocate different
points to the same protocol. Therefore, interrater reliability has been empirically
examined. For example, in a study with a random sample of 50, Torrance (1990) reported
interrater reliability coefficients for the criterion-referenced measures ranging from .60
( emotional expressiveness) to 1. 00 ( expressiveness of titles, synthesis of figures,
and synthesis of lines). In the same study, the range of scoring reliability coefficients for
the norm-referenced measures was from .95 (elaboration) to .99 (fluency and originality).
Based on this study, Torrance reported that it is possible to keep the interrater reliability
of the norm-referenced and the criterion-referenced measures above the . 90 level. The
results of Torrance's study revealed that there should be a relatively small discrepancy
between scores, regardless of the scorer.
Validity of the TTCT; FiiWfal Forms
Content Validity. Content validity is concerned with determining the extent to
which a set of test tasks provides a relevant and representative sample of the task domain
(Grounlund & Linn, 1990). The notion of incorporating several tasks in the TTCT-FFA
was based on Torrance's (1974) definition of creativity as a complex behavior rather than
a pervasive unitary function. The activities in the figural test were selected to sample
different creative thinking abilities. The activities of the TTCT-FF A reflect the significant
sort of creative thinking essential in daily life and creative breakthroughs (Torrance,
1990).
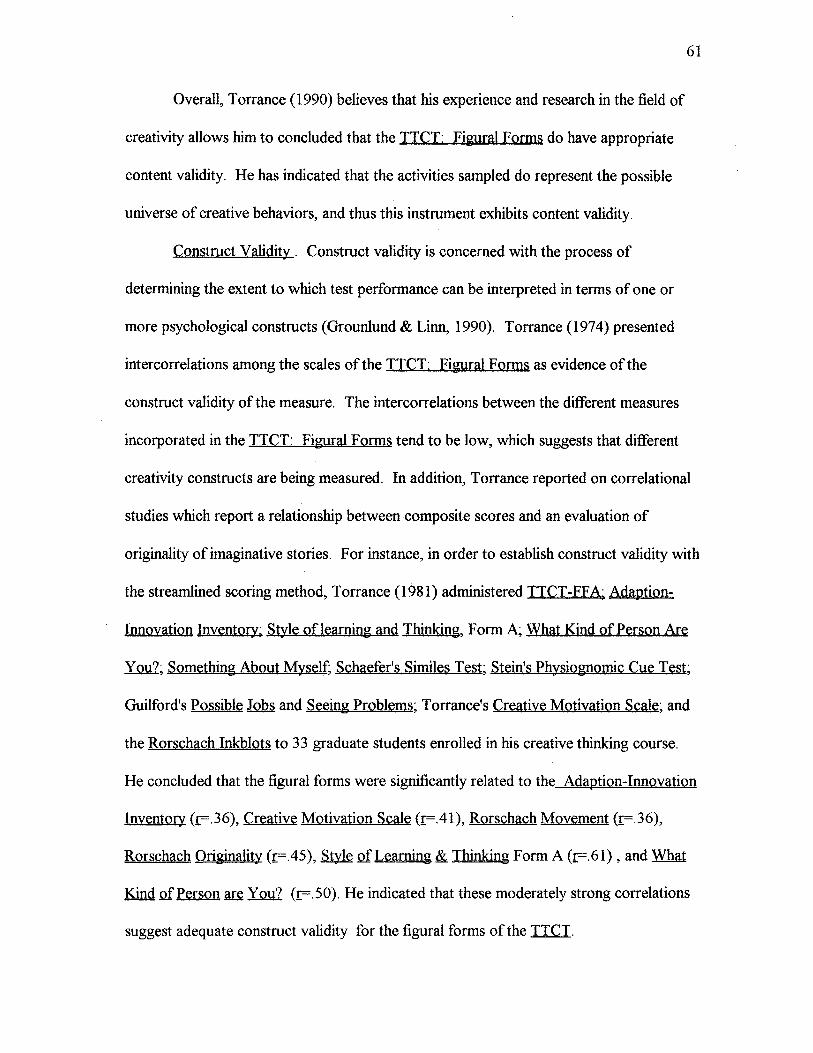
Overall, Torrance (1990) believes that his experience and research in the field of
creativity allows him to concluded that the TTCT; Figural Forms do have appropriate
content validity. He has indicated that the activities sampled do represent the possible
universe of creative behaviors, and thus this instrument exhibits content validity.
61
Construct Validity . Construct validity is concerned with the process of
determining the extent to which test performance can be interpreted in terms of one or
more psychological constructs (Grounlund & Linn, 1990). Torrance (1974) presented
intercorrelations among the scales of the TTCT: Figural Forms as evidence of the
construct validity of the measure. The intercorrelations between the different measures
incorporated in the TTCT: Figural Forms tend to be low, which suggests that different
creativity constructs are being measured. In addition, Torrance reported on correlational
studies which report a relationship between composite scores and an evaluation of
originality of imaginative stories. For instance, in order to establish construct validity with
the streamlined scoring method, Torrance (198l)administered TTCT-FFA; Ada.ption
Innovation Inventory; Style oflearning and Thinking, Form A; What Kind of Person Are
Ymil; Something About Myself; Schaefer's Similes Test; Stein's Physiognomic Cue Test;
Guilford's Possible 1QQ.s and Seeing Problems; Torrance's Creative Motivation Scale; and
the Rorschach Inkblots to 3 3 graduate students enrolled in his creative thinking course.
He concluded that the figural forms were significantly related to the Adaption-Innovation
Inventory (r=.36), Creative Motivation Scale (r=.41), Rorschach Movement (r=.36),
Rorschach Originality (r=.45), Silk cl Learning&. Thinking Form A (r=.61), and What
Kind of Person ru:e You? (r=.50). He indicated that these moderately strong correlations
suggest adequate construct validity for the figural forms of the TTCT.
62
Use of the TTCT-FF A with Older Adults
The TTCT-FF A was not specifically developed for use with older adults.
However, in the Norms-Technical Manual: Figural (Streamlined) Forms A&. B (Torrance,
1990, p.3) it was stated that" ... the figural activities can be administered at all
educational levels from kindergarten to ... the elderly. It ... provides sufficient challenge
to be useful with older adults". Apparently, the ITCT tests have the potential to be useful
indicators of fluency, originality, and elaboration of thinking for virtually any age group
(Torrance, 1974).
The TTCT figural test has had limited use in research focusing on older adults.
For example, Sylcox (1983) used the .TICT figural test with subjects aged 62 to 88 to
assess the creativity of nursing home residents. Engelman (1981) used this measure with
women aged 60 to 82 in a creative problem-solving program. By employing the
TTCT-FF A in the current study, further information concerning use ofthis instrument
with older adults was provided.
Procedures
The next section outlines the data collection procedures followed in this study. Also
discussed are the scoring procedures of the two instruments. Specific procedural issues
relating to the scoring of the instruments is presented here.
Data Collection
There were several recruitment strategies used to solicit participants for this study.
First, posters and sign-up sheets requesting participation in the study were placed at
various locations such as grocery stores, beauty salons, nutrition centers, and senior
centers throughout towns and cities that were accessible to the researcher. Both small and
63
large Midwestern and Western towns and cities were targeted. Potential participants were
directed to leave their names and phone numbers on the sign-up sheets in order for the
researcher to contact them at a later date to arrange a time for participation. In a second
strategy, advertisements were placed in local newspapers requesting participation on
specific dates. Additionally, some local newspapers printed articles concerning the
research project and requesting volunteers. In the advertisements and articles, participants
were asked to call the researcher and sign-up for a data collection date. Third, to assist in
the recruitment of participants, a directory of local community services was used to locate
organizations that cater to adults 50 and over. Once the organizations were identified, a
contact person was called. The contact person would invite participants to the data
collection site on specific days. Finally, the primary researcher attended functions, such as
community meetings and nutrition center programs, to recruit participants. Once
participants were contacted, a "snowball" type method was used, in that individuals who
indicated interest in participating were asked to contact friends and relatives who might be
interested in participating·as well. With all four recruitment strategies, the potential
participants were informed that a free meal was offered the day they chose to participate in
the study.
On each day of data collection, the subjects arrived at the specified location, were
seated, and were then served the free meal. Once the meal was completed, group
administration of instruments began. Two sheets were placed in folders handed out to
each participant. Participants were asked to fill out the Institutional Review Board (IRB)
consent form (Appendix A) and the demographic information questionnaire (Appendix B).
Next, all three activities from the TTCT-FFA were administered by the researcher to the
64
collective group which took approximately 30 minutes. Individuals were instructed to
place the completed TTCT-FFAs into their folders. A fifteen minute break was then
provided. Once the fifteen minutes of free time was up, all participants were administered
the MPD. Since some older adults might have experienced difficulty reading the Me.Q.,
large print copies were provided to all participants. There was no time limit set for
completion of the MPD. Once the older adults completed the Me.[! they were asked to
put this instrument into their folder, and to return the folder to the primary researcher. A
completed folder contained the IRB consent form, personal information questionnaire,
TTCT-FF A, and Mell instruments. At this point, the subjects either left the research site
or stayed and socialized with others.
One final note, the TTCT-FF A and M:eJ2 were not given in counterbalanced
order. There were several reasons for this decision. The constructs of creativity
and psychosocial development do not appear prone to practice effects. Also,
since the participants were given a break between administration of the TT CT -FF A
and the MPD, they may have had a tendency to discuss the instruments, and that
discussion could have potentially contaminated the results. For example, if half of the
subjects were administered the TTCT-FF A before the break, then during the break those
individuals discussed possible solutions to the drawings with those who had not taken the
TTCT-FF A , the data provided might have been biased. Another reason for not
administering the instruments in counterbalanced order is that the TTCT-FF A is timed,
whereas the MPD is not. This method allowed everyone to break at the same time and to
leave at their convenience as soon as the MPD was completed.
The entire data collection took thirteen months. Prior to data collection, certain
65
steps were taken to organize the sessions. Arrangements were made for a meeting place
and for the incentive to participants. During each session a free meal was provided or
catered for the participants. There were two research assistants at some of the meetings.
These assistants aided in distribution of printed materials, served coffee, seated subjects,
and provided other general assistance. These assistants did not administer the instruments
in any manner. Administration of the instruments was done solely by the primary
researcher. The same procedure was followed during each data collection session. On
two occasions, after the data collection sessions, articles appeared in local newspapers
discussing the success of the sessions.
Data Analyses
The following is a discussion of the data analyses performed to address each
research question. Initially, descriptive statistics such as frequencies, means, and standard
deviations were generated for the background data (age, gender, and ethnic background)
obtained through the demographic information questionnaire. The research questions
specific to this study are presented next and the analyses are discussed.
Research Question One
The issue in research question one was to determine whether the Mell total
resolution score (TR) or stage resolution scale scores (Rl through RS) yielded results
consistent with Erikson's epigenetic principle. Because the stages are theoretically
hierarchically related, it was hypothesized that the composite score (TR) would be a more
accurate description of older adults' psychosocial development than the stage specific
resolution scores. In conjunction with the epigenetic principle, it was assumed that the
overall psychosocial development of older adults should take into consideration all eight
stages, collectively, instead of various stages. Additionally, correlational analyses were
conducted to explore the relationship among the eight stage resolution scale scores, and
between the stage resolution scores and the TR score.
Research Question Two
66
Is there a relationship between the divergent thinking of older adults and stage
resolution according to Eriksonian theory? In order to explore this second research
question, correlation coefficients between the divergent thinking variables (i.e, fluency,
originality, elaboration, abstractness of titles, resistance to premature closure, and the sum
of the 13 criterion-referenced indicators of creative strengths) and the eight stage
resolution scale scores (RI through RS) were generated.
Research Question Three
The third research question addressed gender pattern differences in the relationship
between the divergent thinking of older adults and stage resolution according to
Eriksonian theory. Correlation coefficients between the six divergent thinking variables
and the eight stage resolution scale scores separately for both females and male. The
difference between the correlation coefficients for males and females wen~ then tested for
statistical significance with t-tests.
CHAPTER IV
RESULTS OF THE STUDY
Introduction
Presented in this chapter are sampling issues along with the results of the statistical
analyses conducted for the three research questions.
Sampling Issues
One sampling issue is the representativeness of the sample. It must be determined
if the sample selected for use in a study was selected from its population. As with any
research endeavor, if a sample is well selected, research results based on the sample will be
generalizable to the population. The population that the researcher realistically selects
from is referred to as the accessible, or available population. For this study, the accessible
population consisted of both male and female Americans from various ethnic background
who were 50 and older. The sample selected for use in this study consisted of 107 older
adults [female (N=76) and male (N=3 l )] from various backgrounds. In order to
demonstrate the similarity between the accessible population and the sample regarding
age, gender, and ethnicity, tables were constructed. The age, gender, and ethnic
backgrounds of the sample and population are presented in Tables 5, 6, and 7
respectively.
Table 5 presents the frequencies and percentages of age categories for both sample
67
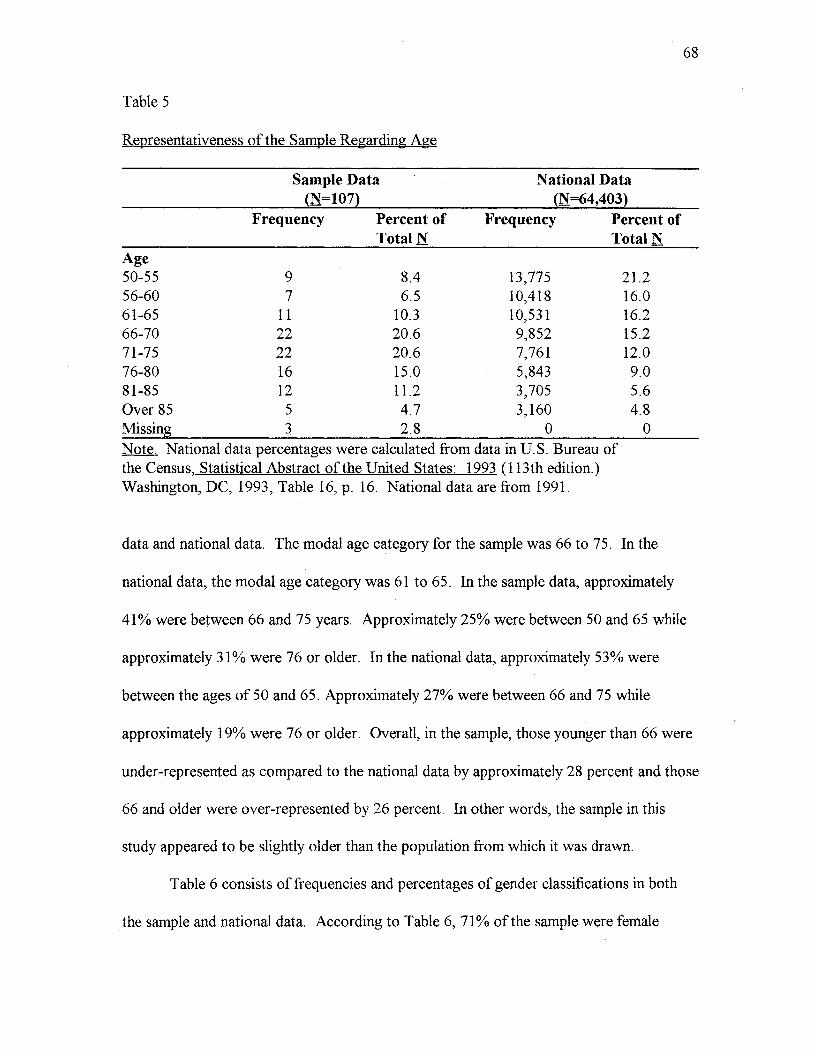
Table 5
Representativeness of the Sample Regarding Age
Age
Sample Data (N=l07)
Frequency Percent of Total N
National Data (N=64,403)
Frequency Percent of Total N
50-55 9 8.4 13,775 21.2 56-60 7 6.5 10,418 16.0 61-65 11 10.3 10,531 16.2 66-70 22 20.6 9,852 15.2 71-75 22 20.6 7,761 12.0 76-80 16 15.0 5,843 9.0 81-85 12 11.2 3,705 5.6 Over 85 5 4.7 3,160 4.8 Missing 3 2.8 0 0 Note. National data percentages were calculated from data in U.S. Bureau of the Census, Statistical Abstract of the United States: 1993 (113th edition.) Washington, DC, 1993, Table 16, p. 16. National data are from 1991.
data and national data. The modal age category for the sample was 66 to 75. In the
national data, the modal age category was 61 to 65. In the sample data, approximately
68
41% were between 66 and 75 years. Approximately 25% were between 50 and 65 while
approximately 31 % were 76 or older. In the national data, approximately 53% were
between the ages of 50 and 65. Approximately 27% were between 66 and 75 while
approximately 19% were 76 or older. Overall, in the sample, those younger than 66 were
under~represented as compared to the national data by approximately 28 percent and those
66 and older were over-represented by 26 percent. In other words, the sample in this
study appeared to be slightly older than the population from which it was drawn.
Table 6 consists of frequencies and percentages of gender classifications in both
_the sample and national data. According to Table 6, 71% of the sample were female
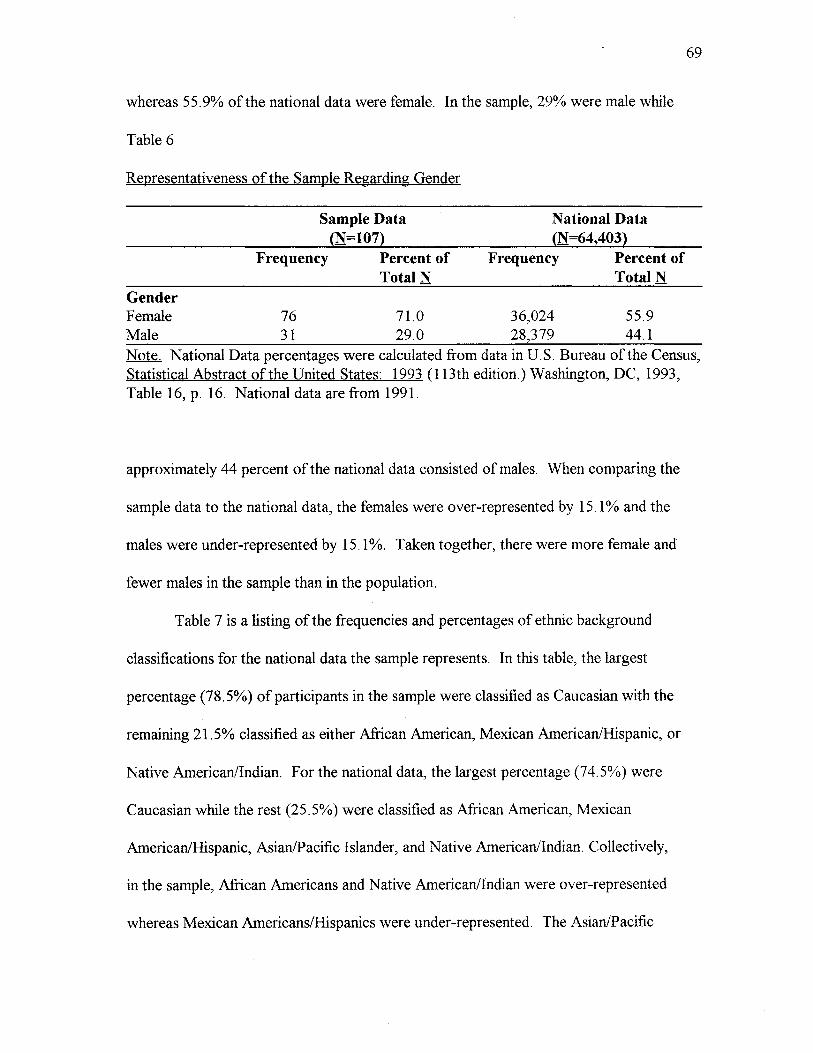
whereas 55.9% of the national data were female. In the sample, 29% were male while
Table 6
Representativeness of the Sample Regarding Gender
Gender Female Male
Sample Data (N=l07)
Frequency Percent of Total N
76 71.0 31 29.0
National Data (N=64,403)
Frequency Percent of Total N
36,024 28,379
55.9 44.1
69
Note. National Data percentages were calculated from data in U.S. Bureau of the Census, Statistical Abstract of the United States: 1993 (113th edition.) Washington, DC, 1993, Table 16, p. 16. National data are from 1991.
approximately 44 percent of the national data consisted of males. When comparing the
sample data to the national data, the females were over-represented by 15.1% and the
males were under-represented by 15.1%. Taken together, there were more female and
fewer males in the sample than in the population.
Table 7 is a listing of the frequencies and percentages of ethnic background
classifications for the national data the sample represents. In this table, the largest
percentage (78. 5%) of participants in the sample were classified as Caucasian with the
remaining 21. 5% classified as either African American, Mexican American/Hispanic, or
Native American/Indian. For the national data, the largest percentage (74.5%) were
Caucasian while the rest (25. 5%) were classified as African American, Mexican
American/Hispanic, Asian/Pacific Islander, and Native American/Indian. Collectively,
in the sample, African Americans and Native American/Indian were over-represented
whereas Mexican Americans/Hispanics were under-represented. The Asian/Pacific
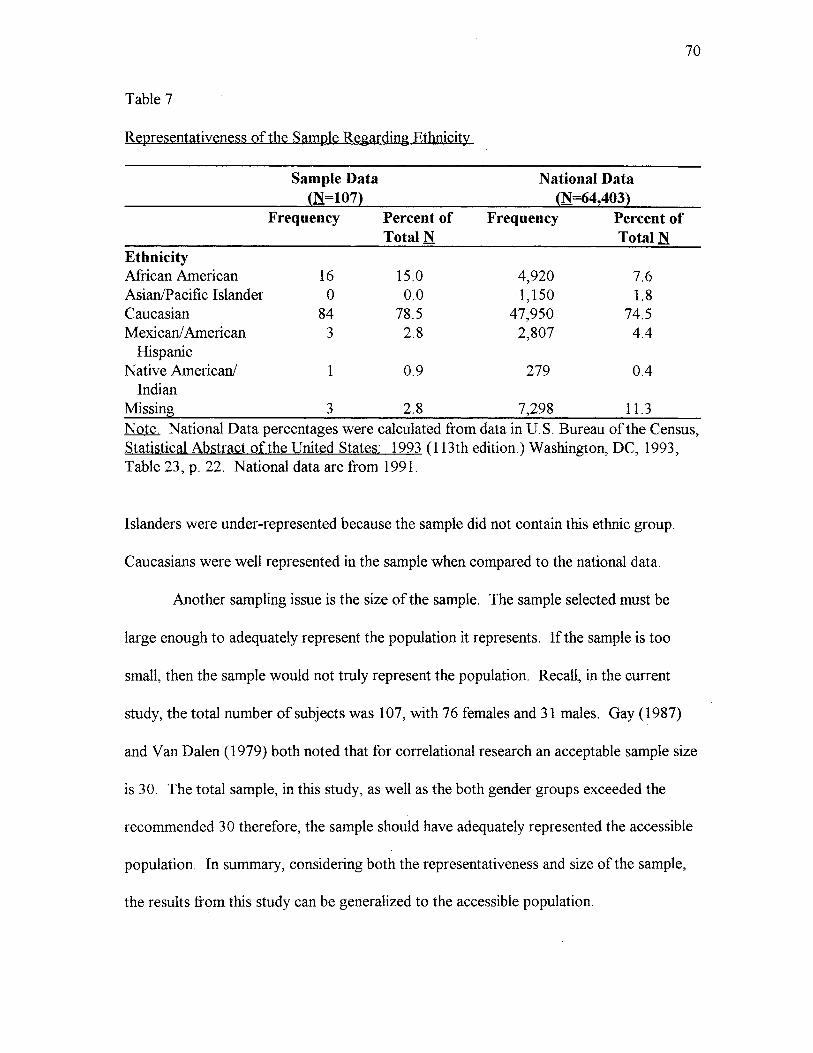
70
Table 7
Representativeness of the Sample Regarding Ethnicity
Sample Data National Data (N=107) (N=64,403)
Frequency Percent of Frequency Percent of Total N Total N
Ethnicity African American 16 15.0 4,920 7.6 Asian/Pacific Islander 0 0.0 1,150 1.8 Caucasian 84 78.5 47,950 74.5 Mexican/ American 3 2.8 2,807 4.4
Hispanic Native American/ 1 0.9 279 0.4
Indian Missing 3 2.8 7,298 11.3 Note. National Data percentages were calculated from data in U.S. Bureau of the Census, Statistical Abstract of the United States· 1993 (113th edition.) Washington, DC, 1993, Table 23, p. 22. National data are from 1991.
Islanders were under-represented because the sample did not contain this ethnic group.
Caucasians were well represented in the sample when compared to the national data.
Another sampling issue is the size of the sample. The sample selected must be
large enough to adequately represent the population it represents. If the sample is too
small, then the sample would not truly represent the population. Recall, in the current
study, the total number of subjects was 107, with 76 females and 31 males. Gay (1987)
and Van Dalen (1979) both noted that for correlational research an acceptable sample size
is 30. The total sample, in this study, as well as the both gender groups exceeded the
recommended 30 therefore, the sample should have adequately represented the accessible
population. In summary, considering both the representativeness and size of the sample,
the results from this study can be generalized to the accessible population.
Results of Statistical Analyses for Research Questions
Research Question One
71
The first research question addressed whether the MPD total resolution score, or
the stage resolution scale scores of older adults yielded results in conjunction with
Erikson's epigenetic principle. Two primary analyses were conducted to explore this
research question.
Descriptive Analysis
Means and standard deviations were computed for the eight positive, eight
negative, eight stage resolution, and the total resolution scales. All means and standard
deviations are presented in Table 8. The means in this table are the average number of
points for all
participants on each scale. The eight positive and negative scales are made up of seven
items each and points are allocated according to the response chosen on the five-point
Likert scale. For each item, the points on the Likert scale ranged from zero to four. The
highest score for any scale could be 28 (four points on all seven items) and the lowest
could be zero (zero points on all seven items). The means for the positive and negative
scales, reported in Table 8, are the average number of points earned by all participants on
each scale. The means for the positive scales ranged from 18.83 (P7-Generativity) to
21.09 (Pl-Trust). The largest mean on the negative scales was on N6-solation (10.16)
and the smallest mean was on
NS-Despair (5.49). On the positive side, the participants' collective opinions were that
they felt more of a sense of Trust, Identity, Ego Integrity, Industry, Autonomy, Intimacy,
Generativity, and Initiative, respectively. On the negative side, they felt more of a sense of
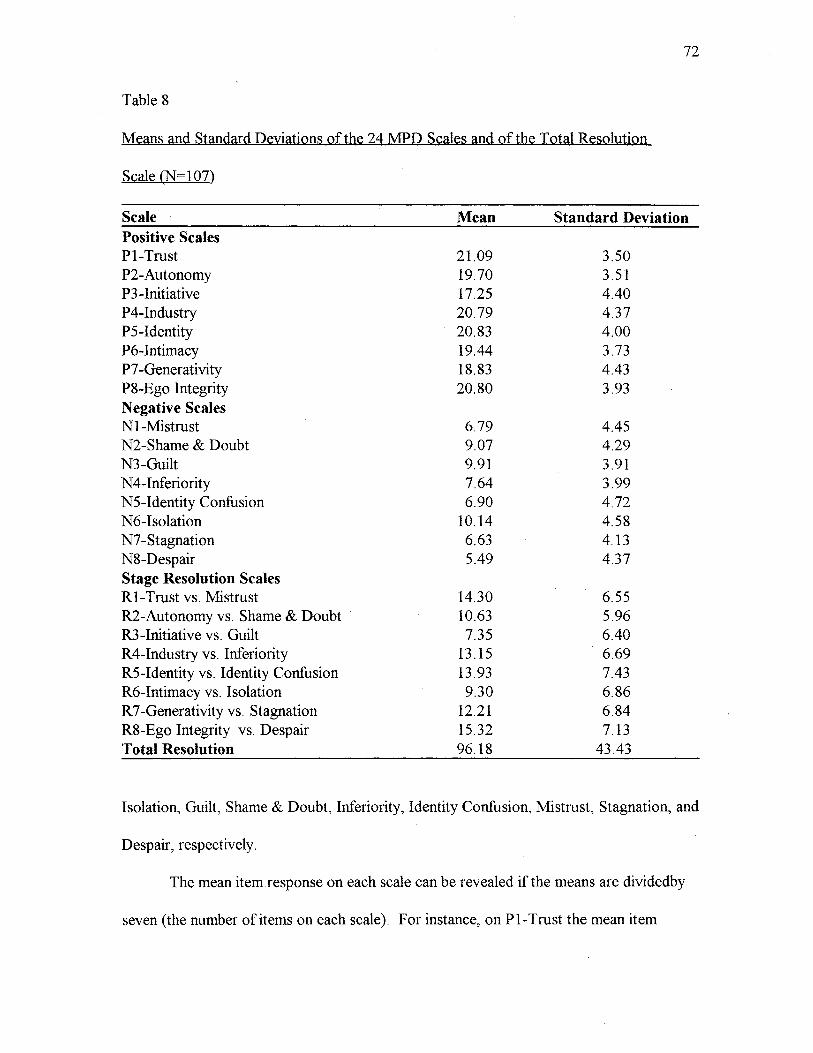
72
Table 8
Means and Standard Deviations of the 24 MPD Scales and of the Total Resolution
S~ale (N=107)
Scale Mean Standard Deviation Positive Scales Pl-Trust 21.09 3.50 P2-Autonomy 19.70 3.51 P3-Initiative 17.25 4.40 P4-Industry 20.79 4.37 PS-Identity 20.83 4.00 P6-Intimacy 19.44 3.73 P7-Generativity 18.83 4.43 PS-Ego Integrity 20.80 3.93 Negative Scales NI-Mistrust 6.79 4.45 N2-Shame & Doubt 9.07 4.29 NJ-Guilt 9.91 3.91 N4-Inferiority 7.64 3.99 NS-Identity Confusion 6.90 4.72 N6-Isolation 10.14 4.58 N7-Stagnation 6.63 4.13 NS-Despair 5.49 4.37 Stage Resolution Scales RI-Trust vs. Mistrust 14.30 6.55 R2-Autonomy vs. Shame & Doubt 10.63 5.96 R3-lnitiative vs. Guilt 7.35 6.40 R4-Industry vs. Inferiority 13.15 6.69 RS-Identity vs. Identity Confusion 13.93 7.43 R6-Intimacy vs. Isolation 9.30 6.86 R 7-Generativity vs. Stagnation 12.21 6.84 RS-Ego Integrity vs. Despair 15.32 7.13 Total Resolution 96.18 43.43
Isolation, Guilt, Shame & Doubt, Inferiority, Identity Confusion, Mistrust, Stagnation, and
Despair, respectively.
The mean item.response on each scale can be revealed if the means are dividedby
seven (the number of items on each scale). For instance, on Pl-Trust the mean item
response (i.e., 21.09/7=3.0l) was between "like me" and "very much like me". And on
P3-lnitiative the mean item (2.46) response was between "somewhat like me" and "like
me". On the negative scale with the highest mean (N6-Isolation, mean=I0.14) the mean
response (1.15) was between "not much like me" and "somewhat like me". And the
negative scale with the lowest mean (NS-Despair, mean=5.49) the mean item response
chosen most often (.78) was between "not at all like me" and "not much like me".
73
Of the stage resolution scales, the highest mean (15.32) was at R8-Ego Integrity
vs. Despair while the lowest mean (7.35) was at R3-Initiative vs. Guilt. Overall, the
participants reported they were struggling more with the issues present at the eighth stage
(i.e., Ego Integrity vs. Despair) and less with the issues present at the third stage (i.e.,
Initiative vs. Guilt). The mean for the Total Resolution scale could range from -224 to
+224 (-28 on all resolution scales to+ 28 on all resolution scales). Therefore, a positive
mean, such as the 96.18 reported in Table 8, indicated that overall resolution was
successful or healthy to some degree. A negative mean would have indicated an overall
unsuccessful resolution. So, overall, the participants in this study appeared to have
successfully resolved, to some degree, the collective eight stages.
The standard deviations reported in Table 8 show how much the respondents'
scores deviated from their respective means, or how closely the scores clustered around
the mean. For instance, the standard deviations ranged from 3.50 to 4.40 on the positive
scales and from 3.91 to 4.72 on the negative scales. The spread of scores was somewhat
similar on Pl-Trust (SD=3.50)and P2-Autonomy (SD=3.51); and on P4-Industry
(SD=4.37) and P3-lnitiative (SD=4.40). Further, there was some commonality among the
responses on N3-Guilt (SD=3.91) and N4-Inferiority (SD=3.99). The standard deviations
74
for the stage resolution scales ranged from 5.96 (R2-Autonomy vs. Shame & Doubt) to
7.43 (RS-Identity vs. Identity Confusion). In other words, there was more variability in
the responses on RS than there on R2. For the TR scale, a standard deviation of 43.43
might be considered relatively large when compared to the positive, negative, and stage
resolution scale standard deviations. This larger standard deviation occurred because the
TR standard deviation was based on responses from all 112 items whereas the other scales
were based on responses from 14 items (seven from each the positive and negative scale).
Regardless of the size of the standard deviation in comparison to the other scales, on the
TR scale, there was limited variability between the responses on the collective scales.
Correlational Analyses
The second analysis conducted for research question one was a correlational
analysis. This was carried out to determine if there was a relationship between the eight
stage resolution scales and the total resolution scale. The resulting Pearson
product-moment correlation coefficients (I) are presented in Table 9. Also presented in
Table 9 are the r2 values which represent the overlap or shared variance between the two
variables. Correlation coefficients are interpreted based on magnitude and direction. For
instance, the correlation between R 1-Trust vs. Mistrust and R2-Autonomy vs. Shame and
Doubt was .55 For an exploratory study, a correlation of .55 can be interpreted as a
moderately strong positive relationship (Bartz, 1988). The..r: value between Rl and R2
was .30. A r2 of .30 means that approximately 30% of the variance between RI and R2 is
shared. Furthermore, l-r2 equals the amount of variance that is not shared. The amount
of variance that is not shared Rl and R2 was . 70 or 70%. Overall, the relationship
between Rl and R2 is statistically significant at the .001 level and 30% of the variance
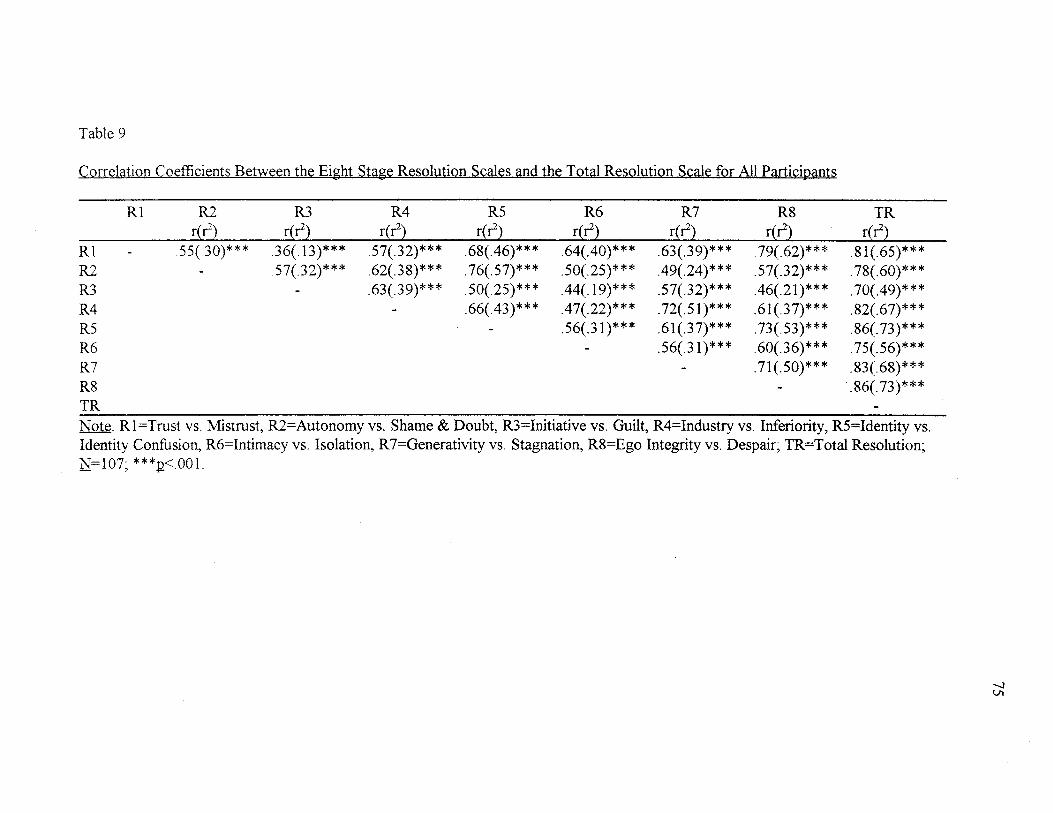
Table 9
Correlation Coefficients Between the Eight Stage Resolution Scales and the Total Resolution Scale for All Participants
Rl ~
~
R4 RS R6 R7 R8 TR
Rl ~ ~ M ~ M ITT U Th
~ ~ ~ ~ ~ ~ ~ ~ .55(.30)*** .36(.13)*** .57(.32)*** .68(.46)*** .64(.40)*** .63(.39)*** .79(.62)*** .81(.65)***
.57(.32)*** .62(.38)*** .76(.57)*** .50(.25)*** .49(.24)*** .57(.32)*** .78(.60)*** .63(.39)*** .50(.25)*** .44(.19)*** .57(.32)*** .46(.21)*** .70(.49)***
.66(.43)*** .47(.22)*** .72(.51)*** .61(.37)*** .82(.67)*** .56(.31)*** .61(.37)*** .73(.53)*** .86(.73)***
.56(.31)*** .60(.36)*** .75(.56)*** .71(.50)*** .83(.68)***
.86(.73)***
~- Rl =Trust vs. Mistrust, ~=Autonomy vs. Shame & Doubt, ~=Initiative vs. Guilt, R4=Industry vs. Inferiority, R5=Identity vs. Identity Confusion, R6=Intimacy vs. Isolation, R7=Generativity vs. Stagnation, R8=Ego Integrity vs. Despair; TR=Total Resolution; N=107; ***p<.001.
-...J VI
76
between them is shared while 70% of the variance is not shared. The remaining
coefficients in Table 9 can be interpreted similarly. It must be noted that all the
coefficients listed in Table 9 reached statistical significance at the .001 level. The
correlations among the stage resolution scales ranged from .36 (RI with R3) to . 79 (RI
with RS). The largest correlation coefficient (r=.79) was between RI- Trust vs. Mistrust
and RS-Ego Integrity vs. Despair. Thus, these two scales share the most variance
(r2=.62). Overall, the relationship among all the stage resolution scales were statistically
significant with the exception ofR3 and R6.
For the Total Resolution scale, the bivariate coefficients ranged from. 70 (R3-Initiative
vs. Guilt) to .86 (RS-Identity vs. Identity Confusion and RS-Ego Integrity vs. Despair).
The relationships between the eight stage resolution scales with the TR scale were
statistically significant and were strong positive values. R6 and RS has the most in
common or shared the most variance (73%) with the TR scale while R3 shared the least
( 49%) variance. Overall, all correlations yielded relatively strong statistically significant
coefficients.
Research Question Two
The second research question addressed whether there was a relationship between
stage resolution according to Eriksonian theory and divergent production in older adults.
In order to answer this research question, the eight stage resolution scale scores were
correlated with the six divergent thinking variables (fluency, originality, elaboration,
abstractness of titles, resistance to premature closure, and the criterion-referenced
indicators). Prior to presenting the correlation coefficients, the means and standard
deviations of the divergent thinking variable set and the eight stage resolution scales are
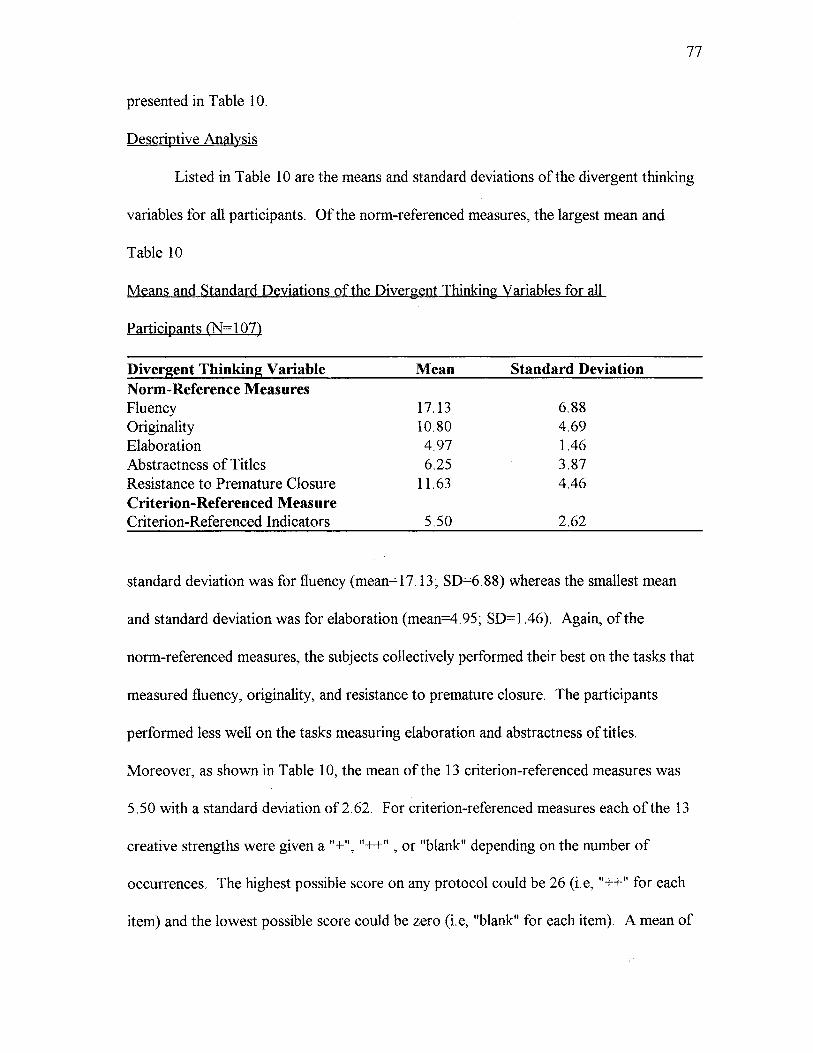
77
presented in Table 10.
Descriptive Analysis
Listed in Table 10 are the means and standard deviations of the divergent thinking
variables for all participants. Of the norm-referenced measures, the largest mean and
Table 10
Means and Standard Deviations of the Divergent Thinking Variables for all
Participants (N= 107)
Divergent Thinking Variable Norm-Reference Measures Fluency Originality Elaboration Abstractness of Titles Resistance to Premature Closure Criterion-Referenced Measure Criterion-Referenced Indicators
Mean
17.13 10.80 4.97 6.25
11.63
5.50
Standard Deviation
6.88 4.69 1.46 3.87 4.46
2.62
standard deviation was for fluency (mean=l 7.13; SD=6.88) whereas the smallest mean
and standard deviation was for elaboration (mean=4.95; SD=l.46). Again, of the
norm-referenced measures, the subjects collectively performed their best on the tasks that
measured fluency, originality, and resistance to premature closure. The participants
performed less well on the tasks measuring elaboration and abstractness of titles.
Moreover, as shown in Table 10, the mean of the 13 criterion-referenced measures was
5.50 with a standard deviation of 2.62. For criterion-referenced measures each of the 13
creative strengths were given a"+","++", or "blank" depending on the number of
occurrences. The highest possible score on any protocol could be 26 (i.e, "++" for each
item) and the lowest possible score could be zero (i.e, "blank" for each item). A mean of
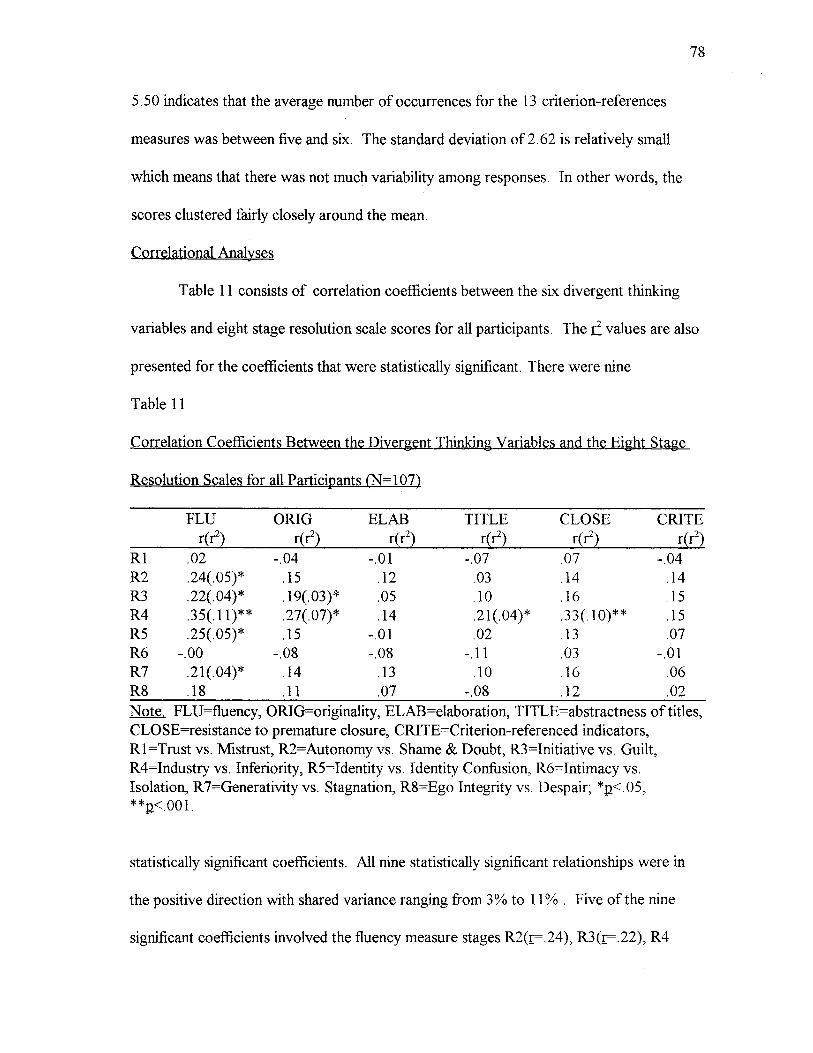
78
5. 50 indicates that the average number of occurrences for the 13 criterion-references
measures was between five and six. The standard deviation of2.62 is relatively small
which means that there was not much variability among responses. In other words, the
scores clustered fairly closely around the mean.
Correlational Analyses
Table 11 consists of correlation coefficients between the six divergent thinking
variables and eight stage resolution scale scores for all participants. The r2 values are also
presented for the coefficients that were statistically significant. There were nine
Table 11
Correlation Coefficients Between the Divergent Thinking Variables and the Eight Stage
Resolution Scales for all Participants ili= 107)
FLU ORIG ELAB TITLE CLOSE CRITE r{r2} r{r2} r{r2} r{r} r{r2} r{r}
Rl .02 -.04 -.01 -.07 .07 -.04 R2 .24(.05)* .15 .12 .03 .14 .14 R3 .22(.04)* .19(.03)* .05 .10 .16 .15 R4 .35(.11)** .27(.07)* .14 .21(.04)* .33(.10)** .15 R5 .25(.05)* .15 -.01 .02 .13 .07 R6 -.00 -.08 -.08 -.11 .03 -.01 R7 .21(.04)* .14 .13 .10 .16 .06 RS .18 .11 .07 -.08 .12 .02 Note. FLU=fluency, ORIG=originality, ELAB=elaboration, TITLE=abstractness of titles, CLOSE=resistance to premature closure, CRITE=Criterion-referenced indicators, Rl =Trust vs. Mistrust, R2=Autonomy vs. Shame & Doubt, R3=Initiative vs. Guilt, R4=Industry vs. Inferiority, R5=Identity vs. Identity Confusion, R6=Intimacy vs. Isolation, R7=Generativity vs. Stagnation, R8=Ego Integrity vs. Despair; *p<.05, **p,<.001.
statistically significant coefficients. All nine statistically significant relationships were in
the positive direction with shared variance ranging from 3% to 11 % . Five of the nine
significant coefficients involved the fluency measure stages R2(r=.24), R3(r=.22), R4
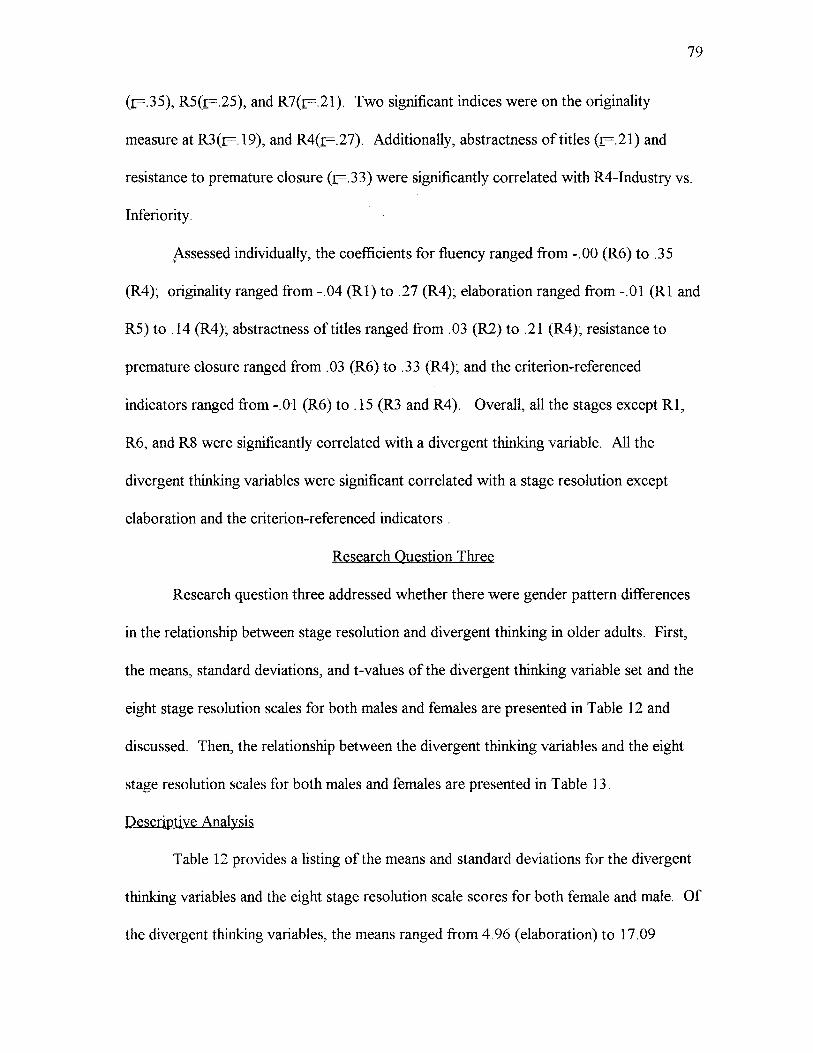
79
(r=.35), RS(r=.25), and R7(r=.21). Two significant indices were on the originality
measure at R3(r=.19), and R4(r=.27). Additionally, abstractness of titles (r=.21) and
resistance to premature closure (r=.33) were significantly correlated with R4-Industry vs.
Inferiority.
,Assessed individually, the coefficients for fluency ranged from -.00 (R6) to .35
(R4); originality ranged from -.04 (Rl) to .27 (R4); elaboration ranged from -.01 (Rl and
RS) to .14 (R4); abstractness of titles ranged from .03 (R2) to .21 (R4); resistance to
premature closure ranged from .03 (R6) to .33 (R4); and the criterion-referenced
indicators ranged from -.0-1 (R6) to .15 (R3 and R4). Overall, all the stages except Rl,
R6, and R8 were significantly correlated with a divergent thinking variable. All the
divergent thinking variables were significant correlated with a stage resolution except
elaboration and the criterion-referenced indicators .
Research Question Three
Research question three addressed whether there were gender pattern differences
in the relationship between stage resolution and divergent thinking in older adults. First,
the means, standard deviations, and t-values of the divergent thinking variable set and the
eight stage resolution scales for both males and females are presented in Table 12 and
discussed. Then, the relationship between the divergent thinking variables and the eight
stage resolution scales for both males and females are presented in Table 13.
Descriptive Analysis
Table 12 provides a listing of the means and standard deviations for the divergent
thinking variables and the eight stage resolution scale scores for both female and male. Of
the divergent thinking variables, the means ranged from 4.96 (elaboration) to 17.09
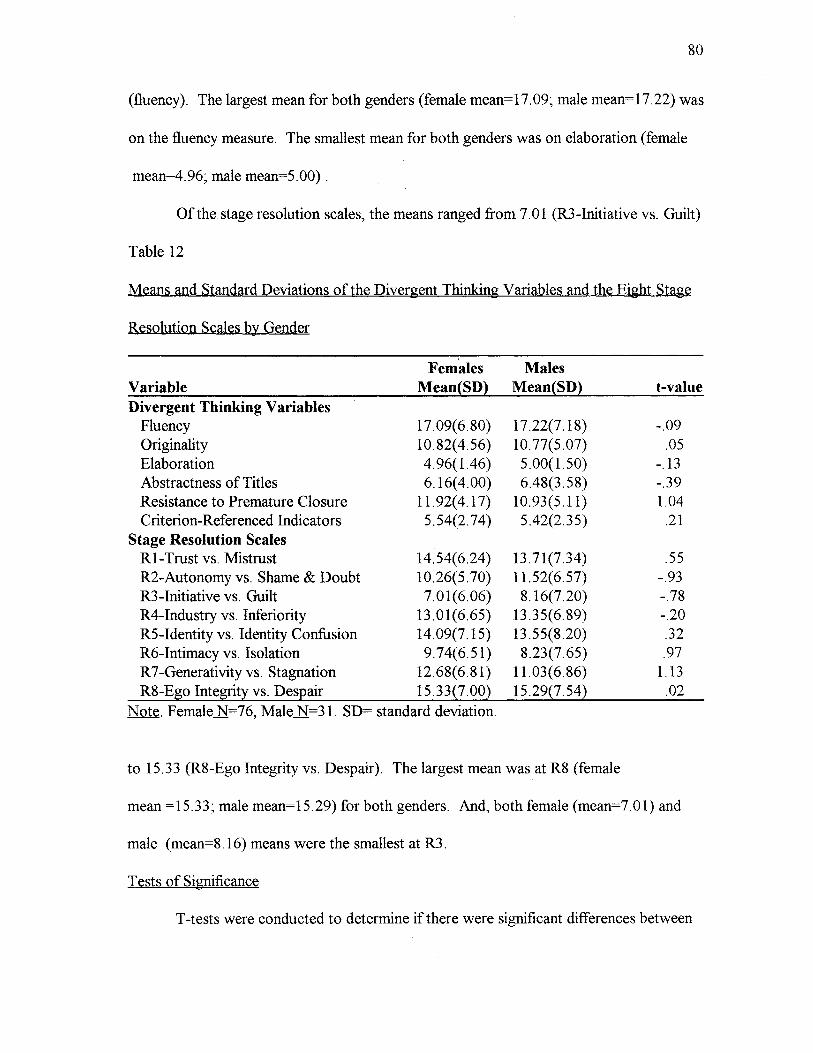
80
(fluency). The largest mean for both genders (female mean=l 7.09; male mean=l 7.22) was
on the fluency measure. The smallest mean for both genders was on elaboration (female
mean=4.96; male mean=S.00).
Of the stage resolution scales, the means ranged froni 7.01 (R3-Initiative vs. Guilt)
Table 12
Means and Standard Deviations of the Divergent Thinking Variables and the Eight Sta,ge
Resolution S~ales b~ Gender
Females Males Variable Mean{SD} Mean{SD} t-value Divergent Thinking Variables
Fluency 17.09(6.80) 17.22(7.18) -.09 Originality 10.82(4.56) 10.77(5.07) .05 Elaboration 4.96(1.46) 5.00(1.50) -.13 Abstractness of Titles 6.16(4.00) 6.48(3.58) -.39 Resistance to Premature Closure 11. 92( 4. 1 7) 10.93(5.11) 1.04 Criterion-Referenced Indicators 5.54(2.74) 5.42(2.35) .21
Stage Resolution Scales RI-Trust vs. Mistrust 14.54(6.24) 13.71(7.34) .55 R2-Autonomy vs. Shame & Doubt 10.26(5.70) 11.52(6.57) -.93 R3-lnitiative vs. Guilt 7.01(6.06) 8.16(7.20) -.78 R4-Industry vs. Inferiority 13.01(6.65) 13.35(6.89) -.20 RS-Identity vs. Identity Confusion 14.09(7.15) 13.55(8.20) .32 R6-Intimacy vs. Isolation 9.74(6.51) 8.23(7.65) .97 R 7-Generativity vs. Stagnation 12.68(6.81) 11.03(6.86) 1.13 R8-Ego Integrity vs. Deseair 15.33{7.00} 15.29{7.54} .02
Note. Female N=76, Male N=31. SD= standard deviation.
to 15.33 (R8-Ego Integrity vs. Despair). The largest mean was at R8 (female
mean =15.33; male mean=lS.29) for both genders. And, both female (mean=7.0l) and
male (mean=8.16) means were the smallest at R3.
Tests of Significance
T-tests were conducted to determine if there were significant differences between
81
the female and male means of the divergent thinking variables and the stage resolution
scales. The resulting t-values are reported in Table 12. According to the t-values for the
divergent thinking variable set, there was not a large enough discrepancy to be considered
a "real" or statistically significant difference between the female and male means. Also,
there was not a statistically significant difference between female and male means on the
stage resolution scales.
Correlational Analyses
The second statistical analysis conducted was a correlational analysis examining
the relationship between the divergent thinking variable set and the eight stage resolution
scales for both genders. The resulting coefficients from this analysis are shown in Table
13. Also presented in Table 13 are the_c values for the statistically significant coefficients.
For females, the statistically significant coefficients reported in Table 13 were
fluency (r=.31) and originality (r=.30) at R3-Initiative vs. Guilt; fluency (r=.35), originality
(r=.25), and resistance to premature closure (r=.28) at R4-Industry vs. Inferiority; and
fluency (r=.25) and elaboration (r==.28) at R7-Generativity vs. Stagnation. There were no
significant relationships across the eight stages for females between abstractness of titles
and the criterion-referenced indicators. All the significant relationships were in the positive
direction.
The largest amount of shared variance was at R4-Industry vs. Inferiority with
fluency (c=. 1 1). The smallest amount of shared variance accounted was 5 % ( originality
at R4-Industry vs. Inferiority). Across the eight stages, fluency was related to three of the
stages (R3-Initiative vs. Guilt, R4-Industry vs. Inferiority, and R7-Generativity vs.
Stagnation); originality to two (R3-Initiative vs. Guilt and R4-Industry vs. Inferiority);
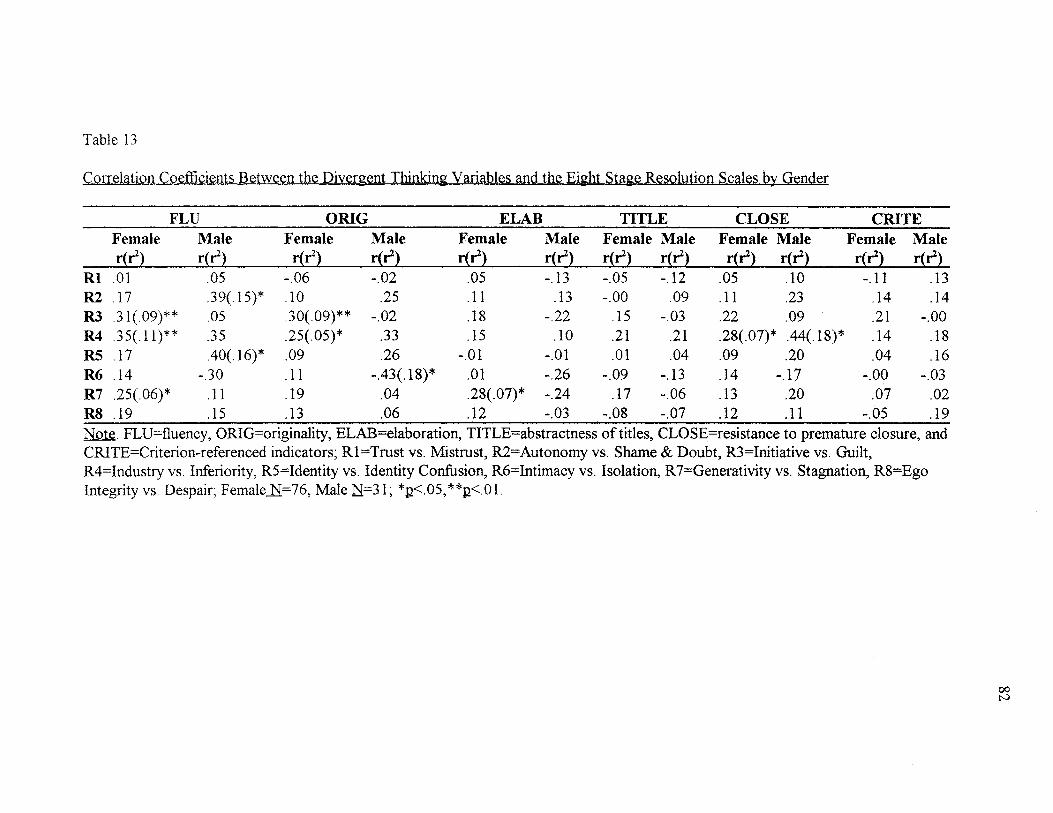
Table 13
Correlation Coefficients Between the Divergent Thinking Variables and the Eight Stage Resolution Scales by Gender
FLU ORIG ELAB TITLE CLOSE CRITE Female Male Female Male Female Male Female Male Female Male Female Male r{r2} r{r2} r{r2} r{r} r{r2} r{r2} r{r2} r(r2} r{r} r{r2) r{r} r{r2}
Rl .01 .05 -.06 -.02 .05 -.13 -.05 -.12 .05 .10 -.11 .13 R2 .17 .39(.15)* .10 .25 .11 .13 -.00 .09 .11 .23 .14 .14 R3 .31(.09)** .05 .30(.09)** -.02 .18 -.22 .15 -.03 .22 .09 .21 -.00 R4 .35(.11)** .35 .25(.05)* .33 .15 .10 .21 .21 .28(.07)* .44(.18)* .14 .18 R5 .17 .40(.16)* .09 .26 -.01 -.01 .01 .04 .09 .20 .04 .16 R6 .14 -.30 .11 -.43(.18)* .01 -.26 -.09 -.13 .14 -.17 -.00 -.03 R7 .25(.06)* .11 .19 .04 .28(.07)* -.24 .17 -.06 .13 .20 .07 .02 RS .19 .15 .13 .06 .12 -.03 -.08 -.07 .12 .11 -.05 .19 ~- FLU=fluency, ORIG=originality, ELAB=elaboration, TITLE=abstractness oftitles, CLOSE=resistance to premature closure, and CRITE=Criterion-referenced indicators; Rl =Trust vs. Mistrust, R2=Autonomy vs. Shame & Doubt, R3=Initiative vs. Guilt, R4=Industry vs. Inferiority, R5=Identity vs. Identity Confusion, R6=Intimacy vs. Isolation, R7=Generativity vs. Stagnation, R8=Ego Integrity vs. Despair; Female N=76, Male N=3 l; *p_<.05, **p_<.01.
00 t--)
83
elaboration to one (R7-Generativity vs. Stagnation); and resistance to premature closure
to one (R4-Industry vs. Inferiority). For males, there were significant relationships
between fluency and R2-Autonomy vs. Shame and Doubt (r=.39); resistance to premature
closure and R4-Industry vs. Inferiority (r=.44); fluency_ and RS-Identity vs. Identity
Confusion (r=.40); and originality and R6-Intimacy vs. Isolation. The amount of shared
variance for ranged from 15% to 18%. Eighteen percent of the variance was accounted
for between originality at R6 and between resistance to premature closure at R4. All of
the bivariate correlations were in the positive direction for males except originality at R6
(r=-.43). This -.43 indicates that as scores on the originality measure increased scores on
R6 decreased and visa versa. This was the only statistically significant coefficient for both
genders that was negative. There were no significant relationships across the eight stages
for males between elaboration, abstractness of titles, and the criterion-referenced
indicators.
Overall, for both genders, there were no statistically significant relationships across
the eight stages at abstractness of titles and the criterion-referenced indicators. Also, there
were no significant relationships across the divergent thinking variable set at Rl and RS.
CHAPTER V
DISCUSSION
Introduction
The main impetus of this study was to determine if there was a relationship between
stage resolution according to Eriksonian theory and divergent production in older male
and female adults. However, before this relationship could be examined, the application of
Erikson's stage theory to older adults needed to be established. As a result, the first
research question regarding whether the MPD total resolution or stage resolution scales
yielded results in conjunction with Erikson's epigenetic principle was formulated and
inspected. Then, the relationship between psychosocial development and divergent
production was examined. This chapter entails a discussion of the results reported in
Chapter IV along with basic limitations and recommendations for future research.
Measurement of Eriksonian Theory
Erikson (1963) recommends that psychosocial development be studied with the
consideration of all the stages in mind (i.e., epigenetic principle), so that it can be
determined what a future stage can be and what a preparatory stage must have been. This
recommendation by Erikson should be considered for all, regardless of age. In the
introduction to this study, the case was made for use of the MPD to assess psychosocial
development of older adults. Following Erikson's words of encouragement, an issue at
84
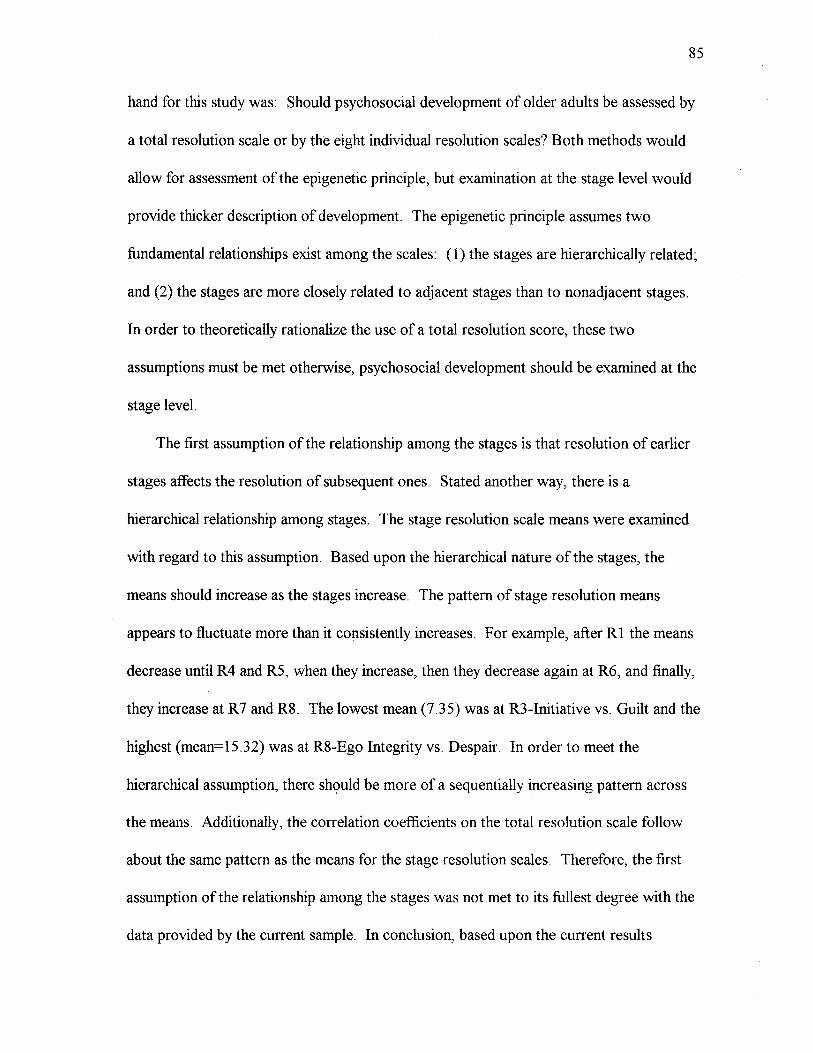
85
hand for this study was: Should psychosocial development of older adults be assessed by
a total resolution scale or by the eight individual resolution scales? Both methods would
allow for assessment of the epigenetic principle, but examination at the stage level would
provide thicker description of development. The epigenetic principle assumes two
fundamental relationships exist among the scales: ( 1) the stages are hierarchically related;
and (2) the stages are more closely related to adjacent stages than to nonadjacent stages.
In order to theoretically rationalize the use of a total resolution score, these two
assumptions must be met otherwise, psychosocial development should be examined at the
stage level.
The first assumption of the relationship among the stages is that resolution of earlier
stages affects the resolution of subsequent ones. Stated another way, there is a
hierarchical relationship among stages. The stage resolution scale means were examined
with regard to this assumption. Based upon the hierarchical nature of the stages, the
means should increase as the stages increase. The pattern of stage resolution means
appears to fluctuate more than it consistently increases. For example, after Rl the means
decrease until R4 and RS, when they increase, then they decrease again at R6, and finally,
they increase at R7 and R8. The lowest mean (7.35) was at R3-Initiative vs. Guilt and the
highest (mean=l5.32) was at R8-Ego Integrity vs. Despair. In order to meet the
hierarchical assumption, there sh9uld be more of a sequentially increasing pattern across
the means. Additionally, the correlation coefficients on the total resolution scale follow
about the same pattern as the means for the stage resolution scales. Therefore, the first
assumption of the relationship among the stages was not met to its fullest degree with the
data provided by the current sample. In conclusion, based upon the current results
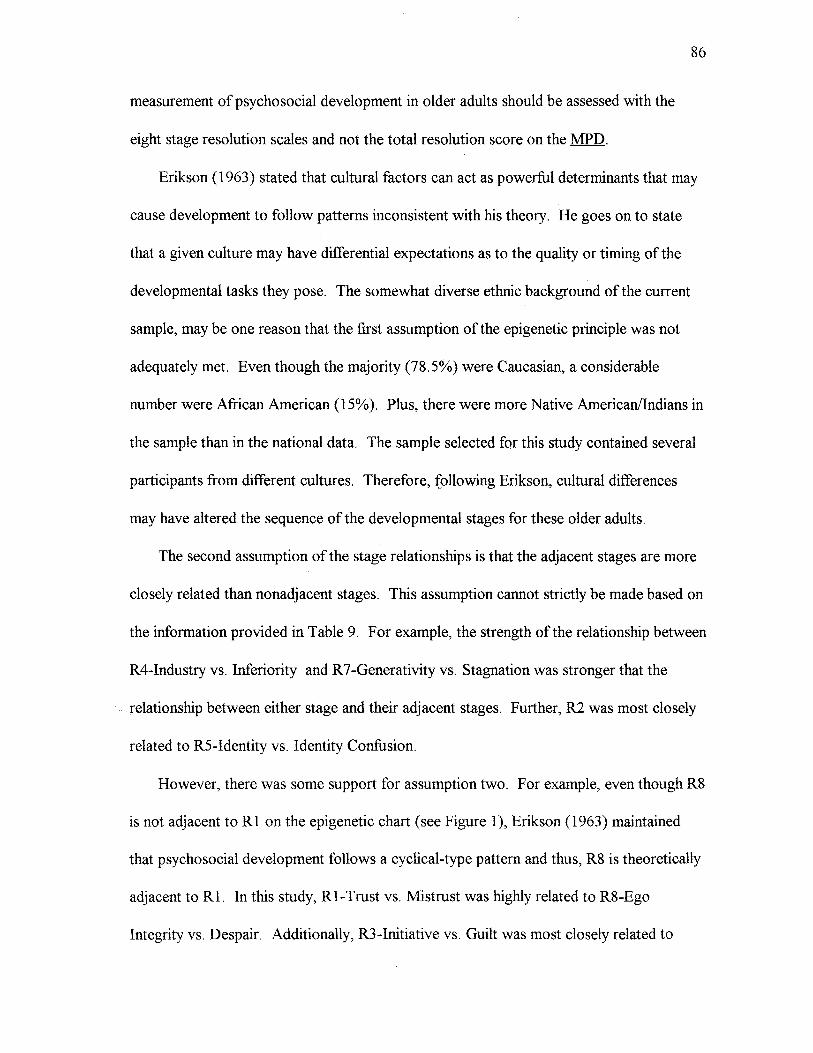
measurement of psychosocial development in older adults should be assessed with the
eight stage resolution scales and not the total resolution score on the MPD.
86
Erikson (1963) stated that cultural factors can act as powerful determinants that may
cause development to follow patterns inconsistent with his theory. He goes on to state
that a given culture may have differential expectations as to the quality or timing of the
developmental tasks they pose. The somewhat diverse ethnic background of the current
sample, may be one reason that the first assumption of the epigenetic principle was not
adequately met. Even though the majority (78.5%) were Caucasian, a considerable
number were African American (15%). Plus, there were more Native American/Indians in
the sample than in the national data. The sample selected for this study contained several
participants from different cultures. Therefore, (ollowing Erikson, cultural differences
may have altered the sequence of the developmental stages for these older adults.
The second assumption of the stage relationships is that the adjacent stages are more
closely related than nonadjacent stages. This assumption cannot strictly be made based on
the information provided in Table 9. For example, the strength of the relationship between
R4-Industry vs. Inferiority and R7-Generativity vs. Stagnation was stronger that the
relationship between either stage and their adjacent stages. Further, R2 was most closely
related to RS-Identity vs. Identity Confusion.
However, there was some support for assumption two. For example, even though R8
is not adjacent to Rl on the epigenetic chart (see Figure 1), Erikson (1963) maintained
that psychosocial development follows a cyclical-type pattern and thus, R8 is theoretically
adjacent to RI. In this study, RI-Trust vs. Mistrust was highly related to R8-Ego
Integrity vs. Despair. Additionally, R3-Initiative vs. Guilt was most closely related to
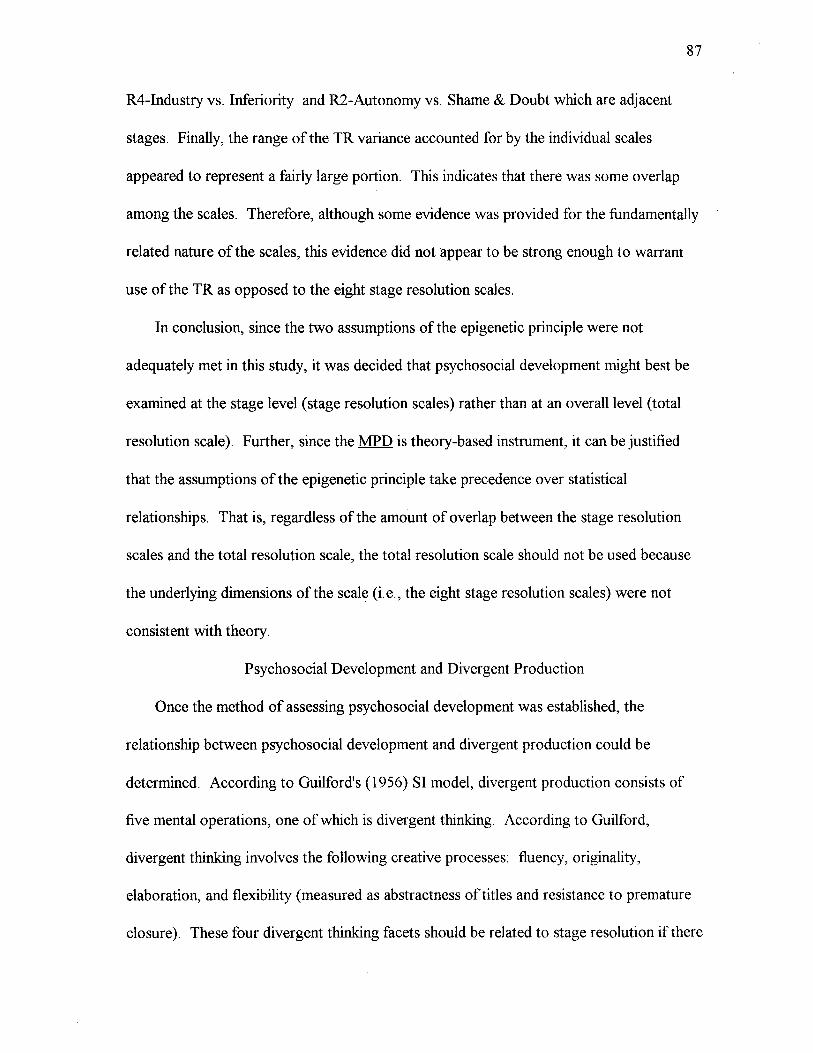
87
R4-Industry vs. Inferiority and R2-Autonomy vs. Shame & Doubt which are adjacent
stages. Finally, the range of the TR variance accounted for by the individual scales
appeared to represent a fairly large portion. This indicates that there was some overlap
among the scales. Therefore, although some evidence was provided for the fundamentally
related nature of the scales, this evidence did not appear to be strong enough to warrant
use of the TR as opposed to the eight stage resolution scales.
In conclusion, since the two assumptions of the epigenetic principle were not
adequately met in this study, it was decided that psychosocial development might best be
examined at the stage level (stage resolution scales) rather than at an overall level (total
resolution scale). Further, since the MPD is theory-based instrument, it can be justified
that the assumptions of the epigenetic principle take precedence over statistical
relationships. That is, regardless of the amount of overlap between the stage resolution
scales and the total resolution scale, the total resolution scale should not be used because
the underlying dimensions of the scale (i.e., the eight stage resolution scales) were not
consistent with theory.
Psychosocial Development and Divergent Production
Once the method of assessing psychosocial development was established, the
relationship between psychosocial development and divergent production could be
determined. According to Guilford's ( 1956) SI model, divergent production consists of
five mental operations, one of which is divergent thinking. According to Guilford,
divergent thinking involves the following creative processes: fluency, originality,
elaboration, and flexibility (measured as abstractness of titles and resistance to premature
closure). These four divergent thinking facets should be related to stage resolution if there
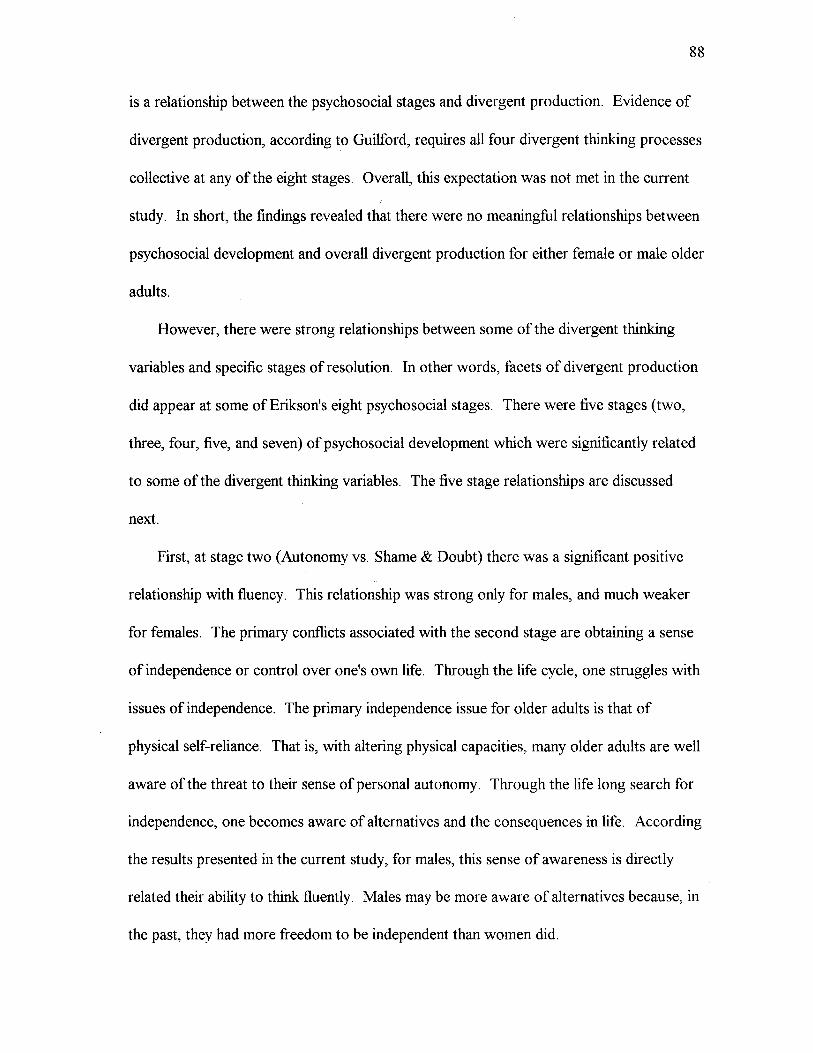
88
is a relationship between the psychosocial stages and divergent production. Evidence of
divergent production, according to Guilford, requires all four divergent thinking processes
collective at any of the eight stages. Overall, this expectation was not met in the current
study. In short, the findings revealed that there were no meaningful relationships between
psychosocial development and overall divergent production for either female or male older
adults.
However, there were strong relationships between some of the divergent thinking
variables and specific stages of resolution. In other words, facets of divergent production
did appear at some of Erikson's eight psychosocial stages. There were five stages (two,
three, four, five, and seven) of psychosocial development which were significantly related
to some of the divergent thinking variables. The five stage relationships are discussed
next.
First, at stage two (Autonomy vs. Shame & Doubt) there was a significant positive
relationship with fluency. This relationship was strong only for males, and much weaker
for females. The primary conflicts associated with the second stage are obtaining a sense
of independence or control over one's own life. Through the life cycle, one struggles with
issues of independence. The primary independence issue for older adults is that of
physical self-reliance. That is, with altering physical capacities, many older adults are well
aware of the threat to their sense of personal autonomy. Through the life long search for
independence, one becomes aware of alternatives and the consequences in life. According
the results presented in the current study, for males, this sense of awareness is directly
related their ability to think fluently. Males may be more aware of alternatives because, in
the past, they had more freedom to be independent than women did.
89
Second, stage three (Initiative vs. Guilt) deals with tensions associated with a search
for a equilibrium between initiative and guilt. Older adults strive for a sense of initiative
through activities that may be new to them. For instance, after retirement many older
adults seek new hobbies. According to the data in this study, this search for initiative
positively impacts older females' ability to gain a sense of overall awareness and to express
their originality.
Third, at stage four (Industry vs. Inferiority) there were meaningful relationships with
four (fluency, originality, abstractness of titles, and resistance to premature closure) of the
divergent thinking variables. The central issue at stage four is harmony between
achievement and failure. The experience one gains through developing a sense of
achievement impacts the ability to think fluently, originally, and be flexible. Specifically,
for females, there were definite relationships between fluency, originality, and resistance to
premature closure at the fourth stage. Whereas for males, there was only a relationship
with resistance to premature closure, Thus, in older womens' attempt to strive for
harmony between achievement and failure,. their ability to express themselves freely and
openly is enhanced. In older men, striving for harmony does not have the same impact it
does for older women, however it does enhance their ability to be open, to a degree.
One intriguing discovery at stage four was that for females and males combined, there
was a meaningful relationship with abstractness of titles. However, when females and
males were assessed separately the relationship disappeared. One reason for this finding
may have been the size of the female and male samples. When the data were analyzed
with regard to gender, the sample size decreased from 107 (males and females combined)
to two groups of 76 (females) and 31 (males). The size of the gender groups affected the
overall relationship between abstractness of titles at stage four. Evidently, the groups
individually were not large enough to produce significant results, but when the groups
were combined the results yielded a strong relationship. Researchers exploring this,area
should note that such fluctuations in estimates may occur with different sample sizes of
older adults.
90
Fourth, at stage five one seeks a sense of identity over identity confusion. These
feelings usually dominate adolescence, however older adults feel the same tension. Older
adults face the tasks of bringing identity and identity diffusion into balance by seeking to
make sense of the self that has lived through many decades, that lives in the present, and
that will continue to live in the indeterminate future (Erikson, 1986). The current results
revealed that identity issues were positively related to older mens' ability to think fluently.
Thus, for men only, the search for identity appeared to enhance their awareness of
alternatives in life.
Fifth, stage seven (Generativity vs. Stagnation) conflicts center around the need to
care for and maintain future generations. Reconciling lifelong generativity and stagnation
requires older adults to review their own years of active responsibility for nurturing the
next generations. That is, older adults must find a balance between the feelings of
generativity and stagnation developed in the course of middle age's active parenting,
working, and creating (Erikson, 1986). In this study, the ability to think fluently and
originally were related to stage seven for females only. In the past, females tended to be
the primary care givers and nurturers of mankind. Throughout female development, the
balance between generativity and stagnation enhanced their awareness of life as well as
their ability to carry out ideas.
91
A startling finding was that even though, overall, there were no strong relationships
between the divergent thinking variables and stage six (Intimacy vs. Isolation), this
relationship was evident when males and females were separately examined. There was a
strong negative relationship, for males, between originality and stage six. Thus, in the
current study, older men who had obtained a high degree of resolution between intimacy
and isolation were not able to produce original ideas. This finding suggests that older men
may conform in order to form intimate relationships with others.
Overall, there were no differences between females and males on any of the divergent
thinking measures or on the stage resolution scores. Apparently, males and females were
similar in their divergent thinking processes and in the degree to which they have resolved
each of the eight stages. However, some evidence for gender pattern differences was
produced in the assessment of the relationships between the divergent thinking process
and the eight stage resolution scales. These gender pattern differences may have been due
to developmental differences. Erikson (1963) proposed a social explanation for
differential development. He theorized that
childbearing forces girls to abandon much of the early locomotor vigor and the social
and intellectual initiative and intrusiveness which, potentially, girls share with boys;
while most boys, in pursuing the male role beyond what came naturally, had to
dissimulate and to disavow what receptivity and intuitiveness they shared with girls
(p. 242).
Erikson's social explanation of gender differences between psychosocial development only
partially explains the differences between males and females reported here. Aritei (1976)
noted that cultural awareness is essential to the creative process. Aritei'~ contention and
Erikson's social explanation, taken together, may explain the gender differences found in
this study. Given their age, the older females in this study may not have had the
social/cultural experiences the males had an opportunity to experience. This lack of
experience might not only affect psychosocial development but the creative process as
well.
92
It should be noted that stage eight (Generativity vs. Stagnation) is the age-appropriate
stage for the participants in this study. However, none of the divergent thinking process
were related to stage eight resolution scores. Further, there were no relationships between
any of the eight stages and the criterion-referenced indicators. Torrance (1992) indicated
that the 13 criterion-referenced indicators each play a role in real life creativity and the
abilities involved can be improved with practice. For the present sample, if the 13
criterion-referenced indicators did play a role in real life creativity they were not related to
psychosocial developmental issues. If one goal for practitioners working with older adults
is to encourage creativity, practice or training in this area does not appear to be sensitive
to psychosocial developmental issues.
There appears to be one central issue relevant to assessing creativity across the
life-span, with regard to the relationship between psychosocial development and divergent
production. Although some theorists believe creativity exists across the life-span, others
do not share this belief For example, prior research (e.g., Lesner & Hillman, 1983) has
indicated that creativity does occur across the life-span. On the other hand, Taylor
(1974), Butler (1974), and Dacey (1988) believe that different creative abilities are
maximized at different points in the life-cycle. Additionally, Taylor (1974) reported that
motivations for creativity vary with the particular stage in which an individual is currently
93
involved. The results in the current study generally tend to support Taylor's findings.
These data suggest that different creative abilities are maximized at different points in the
life-cycle. Finally, developmental issues associated with specific stages may enhance older
adults' divergent production.
Basic Limitations
As with any research project, the results of this study need to be interpreted with
respect to basic limitations, which are presented below.
1. The results of this investigation provided insight into relationships that existed
between the stages of psychosocial development and divergent production. This
relationship reported here in no way inferred causation.
2. In this study, the range of characteristics assessed (e.g., age and ethnic
background) may have been restricted, thus, the correlations reported here may have been
attenuated. Therefore, future researchers could expect higher correlational values.
3. Since the sample chosen was a sample of convenience, the results reported here
should only be generalized to those with similar characteristics.
4. Self-report questionnaires were used in this study. Holden and Edwards (1989)
cite problems pertaining to self- report questionnaires such as social desirability, response
set, and the influence of education on responses. These problems may have occurred in
the current study, however the well validated instruments used here should have limited
such problems.
5. Paper-and-pencil instruments, such as the TTCT and the MPD may be more
difficult for older adults to complete. Precautions were taken in order to avoid this
limitation, however. All subjects were encouraged to do their best. They were also
94
informed that there were no right or wrong answers on the instruments. Also, by having
large print copies available, visual or reading difficulties were deemphasized.
6. Finally, Klein and Birren (1973) report that older adults have a tendency toward
conformity. The generation sampled for this study was reared during a time that
conformity was rewarded. Additionaliy, in this study, older adults were assessed in
groups, and as a result there may have been social pressure to conform. Interestingly, the
older adult participants did not express concern that their peers would see their answers.
They were more concerned that persons outside the testing situation would evaluate their
responses. Once the participants were reassured that only the researcher would have
access to their data, they appeared to feel more comfortable in completing the instruments.
Recommendations for Further Research
As a result of the current findings, there are five recommendations for future research.
The first recommendation is that a larger sample from the population needs to be
measured. The results obtained here may change in research studies designed with
additional participants. Further, with a larger sample size and the results presented here, a
causal model might be developed. More specifically, the pattern of interrelationships
produced in this study could suggest a theoretical model that could be tested.
The second recommendation is to extend the operational definition of the construct of
creativity. Given that the operational definition drives the choice of the assessment tool, it
is suggested that the instrument selected pertain specifically to older adults.
The third recommendation is that research be conducted in an attempt to build the
literature base on the creative processes across the adults life-span. More specifically,
research with older adults needs to be examined across age groups, because there may be
95
variability between those in their 50s, 60s, 70s and 80s. This may be particularly true as
life expectancy increases.
The final recommendation is that longitudinal qualitative research be conduced with
older adults in order to obtain richer detail concerning the relationship between Erikson's
psychosocial stages and divergent production. Additionally, in this study, there was a
lack of support for measurement of the epigenetic principle, In order to demonstrate that
the stages are hierarchically related, in-depth interviews or case studies could be
conducted.
96
References
Aiken, L.R. (1980). Problems in testing the elderly. Educational Gerontology, 2,
119-124.
Albaum, G. (1976). Selecting specialized creators: The independent inventor.
Psychological Reports, 39, 175-179.
Alpaugh, P.K., & Birren, J.E. (1977). Variables affecting creative contributions across
the adult life span. Human Development, 20, 240-248.
Alpaugh, P.K., Parham, I.A, Cole, K.D., & Birren, J.E. (1982). Creativity in adulthood
and old age: An exploratory study. Educational Gerontology, .8,, 101-116.
Alpaugh, P.K., Renner, V.J., & Birren, J.E. (1976). Age and creativity: Implications for
education and teachers. Educational Gerontology, l, 17-40.
Anastasi, A (1982). Psychological testing (5th ed.). New York: Macmillan.
Arasteh, AR., & Arasteh, J.D. (1976). Creativity in human development: An
interpretive and annotated bibliography. Cambridge, Massachusetts: Schenkman
Publishing Company, Inc.
Arieti, S. (1976). Creativity: The magic synthesis. New York: Basic Books.
Ball, 0. & Torrance, E.P. (1984). Effectiveness of new materials developed for training
the streamlined scoring of the TTCT, figural a and b forms. The Journal of Creative
Behavior, 14(3), 199-203.
Barron, F. ( 1963). Creativity and psychological health: Origins of personal vitality and
creative freedom. Princeton: Van Nostrand.
Botwinick, J. (1967). Cognitive processes in maturity and old age. New York:
Springer.
97
Botwinick, J. (1973). Aging and behavior. New York: Springer.
Boyd, R (1964). Analysis of the ego-stage development of school-age children. Journal
of Experimental Education, 32(3), 249-258.
Boyd, R. (1966). Self-description questionnaire. Madison, WI: University of Wisconsin.
Boylin, W., Gordon, S.K., & Nehrke, M.F. (1976). Reminiscing and ego integrity in
institutionalized elderly males. The Gerontologist, 16(2), 118-124.
Buckley, J.C., & Schmidt, H. (1977). The retirement handbook. New York: Harper &
Row, Publishers, Inc.
Butler, RN. (1967). The destiny of creativity in later life: Studies of creative people and
the creative process. In S. Levin & RJ. Kahana (Eds.), Psychodynamic studies on
aging: Creativity, reminiscing, and dying (pp. 20-63). New York: International
Universities Press.
Butler, RN. (1973). The creative life and old age. In E. Pfeiffer (Ed.), Successful aging:
A conference report (pp. 97-107). Durham, NC: Duke University Press.
Butler, RN. (1974). The creative life and aging. In E. Pfeiffer (Ed.), Successful aging.
Durham, NC: Duke University Press.
Caillet, KC. (1980). Ego stage development inventory. Unpublished self-report
inventory. Available from author, California State University, Long Beach, California.
Campbell, E., & Fiske, D.W. (1959). Convergent and discriminant validation by the
multitrait-multimethod matrix. Psychological Bulletin, 56, 81-105.
Canestrairi, RE., Jr. (1963). Paced and self-paced learning in young and elderly adults.
Journal of Gerontology, .IB, 165-169.
Carmer, J.C. (1992). Review of the measures of psychosocial development. In J.J.
Kramer & J.C. Conoley (Eds.), The eleventh mental measurements yearbook (pp.
520-521). Lincoln, NE: University ofNebraska-Lincoln, Burns Institute of Mental
Measurements.
98
Chase, C.I. (1985). Review of the Torrance Tests of Creative Thinking. In J.V. Mitchell
(Ed.), The ninth mental measurements yearbook: Vol II (pp. 1631-1632). Lincoln,
NE: University of Nebraska-Lincoln, Burns Institute of Mental Measurements.
Christensen, P.R., Guilford, J.P., Merrifield, P.R., & Wilson, RC. (1960). Alternate
uses. Beverly Hills, California: Sheridan Psychological Services.
Clark, B. (1983). Growing 1W gifted: Developing the potential of children at home and
at school (2nd ed.). Columbus: Charles E. Merrill.
Clark, P. & Osgood, N.J. (1985). Seniors on stage. New York: Praeger Publishers.
Cohen, S. (1986). Artistic creativity across the adult life-span: An alternative approach.
Interchange, 11, 1-16.
Cohen-Shalev, A ( 1989). Old age style: Developmental changes in creative production
from a life-span perspective. Journal of Aging Studies, .1, 21-37.
Constantinople, AP. (1966). Some correlates of happiness and unhappiness in college
students (Doctoral dissertation, University of Rochester, New York, 1966).
Dissertation Abstracts International, 27, 250A (University Microfilms No. 66-
06849).
Costa, P.T., Zonderman, AB., McCrea, R.R., Cornoni-Huntlye, J., Locke, B.Z., &
Barbano, H.E. (1987). Longitudinal analyses of psychological well-being in a
national sample: Stability of mean levels. Journal of Gerontology, 42(1), 50-55.
Crockenberg, S.B. (1972). Creativity tests: Boon or boondoggle. Review of
Educational Research, 42, 27-46.
Crocker, L., & Algina, J. (1986). Introduction to classical and modern test theory.
Orlando, FL: Holt, Rinehart, and Winston, Inc.
Cronbach, L.J. (1951). Coefficient alpha and the internal structure of tests.
Psychometrika, 16, 297-334.
99
Csikszentmihalyi, M.C. (1990). The domain of creativity. In M.A. Runco, & RS. Albert
(Eds.), Theories of creativity. Newbury Park, CA: Sage.
Dacey, J.S. (1989). Fundamentals of creative thinking. New York: Lexington Books.
Davis, G.A. (1983). Creativity is forever. Dubuque, IA: Kendall/Hunt Publishing Co.
Dawson, AM., & Baller, W.R. (1972). Relationship between creative activity and the
health of elderly persons. The Journal of Psychology, 82, 49-58.
Dennis, W. (1966). Creative productivity between the ages of 20 to 80 years. Journal .Qf
Gerontology, 12, 1-8.
Dohr, J.H., & Forbess, L.A. (1986). Creativity, arts, and profiles of aging: A
reexamination. Educational Gerontology, 12, 123-138.
Engelman, M. (1981 ). The response of older women to a creative problem-solving
program. Educational Gerontology, §., 165-173.
Erikson, E.H. (1950). Childhood and Society. New York: Norton.
Erikson, E.H. (1959). Ego development and historical change. Psychological Issues,
1(1), Monograph 1, International Universities Press, New York, 77-78.
Erikson, E.H. (1963). Childhood and society (2nd ed.). New York: W.W. Norton.
Erikson, E.H. (1964). Insight and responsibility (2nd ed.). New York: W.W. Norton.
100
Erikson, E.H. (1968a). Identity: Youth and Crisis. New York: W.W. Norton.
Erikson, E.H. (1968b). The human life cycle. International Encyclopedia of the Social
Sciences. New York: Crowell- Collier, 286-292.
Erikson, E.H. & Erikson, J.M. (1978). Introduction: Reflections on Aging. In S.F.
Spicker, K.M. Woodward, & D.D. Van Tassel (Eds.), Aging and the elderly:
Humanistic perspectives in gerontology (pp.1-20). Now Jersey: Humanities Press,
Inc.
Erikson, E.H., Erikson, J.M., & Kivnick HQ. (1986). Vital involvement in old age. New
York: W.W. Norton.
Euler, B.L. (1990). Pragmatic, Eriksonian, and locus of control psychological well-being
among the non- institutionalized elderly (Doctoral dissertation, University of New
Mexico, 1990). Dissertation Abstracts International, 21., 06B.
Fishkin, AS. (1989). Effort of odyssey of the mind creative problem solving teams:
Effects on creativity, creative self-concept, locus of control, and general self-concept
in gifted children (Doctoral dissertation, Oklahoma State University, 1989).
Freud, S. (1908). The relation of the poet to day dreaming. In Collected papers.
Translated by Riviere. London: Hogarth Press.
Freud, S. (1963). In J. Strachey (Ed.), The Standard Edition Qfthe Complete
Psychological Works of Sigmund Freud. London: Hogarth Press.
Fromm, E. (1959). Creativity. In H.H. Anderson (Ed.), Creativity and Its Cultivation.
NewYork: Harper.
101
Gable, R.K. (1992). Review of the measures of psychosocial development. In J.J.
Kramer & J.C. Conoley (Eds.), The eleventh mental measurements yearbook (pp.
521-522). Lincoln, NE: University ofNebraska-Lincoln, Burns Institute of Mental
Measurements.
Gamble, A.O. Suggestions for future research. In C. Taylor (Ed.), The 1959 University
of Utah research conference on the identification of creative scientific talent. Salt
Lake City: University of Utah Press. 292-297.
Gay, L.R. (1987). Educational research: Competencies for analysis and application (3rd
ed.). Columbus, Ohio: Merrill Publishing Company.
Ghiselin, B. (1952). The creative process. New York: New American Library.
Goff, K., & Torrance, E.P. (1991, Spring). The Georgia studies of creative behavior:
Venturing into studies of creativity in elders. Journal of the American Society on
Aging. 53-54.
Goff, K., & Torrance, E.P. (in press). Healing qualities of imagery and creativity. Journal
of Creative Behavior.
Gordon, C. (1967). The Gordon Instrument. The Age Center of New England,
Unpublished instrument.
Gowan, J.C. (1975). Trance, .art and creativity. Northridge, CA: Author.
Gray, J.S. (1986). Creative drama with fourth-grade students: Effects of using guided
imagery. Dissertation Abstracts International, 47, 772A.
Grounlund, N.E., & Linn, R.L. (1990). Measurement and evaluation in teaching (6th
ed.). New York: Macmillan Publishing Company.
102
Gruen, W. (1960). Rejection of false information about oneself as an indication of ego
identity. Journal of Consulting Psychology, 24, 231-233.
Gruen, W. (1964). Adult personality: An empirical study of Erikson's theory of ego
development. In B.L. Neugarten (Ed.), Personality in Middle and Late Life. New
York: Atherton Press.
Guilford, J.P. (1950). Creativity. American Psychologist, 2, 444-454.
Guilford, J.P. (1956). The structure of the intellect. Psychological Bulletin, 53, 267-293.
Guilford, J.P. (1959). Traits of creativity. In H.H. Anderson (Ed.), Creativity and Its
Cultivation. New York: Harper.
Guilford, J.P. (1968). Intelligence, creativity, and their education implications. San
Diego, California: Robert R Knapp.
Guilford, J.P. (1977). Creativity: Respect and prospect. In S.J. Parnes, S.J.; RB. Noller,
RB.& AM. Biondi (Eds.), Guide to Creative Action. New York: Scribner's and
Sons, 137-145.
Hawley, G. (1985). Construction and validation of an Eriksonian measure of
psychosocial development (Doctoral Dissertation, University of North Carolina,
Chapel Hill, 1984). Dissertation Abstracts International, 45, 3357. (University
Microfilms No. 72-55159).
Hawley, G.A. (1988). Measures of psychosocial development: Professional manual.
Odessa, FL: Psychological Assessment Resources, Inc.
Heist, P. (1968). Creative students: College transients. In P. Heist (Ed.), The Creative
College Student: An Unmet Challenge (pp. 35-55). San Francisco: Josey-Bass.
Helmholtz, H.V. (1896). Yortrage und Reden, 5th auff. Brammschweig: Viewey und
John.
103
Hendrucks, J. (1987). Productivity. In G.L. Maddox (Ed.), The Encyclopedia of Aging
(pp.539-540). New York: Springer.
Hocevar, D. ( 1981 ). Measurement of creativity: Review and critique. Journal of
Personality Assessment, 45(5), 450-464.
Holden, G., & Edwards, L. (1989). Parental attitudes toward child rearing: Instruments,
issues, and implications. Psychological Bulletin, 106(1), 29-58.
Isaksen, S.G. (1987). Introduction: An orientation to the frontiers of creativity research.
In S.C. Isaksen (Ed.), Frontiers of Creativity Research: Beyond tM Basics (pp. 1-
26). Buffalo, New York: Bearly Limited.
Jaquish, G.A., & Ripple, RE. (1981). Cognitive creative abilities and self-esteem across
the adult life-span. Human Development, 24, 110-119.
Joyce, Sister Mary Ursula. (1970). An empirical investigation of Erikson's developmental
crises of ego identity, intimacy, and generativity in relation to religious women
(Doctoral dissertation, Fordham University). Dissertation Abstracts International,
1971, ll, 3341 A (University Microfilms No. 71-00031).
Kahana, E., & Coe, M. (1969). Dimensions of conformity: A multidisciplinary view.
Journal of Gerontology, 24, 76-81.
Khatena, J. (1977). Facilitating the creative functions of the gifted. Gifted Child
Quarterly, 21, 218-22 7.
Klein, R.L. (1972). Age, sex and task difficulty as predictors of social conformity.
Journal of Gerontology, 27, 229-236.
Klein, R.L., & Birren, J.E. (1973). Age, perceived self- competence and conformity.
Proceedings of the 81st Annual Convention of the American Psychological
Association, .8,, 779-780.
104
Knapp, M.L. (1978). Nonverbal communication in human interaction. New York: Holt,
Reinhart, and Winston.
Kogan, N. (1973). Creativity and cognitive style: A life-span perspective. In P.B. Baltes
& K.W. Schaie (Eds.), Life-span Development Psychology (pp. 145-178). New York:
Academic.
Kogan, N. (1987). Creativity. In G.L. Maddox (Ed.), The encyclopedia Qf .aging (pp.
153-155). New York: Springer.
Kuriansky, J., Gurland, B., & Cowan, D. (1976). The usefulness of a psychological test
battery. International Journal of Aging and Human Development, 1(4), 331-342.
Lehman, H.C. (1953). Age .and achievement. Princeton, N.J.: Princeton University Press.
Lehman, H.C. (1956). Reply to Dennis' critique of age and achievement. Journal of
Gerontology. ll, 333-337.
Lesner, W.J. & Hillman, D. (1983). A developmental schema of creativity. Journal of
Creative Behavior, 17(2), 93-98.
Lindauer, M.S. (1992). Creativity in aging artists: Contributions from the humanities to
the psychology of old age. Creativity Research Journal, 2(3), 211-231.
Longfellow, D.R. (1989). Factorial validity of the measures of psychosocial development
(Doctoral dissertation, Western Conservative Baptist Seminary, 1989). Dissertation
Abstracts International. ii, 06B.
105
Lowenfeld, H. (1941). Psychic trauma and productive experience in the artist.
Psychoanalytic Quarterly, X, 116-130.
MacKinnon, D.W. (1964, April). Personality and the realization of creative potential.
Presidential Address at Western Psychological Association, Portland, Oregon.
Marcia, J.E. (1964). Determination and construct validity of ego identity status (Doctoral
dissertation, Ohio State University, 1965). Dissertation Abstracts International, 25,
6763. (University Microfilms No. 65-05606).
May, R. (1983). The courage :to. create. New York: W.W. Norton and Co., Inc.
Mccaslin, N. (1984). Creative drama in the classroom. New York: Longman, Inc.
Melrose, L. (1989). The creative personality and the creative process: A
phenomenological perspective. Lanham, Maryland: University Press of America, Inc.
Miller, P.H. (1989). Theories of developmental psychology (2nd ed.). San Francisco:
Freeman.
Mooney, R.L. ( 1963). A conceptual model for integrating four approaches to the
identification of creative talent. In C. W. Taylor & F. Barron (Eds.), Scientific
Creativity: Its Recognition and Development. New York: Wiley.
Mouard, S.A. (1976). A factor analytic study of the streamlined scoring of Figural Form
A of the Torrance Tests of Creative Thinking. Masters Abstracts, University of
Georgia.
Mumford, M.D. (1984). Age and outstanding occupational achievement: Lehman
revisited. Journal of Vocational Behavior. 25, 225-244.
Norusis, M.J. (1993). SPSS for Windows. Chicago, IL.
Osborn, AF. (1963). Applied imagination. New York: Scribners.
Parnes, S.J. (1967). Creative Behavior Guidebook. New York: Scribners.
Parnes, S.J. (1981). The magic of your mind. Buffalo, NY: Barely Limited.
Parnes, S.J., Noller, R.B., & Biondi, AM. (1977). Guide to creative action: Revised
edition of creative behavior guidebook. New York: Charles Scribner's.
Parris, D. (1986, May). Stimulating creativity through artistic inspiration. Journal of
Gerontological Nursing, 12(5), 44.
Prelinger, E., & Zimet, C.N. (1964). An Ego-Psychological Approach to Character
Assessment. Glencoe, IL: Free Press.
106
Pruyser, P.W. (1987). Creativity in aging persons. Bulletin of the Menninger Clinic, 21,
425-435.
ReVille, S. (1989). Young adulthood to old age: Looking at intergenerational
possibilities from a human development perspective. Journal of Children in
Contemporary Society, 20(3-4), 45-53.
Rhodes, M. (1961 ). An analysis of creativity. Phi Delta Kappan, 42, 305-310.
Rimm, S. ( 1984). The characteristics approach: Identification and beyond. Gifted Child
Quarterly, 28, 181-187.
Roe, A (1972). Maintenance of creative output through the years. In C.W. Taylor
(Ed.), Climate for creativity. New York: Pergamon Press.
Roid, G.H. & Ledbetter, M.F. (1987). Age trends in personality development: Evidence
for Erikson's theory. Paper presented at meeting of the American Psychological
Association, New York.
Romaniuk, J.G. (1978). Training creativity in the elderly: An examination of attitudes,
self-perceptions and abilities (Doctoral dissertation, University of Wisconsin).
107
Dissertation Abstracts International, 38, (University Microfilms No. 2-144).
Romaniuk, J.G. & Romaniuk, M. (1981). Creativity across the life span: A measurement
perspective. Human Development, 24, 366-381.
Ryff, C.D. (1982). Successful aging: A developmental approach. The Gerontologist,
22(2), 209-214.
Schaie, K.W. (1977). Quasi-experimental research designs. In Birren and Schaie,
Handbook Qf the Psychology of~' New York: van Nostrant & Reinhold.
Schaie, K.W., & Willis, S.L. (1986). Adult development and aging (2nd ed.). Boston,
MA: Little, Brown.
Schmidt, S.L. (1991). Grandmotherhood, psychosocial development, and self-esteem
(Doctoral dissertation, California School of Professional Psychology). Dissertation
Abstracts International, 52, 06B.
Seagoe, M. ( 197 5). Some learning characteristics of gifted children. In R. Martinson
(Ed.), The Identification ofthe Gifted and Talented (pp. 20-21). Reston, VA The
Council for Exceptional Children.
Siegel, J.S., & Taeuber, C.M. (1986, Winter). Demographic perspective on the long
lived society. Daedalus, 115(1), 77-117.
Simonton, D.K. (1975). Age and literary creativity: A cross-cultural and transhistorical
survey. Journal of Cross-Cultural Psychology, Q, 259-277.
Simonton, D. K. ( 1977). Creative productivity, age, and stress: A biographical time
series analysis of 10 classical composers. Journal of Personality and £QciID.
Psychology, 35(11), 791-804.
108
Simonton, D.K. (1984). Artistic creativity and interpersonal relations across and within
generations. Journal of Personality and Social Psychology, 46, 1273-1286.
Simonton, D.K. (1988). Age and outstanding achievement: What do we know after a
century of research? Psychological Bulletin, 104, 251-267.
Simonton, D.K. (1990). Does creativity decline in the later years? In M. Perlmutter
(Ed.), Late life potential (pp. 83-112). Washington, DC: Gerontological Society of
America.
Smith, G.J.W., & Kragh, U. (1975). Creativity in mature and old age. Psychological
Research Bulletin, Lund University, U, No. 7.
Smith, G.J.W., & van der Meer, Gunilla. (1990). Creativity in old age. Creativity
Research Journal • .1(4), 249-264.
· Stein, M.I. (1974-1975). Stimulating creativity (Vols.1-2). New York: Academic Press.
Swank, P., Gaa, J., Harrington, R., Jennings, G., & Longano, D. (1991, April).
Psychometric Properties of the MPD. Paper presented at the meeting of the
Southwestern Psychological Association. New Orleans, LA.
Sylcox, K. (1983). Our elderly: Creatives often overlooked. Activities. Adaptation &
Aging, .1(3), 27-38.
Taylor, I.A. (1974). Patterns of creativity and aging. In E. Pfeiffer (Ed.), Successful
Aging.;_ A Conference Report. Durham, NC: Duke University Press, 113-117.
Terman, L. ( 1921). Mental and physical traits of a thousand gifted children. In Terman,
L.(Ed.), Genetic Studies of Genus, L 648. Stanford, CA: Stanford University Press.
109
Thayer, L.O. (1963). Identity: A conceptual, empirical, and methodological study
(Doctoral dissertation, The University of Oklahoma). Dissertation Abstracts
International, 24, 2567.
Torrance, E.P. (1962). Guiding creative talent. Englewood Cliffs, NJ: Prentice-Hall.
Torrance, E.P. (1963). Education and the creative potential. Minneapolis: University of
Minnesota Press.
Torrance, E.P. (1965). Rewarding creative behavior. Englewood Cliffs, NJ: Prentice-
Hall.
Torrance, E.P. (1966). Torrance Tests of Creative Thinking: Norms Technical Manual.
Princeton, New Jersey: Personnel Press.
Torrance, E.P. (1974). Torrance Tests of Creative Thinking: Norms and technical
manual. Bensenville, IL: Scholastic Testing Service.
Torrance, E.P. (1976). Creativity testing in education. Creative Child and Adult
Quarterly, l, 136-148.
'
Torrance, E.P. (1977, Autumn). Creativity and the older adult. The Creative Child And
Adult Quarterly, 2, 13 6-144.
Torrance, E.P. (1979a). The search for satori and creativity. Buffalo, NY: Creative
Education Foundation.
Torrance, E.P. (1979b). Unique needs of the creative child and adult. In A.H. Passow
(Ed.), The Gifted .and Talented: Their Education and Development (pp. 352-371).
Chicago: National Society for the Study of Education (78th Yearbook, Part I).
llO
Torrance, E.P. (1981). Norms-technical manual: Demonstrator form for the Torrance
Tests Qf Creative Thinking (A teaching/training instrument). Atlanta, GA: Georgia
Studies of Creative Behavior
Torrance, E.P. (1984). Mentor relationships. Buffalo, NY: Beady Limited.
Torrance, E.P., & Ball, O.E. (1984). TTCT streamlined (revised) manual including
norms and directions for administering and scoring Figural A and B. Bensenville, IL:
Scholastic Testing Service.
Torrance, E.P. (1987). Using !he Torrance Tests of Creative Thinking to gukk the
teaching Qf creative behavior. Bensenville, IL: Scholastic Testing Service, Inc.
Torrance, E.P. (1988). The nature of creativity as manifest in its testing. In R.J.
Sternberg (Ed.). The nature of creativity: Contemporary psychological perspectives
(pp. 43-75). New York: Cambridge University Press.
Torrance, E.P. (1990). Torrance Tests of Creative Thinking: Norms-Technical Manual
for Figural (Streamlined) Forms A &..R. Bensenville, IL: Scholastic Testing Service.
Torrance, E.P. (1991). Torrance Tests of Creative Thinking. Bensenville, IL: Scholastic
Testing Service.
Torrance, E.P., Ball, O.E., & Safier, H.T. (1992). Torrance Tests of Creative Thinking:
Streamlined Scoring Guide for Figural A and B. Bensenville, IL: Scholastic Testing
Service.
Tre:ffinger, D.J. (1980). The progress and peril of identifying creative talent among gifted
and talented students. Journal of Creative Behavior, 14, 20-34.
111
Treffinger, D.J. (1985). Torrance Tests of Creative Thinking. In J.V. Mitchell, Jr. (Ed.),
The Ninth Mental Measurement Yearbook (pp. 1632-1634). Lincoln, NE: Burns
Institute of Mental Measurements. 'f),
U.S. Department of Commerce (1992). Statistical Abstract of the United States 1992:
112 Edition.
Vaillant, G.E., & Vaillant, C.O. (1990). Determinants and consequences of creativity in a
cohort of gifted women. Psychology of Women Quarterly, 14, 607-616.
Vinacke, W.E. (1952). The psychology of thinking. New York: McGraw-Hill.
Wallach, M.A., & Wing, C. (1969). The talented student: A validation of the creativity-
intelligence distinction. New York: Holt, Rinehart, and Winston.
Wallas, G. (1926). The art of thought. New York: Harcourt, Brace.
Wehner, L., Csikszentmihalyi, M., & Magyari-Beck, I. (1991). Current approaches used
in studying creativity: An exploratory investigation. Creativity Research Journal,
1(3), 261-271.
Wessman, A.E., & Ricks, D.F. (1966). Mood and Personality. New York: Holt,
Rinehart, and Winston.
Whitbourne, S.K. (1976). Test anxiety in the elderly and young adults. International
Journal of Aging and Human Development, 1(3), 201-209.

APPENDICES
112

APPENDIX A
CONSENT FORM
113

Date:
CONSENT FORM
I, , voluntarily agree to be in ---------------the study. I understand that:
1) I will be asked to answer questions on paper; 2) I will also be asked to complete some incomplete drawings; 3) answering these questions will take about one hour; 4) my answers to the questions will help people understand how
older adults feel about themselves and how creative they are; 5) not being in the study is completely OK, and nothing at all
will happen to me if I'm not in the study; 6) my name will NOT appear on any of the forms; 7) no one except the people doing the study will see any of my
answers to the questions; 8) I don't have to be in the study, and I can quit any time I
want to; 9) I can call Dr. Janice Williams at (405) 744-9457 if I want to
know more about the study, or I can call University Research Services, 001 Life Sciences East, Oklahoma State University,
(405) 744-6983.
I have read this form and choose to be in the study. I can ask questions now about the study if I don't understand.
Signature: -----------------------

APPENDIXB
DEMOGRAPIIlC INFORMATION QUESTIONNAIRE
115

DEMOGRAPHIC INFORMATION QUESTIONNAIRE
Directions: Please respond to the following questions as accurately as possible with only one check per question. There are no right or wrong answers to · these questions.
1. Age: 50-55 -- 56-60 -- 61-65 -- 66-70 --71-75 76-80 81-85 over 85 -- -- -- --
2. Gender: Female Male
3. Current Living Arrangement: --living with spouse
--living with friend(s)
--living alone/widow-widower
--living alone/never married __ living with family members
--Ii ving in retirement community
Other --(please specify ) -----
4. Ethnic Background: African American --Asian-Pacific Islander --Caucasian --
--Mexican American/Hispanic Native American Indian --
--Other(please specify )
5. Are you currently retired? YES NO if yes, approximately how long have you been retired?
YEARS MONTHS --
6. How would you rate your current health on the following scale? Please circle the appropriate number on the scale below.
1 - 2 - 3 - 4 - 5 - 6 - 7 - 8 - 9
7. What are some of the creative accomplishments in your life?
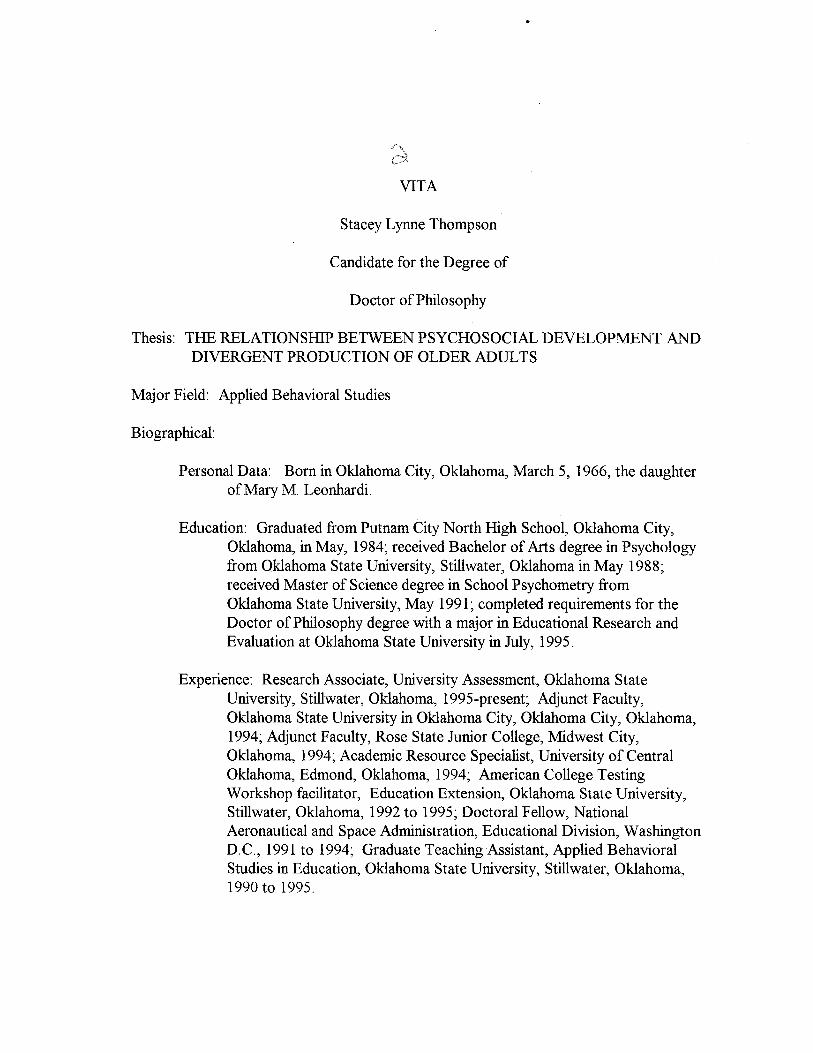
VITA
Stacey Lynne Thompson
Candidate for the Degree of
Doctor of Philosophy
Thesis: THE RELATIONSHIP BETWEEN PSYCHOSOCIAL DEVELOPI\1ENT AND DIVERGENT PRODUCTION OF OLDER ADULTS
Major Field: Applied Behavioral Studies
Biographical:
Personal Data: Born in Oklahoma City, Oklahoma, March 5, 1966, the daughter of Mary M. Leonhardi.
Education: Graduated from Putnam City North High School, Oklahoma City, Oklahoma, in May, 1984; received Bachelor of Arts degree in Psychology from Oklahoma State University, Stillwater, Oklahoma in May 1988; received Master of Science degree in School Psychometry from Oklahoma State University, May 1991; completed requirements for the Doctor of Philosophy degree with a major in Educational Research and Evaluation at Oklahoma State University in July, 1995.
Experience: Research Associate, University Assessment, Oklahoma State University, Stillwater, Oklahoma, 1995-present; Adjunct Faculty, Oklahoma State University in Oklahoma City, Oklahoma City, Oklahoma, 1994; Adjunct Faculty, Rose State Junior College, Midwest City, Oklahoma, 1994; Academic Resource Specialist, University of Central Oklahoma, Edmond, Oklahoma, 1994; American College Testing Workshop facilitator, Education Extension, Oklahoma State University, Stillwater, Oklahoma, 1992 to 1995; Doctoral Fellow, National Aeronautical and Space Administration, Educational Division, Washington D.C., 1991 to 1994; Graduate Teaching Assistant, Applied Behavioral Studies in Education, Oklahoma State University, Stillwater, Oklahoma, 1990 to 1995.

Professional Affiliations: American Assessment for Higher Education, American Educational Research Association, Mid-Western Education Research Association, Southwestern Psychological Association, International Society for Educational Planning.
OKLAHOMA STATE UNIVERSITY INSTITUTIONAL REVIEW BOARD
FOR HUMAN SUBJECTS RESEARCH
Date: 06-11-93 IRE#: ED-93-094
Proposal Title: IMPACT OF PSYCHOSOCIAL DEVELOPMENT ON THE CREATIVITY OF OLDER ADULTS
Principal Investigator(s): Janice Williams, Stacey Ross
Reviewed and Processed as: Expedited
Approval Status Recommended by Reviewer(s): Approved with Provisions
APPROVAL STATUS SUBJECT TO REVIEW BY FULL INSTITUTIONAL REVIEW BOARD AT NEXT MEETING. APPROVAL STATUS PERIOD VALID FOR ONE CALENDAR YEAR AFTER WHICH A CONTINUATION OR RENEWAL REQUEST IS REQUIRED TO BE SUBMITTED FOR BOARD APPROVAL. ANY MODIFICATIONS TO APPROVED PROJECT MUST ALSO BE SUBMITTED FOR APPROVAL.
Comments, Modifications/Conditions for Approval or Reasons for Deferral or Disapproval are as follows:
Modifications Requested:
The consent form should be c:ilittle more specific. Would it be possible to inform the subjects that the study is about creativity without biasing the results? The subjects should be told they will be asked to draw/sketch some figures.
Typo: Question 98, guilt or quilt?
PLEASE SUBMIT MODIFICATIONS TO BETH MCTERNAN, 005 LSE, X45700. DO NOT PROCEED WITH THIS STUDY PRIOR TO RECEIVING FINAL APPROVAL.
Signature: Date: June 11, 1993
Board
Date: 06-16-93
OKLAHOMA STATE UNIVERSITY INSTITUTIONAL REVIEW BOARD
FOR HUMAN SUBJECTS RESEARCH
IRB#: ED-93-094
Proposal Title: IMPACT OF PSYCHOSOCIAL DEVELOPMENT ON THE CREATIVITY OF OLDER ADULTS
Principal Investigator(s): J. Williams, Stacey Ross
Reviewed and Processed as: Modifications
Approval Status Recommended by Reviewer(s): Approved
APPROVAL STATUS SUBJECT TO REVIEW BY FULL INSTITUTIONAL REVIEW BOARD AT NEXT MEETING. APPROVAL STATUS PERIOD VALID FOR ONE CALENDAR YEAR AFTER WHICH A CONTINUATION OR RENEWAL REQUEST IS REQUIRED TO BE SUBMITTED FOR BOARD APPROVAL. ANY MODIFICATIONS TO APPROVED PROJECT MUST ALSO BE SUBMITTED FOR APPROVAL.
Comments, Modifications/Conditions for Approval or Reasons for Deferral or Disapproval are as follows:
MODIFICATIONS RECEIVED AND APPROVED
Signature: Date: June 17, 1993


