Embed Size (px)
Citation preview
UNIVERSITY OF OKLAHOMA
GRADUATE COLLEGE
EXPERIMENTAL STUDY OF THE RHEOLOGY AND STABILITY BEHAVIOUR
OF SURFACTANT STABILIZED WATER-IN-OIL EMULSION
A THESIS
SUBMITTED TO THE GRADUATE FACULTY
in partial fulfillment of the requirements for the
Degree of
MASTER OF SCIENCE IN NATURAL GAS ENGINEERING AND
MANAGEMENT
By
ISRAEL OLUWATOSIN
Norman, Oklahoma
2016
EXPERIMENTAL STUDY OF THE RHEOLOGY AND STABILITY BEHAVIOUR
OF SURFACTANT STABILIZED WATER-IN-OIL EMULSION
A THESIS APPROVED FOR THE
MEWBOURNE SCHOOL OF PETROLEUM AND GEOLOGICAL ENGINEERING
BY
______________________________
Dr. Fahs Mashhad, Chair
______________________________
Dr. Suresh Sharma
______________________________
Dr. Maysam Pournik

© Copyright by ISRAEL OLUWATOSIN 2016
All Rights Reserved.

Dedication
I dedicate this work first to God almighty for his love, provision and protection. My
deepest gratitude goes also to my parents, brothers and my fiancée for their
indefatigable love and support throughout my life. Thank you all for being there for me
always.

iv
Acknowledgement
I am deeply indebted to my advisor Dr. Fahs Mashhad whose inspiring suggestions and
encouragement helped throughout the research. I also appreciate her team building
approach to research.
My thanks and appreciation goes to Dr. Bryan Grady for training me on how to use the
rotational viscometer in his lab. I appreciate Dr. Suresh Sharma and Dr. Maysam
Pournik for serving on my thesis committee.
I am especially grateful to Sergio Gomez for assisting me in running some of the
experiments. My thanks go also to all my colleagues in the PERL research lab for their
direct and indirect assistance and helpful discussions during my work.
Finally, I like to also appreciate Joe Flenniken and Gary Stowe for their useful
suggestions and also helping me out with the lab equipment. I appreciate you all.
v
Table of Contents
Acknowledgement ........................................................................................................... iv
List of Tables ................................................................................................................. viii
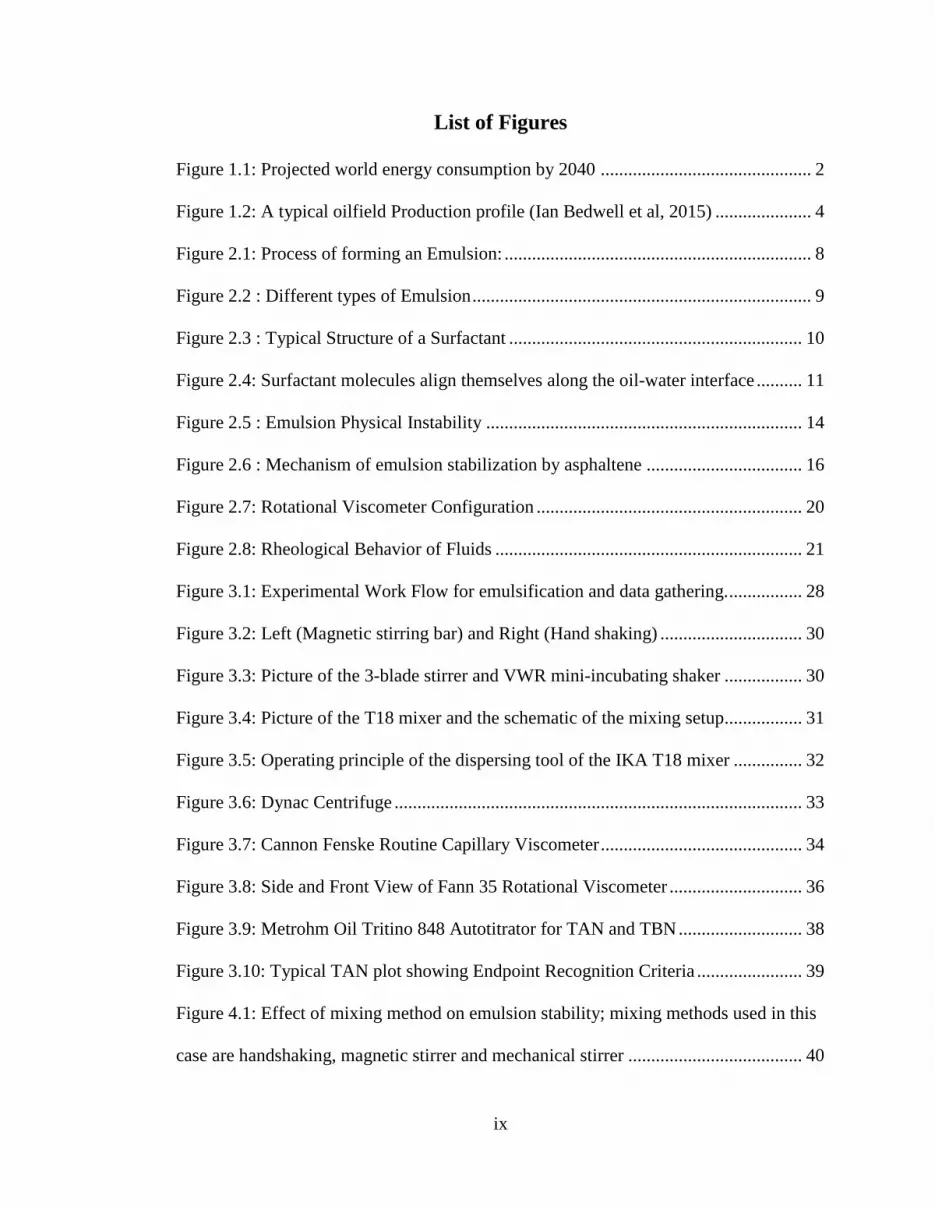
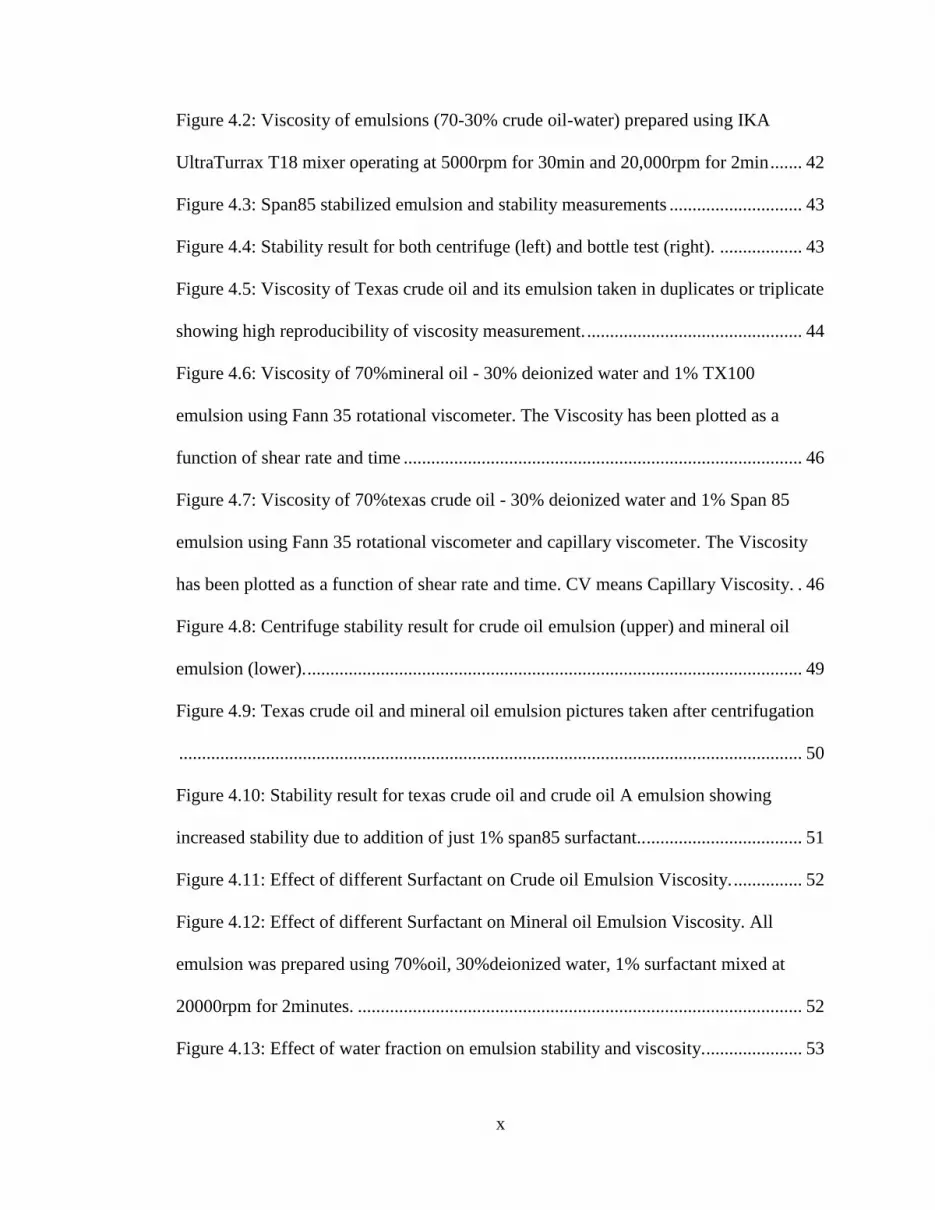
List of Figures .................................................................................................................. ix
Abstract ........................................................................................................................... xii
CHAPTER 1 ..................................................................................................................... 1
INTRODUCTION ............................................................................................................ 1
1.1 Importance of oil and gas in energy generation ............................................. 1
1.2 Oil and gas Recovery mechanisms ................................................................. 1
1.3 Emulsion Challenges associated with crude oil production ........................... 3
1.4 Research Problem Statement .......................................................................... 4
1.5 Research Scope and Objectives ...................................................................... 5
CHAPTER 2 ..................................................................................................................... 7
THEORECTICAL BACKGROUND ............................................................................... 7
2.1 Emulsion ......................................................................................................... 7
2.1.1 Types and Classification of Emulsion ...................................................... 8
2.1.2 Mechanism of Emulsification ................................................................... 8
2.2 Role of Surfactant in Emulsification .............................................................. 9
2.2.1 Hydrophilic Lipophilic Balance (HLB) .................................................. 11
2.3 Breakdown Processes in Emulsions ............................................................. 13
2.4 Water-in-Crude Oil Emulsion Stability Factors ........................................... 13
2.5 Role of Heavy Polar Fractions in Emulsion Stabilization ............................ 15
2.6 Total Acid and Base Number (TAN & TBN) .............................................. 17

vi
2.7 Emulsion Rheology and Viscosity Measurement ......................................... 18
2.7.1 Rheometry .............................................................................................. 18
2.7.2 Emulsion Rheology ................................................................................ 20
2.8 Phase Inversion ............................................................................................. 22
2.9 Emulsion Viscosity Correlations .................................................................. 22
CHAPTER 3 ................................................................................................................... 26
EXPERIMENTAL PROCEDURE ................................................................................. 26
3.1 Experimental Techniques ............................................................................. 26
3.2 Materials ....................................................................................................... 26
3.3 Experimental Work flow .............................................................................. 28
3.4 Emulsification Protocol ................................................................................ 28
3.5 Mixing Method ............................................................................................. 29
3.6 Stability Test ................................................................................................. 32
3.7 Viscosity Measurement ................................................................................ 34
3.7.1 Capillary Viscometer .............................................................................. 34
3.7.2 Washing of the Capillary Viscometer .................................................... 35
3.7.3 Fann 35 Rotational Viscometer .............................................................. 36
3.8 TAN and TBN Measurements ...................................................................... 37
CHAPTER 4 ................................................................................................................... 40
RESULTS AND DISCUSSION ..................................................................................... 40
This chapter presents and discusses the results of the research ................................ 40
4.1 Mixing method ............................................................................................. 40
4.2 Stability testing ............................................................................................. 42

vii
4.3 Viscosity Measurement ................................................................................ 44
4.3.1 Reproducibility of Viscosity Measurement .................................................. 44
4.3.2 Newtonian and Non-newtonian behavior ..................................................... 45
4.3.3 Comparison between Capillary and Rotational Viscometer ........................ 47
4.4 Effect of various Surfactant on Emulsion Stability and Viscosity ............... 48
4.4.1 Effect of different Surfactant on Emulsion Stability .............................. 48
4.4.2 Effect of different Surfactant on Emulsion Viscosity ............................ 51
4.5 Effect of Water fraction on Stability and Viscosity ..................................... 52
4.5.1 Time Effect on Emulsion Stability ......................................................... 54
4.6 Effect of Surfactant Concentration on Viscosity, TAN and TBN of crude oil
...................................................................................................................... 56
4.7 Effect of Surfactant Concentration on Viscosity & Stability of Emulsion .. 58
4.8 Effect of TAN and TBN on Emulsion viscosity and Stability ..................... 62
CHAPTER 5 ................................................................................................................... 66
CONCLUSIONS AND RECOMMENDATIONS ......................................................... 66
5.1 Conclusion .................................................................................................... 66
5.2 Recommendation .......................................................................................... 69
References ...................................................................................................................... 70
viii
List of Tables
Table 2.1: Different HLB number of Surfactants and their Application ........................ 12
Table 2.2: Required HLB for Emulsion of different Oils .............................................. 13
Table 3.1: Bulk Properties of Fluids Used at 25oC ........................................................ 27
Table 3.2: Properties of the Surfactants ......................................................................... 27
Table 4.1: Capillary Viscosity of both Mineral oil and Texas crude oil emulsions
measured before and after shearing in a Fann 35 Viscometer ........................................ 47
Table 4.2: TAN and TBN of the Crude Oils .................................................................. 57
ix
List of Figures
Figure 1.1: Projected world energy consumption by 2040 .............................................. 2
Figure 1.2: A typical oilfield Production profile (Ian Bedwell et al, 2015) ..................... 4
Figure 2.1: Process of forming an Emulsion: ................................................................... 8
Figure 2.2 : Different types of Emulsion .......................................................................... 9
Figure 2.3 : Typical Structure of a Surfactant ................................................................ 10
Figure 2.4: Surfactant molecules align themselves along the oil-water interface .......... 11
Figure 2.5 : Emulsion Physical Instability ..................................................................... 14
Figure 2.6 : Mechanism of emulsion stabilization by asphaltene .................................. 16
Figure 2.7: Rotational Viscometer Configuration .......................................................... 20
Figure 2.8: Rheological Behavior of Fluids ................................................................... 21
Figure 3.1: Experimental Work Flow for emulsification and data gathering. ................ 28
Figure 3.2: Left (Magnetic stirring bar) and Right (Hand shaking) ............................... 30
Figure 3.3: Picture of the 3-blade stirrer and VWR mini-incubating shaker ................. 30
Figure 3.4: Picture of the T18 mixer and the schematic of the mixing setup ................. 31
Figure 3.5: Operating principle of the dispersing tool of the IKA T18 mixer ............... 32
Figure 3.6: Dynac Centrifuge ......................................................................................... 33
Figure 3.7: Cannon Fenske Routine Capillary Viscometer ............................................ 34
Figure 3.8: Side and Front View of Fann 35 Rotational Viscometer ............................. 36
Figure 3.9: Metrohm Oil Tritino 848 Autotitrator for TAN and TBN ........................... 38
Figure 3.10: Typical TAN plot showing Endpoint Recognition Criteria ....................... 39
Figure 4.1: Effect of mixing method on emulsion stability; mixing methods used in this
case are handshaking, magnetic stirrer and mechanical stirrer ...................................... 40
x
Figure 4.2: Viscosity of emulsions (70-30% crude oil-water) prepared using IKA
UltraTurrax T18 mixer operating at 5000rpm for 30min and 20,000rpm for 2min ....... 42
Figure 4.3: Span85 stabilized emulsion and stability measurements ............................. 43
Figure 4.4: Stability result for both centrifuge (left) and bottle test (right). .................. 43
Figure 4.5: Viscosity of Texas crude oil and its emulsion taken in duplicates or triplicate
showing high reproducibility of viscosity measurement. ............................................... 44
Figure 4.6: Viscosity of 70%mineral oil - 30% deionized water and 1% TX100
emulsion using Fann 35 rotational viscometer. The Viscosity has been plotted as a
function of shear rate and time ....................................................................................... 46
Figure 4.7: Viscosity of 70%texas crude oil - 30% deionized water and 1% Span 85
emulsion using Fann 35 rotational viscometer and capillary viscometer. The Viscosity
has been plotted as a function of shear rate and time. CV means Capillary Viscosity. . 46
Figure 4.8: Centrifuge stability result for crude oil emulsion (upper) and mineral oil
emulsion (lower). ............................................................................................................ 49
Figure 4.9: Texas crude oil and mineral oil emulsion pictures taken after centrifugation
........................................................................................................................................ 50
Figure 4.10: Stability result for texas crude oil and crude oil A emulsion showing
increased stability due to addition of just 1% span85 surfactant.. .................................. 51
Figure 4.11: Effect of different Surfactant on Crude oil Emulsion Viscosity. ............... 52
Figure 4.12: Effect of different Surfactant on Mineral oil Emulsion Viscosity. All
emulsion was prepared using 70%oil, 30%deionized water, 1% surfactant mixed at
20000rpm for 2minutes. ................................................................................................. 52
Figure 4.13: Effect of water fraction on emulsion stability and viscosity. ..................... 53

xi
Figure 4.14:Emulsion pictures at different water fraction immediately after preparation
(upper) and 48 hours after (lower) .................................................................................. 55
Figure 4.15: Viscosity as a function of water fraction and time. ................................... 56
Figure 4.16: Effect of increasing surfactant concentration on the viscosity of texas crude
oil emulsion .................................................................................................................... 57
Figure 4.17: Effect of increasing surfactant concentration on the TAN and TBN of texas
crude oil and crude oil A ................................................................................................ 58
Figure 4.18: Relative viscosity at different water fraction for changing surfactant
concentration.. ................................................................................................................ 59
Figure 4.19: Effect of different surfactant concentration on stability of emulsion.. ...... 60
Figure 4.20: Relative viscosity against water fraction for crude oil A. .......................... 61
Figure 4.21: Stability of span85 stabilized crude oil A emulsion at different water
fraction. ........................................................................................................................... 61
Figure 4.22: Pictures of texas crude oil emulsion after 45minutes in a centrifuge. On the
left is 0.5%vol span85 and on the right is 5%vol span85 concentration ........................ 62
Figure 4.23: TAN of texas crude oil emulsion at different water fractions.................... 63
Figure 4.24: Relative viscosity against TAN at different water fraction for texas crude
oil emulsion. ................................................................................................................... 64
Figure 4.25: Effect of TAN on the stability of texas crude oil emulsion at different water
fractions. ......................................................................................................................... 65
xii
Abstract
Formation water almost always comes out with crude oil production. Under extreme
mixing and high turbulence provided by pumps, valves, chokes and pipelines in the
production system, water and oil can mix to form highly stable and viscous emulsions.
These emulsions create flow assurance and separation problems in deep water
production facilities because of the increasing viscosity with water fraction. In order to
predict the changes in viscosity and stability with time it is important to understand the
flow behavior of these emulsion in pipelines. It is also important to understand how the
acid and bases interact with the other surface active components to stabilize emulsion.
This thesis focuses on characterizing the behavior of surfactant stabilized crude oil
emulsion with regards to stability, viscosity, total acid and base number. The outcome
of this study will be used to study the flow of emulsions in pipelines under different
conditions.
A reproducible emulsification protocol was established. Experimental data showed that
span85 surfactant produces very stable emulsion with the crude oil. Increasing the
surfactant concentration only stabilizes the emulsion up to certain amount before
additional amount destabilizes the emulsion. Adding surfactant at low concentration
reduces the viscosity of the emulsion by as much as 75% when compared to emulsion
without any surfactant. Viscosity of the emulsion plays a significant role in emulsion
stabilization. Viscosity profile with increasing total acid number shows a minimum
beyond which the viscosity increases with increasing total acid number. For a given
water fraction, there is a range of total acid number where the acid stabilizes the
emulsion. Outside of this range the acid destabilize the emulsion.
1
CHAPTER 1
INTRODUCTION
1.1 Importance of oil and gas in energy generation
Energy is fundamental to human existence. From day to day we make use of energy
without even thinking about it. Gasoline, diesel and compressed natural gas are all used
in our automobiles for transportation, cooking our food, heating our homes and
commercial building and also for generating electricity. Petroleum oil and gas also
provide basic raw materials for plastics, paints fertilizer, insecticides, soaps industries
etc. Providing raw materials to these industries is very important to modern day
industrial growth. It is perhaps the single most substance consumed in our modern
society (Speight, 2007). Energy from fossil fuels such as crude oil and gas supply over a
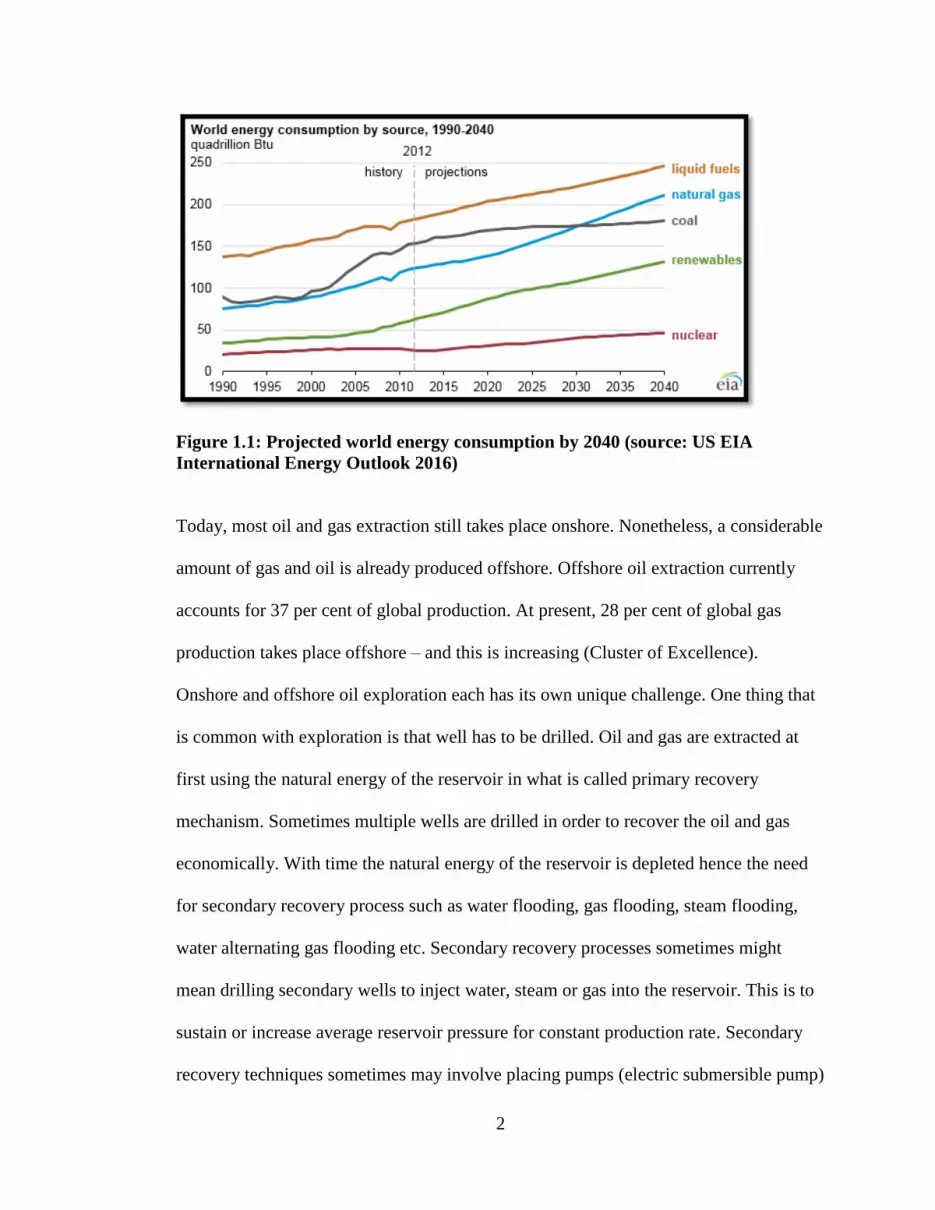
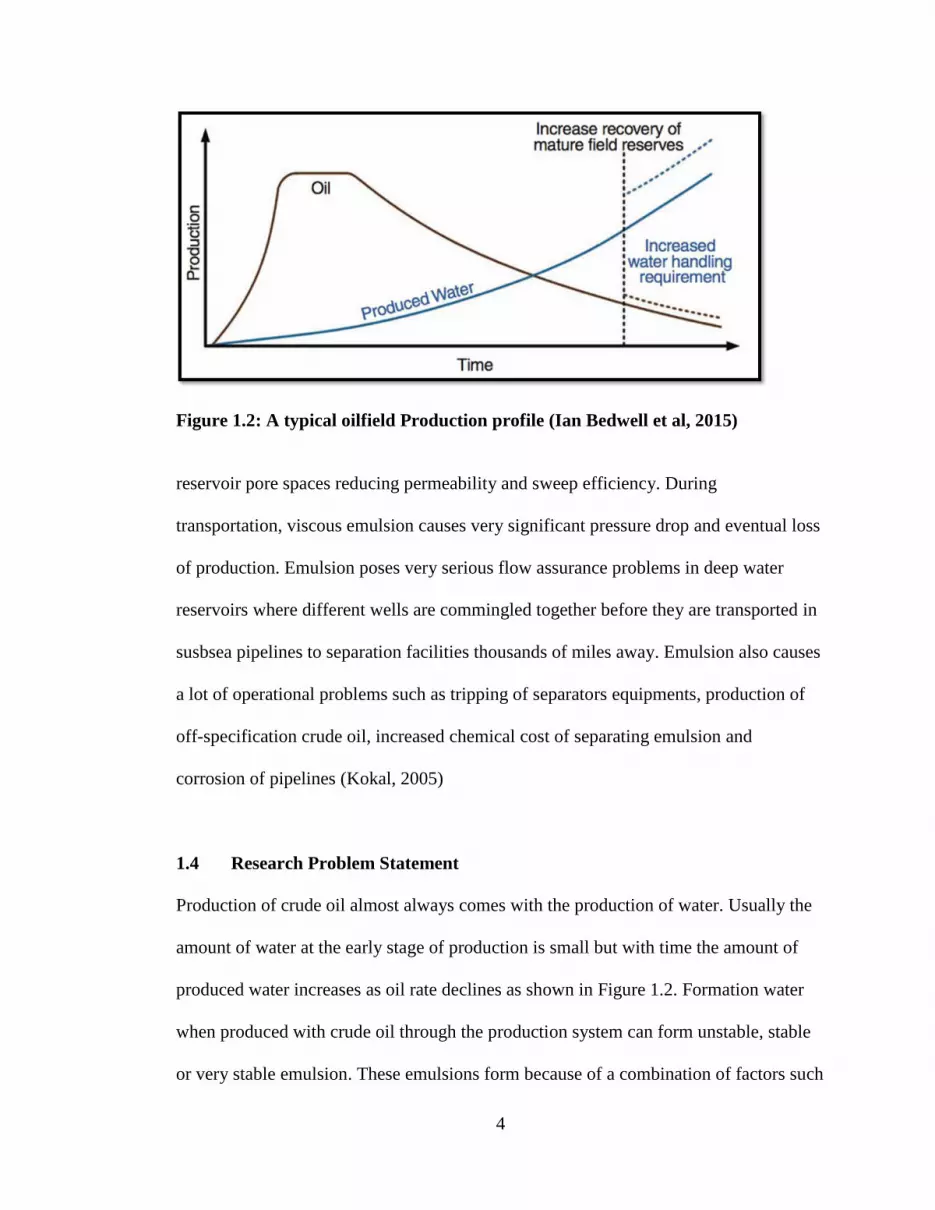
half of the world’s total energy demand. The trend in energy use is expected to increase
worldwide as the population continues to grow (Petrecca, 2014). The United States
Energy Information Administration, (EIA, 2016) energy outlook projects that the
world’s energy consumption will grow by 48% from 2012 to 2040 as shown in Figure
1.1. Over the next two decades nearly all of these growth is forecasted to come from
developing world (Wolfram et al, 2012).
1.2 Oil and gas Recovery mechanisms
Oil and gas is produced today in almost every part of the world. From a few barrels per
day to several millions of barrels in shallow 20-meter-deep reservoir to 3000-meter-
deep water reservoirs (Devold, 2009). Production usually takes place either onshore or
offshore. Offshore productions can either be from shallow or deep water fields.
2
Figure 1.1: Projected world energy consumption by 2040 (source: US EIA
International Energy Outlook 2016)
Today, most oil and gas extraction still takes place onshore. Nonetheless, a considerable
amount of gas and oil is already produced offshore. Offshore oil extraction currently
accounts for 37 per cent of global production. At present, 28 per cent of global gas
production takes place offshore – and this is increasing (Cluster of Excellence).
Onshore and offshore oil exploration each has its own unique challenge. One thing that
is common with exploration is that well has to be drilled. Oil and gas are extracted at
first using the natural energy of the reservoir in what is called primary recovery
mechanism. Sometimes multiple wells are drilled in order to recover the oil and gas
economically. With time the natural energy of the reservoir is depleted hence the need
for secondary recovery process such as water flooding, gas flooding, steam flooding,
water alternating gas flooding etc. Secondary recovery processes sometimes might
mean drilling secondary wells to inject water, steam or gas into the reservoir. This is to
sustain or increase average reservoir pressure for constant production rate. Secondary
recovery techniques sometimes may involve placing pumps (electric submersible pump)
3
downhole to provide additional energy to pump the oil to the surface. It may also
involve gas injection to provide artificial lift of the oil to the surface. Primary and
secondary recovery methods including water flooding or reinjection of produced natural
gas, produce on the average about one-third of the original oil in place (OOlP).
However, by applying the tertiary recovery (commonly called Enhanced Oil Recovery,
EOR), production could reach 40 to 60% of oil in the reservoir (Abubaker et al, 2015).
1.3 Emulsion Challenges associated with crude oil production
Emulsion constitute a major challenge in all aspect of crude oil production and
processing. One of the biggest flow assurance problems associated with crude oil
production is the formation of stable and viscous water in oil emulsion. This is
particularly true for deep water production. Emulsion is usually not a problem in the
initial stage of the life of a reservoir because the amount of produced water is so little.
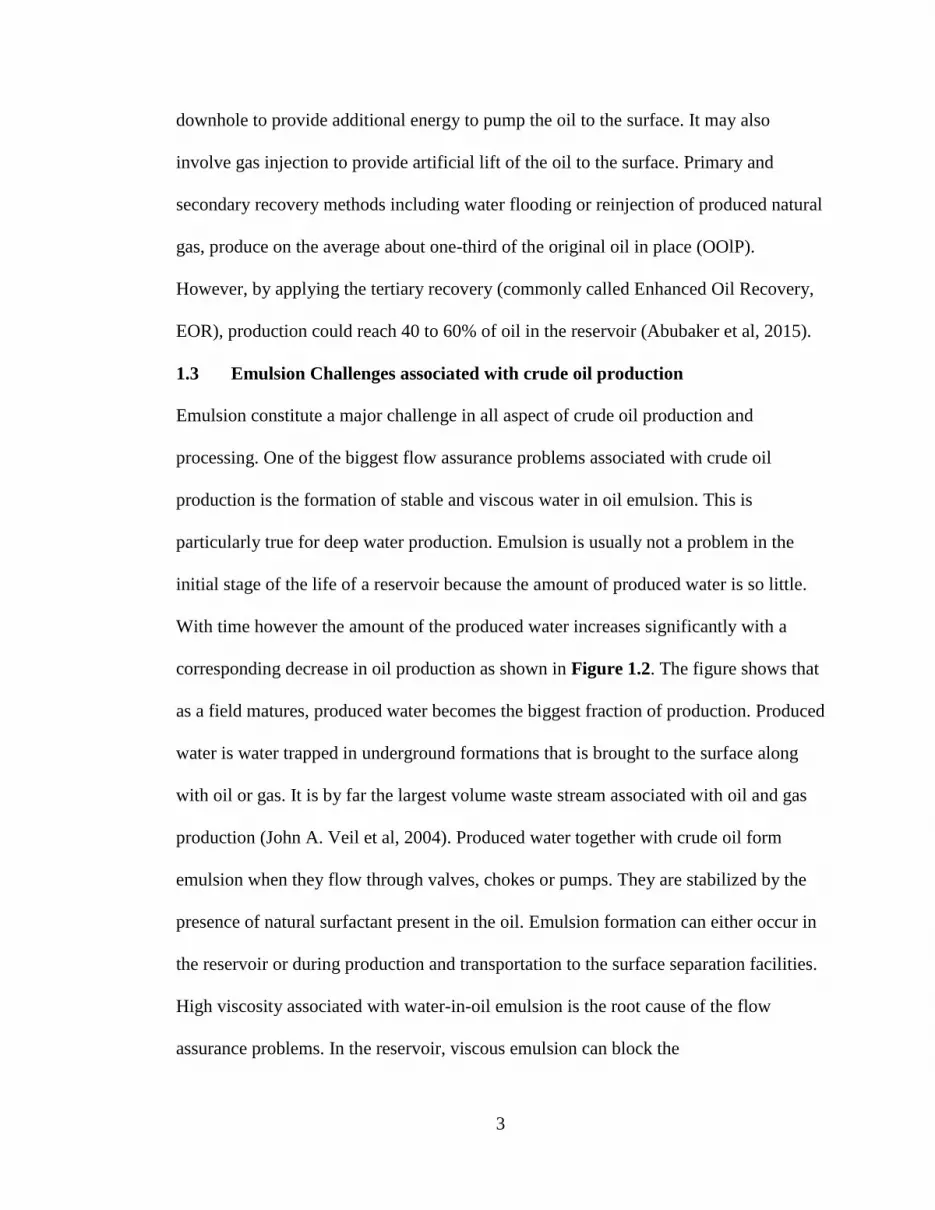
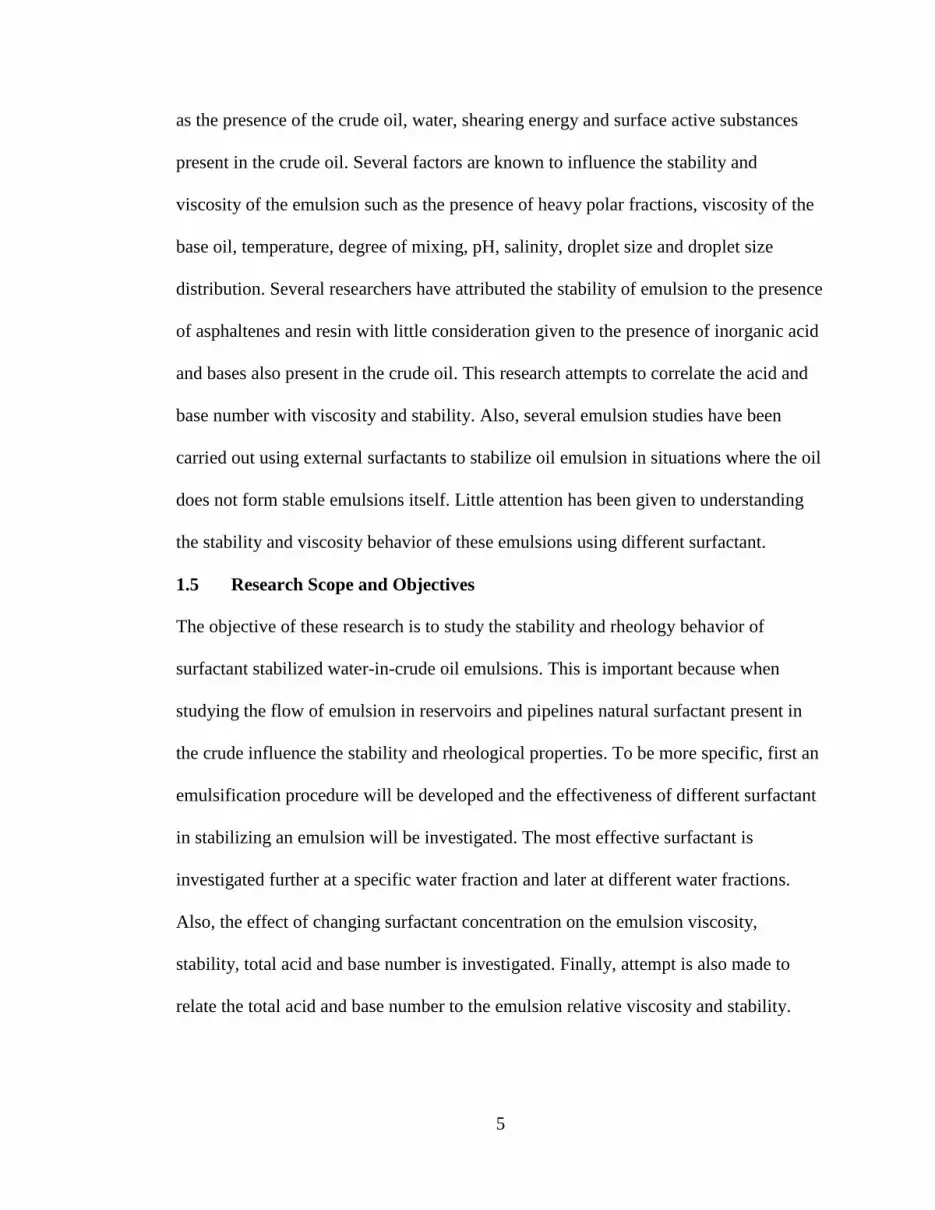
With time however the amount of the produced water increases significantly with a
corresponding decrease in oil production as shown in Figure 1.2. The figure shows that
as a field matures, produced water becomes the biggest fraction of production. Produced
water is water trapped in underground formations that is brought to the surface along
with oil or gas. It is by far the largest volume waste stream associated with oil and gas
production (John A. Veil et al, 2004). Produced water together with crude oil form
emulsion when they flow through valves, chokes or pumps. They are stabilized by the
presence of natural surfactant present in the oil. Emulsion formation can either occur in
the reservoir or during production and transportation to the surface separation facilities.
High viscosity associated with water-in-oil emulsion is the root cause of the flow
assurance problems. In the reservoir, viscous emulsion can block the
4
Figure 1.2: A typical oilfield Production profile (Ian Bedwell et al, 2015)
reservoir pore spaces reducing permeability and sweep efficiency. During
transportation, viscous emulsion causes very significant pressure drop and eventual loss
of production. Emulsion poses very serious flow assurance problems in deep water
reservoirs where different wells are commingled together before they are transported in
susbsea pipelines to separation facilities thousands of miles away. Emulsion also causes
a lot of operational problems such as tripping of separators equipments, production of
off-specification crude oil, increased chemical cost of separating emulsion and
corrosion of pipelines (Kokal, 2005)
1.4 Research Problem Statement
Production of crude oil almost always comes with the production of water. Usually the
amount of water at the early stage of production is small but with time the amount of
produced water increases as oil rate declines as shown in Figure 1.2. Formation water
when produced with crude oil through the production system can form unstable, stable
or very stable emulsion. These emulsions form because of a combination of factors such
5
as the presence of the crude oil, water, shearing energy and surface active substances
present in the crude oil. Several factors are known to influence the stability and
viscosity of the emulsion such as the presence of heavy polar fractions, viscosity of the
base oil, temperature, degree of mixing, pH, salinity, droplet size and droplet size
distribution. Several researchers have attributed the stability of emulsion to the presence
of asphaltenes and resin with little consideration given to the presence of inorganic acid
and bases also present in the crude oil. This research attempts to correlate the acid and
base number with viscosity and stability. Also, several emulsion studies have been
carried out using external surfactants to stabilize oil emulsion in situations where the oil
does not form stable emulsions itself. Little attention has been given to understanding
the stability and viscosity behavior of these emulsions using different surfactant.
1.5 Research Scope and Objectives
The objective of these research is to study the stability and rheology behavior of
surfactant stabilized water-in-crude oil emulsions. This is important because when
studying the flow of emulsion in reservoirs and pipelines natural surfactant present in
the crude influence the stability and rheological properties. To be more specific, first an
emulsification procedure will be developed and the effectiveness of different surfactant
in stabilizing an emulsion will be investigated. The most effective surfactant is
investigated further at a specific water fraction and later at different water fractions.
Also, the effect of changing surfactant concentration on the emulsion viscosity,
stability, total acid and base number is investigated. Finally, attempt is also made to
relate the total acid and base number to the emulsion relative viscosity and stability.
6
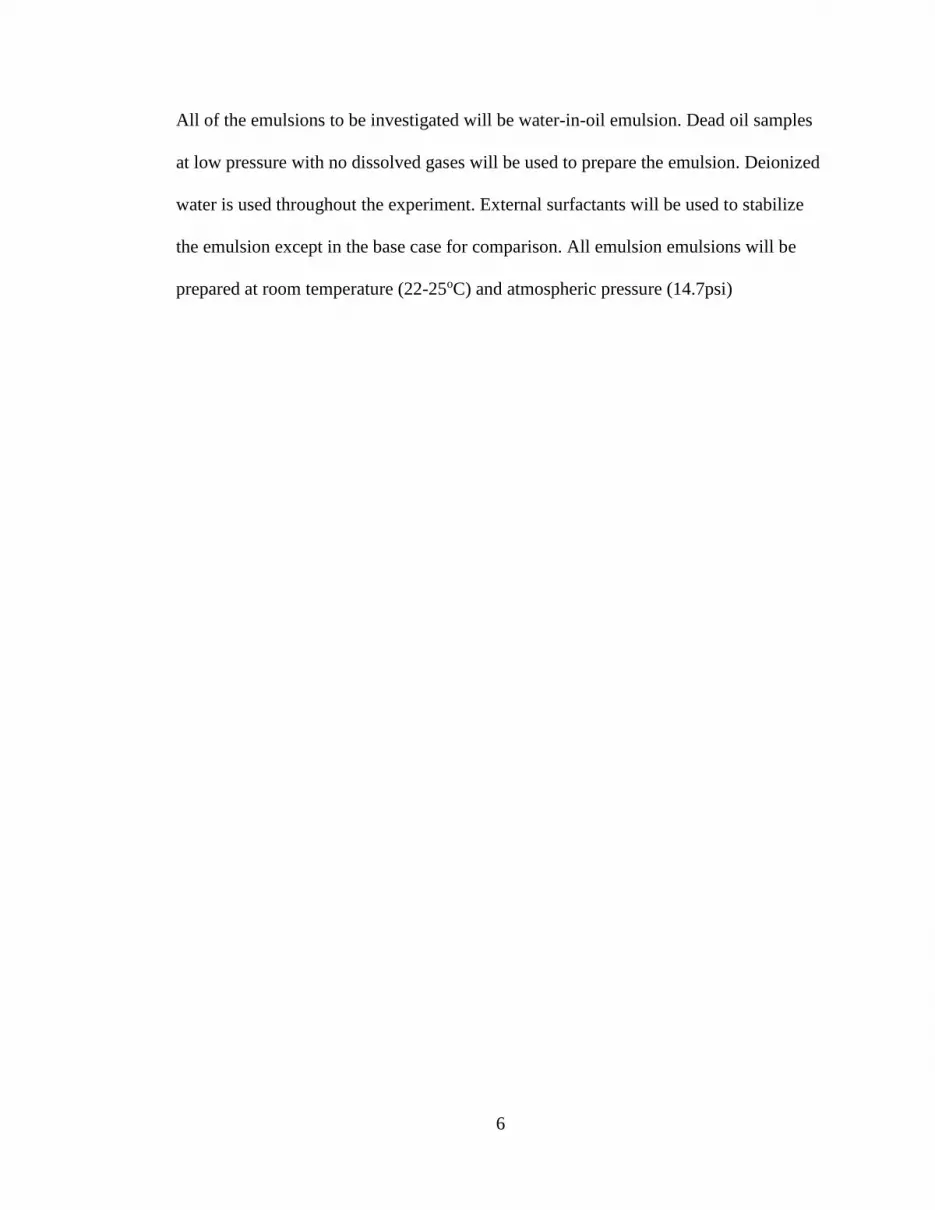
All of the emulsions to be investigated will be water-in-oil emulsion. Dead oil samples
at low pressure with no dissolved gases will be used to prepare the emulsion. Deionized
water is used throughout the experiment. External surfactants will be used to stabilize
the emulsion except in the base case for comparison. All emulsion emulsions will be
prepared at room temperature (22-25oC) and atmospheric pressure (14.7psi)

7
CHAPTER 2
THEORECTICAL BACKGROUND
2.1 Emulsion
Emulsions are colloids in which one phase is dispersed in another phase. The dispersed
phase is called the internal phase while the other phase is called the external or
continuous phase. In order to have an emulsion one of the two liquid phases must be
dispersed in the other as small droplets. The droplet of the dispersed phase is suspended
in the continuous phase because of the resistance of the droplets to coalesce and
separate. The resistance to separate (stability) is usually because of the presence of
agents at the interface of the two phases. Emulsion are commonly encountered in our
daily life such as in milk, yoghurt, mayonnaise, butter, cream, paints, pharmaceutical
etc. To prepare an emulsions oil, water, surfactant, and energy are needed (Tadros,
2013). Each of these components play a significant role in the formation, type, stability
and properties of the emulsion. Emulsions are generally classified as either macro,
micro or nano emulsions depending on the particle size of the dispersed phase. When
the dispersed droplets are larger than 0.1μm, the emulsion is a macroemulsion
(Schramm, 1992). Microemulsion have dispersed particle size less than 10nm and are
thermodynamically stable. Commonly encountered emulsions are macroemulsions
which are thermodynamically unstable but kinetically stable. They are
thermodynamically unstable because the contact between the two phases i.e. water and
oil molecule is unfavorable hence they will always break down over time. This break
down results in free energy needed to create the interfacial tension (Tadros, 2009).
8
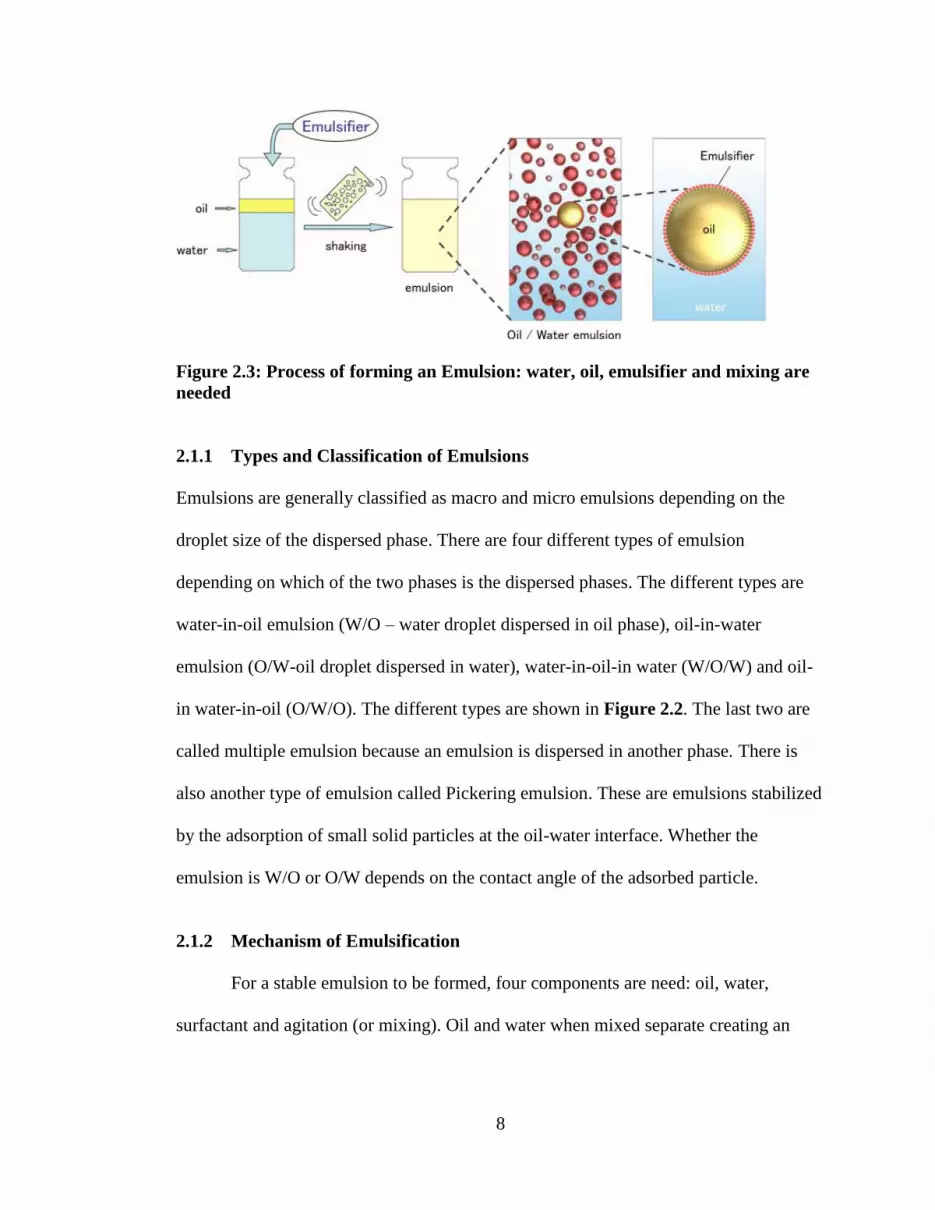
Figure 2.3: Process of forming an Emulsion: water, oil, emulsifier and mixing are
needed
2.1.1 Types and Classification of Emulsions
Emulsions are generally classified as macro and micro emulsions depending on the
droplet size of the dispersed phase. There are four different types of emulsion
depending on which of the two phases is the dispersed phases. The different types are
water-in-oil emulsion (W/O – water droplet dispersed in oil phase), oil-in-water
emulsion (O/W-oil droplet dispersed in water), water-in-oil-in water (W/O/W) and oil-
in water-in-oil (O/W/O). The different types are shown in Figure 2.2. The last two are
called multiple emulsion because an emulsion is dispersed in another phase. There is
also another type of emulsion called Pickering emulsion. These are emulsions stabilized
by the adsorption of small solid particles at the oil-water interface. Whether the
emulsion is W/O or O/W depends on the contact angle of the adsorbed particle.
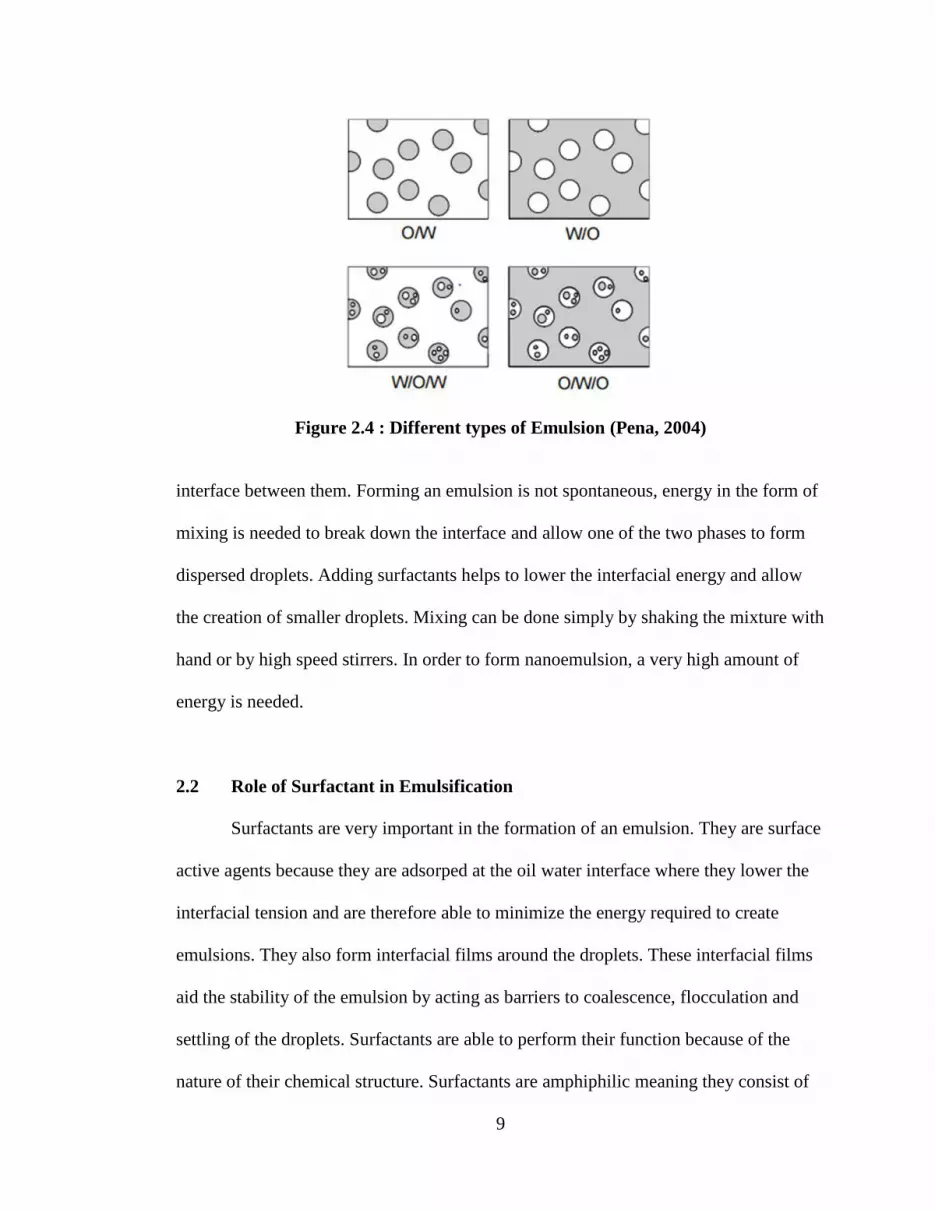
2.1.2 Mechanism of Emulsification
For a stable emulsion to be formed, four components are need: oil, water,
surfactant and agitation (or mixing). Oil and water when mixed separate creating an
9
Figure 2.4 : Different types of Emulsion (Pena, 2004)
interface between them. Forming an emulsion is not spontaneous, energy in the form of
mixing is needed to break down the interface and allow one of the two phases to form
dispersed droplets. Adding surfactants helps to lower the interfacial energy and allow
the creation of smaller droplets. Mixing can be done simply by shaking the mixture with
hand or by high speed stirrers. In order to form nanoemulsion, a very high amount of
energy is needed.
2.2 Role of Surfactant in Emulsification
Surfactants are very important in the formation of an emulsion. They are surface
active agents because they are adsorped at the oil water interface where they lower the
interfacial tension and are therefore able to minimize the energy required to create
emulsions. They also form interfacial films around the droplets. These interfacial films
aid the stability of the emulsion by acting as barriers to coalescence, flocculation and
settling of the droplets. Surfactants are able to perform their function because of the
nature of their chemical structure. Surfactants are amphiphilic meaning they consist of

10
both a non-polar hydrophobic tail (water hating) and a polar hydrophilic head (water
loving) as seen in Figure 2.5. The head and tail of the surfactant align themselves in the
phases in which they are soluble. The surfactant molecules align themselves at the
interface until the critical micelle concentration (CMC). At CMC, the surfactant
molecule with a little mixing begin to form micelles around the dispersed droplets as
shown in Figure 2.6
Figure 2.5 : Typical Structure of a Surfactant (Petroleum Engineering Handbook)
There are two different classes of surfactant based on their behavior in aqueous
solution: Ionic (anionic and cationic) and Nonionic. Anionic Surfactants are dissociated
in water in an amphiphilic anion, and a cation (which in general is an alkaline metal or a
quaternary ammonium). Examples include lauryl sulphate, alkylbenzene sulfonates,
soaps etc. Cationic Surfactants dissociates in water into an amphiphilic cation and an
anion (mostly halogen). Non-ionic surfactant do not dissociate in water. Their
hydrophilic group are either esters, alcohol, phenol, ether or amide (Salager, 2002)
11
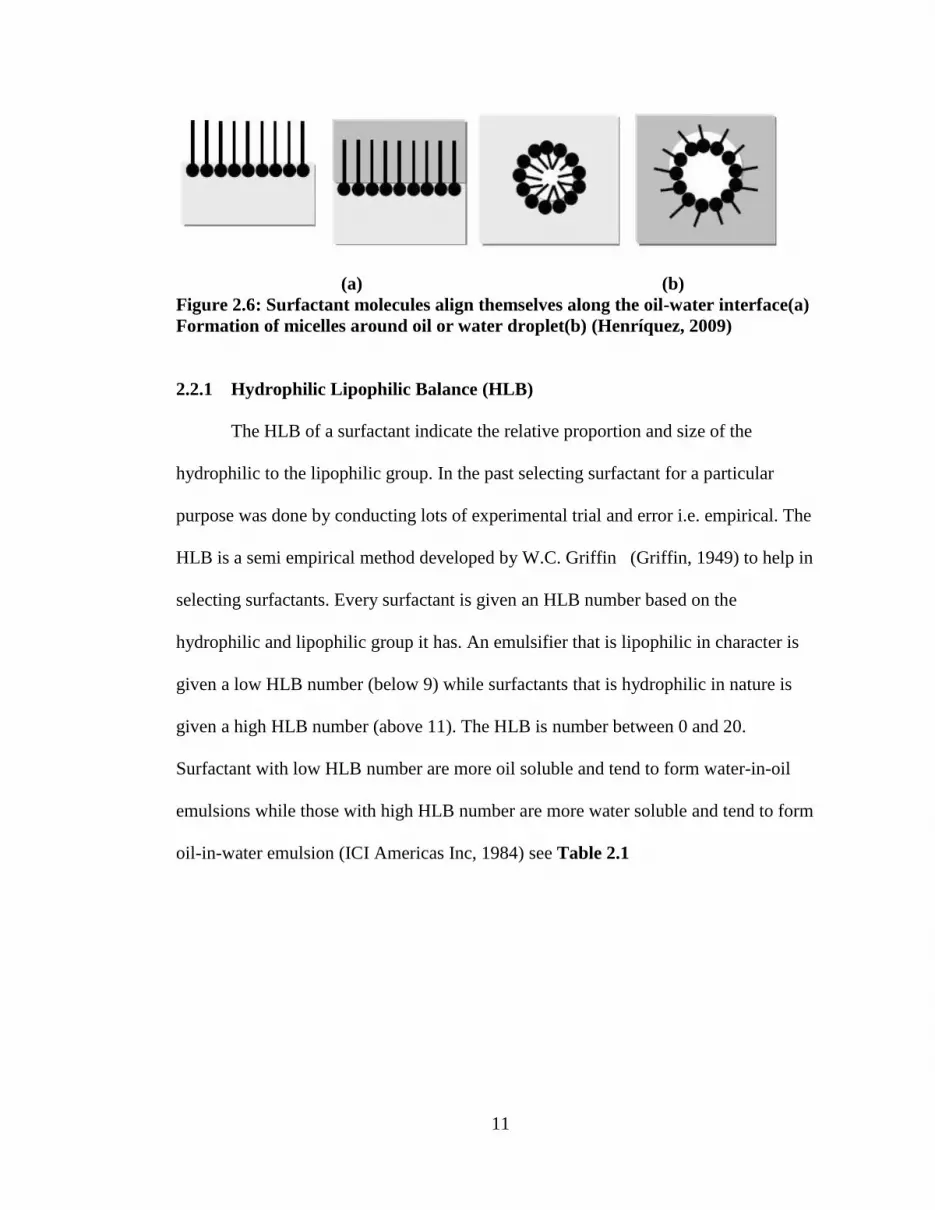
(a) (b)
Figure 2.6: Surfactant molecules align themselves along the oil-water interface(a)
Formation of micelles around oil or water droplet(b) (Henríquez, 2009)
2.2.1 Hydrophilic Lipophilic Balance (HLB)
The HLB of a surfactant indicate the relative proportion and size of the
hydrophilic to the lipophilic group. In the past selecting surfactant for a particular
purpose was done by conducting lots of experimental trial and error i.e. empirical. The
HLB is a semi empirical method developed by W.C. Griffin (Griffin, 1949) to help in
selecting surfactants. Every surfactant is given an HLB number based on the
hydrophilic and lipophilic group it has. An emulsifier that is lipophilic in character is
given a low HLB number (below 9) while surfactants that is hydrophilic in nature is
given a high HLB number (above 11). The HLB is number between 0 and 20.
Surfactant with low HLB number are more oil soluble and tend to form water-in-oil
emulsions while those with high HLB number are more water soluble and tend to form
oil-in-water emulsion (ICI Americas Inc, 1984) see Table 2.1

12
Table 2.1: Different HLB number of Surfactants and their Application
This is in accordance with the Bancroft rule which states that the phase in which
the surfactant is more soluble is usually the continuous phase. HLB values are
additive. The HLB value of a surfactant mixture is the weighted average of the
HLB values for each component as shown below
𝐻𝐿𝐵 = 𝑥1𝐻𝐿𝐵1 + 𝑥2𝐻𝐿𝐵2
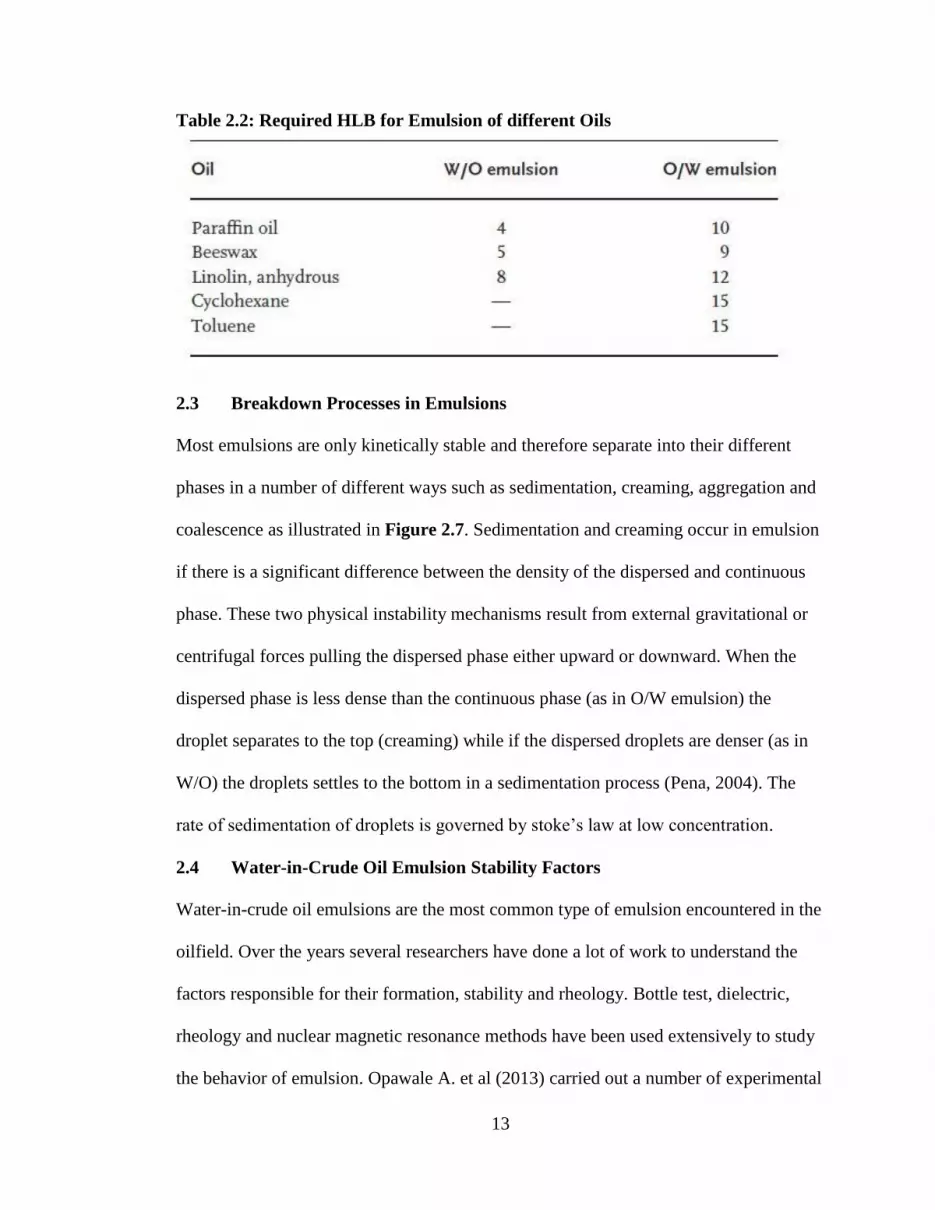
The HLB number required to emulsify a given oil depends on the nature of the
oil. Different oils have predetermined required HLB number as shown in Table
2.2. The HLB of the surfactant are chosen to match the required HLB of the oil
for good emulsification. Required HLB of any oil can be determined
experimentally.
13
Table 2.2: Required HLB for Emulsion of different Oils
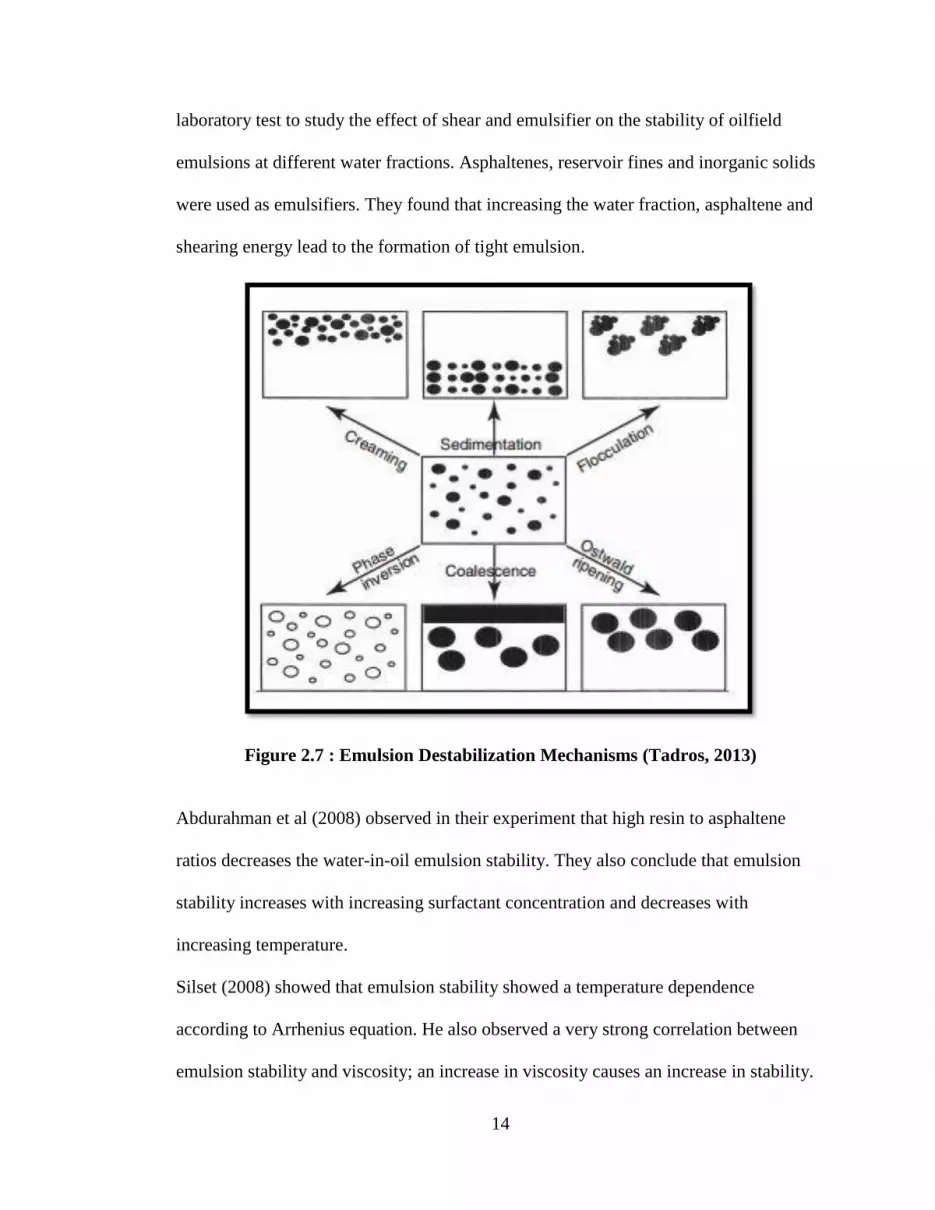
2.3 Breakdown Processes in Emulsions
Most emulsions are only kinetically stable and therefore separate into their different
phases in a number of different ways such as sedimentation, creaming, aggregation and
coalescence as illustrated in Figure 2.7. Sedimentation and creaming occur in emulsion
if there is a significant difference between the density of the dispersed and continuous
phase. These two physical instability mechanisms result from external gravitational or
centrifugal forces pulling the dispersed phase either upward or downward. When the
dispersed phase is less dense than the continuous phase (as in O/W emulsion) the
droplet separates to the top (creaming) while if the dispersed droplets are denser (as in
W/O) the droplets settles to the bottom in a sedimentation process (Pena, 2004). The
rate of sedimentation of droplets is governed by stoke’s law at low concentration.
2.4 Water-in-Crude Oil Emulsion Stability Factors
Water-in-crude oil emulsions are the most common type of emulsion encountered in the
oilfield. Over the years several researchers have done a lot of work to understand the
factors responsible for their formation, stability and rheology. Bottle test, dielectric,
rheology and nuclear magnetic resonance methods have been used extensively to study
the behavior of emulsion. Opawale A. et al (2013) carried out a number of experimental
14
laboratory test to study the effect of shear and emulsifier on the stability of oilfield
emulsions at different water fractions. Asphaltenes, reservoir fines and inorganic solids
were used as emulsifiers. They found that increasing the water fraction, asphaltene and
shearing energy lead to the formation of tight emulsion.
Figure 2.7 : Emulsion Destabilization Mechanisms (Tadros, 2013)
Abdurahman et al (2008) observed in their experiment that high resin to asphaltene
ratios decreases the water-in-oil emulsion stability. They also conclude that emulsion
stability increases with increasing surfactant concentration and decreases with
increasing temperature.
Silset (2008) showed that emulsion stability showed a temperature dependence
according to Arrhenius equation. He also observed a very strong correlation between
emulsion stability and viscosity; an increase in viscosity causes an increase in stability.
15
(Henríquez, 2009) studied water in oil emulsion using paraffin oil and a mixture of
sorbitan monooleate (span 80) and nonylphenol ether (Arkopal N 040) as surfactant.
The surfactant stabilizes the emulsion in a wide range of water content. He observed
that the highest stability of emulsion at the highest surfactant concentration (10%).
2.5 Role of Heavy Polar Fractions in Emulsion Stabilization
Emulsion are stabilized by surface active components present in the crude oil. These
components are heavy polar fractions which includes asphaltenes, carboxylic organic
acids, bases, and fine inorganic particles (Kilpatrick, Water-in-Crude Oil Emulsion
Stabilization: Review and Unanswered, 2012). Some of these components are identified
by carrying out a Saturates, Aromatic, Resin and Asphaltenes (SARA) analysis on the
crude oil. Several authors have attributed the formation of very stable emulsion to the
presence of asphaltenes. Asphaltenes are complex molecules soluble in toluene,
benzene and ethyl acetate but insoluble in low molecular weight n-alkanes (Kokal and
Sayegh., 1995).Michell and Speight (1973) found that asphaltenes exist has colloidal
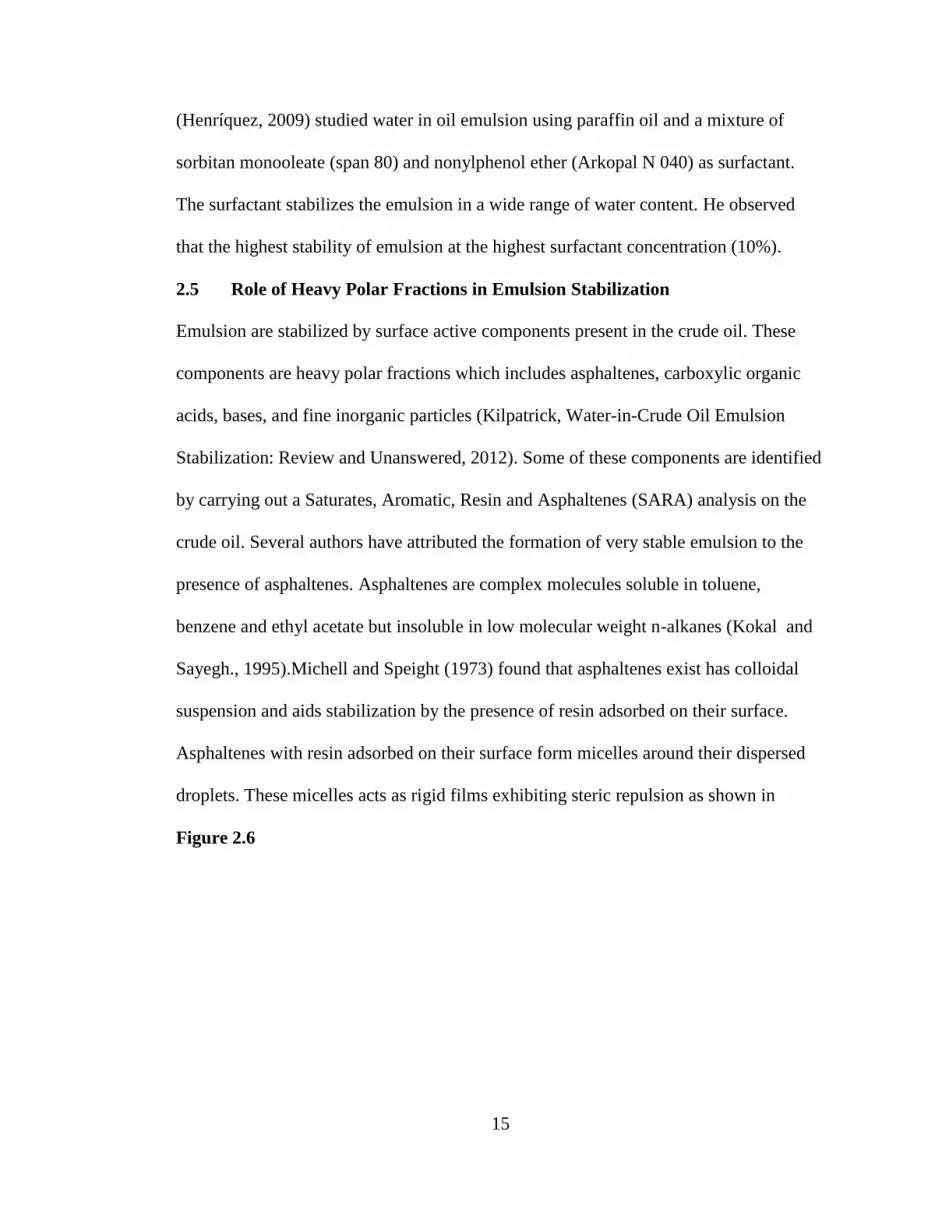
suspension and aids stabilization by the presence of resin adsorbed on their surface.
Asphaltenes with resin adsorbed on their surface form micelles around their dispersed
droplets. These micelles acts as rigid films exhibiting steric repulsion as shown in
Figure 2.6
16
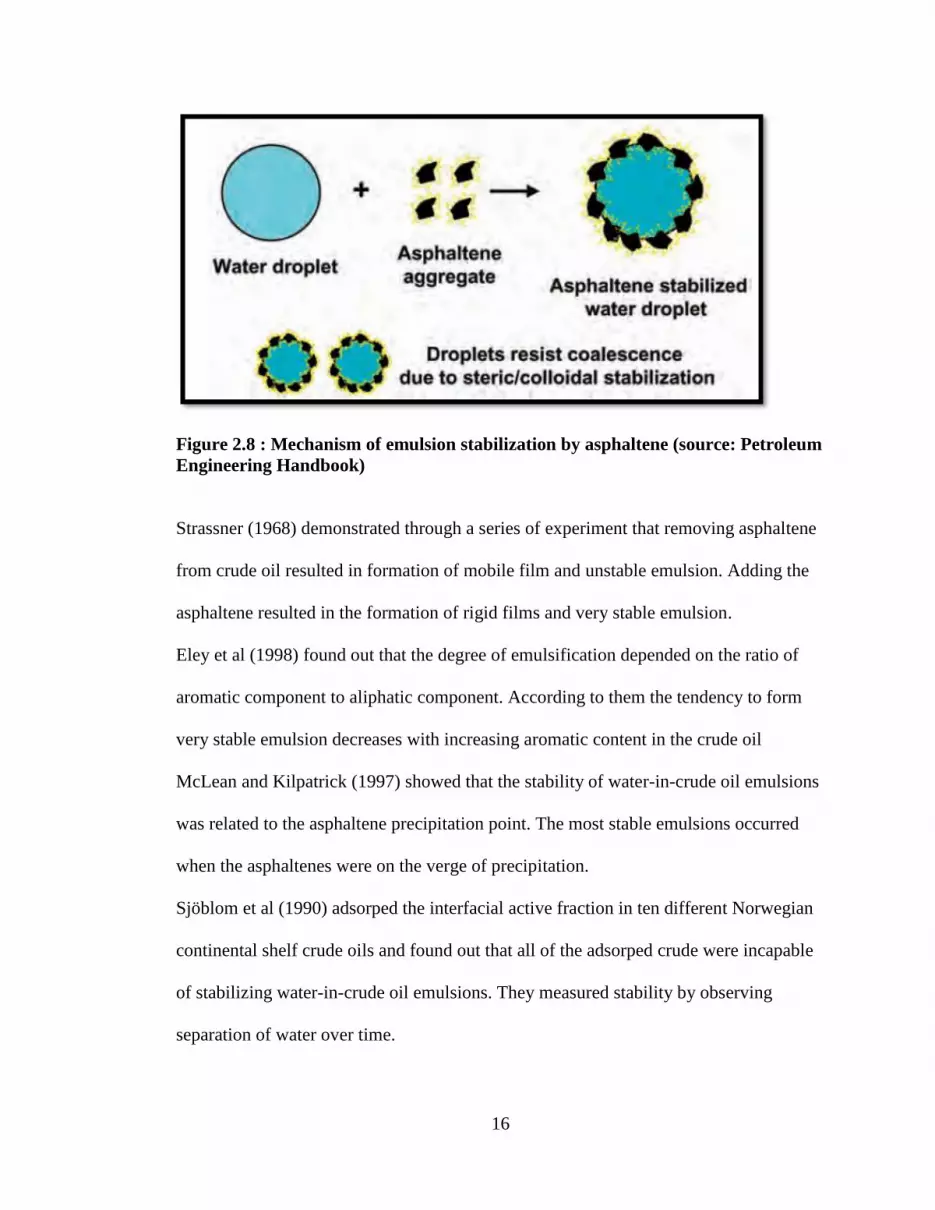
Figure 2.8 : Mechanism of emulsion stabilization by asphaltene (source: Petroleum
Engineering Handbook)
Strassner (1968) demonstrated through a series of experiment that removing asphaltene
from crude oil resulted in formation of mobile film and unstable emulsion. Adding the
asphaltene resulted in the formation of rigid films and very stable emulsion.
Eley et al (1998) found out that the degree of emulsification depended on the ratio of
aromatic component to aliphatic component. According to them the tendency to form
very stable emulsion decreases with increasing aromatic content in the crude oil
McLean and Kilpatrick (1997) showed that the stability of water-in-crude oil emulsions
was related to the asphaltene precipitation point. The most stable emulsions occurred
when the asphaltenes were on the verge of precipitation.
Sjöblom et al (1990) adsorped the interfacial active fraction in ten different Norwegian
continental shelf crude oils and found out that all of the adsorped crude were incapable
of stabilizing water-in-crude oil emulsions. They measured stability by observing
separation of water over time.
17
Kilpatrick (2012) in his review of water in oil emulsion stabilization noted that
asphaltenes is a complex mix of chemically distinct molecules many of which actually
are not soluble in toluene and destabilize emulsion. According to him many of the
molecules in crude oil are acidic and can ionize at the oil-water interface lowering the
interfacial tension and stabilize the emulsion. Some of these acids are simply carboxylic
acids,naphthenic acids and some are fused aromatic acids.
2.6 Total Acid and Base Number (TAN & TBN)
Asphaltene is a complex mix of different compounds, it consists of a continuum of high
molecular weight compounds with different functional groups. Present in crude oil are
also acid and bases functional groups. The interaction between the different functional
asphaltene and acid and base functional group is central to emulsion stability (Tanja et
al, 2005). In addition to the other heavy polar fractions found in crude, some crude oils
are known to also contain significant amount of acids and bases. These acids are in the
form of what is called naphthenic acids. Although the term “naphthenic acids”
originally implied that the acids contained naphthenic rings, today it comprises cyclic,
acyclic, and aromatic acids in crude oils (Brient et al, 1995). They are a complex
mixture of compounds with diverse molecular weight and structures. Recently there has
been an increasing interest in studying how these acids and bases interact with other
crude oil heavy fractions to stabilize emulsions. The complex interactions of
asphaltenes and naphthenic acids is an area of research that is getting a lot of attention.
Pål V. Hemmingsen et al (2006) carried out an experimental in which they washed a
North Sea acidic crude oil to reduce the total acid number using liquid-liquid extraction.
The original and washed crude oil were characterized using electrospray ionization
18
Fourier transform ion cyclotron resonance mass spectrometry (FT-ICR MS) and by
Fourier transform infrared spectroscopy. Each of the washed crude was used in forming
an emulsion and the stability was measured using the critical electric field method. They
observed that reducing the acid component in the crude increases the interfacial tension
and also increases the water-in-oil stability. They concluded that acidic fractions in
crude oil has a solubilizing effect on asphaltene hence removing them causes the
asphaltene to be more surface active.
Tanja Barth et al (2005) found a very strong correllation between the total base number
and asphaltene content of twenty crude oils. They suggested that there could be a very
strong interaction between acids and bases in asphaltene emulsion stability.
2.7 Emulsion Rheology and Viscosity Measurement
2.7.1 Rheometry
Rheometry refers to the measurement of the rheological properties of a fluid. Rheology
is defined as the study of the deformation and flow of fluids under the influence of an
applied shear stress. Stress is an internal reaction to an external force. Viscosity is a
very important rheological property of a fluid that measures the internal resistance to
stress or it is a measure of the fluid friction. Viscosity usually cannot be measured
directly, forces, torque and rotation speed are measured and then converted to viscosity
models. Viscosity in a very simple term is a ratio of shear stress to shear strain.
Viscosity can be measured either by using capillary tube viscometers or rotational
viscometer.
Capillary tube viscometers work on the principle of fully developed laminar flow
described by the Hagen-Poiseuille equation. Glass capillary viscometer are the simplest
19
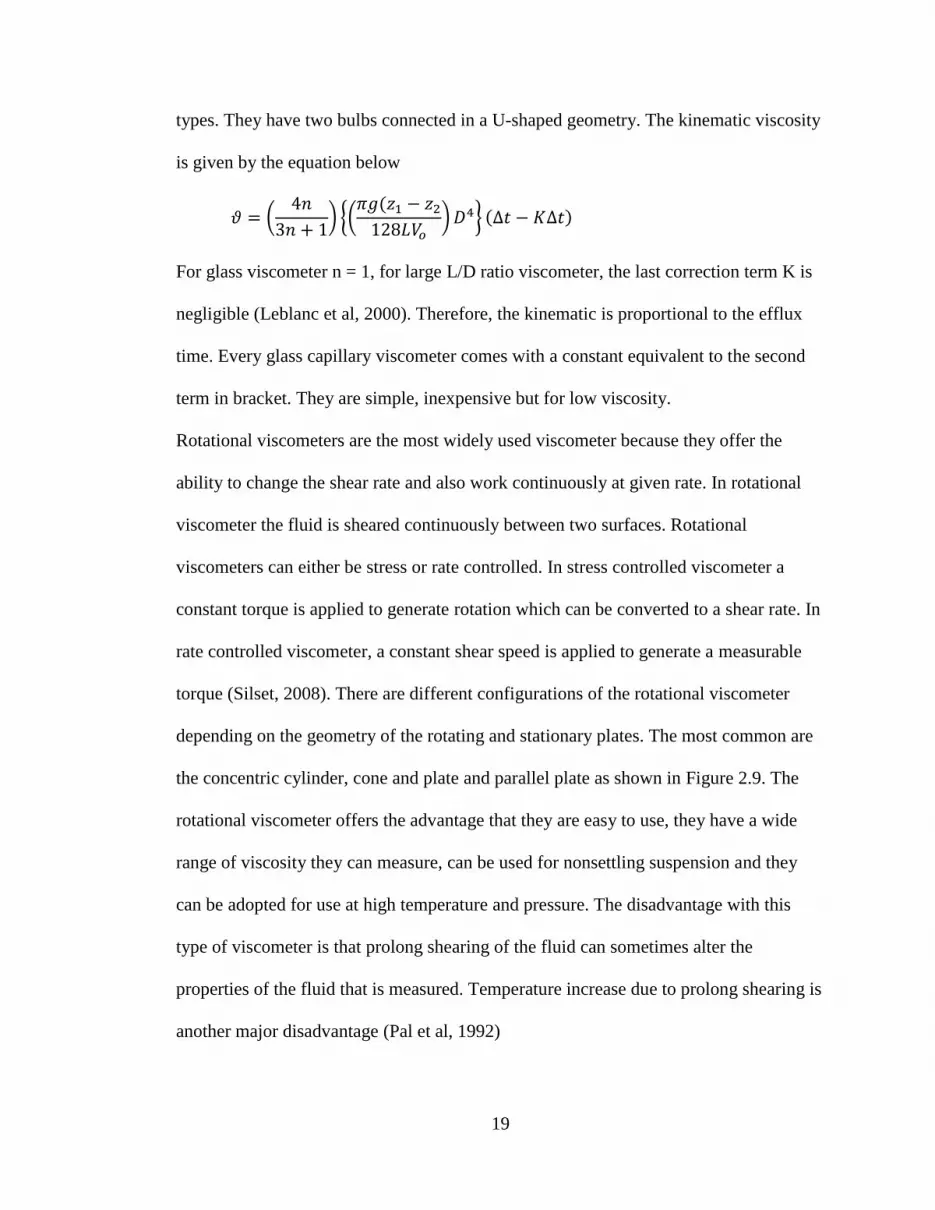
types. They have two bulbs connected in a U-shaped geometry. The kinematic viscosity
is given by the equation below
𝜗 = (4𝑛
3𝑛 + 1) {(
𝜋𝑔(𝑧1 − 𝑧2
128𝐿𝑉𝑜) 𝐷4} (∆𝑡 − 𝐾∆𝑡)
For glass viscometer n = 1, for large L/D ratio viscometer, the last correction term K is
negligible (Leblanc et al, 2000). Therefore, the kinematic is proportional to the efflux
time. Every glass capillary viscometer comes with a constant equivalent to the second
term in bracket. They are simple, inexpensive but for low viscosity.
Rotational viscometers are the most widely used viscometer because they offer the
ability to change the shear rate and also work continuously at given rate. In rotational
viscometer the fluid is sheared continuously between two surfaces. Rotational
viscometers can either be stress or rate controlled. In stress controlled viscometer a
constant torque is applied to generate rotation which can be converted to a shear rate. In
rate controlled viscometer, a constant shear speed is applied to generate a measurable
torque (Silset, 2008). There are different configurations of the rotational viscometer
depending on the geometry of the rotating and stationary plates. The most common are
the concentric cylinder, cone and plate and parallel plate as shown in Figure 2.9. The
rotational viscometer offers the advantage that they are easy to use, they have a wide
range of viscosity they can measure, can be used for nonsettling suspension and they
can be adopted for use at high temperature and pressure. The disadvantage with this
type of viscometer is that prolong shearing of the fluid can sometimes alter the
properties of the fluid that is measured. Temperature increase due to prolong shearing is
another major disadvantage (Pal et al, 1992)

20
Figure 2.9: Rotational Viscometer Configuration; (a) Concentric cylinder (b) Cone
and Plate (c) Parallel plate (Silset, 2008)
2.7.2 Emulsion Rheology
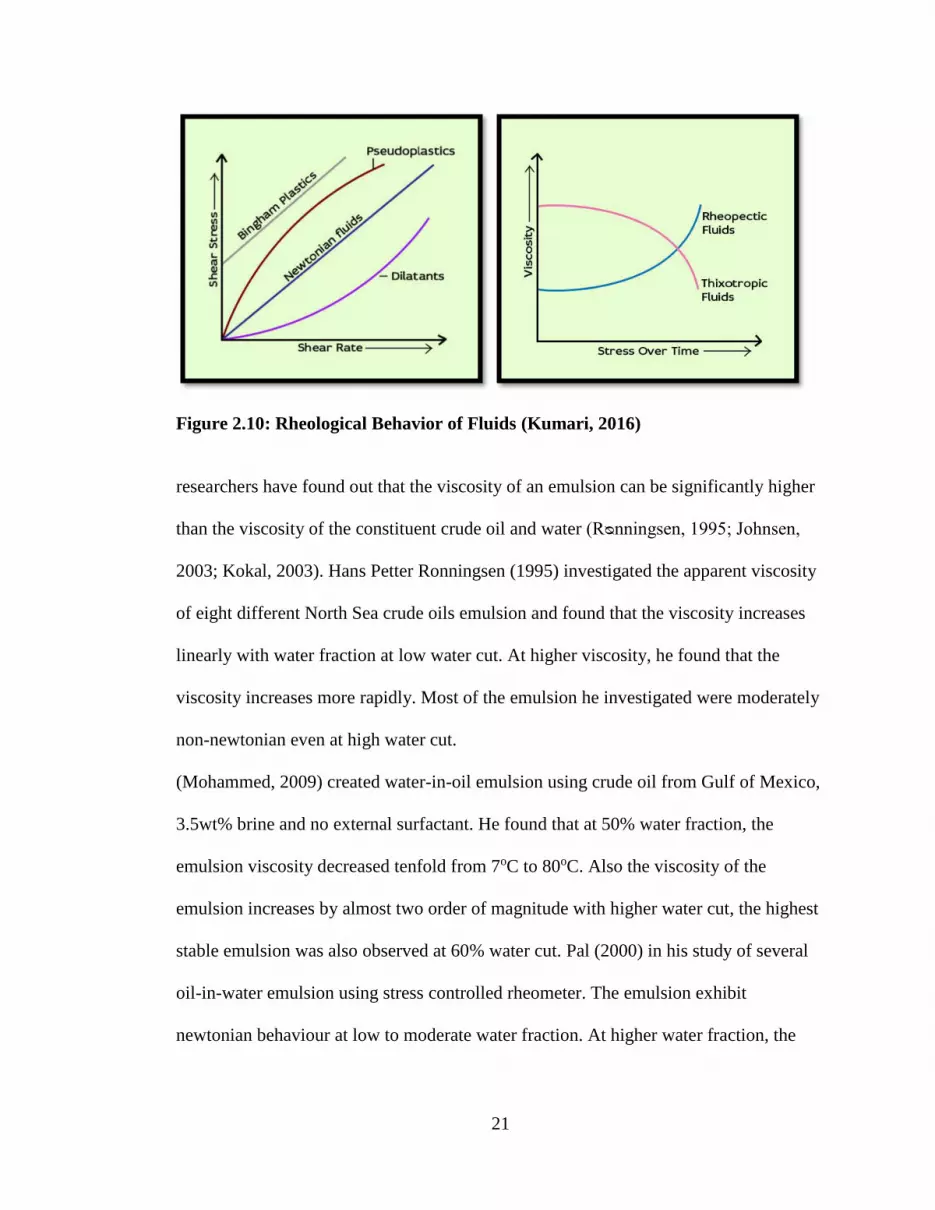
Emulsion exhibit both newtonian and non-newtonian behavior. A fluid is said to be
Newtonian when it obeys Newton's law of viscosity that is the shear stress is
proportional to the shear rate. In another form we say the viscosity is independent of the
shear rate. If the viscosity is a function of the shear rate, then the emulsion is non-
newtonian. Non newtonian fluid can be broadly categorized into time-independent and
time-dependent non newtonian fluid. Time independent non-newtonian fluid can either
be pseudoplastic (shear thinning) or dilatant (shear thickening) as shown in Figure 2.8.
Time dependent non-newtonian have viscosities both a function of shear rate and shear
rate history. They are broadly categorized either has thixotropic or rheopectic fluid.
The viscosity of an emulsion depends on a number of factors such as the viscosity of the
continuous phase, volume fraction of the dispersed phase, temperature, shear rate (for
non-newtonian), pressure, droplet size and distribution of the dispersed phase. Several
21
Figure 2.10: Rheological Behavior of Fluids (Kumari, 2016)
researchers have found out that the viscosity of an emulsion can be significantly higher
than the viscosity of the constituent crude oil and water (Rᴓnningsen, 1995; Johnsen,
2003; Kokal, 2003). Hans Petter Ronningsen (1995) investigated the apparent viscosity
of eight different North Sea crude oils emulsion and found that the viscosity increases
linearly with water fraction at low water cut. At higher viscosity, he found that the
viscosity increases more rapidly. Most of the emulsion he investigated were moderately
non-newtonian even at high water cut.
(Mohammed, 2009) created water-in-oil emulsion using crude oil from Gulf of Mexico,
3.5wt% brine and no external surfactant. He found that at 50% water fraction, the
emulsion viscosity decreased tenfold from 7oC to 80oC. Also the viscosity of the
emulsion increases by almost two order of magnitude with higher water cut, the highest
stable emulsion was also observed at 60% water cut. Pal (2000) in his study of several
oil-in-water emulsion using stress controlled rheometer. The emulsion exhibit
newtonian behaviour at low to moderate water fraction. At higher water fraction, the
22
emulsion exhibit shear thinning behavior. He also observed that the viscosity of the
shear thinning emulsion is strongly affected by the droplet size.
2.8 Phase Inversion
Phase inversion refers to the changing of an emulsion dispersed phase to a continuous
phase. For example, a water-in-oil emulsion can undergo a phase inversion to oil-in-
water emulsion. This change can occur with time or a change in condition of the
emulsion. Phase inversion is usually accompanied with the formation of multiple
emulsion (Tadros, 2009). There are two types of phase inversion: transition inversion
and catastrophic inversion. Catastrophic inversion occurs when the water fraction in an
emulsion is increased up to a point such that the droplet packing is close to the critical
packing factor. Transition inversion occurs when conditions such as the surfactant,
salinity or temperature changes
2.9 Emulsion Viscosity Correlations
There are several correlations that have been developed by researchers to predict the
viscosity of emulsion. A lot of these correlations are empirical or semi-empirical
correlations. Several factors affect the viscosity of emulsion such as: viscosity of the
continuous phase, water fraction, temperature, shear rate, nature and concentration of
the emulsifying agent, droplet size and distribution and presence of solids in the crude
oil. It is almost impossible to incorporate all of these factors into one correlation so
several correlations only consider the effect of water fraction. A few take into account
the effect of water fraction, temperature and shear rate. Correlations for predicting the
viscosity of emulsions are usually represented in term of relative viscosity (
(Rᴓnningsen, 1995). Relative viscosity is the viscosity of the emulsion divided by the
23
viscosity of the base oil. One of the most basic correlation for predicting emulsion
viscosity was proposed by Einstein (1906) when he studied suspension of
nondeformable solid particle at low concentration. He expressed the relative viscosity
linearly with volume fraction of the dispersed phase as follows:
𝜂𝑟 = 1 + 2.5𝜙 … … … … … … (1)
At higher water fraction, emulsion viscosity exhibits a non-linear behavior with water
fraction. (Richardson, 1933) proposed an exponential dependence of viscosity on water
fraction as follows:
𝜂𝑟 = 𝑒𝐾𝜙 … … … … … … (2) where K is Richardson constant
which is dependent on the system. Broughton and Squires (1937) introduced
another system correction factor (A) into the Richardson equations as follows
𝜂𝑟 = 𝐴𝑒𝐾𝜙 … … … … … … (3)
𝑙𝑛 𝜂𝑟 = 𝑙𝑛𝐴 + 𝐾𝜙 … … … … … … (4)
(Rᴓnningsen, 1995) extended the constant A and K to be a linear function of
temperature as shown below
𝑙𝑛 𝜂𝑟 = 𝑘1 + 𝑘2𝑇 + 𝑘3𝜙 + 𝑘4𝑇𝜙 … … … … … … (5) where T is the
temperature, Ø is water volume Percent (not fraction), k1, k2, k3 and k4 are shear rate
dependent (values given in the literature). The correlation was developed using eight
different North Sea crude without the addition of any emulsifier. This correlation is oil
type specific and it is the only correlation that does not require experimental tuning. It is
also noticed that although being developed for gas-free systems, the correlation is valid
also for live oil multiphase systems at pressures up to 100 bars (Zahra, 2012)
24
(Mooney, 1951) developed a correlation from studying viscosity of monodisperse
spheres:
𝑙𝑛𝜂𝑟 =2.5𝜙
1−𝜆𝜙 … … … … … … (6) where λ is a constant to be used to
tune experimental data. This correlation is sensitive to the turning point (Johnsen &
Ronningsen, 2003)
(Pal, 2000) using a large set of experimental data developed a two parameter emulsion
viscosity correlation as shown below
𝜂𝑟−2/5
⌊2𝜂𝑟+5𝐾
2+5𝐾⌋ = 1 − 𝐾𝑜𝜙 … … … … … … (7)
Where K is the ratio of dispersed phase viscosity to continuous phase viscosity, Ø is the
water fraction of the dispersed phase. Ko is takes into account the effect of adsorped
surfactant. In absence of any data use 1.35 (inverse the water fraction equivalent to
maximum packing factor, 0.74) (Zahra, 2012). This correlation is also very sensitive to
the turning point. The correlation was developed using a combination of polymer
thickened oil-in-water emulsion, mineral oil-in-water emulsion, oil-in-water containing
milk fat, heavy oil-in-water emulsion and petroleum oil-in-water emulsion.
Pal & Rhodes (1989) developed a correlation to predict the viscosity of both water-in-
oil and oil-in-water emulsion. They presented both the empirical correlation and the
correlation model. They observed good agreement between the model and the
correlation. The oil used to form their emulsions are bayol-35/CCl4 oil mix, shell vitrea
220, Diesel No.2 and Furnace No.2. The surfactant used were Triton X100 (0.5-1%vol),
Span80 (1.5-2%vol), Span 85 (2%vol). All emulsions were prepared at 23oC-29oC.
Their correlation is presented below:
25
𝜂𝑟 = (1 +𝜙/𝐾2
1.1884 − 𝜙/𝐾2)
2.5
… … … … … … (8)
Ø is the dispersed phase volume fraction. K2 is the dispersed phase concentration at
which the relative viscosity is equal to 100. K2 accounts for system variation and is used
as a fitting parameter. It is an experimental value at a high dispersed phase volume
fraction.
Almrit et al (2011) noted that Ronningsen corellation does not reduce to a relative
viscosity of one (that of the base oil) when the water fraction is zero. Their correlation
also put into consideration the effect of oil type
𝑙𝑛 𝜂𝑟 = 𝜙 ∗ (𝑐1 + 𝑐2𝑇) ∗ ⌈ln (𝐴𝑃𝐼)⌉𝑐3+𝑐4𝑇 … … … … … … (2)
c1-c4 were defined at low shear rate (<100s-1) and high shear rate (>100s-1).

26
CHAPTER 3
EXPERIMENTAL PROCEDURE
3.1 Experimental Techniques
In this chapter, I will discuss the experimental setups as well as the workflow technique I
have employed in carrying out these research. I will also discuss the materials used. The
first stage in these research was to create stable synthetic emulsions in the lab with or
without the use of an external surfactant. In order to create stable and reproducible emulsion
it is important to have an emulsion mixing procedure. Different mixing methods were
investigated and reported. Crude oil emulsion without any external surfactant was created
and checked for stability and viscosity. A number of surfactants were then used to stabilize
the emulsion while observing their effect on viscosity. A surfactant scan was carried out to
identify the best surfactant in terms of stability and viscosity. After identifying the best
method to create the emulsions, the method was tested for repeatability by creating multiple
emulsion using exactly the same method and measuring the stability and viscosity. Stability
measurements were carried out using both bottle test and centrifuge. Viscosity test was
done using capillary viscometer and Fann concentric cylinder rotational viscometer. The
total acid number (TAN) and total base number (TBN) of the crude were measured using
Metrohm oil titrino plus potentiometric titrator. The effect of adding external surfactant was
investigated on the TAN and TBN and their associated emulsion stability and viscosity.
3.2 Materials
The main crude oil used in this research was obtained from a wellhead in Midland
Texas (Texas crude oil). A second crude oil sample (Crude oil A) was also used in some
cases for comparison. Mineral oil obtained in the lab was also used during the initial

27
stage of the research to create emulsions. The water used in preparing the emulsions is
deionized water. Bulk properties of the Texas crude, mineral oil and heptane are
presented in Table 3.1. Density was measured using a pycnometer while viscosity was
measured using capillary viscometer. The following surfactants were used: Span80,
Span 85, Tween 80, TritonX100 and Tergitol. They were purchased from Sigma
Aldrich. The properties of the surfactants are presented in Table 3.2. All surfactants are
non-ionic. There was a need for surfactant because the available crude oil does not
naturally form stable emulsion.
Table 3.1: Bulk Properties of Fluids Used at 25oC
Table 3.2: Properties of the Surfactants
28
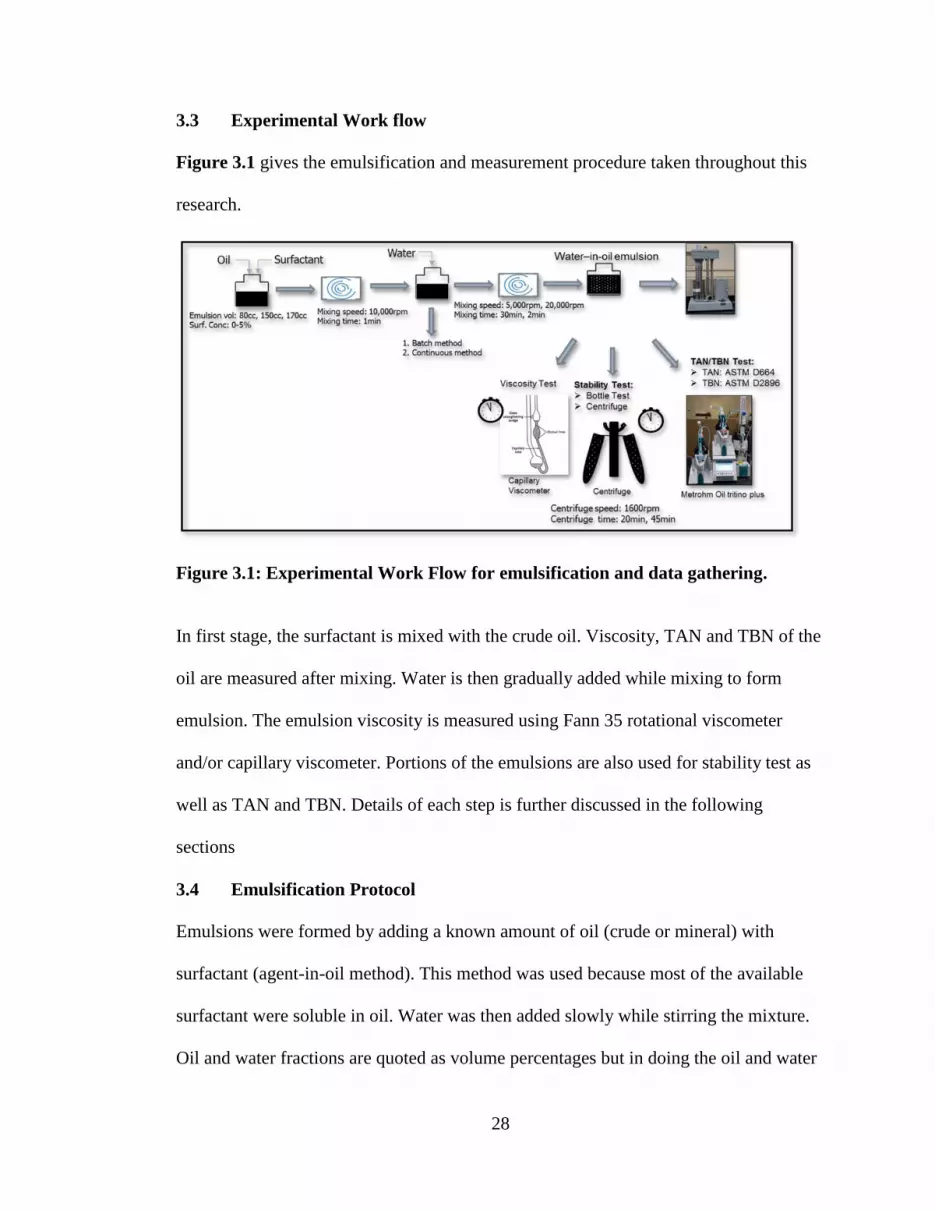
3.3 Experimental Work flow
Figure 3.1 gives the emulsification and measurement procedure taken throughout this
research.
Figure 3.1: Experimental Work Flow for emulsification and data gathering.
In first stage, the surfactant is mixed with the crude oil. Viscosity, TAN and TBN of the
oil are measured after mixing. Water is then gradually added while mixing to form
emulsion. The emulsion viscosity is measured using Fann 35 rotational viscometer
and/or capillary viscometer. Portions of the emulsions are also used for stability test as
well as TAN and TBN. Details of each step is further discussed in the following
sections
3.4 Emulsification Protocol
Emulsions were formed by adding a known amount of oil (crude or mineral) with
surfactant (agent-in-oil method). This method was used because most of the available
surfactant were soluble in oil. Water was then added slowly while stirring the mixture.
Oil and water fractions are quoted as volume percentages but in doing the oil and water
29
measurement their corresponding weight was used. Surfactant volume is a percentage of
the total emulsion volume. Two methods were employed in creating the emulsion; batch
method and continuous method. In the initial stage all emulsions were prepared using
the batch procedure. In the batch procedure, each water fraction was prepared separately
(measuring out each water and oil weight separately). In the continuous method, the
lowest water fraction emulsion was prepared first. To prepare the next water fraction
additional water was added to make up any volume of emulsion removed. This method
was used when investigating emulsions at different water fraction. Continuous method
helps to minimize the amount of crude oil used and also reduce waste emulsion.
3.5 Mixing Method
Five mixing methods was used in these research, most of which were either ineffective
or time consuming. Methods used were handshaking, magnetic stirrer, mechanical 3-
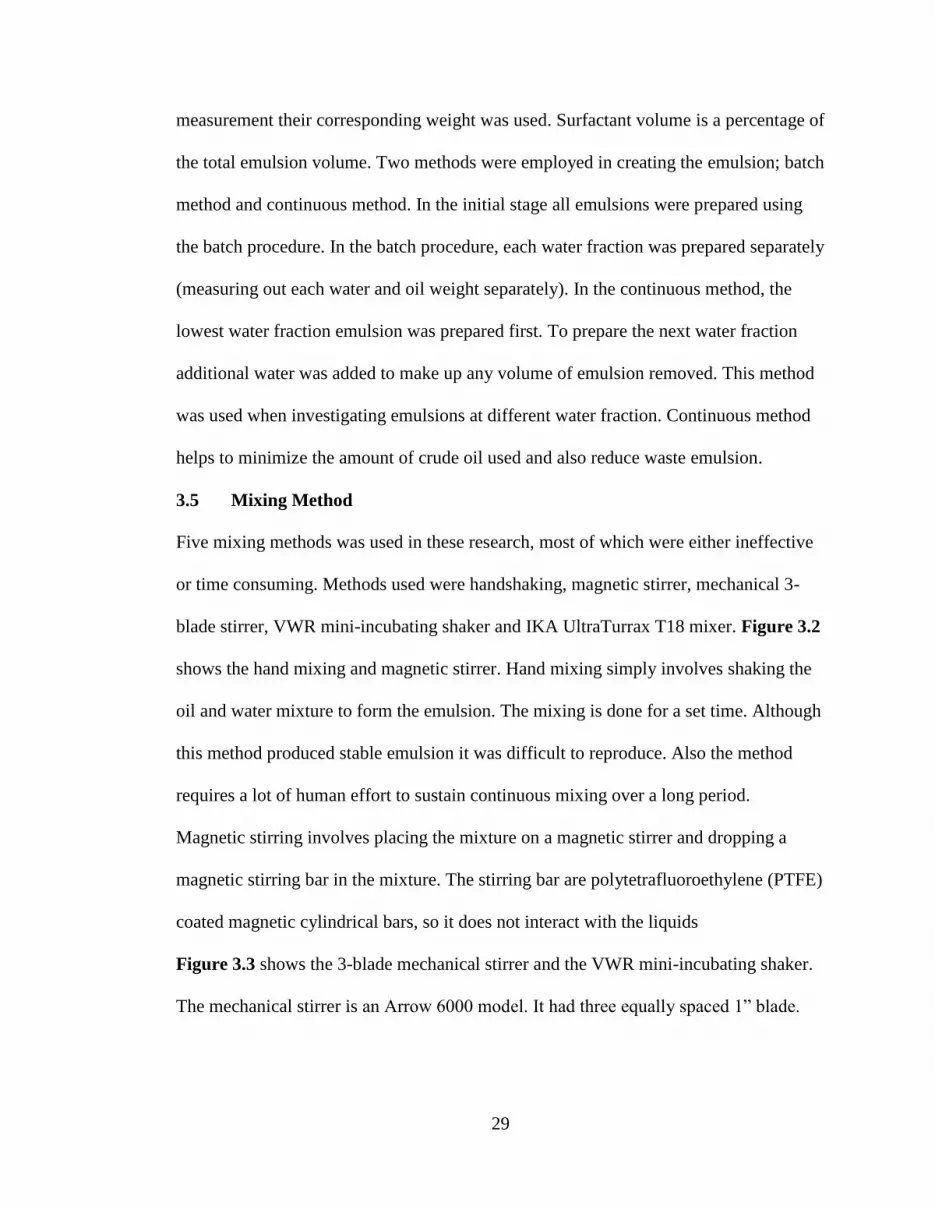
blade stirrer, VWR mini-incubating shaker and IKA UltraTurrax T18 mixer. Figure 3.2
shows the hand mixing and magnetic stirrer. Hand mixing simply involves shaking the
oil and water mixture to form the emulsion. The mixing is done for a set time. Although
this method produced stable emulsion it was difficult to reproduce. Also the method
requires a lot of human effort to sustain continuous mixing over a long period.
Magnetic stirring involves placing the mixture on a magnetic stirrer and dropping a
magnetic stirring bar in the mixture. The stirring bar are polytetrafluoroethylene (PTFE)
coated magnetic cylindrical bars, so it does not interact with the liquids
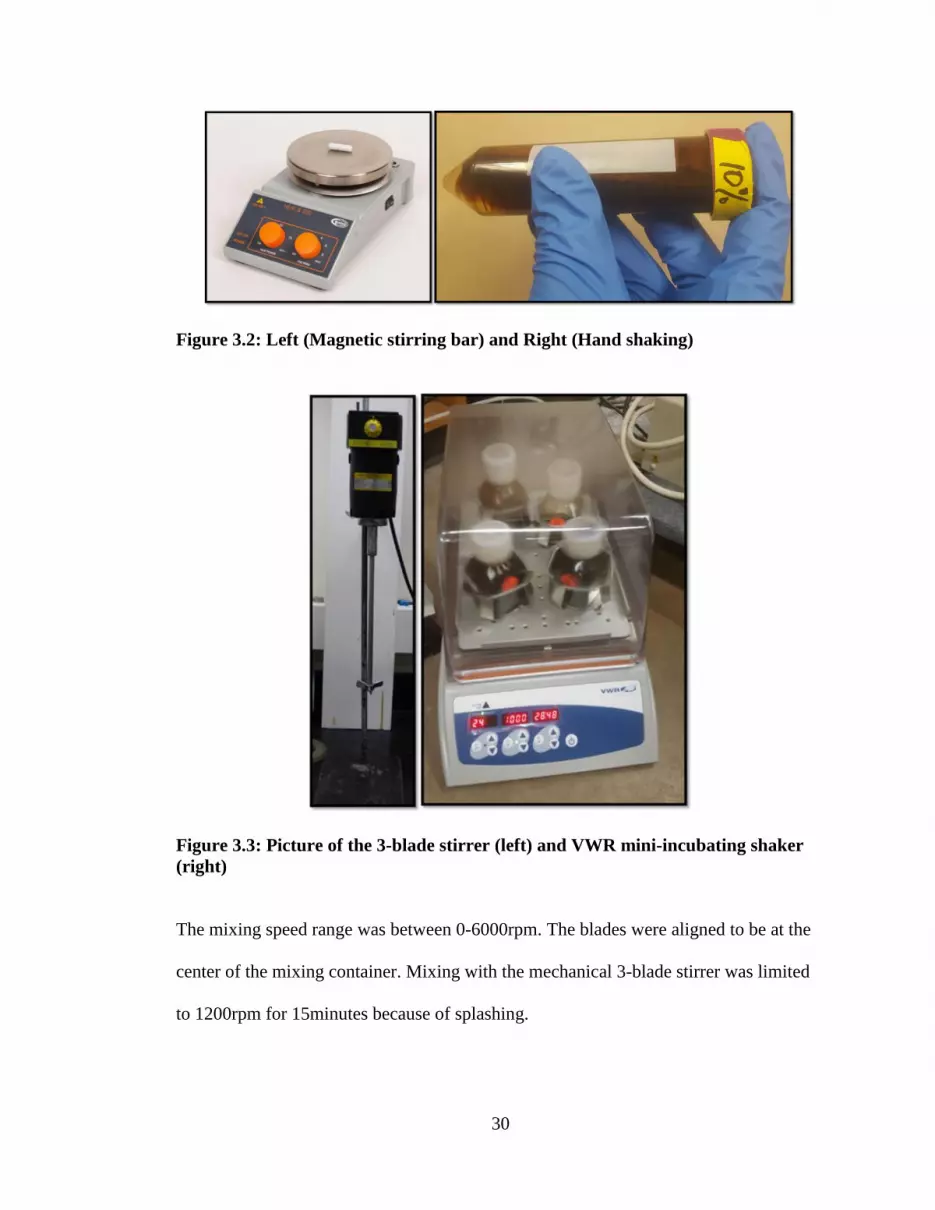
Figure 3.3 shows the 3-blade mechanical stirrer and the VWR mini-incubating shaker.
The mechanical stirrer is an Arrow 6000 model. It had three equally spaced 1” blade.
30
Figure 3.2: Left (Magnetic stirring bar) and Right (Hand shaking)
Figure 3.3: Picture of the 3-blade stirrer (left) and VWR mini-incubating shaker
(right)
The mixing speed range was between 0-6000rpm. The blades were aligned to be at the
center of the mixing container. Mixing with the mechanical 3-blade stirrer was limited
to 1200rpm for 15minutes because of splashing.
31
The mini-incubating was purchased from VWR. It is a variable speed shaker with an
orbit radius of 3mm, it also had a temperature and time adjustment control. The speed
range was between 100-1200rpm. 125mL square bottles were used in each of the four
mixing spot on the shaker. The shaker operates by vibrating about it orbit. Mixing with
this method was carried out at 24oC at 1200rpm for 15minute.
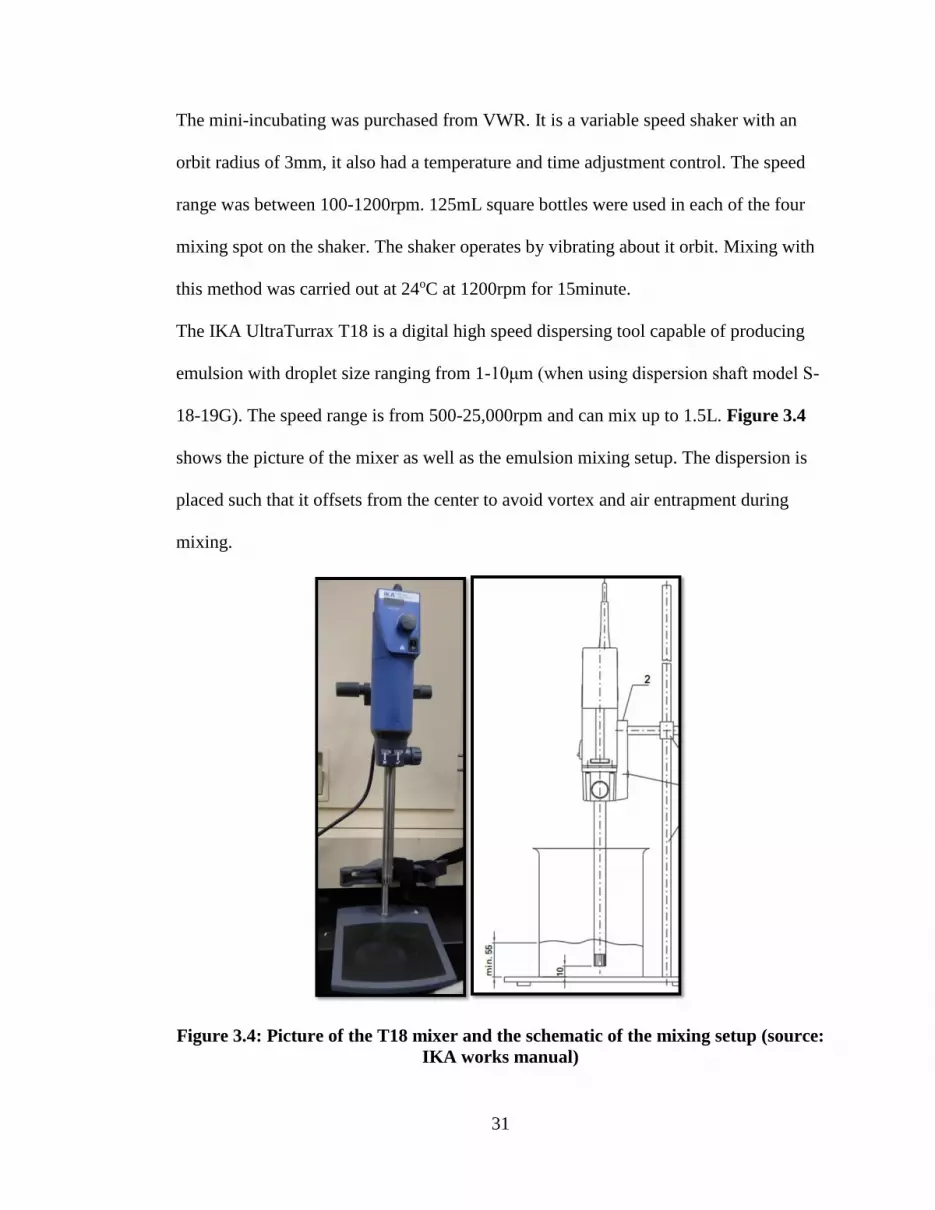
The IKA UltraTurrax T18 is a digital high speed dispersing tool capable of producing
emulsion with droplet size ranging from 1-10μm (when using dispersion shaft model S-
18-19G). The speed range is from 500-25,000rpm and can mix up to 1.5L. Figure 3.4
shows the picture of the mixer as well as the emulsion mixing setup. The dispersion is
placed such that it offsets from the center to avoid vortex and air entrapment during
mixing.
Figure 3.4: Picture of the T18 mixer and the schematic of the mixing setup (source:
IKA works manual)

32
A minimum distance of 10mm was maintained between the bottom of the mixing vessel
and the bottom of the dispersing tool. The mixture is drawn axially into the dispersion
head and then forced radially out through the rotor/stator arrangement as shown in
Figure 3.5. High shear produced between the rotor and stator gap creates turbulence to
provide optimum dispersion. Total emulsion volume prepared were 80cc, 150cc and
170cc depending on the measurements to be taken and the size of the mixing vessel. It
was ensured that the fluids cover a hole at the bottom of the dispersing tool at all time.
Mixing was done at two speeds; 5000rpm for 30minutes and 20,000rpm for 2minutes
Figure 3.5: Operating principle of the dispersing tool of the IKA T18 mixer
(source: IKA Works manual)
3.6 Stability Test
Two methods were used to study the stability of emulsion; bottle test and centrifuge
test. The popular bottle test involves putting sample of the emulsion in a container and
allowing it to separate under gravity. The amount of water and oil separated over time is
used to determine if the emulsion is stable or not. In this research, 40mL of emulsion
samples were kept in a 50mL centrifuge bottle and allowed to separate over a period of
120 hours. Measurement of the oil and water separated were taken every 24 hours.
33
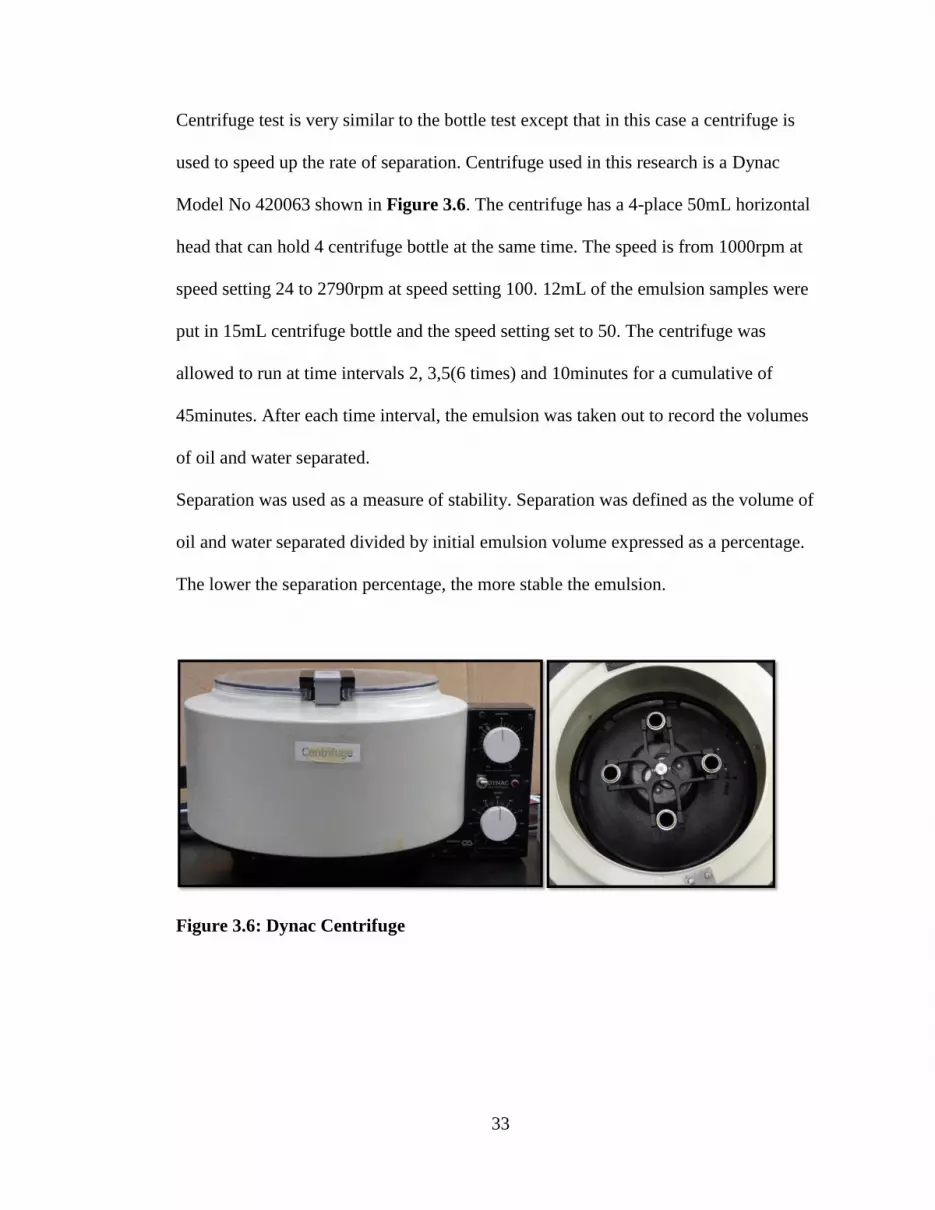
Centrifuge test is very similar to the bottle test except that in this case a centrifuge is
used to speed up the rate of separation. Centrifuge used in this research is a Dynac
Model No 420063 shown in Figure 3.6. The centrifuge has a 4-place 50mL horizontal
head that can hold 4 centrifuge bottle at the same time. The speed is from 1000rpm at
speed setting 24 to 2790rpm at speed setting 100. 12mL of the emulsion samples were
put in 15mL centrifuge bottle and the speed setting set to 50. The centrifuge was
allowed to run at time intervals 2, 3,5(6 times) and 10minutes for a cumulative of
45minutes. After each time interval, the emulsion was taken out to record the volumes
of oil and water separated.
Separation was used as a measure of stability. Separation was defined as the volume of
oil and water separated divided by initial emulsion volume expressed as a percentage.
The lower the separation percentage, the more stable the emulsion.
Figure 3.6: Dynac Centrifuge
34
3.7 Viscosity Measurement
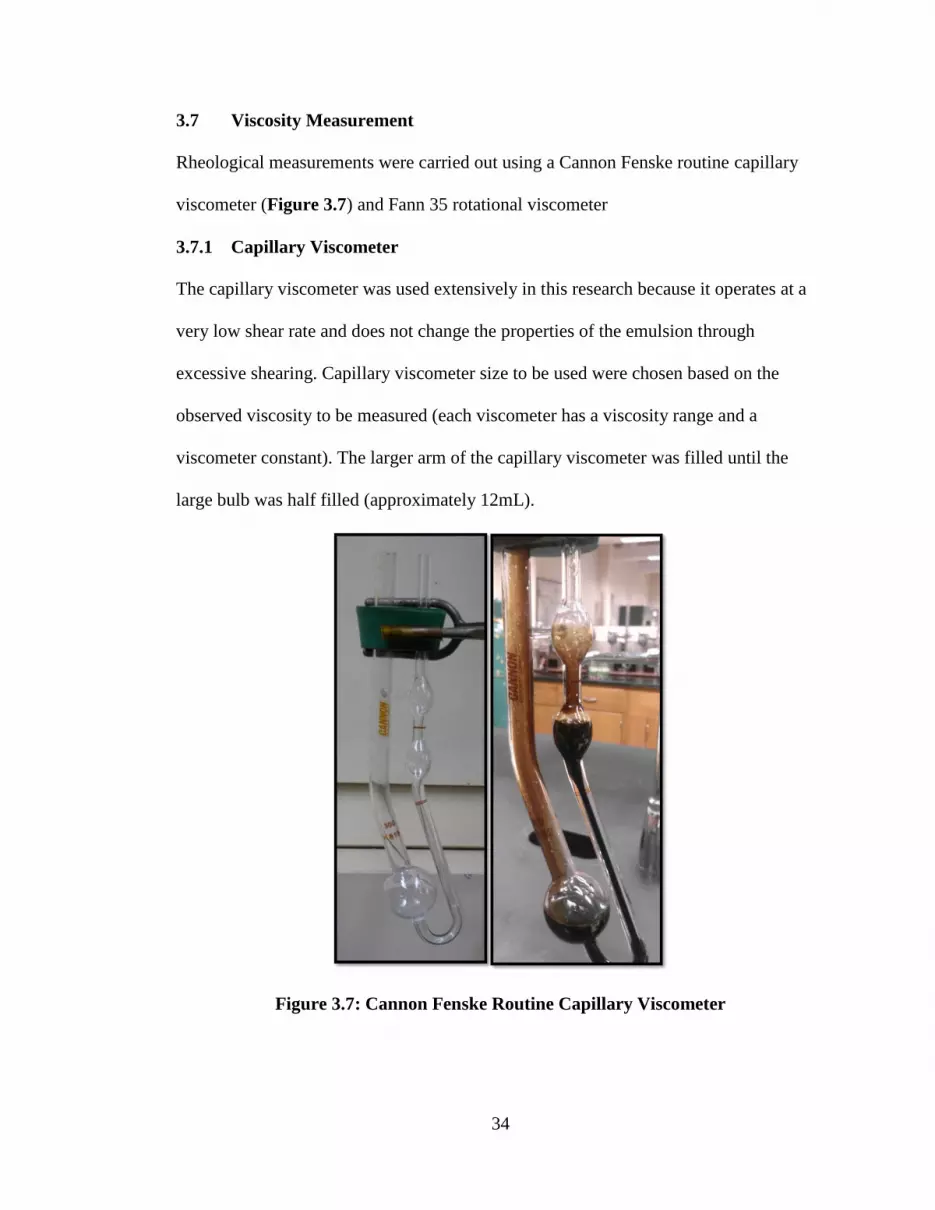
Rheological measurements were carried out using a Cannon Fenske routine capillary
viscometer (Figure 3.7) and Fann 35 rotational viscometer
3.7.1 Capillary Viscometer
The capillary viscometer was used extensively in this research because it operates at a
very low shear rate and does not change the properties of the emulsion through
excessive shearing. Capillary viscometer size to be used were chosen based on the
observed viscosity to be measured (each viscometer has a viscosity range and a
viscometer constant). The larger arm of the capillary viscometer was filled until the
large bulb was half filled (approximately 12mL).
Figure 3.7: Cannon Fenske Routine Capillary Viscometer

35
A suction bulb was used to draw the emulsion up the smaller bulb until it goes past the
upper etched mark. A stop watch is then used to take the time it takes the emulsion to
flow from the upper etched mark to the lower mark (the efflux time). The efflux time is
multiplied by the viscometer constant to get the kinematic viscosity (in cSt). The
dynamic viscosity (cP) is calculated by multiplying the kinematic viscosity by density
of emulsion. Density of emulsion was calculated as weighted fraction of the density of
the constituent oil and water. The concentration of the surfactant does not significantly
affect the density of the emulsion therefore it was not included in the calculation.
Experimental measurement confirms the calculated density. If the calculated viscosity
falls outside the range of that viscometer, the next higher viscometer size was used to
measure the viscosity again.
It is important to note that the efflux time was taken in a single pass down the
viscometer. Repeat measurements were only taken after washing the viscometer using a
procedure described in the next section
3.7.2 Washing of the Capillary Viscometer
In order to ensure reproducibility of viscosity, it was important to have a procedure for
washing the glass viscometers so that the wettability of the glass surface does not
change with each measurement. The procedure used for washing involves; first the
sample used is poured out into a waste container, then toluene is sucked up through the
bulbs several times to dissolve any remaining oil. Tap water is thereafter passed through
the viscometer until any remaining toluene is cleaned off. Finally, acetone is used to
dissolve any remaining water before the viscometer is dried in a stream of dry air.
36
3.7.3 Fann 35 Rotational Viscometer
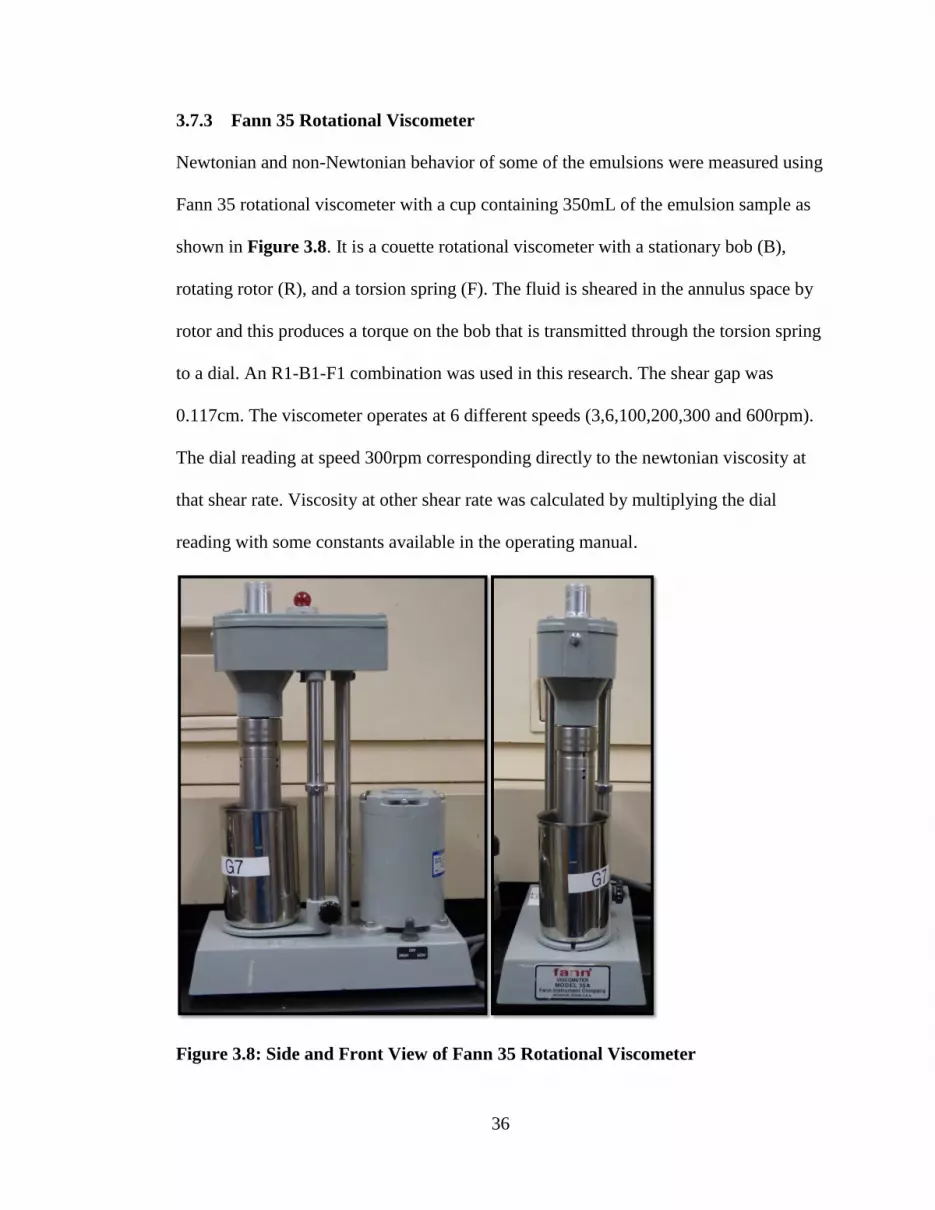
Newtonian and non-Newtonian behavior of some of the emulsions were measured using
Fann 35 rotational viscometer with a cup containing 350mL of the emulsion sample as
shown in Figure 3.8. It is a couette rotational viscometer with a stationary bob (B),
rotating rotor (R), and a torsion spring (F). The fluid is sheared in the annulus space by
rotor and this produces a torque on the bob that is transmitted through the torsion spring
to a dial. An R1-B1-F1 combination was used in this research. The shear gap was
0.117cm. The viscometer operates at 6 different speeds (3,6,100,200,300 and 600rpm).
The dial reading at speed 300rpm corresponding directly to the newtonian viscosity at
that shear rate. Viscosity at other shear rate was calculated by multiplying the dial
reading with some constants available in the operating manual.
Figure 3.8: Side and Front View of Fann 35 Rotational Viscometer

37
Before any measurement was taken the viscometer was checked with a 50cP (at 25oC)
viscosity standard. To measure the viscosity, the dial reading was taken at all six speed
starting with the lowest. Time effect was investigated by first operating at each speed
for 2minutes (total of 12minutes for all six speeds) and then repeating the measurements
again starting from the lowest speed for another 12minutes and so on up to 60minutes.
3.8 TAN and TBN Measurements
TAN and TBN correspond to the mass of potassium hydroxide (KOH) needed to
neutralize the acids contained in 1g of the crude oil. Whereas the TAN uses a base as
the titrant (KOH), the TBN uses an acid (perchloric acid) as the titrant. The amount of
acid used in the TBN is converted to an equivalent KOH mass. Both TAN and TBN are
expressed in mgKOH/g.
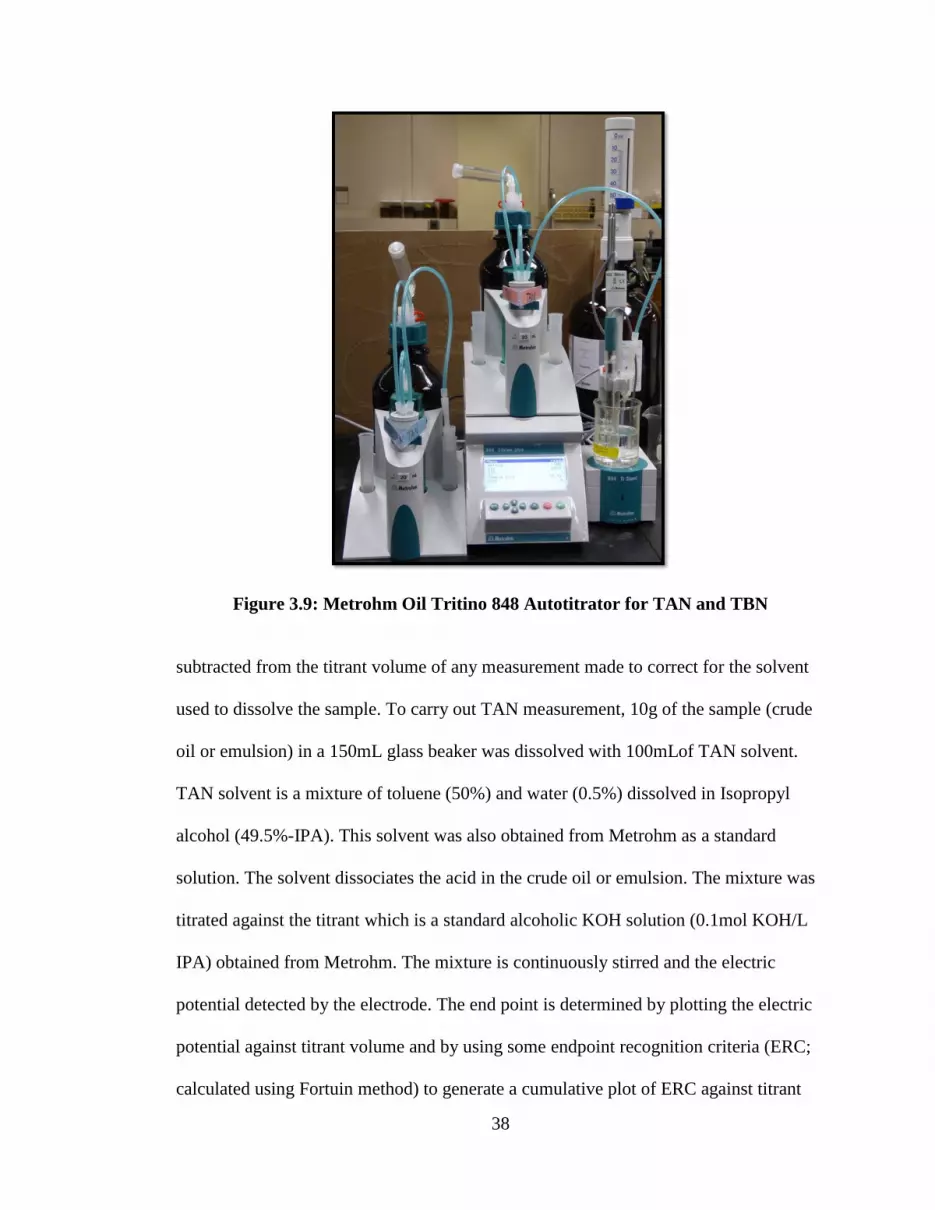
Acid and base fraction present in the crude oil and its emulsion were measured using a
Metrohm autotitrator (model 848) oil tritino plus with a solvotrode electrode shown in
Figure 3.9. The setup consists of the control unit on which the exchange unit slides on.
There are two exchange units: one for TAN and the other for TBN. Each exchange unit
has its own separate titrant bottles. The stirrer and the electrode are mounted on an
adjustable stand. Two dosing units are also available for adding the solvent.
Standard ASTM D664 and D2896 procedure were followed for TAN and TBN
measurement respectively . The titrator was configured to follow these procedures.
TAN measurement makes use of the Monotonic Equivalence point titration method
(MET). In MET titration, the reagent is added in a constant volume step. Before
carrying out any TAN measurement, the TAN of the solvent is first determined and
stored in the control unit memory. This volume is
38
Figure 3.9: Metrohm Oil Tritino 848 Autotitrator for TAN and TBN
subtracted from the titrant volume of any measurement made to correct for the solvent
used to dissolve the sample. To carry out TAN measurement, 10g of the sample (crude
oil or emulsion) in a 150mL glass beaker was dissolved with 100mLof TAN solvent.
TAN solvent is a mixture of toluene (50%) and water (0.5%) dissolved in Isopropyl
alcohol (49.5%-IPA). This solvent was also obtained from Metrohm as a standard
solution. The solvent dissociates the acid in the crude oil or emulsion. The mixture was
titrated against the titrant which is a standard alcoholic KOH solution (0.1mol KOH/L
IPA) obtained from Metrohm. The mixture is continuously stirred and the electric
potential detected by the electrode. The end point is determined by plotting the electric
potential against titrant volume and by using some endpoint recognition criteria (ERC;
calculated using Fortuin method) to generate a cumulative plot of ERC against titrant
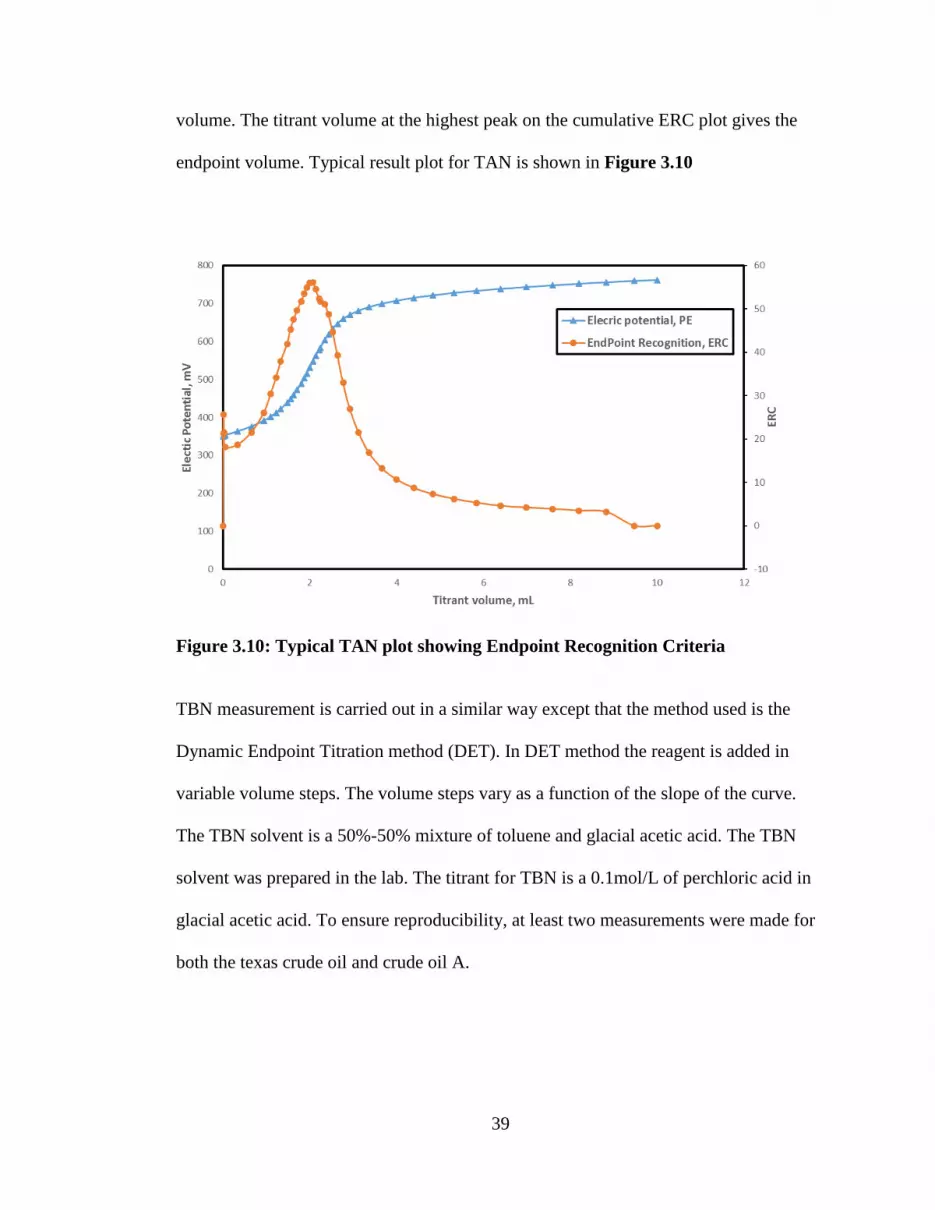
39
volume. The titrant volume at the highest peak on the cumulative ERC plot gives the
endpoint volume. Typical result plot for TAN is shown in Figure 3.10
Figure 3.10: Typical TAN plot showing Endpoint Recognition Criteria
TBN measurement is carried out in a similar way except that the method used is the
Dynamic Endpoint Titration method (DET). In DET method the reagent is added in
variable volume steps. The volume steps vary as a function of the slope of the curve.
The TBN solvent is a 50%-50% mixture of toluene and glacial acetic acid. The TBN
solvent was prepared in the lab. The titrant for TBN is a 0.1mol/L of perchloric acid in
glacial acetic acid. To ensure reproducibility, at least two measurements were made for
both the texas crude oil and crude oil A.
40
CHAPTER 4
RESULTS AND DISCUSSION
This chapter presents and discusses the results of the research
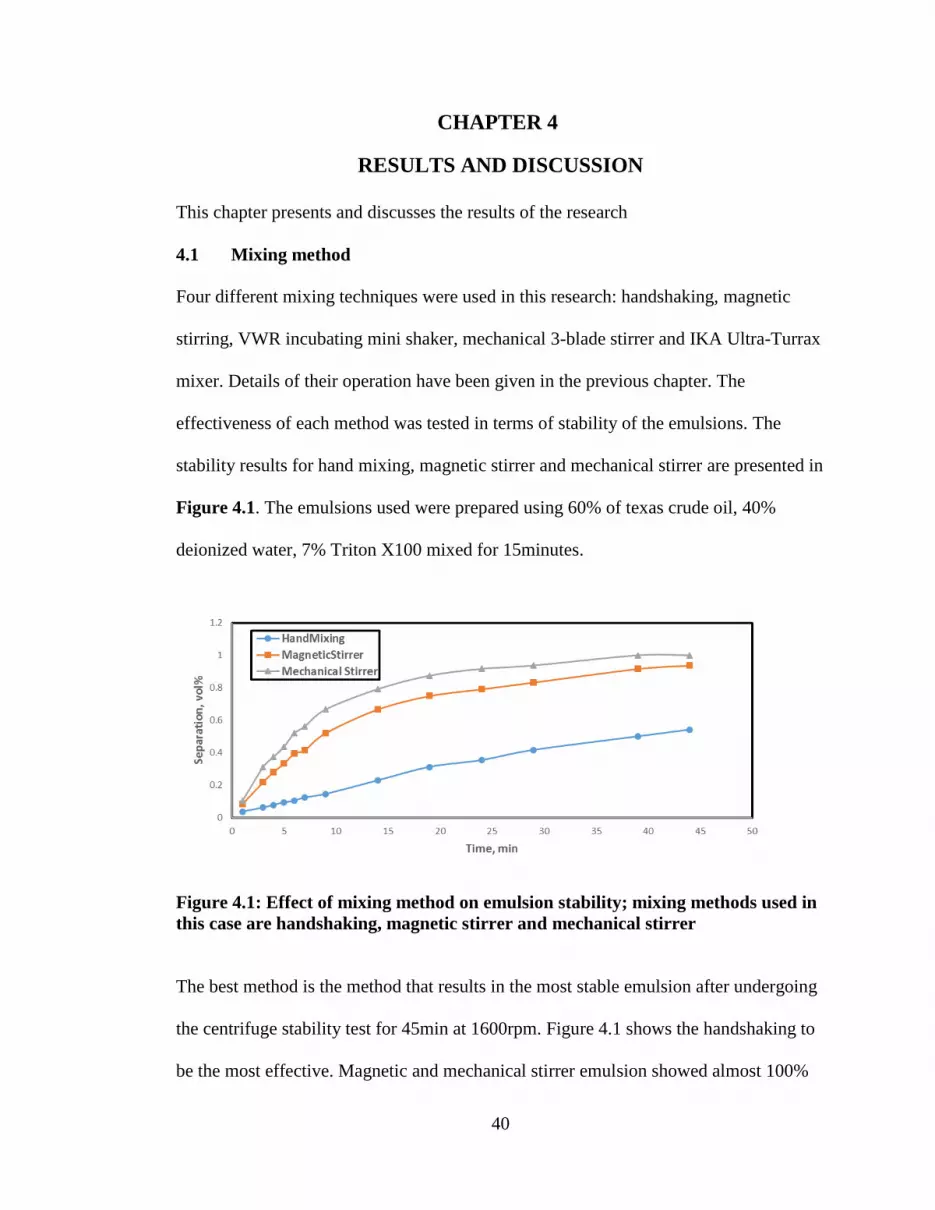
4.1 Mixing method
Four different mixing techniques were used in this research: handshaking, magnetic
stirring, VWR incubating mini shaker, mechanical 3-blade stirrer and IKA Ultra-Turrax
mixer. Details of their operation have been given in the previous chapter. The
effectiveness of each method was tested in terms of stability of the emulsions. The
stability results for hand mixing, magnetic stirrer and mechanical stirrer are presented in
Figure 4.1. The emulsions used were prepared using 60% of texas crude oil, 40%
deionized water, 7% Triton X100 mixed for 15minutes.
Figure 4.1: Effect of mixing method on emulsion stability; mixing methods used in
this case are handshaking, magnetic stirrer and mechanical stirrer
The best method is the method that results in the most stable emulsion after undergoing
the centrifuge stability test for 45min at 1600rpm. Figure 4.1 shows the handshaking to
be the most effective. Magnetic and mechanical stirrer emulsion showed almost 100%
41
separation after a few minutes. The reason for this is because hand mixing allows the
bulk of the fluid to be agitated while magnetic and mechanical stirrer can only produce
localized mixing because of the orientation of their blade. They only mix the fluids at
the level of their blade orientation in the emulsification vessel. Sometimes after mixing
an oil layer could be seen at the top. Hand mixing, even though effective can only be
used to mix very small amount of sample and requires a lot of effort to sustain mixing
for long period hence it use was discontinued.
VWR mini incubating shaker could not produce stable emulsion because it only
vibrates. The orbit radius was too small to provide complete mixing of the fluids. There
were four spots on the mixer and each spot produced very different emulsion in
viscosity and stability i.e. the emulsions were not homogenous
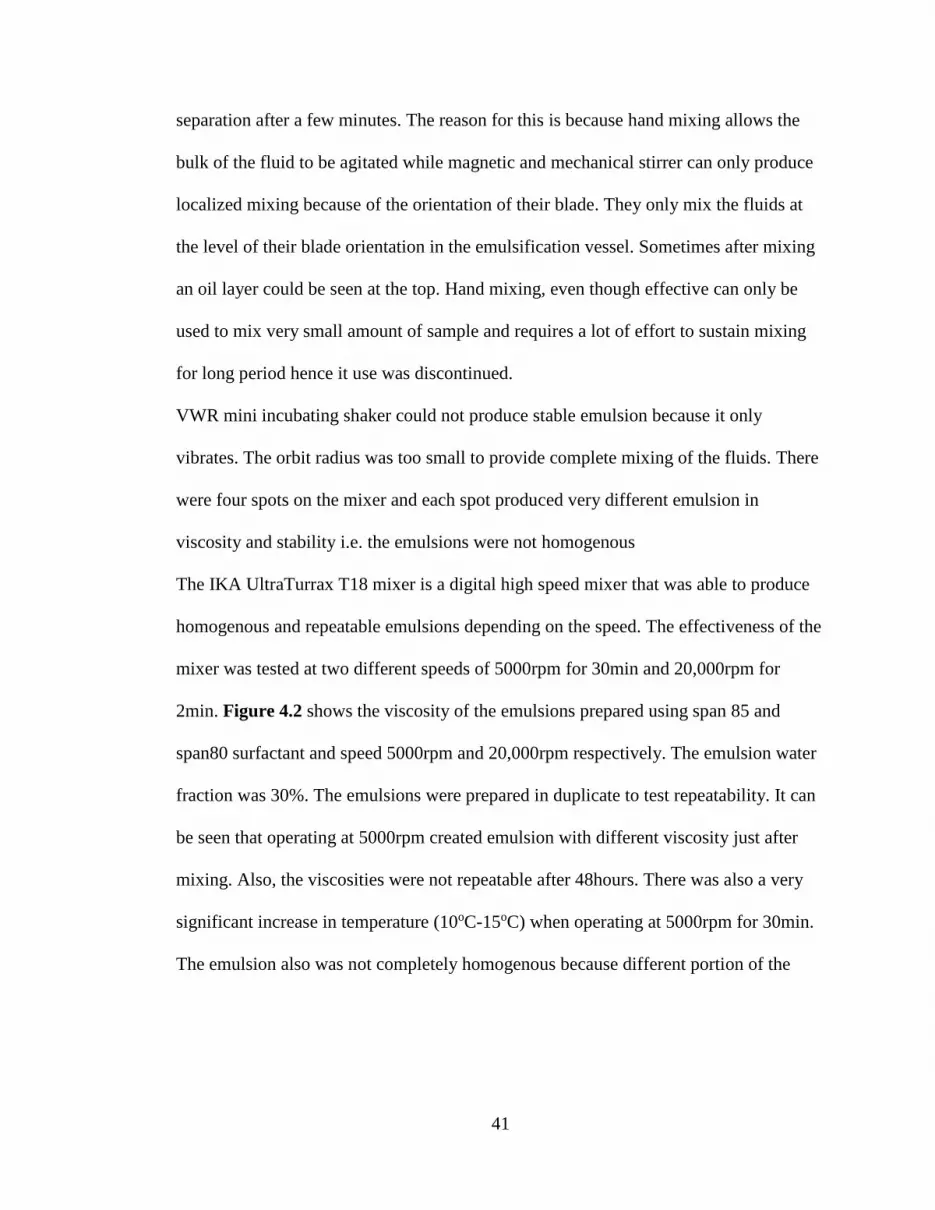
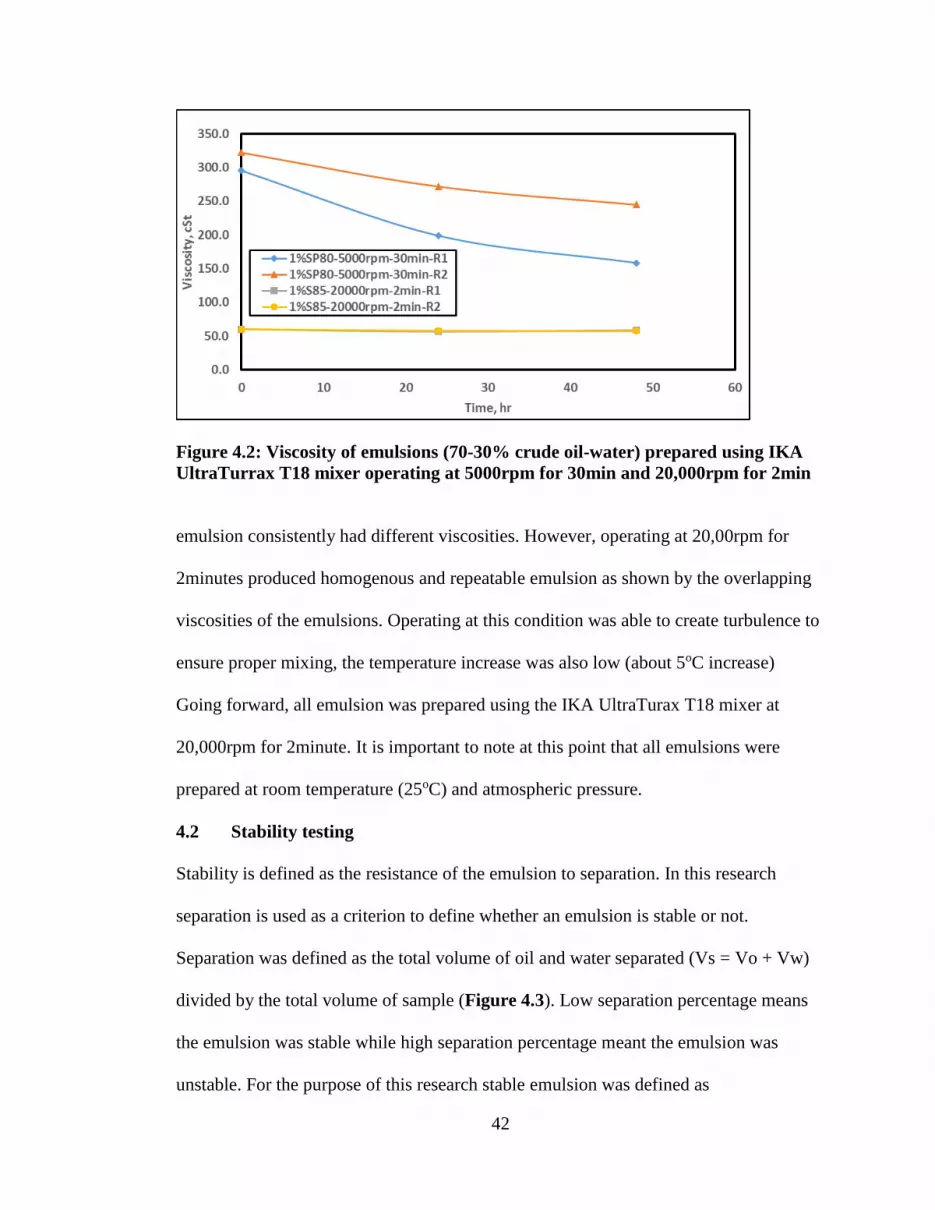
The IKA UltraTurrax T18 mixer is a digital high speed mixer that was able to produce
homogenous and repeatable emulsions depending on the speed. The effectiveness of the
mixer was tested at two different speeds of 5000rpm for 30min and 20,000rpm for
2min. Figure 4.2 shows the viscosity of the emulsions prepared using span 85 and
span80 surfactant and speed 5000rpm and 20,000rpm respectively. The emulsion water
fraction was 30%. The emulsions were prepared in duplicate to test repeatability. It can
be seen that operating at 5000rpm created emulsion with different viscosity just after
mixing. Also, the viscosities were not repeatable after 48hours. There was also a very
significant increase in temperature (10oC-15oC) when operating at 5000rpm for 30min.
The emulsion also was not completely homogenous because different portion of the
42
Figure 4.2: Viscosity of emulsions (70-30% crude oil-water) prepared using IKA
UltraTurrax T18 mixer operating at 5000rpm for 30min and 20,000rpm for 2min
emulsion consistently had different viscosities. However, operating at 20,00rpm for
2minutes produced homogenous and repeatable emulsion as shown by the overlapping
viscosities of the emulsions. Operating at this condition was able to create turbulence to
ensure proper mixing, the temperature increase was also low (about 5oC increase)
Going forward, all emulsion was prepared using the IKA UltraTurax T18 mixer at
20,000rpm for 2minute. It is important to note at this point that all emulsions were
prepared at room temperature (25oC) and atmospheric pressure.
4.2 Stability testing
Stability is defined as the resistance of the emulsion to separation. In this research
separation is used as a criterion to define whether an emulsion is stable or not.
Separation was defined as the total volume of oil and water separated (Vs = Vo + Vw)
divided by the total volume of sample (Figure 4.3). Low separation percentage means
the emulsion was stable while high separation percentage meant the emulsion was
unstable. For the purpose of this research stable emulsion was defined as
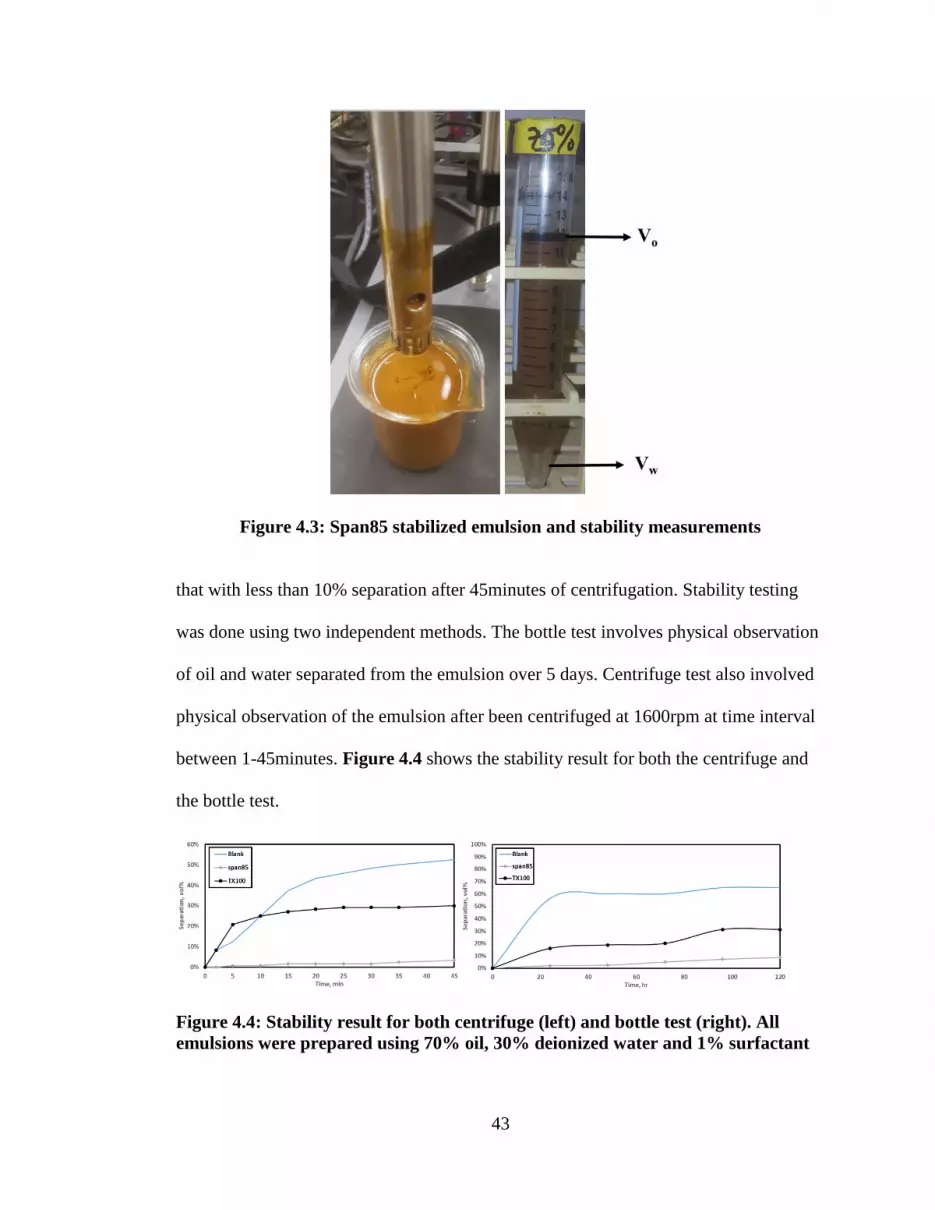
43
Figure 4.3: Span85 stabilized emulsion and stability measurements
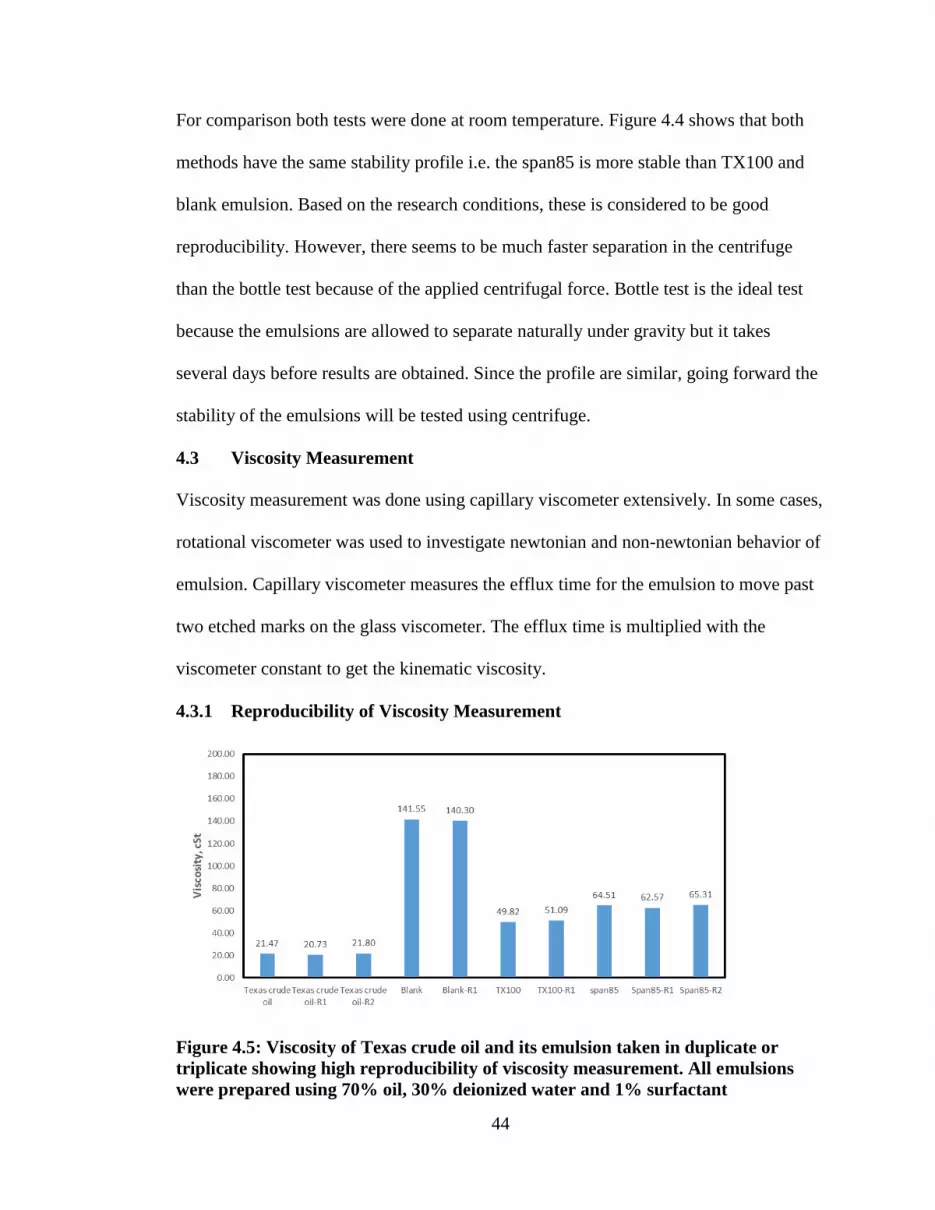
that with less than 10% separation after 45minutes of centrifugation. Stability testing
was done using two independent methods. The bottle test involves physical observation
of oil and water separated from the emulsion over 5 days. Centrifuge test also involved
physical observation of the emulsion after been centrifuged at 1600rpm at time interval
between 1-45minutes. Figure 4.4 shows the stability result for both the centrifuge and
the bottle test.
Figure 4.4: Stability result for both centrifuge (left) and bottle test (right). All
emulsions were prepared using 70% oil, 30% deionized water and 1% surfactant
44
For comparison both tests were done at room temperature. Figure 4.4 shows that both
methods have the same stability profile i.e. the span85 is more stable than TX100 and
blank emulsion. Based on the research conditions, these is considered to be good
reproducibility. However, there seems to be much faster separation in the centrifuge
than the bottle test because of the applied centrifugal force. Bottle test is the ideal test
because the emulsions are allowed to separate naturally under gravity but it takes
several days before results are obtained. Since the profile are similar, going forward the
stability of the emulsions will be tested using centrifuge.
4.3 Viscosity Measurement
Viscosity measurement was done using capillary viscometer extensively. In some cases,
rotational viscometer was used to investigate newtonian and non-newtonian behavior of
emulsion. Capillary viscometer measures the efflux time for the emulsion to move past
two etched marks on the glass viscometer. The efflux time is multiplied with the
viscometer constant to get the kinematic viscosity.
4.3.1 Reproducibility of Viscosity Measurement
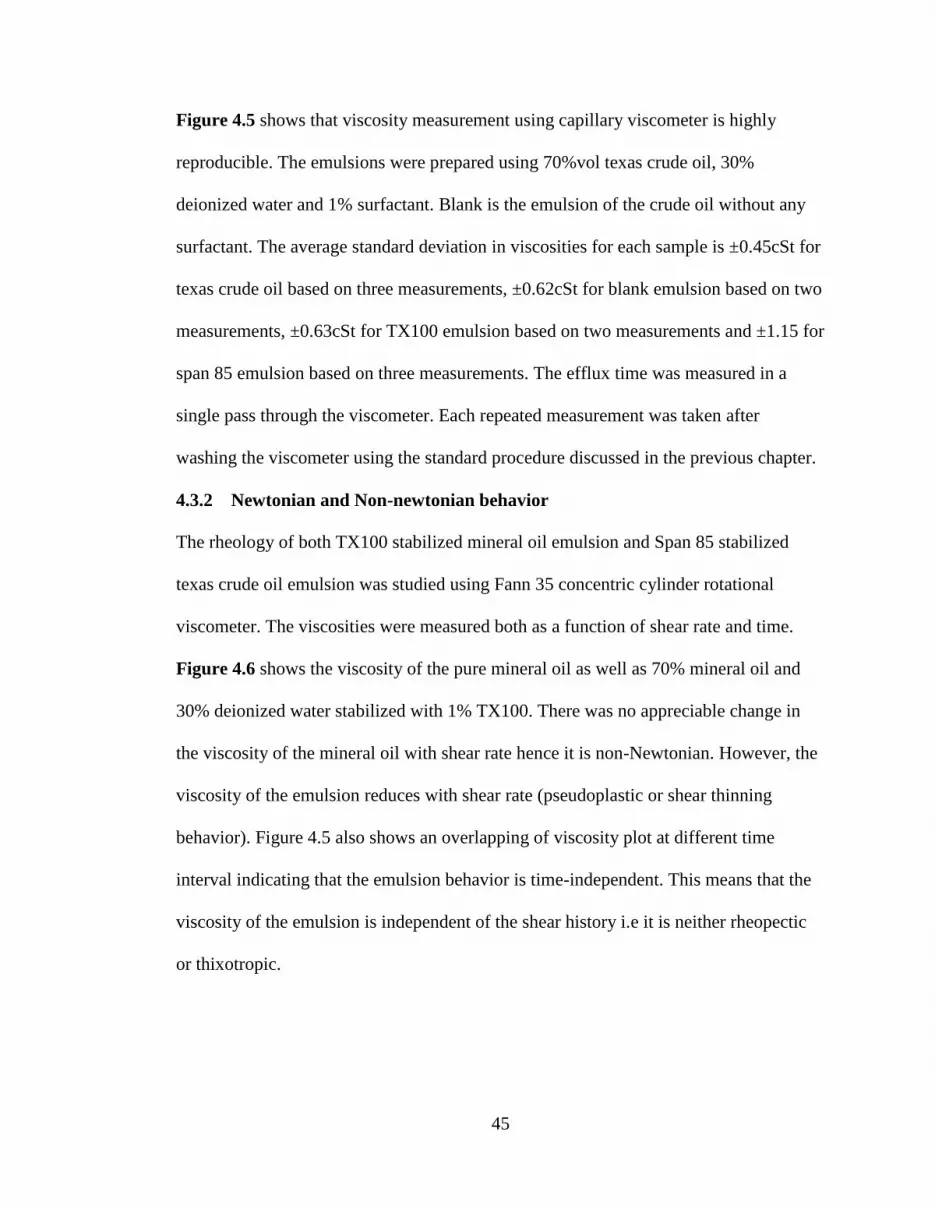
Figure 4.5: Viscosity of Texas crude oil and its emulsion taken in duplicate or
triplicate showing high reproducibility of viscosity measurement. All emulsions
were prepared using 70% oil, 30% deionized water and 1% surfactant
45
Figure 4.5 shows that viscosity measurement using capillary viscometer is highly
reproducible. The emulsions were prepared using 70%vol texas crude oil, 30%
deionized water and 1% surfactant. Blank is the emulsion of the crude oil without any
surfactant. The average standard deviation in viscosities for each sample is ±0.45cSt for
texas crude oil based on three measurements, ±0.62cSt for blank emulsion based on two
measurements, ±0.63cSt for TX100 emulsion based on two measurements and ±1.15 for
span 85 emulsion based on three measurements. The efflux time was measured in a
single pass through the viscometer. Each repeated measurement was taken after
washing the viscometer using the standard procedure discussed in the previous chapter.
4.3.2 Newtonian and Non-newtonian behavior
The rheology of both TX100 stabilized mineral oil emulsion and Span 85 stabilized
texas crude oil emulsion was studied using Fann 35 concentric cylinder rotational
viscometer. The viscosities were measured both as a function of shear rate and time.
Figure 4.6 shows the viscosity of the pure mineral oil as well as 70% mineral oil and
30% deionized water stabilized with 1% TX100. There was no appreciable change in
the viscosity of the mineral oil with shear rate hence it is non-Newtonian. However, the
viscosity of the emulsion reduces with shear rate (pseudoplastic or shear thinning
behavior). Figure 4.5 also shows an overlapping of viscosity plot at different time
interval indicating that the emulsion behavior is time-independent. This means that the
viscosity of the emulsion is independent of the shear history i.e it is neither rheopectic
or thixotropic.
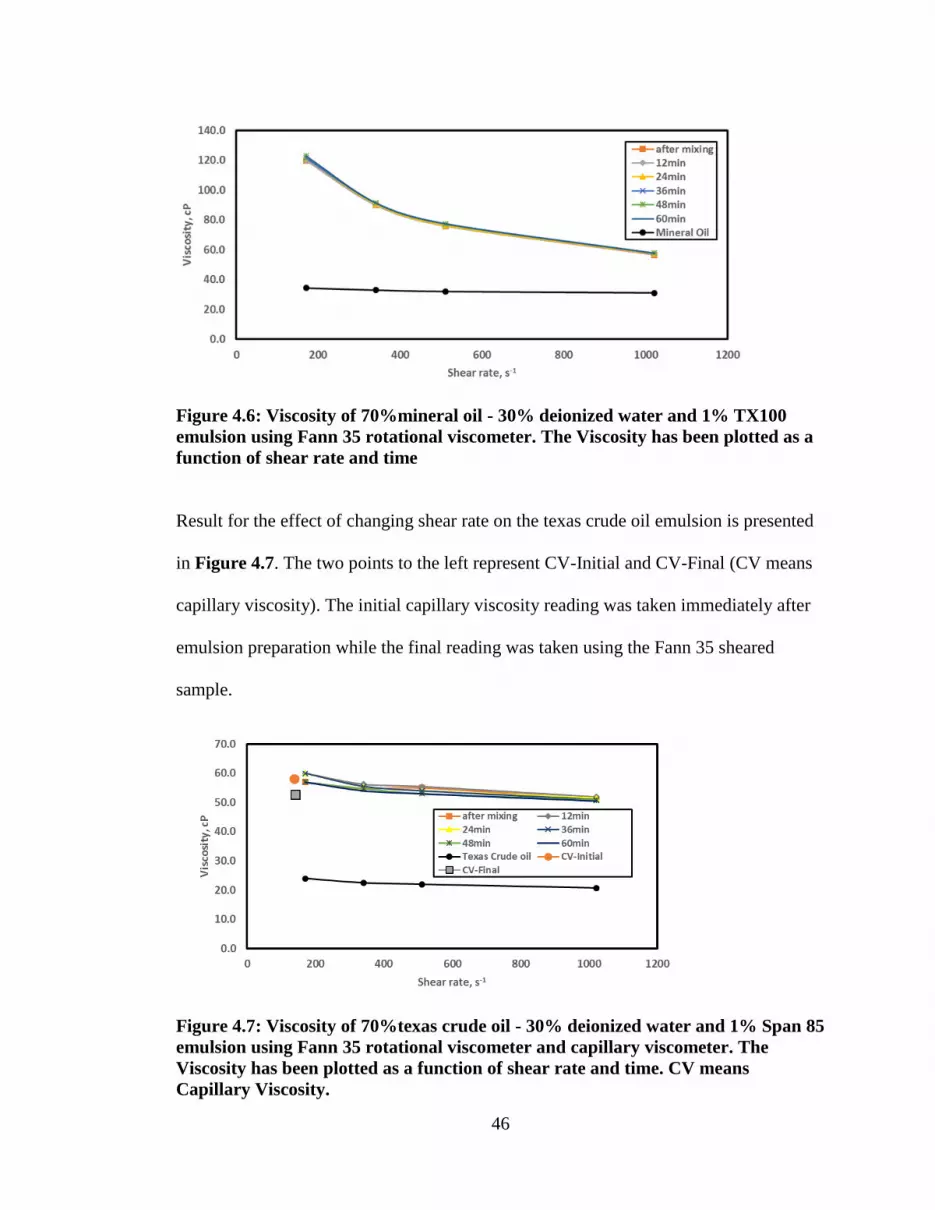
46
Figure 4.6: Viscosity of 70%mineral oil - 30% deionized water and 1% TX100
emulsion using Fann 35 rotational viscometer. The Viscosity has been plotted as a
function of shear rate and time
Result for the effect of changing shear rate on the texas crude oil emulsion is presented
in Figure 4.7. The two points to the left represent CV-Initial and CV-Final (CV means
capillary viscosity). The initial capillary viscosity reading was taken immediately after
emulsion preparation while the final reading was taken using the Fann 35 sheared
sample.
Figure 4.7: Viscosity of 70%texas crude oil - 30% deionized water and 1% Span 85
emulsion using Fann 35 rotational viscometer and capillary viscometer. The
Viscosity has been plotted as a function of shear rate and time. CV means
Capillary Viscosity.
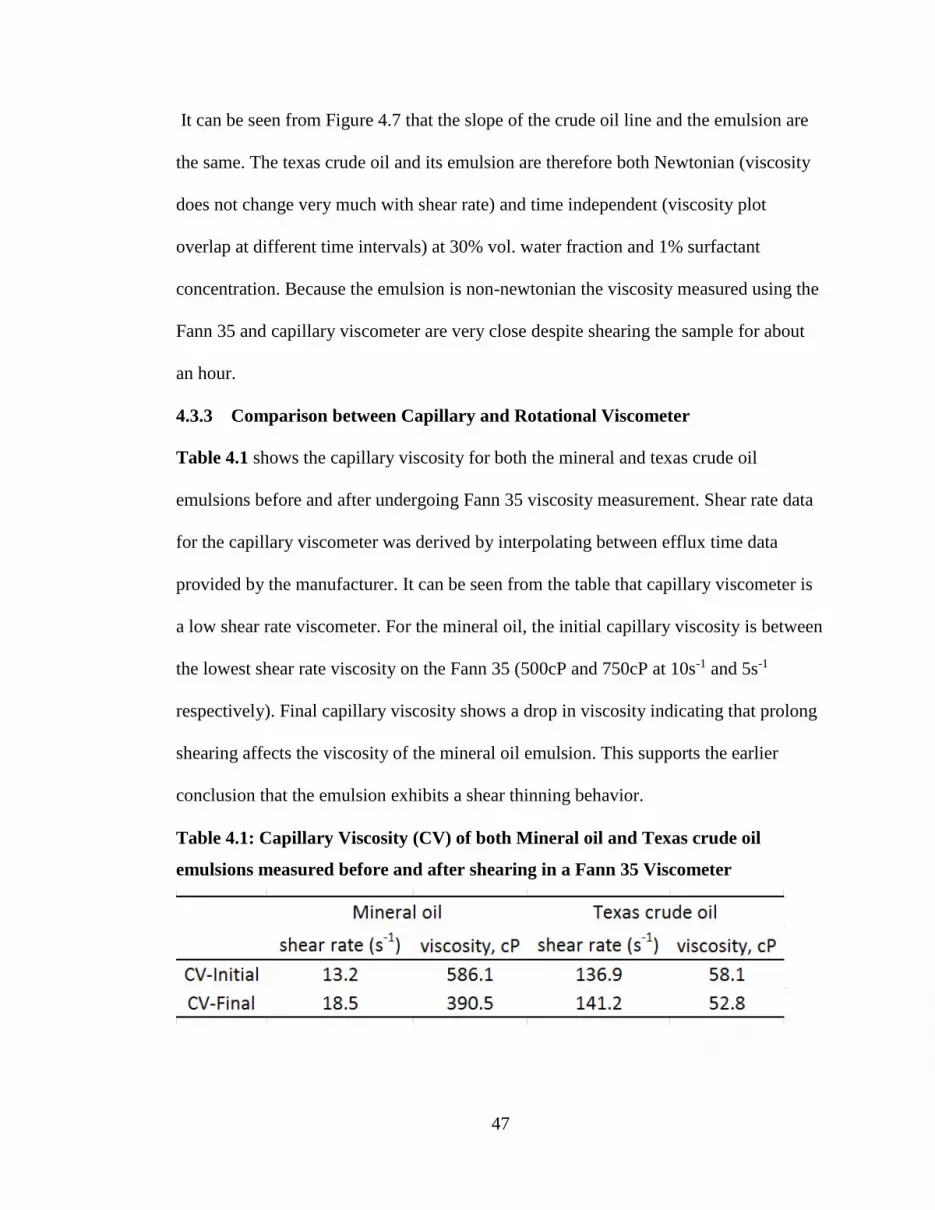
47
It can be seen from Figure 4.7 that the slope of the crude oil line and the emulsion are
the same. The texas crude oil and its emulsion are therefore both Newtonian (viscosity
does not change very much with shear rate) and time independent (viscosity plot
overlap at different time intervals) at 30% vol. water fraction and 1% surfactant
concentration. Because the emulsion is non-newtonian the viscosity measured using the
Fann 35 and capillary viscometer are very close despite shearing the sample for about
an hour.
4.3.3 Comparison between Capillary and Rotational Viscometer
Table 4.1 shows the capillary viscosity for both the mineral and texas crude oil
emulsions before and after undergoing Fann 35 viscosity measurement. Shear rate data
for the capillary viscometer was derived by interpolating between efflux time data
provided by the manufacturer. It can be seen from the table that capillary viscometer is
a low shear rate viscometer. For the mineral oil, the initial capillary viscosity is between
the lowest shear rate viscosity on the Fann 35 (500cP and 750cP at 10s-1 and 5s-1
respectively). Final capillary viscosity shows a drop in viscosity indicating that prolong
shearing affects the viscosity of the mineral oil emulsion. This supports the earlier
conclusion that the emulsion exhibits a shear thinning behavior.
Table 4.1: Capillary Viscosity (CV) of both Mineral oil and Texas crude oil
emulsions measured before and after shearing in a Fann 35 Viscometer
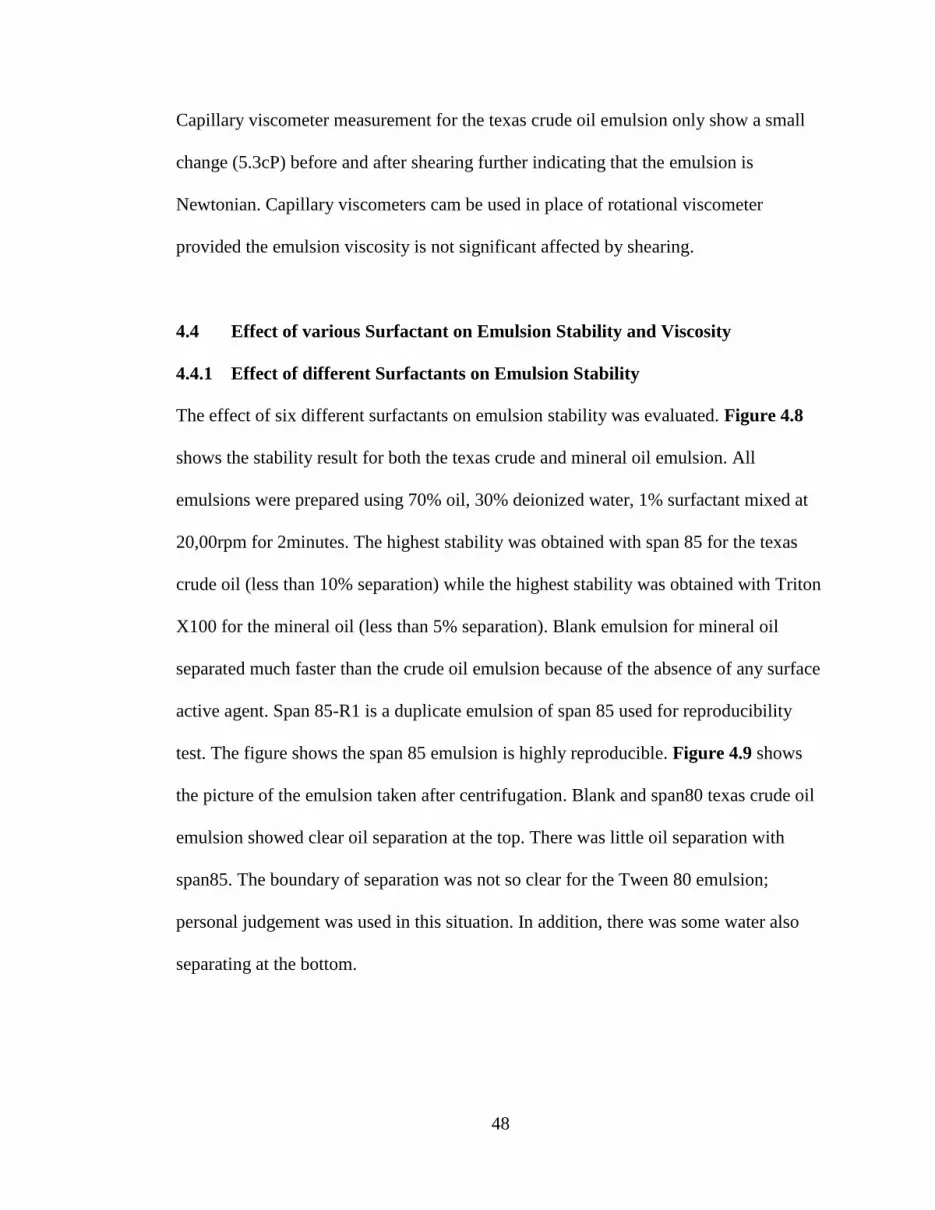
48
Capillary viscometer measurement for the texas crude oil emulsion only show a small
change (5.3cP) before and after shearing further indicating that the emulsion is
Newtonian. Capillary viscometers cam be used in place of rotational viscometer
provided the emulsion viscosity is not significant affected by shearing.
4.4 Effect of various Surfactant on Emulsion Stability and Viscosity
4.4.1 Effect of different Surfactants on Emulsion Stability
The effect of six different surfactants on emulsion stability was evaluated. Figure 4.8
shows the stability result for both the texas crude and mineral oil emulsion. All
emulsions were prepared using 70% oil, 30% deionized water, 1% surfactant mixed at
20,00rpm for 2minutes. The highest stability was obtained with span 85 for the texas
crude oil (less than 10% separation) while the highest stability was obtained with Triton
X100 for the mineral oil (less than 5% separation). Blank emulsion for mineral oil
separated much faster than the crude oil emulsion because of the absence of any surface
active agent. Span 85-R1 is a duplicate emulsion of span 85 used for reproducibility
test. The figure shows the span 85 emulsion is highly reproducible. Figure 4.9 shows
the picture of the emulsion taken after centrifugation. Blank and span80 texas crude oil
emulsion showed clear oil separation at the top. There was little oil separation with
span85. The boundary of separation was not so clear for the Tween 80 emulsion;
personal judgement was used in this situation. In addition, there was some water also
separating at the bottom.

49
Figure 4.8: Centrifuge stability result for crude oil emulsion (upper) and mineral
oil emulsion (lower). All emulsions were prepared using 70%oil, 30%deionized
water, 1% surfactant mixed at 20000rpm for 2minutes
It was a lot easier to read separating volumes for the mineral oil. The lower HLB
surfactant emulsion (span80 and span85) had oil separating out while the high HLB
surfactant (Twee80 and TX100) had water separating out or no separation happening at
all.
Further studies were also carried out to investigate the quantitative increase in stability
by adding span85. Figure 4.10 shows the effect of adding 1% span85 to texas crude oil
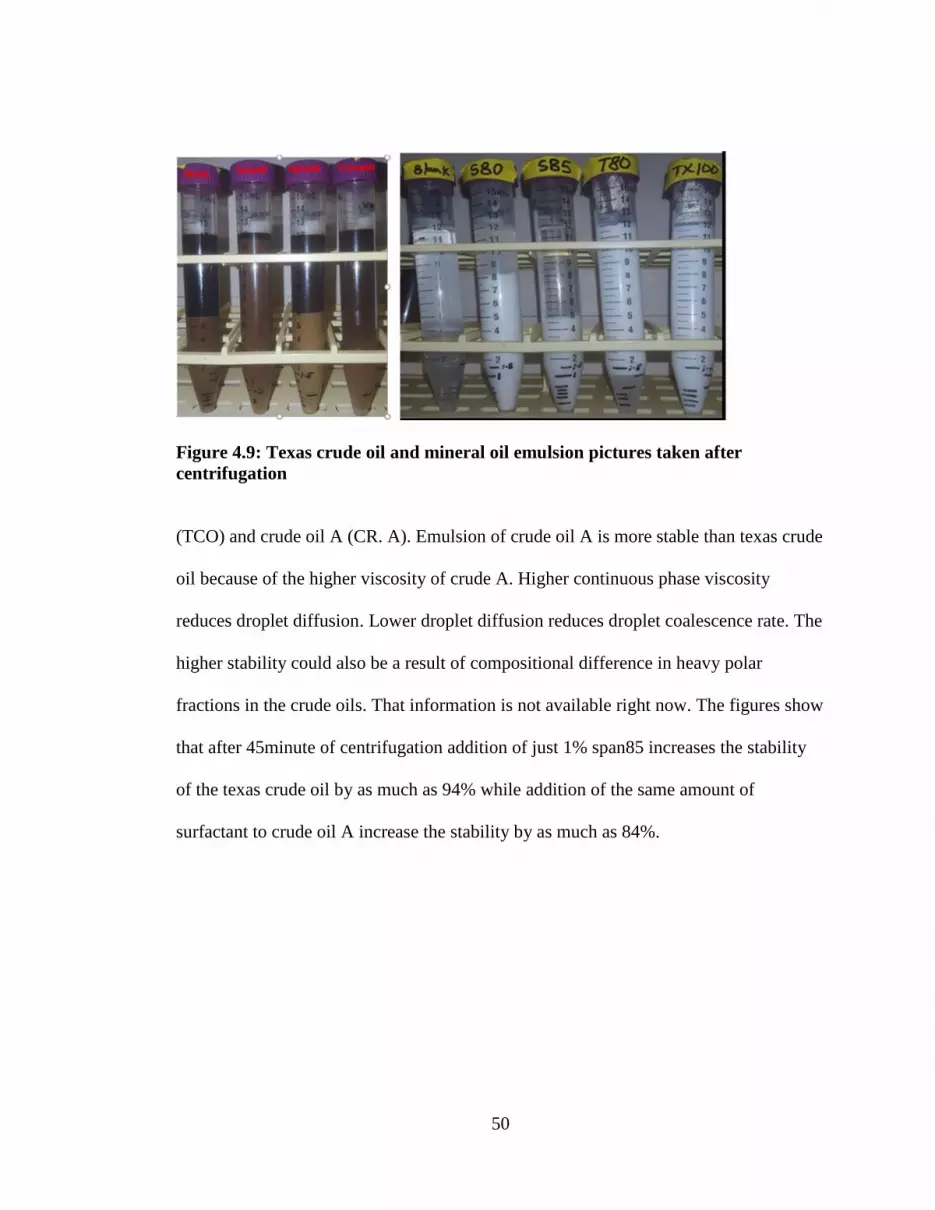
50
Figure 4.9: Texas crude oil and mineral oil emulsion pictures taken after
centrifugation
(TCO) and crude oil A (CR. A). Emulsion of crude oil A is more stable than texas crude
oil because of the higher viscosity of crude A. Higher continuous phase viscosity
reduces droplet diffusion. Lower droplet diffusion reduces droplet coalescence rate. The
higher stability could also be a result of compositional difference in heavy polar
fractions in the crude oils. That information is not available right now. The figures show
that after 45minute of centrifugation addition of just 1% span85 increases the stability
of the texas crude oil by as much as 94% while addition of the same amount of
surfactant to crude oil A increase the stability by as much as 84%.
51
Figure 4.10: Stability result for texas crude oil and crude oil A emulsion showing
increased stability due to addition of just 1% span85 surfactant. All emulsions
were prepared using 70%oil, 30%deionized water, 1% surfactant mixed at
20000rpm for 2minutes.
4.4.2 Effect of different Surfactant on Emulsion Viscosity
Figure 4.11 and Figure 4.12 shows the capillary viscosity for different surfactant
stabilized emulsion. The mineral oil viscosity was higher than the viscosity of the crude
oil. Also mineral oil emulsion had higher viscosity than the crude oil emulsion for the
same surfactant. The viscosity of all emulsions were higher than the viscosity of the
base oil. This holds true for both the texas crude oil and the mineral oil. Higher
viscosity than that of the base oil suggests all emulsions were water-in-oil emulsion.
Span 80 emulsions had very high viscosity outside of the range of available capillary
viscometer. It should be mentioned that the viscosity was taken using different
viscometer sizes but it was ensured that the viscosity value falls within the range
specified for that viscometer.
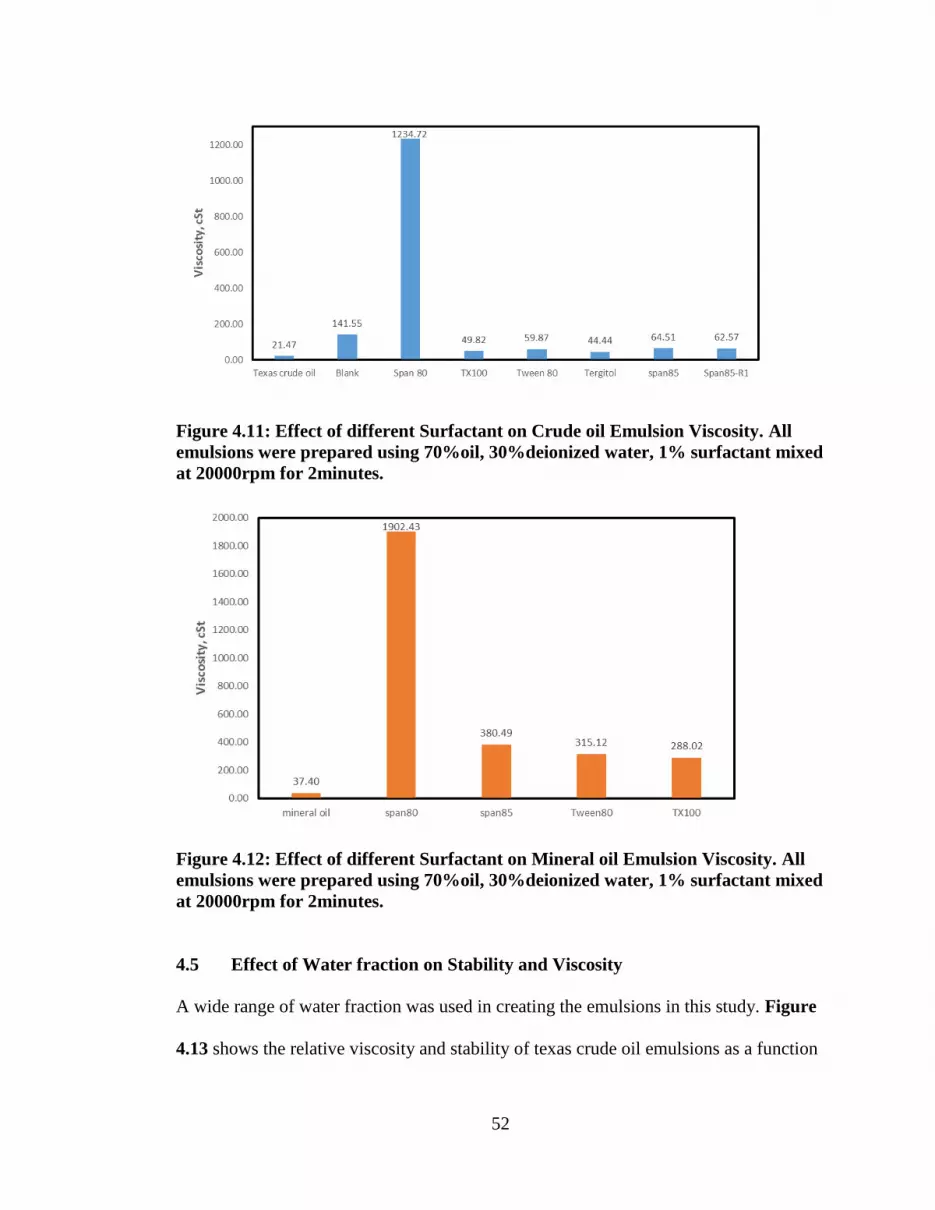
52
Figure 4.11: Effect of different Surfactant on Crude oil Emulsion Viscosity. All
emulsions were prepared using 70%oil, 30%deionized water, 1% surfactant mixed
at 20000rpm for 2minutes.
Figure 4.12: Effect of different Surfactant on Mineral oil Emulsion Viscosity. All
emulsions were prepared using 70%oil, 30%deionized water, 1% surfactant mixed
at 20000rpm for 2minutes.
4.5 Effect of Water fraction on Stability and Viscosity
A wide range of water fraction was used in creating the emulsions in this study. Figure
4.13 shows the relative viscosity and stability of texas crude oil emulsions as a function
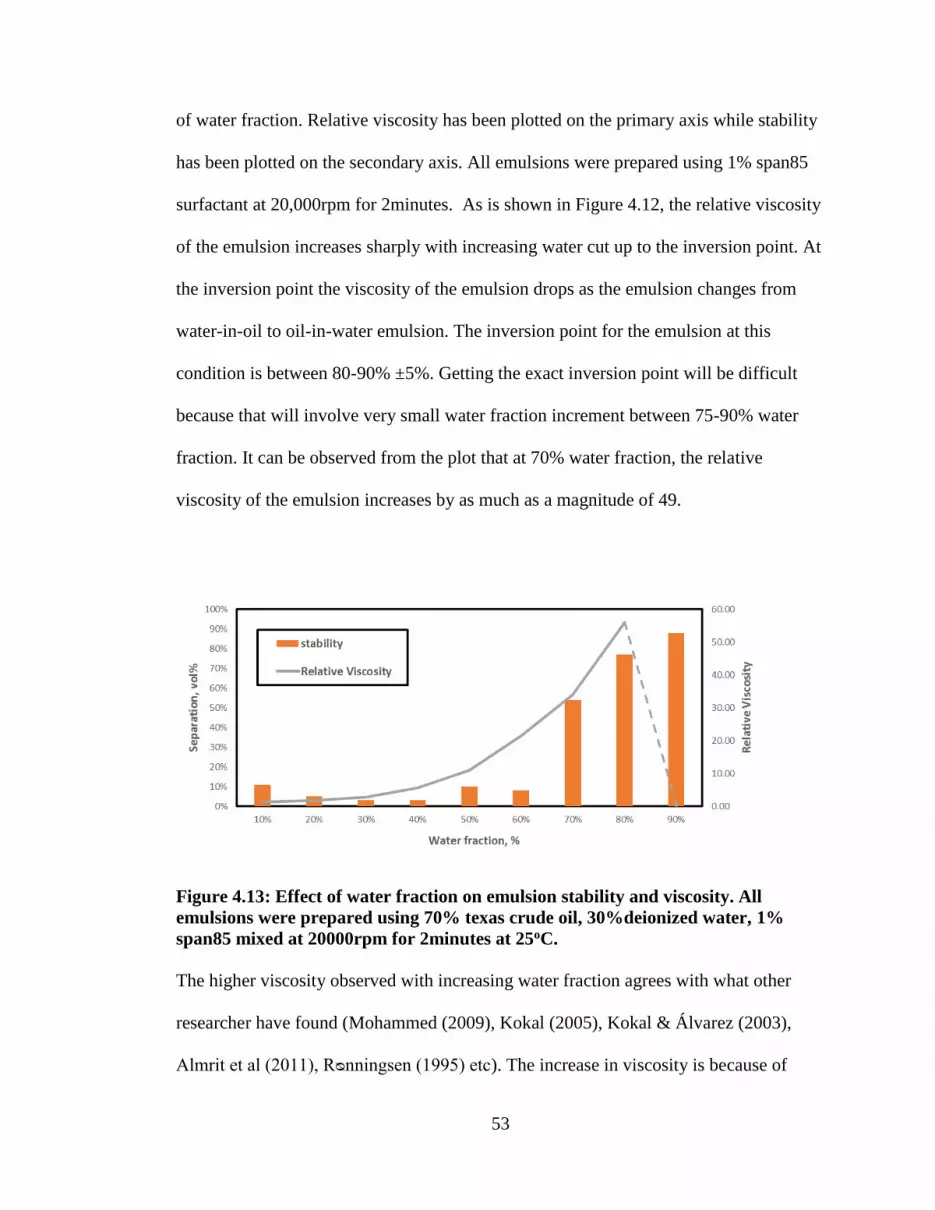
53
of water fraction. Relative viscosity has been plotted on the primary axis while stability
has been plotted on the secondary axis. All emulsions were prepared using 1% span85
surfactant at 20,000rpm for 2minutes. As is shown in Figure 4.12, the relative viscosity
of the emulsion increases sharply with increasing water cut up to the inversion point. At
the inversion point the viscosity of the emulsion drops as the emulsion changes from
water-in-oil to oil-in-water emulsion. The inversion point for the emulsion at this
condition is between 80-90% ±5%. Getting the exact inversion point will be difficult
because that will involve very small water fraction increment between 75-90% water
fraction. It can be observed from the plot that at 70% water fraction, the relative
viscosity of the emulsion increases by as much as a magnitude of 49.
Figure 4.13: Effect of water fraction on emulsion stability and viscosity. All
emulsions were prepared using 70% texas crude oil, 30%deionized water, 1%
span85 mixed at 20000rpm for 2minutes at 25oC.
The higher viscosity observed with increasing water fraction agrees with what other
researcher have found (Mohammed (2009), Kokal (2005), Kokal & Álvarez (2003),
Almrit et al (2011), Rᴓnningsen (1995) etc). The increase in viscosity is because of

54
droplet interaction. Distance between droplets decreases as water fraction increase.
Reduced inter droplet distance increases the van der waal forces of attraction between
the droplets hence a higher resistance to flow. Figure 4.13 also shows that the stability
of the emulsion is closely related to viscosity. Since all water fractions were prepared at
the same surfactant concentration, increased stability can only be a result of the
increasing viscosity of the emulsion. From 10-40% water fraction the stability increases
with increasing viscosity because according to stoke’s law, the rate of settling
(separation) reduces as the viscosity of the emulsion increases. However, as the
inversion point is reached the droplets begin to coagulate and form droplets with a
larger radius. This increased droplet radius overides the effect of increasing viscosity
hence the emulsion becomes unstable and invert.
4.5.1 Time Effect on Emulsion Stability
In order to study the flow of emulsion in pipelines it is important to have emulsion that
do not change properties such as viscosity and stability over time. This is to ensure that
the pipe flow results are consistent and reproducible. The emulsion might also be
prepare at a certain time and then studied at another time. It is therefore important to
know how the properties change over time. Since the most stable emulsion was
produced using span85 it was used to form emulsion at different water fractions. The
emulsions were allowed to settle in a bottle test and their viscosity measured every
24hrs for 48hours. Figure 4.14 is a picture of the emulsion just after preparation and 48
hours after. It can be observed that the color of the emulsion changes from dark brown
at low water fraction to light brown at high water fraction. With time the emulsion
begins to break and the color also begins to change. Each emulsion was prepared in
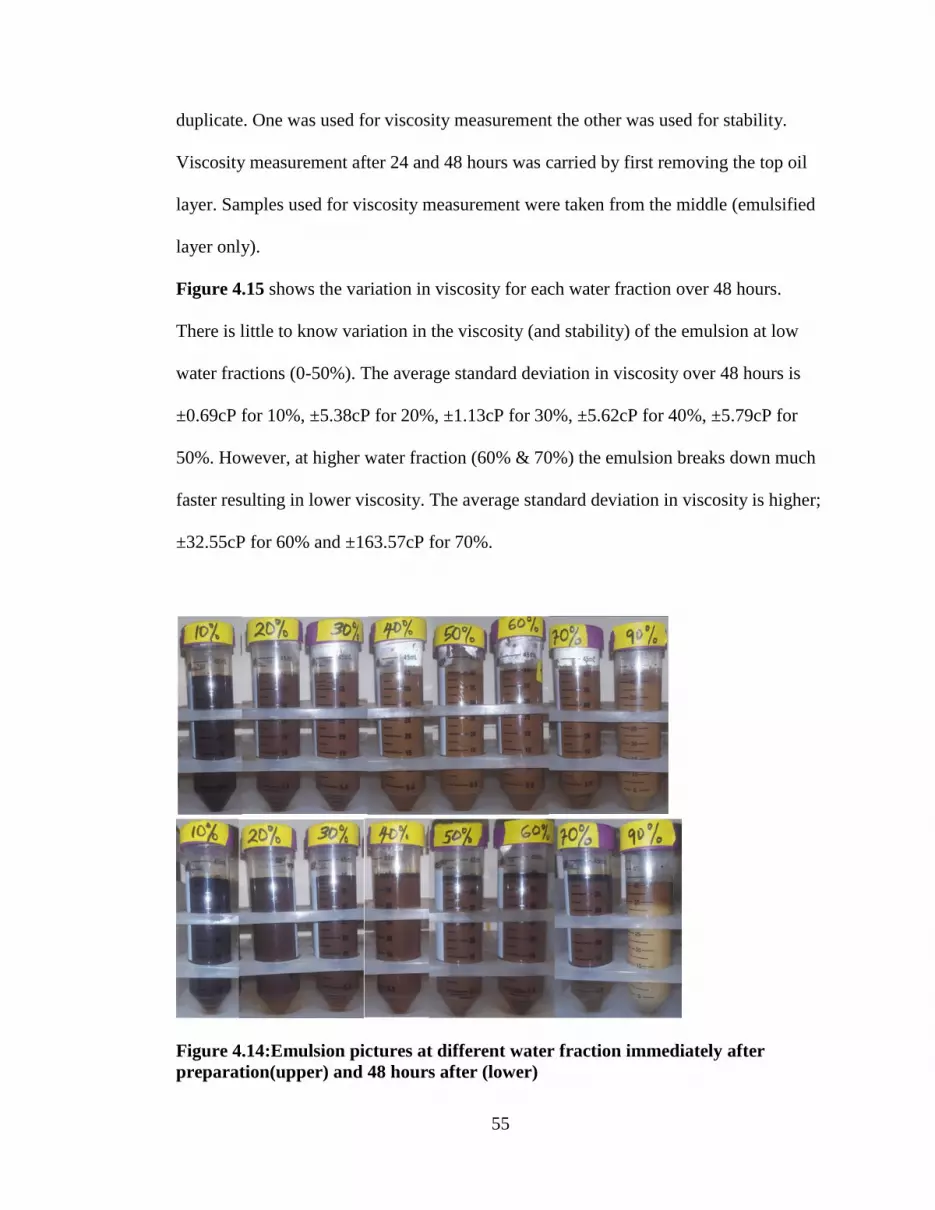
55
duplicate. One was used for viscosity measurement the other was used for stability.
Viscosity measurement after 24 and 48 hours was carried by first removing the top oil
layer. Samples used for viscosity measurement were taken from the middle (emulsified
layer only).
Figure 4.15 shows the variation in viscosity for each water fraction over 48 hours.
There is little to know variation in the viscosity (and stability) of the emulsion at low
water fractions (0-50%). The average standard deviation in viscosity over 48 hours is
±0.69cP for 10%, ±5.38cP for 20%, ±1.13cP for 30%, ±5.62cP for 40%, ±5.79cP for
50%. However, at higher water fraction (60% & 70%) the emulsion breaks down much
faster resulting in lower viscosity. The average standard deviation in viscosity is higher;
±32.55cP for 60% and ±163.57cP for 70%.
Figure 4.14:Emulsion pictures at different water fraction immediately after
preparation(upper) and 48 hours after (lower)
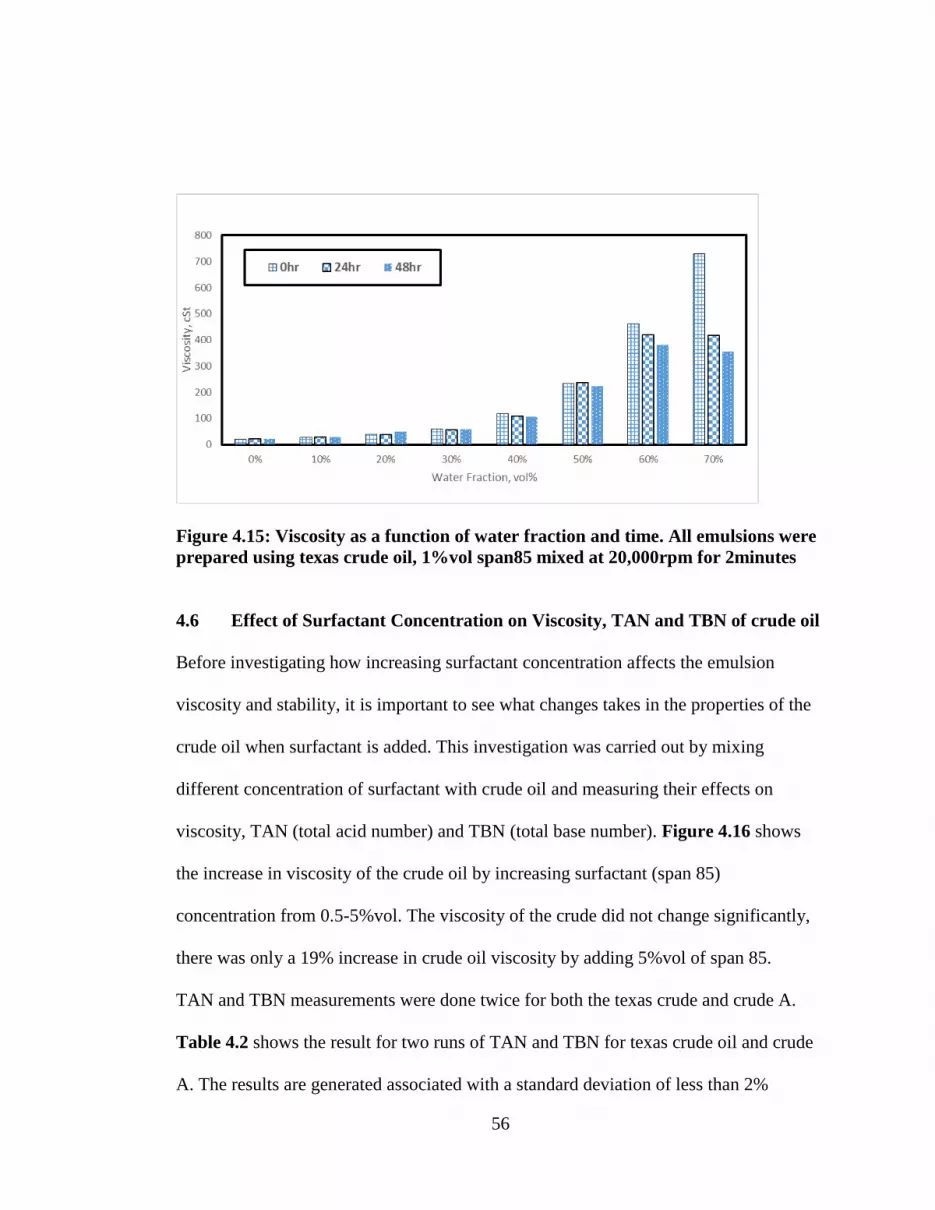
56
Figure 4.15: Viscosity as a function of water fraction and time. All emulsions were
prepared using texas crude oil, 1%vol span85 mixed at 20,000rpm for 2minutes
4.6 Effect of Surfactant Concentration on Viscosity, TAN and TBN of crude oil
Before investigating how increasing surfactant concentration affects the emulsion
viscosity and stability, it is important to see what changes takes in the properties of the
crude oil when surfactant is added. This investigation was carried out by mixing
different concentration of surfactant with crude oil and measuring their effects on
viscosity, TAN (total acid number) and TBN (total base number). Figure 4.16 shows
the increase in viscosity of the crude oil by increasing surfactant (span 85)
concentration from 0.5-5%vol. The viscosity of the crude did not change significantly,
there was only a 19% increase in crude oil viscosity by adding 5%vol of span 85.
TAN and TBN measurements were done twice for both the texas crude and crude A.
Table 4.2 shows the result for two runs of TAN and TBN for texas crude oil and crude
A. The results are generated associated with a standard deviation of less than 2%

57
between runs. The variation is larger in the TBN than the TAN. TBN values for both
crudes are almost the same while texas crude oil has more acids than crude A.
Table 4.2: TAN and TBN of the Crude Oils
Figure 4.17 shows the effect of increasing surfactant concentration on the TAN and
TBN. There was no consistent trend observed in the TBN, the value measured were
consistently close to that of the texas crude after adding different surfactant
concentration. For the TAN however, there was an increase with increasing surfactant
concentration. It is important to note that the surfactant does not contain any acid. The
TAN setup could not detect any titration endpoint for the surfactant.
Figure 4.16: Effect of increasing surfactant concentration on the viscosity of texas
crude oil emulsion
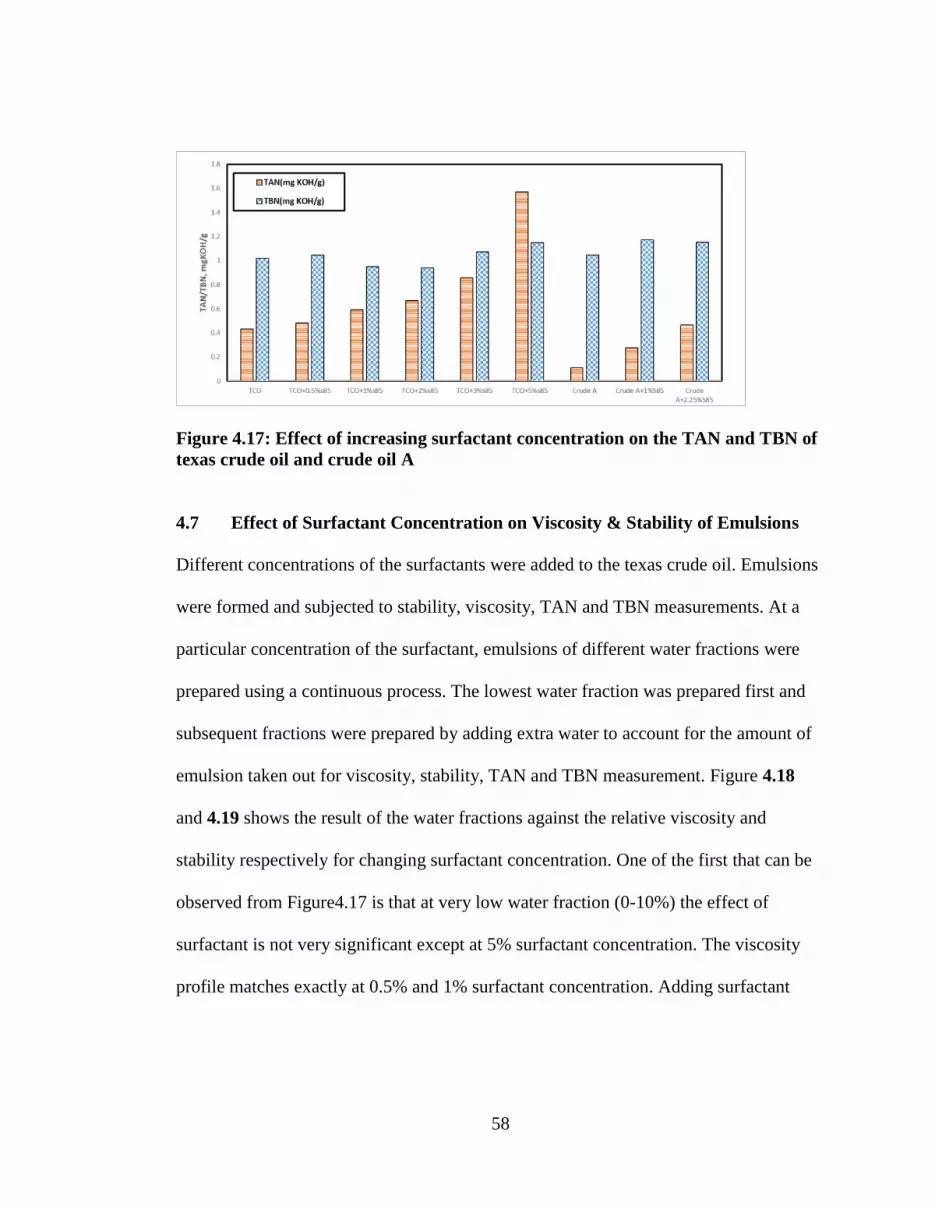
58
Figure 4.17: Effect of increasing surfactant concentration on the TAN and TBN of
texas crude oil and crude oil A
4.7 Effect of Surfactant Concentration on Viscosity & Stability of Emulsions
Different concentrations of the surfactants were added to the texas crude oil. Emulsions
were formed and subjected to stability, viscosity, TAN and TBN measurements. At a
particular concentration of the surfactant, emulsions of different water fractions were
prepared using a continuous process. The lowest water fraction was prepared first and
subsequent fractions were prepared by adding extra water to account for the amount of
emulsion taken out for viscosity, stability, TAN and TBN measurement. Figure 4.18
and 4.19 shows the result of the water fractions against the relative viscosity and
stability respectively for changing surfactant concentration. One of the first that can be
observed from Figure4.17 is that at very low water fraction (0-10%) the effect of
surfactant is not very significant except at 5% surfactant concentration. The viscosity
profile matches exactly at 0.5% and 1% surfactant concentration. Adding surfactant
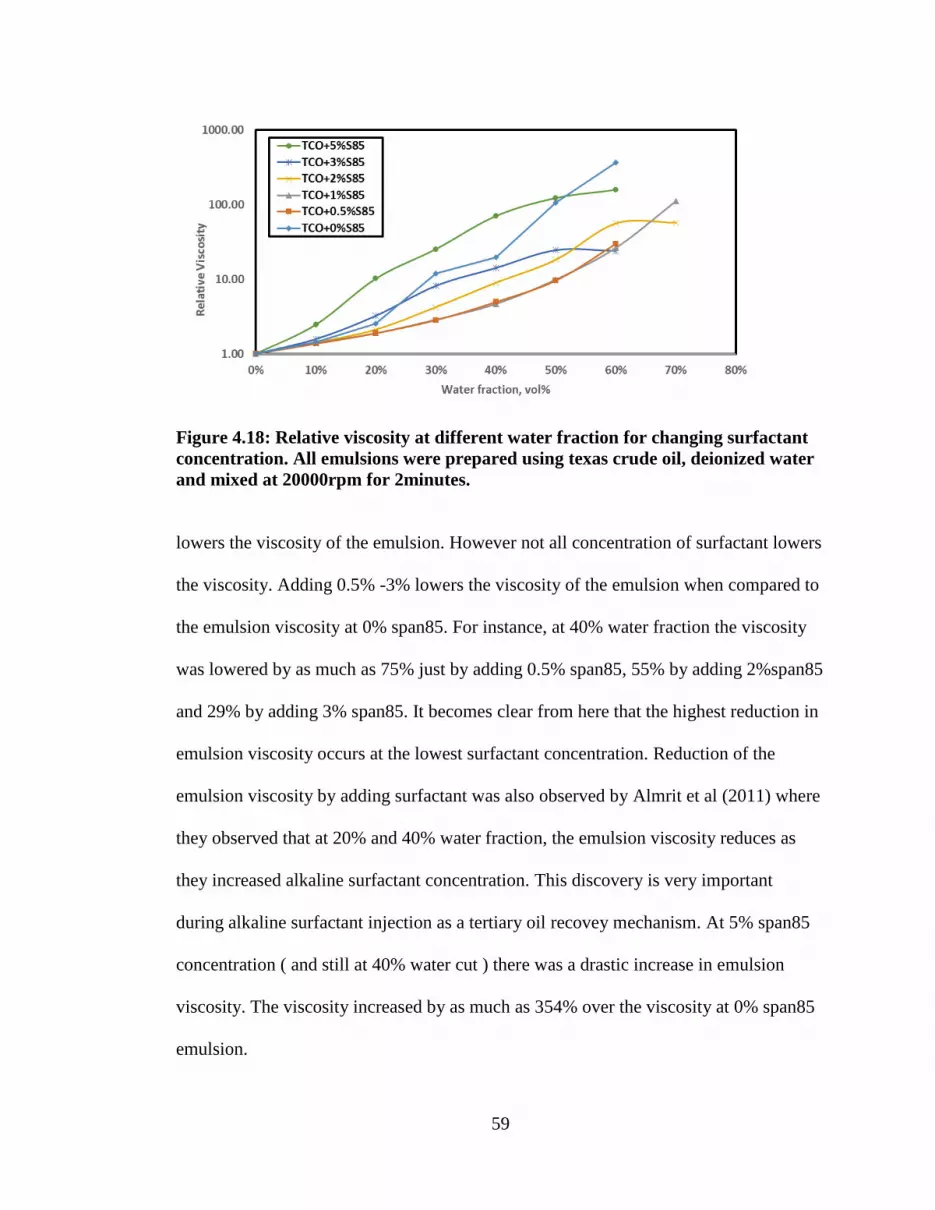
59
Figure 4.18: Relative viscosity at different water fraction for changing surfactant
concentration. All emulsions were prepared using texas crude oil, deionized water
and mixed at 20000rpm for 2minutes.
lowers the viscosity of the emulsion. However not all concentration of surfactant lowers
the viscosity. Adding 0.5% -3% lowers the viscosity of the emulsion when compared to
the emulsion viscosity at 0% span85. For instance, at 40% water fraction the viscosity
was lowered by as much as 75% just by adding 0.5% span85, 55% by adding 2%span85
and 29% by adding 3% span85. It becomes clear from here that the highest reduction in
emulsion viscosity occurs at the lowest surfactant concentration. Reduction of the
emulsion viscosity by adding surfactant was also observed by Almrit et al (2011) where
they observed that at 20% and 40% water fraction, the emulsion viscosity reduces as
they increased alkaline surfactant concentration. This discovery is very important
during alkaline surfactant injection as a tertiary oil recovey mechanism. At 5% span85
concentration ( and still at 40% water cut ) there was a drastic increase in emulsion
viscosity. The viscosity increased by as much as 354% over the viscosity at 0% span85
emulsion.
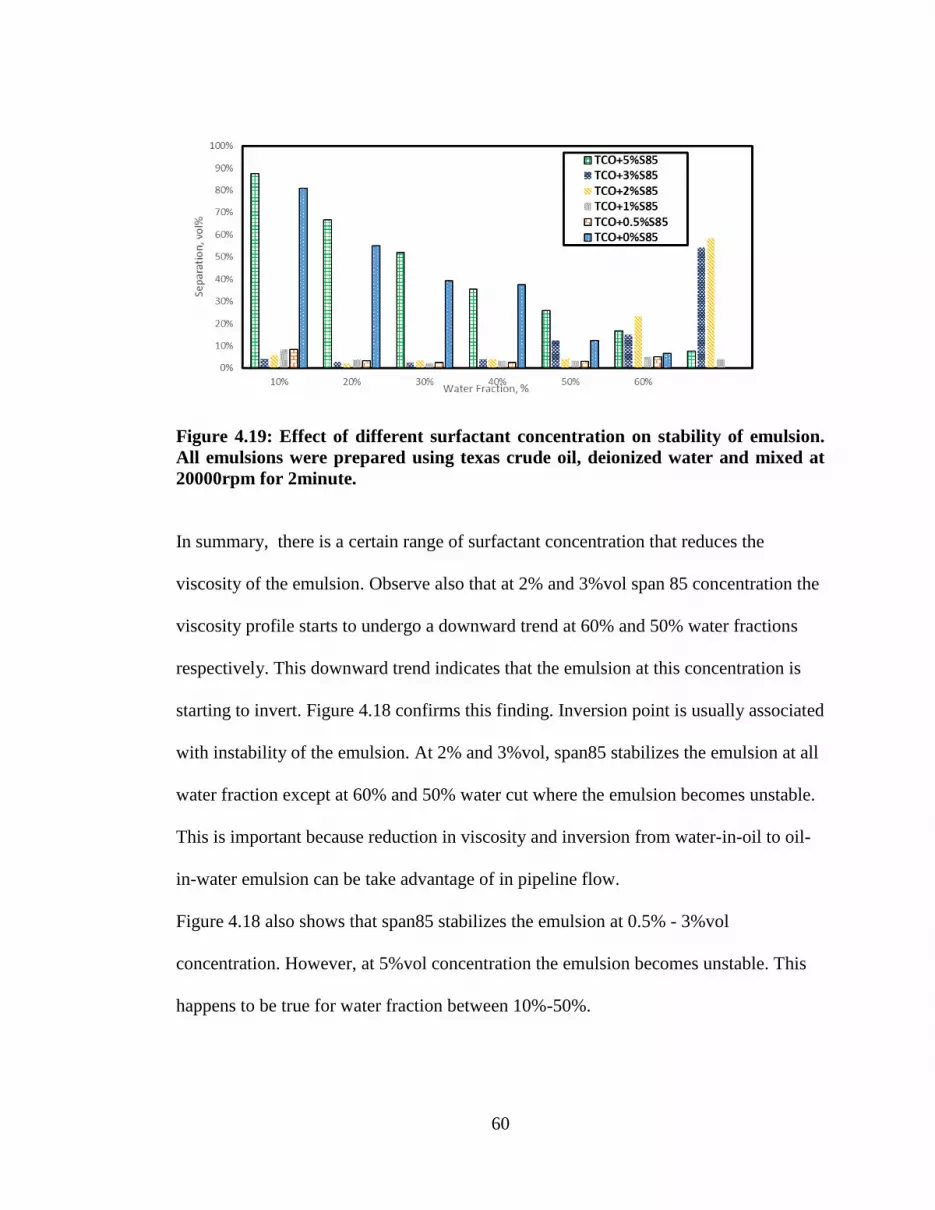
60
Figure 4.19: Effect of different surfactant concentration on stability of emulsion.
All emulsions were prepared using texas crude oil, deionized water and mixed at
20000rpm for 2minute.
In summary, there is a certain range of surfactant concentration that reduces the
viscosity of the emulsion. Observe also that at 2% and 3%vol span 85 concentration the
viscosity profile starts to undergo a downward trend at 60% and 50% water fractions
respectively. This downward trend indicates that the emulsion at this concentration is
starting to invert. Figure 4.18 confirms this finding. Inversion point is usually associated
with instability of the emulsion. At 2% and 3%vol, span85 stabilizes the emulsion at all
water fraction except at 60% and 50% water cut where the emulsion becomes unstable.
This is important because reduction in viscosity and inversion from water-in-oil to oil-
in-water emulsion can be take advantage of in pipeline flow.
Figure 4.18 also shows that span85 stabilizes the emulsion at 0.5% - 3%vol
concentration. However, at 5%vol concentration the emulsion becomes unstable. This
happens to be true for water fraction between 10%-50%.

61
To confirm if this trend is consistent across different types of crude oil, crude oil A with
a different API and viscosity was used. The result is presented in Figures 4.20 and 4.21
Figure 4.20: Relative viscosity against water fraction for crude oil A.
The trend observed with texas crude oil is consistent with what is observed with crude
oil A. Adding span85 reduces the viscosity at 1%vol and 2.25%vol. There was also an
inversion at 50% water cut at 2.25%span85 concentration.
Figure 4.21: Stability of span85 stabilized crude oil A emulsion at different water
fraction.
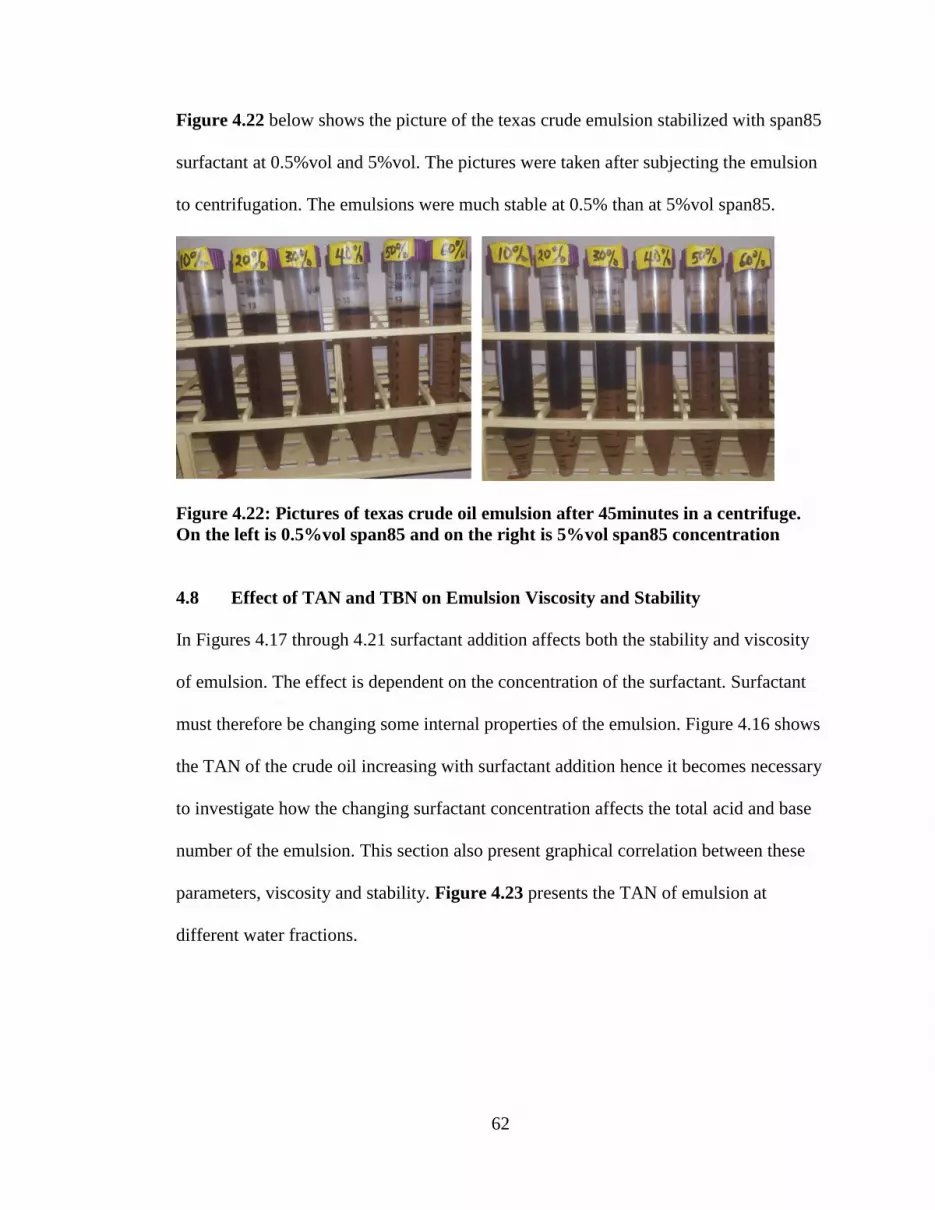
62
Figure 4.22 below shows the picture of the texas crude emulsion stabilized with span85
surfactant at 0.5%vol and 5%vol. The pictures were taken after subjecting the emulsion
to centrifugation. The emulsions were much stable at 0.5% than at 5%vol span85.
Figure 4.22: Pictures of texas crude oil emulsion after 45minutes in a centrifuge.
On the left is 0.5%vol span85 and on the right is 5%vol span85 concentration
4.8 Effect of TAN and TBN on Emulsion Viscosity and Stability
In Figures 4.17 through 4.21 surfactant addition affects both the stability and viscosity
of emulsion. The effect is dependent on the concentration of the surfactant. Surfactant
must therefore be changing some internal properties of the emulsion. Figure 4.16 shows
the TAN of the crude oil increasing with surfactant addition hence it becomes necessary
to investigate how the changing surfactant concentration affects the total acid and base
number of the emulsion. This section also present graphical correlation between these
parameters, viscosity and stability. Figure 4.23 presents the TAN of emulsion at
different water fractions.
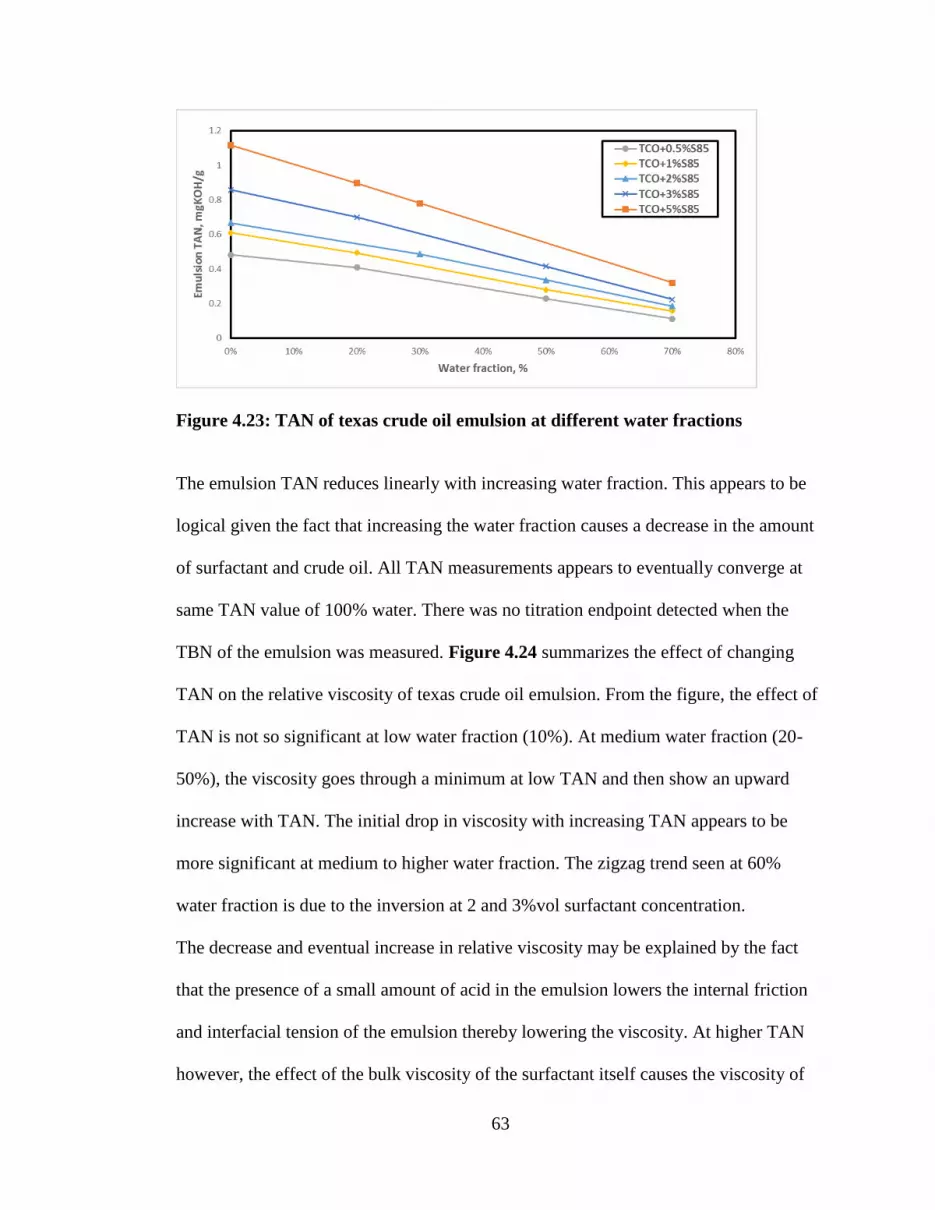
63
Figure 4.23: TAN of texas crude oil emulsion at different water fractions
The emulsion TAN reduces linearly with increasing water fraction. This appears to be
logical given the fact that increasing the water fraction causes a decrease in the amount
of surfactant and crude oil. All TAN measurements appears to eventually converge at
same TAN value of 100% water. There was no titration endpoint detected when the
TBN of the emulsion was measured. Figure 4.24 summarizes the effect of changing
TAN on the relative viscosity of texas crude oil emulsion. From the figure, the effect of
TAN is not so significant at low water fraction (10%). At medium water fraction (20-
50%), the viscosity goes through a minimum at low TAN and then show an upward
increase with TAN. The initial drop in viscosity with increasing TAN appears to be
more significant at medium to higher water fraction. The zigzag trend seen at 60%
water fraction is due to the inversion at 2 and 3%vol surfactant concentration.
The decrease and eventual increase in relative viscosity may be explained by the fact
that the presence of a small amount of acid in the emulsion lowers the internal friction
and interfacial tension of the emulsion thereby lowering the viscosity. At higher TAN
however, the effect of the bulk viscosity of the surfactant itself causes the viscosity of
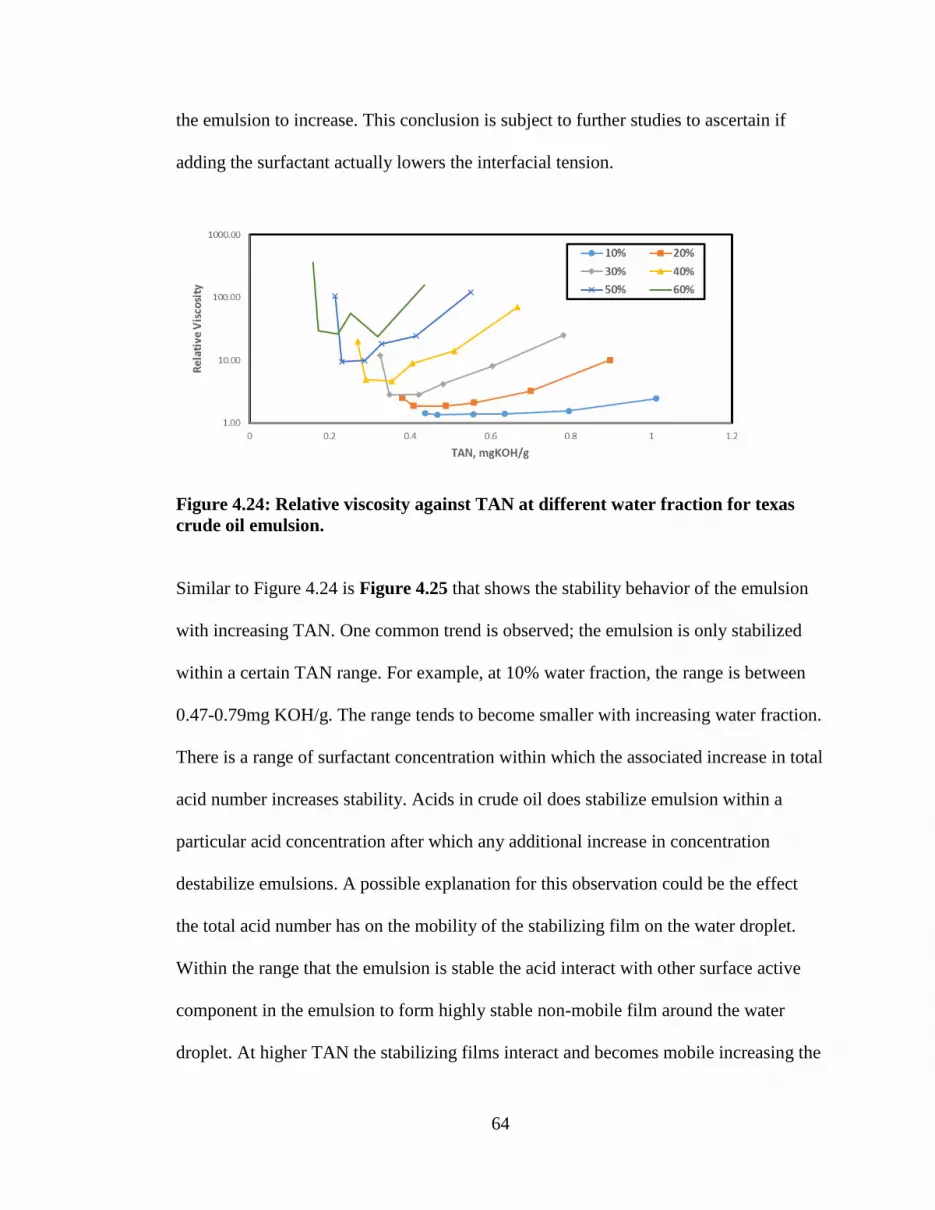
64
the emulsion to increase. This conclusion is subject to further studies to ascertain if
adding the surfactant actually lowers the interfacial tension.
Figure 4.24: Relative viscosity against TAN at different water fraction for texas
crude oil emulsion.
Similar to Figure 4.24 is Figure 4.25 that shows the stability behavior of the emulsion
with increasing TAN. One common trend is observed; the emulsion is only stabilized
within a certain TAN range. For example, at 10% water fraction, the range is between
0.47-0.79mg KOH/g. The range tends to become smaller with increasing water fraction.
There is a range of surfactant concentration within which the associated increase in total
acid number increases stability. Acids in crude oil does stabilize emulsion within a
particular acid concentration after which any additional increase in concentration
destabilize emulsions. A possible explanation for this observation could be the effect
the total acid number has on the mobility of the stabilizing film on the water droplet.
Within the range that the emulsion is stable the acid interact with other surface active
component in the emulsion to form highly stable non-mobile film around the water
droplet. At higher TAN the stabilizing films interact and becomes mobile increasing the
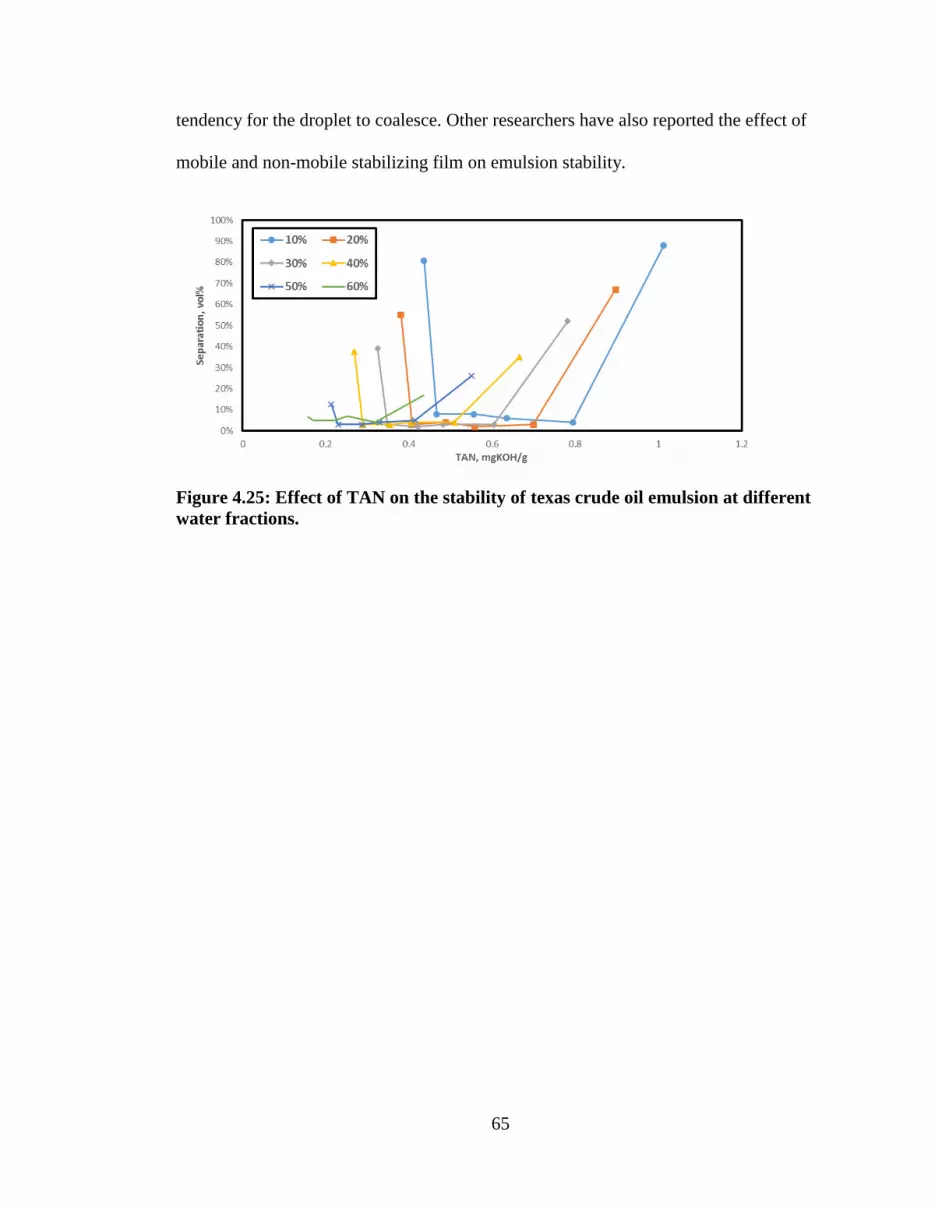
65
tendency for the droplet to coalesce. Other researchers have also reported the effect of
mobile and non-mobile stabilizing film on emulsion stability.
Figure 4.25: Effect of TAN on the stability of texas crude oil emulsion at different
water fractions.

66
CHAPTER 5
CONCLUSIONS AND RECOMMENDATIONS
5.1 Conclusion
In this study, the rheology and stability of surfactant stabilized emulsions were studied.
First a surfactant scan was carried out to determine the best surfactant for stable emulsion
formulation. The Stability of the emulsion was investigated using bottle and centrifuge test
while viscosity was carried out using capillary and rotational viscometer. TAN and TBN of
the emulsion were also studied to correlate them with stability and viscosity changes.
The following conclusions about 70%-30% oil-water texas crude oil and mineral oil
emulsions using 1%vol surfactant concentration were made:
An emulsification protocol was developed that produced homogenous and
reproducible emulsions. Mixing with IKA T18 homogenizer at 20,00rpm for
2minutes produced emulsions that could be reproduced.
Among the surfactants investigated Span85 produced the most stable emulsion
with texas crude oil while TritonX100 produced the most stable emulsion with
mineral oil. They had less than 10% separation after 45minutes in a centrifuge.
All surfactants investigated produced emulsion with viscosities higher than that
of the base oil i.e. all produced water-in-oil emulsion
The stability of the texas crude oil increased by as much as 94% just by adding
1% span85 while the stability of crude A increased by 84% by adding the same
amount of surfactant.
The texas crude oil emulsion was Newtonian while the mineral oil emulsion was
non-Newtonian. Both had time-independent viscosity behaviour.
67
The following conclusions about 1% span85 texas crude oil emulsion at different
water fractions were made:
Viscosity of the emulsion increases with increasing water fraction up to the
inversion point where the viscosity reduces significantly and the emulsion
inverts from water-in-oil to oil-in water. Relative viscosity at 70% water
fraction increases by as much as a factor of 37 over the base oil
The inversion point for the crude at 1% span85 is between 80%-90% ±5%
Stability of the emulsion increases with increasing relative viscosity.
However, as the inversion point is approached the emulsion becomes less
stable despite increasing viscosity
All emulsions were stable for 48hours with little variation in viscosity except
at high water fractions (>60%)
The following conclusions about the effect of increasing surfactant concentration on the
viscosity of the crude oil, TAN and TBN were made;
Adding a maximum of 5%vol span85 to the crude oil only increases the
viscosity by 19%.
TAN of the crude oil increases with increasing surfactant concentration while
there was no regular trend observed with the TBN
Finally, the following conclusions about the effect of changing surfactant (span 85)
concentration on the TAN/TBN, viscosity and stability of emulsion were made:
The TAN of the emulsion decreases with increasing water fraction
68
The relative viscosity of the emulsion is reduced by adding between 0.5-3%
span85. At 40%, the relative viscosity of emulsion with no surfactant was 19.73
while the relative viscosity with just 0.5%span85 was 4.94 (75% reduction).
Relative viscosity is independent of surfactant concentration at low water
fraction (<10%) except at 5% span85 concentration
At 2 and 3% surfactant concentration there was an observed lowering of the
inversion point to 60% and 50% respectively. At the observed inversion point
the emulsion became unstable.
At a fixed water fraction, increasing the TAN reduces the viscosity initially
thereafter the viscosity begins an upward with increasing TAN i.e. the viscosity
goes through a minimum with increasing TAN
Emulsion are only stabilized within a particular TAN range. Outside of this
range the acids destabilizes the emulsion. The range reduces with increasing
water fraction.
69
5.2 Recommendation
The following further studies are recommended
Investigate if other stability and viscosity measurement method give the same
result. Determining the interfacial boundary of separation can sometimes be
subjective. Sometimes the separation boundary is not even distinct.
Study the effect of changing TAN on the surface and interfacial tension.
Investigate the flow of stable crude oil emulsion and surfactant stabilized crude
oil emulsion in pipeline.
Develop correlation to predict emulsion viscosity at higher water fraction.
Repeat the stability and viscosity study using brine instead of deionized water.

70
References
Abdurahman, H. S. (2008). Stabilization Mechanism of Water-in-Crude Oil Emulsion.
Journal of Applied Sciences, 8(8), pp 1571-1575.
Abubaker H. Alagorni, Z. B. (2015, September). An Overview of Oil Production
Stages: Enhanced Oil Recovery Techniques and Nitrogen Injection.
International Journal of Environmental Science and Development, 6(9).
Retrieved from http://www.ijesd.org/vol6/682-A3001.pdf
Almrit, K., Kirk, R., & Ashwin, V. (2011). Prediction and Experimental Measurements
of Water-in-Oil Emulsion Viscosities during Alkaline Surfactant Injections. SPE
Enhanced Oil Recovery Conference, 19-21 July, Kuala Lumpur, . Malaysia:
Society of Petroleum Engineers. doi:http://dx.doi.org/10.2118/143992-MS
Boothroyd, S. (2013, July). Emulsion Technology. Retrieved from SlidePlayer:
http://slideplayer.com/slide/4117916/
Brient, J. A., Wessner, P. J., & Doyle, M. N.-O. (1995). Encyclopedia of Chemical
Technology. (J. S. Kroschwitz, Ed.) New York: John Wiley & Sons.
Broughton, G. &. (1937, January). THE VISCOSITY OF OIL-WATER EMULSIONS.
The Journal of Physical Chemistry, 42(2), pp 253-263.
doi:10.1021/j100897a010
Cluster of Excellence. (n.d.). Oil ang gas from the sea. maribus gGmbH, Pickhuben 2,
D-20457 Hamburg, Germany. Retrieved from http://worldoceanreview.com/wp-
content/downloads/wor3/WOR3_chapter_1.pdf
Devold, H. (2009). An introduction to oil and gas production. Oslo.
EIA. (2016, May 12). Today in Energy. Retrieved from US Energy Information
Administration: http://www.eia.gov/todayinenergy/detail.php?id=26212
Einstein, A. (1906). Molecular Dimensions. Journal of Physics, 19, pp 289.
Eley, D. H. (1998). Emulsions of Water in Asphaltene Containing Oils. Colloids &
Surfaces, 32, pp 87.

71
Griffin, W. (1949). Classification of surface-active agents by HLB. J. Soc. Cosmet,
Chem, 311-326.
Henríquez, C. J. (2009). W/O Emulsions: Formulation, Characterization and
Destabilization. Technischen Universität Cottbus zur Erlangung, Caracas.
Ian Bedwell, S. D. (2015). Extending the Life of Mature Facilities. Oil & Gas
Facilities., 4(1). Retrieved 11 3, 2016, from
http://www.spe.org/news/article/extending-the-life-of-mature-facilities
ICI Americas Inc. (1984). The HLB System: A Time-saving Guide to Emulsifier
Selection. Wilmington, Delaware: CHEMMUNIQUE.
John A. Veil, M. G. (2004). A White Paper Describing Produced Water from
Production of Crude Oil, Natural gas, and Coal Bed Methane. Argonne
National Laboratory. Retrieved November 11, 2016, from
http://www.circleofblue.org/wp-content/uploads/2010/08/prodwaterpaper1.pdf
Johnsen, E. A. (2003). Viscosity of ‘live’ water-in-crude-oil emulsions: experimental
work and validation of correlations. Journal of Petroleum Science and
Engineering, 38(1-2), pp 23-26. doi:10.1016/S0920-4105(03)00020-2
Kilpatrick, P. K. (2012, May 30). Water-in-Crude Oil Emulsion Stabilization: Review
and Unanswered. Energy & Feuls, 26(7), pp 4017–4026. doi:10.1021/ef3003262
Kilpatrick, P. K. (2012, May 30). Water-in-Crude Oil Emulsion Stabilization: Review
and Unanswered Questions. Energy Fuels, 26(7), pp 4017-4026.
doi:10.1021/ef3003262
Kokal, S. (2005). Crude Oil Emulsion: A State-Of-The-Art Review. Society of
Petroleum Engineers. doi:http://dx.doi.org/10.2118/77497-PA
Kokal, S. a. (1995). Asphaltenes: The Cholesterol of Petroleum. Middle East Oil Show,
11-14 March, . Bahrain: Society of Petroleum Engineers.
doi:http://dx.doi.org/10.2118/29787-MS

72
Kokal, S., & Álvarez, C. (2003). Reducing pressure drop in offshore pipelines by
controlling the viscosities of pressurized emulsions. Middle East Oil Show.
Bahrain: Society of Petroleum Engineers.
Kumari, A. (2016). Brief Information About Non-Newtonian Fluids and Their
Properties. Retrieved from Buzzle: http://www.buzzle.com/articles/brief-
information-about-non-newtonian-fluids.html
Leblanc, G. S. (2000). Viscosity Measurement. Canada: CRC Press LLC.
McLean, J. a. (1997). Effects of Asphaltene Aggregation in Model HeptaneToluene.
Journal of Colloid and Interface, 196, pp 23-34.
Michell, D. a. (1973). The Solubility of Asphaltenes in Hydrocarbon Solvents. Fuel, 53.
Mohammed, S. (2009). Characterization and Rheology of Water-in-Oil Emulsion from
Deepwater Fields. MSc. Thesis, Rice University, Department of Chemical
Engineering, Houston.
Mooney, M. (1951). The Viscosity of a Concentrated Suspension of Spherical Particle.
Journal of Colloid Science, 6, pp 162-170.
Opawale A., O. S. (2013). Tools for Troubleshooting Emulsion Problems in Producing
Oilfields. SPE Production and Operations Symposium. Oklahoma City: Society
of Petroleum Engineers. doi:http://dx.doi.org/10.2118/164512-MS
Pål V. Hemmingsen, S. K. (2006, July 26). Structural Characterization and Interfacial
Behavior of Acidic Compounds Extracted from a North Sea Oil. Energy Fuels,
20 (5), pp 1980–1987. doi:10.1021/ef0504321
Pal, R. (2000, May 15). Shear viscosity behavior of emulsions of two immiscible
liquids. Journal of Colloid and Interface Science, 225(2), pp 359-366.
doi:doi:10.1006/jcis.2000.6776
Pal, R. (2000). Viscosity – concentration equation for emulsions of nearly Spherical
Drops. Journal of Colloid Interface Science, 231, pp 168-175.
73
Pal, R. Y. (1992). Rheology of Emulsions. In L. Schramm, EMULSIONS IN THE
PETROLEUM INDUSTRY (pp. pp 132- 169). Washington, DC: American
Chemical Society. doi:doi: 10.1021/ba-1992-0231.ch004
Pal, R., & Rhodes, E. (1989). Viscosity/Concentration Relationships for Emulsions.
Journal of Rheology, 33(1021). doi:10.1122/1.550044
Pena, A. (2004). Dynamic aspect of emulsion stability,PhD thesis. Rice University
Houston.
Petrecca, G. (2014). World Energy Demand. Springer International Publishing.
doi:10.1007/978-3-319-06560-1_3
Petroleum Engineering Handbook. (n.d.). In J. R. Fanchi, & L. Lake (Eds.). Society of
Petroleum Engineers.
Richardson, E. (1933, April 28). Über die Viskosität von Emulsionen. Kolloid-
Zeitschrift, 65(1), pp 32-37. doi:10.1007/BF01428855
Rᴓnningsen, H. (1995). Correlations for predicting viscosity. SPE International
Symposium on Oilfield Chemistry. Texas: Society of Petroleum Engineers.
Salager, J.-L. (2002). Surfactant: Types and Uses. Merida VENEZUELA: Laboratorio
FIRP Escuela de INGENIERIA QUIMICA UNIVERSIDAD de Los ANDES.
Schramm, L. L. (1992). Emulsions: Fundamental and Applications in the Petroleum
Industry. Washington DC: Advances in Chemistry Series No. 231.
Silset, A. (2008). Emulsions (w/o and o/w) of Heavy Crude Oils Characterization,
Stabilization,Destabilization and Produced Water Quality. PhD Thesis,
Norwegian University of Science and Technology, Trondheim,.
Sjöblom, J. O. (1990). Water-In-Crude Oil Emulsions: Formation, Characterization and
Destabilization. Progress in Colloid & Polymer Science, 82, pp 131-139.
doi:10.1007/BFb0118251
74
Speight, J. G. (2007). The Chemistry and Technology of Petroleum (Fifth Edition ed.).
CRC Press. Retrieved 10 2016, from 15
Strassner, J. (1968, March). Effect of pH on Interfacial Films and Stability of Crude
Oil-Water Emulsions. Journal of Petroleum Technology, 20(03).
doi:http://dx.doi.org/10.2118/1939-PA
Tadros, T. (2009). Emulsion Science and Technology: A General Introduction. (T. F.
Tadros, Ed.) Germany: WILEY-VCH Verlag GmbH & Co. KGaA, Weinheim.
doi:10.1002/9783527647941.ch1
Tadros, T. F. (2013). Emulsion Formation, Stability, and Rheology. Wiley-VCH Verlag
GmbH & Co. KGaA.
Tanja Barth, S. H. (2005, May 21). Relationship between the Content of Asphaltenes
and Bases in Some Crude Oils. Energy Fuels, pp 1624–1630.
doi:10.1021/ef049750a
Wolfram, C., Shelef, O., & Gertler, P. (2012, Dec 1). How Will Energy Demand
Develop in the Developing World? The Journal of Economic Perspectives, 26,
pp, 119-137(19). doi:http://dx.doi.org/10.1257/jep.26.1.119
Zahra, U. (2012). Modelling Emulsions and Correlations. TRC-Q PROJECT STATUS
REPORT.


