Embed Size (px)
Citation preview

T
VT
a
ARRAA
KTMHETC
1
a[mmidiimattTbatbt
m
0d
Sensors and Actuators B 166– 167 (2012) 608– 615
Contents lists available at SciVerse ScienceDirect
Sensors and Actuators B: Chemical
j o ur nal homep a ge: www.elsev ier .com/ locate /snb
hermoelectric microfluidic sensor for bio-chemical applications
arun Lingaiah Kopparthy, Siva Mahesh Tangutooru, Gergana G. Nestorova, Eric J. Guilbeau ∗
he Center for Biomedical Engineering and Rehabilitation Science, P.O. Box 10157/BEC228, 818 Nelson Avenue, Louisiana Tech University, Ruston, LA 71272, United States
r t i c l e i n f o
rticle history:eceived 22 November 2011eceived in revised form 5 March 2012ccepted 7 March 2012vailable online 23 March 2012
eywords:hermopileicrofluidic device
a b s t r a c t
A thermoelectric microfluidic sensor (TMS) was developed for characterizing biochemical reactions. Thedevice consists of a 100 �m deep microfluidic channel with a Bi/Sb thin-film thermopile attached to itsbottom surface. The thermopile has a Seebeck coefficient of ∼7 �V (m K)−1 and excellent rejection ofcommon mode thermal signals. The design and geometry of the microfluidic device and thermopile incombination with hydrodynamic fluid focusing facilitates the detection of small dynamic temperaturechanges in the order of 10−4 K without the control of ambient temperature or the thermopile referencejunction temperature. Response of the thermopile for interaction of water with various concentrationsof ethanol was studied to demonstrate the operation of the sensor. CoventorWare® simulations were
ydrodynamic focusingthanol sensorhermoelectricalorimeter
performed to demonstrate the hydrodynamic focusing effect and the extent of mixing for different deviceflow rates. The device has the sensitivity of 0.045 V-s J−1 when known quantities of energy are appliedto a nichrome heater incorporated on the inner side of the microfluidic sensor bottom channel wall,while continuously injecting deionized (DI) water. A low ethanol sample volume of 5 �L is used in themicrofluidic device. Effects of flow rates on the ethanol response were characterized. Results showed anincreased ethanol response with a decrease in the relative inlet flow rates.
. Introduction
Microfluidic devices are used in an increasing number ofpplications in the fields of biochemistry [1], molecular biology2], genomics [3], microelectronics [4] and biodefense [5]. These
icrofluidic systems typically have one or more features withicrometer length scales. Flow in these systems is laminar because
nertial forces are very low relative to viscous forces. The highegree of laminar flow makes it possible for two fluids to flow
n parallel without mixing. Microfluidic calorimeters character-zed by large surface-to-volume ratios have increased heat and
ass transfer efficiencies [6]. Microfluidic calorimeters offer otherdvantages over the standard calorimeters commonly used to studyhe thermodynamics of chemical reactions. Microfluidic calorime-ers require less sample volume and exhibit fast response times.his makes them desirable as thermal detection components iniosensor systems designed to detect chemical and biologicalgents. By way of example, these calorimeters are used to measurehe phase transition of DNA [7], to test the neutralization reaction
etween sodium hydroxide and sulphuric acid [8,9], and to detecthe heat of reaction of urea hydrolysis by urease [10].∗ Corresponding author. Tel.: +1 318 257 5208; fax: +1 318 965 4000;obile: +1 480 229 5818.
E-mail address: [email protected] (E.J. Guilbeau).
925-4005/$ – see front matter © 2012 Elsevier B.V. All rights reserved.oi:10.1016/j.snb.2012.03.021
© 2012 Elsevier B.V. All rights reserved.
In past microfluidic calorimeters, however, the measurement ofvery small temperatures or temperature differences has requiredcontrol of the thermopile reference junction temperature andthe ambient temperature to provide an adequate signal to noiseratio so that the signal can be differentiated from thermal noise[1,11]. Heaters [1,11,12], heat sinks, or vacuum encapsulation [10]have been used to control the reference junction temperature orthe ambient temperature but these components add complex-ity to the system, increase the size of the system, decrease morewidespread sensor applications, and increase cost. Fluctuationsin the temperature control interferes with the heat power res-olution of the calorimeter [1]. Silicon chip based technology isoften used to fabricate microfluidic calorimeters to achieve advan-tages such as high power sensitivity and small time constants[1,10–14]. The fabrication of silicon chip based calorimeters; how-ever, is also complex and costly and has required similar control ofthe thermal environment in applications where the temperaturechanges being detected are small. Microcalorimeters developedusing MEMS involve silicon substrates that have higher parasiticheat transfer rate, which results in heat loss to the substrate com-pared to heat transfer to the thermopile. Several efforts were madeto reduce the heat loss to the substrate [12,14].
Few attempts were made to eliminate the active heating ele-
ment in the micro-calorimeters [13,14]. Dual thermopiles wereused by Kwak et al. to measure the reference temperature andbiochemical reaction simultaneously to eliminate the use of heat-ing element [13]. Yoon et al. used a split flow design to fabricate a
V.L. Kopparthy et al. / Sensors and Actua
Fm
maso
sc
Fmr
ig. 1. Components of microfluidic device. (a) PDMS inlet & outlet connectors, (b)icroscope glass slide, (c) Kapton® tape, (d) microscope glass coverslip.
icro-calorimeter to eliminate the heating element [14]. It has andvantage of very low sample volume consumption, but the entireystem is based on stop-flow. Single measurement at a time can
nly be performed using the split flow device.We report the fabrication and operation of a highly sensitive,imple and cost effective thermoelectric microfluidic sensor (TMS)apable of small temperature detection without the need to control
ig. 2. CoventorWare® simulations showing the effect of flow rate on hydrodynamic focusixing). (a) Inlet 1 and 2 flow rates 100 �L min−1 and 25 �L min−1, respectively. (b) Inlet 1
ates 100 �L min−1 and 75 �L min−1, respectively. (d) Close view of interfacial mixing at t
tors B 166– 167 (2012) 608– 615 609
the external thermal environment using external heat sources orheat sinks. To eliminate the need for external temperature control,the TMS uses hydrodynamic focusing in combination with a novelthermopile design to insure the rejection of common mode thermalsignals. This TMS is used to demonstrate its use as an ethanol sensorby detecting the temperature increase due to the heat produced bythe interaction of an ethanol sample with water.
2. Materials and methods
2.1. Fabrication of TMS
The TMS has two principal components, a microfluidic deviceand a thermopile.
2.2. Microfluidic device
The microfluidic device was fabricated using an inexpensive andpractical method, Xurography [15]. The device components are aglass microscope slide (thickness – 1.2 mm and thermal conductiv-ity −1.05 W (m ◦C)−1, Electron Microscopy Sciences, Hatfield, PA),100 �m thick (thermal conductivity −0.12 W (m ◦C)−1) Kapton®
tape (KaptonTape.com), and a 0.17 mm thick glass microscopecoverslip (thickness – 0.13–0.17 mm and thermal conductivity –1.14 W (m ◦C)−1, Electron Microscopy Sciences, Hatfield, PA). TheKapton® tape is cut using a cutting plotter (Graphtec America Inc.,
Santa Ana, CA) to form the flow channel geometry and then sand-wiched between the glass slide and the glass coverslip. The channelis 1.2 cm wide, 6 cm long and 100 �m deep and the device hastwo inlets and an outlet formed with 1/16 in. OD ports (Upchurching in the microfluidic device (red = fluid 1, blue = fluid 2, green to yellow = interfacial and 2 flow rates 100 �L min−1 and 50 �L min−1, respectively. (c) Inlet 1 and 2 flowhe fluid interface.

610 V.L. Kopparthy et al. / Sensors and Actuators B 166– 167 (2012) 608– 615
F d on 1b
Slsd
sHEpniislticNfla
2
TotwNmw5N6mnmSmwufa
ig. 3. Typical thermopile (showing measuring and reference junctions), fabricateismuth films are 1 �m and 0.6 �m, respectively.
cientific, Oak Harbor, WA) or custom made PDMS inlet and out-et connectors attached over holes drilled into a glass microscopelide. The volume of the microfluidic channel is 72 �L. An assemblyrawing of the microfluidic device is shown in Fig. 1.
Fluids are pumped into the microfluidic device using twoyringe pumps (Model ‘11’ Plus syringe pumps, Harvard Apparatus,olliston, MA) through tubing (0.01 in. internal diameter Teflon,TFE, Upchurch Scientific, Oak Harbor, WA) connecting to the inletorts of the device. The flow in the microfluidic channel is lami-ar due to low Reynolds number. In operation, the fluid introduced
nto the distal inlet port is hydrodynamically focused by the fluidntroduced into the proximal inlet port [16]. The two fluids flowide-by-side down the channel and leave the device from the out-et port. Mixing of the two fluids at the interface between thewo fluids is only due to diffusion. The width of the center fluids controlled by the relative flow rates of the two fluids and modifi-ations in the channel geometry. CoventorWare® (Coventor, Inc.,C.www.coventer.com) simulations were performed for variousow rates in the microfluidic device. The results of the simulationsre shown in Fig. 2.
.3. Thermopile fabrication
Thermopiles work on the principle of the Seebeck effect.he thermopile output voltage is a self-generating signalbtained when the reference junctions and measuring junc-ions are maintained at different temperatures. Thermopilesere fabricated according to the procedure discussed byestorova and Guilbeau [17]. Thin film antimony/bismuth ther-opiles were fabricated on 100 �m thick polyimide (Kapton®,ww.Kaptonfilm.com) substrate (Fig. 3) using a Denton model DV-
02B metal evaporation system (Denton Vacuum, Moorestown,J). The thermopiles have dimensions of 8 mm × 8 mm with0 thermocouple junctions. Two complementary metal shadowasks were customized and manufactured by Town Tech-
ologies Inc. (Town Technologies Inc., Somerville, NJ). Bis-uth metal (Bismuth shot, tear-shaped, −4 + 30 mesh, 99.9%,
igma–Aldrich Chemicals, www.sigmaaldrich.com) and antimonyetal (Antimony shot, 102 mm, 99.999% Sigma–Aldrich Chemicals,
ww.sigmaaldrich.com) was evaporated on the polyimide supportsing metal shadow masks to obtain the thermopile pattern. Afterabrication the thermopiles were tested for electrical continuitynd covered with thin polyimide tape to prevent physical damage.00 �m Kapton® support using thermal evaporation. Thicknesses of antimony and
Typical thermopiles have a resistance of about 30 K�. Calibrationof the thermopile is performed by incorporating a nichrome wire(1.52 mm wide and 0.025 mm thick, Scientific Instrument Services,Inc., Ringoes, NJ) over the measuring junctions on the back of ther-mopile.
2.4. Thermoelectric microfluidic sensor
The TMS is fabricated by integrating the thermopile beneath theouter side of the microfluidic device bottom channel wall. The sur-face of the inner side of the microfluidic device bottom channelwall, in the region over the measuring junctions of the thermopileserves as a reaction site and the thermopile serves as the sensorfor detecting the heat generated by the reaction. The thermopileswere attached to the microscope glass coverslip using a small quan-tity of cyanoacrylate adhesive (Scotch Single-Use Super Glue, 3M,St. Paul, MN). Thin, copper sheet conductor leads are attached tothe pads of the thermopile using silver print. An Agilent Model34420A nano voltmeter (Agilent, Inc., Loveland, CO) measures thegenerated Seebeck voltage from the thermopile, which is recordedusing National Instruments Signal Express (National InstrumentsCorporation, Austin, TX) on a Dell Computer (www.Dell.com). Ther-mopiles have been shown to have remarkable sensitivity and roomtemperature stability when operated in laminar flow streams [18].This configuration results in rejection of common-mode thermalsignals thereby eliminating the need for extensive control of theambient thermal environment [18]. The side view and top viewof the TMS is shown in Fig. 4. The heat that is generated in themicrofluidic device due to biochemical process is transferred to theglass slide, glass coverslip, Kapton support and the thermopile. Bya thermal model (Fig. 5), the heat transfer from the channel to thethermopile and substrate can be analyzed. At steady-state, the totalheat generated (Q) is given by Eq. (1).
Q = q1 + q2 (1)
where Q is equal to the total heat produced by the biochemicalprocess. q1 is the heat transfer towards the glass slide. q2 is theheat transfer towards the thermopile.
Tf − T∞
q1 =Rconv,1 + Rgs + Rconv,3(2)
q2 = Tf − T∞Rconv,2 + Rcs + Rk + Rconv,4
(3)
V.L. Kopparthy et al. / Sensors and Actua
Fo
wRwt
w
a
f
R
w(
tN
q
Fpahtr
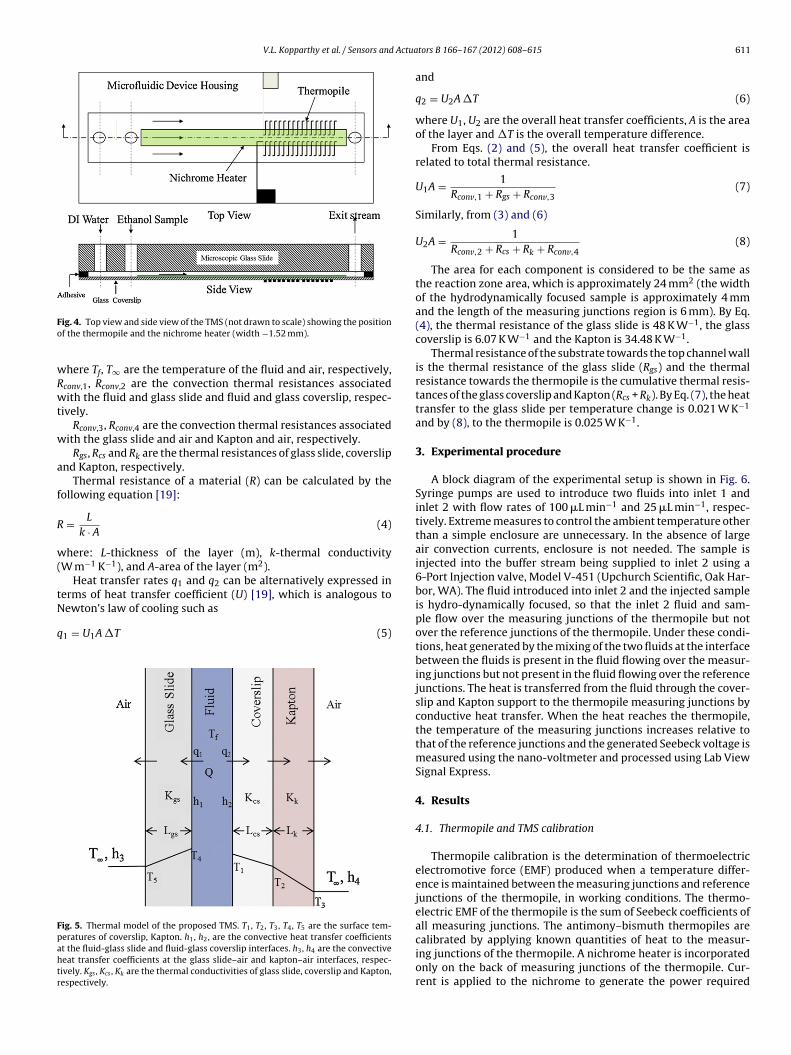
ig. 4. Top view and side view of the TMS (not drawn to scale) showing the positionf the thermopile and the nichrome heater (width −1.52 mm).
here Tf, T∞ are the temperature of the fluid and air, respectively,conv,1, Rconv,2 are the convection thermal resistances associatedith the fluid and glass slide and fluid and glass coverslip, respec-
ively.Rconv,3, Rconv,4 are the convection thermal resistances associated
ith the glass slide and air and Kapton and air, respectively.Rgs, Rcs and Rk are the thermal resistances of glass slide, coverslip
nd Kapton, respectively.Thermal resistance of a material (R) can be calculated by the
ollowing equation [19]:
= L
k · A(4)
here: L-thickness of the layer (m), k-thermal conductivityW m−1 K−1), and A-area of the layer (m2).
Heat transfer rates q1 and q2 can be alternatively expressed inerms of heat transfer coefficient (U) [19], which is analogous to
ewton’s law of cooling such as1 = U1A �T (5)
ig. 5. Thermal model of the proposed TMS. T1, T2, T3, T4, T5 are the surface tem-eratures of coverslip, Kapton. h1, h2, are the convective heat transfer coefficientst the fluid-glass slide and fluid-glass coverslip interfaces. h3, h4 are the convectiveeat transfer coefficients at the glass slide–air and kapton–air interfaces, respec-ively. Kgs , Kcs , Kk are the thermal conductivities of glass slide, coverslip and Kapton,espectively.
tors B 166– 167 (2012) 608– 615 611
and
q2 = U2A �T (6)
where U1, U2 are the overall heat transfer coefficients, A is the areaof the layer and �T is the overall temperature difference.
From Eqs. (2) and (5), the overall heat transfer coefficient isrelated to total thermal resistance.
U1A = 1Rconv,1 + Rgs + Rconv,3
(7)
Similarly, from (3) and (6)
U2A = 1Rconv,2 + Rcs + Rk + Rconv,4
(8)
The area for each component is considered to be the same asthe reaction zone area, which is approximately 24 mm2 (the widthof the hydrodynamically focused sample is approximately 4 mmand the length of the measuring junctions region is 6 mm). By Eq.(4), the thermal resistance of the glass slide is 48 K W−1, the glasscoverslip is 6.07 K W−1 and the Kapton is 34.48 K W−1.
Thermal resistance of the substrate towards the top channel wallis the thermal resistance of the glass slide (Rgs) and the thermalresistance towards the thermopile is the cumulative thermal resis-tances of the glass coverslip and Kapton (Rcs + Rk). By Eq. (7), the heattransfer to the glass slide per temperature change is 0.021 W K−1
and by (8), to the thermopile is 0.025 W K−1.
3. Experimental procedure
A block diagram of the experimental setup is shown in Fig. 6.Syringe pumps are used to introduce two fluids into inlet 1 andinlet 2 with flow rates of 100 �L min−1 and 25 �L min−1, respec-tively. Extreme measures to control the ambient temperature otherthan a simple enclosure are unnecessary. In the absence of largeair convection currents, enclosure is not needed. The sample isinjected into the buffer stream being supplied to inlet 2 using a6-Port Injection valve, Model V-451 (Upchurch Scientific, Oak Har-bor, WA). The fluid introduced into inlet 2 and the injected sampleis hydro-dynamically focused, so that the inlet 2 fluid and sam-ple flow over the measuring junctions of the thermopile but notover the reference junctions of the thermopile. Under these condi-tions, heat generated by the mixing of the two fluids at the interfacebetween the fluids is present in the fluid flowing over the measur-ing junctions but not present in the fluid flowing over the referencejunctions. The heat is transferred from the fluid through the cover-slip and Kapton support to the thermopile measuring junctions byconductive heat transfer. When the heat reaches the thermopile,the temperature of the measuring junctions increases relative tothat of the reference junctions and the generated Seebeck voltage ismeasured using the nano-voltmeter and processed using Lab ViewSignal Express.
4. Results
4.1. Thermopile and TMS calibration
Thermopile calibration is the determination of thermoelectricelectromotive force (EMF) produced when a temperature differ-ence is maintained between the measuring junctions and referencejunctions of the thermopile, in working conditions. The thermo-electric EMF of the thermopile is the sum of Seebeck coefficients ofall measuring junctions. The antimony–bismuth thermopiles are
calibrated by applying known quantities of heat to the measur-ing junctions of the thermopile. A nichrome heater is incorporatedonly on the back of measuring junctions of the thermopile. Cur-rent is applied to the nichrome to generate the power required
612 V.L. Kopparthy et al. / Sensors and Actuators B 166– 167 (2012) 608– 615
m of e
tttmwctrdcrtb
Ft
Fig. 6. Block diagra
o heat the measuring junctions of the thermopile. A standard Jype thermocouple is placed on the heater that is incorporated onhe back of the thermopile, to measure the temperature at the
easuring junctions. The reference for the J-type thermocoupleas placed in an ice bath. Thermopile response and temperature
hange at the heater with respect to the surrounding tempera-ure is measured as a function of applied power. Fig. 7 shows theesponse of three thermopiles for temperatures associated withifferent applied energy levels. Theoretically, the Seebeck coeffi-
−1
ient of bismuth and antimony metals are −73.4 and 48.9 �V K ,espectively [20]. The Seebeck coefficient of a bismuth–antimonyhermocouple is 122.3 �V K−1. For a thermopile of 60 measuringismuth and antimony junctions the Seebeck coefficient calculatedig. 7. Thermopile response for known quantities of temperature measured forhree different thermopiles of resistances 18 K�, 19 K� and 28 K�.
xperimental setup.
is 7.33 �V (m K−1). Typical thermopiles of resistance ∼20 K� gavea response of ∼7 �V (m K)−1 under experimental conditions, whichis close to the theoretical value.
To calibrate and measure the heat power sensitivity of the TMS, anichrome wire strip is placed along the length of the TMS as shownin Fig. 4. When the nichrome wire is heated, it mimics the exother-mic reaction in the TMS. DI water is introduced into the microfluidicdevice from inlet 1 and 2 with flow rates of 100 and 25 �L min−1,respectively. The response of the thermopile was recorded for 30 safter applying a known current to the nichrome wire. The responseof the thermopile increases linearly with an increase in the appliedpower with an R2 value of 0.9999. To determine the sensitivity, theareas under the curves of the responses were plotted against theenergy applied. Slope of the obtained curve (Fig. 8) determines thesensitivity of the TMS. The TMS has a sensitivity of 0.045 V-s J−1
with an R2 value of 0.9998.
4.2. Thermopile response for laser light
Thermopile response time is measured by the laser light simula-tion. The temperature increases when laser light is incident on themeasuring junctions of the thermopile. The thermopile responsefollowing an incident laser light pulse of 24 s is shown in Fig. 9. The90% response time calculated for the thermopile for a laser lightstimulation is 8 s.
4.3. Sample detection
To demonstrate the operation of the TMS, various concentra-tions of 5 �L ethanol samples are injected and the responses of thethermopile are studied. Deionized (DI) water is introduced into thedevice continuously from inlets 1 and 2 until the thermopile signalreaches a stable baseline. Concentrations of ethanol ranging from10% (v/v) to 100% (v/v) are injected into the sample loop using a
syringe and then introduced into the flow of inlet 2. Due to hydro-dynamic focusing, mixing only takes place at the interface betweenthe water flowing from inlet 1 and the ethanol sample flowingfrom inlet 2 and heat is generated. When the sample reaches the
V.L. Kopparthy et al. / Sensors and Actuators B 166– 167 (2012) 608– 615 613
Fig. 8. Area under the curve plotted as a function of applied energy by heating thenco
tortfttio
∼mnnlicf
1ic
F6
Fig. 10. Thermopile output as a function of time following the injection of 5 �L of
ent temperature or the thermopile reference junction temperature.The signal-to-noise ratio (SNR) for ethanol detection was approxi-mately 50:1 for 10% (v/v) ethanol concentration. The sensitivity of
ichrome wire incorporated on the inner side of the microfluidic device bottomhannel wall. DI water is continuously injected from inlet 1 and inlet 2 at a flow ratef 100 �L min−1 and 25 �L min−1, respectively.
hermopile, the measuring junctions arranged in the centerlinef the flow channel detect the heat generated by the exothermiceaction between water and ethanol producing a correspondinghermopile voltage. Fig. 10 shows the response of the thermopileor a 5 �L sample of pure ethanol. When the sample flows over thehermopile, the voltage increases rapidly and slowly decreases ashe sample flows past the thermopile. The duration of the responses ∼260 s. Although the duration of sample on the thermopile isnly 200 s, additional time is taken for the dissipation of heat.
Noise in the signal obtained was in the range of ∼20 nV to50 nV. Fig. 10 inset shows the baseline noise levels of the ther-opile during the fluid flow in microfluidic device. The baseline
oise consists of both thermal and electrical noises. The thermaloise levels can be reduced by an enclosure box in the presence of
arge air currents. Electrical noise levels are decreased by shield-ng the TMS from electrical noise sources by placing it in a faradayage. Proper grounding of the nano-voltmeter, syringe pumps andaraday cage ensures low electrical noise.
Ethanol experiments were performed with the flow rates of00 �L min−1 in inlet 1 and either 25 �L min−1or 50 �L min−1 in
nlet 2. Fig. 11 shows the thermopile response for various con-entrations of ethanol under these flow conditions. Thermopile
ig. 9. Thermopile response for an incident laser light. Laser source: laser pointer,30–680 nm.
pure ethanol into the inlet 2 flow stream using the 6-port injection valve. Inlet 1 flowrate is 100 �L min−1 and inlet 2 flow rate is 25 �L min−1. Inset: thermopile baselinewhen DI water is continuously flown through the TMS.
response data can be analyzed by two characteristics of theresponse, peak height and area under the curve. Peak height ofthe response indicates the rise in the temperature at the measur-ing junctions of the thermopile. Area under the curve representsthe total heat detected by the thermopile. The response representsthe increase in the temperature due to the exothermic reactionbetween ethanol and water. Areas under the curves for the obtainedresponses were also calculated and are plotted in Fig. 12. The TMShas a sensitivity of 0.045 V W−1, and the minimum output volt-age obtained from the ethanol experiment is 2.5 �V. So, the TMSdetected a low heat power of ∼56 �W for ethanol mixing. Con-sidering the Seebeck coefficient of the thermopile, 7 �V (m K)−1,the minimum output voltage corresponds to a temperature changeof 3.5 × 10⁻⁴ K. The novel TMS design allows measurement of thisvery small temperature difference without control of the ambi-
Fig. 11. Effect of flow rate on response of sensor for various concentrations of 5 �Lethanol sample injections into inlet 2 flow stream. Inlet 1 flow rate is 100 �L min−1.
614 V.L. Kopparthy et al. / Sensors and Actu
Fti
Tpdsd(
iifgt
5
caswt
irhwmfTbflmmAhsctwXbit
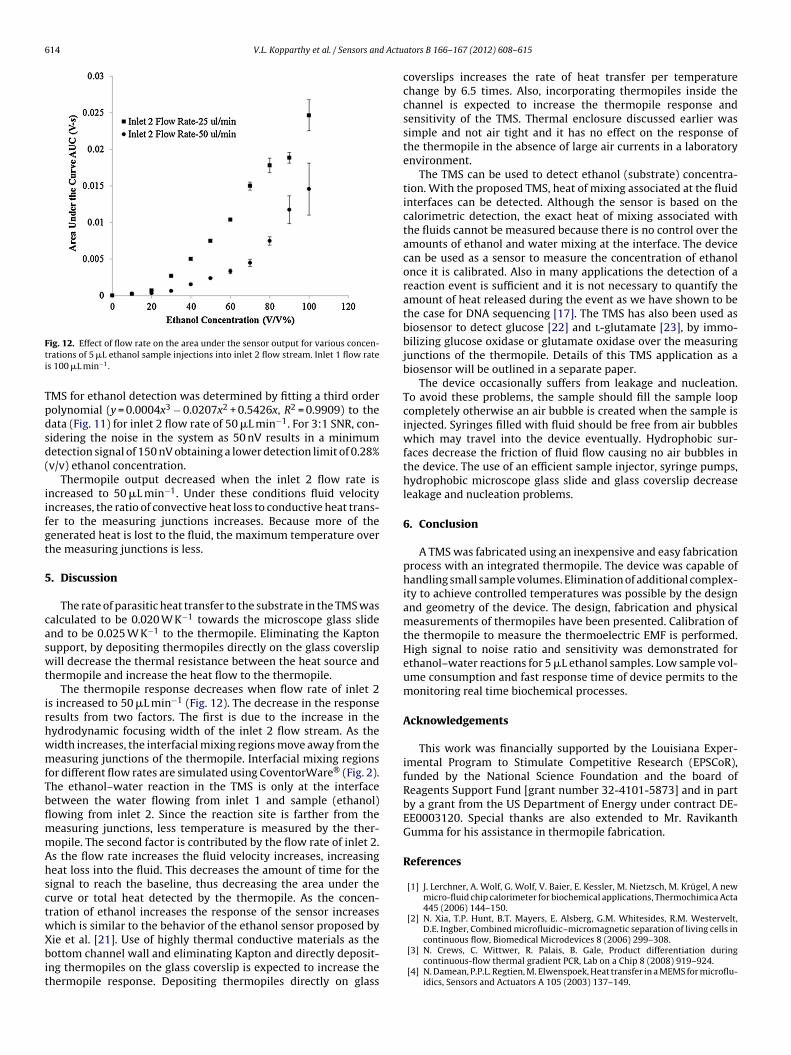
ig. 12. Effect of flow rate on the area under the sensor output for various concen-rations of 5 �L ethanol sample injections into inlet 2 flow stream. Inlet 1 flow rates 100 �L min−1.
MS for ethanol detection was determined by fitting a third orderolynomial (y = 0.0004x3 − 0.0207x2 + 0.5426x, R2 = 0.9909) to theata (Fig. 11) for inlet 2 flow rate of 50 �L min−1. For 3:1 SNR, con-idering the noise in the system as 50 nV results in a minimumetection signal of 150 nV obtaining a lower detection limit of 0.28%v/v) ethanol concentration.
Thermopile output decreased when the inlet 2 flow rate isncreased to 50 �L min−1. Under these conditions fluid velocityncreases, the ratio of convective heat loss to conductive heat trans-er to the measuring junctions increases. Because more of theenerated heat is lost to the fluid, the maximum temperature overhe measuring junctions is less.
. Discussion
The rate of parasitic heat transfer to the substrate in the TMS wasalculated to be 0.020 W K−1 towards the microscope glass slidend to be 0.025 W K−1 to the thermopile. Eliminating the Kaptonupport, by depositing thermopiles directly on the glass coverslipill decrease the thermal resistance between the heat source and
hermopile and increase the heat flow to the thermopile.The thermopile response decreases when flow rate of inlet 2
s increased to 50 �L min−1 (Fig. 12). The decrease in the responseesults from two factors. The first is due to the increase in theydrodynamic focusing width of the inlet 2 flow stream. As theidth increases, the interfacial mixing regions move away from theeasuring junctions of the thermopile. Interfacial mixing regions
or different flow rates are simulated using CoventorWare® (Fig. 2).he ethanol–water reaction in the TMS is only at the interfaceetween the water flowing from inlet 1 and sample (ethanol)owing from inlet 2. Since the reaction site is farther from theeasuring junctions, less temperature is measured by the ther-opile. The second factor is contributed by the flow rate of inlet 2.s the flow rate increases the fluid velocity increases, increasingeat loss into the fluid. This decreases the amount of time for theignal to reach the baseline, thus decreasing the area under theurve or total heat detected by the thermopile. As the concen-ration of ethanol increases the response of the sensor increaseshich is similar to the behavior of the ethanol sensor proposed by
ie et al. [21]. Use of highly thermal conductive materials as theottom channel wall and eliminating Kapton and directly deposit-ng thermopiles on the glass coverslip is expected to increase thehermopile response. Depositing thermopiles directly on glass
ators B 166– 167 (2012) 608– 615
coverslips increases the rate of heat transfer per temperaturechange by 6.5 times. Also, incorporating thermopiles inside thechannel is expected to increase the thermopile response andsensitivity of the TMS. Thermal enclosure discussed earlier wassimple and not air tight and it has no effect on the response ofthe thermopile in the absence of large air currents in a laboratoryenvironment.
The TMS can be used to detect ethanol (substrate) concentra-tion. With the proposed TMS, heat of mixing associated at the fluidinterfaces can be detected. Although the sensor is based on thecalorimetric detection, the exact heat of mixing associated withthe fluids cannot be measured because there is no control over theamounts of ethanol and water mixing at the interface. The devicecan be used as a sensor to measure the concentration of ethanolonce it is calibrated. Also in many applications the detection of areaction event is sufficient and it is not necessary to quantify theamount of heat released during the event as we have shown to bethe case for DNA sequencing [17]. The TMS has also been used asbiosensor to detect glucose [22] and l-glutamate [23], by immo-bilizing glucose oxidase or glutamate oxidase over the measuringjunctions of the thermopile. Details of this TMS application as abiosensor will be outlined in a separate paper.
The device occasionally suffers from leakage and nucleation.To avoid these problems, the sample should fill the sample loopcompletely otherwise an air bubble is created when the sample isinjected. Syringes filled with fluid should be free from air bubbleswhich may travel into the device eventually. Hydrophobic sur-faces decrease the friction of fluid flow causing no air bubbles inthe device. The use of an efficient sample injector, syringe pumps,hydrophobic microscope glass slide and glass coverslip decreaseleakage and nucleation problems.
6. Conclusion
A TMS was fabricated using an inexpensive and easy fabricationprocess with an integrated thermopile. The device was capable ofhandling small sample volumes. Elimination of additional complex-ity to achieve controlled temperatures was possible by the designand geometry of the device. The design, fabrication and physicalmeasurements of thermopiles have been presented. Calibration ofthe thermopile to measure the thermoelectric EMF is performed.High signal to noise ratio and sensitivity was demonstrated forethanol–water reactions for 5 �L ethanol samples. Low sample vol-ume consumption and fast response time of device permits to themonitoring real time biochemical processes.
Acknowledgements
This work was financially supported by the Louisiana Exper-imental Program to Stimulate Competitive Research (EPSCoR),funded by the National Science Foundation and the board ofReagents Support Fund [grant number 32-4101-5873] and in partby a grant from the US Department of Energy under contract DE-EE0003120. Special thanks are also extended to Mr. RavikanthGumma for his assistance in thermopile fabrication.
References
[1] J. Lerchner, A. Wolf, G. Wolf, V. Baier, E. Kessler, M. Nietzsch, M. Krügel, A newmicro-fluid chip calorimeter for biochemical applications, Thermochimica Acta445 (2006) 144–150.
[2] N. Xia, T.P. Hunt, B.T. Mayers, E. Alsberg, G.M. Whitesides, R.M. Westervelt,D.E. Ingber, Combined microfluidic–micromagnetic separation of living cells in
continuous flow, Biomedical Microdevices 8 (2006) 299–308.[3] N. Crews, C. Wittwer, R. Palais, B. Gale, Product differentiation duringcontinuous-flow thermal gradient PCR, Lab on a Chip 8 (2008) 919–924.
[4] N. Damean, P.P.L. Regtien, M. Elwenspoek, Heat transfer in a MEMS for microflu-idics, Sensors and Actuators A 105 (2003) 137–149.

Actua
[
[
[
[
[
[
[
[
[
[
[
[
[
[
Eric J. Guilbeau received his Ph.D. degree in chemical engineering from LouisianaTech University in 1971. He is currently the Watson Eminent Scholar and Director of
V.L. Kopparthy et al. / Sensors and
[5] D. Ivnitski, I. Abdel-Hamid, P. Atanasov, E. Wilkins, Biosensors for detection ofpathogenic bacteria, Biosensors and Bioelectronics 14 (1999) 599–624.
[6] N. Crews, T. Ameel, C. Wittwer, B. Gale, Flow-induced thermal effects on spatialDNA melting, Lab on a Chip 8 (2008) 1922–1929.
[7] C.H. Lee, G. Walker, A.O. O’Neill, D.K. Manikkam, Micro-calorimeter withenclosed parylene chambers for bio/chemical applications, in: 12th Interna-tional Conference on Miniaturized Systems for Chemistry and Life Sciences,San Diego, CA, USA, 2008, pp. 1429–1431.
[8] J.M. Kohler, M. Zieren, Chip reactor for microfluid calorimetry, ThermochimicaActa 310 (1998) 25–35.
[9] M. Zieren, J.M. Kohler, A micro-fluid channel calorimeter using BiSb/Sb thinfilm thermopiles, In: Solid State Sensors and Actuators, 1997. InternationalConference on TRANSDUCERS’97 Chicago, vol. 531, 1997, pp. 539–542.
10] W. Lee, W. Fon, B.W. Axelrod, M.L. Roukes, High-sensitivity microfluidiccalorimeters for biological and chemical applications, Proceedings of theNational Academy of Sciences of the United States of America 106 (2009)15225–15230.
11] V. Baier, R. Fodisch, A. Ihring, E. Kessler, J. Lerchner, G. Wolf, J.M. Kohler, M.Nietzsch, M. Krugel, Highly sensitive thermopile heat power sensor for micro-fluid calorimetry of biochemical processes, Sensors and Actuators A: Physical123–124 (2005) 354–359.
12] Y. Zhang, S. Tadigadapa, Calorimetric biosensors with integrated microfluidicchannels, Biosensors and Bioelectronics 19 (2004) 1733–1743.
13] B. Kwak, B. Kim, H. Cho, J. Park, H. Jung, Dual thermopile integrated microfluidiccalorimeter for biochemical thermodynamics, Microfluidics and Nanofluidics5 (2008) 255–262.
14] Y. Seung-Il, L. Mi-Hwa, P. Se-Chul, S. Jeon-Soo, K. Yong-Jun, Neisseria menin-gitidis detection based on a microcalorimetric biosensor with a split-flowmicrochannel, Journal of Microelectromechanical Systems 17 (2008) 590–598.
15] D.A. Bartholomeusz, R.W. Boutte, J.D. Andrade, Xurography: rapid prototypingof microstructures using a cutting plotter, Journal of MicroelectromechanicalSystems 14 (2005) 1364–1374.
16] G. Lee, C. Chang, S. Huang, R. Yang, The hydrodynamic focusing effect insiderectangular microchannels, Journal of Micromechanics and Microengineering16 (2006) 1024–1032.
17] G.G. Nestorova, E.J. Guilbeau, Thermoelectric method for sequencing DNA, Labon a Chip 11 (2011) 1761–1769.
18] M.J. Muehlbauer, E.J. Guilbeau, B.C. Towe, Applications and stability of athermoelectric enzyme sensor, Sensors and Actuators B: Chemical 2 (1990)223–232.
19] F. Incropera, D. DeWitt, Fundamentals of Heat and Mass Transfer, 5th ed., Wiley,2001.
tors B 166– 167 (2012) 608– 615 615
20] S.C. Allison, R.L. Smith, D.W. Howard, C. González, S.D. Collins, A bulk micro-machined silicon thermopile with high sensitivity, Sensors and Actuators A:Physical 104 (2003) 32–39.
21] X. Xie, A.A. Suleiman, G.G. Guilbault, Z. Yang, Z.-a. Sun, Flow-injection determi-nation of ethanol by fiber-optic chemiluminescence measurement, AnalyticaChimica Acta 266 (1992) 325–329.
22] S.M. Tangutooru, V.L. Kopparthy, R. Gumma, G.G. Nestorov, E.J. Guilbeau,Dynamic thermoelectric glucose sensing with layer-by-layer glucose oxidaseimmobilization, Proceedings of International Journal of Medical Implants andDevices 5 (2011) 66.
23] V.L. Kopparthy, S.M. Tangutooru, R. Gumma, G.G. Nestorova, E.J. Guilbeau,Highly sensitive continuous flow micro-calorimeter for biological applications,in: Proceedings of Annual Fall Meeting of the BMES, 2011, p. 151.
Biographies
Varun Lingaiah Kopparthy received his bachelor of technology degree in biomed-ical engineering from Jawaharlal Nehru Technological University, Hyderabad, Indiain 2008 and received his master of science degree in biomedical engineering fromLouisiana Tech University in 2011. His current research interests include thermo-electric and MEMS biosensors.
Siva Mahesh Tangutooru received his bachelor of engineering degree in biomedi-cal engineering from Osmania University, Hyderabad, India in 2008. He is currentlypursuing Ph.D. in biomedical engineering at Louisiana Tech University. His currentresearch interests include development of micro biosensors for detecting neuro-transmitter and metabolism in brain cells.
Gergana G. Nestorova received her bachelor of science degree in molecular biologyfrom Coastal Carolina University in 2006 and received her master of science degree inmolecular sciences and nanotechnology from Louisiana Tech University in 2011. Hercurrent research interests include thermoelectric detection of nucleic acid reactionsin a microfluidic device.
Center for Biomedical Engineering and Rehabilitation Science (CBERS) at LouisianaTech University. His current research interests include applied biotechnology andbiosensors.