Embed Size (px)
Citation preview
1
Anomalous Thermoelectric power of over-doped Bi2Sr2CaCu2O8 superconductor
V.P.S. Awana1, *, Jagdish Kumar Bains1, G.S. Okram 2, Ajay Soni2 and H. Kishan1
1National Physical Laboratory, Dr. K.S. Krishnan Marg, New Delhi – 110012, India.
2UGC-DAE Consortium for Scientific Research, Indore 452001, India
Temperature dependence of thermoelectric power S(T) of three differently
processed Bi2Sr2CaCu2O8 (Bi2212) samples, viz. as-processed melt quenched (Bi2212-
MQ), 6000C N2-annealed (Bi2212-N2) and 6000C O2-annealed (Bi2212-O2) is reported
here. All the samples possess single-phase character and their superconducting transition
temperatures (TcR=0) are 85 K, 90 K and 72 K respectively for Bi2212-MQ, Bi2212-N2
and Bi2212-O2. While Bi2212-MQ and Bi2212-N2 samples are in near optimum doping
regime, Bi2212-O2 is an over-doped sample. TcS=0 values obtained through S(T) data are
also in line with those deduced from the temperature dependence of resistance and DC
magnetization. Interestingly, S(T) behaviour of the optimally-doped Bi2212-MQ and
Bi2212-N2 samples is seen to be positive in whole temperature range, it is found negative
for the over-doped Bi2212-O2 sample above TcS=0. These results have been seen in the
light of the recent band structure calculations and the ensuing split Fermi surface as
determined by angle-resolved photoelectron spectroscopy (ARPES).
PACS number(s): 74.25.Fy, 74.72.Hs Key words: Bi2Sr2CaCu2O8 (Bi2212) superconductor, over-doped regime, Thermoelectric power ----------------------------------------------------------------------------------------------------------- * Corresponding Author: Dr. V.P.S. Awana , [email protected] www.freewebs.com/vpsawana/ Fax : 0091-11-45609310: Phone : 0091-11-45609210
2
INTRODUCTION
Ever since the discovery of high Tc superconductivity (HTSc) in perovskite
cuprates [1], the theoretical understanding of the phenomenon is still elusive. The
observance of the high superconducting transition temperatures of up to 132 K [2] and
the anomalous normal state physical properties of the HTSc are quite intriguing [3-5].
Principally not only the pairing mechanism for very high Tc has been undecided, precise
normal state electrical or thermal conduction processes are also far from being clear [3-
7]. Thermoelectric power S(T) behavior in these regards is one of the important tools.
Unlike the resistivity R(T), the S(T) precisely mimics the exact electronic conduction
process in terms of the dominating charge carriers [8,9]. For example in NaCoO2 the
electrical conduction is through highly metallic Co-O layers and the S(T) is controlled
from phonon drag Na-O, giving rise to high conductivity along with the higher S value
[10]. In case of HTSc cuprates, several articles exist in the literature on their S(T) but
apparently no consensus seems to has been arrived at [4,11-14]. Though the R(T)
behavior mostly match in various reports the S(T) does not [11-15]. This is precisely
because of the split Fermi surface and ensuing two-band structure in most of HTSc [16-
18]. Further, the distribution of oxygen in highly inhomogeneous HTSc samples, in
particular the Bi-based cuprates, does hamper the real out put [19]. In case of Bi2212
though negative S(T) is reported in some reports for the over-doped samples [13], the
same is also reported positive in others [20]. This could primarily be attributed to
inhomogeneous oxygen distribution within the grains of polycrystalline samples [19].
In present article we address this problem, and present the S(T) results on oxygen
homogenized Bi2212 samples from optimum- to over-doping regime. This is achieved by
relatively longer hours annealing the samples in various environments. In particular, for
obtaining the over-doped regime we annealed Bi2212 in O2 atmosphere for around 36
hours. Also the S(T) is measured very precisely [21] and the repeatability of the
experiments is checked. We found that the S(T) of over doped Bi2212 is unambiguously
negative throughout its normal state i.e. above its Tc. This is also in contrast to one of our
previous results on an in homogenously oxygen distributed sample [20]. The negative
S(T) of the over-doped Bi2212 is in direct confirmation with the recent band structure
3
calculations based on angle-resolved photoelectron spectroscopy (ARPES) studies
[13,18].
EXPERIMENTAL DETAILS
Samples of Bi2Sr2CaCu2O8 (Bi2212) were synthesized through the general solid-
state reaction route using the ingredients Bi2O3, CaCO3, SrCO3 and CuO with more than
3N purity. Stoichiometric ratios were taken, ground thoroughly, and subsequently heat-
treated thrice at 800oC for 24 hrs each in air with intermediate grindings. The bar shaped
samples were then partially melted at 930oC for few minutes and annealed in the same
furnace at 860oC for 20 hours before quenching to room temperature [22]. The samples
thus produced are named as Bi2212-MQ. One of the samples from among Bi2212-MQ
set is further annealed in flow of N2 gas at 600oC for 20 hours and cooled slowly to room
temperature in same atmosphere. This sample is named as Bi2212-N2. Another sample
from Bi2212-MQ set is annealed in O2 gas flow at 600oC for 36 hours and cooled slowly
to room temperature in same atmosphere. This sample is named as Bi2212-O2. X-ray
diffraction (XRD) patterns of the samples were recorded by using CuKα radiation
(Rigaku miniFlex-II, λ = 1.54Å). R(T) measurements in the temperature range of 20 to
300K were carried out on a close cycle refrigerator using four-probe method.
Temperature dependence of DC magnetization of the Bi2212-MQ and Bi2212-O2
samples was carried out in a SQUID magnetometer (Quantum Design) both in zero field
and field cooled configurations. The thermoelectric power S(T) measurements were
carried out on an automated precision measurement system [21].
RESULTS AND DISCUSSION
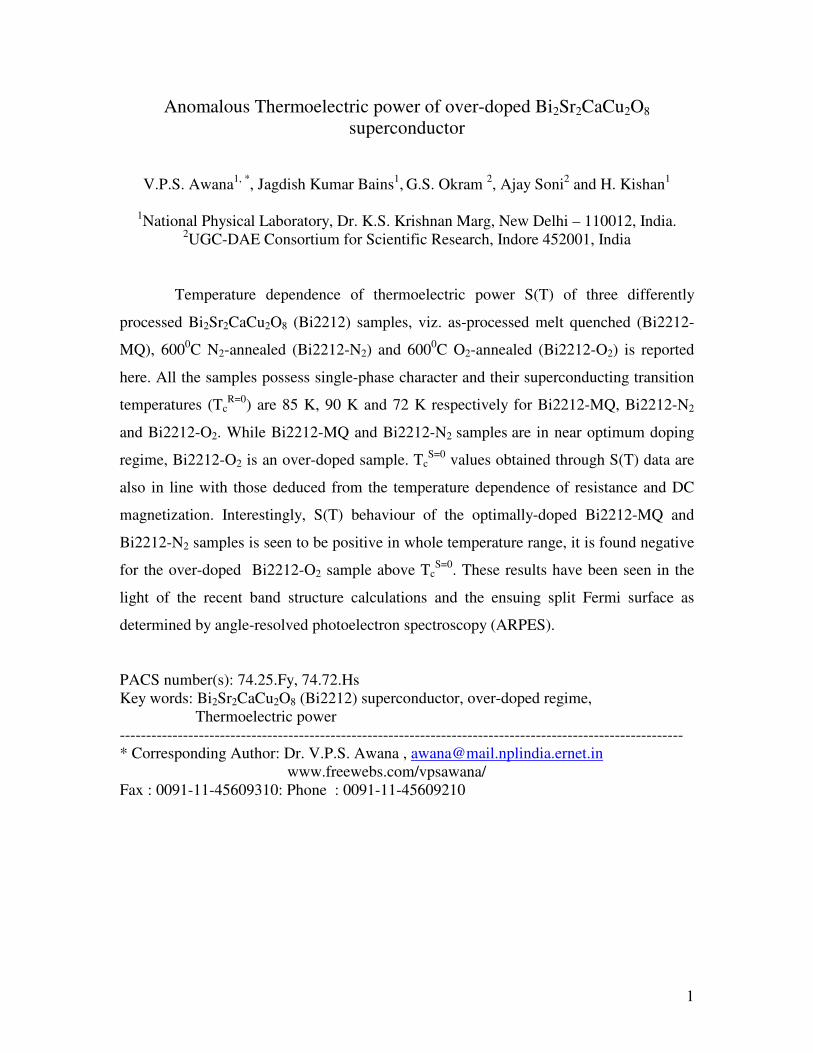
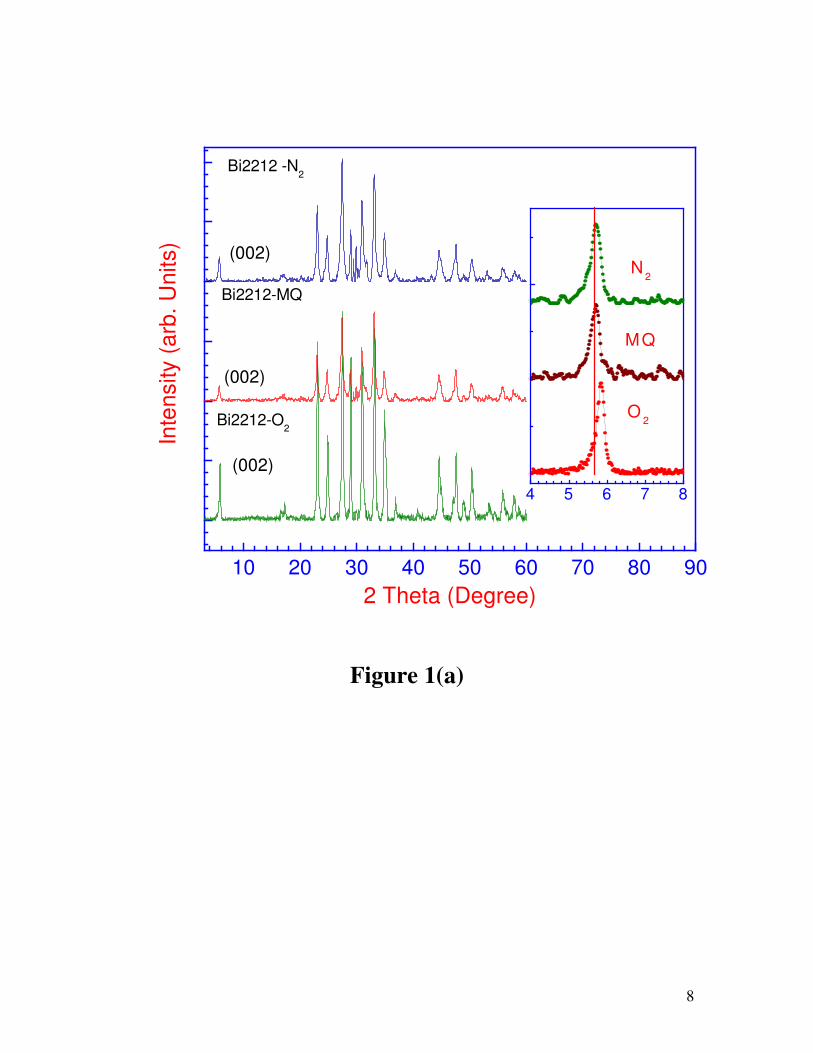
Figure 1(a) depicts the room temperature x-ray diffraction (XRD) patterns of
Bi2212-MQ, Bi2212-N2 and Bi2212-O2 samples. All the samples exhibit phase purity
with tetragonal structure. The characteristic low angle {002} peak is seen distinctly at 2θ
~5.80. Any intermixing of Bi2212 phase (002 at 2θ ~ 5.80) with that of Bi2201 (002 at 2θ
~7.60) or Bi2223 (002 at 2θ ~ 4.60) is also ruled out. The lattice parameters a and c of
Bi2212-MQ and Bi2212-O2 samples calculated with Rietveld refinement are 3.8238±
4
0.0004 Å, 30.8744± 0.0037 Å and 3.8177 ±0.0048 Å, 30.8457± 0.0038 Å respectively.
The observed decrease in lattice parameters for Bi2212-O2 sample vis-à-vis the Bi2212-
MQ sample is clear indication of the increased oxygen content for the same sample. The
decrease in c-parameter for Bi2212-O2 sample is clear from its characteristic low angle
(002) peak shift towards higher angle (see inset Fig.1a).
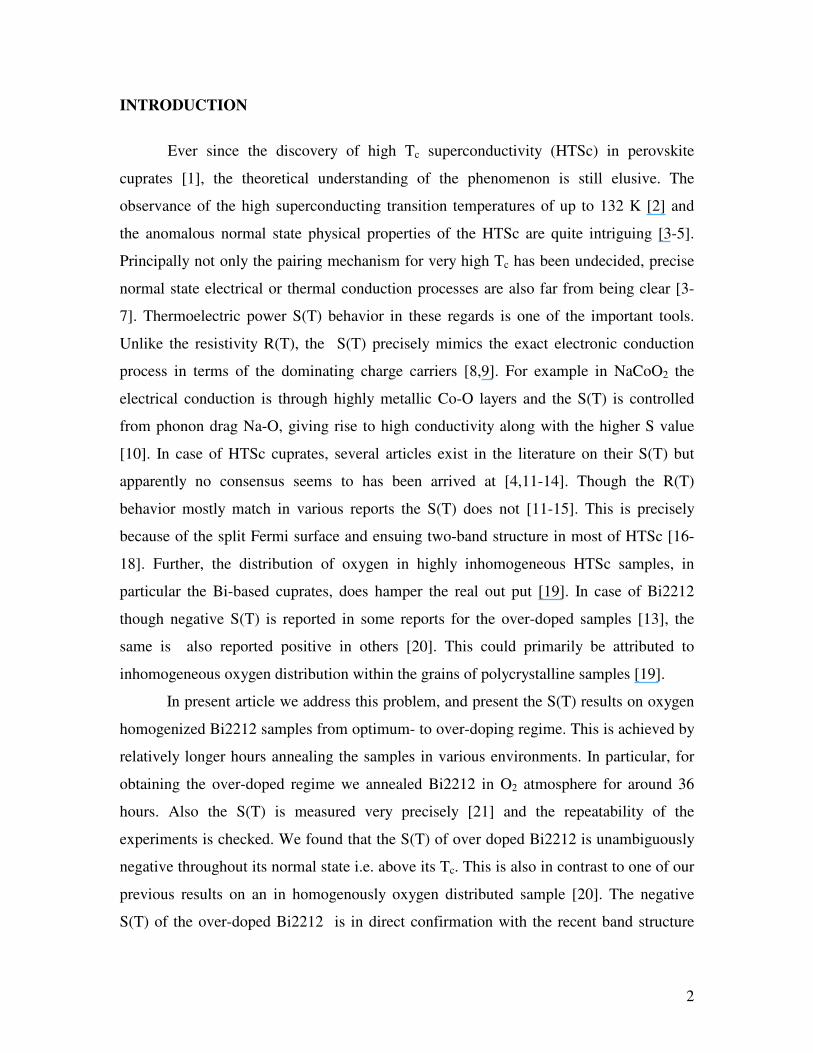
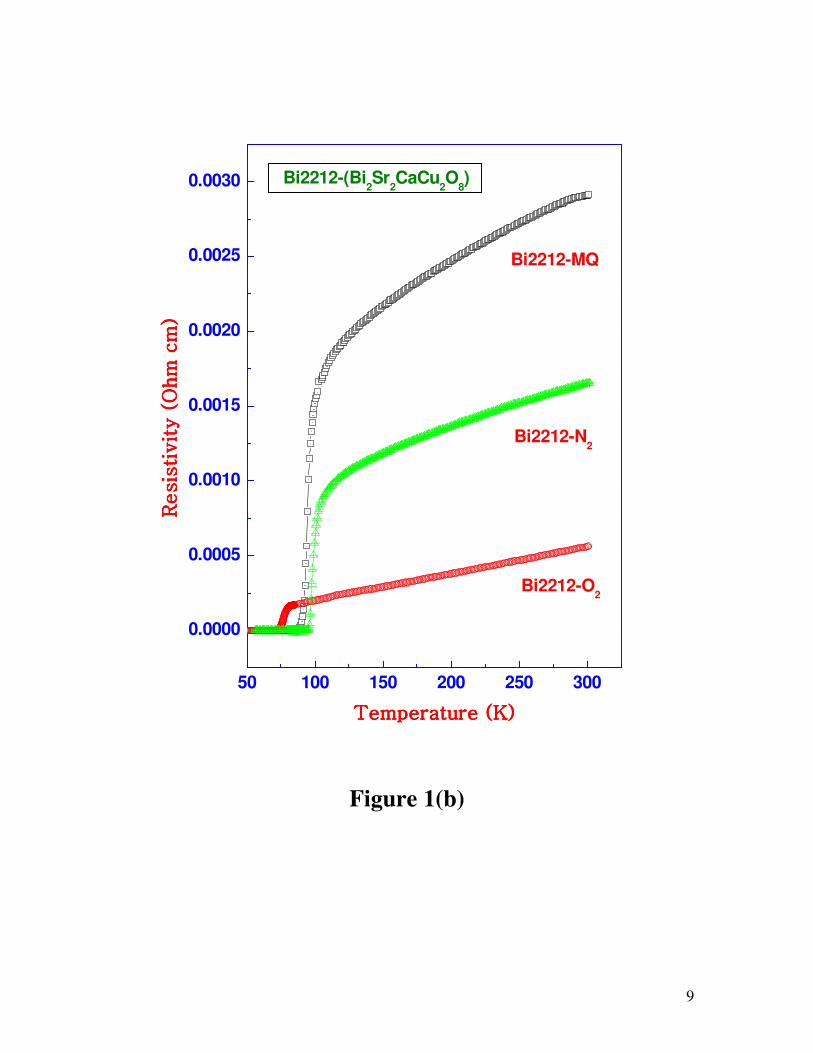
The resistance versus temperature plots R(T) for Bi2212-MQ, Bi2212-N2 and
Bi2212-O2 samples are provided in Fig.1(b). The normal state conductivity of Bi2212-O2
sample has improved tremendously in comparison to both Bi2212-MQ and Bi2212-N2
samples, indicating a higher density of mobile carriers in Bi2212-O2 material vis-à-vis
Bi2212-MQ and Bi2212-N2 samples. Interestingly, the superconductivity transition
temperature (Tc) is least around 72K for the Bi2212-O2 in comparison to 85K and 90K
respectively for Bi2212-MQ and Bi2212-O2 samples. This shows that Bi2212-O2
annealed sample is over-doped, i.e., better normal state conductivity with lower Tc in
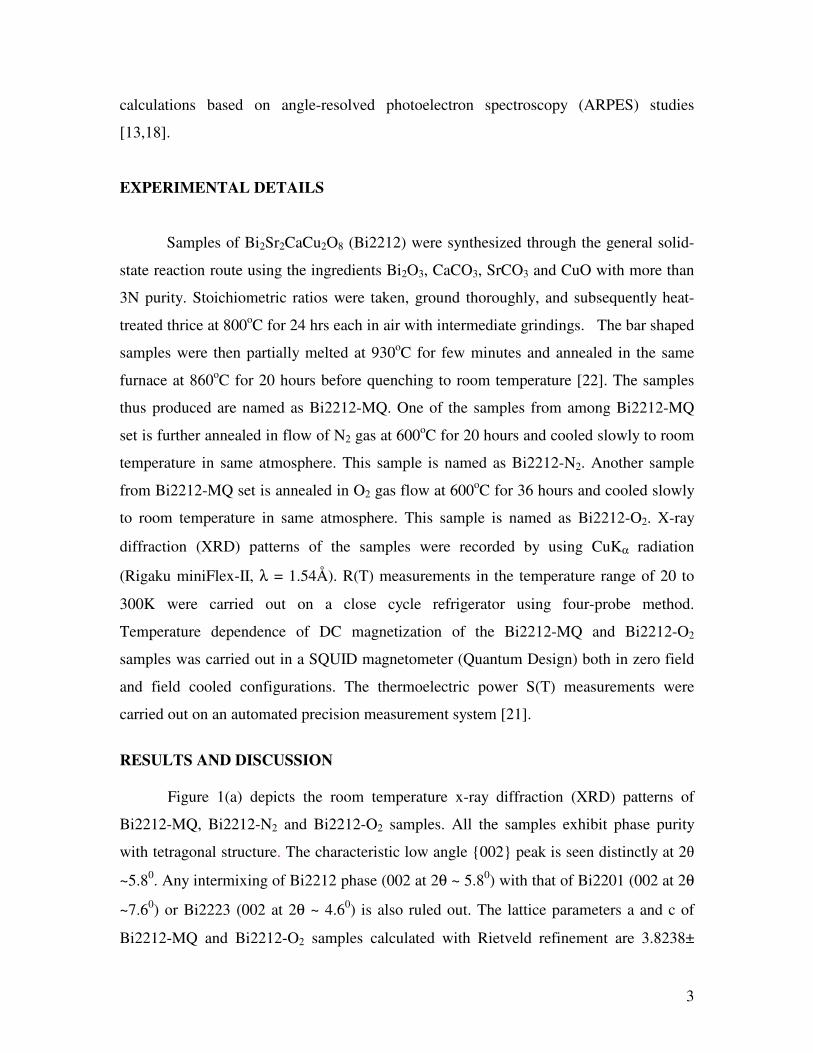
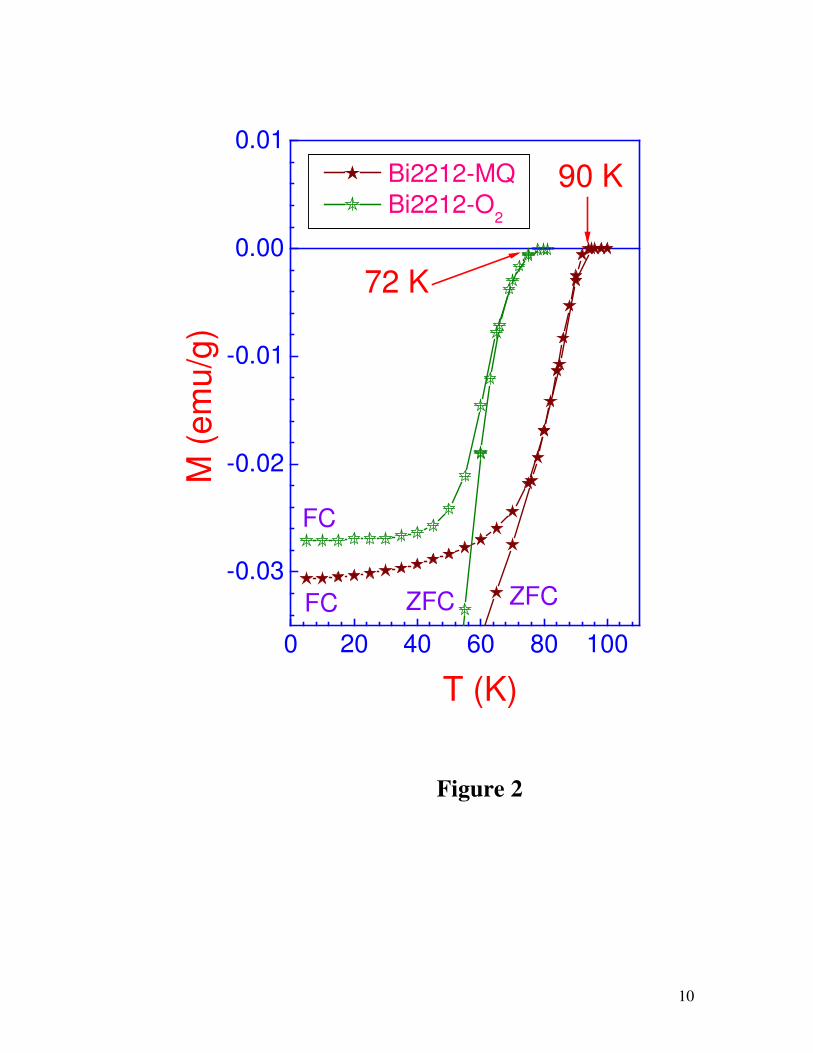
comparison to Bi2212-MQ and Bi2212-N2 samples. DC magnetization measurements of
the MQ and O2 treated samples in both ZFC and FC configurations, also substantiate
these Tc values (Fig.2)
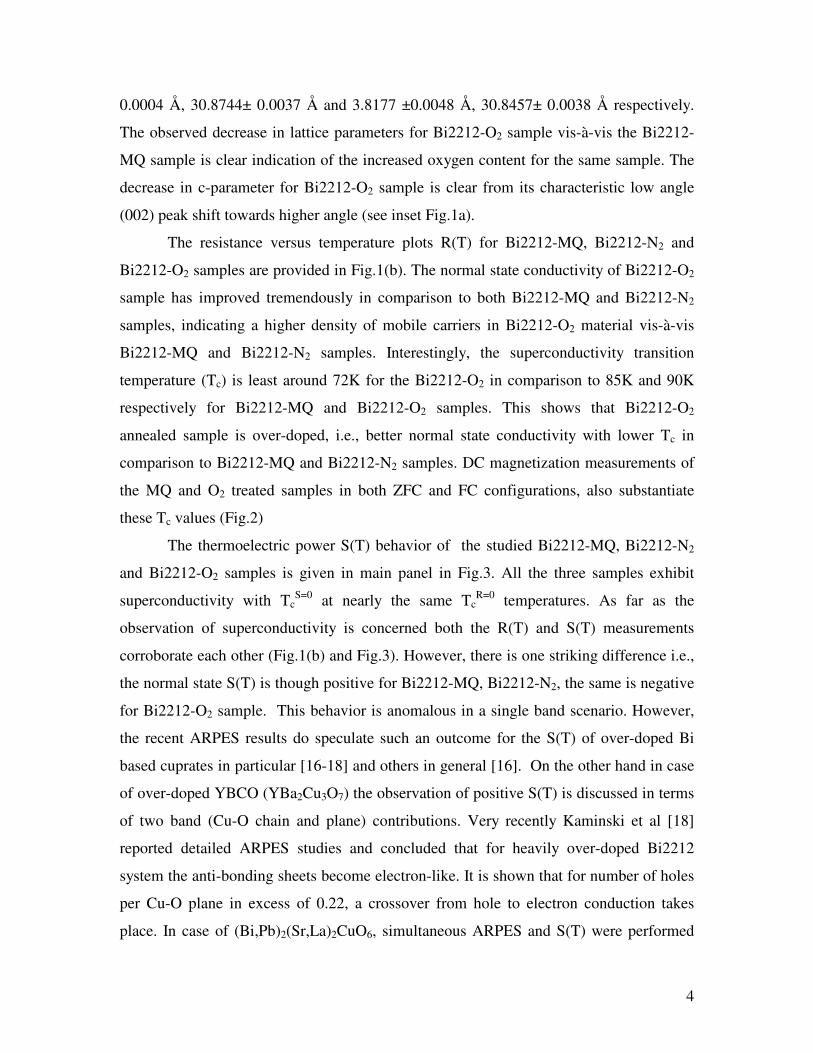
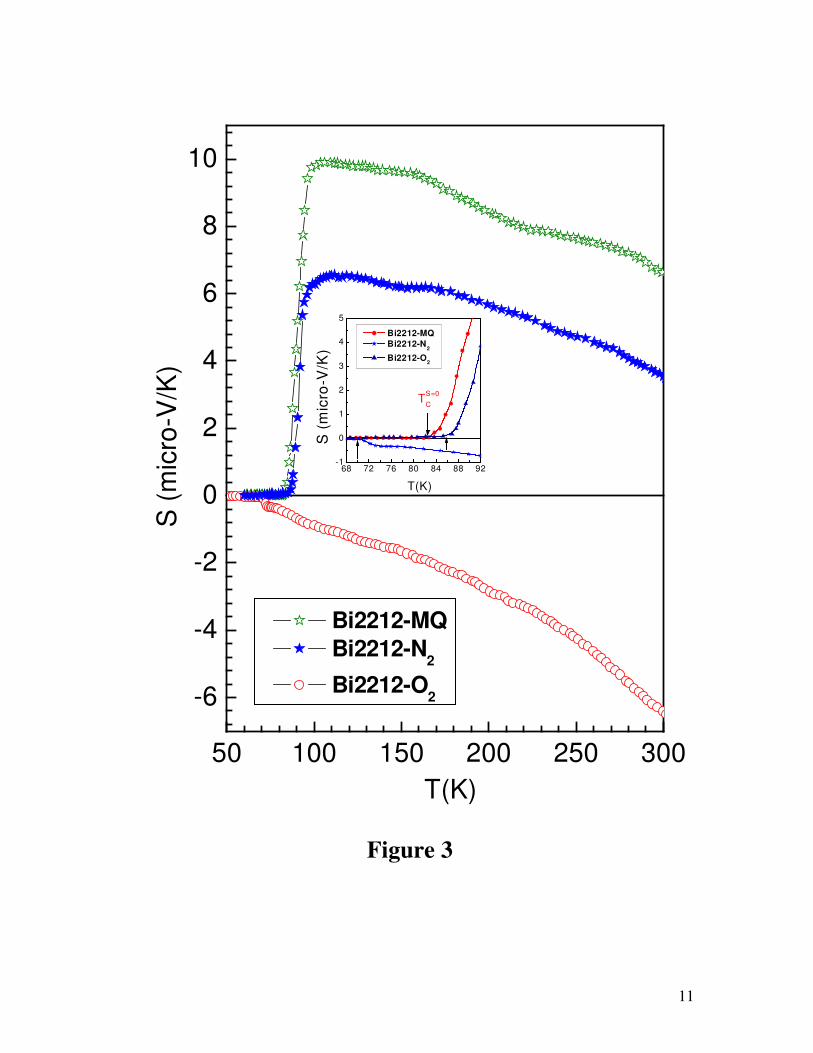
The thermoelectric power S(T) behavior of the studied Bi2212-MQ, Bi2212-N2
and Bi2212-O2 samples is given in main panel in Fig.3. All the three samples exhibit
superconductivity with TcS=0 at nearly the same Tc
R=0 temperatures. As far as the
observation of superconductivity is concerned both the R(T) and S(T) measurements
corroborate each other (Fig.1(b) and Fig.3). However, there is one striking difference i.e.,
the normal state S(T) is though positive for Bi2212-MQ, Bi2212-N2, the same is negative
for Bi2212-O2 sample. This behavior is anomalous in a single band scenario. However,
the recent ARPES results do speculate such an outcome for the S(T) of over-doped Bi
based cuprates in particular [16-18] and others in general [16]. On the other hand in case
of over-doped YBCO (YBa2Cu3O7) the observation of positive S(T) is discussed in terms
of two band (Cu-O chain and plane) contributions. Very recently Kaminski et al [18]
reported detailed ARPES studies and concluded that for heavily over-doped Bi2212
system the anti-bonding sheets become electron-like. It is shown that for number of holes
per Cu-O plane in excess of 0.22, a crossover from hole to electron conduction takes
place. In case of (Bi,Pb)2(Sr,La)2CuO6, simultaneous ARPES and S(T) were performed
5
by Kondo et al[13] and the thermo-power data was fitted from positive to negative
spectrum for under- to over-doped samples. The recent ARPES studies [13,18] have
clearly predicted the negative S(T) behavior for the heavily over-doped samples as has
been observed in the present studies for the longer hours O2 annealed over-doped Bi2212
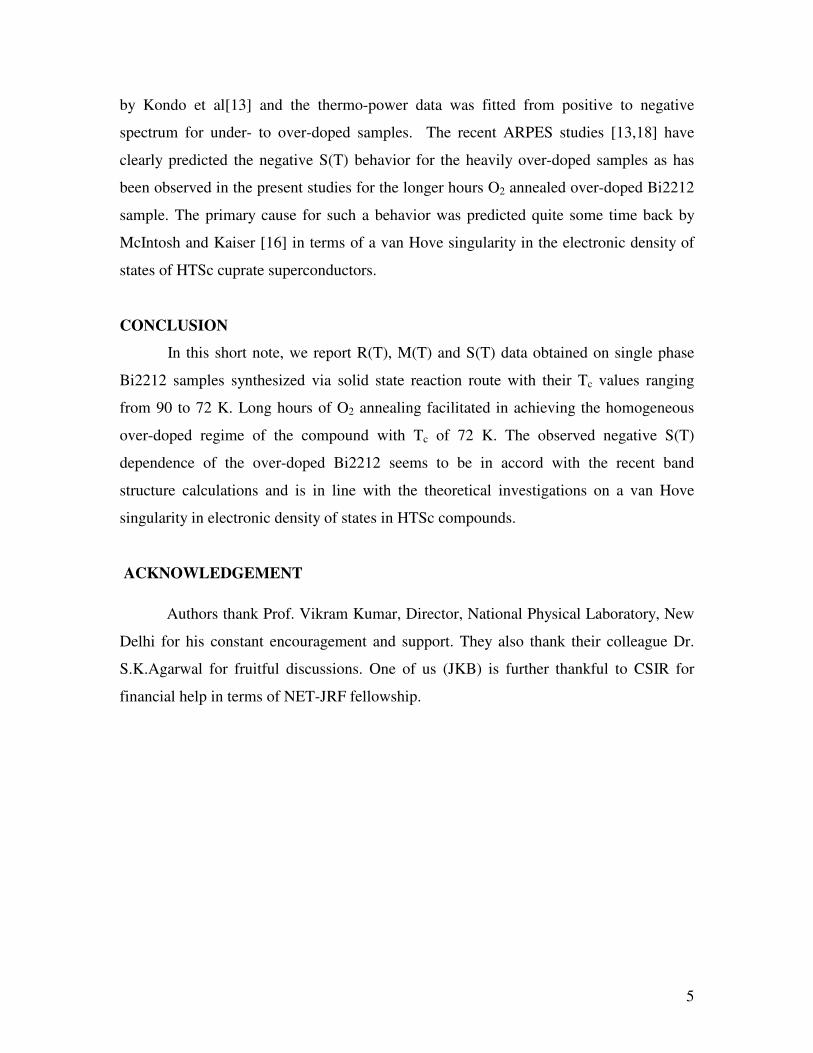
sample. The primary cause for such a behavior was predicted quite some time back by
McIntosh and Kaiser [16] in terms of a van Hove singularity in the electronic density of
states of HTSc cuprate superconductors.
CONCLUSION
In this short note, we report R(T), M(T) and S(T) data obtained on single phase
Bi2212 samples synthesized via solid state reaction route with their Tc values ranging
from 90 to 72 K. Long hours of O2 annealing facilitated in achieving the homogeneous
over-doped regime of the compound with Tc of 72 K. The observed negative S(T)
dependence of the over-doped Bi2212 seems to be in accord with the recent band
structure calculations and is in line with the theoretical investigations on a van Hove
singularity in electronic density of states in HTSc compounds.
ACKNOWLEDGEMENT
Authors thank Prof. Vikram Kumar, Director, National Physical Laboratory, New
Delhi for his constant encouragement and support. They also thank their colleague Dr.
S.K.Agarwal for fruitful discussions. One of us (JKB) is further thankful to CSIR for
financial help in terms of NET-JRF fellowship.
6
REFERENCES
1. J.G. Bednorz and K.A. Muller, Z. Phys. B 64, 189 (1986).
2. A. Schilling, M. Cantoni, J.D. Guo and H.R. Ott, Nature 363, 56 (1993).
3. Minoru Suzuki, Phys. Rev. B 39, 2312 (1989).
4. Wu Jiang, J.L. Peng and R.L. Greene, Phys. Rev. B 46, 8694 (1992); Wu Jiang,
S.N. Mao, X.X. Xi, Xiuguang Jiang, J.L. Peng, T. Venkatesan, C.J. Lobb and
R.L. Greene, Phys. Rev. Lett. 73, 1291 (1994); G. S. Okram, B. D. Padalia, Om
Prakash, S. K. Agarwal and A. V. Narlikar, Physica C 277, 19 (1997).
5. C. Heine, W. Lang, X.L. Wang and S.X. Dou, Phys. Rev. B. 59, 11179 (1999).
6. A.V. Inyushkin, A.N. Taldenkov and T.G. Uvarova, Phys. Rev. B. 54, 13261
(1996).
7. Yoichi Ando and Kouji Segawa, Phys. Rev. Lett. 88, 16705 (2002).
8. D.K.C. McDonald, Thermoelectricity (Wiley, New York, 1962).
9. C. Uher, A.B. Kaiser, E. Gmelin and L. Walz, Phys. Rev. B. 36, 5676 (1987).
10. I. Terasaki, Y. Sasago and K. Uchinokura, Phys. Rev. B. 56, 12685 (1997).
11. F. Muranakata, K. Matsuura, K. Kubo, T. Kawano and H. Yamauchi, Phys. Rev.
B. 45, 10604 (1992).
12. C. Bernhad and J.L. Tallon, Phys. Rev. B. 54, 10201 (1996).
13. Takeshi Kondo, Tsunehiro Takeuchi, Uchiro Mizutani, Takeyoshi Yokoya,
Syunsuke Tsuda and Shik Shin, Phys. Rev. B. 72, 024533 (2005).
14. J.-S. Zhou and J. B. Goodenough, Phys. Rev. B 54, 12488 (1996).
15. T. Plackowski and M. Matusiak, Phys. Rev. B 60, 14872 (1999).
16. G.C. McIntosh and A.B. Kaiser, Phys. Rev. B. 54, 12569 (1996).
17. Mao Zhiqiang, Xu Gaojie, Wang Ruping, Wang Keqing, Tian Mingliang and
Zhang Yuheng, Phys. Rev. B. 55, 14581 (1997).
18. A. Kaminiski, S. Rosenkranz, H.M. Fretwell, M.R. Norman, M. Randeria, J.C.
Kapuzano, J-M. Park, Z.Z. Li and H. Raffy, Phys. Rev. B. 73, 174511 (2006).
19. H. Mashima, N. Fukuo, Y. Matsumoto, G. Kinoda, T. Kondo, H. Ikuta, T.
Hitosugi and T. Hasegawa, Phys. Rev. B. 73, 060502 (2006).
20. V.P.S. Awana, Ratan Lal and A.V. Narlikar, J. Phys. Cond. Matt. 7, L171 (1997).
21. Ajay Soni and G.S. Okram, Rev. Sci. Instr. 79, 125103 (2008).
7
22. S.K. Agarwal, V.P.S. Awana, V.N. Moorthy, P.M. Kumar, B.V. Kumaraswamy,
C.V.N. Rao and A.V. Narlikar, Physica C 160, 278 (1989).
FIGURE CAPTIONS
Fig.1(a) X-ray diffractograms of the various Bi2212 samples, the inset shows the extended low angle characteristic (002) peak. Fig.1(b) Temperature dependence of resistance R(T) of the Bi2212-MQ, Bi2212-N2 and Bi2212-O2 samples. Fig.2 Temperature dependence of DC magnetization of the Bi2212-MQ and Bi2212-O2 samples in ZFC and FC configurations. Fig.3 Temperature dependence of thermopower S(T) of the Bi2212-MQ, Bi2212-N2 and Bi2212-O2 samples.
8
10 20 30 40 50 60 70 80 90
4 5 6 7 8
MQ
N2
O2Bi2212-O
2
Bi2212 -N2
Bi2212-MQ
Inte
nsity (
arb
. U
nits)
2 Theta (Degree)
(002)
(002)
(002)
Figure 1(a)
9
50 100 150 200 250 300
0.0000
0.0005
0.0010
0.0015
0.0020
0.0025
0.0030
Bi2212-O2
Bi2212-N2
Bi2212-MQ
Resis
tivity (
Ohm
cm
)Resis
tivity (
Ohm
cm
)Resis
tivity (
Ohm
cm
)Resis
tivity (
Ohm
cm
)
Temperature (K)Temperature (K)Temperature (K)Temperature (K)
Bi2212-(Bi2Sr
2CaCu
2O
8)
Figure 1(b)
10
0 20 40 60 80 100
-0.03
-0.02
-0.01
0.00
0.01
72 K
90 KM
(em
u/g
)
T (K)
Bi2212-MQ
Bi2212-O2
FC
FC ZFCZFC
Figure 2
11
50 100 150 200 250 300
-6
-4
-2
0
2
4
6
8
10
68 72 76 80 84 88 92-1
0
1
2
3
4
5S
(m
icro
-V/K
) Bi2212-MQ
Bi2212-N2
Bi2212-O2
T(K)
TS=0
C
S (
mic
ro-V
/K)
T(K)
Bi2212-MQ
Bi2212-N2
Bi2212-O2
Figure 3


