Embed Size (px)
Citation preview
The US Federal Reserve bankIntroductionThis note covers the National Banks of the US, the Federal Reserve Bank, Financial Stability Policy, Monetary Policy, Taylor Rule, “Quantitative Easing”, “Forward Guidance”, Inflation Target and Economic Recovery in the US.
The First and Second National bank of the USAfter the US won its independence from Great Britain in 1776 there was a desire among many business people and politicians to set up a National Bank similar to the Bank of England. There was also opposition to a strong bank from groups such asfarmers who disliked bankers. The First National Bank of the United States was given a charter by the Federal Government in 1791 but this was only a 20 year charter and thecharter was not renewed in 1811.
In 1812 however the US got involved in a war with Great Britain. During this war in 1813 the British captured Washington and burned the White House. During the war the Government realized that they needed a large powerful bank to raise finance for the war by selling government bonds. This eventually led to the setting up of a second national bank.
The Second National Bank of the United States was given a 20 year charter in 1816 but in 1836 its charter was also not renewed. This meant that America only had small state-chartered banks which only operated within their own state. This created many difficulties very poor quality bank notes and problems for the government in raising finance.
During the US Civil War the “Union” government could not raiseenough funding and the US Treasury started printing “United States Notes”. These were “legal tender” and were used to help
1
finance the war although the government had other sources alsoincluding tax revenues and war bonds.
National BanksIn 1863 the National Banking Act, passed during the Civil War,provided for the setting up of banks with national charters that could carry on banking all over the US. The act also led to the ending of note issue by the state banks. The national banks had to follow rules on Capital and Reserves. The national banks could only issue banknotes if they were fully backed by US government securities. This meant that there was no agency that could give banks notes, secured by bank assets,during a financial panic.
There were regular financial panics in the US over the following 40 years. These included panics in 1873, 1884, 1890, 1893 and 1907. These financial panics led to bank collapses, losses by depositors and “Trade Recessions”.
The 1907 financial crisis led to a large number of bank failures and would have been much worse only for the actions of JP Morgan who coordinated the major banks in New York to provide funding for other banks.
A consensus emerged after 1907 that the US needed a Central Bank but there was no consensus on who should control the new bank or how it would be organized. The larger banks wanted a single Central Bank based in New York and controlled by bankers. President Wilson proposed 12 Regional Federal ReserveBanks with their capital subscribed by the commercial banks and a Federal Reserve Board with some members appointed by thePresident to supervise the system. The attached site gives a short background history of the setting up of the Federal Reserve Banking System. This site gives a short background history of the setting up of the Federal Reserve Banking System.
2
The Federal Reserve BankThe Federal Reserve Act was passed in 1913 and 99% of the 7,000 national banks joined. The start of World War 1 delayed the setting up of the Federal Reserve but the banks opened in November 1914.
The preamble to the Act states that it is “An act to provide for the establishment of Federal reserve banks, to furnish an elastic currency, to afford means of rediscounting commercial paper, to establish a more effective supervision of banking in the United States and for other purposes”
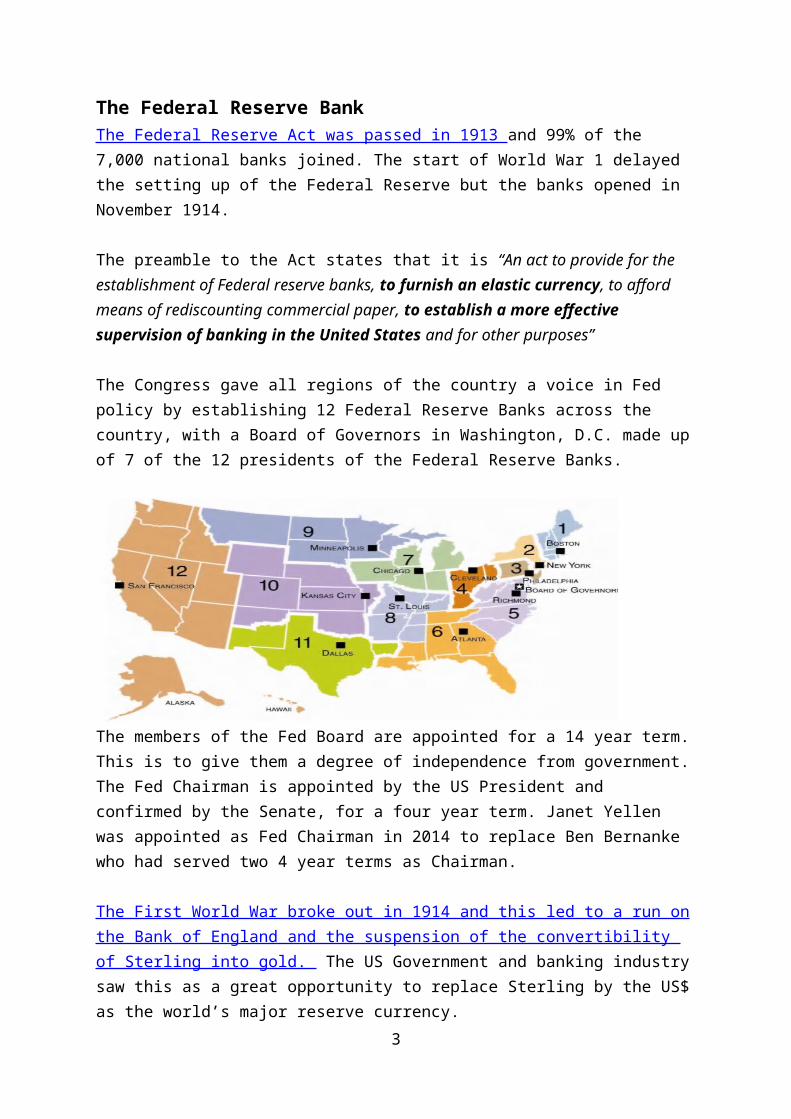
The Congress gave all regions of the country a voice in Fed policy by establishing 12 Federal Reserve Banks across the country, with a Board of Governors in Washington, D.C. made upof 7 of the 12 presidents of the Federal Reserve Banks.
The members of the Fed Board are appointed for a 14 year term.This is to give them a degree of independence from government.The Fed Chairman is appointed by the US President and confirmed by the Senate, for a four year term. Janet Yellen was appointed as Fed Chairman in 2014 to replace Ben Bernanke who had served two 4 year terms as Chairman. The First World War broke out in 1914 and this led to a run onthe Bank of England and the suspension of the convertibility of Sterling into gold. The US Government and banking industrysaw this as a great opportunity to replace Sterling by the US$as the world’s major reserve currency.
3
The US Government, under the leadership of Treasury Secretary W. McAdoo, decided that they would maintain the convertibilityof the $ into Gold . The US Treasury provided emergency loans to banks. The emergency loans to banks prevented financial panic. Foreign Investors had invested heavily in US business particularly in the railways. The US Government closed the NYSE for 4 months from July 31 to make it difficult for foreign countries to sell their US investments. If countries could sell their US investments they would be paid in $s whichthey would then want to convert into gold. This would have created a drain on US gold reserves. In addition the US wouldonly export in exchange for $s or gold and this created a demand for $s which also protected the gold reserves.
The Fed was established in November 2014. The first major testof the Fed after 1914 was in 1929 with the start of the “GreatDepression”. The failure of the Fed in 1929 is in sharp contrast with the success of the US Treasury in 1914.
The Fed responded inadequately to bank runs and bank failures swept the US. More than 10,700 of the nation's 25,000 banks (at the end of 1928) suspended operations between 1929 and 1934. The Federal Reserve failed in both parts of its mission,Monetary Policy and Financial Policy:
• It did not use monetary policy to prevent deflation and the collapse in output and employment.
• It did not adequately perform its function as Lender of Last Resort, allowing many bank failures and a resulting contraction in credit.
In bank failures bank depositors suffered significant losses, on average about 20% of the value of the deposits. In 1934 theUS introduced bank deposit insurance by setting up the FDIC, Federal Deposit Insurance Corporation under the FDIC Act of 1933
4
Between World War II, ended 1945, and the recent financial crisis, macroeconomic stability was the predominant concern ofmost central banks including the Fed as there was general financial stability.
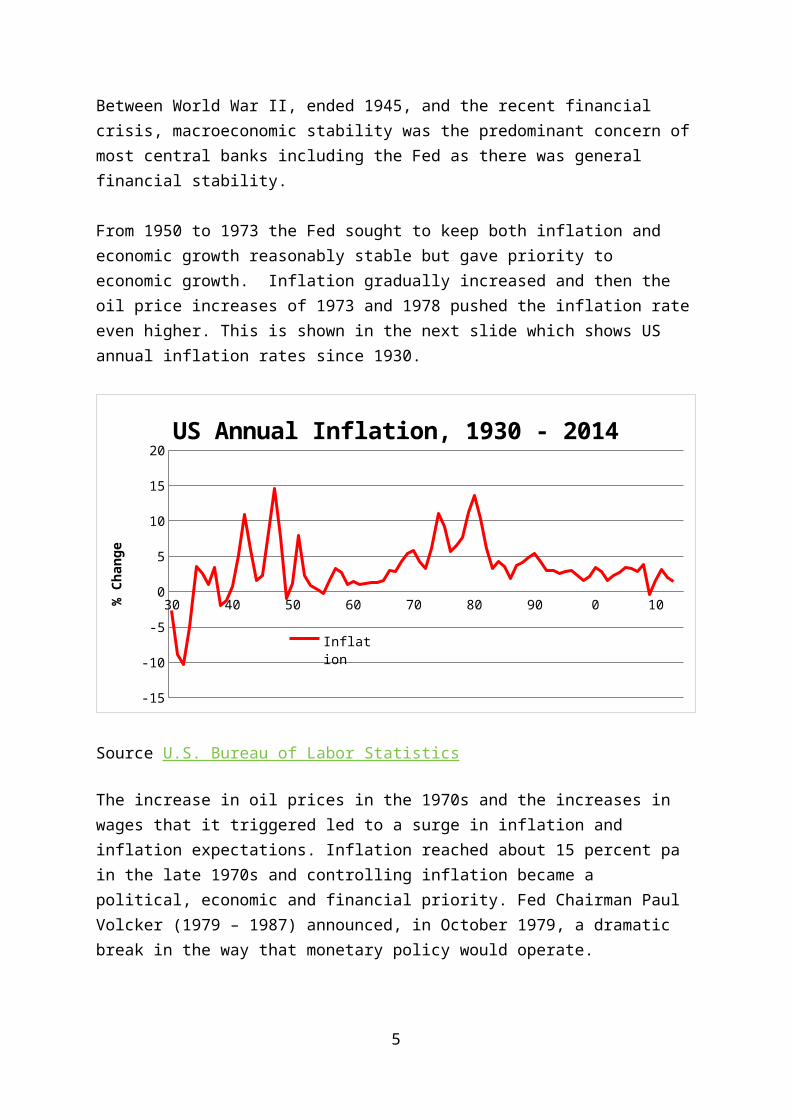
From 1950 to 1973 the Fed sought to keep both inflation and economic growth reasonably stable but gave priority to economic growth. Inflation gradually increased and then the oil price increases of 1973 and 1978 pushed the inflation rateeven higher. This is shown in the next slide which shows US annual inflation rates since 1930.
30 40 50 60 70 80 90 0 10
-15
-10
-5
0
5
10
15
20US Annual Inflation, 1930 - 2014
Inflation
% Ch
ange
Source U.S. Bureau of Labor Statistics
The increase in oil prices in the 1970s and the increases in wages that it triggered led to a surge in inflation and inflation expectations. Inflation reached about 15 percent pa in the late 1970s and controlling inflation became a political, economic and financial priority. Fed Chairman Paul Volcker (1979 – 1987) announced, in October 1979, a dramatic break in the way that monetary policy would operate.
5
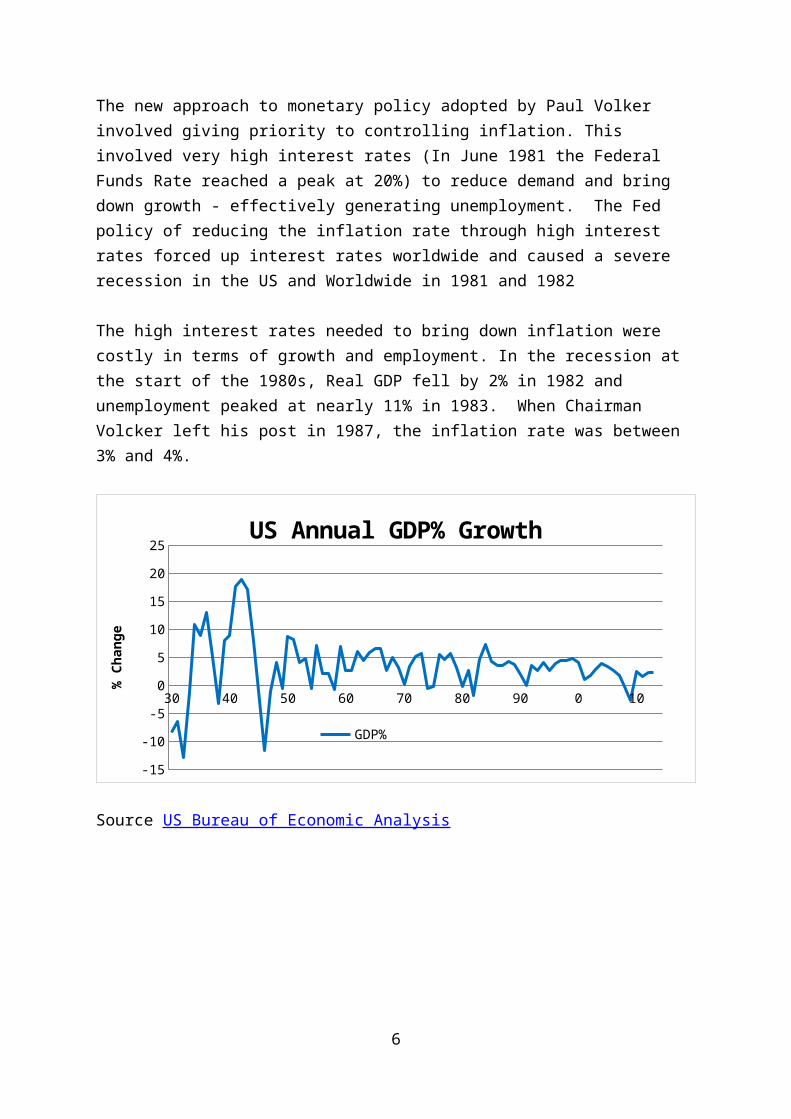
The new approach to monetary policy adopted by Paul Volker involved giving priority to controlling inflation. This involved very high interest rates (In June 1981 the Federal Funds Rate reached a peak at 20%) to reduce demand and bring down growth - effectively generating unemployment. The Fed policy of reducing the inflation rate through high interest rates forced up interest rates worldwide and caused a severe recession in the US and Worldwide in 1981 and 1982
The high interest rates needed to bring down inflation were costly in terms of growth and employment. In the recession at the start of the 1980s, Real GDP fell by 2% in 1982 and unemployment peaked at nearly 11% in 1983. When Chairman Volcker left his post in 1987, the inflation rate was between 3% and 4%.
30 40 50 60 70 80 90 0 10
-15
-10
-5
0
5
10
15
20
25US Annual GDP% Growth
GDP%
% Ch
ange
Source US Bureau of Economic Analysis
6
30 40 50 60 70 80 90 0 10
-15
-10
-5
0
5
10
15
20
25
-15
-10
-5
0
5
10
15
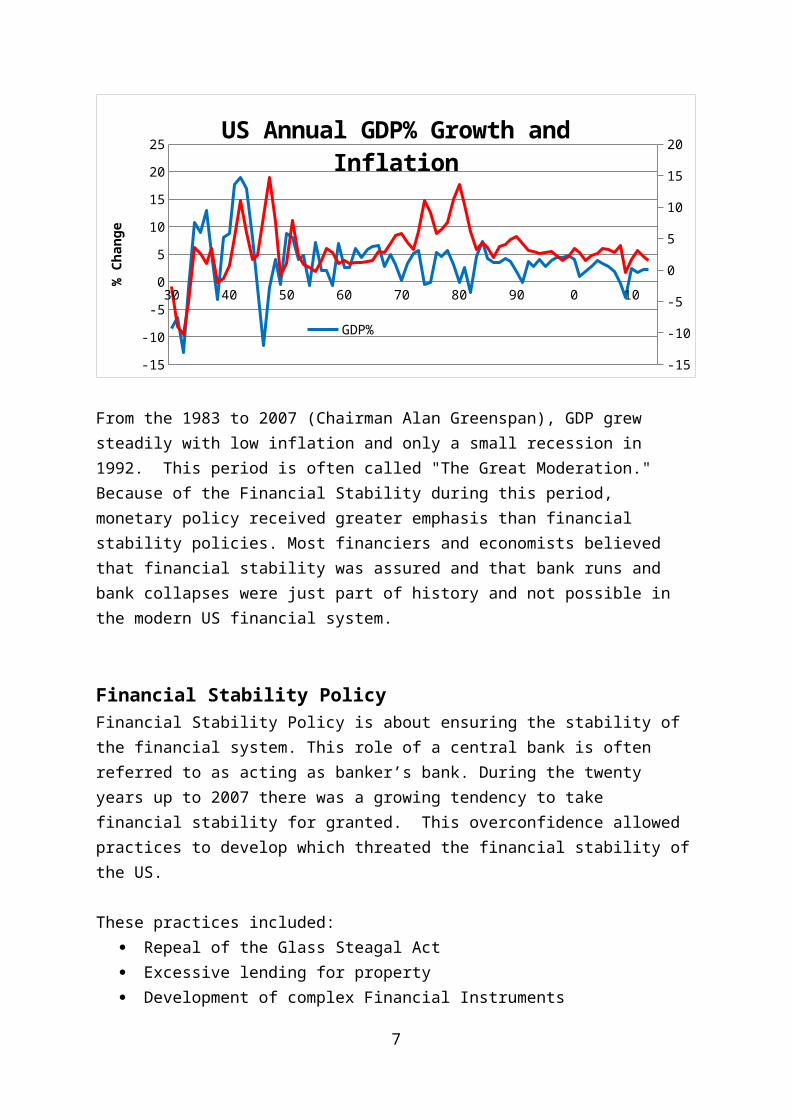
20US Annual GDP% Growth and
Inflation
GDP%
% Ch
ange
From the 1983 to 2007 (Chairman Alan Greenspan), GDP grew steadily with low inflation and only a small recession in 1992. This period is often called "The Great Moderation." Because of the Financial Stability during this period, monetary policy received greater emphasis than financial stability policies. Most financiers and economists believed that financial stability was assured and that bank runs and bank collapses were just part of history and not possible in the modern US financial system.
Financial Stability PolicyFinancial Stability Policy is about ensuring the stability of the financial system. This role of a central bank is often referred to as acting as banker’s bank. During the twenty years up to 2007 there was a growing tendency to take financial stability for granted. This overconfidence allowed practices to develop which threated the financial stability ofthe US.
These practices included: Repeal of the Glass Steagal Act Excessive lending for property Development of complex Financial Instruments
7
Increased importance of unregulated banks
The Glass Steagal Act, US Banking Act of 1933, was introducedto reduce the risk of bank failures by imposing restrictions on commercial banks. Banks were not allowed to get involved incomplex securities trading. In effect Glass Steagal separated normal banking activities from investment banking. During the 1990s pressure built up to eliminate these restrictions and GLBA Act of 1999 repealed Glass Seagal and allowed banks to get involved in securities trading and other high risk financial activities.
One of the key reasons for the financial crisis of 2008 was the excessive lending to property. Prior to the early 2000s, US homebuyers typically made a significant down payment and lenders were very careful about accurate documentation. The Fed's low interest rate monetary policy in the early 2000s made house purchase very attractive and led to rising prices.
Rising house prices created an expectation that housing was a "can't lose" investment. A surge in Sub-Prime Lending (Loans to borrowers with high risk) and Adjustable Rate Mortgages (1%start) ARMs, drove up demand for housing, raising prices further.
Complex Financial Instruments were developed with very little regulation or understanding of the risks involved. One of category of such instruments was securitization of home loans.Lenders “bundled” home loans into Mortgage Backed Securities which they sold as low risk investments and then used the money they raised to give further house loans.Fannie Mae and Freddie Mac are two US Government-backed Agencies that helped to finance home purchases by purchasing these Mortgage Backed Securities which now had little value. They funded their MBS purchases through short term borrowings.
8
Between 1999 and 2006, US house prices rose by 130 percent. Rising House Prices combined with rising interest rates eventually led to a drop in demand for houses. Declining demand for houses led to a drop in house prices beginning in early 2006. House prices fell by about 40 percent between 2006and 2008. Many house owners, particularly Sub-Prime ARMs Borrowers had “Negative Equity” and could not meet payments. Mortgage delinquencies and foreclosures surged. The number of houses for sale grew rapidly and prices fell. Banks and other holders of Mortgage Backed Securities suffered sizable losses—a key trigger of the crisis.
As investors realized that the housing market was collapsing they withdrew funding from all organisations linked to housingfinance including Fannie Mae and Freddie Mac. These two companies were rescued by the US Treasury which guaranteed loans of $200 billion to them.
Many of the Mortgage Backed Securities were insured by AIG, the largest Insurance Co in the World. The Fed rescued AIG with a $85bn loan.
The rescue of Fannie Mae, Freddie Mac and AIG were part of a cascade of events in September 2008 that spread out from the collapse in the housing market and rocked the US financial system.
Up until 2008 New York had five major investment banks. These were Goldman Sachs, Lehman Brothers, Bear Stearns, Merrill Lynch and Morgan Stanley. These investment banks were not regulated by the Federal Reserve Bank and so had much greater freedom of action than ordinary banks. The downside of this was that since they were not regulated by the Federal Reserve they could not access the Fed for short terms loans if they were in difficulty.
9
These investment bankers were heavily involved in subprime lending and derivative trading and were badly affected by the financial crisis of 2007/2008. The Federal Reserve Bank of NY organized a bail-out of Bear Stearns in March 2008. BS was facing a “liquidity” crisis so the Fed of NY approached JP Morgan Chase to bailout BS and this was done by means of an immediate buyout. JPM offered just $2 per share even though BSshares were trading at $150 per share less than one year earlier, although it later increased the offer to $10. The Fedlent $29bn to JP Morgan Chase to support the bailout of Bear Stearns.
The crisis on Wall Street came to a head in September 2008. Merrill Lynch was bought by Bank of America on September 14th. On September 15th Lehman Brothers filed for bankruptcy. Lehman Brothers had assets of over €600 billion and this was the biggest bankruptcy in US history. Within days of the collapse of Lehman Brothers both Morgan Stanley and Goldman Sachs converted into ordinary banks regulated by the Federal Reserve in order to be able to borrow directly from the Fed. This was the end of Wall Street Investment Banking. The decision by US Financial Authorities to allow Lehman Brothers to go bankrupt was quickly seen as a massive error asit reduced confidence in the banking system on a world-wide basis and deepened the world-wide recession.
The collapse of Lehmans had a devastating impact on the Money Market. Up to this event all major banks had complete confidence in other major banks. This confidence allowed the Money Market to function. The collapse of Lehmans shattered this confidence so the Money Market stopped functioning. Banksthat had surplus cash hoarded it and refused to lend to banks with cash shortages. Rather than lend to another ban they deposited these funds with the Fed. The Fed rescued the US Financial System by acting vigorously as “Lender of Last Resort”. The Fed cut interest rates and relent these funds to
10
the banks and other financial institutions with cash shortages.
The deepening financial crisis led the US Treasury to make $700 billion available to US banks in October 2008 to help them survive. Part of this involved the Treasury buying $125 billion of Preference Shares in 9 leading banks including Citigroup which was allocated $25 billion of this.
The actions of the Fed prevented a financial collapse and gradually confidence and stability returned to the US financial system. This is evidenced by the rapid return to normal of the Money Market and the recovery of share prices. Share Prices were back to 14k, the pre- recession peak in February 2013.
During the Financial Crisis it became obvious that the repeal of the 1933 Glass-Steagal Act by the GLBA Act of 1999, which allowed banks to get involved in a variety of high risk areas including proprietary trading in complex derivatives, had contributed to the financial instability .The Dodd-Frank’s Actof 2010 introduced restrictions on the activities of US banks to prevent them from engaging in such high risk activities. One section of the Dodd-Franks Act, known as the Volker Rule, restrains banks from short-term proprietary trading of securities, derivatives, commodity futures and options on these instruments .In other words, banks cannot use their own funds to make these types of investments to increase their profits
Following on from the Financial Crisis the Fed, in line with the development of the Basel 3 Rules and the requirements of the 2010 Dodd-Franks Act, introduced new Capital Ratios and Liquidity Requirements for US institutions. The Capital Ratiorequires banks to have capital equal to 8% of Risk Weighted Assets. The Liquidity Requirements involve having liquid
11
assets to cover 30 days potential outflows under stressed conditions.
Monetary PolicyThe Federal Reserve Website explains that “"monetary policy" refers to the actions undertaken by a central bank, such as the Federal Reserve, to influence the availability and cost of money and credit to help promote national economic goals. The Federal Reserve Act of 1913 gave the Federal Reserve responsibility for setting monetary policy”.
The Federal Reserve’s responsibility for managing monetary policy comes from the 1913 Act’s Preamble which directed the Fed "to furnish an elastic currency”. The Feds role in Monetary Policy was clarified by Federal Reserve Act in 1977 which directed the Fed to "maintain long run growth of monetary and credit aggregates … so as to promote effectively the goals of maximum employment, stable prices, and moderate long-term interest rates.". This wording, focused on Monetary and Credit aggregates, reflected the thinking in the 1970s (Monetarism) which argued that the role of a central bank was to control the economy andparticularly inflation by focusing on “Monetary Aggregates” such as M1 and Credit Growth.However all attempts to control the economy through controlling the money supply with targets for M1 or other definitions of money were not effective as banks innovated andtechnology changed. More recent examples of tis innovation andtechnology change include Internet banking and Bitcoins.
Ben Bernanke explained this in 2006 “Unfortunately, forecast errors for money growth are often significant, and the empirical relationship between money growth and variables such as inflation and nominal output growth has continued to be unstable at times”
This led the Fed to focus on controlling Interest rates as a way of controlling the economy. This single focus on interest rates, now referred to as “Conventional Monetary Policy”
12
lasted from the 1980s until the 2008 Great Recession. After 2008 the Fed also used Quantitative Easing and Forward Guidance.
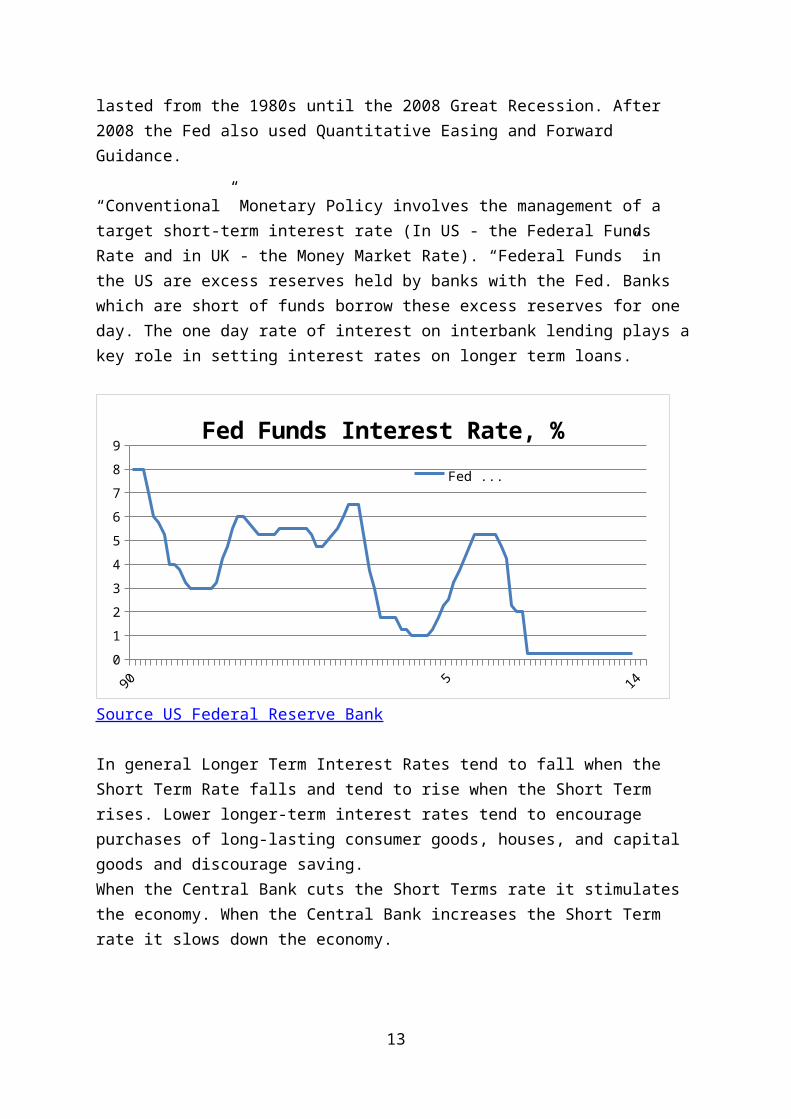
“Conventional” Monetary Policy involves the management of a target short-term interest rate (In US - the Federal Funds Rate and in UK - the Money Market Rate). “Federal Funds” in the US are excess reserves held by banks with the Fed. Banks which are short of funds borrow these excess reserves for one day. The one day rate of interest on interbank lending plays akey role in setting interest rates on longer term loans.
90 5 140123456789
Fed Funds Interest Rate, %Fed ...
Source US Federal Reserve Bank
In general Longer Term Interest Rates tend to fall when the Short Term Rate falls and tend to rise when the Short Term rises. Lower longer-term interest rates tend to encourage purchases of long-lasting consumer goods, houses, and capital goods and discourage saving. When the Central Bank cuts the Short Terms rate it stimulates the economy. When the Central Bank increases the Short Term rate it slows down the economy.
13
The Federal Reserve controls four tools of monetary policy, the Discount Rate, Reserve Requirements, the Interest Rate on Excess Deposits and Open Market Operations (OMO).The Board of Governors of the Federal Reserve System is responsible for the Discount Rate, Excess Reserves Rate and Reserve Requirements and the Federal Open Market Committee is responsible for Open Market Operations.
The Discount Rate is the interest rate charged to commercial banks and other depository institutions on loans they receive from their regional Federal Reserve Bank's lending facility--the discount window. All “discount window loans” are fully secured. The Discount Rate is set above the usual level of short-term market interest rates.
The Federal Reserve Website explains that “The interest rate paid on excess balances is also determined by the Board and gives the Federal Reserve an additional tool for the conduct of monetary policy”. That rate is now 0.0% but if in the future the Fed wants to push up the Federal Funds Rate it can do so by offering an attractive interest rate on Excess Deposits.
US Banks need to have reserves with the Fed for two reasons:1 To allow settlements under the “Fedwire” bank settlement
system. 2 To meet the Fed’s Minimum Reserve Requirements.
All 9k banks in the US use the Fedwire “clearinghouse” settlement system which handles 45 million items per day with average value of $1.7k.
The Fed Website explains that “Reserve Requirements are the amount of funds that a depository institution (Bank) must holdin reserve against specified deposit liabilities. Within limits specified by law, the Board of Governors has sole authority over changes in reserve requirements. Depository
14
institutions must hold reserves in the form of vault cash or deposits with Federal Reserve Banks”.
The Fed Website explains that “Open Market Operations (OMOs) --the purchase and sale of securities in the open market--are a key tool used by the Federal Reserve in the implementation of monetary policy. The Federal Reserve uses OMOs to adjust the supply of reserve balances so as to keep the Federal FundsRate--the interest rate at which depository institutions lend reserve balances to other depository institutions overnight--around the target established by the FOMC”.
And that “Using the three (Four) tools, the Federal Reserve influences the demand for, and supply of, balances that depository institutions hold at Federal Reserve Banks and in this way alters the Federal Funds Rate. The Federal Funds Rateis the interest rate at which depository institutions lend balances at the Federal Reserve to other depository institutions overnight”.
The Federal Reserve Act of 1913 was designed “to provide the nation with a safer, more flexible, and more stable monetary and financial system”. Traditionally the US Federal Reserve Bank has attempted to control the Business Cycle in the US Economy using the rate of interest. The “Fed” attempts to balance the economy to achieve “its long-run goals of price stability and sustainable economic growth”. The choices open to the Fed are illustrated by the Table below which illustrates the link between the Business Cycle, the level of Overall Demand, the level of GNP Growth, the level of Inflation and the Employment situation. The three examples represent Recession, Balance and Boom.
15
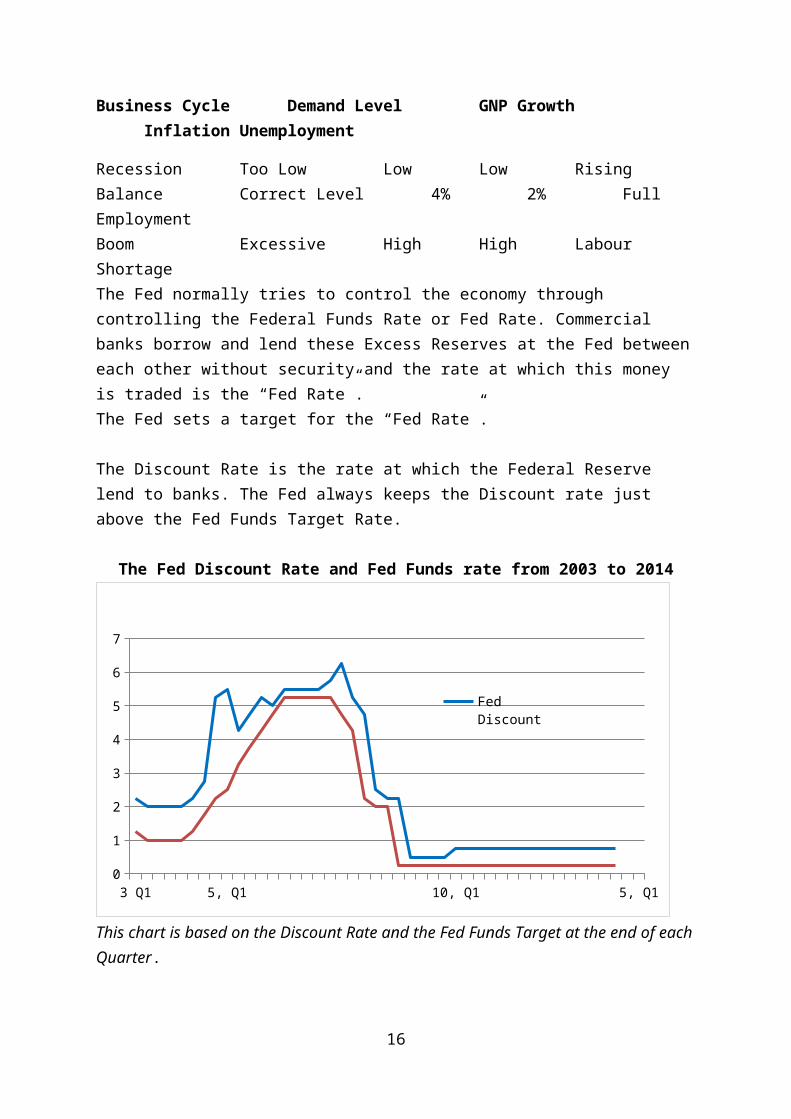
Business Cycle Demand Level GNP GrowthInflation Unemployment
Recession Too Low Low Low RisingBalance Correct Level 4% 2% Full EmploymentBoom Excessive High High Labour ShortageThe Fed normally tries to control the economy through controlling the Federal Funds Rate or Fed Rate. Commercial banks borrow and lend these Excess Reserves at the Fed betweeneach other without security and the rate at which this money is traded is the “Fed Rate”. The Fed sets a target for the “Fed Rate”.
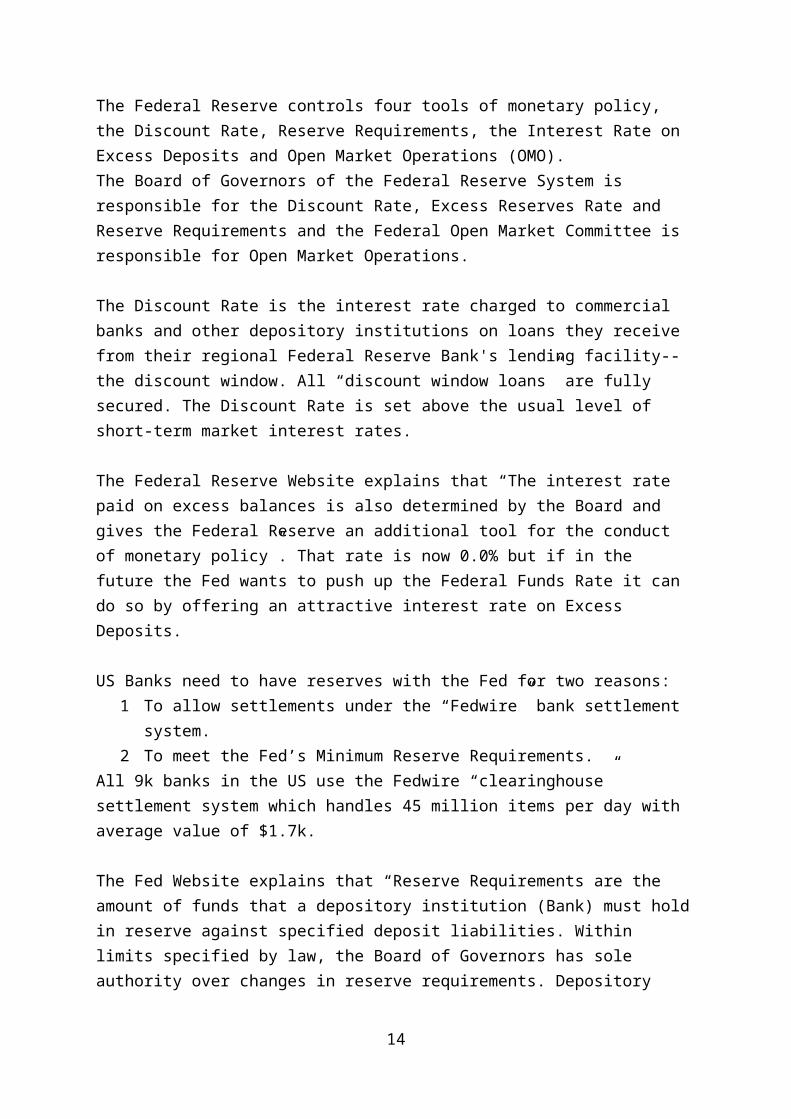
The Discount Rate is the rate at which the Federal Reserve lend to banks. The Fed always keeps the Discount rate just above the Fed Funds Target Rate.
The Fed Discount Rate and Fed Funds rate from 2003 to 2014
3 Q1 5, Q1 10, Q1 5, Q10
1
2
3
4
5
6
7
Fed Discount
This chart is based on the Discount Rate and the Fed Funds Target at the end of eachQuarter.
16
If the economy is in balance the Fed will pursue what is called a neutral interest rate policy. A 4% Fed Rate is normally regarded as neutral. A rate below 4% is often described as “expansionary” or “accommodative” and a rate above 4% is described as “restrictive”.
Before the 2007 Financial Crisis the Fed Rate was 5.25%. The Fed cut the Fed Rate rapidly to a range from 0.0% to 0.25% in December 2008. This is the lowest rate ever in the history of the Fed and indicates a severe recession with inadequate Demand and with the danger of inflation being replaced by a danger of deflation.
US Fed Funds Rate Cycle1990 1993 2000 2003 2007 2008
High Rate 8.0% 6.5% 5.25%Low Rate 3.0% 1.0% <0.25%
Taylor RuleUp until 2009 the Fed did not state its target growth or inflation rates. The thinking in the Fed appears to be in lines with the Taylor Rule which was devised by John Taylor ofPrinceton University. The rule specifies the appropriate Fed Rate. It is based on the belief that the Potential Growth Ratein the US is about 4% and that a 2% Inflation Rate is desirable. The Taylor Rule is:Fed Rate = 4% + 1.5 (Actual GDP Growth - Target GDP Growth + Actual Inflation - Target Inflation)
The Target GDP Growth is the Long-term Sustainable Growth Rateof 4% and the Target Inflation Rate is 2%. Using these targetsgives us the Fed Rate as followsFed Rate = 4% + 1.5 (Actual GDP Growth - 4 + Actual Inflation - 2)
The Taylor Rule gives a Fed Rate of 4% (seen as a neutral rate) if the GDP Growth Rate is 4% and the Inflation Rate is 2% but if the overall level of demand is too high resulting in
17
a GDP growth rate higher than 4% and inflation above 2% then the Fed Rate must rise, eg if GDP growth is 5% and inflation is 3% then the Fed Rate should rise to 7%.
The Taylor Rule shows how interest rate should move in a normal business cycle however the crisis in finance and the scale of the recession in 2008/09 was outside this normal cycle.GDP fell by 2.8% and prices fell by 0.34% in 2009. Applying the Taylor Rule to this situation would have given a 2009 Fed Rate = 4 + 1.5(-2.8 -4 -0.3 – 2) = 4 + 1.5(-9.1) = -10
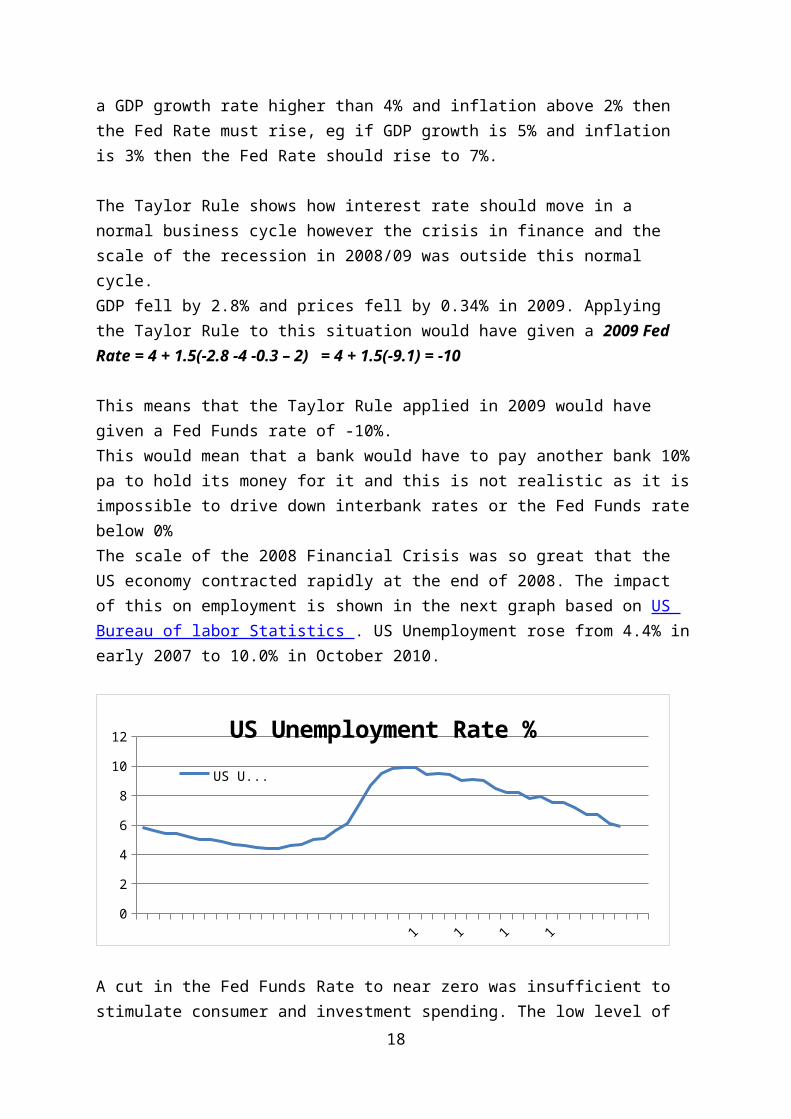
This means that the Taylor Rule applied in 2009 would have given a Fed Funds rate of -10%.This would mean that a bank would have to pay another bank 10%pa to hold its money for it and this is not realistic as it isimpossible to drive down interbank rates or the Fed Funds ratebelow 0%The scale of the 2008 Financial Crisis was so great that the US economy contracted rapidly at the end of 2008. The impact of this on employment is shown in the next graph based on US Bureau of labor Statistics . US Unemployment rose from 4.4% inearly 2007 to 10.0% in October 2010.
1 1 1 10
2
4
6
8
10
12 US Unemployment Rate %US U...
A cut in the Fed Funds Rate to near zero was insufficient to stimulate consumer and investment spending. The low level of
18
demand was leading to a rapid rise in unemployment and also creating a risk of long-term deflation. This led to the Fed toadopt “Unconventional Monetary Policy” tools. These were Quantitative Easing and Forward Guidance
Quantitative Easing “Quantitative Easing” (QE) is an “Unconventional Monetary Policy” used by central banks to stimulate the economy when standard monetary policy has become ineffective. A central bank implements quantitative easing by increasing the money supply. It does this by buying financial assets from commercial banks and other private institutions. By buying these assets and bidding up their price the central bank also lowers the yield on these assets.
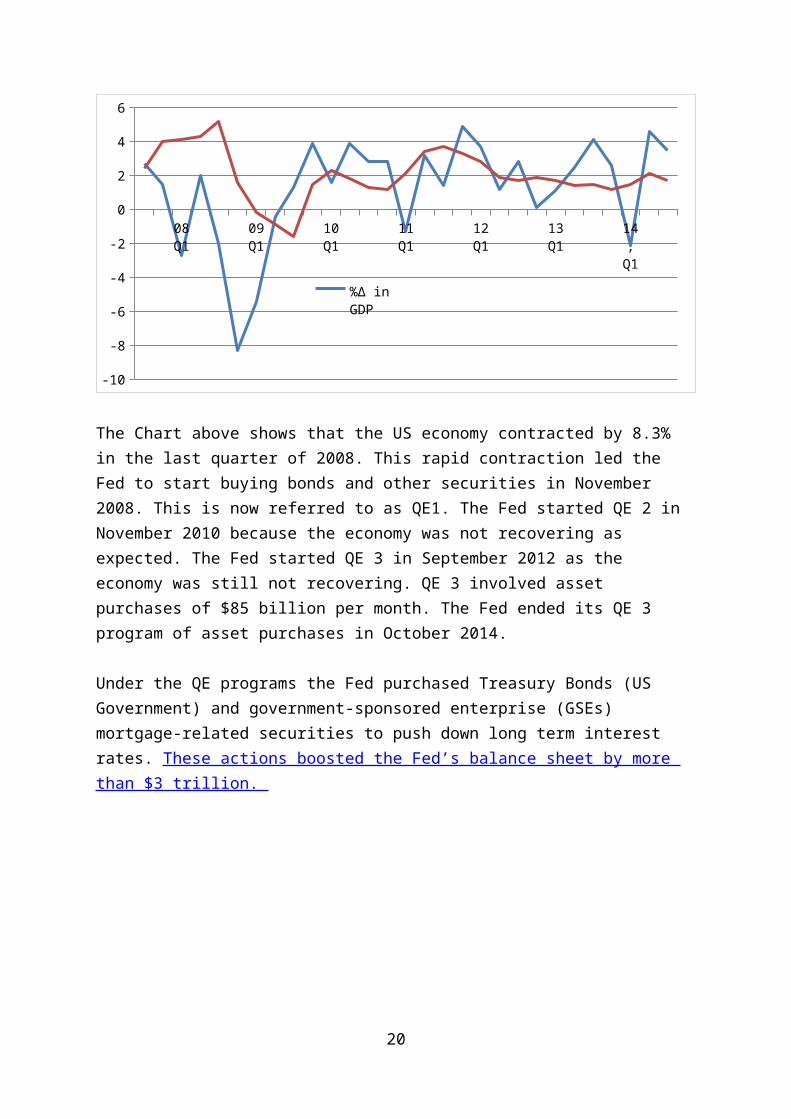
US Quarterly %∆ in GDP and Quarterly Inflation from 2008 to2014
19
08 Q1
09 Q1
10 Q1
11 Q1
12 Q1
13 Q1
14, Q1
-10
-8
-6
-4
-2
0
2
4
6
%∆ in GDP
The Chart above shows that the US economy contracted by 8.3% in the last quarter of 2008. This rapid contraction led the Fed to start buying bonds and other securities in November 2008. This is now referred to as QE1. The Fed started QE 2 in November 2010 because the economy was not recovering as expected. The Fed started QE 3 in September 2012 as the economy was still not recovering. QE 3 involved asset purchases of $85 billion per month. The Fed ended its QE 3 program of asset purchases in October 2014.
Under the QE programs the Fed purchased Treasury Bonds (US Government) and government-sponsored enterprise (GSEs) mortgage-related securities to push down long term interest rates. These actions boosted the Fed’s balance sheet by more than $3 trillion.
20
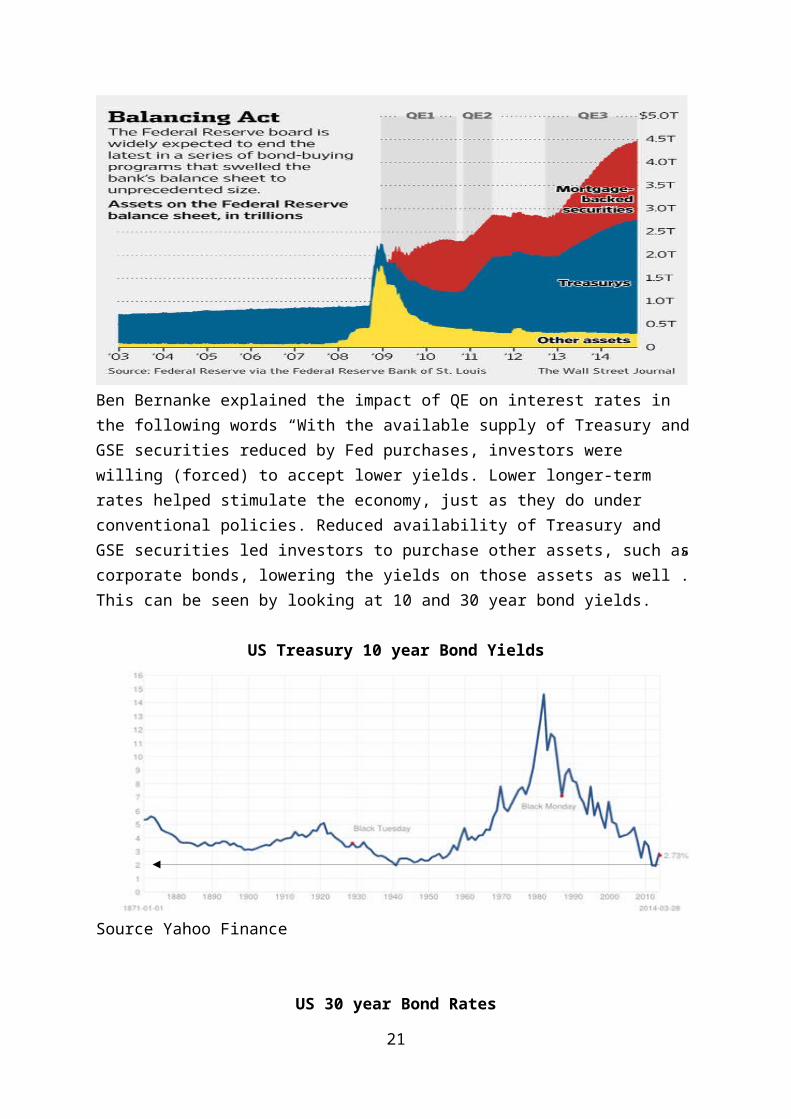
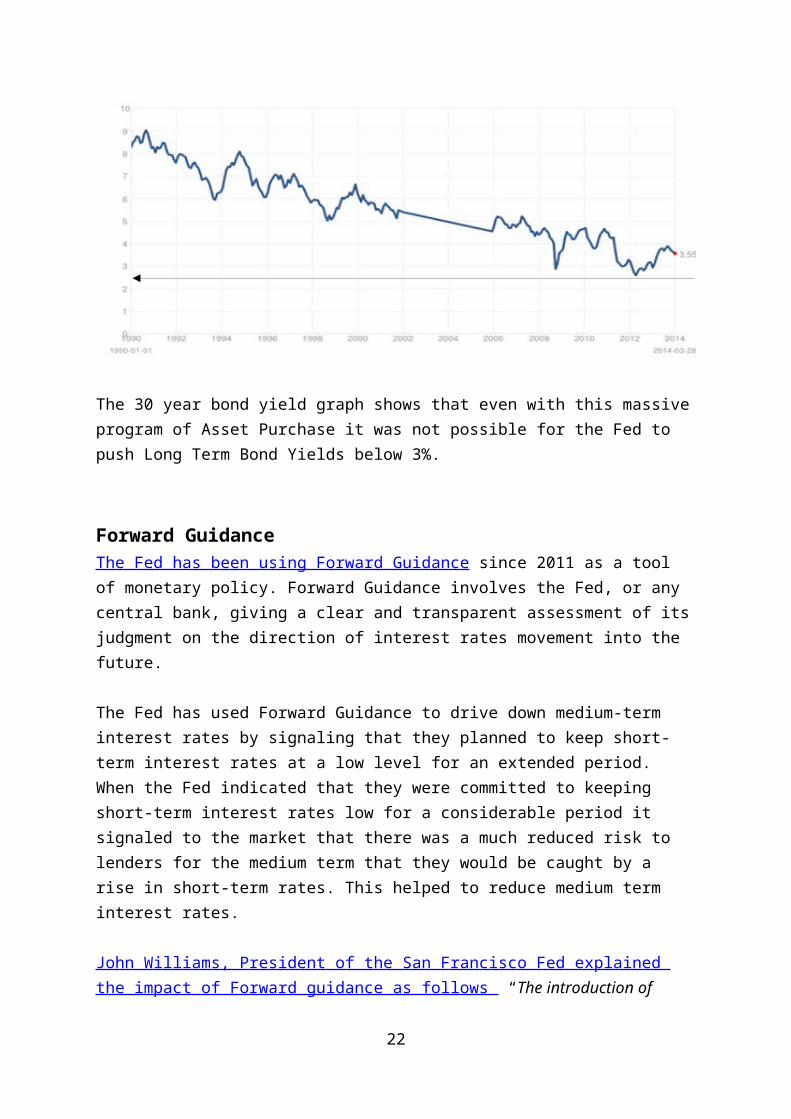
Ben Bernanke explained the impact of QE on interest rates in the following words “With the available supply of Treasury andGSE securities reduced by Fed purchases, investors were willing (forced) to accept lower yields. Lower longer-term rates helped stimulate the economy, just as they do under conventional policies. Reduced availability of Treasury and GSE securities led investors to purchase other assets, such ascorporate bonds, lowering the yields on those assets as well”.This can be seen by looking at 10 and 30 year bond yields.
US Treasury 10 year Bond Yields
Source Yahoo Finance
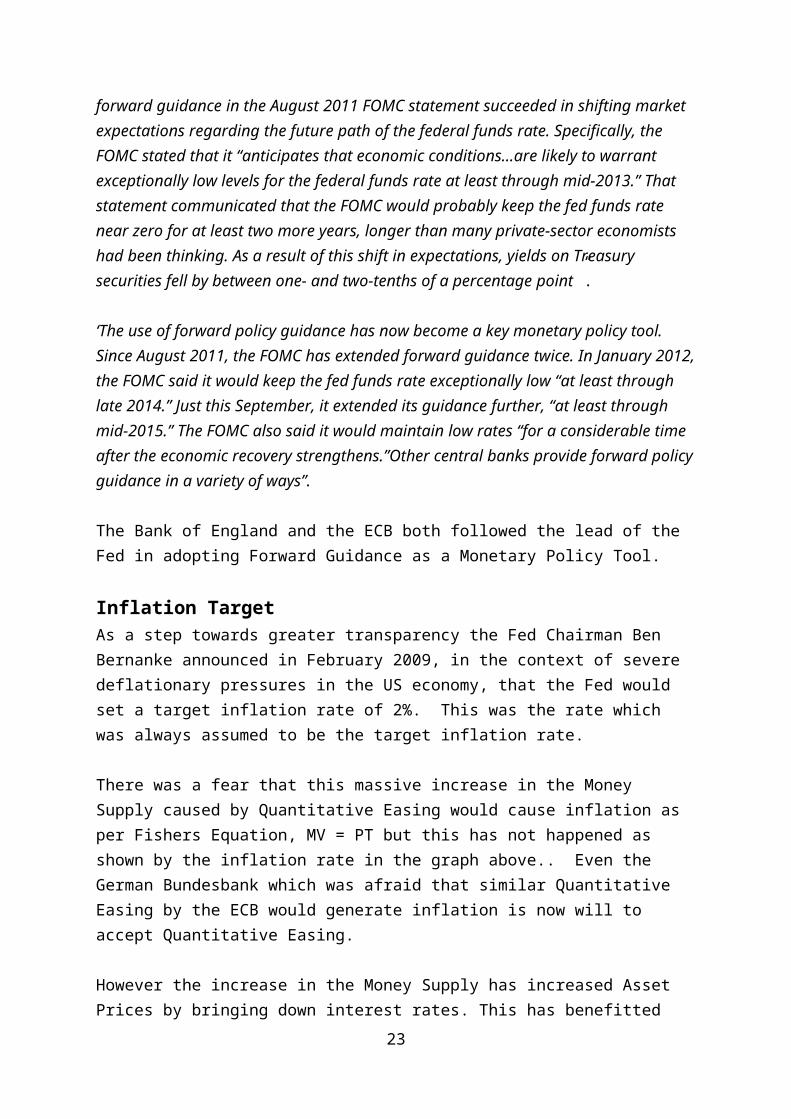
US 30 year Bond Rates
21
The 30 year bond yield graph shows that even with this massiveprogram of Asset Purchase it was not possible for the Fed to push Long Term Bond Yields below 3%.
Forward GuidanceThe Fed has been using Forward Guidance since 2011 as a tool of monetary policy. Forward Guidance involves the Fed, or any central bank, giving a clear and transparent assessment of itsjudgment on the direction of interest rates movement into the future.
The Fed has used Forward Guidance to drive down medium-term interest rates by signaling that they planned to keep short-term interest rates at a low level for an extended period. When the Fed indicated that they were committed to keeping short-term interest rates low for a considerable period it signaled to the market that there was a much reduced risk to lenders for the medium term that they would be caught by a rise in short-term rates. This helped to reduce medium term interest rates.
John Williams, President of the San Francisco Fed explained the impact of Forward guidance as follows “The introduction of
22
forward guidance in the August 2011 FOMC statement succeeded in shifting market expectations regarding the future path of the federal funds rate. Specifically, the FOMC stated that it “anticipates that economic conditions…are likely to warrant exceptionally low levels for the federal funds rate at least through mid-2013.” That statement communicated that the FOMC would probably keep the fed funds rate near zero for at least two more years, longer than many private-sector economists had been thinking. As a result of this shift in expectations, yields on Treasury securities fell by between one- and two-tenths of a percentage point”.
‘The use of forward policy guidance has now become a key monetary policy tool. Since August 2011, the FOMC has extended forward guidance twice. In January 2012,the FOMC said it would keep the fed funds rate exceptionally low “at least through late 2014.” Just this September, it extended its guidance further, “at least through mid-2015.” The FOMC also said it would maintain low rates “for a considerable time after the economic recovery strengthens.”Other central banks provide forward policyguidance in a variety of ways”.
The Bank of England and the ECB both followed the lead of the Fed in adopting Forward Guidance as a Monetary Policy Tool.
Inflation TargetAs a step towards greater transparency the Fed Chairman Ben Bernanke announced in February 2009, in the context of severe deflationary pressures in the US economy, that the Fed would set a target inflation rate of 2%. This was the rate which was always assumed to be the target inflation rate.
There was a fear that this massive increase in the Money Supply caused by Quantitative Easing would cause inflation as per Fishers Equation, MV = PT but this has not happened as shown by the inflation rate in the graph above.. Even the German Bundesbank which was afraid that similar Quantitative Easing by the ECB would generate inflation is now will to accept Quantitative Easing.
However the increase in the Money Supply has increased Asset Prices by bringing down interest rates. This has benefitted
23
the owners of assets, such as shares and property, and therefore has shifted wealth in favor of those who were already wealthy.
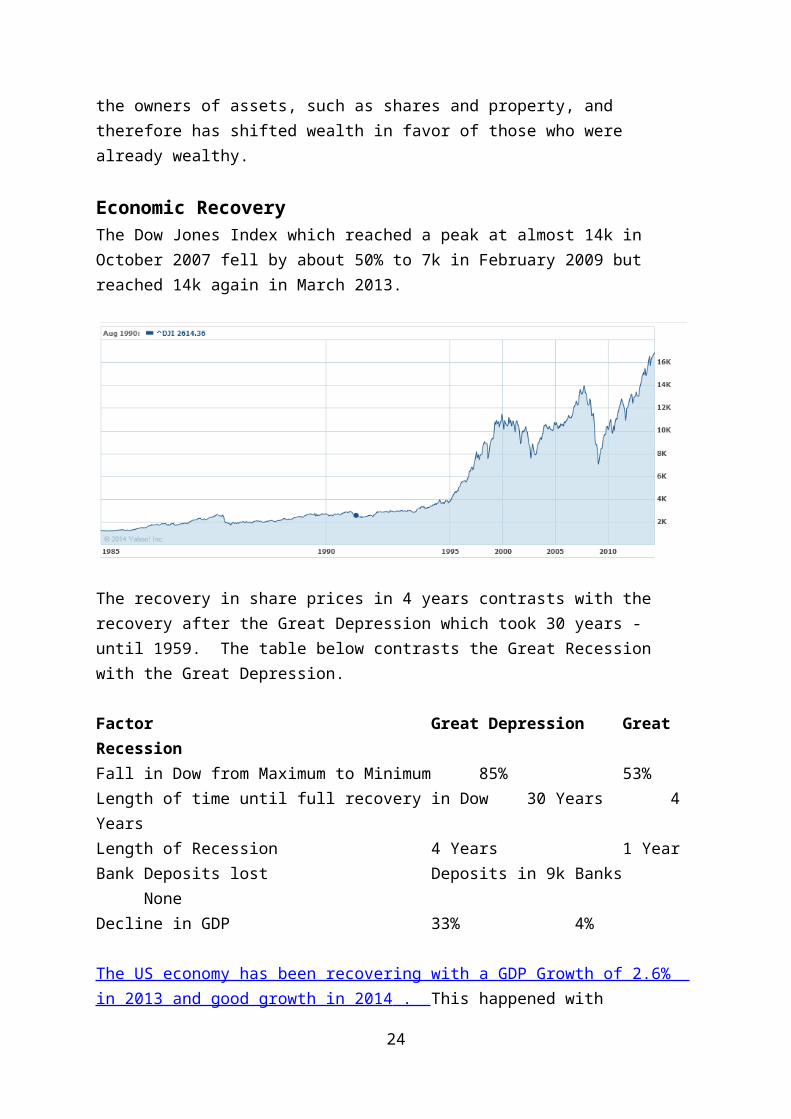
Economic RecoveryThe Dow Jones Index which reached a peak at almost 14k in October 2007 fell by about 50% to 7k in February 2009 but reached 14k again in March 2013.
The recovery in share prices in 4 years contrasts with the recovery after the Great Depression which took 30 years - until 1959. The table below contrasts the Great Recession with the Great Depression.
Factor Great Depression Great RecessionFall in Dow from Maximum to Minimum 85% 53%Length of time until full recovery in Dow 30 Years 4 YearsLength of Recession 4 Years 1 YearBank Deposits lost Deposits in 9k Banks
NoneDecline in GDP 33% 4%
The US economy has been recovering with a GDP Growth of 2.6% in 2013 and good growth in 2014 . This happened with
24
Inflation still below the Fed Target. The Fed decided in December 2013 to run down its Asset Purchase Program during 2014. QE3 ended in October 2014.
Over the next two years the Fed is likely to reverse QE by large scale selling of its Assets. It will also increase the Federal Funds Rate broadly in line with the Taylor Rule although how to apply the Taylor Rule as the economy comes outof this dramatic recession may be complex. The Fed Funds Rate will almost certainly increase significantly during 2015.
The Fed has a simple game for students showing how Monetary Policy Works . This site is worth visiting.
25


