Embed Size (px)
Citation preview
Please cite this paper as:
Stone, S., R. Cavazos Cepeda and A. Jankowska(2011-04-01), “The Role of Factor Content in Trade: HaveChanges in Factor Endowments Been Reflected in TradePatterns and on Relative Wages?”, OECD Trade PolicyPapers, No. 109, OECD Publishing, Paris.http://dx.doi.org/10.1787/5kgdnq52qxzw-en
OECD Trade Policy Papers No. 109
The Role of Factor Contentin Trade
HAVE CHANGES IN FACTOR ENDOWMENTSBEEN REFLECTED IN TRADE PATTERNS ANDON RELATIVE WAGES?
Susan Stone
Ricardo H. Cavazos Cepeda
Anna Jankowska
OECD TRADE POLICY WORKING PAPERS
The OECD Trade Policy Working Paper series is designed to make available to a
wide readership selected studies by OECD staff or by outside consultants, and is
generally available only in the original language English or French.
This document has been declassified by decision of the Working Party of the Trade
Committee under the OECD reference number TAD/TC/WP(2010)14/FINAL.
Comments on the series are welcome and should be sent to [email protected].
OECD TRADE POLICY WORKING PAPERS
are published on www.oecd.org/trade
© OECD 2011
Applications for permission to reproduce or translate all or part of this material should be made to:
OECD Publishing, [email protected] or by fax 33 1 45 24 99 30.
2 – THE ROLE OF FACTOR CONTENT IN TRADE: HAVE CHANGES IN FACTOR ENDOWMENTS BEEN REFLECTED IN TRADE PATTERNS AND ON RELATIVE WAGES?
OECD TRADE POLICY WORKING PAPER NO. 109 © OECD 2011
ABSTRACT
THE ROLE OF FACTOR CONTENT IN TRADE:
HAVE CHANGES IN FACTOR ENDOWMENTS BEEN REFLECTED
IN TRADE PATTERNS AND ON RELATIVE WAGES?
by
Susan F. Stone, Ricardo Cavazos and Anna Jankowska
OECD Secretariat
The pattern of trade analysed from a factor content perspective reflects the relative
factor endowments of the countries examined. Although some large economies, such as
the United States, seem to exhibit counter-intuitive behaviour, this is reversed when
intermediate trade is taken into account. We argue this is a reflection of the changing
nature of production processes and trade. The evidence presented here implies factor
endowments are undergoing changes that call for careful analysis of the measures
commonly used in trade. Acknowledging the role of intermediate goods to understand a
country‘s factor content trade position is one step. Additionally, one must account for the
interaction between the domestic determination of employment and wages with
international movement of goods and services, and location of tasks.
Key words: Factor content, comparative advantage, intermediate inputs, wages.
JEL Classification: F0, F14, F20
Acknowledgements
This study was prepared by Susan Stone, Ricardo Cavazos and Anna Jankowska
under the supervision of Michael Plummer. Clarisse Legendre and Jacqueline Maher
provided excellent statistical and administrative support, respectively. The report
benefited from discussions with OECD colleagues in the Trade and Agriculture
Directorate and the Employment, Labour and Social Affairs Directorate as well as the
OECD Working Party of the Trade Committee which has agreed to make the study more
widely available through declassification on its responsibility.
THE ROLE OF FACTOR CONTENT IN TRADE: HAVE CHANGES IN FACTOR ENDOWMENTS BEEN REFLECTED IN TRADE PATTERNS AND ON RELATIVE WAGES?– 3
OECD TRADE POLICY WORKING PAPER NO. 109 © OECD 2011
Table of contents
Executive Summary ............................................................................................................................. 4
I. Introduction ................................................................................................................................ 5
II. The Heckscher-Ohlin theory of international trade .................................................................... 6
III. Trends in factor endowments ..................................................................................................... 8
Relative factor endowments ............................................................................................................ 8 Trends in factor utilisation in OECD Countries ............................................................................ 11 Capital and labour utilisation in selected emerging markets ......................................................... 12 Productivity.................................................................................................................................... 13
IV. Measuring factor content .......................................................................................................... 13
Data ................................................................................................................................................ 14 How has factor usage within a country changed over time? .......................................................... 15 How has factor content of trade changed over time? ..................................................................... 17 What role has intermediate inputs played in measuring factor content of trade? ........................... 19 China .............................................................................................................................................. 20 United States .................................................................................................................................. 21
V. Relationship between trade and relative wages ........................................................................ 23
VI. Conclusions and areas of policy consideration ......................................................................... 28
References ............................................................................................................................................. 30
Data Annex ............................................................................................................................................ 33
Technical Annex .................................................................................................................................... 43
4 – THE ROLE OF FACTOR CONTENT IN TRADE: HAVE CHANGES IN FACTOR ENDOWMENTS BEEN REFLECTED IN TRADE PATTERNS AND ON RELATIVE WAGES?
OECD TRADE POLICY WORKING PAPER NO. 109 © OECD 2011
Executive Summary
The results of this study show that overall trade patterns reflect the relative factor
endowments of the countries under investigation. That is, OECD countries have larger
stocks of capital and skilled labour and show relatively intensive use of these factors in
their traded goods and services. Selected Emerging Markets (SEMs) have large stocks of
unskilled labour and show strong trade surpluses in goods and services using this resource
intensively. In this sense, we show that factor content of trade, as measured via factor
services, provides useful insights into trade patterns, as predicted by neoclassical trade
theory.
However, some large economies, such as the United States and Japan, exhibit
counter-intuitive results as illustrated by large factor content of trade surpluses in
unskilled labour for Japan and deficits in the capital-content of trade for the United States.
Accounting for intermediate trade in our analysis reverses some of these seemingly
counter-intuitive results, and in general has a large impact on measured factor content.
We argue that this is a reflection of the changing nature of trade, driven by the forces of
production fragmentation and offshoring. We contend that these trends reflect a shift
away from thinking of trade in terms of domestically-based factor (i.e. labour or capital)
content, to thinking of trade in terms of internationally mobile tasks required to produce
output. The evidence presented here implies that factor content patterns are undergoing
fundamental changes calling for more careful analysis of the broad measures used in
trade. Trade patterns are now just as reliant on the cost of moving goods and tasks, as
they are on the particular endowment structure of an economy.
Finally we find little evidence that the changes in trade patterns have had a significant
impact on relative wages, or wage inequality, in the time period examined. We speculate
that domestic considerations, and the growing influence of tasks as opposed to
endowments, play a larger role in determining these outcomes. This is an important
finding that argues against the imposition of trade barriers in an attempt to influence
either wages or levels of employment, and in favour of pursuing targeted labour market
policies that would accommodate, rather than hinder, the process of adjustments,
including in the aftermath of trade reforms.
Another implication of this work for policy makers is the need to be aware that the
methods used to derive the value for trade balances matter. Those values based on
traditional approaches are more of a reflection of historical investments and could lead to
‗lagging‘ policy advice, based on past behaviour, rather than the forward looking advice
needed to steer an economy into the future.
Acknowledging the role of intermediate goods in understanding a country‘s trade
position is only the first step. What remains a challenge for policy makers is the need to
reconcile the seemingly opposing trends of the domestic (i.e. geographic specific)
determination of employment and wages with the international (i.e. non-geographic
specific) determination of the movement of goods and services and location of tasks.
Thus policy makers should appreciate the limits of using trade policy to influence
THE ROLE OF FACTOR CONTENT IN TRADE: HAVE CHANGES IN FACTOR ENDOWMENTS BEEN REFLECTED IN TRADE PATTERNS AND ON RELATIVE WAGES?– 5
OECD TRADE POLICY WORKING PAPER NO. 109 © OECD 2011
domestic issues. Rather they should implement proactive measures– such as greater
investment in resource markets through training and education and ensuring well
functioning capital markets – that create an environment conducive to taking full
advantage of these trends.
I. Introduction
The global economy is entering a new era characterised by a rise in new trade power-
houses (such as China) and intensifying competition for new consumer and product
markets (such as Asia and renewable energy, respectively). Indeed, there are a growing
number of economists who argue that the nature of international trade is changing in
fundamental ways (Baldwin and Robert-Nicoud 2010). Thus, it is argued that in an
integrated global market, trade is increasingly about intermediates goods and services.
Simultaneously, concern remains over the impacts of globalisation including excessive
market volatility, increased vulnerability to crises, and the perceived ability of low-wage
producers to disrupt domestic labour markets. Calls to ―manage‖ globalisation remain and
are unlikely to subside in the context of the current economic uncertainty and stalled
DDA talks.
Understanding the fundamental forces behind observed trading patterns has generally
been undertaken through what international economic theory would describe as a
realisation of comparative advantage; a country exports those goods in which it has a
relative cost advantage vis a vis its trading partners. This concept has powerful policy
implications in that from it stems the basic reasoning that free trade policies are superior
to interventionist trade practices.1 However, comparative advantage evolves for a host of
reasons, including endowment structure, technology and the institutional landscape of
both domestic and international commerce. That is, comparative advantage can be
influenced by domestic policies in the trading countries themselves as well as those in
their trading partners. It is not a static concept; it influences, and is influenced by, policy
as well as stages of economic development and evolution (Balassa 1979). This interaction
provides an interesting and complex context for an empirical study on patterns of
specialisation and comparative advantage and underlying policy implications for OECD
and non-OECD countries alike.
As per the original scoping paper, The Effects of Globalisation: Openness and
Changing Patterns of Comparative Advantage (OECD internal document), the project is
structured to deliver four consecutive reports, which will constitute its principal direct
outputs:
Production, Consumption and Trade Developments.
Comparative Advantage and Export Specialisation Mobility in OECD and Selected
Emerging Market Economies.
Have Changes in Factor Endowments been reflected in Trade Patterns and What Effect
has this had on Relative Wages?
Comparative Advantage and Trade Performance: Policy Implications.
1. The gains from an open trading regime have been well documented in the literature. Trade
liberalisation and productivity links have been confirmed in a wide range of empirical studies and
reviews include Bernard et al. (2007) and Nordas et al. (2006).
6 – THE ROLE OF FACTOR CONTENT IN TRADE: HAVE CHANGES IN FACTOR ENDOWMENTS BEEN REFLECTED IN TRADE PATTERNS AND ON RELATIVE WAGES?
OECD TRADE POLICY WORKING PAPER NO. 109 © OECD 2011
This paper presents the analysis completed under the third instalment of the project
examining comparative advantage from the perspective of factor services embodied in
traded outputs. It takes a closer look at the underlying forces in factor markets and how
they potentially drive Comparative Advantage.
The paper begins with a discussion of the factor content theory of comparative
advantage and briefly reviews the empirical literature examining factor content of trade
within this framework. It then moves to a review of the trends in resource accumulation
and utilisation among OECD and selected non–OECD economies, focusing on capital
and labour. The fourth section examines relative resource use and, relationship to
endowments and trade. We then apply these insights to the matter of relative wages with
an analysis of how the identified trends in productivity, resource endowments and trade
have played a role in changes in relative wages. The final section offers some conclusions
and areas of policy relevance.
II. The Heckscher-Ohlin theory of international trade
The Heckscher-Ohlin theory of international trade states that comparative advantage
is derived from differences in relative factor endowments across countries and relative
intensities with which factors are used across sectors.2 A country will have an advantage,
vis a vis other countries, in producing goods in those sectors which use factors it holds in
relative abundance. Vanek (1968) formalised the link between factors used in the
production of a country‘s goods and services and its trade by comparing the relationship
between those factors embodied in a country‘s production versus those embodied in its
consumption. This has become known as Heckscher-Ohlin-Vanek (HOV) model of
international trade.
The HOV model has been subject to extensive empirical scrutiny with an uneven
record of success. The problem is that the lack of a clearly differentiated framework
relating endowments and trade makes it impossible to test HOV against a well-specified
alternative. Thus, researchers have been focusing on what version of a constantly
evolving HOV model best fits the data. Starting with Leontief (1953) through Trefler
(1995), HOV failed most major empirical challenges.3 Trefler (1995) found that the
measured net factor content of trade using a HOV framework is essentially zero, calling
this the ―case of the missing trade‖. He then develops a specification that allows for home
bias in consumption and international technology differences and the model successfully
fits the data. However Gabaix (1997) showed that this improved model is based on a set
of carefully chosen specifications and when the estimated parameters are tested to see if
they successfully reconcile the predicted with the measured factor content of trade, no
real improvement is observed.
Work following Trefler began to focus on why HOV models performed so badly.
Measurement error tended to be the most common explanation – factors are not well
defined or are not captured well enough in the value of trade (Fisher and Marshall 2008);
significant aggregation bias existed in measures of trade used (Feenstra and Hanson
2000); incorrect assumptions were being made regarding returns to scale (Antweiler and
2. The model was originally formulated by Heckscher (1919) and further developed by Ohlin (1933)
and formalised by Samuelson through a series of papers between 1948 and 1953. The model is
often also referred to as the Heckscher-Ohlin-Samuelson model.
3. For an extensive review of empirical studies during this period see Leamer and Levinsohn (1995).

THE ROLE OF FACTOR CONTENT IN TRADE: HAVE CHANGES IN FACTOR ENDOWMENTS BEEN REFLECTED IN TRADE PATTERNS AND ON RELATIVE WAGES?– 7
OECD TRADE POLICY WORKING PAPER NO. 109 © OECD 2011
Trefler 2002) and difference in technology (early examples include Trefler and Zhu 2000,
Hakura 2001 and Davis and Weinstein 2001). Romalis (2004) showed that transport costs
and monopolistic competition are important determinants of the structure of trade and
need to be incorporated into the HOV framework. In the end, what this body of work
showed was that by improving specifications and including more realistic elements of
trade, the HOV framework performs well.
One of the most active areas of investigation has been testing the HOV assumptions
regarding technology. A country‘s technology matrix is a measure of the units of inputs –
both primary inputs such as labour and capital and intermediate inputs that are produced
outputs of an industry – that are required to produce each unit of output, thus is an
indication of the technology, or production method, used within each sector in an
economy. Many early empirical studies had relied on one technology matrix (usually the
United States) measuring primary inputs only. Later studies made adjustments for
potential differences in the United States and ―other‖ potential technology matrices but
these were based on estimated deviations from a US base. A study by Hakura (2001) is an
example of an early attempt to use directly observed technology matrices. By utilising
four OECD country matrices, this paper found significant improvement in the model‘s
performance. However, this does not provide a ―test‖ of any hypothesis of underlying
production (matrices fit the model as a matter of construction), and raised the question as
to how differences in these technology matrices occurred and if they systematically
related to fundamental characteristics (i.e. endowment structures) of countries in the
trading system (Davis and Weinstein 2001).
With the publication of the OECD‘s Input-Output tables, the academic community
―… dramatically improved our ability to test trade theory‖ (Davis and Weinstein 2001).
Using these tables Davis and Weinstein found that allowing for Hicks-neutral
productivity differences, industry input usage strongly correlated with country factor
abundance, which had not held in conventional HOV model tests to date.4 However, once
again, this modification was relative to a base technology matrix.
Davis and Weinstein (2003) observe that the study of factor content has ―become a
laboratory to test‖ ideas about how the elements of endowments, production,
consumption and trade fit together in a general equilibrium framework. They suggest that
while great progress has been made, a deeper consideration of intermediates inputs,
demand side issues (i.e. the differences in patterns of total domestic consumption of final
goods and services by a country, otherwise known as ―absorption‖), and the role of
aggregation biases is needed. This last point is echoed in Feenstra and Hanson (2000)
who found significant evidence that the factor content of exports differs systemically
from domestic production and that as disaggregation increases, the factor content of skill
intensity in US trade rises. Reimer (2006) and Trefler and Zhu (2010) are two attempts to
directly include traded intermediate inputs into the picture.
In the end, the HOV framework properly measured, has been shown to successfully
explain trade patterns through differences in factor scarcities, or on the flip side, factor
abundance, between economies. Thus, for our purposes, it remains a useful framework
for measurement and analysis. It is not the goal of this paper to reconcile theoretical
predictions from the model – there exists a wide body of literature having already done
this. Rather, we use this framework to examine measures of factor content across a
4 A Hicks neutral technology change refers to a change that affects both capital and labour in the same
way.
8 – THE ROLE OF FACTOR CONTENT IN TRADE: HAVE CHANGES IN FACTOR ENDOWMENTS BEEN REFLECTED IN TRADE PATTERNS AND ON RELATIVE WAGES?
OECD TRADE POLICY WORKING PAPER NO. 109 © OECD 2011
variety of OECD and non-OECD economies, carefully incorporating improvements in the
specifications of the model identified in the literature.
Before we undertake an analysis of factor content of trade, however, we review the
trends in country‘s underlying endowment structure.
III. Trends in factor endowments
This section examines trends in accumulation of capital and labour and compares
changes in stocks with changes in the utilisation of these factors in goods and services
over time across OECD and Accession countries5 (here after referred to as OECD), as
well as several Selected Emerging Markets (SEMs).6
Relative factor endowments
There is wide variation both within and between the OECD and SEM groupings in
their relative endowments of capital and labour, as can be seen through measures of
variation. For OECD countries, the coefficient of variation for capital is 25.5% while it is
only 4.5% for labour, indicating a great disparity in capital stocks than labour stocks in
the region. SEMs show greater dissimilarity for both measures – 43.1% for capital and
15.5% for labour – but the same higher values for capital than labour.
The OECD area is capital abundant, accounting for 80% of the capital available
among these countries in 2005.7 The largest capital stocks are found in the United States
and Japan, followed by Germany, France, the United Kingdom, Korea and Italy
(Figure A1). Capital stocks grew at an average per annum rate of 4.5% in the OECD as a
whole during the 1990-2005 period (Table A1), with the highest per annum growth rates
in Chile (10.4%) and Korea (7.7%). By comparison, in the SEM area capital is relatively
scarce. These countries held roughly 20% of total capital measured in 2005 with the
largest capital stocks held by China, India, and Brazil (Figure A1). China shows an
especially rapid accumulation in capital stocks in the period 1995-2005 with a per annum
rate of 11.5%, followed by India with a rate of 9.2%. Stocks of capital in the SEM area
overall grew at a rate of 8.3% per annum, outpacing growth in the OECD.
Conversely, labour is relatively abundant in the SEM area, which accounts for
roughly 70% of labour in the total sample. Within the OECD area, the largest stocks of
labour are found in the United States and Japan (Figure A2). The largest stocks in the
SEMs are in China, India and Indonesia (Figure A2). As with capital, labour stock grew
at disparate rates across these two groupings during the 1990-2005 period. In the OECD
5. The Accession grouping originally pertained to Chile, Estonia, Israel, Russia and Slovenia. Chile
formally became a member of the OECD on 7 May 2010 and Estonia, Israel and Slovenia were
invited to join 10 May 2010.
6. SEMs include the five enhanced engagement economies (Brazil, China, India, Indonesia, and
South Africa) as well as Argentina, Malaysia, Thailand, Bangladesh, Hong Kong, Singapore, and
Egypt where data is available.
7 This is a share of the total capital stocks for the 38 countries for which data is available. Data was
not available for Poland, Turkey, the Slovak Republic, and the Czech Republic. The net capital
stocks are calculated from real GFCF series from the World Bank WDI. See data annex for
calculation details.
THE ROLE OF FACTOR CONTENT IN TRADE: HAVE CHANGES IN FACTOR ENDOWMENTS BEEN REFLECTED IN TRADE PATTERNS AND ON RELATIVE WAGES?– 9
OECD TRADE POLICY WORKING PAPER NO. 109 © OECD 2011
area the labour pool grew at a rate of 0.60% per annum while the SEMs increased at the
considerably faster annual rate of 2.1% (Table A1).
Decomposing by skill level reveals further differences in labour force characteristics
between the OECD area and SEMs (Figures A 3 and 4).8 Overall, the 2005 total labour
force breaks down into a 10% share of skilled workers9, and 90% share of unskilled
workers. The OECD countries accounted for 56% of total skilled labour force, while the
SEMs held the remaining 44%. Stocks of skilled labour increased in the OECD area at a
per annum rate of 3.3% between 1990-2005; more slowly than the SEMS rate of 4.8%
per year in the same period. India and China held the bulk of the skilled labour stocks
among the SEMs.
The OECD‘s share of unskilled labour was 25%, while the SEMs accounted for the
remaining 75%. Unskilled labour stocks grew at a rate of 0.53% per annum in the OECD
area, only a third as fast as the rate of 1.7% per annum in SEMs during the 1990-2005
period. The US holds the largest stocks among the OECD countries while China and
India dominate the SEMs (Figure A4). Thus while OECD countries continue to hold
larger stocks of capital and skilled labour endowments, SEMs accumulation rates are
much higher for both, indicating that relative abundance may be changing over time. This
is especially true in capital and skilled labour and dominated by China and India.
As discussed in Section II, to understand how endowments play a role in a country‘s
trade composition, it is important to understand the way these factors are used. Thus, we
look at changes in the amount of capital per worker across these economies. The ratio of
capital stock per worker (k/l) provides a direct comparison of factor abundance.10
Figure
A5 shows the k/l ratios for two selected groupings of OECD countries.11
In line with
observed changes in stocks of capital, k/l increased in all OECD countries, except Mexico
between 1990 and 2005. The highest values of k/l ratios corresponded to the countries
with the largest capital stocks; the United States and Japan (with Japan dominating) and
the largest increases in the k/l ratio in occurred in Chile and Korea (Figure A5).
By comparison (Figure A5), the capital per worker ratios in SEMs are small,
reflecting the smaller capital base relative to labour abundance in this grouping. Only
Argentina and Malaysia fall within a k/l range comparable to some OECD countries. The
k/l ratios in SEMs have remained relatively stable during the 1980-2005 period in China,
Indonesia, and India, while decreasing over time in Brazil. The largest increases in value
of k/l ratio occurred in Argentina, Malaysia and Thailand.
8. The data for workforce by education level and gender comes from the IIASA and Vienna Institute
for Demography data sets for 1970-1995 and 2000-2050, further details on about these datasets can
be found in the data annex.
9. Skilled workers are those who have completed tertiary education.
10. Labour ratios are taken from the same source as labour stocks reported above. That is, the working
age population (15+) from the IIASA/VID Human Capital and Economic Growth Program. This
measure includes all available human capital, and does not distinguish economically active
population from those who do not participate. The same ratios were constructed using figures for
economically active labour force from the World Bank World Development Indicators, and the
resulting ratios demonstrated similar trends.
11. For ease of discussion, we show only selected OECD countries. For a complete table of ratios can be
found in the data annex.
10 – THE ROLE OF FACTOR CONTENT IN TRADE: HAVE CHANGES IN FACTOR ENDOWMENTS BEEN REFLECTED IN TRADE PATTERNS AND ON RELATIVE WAGES?
OECD TRADE POLICY WORKING PAPER NO. 109 © OECD 2011
According to the HOV framework, these relative endowments are a major
determinant of economic activity in which countries will have a comparative advantage.
While the above analysis provides an indication of stocks of endowments available within
a country, it does not tell us how, or how much, of these stocks are actually utilised in
production. While standard HOV assumes full employment, (i.e. all stocks are fully
employed), we know this does not hold true, especially in specific periods of time. Thus,
to get an idea of how much capital and labour are used in the production process, we
examine their share in value added. To focus on the amount of capital being put in place,
we look at investment in gross fixed capital formation (GFCF) as a share of value added
and examine the role of labour in production by looking at the ratio of total wage bill to
value added.12
13
The GFCF and total wage bill to value added ratios for all OECD countries and
SEMs14
are shown in Figures A A6 and A7, respectively. These figures present the
average and standard deviation of the two measures for all countries for the 1988-2005
period as well as several sub-periods.15
The figures depict opposing trends in the shares of
capital and labour to value added in total manufacturing with the mean share of capital to
value added increasing while the labour share declines slightly across periods. This
outcome implies that the capital intensity of manufacturing production increased across
the dataset. The overall increase in the divergence of the GFCF to value added ratio, as
measured by its standard deviation, comes mainly from the large increase in the post-
1997 time period. Prior to that, the deviations among countries appear to have been
declining. While a part of this finding can be attributed to an increase in country coverage
in the later period, the basic observation of an increase in the divergence of capital
utilisation across the economies examined holds. The increasing mean of capital as a
share of value added is in line with the growth of capital stocks observed across both
regions during this period.
Conversely, the mean wage bill to value added ratio decreased over the period. This
result is partially explained by the larger growth in value added in manufacturing relative
to the total wage bill but also is in line with trends in production fragmentation utilizing
an increasingly diverse pool of cheaper labour in Eastern European OECD and Emerging
Markets, as well as the decline in manufacturing employment overall in OECD area (Pilat
et. al, 2006). The next section examines factor intensity of utilisation in manufacturing
across the two country groupings.
12. An alternative measure of capital used in the production process is to take the residual of the wage
bill/value added ratio, or 1-(wage bill/VA). However, as the mirror reflection of the wage bill share,
it provides little additional information about changing investment in fixed capital. Thus GFCF was
chosen as a better available capital proxy in measuring the factor‘s intensity in production. However,
we use GFCF/VA as a broad indication of the capital usage across all manufacturing activity within
an economy and thus it will not capture the expansion or contraction of capital in any particular
industry.
13. We also calculated these ratios using units instead of values, applying price indices for capital,
labour and output. This yielded no qualitative difference in the results.
14. The countries in this grouping include Argentina, Bangladesh, Brazil, China, Egypt, India,
Indonesia, Singapore, South Africa, Thailand and Vietnam.
15. Periods were chosen to reflect economic breaks, i.e. the recession in 1991and the Asian Financial
Crisis in 1997.
THE ROLE OF FACTOR CONTENT IN TRADE: HAVE CHANGES IN FACTOR ENDOWMENTS BEEN REFLECTED IN TRADE PATTERNS AND ON RELATIVE WAGES?– 11
OECD TRADE POLICY WORKING PAPER NO. 109 © OECD 2011
Trends in factor utilisation in OECD countries
Within the OECD grouping, the average share of capital in value-added (VA) during
the 1988-2005 period was 14.5%, and on average has been declining at an annual rate of -
0.97% (Figure A6).16
Driving this average decline is the fact that growth in GFCF is
outpacing value added growth in several OECD countries, for example in Mexico,
Iceland, Australia, Poland, New Zealand, the Slovak Republic and Hungary. The largest
decreases in the overall ratio are observed in Korea and Finland, but decreases were also
evident in other member countries including the Netherlands, France, Austria, Belgium,
Sweden, Canada, and Ireland. The faster growth in GFCF is not surprising given the
changes in economic structure that occurred in Eastern Europe during this period (i.e. the
transition to a market based economy in Poland), and the large investment program that
occurred in Iceland.17
Several trends explain the extent to which the overall decrease in capital intensity in
manufacturing in OECD countries appears to be inconsistent with the observed increases
in capital stocks per worker in these countries. First, the capital intensity numbers apply
only to the manufacturing sector, where the k/l ratios are reported across all economic
activity. We know that services are an increasingly important part of overall economic
activity, including trade, in many OECD economies.18
To the extent that this sector has an
increasing k/l ratio, one would expect this to influence the overall k/l ratios reported for
these economies. Second, to the extent economies with large k/l ratios dominate reported
value added totals in the OECD groupings, they will again, unduly influence observed
outcomes (e.g. the contribution of the United States versus that of Hungary). Finally, the
deviation in the trends of stock accumulation and utilisation may be due to the relative
maturity of, and decreasing investment in, certain segments of manufacturing as
identified in Interim Report 1.19
Figure A7 shows the trends in total wage bill in manufacturing as a share of value
added across the economies under examination during this period. The average of the
wage bill to value added ratio was 43%, although values for OECD countries in 2005
ranged from a low of 12% in Chile to a high of 65% in Denmark. Growth rate
calculations show a decline in the ratio at an average annual rate of -0.34%, with the
largest decreases in Japan, Korea, and Canada. This is primarily a reflection of the faster
growth rates in value added compared with wages across most OECD economies (with
the notable exception of Poland). The relatively small share of wage bill to value added in
Japan may be a reflection of its relatively (as shown above) high share of unskilled
workers (Figure A4).20
The decrease in the wage bill to value added is consistent with
employment decreases in this sector as labour moved away from manufacturing toward
services and other sectors in the economy (Pilat et al. 2006). The exceptions to this trend
are Luxembourg, New Zealand, Portugal, Sweden, France, Spain and the Russian
Federation.
16. Countries are ranked by 2005 capital to value added ratio. Data are missing for Switzerland and
Slovenia.
17. For further details regarding investment activity in Iceland, see the OECD (2009) Iceland Country
Study.
18. Interim Report on Production, Consumption, and Trade Developments (OECD internal document).
19. Interim Report on Production, Consumption, and Trade Developments (OECD internal document).
20. The role of unskilled workers in Japan is discussed in more detail in the next section.
12 – THE ROLE OF FACTOR CONTENT IN TRADE: HAVE CHANGES IN FACTOR ENDOWMENTS BEEN REFLECTED IN TRADE PATTERNS AND ON RELATIVE WAGES?
OECD TRADE POLICY WORKING PAPER NO. 109 © OECD 2011
Capital and labour utilisation in selected emerging markets
GFCF to value added ratios for total manufacturing in SEMs are presented in
Figure A6. Increased investment activity and expansion of the manufacturing sector in
many of these countries is demonstrated by the three times larger average share of GFCF
to value added relative to the OECD country grouping. The average ratio is 49.3% with
an annual growth rate across these economies in excess of 11%. This growth trend
however, was not consistent throughout the SEMs. There appears to be a decline during
this period in India, Malaysia and Thailand. At the other extreme, China, Indonesia, and
Egypt experienced rapid growth in investment activity leading to GFCF to VA ratios over
100%.
Wage bill to value added ratios (Figure A7) varied considerably across the SEM
grouping with Bangladesh and South Africa at the high end of the spectrum and China at
the low end. The larger ratios in the case of Bangladesh and South Africa were primarily
due to lower value added figures for manufacturing rather than to particularly high wage
bills. Wages to value added over the 1990-2005 time period averaged 24% and decreased
on average at a rate of -1.5% per annum. Significant differences are observed across
countries with decreases in India, South Africa, Egypt, and Singapore while Argentina,
Thailand, Malaysia and Bangladesh experienced an increase. The relative volatility of
values in this area indicates that changes in factor utilisations were occurring rapidly. The
decreasing share of Wage Bill in value added is, in part, a reflection of the increasing
capital intensity of manufacturing production in SEMs during this period. This is despite
the large increase in the stock of labour in the region. As value added increases across
most of these country‘s manufacturing sector and increasing labour stocks put downward
pressure on wages, we would expect to see a further decline in the overall ratio.
This section has shown that while the OECD countries have larger stocks of capital
and skilled labour, SEMs are accumulating these factors at a faster rate. We also see that
as a whole, capital per worker is increasing in the OECD while it remains flat across
many SEMs. This apparently inconsistent outcome could be due to the changing nature of
the output in the two regional groupings and the rapid accumulation of both resources in
the SEMs. As many OECD economies increase their output in services, they are adding
increasing amounts of investment to this sector thus influencing the overall capital to
labour ratios reported and potentially offsetting declining shares of capital formation in
value added in manufacturing. Also potentially influencing these results is the relative
change in demand for labour. For instance, in the OECD context, sectors that employ
(unskilled) workers and are capital-intensive (such as construction and light
manufacturing) are growing more slowly – or even contracting – shedding labour at a
faster rate than capital, thus raising the k/l ratio. Other sectors, such as services, which are
increasing their demand for (skilled) labour, are also adding invested capital, thus
influencing the overall increase in capital intensity observed here. We do observe,
however, that these patterns are not uniform across all OECD economies with more
newly industrialised members (such as Poland and Hungary) showing increasing shares
of capital in manufacturing value added.
Across the SEMs we observe increasing stocks of both capital and labour and this is
reflected in the relatively flat k/l ratios over the period. The shares of capital and labour in
value added varies across country and time, reflecting the relative changes in value added,
wages and returns to capital, thus complicating any straightforward conclusions to be
drawn from the underlying changes observed in capital and labour stocks. Next we
THE ROLE OF FACTOR CONTENT IN TRADE: HAVE CHANGES IN FACTOR ENDOWMENTS BEEN REFLECTED IN TRADE PATTERNS AND ON RELATIVE WAGES?– 13
OECD TRADE POLICY WORKING PAPER NO. 109 © OECD 2011
explore relative productivity of labour in order gain further insights into what these
changes in factor availability and utilisation imply for economic performance.
Productivity
In order to provide a broad consistent measure of labour productivity across the
economy as a whole, we look at output per worker, (using GDP as a proxy for output).21
Productivity within and between the OECD and SEM country groupings vary widely (see
Figure A8). Among OECD countries, the highest ratios of output per worker are found in
Luxembourg, Norway, Japan and the United States. At the lower end of the spectrum, we
find newer Eastern European member states, Turkey and Chile. During the 1990-2005
period, output per worker across the OECD increased at an average per annum rate of
1.5% (Figure A8).
In SEMs, labour productivity remains significantly lower on average, with the
exceptions of Hong Kong and Singapore (Figure A8). Despite this considerably lower
base, productivity growth rates indicate that this is changing rapidly, at an average per
annum rate of 4.2%, nearly three times faster than the OECD area. The growth was not,
however, consistent throughout the grouping. Output per worker declined in Brazil and
South Africa during this period.
This comparison underscores the importance of taking into account how factors are
utilized and differences in technology of production in order to better understand how
factor abundance influences a country‘s comparative advantage. For example, it has been
shown that labour productivity increases with capital investment.22
Thus, the fast growth
rates of labour productivity in SEMs may be a product of the rapid increase in capital
formation in these economies observed here. To see how these various, often competing
forces, have played out in trade patterns, we now turn to examining the measured factor
content of trade.
IV. Measuring factor content
Total endowment stocks have been growing across both OECD and SEMs, with
SEMs experiencing faster growth across the board. Within the OECD, skilled labour
stocks grew 6.5 times faster than unskilled while the SEMs skilled labour growth rate
exceeded its unskilled rate at a slower rate (2.7 times). We also observe diminishing wage
bill to value added ratio, on average, across the OECD in manufacturing and a rise in
SEMs. However, as stated, this trend more likely reflects a decline in the value added in
manufacturing among OECD countries as a whole rather than an absolute decline in
labour usage. Indeed, labour productivity continues to grow at a robust rate among OECD
countries, especially in Korea, Estonia and Poland. There was also strong productivity
growth in China and Vietnam among the SEMs. We now look to see how these trends are
reflected in trade patterns.
21. Real GDP measures and total labour force were taken from the World Bank World Development
Indicators (2010).
22. There is a vast literature on the relationship between capital and labour productivity. See, for
instance, Romer (1990).
14 – THE ROLE OF FACTOR CONTENT IN TRADE: HAVE CHANGES IN FACTOR ENDOWMENTS BEEN REFLECTED IN TRADE PATTERNS AND ON RELATIVE WAGES?
OECD TRADE POLICY WORKING PAPER NO. 109 © OECD 2011
We begin our construction of the factor content of trade with the simple HOV model:
wiiii VsVATF (1)
The first expression on the right hand side represents the standard HO specification:
the factor content of i‘s trade (Fi) is a function of the inputs used (A) times the country‘s
net exports Ti. The final expression comes from Vanek (1968), who showed that the
measure of factor content should equal an economy‘s measure of factor abundance. In
this expression, V
i is a measure of factor endowments in country i, V
w is the measure of
world endowments and si is the share of country i in world consumption. So, for example,
if a country is relatively abundant in labour, the factor content of trade would be positive
as the excess of what is produced with the country‘s labour supply, over what is
consumed of labour-intensive goods, is exported. Conversely, if a country is relatively
scarce in labour, the value would be negative, as it consumes a greater share of the
world‘s labour endowment.
As pointed out in Trefler and Zhu (2010), the past decade has witnessed an
―explosion‖ of research into the impact of international technology differences on
measuring the factor content of trade. However, they argue that this literature has failed to
properly account for differences in international technology and address the pivotal issue
of traded intermediate inputs. They put forth a theoretical model which does both,
providing a complete characterisation of the class of models that are implied by the
Vanek prediction of factor content of trade. This section relies upon this model to
construct a measure of factor content that is theoretically consistent and accounts for both
technological differences across country‘s production processes while explicitly including
trade in intermediate goods.
The work presented here makes two major advancements over these existing
measures of factor content. First, as in Trefler and Zhu (2010), we rely on individual
countries‘ technology matrices rather than the existing approach of using a single matrix
adjusted for production technology differentials. We then apply a definition of factor
content that measures the amount of factors used worldwide to produce a country‘s trade
flows, and we apply this across a set of five factors of production, including a breakout of
skilled and unskilled labour. Thus we construct a more complete factor requirements
matrix for a country‘s trade by allowing for differentiated production processes including
those inputs used in producing intermediate inputs overseas (Deardorff, 1982). Finally,
we apply this approach to different time periods to observe how the factor content of
trade has changed. By comparing the equations derived without directly accounting for
intermediate inputs with those that do, we can analyse the role of intermediate inputs in
trade and the determination of a country‘s comparative advantage.23
Data
To implement this approach, it is important we have access to input-output data for as
complete and consistent a set of countries as possible. While the OECD input-output
tables are a consistent and up-to-date set of information, they cover only a few countries
outside the OECD and are limited in their factor input coverage. The GTAP database also
provides a consistent measure of trade flows and input data but covers a larger number of
23. See the Technical Appendix for a more detailed explanation of our approach to measuring factor
content.
THE ROLE OF FACTOR CONTENT IN TRADE: HAVE CHANGES IN FACTOR ENDOWMENTS BEEN REFLECTED IN TRADE PATTERNS AND ON RELATIVE WAGES?– 15
OECD TRADE POLICY WORKING PAPER NO. 109 © OECD 2011
countries globally, as well as a breakdown of skilled and unskilled labour.24
We use three
versions of the database, namely GTAP versions 5, 6 and 7 which correspond to base
years of 1997, 2001 and 2004, respectively. The input-output tables contain five primary
factors of production: land, unskilled labour, skilled labour, capital and natural resources.
Land is defined in GTAP as an agriculture-specific resource and is used only in
production in these sectors. Natural resources are associated with extraction industries
and are a factor input for the sectors fishery, forestry, coal, oil, gas and other mining.
Labour is divided into skilled and unskilled based on the International Labour
Organisations (ILO) classification.25
How has factor usage within a country changed over time?
As discussed in Section III, capital utilisation has increased and overall labour
productivity rates rose over the 1990 – 2005 time period, especially in the emerging
OECD and SEM economies. In this section, we apply the factor content of trade
definition to explore the relative uses of these factor endowments and how they have
changed over time.
To examine a country‘s relative factor abundance, that is each endowment relative to
other endowments within a country, at a point in time, we normalise each factor by its
content in consumption and compare across the various factors (Muriel and Terra, 2009).
For example, the content of skilled labour in net exports is higher (lower) than the factor
content of capital if skilled labour is relatively more abundant (less abundant), when the
factor contents are normalised by domestic consumption. We can also restate these
values, measuring factor abundance by income rather than consumption, adjusting the
value to take account of the trade balance as in Bowen and Sveikaukas (1992). Both
measures provide a relative value for factor abundance with respect to other factors
within a single country.26
We calculate these relative values for each country in the sample for the three time
periods: namely 1997, 2001 and 2004 and rank the factors to determine the relative
abundance as revealed by the country‘s trade position, and examine how this has changed
over time. The relative factor abundance values and their rankings are presented for
OECD and SEM countries in Tables A2 and A3, respectively.27
The two tables present three pieces of information: (1) the calculated factor
abundance measure for each of the five resources, relative to the other resources within
each country; (2) the rankings for each of these factors of production relative to the other
factors for each of the three years; and (3) the standard deviation of the factor abundance
measures for each year. As shown in the table, in all three years, the relative rankings for
most OECD economies have remained consistent which means there have been no
significant changes in relative factor endowments within each of these economies in the
24. For complete documentation of the GTAP database see website
www.gtap.agecon.purdue.edu/databases/default.asp. Summary details of the data used in our
analysis, including on individual input-output tables, can be found in the Data Annex.
25. Completed documentation of the methods used to split total labour payments into skilled and
unskilled can be found in Liu, et al. (1998a, b).
26. See Technical Annex for details on calculating relative factor usage measures.
27. We report rankings using adjusted income shares. The rankings using consumption shares were
qualitatively similar and are available upon request.
16 – THE ROLE OF FACTOR CONTENT IN TRADE: HAVE CHANGES IN FACTOR ENDOWMENTS BEEN REFLECTED IN TRADE PATTERNS AND ON RELATIVE WAGES?
OECD TRADE POLICY WORKING PAPER NO. 109 © OECD 2011
time period examined. Most OECD economies consistently rank skilled labour and
capital at the top of their relative resource endowments as measured by the factor services
employed. The rankings for Mexico, Chile, Hungary, Poland and Turkey show a greater
reliance on land and natural resources. Australia also shows a high reliance on natural
resources, but unlike the other countries listed, capital and skilled labour are also
significant factors. Within their own resource structure, capital ranks first in Austria,
France, Germany, Italy and New Zealand for each of the three years examined. Denmark,
Sweden, Switzerland, the United Kingdom and the United States all consistently rank
skilled labour as number one, relative to their other resource use. These countries show a
high use of labour in general, with unskilled labour ranking second.
Despite the relative stability in rankings of endowments in OECD countries, there
have been some noteworthy developments among member states. Into the 2000s, both
skilled and unskilled labour moved up in ranking over capital for Australia. New Zealand
experienced a small change in its endowment rankings with the role of natural resources
declining and unskilled labour increasing. Korea shows an increase in the prominence of
capital in place of unskilled labour while Japan‘s unskilled labour and capital both
increase their rank relative to the use of their other resources, namely skilled labour. The
increasingly significant ranking of unskilled labour in Japan (as foreshadowed by their
large stock of unskilled endowment) is reflected in employment growth patterns. Between
1990 and 2009, the only employment sectors which enjoyed consistent positive growth in
Japan were labourers, service workers and professional and technical workers (Statistical
Bureau Office of Japan 2010). The first two categories, which experienced the fastest
growth, are dominated by unskilled workers. Spain, Poland and Hungary all saw their top
ranked resource move from land in 1997 to capital by 2004.
Land and natural resources hold the dominant positions in the SEMs for each of the
three time periods (Table A3). As with the OECD, the rankings show little movement
over this time. Exceptions are Brazil and South Africa who both experienced a shift away
from land and resource extraction to a greater reliance on capital and labour. In both these
economies, capital was ranked the highest in 2004. All countries examined show
relatively low rankings in the use of skilled labour.
A notable difference between the two country groupings is in the standard deviation
of the abundance measure. This measure provides some insights in the changing
endowment structure and the relative intensities with which resources are used within
each economy examined. The more dominant one or two resources are in terms of their
relative intensity, the greater the spread in values among the resources and the greater the
standard deviation. Thus, it is interesting to see if these values have changed over the
three time periods examined.
We see countries like France, the United Kingdom and Germany with small and fairly
constant measures of standard deviation, implying the relative intensity of factor usage
has changed little over the three time periods. Greece and Russia exhibit large standard
deviations implying dominance in a specific resource – in Russia‘s case natural resources.
Greece‘s standard deviation declined significantly in 2004 as capital and labour began to
play a greater role in its economic activities diversifying away from natural resources.
Interestingly enough, the United States shows a slightly increasing standard deviation
among its factor measures while its actual rankings remain stable. This is due to an
increasing use of labour relative to that of capital. Mexico and Chile, on the other hand,
experienced a decline in their standard deviation. For Mexico, there was a relatively small
change in the use of labour and capital across its economic activities while for Chile the
THE ROLE OF FACTOR CONTENT IN TRADE: HAVE CHANGES IN FACTOR ENDOWMENTS BEEN REFLECTED IN TRADE PATTERNS AND ON RELATIVE WAGES?– 17
OECD TRADE POLICY WORKING PAPER NO. 109 © OECD 2011
use of labour increased relative to that of capital. What is interesting for Chile is that
while the relative rankings of the two labour and capital measures do not change, the
relative abundance measure shows a convergence in the intensity of usage.
Among most of the SEMs, there is much greater variation within each country‘s
resource ranking as shown by the standard deviations. The exceptions are Brazil, which
has the lowest standard deviation of all economies reported here, and South Africa whose
measure substantially declined in 2004. This implies that Brazil has employed the five
resources measured here with relatively equal intensity in each of the three time periods.
Thailand‘s standard deviation has increased as evidenced by the large and increasing
factor abundance measure for land. This would imply that agricultural products are taking
a larger role while capital usage shows a relative decline. India remains dominated by its
land usage as does Indonesia. However, Indonesia‘s factor abundance measures for land
and natural resources have declined somewhat indicating a potential increase in the
diversity of other resources used.
What the above discussion highlights is a relatively stable factor abundance story for
most of the advanced OECD countries.28
However, the dynamics of changing market
structure are evident, as illustrated by the changing ranks and growing dispersion of
relative factor abundance measures in, for example, the United States and South Korea.
Chile, Mexico and Poland show decreasing variation among measures of factor
abundance which could imply, as revealed by factor abundance measures, established
production patterns. Turkey, on the other hand, shows increasing dispersion potentially
indicating a changing relative factor base.
SEMs, for the three time periods examined, show a relatively consistent factor
ranking, still heavily dependent on land (i.e. agricultural) and natural resources. However,
movement to capital goods can be observed in the case of Brazil and to a lesser extent,
Indonesia. Most countries continue to show a factor endowment story related to
agriculture and natural resources.
Overall, these results are consistent with those observed in factor endowment trends.
The stability in both groups of countries‘ rankings is a possible reflection of the large
established factor stocks in these economies. That is, the large share of capital and skilled
labour stocks in the OECD and the unskilled labour stocks in the SEMs. However, the
small shifts in rankings and the changing abundance measures, along with their standard
deviations, show an emerging trend of diversification into using capital and skilled labour
for SEMs and a subtle shift in the OECD endowment usage as well.
How has factor content of trade changed over time?
We calculate a measure of factor content for each of the five GTAP factors for the
three time periods (1997, 2001 and 2004) based on a derivation of the basic equation
shown in (1) and presented in Figures A 9 and 10.29
Positive values are an indication of a
28. While we are able to look at a greater level of factor disaggregation than previous studies, our
measures are still quite broad. It is to be expected that if we could conduct this analysis at an even
more refined level of inputs (e.g. different types of skilled labour) we may see different patterns
emerging.
29. The values at the economy-wide level were scaled by relative income measures to ease comparisons.
The authors wish to thank Frank Van Tongeren for providing a crucial piece of code to perform the
calculations.
18 – THE ROLE OF FACTOR CONTENT IN TRADE: HAVE CHANGES IN FACTOR ENDOWMENTS BEEN REFLECTED IN TRADE PATTERNS AND ON RELATIVE WAGES?
OECD TRADE POLICY WORKING PAPER NO. 109 © OECD 2011
comparative advantage as implied by exporting abundant factors of production, while a
negative value reflects a negative factor content of trade.
For ease of discussion, we present a measure of factor content of trade for three
factors: skilled labour, unskilled labour and capital, for OECD economies (Figure A9)
and SEMs (Figure A10). As expected, most of the OECD countries show a deficit in
unskilled labour (panel 1). The notable exceptions are Japan and Korea who have
surpluses in each of the three years, as do, albeit to a lesser extent, Australia, Chile,
Finland, Ireland, Slovenia, Switzerland, Estonia, Turkey and the United States. This
outcome is consistent with the rankings of relative factor abundance presented in the
previous discussion. For example, the United States and Japan had the highest OECD
stocks of unskilled labour and both show labour in general (skilled and unskilled) as a
consistently ranked highly utilised resource relative to the other resources used. A notable
exception is Korea. Its unskilled labour stocks were not significantly higher than other
OECD countries, showing a trade deficit in this factor (France, for example) yet its
relative factor usage ranking for unskilled labour was behind both land and capital in
2001 and 2004 (Table A2). However, broadly speaking these results do reflect the
patterns observed in the factor endowment trends noted in section III.
The highly positive values for both Japan and the United States in its factor content of
skilled workers shown in the following panel is again a reflection of the abundance of
labour reported for these countries. France, Italy and Germany, among others, are all
shown to have deficits in their factor content of trade in skilled workers. This is in fact
surprising as most OECD countries have a relative abundance of skilled workers vis-a-vis
the rest of the world and skilled labour ranks as Italy and Germany‘s second most
intensively used resource (Table A2). However, where these countries show a consistent
comparative advantage is in the area of capital, where all three have relatively large
positive values (France excepting in 2004). Mexico‘s increase in capital stock and its
associated increase in relative usage rank are reflected in its positive factor content of
trade for capital. This trend is observed despite Mexico‘s falling k/l ratio which is more a
reflection of faster labour growth than declines in capital stock. While the measure
experienced a downturn in 2004, it was strongly positive in 1997 and 2001. Other
countries with factor content surpluses in capital include New Zealand, Ireland and Chile
and the newly emerging OECD economies of Poland, Hungary, Slovenia, Estonia and
Turkey.
The United States and the United Kingdom are shown to have a negative factor
content of trade in capital in each time period examined. This could be due to the
―de-industrialisation‖ of these economies as identified in Interim Report 1. The increasing
use of resources in the production of services is something that was observed throughout
the OECD but especially so in countries such as the United Kingdom and United States.
As further noted in Interim Report 1, the share of manufactured exports from the top
OECD exporters has been declining over the period 1990-2007. Finally, the United States
and United Kingdom were among the lowest ranked OECD economies in measures of
GFCF to value added in manufacturing (Figure A6).
The three panels in Figure A10 look at the same measures for the SEMs. As expected,
almost all show a comparative advantage in unskilled labour judging by the factor content
of their trade. Some countries, Thailand, Russia and South Africa, show a negative factor
content of trade in more recent years, but for South Africa and Russia, this is not a
consistent pattern and for Thailand, it is decidedly smaller in recent years. Neither South
Africa nor Thailand (information was not available for Russia) have large stocks of
THE ROLE OF FACTOR CONTENT IN TRADE: HAVE CHANGES IN FACTOR ENDOWMENTS BEEN REFLECTED IN TRADE PATTERNS AND ON RELATIVE WAGES?– 19
OECD TRADE POLICY WORKING PAPER NO. 109 © OECD 2011
unskilled labour with respect to other SEMs (Figure A4). Again, as expected, all show a
negative balance in skilled labour with the exception of Brazil and Malaysia who both
show a positive factor content of trade in this resource in more recent years (2001 and
2004). Interestingly, relative stocks of skilled labour with respect to other SEMs were no
higher in these two economies (Figure A3) and skilled labour actually ranked fifth in
Malaysia‘s relative factor usage (Table A3).
Another interesting observation can be seen in the patterns revealed when looking at
capital. All of the SEMs show at least one period with positive factor content for capital.
This implies that the trade balance in goods using capital is positive and thus these
countries have a comparative advantage in this resource. A possible explanation for this
pattern is the growing industrial production base of these economies, especially those in
Southeast Asia. As observed in Interim Report 1, OECD countries are moving toward
services and away from traditional ―capital intensive‖ manufacturing and the slack is
being picked up by SEMs. As these countries increase their inflow of FDI and expand
their own higher value-added manufacturing processes, the capital content of their trade
should necessarily increase. We saw this by the increased rank of capital usage in some of
these economies, China especially, implying growing participation of relatively capital
intensive goods in their trade.
These outcomes are consistent with the growth in capital stocks in SEMs and a slower
investment rate among OECD countries observed above (Figure A1). Further, we see that
the majority of OECD countries which have an increase ranking in capital factor usage
are emerging OECD economies like Poland, Mexico and Estonia while only a few SEMs
show an increased ranking of capital (China, Thailand and South Africa). However, the
increase in relative ranking for China is small, indicating that their factor usage is still
dominated by other factors, i.e. labour.
When we observe, however, the relative contribution of labour and capital as
measured in countries‘ k/l ratios, we see that capital still dominates among OECD
countries. What this implies is that while the production base is shifting, it is shifting
slowly. OECD countries still employ a relatively large share of capital reflective of their
large capital stocks while SEMs employ larger shares of labour, reflective of their stocks.
However, among those sectors seeing the most growth in each region (i.e. services in
OECD and manufacturing in SEMs) we see the potential reversal of these resource uses.
Overall, the base is dominated by capital in the OECD with changes in labour, while the
base is dominated by labour in SEMs and capital is driving the change. This may also
imply something about the nature of traded versus non-traded goods. Overall, according
to resource rankings, the relative use of labour by OECD countries has remained fairly
stable while capital has increased. However, the factor content of resources implies these
rankings will change to reflect a declining use of capital among traded goods, and a
possible reflection of the shift from manufacturing to services.
What role has intermediate inputs played in measuring factor content of trade?
As stated above, traditional measures of factor content have tended to be based on
primary factor services embodied in the trade of final goods and services. We aim to
expand this measure to include the factor services embodied in intermediate inputs –
imported as well as locally sourced - as well. Thus, equation (1) becomes:
i
k
1ii
k
i
k T)B(IDF (2)

20 – THE ROLE OF FACTOR CONTENT IN TRADE: HAVE CHANGES IN FACTOR ENDOWMENTS BEEN REFLECTED IN TRADE PATTERNS AND ON RELATIVE WAGES?
OECD TRADE POLICY WORKING PAPER NO. 109 © OECD 2011
where F is the factor content of input k in country i; D is the vector of factor inputs k,
i‘s intermediate inputs matrix B is adjusted to fully account for imported intermediates, as
outlined in the technical appendix, and T is the net trade vector in country i.
We can further examine the trends in factor content derived from the traditional
HOV specification by comparing the outcomes of an equation which accounts for a
country‘s use of resources embodied in its intermediate inputs with one that does not.
This analysis is discussed below. While we developed results at the general country level,
we report here those outcomes pertaining to individual sector outcomes.30
Including a correctly specified measure of traded intermediates is crucial to a more
accurate measurement of factor content. In order to better understand the relative
importance of intermediate trade we examine the factor content of trade with and without
imported intermediate inputs for China and the United States.31
China
We examine the trends in factor content across sectors for three factors of production:
skilled labour, unskilled labour and capital. Given that most imported intermediate shares
are in the manufacturing sector, we begin our analysis in this area. In addition, because
we are comparing with the United States and the changing nature of the two economies
stresses the role of services, we include this sector as well.
Figure A11 shows the factor content of Chinese trade for skilled labour in three time
periods: 1997, 2001 and 2004. The bars represent the factor content of trade as defined by
equation without explicitly accounting for intermediate inputs and the dots are defined
with intermediate inputs. While measures without show a consistently negative balance
across both sectors and time periods, there are significant difference when accounting for
intermediates.
When examining skilled labour, accounting for intermediate inputs in the calculation
of factor content reduces the observed deficit, or creates a small surplus, in almost every
sector. Notable exceptions are the chemical and rubber sector (crp) and the trade (retail
and wholesale, trd) sector in 2001. Thus, for example, it would appear that the inputs
which China accesses from the rest of the world are more skill intensive in the production
of electronics and other manufacturing goods. Across the sectors of textiles (tex), wearing
apparel (wap) and leather (lea), the same phenomenon is observed, although to a lesser
extent. An outlier is the other services sector consisting of public administration and
government services (osg). Here, especially in 1997 and 2001, we see a large surplus
reduced to a small deficit in 1997, balanced trade in 2001 when accounting for the factor
content of intermediate inputs. This would imply that China was importing intermediate
inputs that are non-highly skill intensive, or at least less skill intensive than non-traded
intermediate inputs. By 2004, this trend had reversed itself and including intermediate
imports leads to a slightly larger surplus, implying that more skilled labour was now
being sourced internationally.
Turning to unskilled labour, shown in Figure A12, the pattern of comparative
advantage appears to be changing regardless of intermediate inputs (although these inputs
30. Table 2 in the Data Annex provides a list of sectors covered.
31. While similar comparisons are available for all covered countries, as two of the largest trading
nations, we focus our discussion on these two countries.
THE ROLE OF FACTOR CONTENT IN TRADE: HAVE CHANGES IN FACTOR ENDOWMENTS BEEN REFLECTED IN TRADE PATTERNS AND ON RELATIVE WAGES?– 21
OECD TRADE POLICY WORKING PAPER NO. 109 © OECD 2011
impact the results as well). In 1997 and 2001, we observe surpluses in sectors using
unskilled labour (before adjusting for intermediate inputs). These include construction
(cns), chemicals and rubber, non-metallic minerals (nmm, such as cement, lime and
concrete), trade and other business services (obs). By 2004 none of the sectors show a
surplus in unskilled labour. This is consistent with the decline in the relative abundance
ranking for unskilled labour in China between these two time periods. However, once we
account for the factors embodied in intermediate inputs, we observe a number of strong
surplus sectors. These include electronics (ele), other manufacturing (omf), textiles,
wearing apparel, leather and lumber (lum). Again, this could be an indication of China‘s
own increasing use of production outsourcing, especially in the textiles and electronics
sectors.
Capital shows a different story to that of labour (Figure A13). In most of the sectors,
in all three time periods, China has a small surplus in capital, and we see this trend
strengthening in 2004. However, as distinct from labour, including intermediates creates a
smaller surplus and even a deficit in many sectors including paper products (ppp),
petroleum and coke (p_c), chemical and rubber, iron and steel (i_s), motor vehicles
(mvh), other machinery and equipment (ome) and trade. By 2004 many services sectors
see shrinking surpluses when intermediate inputs are accounted for, including finance and
banking (ofi) and other business services. As stated above, this implies that most
imported intermediate inputs are more capital intensive than other inputs while imported
intermediate inputs into chemicals and machinery and equipment, for example, are less
capital intensive in 2004. While we do not have detailed source information for
intermediate inputs to China, looking at total imports provides some explanation. Japan
remains a major source of imports across four of the five sectors in 2004. Taiwan and
Korea also contribute significantly to imports of chemicals and rubber and other
machinery and equipment while Hong Kong is by far the largest supplier of imports in the
trade sector, all sectors with implied higher capital input in imported than domestic
intermediates. However, among those sectors which showed lower capital intensity in
imports – electronics and other manufacturing – Malaysia, India and Thailand were also
significant sources of imports.
The United States
Figure A14 shows the same three sets of graphs for the United States, that is, the
evolution of surplus/deficit sectors with and without intermediate inputs for skilled
labour. Across all three time periods the United States shows a significant surplus in
skilled labour in the services sector with other business services showing particular
strength in 2004. Other sectors, such as motor vehicles, other machinery and equipment,
chemicals and rubber, construction and trade had shown relatively strong surpluses with
smaller values in 2004.
Intermediate inputs make less of a difference in the overall results of the
United States data over each successive period. Indeed, by 2004 the only sectors outside
services that experience a relatively large shift is other machinery and equipment and, to a
lesser extent, chemicals and rubber. These small changes are in contrast to China who
shows large changes in each time period. While this does not indicate that the United
States has fewer imported intermediate inputs than China (indeed the many cases the
United States imports more), rather that the resource profile in the inputs are more similar
to those sourced from within the United States.
22 – THE ROLE OF FACTOR CONTENT IN TRADE: HAVE CHANGES IN FACTOR ENDOWMENTS BEEN REFLECTED IN TRADE PATTERNS AND ON RELATIVE WAGES?
OECD TRADE POLICY WORKING PAPER NO. 109 © OECD 2011
Much the same pattern holds for unskilled labour in that there are small differences
with and without intermediate inputs in sectors outside services (Figure A15). Here,
however, many of the sectors go from large surpluses to balanced trade, implying that the
United States imports unskilled-intensive intermediates. Sectors that maintain their
surplus, albeit at a lower level include other transport equipment (otn), banking and
business and government services sectors. Again, this implies that the United States trade
in goods using unskilled labour is generally in balance with the exception of a few
sectors, and trade in intermediate inputs have only a limited role to play in this story.
As noted above, the role of capital in US trade is not as large as one would have
expected a priori (Figure A16). Indeed, across the manufacturing sectors there are no
significant surplus sectors in any of the three time periods examined with most of these
sectors remaining more or less in balance. However, there are significant deficits across
many of the services sectors. In 2004, the deficit in other business services sector was
particularly large. Indeed, all of the service sectors (with the exception of the transport
sectors) show deficits in each period. Thus, it would appear that these sectors are driving
the deficit in capital observed for the United States in Figure A9.
When adjusting for intermediate inputs, the deficits in the services sector change
considerably. Most of the deficit sectors move to a balanced trade or even surplus as in
the case of other business and government services. One of the issues with the
measurement of capital is that we are unable to determine what part of the imported
intermediate goods are made with the exporting country‘s capital from that which may be
produced with US capital employed overseas. Thus, while it appears that the United
Kingdom is a net importer of capital in these sectors, it may be that a large part of the
capital is owned by US companies. Grossman and Rossi-Hansberg (2009) show that trade
between US companies and their foreign subsidiaries accounted for 47% of US imports in
2005. Further they show that US imports in ―Business, Professional and Technical
Services‖ (which overlaps with our other business services) grew in real terms by more
than 66% between 1997 and 2004.
From this analysis we can see what has been a growing acknowledgement in trade
circles: intermediate trade matters. Further, we see that it affects factors differently. Thus
if policy is to be effective, it must rely on analysis which includes intermediate trade and
the embodied factor services in this trade, and includes it in a meaningful way,
i.e. measured in terms of value added. How this information can be used in the formation
of trade policy will be discussed in more detail in the fourth paper of this series.
However, before we move to that, we provide some insights into how this information
plays a role in analysing a widespread phenomenon across both OECD and SEM
economies: that of wage inequality.
THE ROLE OF FACTOR CONTENT IN TRADE: HAVE CHANGES IN FACTOR ENDOWMENTS BEEN REFLECTED IN TRADE PATTERNS AND ON RELATIVE WAGES?– 23
OECD TRADE POLICY WORKING PAPER NO. 109 © OECD 2011
V. Relationship between trade and relative wages
The developments in factor content of trade are intertwined with factor returns
because the latter function as signals about resource allocation and the former about
utilization within a country. Trade literature analyzing factor content links the HOV
model to the factor price equalisation (FPE) theorem because equalisation of marginal
factor returns would be the expected outcome when two countries with identical
technologies but with different factor endowments, producing the same goods or services
engage in free trade.32
The trade literature succinctly summarized in Freeman (1995) has
investigated whether factor price equalisation occurs empirically across countries. The
main conclusions are that factor price equalisation is a rare occurrence because of its
demanding conditions. These conditions include: identical technology and tastes; similar
ranking of sectors by skilled to unskilled and capital to labour ratios at all prices; absence
of scale effects; and incomplete specialisation by all countries, that is, all countries
produce the full set of traded goods. As a consequence of the breakdown in FPE, we need
to identify other forces that could explain factor return differentials. This is important
because these differentials are at the heart of the North-South development gap; they are
also critical in explaining differing equilibrium growth paths across nations, and can
exacerbate trade frictions (Trefler, 1993). Moreover, the growing importance of trade of
intermediate goods observed above can have a potentially large impact on factor returns,
in particular, wages, through production fragmentation and offshoring.
Using data available in Freeman and Oostendorp (2000), we examine the evolution of
real wages and wage inequality for a sample of OECD and non-OECD economies.
Freeman and Oostendorp standardized the International Labor Organization‘s (ILO)
―October Inquiry‖ survey to allow for wage comparisons across countries, industries, and
occupations.33
The resulting dataset covers approximately 130 countries and around
161 occupations for the years 1983-2003. Details can be found in the Data Annex.
The data in the sample allows compensation to be disaggregated by industries and
occupations to identify those having the lowest and highest wages. Figures A17 and 18
present the frequencies of industries and occupations which reported the lowest
compensation in the sample. The occupation Room attendant or Chambermaid in the
Restaurant and hotels industry received the lowest wage about 13% of the time across all
countries. Other occupations receiving low compensation were Labourer, Field crop farm
worker, Cash desk cashier, Sewing machine operator, and Waiter. The corresponding
industries for these occupations were Textile (spinning, weaving and finishing), Retail
trade (grocery), and Agricultural production. The occupations receiving the highest
compensation across all countries were Air transport pilot, General physician, Air traffic
controller, and Chemical engineer. The corresponding industries were Air transport and
its supporting services; Medical and dental services; and Crude petroleum and natural gas
production. Figures A19 and 20 present these occupations and industries.
We next identify the industry/occupation breakdown for OECD and SEM economies.
Figures A21 and 22 present the lowest paying industries and occupations for OECD
32. The Factor Price Equalisation Theorem states trade in goods has the ability to equalize factor prices
where trade in goods is a proxy for trade in factors of production.
33. This circumvents measurement problems such as different reporting units, quality of reporting
sources, wage levels, and other issues, providing the use of a unique standardised dataset.

24 – THE ROLE OF FACTOR CONTENT IN TRADE: HAVE CHANGES IN FACTOR ENDOWMENTS BEEN REFLECTED IN TRADE PATTERNS AND ON RELATIVE WAGES?
OECD TRADE POLICY WORKING PAPER NO. 109 © OECD 2011
countries. The occupation Room attendant or Chambermaid was the lowest compensated
occupation and the industry was Restaurant and hotels. Other industries receiving the
lowest compensation were Retail trade (grocery); Agricultural production (fieldworkers);
and Manufacturing of wearing apparel. Note that in our analysis of factor content, we
observe some of the most significant shifts in trade positions from including intermediate
inputs were in the Textile (including wearing apparel) industry. Figures A23 and 24
present the reverse, the highest compensated industries and occupations, in the OECD
countries. Air transport pilot, General physician, Air traffic controller, and Chemical
engineer were again the highest compensated occupations. The industries were Air
transport and supporting services, Medical and dental services, and Manufacturing of
industrial chemicals.
Figure A25 shows that Labourer, Field crop farm worker, Plantation worker, and
Room attendant or Chambermaids were the lowest compensated occupations in the
SEMs. The lowest compensated industries were Textiles, Education services, Printing,
Publishing and related industries, and Restaurants and hotels (Figure A26). Finally, the
occupations which registered the highest compensation were Air transport pilot, General
physician, Accountant, and Air traffic controller. Those industries paying the highest
wages included Air transport, Medical and dental services, Construction, and Banking
(Figures A 27 and 28). Notably, none of these sectors (with the exception of Textiles)
figures prominently in SEMs factor content of trade. This anecdotal evidence provides
little incentive to suspect a strong relationship between trade and wages.
To more rigorously examine the influence of domestic and international wage setting
mechanisms, we use the concept of factor price equalisation (Freeman 1995). As stated,
the conditions for factor price equalisation are demanding and, therefore, observing wage
convergence is rare. Moreover, factor price equalisation implies domestic labour market
policies have little or no effect on the level of wages. Countries with larger labour forces
would have an advantage in setting wage levels and could exert undue influence in
determining modifications on wage levels. The exceptions to this potential influence are
occupations found exclusively in the non-tradable sector which would not be affected by
changes in the international environment.
Figures A29-31 present the logarithmic difference between the wages reported for
selected occupations identified as the lowest and highest paying in each country using the
United States as reference. In this context, zero implies equality of wages and negative
numbers represent wages lower than the United States, and vice versa for positive
numbers. No consistent evidence of factor price equalization is shown in the figures.34
We do observe, however, the emergence of three wage levels, which seem to be
associated with the particular country‘s development level. For example, in the case of
Field crop farm worker the differences in wages between India and Bangladesh with the
United States are the largest and maintain a consistent spread. Similarly, for Field worker
the differences between Mexico and the United States; are smaller compared to India,
Bangladesh, and China, but still maintain a consistent spread. Finally, the differences in
wages between Austria, Italy, and Sweden and the United States with respect to Field
workers are positive –wages are higher in these countries than in the United States—and
consistent in this pattern. The same pattern can be found for Room attendant or
Chambermaids. Another example, the case of General physician, shows a repetition of the
aforementioned pattern. Countries such as Austria, Italy, and Korea have smaller
34. We examined the evolution of both nominal and real wages. The results are similar.
THE ROLE OF FACTOR CONTENT IN TRADE: HAVE CHANGES IN FACTOR ENDOWMENTS BEEN REFLECTED IN TRADE PATTERNS AND ON RELATIVE WAGES?– 25
OECD TRADE POLICY WORKING PAPER NO. 109 © OECD 2011
differences with the United States and consistently higher wage levels compared to
China, Hungary, and Mexico.
Finally, regression results looking for convergence effects show no conclusive
statistical evidence of convergence in real wages.35
We analyse different sets of cross-
sectional regressions starting with a simple specification where the dependent variable is
the percentage change in the real wage as a function of the initial level of development,
proxied by the logarithm of gross domestic product per capita, and a constant. A negative
and statistically significant coefficient on the logarithm of gross domestic product per
capita would suggest a process of wage convergence. More developed countries initially
would have their wages grow at a slower rate than less developed countries, thus allowing
for catch-up. Table A4 in the Annex presents mixed evidence since the parameter
estimates change sign (regressions 1 and 4) and statistical significance (regressions 2 and
5) depending on the estimation method, the time period, and the inclusion of fixed effects.
Next we include a measure of the country‘s initial level of openness, proxied by the
sum of total imports and total exports as a share of gross domestic product, into the
regression specification. The objective is to determine if the country‘s initial exposure to
the international economy has any influence on the percentage change in real wages. A
positive sign associated with the parameter estimate would indicate greater exposure to
the international economy would be correlated with a greater percentage change in real
wages. Table A5 in the Annex presents the regression results. The inclusion of the
openness measure does not modify the previous conclusion where there is no clear
evidence suggesting convergence in real wages between developed and developing
economies. In addition, the openness measure itself does not prove to be robust and
statistically significant as it is only positive and statistically significant in regressions 7
and 9.
Finally, we construct a concordance between the GTAP sectors and the ILO
occupations and associate the industries in the ILO October Inquiry to the GTAP
industries. We explore industry heterogeneity in case those industries which are more
exposed to international trade show evidence of greater wage volatility. Given we were
only able to map 27 GTAP sectors, we re-ran the regression models including these
sectors as fixed effects. Table A6 in the Annex presents the parameter estimates. The
parameter estimate of the logarithm of real per capita GDP shows mixed results by
changing direction (regressions 1 and 2 compared to 3, 4, 5, and 6) from positive to
negative and the parameter estimate associated with openness is not consistently
statistically significant. All this evidence taken together suggests internal factors have
greater influence on the setting and evolution of real wages.
Thus far we have found no significant link between trade and wage determination.
However, we have shown that, overall, factor abundance is reflected in a country‘s trade
pattern. Therefore the next logical question is then to what extent does factor abundance
influence factor returns. That is, do the returns paid to abundant factors used intensively
rise as countries expand trade and fall in those factors that are relatively scarce? In
particular, this would imply rising wages for low skilled workers in developing countries
and decreasing wages for this type of individuals in developed economies.
To examine this question, we construct yearly wage distributions to obtain more
detail about the evolution of wages in the OECD and SEM economies. Figures A32
35. Regression results are reported in Tables 4, 5, and 6 of the Annex.
26 – THE ROLE OF FACTOR CONTENT IN TRADE: HAVE CHANGES IN FACTOR ENDOWMENTS BEEN REFLECTED IN TRADE PATTERNS AND ON RELATIVE WAGES?
OECD TRADE POLICY WORKING PAPER NO. 109 © OECD 2011
through 39 present these wage distributions for 1984, 1991, 1997, and 2001.36
Figure A32
presents the estimated wage distribution for OECD countries in 1984 comparing it to a
normal distribution created using the data‘s observed mean and standard deviation. The
distribution is right-skewed with the majority of the mass concentrating at lower wage
levels. Similarly, Figure A33 presents the wage distribution for SEM economies for 1984.
While the distribution is skewed to the right, it presents different features such as two
humps suggesting two major wage levels where most observations concentrate. Like the
figure for OECD countries these suggest low paying jobs are more abundant and a
smaller group of individuals command high wages. The remaining figures, Figure A34
through Figure A39, are also right-skewed confirming that high paying jobs are relatively
scarce.
Figures A32 through 39 do not consistently suggest the presence of a sorting effect
related to a skill premium. The skill premium relates to workers possessing a wider set of
abilities becoming more valuable to firms. Likewise, more productive firms, paying
higher wages, become more selective in their hiring policies (Helpman, Itskhoki, and
Redding, 2009). Therefore, if a larger number of skilled individuals command higher
wages and firms‘ hiring policies focus on skills we expect the wage distribution to
develop multiple humps. The wages of low skilled workers would be located at the lower
end of the distribution and wages for high skilled individuals would be located around the
second hump towards the right end of the distribution. We only observe wage
distributions with two humps for OECD countries in 1997 and for SEM economies in
1984 and 1997.
Have the changes in wage distribution observed above been a significant development
across the OECD and SEMs? Documenting the per cent wage differential across
occupations over time in each country allows us to look at within country wage
distribution. Such distributions can be considered an outcome of particular labour
policies, and can influence the factor content of trade. As these labour market policies,
such as education and skill enhancement programs, influence a country‘s endowment
structure, it is important to understand the link between policies which influence
endowments, thus trade, and the potential feedback mechanisms which could impact
wages.
Figure A40 presents the evolution of the per cent wage differentials across
occupations for the countries of interest.37
Romania presents the biggest percentage
spread and the largest changes in the spread, implying growing wage inequality. Other
countries which showed increases in wage inequality from 1990 to the year 2000 are
Brazil, India, Mexico, Slovakia, Italy, Portugal, and the United States. On the other hand,
Canada and China show a decrease in wage inequality in this same period.38
Finally, the
wage distribution behaves in a stable manner in Finland, Iceland, Belgium, Norway,
Denmark, The Netherlands, and New Zealand. Norway has the lowest percentage wage
differential with this being just over one-half. The increase in the observed wage
36. The starting point is 1984 since there is no available data for SEMs in 1983.
37. There are several countries which are not included because of lack of data. In particular Chile,
France, Luxembourg, Switzerland for the OECD group; Indonesia for the Enhanced Engagement
group, Egypt, and Malaysia for the other Selected Emerging Market economies.
38. Given the available data for China only goes to the year 2000 we cannot follow-up on developments
regarding wage inequality in the subsequent years. However, Wu and Perloff, (2005) report figures
that suggest an increase in rural-urban inequality in later years.
THE ROLE OF FACTOR CONTENT IN TRADE: HAVE CHANGES IN FACTOR ENDOWMENTS BEEN REFLECTED IN TRADE PATTERNS AND ON RELATIVE WAGES?– 27
OECD TRADE POLICY WORKING PAPER NO. 109 © OECD 2011
differential in most economies over this period correlates with world economic expansion
and increased trade in the decade of the 1990s. This of course does not imply a causal
link.
Figure A41 shows a detailed picture of the percent wage evolution among OECD
countries where data is available. Hungary, Poland, Slovakia, and Turkey experienced an
increase in wage inequality, but not the Czech Republic. While Mexico and the United
States both saw wage inequality increase, the increase in Mexico was greater. Other
OECD countries that have suffered from an increase in wage inequality are Italy,
Portugal, and Sweden. On the other hand, Germany, Japan, Austria, Canada, and Korea
have managed to make their wage distributions more compact. Thus, on the face of
things, increases in wage inequality are not necessarily associated with large trading
nations (i.e. difference outcomes for the United States and Germany) nor with those
having a particular endowment structure (i.e. similar findings for Japan and Canada, for
example).
Turning to the SEMs, Romania and Brazil have experienced significant increases in
wage inequality, while wage inequality in India, Singapore, and China had been falling
up to the year 2000 (Figure A42). Focusing on Enhanced Engagement and Accession
economies, Brazil had the highest level of wage inequality followed by India, and Russia.
Brazil‘s percent differential between the lowest and the highest wage was almost
28 times.
No clear linkage between factor content of labour (either in ranking or intensity) and
wage inequality emerges from this analysis. Thus, while trade expansion has occurred
during this period of overall wage inequality growth, circumstantial evidence does not
indicate a strong link to trade.39
Overall, while we do not explicitly test for FPE, we did not observe trends which
would suggest factor price equalisation in workers‘ wages. The differential in wages is
consistently maintained leading to the improbability of factor return convergence. Stated
in other terms, wages in developed countries do not seem to be converging towards wage
levels observed in developing countries with large labour endowments. This was not
unexpected due to reasons described above, not the least of which is the differences in
labour productivity noted in Section III. What these various trends do suggest is that
differences in labour (reflected in different wage levels) lead to the application of
different technology matrices (which we have shown to play a major role in correctly
analysing the factor content of trade). We also do not observe reductions in wage
inequality in unskilled labour abundant countries (SEMs) where this factor of production
is shown to be used intensively. We observe evidence of a skill premium in the wage
distributions for 1997 in both OECD and SEMs, but such phenomenon does not appear
consistently in the figures. However, as Helpman, Itskhoki, and Redding (2009) state,
firms appear to have changed their hiring practices focusing on hiring workers with a
wider set of skills. This opens the door to explore and examine the impact of economic
policies on the domestic labour market of these countries and the effective development
of a labour endowment.
39. It is possible to try and establish a more robust link between wage inequality and factor content
through more sophisticated econometrics, but that is beyond the scope of this paper and left to future
research

28 – THE ROLE OF FACTOR CONTENT IN TRADE: HAVE CHANGES IN FACTOR ENDOWMENTS BEEN REFLECTED IN TRADE PATTERNS AND ON RELATIVE WAGES?
OECD TRADE POLICY WORKING PAPER NO. 109 © OECD 2011
VI. Conclusions and areas of policy consideration
We observe that overall, factor content is reflected in changing trade patterns while
the link to relative wages appears to be limited.
OECD economies as a whole continue to hold the lion‘s share of capital and skilled
labour endowment stocks while SEMs hold more unskilled labour. Overall, measures of
factor content of trade reflect these holdings. However, while OECD countries have been
shown to be accumulating capital stocks at a rapid rate, over 4% per annum for the past
15 years, SEMs have been doing so at an even faster rate, over 11% over the same time
period. The same observation can be made for skilled labour; OECD stocks growing at
over 3% while SEMs are growing at an annual rate of almost 5%.
Capital/labour (k/l) ratios show that OECD economies remain relatively capital
intensive, and this is confirmed in the relative rankings of the intensity of this resource
use in traded goods. Capital consistently ranks high, as does skilled labour. For SEMs, we
see smaller k/l ratios and these factors rank lower in their relative usage; unskilled labour
ranks high, but natural resources and land figure prominently in the relative intensity of
factor usage for SEMs as well. There are broad exceptions (such as Australia for natural
resources and Brazil for capital) but overall these results hold.
If, however, we look a little deeper at movements in the rankings and relate them to
the observed difference in factor accumulation across the country sample, we see
increasing use of unskilled labour in OECD countries and capital increasing its intensity
among SEMs.
These changing dynamics are reflected in the total factor content for trade for capital,
skilled labour and unskilled labour. However, the analysis did yield some unexpected
results. Among the OECD economies, the two largest capital stock holders – Japan and
the United States – show deficits in the trade of capital embodied goods. More in line
with expectations, newly emerging OECD economies such as Hungary, Chile and Poland,
all show strong surpluses. We see an increase in the use of unskilled labour embodied in
the United States and Japanese trade, but also in Korea and Australia. SEMs show a
strong surplus in unskilled labour trade across the board. Finally, skilled labour stocks are
strongest in the United States and Japan and both show a sizable surplus in the factor
content of skill embodied trade while only Malaysia and Brazil among the SEMs show a
surplus here.
The picture emerging among the OECD economies is thus more varied and nuanced
than that among the SEMs. Part of the explanation for the OECD results could be the
manner in which we think and account for factors. That is, whether the traditional method
of measuring actual units of capital and labour, located with the geographic boundaries of
a country, is still appropriate. Rather, we should be looking at more refined measures of
individual tasks and factors roles in intermediate inputs, which are not necessarily defined
by geographic boundaries. The large literature on production fragmentation and
offshoring attest to this trend. Trade, even factor content, can no longer be thought of as a
function of the endowments located solely within a country‘s borders, but rather can be
seen as a function of trade-in-goods and trade-in-tasks where the level and direction of
this trade are a function of the changes in the costs of moving goods and particular tasks
and ideas, rather than ―jobs.‖
Baldwin and Robert-Nicoud (2010) present a model which attempts to integrate these
new patterns of firm behaviour into traditional trade theory like HOV. They argue that
THE ROLE OF FACTOR CONTENT IN TRADE: HAVE CHANGES IN FACTOR ENDOWMENTS BEEN REFLECTED IN TRADE PATTERNS AND ON RELATIVE WAGES?– 29
OECD TRADE POLICY WORKING PAPER NO. 109 © OECD 2011
this movement of tasks creates ‗shadow migration‘ and changes the way factors are
characterised in standard trade theory. This, they argue, explains why standard trade
theory presents so many ‗unexpected‘ results.
This observation can be inferred from the analysis of trends in factor content with and
without fully accounting for imported intermediate trade flows. We observe shifting
patterns in comparative advantage depending on whether we account for worldwide use
of resources, regardless of location. In the United States we see changes mainly across the
services sector, while China experiences large differentials in the outcome of their
manufacturing sector – both of these dynamic and growing sectors in the respective
economies.
Finally, when exploring the impact of these trends on wages, and wage differentials,
we find little evidence of a strong link. This is especially true when we look at trends in
wage inequality where it appears that domestic conditions have a greater bearing on
outcomes than trade patterns in general, and factor endowments in particular. For policy
makers, the complexity of the endowment/trade/wages link means careful analysis is
required of any policies attempting to affect labour market outcomes through trade.
As the driving forces behind trade patterns change, so must the approach to
measuring these patterns. We have shown that intermediate goods play an important role
in the analysis driving policy advice. In addition, inferred here is the importance of
foreign direct investment and the role domestic capital, employed overseas, can make to
notions of trade deficits or surpluses. Thus, policy advice based on simplistic measures of
trade can be misleading.
Given that resource stocks are still a major driver of trade patterns, policies that
develop and enhance these stocks will help countries shape their future comparative
advantage.
We have shown that factor content is an important determinant of comparative
advantage and that comparative advantage, in turn, drives trade patterns. What is
important for policymakers is the fact that this directional flow - endowments to
comparative advantage to trade – does not work in the reverse order. Targeting industries
and ―picking winners‖ is inefficient in the long run, because it is inconsistent with this
basic causal flow. Therefore, trying to impact endowment sectors – such as employment –
through trade policy is counter-productive. That is not to say that a country cannot have
an influence on its comparative advantage, rather this is best accomplished by developing
factors more broadly. A major policy implication of this work is that the best approach to
influencing trade outcomes is to invest in resource market enhancement, such as
education and training for labour and transparency and availability for capital.
30 – THE ROLE OF FACTOR CONTENT IN TRADE: HAVE CHANGES IN FACTOR ENDOWMENTS BEEN REFLECTED IN TRADE PATTERNS AND ON RELATIVE WAGES?
OECD TRADE POLICY WORKING PAPER NO. 109 © OECD 2011
References
Antweiler W. and D. Trefler (2002), ―Increasing Returns and All That: A View from Trade‖,
American Economic Review, 92(1), pp. 93-119.
Athukorala, P. C. and N. Yamashita (2005), ―Production Fragmentation and Trade Integration:
East Asia in a Global Context‖, RSPAS Departmental Working Papers ―2005-07, Australian
National University.
Attanasio, O., P. K. Goldberg and N. Pavcnik (2004), ―Trade Reforms and wage inequality in
Colombia.‖ Journal of Development Economics. Vol. 74. pp. 331-366.
Balassa, B. (1979), ―The Changing Pattern of Comparative Advantage in Manufactured Goods‖,
The Review of Economics and Statistics, 61(2), pp. 259-266.
Baldwin R. and F. Robert-Nicoud (2010), ―Trade-in-Goods and Trade-in-Tasks: An Integrating
Framework‖ NBER Working paper, No. 15882.
Badri, N. G. and T. L. Walmsley (eds) (2008), Global Trade, Assistance, and Production: The
GTAP 7 Data Base, Center for Global Trade Analysis, Purdue University.
Berman, E., J. Bound and Z. Griliches (1994), ―Changes in the Demand for Skilled Labor within
U.S. Manufacturing: Evidence from the Annual Survey of Manufacturers.‖ Quarterly Journal
of Economics. 109(2) pp. 367-397.
Bernard, A., J. Jensen, S. Redding and P. Schott (2007), ―Firms in International Trade‖, Journal of
Economic Perspectives, 21(3), pp. 105-130.
Bowen H. P. and L. Sveikauskas (1992), ―Judging Factor Abundance‖, The Quarterly Journal of
Economics, 107(2), pp. 599-620.
Davis, S. J. and J. Haltiwanger (1991), ―Wage Dispersion between and within U.S. Manufacturing
Plants, 1963-86.‖ Brookings Papers on Economic Activity. Microeconomics, pp. 115-200.
Davis, D. R. and D. E. Weinstein (2001), ―An Account of Global Factor Trade‖, American
Economic Review, 91(5). Pp. 1423-1453.
Davis, D. R. and D. E. Weinstein (2003), ―The Factor Content of Trade‖, The Handbook of
International Trade, J. Choi, Harrigan, eds., London: Blackwell.
Deardorff, A. V. (1982), ―The General Validity of the Heckscher-Ohlin Theorem‖, American
Economic Review, 72(4), pp. 683-694.
Dimaranan, B. D. and R.A. McDougall (eds) (2002), Global Trade, Assistance and Protection:
The GTAP 5 Data Base, Purdue University Press, West Lafayette, IN.
Feenstra, R. C. and G. H. Hanson (2000), ―Aggregation Bias in the Factor Content of Trade:
Evidence from US Manufacturing‖, American Economic Review, 90(2), pp. 155-160.
Fisher, E. and K. Marshall (2008), ―The Structure of the American Economy‖, CESifo Working
Paper Series, No. 2295.
Freeman, R. B. (1995), ―Are your Wages set in Beijing?‖ Journal of Economic Perspectives, 9(3),
pp. 15-32.
Freeman, R. B. and R. Ostendorp (2000), ―Wages Around the World: Pay Across Occupations and
Countries‖, NBER Working paper, No. 8058.
Gabaix, X. (1997), ―The Factor Content of Trade: A rejection of the Heckscher-Ohlin-Leontief
Hypothesis‖ Harvard University, mimeo.
THE ROLE OF FACTOR CONTENT IN TRADE: HAVE CHANGES IN FACTOR ENDOWMENTS BEEN REFLECTED IN TRADE PATTERNS AND ON RELATIVE WAGES?– 31
OECD TRADE POLICY WORKING PAPER NO. 109 © OECD 2011
Goldberg, P. K. and N. Pavcnik (2005), ―Trade, wages, and the political economy of trade
protection: Evidence from the Colombian trade reforms.‖ Journal of International Economics.
Grossman G. and E. Rossi-Hansberg (2006), ―The Rise of Offshoring: It's Not Wine for Cloth
Anymore‖, The New Economic Geography: Effects and Policy Implications. Ed. Federal
Reserve Bank of Kansas City.
Hakura, D. S. (2001), ―Why does HOV Fail? The Role of Technological Difference within the
EC‖, Journal of International Economics, 54, pp. 361-382.
Hanson, G. and A. Harrison (1999), ―Trade Liberalization and Wage Inequality in Mexico.‖
Industrial and Labor Relations Review.52(2). pp 271-287.
Heckscher, E. F. (1919), ―The Effects of Foreign Trade on the Distribution of Income‖, Ekonomisk
Tidskirft, reprinted in Readings in the Theory of International Trade, Homewood, Il, Irwin, pp.
272-300.
Helpman, E. (1999), ―The Structure of Foreign Trade‖ Journal of Economic Perspectives 13(2),
pp. 121-144
Helpman, E., O. Itskhoki, and S. Redding (2009), ―Unequal effects of Trade on Workers with
Different Abilities‖ Harvard, mimeo.
Katz, L. F. and D. H. Autor (1999), ―Changes in the Wage Structure and Earnings Inequality‖ in
Handbook of Labor Economics, Volume 3. Ashenfelter, O. and D. Card (eds). Elsevier Science
B.V.
Katz, L. F. and K. M. Murphy (1992), ―Changes in Relative Wages, 1963-1987: Supply and
Demand Factors.‖ Quarterly Journal of Economics. 107(1) pp. 35-78.
Lawrence, R. Z. and M. J. Slaughter (1993), ―International Trade and American Wages in the
1980s: Giant Sucking Sound or Small Hiccup?‖ Brookings Papers on Economic Activity
Microeconomics. No. 2. pp. 161-226.
Leamer, E. E. (1993), ―Factor-Supply Difference as a Source of Comparative Advantage,
American Economic Review, 83(2), pp. 436-439.
Leontief, W. (1953), ―Domestic Production and Foreign Trade: The American Capital Position Re-
examined‖, Proceedings of the American Philosophical Society, 97, pp. 332-349.
Liu, J., N. van Leeuwen, T. T. Vo, R. Tyers and T. Hertel (1998a), ―Disaggregating Labor
Payments by Skill Level in GTAP‖, GTAP Technical Paper No. 11, Purdue university, West
Lafayette, Indiana.
Lutz, W., A. Goujon, K. C. Samir, W. Sanderson (2007), Reconstruction of population by age, sex
and level of educational attainment of 120 countries for 1970-2000. Vienna Yearbook of
Population Research, vol. 2007, pp 193-235,
http://www.iiasa.ac.at/Research/POP/edu07/index.html?sb=12, accessed on March 12, 2010.
Lutz, W., A. Goujon, K. C. Samir, W. Sanderson (1998b), ―Disaggregating Labor Payments by
Skill Level‖, Global Trade, Assistance and Protection: The GTAP 4 Data Base, R. McDougall,
A. Elbehri and T.P. Troung, editors, Center for Global Trade Analysis, Purdue University,
West Lafayette, Indiana.
Melitz, M. (2003), ―The Impact of Trade on Intra-Industry Reallocations and Aggregate Industry
Productivity‖, Econometrica, 71(6), pp. 1695-1725.
Muriel, B. and C. Terra (2009), ―Sources of Comparative Advantage in Brazil‖, Review of
Development Economics, 13(1), pp. 15–27.
Murphy, K. M. and F. Welch (1992), ―The Structure of Wages.‖ Quarterly Journal of Economics.
107(1). pp. 285-326.
Nicita A. and M. Olarreaga (2006), Trade, Production and Protection 1976-2004, World Bank
Economic Review 21(1).
32 – THE ROLE OF FACTOR CONTENT IN TRADE: HAVE CHANGES IN FACTOR ENDOWMENTS BEEN REFLECTED IN TRADE PATTERNS AND ON RELATIVE WAGES?
OECD TRADE POLICY WORKING PAPER NO. 109 © OECD 2011
Nordas, H., S. Miroudot and P. Kowalski (2006), ―Dynamic Gains from Trade‖, OECD Trade
Policy Working Paper No. 43, http://dx/doi.org/10.1787/276358887412.
OECD (2009), Openness and Effects of Globalisation: Openness and Changing Patterns of
Comparative Advantage, (OECD internal document), Paris.
OECD (2009), Production, Consumption and Trade Developments, (OECD internal document),
Paris, Paris.
OECD, STAN database.
Ohlin, B. G. (1933), Interregional and International Trade, Cambridge, MA Harvard University
Press.
Pilat, D, A. Cimper, K. Olsen, K. and C. Webb (2006), ―The Changing Nature of Manufacturing in
OECD Economies‖, DSTI/DOC(2006)9.
Reimer, J. J. (2006), ―Global Production Sharing and Trade in the Services of Factors‖ Journal of
International Economics, 68, pp. 384-408.
Reimer, J. J. (2006), ―Global Production Sharing and Trade in the Services in the Services of
Factors‖, Journal of International Economics, 68, pp. 384-408.
Romalis, J. (2004), ―Factor Proportions and the Structure of Commodity Trade‖, American
Economic Review, 94(1), pp. 67-97.
Romer, P. (1990), ―Capital, Labor and Productivity‖, Brookings Papers on Economic Activity:
Microeconomics, eds. Martin Neil Baily and Clifford Winston, Washington, DC: The
Brookings Institution, pp. 337-367.
Sachs, J. D. and H. J. Shatz (1994), ―Trade and Jobs in U.S. Manufacturing.‖ Brookings Papers on
Economic Activity. No. 1. pp. 1-84.
Samir K. C, B. Barakat, A. Goujon, V. Skirbekk, W. Sanderson, W. Lutz (2010), Projection of
populations by level of educational attainment, age, and sex for 120 countries for 2005-2050,
Demographic Research 22 (15):383-472,
www.iiasa.ac.at/Research/POP/Edu07FP/index.html?sb=12, accessed on 12 March 2010.
Samuelson, P. S. (1948), ―International Trade and the Equalization of Factor Prices‖, Economic
Journal, 58(230). pp. 163-184.
Statistics Bureau of Japan (2010), www.e-stat.go.jp/SG1/estat/, accessed 12 March.
Trefler, D. (1993), ―International Factor Price Differences: Leontief was Right!‖ Journal of
Political Economy, 101(6). pp. 961-987.
Trefler, D. (1995), ―The Case of the Missing Trade and Other Mysteries‖, American Economic
Review, 85(5), pp. 1029-1046.
Trefler, D. and S. Zhu (2000), ―Beyond the algebra of explanation: HOV for the Technology
Age‖, American Economic Review of Papers and Proceedings, 90(2), pp. 145-149.
Trefler, D. and S. Zhu (2010),“The Structure of Factor Content Predictions‖, University of
Toronto Working Paper.
UNIDO, Demand-Supply Balance Database, ESDS International, University of Manchester.
Vanek, J. (1968), ―The Factor Proportions Theory: the N-Factor Case‖, Kyklos, 21, pp. 749-756.
World Bank (2010), World Bank Development Indicators, http://data.worldbank.org, accessed
April 19, 2010.
Wu, X. and J. Perloff (2005), ―China‘s Income Distribution, 1985-2001‖ Review of Economics and
Statistics 87(4), pp. 763-775.
THE ROLE OF FACTOR CONTENT IN TRADE: HAVE CHANGES IN FACTOR ENDOWMENTS BEEN REFLECTED IN TRADE PATTERNS AND ON RELATIVE WAGES?– 33
OECD TRADE POLICY WORKING PAPER NO. 109 © OECD 2011
Data Annex
Capital and LabourStocks for both capital and labour are expressed in units. The
capital stocks were calculated with the perpetual inventory method using real gross fixed
capital formation flows from the World Bank World Development Indicators. For the
base stock in 1980, an average of Gross Fixed Capital Formation (GFCF) flows was
calculated from 1978 to 1982 to limit year specific anomalies and multiplied it by two.
The depreciation rate used was 7%. The stocks were adjusted with the price of investment
from the Penn World Tables to convert the PPP values into units of capital. Data for
stocks were unavailable for Poland, Slovak Republic, Turkey, Slovenia, Singapore, and
Israel.
Labour stocks were taken from the IIASA and Vienna Institute for Demography data
sets. Labour stocks are defined as total population over the age of fifteen, providing
information about the total human capital available, but not differentiating between
economically active and those that are unable or choose not to work. These data report
populations by age, sex and level of educational attainment for 120 countries for 1970-
2000 using demographic back projection methods. Skilled labour includes the population
with completed tertiary education. This data set takes into account fertility, mortality, and
migration rates for improving the accuracy of population projections by education level.
The data and methodology paper can be accessed at:
www.iiasa.ac.at/Research/POP/edu07/index.html?sb=12.
Given actual observation for 2005 are unavailable, the data for 2005 was taken from
the Education Forward Projections dataset for 2000-2050. The data was based on the
Global Education Trend Scenario series which assumes that a country‘s educational
expansion will converge on an expansion trajectory based on the historical global trend.
Identification of the global trend is based on a data driven-judgmental analysis.
To minimise inconsistencies and promote analysis based on real trends as opposed to
difference in accounting methods, we focused on obtaining data from sources which
covered as many countries as possible, over as long a time period as possible. We
examined flows of capital and labour relative to their contribution to output. All measures
for flows are in US dollars (USD). For annual expenditures on capital and labour, we
used GFCF and Total Wage Bill to Value Added. The majority of the data for OECD
countries was taken from the OECD Structural Analysis database (STAN) whenever
available. Gaps in this data and information for non-OECD countries were supplemented
from the UNIDO Industrial Statistics database and the World Bank Trade Production and
Protection database. Remaining gaps in the data were supplemented from national
sources. For Brazilian GFCF, we utilised information from the Annual Industrial Survey
(Pesquisa Industrial annual) from the IBGE website (www.ibge.gov.br). Firm level data
for manufacturing companies was used summing new capital formation with
improvement to existing capital less depreciation. These capital figures were then
converted to USD using OECD MEI exchange rate figures for this period. For South
Africa, GFCF figures were taken from the South African Reserve Bank reporting GFCF
by Economic Activity and these figures were also converted using MEI exchange rates.
34 – THE ROLE OF FACTOR CONTENT IN TRADE: HAVE CHANGES IN FACTOR ENDOWMENTS BEEN REFLECTED IN TRADE PATTERNS AND ON RELATIVE WAGES?
OECD TRADE POLICY WORKING PAPER NO. 109 © OECD 2011
GFCF, Value Added, and employment for China were gathered from the National Bureau
of Statistics of China from the Statistical Yearbooks. The Employment data was collected
from the employment breakdown by sector for manufacturing, the GFCF was taken from
the GDP by expenditure series, and Value Added were supplied by the OECD‘s
Economics Department from staff calculations based on other national sources. Indian
employment data were taken from the IPUMS micro data set put together by the
University of Michigan. This survey data provided employment information by sector for
1983, 1987, 1993, 1999, and 2004. Despite these efforts, some gaps in the data persist.
Data for GFCF was unavailable for Switzerland, Russia and Slovenia. For Total Wage
Bill data is missing for Switzerland.
For the labour productivity calculations of output per worker, we used World Bank
World Development Indicators of total labour force and GDP in constant USD 2000.
Ideally, a measure of GDP per hour worked would have been useful, but no complete
cross country data on this was available at this time.
Table 1. K/L Ratios (units of capital per worker)
1990 1995 2000 2005
Argentina 25,027.71 24,963.70 29,031.27 50,603.00
Australia 47,984.56 61,242.59 88,428.75 86,917.43
Austria 57,194.21 58,169.80 93,797.58 85,366.51
Belgium 50,858.29 54,773.70 87,223.29 82,072.87
Brazil 14,132.71 13,384.56 17,211.65 15,265.45
Canada 50,295.96 68,773.98 80,592.82 86,509.98
Chile 11,684.57 16,876.81 28,857.29 39,020.01
China 2,952.20 5,395.86 8,058.30 12,227.42
Denmark 39,962.64 46,209.82 79,870.82 79,840.02
Egypt 76,815.51 225,185.86 241,848.62 480,194.61
Finland 43,975.70 57,751.91 83,365.83 80,671.47
France 45,368.80 50,476.94 77,715.92 70,750.18
Germany 48,851.79 49,130.41 81,723.22 78,734.96
Greece 37,986.96 37,348.82 51,380.99 52,461.02
Hong Kong 75,947.57 72,881.85 89,190.55 145,027.86
Hungary 20,165.43 20,435.05 30,742.68 25,484.41
India 1,850.13 2,881.34 3,984.30 4,886.38
Indonesia 4,281.83 5,651.73 6,874.12 6,363.64
Ireland 61,722.61 64,024.78 81,884.87 69,686.52
Italy 44,856.61 63,760.25 83,875.00 74,241.22
Japan 100,880.79 85,978.13 113,901.52 154,905.53
Korea 33,734.85 47,120.84 74,320.59 84,208.53
Luxembourg 80,649.34 86,609.02 149,730.57 156,249.59
Malaysia 15,195.45 21,906.55 34,021.57 39,200.30
Mexico 29,410.47 31,616.46 27,388.87 29,331.40
Netherlands 44,255.00 47,810.81 81,938.65 74,322.11
New Zealand 31,235.44 31,388.73 51,478.27 44,276.85
Norway 76,736.90 84,318.14 119,675.21 103,074.56
Philippines 8,861.40 6,830.86 9,543.59 11,249.90
Portugal 36,187.41 40,573.54 62,153.61 56,041.40
South Africa 8,494.66 8,133.53 11,114.74 9,628.17
Spain 37,803.89 49,149.74 70,906.96 59,273.93
Sweden 35,430.95 47,968.19 64,550.95 67,691.21
Switzerland 67,252.81 77,852.19 113,644.83 110,233.74
Thailand 14,866.11 21,422.33 28,313.13 27,519.37
United Kingdom 33,708.74 47,202.73 57,644.77 63,919.79
United States 64,482.50 77,559.25 94,770.41 118,937.69
THE ROLE OF FACTOR CONTENT IN TRADE: HAVE CHANGES IN FACTOR ENDOWMENTS BEEN REFLECTED IN TRADE PATTERNS AND ON RELATIVE WAGES?– 35
OECD TRADE POLICY WORKING PAPER NO. 109 © OECD 2011
Trends in factor content
This section relies primarily on data from the Global Trade Analysis Project (GTAP).
This publicly available, completely documented (Dimaranan and McDougall (2002) and
Badri and Walmsley (2008)) database provides input-output tables for between 45 and
85 countries (depending on the database version), 57 sectors and five factors of
production. It consists of independently complied country-specific input-output tables
(thus allowing us to recover country-specific technology matrices) which are reconciled
to bilateral trade data and other statistics. The data have been through seven public
releases and have been extensively tested by members of the GTAP consortium and other
researchers.
In order to observe the factor content in different time periods, we use three of the
GTAP databases to derive the necessary components of this part of our analysis. These
databases are version 5, corresponding to a base year of 1997; version 6 corresponding to
a base year of 2001 and version 7, corresponding to a base year of 2004. To cover as
many countries and sectors in a consistent manner, GTAP measurements are made in
value terms (US$). This allows the consistent basis from which to compare outcomes
across countries. While we do acknowledge the well known shortcomings of measuring
economic variables in USD (as well as the shortcomings of other measures such a PPP),
we believe the value in obtaining an internally consistent database outweighs any
potential bias introduced in our figures.
Table 2 presents the primary regions covered in our analysis and the corresponding
year of the base input-output data for each database version. Table 3 presents the sectors
included in the analysis.
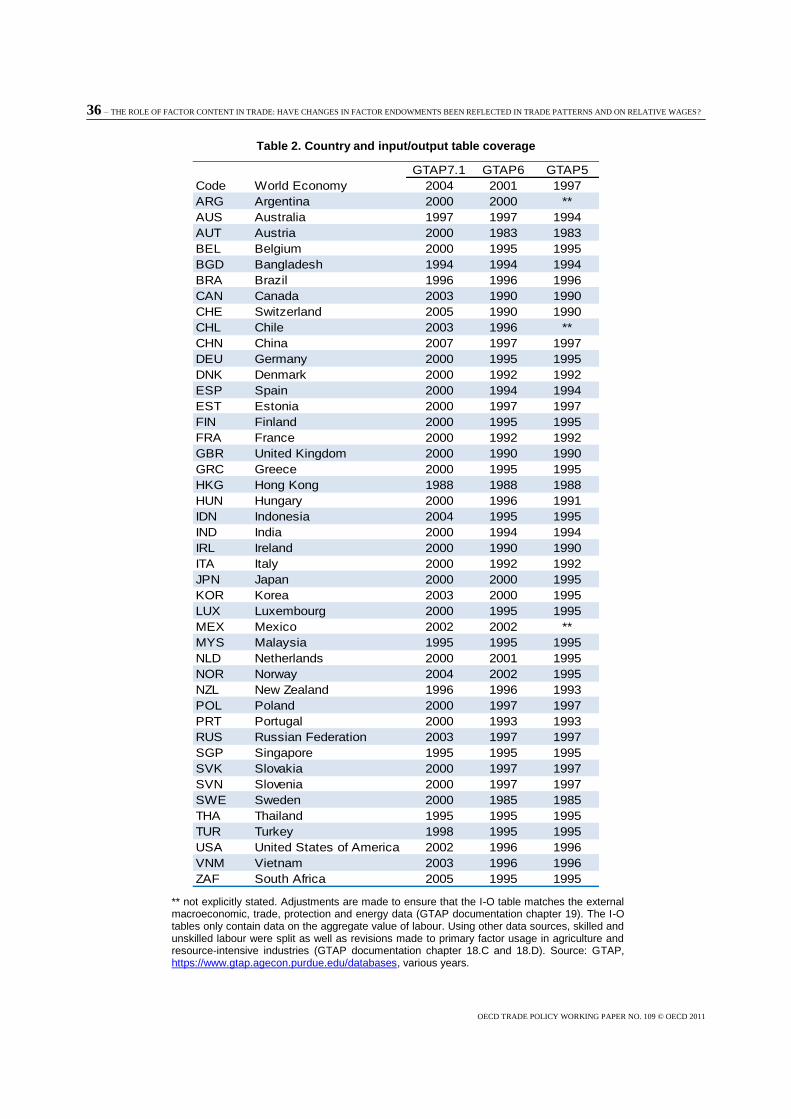
36 – THE ROLE OF FACTOR CONTENT IN TRADE: HAVE CHANGES IN FACTOR ENDOWMENTS BEEN REFLECTED IN TRADE PATTERNS AND ON RELATIVE WAGES?
OECD TRADE POLICY WORKING PAPER NO. 109 © OECD 2011
Table 2. Country and input/output table coverage
GTAP7.1 GTAP6 GTAP5
Code World Economy 2004 2001 1997
ARG Argentina 2000 2000 **
AUS Australia 1997 1997 1994
AUT Austria 2000 1983 1983
BEL Belgium 2000 1995 1995
BGD Bangladesh 1994 1994 1994
BRA Brazil 1996 1996 1996
CAN Canada 2003 1990 1990
CHE Switzerland 2005 1990 1990
CHL Chile 2003 1996 **
CHN China 2007 1997 1997
DEU Germany 2000 1995 1995
DNK Denmark 2000 1992 1992
ESP Spain 2000 1994 1994
EST Estonia 2000 1997 1997
FIN Finland 2000 1995 1995
FRA France 2000 1992 1992
GBR United Kingdom 2000 1990 1990
GRC Greece 2000 1995 1995
HKG Hong Kong 1988 1988 1988
HUN Hungary 2000 1996 1991
IDN Indonesia 2004 1995 1995
IND India 2000 1994 1994
IRL Ireland 2000 1990 1990
ITA Italy 2000 1992 1992
JPN Japan 2000 2000 1995
KOR Korea 2003 2000 1995
LUX Luxembourg 2000 1995 1995
MEX Mexico 2002 2002 **
MYS Malaysia 1995 1995 1995
NLD Netherlands 2000 2001 1995
NOR Norway 2004 2002 1995
NZL New Zealand 1996 1996 1993
POL Poland 2000 1997 1997
PRT Portugal 2000 1993 1993
RUS Russian Federation 2003 1997 1997
SGP Singapore 1995 1995 1995
SVK Slovakia 2000 1997 1997
SVN Slovenia 2000 1997 1997
SWE Sweden 2000 1985 1985
THA Thailand 1995 1995 1995
TUR Turkey 1998 1995 1995
USA United States of America 2002 1996 1996
VNM Vietnam 2003 1996 1996
ZAF South Africa 2005 1995 1995
** not explicitly stated. Adjustments are made to ensure that the I-O table matches the external macroeconomic, trade, protection and energy data (GTAP documentation chapter 19). The I-O tables only contain data on the aggregate value of labour. Using other data sources, skilled and unskilled labour were split as well as revisions made to primary factor usage in agriculture and resource-intensive industries (GTAP documentation chapter 18.C and 18.D). Source: GTAP, https://www.gtap.agecon.purdue.edu/databases, various years.
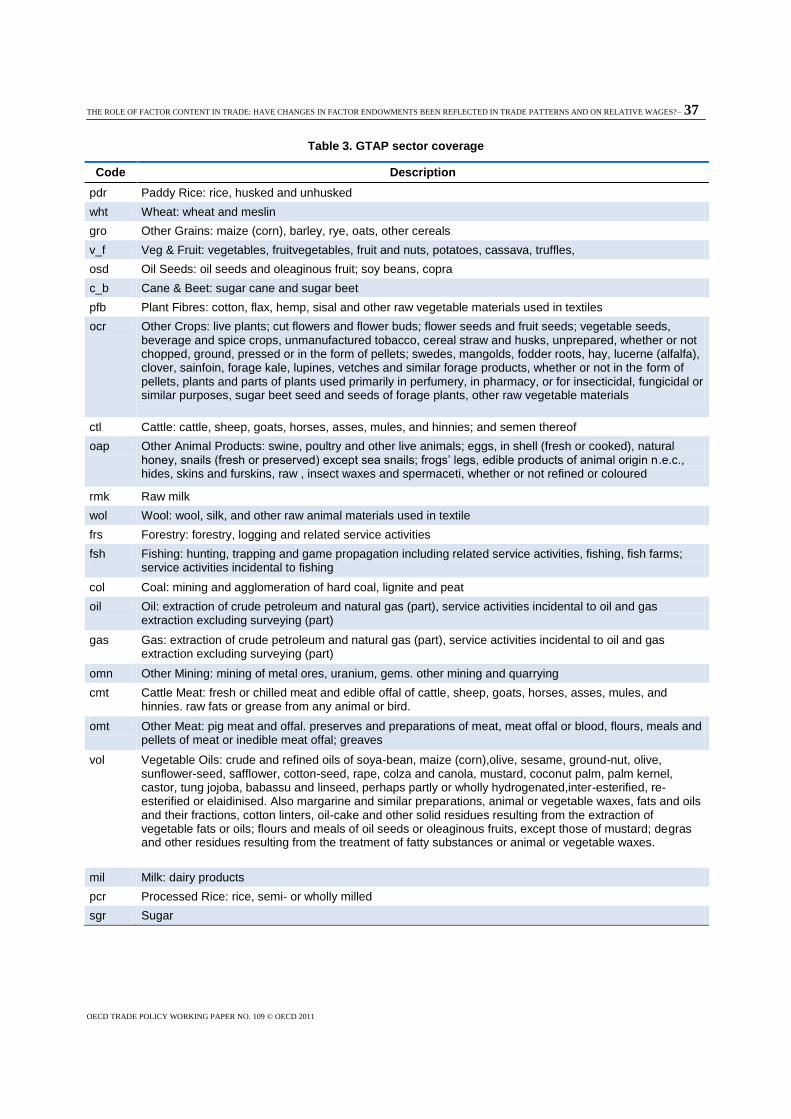
THE ROLE OF FACTOR CONTENT IN TRADE: HAVE CHANGES IN FACTOR ENDOWMENTS BEEN REFLECTED IN TRADE PATTERNS AND ON RELATIVE WAGES?– 37
OECD TRADE POLICY WORKING PAPER NO. 109 © OECD 2011
Table 3. GTAP sector coverage
Code Description
pdr Paddy Rice: rice, husked and unhusked
wht Wheat: wheat and meslin
gro Other Grains: maize (corn), barley, rye, oats, other cereals
v_f Veg & Fruit: vegetables, fruitvegetables, fruit and nuts, potatoes, cassava, truffles,
osd Oil Seeds: oil seeds and oleaginous fruit; soy beans, copra
c_b Cane & Beet: sugar cane and sugar beet
pfb Plant Fibres: cotton, flax, hemp, sisal and other raw vegetable materials used in textiles
ocr Other Crops: live plants; cut flowers and flower buds; flower seeds and fruit seeds; vegetable seeds, beverage and spice crops, unmanufactured tobacco, cereal straw and husks, unprepared, whether or not chopped, ground, pressed or in the form of pellets; swedes, mangolds, fodder roots, hay, lucerne (alfalfa), clover, sainfoin, forage kale, lupines, vetches and similar forage products, whether or not in the form of pellets, plants and parts of plants used primarily in perfumery, in pharmacy, or for insecticidal, fungicidal or similar purposes, sugar beet seed and seeds of forage plants, other raw vegetable materials
ctl Cattle: cattle, sheep, goats, horses, asses, mules, and hinnies; and semen thereof
oap Other Animal Products: swine, poultry and other live animals; eggs, in shell (fresh or cooked), natural honey, snails (fresh or preserved) except sea snails; frogs’ legs, edible products of animal origin n.e.c., hides, skins and furskins, raw , insect waxes and spermaceti, whether or not refined or coloured
rmk Raw milk
wol Wool: wool, silk, and other raw animal materials used in textile
frs Forestry: forestry, logging and related service activities
fsh Fishing: hunting, trapping and game propagation including related service activities, fishing, fish farms; service activities incidental to fishing
col Coal: mining and agglomeration of hard coal, lignite and peat
oil Oil: extraction of crude petroleum and natural gas (part), service activities incidental to oil and gas extraction excluding surveying (part)
gas Gas: extraction of crude petroleum and natural gas (part), service activities incidental to oil and gas extraction excluding surveying (part)
omn Other Mining: mining of metal ores, uranium, gems. other mining and quarrying
cmt Cattle Meat: fresh or chilled meat and edible offal of cattle, sheep, goats, horses, asses, mules, and hinnies. raw fats or grease from any animal or bird.
omt Other Meat: pig meat and offal. preserves and preparations of meat, meat offal or blood, flours, meals and pellets of meat or inedible meat offal; greaves
vol Vegetable Oils: crude and refined oils of soya-bean, maize (corn),olive, sesame, ground-nut, olive, sunflower-seed, safflower, cotton-seed, rape, colza and canola, mustard, coconut palm, palm kernel, castor, tung jojoba, babassu and linseed, perhaps partly or wholly hydrogenated,inter-esterified, re-esterified or elaidinised. Also margarine and similar preparations, animal or vegetable waxes, fats and oils and their fractions, cotton linters, oil-cake and other solid residues resulting from the extraction of vegetable fats or oils; flours and meals of oil seeds or oleaginous fruits, except those of mustard; degras and other residues resulting from the treatment of fatty substances or animal or vegetable waxes.
mil Milk: dairy products
pcr Processed Rice: rice, semi- or wholly milled
sgr Sugar
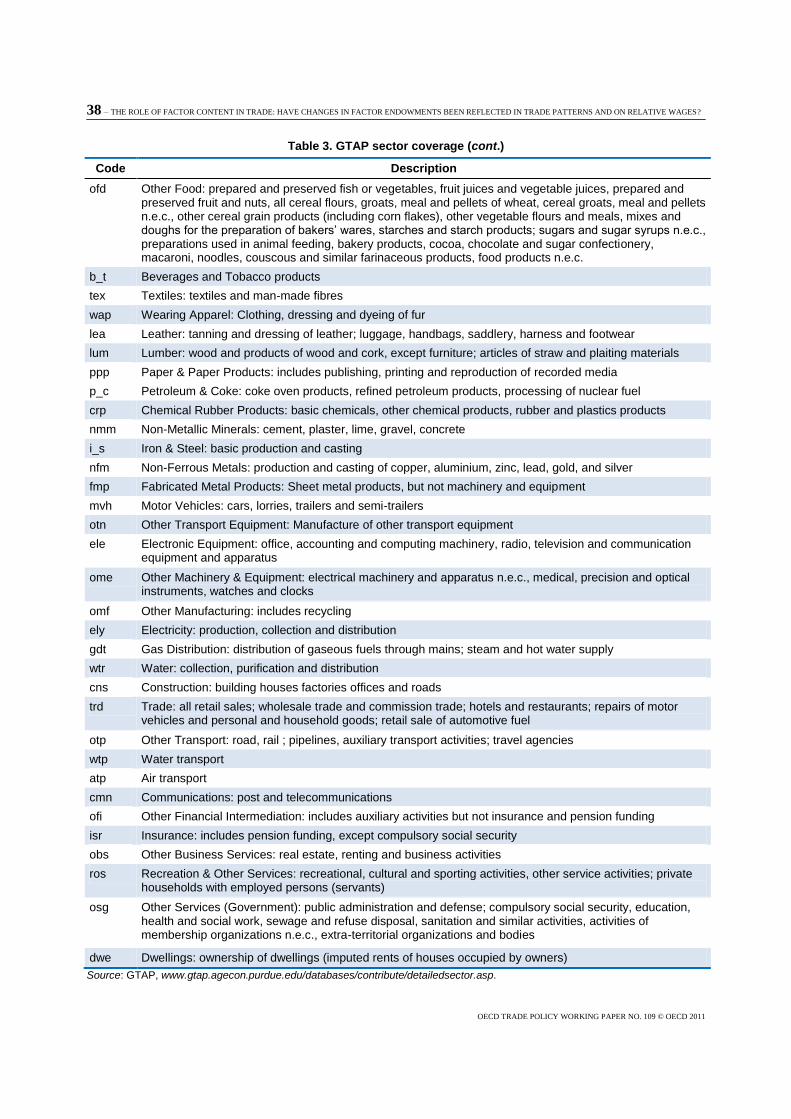
38 – THE ROLE OF FACTOR CONTENT IN TRADE: HAVE CHANGES IN FACTOR ENDOWMENTS BEEN REFLECTED IN TRADE PATTERNS AND ON RELATIVE WAGES?
OECD TRADE POLICY WORKING PAPER NO. 109 © OECD 2011
Table 3. GTAP sector coverage (cont.)
Code Description
ofd Other Food: prepared and preserved fish or vegetables, fruit juices and vegetable juices, prepared and preserved fruit and nuts, all cereal flours, groats, meal and pellets of wheat, cereal groats, meal and pellets n.e.c., other cereal grain products (including corn flakes), other vegetable flours and meals, mixes and doughs for the preparation of bakers’ wares, starches and starch products; sugars and sugar syrups n.e.c., preparations used in animal feeding, bakery products, cocoa, chocolate and sugar confectionery, macaroni, noodles, couscous and similar farinaceous products, food products n.e.c.
b_t Beverages and Tobacco products
tex Textiles: textiles and man-made fibres
wap Wearing Apparel: Clothing, dressing and dyeing of fur
lea Leather: tanning and dressing of leather; luggage, handbags, saddlery, harness and footwear
lum Lumber: wood and products of wood and cork, except furniture; articles of straw and plaiting materials
ppp Paper & Paper Products: includes publishing, printing and reproduction of recorded media
p_c Petroleum & Coke: coke oven products, refined petroleum products, processing of nuclear fuel
crp Chemical Rubber Products: basic chemicals, other chemical products, rubber and plastics products
nmm Non-Metallic Minerals: cement, plaster, lime, gravel, concrete
i_s Iron & Steel: basic production and casting
nfm Non-Ferrous Metals: production and casting of copper, aluminium, zinc, lead, gold, and silver
fmp Fabricated Metal Products: Sheet metal products, but not machinery and equipment
mvh Motor Vehicles: cars, lorries, trailers and semi-trailers
otn Other Transport Equipment: Manufacture of other transport equipment
ele Electronic Equipment: office, accounting and computing machinery, radio, television and communication equipment and apparatus
ome Other Machinery & Equipment: electrical machinery and apparatus n.e.c., medical, precision and optical instruments, watches and clocks
omf Other Manufacturing: includes recycling
ely Electricity: production, collection and distribution
gdt Gas Distribution: distribution of gaseous fuels through mains; steam and hot water supply
wtr Water: collection, purification and distribution
cns Construction: building houses factories offices and roads
trd Trade: all retail sales; wholesale trade and commission trade; hotels and restaurants; repairs of motor vehicles and personal and household goods; retail sale of automotive fuel
otp Other Transport: road, rail ; pipelines, auxiliary transport activities; travel agencies
wtp Water transport
atp Air transport
cmn Communications: post and telecommunications
ofi Other Financial Intermediation: includes auxiliary activities but not insurance and pension funding
isr Insurance: includes pension funding, except compulsory social security
obs Other Business Services: real estate, renting and business activities
ros Recreation & Other Services: recreational, cultural and sporting activities, other service activities; private households with employed persons (servants)
osg Other Services (Government): public administration and defense; compulsory social security, education, health and social work, sewage and refuse disposal, sanitation and similar activities, activities of membership organizations n.e.c., extra-territorial organizations and bodies
dwe Dwellings: ownership of dwellings (imputed rents of houses occupied by owners)
Source: GTAP, www.gtap.agecon.purdue.edu/databases/contribute/detailedsector.asp.
THE ROLE OF FACTOR CONTENT IN TRADE: HAVE CHANGES IN FACTOR ENDOWMENTS BEEN REFLECTED IN TRADE PATTERNS AND ON RELATIVE WAGES?– 39
OECD TRADE POLICY WORKING PAPER NO. 109 © OECD 2011
Trends in relative wages
The Occupational Wages around the World dataset by Richard Freeman and Remco
Oostendorp was used to examine wages and occupations. Freeman and Oostendorp
transformed the International Labour Organization‘s October Inquiry Survey into a
consistent data file on pay for 161 occupations in over 150 countries from 1983 to 2003.
The standardization allowed for comparison across countries circumventing measurement
problems such as differences in reporting units, quality of reporting sources, wage levels,
and any other country specific issues. The wages are reported in domestic currency units
and in US dollars. The figures employed were in US dollars and deflated using the
deflators in the Penn World Tables to account for purchasing power parity issues. The
following tables present the countries, industries, and occupations used in the wage
analysis.
40 – THE ROLE OF FACTOR CONTENT IN TRADE: HAVE CHANGES IN FACTOR ENDOWMENTS BEEN REFLECTED IN TRADE PATTERNS AND ON RELATIVE WAGES?
OECD TRADE POLICY WORKING PAPER NO. 109 © OECD 2011
Table 4. Countries and Industries – wage
Country Name Industry Name
Argentina Agricultural production (field crops)
Austria Plantations
Australia Forestry
Bangladesh Logging
Belgium Deep-sea and coastal fishing
Bulgaria Coalmining
Brazil Crude petroleum and natural gas production
Canada Other mining and quarrying
Chile Slaughtering, preparing and preserving meat
China Manufacture of dairy products
Czechoslovakia Grain mill products
Czech Republic Manufacture of bakery products
Germany Spinning, weaving and finishing textiles
Denmark Manufacture of wearing apparel (except footwear)
Estonia Manufacture of leather and leather products (except footwear)
Finland Manufacture of footwear
France Sawmills, planing and other wood mills
United Kingdom Manufacture of wooden furniture and fixtures
Hong Kong Manufacture of pulp, paper and paperboard
Hungary Printing, publishing and allied industries
Ireland Manufacture of industrial chemicals
India Manufacture of other chemical products
Iceland Petroleum refineries
Italy Iron and steel basic industries
Japan Manufacture of metal products (except machinery and equipment)
Korea, Republic of Manufacture of machinery (except electrical)
Kazachstan Manufacture of electronic equipment, machinery and supplies
Luxembourg Shipbuilding and repairing
Mexico Electric light and power
Netherlands Construction
Norway Wholesale trade (grocery)
New Zealand Retail trade (grocery)
Philippines Restaurants and hotels
Poland Railway transport
Portugal Passenger transport by road
Romania Freight transport by road
Russian Federation Maritime transport
Sweden Supporting services to maritime transport
Singapore Air transport
Slovakia Supporting services to air transport
Thailand Communication
Turkey Banks
Taiwan Insurance
Ukraine Engineering and architectural services
United States Public administration
South Africa Sanitary services
Education services
Medical and dental services
Repair of motor vehicles
THE ROLE OF FACTOR CONTENT IN TRADE: HAVE CHANGES IN FACTOR ENDOWMENTS BEEN REFLECTED IN TRADE PATTERNS AND ON RELATIVE WAGES?– 41
OECD TRADE POLICY WORKING PAPER NO. 109 © OECD 2011
Table 5. Occupations in the occupational wages around the world*
Farm supervisor Mixing- and blending-machine operator Bus conductor
Field crop farm worker Labourer Automobile mechanic
Plantation supervisor Mixing- and blending-machine operator Motor bus driver
Plantation worker Packer Urban motor truck driver
Forest supervisor Labourer Long-distance motor truck driver
Forestry worker Controlman Ship's chief engineer
Logger Occupational health nurse Ship's steward (passenger)
Tree feller and bucker Blast furnaceman (ore smelting) Able seaman
Deep-sea fisherman Hot-roller (steel) Dock worker
Inshore (coastal) maritime fisherman Metal melter Air transport pilot
Coalmining engineer Labourer Flight operations officer
Miner Metalworking machine setter Airline ground receptionist
Underground helper, loader Welder Aircraft cabin attendant
Petroleum and natural gas engineer Bench moulder (metal) Aircraft engine mechanic
Petroleum and natural gas extraction technician Machinery fitter-assembler Aircraft loader
Supervisor or general foreman Labourer Air traffic controller
Derrickman Electronics draughtsman Aircraft accident fire-fighter
Miner Electronics engineering technician Post office counter clerk
Quarryman Electronics fitter Postman
Butcher Electronic equipment assembler Telephone switchboard operator
Packer Ship plater Accountant
Dairy product processor Power distribution and transmission engineer Stenographer-typist
Grain miller Office clerk Bank teller
Baker (ovenman) Electric power lineman Book-keeping machine operator
Thread and yarn spinner Power-generating machinery operator Computer programmer
Loom fixer, tuner Labourer Stenographer-typist
Cloth weaver (machine) Building electrician Card- and tape-punching- machine operator
Labourer Plumber Insurance agent
Garment cutter Constructional steel erector Clerk of works
Sewing-machine operator Building painter Computer programmer
Tanner Bricklayer (construction) Government executive official:
Leather goods maker Reinforced concreter Stenographer-typist
Clicker cutter (machine) Cement finisher Card- and tape-punching- machine operator
Laster Construction carpenter Office clerk
Shoe sewer (machine) Plasterer Fire-fighter
Sawmill sawyer Labourer Refuse collector
Veneer cutter Stenographer-typist Mathematics teacher (third level)
Plywood press operator Stock records clerk Teacher in languages and literature (third level)
Furniture upholsterer Salesperson Teacher in languages and literature (second level)
Cabinetmaker Book-keeper Mathematics teacher (second level)
Wooden furniture finisher Cash desk cashier Technical education teacher (second level)
Wood grinder Salesperson First-level education teacher
Paper-making-machine operator (wet end) Hotel receptionist Kindergarten teacher
Journalist Cook General physician
Stenographer-typist Waiter Dentist (general)
Office clerk Room attendant or chambermaid Professional nurse (general)
Hand compositor Ticket seller (cash desk cashier) Auxiliary nurse
Machine compositor Railway services supervisor Physiotherapist
Printing pressman Railway passenger train guard Medical X-ray technician
Bookbinder (machine) Railway vehicle loader Ambulance driver
Labourer Railway engine-driver Automobile mechanic
Chemical engineer Railway steam-engine fireman Pattern makers (wood)
Chemistry technician Railway signalman Permanent way labourers
Supervisor or general foreman Road transport services supervisor Labourers (unskilled, public parks and gardens)
* Dataset by Freeman and Oostendorp.
Source: Occupational Wages around the World Dataset.
42 – THE ROLE OF FACTOR CONTENT IN TRADE: HAVE CHANGES IN FACTOR ENDOWMENTS BEEN REFLECTED IN TRADE PATTERNS AND ON RELATIVE WAGES?
OECD TRADE POLICY WORKING PAPER NO. 109 © OECD 2011
Table 6. Concordance between GTAP and occupational wages around the world industry classifications
Industry Name GTAP sectors ISIC-88 rev 3
Agricultural production (field crops) nc available 11
Plantations nc available 11
Forestry nc available 2
Logging nc available 2
Deep-sea and coastal fishing fsh 5
Coalmining col 101
Crude petroleum and natural gas production oil 111/112
Other mining and quarrying omn 141/142
Slaughtering, preparing and preserving meat nc available 1511
Manufacture of dairy products nc available 152
Grain mill products nc available 1531
Manufacture of bakery products nc available 1541
Spinning, weaving and finishing textiles tex 171
Manufacture of wearing apparel (except footwear) wap 181
Manufacture of leather and leather products (except footwear) lea 191
Manufacture of footwear lea 192
Sawmills, planing and other wood mills lum 201
Manufacture of wooden furniture and fixtures omf 361
Manufacture of pulp, paper and paperboard ppp 211
Printing, publishing and allied industries ppp 22
Manufacture of industrial chemicals crp 241
Manufacture of other chemical products crp 242
Petroleum refineries p_c 232
Iron and steel basic industries i_s 271+2731
Manufacture of metal products (except machinery and equipment) fmp 28
Manufacture of machinery (except electrical) ome 29
Manufacture of electronic equipment, machinery and supplies ome 31
Shipbuilding and repairing otn 351
Electric light and power ely 401
Construction cns 45
Wholesale trade (grocery) trd 512
Retail trade (grocery) trd 522
Restaurants and hotels trd 55
Railway transport otp 601
Passenger transport by road otp 6021
Freight transport by road otp 6023
Maritime transport wtp 611
Supporting services to maritime transport otp 630
Air transport atp 62
Supporting services to air transport otp 6303
Communication cmn 64
Banks ofi 651
Insurance isr 660
Engineering and architectural services nc available 742
Public administration osg 75
Sanitary services osg 90
Education services osg 80
Medical and dental services osg 851
Repair of motor vehicles trd 502
THE ROLE OF FACTOR CONTENT IN TRADE: HAVE CHANGES IN FACTOR ENDOWMENTS BEEN REFLECTED IN TRADE PATTERNS AND ON RELATIVE WAGES?– 43
OECD TRADE POLICY WORKING PAPER NO. 109 © OECD 2011
Technical Annex
The theory
The theory of trade and comparative advantage has a long tradition in the economics
profession. Starting with Ricardo (whose theory predicts that a country will export
products in which it has a comparative advantage, that is, where its labour productivity is
high relative to its labour productivity in other products. The theory moved on to
Heckscher (1919) and Ohlin (1933) who emphasized the role of labour, capital and land
in explaining how their availability shapes a country‘s pattern of specialisation and hence
their comparative advantage. Samuelson (1948) (and others) developed the two-factor,
two-sector model that became the standard for trade theory leading to the version of the
H-O model where a capital rich country – that is, one that has more capital per worker
than its trade partners – should export capital-intensive products.
Leontief (1953) calculated the labour-output and capital-output ratios for various
sectors in the United States economy and then calculated how much of these factors were
embodied in US exports and imports. He found that the capital-labour ratio of US imports
exceeded the ratio embodied in exports by 60%. This finding became known as the
―Leontief paradox‖. While the next several decades were devoted to solving this paradox,
a test of the generalised H-O theory was elusive due to the fact that the theory predicts the
relationship between endowments and trade within a certain technological structure. Thus
to test the theory, one needs information on technology, endowments and trade.
Vanek (1968) shows that under the HO model‘s assumptions, using a common
technology matrix, the Leontief measure of factor content should equal the economy‘s
measure of factor abundance. That is, the total factor content of a country‘s production
(equal to that country‘s endowments) minus the factor content of its consumption should
provide a measure of factor abundance where those factors that are relatively abundant
are exported and those that are scarce are imported. This became known as the HOV
model.
Work that followed focused on identifying the gap between measured factor content
of trade and the HO theoretically predicted value. Trefler (1995) was one of the first to
show clearly the ways in which the data used to measure the theory deviates from the
predictions of the model. Most of the subsequent work focused on the deviation of the
common technology matrix and the inclusion of trade in intermediate inputs. This body of
work (see, for example Davis and Weinstein (2001), Hakura (2001), Trefler and Zhu
(2000, 2010) and Reimer (2006)) has shown the importance of incorporating these
aspects when examining factor content of trade.
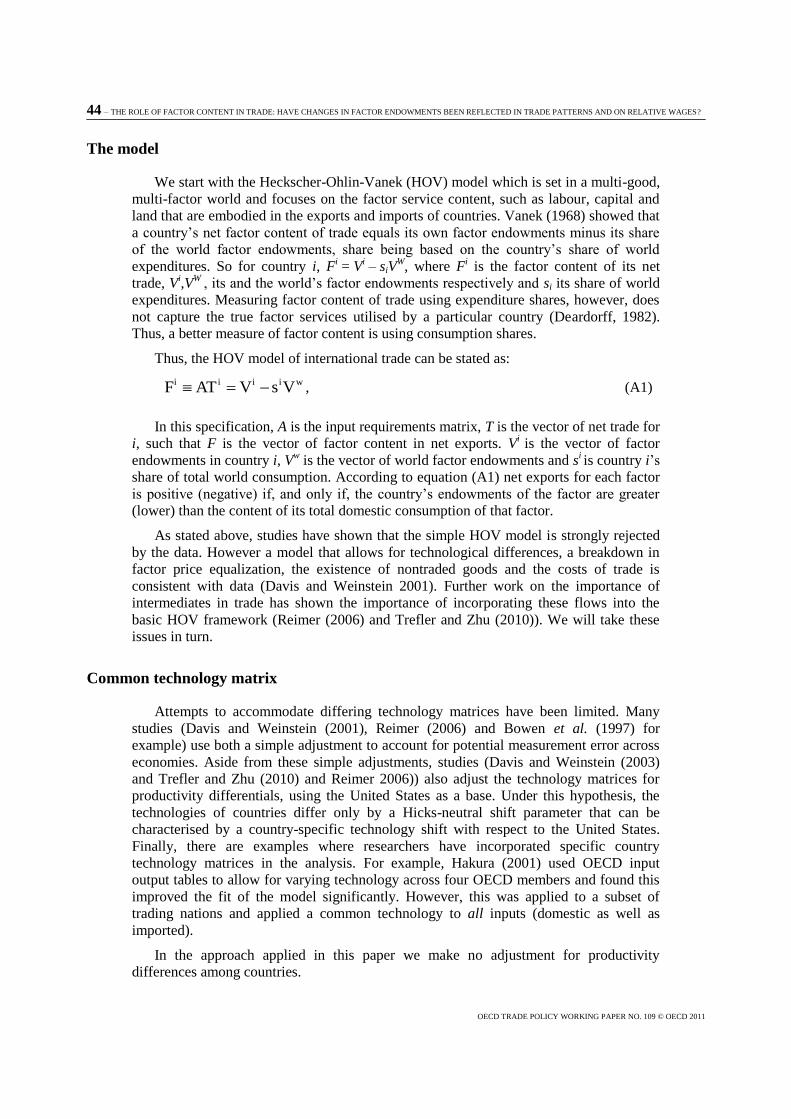
44 – THE ROLE OF FACTOR CONTENT IN TRADE: HAVE CHANGES IN FACTOR ENDOWMENTS BEEN REFLECTED IN TRADE PATTERNS AND ON RELATIVE WAGES?
OECD TRADE POLICY WORKING PAPER NO. 109 © OECD 2011
The model
We start with the Heckscher-Ohlin-Vanek (HOV) model which is set in a multi-good,
multi-factor world and focuses on the factor service content, such as labour, capital and
land that are embodied in the exports and imports of countries. Vanek (1968) showed that
a country‘s net factor content of trade equals its own factor endowments minus its share
of the world factor endowments, share being based on the country‘s share of world
expenditures. So for country i, Fi = V
i – siV
W, where F
i is the factor content of its net
trade, Vi,V
W , its and the world‘s factor endowments respectively and si its share of world
expenditures. Measuring factor content of trade using expenditure shares, however, does
not capture the true factor services utilised by a particular country (Deardorff, 1982).
Thus, a better measure of factor content is using consumption shares.
Thus, the HOV model of international trade can be stated as:
wiiii VsVATF , (A1)
In this specification, A is the input requirements matrix, T is the vector of net trade for
i, such that F is the vector of factor content in net exports. Vi is the vector of factor
endowments in country i, Vw is the vector of world factor endowments and s
i is country i‘s
share of total world consumption. According to equation (A1) net exports for each factor
is positive (negative) if, and only if, the country‘s endowments of the factor are greater
(lower) than the content of its total domestic consumption of that factor.
As stated above, studies have shown that the simple HOV model is strongly rejected
by the data. However a model that allows for technological differences, a breakdown in
factor price equalization, the existence of nontraded goods and the costs of trade is
consistent with data (Davis and Weinstein 2001). Further work on the importance of
intermediates in trade has shown the importance of incorporating these flows into the
basic HOV framework (Reimer (2006) and Trefler and Zhu (2010)). We will take these
issues in turn.
Common technology matrix
Attempts to accommodate differing technology matrices have been limited. Many
studies (Davis and Weinstein (2001), Reimer (2006) and Bowen et al. (1997) for
example) use both a simple adjustment to account for potential measurement error across
economies. Aside from these simple adjustments, studies (Davis and Weinstein (2003)
and Trefler and Zhu (2010) and Reimer 2006)) also adjust the technology matrices for
productivity differentials, using the United States as a base. Under this hypothesis, the
technologies of countries differ only by a Hicks-neutral shift parameter that can be
characterised by a country-specific technology shift with respect to the United States.
Finally, there are examples where researchers have incorporated specific country
technology matrices in the analysis. For example, Hakura (2001) used OECD input
output tables to allow for varying technology across four OECD members and found this
improved the fit of the model significantly. However, this was applied to a subset of
trading nations and applied a common technology to all inputs (domestic as well as
imported).
In the approach applied in this paper we make no adjustment for productivity
differences among countries.
THE ROLE OF FACTOR CONTENT IN TRADE: HAVE CHANGES IN FACTOR ENDOWMENTS BEEN REFLECTED IN TRADE PATTERNS AND ON RELATIVE WAGES?– 45
OECD TRADE POLICY WORKING PAPER NO. 109 © OECD 2011
First, studies examining the factor content generally look at a subset of countries and
thus apply a common reference base (either technology matrix or productivity
adjustment). For example, Reimer examines the factor content of trade in the context of
two entities: the United States, and an agglomeration of technology matrices for the rest
of the world (ROW). He then adjusts this ROW matrix for productivity differences with
respect to the base country, the Unites States. In this study, we apply country-specific
technology matrices for each of the economies examined and thus the differences in the
technologies applied in each region are captured in their own technology matrices.
On a more practical basis, the primary reason for the implementation of this
adjustment in the literature is to improve the performance of their measured factor content
when tested against the theoretically predicted value. It is not the purpose of this work to
test the validity of the HOV model. Indeed, as briefly outlined above and in much more
detail in the various works cited, this service has been performed. Rather we are using the
model to measure factor content and fully expect these values to diverge precisely based
on their productivity differentials. To do a prior adjustment for these differences is to
reduce the information available in the measured values themselves.
Factor price equalisation
The failure of factor price equalisation (FPE) can lead to important differences in the
technology matrices for traded and nontraded goods. The input coefficients differ in
tradables because the failure of FPE has led countries to specialise in different goods.
They differ in nontradables because the same goods are produced with different factor
proportions. To the extent that FPE breaks down, the standard HOV needs to be adjusted
to account for departures in the factor usage of nontrables goods from world averages.
The need to make this adjustment is tied to the standardisation of technology matrices
across countries. Again, we are not applying world averages when inputting our
technology matrices so the adjustment is not as critical for our database. However, this
issue does come into play when determining which data measurement (i.e. values versus
units) arises. If the only reason that factor prices differ is due to factor-augmenting
productivity differences, then we can use the reported values as representative of
efficiency-adjusted factor usage as this measure is well suited for calculations of the input
matrices. However, it is well acknowledged that FPE breaks down for reasons beyond
quality differences. To the extent this breakdown is not captured, it is preferable to
measure factor usage in terms of physical units and adjust for international quality
differences in a different manner.
Converting to physical units poses several problems for the analysis presented here.
First, it dramatically reduces the number of factors available for examination to those
with relevant, observable price information, i.e. total labour and capital. It also removes a
source of information on factor-augmenting productivity differences which, as explained
above, we purposefully make no adjustment for. Finally, as stated above, studies of factor
content are designed to test the differential between fit of the theorectically-constrained
model (for example, under assumptions of the realisation of factor price equalisation) and
measured values. We, on the other hand, are interested in what measured values say about
revealed patterns of trade between countries. The theory often factors away the exact
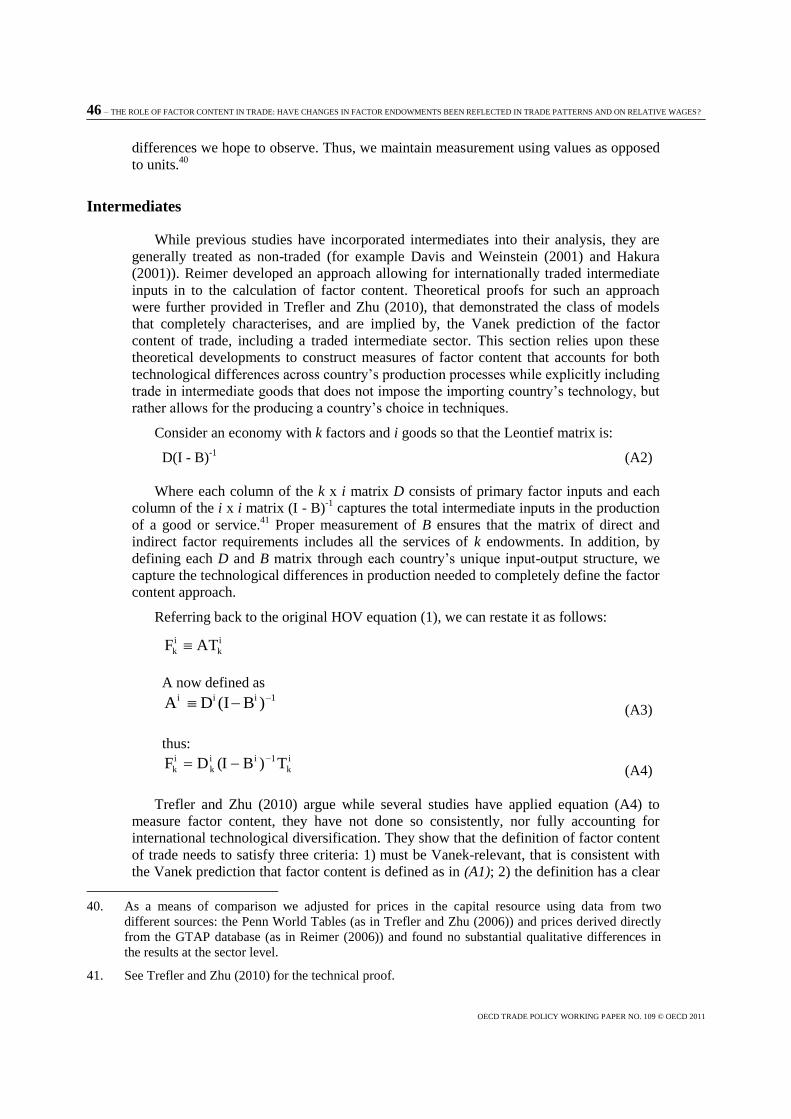
46 – THE ROLE OF FACTOR CONTENT IN TRADE: HAVE CHANGES IN FACTOR ENDOWMENTS BEEN REFLECTED IN TRADE PATTERNS AND ON RELATIVE WAGES?
OECD TRADE POLICY WORKING PAPER NO. 109 © OECD 2011
differences we hope to observe. Thus, we maintain measurement using values as opposed
to units.40
Intermediates
While previous studies have incorporated intermediates into their analysis, they are
generally treated as non-traded (for example Davis and Weinstein (2001) and Hakura
(2001)). Reimer developed an approach allowing for internationally traded intermediate
inputs in to the calculation of factor content. Theoretical proofs for such an approach
were further provided in Trefler and Zhu (2010), that demonstrated the class of models
that completely characterises, and are implied by, the Vanek prediction of the factor
content of trade, including a traded intermediate sector. This section relies upon these
theoretical developments to construct measures of factor content that accounts for both
technological differences across country‘s production processes while explicitly including
trade in intermediate goods that does not impose the importing country‘s technology, but
rather allows for the producing a country‘s choice in techniques.
Consider an economy with k factors and i goods so that the Leontief matrix is:
D(I - B)-1
(A2)
Where each column of the k x i matrix D consists of primary factor inputs and each
column of the i x i matrix (I - B)-1
captures the total intermediate inputs in the production
of a good or service.41
Proper measurement of B ensures that the matrix of direct and
indirect factor requirements includes all the services of k endowments. In addition, by
defining each D and B matrix through each country‘s unique input-output structure, we
capture the technological differences in production needed to completely define the factor
content approach.
Referring back to the original HOV equation (1), we can restate it as follows:
i
k
i
k ATF
A now defined as 1iii )B(IDA (A3)
thus: i
k
1ii
k
i
k T)B(IDF (A4)
Trefler and Zhu (2010) argue while several studies have applied equation (A4) to
measure factor content, they have not done so consistently, nor fully accounting for
international technological diversification. They show that the definition of factor content
of trade needs to satisfy three criteria: 1) must be Vanek-relevant, that is consistent with
the Vanek prediction that factor content is defined as in (A1); 2) the definition has a clear
40. As a means of comparison we adjusted for prices in the capital resource using data from two
different sources: the Penn World Tables (as in Trefler and Zhu (2006)) and prices derived directly
from the GTAP database (as in Reimer (2006)) and found no substantial qualitative differences in
the results at the sector level.
41. See Trefler and Zhu (2010) for the technical proof.
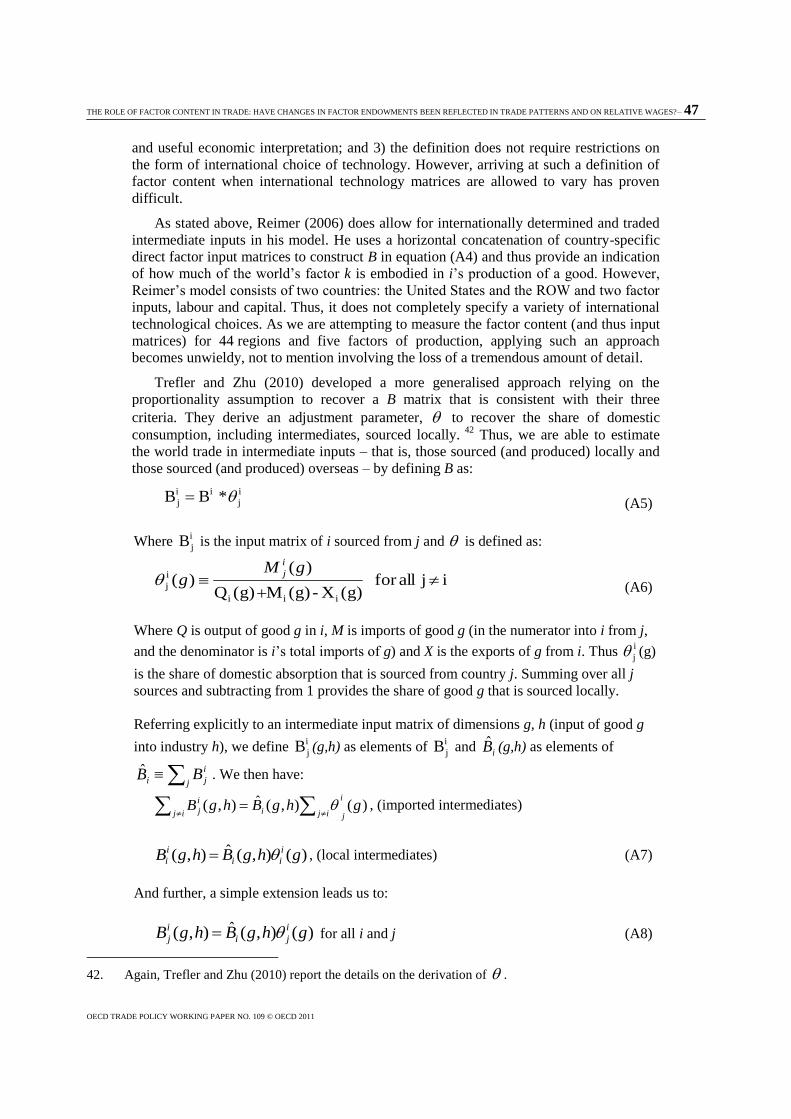
THE ROLE OF FACTOR CONTENT IN TRADE: HAVE CHANGES IN FACTOR ENDOWMENTS BEEN REFLECTED IN TRADE PATTERNS AND ON RELATIVE WAGES?– 47
OECD TRADE POLICY WORKING PAPER NO. 109 © OECD 2011
and useful economic interpretation; and 3) the definition does not require restrictions on
the form of international choice of technology. However, arriving at such a definition of
factor content when international technology matrices are allowed to vary has proven
difficult.
As stated above, Reimer (2006) does allow for internationally determined and traded
intermediate inputs in his model. He uses a horizontal concatenation of country-specific
direct factor input matrices to construct B in equation (A4) and thus provide an indication
of how much of the world‘s factor k is embodied in i‘s production of a good. However,
Reimer‘s model consists of two countries: the United States and the ROW and two factor
inputs, labour and capital. Thus, it does not completely specify a variety of international
technological choices. As we are attempting to measure the factor content (and thus input
matrices) for 44 regions and five factors of production, applying such an approach
becomes unwieldy, not to mention involving the loss of a tremendous amount of detail.
Trefler and Zhu (2010) developed a more generalised approach relying on the
proportionality assumption to recover a B matrix that is consistent with their three
criteria. They derive an adjustment parameter, to recover the share of domestic
consumption, including intermediates, sourced locally. 42
Thus, we are able to estimate
the world trade in intermediate inputs – that is, those sourced (and produced) locally and
those sourced (and produced) overseas – by defining B as:
i
j
ii
j * BB (A5)
Where i
jB is the input matrix of i sourced from j and is defined as:
i j allfor (g)X - (g)M (g)Q
)()(
iii
i
j
gM
g
i
j
(A6)
Where Q is output of good g in i, M is imports of good g (in the numerator into i from j,
and the denominator is i‘s total imports of g) and X is the exports of g from i. Thus i
j (g)
is the share of domestic absorption that is sourced from country j. Summing over all j
sources and subtracting from 1 provides the share of good g that is sourced locally.
Referring explicitly to an intermediate input matrix of dimensions g, h (input of good g
into industry h), we define i
jB (g,h) as elements of i
jB and iB̂ (g,h) as elements of
iB̂ j
i
jB . We then have:
)(),(ˆ),( ghgBhgBi
jijiij
i
j , (imported intermediates)
)(),(ˆ),( ghgBhgB i
ii
i
i , (local intermediates) (A7)
And further, a simple extension leads us to:
)(),(ˆ),( ghgBhgB i
ji
i
j for all i and j (A8)
42. Again, Trefler and Zhu (2010) report the details on the derivation of .
48 – THE ROLE OF FACTOR CONTENT IN TRADE: HAVE CHANGES IN FACTOR ENDOWMENTS BEEN REFLECTED IN TRADE PATTERNS AND ON RELATIVE WAGES?
OECD TRADE POLICY WORKING PAPER NO. 109 © OECD 2011
As expressed in equation (A5), where equation (A5) suppresses the (g,h) reference to
industries. When Trefler and Zhu (2010) applied this adjustment to data for 41 countries,
focusing on labour inputs, their results show a 95% consistency rate with predicted
values, as opposed to the 34% reported in previous studies.
By measuring the amount of factors used worldwide to produce a country‘s trade
flows, we can say that the factor requirements matrix for country i‘s trade is constructed
accounting for the complete production process of each good that enters into net exports
and adding up the factors actually used, including those used in producing intermediate
inputs overseas (Deardorff 1982). This will further allow us to analyse the role of
intermediate inputs in trade, by comparing the F derived in equations (A1) with its
counterpart expressed generally in equation (A4), and adjusted by (A5).
Ranking factor content
In order to better understand the potential drivers of the factor content of trade, it is
important to understand the relative factor endowment structure both within, and
between, countries, and how that has changed over time. According to equation (A1), net
exports of a factor is positive (negative) if the country‘s endowment of the factor is great
(lower) than its content of total domestic consumption, that is if Vik – s
iV
wk >0, for factor k.
Additionally, it is possible to look at a country‘s relative factor abundance (each
endowment relative to other endowments within a country) by examining the variables
normalised by the factor content of the country‘s consumption. Again, from
equation (A1) we can define the following:
sVc w
kk * (A9)
where s remains the country‘s share of world consumption, Vw
k is the world endowment of
factor k and ck is the content of factor k in domestic consumption (Muriel and Terra
2009). The factor abundance test can be compared across the various factors k such that:
'
'
k
i
k
k
i
k
c
V
c
V (A10)
The relationship in (9) states that the content of factor k in net exports is higher
(lower) than that of factor k’ if factor k is relatively more abundant (less abundant); where
factor contents are normalised by domestic consumption. We can also restate these
values, measuring factor abundance by income rather than consumption, adjusting this
value to take account of the trade balance as in Bowen and Sveikauskas (1992). To
account for a country‘s income level (Yi) adjusted by the trade balance (bi) we can restate
ck as follows:
k
ii
ib
k cbY
Yc *
(A11)
and rank each factor accordingly.
THE ROLE OF FACTOR CONTENT IN TRADE: HAVE CHANGES IN FACTOR ENDOWMENTS BEEN REFLECTED IN TRADE PATTERNS AND ON RELATIVE WAGES?– 49
OECD TRADE POLICY WORKING PAPER NO. 109 © OECD 2011
Data
In order to derive the various data points needed to obtain a HOV-consistent measure
of factor content of trade, we need to have consistent measures of world output,
consumption, trade, factors of productions and intermediate inputs. One source which
provides such a database is the Global Trade Analysis Project (GTAP). The details of this
data can be found in the Data Annex.
Wage regressions
The specification for the cross-sectional wage regressions is:
ikik Xy (A12)
where i indexes occupations and k countries;
iky is a vector of observations containing the growth rate of real wages by
occupation by country in the sample;
X is a matrix of observations with its first column containing a vector of ones, the
logarithm of GDP per capita in 1984, and the logarithm of total trade as a share of
GDP in 1984;
ik is the regression‘s error term; and
is a vector of parameters to be estimated.
The parameter estimates are presented in Tables A4, A5, and A6 of the Annex Tables
and Graphs.

THE ROLE OF FACTOR CONTENT IN TRADE: HAVE CHANGES IN FACTOR ENDOWMENTS BEEN REFLECTED IN TRADE PATTERNS AND ON RELATIVE WAGES?– 51
OECD TRADE POLICY WORKING PAPER NO. 109 © OECD 2011
Annex Tables and Graphs
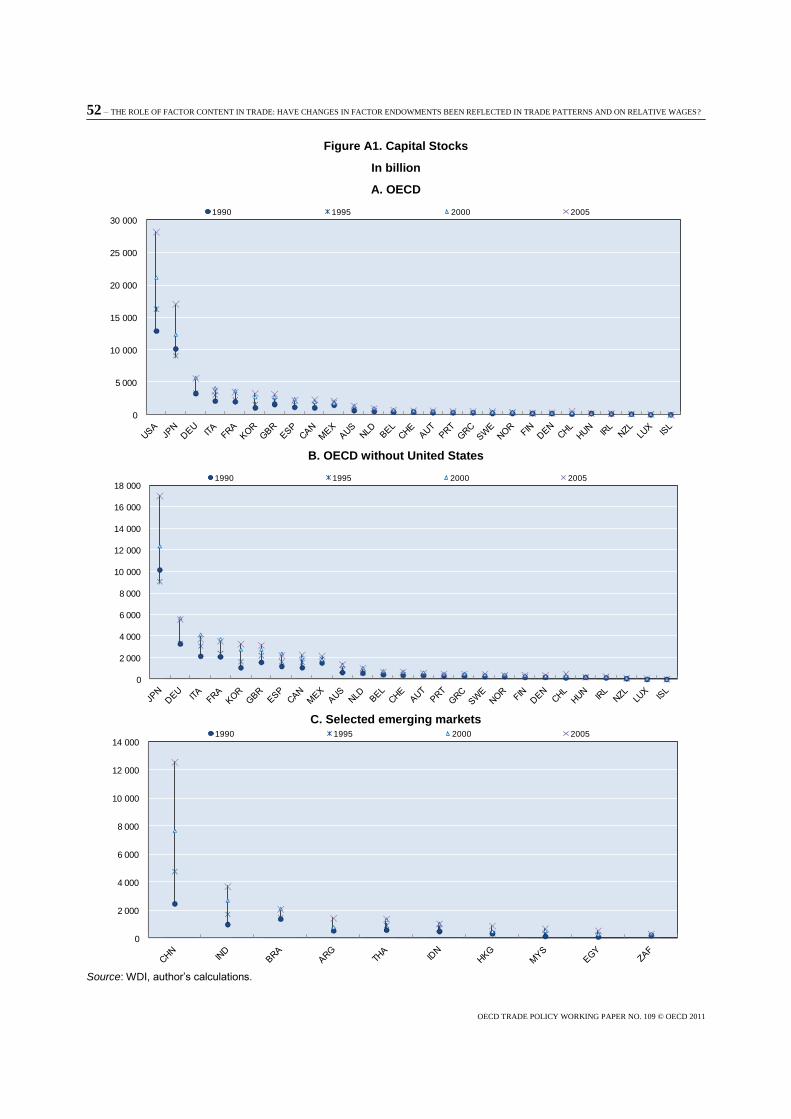
52 – THE ROLE OF FACTOR CONTENT IN TRADE: HAVE CHANGES IN FACTOR ENDOWMENTS BEEN REFLECTED IN TRADE PATTERNS AND ON RELATIVE WAGES?
OECD TRADE POLICY WORKING PAPER NO. 109 © OECD 2011
Figure A1. Capital Stocks
In billion
A. OECD
0
5 000
10 000
15 000
20 000
25 000
30 0001990 1995 2000 2005
B. OECD without United States
0
2 000
4 000
6 000
8 000
10 000
12 000
14 000
16 000
18 0001990 1995 2000 2005
C. Selected emerging markets
0
2 000
4 000
6 000
8 000
10 000
12 000
14 0001990 1995 2000 2005
Source: WDI, author’s calculations.
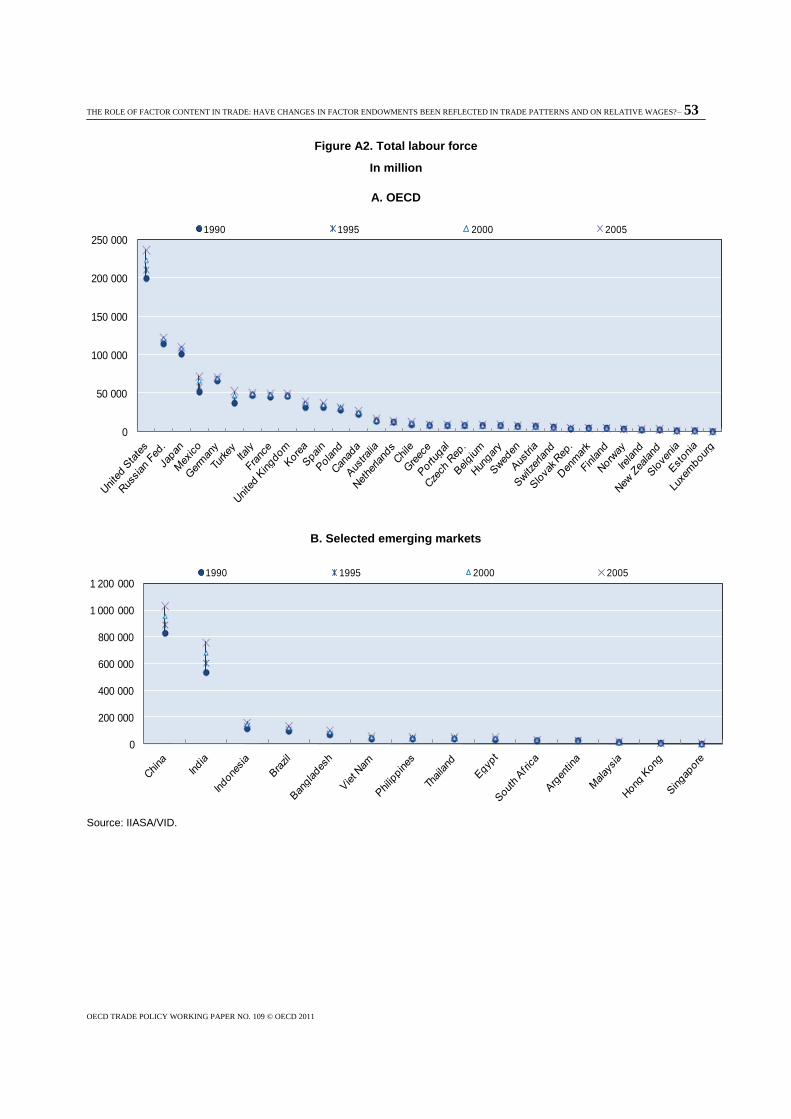
THE ROLE OF FACTOR CONTENT IN TRADE: HAVE CHANGES IN FACTOR ENDOWMENTS BEEN REFLECTED IN TRADE PATTERNS AND ON RELATIVE WAGES?– 53
OECD TRADE POLICY WORKING PAPER NO. 109 © OECD 2011
Figure A2. Total labour force
In million
A. OECD
0
50 000
100 000
150 000
200 000
250 0001990 1995 2000 2005
B. Selected emerging markets
0
200 000
400 000
600 000
800 000
1 000 000
1 200 0001990 1995 2000 2005
Source: IIASA/VID.
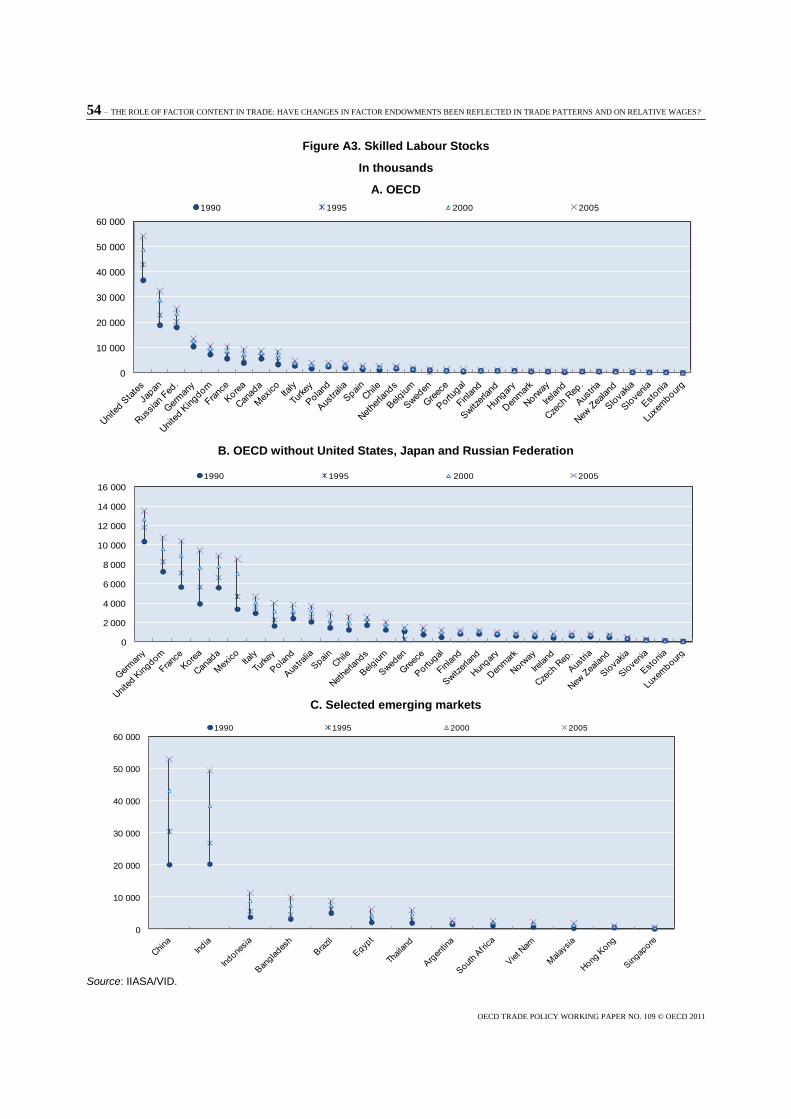
54 – THE ROLE OF FACTOR CONTENT IN TRADE: HAVE CHANGES IN FACTOR ENDOWMENTS BEEN REFLECTED IN TRADE PATTERNS AND ON RELATIVE WAGES?
OECD TRADE POLICY WORKING PAPER NO. 109 © OECD 2011
Figure A3. Skilled Labour Stocks
In thousands
A. OECD
0
10 000
20 000
30 000
40 000
50 000
60 000
1990 1995 2000 2005
B. OECD without United States, Japan and Russian Federation
0
2 000
4 000
6 000
8 000
10 000
12 000
14 000
16 000
1990 1995 2000 2005
C. Selected emerging markets
0
10 000
20 000
30 000
40 000
50 000
60 0001990 1995 2000 2005
Source: IIASA/VID.
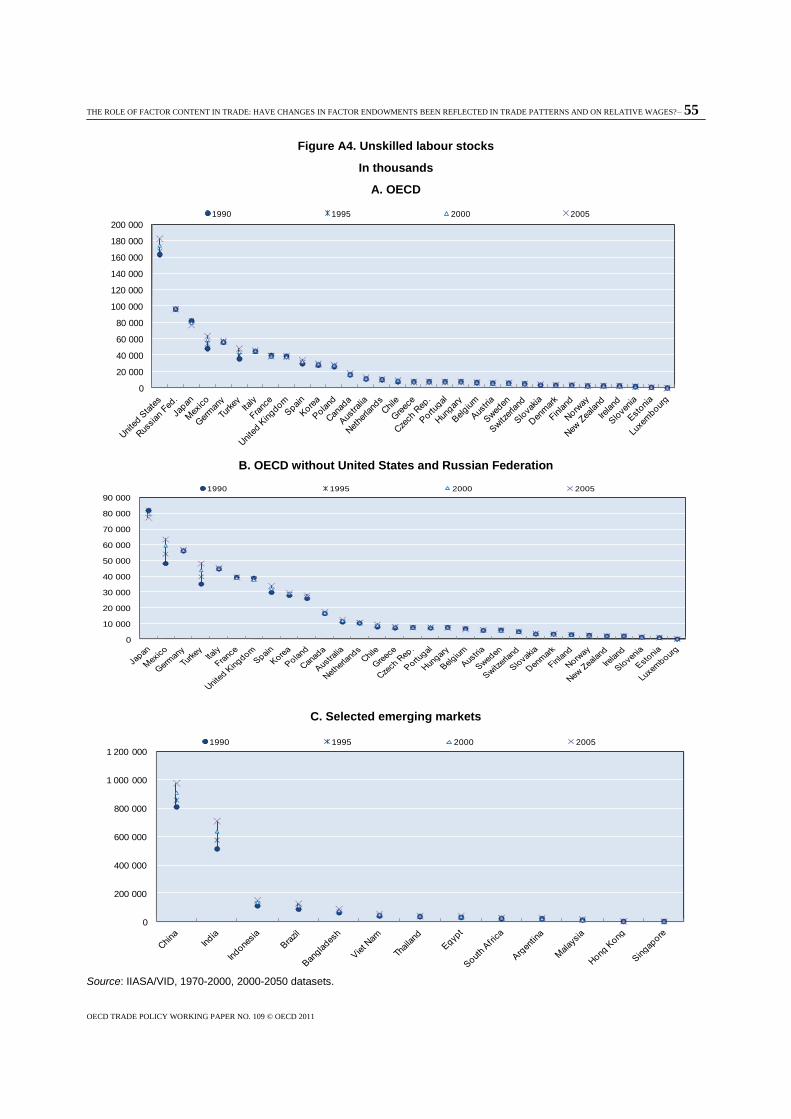
THE ROLE OF FACTOR CONTENT IN TRADE: HAVE CHANGES IN FACTOR ENDOWMENTS BEEN REFLECTED IN TRADE PATTERNS AND ON RELATIVE WAGES?– 55
OECD TRADE POLICY WORKING PAPER NO. 109 © OECD 2011
Figure A4. Unskilled labour stocks
In thousands
A. OECD
0
20 000
40 000
60 000
80 000
100 000
120 000
140 000
160 000
180 000
200 000
1990 1995 2000 2005
B. OECD without United States and Russian Federation
0
10 000
20 000
30 000
40 000
50 000
60 000
70 000
80 000
90 000
1990 1995 2000 2005
C. Selected emerging markets
0
200 000
400 000
600 000
800 000
1 000 000
1 200 0001990 1995 2000 2005
Source: IIASA/VID, 1970-2000, 2000-2050 datasets.
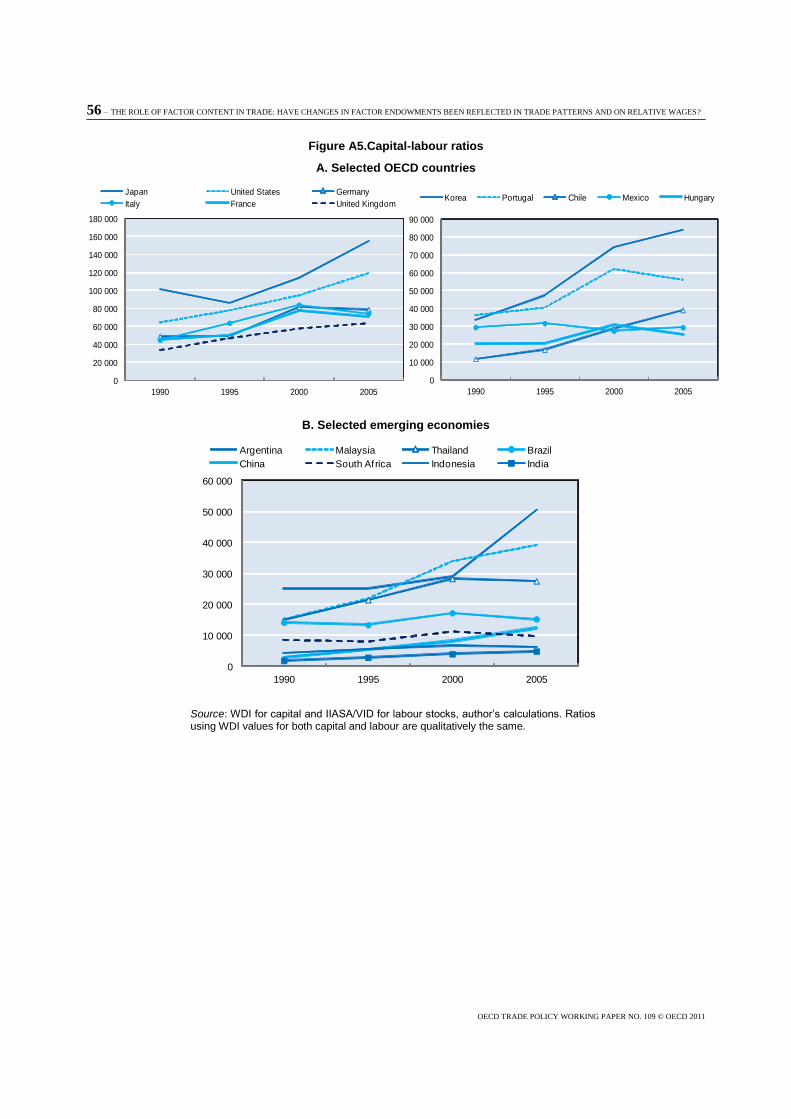
56 – THE ROLE OF FACTOR CONTENT IN TRADE: HAVE CHANGES IN FACTOR ENDOWMENTS BEEN REFLECTED IN TRADE PATTERNS AND ON RELATIVE WAGES?
OECD TRADE POLICY WORKING PAPER NO. 109 © OECD 2011
Figure A5.Capital-labour ratios
A. Selected OECD countries
0
20 000
40 000
60 000
80 000
100 000
120 000
140 000
160 000
180 000
1990 1995 2000 2005
Japan United States Germany
Italy France United Kingdom
0
10 000
20 000
30 000
40 000
50 000
60 000
70 000
80 000
90 000
1990 1995 2000 2005
Korea Portugal Chile Mexico Hungary
B. Selected emerging economies
0
10 000
20 000
30 000
40 000
50 000
60 000
1990 1995 2000 2005
Argentina Malaysia Thailand Brazil
China South Africa Indonesia India
Source: WDI for capital and IIASA/VID for labour stocks, author’s calculations. Ratios using WDI values for both capital and labour are qualitatively the same.
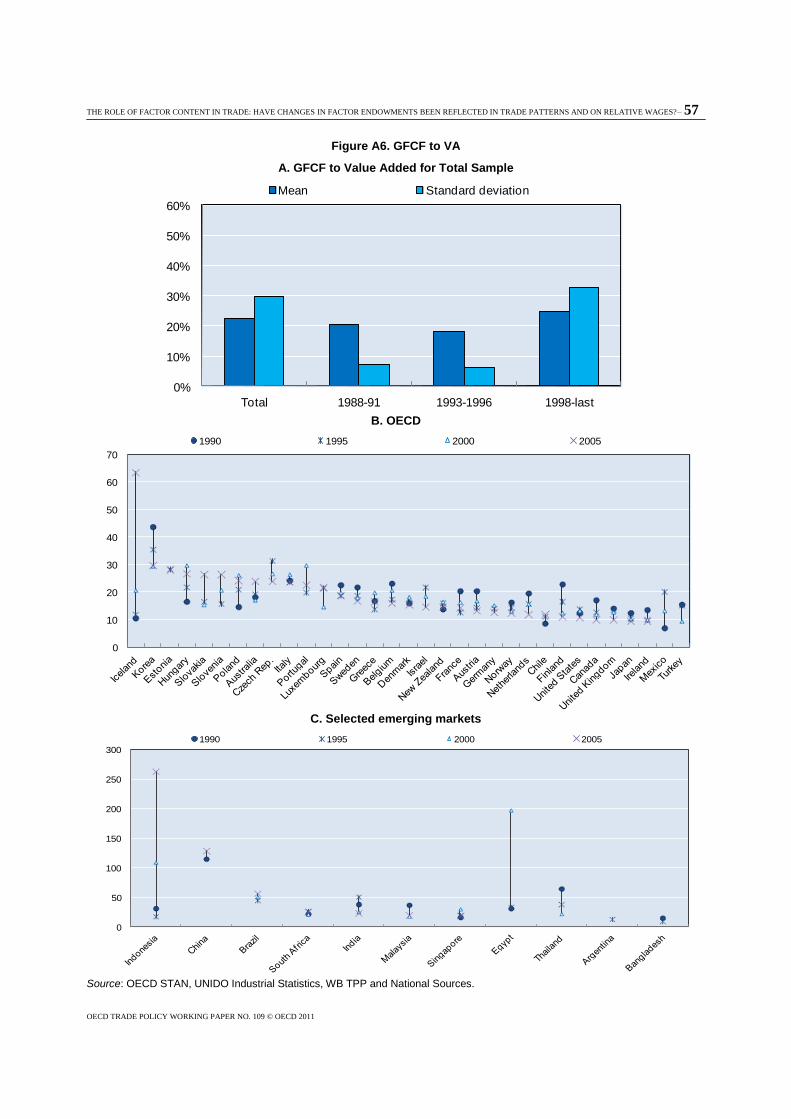
THE ROLE OF FACTOR CONTENT IN TRADE: HAVE CHANGES IN FACTOR ENDOWMENTS BEEN REFLECTED IN TRADE PATTERNS AND ON RELATIVE WAGES?– 57
OECD TRADE POLICY WORKING PAPER NO. 109 © OECD 2011
Figure A6. GFCF to VA
A. GFCF to Value Added for Total Sample
0%
10%
20%
30%
40%
50%
60%
Total 1988-91 1993-1996 1998-last
Mean Standard deviation
B. OECD
0
10
20
30
40
50
60
70
1990 1995 2000 2005
C. Selected emerging markets
0
50
100
150
200
250
300
1990 1995 2000 2005
Source: OECD STAN, UNIDO Industrial Statistics, WB TPP and National Sources.
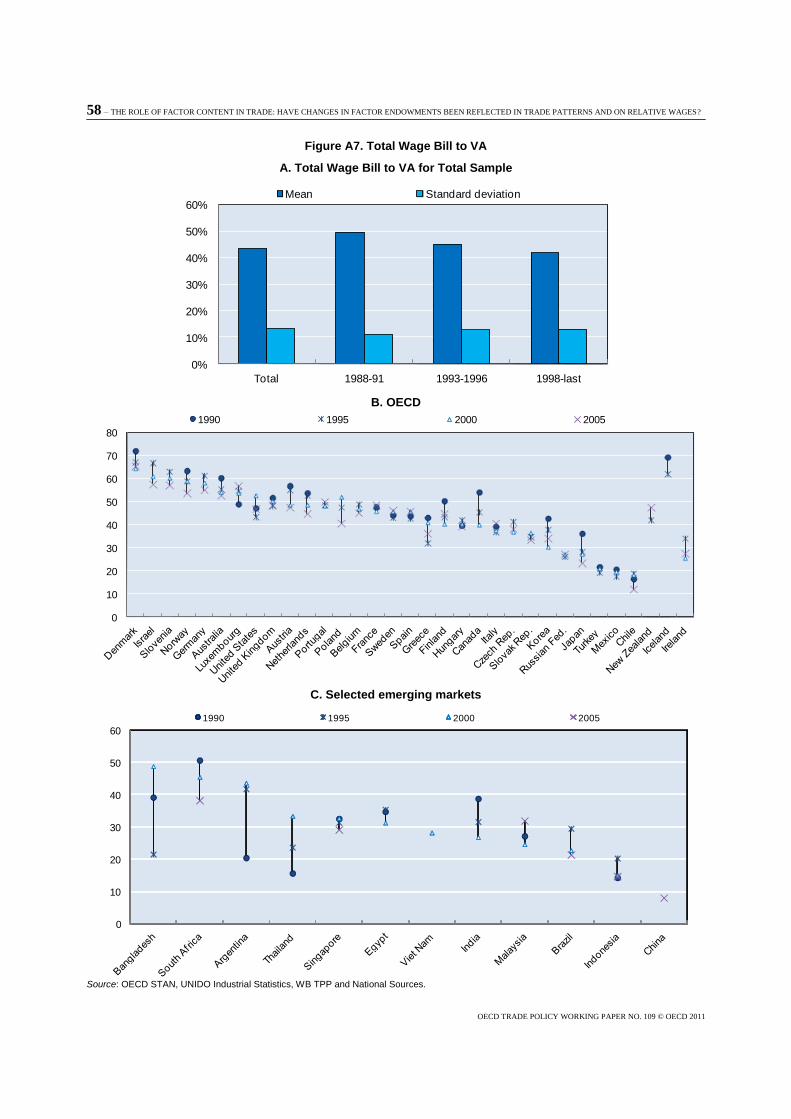
58 – THE ROLE OF FACTOR CONTENT IN TRADE: HAVE CHANGES IN FACTOR ENDOWMENTS BEEN REFLECTED IN TRADE PATTERNS AND ON RELATIVE WAGES?
OECD TRADE POLICY WORKING PAPER NO. 109 © OECD 2011
Figure A7. Total Wage Bill to VA
A. Total Wage Bill to VA for Total Sample
0%
10%
20%
30%
40%
50%
60%
Total 1988-91 1993-1996 1998-last
Mean Standard deviation
B. OECD
0
10
20
30
40
50
60
70
80
1990 1995 2000 2005
C. Selected emerging markets
0
10
20
30
40
50
60
1990 1995 2000 2005
Source: OECD STAN, UNIDO Industrial Statistics, WB TPP and National Sources.
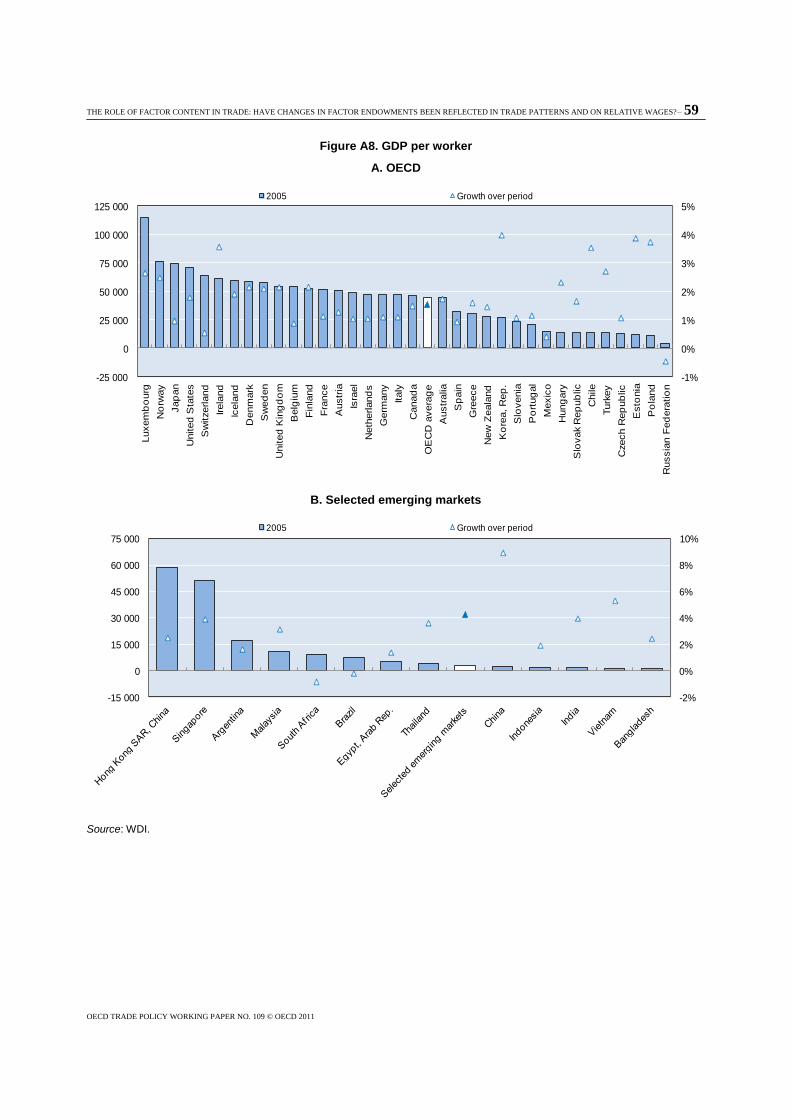
THE ROLE OF FACTOR CONTENT IN TRADE: HAVE CHANGES IN FACTOR ENDOWMENTS BEEN REFLECTED IN TRADE PATTERNS AND ON RELATIVE WAGES?– 59
OECD TRADE POLICY WORKING PAPER NO. 109 © OECD 2011
Figure A8. GDP per worker
A. OECD
-1%
0%
1%
2%
3%
4%
5%
-25 000
0
25 000
50 000
75 000
100 000
125 000
Luxem
bo
urg
No
rway
Jap
an
United
Sta
tes
Sw
itzerland
Irela
nd
Icela
nd
Denm
ark
Sw
ed
en
United
Kin
gd
om
Belg
ium
Fin
land
Fra
nce
Austr
ia
Isra
el
Neth
erland
s
Germ
any
Italy
Canad
a
OE
CD
avera
ge
Austr
alia
Sp
ain
Gre
ece
New
Zeala
nd
Ko
rea, R
ep
.
Slo
venia
Po
rtug
al
Mexic
o
Hung
ary
Slo
vak R
ep
ub
lic
Chile
Turk
ey
Czech R
ep
ub
lic
Esto
nia
Po
land
Russia
n F
ed
era
tio
n
2005 Growth over period
B. Selected emerging markets
-2%
0%
2%
4%
6%
8%
10%
-15 000
0
15 000
30 000
45 000
60 000
75 0002005 Growth over period
Source: WDI.
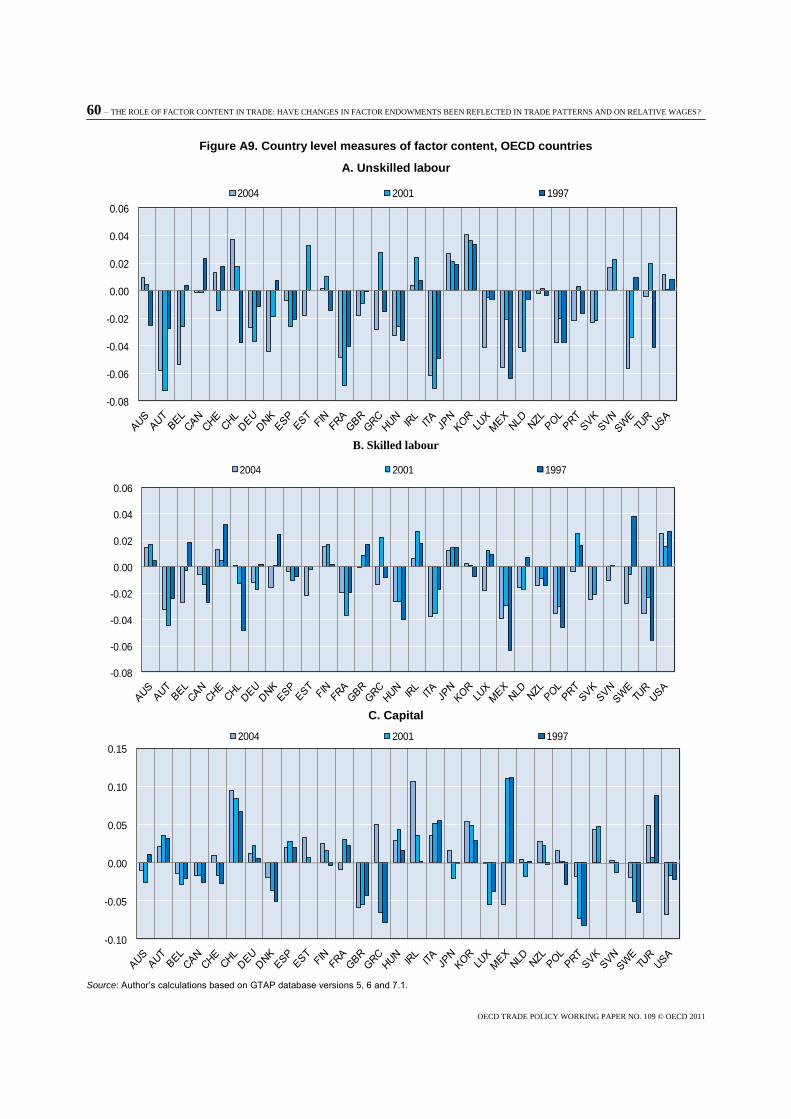
60 – THE ROLE OF FACTOR CONTENT IN TRADE: HAVE CHANGES IN FACTOR ENDOWMENTS BEEN REFLECTED IN TRADE PATTERNS AND ON RELATIVE WAGES?
OECD TRADE POLICY WORKING PAPER NO. 109 © OECD 2011
Figure A9. Country level measures of factor content, OECD countries
A. Unskilled labour
-0.08
-0.06
-0.04
-0.02
0.00
0.02
0.04
0.06
2004 2001 1997
B. Skilled labour
-0.08
-0.06
-0.04
-0.02
0.00
0.02
0.04
0.06
2004 2001 1997
C. Capital
-0.10
-0.05
0.00
0.05
0.10
0.15
2004 2001 1997
Source: Author’s calculations based on GTAP database versions 5, 6 and 7.1.
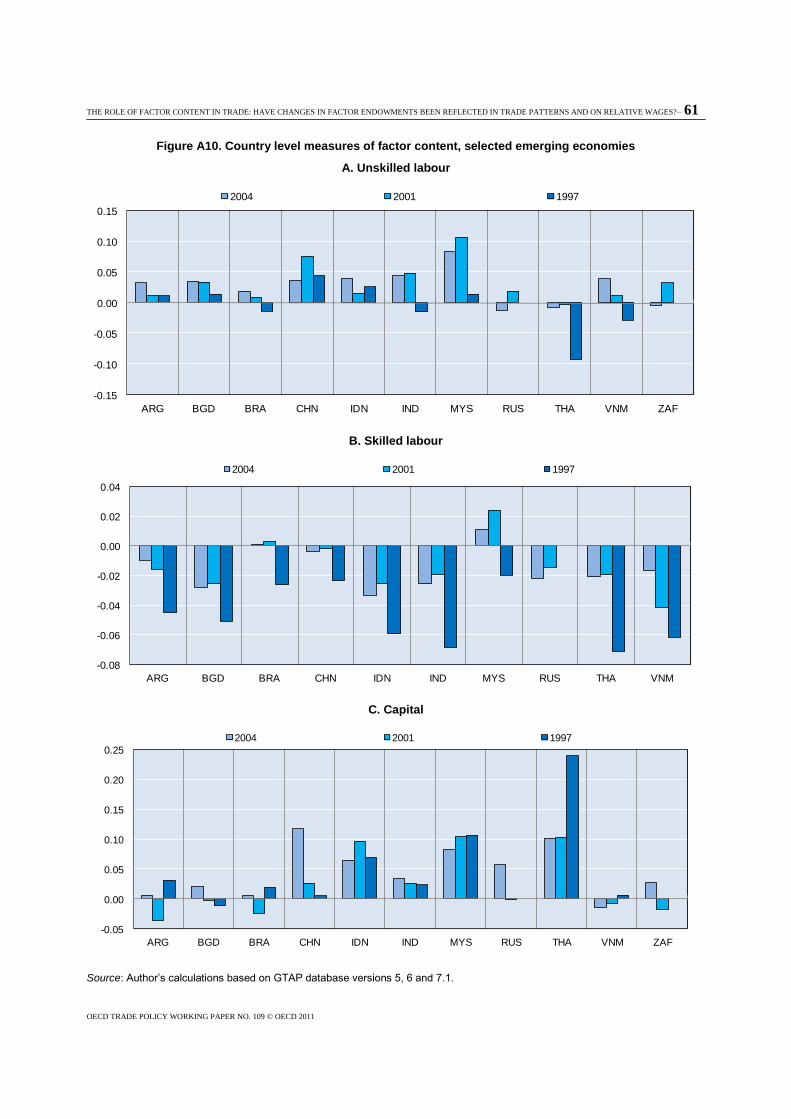
THE ROLE OF FACTOR CONTENT IN TRADE: HAVE CHANGES IN FACTOR ENDOWMENTS BEEN REFLECTED IN TRADE PATTERNS AND ON RELATIVE WAGES?– 61
OECD TRADE POLICY WORKING PAPER NO. 109 © OECD 2011
Figure A10. Country level measures of factor content, selected emerging economies
A. Unskilled labour
-0.15
-0.10
-0.05
0.00
0.05
0.10
0.15
ARG BGD BRA CHN IDN IND MYS RUS THA VNM ZAF
2004 2001 1997
B. Skilled labour
-0.08
-0.06
-0.04
-0.02
0.00
0.02
0.04
ARG BGD BRA CHN IDN IND MYS RUS THA VNM
2004 2001 1997
C. Capital
-0.05
0.00
0.05
0.10
0.15
0.20
0.25
ARG BGD BRA CHN IDN IND MYS RUS THA VNM ZAF
2004 2001 1997
Source: Author’s calculations based on GTAP database versions 5, 6 and 7.1.
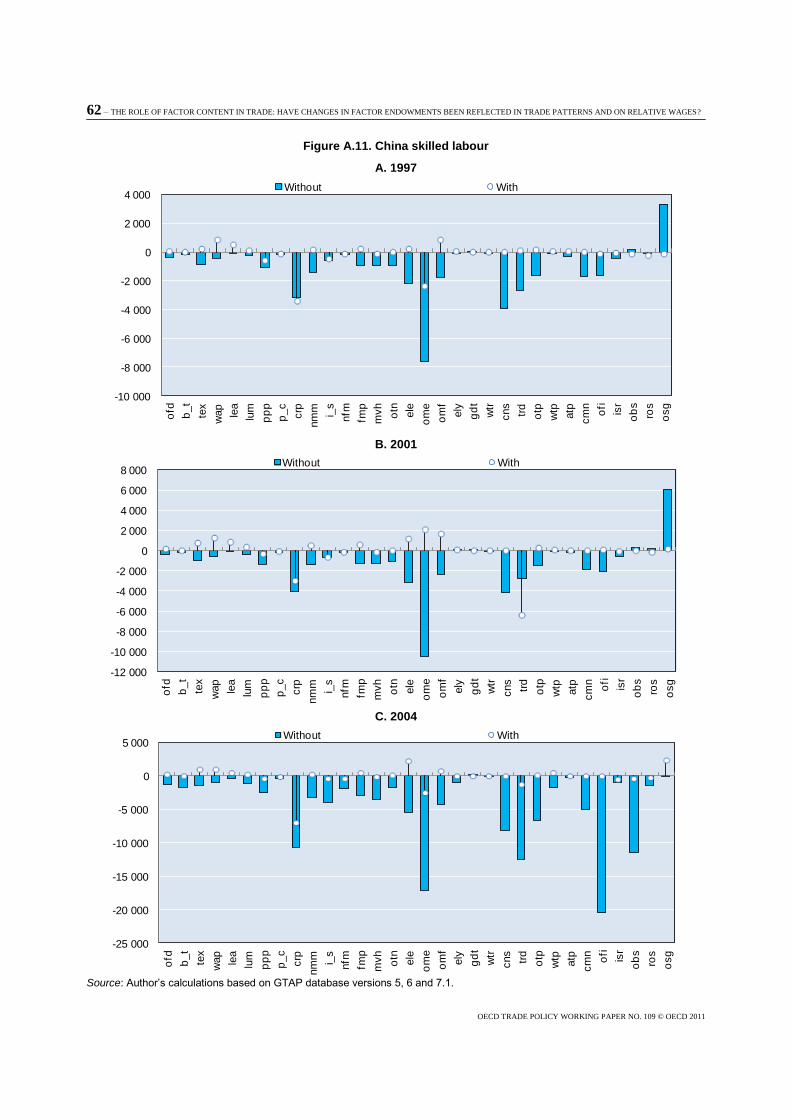
62 – THE ROLE OF FACTOR CONTENT IN TRADE: HAVE CHANGES IN FACTOR ENDOWMENTS BEEN REFLECTED IN TRADE PATTERNS AND ON RELATIVE WAGES?
OECD TRADE POLICY WORKING PAPER NO. 109 © OECD 2011
Figure A.11. China skilled labour
A. 1997
-10 000
-8 000
-6 000
-4 000
-2 000
0
2 000
4 000
ofd
b_t
tex
wap
lea
lum
pp
p
p_c
crp
nm
m i_s
nfm
fmp
mvh
otn
ele
om
e
om
f
ely
gd
t
wtr
cns
trd
otp
wtp
atp
cm
n
ofi
isr
ob
s
ros
osg
Without With
B. 2001
-12 000
-10 000
-8 000
-6 000
-4 000
-2 000
0
2 000
4 000
6 000
8 000
ofd
b_t
tex
wap
lea
lum
pp
p
p_c
crp
nm
m i_s
nfm
fmp
mvh
otn
ele
om
e
om
f
ely
gd
t
wtr
cns
trd
otp
wtp
atp
cm
n
ofi
isr
ob
s
ros
osg
Without With
C. 2004
-25 000
-20 000
-15 000
-10 000
-5 000
0
5 000
ofd
b_t
tex
wap
lea
lum
pp
p
p_c
crp
nm
m i_s
nfm
fmp
mvh
otn
ele
om
e
om
f
ely
gd
t
wtr
cns
trd
otp
wtp
atp
cm
n
ofi
isr
ob
s
ros
osg
Without With
Source: Author’s calculations based on GTAP database versions 5, 6 and 7.1.
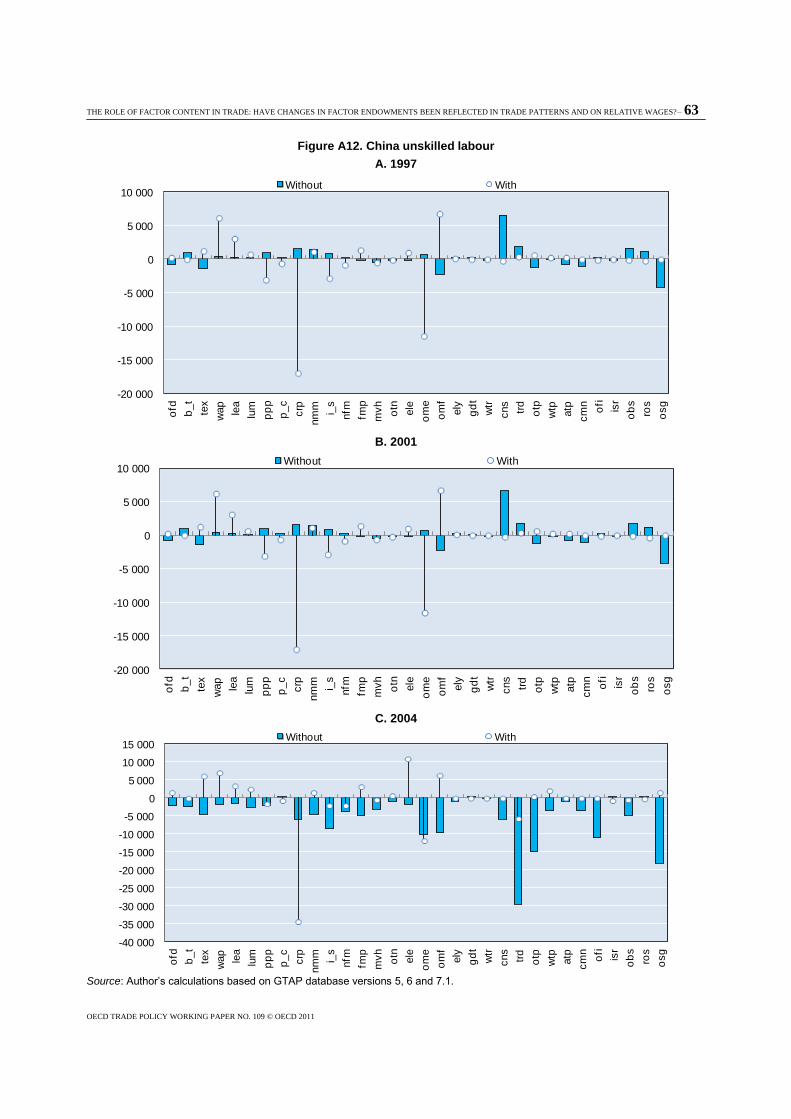
THE ROLE OF FACTOR CONTENT IN TRADE: HAVE CHANGES IN FACTOR ENDOWMENTS BEEN REFLECTED IN TRADE PATTERNS AND ON RELATIVE WAGES?– 63
OECD TRADE POLICY WORKING PAPER NO. 109 © OECD 2011
Figure A12. China unskilled labour
A. 1997
-20 000
-15 000
-10 000
-5 000
0
5 000
10 000
ofd
b_t
tex
wap
lea
lum
pp
p
p_c
crp
nm
m i_s
nfm
fmp
mvh
otn
ele
om
e
om
f
ely
gd
t
wtr
cns
trd
otp
wtp
atp
cm
n
ofi
isr
ob
s
ros
osg
Without With
B. 2001
-20 000
-15 000
-10 000
-5 000
0
5 000
10 000
ofd
b_t
tex
wap
lea
lum
pp
p
p_c
crp
nm
m i_s
nfm
fmp
mvh
otn
ele
om
e
om
f
ely
gd
t
wtr
cns
trd
otp
wtp
atp
cm
n
ofi
isr
ob
s
ros
osg
Without With
C. 2004
-40 000
-35 000
-30 000
-25 000
-20 000
-15 000
-10 000
-5 000
0
5 000
10 000
15 000
ofd
b_t
tex
wap
lea
lum
pp
p
p_c
crp
nm
m i_s
nfm
fmp
mvh
otn
ele
om
e
om
f
ely
gd
t
wtr
cns
trd
otp
wtp
atp
cm
n
ofi
isr
ob
s
ros
osg
Without With
Source: Author’s calculations based on GTAP database versions 5, 6 and 7.1.
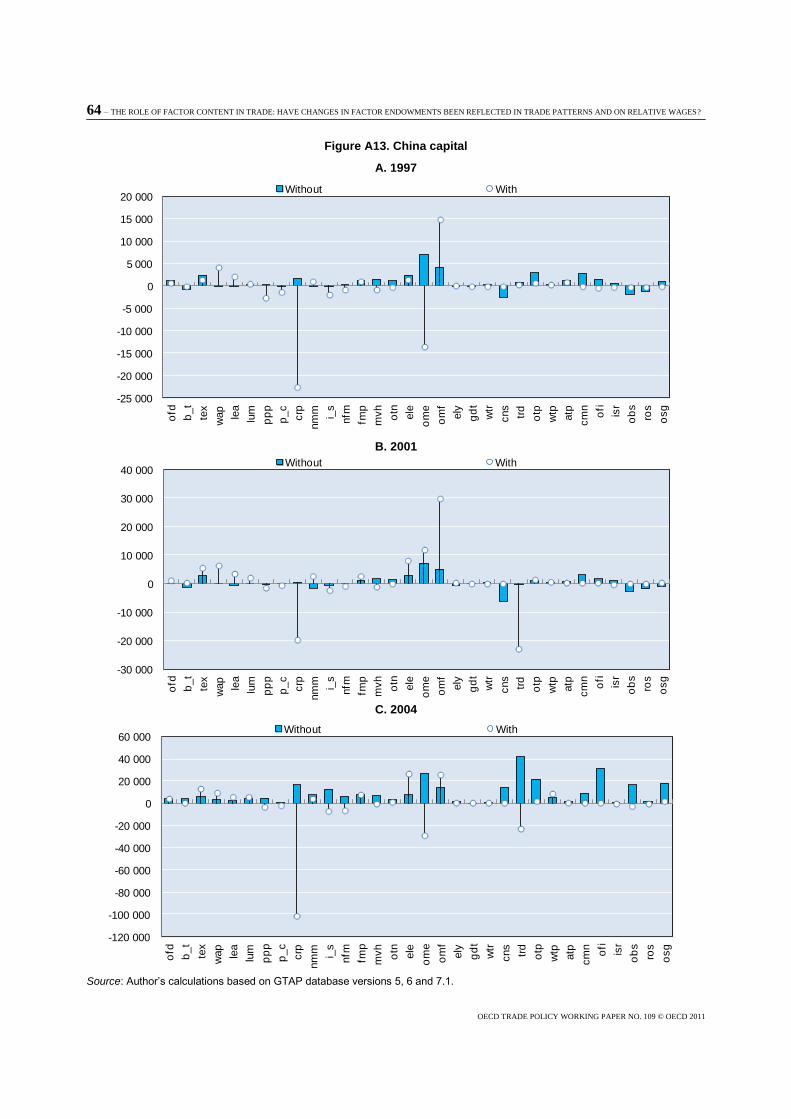
64 – THE ROLE OF FACTOR CONTENT IN TRADE: HAVE CHANGES IN FACTOR ENDOWMENTS BEEN REFLECTED IN TRADE PATTERNS AND ON RELATIVE WAGES?
OECD TRADE POLICY WORKING PAPER NO. 109 © OECD 2011
Figure A13. China capital
A. 1997
-25 000
-20 000
-15 000
-10 000
-5 000
0
5 000
10 000
15 000
20 000
ofd
b_t
tex
wap
lea
lum
pp
p
p_c
crp
nm
m i_s
nfm
fmp
mvh
otn
ele
om
e
om
f
ely
gd
t
wtr
cns
trd
otp
wtp
atp
cm
n
ofi
isr
ob
s
ros
osg
Without With
B. 2001
-30 000
-20 000
-10 000
0
10 000
20 000
30 000
40 000
ofd
b_t
tex
wap
lea
lum
pp
p
p_c
crp
nm
m i_s
nfm
fmp
mvh
otn
ele
om
e
om
f
ely
gd
t
wtr
cns
trd
otp
wtp
atp
cm
n
ofi
isr
ob
s
ros
osg
Without With
C. 2004
-120 000
-100 000
-80 000
-60 000
-40 000
-20 000
0
20 000
40 000
60 000
ofd
b_t
tex
wap
lea
lum
pp
p
p_c
crp
nm
m i_s
nfm
fmp
mvh
otn
ele
om
e
om
f
ely
gd
t
wtr
cns
trd
otp
wtp
atp
cm
n
ofi
isr
ob
s
ros
osg
Without With
Source: Author’s calculations based on GTAP database versions 5, 6 and 7.1.
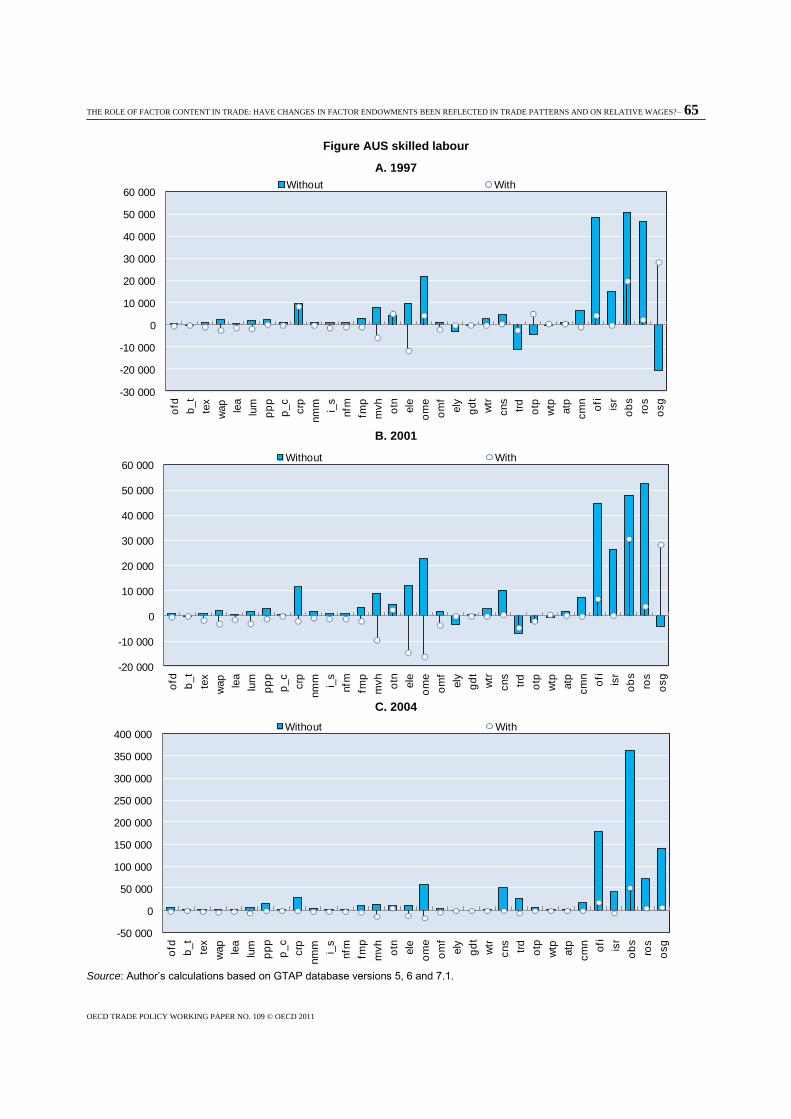
THE ROLE OF FACTOR CONTENT IN TRADE: HAVE CHANGES IN FACTOR ENDOWMENTS BEEN REFLECTED IN TRADE PATTERNS AND ON RELATIVE WAGES?– 65
OECD TRADE POLICY WORKING PAPER NO. 109 © OECD 2011
Figure AUS skilled labour
A. 1997
-30 000
-20 000
-10 000
0
10 000
20 000
30 000
40 000
50 000
60 000
ofd
b_t
tex
wap
lea
lum
pp
p
p_c
crp
nm
m i_s
nfm
fmp
mvh
otn
ele
om
e
om
f
ely
gd
t
wtr
cns
trd
otp
wtp
atp
cm
n
ofi
isr
ob
s
ros
osg
Without With
B. 2001
-20 000
-10 000
0
10 000
20 000
30 000
40 000
50 000
60 000
ofd
b_t
tex
wap
lea
lum
pp
p
p_c
crp
nm
m i_s
nfm
fmp
mvh
otn
ele
om
e
om
f
ely
gd
t
wtr
cns
trd
otp
wtp
atp
cm
n
ofi
isr
ob
s
ros
osg
Without With
C. 2004
-50 000
0
50 000
100 000
150 000
200 000
250 000
300 000
350 000
400 000
ofd
b_t
tex
wap
lea
lum
pp
p
p_c
crp
nm
m i_s
nfm
fmp
mvh
otn
ele
om
e
om
f
ely
gd
t
wtr
cns
trd
otp
wtp
atp
cm
n
ofi
isr
ob
s
ros
osg
Without With
Source: Author’s calculations based on GTAP database versions 5, 6 and 7.1.
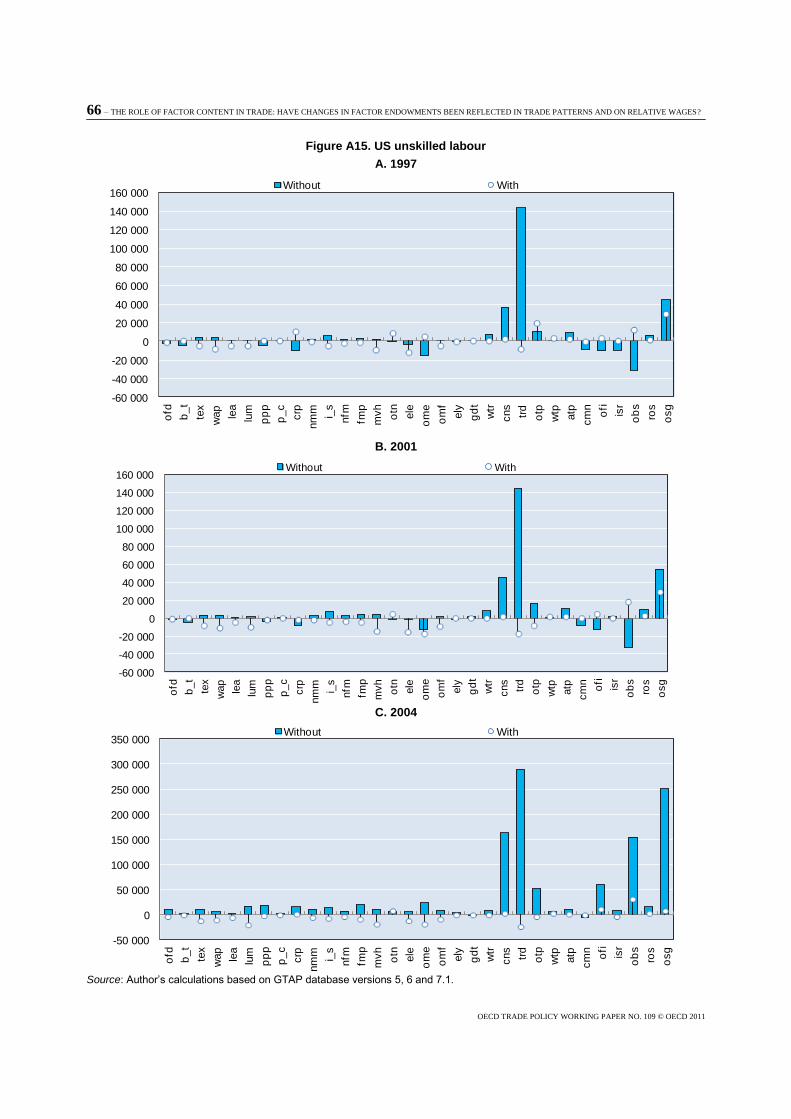
66 – THE ROLE OF FACTOR CONTENT IN TRADE: HAVE CHANGES IN FACTOR ENDOWMENTS BEEN REFLECTED IN TRADE PATTERNS AND ON RELATIVE WAGES?
OECD TRADE POLICY WORKING PAPER NO. 109 © OECD 2011
Figure A15. US unskilled labour
A. 1997
-60 000
-40 000
-20 000
0
20 000
40 000
60 000
80 000
100 000
120 000
140 000
160 000
ofd
b_t
tex
wap
lea
lum
pp
p
p_c
crp
nm
m i_s
nfm
fmp
mvh
otn
ele
om
e
om
f
ely
gd
t
wtr
cns
trd
otp
wtp
atp
cm
n
ofi
isr
ob
s
ros
osg
Without With
B. 2001
-60 000
-40 000
-20 000
0
20 000
40 000
60 000
80 000
100 000
120 000
140 000
160 000
ofd
b_t
tex
wap
lea
lum
pp
p
p_c
crp
nm
m i_s
nfm
fmp
mvh
otn
ele
om
e
om
f
ely
gd
t
wtr
cns
trd
otp
wtp
atp
cm
n
ofi
isr
ob
s
ros
osg
Without With
C. 2004
-50 000
0
50 000
100 000
150 000
200 000
250 000
300 000
350 000
ofd
b_t
tex
wap
lea
lum
pp
p
p_c
crp
nm
m i_s
nfm
fmp
mvh
otn
ele
om
e
om
f
ely
gd
t
wtr
cns
trd
otp
wtp
atp
cm
n
ofi
isr
ob
s
ros
osg
Without With
Source: Author’s calculations based on GTAP database versions 5, 6 and 7.1.
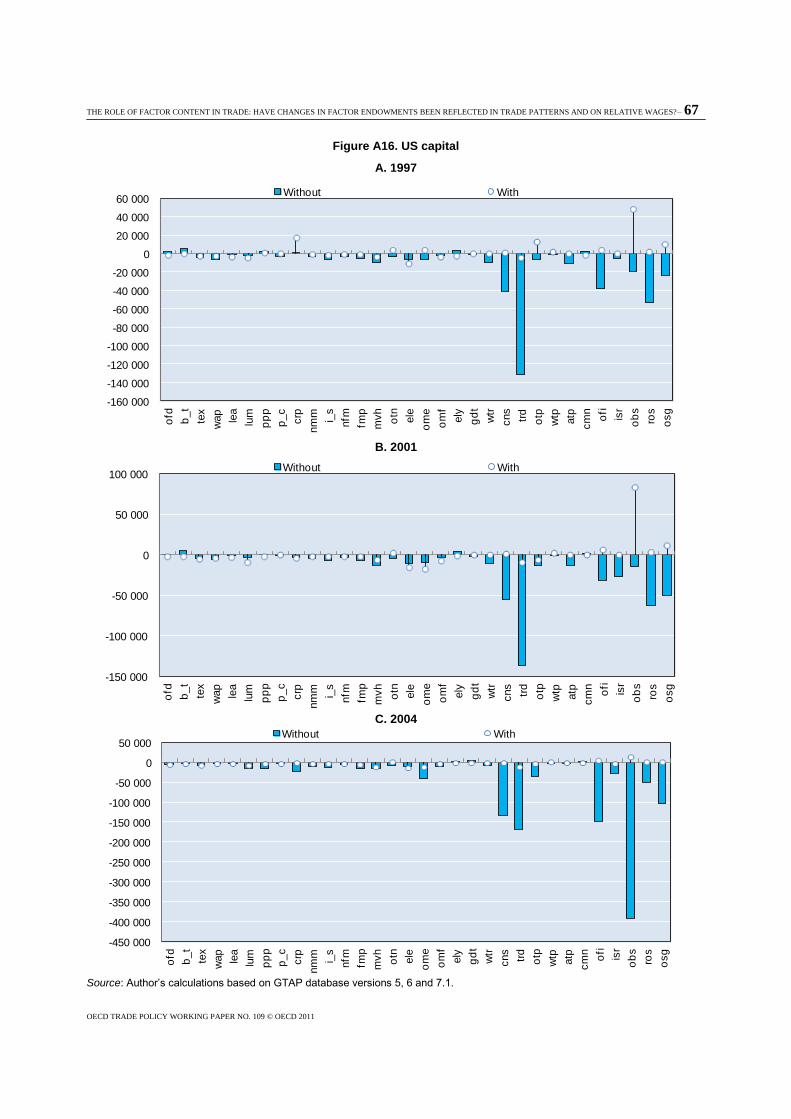
THE ROLE OF FACTOR CONTENT IN TRADE: HAVE CHANGES IN FACTOR ENDOWMENTS BEEN REFLECTED IN TRADE PATTERNS AND ON RELATIVE WAGES?– 67
OECD TRADE POLICY WORKING PAPER NO. 109 © OECD 2011
Figure A16. US capital
A. 1997
-160 000
-140 000
-120 000
-100 000
-80 000
-60 000
-40 000
-20 000
0
20 000
40 000
60 000
ofd
b_t
tex
wap
lea
lum
pp
p
p_c
crp
nm
m i_s
nfm
fmp
mvh
otn
ele
om
e
om
f
ely
gd
t
wtr
cns
trd
otp
wtp
atp
cm
n
ofi
isr
ob
s
ros
osg
Without With
B. 2001
-150 000
-100 000
-50 000
0
50 000
100 000
ofd
b_t
tex
wap
lea
lum
pp
p
p_c
crp
nm
m i_s
nfm
fmp
mvh
otn
ele
om
e
om
f
ely
gd
t
wtr
cns
trd
otp
wtp
atp
cm
n
ofi
isr
ob
s
ros
osg
Without With
C. 2004
-450 000
-400 000
-350 000
-300 000
-250 000
-200 000
-150 000
-100 000
-50 000
0
50 000
ofd
b_t
tex
wap
lea
lum
pp
p
p_c
crp
nm
m i_s
nfm
fmp
mvh
otn
ele
om
e
om
f
ely
gd
t
wtr
cns
trd
otp
wtp
atp
cm
n
ofi
isr
ob
s
ros
osg
Without With
Source: Author’s calculations based on GTAP database versions 5, 6 and 7.1.
68 – THE ROLE OF FACTOR CONTENT IN TRADE: HAVE CHANGES IN FACTOR ENDOWMENTS BEEN REFLECTED IN TRADE PATTERNS AND ON RELATIVE WAGES?
OECD TRADE POLICY WORKING PAPER NO. 109 © OECD 2011
Figure A17. Percentage of lowest paid wage by industry across countries and years
0
2
4
6
8
10
12
14
16
18
Source: Occupational Wages around the World Dataset; Author’s calculations.
Figure A18. Percentage of lowest paid wage by occupation across countries and years
0
2
4
6
8
10
12
14
16
Source: Occupational Wages around the World Dataset; Author’s calculations.
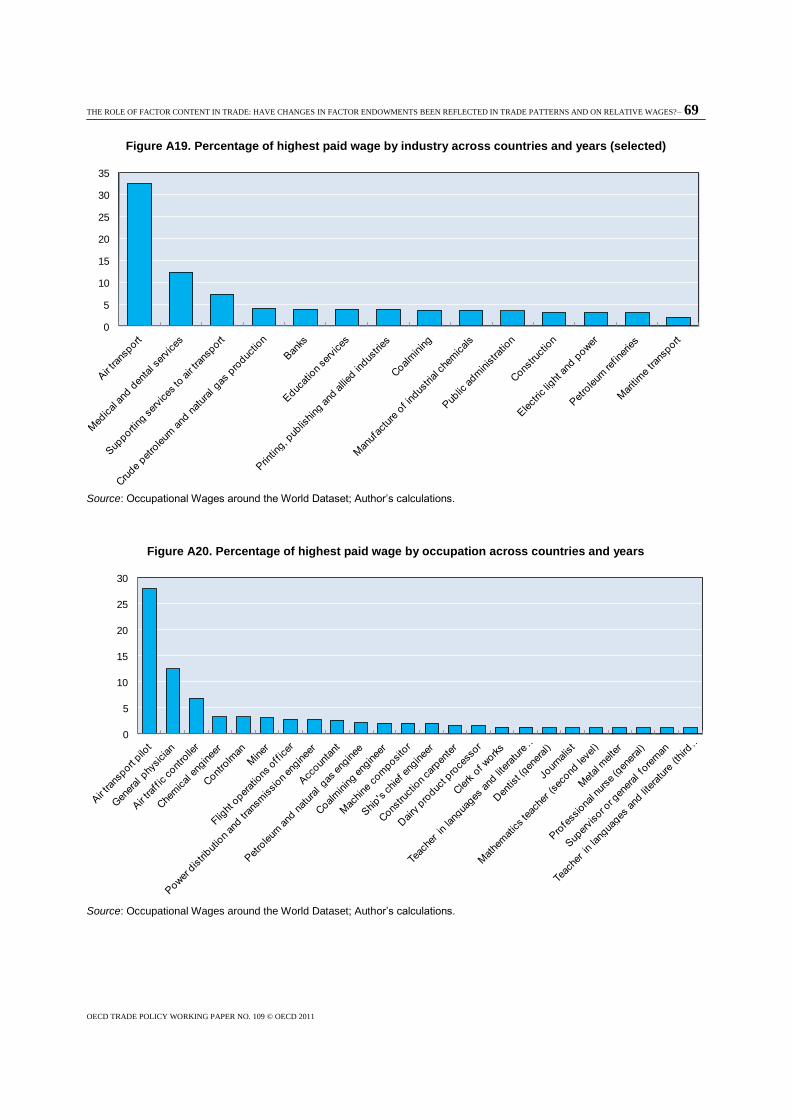
THE ROLE OF FACTOR CONTENT IN TRADE: HAVE CHANGES IN FACTOR ENDOWMENTS BEEN REFLECTED IN TRADE PATTERNS AND ON RELATIVE WAGES?– 69
OECD TRADE POLICY WORKING PAPER NO. 109 © OECD 2011
Figure A19. Percentage of highest paid wage by industry across countries and years (selected)
0
5
10
15
20
25
30
35
Source: Occupational Wages around the World Dataset; Author’s calculations.
Figure A20. Percentage of highest paid wage by occupation across countries and years
0
5
10
15
20
25
30
Source: Occupational Wages around the World Dataset; Author’s calculations.
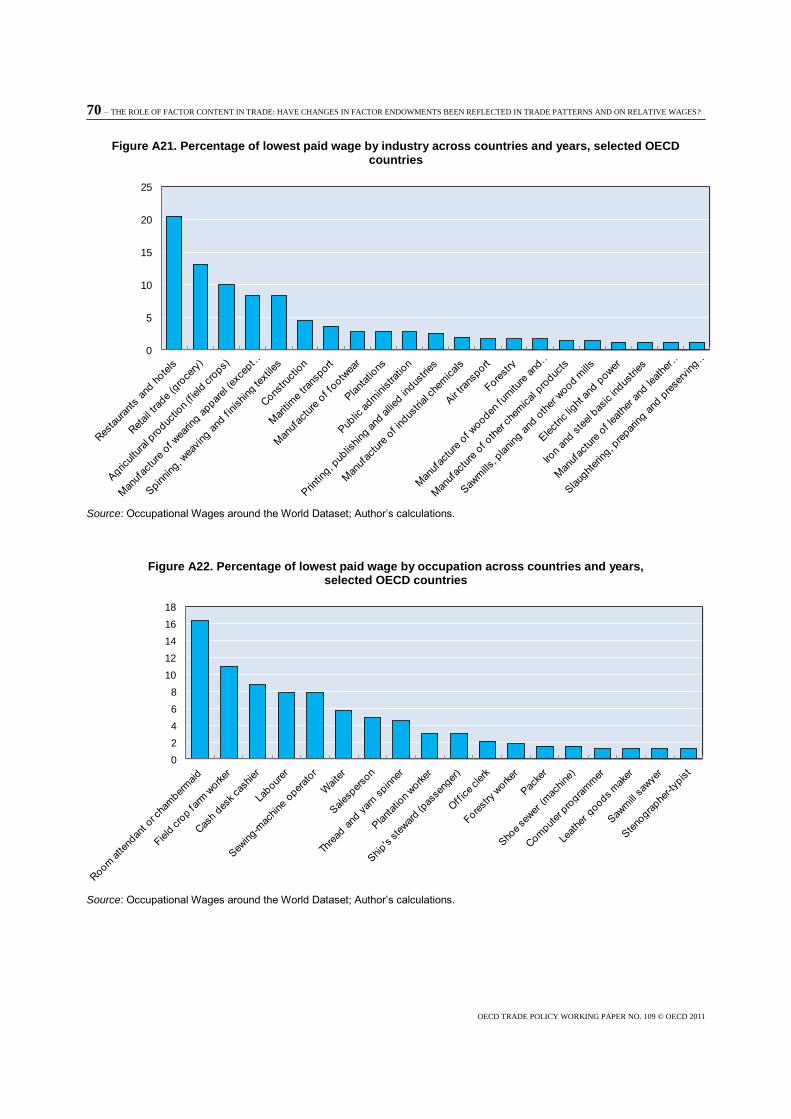
70 – THE ROLE OF FACTOR CONTENT IN TRADE: HAVE CHANGES IN FACTOR ENDOWMENTS BEEN REFLECTED IN TRADE PATTERNS AND ON RELATIVE WAGES?
OECD TRADE POLICY WORKING PAPER NO. 109 © OECD 2011
Figure A21. Percentage of lowest paid wage by industry across countries and years, selected OECD countries
0
5
10
15
20
25
Source: Occupational Wages around the World Dataset; Author’s calculations.
Figure A22. Percentage of lowest paid wage by occupation across countries and years, selected OECD countries
0
2
4
6
8
10
12
14
16
18
Source: Occupational Wages around the World Dataset; Author’s calculations.
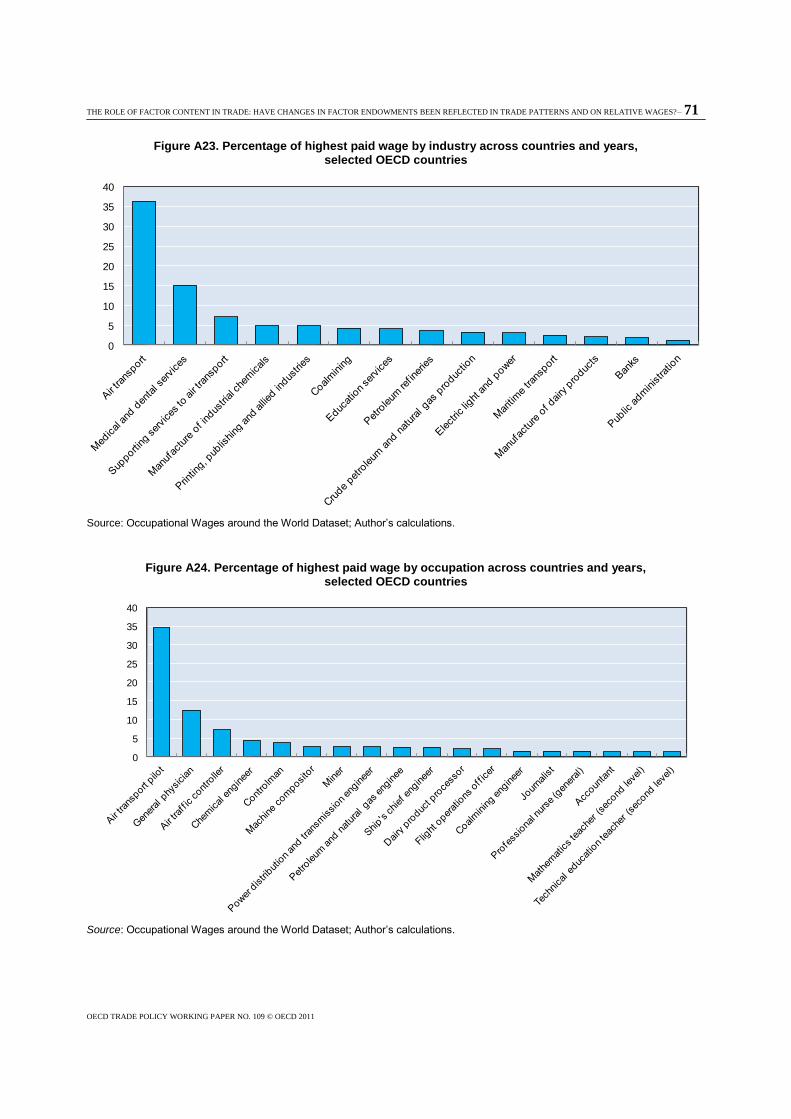
THE ROLE OF FACTOR CONTENT IN TRADE: HAVE CHANGES IN FACTOR ENDOWMENTS BEEN REFLECTED IN TRADE PATTERNS AND ON RELATIVE WAGES?– 71
OECD TRADE POLICY WORKING PAPER NO. 109 © OECD 2011
Figure A23. Percentage of highest paid wage by industry across countries and years, selected OECD countries
0
5
10
15
20
25
30
35
40
Source: Occupational Wages around the World Dataset; Author’s calculations.
Figure A24. Percentage of highest paid wage by occupation across countries and years, selected OECD countries
0
5
10
15
20
25
30
35
40
Source: Occupational Wages around the World Dataset; Author’s calculations.
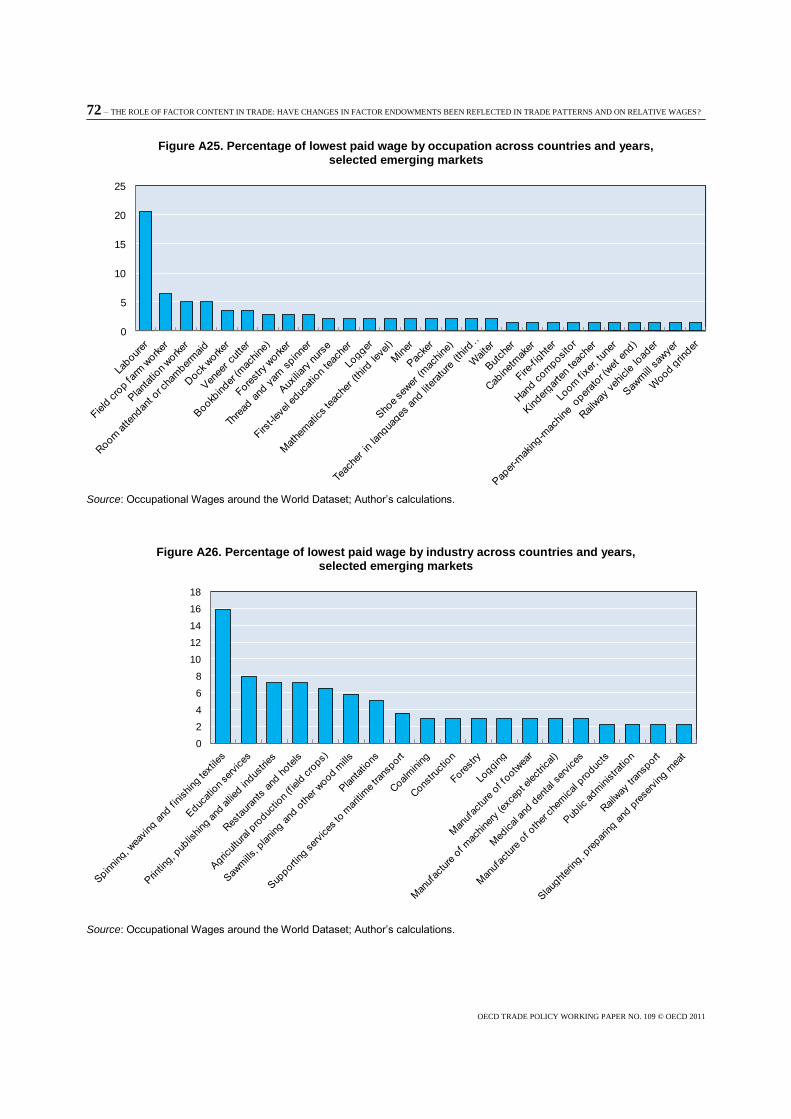
72 – THE ROLE OF FACTOR CONTENT IN TRADE: HAVE CHANGES IN FACTOR ENDOWMENTS BEEN REFLECTED IN TRADE PATTERNS AND ON RELATIVE WAGES?
OECD TRADE POLICY WORKING PAPER NO. 109 © OECD 2011
Figure A25. Percentage of lowest paid wage by occupation across countries and years, selected emerging markets
0
5
10
15
20
25
Source: Occupational Wages around the World Dataset; Author’s calculations.
Figure A26. Percentage of lowest paid wage by industry across countries and years, selected emerging markets
0
2
4
6
8
10
12
14
16
18
Source: Occupational Wages around the World Dataset; Author’s calculations.
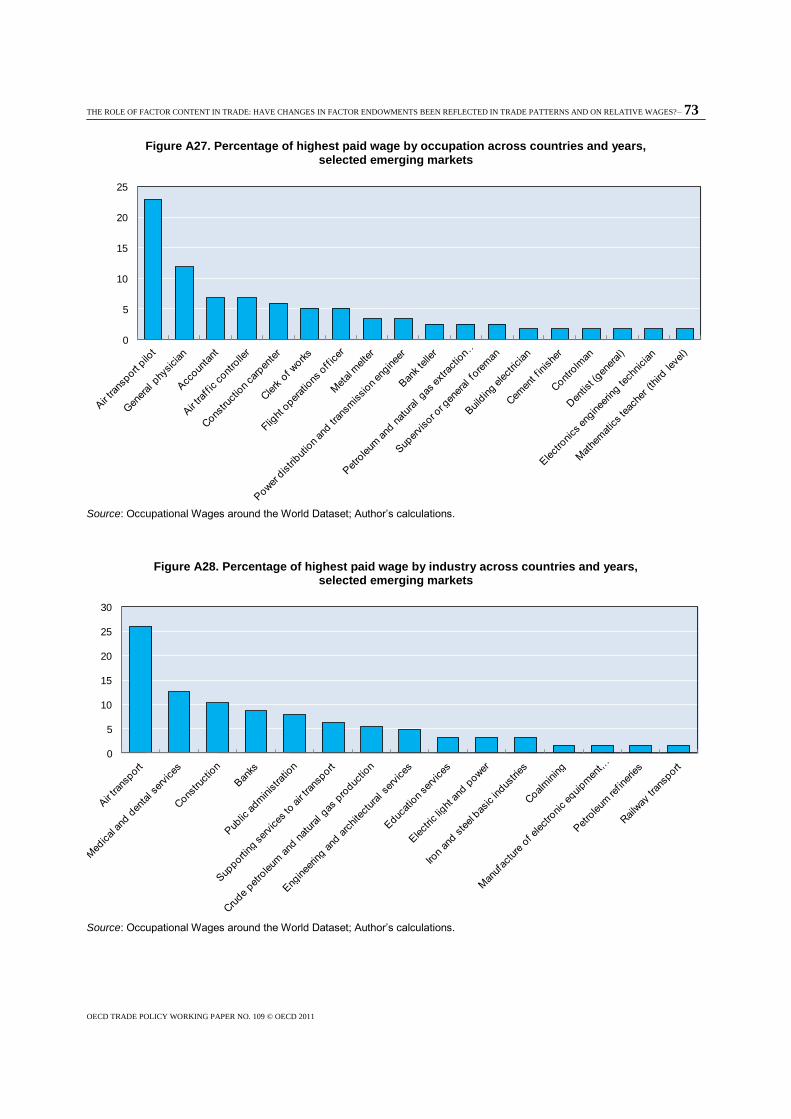
THE ROLE OF FACTOR CONTENT IN TRADE: HAVE CHANGES IN FACTOR ENDOWMENTS BEEN REFLECTED IN TRADE PATTERNS AND ON RELATIVE WAGES?– 73
OECD TRADE POLICY WORKING PAPER NO. 109 © OECD 2011
Figure A27. Percentage of highest paid wage by occupation across countries and years, selected emerging markets
0
5
10
15
20
25
Source: Occupational Wages around the World Dataset; Author’s calculations.
Figure A28. Percentage of highest paid wage by industry across countries and years, selected emerging markets
0
5
10
15
20
25
30
Source: Occupational Wages around the World Dataset; Author’s calculations.
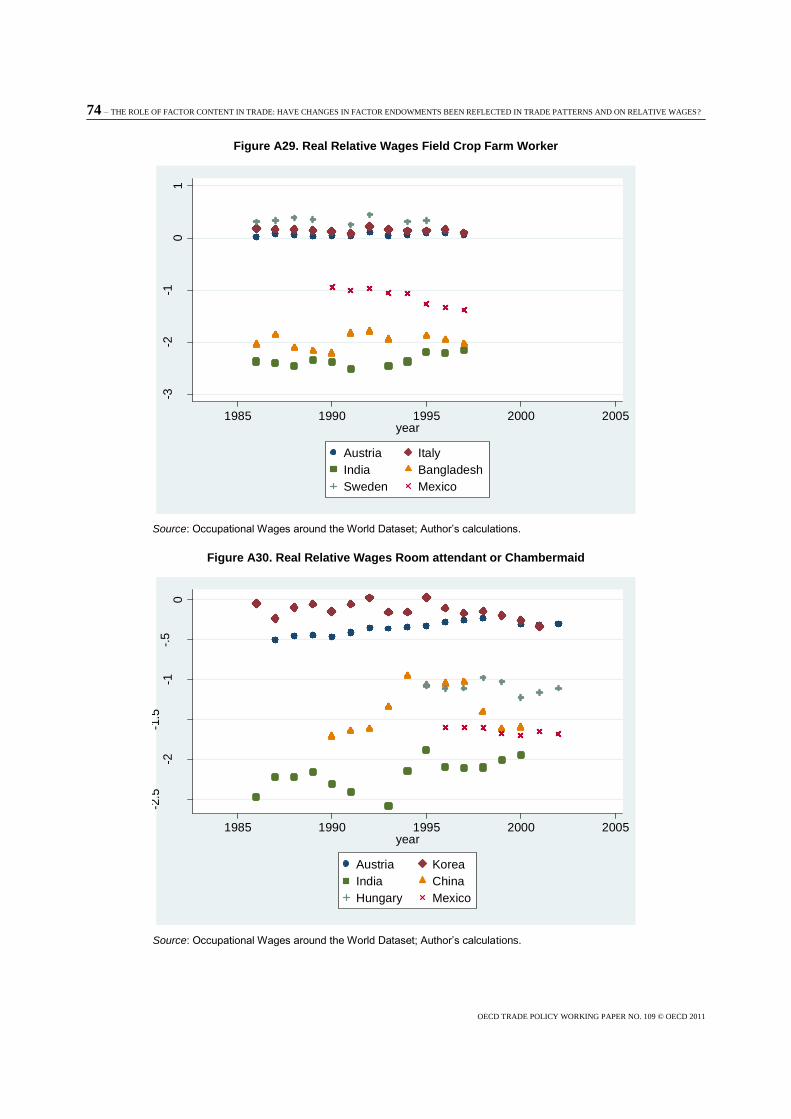
74 – THE ROLE OF FACTOR CONTENT IN TRADE: HAVE CHANGES IN FACTOR ENDOWMENTS BEEN REFLECTED IN TRADE PATTERNS AND ON RELATIVE WAGES?
OECD TRADE POLICY WORKING PAPER NO. 109 © OECD 2011
Figure A29. Real Relative Wages Field Crop Farm Worker
-3-2
-10
1
1985 1990 1995 2000 2005year
Austria Italy
India Bangladesh
Sweden Mexico
Source: Occupational Wages around the World Dataset; Author’s calculations.
Figure A30. Real Relative Wages Room attendant or Chambermaid
-2.5
-2-1
.5-1
-.5
0
1985 1990 1995 2000 2005year
Austria Korea
India China
Hungary Mexico
Source: Occupational Wages around the World Dataset; Author’s calculations.
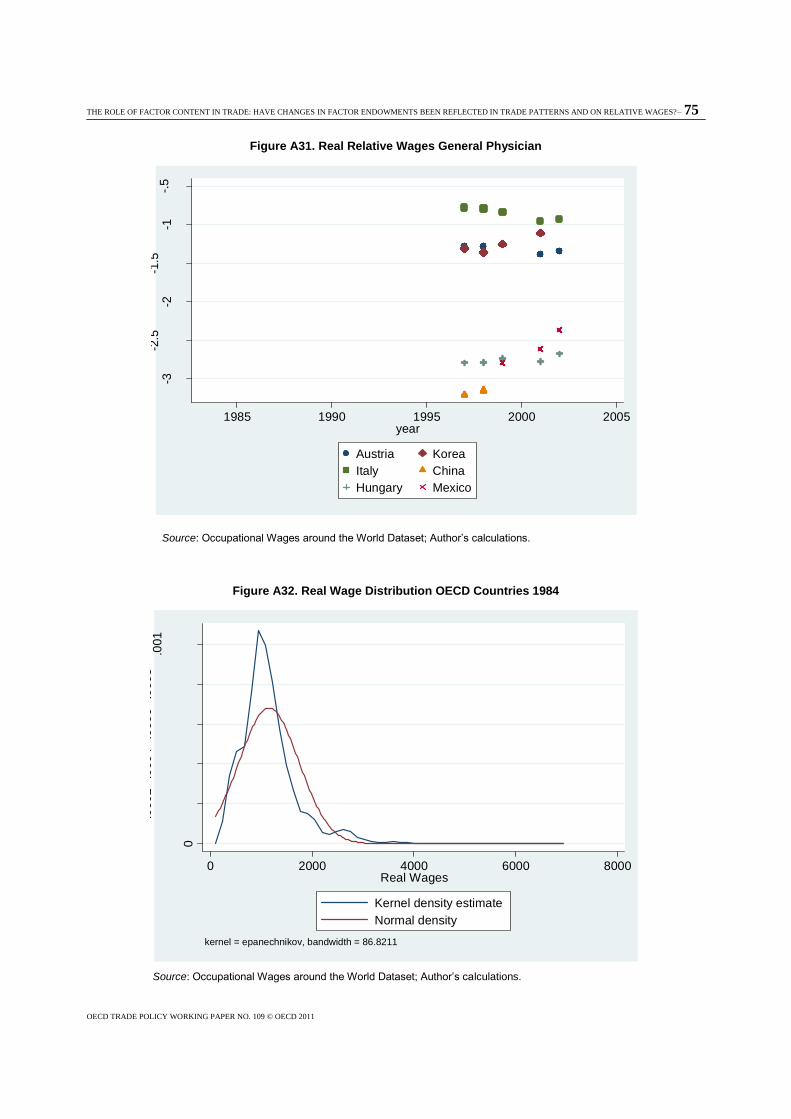
THE ROLE OF FACTOR CONTENT IN TRADE: HAVE CHANGES IN FACTOR ENDOWMENTS BEEN REFLECTED IN TRADE PATTERNS AND ON RELATIVE WAGES?– 75
OECD TRADE POLICY WORKING PAPER NO. 109 © OECD 2011
Figure A31. Real Relative Wages General Physician
-3-2
.5-2
-1.5
-1-.
5
1985 1990 1995 2000 2005year
Austria Korea
Italy China
Hungary Mexico
Source: Occupational Wages around the World Dataset; Author’s calculations.
Figure A32. Real Wage Distribution OECD Countries 1984
0
.000
2.0
00
4.0
00
6.0
00
8.0
01
De
nsity
0 2000 4000 6000 8000Real Wages
Kernel density estimate
Normal density
kernel = epanechnikov, bandwidth = 86.8211
Source: Occupational Wages around the World Dataset; Author’s calculations.
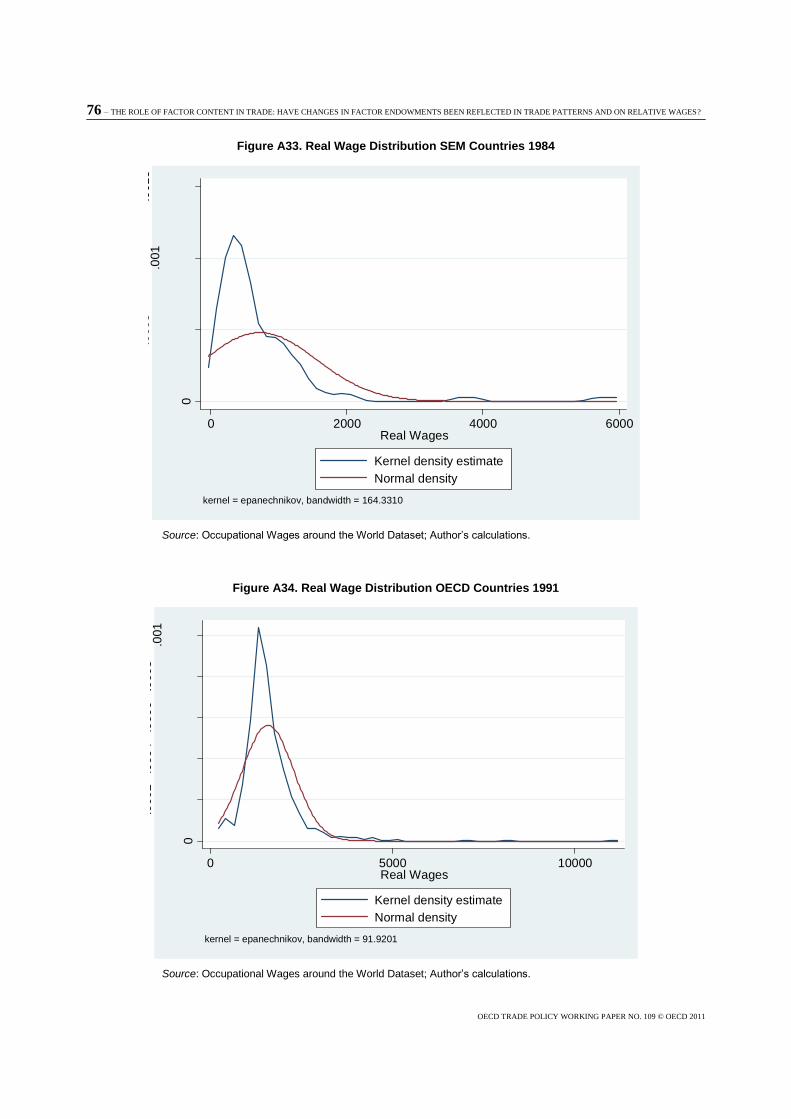
76 – THE ROLE OF FACTOR CONTENT IN TRADE: HAVE CHANGES IN FACTOR ENDOWMENTS BEEN REFLECTED IN TRADE PATTERNS AND ON RELATIVE WAGES?
OECD TRADE POLICY WORKING PAPER NO. 109 © OECD 2011
Figure A33. Real Wage Distribution SEM Countries 1984
0
.000
5.0
01
.001
5
De
nsity
0 2000 4000 6000Real Wages
Kernel density estimate
Normal density
kernel = epanechnikov, bandwidth = 164.3310
Source: Occupational Wages around the World Dataset; Author’s calculations.
Figure A34. Real Wage Distribution OECD Countries 1991
0
.000
2.0
00
4.0
00
6.0
00
8.0
01
De
nsity
0 5000 10000Real Wages
Kernel density estimate
Normal density
kernel = epanechnikov, bandwidth = 91.9201
Source: Occupational Wages around the World Dataset; Author’s calculations.
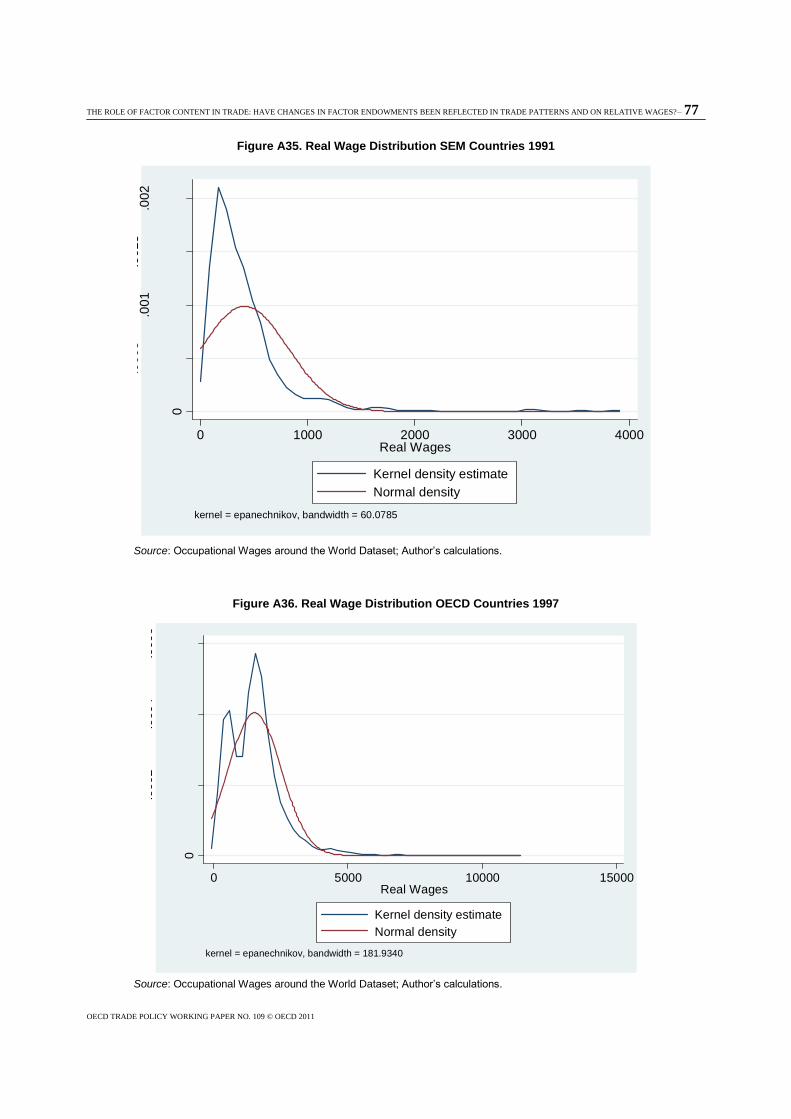
THE ROLE OF FACTOR CONTENT IN TRADE: HAVE CHANGES IN FACTOR ENDOWMENTS BEEN REFLECTED IN TRADE PATTERNS AND ON RELATIVE WAGES?– 77
OECD TRADE POLICY WORKING PAPER NO. 109 © OECD 2011
Figure A35. Real Wage Distribution SEM Countries 1991
0
.000
5.0
01
.001
5.0
02
De
nsity
0 1000 2000 3000 4000Real Wages
Kernel density estimate
Normal density
kernel = epanechnikov, bandwidth = 60.0785
Source: Occupational Wages around the World Dataset; Author’s calculations.
Figure A36. Real Wage Distribution OECD Countries 1997
0
.000
2.0
00
4.0
00
6
De
nsity
0 5000 10000 15000Real Wages
Kernel density estimate
Normal density
kernel = epanechnikov, bandwidth = 181.9340
Source: Occupational Wages around the World Dataset; Author’s calculations.

78 – THE ROLE OF FACTOR CONTENT IN TRADE: HAVE CHANGES IN FACTOR ENDOWMENTS BEEN REFLECTED IN TRADE PATTERNS AND ON RELATIVE WAGES?
OECD TRADE POLICY WORKING PAPER NO. 109 © OECD 2011
Figure A37. Real Wage Distribution SEM Countries 1997
0
.000
5.0
01
.001
5
De
nsity
0 1000 2000 3000 4000 5000Real Wages
Kernel density estimate
Normal density
kernel = epanechnikov, bandwidth = 104.1781
Source: Occupational Wages around the World Dataset; Author’s calculations.
Figure A38. Real Wage Distribution OECD Countries 2001
0
.000
1.0
00
2.0
00
3.0
00
4
De
nsity
0 5000 10000 15000 20000 25000Real Wages
Kernel density estimate
Normal density
kernel = epanechnikov, bandwidth = 224.1537
Source: Occupational Wages around the World Dataset; Author’s calculations.
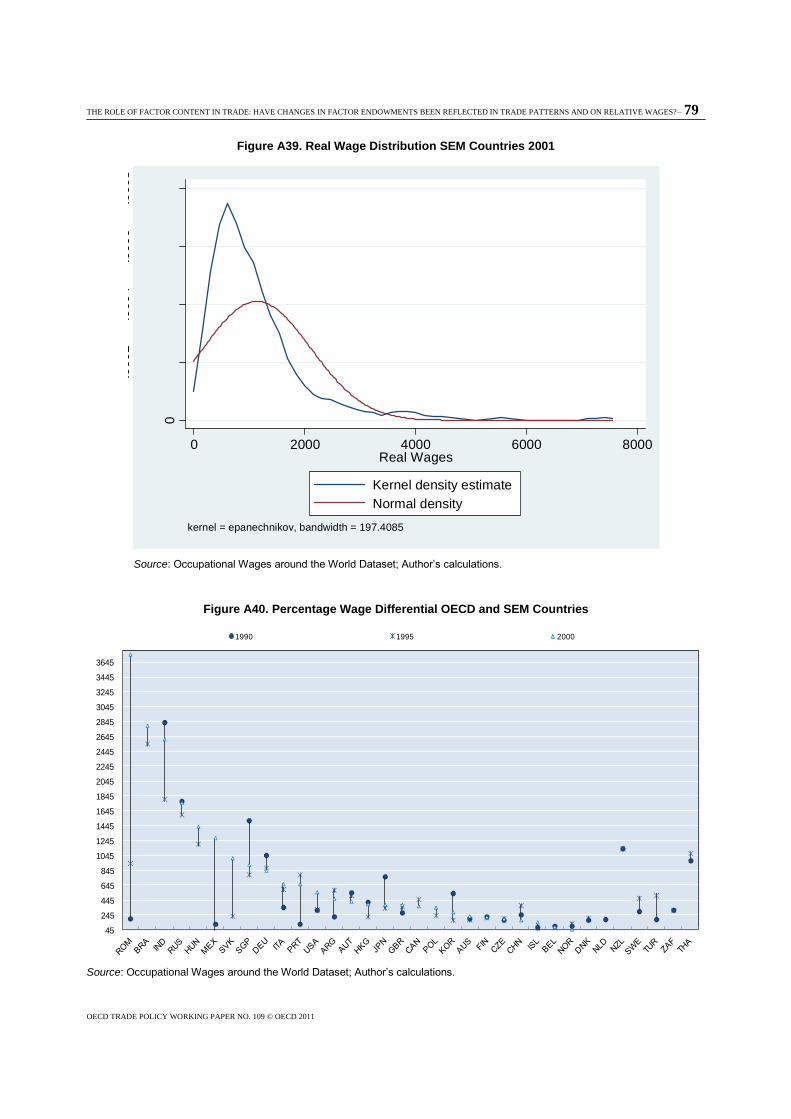
THE ROLE OF FACTOR CONTENT IN TRADE: HAVE CHANGES IN FACTOR ENDOWMENTS BEEN REFLECTED IN TRADE PATTERNS AND ON RELATIVE WAGES?– 79
OECD TRADE POLICY WORKING PAPER NO. 109 © OECD 2011
Figure A39. Real Wage Distribution SEM Countries 2001
0
.000
2.0
00
4.0
00
6.0
00
8
De
nsity
0 2000 4000 6000 8000Real Wages
Kernel density estimate
Normal density
kernel = epanechnikov, bandwidth = 197.4085
Source: Occupational Wages around the World Dataset; Author’s calculations.
Figure A40. Percentage Wage Differential OECD and SEM Countries
45
245
445
645
845
1045
1245
1445
1645
1845
2045
2245
2445
2645
2845
3045
3245
3445
3645
1990 1995 2000
Source: Occupational Wages around the World Dataset; Author’s calculations.
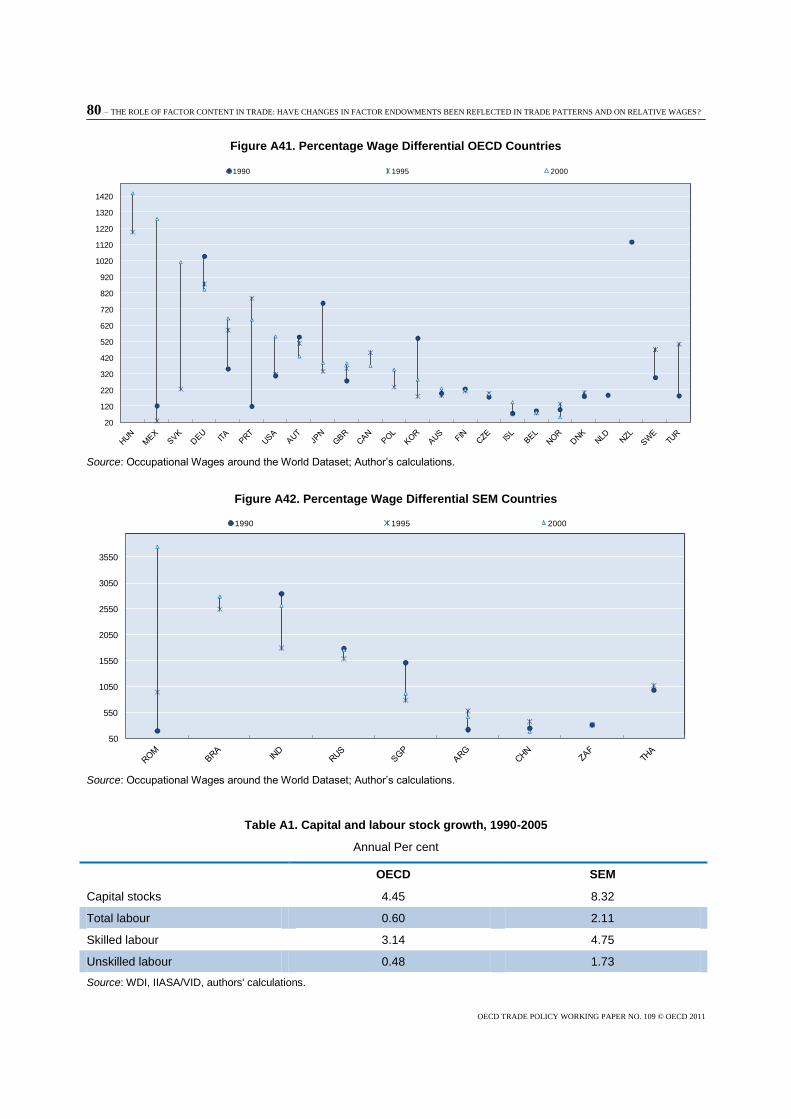
80 – THE ROLE OF FACTOR CONTENT IN TRADE: HAVE CHANGES IN FACTOR ENDOWMENTS BEEN REFLECTED IN TRADE PATTERNS AND ON RELATIVE WAGES?
OECD TRADE POLICY WORKING PAPER NO. 109 © OECD 2011
Figure A41. Percentage Wage Differential OECD Countries
20
120
220
320
420
520
620
720
820
920
1020
1120
1220
1320
1420
1990 1995 2000
Source: Occupational Wages around the World Dataset; Author’s calculations.
Figure A42. Percentage Wage Differential SEM Countries
50
550
1050
1550
2050
2550
3050
3550
1990 1995 2000
Source: Occupational Wages around the World Dataset; Author’s calculations.
Table A1. Capital and labour stock growth, 1990-2005
Annual Per cent
OECD SEM
Capital stocks 4.45 8.32
Total labour 0.60 2.11
Skilled labour 3.14 4.75
Unskilled labour 0.48 1.73
Source: WDI, IIASA/VID, authors' calculations.
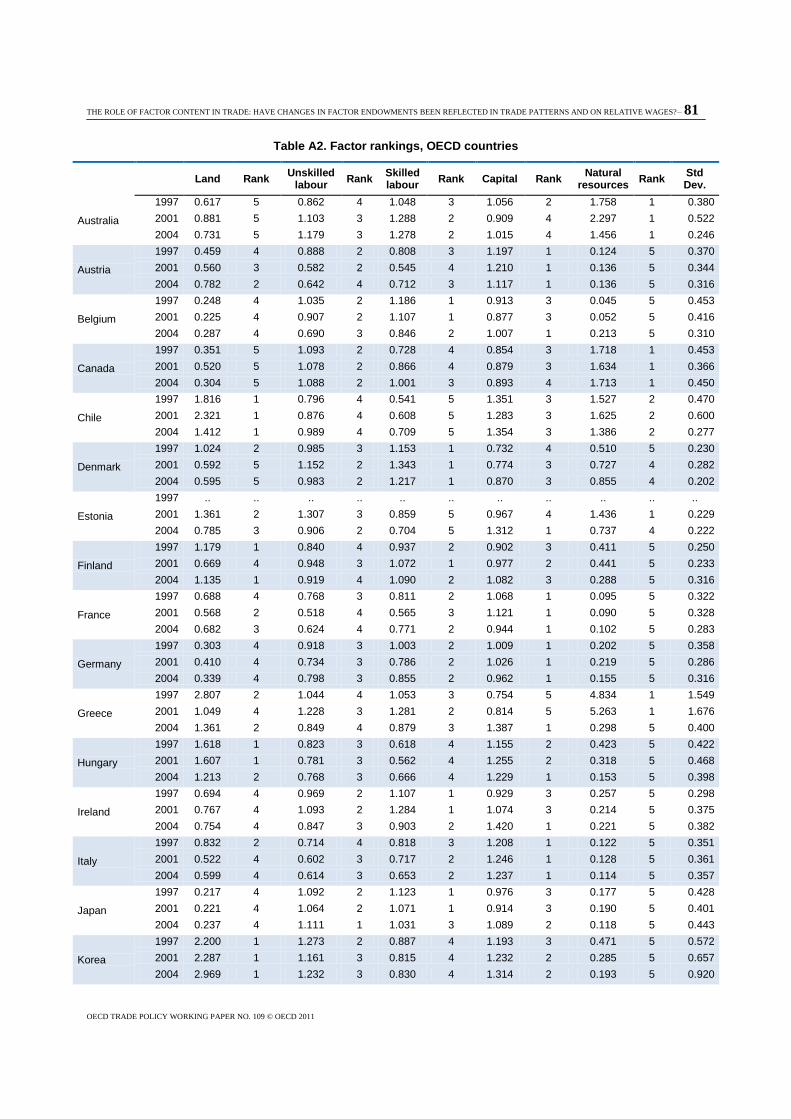
THE ROLE OF FACTOR CONTENT IN TRADE: HAVE CHANGES IN FACTOR ENDOWMENTS BEEN REFLECTED IN TRADE PATTERNS AND ON RELATIVE WAGES?– 81
OECD TRADE POLICY WORKING PAPER NO. 109 © OECD 2011
Table A2. Factor rankings, OECD countries
Land Rank Unskilled
labour Rank
Skilled labour
Rank Capital Rank Natural
resources Rank
Std Dev.
Australia
1997 0.617 5 0.862 4 1.048 3 1.056 2 1.758 1 0.380
2001 0.881 5 1.103 3 1.288 2 0.909 4 2.297 1 0.522
2004 0.731 5 1.179 3 1.278 2 1.015 4 1.456 1 0.246
Austria
1997 0.459 4 0.888 2 0.808 3 1.197 1 0.124 5 0.370
2001 0.560 3 0.582 2 0.545 4 1.210 1 0.136 5 0.344
2004 0.782 2 0.642 4 0.712 3 1.117 1 0.136 5 0.316
Belgium
1997 0.248 4 1.035 2 1.186 1 0.913 3 0.045 5 0.453
2001 0.225 4 0.907 2 1.107 1 0.877 3 0.052 5 0.416
2004 0.287 4 0.690 3 0.846 2 1.007 1 0.213 5 0.310
Canada
1997 0.351 5 1.093 2 0.728 4 0.854 3 1.718 1 0.453
2001 0.520 5 1.078 2 0.866 4 0.879 3 1.634 1 0.366
2004 0.304 5 1.088 2 1.001 3 0.893 4 1.713 1 0.450
Chile
1997 1.816 1 0.796 4 0.541 5 1.351 3 1.527 2 0.470
2001 2.321 1 0.876 4 0.608 5 1.283 3 1.625 2 0.600
2004 1.412 1 0.989 4 0.709 5 1.354 3 1.386 2 0.277
Denmark
1997 1.024 2 0.985 3 1.153 1 0.732 4 0.510 5 0.230
2001 0.592 5 1.152 2 1.343 1 0.774 3 0.727 4 0.282
2004 0.595 5 0.983 2 1.217 1 0.870 3 0.855 4 0.202
Estonia
1997 .. .. .. .. .. .. .. .. .. .. ..
2001 1.361 2 1.307 3 0.859 5 0.967 4 1.436 1 0.229
2004 0.785 3 0.906 2 0.704 5 1.312 1 0.737 4 0.222
Finland
1997 1.179 1 0.840 4 0.937 2 0.902 3 0.411 5 0.250
2001 0.669 4 0.948 3 1.072 1 0.977 2 0.441 5 0.233
2004 1.135 1 0.919 4 1.090 2 1.082 3 0.288 5 0.316
France
1997 0.688 4 0.768 3 0.811 2 1.068 1 0.095 5 0.322
2001 0.568 2 0.518 4 0.565 3 1.121 1 0.090 5 0.328
2004 0.682 3 0.624 4 0.771 2 0.944 1 0.102 5 0.283
Germany
1997 0.303 4 0.918 3 1.003 2 1.009 1 0.202 5 0.358
2001 0.410 4 0.734 3 0.786 2 1.026 1 0.219 5 0.286
2004 0.339 4 0.798 3 0.855 2 0.962 1 0.155 5 0.316
Greece
1997 2.807 2 1.044 4 1.053 3 0.754 5 4.834 1 1.549
2001 1.049 4 1.228 3 1.281 2 0.814 5 5.263 1 1.676
2004 1.361 2 0.849 4 0.879 3 1.387 1 0.298 5 0.400
Hungary
1997 1.618 1 0.823 3 0.618 4 1.155 2 0.423 5 0.422
2001 1.607 1 0.781 3 0.562 4 1.255 2 0.318 5 0.468
2004 1.213 2 0.768 3 0.666 4 1.229 1 0.153 5 0.398
Ireland
1997 0.694 4 0.969 2 1.107 1 0.929 3 0.257 5 0.298
2001 0.767 4 1.093 2 1.284 1 1.074 3 0.214 5 0.375
2004 0.754 4 0.847 3 0.903 2 1.420 1 0.221 5 0.382
Italy
1997 0.832 2 0.714 4 0.818 3 1.208 1 0.122 5 0.351
2001 0.522 4 0.602 3 0.717 2 1.246 1 0.128 5 0.361
2004 0.599 4 0.614 3 0.653 2 1.237 1 0.114 5 0.357
Japan
1997 0.217 4 1.092 2 1.123 1 0.976 3 0.177 5 0.428
2001 0.221 4 1.064 2 1.071 1 0.914 3 0.190 5 0.401
2004 0.237 4 1.111 1 1.031 3 1.089 2 0.118 5 0.443
Korea
1997 2.200 1 1.273 2 0.887 4 1.193 3 0.471 5 0.572
2001 2.287 1 1.161 3 0.815 4 1.232 2 0.285 5 0.657
2004 2.969 1 1.232 3 0.830 4 1.314 2 0.193 5 0.920
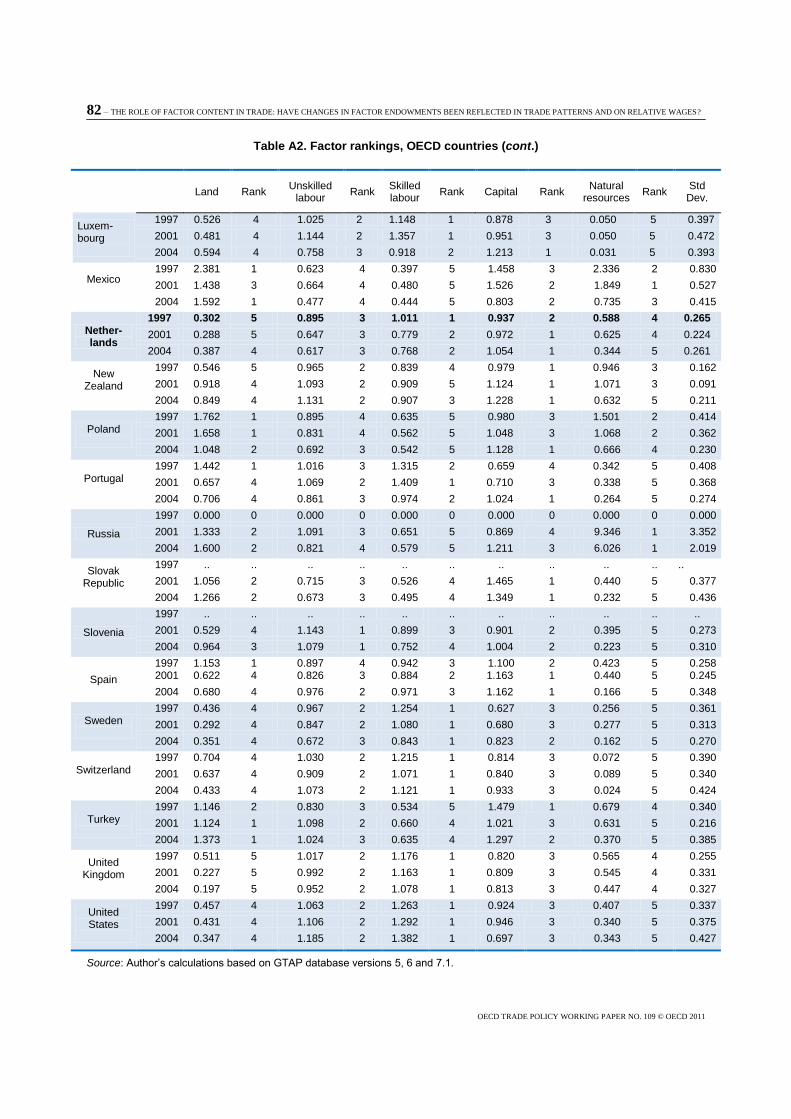
82 – THE ROLE OF FACTOR CONTENT IN TRADE: HAVE CHANGES IN FACTOR ENDOWMENTS BEEN REFLECTED IN TRADE PATTERNS AND ON RELATIVE WAGES?
OECD TRADE POLICY WORKING PAPER NO. 109 © OECD 2011
Table A2. Factor rankings, OECD countries (cont.)
Land Rank Unskilled
labour Rank
Skilled labour
Rank Capital Rank Natural
resources Rank
Std Dev.
Luxem-bourg
1997 0.526 4 1.025 2 1.148 1 0.878 3 0.050 5 0.397
2001 0.481 4 1.144 2 1.357 1 0.951 3 0.050 5 0.472
2004 0.594 4 0.758 3 0.918 2 1.213 1 0.031 5 0.393
Mexico 1997 2.381 1 0.623 4 0.397 5 1.458 3 2.336 2 0.830
2001 1.438 3 0.664 4 0.480 5 1.526 2 1.849 1 0.527
2004 1.592 1 0.477 4 0.444 5 0.803 2 0.735 3 0.415
Nether-lands
1997 0.302 5 0.895 3 1.011 1 0.937 2 0.588 4 0.265
2001 0.288 5 0.647 3 0.779 2 0.972 1 0.625 4 0.224
2004 0.387 4 0.617 3 0.768 2 1.054 1 0.344 5 0.261
New Zealand
1997 0.546 5 0.965 2 0.839 4 0.979 1 0.946 3 0.162
2001 0.918 4 1.093 2 0.909 5 1.124 1 1.071 3 0.091
2004 0.849 4 1.131 2 0.907 3 1.228 1 0.632 5 0.211
Poland
1997 1.762 1 0.895 4 0.635 5 0.980 3 1.501 2 0.414
2001 1.658 1 0.831 4 0.562 5 1.048 3 1.068 2 0.362
2004 1.048 2 0.692 3 0.542 5 1.128 1 0.666 4 0.230
Portugal
1997 1.442 1 1.016 3 1.315 2 0.659 4 0.342 5 0.408
2001 0.657 4 1.069 2 1.409 1 0.710 3 0.338 5 0.368
2004 0.706 4 0.861 3 0.974 2 1.024 1 0.264 5 0.274
Russia
1997 0.000 0 0.000 0 0.000 0 0.000 0 0.000 0 0.000
2001 1.333 2 1.091 3 0.651 5 0.869 4 9.346 1 3.352
2004 1.600 2 0.821 4 0.579 5 1.211 3 6.026 1 2.019
Slovak Republic
1997 .. .. .. .. .. .. .. .. .. .. ..
2001 1.056 2 0.715 3 0.526 4 1.465 1 0.440 5 0.377
2004 1.266 2 0.673 3 0.495 4 1.349 1 0.232 5 0.436
Slovenia
1997 .. .. .. .. .. .. .. .. .. .. ..
2001 0.529 4 1.143 1 0.899 3 0.901 2 0.395 5 0.273
2004 0.964 3 1.079 1 0.752 4 1.004 2 0.223 5 0.310
Spain
1997 1.153 1 0.897 4 0.942 3 1.100 2 0.423 5 0.258 2001 0.622 4 0.826 3 0.884 2 1.163 1 0.440 5 0.245
2004 0.680 4 0.976 2 0.971 3 1.162 1 0.166 5 0.348
Sweden
1997 0.436 4 0.967 2 1.254 1 0.627 3 0.256 5 0.361
2001 0.292 4 0.847 2 1.080 1 0.680 3 0.277 5 0.313
2004 0.351 4 0.672 3 0.843 1 0.823 2 0.162 5 0.270
Switzerland
1997 0.704 4 1.030 2 1.215 1 0.814 3 0.072 5 0.390
2001 0.637 4 0.909 2 1.071 1 0.840 3 0.089 5 0.340
2004 0.433 4 1.073 2 1.121 1 0.933 3 0.024 5 0.424
Turkey
1997 1.146 2 0.830 3 0.534 5 1.479 1 0.679 4 0.340
2001 1.124 1 1.098 2 0.660 4 1.021 3 0.631 5 0.216
2004 1.373 1 1.024 3 0.635 4 1.297 2 0.370 5 0.385
United Kingdom
1997 0.511 5 1.017 2 1.176 1 0.820 3 0.565 4 0.255
2001 0.227 5 0.992 2 1.163 1 0.809 3 0.545 4 0.331
2004 0.197 5 0.952 2 1.078 1 0.813 3 0.447 4 0.327
United States
1997 0.457 4 1.063 2 1.263 1 0.924 3 0.407 5 0.337
2001 0.431 4 1.106 2 1.292 1 0.946 3 0.340 5 0.375
2004 0.347 4 1.185 2 1.382 1 0.697 3 0.343 5 0.427
Source: Author’s calculations based on GTAP database versions 5, 6 and 7.1.
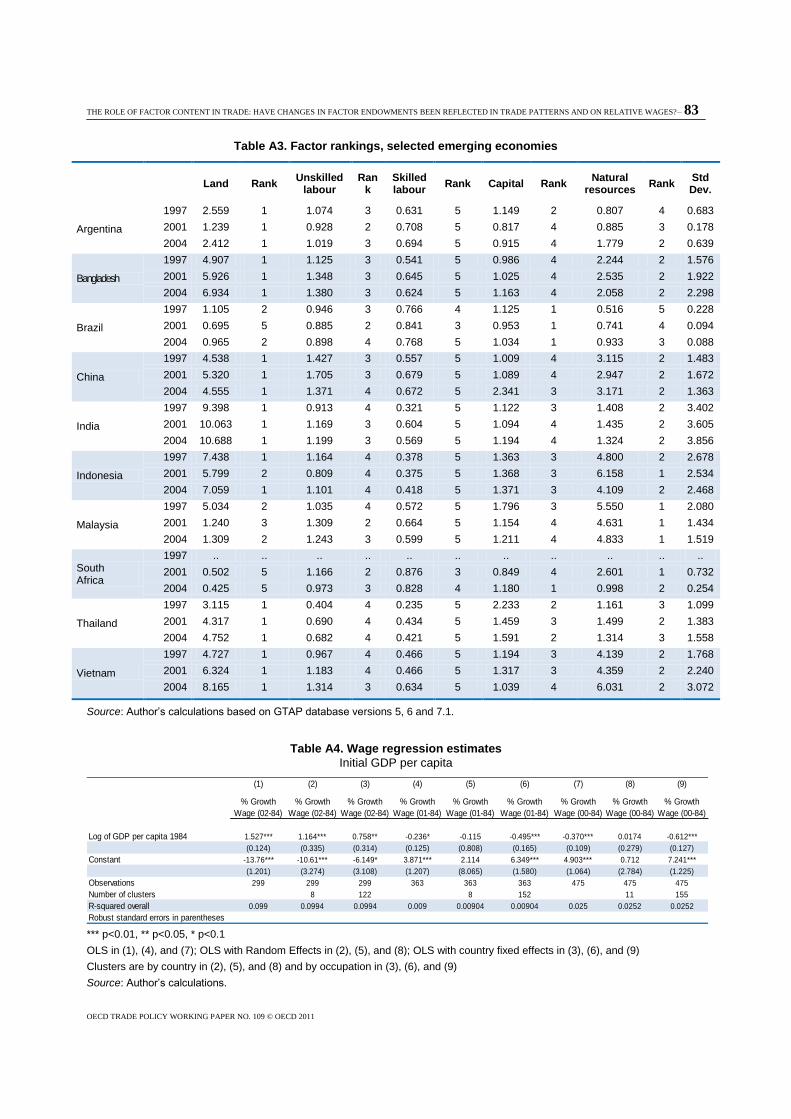
THE ROLE OF FACTOR CONTENT IN TRADE: HAVE CHANGES IN FACTOR ENDOWMENTS BEEN REFLECTED IN TRADE PATTERNS AND ON RELATIVE WAGES?– 83
OECD TRADE POLICY WORKING PAPER NO. 109 © OECD 2011
Table A3. Factor rankings, selected emerging economies
Land Rank Unskilled
labour Ran
k Skilled labour
Rank Capital Rank Natural
resources Rank
Std Dev.
Argentina
1997 2.559 1 1.074 3 0.631 5 1.149 2 0.807 4 0.683
2001 1.239 1 0.928 2 0.708 5 0.817 4 0.885 3 0.178
2004 2.412 1 1.019 3 0.694 5 0.915 4 1.779 2 0.639
Bangladesh
1997 4.907 1 1.125 3 0.541 5 0.986 4 2.244 2 1.576
2001 5.926 1 1.348 3 0.645 5 1.025 4 2.535 2 1.922
2004 6.934 1 1.380 3 0.624 5 1.163 4 2.058 2 2.298
Brazil
1997 1.105 2 0.946 3 0.766 4 1.125 1 0.516 5 0.228
2001 0.695 5 0.885 2 0.841 3 0.953 1 0.741 4 0.094
2004 0.965 2 0.898 4 0.768 5 1.034 1 0.933 3 0.088
China
1997 4.538 1 1.427 3 0.557 5 1.009 4 3.115 2 1.483
2001 5.320 1 1.705 3 0.679 5 1.089 4 2.947 2 1.672
2004 4.555 1 1.371 4 0.672 5 2.341 3 3.171 2 1.363
India
1997 9.398 1 0.913 4 0.321 5 1.122 3 1.408 2 3.402
2001 10.063 1 1.169 3 0.604 5 1.094 4 1.435 2 3.605
2004 10.688 1 1.199 3 0.569 5 1.194 4 1.324 2 3.856
Indonesia
1997 7.438 1 1.164 4 0.378 5 1.363 3 4.800 2 2.678
2001 5.799 2 0.809 4 0.375 5 1.368 3 6.158 1 2.534
2004 7.059 1 1.101 4 0.418 5 1.371 3 4.109 2 2.468
Malaysia
1997 5.034 2 1.035 4 0.572 5 1.796 3 5.550 1 2.080
2001 1.240 3 1.309 2 0.664 5 1.154 4 4.631 1 1.434
2004 1.309 2 1.243 3 0.599 5 1.211 4 4.833 1 1.519
South Africa
1997 .. .. .. .. .. .. .. .. .. .. ..
2001 0.502 5 1.166 2 0.876 3 0.849 4 2.601 1 0.732
2004 0.425 5 0.973 3 0.828 4 1.180 1 0.998 2 0.254
Thailand
1997 3.115 1 0.404 4 0.235 5 2.233 2 1.161 3 1.099
2001 4.317 1 0.690 4 0.434 5 1.459 3 1.499 2 1.383
2004 4.752 1 0.682 4 0.421 5 1.591 2 1.314 3 1.558
Vietnam
1997 4.727 1 0.967 4 0.466 5 1.194 3 4.139 2 1.768
2001 6.324 1 1.183 4 0.466 5 1.317 3 4.359 2 2.240
2004 8.165 1 1.314 3 0.634 5 1.039 4 6.031 2 3.072
Source: Author’s calculations based on GTAP database versions 5, 6 and 7.1.
Table A4. Wage regression estimates
Initial GDP per capita
(1) (2) (3) (4) (5) (6) (7) (8) (9)
% Growth
Wage (02-84)
% Growth
Wage (02-84)
% Growth
Wage (02-84)
% Growth
Wage (01-84)
% Growth
Wage (01-84)
% Growth
Wage (01-84)
% Growth
Wage (00-84)
% Growth
Wage (00-84)
% Growth
Wage (00-84)
Log of GDP per capita 1984 1.527*** 1.164*** 0.758** -0.236* -0.115 -0.495*** -0.370*** 0.0174 -0.612***
(0.124) (0.335) (0.314) (0.125) (0.808) (0.165) (0.109) (0.279) (0.127)
Constant -13.76*** -10.61*** -6.149* 3.871*** 2.114 6.349*** 4.903*** 0.712 7.241***
(1.201) (3.274) (3.108) (1.207) (8.065) (1.580) (1.064) (2.784) (1.225)
Observations 299 299 299 363 363 363 475 475 475
Number of clusters 8 122 8 152 11 155
R-squared overall 0.099 0.0994 0.0994 0.009 0.00904 0.00904 0.025 0.0252 0.0252
Robust standard errors in parentheses *** p<0.01, ** p<0.05, * p<0.1
OLS in (1), (4), and (7); OLS with Random Effects in (2), (5), and (8); OLS with country fixed effects in (3), (6), and (9)
Clusters are by country in (2), (5), and (8) and by occupation in (3), (6), and (9)
Source: Author’s calculations.
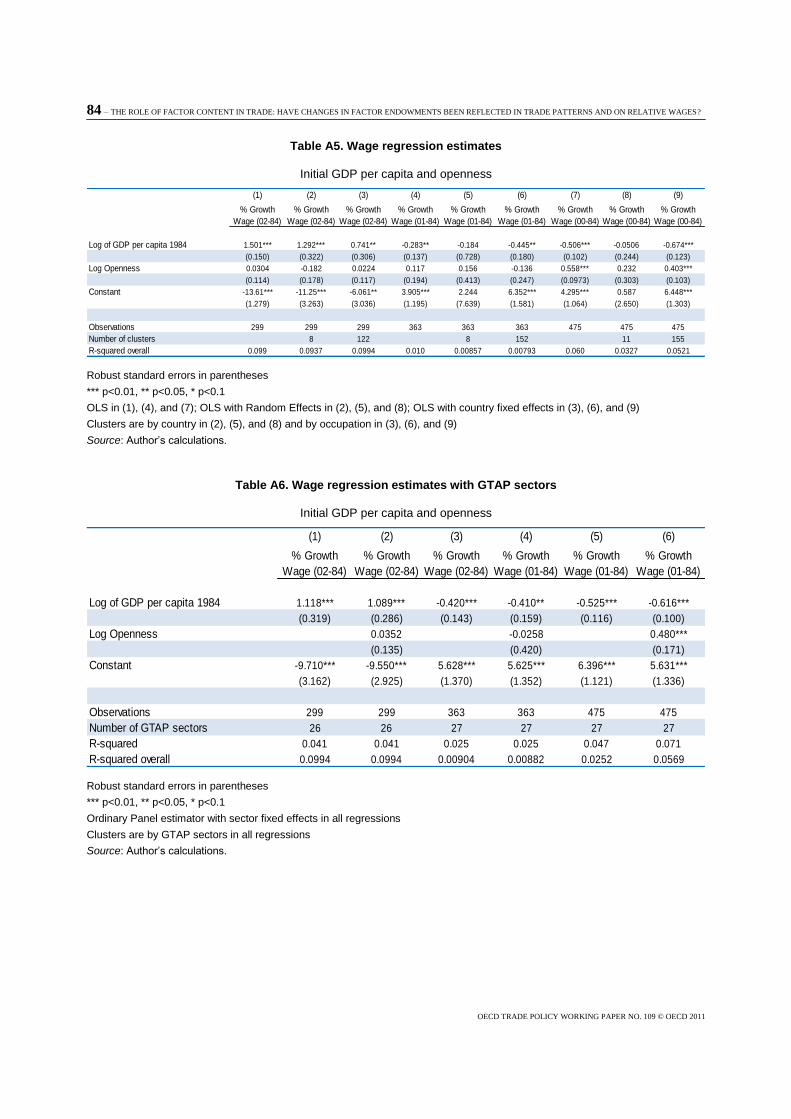
84 – THE ROLE OF FACTOR CONTENT IN TRADE: HAVE CHANGES IN FACTOR ENDOWMENTS BEEN REFLECTED IN TRADE PATTERNS AND ON RELATIVE WAGES?
OECD TRADE POLICY WORKING PAPER NO. 109 © OECD 2011
Table A5. Wage regression estimates
Initial GDP per capita and openness
(1) (2) (3) (4) (5) (6) (7) (8) (9)
% Growth
Wage (02-84)
% Growth
Wage (02-84)
% Growth
Wage (02-84)
% Growth
Wage (01-84)
% Growth
Wage (01-84)
% Growth
Wage (01-84)
% Growth
Wage (00-84)
% Growth
Wage (00-84)
% Growth
Wage (00-84)
Log of GDP per capita 1984 1.501*** 1.292*** 0.741** -0.283** -0.184 -0.445** -0.506*** -0.0506 -0.674***
(0.150) (0.322) (0.306) (0.137) (0.728) (0.180) (0.102) (0.244) (0.123)
Log Openness 0.0304 -0.182 0.0224 0.117 0.156 -0.136 0.558*** 0.232 0.403***
(0.114) (0.178) (0.117) (0.194) (0.413) (0.247) (0.0973) (0.303) (0.103)
Constant -13.61*** -11.25*** -6.061** 3.905*** 2.244 6.352*** 4.295*** 0.587 6.448***
(1.279) (3.263) (3.036) (1.195) (7.639) (1.581) (1.064) (2.650) (1.303)
Observations 299 299 299 363 363 363 475 475 475
Number of clusters 8 122 8 152 11 155
R-squared overall 0.099 0.0937 0.0994 0.010 0.00857 0.00793 0.060 0.0327 0.0521
Robust standard errors in parentheses
*** p<0.01, ** p<0.05, * p<0.1
OLS in (1), (4), and (7); OLS with Random Effects in (2), (5), and (8); OLS with country fixed effects in (3), (6), and (9)
Clusters are by country in (2), (5), and (8) and by occupation in (3), (6), and (9)
Source: Author’s calculations.
Table A6. Wage regression estimates with GTAP sectors
Initial GDP per capita and openness
(1) (2) (3) (4) (5) (6)
% Growth
Wage (02-84)
% Growth
Wage (02-84)
% Growth
Wage (02-84)
% Growth
Wage (01-84)
% Growth
Wage (01-84)
% Growth
Wage (01-84)
Log of GDP per capita 1984 1.118*** 1.089*** -0.420*** -0.410** -0.525*** -0.616***
(0.319) (0.286) (0.143) (0.159) (0.116) (0.100)
Log Openness 0.0352 -0.0258 0.480***
(0.135) (0.420) (0.171)
Constant -9.710*** -9.550*** 5.628*** 5.625*** 6.396*** 5.631***
(3.162) (2.925) (1.370) (1.352) (1.121) (1.336)
Observations 299 299 363 363 475 475
Number of GTAP sectors 26 26 27 27 27 27
R-squared 0.041 0.041 0.025 0.025 0.047 0.071
R-squared overall 0.0994 0.0994 0.00904 0.00882 0.0252 0.0569
Robust standard errors in parentheses
*** p<0.01, ** p<0.05, * p<0.1
Ordinary Panel estimator with sector fixed effects in all regressions
Clusters are by GTAP sectors in all regressions
Source: Author’s calculations.


