Embed Size (px)
Citation preview

12Calculation and aggregation of PPPs
Eurostat-OECD Methodological Manual on Purchasing Power Parities 167
Chapter 8: Education
Education

Education 8
Eurostat-OECD Methodological Manual on Purchasing Power Parities 169
8.1 Introduction
8.1 Education is primarily a non-market service with the majority of pupils and students in participating countries receiving their education free or at prices that are not economically significant from non-market producers. Without economically-significant prices to value output, the expenditure on education provided by non-market producers cannot be derived as it is for market producers by summing their sales. To get round the problem, national accountants have adopted the convention of estimating expenditures on non-market services by summing their costs of production. Previously, to preserve consistency with the prices underlying the expenditure estimates, Eurostat and the OECD calculated PPPs for education and other non-market services with input prices: the input-price approach.
8.2 In practice, with this approach, only prices for the principal cost component – compensation of employees – are collected.1 PPPs are calculated with the prices (wages, salaries and allowances) that general government pays employees in selected occupations, such as teaching professionals, school administrators and support staff in the case of education. The volume measures generated by these PPPs are volume measures for inputs and do not reflect productivity differences between the non-market producers of participating countries. In the absence of any adjustment for productivity, this is widely perceived as a serious weakness of the approach. It is, in effect, assuming that productivity is uniform across the producers of non-market services in different countries which is unrealistic. Even so, it is only recently, that alternative approaches for non-market services have emerged and been adopted by the Programme. The new approaches concern individual services such as health and education. The input-price approach is still used for collective services as described in Chapter 9.2
8.3 Eurostat and the OECD stopped using the input-price approach for education in 2008. It has been replaced by an output method or, more precisely, a quantity method with quality adjustments. The method provides direct measures of the volume of education output where the definition of education output is the same as that of the Eurostat national accounts handbook on price and volume measures3. It has the additional advantage that it draws on data from in-house databases which eases the Programme’s response burden for most participating countries. This chapter describes the approach, the data used, the derivation of the quantity measures, the quality adjustments made, and the calculation of the PPPs and volume measures.
8.2 The output method
8.4 Education like other non-market services is considered to be comparison resistant. While this is principally because there are no economically-significant prices with which to value output, it is also because the units of output are difficult to define and measure and because the differences in the quality of output between countries cannot be easily identified and quantified. Education provided by market producers faces similar difficulties when it comes to defining and measuring output and to identifying and quantifying quality differences among countries. This suggests that any method developed for non-market producers of education that defines and measures output would be applicable to market producers as well. Employing a common method avoids any bias that differences in the relative shares of market and non-market producers between countries may introduce to the comparison if their education outputs are treated differently.
8.5 The output method that Eurostat and the OECD employ for education makes no distinction between market and non-market producers. The individual consumption expenditures on education
1 Reference PPPs are used for the other cost components as explained in Chapter 9, Section 9.3. 2 And, until the output approach being developed for health is introduced in 2013, for hospital services. See Chapter 7,
Sections 7.5 and 7.6.
3 Handbook on price and volume measures in national accounts, Eurostat, Luxembourg, 2001: http://epp.eurostat.ec.europa.eu/portal/page/portal/product_details/publication?p_product_code=KS-41-01-543. See as well Chapters 2 and 3, Towards measuring the volume output of education and health services: a handbook, Paul Schreyer, Statistics Directorate Working Paper No 31, OECD, Paris, April 2010.
Education 8
Eurostat-OECD Methodological Manual on Purchasing Power Parities 170
by households, by non-profit making institutions serving households (NPISHs) and by general government – each of which is a separate basic heading in the Eurostat-OECD classification of GDP expenditures - are added together to obtain actual individual consumption of education (AICE). PPPs and volume measures are calculated for AICE as a whole. Volume measures for the component individual consumption expenditures are subsequently derived with the overall PPPs for AICE. The approach reflects that education is an individual service that is consumed by individual and identifiable households. It is fully consistent with the Programme’s objective to provide a measure of material well-being that compares what households in participating countries actually consume rather than what they purchase.4
8.6 For the national accountant, education consists “principally of teaching provided by the producers of education services – schools, colleges, universities - to the pupils and students who consume such services”5. The Eurostat handbook defines education output as “the quantity of teaching received by the students, adjusted to allow for the qualities of the services provided for each type of education”6. A measure of output has therefore to take into account the quantity of teaching provided by the producers of education, the quality of the education provided by their producers and the level and field of education for which education is provided.
8.7 The quantity of teaching can be expressed as the number of hours that teachers spend teaching or as the number of hours that students spend being taught. Teaching is usually undertaken in groups and the groups can vary in size. This is not reflected in the number of hours spent teaching because it does not take into account the number of students being taught. The number of hours that students spend being taught, on the other hand, does and so it is considered to be the appropriate measure of education output. Data on student-hours are not available for all levels of education among participating countries. So for the Eurostat-OECD output method, the number of students is measured in full-time equivalents (FTEs). Although close to the concept of student hours, FTEs are not necessarily fully comparable across countries because the number of hours within a FTE can differ from one country to another, particularly at the tertiary level. Even so, they are regarded as an acceptable approximation of student hours in general and compatible with the use of outcome based quality indicators.
8.8 Measuring the quality of education is not so straightforward. The issue itself is highly sensitive and its measurement is full of conceptual and practical pitfalls. Yet an output method based on the quantity of teaching alone would be difficult to justify given that significant differences in the quality of education are thought to exist between countries. The Eurostat handbook recommends using outcomes to adjust for quality, stating that “the quality of the output lies in its results, that is, in the outcome. The most appropriate way of adjusting for quality is to investigate changes in outcome indicators.”7 For education, this implies investigating international examination or test results such as those conducted for international studies of student attainment levels.
8.9 Three such studies were reviewed to determine which would best provide the outcome indicators required for the Eurostat-OECD output method. These were PISA8, PIRLS9 and TIMSS10. 4 Chapter 1, paragraph 1.6. 5 Paragraph 16.137, System of National Accounts 1993, Commission of the European Communities, International Monetary
Fund, Organisation for Economic Co-operation and Development, United Nations, World Bank, 1993. 6 Section 4.12. 7 Section 3.1.2.2. 8 The Programme for International Student Assessment (PISA) is managed by the OECD. Tests are administered to 15 year
olds in schools and cover three topics: mathematics, reading and science. Typically between 4,500 and 10,000 students sit the tests per country. The first assessment was in 2000 and covered 43 countries, the second was in 2003 and covered 41 countries, the third was in 2006 and covered 57 countries, and fourth was in 2009 and covered 65 countries. 43 out of the 47 countries participating in the Eurostat–OECD PPP Programme were covered in the 2009 assessment.
9 The Progress in International Reading Literacy Study (PIRLS) gives qualitative indicators for primary schools. PIRLS 2001 covered 35 countries and tested 150,000 9 and 10 year olds in schools. PIRLS 2006 covered 40 countries and PIRLS 2011 covered 50 countries (of which 30 participate in the Eurostat-OECD PPP Programme). The project is managed by the International Study Centre at Boston College in partnership with the International Association for the Evaluation of Education Achievement.
10 The Trends in International Mathematics and Science Study (TIMSS) tests 9 year olds and 13 year olds. The study was conducted in 1995 (45 countries), 1999 (38 countries), 2003 (49 countries), 2007 (60 countries) and 2011 (65 countries of which 34 participate in the Eurostat-OECD PPP Programme). Like PIRLS, it is managed by the International Study Centre at Boston College and the International Association for the Evaluation of Education Achievement.
Education 8
Eurostat-OECD Methodological Manual on Purchasing Power Parities 171
Of the three, PISA was found to have the widest coverage of education fields, of education levels and of countries participating in the PPP Programme. PISA also provides assessments that are corrected for the economic, social and cultural status (ESCS) of students thereby making possible a better evaluation of the quality of the teaching. The quality adjustments made at the primary and secondary levels of education for the Eurostat-OECD output method are based on ESCS corrected PISA scores.
8.10 The Eurostat-OECD output method requires education to be stratified into homogeneous groups by education levels and educational fields as this will improve comparability between countries and facilitate quality adjustments. The international classification of education currently used in participating countries is ISCED-9711. It identifies seven education levels and 25 education fields. In practice, a lack of comparable basic data across participating countries limits detailed stratification. Only the following levels of education are used by Eurostat and the OECD:
• ISCED 0 Pre-primary education; • ISCED 1 Primary education; • ISCED 2 Lower secondary education; • ISCED 3+4 Upper secondary education and post-secondary non-tertiary education; • ISCED 5+6 First and second stage of tertiary education (and unclassified).
8.11 For the purpose of calculating PPPs and volume measures for education, the ISCED levels can be regarded as products under the basic heading AICE. Eurostat and OECD make quality adjustments only for education levels ISCED 1 and ISCED 2. Together these two levels account for between 40 to 50 per cent of the total number of FTE students in most participating countries. In a few countries, they account for 55 to 60 per cent. This coverage illustrates that, the Eurostat-OECD output method, while an improvement on the input-price approach employed previously, is still a work in progress. Quality adjustments for the upper secondary and tertiary levels of education have to be investigated and, as can be seen from the next section, the basic data on which the method is based need improvement.
8.3 Data sources
8.12 The Eurostat-OECD output method is a quantity method with partial quality adjustments. Quantity measures are based on the number of FTE students per head of population, price measures are based on AICE expenditures per FTE student and quality adjustments are based on PISA ESCS corrected scores. In its simple form, the method does not require student numbers or expenditure data by ISCED level, but then the price and volume measures that result would not be quality adjusted. Eurostat and the OECD calculate these measures, but only as checks on those from the more complex method actually applied. This method requires data on FTE student numbers by ISCED level, AICE by ISCED level, PISA scores (both with and without the ESCS correction), population totals and exchange rates.
8.13 The source for numbers of FTE students by ISCED level is the UNESCO-OECD-Eurostat (UOE) education database. It covers almost all the countries participating in the PPP Programme. Data for the few countries that are not included are obtained from their national statistical institutes. The FTE student numbers comprise both public sector students and private sector students. Occasionally the breakdown by ISCED level is available only for the public sector. When this happens, it is adjusted by the ratio between total public sector FTEs and total (public plus private) FTEs of a previous year.12
11 International Standard Classification of Education 1997, United Nations Educational, Scientific and Cultural Organisation
Institute for Statistics, May 2008, Re-edition. See also Classifying Educational Programmes: Manual for ISCED-97 Implementation in OECD Countries, Organisation for Economic Co-operation and Development, Paris, 1999.
12 The UOE database records the number of students registered at education institutions in each country. This includes students from other countries. For consistency sake, the expenditures used to calculate the PPPs should follow the same domestic concept.
Education 8
Eurostat-OECD Methodological Manual on Purchasing Power Parities 172
8.14 Usually student numbers in the UOE database are one year behind the reference year of the current comparison. FTE student numbers by ISCED level for the reference year are obtained by extrapolating the FTE numbers for the previous year in line with population growth. In other words, if t is the reference year, the latest FTE student numbers in the UOE database will refer to t-1. They will be extrapolated to t with population growth between t-1 and t as the extrapolator. FTE student numbers should refer to the calendar year and mostly do. In cases where numbers for the calendar year are not available, then those of the overlapping academic year are taken instead - that is, the FTE numbers for the academic year t-1 to t are taken for the calendar year t.
8.15 Sometimes student numbers are lacking completely for a country in year t-1 in which case reference has to be made to t-2 and the extrapolation made accordingly. It is more common for the ISCED breakdown to be incomplete. For example, a country reports primary and lower secondary student numbers together. This requires reference back to a previous year or, if that is unsuccessful because the country always reports the two levels together, then the breakdown of similar countries is applied. Sometimes the FTE numbers at the ISCED levels do not sum to the total. Consistency is imposed by defining the total as the sum of its components.
8.16 AICE expenditures by ISCED level are not usually available in the national accounts. Only totals - that is, the sum of the three basic headings covering the individual consumption expenditures on education by households, NPISHs and general government - are available. These are taken from the detailed expenditure data that participating countries report specifically for the calculation of PPPs and real expenditures. For a breakdown of education expenditure by ISCED level an alternative source is used. This is the UOE database. The education expenditures in the UOE database do not necessarily conform to national accounting concepts and definitions, but they are acceptable proxies and provide the structure with which to allocate the total AICE taken from the national accounts database over ISCED levels.
8.17 The expenditure data in the UOE database are not as up to date as the data on student numbers. They can be two if not three years behind the comparison reference year. This is not a serious drawback since it is the structure of the expenditure and not the level of expenditure that is required. The structure used for the reference year is that for latest year available in the UOE database. As with student numbers, the ISCED expenditure breakdowns can be incomplete with two ISCED levels being reported as one or inconsistent with the expenditures at the ISCED levels not adding up to the total. These omissions and inconsistencies are treated in the same way as they are for student numbers.
8.18 Expenditure on tertiary education, ISCED 5+6, in the UOE database includes expenditure on education and expenditure on research. Since it is education expenditure that is being compared, the expenditure on research has to be deducted. Data on research expenditure are available from the UOE database, but coverage of participating countries is incomplete and updates are infrequent. With the data that are available, an initial set of coefficients with which to adjust the expenditure share of tertiary education has been established for the year 2005. Recently, the UOE data has been combined with more recent data originating from R&D statistics to update the coefficients. In order to include all participating countries in the set, the coefficients for countries for which there is no information on research expenditure have been assumed to be the same as the average coefficient for all participating countries for which research expenditure is available.
8.19 Original PISA scores and the ESCS corrected PISA scores are extracted from the reports covering PISA 2000, PISA 2003, PISA 2006 and PISA 2009. The scores for participating countries not included in all PISA rounds, are assumed to be the same as their scores for the rounds in which they were included. The scores for participating countries not covered by any PISA round are assumed to be the same as the average scores of all participating countries covered by the round or the average scores of a subset of similar participating countries covered by round, whichever is the more appropriate.
8.20 Population totals and exchange rates are taken from in-house databases. Population totals refer to the average annual resident population of the economic territories covered by the GDPs of participating countries. The exchange rates are the annual averages of daily market or central rates compiled by the European Central Bank or the International Monetary Fund.
Education 8
Eurostat-OECD Methodological Manual on Purchasing Power Parities 173
8.4 Quality adjustment factors
8.21 PISA measures students’ levels of attainment at the age of 15 by testing them in mathematics, reading and science. The tests are the same in each country. Scores are placed on a scale with 500 as the average of OECD countries13 and 100 as the standard deviation. The choice of scale is arbitrary, any number could be set as average and any number as standard deviation. The choices have an impact on the perceived differences (distances) between countries, but not on their ranking nor on the ratios of their deviations from the average. The PISA score of a country can be seen as a measure of the level of skills and knowledge of 15 year olds. This level is not just the result of the most recent year of education, but rather the sum of all formal education received up to the age of 15, the knowledge and skills contributed by the student’s family and social environment and the student’s inherited skills.
8.22 The output measure should only reflect the skills and knowledge transferred by the school system through teaching, only skills and knowledge that can be attributed to formal education should be taken into account. PISA scores need to be corrected or adjusted so that the knowledge and skills contributed by the student’s family and social environment and the student’s inherited skills are excluded from the quality adjustment. To correct for the impact of family and social environment, a PISA score – the ESCS corrected score or ESCS score - has been developed that takes account of the differences in economic, social and cultural status. The original PISA scores are adjusted by assuming that the ESCS indicator is equal to the OECD average. Scores are thus adjusted for differences in the impact of ESCS across countries, but not for the average impact. The ESCS scores are assumed to reflect better the actual contribution of schools to the outcome of formal education and are therefore more suitable for quality adjustments. Ideally, the ESCS scores would also have to be corrected for the inherited skills of the student, but this is not feasible at the moment and no adjustment is made. It is assumed that inherited skills have the same impact in all countries.
8.23 For the Eurostat-OECD output method, the PISA ESCS scores are transformed into quality adjustment factors by normalising them to the average for the EU27 set to 100. The quality adjustments factors are used to adjust expenditure per student for ISCED levels 1 and 2. This is because the PISA tests are taken at the age of 15 and the results only capture the skills and knowledge acquired up to that age.
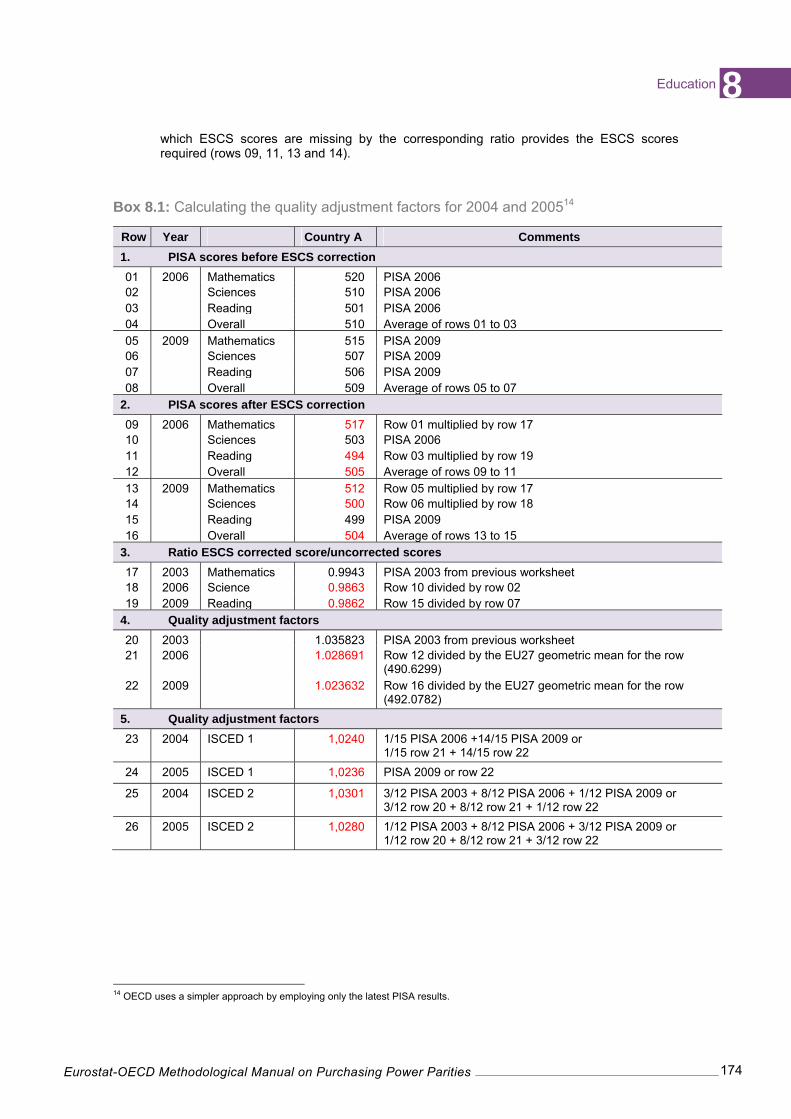
8.24 Box 8.1 provides a worked example of how quality adjustment factors are calculated for a single country, country A. The example covers the years 2004 and 2005, but the procedure illustrated is independent of the choice of year. The main steps are as follows:
• The calculation begins with the original scores and the ESCS scores for mathematics, science and reading for PISA 2006 and PISA 2009. The scores are taken from the reports on PISA 2006 (rows 01 to 04 and row 10) and PISA 2009 (rows 05 to 08 and row 15). The calculation also requires data based on PISA 2003. These are taken from a previous worksheet (rows 17 and 20).
• Original scores are available for the three subjects tested, but ESCS scores are only available for sciences in 2006 (row 10) and reading in 2009 (row 11). This is because in a PISA study ESCS corrections are only established for one of the three subjects surveyed. Reading was covered in PISA 2000 and PISA 2009, mathematics in PISA 2003 and science in 2006. ESCS scores have to be imputed for the missing subjects: mathematics and reading for 2006, mathematics and sciences for 2009.
• The imputations are done by assuming that the ESCS scores for the missing subjects retain the same relationship with the original scores as they had when ESCS scores were established for them. In other words, the ratio between the ESCS score for mathematics and the original score for mathematics of 2003 (row 17) holds for 2006 and 2009; the ratio between the ESCS score for sciences and the original score for sciences of 2006 (row 18) holds for 2009; and the ratio between the ESCS score for reading and the original score for reading of 2009 (row 19) holds for 2006. Multiplying the original scores for the subjects for
13 To strictly maintain fixity within the EU, the PISA scores should be scaled to the average of the EU27 instead of the average
of OECD countries. However, as not all EU Member States take part in the PISA survey, this is currently not possible.
Education 8
Eurostat-OECD Methodological Manual on Purchasing Power Parities 174
which ESCS scores are missing by the corresponding ratio provides the ESCS scores required (rows 09, 11, 13 and 14).
Box 8.1: Calculating the quality adjustment factors for 2004 and 200514
Row Year Country A Comments
1. PISA scores before ESCS correction
01 2006 Mathematics 520 PISA 200602 Sciences 510 PISA 200603 Reading 501 PISA 200604 Overall 510 Average of rows 01 to 0305 2009 Mathematics 515 PISA 200906 Sciences 507 PISA 200907 Reading 506 PISA 200908 Overall 509 Average of rows 05 to 07
2. PISA scores after ESCS correction
09 2006 Mathematics 517 Row 01 multiplied by row 17 10 Sciences 503 PISA 200611 Reading 494 Row 03 multiplied by row 19 12 Overall 505 Average of rows 09 to 1113 2009 Mathematics 512 Row 05 multiplied by row 1714 Sciences 500 Row 06 multiplied by row 1815 Reading 499 PISA 200916 Overall 504 Average of rows 13 to 15
3. Ratio ESCS corrected score/uncorrected scores
17 2003 Mathematics 0.9943 PISA 2003 from previous worksheet 18 2006 Science 0.9863 Row 10 divided by row 0219 2009 Reading 0.9862 Row 15 divided by row 07
4. Quality adjustment factors
20 2003 1.035823 PISA 2003 from previous worksheet 21 2006 1.028691 Row 12 divided by the EU27 geometric mean for the row
(490.6299) 22 2009 1.023632 Row 16 divided by the EU27 geometric mean for the row
(492.0782)
5. Quality adjustment factors
23 2004 ISCED 1 1,0240 1/15 PISA 2006 +14/15 PISA 2009 or 1/15 row 21 + 14/15 row 22
24 2005 ISCED 1 1,0236 PISA 2009 or row 22
25 2004 ISCED 2 1,0301 3/12 PISA 2003 + 8/12 PISA 2006 + 1/12 PISA 2009 or 3/12 row 20 + 8/12 row 21 + 1/12 row 22
26 2005 ISCED 2 1,0280 1/12 PISA 2003 + 8/12 PISA 2006 + 3/12 PISA 2009 or 1/12 row 20 + 8/12 row 21 + 3/12 row 22
14 OECD uses a simpler approach by employing only the latest PISA results.
Education 8
Eurostat-OECD Methodological Manual on Purchasing Power Parities 175
Box 8.2: Derivation of weights for quality adjustment factors for 2004 and 2005
Grade
2004 weights 2005 weights
Will be 15 in
PISA 2003
PISA 2006
PISA 2009
Will be 15 in
PISA 2003
PISA 2006
PISA 2009
01 2012 3/3 2013 3/3
02 2011 3/3 2012 3/3
03 2010 3/3 2011 3/3
04 2009 3/3 2010 3/3
05 2008 1/3 2/3 2009 3/3
ISCED 1 1/15 14/15 15/15
06 2007 2/3 1/3 2008 1/3 2/3
07 2006 3/3 2007 2/3 1/3
08 2005 1/3 2/3 2006 3/3
09 2004 2/3 1/3 2005 1/3 2/3
ISCED 2 3/12 8/12 1/12 1/12 8/12 3/12
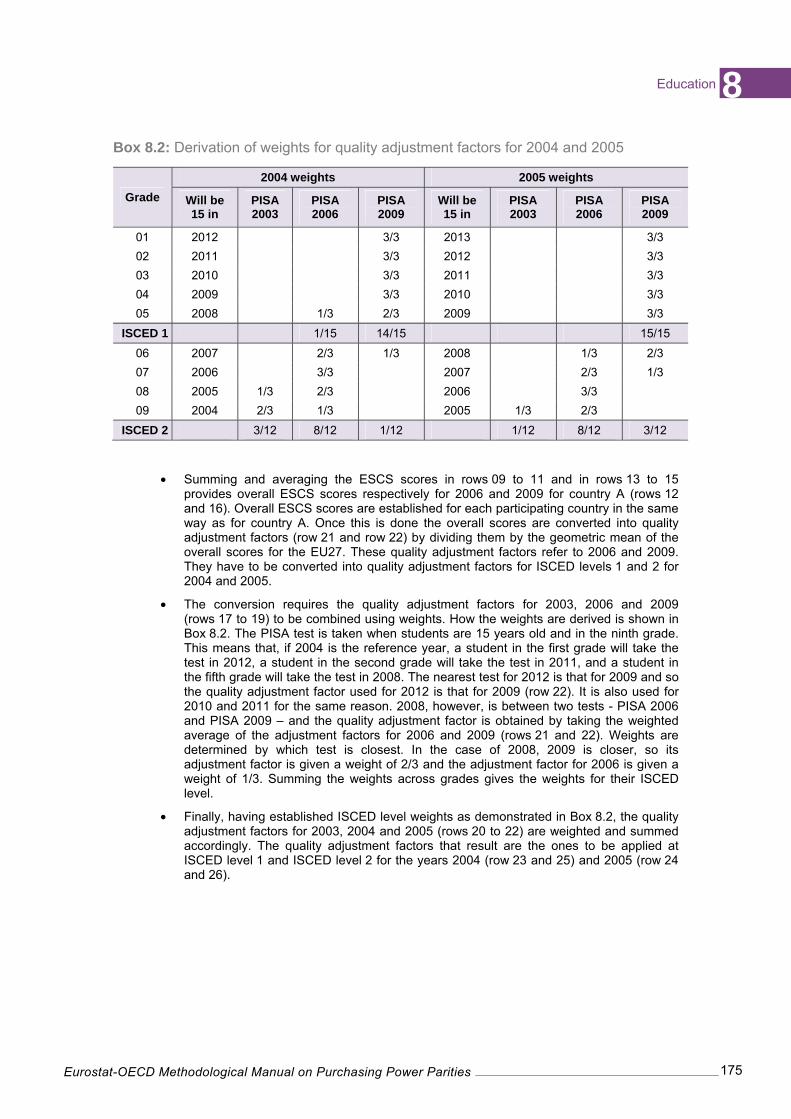
• Summing and averaging the ESCS scores in rows 09 to 11 and in rows 13 to 15 provides overall ESCS scores respectively for 2006 and 2009 for country A (rows 12 and 16). Overall ESCS scores are established for each participating country in the same way as for country A. Once this is done the overall scores are converted into quality adjustment factors (row 21 and row 22) by dividing them by the geometric mean of the overall scores for the EU27. These quality adjustment factors refer to 2006 and 2009. They have to be converted into quality adjustment factors for ISCED levels 1 and 2 for 2004 and 2005.
• The conversion requires the quality adjustment factors for 2003, 2006 and 2009 (rows 17 to 19) to be combined using weights. How the weights are derived is shown in Box 8.2. The PISA test is taken when students are 15 years old and in the ninth grade. This means that, if 2004 is the reference year, a student in the first grade will take the test in 2012, a student in the second grade will take the test in 2011, and a student in the fifth grade will take the test in 2008. The nearest test for 2012 is that for 2009 and so the quality adjustment factor used for 2012 is that for 2009 (row 22). It is also used for 2010 and 2011 for the same reason. 2008, however, is between two tests - PISA 2006 and PISA 2009 – and the quality adjustment factor is obtained by taking the weighted average of the adjustment factors for 2006 and 2009 (rows 21 and 22). Weights are determined by which test is closest. In the case of 2008, 2009 is closer, so its adjustment factor is given a weight of 2/3 and the adjustment factor for 2006 is given a weight of 1/3. Summing the weights across grades gives the weights for their ISCED level.
• Finally, having established ISCED level weights as demonstrated in Box 8.2, the quality adjustment factors for 2003, 2004 and 2005 (rows 20 to 22) are weighted and summed accordingly. The quality adjustment factors that result are the ones to be applied at ISCED level 1 and ISCED level 2 for the years 2004 (row 23 and 25) and 2005 (row 24 and 26).
Education 8
Eurostat-OECD Methodological Manual on Purchasing Power Parities 176
8.5 Calculating PPPs for education
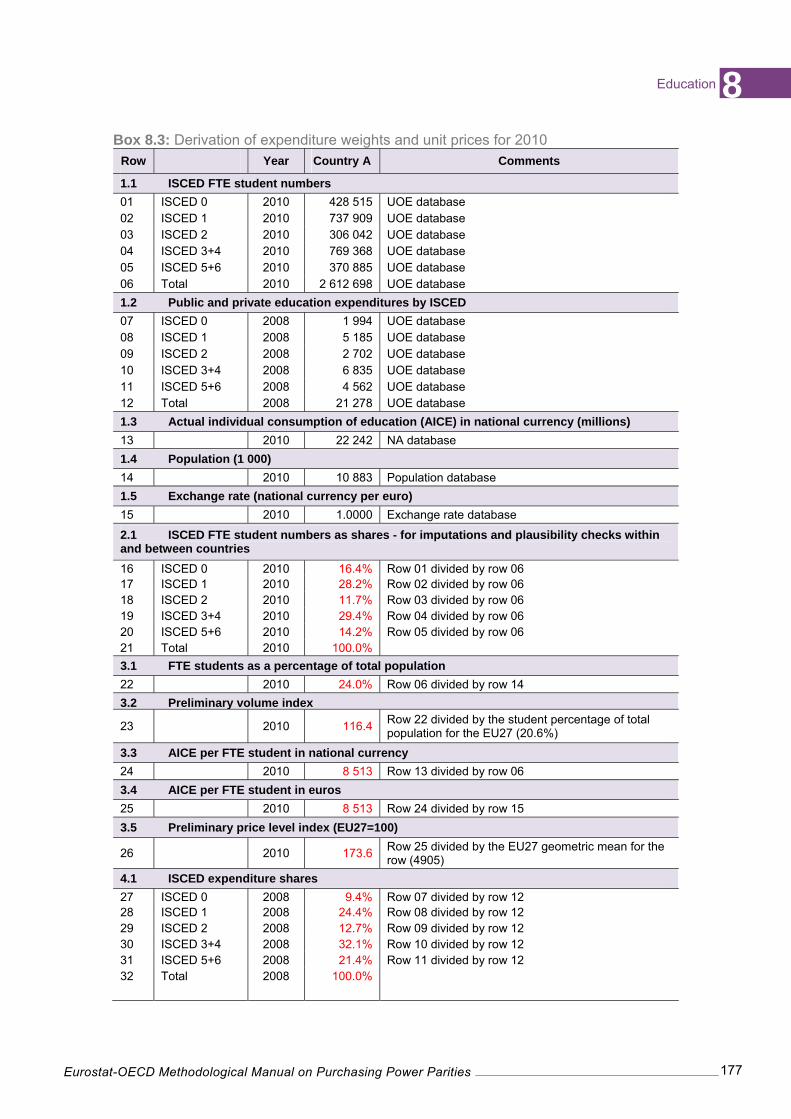
8.25 In order to be able to calculate a weighted quantity index and to apply quality adjustments at ISCED 1 and 2 levels, the practical implementation of the output method for education is similar to the price approach followed for actual and imputed rents in Chapter 6, Section 6.4.1. The PPPs for AICE are calculated on the basis of quality-adjusted expenditure per student at each ISCED level as unit prices and total expenditure for each ISCED level as weights. The derivation of the expenditure weights and unit prices is illustrated by the worked example in Box 8.3. The example covers a single country, country A, but the procedure is the same for all participating countries. Similarly the procedure is not affected by the choice of reference year which is 2010 in the example.
• The procedure starts after data on FTE student numbers by ISCED level (rows 01 to 06), private and public expenditure on education by ISCED level (rows 07 to 12), AICE in national currency (row 13), average annual resident population (row 14), and euro exchange rates (row 15) have been extracted from the UOE and other relevant in-house databases. The FTE numbers and expenditure data taken from the UOE database may not be up to date, with incomplete ISCED breakdowns and ISCED breakdowns that do not sum to the total. To help with the updating and the imputations needed to fill gaps and remove inconsistencies, as well as to assist with intra-country and inter-country plausibility checks, the shares at ISCED level of FTE student numbers of total FTE numbers are calculated (rows 16 to 20).
• After the extraction and cleaning of the price and expenditure data, a preliminary volume index (row 23) can be calculated by first expressing the total number of FTE students (row 06) as a percentage of total population (row 14) and then dividing the percentage (row 22) by the student/population percentage for the EU27. Similarly, a preliminary price level index (row 23) can be obtained by first calculating AICE per FTE student in national currency (row 24), then converting the per capita figure to euros (row 25) and finally expressing the per capita figure in euros as a index relative to the geometric mean of the per capita figures in euros for the EU27 (row 26). These two measures are used to check the volume indices and price level indices obtained by the EKS calculation that follows the procedure described here.
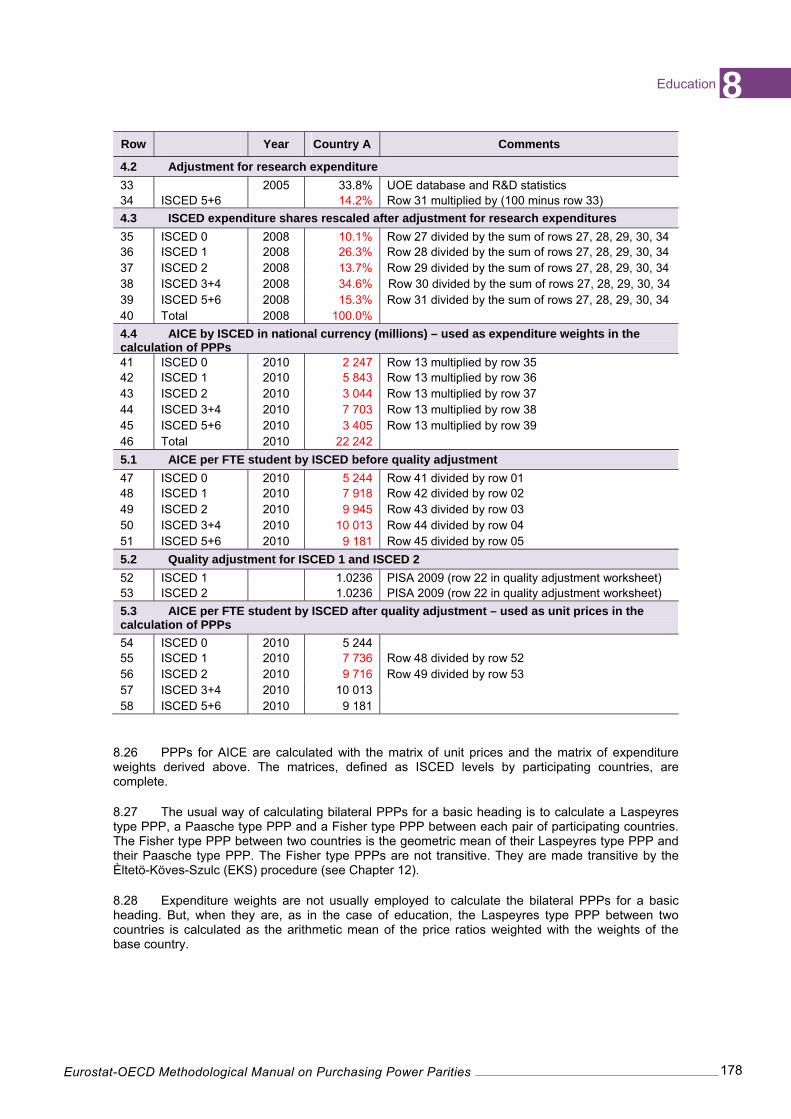
• The next step is to adjust the ISCED expenditures (rows 07 to 11) for research expenditure and to determine the expenditure weights with which to calculate PPPs. First, the expenditure on research is removed from the expenditure on ISCED 5+6 level. The expenditure data on which the adjustment is based are not current; they refer to an earlier year. Research expenditure is expressed as a percentage of total expenditure at the ISCED 5+6 level (row 33). The percentage is used to adjust the share of ISCED 5+6 level expenditure of the current year (row 31). As a result of the adjustment, the ISCED expenditure shares (rows 27 to 31) have to be rescaled. The rescaled shares (rows 35 to 39) are used to distribute AICE in national currency (row 13) by ISCED level (rows 41 to 45). The AICE at the ISCED levels are the expenditure weights used in the calculation of PPPs.
• The final step is to determine the unit prices for the PPP calculation. This involves the quality adjustment discussed in the previous section. Before the quality adjustment can be made, the AICE at ISCED levels (rows 41 to 45) have to be converted to AICE per FTE student by ISCED level (rows 47 to 51). The quality adjustment factor for ISCED level 1 (rows 52) is applied to the AICE per FTE student for ISCED level 1 (row 48) and the quality adjustment factor for ISCED level 2 (row 53) is applied to the AICE per FTE student for ISCED level 2 (row 49). (In this example, the two quality adjustment factors are the same, but, as can be seen from Box 8.2, they can be different.) The AICE per FTE student at ISCED levels following the quality adjustments to ISCED levels 1 and 2 are the unit prices used to calculate the PPPs.
Education 8
Eurostat-OECD Methodological Manual on Purchasing Power Parities 177
Box 8.3: Derivation of expenditure weights and unit prices for 2010 Row Year Country A Comments
1.1 ISCED FTE student numbers
01 ISCED 0 2010 428 515 UOE database 02 ISCED 1 2010 737 909 UOE database 03 ISCED 2 2010 306 042 UOE database 04 ISCED 3+4 2010 769 368 UOE database 05 ISCED 5+6 2010 370 885 UOE database 06 Total 2010 2 612 698 UOE database
1.2 Public and private education expenditures by ISCED
07 ISCED 0 2008 1 994 UOE database 08 ISCED 1 2008 5 185 UOE database 09 ISCED 2 2008 2 702 UOE database 10 ISCED 3+4 2008 6 835 UOE database 11 ISCED 5+6 2008 4 562 UOE database 12 Total 2008 21 278 UOE database
1.3 Actual individual consumption of education (AICE) in national currency (millions)
13 2010 22 242 NA database
1.4 Population (1 000)
14 2010 10 883 Population database
1.5 Exchange rate (national currency per euro)
15 2010 1.0000 Exchange rate database
2.1 ISCED FTE student numbers as shares - for imputations and plausibility checks within and between countries
16 ISCED 0 2010 16.4% Row 01 divided by row 06 17 ISCED 1 2010 28.2% Row 02 divided by row 06 18 ISCED 2 2010 11.7% Row 03 divided by row 06 19 ISCED 3+4 2010 29.4% Row 04 divided by row 06 20 ISCED 5+6 2010 14.2% Row 05 divided by row 06 21 Total 2010 100.0%
3.1 FTE students as a percentage of total population
22 2010 24.0% Row 06 divided by row 14
3.2 Preliminary volume index
23 2010 116.4 Row 22 divided by the student percentage of total population for the EU27 (20.6%)
3.3 AICE per FTE student in national currency
24 2010 8 513 Row 13 divided by row 06
3.4 AICE per FTE student in euros
25 2010 8 513 Row 24 divided by row 15
3.5 Preliminary price level index (EU27=100)
26 2010 173.6 Row 25 divided by the EU27 geometric mean for the row (4905)
4.1 ISCED expenditure shares
27 ISCED 0 2008 9.4% Row 07 divided by row 12 28 ISCED 1 2008 24.4% Row 08 divided by row 12 29 ISCED 2 2008 12.7% Row 09 divided by row 12 30 ISCED 3+4 2008 32.1% Row 10 divided by row 12 31 ISCED 5+6 2008 21.4% Row 11 divided by row 12 32 Total 2008 100.0%
Education 8
Eurostat-OECD Methodological Manual on Purchasing Power Parities 178
Row Year Country A Comments
4.2 Adjustment for research expenditure
33 2005 33.8% UOE database and R&D statistics 34 ISCED 5+6 14.2% Row 31 multiplied by (100 minus row 33)
4.3 ISCED expenditure shares rescaled after adjustment for research expenditures
35 ISCED 0 2008 10.1% Row 27 divided by the sum of rows 27, 28, 29, 30, 34 36 ISCED 1 2008 26.3% Row 28 divided by the sum of rows 27, 28, 29, 30, 34 37 ISCED 2 2008 13.7% Row 29 divided by the sum of rows 27, 28, 29, 30, 34 38 ISCED 3+4 2008 34.6% Row 30 divided by the sum of rows 27, 28, 29, 30, 34 39 ISCED 5+6 2008 15.3% Row 31 divided by the sum of rows 27, 28, 29, 30, 34 40 Total 2008 100.0%
4.4 AICE by ISCED in national currency (millions) – used as expenditure weights in the calculation of PPPs 41 ISCED 0 2010 2 247 Row 13 multiplied by row 35 42 ISCED 1 2010 5 843 Row 13 multiplied by row 36 43 ISCED 2 2010 3 044 Row 13 multiplied by row 37 44 ISCED 3+4 2010 7 703 Row 13 multiplied by row 38 45 ISCED 5+6 2010 3 405 Row 13 multiplied by row 39 46 Total 2010 22 242
5.1 AICE per FTE student by ISCED before quality adjustment
47 ISCED 0 2010 5 244 Row 41 divided by row 01 48 ISCED 1 2010 7 918 Row 42 divided by row 02 49 ISCED 2 2010 9 945 Row 43 divided by row 03 50 ISCED 3+4 2010 10 013 Row 44 divided by row 04 51 ISCED 5+6 2010 9 181 Row 45 divided by row 05
5.2 Quality adjustment for ISCED 1 and ISCED 2
52 ISCED 1 1.0236 PISA 2009 (row 22 in quality adjustment worksheet) 53 ISCED 2 1.0236 PISA 2009 (row 22 in quality adjustment worksheet)
5.3 AICE per FTE student by ISCED after quality adjustment – used as unit prices in the calculation of PPPs
54 ISCED 0 2010 5 244 55 ISCED 1 2010 7 736 Row 48 divided by row 52 56 ISCED 2 2010 9 716 Row 49 divided by row 53 57 ISCED 3+4 2010 10 013 58 ISCED 5+6 2010 9 181
8.26 PPPs for AICE are calculated with the matrix of unit prices and the matrix of expenditure weights derived above. The matrices, defined as ISCED levels by participating countries, are complete.
8.27 The usual way of calculating bilateral PPPs for a basic heading is to calculate a Laspeyres type PPP, a Paasche type PPP and a Fisher type PPP between each pair of participating countries. The Fisher type PPP between two countries is the geometric mean of their Laspeyres type PPP and their Paasche type PPP. The Fisher type PPPs are not transitive. They are made transitive by the Èltetö-Köves-Szulc (EKS) procedure (see Chapter 12).
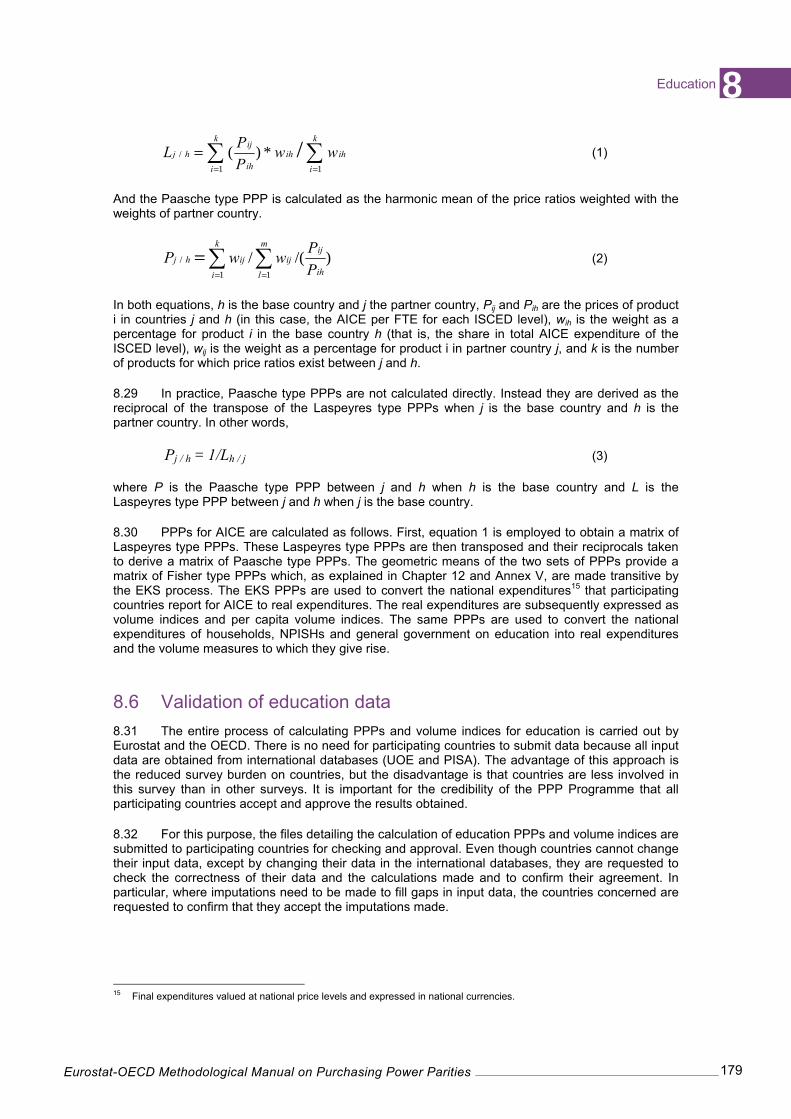
8.28 Expenditure weights are not usually employed to calculate the bilateral PPPs for a basic heading. But, when they are, as in the case of education, the Laspeyres type PPP between two countries is calculated as the arithmetic mean of the price ratios weighted with the weights of the base country.
Education 8
Eurostat-OECD Methodological Manual on Purchasing Power Parities 179
==
=k
i
ihih
k
i ih
ijhj ww
P
PL
11/ /*)( (1)
And the Paasche type PPP is calculated as the harmonic mean of the price ratios weighted with the weights of partner country.
)/(/11
/ ==
=m
l ih
ijij
k
i
ijhjP
PwwP (2)
In both equations, h is the base country and j the partner country, Pij and Pih are the prices of product i in countries j and h (in this case, the AICE per FTE for each ISCED level), wih is the weight as a percentage for product i in the base country h (that is, the share in total AICE expenditure of the ISCED level), wij is the weight as a percentage for product i in partner country j, and k is the number of products for which price ratios exist between j and h.
8.29 In practice, Paasche type PPPs are not calculated directly. Instead they are derived as the reciprocal of the transpose of the Laspeyres type PPPs when j is the base country and h is the partner country. In other words,
Pj / h = 1/Lh / j (3)
where P is the Paasche type PPP between j and h when h is the base country and L is the Laspeyres type PPP between j and h when j is the base country.
8.30 PPPs for AICE are calculated as follows. First, equation 1 is employed to obtain a matrix of Laspeyres type PPPs. These Laspeyres type PPPs are then transposed and their reciprocals taken to derive a matrix of Paasche type PPPs. The geometric means of the two sets of PPPs provide a matrix of Fisher type PPPs which, as explained in Chapter 12 and Annex V, are made transitive by the EKS process. The EKS PPPs are used to convert the national expenditures15 that participating countries report for AICE to real expenditures. The real expenditures are subsequently expressed as volume indices and per capita volume indices. The same PPPs are used to convert the national expenditures of households, NPISHs and general government on education into real expenditures and the volume measures to which they give rise.
8.6 Validation of education data
8.31 The entire process of calculating PPPs and volume indices for education is carried out by Eurostat and the OECD. There is no need for participating countries to submit data because all input data are obtained from international databases (UOE and PISA). The advantage of this approach is the reduced survey burden on countries, but the disadvantage is that countries are less involved in this survey than in other surveys. It is important for the credibility of the PPP Programme that all participating countries accept and approve the results obtained.
8.32 For this purpose, the files detailing the calculation of education PPPs and volume indices are submitted to participating countries for checking and approval. Even though countries cannot change their input data, except by changing their data in the international databases, they are requested to check the correctness of their data and the calculations made and to confirm their agreement. In particular, where imputations need to be made to fill gaps in input data, the countries concerned are requested to confirm that they accept the imputations made.
15 Final expenditures valued at national price levels and expressed in national currencies.

From:Eurostat-OECD Methodological Manual onPurchasing Power Parities (2012 Edition)
Access the complete publication at:https://doi.org/10.1787/9789264189232-en
Please cite this chapter as:
OECD/Eurostat (2012), “Education”, in Eurostat-OECD Methodological Manual on Purchasing PowerParities (2012 Edition), OECD Publishing, Paris.
DOI: https://doi.org/10.1787/9789264189232-11-en
This work is published under the responsibility of the Secretary-General of the OECD. The opinions expressed and argumentsemployed herein do not necessarily reflect the official views of OECD member countries.
This document and any map included herein are without prejudice to the status of or sovereignty over any territory, to thedelimitation of international frontiers and boundaries and to the name of any territory, city or area.
You can copy, download or print OECD content for your own use, and you can include excerpts from OECD publications,databases and multimedia products in your own documents, presentations, blogs, websites and teaching materials, providedthat suitable acknowledgment of OECD as source and copyright owner is given. All requests for public or commercial use andtranslation rights should be submitted to [email protected]. Requests for permission to photocopy portions of this material forpublic or commercial use shall be addressed directly to the Copyright Clearance Center (CCC) at [email protected] or theCentre français d’exploitation du droit de copie (CFC) at [email protected].


