Embed Size (px)
Citation preview
Bond UniversityePublications@bond
Mirvac School of Sustainable Development Institute of Sustainable Development andArchitecture
1-1-2008
The Robina residential archipelago: Its current andfuture sustainabilityNigel CartlidgeBond University, [email protected]
This Research Report is brought to you by the Institute of Sustainable Development and Architecture at ePublications@bond. It has been accepted forinclusion in Mirvac School of Sustainable Development by an authorized administrator of ePublications@bond. For more information, please contactBond University's Repository Coordinator.
Recommended CitationCartlidge, Nigel, "The Robina residential archipelago: Its current and future sustainability" (2008). Mirvac School of SustainableDevelopment. Paper 36.http://epublications.bond.edu.au/sustainable_development/36
Research Project
The Robina Residential Archipelago:
Its current and future sustainabil ity
Nigel Llewellyn Cartlidge M.A. P.G.C.E. B.A. (hons).
Student Number 12981579
Mirvac School of Sustainable Development
Research project: SDUP71-400 083
A research project submitted in partial fulfillment of the requirements of Bond
University for the degree of Master of Urban Planning

Bond University Master of Urban Planning Research Project
The Robina Residential Archipelago: Nigel Cartlidge 2008
ii
Abstract
This study examined the nature of the urban connectivity and evaluated the long-term
sustainability of a specific area of the suburb of Robina on the Gold Coast, Queensland,
Australia. Additionally, the challenges, impacts, and benefits of the solutions proposed in
this study were considered. In order to analyse the urban connectivity of Robina Woods,
walkability was seen as the most critical measure. Ten homes were selected, the local
amenities identified and the Green, Blue, Grey, Planned and Social barriers to connec-
tivity mapped out.
Maps were used to trace the distances and walking routes from the selected residences
to each of the amenities. A walking speed was nominated in consideration of the average
age of residents, climate, terrain and slope of the area. Using this information Ped Shed
Patterns were drawn and a Road Deviation Index calculated. The most significant findings
indicated a significant disruption to the urban connectivity of Robina Woods to its south-
ern and western boundaries, creating a car dependant urban design that isolates the in-
firm, young, and elderly despite Robina Woods being in the geographical centre of the
sixth largest city in Australia. Walkability is severely restricted by the design and spatial
layout of the street patterns. The lack of destinations and community facilities in a com-
munity of over three thousand people suggest a high level of social isolation for those
without access to a car.
The efficiency of the road network is seen as very poor, with an inefficient and problem-
atic hierarchical road structure. The extra cost of running a vehicle in the suburb affects
the individual and the environment. The urban connectivity to the neighbouring suburbs is
poor by all modes of transport especially to Varsity Lakes. There would be multiple chal-
lenges to face if any solutions for connectivity are pursued; however the physical and
mental health costs, loss of social capital, and changing demographic profile are such
important factors that the issue cannot simply be ignored.

The Robina Residential Archipelago Nigel Cartlidge 2008
iii
Acknowledgements
I would like to acknowledge the contribution of Dr Danny O’Hare, Dr Bhishna Bajracharya,
Dr Ned Wales and Ben O’Callaghan for their insightful comments on urban design and
the importance of sustainable development and the involvement of the community in
achieving that development during my course at Bond University. I would also like to
thank my wife Janet Cartlidge for her support and proof reading contribution.
Statement of Original Authorship
This work has not been previously submitted for a degree or diploma at any higher edu-
cation institution. To the best of my knowledge and belief, this work contains no material
previously published or written by another person except where due reference is made.
Signed Date
Bond University Master of Urban Planning Research Project
The Robina Residential Archipelago: Nigel Cartlidge 2008
iv
Table of Contents
Abstract ii
Preface vii
Glossary ix
1.0 Introduction 1
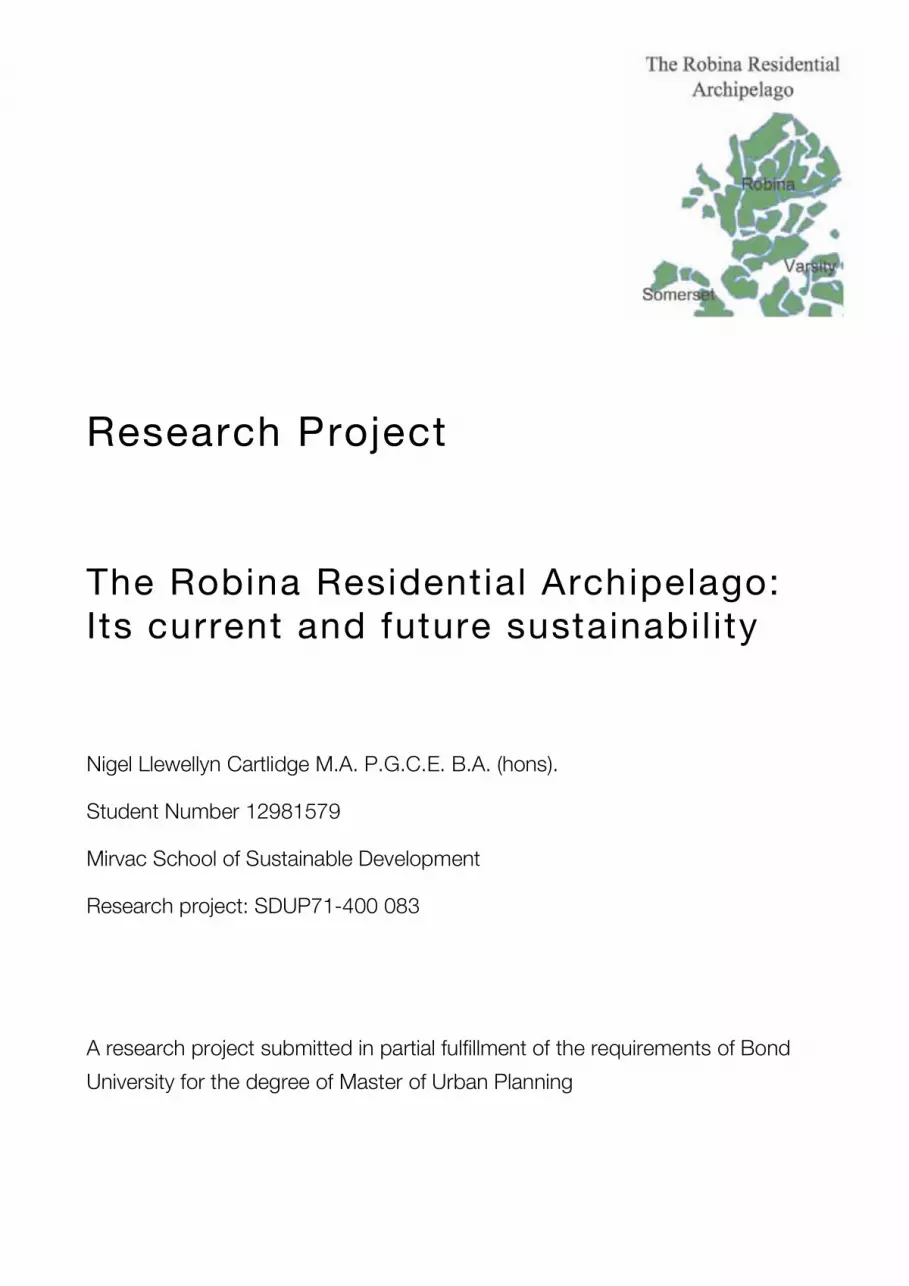
1.1 The Robina Residential Archipelago 1
1.2 The research questions 1
1.3 The research focus 3
1.4 The limits of research 4
1.5 The context of the research 4
1.6 Research Methods and Methodology 5
1.7 Analysis of the urban connectivity of Robina Woods 8
1.8 The selected walking speed 12
2.0 The planning of new settlements and connectivity 13
2.1 The political approaches to urban design 14
2.2 A historical perspective of new town planning 15
2.3 Urban form and connectivity 17
2.4 How planning can help to determine urban connectivity 19
2.5 Measuring urban connectivity 21
3.0 Robina in context 22
3.1 The development of Robina 22
3.2 The car dependent focus of the Robina development 25
4.0 Describing the barriers to the urban connectivity of Robina 27
4.1 The consensus on the desirable qualities of urban connectivity 27
4.2 The selected study areas 29
4.2 Identified barriers to connectivity in Robina 32
4.3 The Grey Barriers 33
4.4 The Green Barriers 38
4.5 The Blue Barriers 40
4.6 The Planned Barriers 41
4.7 The Social Barriers 42
4.7.1 Demographics of Robina 43
4.7.2 Pattern and nature of urban development in Robina Woods 44
4.7.3 Car primacy in street design 47
4.7.4 Pocket Parks, fences, and paths in the public realm of Robina Woods 48
4.7.5 A decrease in density and household size 51
4.8 Combining the barriers 52
4.9 Non-residential land uses in Robina and Varsity Lakes 53
4.10 The extent of car dependency in Robina 54

The Robina Residential Archipelago Nigel Cartlidge 2008
v
5.0 Mapping the walkability of Robina Woods 55
5.1 Mapping the road connectivity of Robina Woods 55
5.2 The accuracy of the collected data 56
5.3 The effect of Robina Parkway on local walkability 56
5.4 The effect of Cheltenham and Cottesloe Drives on local walkability 57
5.5 Analysis of the collected Data 59
5.6 Analysis of the ped shed maps 59
5.7 Analysis of the Robina Woods RDI maps 60
5.8 Comparison to RDI of a selected Vancouver suburb 62
5.9 Analysis of the comparative RDI results 63
5.10 A proposed model for using the RDI scores 64
5.11 Impacts of the inefficient road design for Robina Woods residents 67
6.0 The ped shed Maps 71
6.1 The road deviation index (RDI) maps 81
7.0 Conclusions 91
7.1 The nature of the urban connectivity for the residents of Robina 92
7.2 The reasons for change to the urban connectivity of Robina 93
7.3 The challenges for the future sustainability of Robina 94
7.4 The possible solutions for Robina residents 95
7.5 The benefits for Robina residents and the wider community 96
7.6 Designing a solution to car dependent suburb 97
7.7 Areas for further research 99
8.0 References 101
Illustrations
Figure 1.1: 1991 Robina Master Plan, showing density and street layout 2
Figure 1.2: Aerial view of Clear Island Waters Gold Coast sourced from Google Earth 6
Figure 1.3: Aerial view of Broadbeach Waters Gold Coast sourced from Google Earth 6
Figure 1.4: The location of Robina Woods 9
Figure 1.5: The selected residences and destinations of the study area 10
Figure 2.1: The street layout of Colchester circa 2nd century AD 16
Figure 2.2: Influence of elements in the built environment on physical activity 19
Figure 2.3: Proposed model of the factors that can determine urban connectivity 20
Figure 3.1 Aerial views of Robina in 1981 and 1996 23
Figure 3.2: The Gold Coast Urban Footprint in 1980 and 1997 24
Figure 3.3: Population growth in the Gold Coast by suburb 1986 to 2006 24
Figure 4.1: Example of street grids from the “Urban Design Compendium” 28
Figure 4.2: Aerial view of Robina Woods 29
Figure 4.3: Aerial view of a suburb of Vancouver at the same scale 30
Figure 4.4: Robina Woods road connectivity diagram 31
Bond University Master of Urban Planning Research Project
The Robina Residential Archipelago: Nigel Cartlidge 2008
vi
Figure 4.5: A residential suburb of Vancouver’s road connectivity diagram 31
Figure 4.6: The residential suburbs appear as fractured and disconnected islands 33
Figure 4.7: The Grey Barriers a hierarchical road network designed for cars 34
Figure 4.8: A view along Robina Parkway looking north 35
Figure 4.9: The only pedestrian crossing along the length of Robina Parkway 36
Figure 4.10: The pedestrian access to Robina Parkway from Princeville Court Robina Woods 37
Figure 4.11: The steep track down towards Medinde Court Robina from Robina Parkway 37
Figure 4.12: The Green Barriers consist of Private Open Spaces 38
Figure 4.13: Aerial view of Robina Woods Golf Course 39
Figure 4.14: The Varsity College Middle and Senior School catchment area 40
Figure 4.15: The Blue Barrier, the ribbon of lakes and waterways 41
Figure 4.16: The planned barriers of car dependent pockets of residential development 42
Figure 4.17: The distribution of age groups in Robina 43
Figure 4.18: 1980s brick and tile homes 44
Figure 4.19: 2000s rendered homes with driveway, and garage frontages 45
Figure 4.20: An example of a fortified home built in 2008; this is its street face 45
Figure 4.21: Residents of 1980s homes are gradually erecting fencing to the street 46
Figure 4.22: The road entrance to the gallery, Great Southern Drive Robina Woods 47
Figure 4.23: The intersection of Ron Penhaligon Way, Cheltenham, and Cottesloe Drives 48
Figure 4.24: A connecting path, fenced off, unlit, poorly made and constructed 49
Figure 4.25: Well planned streets and pedestrian areas? 50
Figure 4.26: The fencing of homes from street and adjacent parks 51
Figure 4.27: The combination of the barriers creates the disconnected urban form that is the
Robina Residential Archipelago. 52
Figure 4.28: The spatial relationship of non-residential land uses in Robina 53
Figure 4.29: Robina has is service centres on the outside of a fragmented residential “core” 53
Figure 4.30: The illustrated extent of suspected high car dependency in Robina 54
Figure 5.1: Aerial view of Robina Parkway and Cheltenham Drive intersection 57
Figure 5.2: Aerial view of Ron Penhaligon Way Cheltenham Drive Roundabout 58
Figure 5.3: Map of residences and destinations used to calculate comparative RDI 62
Figures 6.1 to 6.10: The ped shed patterns for residences 1 to 10 71
Figures 6.11 to 6.20: The RDI map from selected destinations to the selected residences 81
Figure 7.1: The Proposed Planning Design Cycle 98
Tables
Table 1.1: “ Measures of Ageing’ sourced from Australian Bureau of Statistics (ABS) website 8
Table 1.2: The selected destinations local to Robina Woods 11
Table 5.1: Destinations reached in 5, 10 and 20 minutes walk from selected residences 60
Table 5.2: Excess road travel to selected destinations from residences in Robina Woods 61
Table 5.3: Comparative RDI results for Vancouver suburb 64
Table 5.4: Proposed RDI star rating scale 65
Table 5.5: Star ratings for destinations from Robina Woods 66
Table 5.6: Private vehicle ownership costs from the RACQ October 2008 68
Table 5.7: Excess travel estimates per single journey 69

The Robina Residential Archipelago Nigel Cartlidge 2008
vii
Preface
The researcher’s relationship with Robina
The researcher has resided in Robina in 1995/6 and again from 2001 to the present day.
The experience of living in the suburb has given the researcher an understanding of the
extent of car dependency inherent in the urban design of this suburb. The researcher’s
studies at Bond University in the Master of Urban Planning program built an awareness of
urban morphology and its contribution to sustainable development.
The impression of the urban form of Robina gained during this time is that a car is
essential to live in the town for nearly all journeys, as the goods, services and amenities
are mostly located outside of the residential suburbs at some distance. There are only
indirect routes to reach the neighbouring suburbs within Robina and the adjacent suburbs
of Burleigh Waters, Clear Island Waters, Mermaid Waters, Merrimac, Mudgeeraba and
Varsity Lakes.
Public bus transport is inadequate, often requiring a long walk to a bus stop. It starts too
late to connect to the commuter train service to Brisbane and finishes too early to return
from long trips. Its frequency is inadequate during the day to make short local trips
practical. It can be unreliable and the timetabling is not coordinated with rail transport,
allowing trains to leave before the buses arrive at the railway station and conversely
buses leaving just before trains arrive.
The Railway Station, Robina High School and the Hospital are inappropriately positioned
for residents and difficult to get to by public transport. Students in Robina face a difficult
choice of schools, as very few students resident in Robina are able to walk to school,
either to Robina State School or Varsity College in the neighbouring suburb of Varsity
Lakes.
The lack of walkable destinations within the residential suburbs leads to very few people
walking on the streets; most walkers are either exercising themselves or their dogs. Very
few people are observed cycling; most cyclists observed appear to be training or in
cycling clubs and taking advantage of the strenuous local conditions. This means that
Bond University Master of Urban Planning Research Project
The Robina Residential Archipelago: Nigel Cartlidge 2008
viii
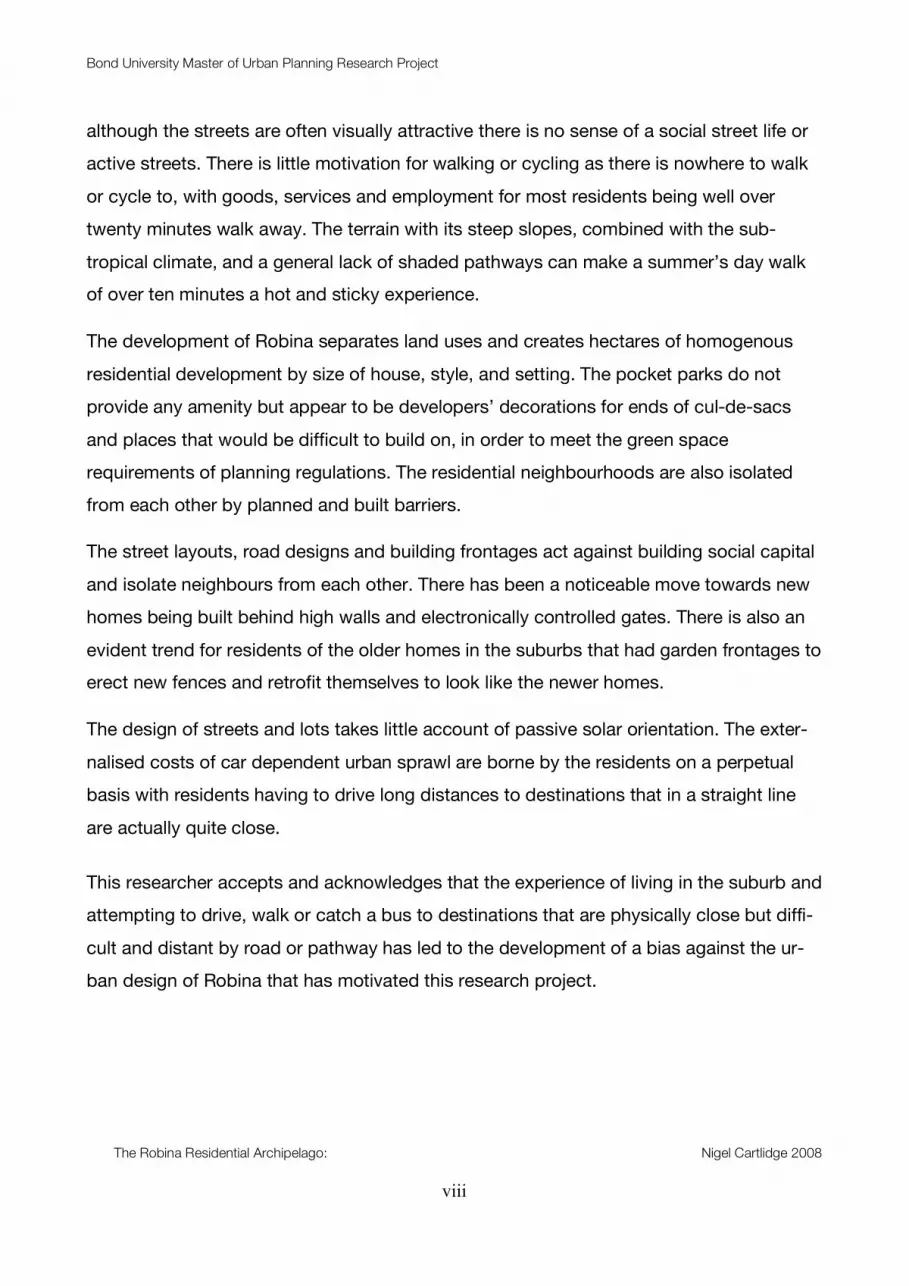
although the streets are often visually attractive there is no sense of a social street life or
active streets. There is little motivation for walking or cycling as there is nowhere to walk
or cycle to, with goods, services and employment for most residents being well over
twenty minutes walk away. The terrain with its steep slopes, combined with the sub-
tropical climate, and a general lack of shaded pathways can make a summer’s day walk
of over ten minutes a hot and sticky experience.
The development of Robina separates land uses and creates hectares of homogenous
residential development by size of house, style, and setting. The pocket parks do not
provide any amenity but appear to be developers’ decorations for ends of cul-de-sacs
and places that would be difficult to build on, in order to meet the green space
requirements of planning regulations. The residential neighbourhoods are also isolated
from each other by planned and built barriers.
The street layouts, road designs and building frontages act against building social capital
and isolate neighbours from each other. There has been a noticeable move towards new
homes being built behind high walls and electronically controlled gates. There is also an
evident trend for residents of the older homes in the suburbs that had garden frontages to
erect new fences and retrofit themselves to look like the newer homes.
The design of streets and lots takes little account of passive solar orientation. The exter-
nalised costs of car dependent urban sprawl are borne by the residents on a perpetual
basis with residents having to drive long distances to destinations that in a straight line
are actually quite close.
This researcher accepts and acknowledges that the experience of living in the suburb and
attempting to drive, walk or catch a bus to destinations that are physically close but diffi-
cult and distant by road or pathway has led to the development of a bias against the ur-
ban design of Robina that has motivated this research project.

The Robina Residential Archipelago Nigel Cartlidge 2008
ix
Glossary Key Definitions Accessibility
Studies have found an association between the availability, proximity and quality of open
space, parks, walking and cycling paths and increased physical activity for recreation. In
some cases, there is also an association with access to transport. A key motivator for
regular physical activity, especially walking is a variety of local destinations within easy
walking distance usually within 5–10 minutes/400 metres of the home, or work and rarely
further away than 20 minutes. (Australian Local Government Association et al., 2008).
Amenity
Amenity is a term meaning “the quality of being pleasant” and is widely used in planning
to describe one of its principal objectives. Amenity is a composite of aesthetic and envi-
ronmental qualities. These can be private views, privacy, quiet, sitting out space, land-
scaped and play spaces, and other recreational facilities or public views from public
spaces, pleasant streets, furnishings, landscaping public spaces, and public art (Punter,
2003)
Connectivity
Connectivity is the degree to which networks - streets, railways, walking and cycling
routes, services and infrastructure - interconnect. Good connections encourage access
within a region, city, town or neighbourhood (Ministry of the Environment New Zealand,
2001).
Connectivity is also described as the directness of travel between destinations, which is
influenced by the kinds of intersections and their density in a given area (Australian Local
Government Association et al., 2008)

Bond University Master of Urban Planning Research Project
The Robina Residential Archipelago: Nigel Cartlidge 2008
x
An interconnected street system encourages walking, bicycling, and transit use, and can
reduce the number of and length of automobile trips. Local traffic is diffused over several
smaller streets rather than focused on a few congested arterials where it is combined with
through regional traffic, allowing greater flexibility in street design (Metropolitan Council,
2003).
Urban connectivity in the context of this research project has been defined as The degree
to which the urban form allows people to travel to retail, education, health, employment,
professional, social and recreational facilities from their homes on foot, by bicycle, public
transport or private vehicle.
Density
Refers to site density, net dwelling density and gross dwelling density. Except where ref-
erenced, all density definitions are from the Queensland Transport document “Shaping
Up” (Queensland Government, 2008).
Net residential density: A measure of housing density expressed as dwellings or lots per
hectare, calculated by adding the area of residential lots plus the area of local roads and
parks, and then divided by the number of dwellings or residential lots created
(Queensland Government, 2005).
Net Dwelling Density: means the number of dwellings on the land occupied by dwellings
plus internal public streets and incidental open spaces.
Gross Dwelling Density: Means the number of dwellings on the land occupied by dwell-
ings plus local streets, open spaces, shops and service premises, primary schools, and
half the width of adjoining sub-arterial or arterial roads.
Site Density: Means the ratio of dwellings and the site area they occupy. The land area
excludes local streets, open space and any other land not directly related to the dwell-
ings.

The Robina Residential Archipelago Nigel Cartlidge 2008
xi
Density Gradient: Placing the most intense site density an area closest to an activity
centre, and site density is gradually reduced as the distance increase from the activity
centre and development sites. It provides for a mix of housing and development, which
supports the provision of effective public transport.
Externality
In economics, an externality is an impact on any party not directly involved in an eco-
nomic decision. An externality occurs when an economic activity causes external costs or
external benefits to third party stakeholders who did not directly effect the economic
transaction (Wikipedia)
Externality is a factor, for example environmental damage, that results in the way some-
thing is produced is not taken into account in establishing the market price of the goods
or materials concerned (Encarta)
Local
Relating to, situated in, or providing a service for a particular area, especially the area
near home or work (Encarta, 2008). In this research project local refers to the town of
Robina and its neighbouring suburbs of Varsity Lakes, Burleigh Waters, Mermaid Waters,
Clear Island Waters, Merrimac and Mudgeeraba (see figure 4).
Masterplanned Community (MPC)
Masterplanned communities are defined as private sector driven; large scale inte-
grated housing developments on 'greenfield' sites in the outskirts of the cities (Min-
ery and Bajracharya, 1999; Gwyther, 2005). MPCs usually have a mix of housing
types, shopping and services, open spaces and recreation facilities, and some-
times employment opportunities. In most cases, MPCs are a product of long-term,
multi-phase development programs that combine complementary mix of land uses
(Schmitz and Bookout, 1998).
Bond University Master of Urban Planning Research Project
The Robina Residential Archipelago: Nigel Cartlidge 2008
xii
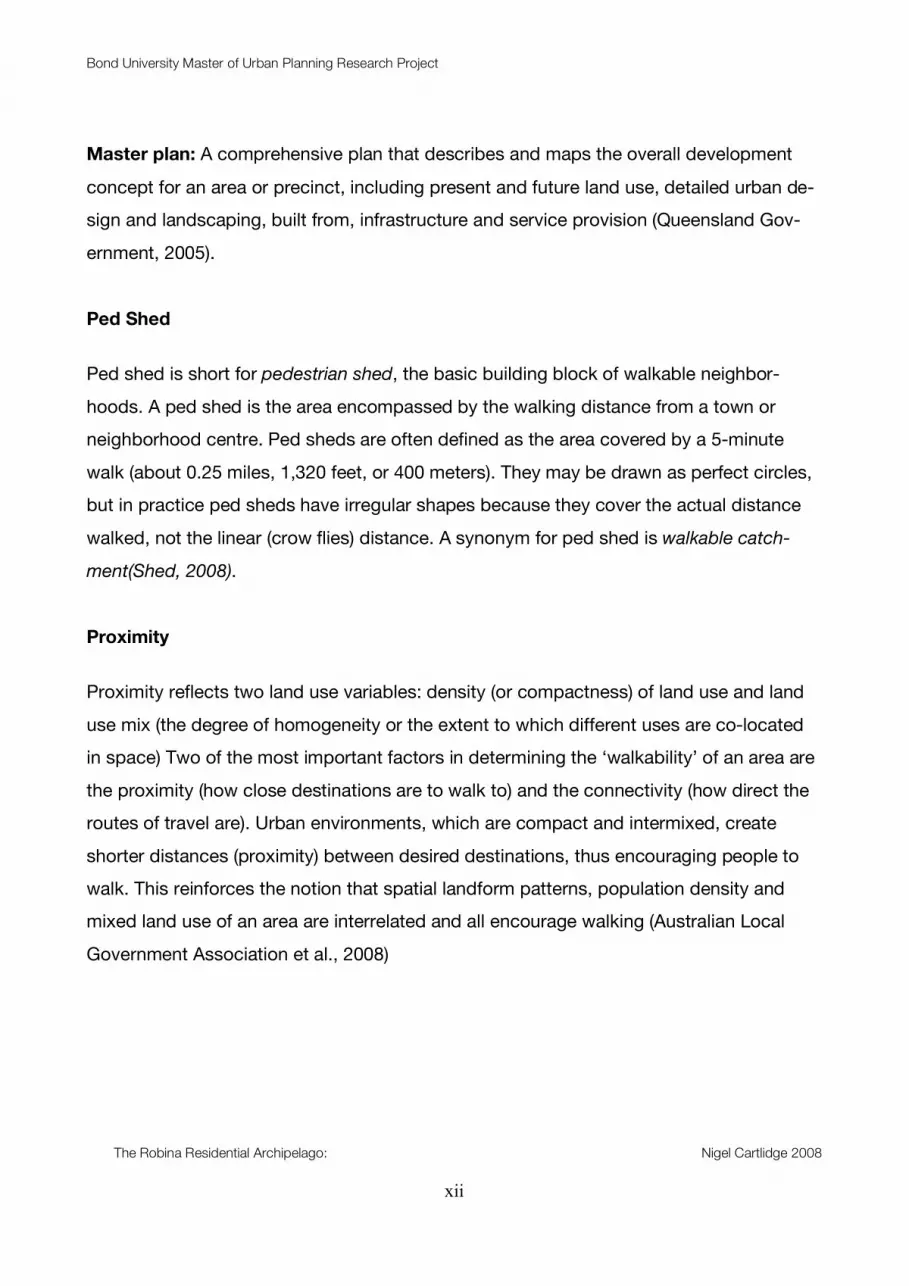
Master plan: A comprehensive plan that describes and maps the overall development
concept for an area or precinct, including present and future land use, detailed urban de-
sign and landscaping, built from, infrastructure and service provision (Queensland Gov-
ernment, 2005).
Ped Shed
Ped shed is short for pedestrian shed, the basic building block of walkable neighbor-
hoods. A ped shed is the area encompassed by the walking distance from a town or
neighborhood centre. Ped sheds are often defined as the area covered by a 5-minute
walk (about 0.25 miles, 1,320 feet, or 400 meters). They may be drawn as perfect circles,
but in practice ped sheds have irregular shapes because they cover the actual distance
walked, not the linear (crow flies) distance. A synonym for ped shed is walkable catch-
ment(Shed, 2008).
Proximity
Proximity reflects two land use variables: density (or compactness) of land use and land
use mix (the degree of homogeneity or the extent to which different uses are co-located
in space) Two of the most important factors in determining the ‘walkability’ of an area are
the proximity (how close destinations are to walk to) and the connectivity (how direct the
routes of travel are). Urban environments, which are compact and intermixed, create
shorter distances (proximity) between desired destinations, thus encouraging people to
walk. This reinforces the notion that spatial landform patterns, population density and
mixed land use of an area are interrelated and all encourage walking (Australian Local
Government Association et al., 2008)

The Robina Residential Archipelago Nigel Cartlidge 2008
xiii
Sustainability and Urban Sustainability
Sustainable means able to be maintained and, using its associated ecological meaning,
refers to exploiting natural resources without destroying the ecological balance of a par-
ticular area (Encarta World English Dictionary)
Sustainable development is development that meets the needs of the present without
compromising the ability of future generations to meet their own needs (The Brundlandt
Commission, 1987).
Planning for sustainability identifies a process that considers a community’s on -site natu-
ral land, water air and energy resources as integral aspects of the design. It integrates
natural systems with human patterns and celebrates continuity, uniqueness, and place
making (Viera, 1993; and Early, 1993; in Jenks page 221)
The Centre for Sustainable Cities (2008) defines urban sustainability as a local, informed,
participatory, balance-seeking process, operating within an equitable ecological region,
exporting no problems beyond its territory or into the future.
Walkability
Walkability has been developed as a measure to assess the relative characteristics of dif-
ferent urban forms and designs. Questions about residential density, land use mix, ac-
cessibility, street networks and connectedness, walking/cycling facilities, aesthetics and
safety are often included (Australian Local Government Association et al., 2008)
Walkable communities: give people a variety of destinations within walking distance of
home, and safe and connected streets and pathways to get there (Australian Local Gov-
ernment Association et al., 2008)

Bond University Master of Urban Planning Research Project
The Robina Residential Archipelago: Nigel Cartlidge 2008
xiv
Abbreviations Used
ABS Australian Bureau of Statistics
GCCC Gold Coast City Council
GCPS Gold Coast Planning Scheme
GHG Green House Gas
IPA Integrated Planning Act
LGMS Local Growth Management Strategy
LUPTAI Land Use and Public Transport Accessibility Index
MPC Master Planned Community
PIA Planning Institute of Australia
RDI Road Deviation Index
RLC Robina Land Corporation
SEQRP South East Queensland Regional Plan
Kgs Kilograms
km/h Kilometres per hour
The Robina Residential Archipelago Nigel Cartlidge 2008
1
1.0 Introduction
“The Robina Residential Archipelago: Its current and future sustainability” is an examina-
tion of the nature of urban connectivity for the residents of the suburbs of Robina. The
research questions the developer’s claims to Robina’s being an environmentally sustain-
able development, as made on its current website:
“A relaxed, quietly efficient, well-planned network of precincts and business spaces with
everything you need within walking distance. These days people call it environmentally
sustainable development” (CBD Robina, 2008).
The research project is intended to inform the debate on the urban design of communities
and their current and future sustainability. A literature review was conducted of current
and historical theories and ideas on sustainable urban development. Interviews with key
informed people were intended, where possible, to clarify information and seek perspec-
tives for political solutions to the current urban design disconnect. Robina Woods Golf
Course declined to take part and Robina Land Corporation were unable to direct the re-
searcher to anyone with knowledge of the early development. Margaret May the Federal
MP was unable to contribute as she was in a sitting of Federal Parliament.
1.1 The Robina Residential Archipelago
The term Residential Archipelago has been adopted to describe the fragmented residen-
tial urban form of Robina. This arose from the graphical analysis of the land uses of the
town, where the residential islands can be seen as a disconnected string separated by
various barriers (see section 3). These barriers make travel for residents difficult except by
car. This is analogous to the difficulties encountered by inhabitants of small, island archi-
pelagos surrounded by sea that are dependent on small boats to reach neighbours and
larger islands that provide goods, services, and employment.
The research project seeks to understand the barriers to connectivity for the residents of
Robina, how these barriers affect mobility choices, and the impacts of those barriers on
residents. The project will also briefly consider ways that residents, government and de-
Bond University Master of Urban Planning Research Project
The Robina Residential Archipelago: Nigel Cartlidge 2008
2
velopers can improve the existing levels of connectivity and enhance the liveability of the
town to make it a more sustainable, vibrant, compact, adaptable and resilient place for its
residents to live, work and enjoy.
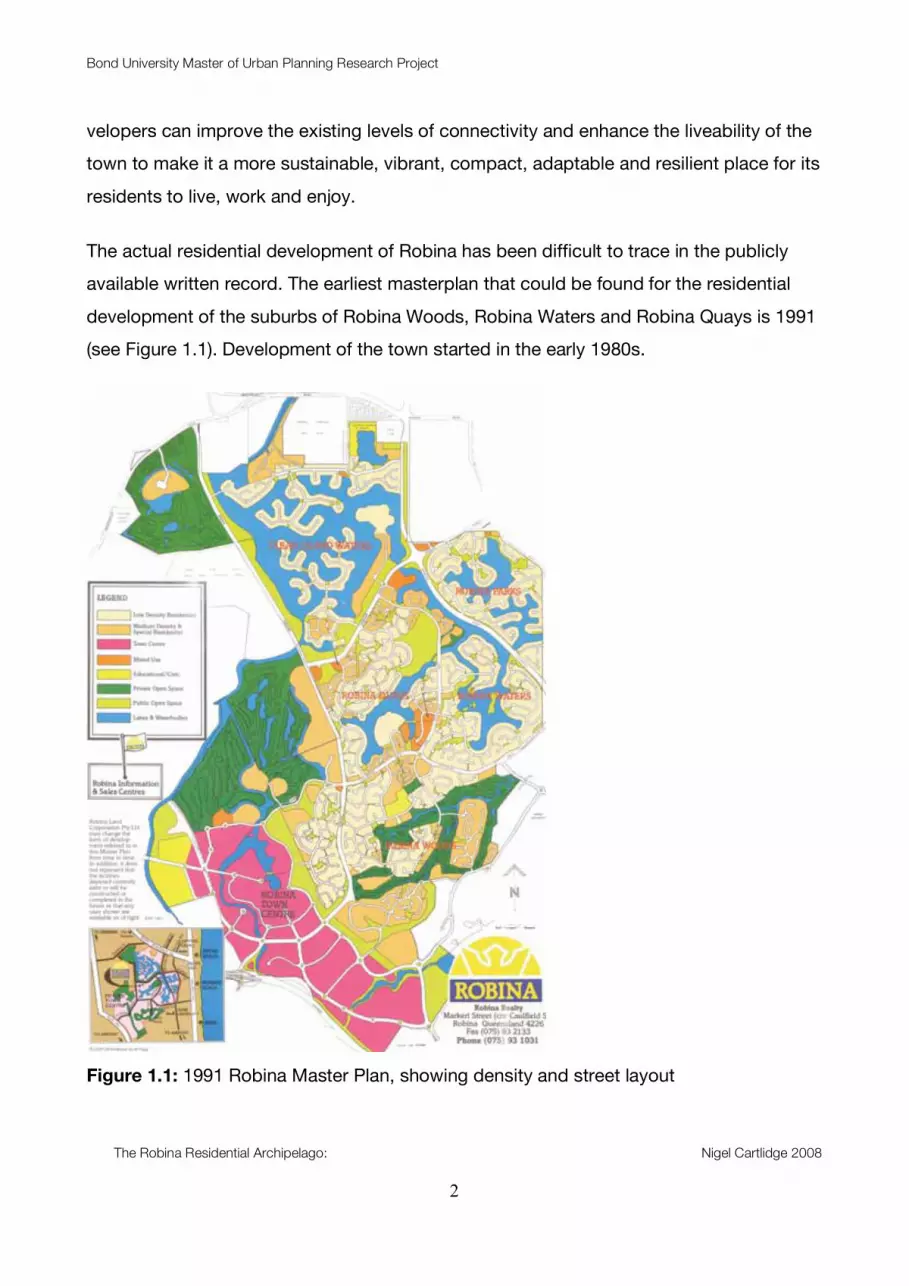
The actual residential development of Robina has been difficult to trace in the publicly
available written record. The earliest masterplan that could be found for the residential
development of the suburbs of Robina Woods, Robina Waters and Robina Quays is 1991
(see Figure 1.1). Development of the town started in the early 1980s.
Figure 1.1: 1991 Robina Master Plan, showing density and street layout
The Robina Residential Archipelago Nigel Cartlidge 2008
3
The majority of the master planning that can be found describes the commercial and
residential precincts of Robina Town Centre. This may be due to the residential develop-
ment starting in the 1980s being before the widespread adoption of digital records. An-
other explanation may be found in the structure of the Robina Land Corporation in 1999
(Robina Land Corporation, 1999). The development group had eight divisions:
1. Robina Land Corporation (now CBD Robina)
2. Robina Planning
3. Robina Realty
4. Robina Design Service
5. Robina Nursery
6. Robina Woods Golf Course
7. ROTAN (It is not known what this stood for)
8. Robina Town Centre (A joint venture with Commonwealth Funds Management)
Robina Planning, Robina Design Service, Robina Nursery and ROTAN appear to have
been wound up after serving their initial marketing, planning or development functions.
This may have led to important sources being lost or publicly unavailable. The Focus on
the commercial town centre for the Robina Land Corporation (Robina Land Corporation,
1999) and the possibility of the residential subdivisions having been built by other devel-
opers may also have contributed to a lack of detail for the residential masterplan available
to this researcher.
1.2 The research questions
The questions chosen to guide this research project are:
1. What is the current nature of the urban connectivity of Robina?
2. How does the current urban design and connectivity impact on the residents of the
suburbs?
3. What measures could be taken to improve the urban design and connectivity?
Bond University Master of Urban Planning Research Project
The Robina Residential Archipelago: Nigel Cartlidge 2008
4
1.3 The research focus
The research paper seeks to describe historical and contemporary viewpoints of urban
design and connectivity. It investigates the mobility choices that residents have and how
the size and shape of the residential islands, the hierarchical layout of streets, and the
identified barriers to connectivity affect mobility. The research paper also seeks to identify
key sustainability issues for residents and how the current urban design of the residential
islands affects them.
The research questions have been chosen to describe the current situation, attempt to
establish how the current urban form impacts on the residents of Robina and consider
opportunities for change. The paper will attempt to describe the benefits that may arise
from changes to the current development, and new planning practices and government
policies for the suburb.
1.4 The limits of the research
The case study is limited by the short time available to a single researcher, access to
suitable maps, software and equipment. The case study is also limited by the relatively
wide focus of determining the economic, social and environmental impacts on residents
of the current urban form.
The original intent was to compare connectivity for all modes of transport but after initial
enquiries the walkability of the town was seen as the most critical measure of connectivity
for the residents. In initial field visits it was found that no local destination was over ten
minutes by car from any residence in Robina. The study looked at the routes cars have to
take from residences to destinations and the barriers the road hierarchy creates for pe-
destrians.
A definitive study of public transport in the Gold Coast known as LUPTAI (Pitot, Yigitcan-
lar, Sipe, & Evans, 2005) measured the Gold Coast public transport service and examined
the accessibility of services for residents. Cycling connectivity was considered outside of
the experience of this researcher; the climate and steep slopes also make cycling difficult
The Robina Residential Archipelago Nigel Cartlidge 2008
5
in Robina Woods. Walking was considered the key measure to examine the level of con-
nectivity of the suburb for the majority of residents of all ages.
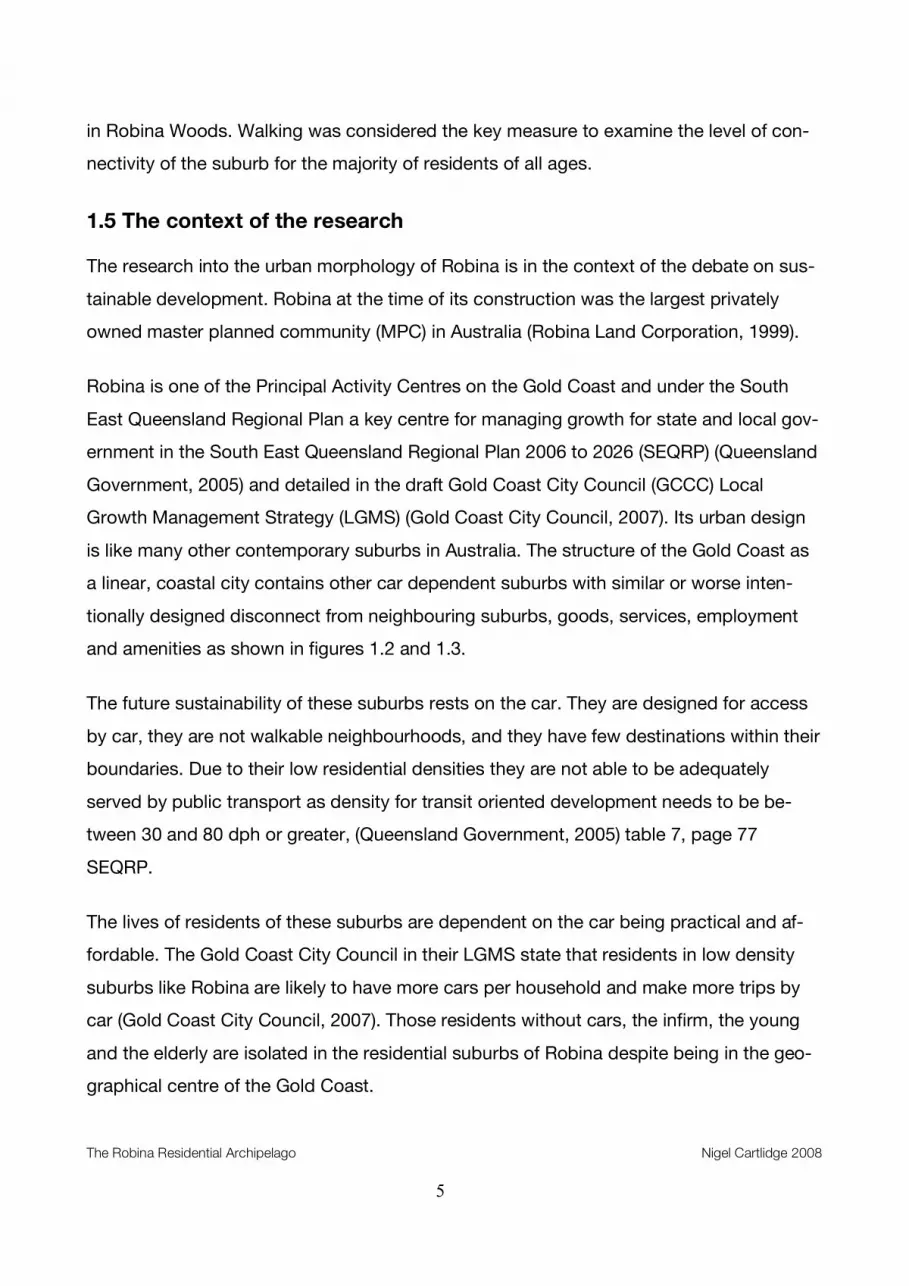
1.5 The context of the research
The research into the urban morphology of Robina is in the context of the debate on sus-
tainable development. Robina at the time of its construction was the largest privately
owned master planned community (MPC) in Australia (Robina Land Corporation, 1999).
Robina is one of the Principal Activity Centres on the Gold Coast and under the South
East Queensland Regional Plan a key centre for managing growth for state and local gov-
ernment in the South East Queensland Regional Plan 2006 to 2026 (SEQRP) (Queensland
Government, 2005) and detailed in the draft Gold Coast City Council (GCCC) Local
Growth Management Strategy (LGMS) (Gold Coast City Council, 2007). Its urban design
is like many other contemporary suburbs in Australia. The structure of the Gold Coast as
a linear, coastal city contains other car dependent suburbs with similar or worse inten-
tionally designed disconnect from neighbouring suburbs, goods, services, employment
and amenities as shown in figures 1.2 and 1.3.
The future sustainability of these suburbs rests on the car. They are designed for access
by car, they are not walkable neighbourhoods, and they have few destinations within their
boundaries. Due to their low residential densities they are not able to be adequately
served by public transport as density for transit oriented development needs to be be-
tween 30 and 80 dph or greater, (Queensland Government, 2005) table 7, page 77
SEQRP.
The lives of residents of these suburbs are dependent on the car being practical and af-
fordable. The Gold Coast City Council in their LGMS state that residents in low density
suburbs like Robina are likely to have more cars per household and make more trips by
car (Gold Coast City Council, 2007). Those residents without cars, the infirm, the young
and the elderly are isolated in the residential suburbs of Robina despite being in the geo-
graphical centre of the Gold Coast.

Bond University Master of Urban Planning Research Project
The Robina Residential Archipelago: Nigel Cartlidge 2008
6
Figure 1.2: Aerial view of Clear Island Waters Gold Coast sourced from Google Earth
Figure 1.3: Aerial view of Broadbeach Waters Gold Coast sourced from Google Earth

The Robina Residential Archipelago Nigel Cartlidge 2008
7
The design of suburbs such as those found in Robina is seen as a significant contributor
to the health problems that arise from low incidental exercise including obesity, cardiac
disease, diabetes, hypertension, stress and depression (Australian Local Government As-
sociation et al., 2008).
The urban design of the suburbs with their hierarchical road structure is inefficient, caus-
ing cars, buses, service, and delivery vehicles to travel longer distances than would be
the case with a more permeable urban structure. This leads to higher than necessary
consumption of petrol releasing higher levels of green house gas (GHG) emissions than
would be the case with an improved level of connectivity and permeability.
The current urban morphology is not seen as resilient to possible and probable stresses
on the ability of residents to afford the car dependent lifestyle in the event of an economic
recession. Other stresses that will test the residents are higher prices for fuel and food
and the impacts of climate change (Garnaut, 2008) on the low lying flood prone suburbs
of the Gold Coast including parts of Robina. These, along with peak oil (ASPO Interna-
tional, 2008) and its attendant threat to reliable petrol supplies and affordability may
cause a decline in the popularity of similar residential archipelagos.
The social capital to deal with the stresses of the likely challenges of economic recession,
climate change and peak oil are also adversely affected by the current urban form. Social
capital has been found to be higher in communities with higher levels of physical activity
participation (Australian Local Government Association et al., 2008). There is evidence
that lower levels of available community support and higher levels of neighbourhood
crime are associated with urban areas with poor walkability and urban connectivity (ibid).
The lack of diversity of housing in the suburbs of the Gold Coast also has implications for
the relative value of homes of disconnected suburbs as against suburbs with more sus-
tainable features such as mixed use development, street connectivity and provision for
walking and cycling. This may be affected by changes in housing demand that will occur
from the social change and the demographic shift expected in the next twenty years. Ta-
ble 1.1 shows that the number of people who will be over 65 by 2025 will reach 20 per

Bond University Master of Urban Planning Research Project
The Robina Residential Archipelago: Nigel Cartlidge 2008
8
cent of the population. Despite a preference for “ageing in place” (Australian Local Gov-
ernment Association et al., 2008) the demand for three to four bedroom homes is seen as
likely to decline with an accompanying fall in the number of 15 to 64 year olds and
changes to household formation patterns (Department of Family and Community Serv-
ices, 2000).
Table 1.1 “ Measures of Ageing’ sourced from Australian Bureau of Statistics (ABS) website
More walkable neighbourhoods are a strategy to improve the physical activity level of
older Australians, improve the quality of their lives and decrease the demands on the
health care system (Australian Local Government Association et al., 2008)
1.6 Research methods and methodology
The research method chosen to answer the questions posed was to conduct a case
study of the Robina Woods suburb to examine the spatial layout, and urban design fea-
tures that determine the levels of connectivity for residents to neighbouring suburbs, and
local goods, services and employment.
Robina Woods was chosen for the case study area as it is geographically the most cen-
tral suburb in Robina/Varsity Lakes, lying between Varsity Lakes, Robina Town Centre,

The Robina Residential Archipelago Nigel Cartlidge 2008
9
Bond University and its neighbours of Robina Waters and Robina Quays as can be seen
in figure 1.4.
Figure 1.4: The location of Robina Woods, image adapted and sourced from GCCC website
The research compiled data for mobility/connectivity by utilising field research, primarily
by mapping the actual distances and times to complete journeys. In order to attempt to
understand the effect the identified barriers have on the residents of Robina Woods, ten
residential addresses were selected for their position adjacent to barriers, proximity to
destinations outside of the neighbourhood and their position in the suburb to represent
the range of residences within the study area. The residences were numbered from one
to ten (see figure 1.5).
Bond University Master of Urban Planning Research Project
The Robina Residential Archipelago: Nigel Cartlidge 2008
10
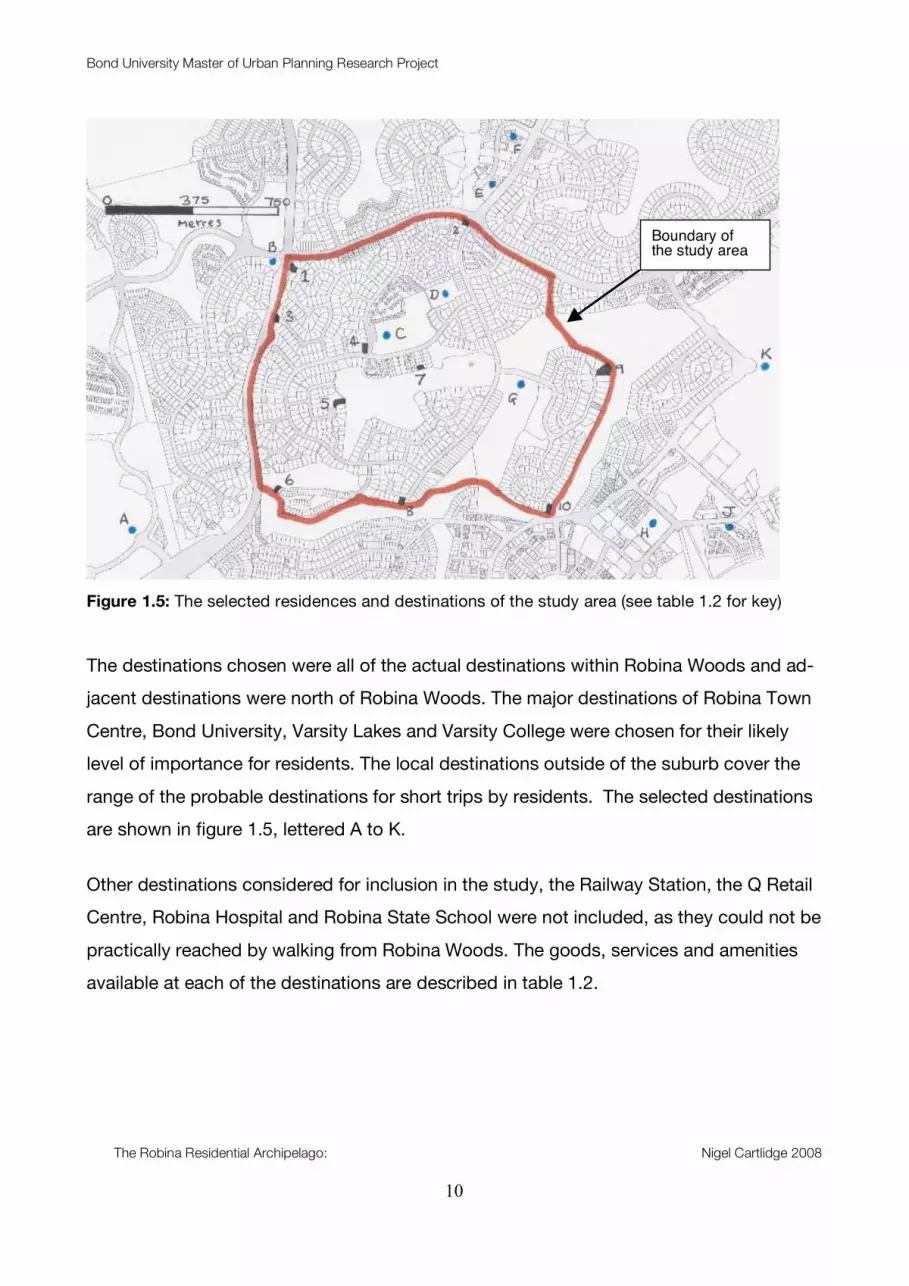
Figure 1.5: The selected residences and destinations of the study area (see table 1.2 for key)
The destinations chosen were all of the actual destinations within Robina Woods and ad-
jacent destinations were north of Robina Woods. The major destinations of Robina Town
Centre, Bond University, Varsity Lakes and Varsity College were chosen for their likely
level of importance for residents. The local destinations outside of the suburb cover the
range of the probable destinations for short trips by residents. The selected destinations
are shown in figure 1.5, lettered A to K.
Other destinations considered for inclusion in the study, the Railway Station, the Q Retail
Centre, Robina Hospital and Robina State School were not included, as they could not be
practically reached by walking from Robina Woods. The goods, services and amenities
available at each of the destinations are described in table 1.2.
Boundary of the study area
The Robina Residential Archipelago Nigel Cartlidge 2008
11
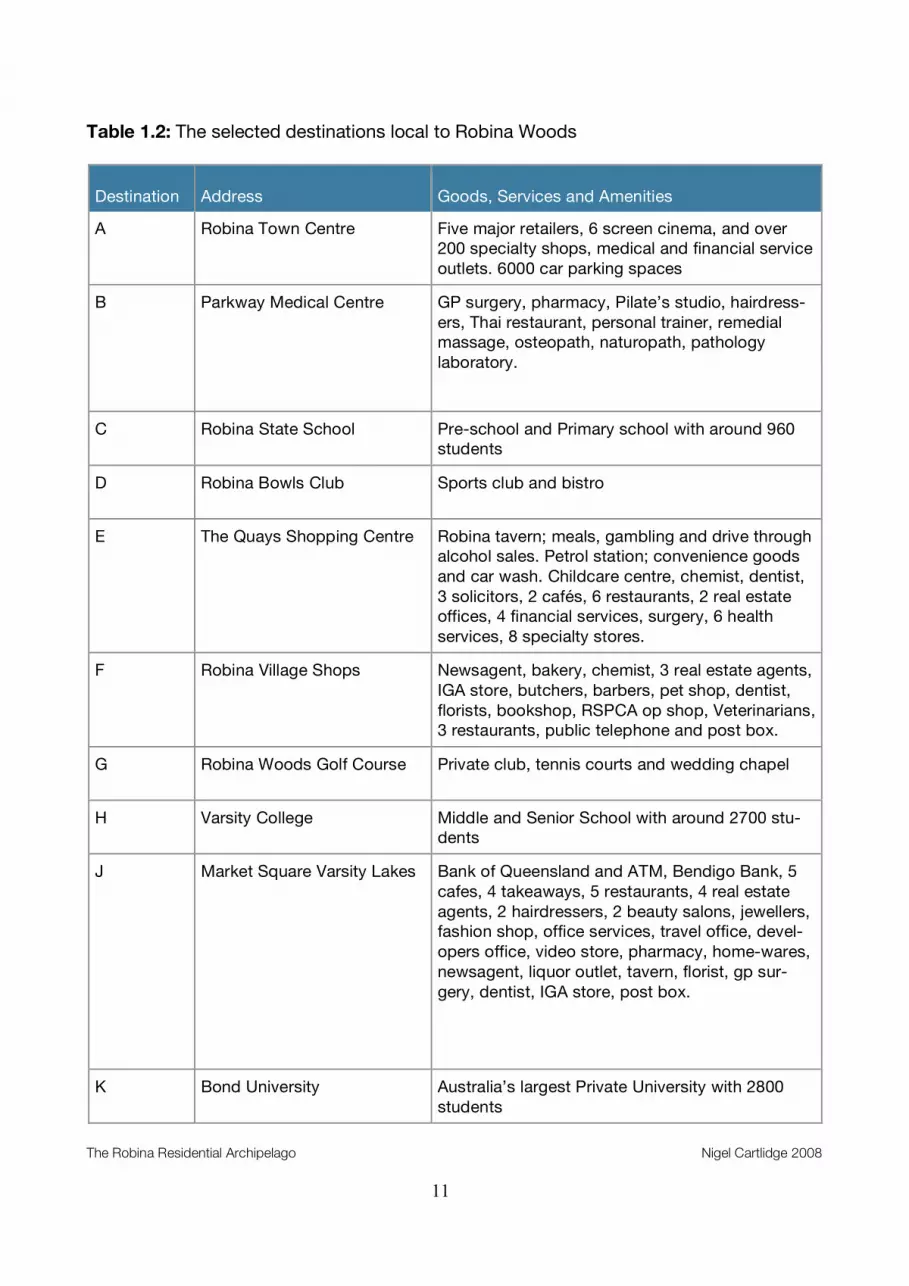
Table 1.2: The selected destinations local to Robina Woods
Destination Address Goods, Services and Amenities
A Robina Town Centre Five major retailers, 6 screen cinema, and over
200 specialty shops, medical and financial service
outlets. 6000 car parking spaces
B Parkway Medical Centre GP surgery, pharmacy, Pilate’s studio, hairdress-
ers, Thai restaurant, personal trainer, remedial
massage, osteopath, naturopath, pathology
laboratory.
C Robina State School Pre-school and Primary school with around 960
students
D Robina Bowls Club Sports club and bistro
E The Quays Shopping Centre Robina tavern; meals, gambling and drive through
alcohol sales. Petrol station; convenience goods
and car wash. Childcare centre, chemist, dentist,
3 solicitors, 2 cafés, 6 restaurants, 2 real estate
offices, 4 financial services, surgery, 6 health
services, 8 specialty stores.
F Robina Village Shops Newsagent, bakery, chemist, 3 real estate agents,
IGA store, butchers, barbers, pet shop, dentist,
florists, bookshop, RSPCA op shop, Veterinarians,
3 restaurants, public telephone and post box.
G Robina Woods Golf Course Private club, tennis courts and wedding chapel
H Varsity College Middle and Senior School with around 2700 stu-
dents
J Market Square Varsity Lakes Bank of Queensland and ATM, Bendigo Bank, 5
cafes, 4 takeaways, 5 restaurants, 4 real estate
agents, 2 hairdressers, 2 beauty salons, jewellers,
fashion shop, office services, travel office, devel-
opers office, video store, pharmacy, home-wares,
newsagent, liquor outlet, tavern, florist, gp sur-
gery, dentist, IGA store, post box.
K Bond University Australia’s largest Private University with 2800
students
Bond University Master of Urban Planning Research Project
The Robina Residential Archipelago: Nigel Cartlidge 2008
12
1.7 Analysis of the urban connectivity of Robina Woods
The analysis of urban connectivity in Robina Woods was conducted with a focus on pe-
destrian connectivity and the directness of the road system for private vehicles. The pe-
destrian analysis was conducted using maps to trace the distances and routes available
to the residents of each home. The analysis of the road network was also conducted us-
ing maps that traced the routes of vehicles from selected destinations to the homes of
residents. The results were audited by the researcher traveling along representative
routes for each analysis to verify travel time and record the conditions to be found along
the route.
1.8 The selected walking speed
The walking speed adopted for this research project is 4.5 km/h per hour, giving a walk-
ing distance of 375 metres in 5 minutes and 750 metres in 10 minutes. This has been
converted from studies indicating older pedestrians walk at 4.11 ft per second (US Roads
2008). The lower distance is seen as more appropriate than the usually quoted 400 and
800 meters as pedestrians are usually either younger or older than average (US Roads,
2008). The lower speed also allows for climate, terrain and slope. The quote by Bernard
Isaacs, Design for the young and you exclude the old; design for the old and you include
the young cited in (Australian Local Government Association et al., 2008) is also seen as
supporting a lower walking speed.
The Robina Residential Archipelago Nigel Cartlidge 2008
13
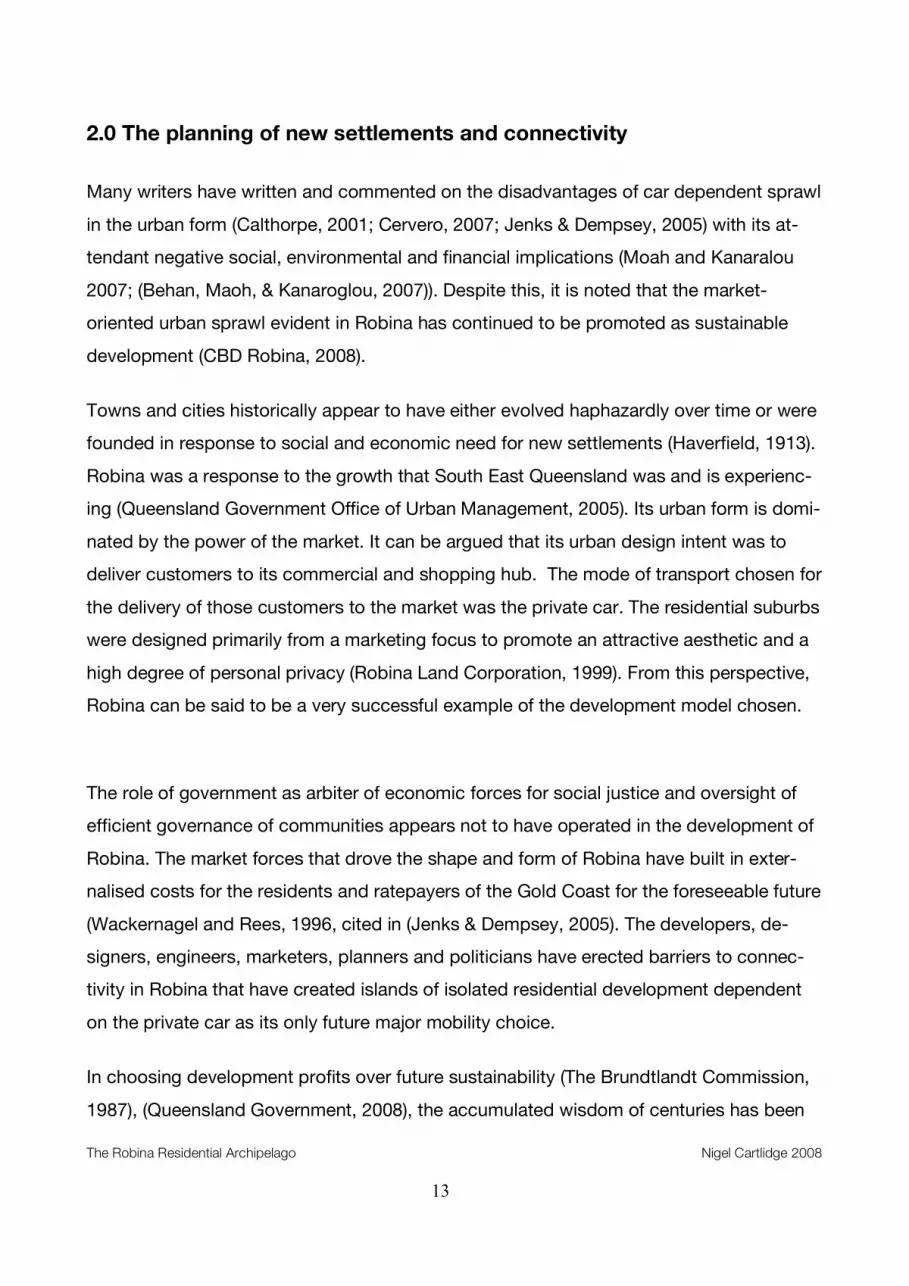
2.0 The planning of new settlements and connectivity
Many writers have written and commented on the disadvantages of car dependent sprawl
in the urban form (Calthorpe, 2001; Cervero, 2007; Jenks & Dempsey, 2005) with its at-
tendant negative social, environmental and financial implications (Moah and Kanaralou
2007; (Behan, Maoh, & Kanaroglou, 2007)). Despite this, it is noted that the market-
oriented urban sprawl evident in Robina has continued to be promoted as sustainable
development (CBD Robina, 2008).
Towns and cities historically appear to have either evolved haphazardly over time or were
founded in response to social and economic need for new settlements (Haverfield, 1913).
Robina was a response to the growth that South East Queensland was and is experienc-
ing (Queensland Government Office of Urban Management, 2005). Its urban form is domi-
nated by the power of the market. It can be argued that its urban design intent was to
deliver customers to its commercial and shopping hub. The mode of transport chosen for
the delivery of those customers to the market was the private car. The residential suburbs
were designed primarily from a marketing focus to promote an attractive aesthetic and a
high degree of personal privacy (Robina Land Corporation, 1999). From this perspective,
Robina can be said to be a very successful example of the development model chosen.
The role of government as arbiter of economic forces for social justice and oversight of
efficient governance of communities appears not to have operated in the development of
Robina. The market forces that drove the shape and form of Robina have built in exter-
nalised costs for the residents and ratepayers of the Gold Coast for the foreseeable future
(Wackernagel and Rees, 1996, cited in (Jenks & Dempsey, 2005). The developers, de-
signers, engineers, marketers, planners and politicians have erected barriers to connec-
tivity in Robina that have created islands of isolated residential development dependent
on the private car as its only future major mobility choice.
In choosing development profits over future sustainability (The Brundtlandt Commission,
1987), (Queensland Government, 2008), the accumulated wisdom of centuries has been

Bond University Master of Urban Planning Research Project
The Robina Residential Archipelago: Nigel Cartlidge 2008
14
overlooked and an opportunity to create a model of development has been missed. It
would appear that prudence in regulating and controlling development by the state gov-
ernment and local council could have avoided the future costs of reversing and retrofitting
current development. This includes the maintenance and repair of ageing infrastructure
with a low-density residential rateable base, provision of adequate social infrastructure,
subsidy of low viability public transport and a need to promote a reduction in car de-
pendency and its associated health risks and environmental damage (Australian Local
Government Association et al., 2008).
2.1 The political approaches to urban design
Planning operates in a social, economic, environmental and political context (England,
2004). There have been and continue to be many different forms of political response to
urban design. 1 Historically they could be characterised as:
1. Impotent: where a politically, morally, or financially bankrupt, incompetent or cor-
rupt, government is unable or unwilling to influence or control development. This
can occur in advanced and developing countries and is characterised by the un-
controlled urban development this can occur in countries like the United States or
shantytowns in third world countries.
2. Indifferent: where the government lacks the political vision, will, or power to make
decisions on urban development. This can be a response in various forms and
combinations in many societies.
3. Laissez Faire: where the government believes that market forces are the arbiters of
the urban form and government interference is unwarranted in the organic devel-
opment of urban form, common in United Kingdom and the United States.
4. Colonial: where a dominant and imperial government makes decisions on political,
religious, or cultural grounds that determine the urban form such as Roman colo-
nia, Imperial France and Germany or Communist era workers’ paradises.
1 This suggested list is an initial attempt by the author to characterise political responses to urban
design.

The Robina Residential Archipelago Nigel Cartlidge 2008
15
5. Municipal; where a powerful or wealthy, localized, controlling group engineer a
town to fit their purposes. This can be seen in Ancient Greece, Renaissance Italy,
and modern cities around the world such as Las Vegas, Bahrain or Abu Dhabi.
6. Interventionist; where governments react to public health, social or economic dis-
asters to intervene, for example in slum clearances after World War Two, the re-
building of London after the great fire; or the epidemics and social disorder com-
mon in crowded European towns in the nineteenth century
7. Structural; The dominant form of planning in western contemporary society, where
the control of urban design is legislated, regulated and directed as an arm of politi-
cal policy by elected representative government.
8. Collaborative; is an emerging form of governance (Australian National University,
2008) found in such cities such as Portland and Vancouver in which citizens par-
ticipate in the decision and policy making process.
The development of Robina carried out as it was by a private company appears to have
enjoyed a structural/laissez faire approach to planning from the responsible government
bodies.
2.2 A historical perspective of new town planning
In a paper presented in 1910 at the University of London, Francis Haverfield stated that
“Town-planning--the art of laying out towns with due care for the health and comfort of
inhabitants, for industrial and commercial efficiency, and for reasonable beauty of build-
ings--is an art of intermittent activity”(Haverfield, 1913). Haverfield went on to demand
that politicians ensure that towns should be planned for the health, convenience, and oc-
cupations of their probable tenants. Haverfield also observed that there were two condi-
tions necessary for successful town planning “the wit enough to care for the well-being of
common men and the due arrangement of ordinary dwellings”. He identified the Romans
as having perfected the art and science of town planning.
The Romans built towns to colonise their conquests, and they were usually founded as
places for their legionnaires to settle. In form they resembled the forts that the Roman
Bond University Master of Urban Planning Research Project
The Robina Residential Archipelago: Nigel Cartlidge 2008
16
armies built. Interestingly the towns were intended to be self sufficient and relied on their
hinterland for most goods and services. They differed from the army forts in having civic
functions like forums, markets, temples, courts, and entertainment within their bounda-
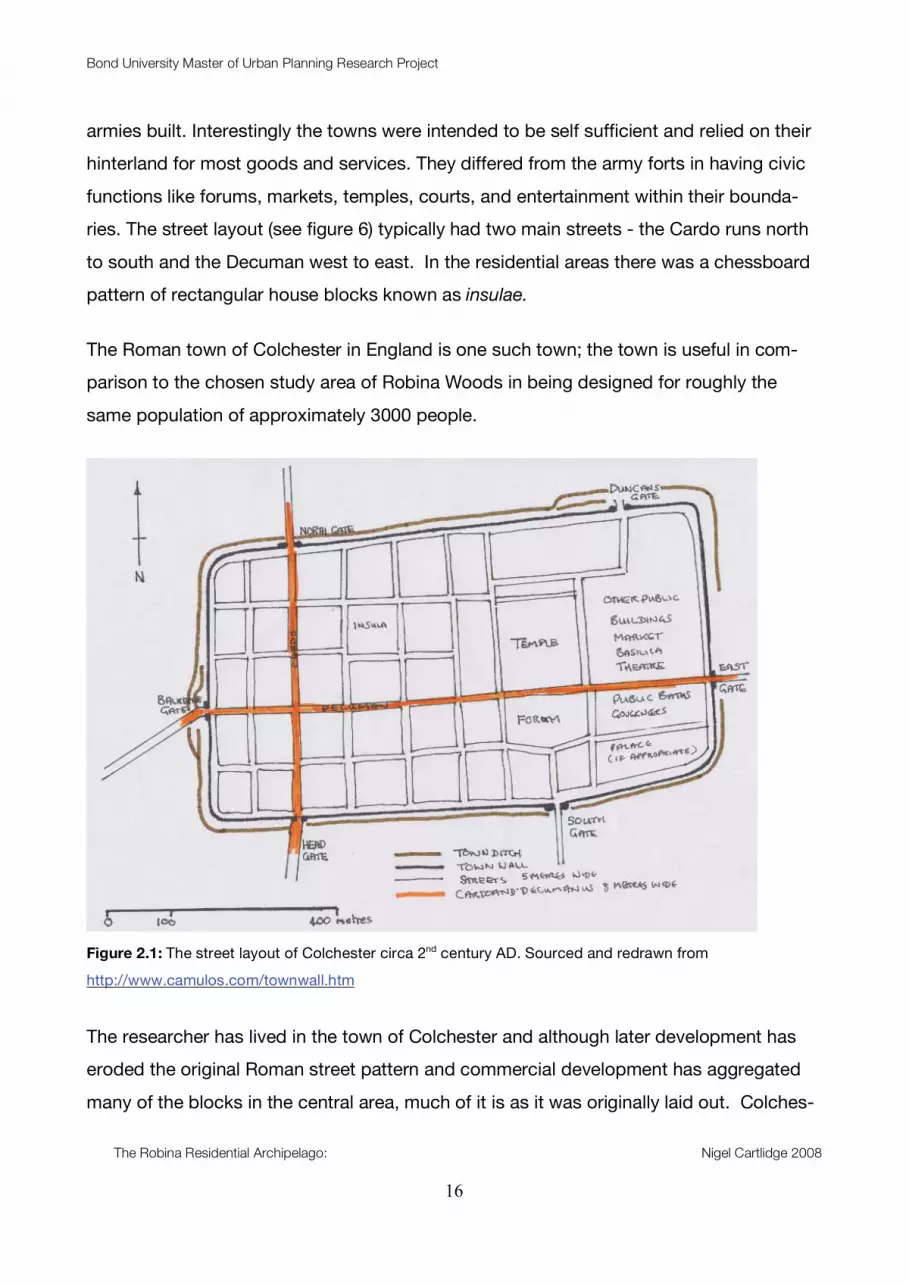
ries. The street layout (see figure 6) typically had two main streets - the Cardo runs north
to south and the Decuman west to east. In the residential areas there was a chessboard
pattern of rectangular house blocks known as insulae.
The Roman town of Colchester in England is one such town; the town is useful in com-
parison to the chosen study area of Robina Woods in being designed for roughly the
same population of approximately 3000 people.
Figure 2.1: The street layout of Colchester circa 2nd century AD. Sourced and redrawn from
http://www.camulos.com/townwall.htm
The researcher has lived in the town of Colchester and although later development has
eroded the original Roman street pattern and commercial development has aggregated
many of the blocks in the central area, much of it is as it was originally laid out. Colches-
The Robina Residential Archipelago Nigel Cartlidge 2008
17
ter is a vibrant town and despite being constrained by walls and on a prominent hill, it has
more exits to its surrounding suburbs and greater connectivity both within and outside of
its boundaries with access to most of the goods and services necessary for an urban life-
style than the suburbs of Robina.
2.3 Urban form and connectivity
Urban connectivity in the context of this research project has been defined as the degree
to which the urban form allows people to travel to retail, education, health, employment,
professional, social and recreational facilities from their homes on foot, by bicycle, public
transport or private vehicle. This may be seen as a definition of accessibility but in an ur-
ban context, connectivity without destinations for residents can be reasonably seen as of
little use. The suburb of Robina Woods could be on a grid pattern but the number of des-
tinations within the suburb would still make it a disconnected urban form.
The last two centuries have seen a transformation in cities from being relatively contained
to widespread urban sprawl. This is has been a worldwide phenomenon. The strengthen-
ing of international capital has led to the concentration of economic power in a number of
global centres of finance and highly specialised services (Sassen, 2001; Smith 2002 in
(Jenks & Dempsey, 2005).
This globalisation has also led to fewer local developers and the emergence of large cor-
porate developers who prefer and need the release of green field sites for their profita-
bility. This has been commented on in a recent article in the Courier Mail (McCarthy,
2008) who reports that 54 per cent of the land in the development pipeline on the Sun-
shine Coast is held by just three companies, Stockland, Springfield Land Corporation and
Delfin Lend Lease. In the article Professor Phil Heywood of the Queensland University of
Technology was quoted as saying that, “there was a risk that too much land in too few
hands could constrain supply, but it could also prevent new players from entering the
market.”

Bond University Master of Urban Planning Research Project
The Robina Residential Archipelago: Nigel Cartlidge 2008
18
This trend towards large scale developers and the resulting developments has led to a
reaction amongst urban design and planning theorists which is directed at the car de-
pendent and sprawling MPCs that were often a result of developers’ activities in the past.
Alonso (1964) and Muth (1969) indicated that the nature of connectivity is related to the
concepts of car dependency and urban sprawl. “The spatial structure of cities is deter-
mined by households balancing commuting costs against housing costs in search of an
optimal location”. This has led to many of society’s most vulnerable people being forced
to live at considerable distances from goods, services and employment (Dodson & Sipe,
2005).
The emergence of the new urbanist movement in the 1990s was a direct result of the
urban sprawl witnessed across the developed world but especially in the United States.
This movement went through an evolution of principles for public policy, development
practice and urban planning intended to provide density, diversity and connectivity and a
return to neighbourhoods that are walkable, defined and publicly accessible, through citi-
zen based participatory planning and design (Congress for the New Urbanism, 1996).
There were other responses to the problems created by urban sprawl and car dependent
neighbourhoods, including “Smart Growth” (Ewing, Bartholomew, Winkelman, Walters, &
Chen, 2008). This is an approach which has gathered wide spread support from envi-
ronmentalists, transport engineers, local government agencies, realtors, lawyers, com-
munity advocates, architects, urban designers and planners.
In the United States, various non-government and government groups have come to-
gether and formed the Smart Growth Network which is supported and sponsored by the
Environmental Protection Agency (Smart Growth Online, 2007) to promote public aware-
ness of the Smart Growth approach to planning. In brief, its policies and principles sup-
port development in a compact development model within the existing urban footprint to
create a range of housing choices, walkable neighbourhoods, community participation in
decision making, mixed land uses, and urban design which fosters a sense of place and
uses compact building design. It also seeks to preserve open space, farmland, and envi-

The Robina Residential Archipelago Nigel Cartlidge 2008
19
ronmental areas and make development decisions predictable, fair, and cost effective
(Smart Growth Online, 2007).
2.4 How planning can help to determine urban connectivity
The Planning Institute of Australia, in conjunction with the Heart Foundation and the
Australian Local Government Association, has produced a draft document which intends
to provide a national perspective on the nexus between health and the built environment
(Australian Local Government Association et al., 2008). This promises to be a significant
step forward in articulating and mobilising support for change and debate over guidelines
for healthy neighbourhoods.
It has produced the Introduction to Healthy Spaces and Places draft document to en-
courage the inter-disciplinary co-operation it sees as part of the political process to initi-
ate and encourage change. Originally intended to improve the welfare of older Australians
it has been adapted to be for all Australians.
Figure 2.2: Influence of elements in the built environment on physical activity (Source: U.S. Transportation
Research Board (2005))

Bond University Master of Urban Planning Research Project
The Robina Residential Archipelago: Nigel Cartlidge 2008
20
The previous diagram illustrates the connections between the built environment, neigh-
bourhood and region and its influence on individuals’ choices to take part in physical ac-
tivity. The paper goes on to identify major elements of the built environment and their in-
fluence on a range of planning outcomes, Accessibility, Affordability, Connectivity, Di-
versity and Proximity.
This was found to be a useful starting point in designing a mindmap of the factors that
affect and determine urban connectivity (see Figure 2.3). The addition of Urban Design,
Barriers, Mobility, Conditions, Safety, and Opportunity appears to offer tools to measure
urban connectivity holistically.
Figure 2.3: Proposed model of the factors that can determine urban connectivity (source: author)

The Robina Residential Archipelago Nigel Cartlidge 2008
21
2.5 Measuring urban connectivity
The high number of factors (see figure 2.3) that are capable of affecting connectivity in an
urban context goes some way to explaining why a simple measure of connectivity is not
capable of determining levels of connectivity in various contexts. It may also explain a
lack of comprehensive description of how to achieve urban connectivity in the literature.
Although there are a number of measurements of aspects of connectivity available in the
literature, none appear capable of taking into account all the factors that affect urban
connectivity. Types of measurements encountered include:
I. Measurement of Mixed density through the Mixed Density Index (Chu 2002)
II. Measurement of the public transport accessibility index (Pitot, Yigitcanlar, Sipe, &
Evans, 2005)
III. Measurements of permeability such as number of intersections per hectare
These measures may be useful in some contexts and can help to inform decision making
in particular scenarios. For this researcher’s purpose, they were considered inadequate in
describing the urban connectivity of the residents of Robina.
In the absence of a simple to use connectivity measure that the researcher can apply to
the study area, the intent is to use the identified factors that affect and determine urban
connectivity to describe the current urban form. The following combinations of factors will
be used to attempt to describe connectivity in Robina’s Residential Archipelago:
1. spatial layout of roads, streets and pathways
2. the effect of barriers on proximity
3. the influence of urban design and destinations on mobility choices
4. the effect of safety, environmental conditions and accessibility on opportunity
Bond University Master of Urban Planning Research Project
The Robina Residential Archipelago 22
3.0 Robina in context
Robina is in the local government area of the Gold Coast City Council (GCCC) in the
southeast corner of the state of Queensland. The Gold Coast is the second largest city in
the state and the sixth largest city in Australia (Australian Bureau of Statistics, 2007).
Robina was developed under its own act of Parliament. The then Robina Properties and
Albert Shire Council entered into an agreement to develop a Masterplanned Community
(MPC) (Queensland State Government, 1992). Robina is centrally located in the Gold
Coast City with rail and road connections to the state capital city of Brisbane. It has air
links from Brisbane Airport and Gold Coast Airport in the Southern Gold Coast to the rest
of Australia and internationally. The South East Queensland Region is recognised as the
fastest growing region in Australia (Office of Urban Management, 2005).
Gold Coast City Council like all local government authorities in Queensland operates
under the authority of the State Government (Thompson, 2007). The overriding
documents that govern planning in the Gold Coast are the Integrated Planning Act
(IPA) (England, 2004,) the South East Queensland Regional Plan (SEQRP) and the
local Gold Coast Planning Scheme (GCPS). The SEQRP designated Robina and
Southport as the two Principal Regional Activity Centres in the Gold Coast in 2005
(Queensland Government, 2005).
3.1 The development of Robina
Robina was a developed as a Masterplan Community on a green field site. In December
1980 a Singaporean developer, Robin Loh, and Arthur Earle, a local landowner and real-
tor, began to develop the town. Together they founded the Robina Land Corporation
when they purchased a 1658-hectare site from the liquidators of the Cambridge Credit
Company (Robina Land Corporation, 1999). The site for Robina Town Centre was known
as the “Great Swamp” and largely used as dry season grazing for livestock. Neighbouring
farms were purchased in 1981 bringing the land holding up to 1850 hectares (Gold Coast
Bond University Master of Urban Planning Research Project
The Robina Residential Archipelago 23
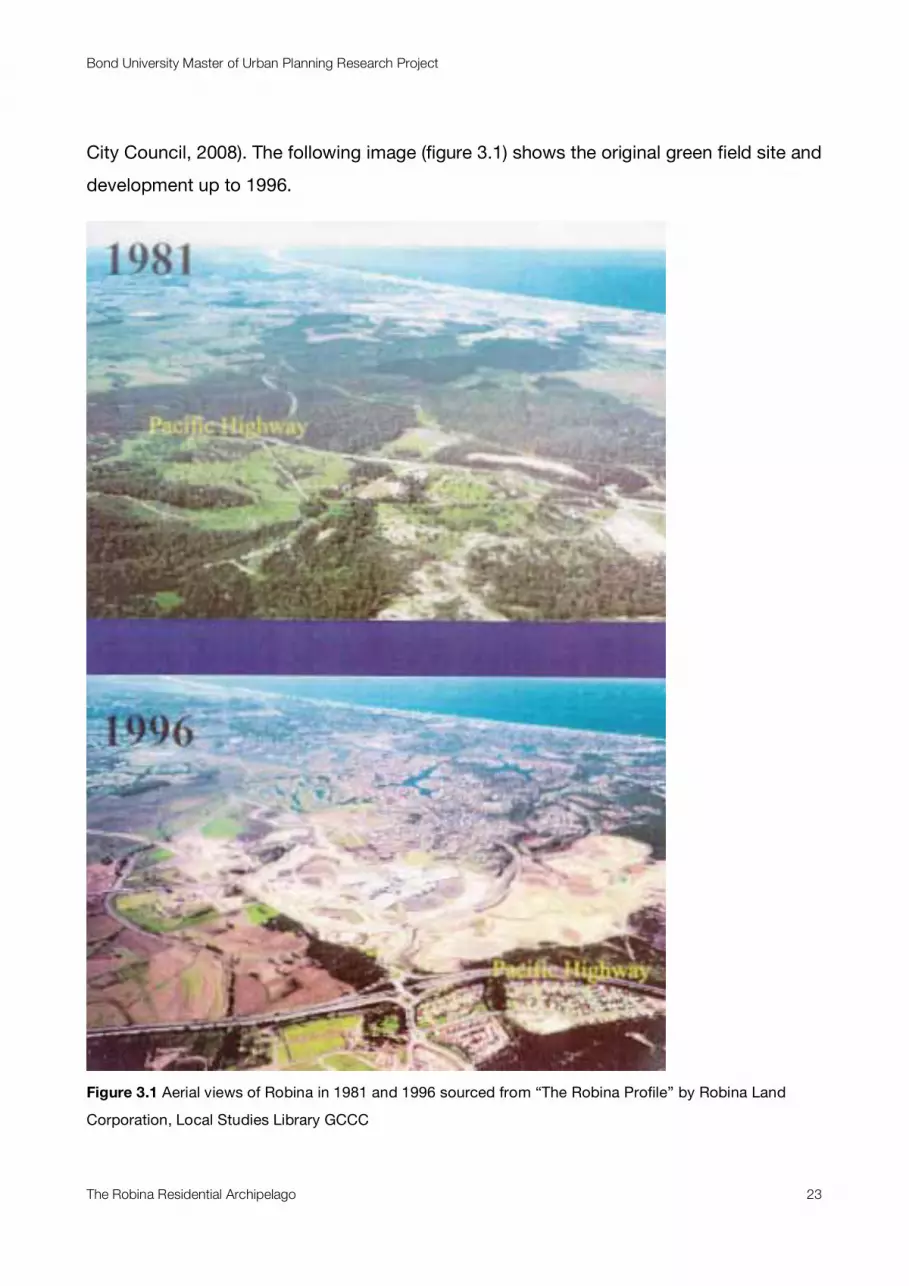
City Council, 2008). The following image (figure 3.1) shows the original green field site and
development up to 1996.
Figure 3.1 Aerial views of Robina in 1981 and 1996 sourced from “The Robina Profile” by Robina Land
Corporation, Local Studies Library GCCC

Bond University Master of Urban Planning Research Project
The Robina Residential Archipelago 24
In 1981 the first subdivision was put on the market and an urban planner, Moshe Safdie
who was based in California, was commissioned to develop the master concept plan.
Robina became Australia’s largest privately owned, master planned community and was
developed to act as the major commercial and community focus for the Gold Coast’s
permanent population (Robina Land Corporation, 1999).
Figure 3.2: The Gold Coast Urban Footprint in 1980 and 1997, sourced from “The Robina Profile” by Robina
Land Corporation, Local Studies Library GCCC
Figure 3.3: Population growth in the Gold Coast by suburb, sourced from “The Robina Profile” by Robina
Land Corporation, Local Studies Library GCCC
Bond University Master of Urban Planning Research Project
The Robina Residential Archipelago 25
Prior to the 1980s the urban footprint of the Gold Coast City was a linear strip along the
coast (see figure 3.2). This figure also illustrates the geographical centrality of Robina and
suggests the extent of the Gold Coast that can be reached in a ten and twenty minute
drive time. Population growth in Robina was rapid in the period 1986 to 1996 (see figure
3.3) but slowed as development shifted to Varsity Lakes in the period 1996 to 2006.
3.2 The car dependent focus of the Robina development
The car focus of the Robina development can be seen from various sources, primarily
from the Robina Profile prepared by the Robina Land Corporation (Robina Land
Corporation, 1999) and its current webpage (CBD Robina, 2008a). Key statements,
which support the idea of an intended car dependent development designed to deliver
customers to the commercial and retail hub of Robina Town Centre, include the following
quotes:
Unmatched vehicular accessibility with major arterial roads such as Robina Town
Centre Drive, Robina Parkway, Cheltenham Drive, and Christine Avenue all radiating from
the Robina Town Shopping Centre and providing easy and fast access in all directions
(Robina Land Corporation, 1999)
To provide for long-term demands and avoid bottlenecks in surrounding streets,
access roads to the site have been planned to handle up to 250,000 vehicle movements
per day, twice the amount that crosses the Sydney Harbour Bridge each day (ibid).
In 1996 313,000 people (91 per cent of the Gold Coast population) live within a 20-
minute drive from Robina, in 10 years this is expected to grow to 419,000 people (ibid)
The current website indicates the success of that planning for a car accessible Robina
Town Centre with a drive time analysis conducted in 2008 by Conics Robina (CBD
Robina, 2008b):
• 9 per cent of the population (of the Gold Coast) live within a 5 minute drive of Robina
(Town Centre Shopping)
• 33 per cent of the population live within a 10 minute drive

Bond University Master of Urban Planning Research Project
The Robina Residential Archipelago 26
• 79 per cent of the population live within a 20 minute drive
• 89 per cent of the population live within a 30 minute drive
The website also states that Robina Parkway, the main entry to CBD Robina now records
35,217 vehicles per day which is a 34% increase since 2002. The other main entry point,
Robina Town Centre Drive, now records 15,929 vehicles per day, which is an 11%
increase since 2002.
Considering that the designed capacity is 250,000 vehicle movements per day for the
town centre roads this is far short of its capacity, suggesting that modifications to the
current road hierarchy are quite possible without adversely affecting the carrying capacity
of the arterial roads to meet demand. The current research investigates the scope for
modifying the current road system to enhance urban connectivity, choice and mobility by
dispersing traffic through a more connected local road network. This in combination with
a more compact urban form would allow more growth within the existing urban footprint.

Bond University Master of Urban Planning Research Project
The Robina Residential Archipelago Nigel Cartlidge 2008
27
4.0 Describing the barriers to the urban connectivity of Robina
In the limited scope of this research project it was decided to identify some of the barriers
that affect and determine the current urban connectivity of Robina. The walkability of the
residential suburbs is the central focus of this case study. This research compiled data for
mobility/connectivity by utilising field research, mapping the actual distances and times to
complete journeys by foot. The first step taken was to examine the spatial layout of the
suburb, to describe and map the barriers to connectivity in its design.
4.1 The consensus on the desirable qualities of urban connectivity
There is some consensus in contemporary sustainable design literature about urban
connectivity. The Urban Design Alliance of Queensland (UDAL, 2005) writes about places
being physically connected with a multitude of fine mesh through-routes that offer short
journeys between places. This connectivity also needs clear visual signals of vistas and
landmarks with delineated private and public places (Urban Design Alliance of
Queensland (UDAL Qld), 2005). UDAL describes the qualities that those connections
should have to meet peoples’ needs as: accessible to all members of the community, with
pedestrian paths with good surfaces that avoid unnecessary steps and have adequate
lighting.
The influential Urban Design Compendium by English Partnerships (Llewellyn Davies,
2007) sees making connections as one of the key aspects of urban design. There is a
strong emphasis on ease of movement, legibility, and permeability with developments
being integrated into the existing urban form and natural built environment. The
compendium seeks to address the needs of people to access jobs and key services from
a walkable neighbourhood priority that creates a movement framework designed for
people to feel safe, with a maximum choice for how people will make their journeys with
clear connections. There is also advice on how to achieve this by mixed use
development, compatible uses that combine primary activities of living and working and
centres located at crossroads with an emphasis on the civic value of public space, edges,
transition zones, density and form.

Bond University Master of Urban Planning Research Project
Nigel Cartlidge 2008
28
The compendium recommends the grid as the spatial model for mobility networks for
pedestrians and vehicles alike (see Figure 4.1). The optimal grid spacing for this network
is seen as 80 to 100 metres in most cases with a tighter 50 to 70 metres grid in areas with
intensive pedestrian circulation (Llewellyn Davies, 2007).
Figure 4.1: Example of street grids from the “Urban Design Compendium”
In the book “Urban Places Urban Spaces” (Carmona, Heath, Oc, & Tiesdell, 2003) the
dimensions of urban design are seen as morphological, perceptual, social, visual,
functional and temporal. In this the authors identify two types of urban form: “traditional”
and “modernist”. They refer to work by Pope, 1996; and Bentley, 1998 as documenting
Bond University Master of Urban Planning Research Project
The Robina Residential Archipelago Nigel Cartlidge 2008
29
the change in the morphological structure of urban space from the traditional integrated
pattern of connected small-scale finely meshed street grids, to road networks surrounding
segregated and introverted enclaves of the modernist urban form. The later description is
seen as applicable to the urban form of Robina.
4.2 The selected study areas
The following diagrams (figures 4.2 and 4.3) give some sense of the road connectivity of
the study area and an area chosen for comparison approximately five kilometres south of
the CBD of Vancouver at the same scale. Vancouver was chosen, as with a population of
around 600,000 it is similar to the population of the Gold Coast (Ip, 2007).
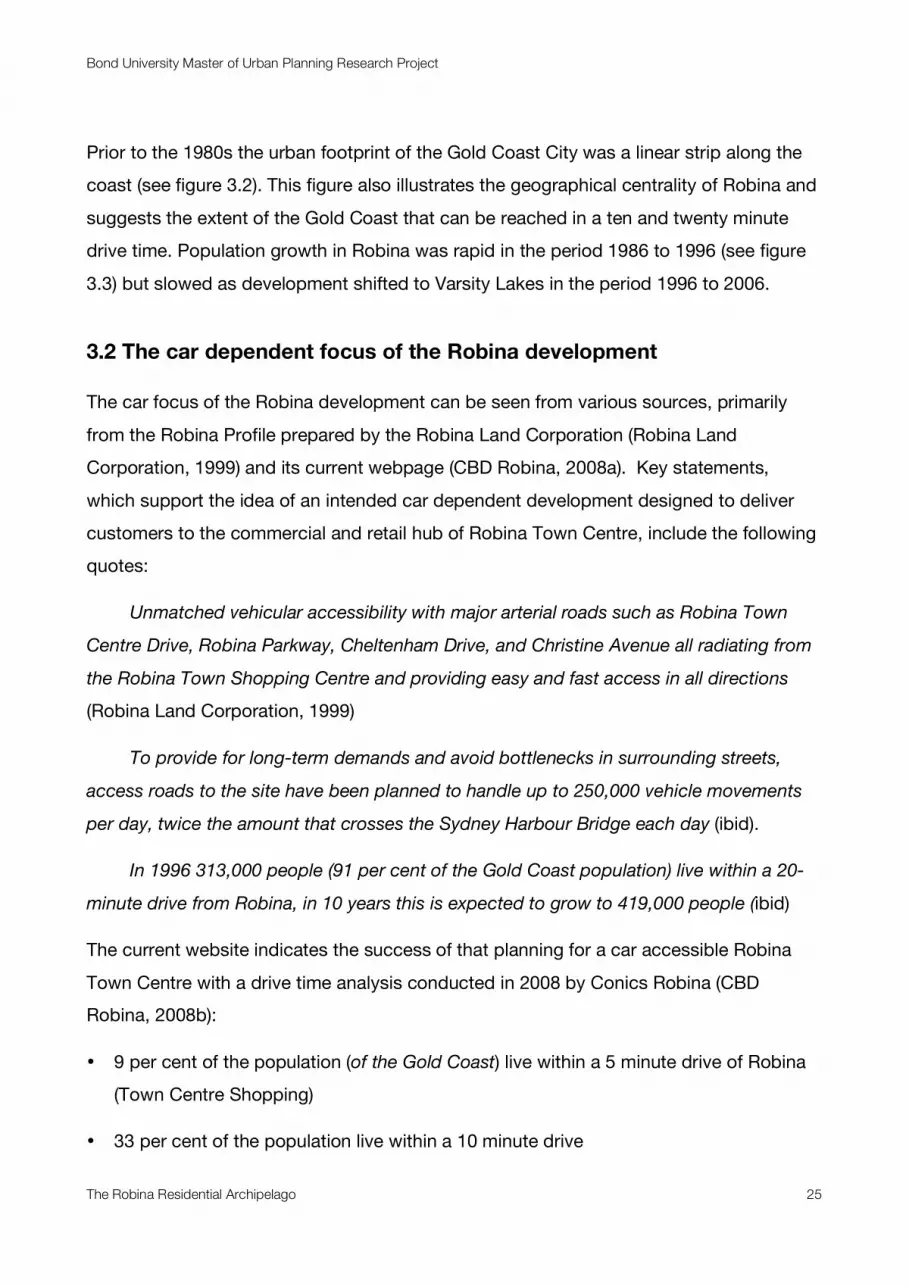
Figure 4.2: Aerial view of Robina Woods sourced from Google
The area of Vancouver selected is south of Van Dusen Botanical Gardens. It has
Oakridge Shopping Centre on its fringe and contains two parks and a school. Its primary
selection criteria was as a residential area on the same physical scale as Robina that had
a grid pattern. It was also chosen for having some distortion in the grid caused by open
spaces and large block destinations. Vancouver was chosen as it often makes the top ten
in the world ratings for green and sustainable cities (Shepherd, 2007).

Bond University Master of Urban Planning Research Project
Nigel Cartlidge 2008
30
Figure 4.3: Aerial view of a suburb of Vancouver at the same scale
Comparing the two images of Robina Woods and Vancouver visually, it would appear that
the housing lots are smaller in Vancouver. The streets are also more compact and there
are distinct variations in the orientation and rhythm of the street patterns. There are many
more three and four way street intersections in Vancouver compared to Robina. There are
obvious main through routes with north to south and east to west routes reminiscent of
the Roman layout of Colchester (see figure 2.1). Major destinations in Vancouver are near
or at the major intersections; permeability and alternative route choices are very visible.
There are no obvious barriers for residents of Vancouver to reach adjacent
neighbourhoods. The school and other destinations are integrated into the street pattern.
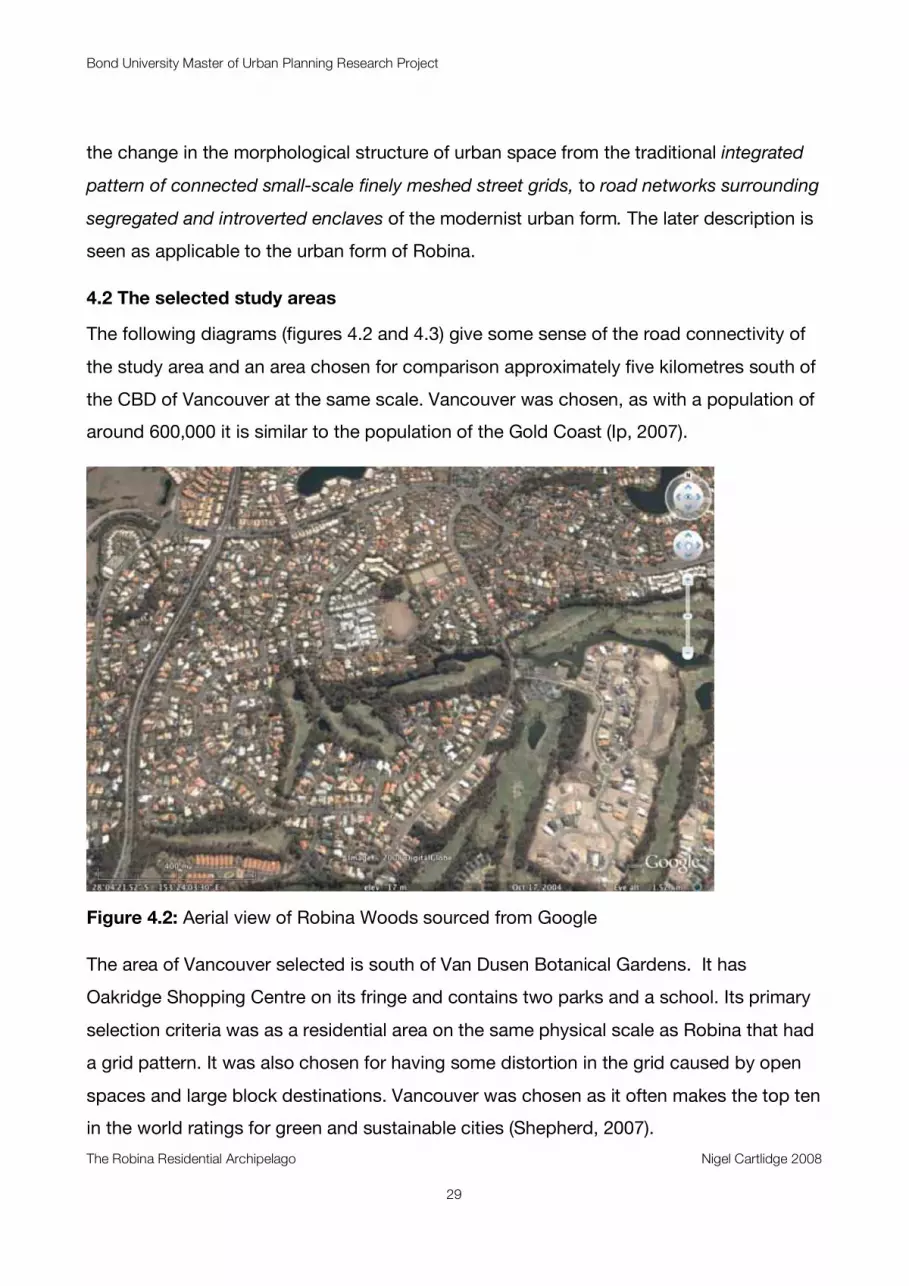
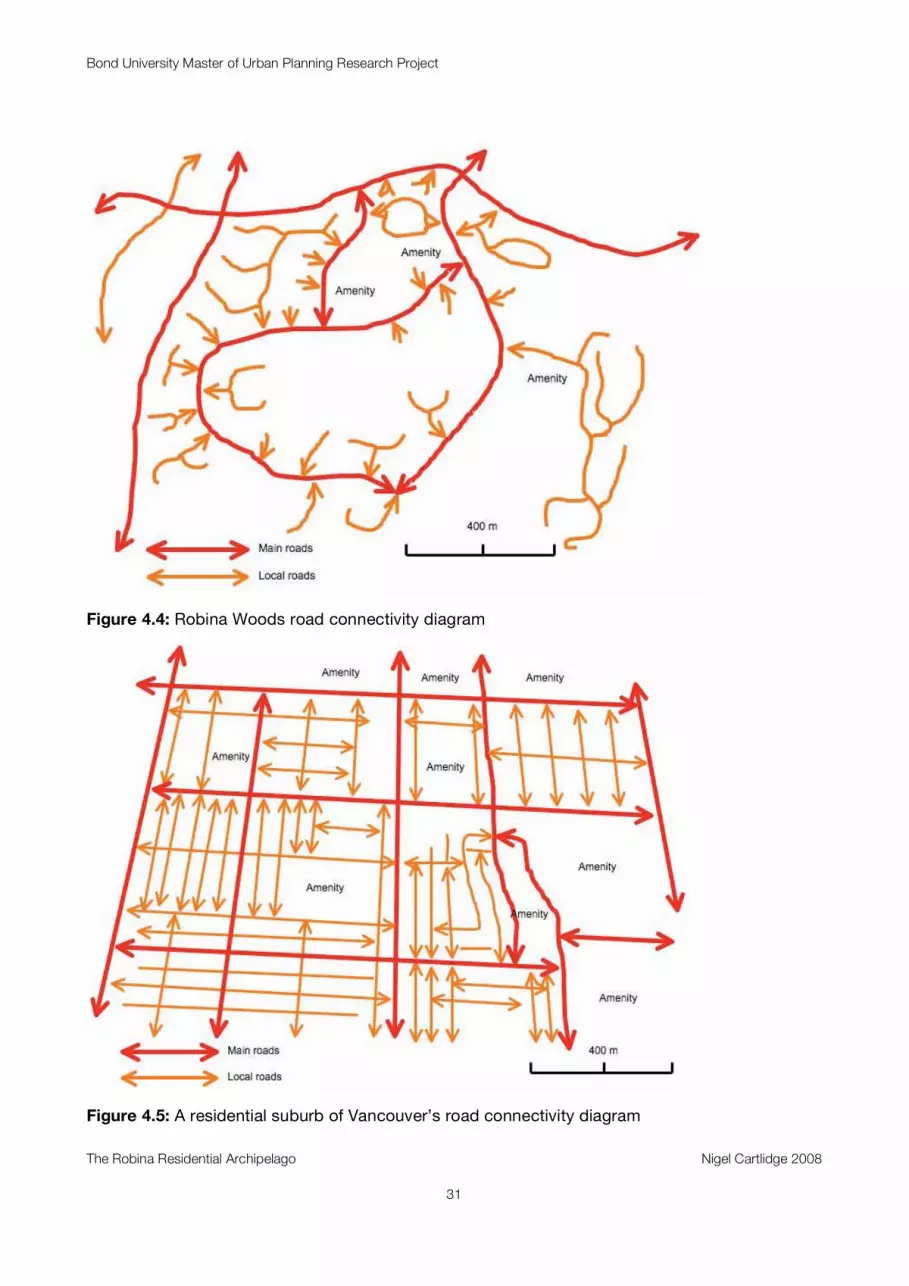
The following diagrams (Figures 4.4 and 4.5) are an attempt to simplify and examine the
nature of the road connectivity in Robina Woods and Vancouver. The red lines are the
main roads and the orange lines indicate local residential roads. The arrows indicate if
travel is possible beyond the end of the drawn line.
Oakridge Shopping Centre
Van Dusen Botanical Gar-
Montgomery Park
Tisdale Park
Vancouver College
Bond University Master of Urban Planning Research Project
The Robina Residential Archipelago Nigel Cartlidge 2008
31
Figure 4.4: Robina Woods road connectivity diagram
Figure 4.5: A residential suburb of Vancouver’s road connectivity diagram

Bond University Master of Urban Planning Research Project
Nigel Cartlidge 2008
32
Visually the comparison of the two suburbs is stark. The road connectivity of Robina
Woods appears broken and disjointed. The cul-de-sacs of Robina are clearly seen to feed
the collector roads, the cul-de-sacs in Vancouver are only found in one smaller area of
the south east of the diagram. Permeability of Vancouver is clear with no obvious
impediment for route choice to neighbouring suburbs. The local residential roads of
Vancouver are contained within the larger grid of the main roads and have intersections
and route choice. The local residential roads of Robina Woods have no connectivity to
each other and no choice of routes to the south, east, and west.
The amenities of Vancouver are dispersed through the road network and sited to be
accessible from the main through routes. This invites neighbouring suburbs to utilise the
amenities, and this in turn may also contribute to the vitality and viability of those
amenities. This ability to choose destinations within and outside of the neighbourhoods is
a significant difference between Robina Woods and Vancouver. The arterial road
structure of Robina funnels residents to destinations. Indeed the intent to funnel
customers to Robina Town Centre has been identified as a function in the design of the
road structure of Robina (Robina Land Corporation, 1999). The question is has choice
been removed from the residents of Robina to access their goods, services, recreation
and employment? The design of Robina can be seen as centrally controlled and anti free
market if viewed in this way.
4.3 Identified barriers to connectivity in Robina
The spatial layout of Robina was examined to establish the main barriers to connectivity
for residents. These were identified in mapping of the town as the Grey Barriers of roads
(Figure 4.7); the Green Barriers of private open space (Figure 4.12); the Blue Barriers of
waterways and lakes (Figure 4.15); the Planned Barriers of land use and streetscape
design (Figure 4.16) and the Social Barriers of public and private spaces created by the
choices made by developers and residents (Figures 4.17 to 4.26). The following images
illustrate and help us understand how the residential suburbs of Robina are separated
from each other and the goods, services, employment and amenities they need.
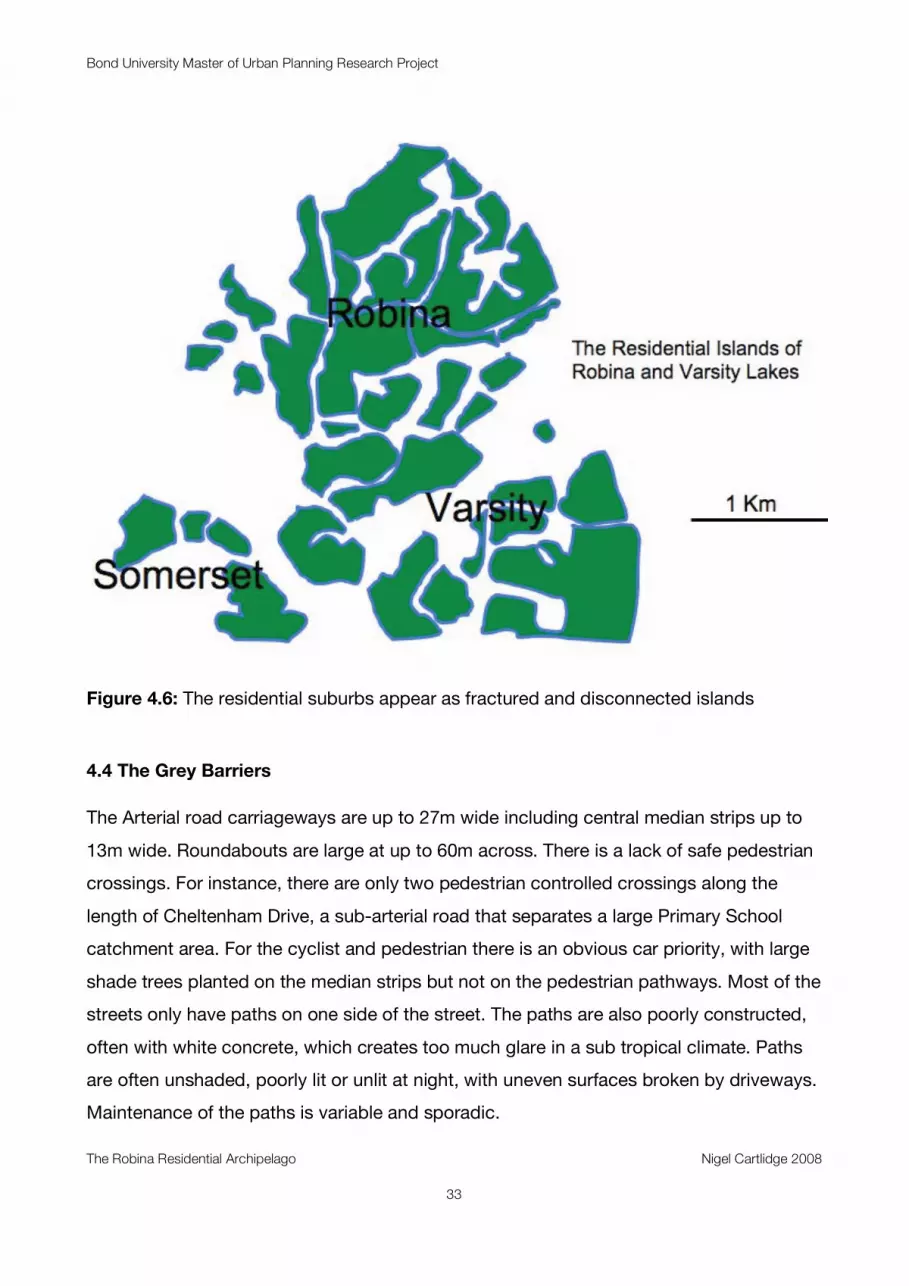
Bond University Master of Urban Planning Research Project
The Robina Residential Archipelago Nigel Cartlidge 2008
33
Figure 4.6: The residential suburbs appear as fractured and disconnected islands
4.4 The Grey Barriers
The Arterial road carriageways are up to 27m wide including central median strips up to
13m wide. Roundabouts are large at up to 60m across. There is a lack of safe pedestrian
crossings. For instance, there are only two pedestrian controlled crossings along the
length of Cheltenham Drive, a sub-arterial road that separates a large Primary School
catchment area. For the cyclist and pedestrian there is an obvious car priority, with large
shade trees planted on the median strips but not on the pedestrian pathways. Most of the
streets only have paths on one side of the street. The paths are also poorly constructed,
often with white concrete, which creates too much glare in a sub tropical climate. Paths
are often unshaded, poorly lit or unlit at night, with uneven surfaces broken by driveways.
Maintenance of the paths is variable and sporadic.

Bond University Master of Urban Planning Research Project
Nigel Cartlidge 2008
34
Figure 4.7: The Grey Barriers a hierarchical road network designed for cars
The two main grey barriers for the residents of Robina Woods are Robina Parkway and
Cheltenham Drive. These two roads define the northern and western boundaries of
Robina Woods. The term ‘parkway’ means a wide scenic road planted with trees. It is an
unusual term in Australia having originated in New York in the design of Central Park. The
use of the term in this case is a liberal interpretation as parkways were originally intended
to exclude trucks and heavy vehicles (Answers.com, 2008). Robina Parkway is part of an
arterial network connecting the Pacific Highway to Gooding Drive and the Nerang
Broadbeach Road. Cheltenham Drive and Cottesloe Drive are designated distributor
roads in the Gold Coast Planning Scheme (GCPS).
Robina Parkway is a major barrier for pedestrians and effectively blocks, funnels and
constrains any pedestrian network from Robina Woods to the town centre and
neighbouring residential areas to the west. The speed limit on Robina Parkway is
nominally 70 kmh, but in practice this is often observed as over 80 kmh.
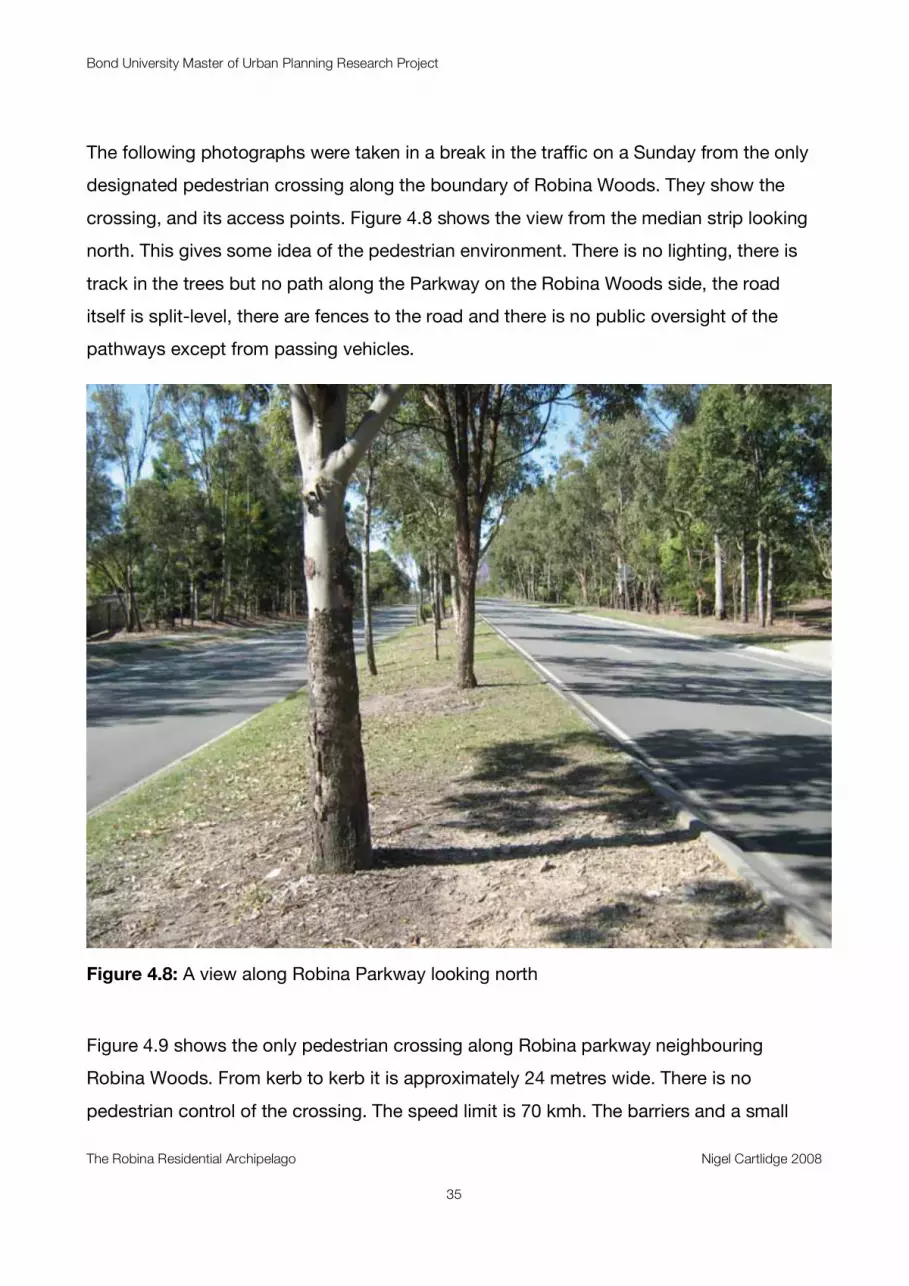
Bond University Master of Urban Planning Research Project
The Robina Residential Archipelago Nigel Cartlidge 2008
35
The following photographs were taken in a break in the traffic on a Sunday from the only
designated pedestrian crossing along the boundary of Robina Woods. They show the
crossing, and its access points. Figure 4.8 shows the view from the median strip looking
north. This gives some idea of the pedestrian environment. There is no lighting, there is
track in the trees but no path along the Parkway on the Robina Woods side, the road
itself is split-level, there are fences to the road and there is no public oversight of the
pathways except from passing vehicles.
Figure 4.8: A view along Robina Parkway looking north
Figure 4.9 shows the only pedestrian crossing along Robina parkway neighbouring
Robina Woods. From kerb to kerb it is approximately 24 metres wide. There is no
pedestrian control of the crossing. The speed limit is 70 kmh. The barriers and a small

Bond University Master of Urban Planning Research Project
Nigel Cartlidge 2008
36
road sign (on one side of the road only) are the only visual signals for a driver of the
presence of a pedestrian crossing. There is no lighting at night.
Figure 4.9: The only pedestrian crossing along the length of Robina Parkway
Figures 4.10 and 4.11 show how the pedestrian crossing on Robina Parkway is accessed
from Robina Woods and Robina. These access points to the Robina Parkway crossing
are unknown to the majority of Robina Woods’ residents. Princeville Court is a steeply
sloping cul de sac. There is no lighting on either approach path. The access from
Medinde Court is a steep track that is fenced from the houses alongside. There is no
clear sense of direction or way finding in either approach to the parkway.
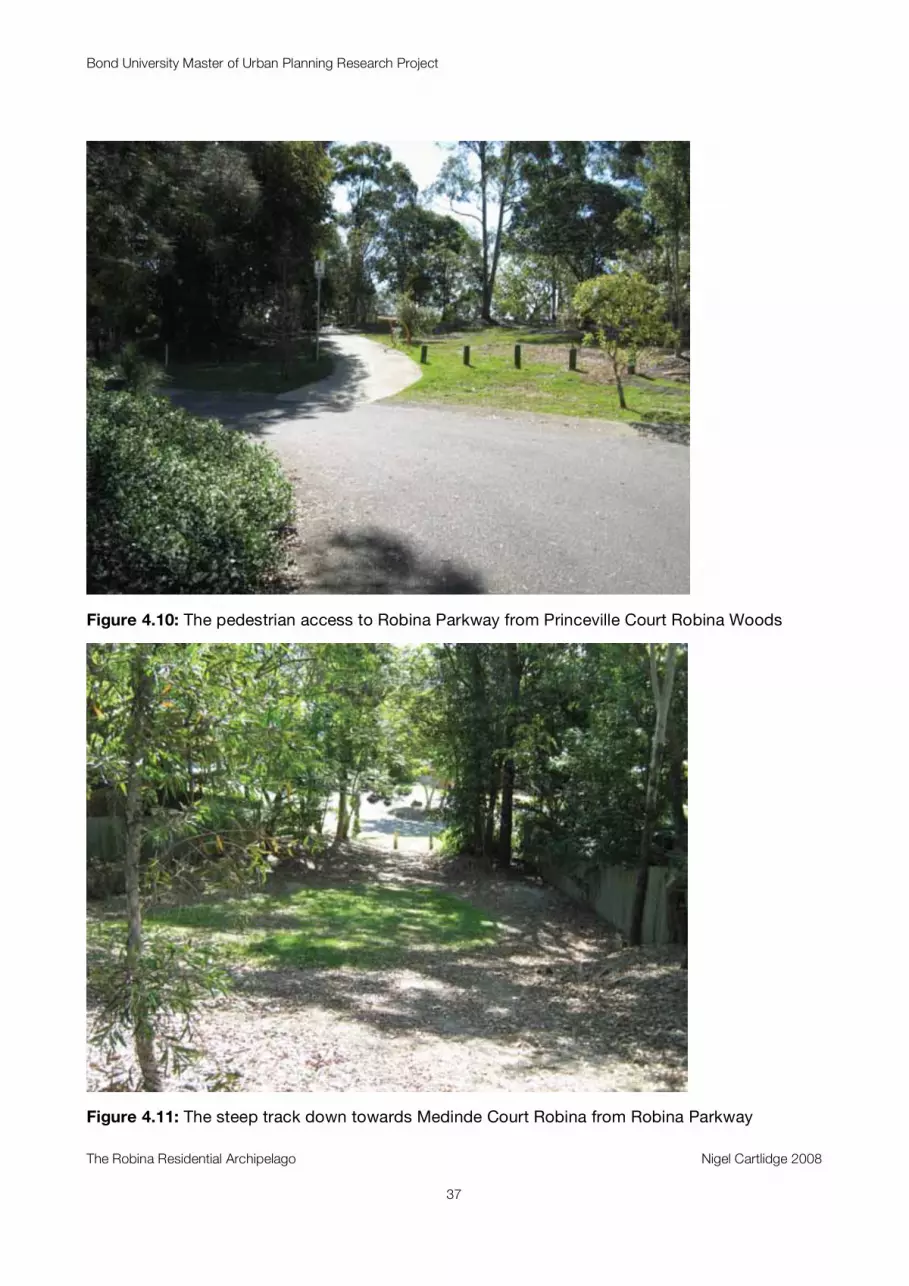
Bond University Master of Urban Planning Research Project
The Robina Residential Archipelago Nigel Cartlidge 2008
37
Figure 4.10: The pedestrian access to Robina Parkway from Princeville Court Robina Woods
Figure 4.11: The steep track down towards Medinde Court Robina from Robina Parkway

Bond University Master of Urban Planning Research Project
Nigel Cartlidge 2008
38
4.5 The Green Barriers
Golf courses are part of the Planning Strategy of the GCCC with ten golf courses being
within a fifteen-minute drive of Broadbeach (Planning Strategy Map PS6). The Robina
Woods Golf Course effectively fractures the suburb of Robina Woods and separates
Robina Woods from Varsity Lakes. The golf course was opened in 1991 and is ranked as
one of the top 30 resort courses in the country. Robina Woods is a 6078 meter, 18 hole,
Par 71 championship golf course and occupies 68 hectares (Maxmoment International
Internet Application Developers, 2008).
Figure 4.12: The Green Barriers consist of Private open spaces
The meandering course follows the landscaped watercourses. The course is over 2000m
by 850m, and surrounds and isolates “The Gallery” residential precinct from all its
neighbours in Robina Woods (see figure 4.13). In one particular place, the course is only
33m wide but still manages to separate Robina from Varsity Lakes.

Bond University Master of Urban Planning Research Project
The Robina Residential Archipelago Nigel Cartlidge 2008
39
Figure 4.13: Aerial view of Robina Woods Golf Course sourced from its website
This space between the Gallery and Varsity Lakes is taken up with a fenced golf buggy
route between holes and was rejected in 2003 as a possible pedestrian/cycle access for
students who live in Robina Woods but attend the Varsity College Middle and Senior
School in Varsity Lakes1.
Figure 4.14 shows the northern part of the catchment area for Varsity College Middle and
Senior School. The green line is the fenced barrier of the private Golf Course. This
indicates the extent of the catchment area affected. It indicates the routes and distances
that students who wish to walk and cycle have to go around the Golf Course to get to
school.
1 The author requested consideration of a pedestrian and cyclist link between Robina Woods and
Varsity Lakes before the Gallery was built out from the local councilor.
Varsity Lakes Robina Woods
The Gallery
Narrow Gap

Bond University Master of Urban Planning Research Project
Nigel Cartlidge 2008
40
Figure 4.14: The Varsity College Middle and Senior School catchment area, showing the
green barrier. sourced from Queensland Education website
4.6 The Blue Barriers
The developers of Robina enlarged existing natural waterways in the construction of the
town to create a series of lakes (see figure 4.14). They range from 40 to 500m across and
up to 1300m long. It is interesting to note that the narrowest waterways appear to be in
Robina Woods Golf Course. The urban form often uses them as moats to isolate pockets
of development. They are usually only privately accessible and have little actual amenity
for residents without waterside property.
The suburbs of Robina Waters and Robina Quays can be seen to have a fracturing of the
urban form caused by the central positioning of the lakes (see Figure 4.14). There is a
recognisable similarity in shape and position of the waterways to the role that Robina
Woods Golf Course plays in fracturing Robina Woods.

Bond University Master of Urban Planning Research Project
The Robina Residential Archipelago Nigel Cartlidge 2008
41
Figure 4.15: The Blue Barrier, the ribbon of lakes and waterways that cut through the suburbs
4.7 The Planned Barriers
The layout of Robina Woods shows the determining influence of the arterial road
hierarchy. The majority of residents live in cul-de-sacs. These cul-de-sacs are often
physically close to the arterial roads but are fenced and screened off from them (Figure
4.16).
The residents of cul-de-sacs travel by car along the collecting crescents into a limited
number of virtual gated entries and exits. These have been indicated on Figure 4.16 with
blue circles. These three entries are the only entry and exits points to the suburb for
vehicles. There are an extra two pedestrian/cyclist access points on the western
boundary of Robina Woods, these access points have been indicated by yellow circles.
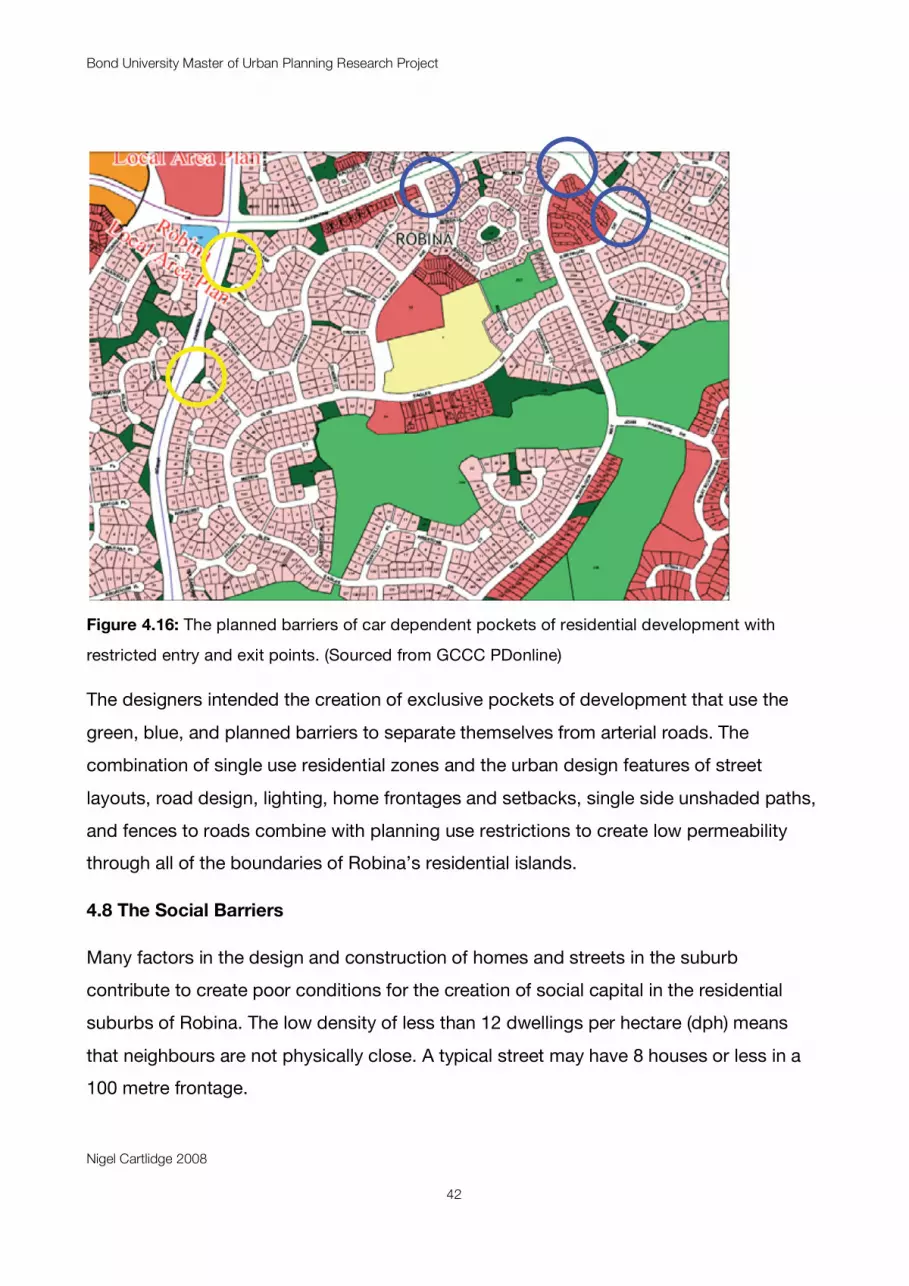
Bond University Master of Urban Planning Research Project
Nigel Cartlidge 2008
42
Figure 4.16: The planned barriers of car dependent pockets of residential development with
restricted entry and exit points. (Sourced from GCCC PDonline)
The designers intended the creation of exclusive pockets of development that use the
green, blue, and planned barriers to separate themselves from arterial roads. The
combination of single use residential zones and the urban design features of street
layouts, road design, lighting, home frontages and setbacks, single side unshaded paths,
and fences to roads combine with planning use restrictions to create low permeability
through all of the boundaries of Robina’s residential islands.
4.8 The Social Barriers
Many factors in the design and construction of homes and streets in the suburb
contribute to create poor conditions for the creation of social capital in the residential
suburbs of Robina. The low density of less than 12 dwellings per hectare (dph) means
that neighbours are not physically close. A typical street may have 8 houses or less in a
100 metre frontage.

Bond University Master of Urban Planning Research Project
The Robina Residential Archipelago Nigel Cartlidge 2008
43
There is a lack of local amenities or public meeting places within Robina Woods. There is
a noticeable car priority on the streets even in the residential areas as explained in 4.7.3.
This, combined with a need to drive to get to most destinations, means that people
usually only know their immediate neighbours. A significant proportion of the population
is over 55 and under 18 years of age. Local real estate agents report that people who live
in Robina would like to stay in Robina. This could lead to an isolated ageing population
with a low local social capital.
The SEQRP, which recognises the strong links between urban design and safe, healthy
local environments, says one of the objectives of a sustainable community is that they
should have “well-designed activity centres focused around public transport hubs;
efficient infrastructure and well-utilised public transport.” This can be argued to not be the
case in Robina. For a neighbourhood of over 3000 people the study area appears to be
under-resourced by the principles and policies in section 6 of the SEQRP (Queensland
Government, 2005).
4.8.1 Demographics of Robina
The demographics of Robina indicate the suburb as having a large number of households
of couples with children. These appear to be made up of parents in their forties and fifties
with children in their teens and twenties (see Figure 4.17). There is also a significant group
of childless couples.
Figure 4.17: The distribution of age groups in Robina

Bond University Master of Urban Planning Research Project
Nigel Cartlidge 2008
44
The Robina Statistical Profile produced by the GCCC gives household income figures
that show two peaks at $15,000 to $26000 p.a. and $52,000 to $78,000 p.a. The
distribution would appear to indicate the area as dominated by mature families. Income
levels appear consistent with the Gold Coast median.
The ownership structure of homes in the suburb is equally divided between households
that own their home outright, are currently paying a mortgage, or are renting (Gold Coast
City Council, 2007). The median sale price in September of 2007 is given as $513,000
compared to the Gold Coast median sale price of $466,500. (RP DATA, 2007) Median
rentals are reported at $350 for 3 bedroom units. Property rental and purchase costs are
above reported Gold Coast City averages (RP DATA, 2007).
Occupation statistics indicate that the majority of the residents of the suburb are clerical,
sales, and service workers or associate professionals. In 2003, a third of Robina residents
were born overseas, more than half of these came from mainly English speaking
countries.
4.8.2 Pattern and nature of urban development in Robina Woods
There have been two active phases of development in Robina Woods: firstly, the 1980s’
“Garden City” parkland style with a garage door frontage brick and tile facade (see Figure
4.18) and secondly, since around 2002 infill has occurred on any vacant blocks in the
recently fashionable post-modern, rendered concrete style (see Figure 4.19).
Figure 4.18: 1980s brick and tile homes with a deep setback, driveway, and garage frontages
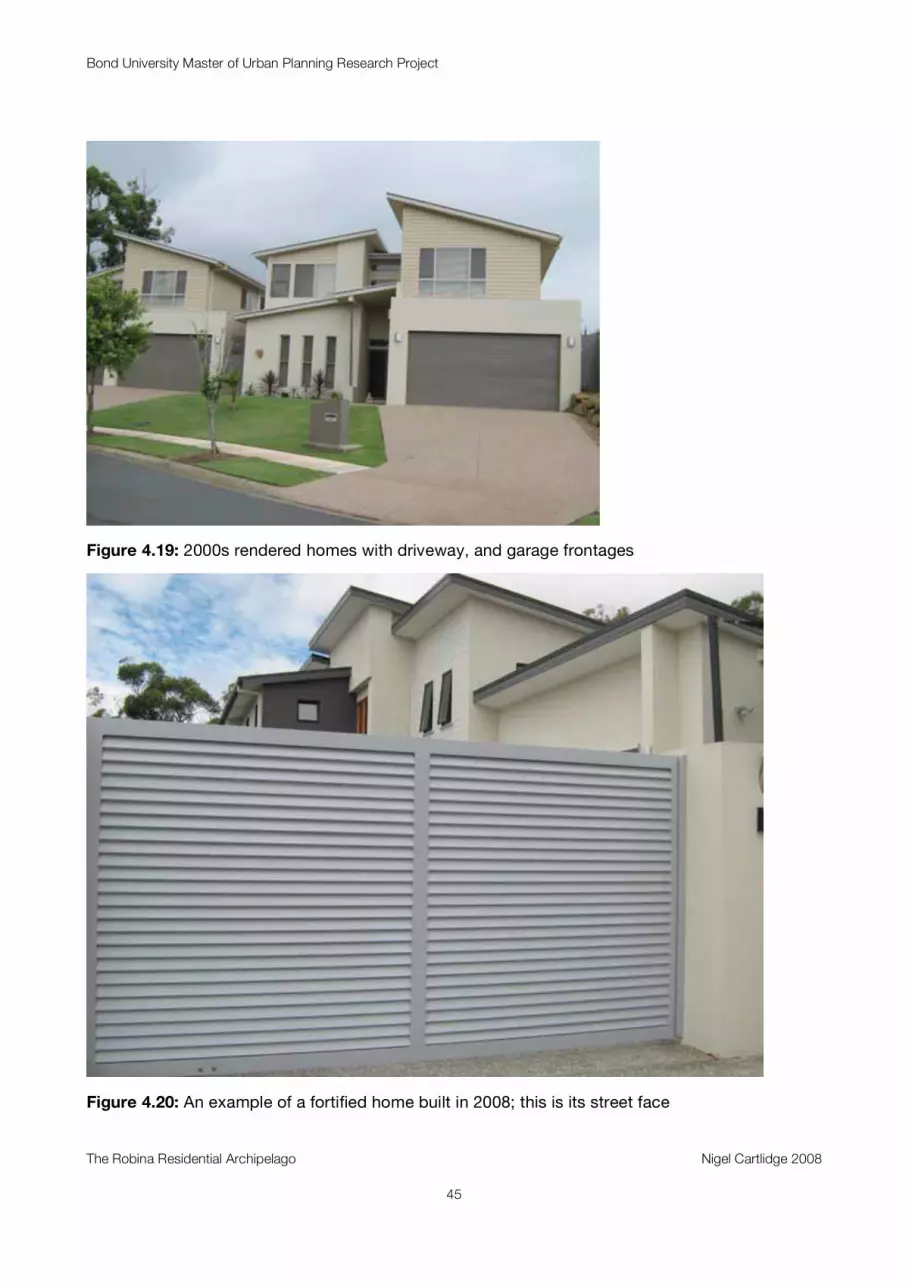
Bond University Master of Urban Planning Research Project
The Robina Residential Archipelago Nigel Cartlidge 2008
45
Figure 4.19: 2000s rendered homes with driveway, and garage frontages
Figure 4.20: An example of a fortified home built in 2008; this is its street face
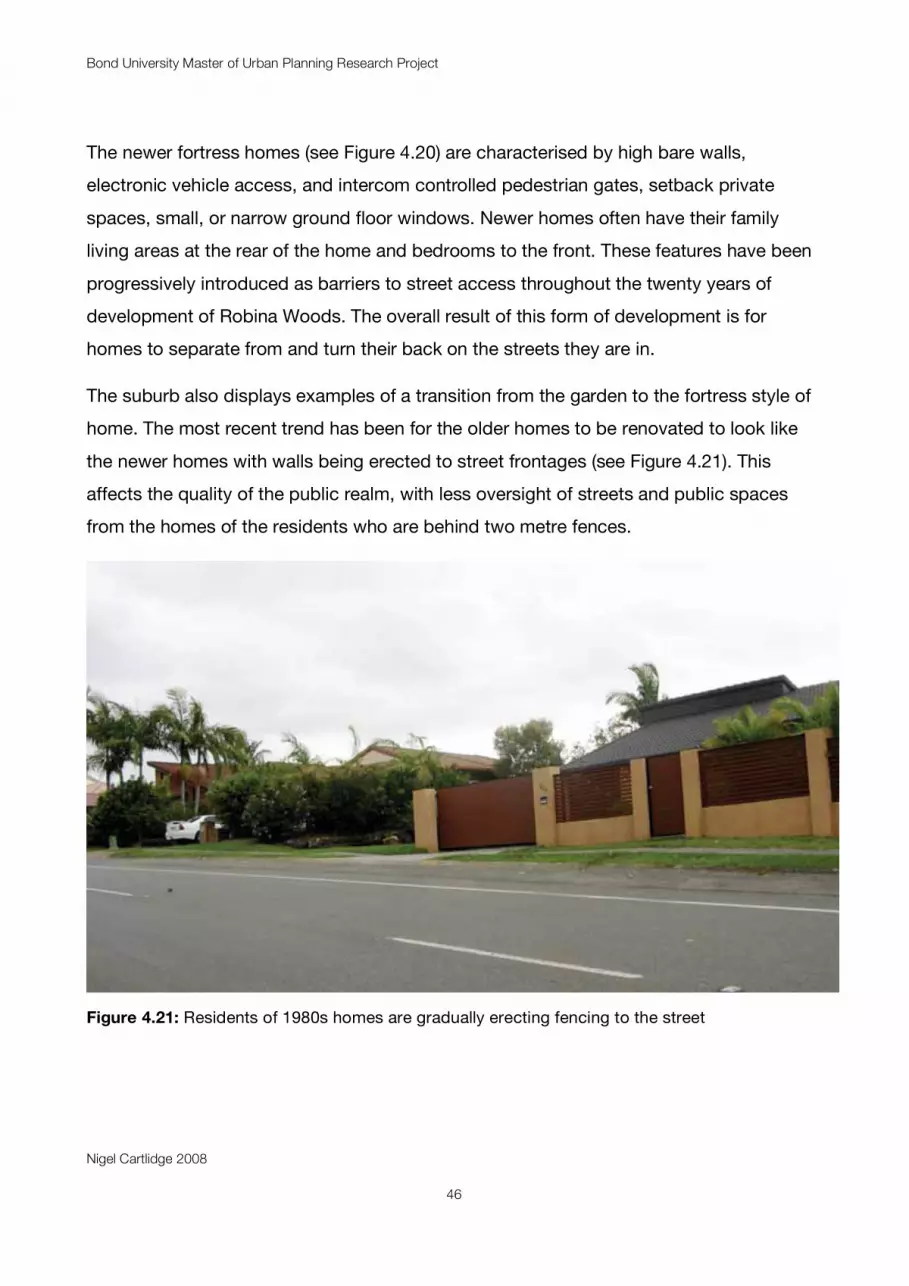
Bond University Master of Urban Planning Research Project
Nigel Cartlidge 2008
46
The newer fortress homes (see Figure 4.20) are characterised by high bare walls,
electronic vehicle access, and intercom controlled pedestrian gates, setback private
spaces, small, or narrow ground floor windows. Newer homes often have their family
living areas at the rear of the home and bedrooms to the front. These features have been
progressively introduced as barriers to street access throughout the twenty years of
development of Robina Woods. The overall result of this form of development is for
homes to separate from and turn their back on the streets they are in.
The suburb also displays examples of a transition from the garden to the fortress style of
home. The most recent trend has been for the older homes to be renovated to look like
the newer homes with walls being erected to street frontages (see Figure 4.21). This
affects the quality of the public realm, with less oversight of streets and public spaces
from the homes of the residents who are behind two metre fences.
Figure 4.21: Residents of 1980s homes are gradually erecting fencing to the street

Bond University Master of Urban Planning Research Project
The Robina Residential Archipelago Nigel Cartlidge 2008
47
4.8.3 Car primacy in street design
The dominance and extent of the car hierarchy in Robina Woods is described in the
following illustrations. The pedestrian and cyclist in Robina continually compete with the
car in a residential community. The design of the roads appears to invite cars to travel
faster than the speed limits set. The speed limits on the roads are 50 kilometres per hour
(kph) within the suburb, 60 kph on Cheltenham and Cottesloe Drives and 70 kph on
Robina Parkway. These speed limits often appear to be regularly ignored by cars and
other vehicles. Police radar traps are often seen on Cottesloe Drive and have been
observed to be very active.
Figure 4.22: The road entrance to The Gallery, Great Southern Drive Robina Woods
Many of the roads within Robina Woods appear to be unnecessarily wide for a residential
suburb. This can be seen in figure 4.22. This is the entry road to the Gallery development
with the main entry to Robina Woods Golf Course to the right being given its own lane
turn.

Bond University Master of Urban Planning Research Project
Nigel Cartlidge 2008
48
Considering the low level of traffic to this part of Robina Woods this would appear to be
excessive. In comparison, the arterial road roundabout intersection of Ron Penhaligon
Way, Cheltenham, and Cottesloe Drives seen in figure 4.23 would be at the same scale. It
appears that Great Southern Drive was designed as an entry statement rather than a
street.
Figure 4.23: The intersection of Ron Penhaligon Way, Cheltenham, and Cottesloe Drives
4.8.4 Pocket parks, fences, and paths in the public realm of Robina Woods
A noted feature of the urban design of Robina Woods is the pocket parks and paths.
These are cited as an example of the green credentials of sustainable design in Robina.
The current quote from the CBD Robina website is: Well planned streets and pedestrian
areas, a generous provision of parks, lakes, paths and sports fields, safety and security,
the promotion of high building standards (CBD Robina, 2008).
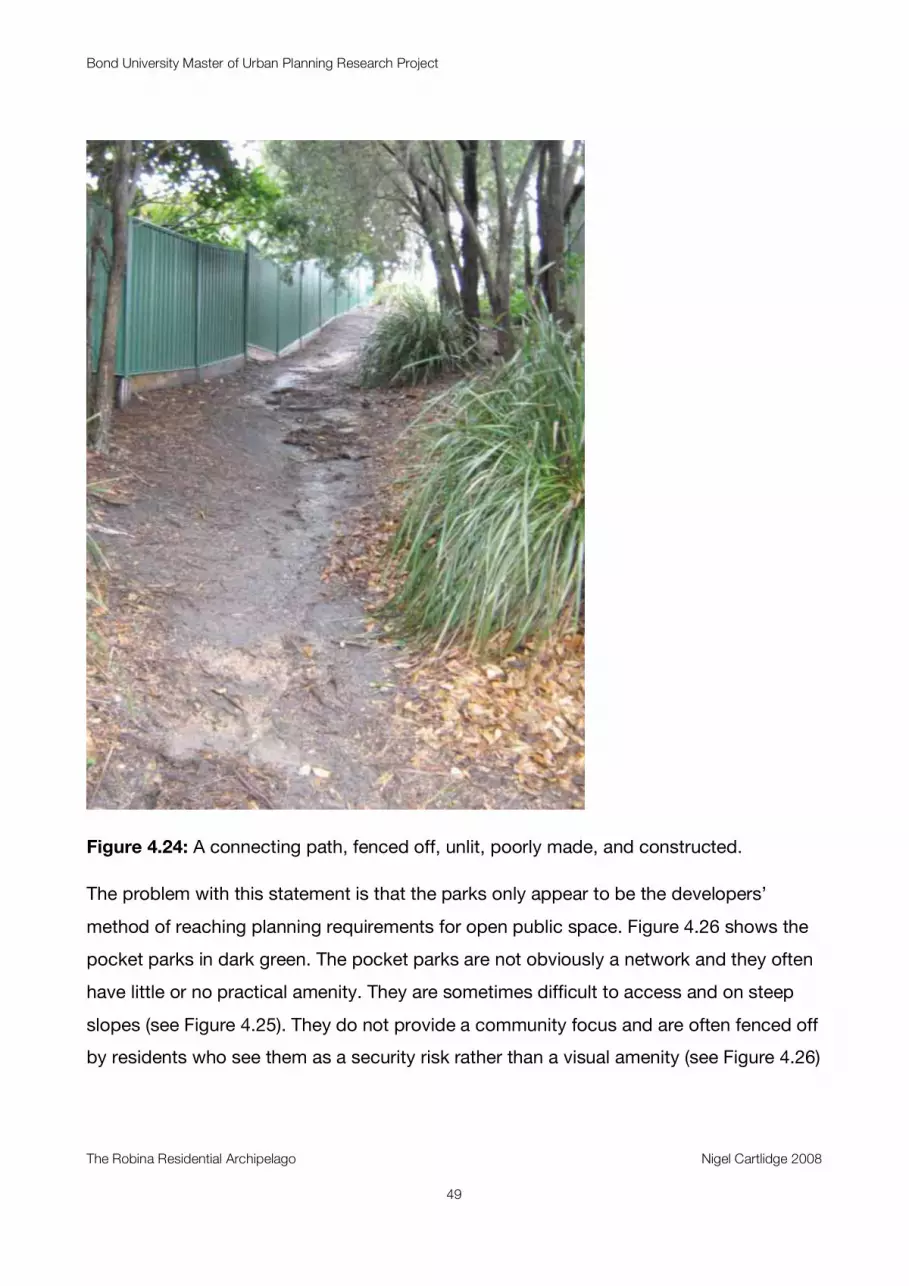
Bond University Master of Urban Planning Research Project
The Robina Residential Archipelago Nigel Cartlidge 2008
49
Figure 4.24: A connecting path, fenced off, unlit, poorly made, and constructed.
The problem with this statement is that the parks only appear to be the developers’
method of reaching planning requirements for open public space. Figure 4.26 shows the
pocket parks in dark green. The pocket parks are not obviously a network and they often
have little or no practical amenity. They are sometimes difficult to access and on steep
slopes (see Figure 4.25). They do not provide a community focus and are often fenced off
by residents who see them as a security risk rather than a visual amenity (see Figure 4.26)

Bond University Master of Urban Planning Research Project
Nigel Cartlidge 2008
50
Figure 4.25: Well planned streets and pedestrian areas?
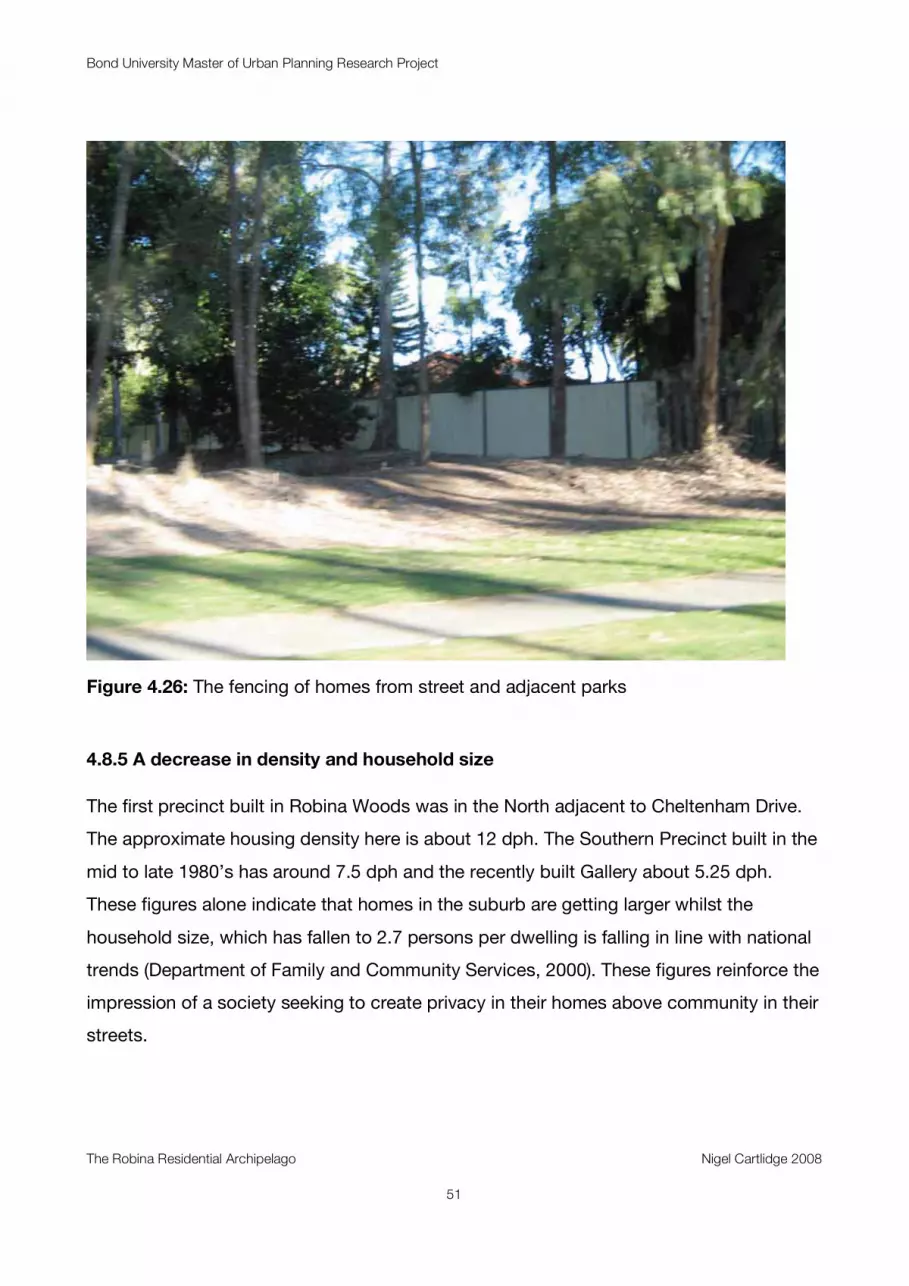
Bond University Master of Urban Planning Research Project
The Robina Residential Archipelago Nigel Cartlidge 2008
51
Figure 4.26: The fencing of homes from street and adjacent parks
4.8.5 A decrease in density and household size
The first precinct built in Robina Woods was in the North adjacent to Cheltenham Drive.
The approximate housing density here is about 12 dph. The Southern Precinct built in the
mid to late 1980’s has around 7.5 dph and the recently built Gallery about 5.25 dph.
These figures alone indicate that homes in the suburb are getting larger whilst the
household size, which has fallen to 2.7 persons per dwelling is falling in line with national
trends (Department of Family and Community Services, 2000). These figures reinforce the
impression of a society seeking to create privacy in their homes above community in their
streets.
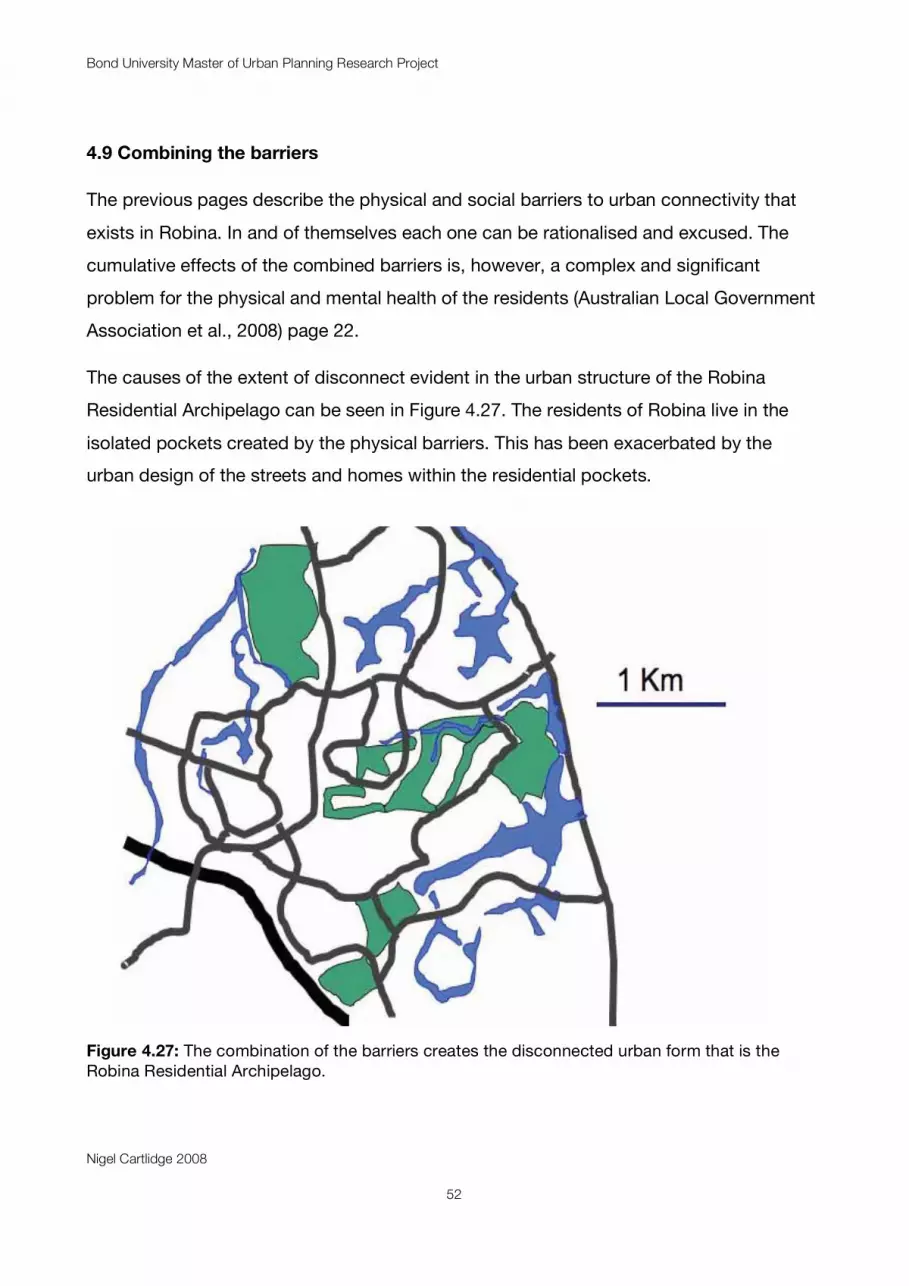
Bond University Master of Urban Planning Research Project
Nigel Cartlidge 2008
52
4.9 Combining the barriers
The previous pages describe the physical and social barriers to urban connectivity that
exists in Robina. In and of themselves each one can be rationalised and excused. The
cumulative effects of the combined barriers is, however, a complex and significant
problem for the physical and mental health of the residents (Australian Local Government
Association et al., 2008) page 22.
The causes of the extent of disconnect evident in the urban structure of the Robina
Residential Archipelago can be seen in Figure 4.27. The residents of Robina live in the
isolated pockets created by the physical barriers. This has been exacerbated by the
urban design of the streets and homes within the residential pockets.
Figure 4.27: The combination of the barriers creates the disconnected urban form that is the
Robina Residential Archipelago.
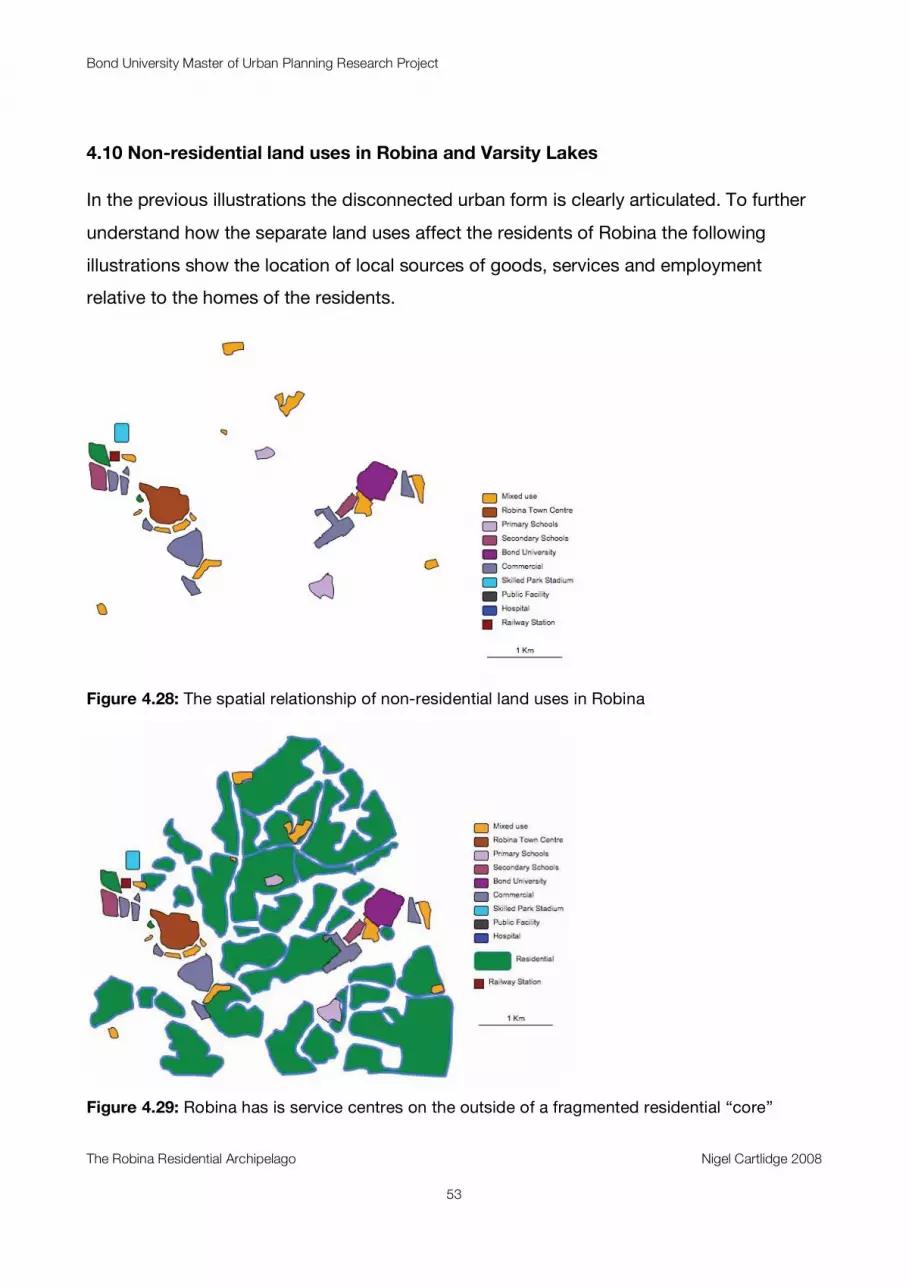
Bond University Master of Urban Planning Research Project
The Robina Residential Archipelago Nigel Cartlidge 2008
53
4.10 Non-residential land uses in Robina and Varsity Lakes
In the previous illustrations the disconnected urban form is clearly articulated. To further
understand how the separate land uses affect the residents of Robina the following
illustrations show the location of local sources of goods, services and employment
relative to the homes of the residents.
Figure 4.28: The spatial relationship of non-residential land uses in Robina
Figure 4.29: Robina has is service centres on the outside of a fragmented residential “core”
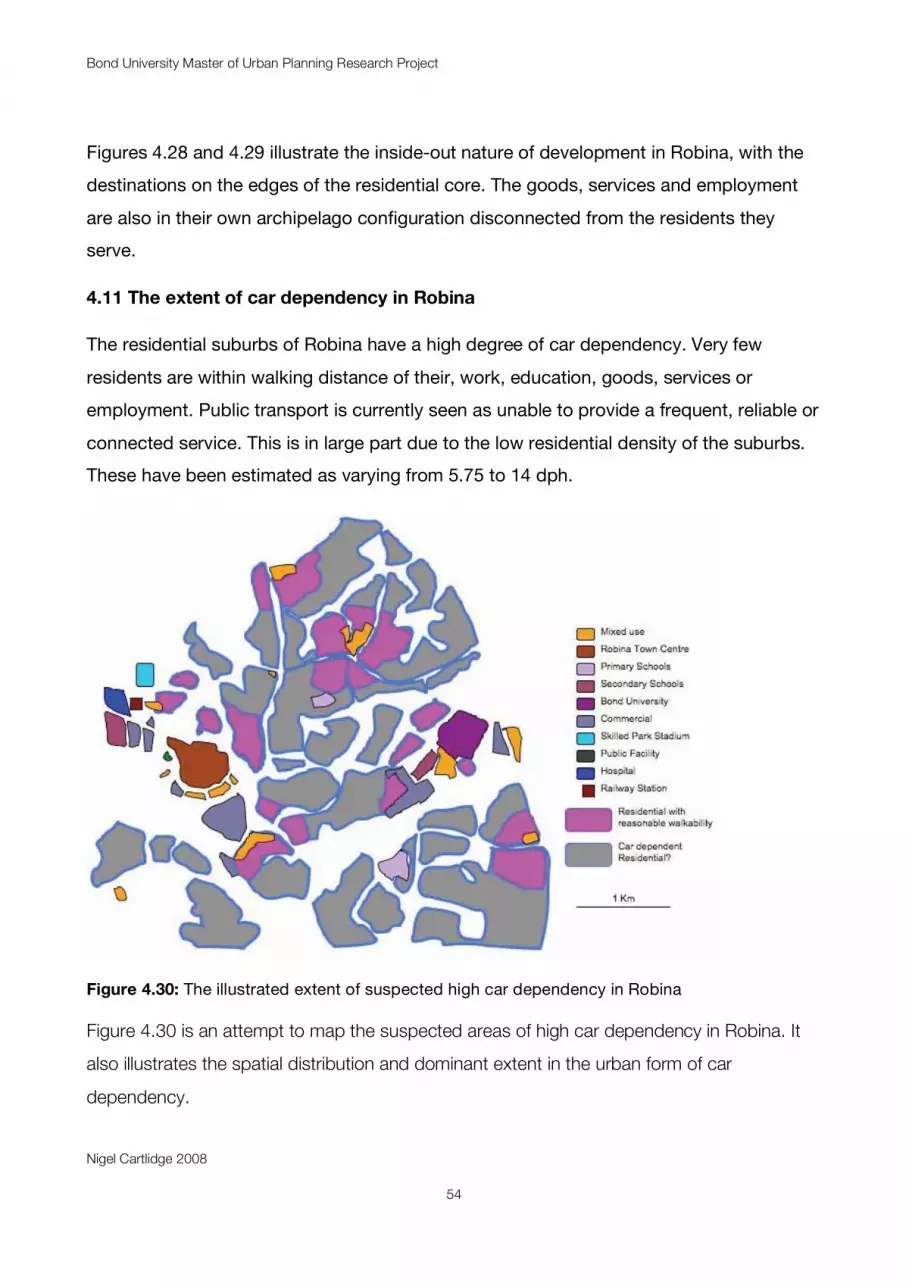
Bond University Master of Urban Planning Research Project
Nigel Cartlidge 2008
54
Figures 4.28 and 4.29 illustrate the inside-out nature of development in Robina, with the
destinations on the edges of the residential core. The goods, services and employment
are also in their own archipelago configuration disconnected from the residents they
serve.
4.11 The extent of car dependency in Robina
The residential suburbs of Robina have a high degree of car dependency. Very few
residents are within walking distance of their, work, education, goods, services or
employment. Public transport is currently seen as unable to provide a frequent, reliable or
connected service. This is in large part due to the low residential density of the suburbs.
These have been estimated as varying from 5.75 to 14 dph.
Figure 4.30: The illustrated extent of suspected high car dependency in Robina
Figure 4.30 is an attempt to map the suspected areas of high car dependency in Robina. It
also illustrates the spatial distribution and dominant extent in the urban form of car
dependency.

Bond University Master of Urban Planning Research Project
The Robina Residential Archipelago 55
5.0 Mapping the walkability of Robina Woods
Mapping was chosen as the primary method of measuring the walkability of the chosen study
area. The ped shed pattern maps presented in Section 6.0 illustrate the degree of walkability
found for residents in Robina Woods. They show the distances that were achievable in a five, ten
and twenty minute walk by a reasonably fit person. They disregard the actual terrain, traffic on the
arterial roads, condition or legibility of paths, and the sub tropical climate. They can only be
considered to be indicative of how far it is possible to walk in the time available.
The ped shed maps, Figures 6.1 – 6.10, are intended to examine how many destinations are pos-
sible from each selected residence and how the spatial layout of streets and paths affect resi-
dents’ ability to reach destinations. The colours chosen to represent the probable distance cov-
ered by a pedestrian on each of the pedestrian pattern maps is:
• Red lines represent 375M from the residence or 5 minutes travel time
• Orange lines represent 750M from the residence or 10 minutes travel time
• Yellow lines represent 1500M from the residence or 20 minutes travel time
5.1 Mapping the road connectivity of Robina Woods
The Road Deviation Index maps, Figures 6.11 – 6.20, are an analysis of the distance by road and in
a straight line from each of the selected destinations to each of the selected residences in the
Robina Woods study area. A calculation was made of the variation of travel distance in a straight
line and the actual traveling distance by subtracting the straight-line distance from the actual dis-
tance. This has been termed the ‘variance’. The variance can be used to estimate the costs of ex-
tra travel for residents caused by spatial layout of the urban form.
From these figures it is also possible to give an indication of the distortion caused by the spatial
layout and barriers of the urban form as a numerical percentage. Dividing the actual road distance
by the straight-line distance and multiplying by 100 creates an answer expressed as a percentage
of the straight-line distance. This percentage can be used as an index of the distortion caused by
the design of the road network. This distortion is called the Road Deviation Index in the text.

Bond University Master of Urban Planning Research Project
The Robina Residential Archipelago 56
5.2 The accuracy of the collected data
The data produced from the analysis is presented with known limitations. The base maps used
were scaled and checked against distances measured on Google Earth and the GCCC PDOnline
database of Gold Coast properties. However, the method used to calculate walk and road travel
distances was to use string to measure along the roads on the map. This is acknowledged to be
subject to inaccuracies but it is still seen as a useful method that produces a more accurate pic-
ture of the ped shed than drawing a circle on the map.
A difficulty in measuring the accuracy of travel distances and times was the actual pedestrian
ability to negotiate the measured distances in the time available. The roads in the case study area
especially Robina Parkway, Cheltenham and Cottesloe Drives can be very variable in the actual
time it takes to cross them, either at pedestrian crossings or otherwise. The time taken to cross
these roads depends on traffic conditions and traffic light timings.
Another factor affecting accuracy of the findings is that the slope and terrain could not be ac-
counted for. Slopes in Robina Woods can be steep and the pathways not well made or clearly
defined (see figures 4.24 and 4.25). However, the effect of possible inaccuracies of the maps is
seen as likely to be overestimating the distance that pedestrians can travel in the time available.
Considering these factors the findings are seen as understated and likely to be conservative.
5.3 The effect of Robina Parkway on local walkability
The walkability indicated on the pedestrian maps to the west of Robina Parkway is considered
possible but unlikely in its penetration of the local street pattern. Many residents would either not
know about, be able to navigate or use the routes that were mapped. This is especially true at
night as there is no lighting on the paths or at the crossing (see figures 4.10 and 4.11). The diffi-
culties that residents will encounter at the pedestrian crossing at Princeville Court on Robina
Parkway (see figures) of lighting, safety and pedestrian path usability are also described in Sec-
tion 4.0.
The crossing at the intersection of Robina Parkway and Cheltenham Drive (see figure 5.1) is sub-
ject to the traffic light sequence and has been observed to be the site of frequent vehicle colli-
sions. These appear to be due to poor visibility at the junction and the high approach speeds of
cars along Robina Parkway.

Bond University Master of Urban Planning Research Project
The Robina Residential Archipelago 57
Figure 5.1: Aerial view of Robina Parkway and Cheltenham Drive intersection
Image from Google Earth
5.4 The effect of Cheltenham and Cottesloe Drives on local walkability
The walkability north of Cheltenham Drive is subject to the pedestrians’ ability to actually cross
the road. Waiting times at the three pedestrian crossings along Cheltenham and Cottesloe Drives
affect the permeability of the road for pedestrians. The roundabout and median strips offer limited
accessibility for anyone who is slow to cross a road as the highway has four lanes; the traffic is
fast and frequent at most times of the day. There are only two pedestrian controlled crossings
along the 1020 metre length of Cheltenham and Cottesloe Drives where they border Robina
Woods.
The crossing point on the Cheltenham/Cottesloe Drive roundabout intersection with Ron Penhali-
gon Way (see figure 5.2) is difficult to cross safely as vehicles can enter and exit the roundabout
at some speed. The roundabout is over 60 metres across with two traffic lanes. It is difficult for
pedestrians to judge the presence, directional intent and speed of vehicles on each of the entries
to the roundabout.
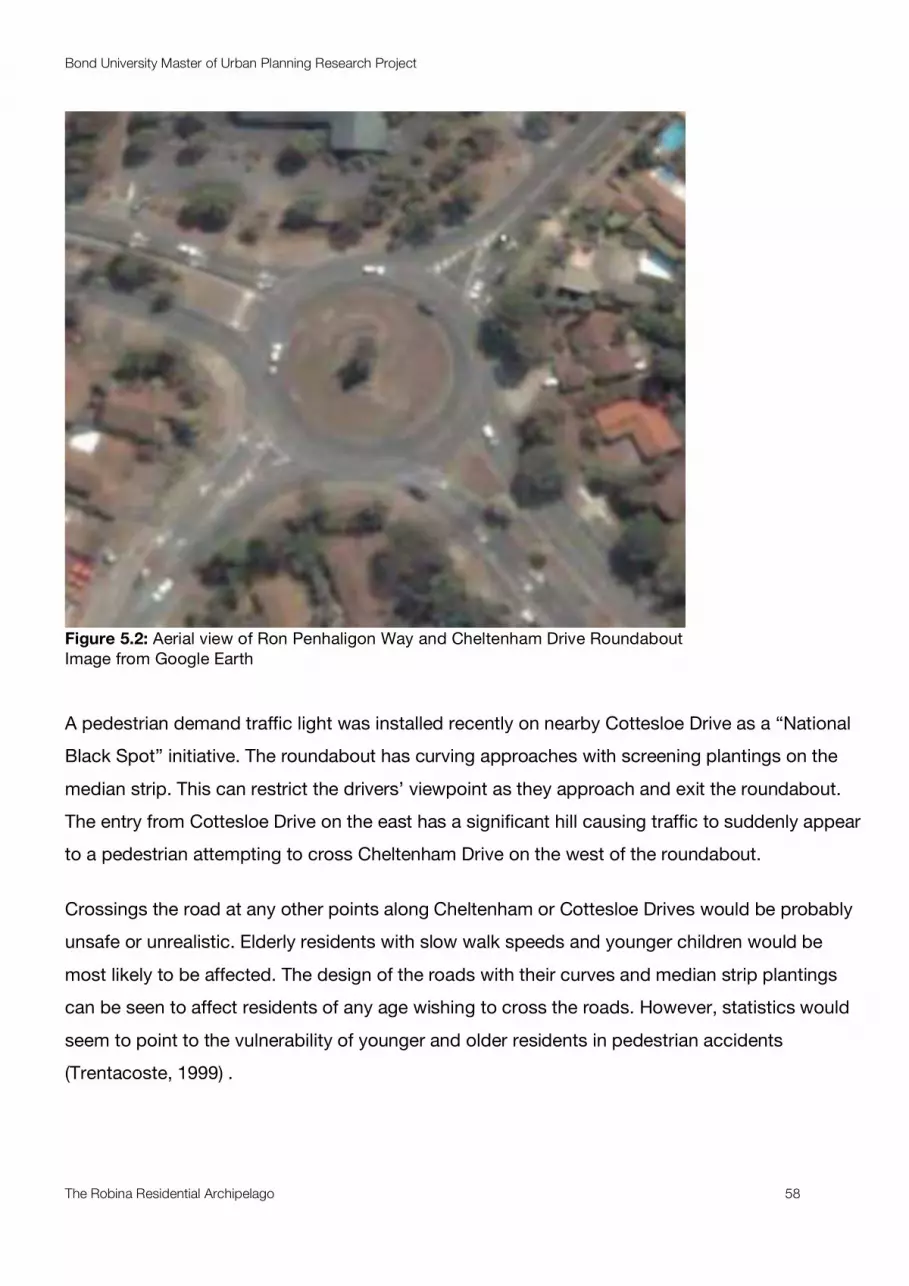
Bond University Master of Urban Planning Research Project
The Robina Residential Archipelago 58
Figure 5.2: Aerial view of Ron Penhaligon Way and Cheltenham Drive Roundabout
Image from Google Earth
A pedestrian demand traffic light was installed recently on nearby Cottesloe Drive as a “National
Black Spot” initiative. The roundabout has curving approaches with screening plantings on the
median strip. This can restrict the drivers’ viewpoint as they approach and exit the roundabout.
The entry from Cottesloe Drive on the east has a significant hill causing traffic to suddenly appear
to a pedestrian attempting to cross Cheltenham Drive on the west of the roundabout.
Crossings the road at any other points along Cheltenham or Cottesloe Drives would be probably
unsafe or unrealistic. Elderly residents with slow walk speeds and younger children would be
most likely to be affected. The design of the roads with their curves and median strip plantings
can be seen to affect residents of any age wishing to cross the roads. However, statistics would
seem to point to the vulnerability of younger and older residents in pedestrian accidents
(Trentacoste, 1999) .

Bond University Master of Urban Planning Research Project
The Robina Residential Archipelago 59
5.5 Analysis of the collected Data
An analysis of the tables presented in section six suggests that residents of Robina Woods are
affected in different ways by their geographical position within the suburb, their proximity to the
identified physical barriers and the spatial layout of the road network. When examining the maps
similarities were distinguished in groups of residences. It is recognised that the samples are
small and the way the data is presented was subsequently reorganized to reflect these findings.
5.6 Analysis of the ped shed maps
The analysis of the ped shed maps show that residences within Robina Woods can be grouped
according to similarities in the their shape and level of penetration of the local street structure evi-
dent in their ped shed maps.
These groups share the same constraints and impediments to walkability:
• The northern residences 1 and 2 are close to major crossroads and have a reasonably
deep penetration of the surrounding urban form.
• The western residences 3, 4 and 5 are constrained by Robina Parkway and the central
section of the Golf Course.
• The southern and eastern residences 6, 7, 8, 9 and 10 are mostly constrained by their re-
lationship to the golf course that encloses them in varying degrees.
The residents of Robina Woods can be seen to have very poor ability to reach destinations either
in or outside of their suburb. Table 5.1 shows only one residence at the northern entry to the sub-
urb can reach four destinations in a 10-minute walk and this is constrained by the ability to cross
the roundabout intersection of Ron Penhaligon Way and Cheltenham Drive (see figure 5.2). Six
residences can only reach 1 destination and one residence cannot reach any destinations in 10
minutes. In light of the fact that a 10-minute walk is a maximum walking range for many months in
the sub tropical climate, the results for walkability in Table 5.1 illustrate that the residents have
few options and few destinations either inside or just outside their neighbourhood to maintain
motivation to walk rather than use a car (US Transportation Research Board, 2005 cited in
(Australian Local Government Association et al., 2008)).
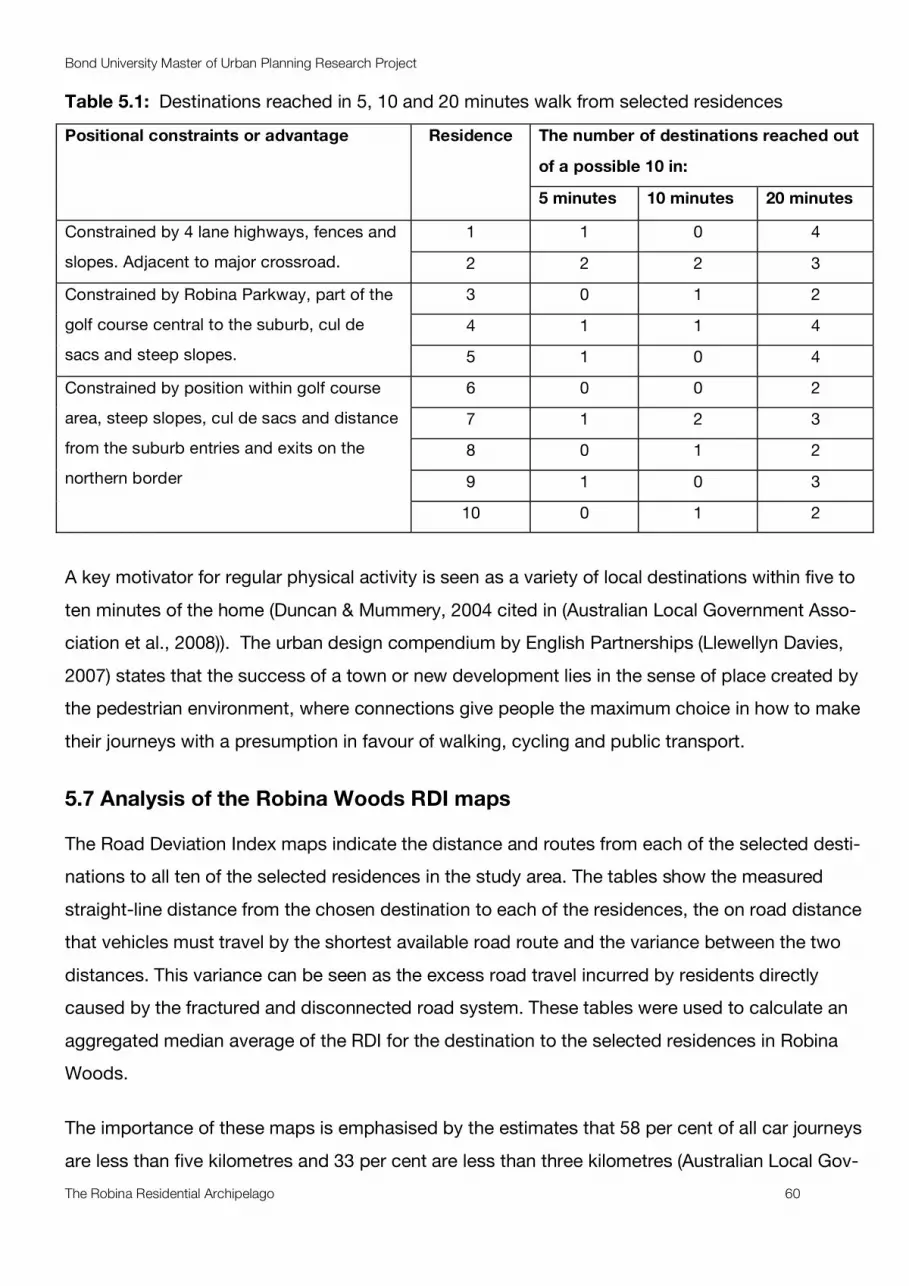
Bond University Master of Urban Planning Research Project
The Robina Residential Archipelago 60
Table 5.1: Destinations reached in 5, 10 and 20 minutes walk from selected residences
The number of destinations reached out
of a possible 10 in:
Positional constraints or advantage Residence
5 minutes 10 minutes 20 minutes
1 1 0 4 Constrained by 4 lane highways, fences and
slopes. Adjacent to major crossroad. 2 2 2 3
3 0 1 2
4 1 1 4
Constrained by Robina Parkway, part of the
golf course central to the suburb, cul de
sacs and steep slopes. 5 1 0 4
6 0 0 2
7 1 2 3
8 0 1 2
9 1 0 3
Constrained by position within golf course
area, steep slopes, cul de sacs and distance
from the suburb entries and exits on the
northern border
10 0 1 2
A key motivator for regular physical activity is seen as a variety of local destinations within five to
ten minutes of the home (Duncan & Mummery, 2004 cited in (Australian Local Government Asso-
ciation et al., 2008)). The urban design compendium by English Partnerships (Llewellyn Davies,
2007) states that the success of a town or new development lies in the sense of place created by
the pedestrian environment, where connections give people the maximum choice in how to make
their journeys with a presumption in favour of walking, cycling and public transport.
5.7 Analysis of the Robina Woods RDI maps
The Road Deviation Index maps indicate the distance and routes from each of the selected desti-
nations to all ten of the selected residences in the study area. The tables show the measured
straight-line distance from the chosen destination to each of the residences, the on road distance
that vehicles must travel by the shortest available road route and the variance between the two
distances. This variance can be seen as the excess road travel incurred by residents directly
caused by the fractured and disconnected road system. These tables were used to calculate an
aggregated median average of the RDI for the destination to the selected residences in Robina
Woods.
The importance of these maps is emphasised by the estimates that 58 per cent of all car journeys
are less than five kilometres and 33 per cent are less than three kilometres (Australian Local Gov-
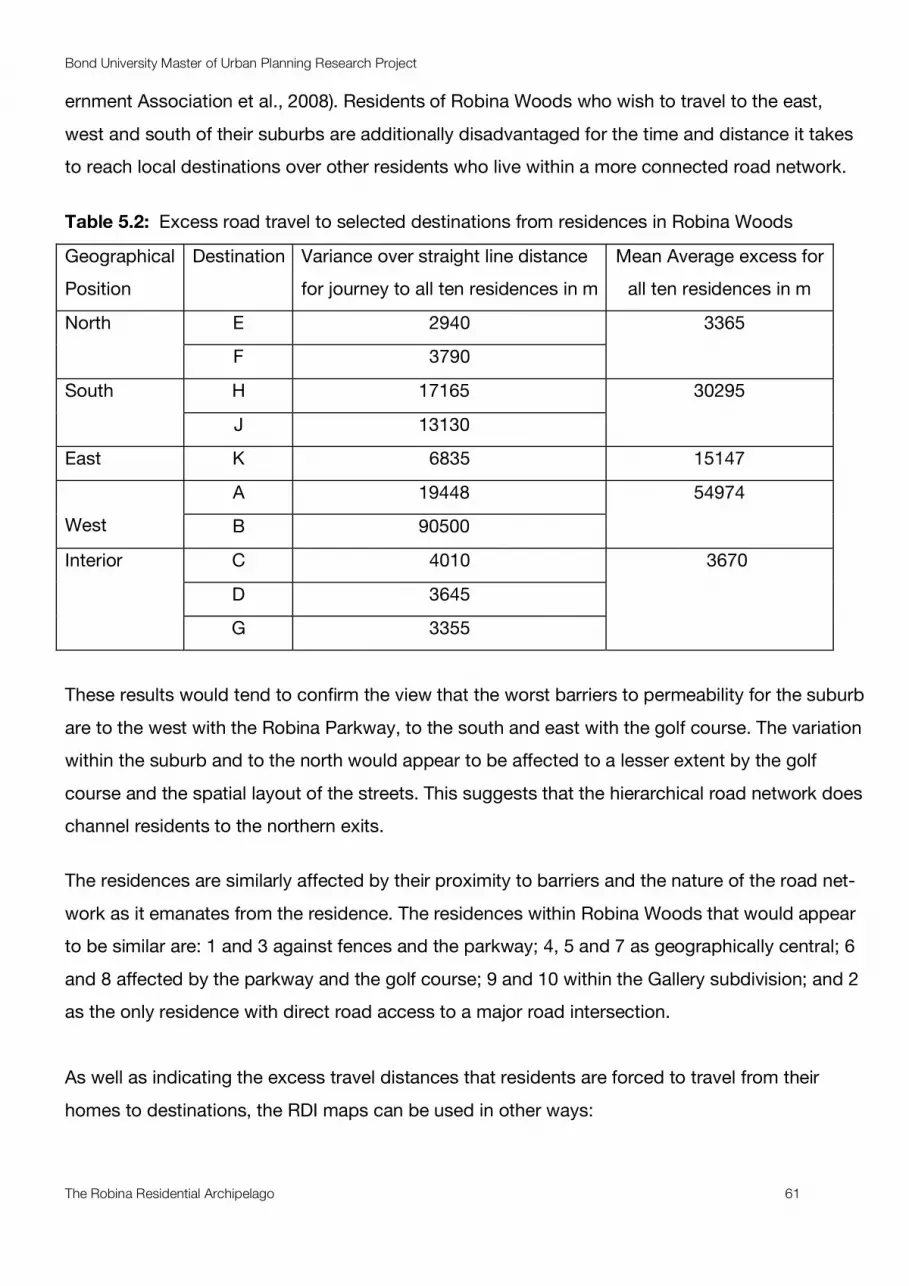
Bond University Master of Urban Planning Research Project
The Robina Residential Archipelago 61
ernment Association et al., 2008). Residents of Robina Woods who wish to travel to the east,
west and south of their suburbs are additionally disadvantaged for the time and distance it takes
to reach local destinations over other residents who live within a more connected road network.
Table 5.2: Excess road travel to selected destinations from residences in Robina Woods
Geographical
Position
Destination Variance over straight line distance
for journey to all ten residences in m
Mean Average excess for
all ten residences in m
E 2940 North
F 3790
3365
H 17165 South
J 13130
30295
East K 6835 15147
A 19448
West B 90500
54974
C 4010
D 3645
Interior
G 3355
3670
These results would tend to confirm the view that the worst barriers to permeability for the suburb
are to the west with the Robina Parkway, to the south and east with the golf course. The variation
within the suburb and to the north would appear to be affected to a lesser extent by the golf
course and the spatial layout of the streets. This suggests that the hierarchical road network does
channel residents to the northern exits.
The residences are similarly affected by their proximity to barriers and the nature of the road net-
work as it emanates from the residence. The residences within Robina Woods that would appear
to be similar are: 1 and 3 against fences and the parkway; 4, 5 and 7 as geographically central; 6
and 8 affected by the parkway and the golf course; 9 and 10 within the Gallery subdivision; and 2
as the only residence with direct road access to a major road intersection.
As well as indicating the excess travel distances that residents are forced to travel from their
homes to destinations, the RDI maps can be used in other ways:
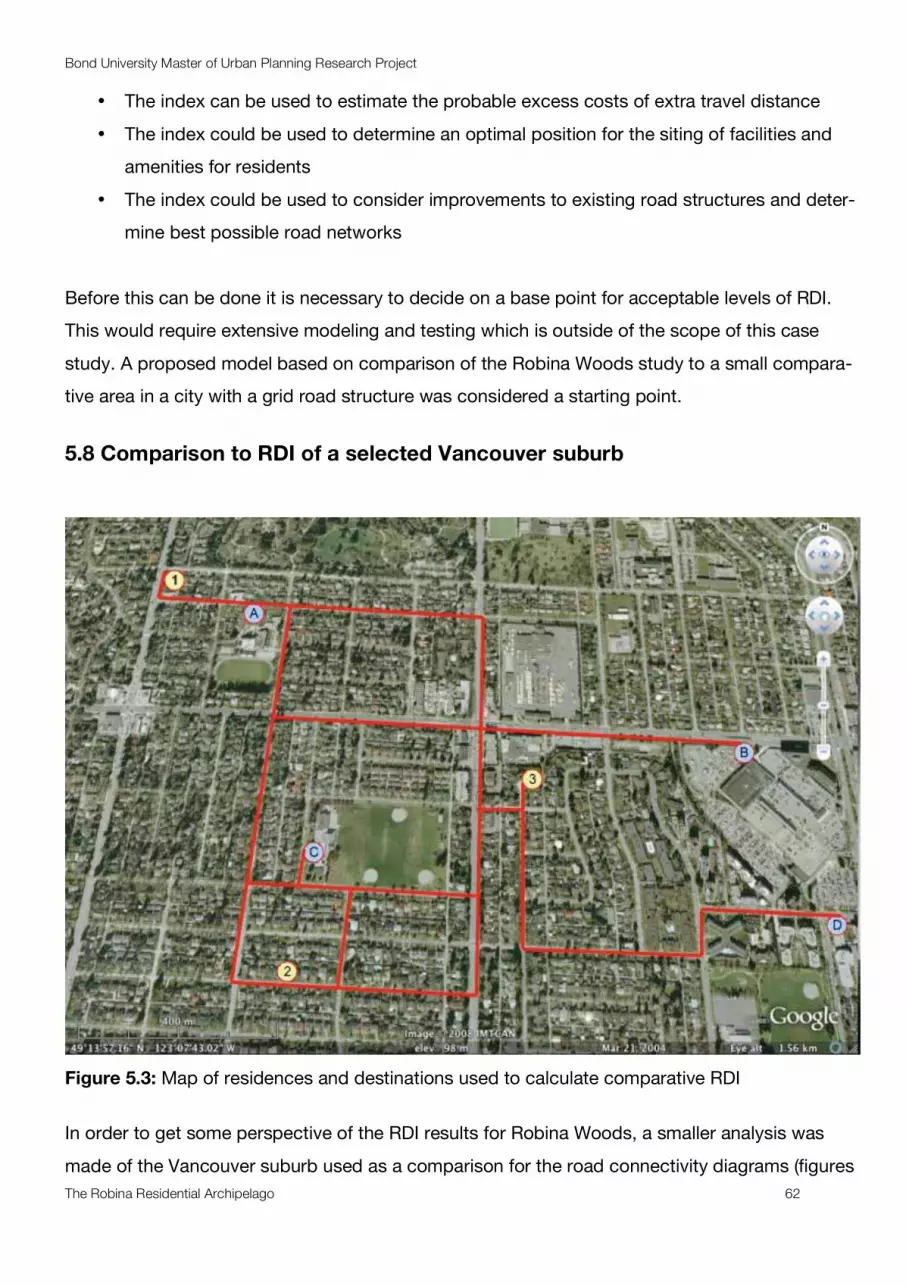
Bond University Master of Urban Planning Research Project
The Robina Residential Archipelago 62
• The index can be used to estimate the probable excess costs of extra travel distance
• The index could be used to determine an optimal position for the siting of facilities and
amenities for residents
• The index could be used to consider improvements to existing road structures and deter-
mine best possible road networks
Before this can be done it is necessary to decide on a base point for acceptable levels of RDI.
This would require extensive modeling and testing which is outside of the scope of this case
study. A proposed model based on comparison of the Robina Woods study to a small compara-
tive area in a city with a grid road structure was considered a starting point.
5.8 Comparison to RDI of a selected Vancouver suburb
Figure 5.3: Map of residences and destinations used to calculate comparative RDI
In order to get some perspective of the RDI results for Robina Woods, a smaller analysis was
made of the Vancouver suburb used as a comparison for the road connectivity diagrams (figures
Bond University Master of Urban Planning Research Project
The Robina Residential Archipelago 63
4.4 and 4.5). Three residences and four destinations were selected to give a comparative RDI for
Vancouver to use in examining the results obtained in Robina Woods. The residences were se-
lected to be as representative as possible for a small sample on the following criteria:
• Residence 1 is on an intersection and in the northwest of the study area
• Residence 2 is mid block on a large block pattern in the south of the study area
• Residence 2 is centrally situated and one of the few cul de sacs of the study area
The destinations were selected to be as representative and difficult to reach as was possible, to
be as useful for comparison to the Robina Woods sample. There were no destinations that could
be considered as isolated by major spatial barriers as in Robina Woods. The reasons for selecting
each destination were:
• Destination A is the high school and in a corner of the study area
• Destination B is an 8 block development at the edge of the study area
• Destination C has a large 3 block green space adjacent and is central to the study area
• Destination D was selected as it is adjacent to a large shopping centre which disrupts the
grid pattern on the edge of the study area
5.9 Analysis of the comparative RDI results
The results of the study in Vancouver give a remarkably low range of results with RDIs of 134.2 to
140.1(see table 5.3). Given that the grid structure is the recommended spatial model for mobility
networks for pedestrians and vehicles alike (Llewellyn Davies, 2007), the results from Vancouver
could be used as a base point in the calculation of the extra costs incurred by residents of Robina
Woods in time, vehicle running costs and excess fuel consumption.

Bond University Master of Urban Planning Research Project
The Robina Residential Archipelago 64
Table 5.3: Comparative RDI results for Vancouver suburb
Vehicle journey distances originating from destination A
Residence Straight line distance m Road route distance m Variation m
1 256 350 94
2 903 1110 207
3 836 1218 382
Totals 1995 2678 683
Mean Average RDI for destination A
134.2 Vehicle journey distances originating from destination B
1 1533 1873 340
2 1171 1643 472
3 530 1015 485
Totals 3234 4531 1297
Mean Average RDI for destination B
140.1 Vehicle journey distances originating from destination C
1 828 1123 295
2 301 526 225
3 523 630 107
Totals 1652 2279 627
Mean Average RDI for destination C
137.9 Vehicle journey distances originating from destination D
1 1806 2542 736
2 1170 1344 174
3 710 1129 419
Totals 3685 5015 1329
Mean Average RDI for destination D
136
5.10 A proposed model for using the RDI scores
The low variance in the range of results for the comparative RDIs in Vancouver suggest an opti-
mal baseline range of the RDI to be 130 for the street grid. There were, however, lower results in
the curvilinear road structure of Robina Woods. Based on both sets of results the author pro-
poses a six star scale (table 5.4). This could be used to assess the contribution road structures
can make to urban connectivity.

Bond University Master of Urban Planning Research Project
The Robina Residential Archipelago 65
Table 5.4: Proposed RDI star rating scale
RDI range RDI range RDI range RDI range RDI range RDI range
100 to 124 125 to 149 150 to 174 175 to 199 200 to 224 225 to 250
Five Star Four Star Three Star Two Star One Star No rating
The advantage of a star rating is that it is easily understood, and can be used to raise standards.
For instance, if suburbs were rated for their RDI, residents could use the index in determining
where to live. This in turn puts pressure on developers and providers of goods, services, ameni-
ties and employment to raise their level of commitment to connected places.
The rating descriptors of the individual star rating are:
• Five Star: excellent urban connectivity by the road system
• Four Star: very good urban connectivity by the road system
• Three Star: good urban connectivity by the road system
• Two Star: poor urban connectivity by the road system
• One Star: very poor urban connectivity by the road system
• No Rating: extremely poor urban connectivity by the road system
This rating system needs to be understood in terms of the road system only and could not be
taken as an indication of the urban quality of the streets nor the ease of access for cyclists and
pedestrians who need a safe and legible route as much as a direct route to destinations.
This star rating is only a preliminary suggestion and would need to be examined, critiqued and
tested against a range of scenarios to refine it. In applying it in its current form to the Robina
Woods study we get the following results (table 5.5).

Bond University Master of Urban Planning Research Project
The Robina Residential Archipelago 66
Table 5.5: Star ratings for destinations from Robina Woods
Geographical Position Destination Road Deviation Index RDI
result
Star Ratings
E 127.7 4 North
F 129.2 4
4
H 222.6 No rating South
J 178.8 2
1
East K 138.5 4 4
A 238.6 No rating
West B 204.5 1
1
C 172.6 3
D 152.2 3
Interior
G 143.7 4
3
The results in table 5.5 indicate that the scale may be too lenient and may also need to be a loga-
rithmic rather than an arithmetic scale. Even allowing for this, the scale in its current form gives
some interesting results that would probably be true even after refinement of the scale. The re-
sults indicate that:
• Destination H, Varsity College has an extremely poor result that needs to be rectified con-
sidering its importance to the Robina Woods community.
• Destination J, Market Square Varsity Lakes has a poor result that indicates that it is not re-
alising its market potential as a neighbourhood centre.
• The suburb of Varsity Lakes is extremely disconnected by road for pedestrians and cyclists
and very inefficiently connected to Robina Woods.
• Destination A, Robina Town Centre has an extremely poor result. This is very significant for
residents of Robina Woods as it is the primary, local destination. It cannot be practically
reached on foot; it is very difficult and unsafe for cyclists to get to. It is also an extremely
inefficient destination for motorists and probably causing a significant extra cost to any
residents who have cause to go there regularly.
• Destination B, Robina Parkway Medical Centre has a very poor result. This is very signifi-
cant as it can be assumed that the sick, disabled, young and the elderly who need to use it

Bond University Master of Urban Planning Research Project
The Robina Residential Archipelago 67
will find it difficult to access. It is further disadvantaged by its proximity to Robina Parkway
and can only practically be reached by vehicle.
• The town centre area west of Robina Woods has very poor urban road connectivity. This is
significant due to the very high level of importance this area has for residents. Major desti-
nations to the west include Robina State School, Robina Railway Station, Robina Hospital,
Skilled Park and the Pacific Highway. The inefficiency of this road connection is likely to be
currently causing very high, ongoing externalized costs to residents.
• Destination C, Robina State School has a good urban connectivity rating, however it is
lower than could be expected considering its geographical position near the centre of the
suburb. This is almost certainly limited by the proximity and spatial shape of the golf
course. This is also probably true of destinations D and G.
• Destinations E and F, have very good results that are better than the Vancouver compari-
son. This is thought to be a function of the curvilinear tree structure of the cul de sacs and
crescents that direct and channel traffic to the entry and exit points. Both destinations
benefit from their proximity to the Ron Penhaligon Way exit from the suburb. This is a logi-
cal result as curves can be closer to straight-line connections than rectangular grids. Des-
tination K also seems to bear this observation out.
• The results for the northern and eastern destinations is significant in suggesting that devel-
opment of facilities and amenities close to the exits of the suburbs may be beneficial to
residents of Robina Woods, Robina Quays and Robina Waters. They also invite further in-
vestigation of the concept of curvilinear grid road structures.
5.11 Impacts of the inefficient road design for Robina Woods residents.
The results from the initial survey of Robina Woods indicated that residents are traveling further
and as a result paying more to run and fuel their cars than if they lived in a more connected place.
The distances that residents have to travel to reach the goods, services and employment destina-
tions from their homes were calculated to give an estimate of the impact on household budgets
These calculations on table 5.6 can be used to calculate the current externalized costs borne by
residents of Robina Woods as a direct result of living in a disconnected urban form. They are
based on total running costs per km and litres per 100 km. These were sourced from Royal
Automobile Club of Queensland magazine “the Road Ahead” October 2008 edition (Green, 2008).
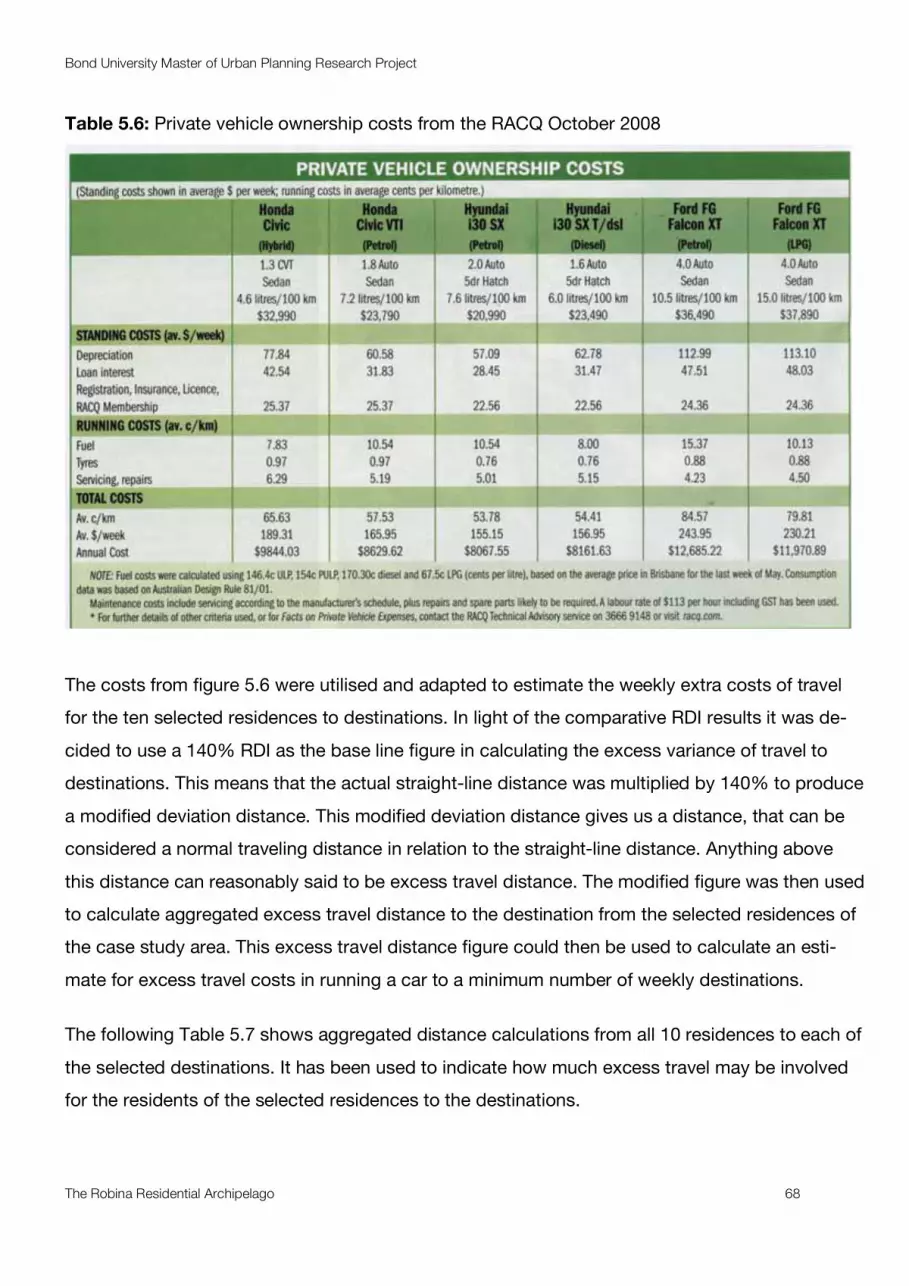
Bond University Master of Urban Planning Research Project
The Robina Residential Archipelago 68
Table 5.6: Private vehicle ownership costs from the RACQ October 2008
The costs from figure 5.6 were utilised and adapted to estimate the weekly extra costs of travel
for the ten selected residences to destinations. In light of the comparative RDI results it was de-
cided to use a 140% RDI as the base line figure in calculating the excess variance of travel to
destinations. This means that the actual straight-line distance was multiplied by 140% to produce
a modified deviation distance. This modified deviation distance gives us a distance, that can be
considered a normal traveling distance in relation to the straight-line distance. Anything above
this distance can reasonably said to be excess travel distance. The modified figure was then used
to calculate aggregated excess travel distance to the destination from the selected residences of
the case study area. This excess travel distance figure could then be used to calculate an esti-
mate for excess travel costs in running a car to a minimum number of weekly destinations.
The following Table 5.7 shows aggregated distance calculations from all 10 residences to each of
the selected destinations. It has been used to indicate how much excess travel may be involved
for the residents of the selected residences to the destinations.

Bond University Master of Urban Planning Research Project
The Robina Residential Archipelago 69
Table 5.7: Excess travel estimates per single journey
Destination Aggregate straight
line distance m
Modified devia-
tion distance m
Actual road route
distance m
Excess travel
distance m
A 14032 19645 33480 13835
B 8660 12124 17700 5576
C 5520 7728 9530 1802
D 6985 9779 10630 851
E 10610 14854 13550 -1304
F 12980 18172 16770 -1402
G 7665 10731 11020 289
H 13995 19593 30890 11297
J 16660 23324 29790 6466
K 15950 22330 22090 -240
It is reasonable to believe that residents would not travel to each destination equally. To be able
to calculate an estimated journey week for an individual resident and to calculate an indicative
extra travel cost to the resident, the proposal is that, in the course of a week, they are likely to
make:
• 5 round trips to destination A, Robina Town Centre making 10 journeys
• 1 round trip to destination B, Parkway medical centre making 2 journeys
• 5 round trips to destination C, Robina State School making 10 Journeys
• 1 round trip to either destination D or G making 2 journeys
• 7 round trips to either destination E or F making 14 journeys
• 5 round trips to either destination H or J making 10 journeys
• 1 round trip to destination K making 2 journeys
This then has to be divided by 10 to average out the results from 10 residences. Using this
method the excess travel distance per resident was calculated as 23.8 km per week. It is ac-
cepted that for some people it would be more or less depending on their travel needs. This extra
23.8 km per week results in the following costs per resident per week if the RACQ costs in table
5.6 figures are applied:
Bond University Master of Urban Planning Research Project
The Robina Residential Archipelago 70
• In a Hyundai i30 SX T $12.95
• In a Honda Civic Hybrid $15.62
• In a Ford FG Falcon XT $20.13
They will also consume extra fuel resulting in the release of increased carbon emissions based on
2.3 kg CO2 emissions per litre of petrol (timeforchange.org, 2008).
• In a Hyundai i30 SX T 1.09 litres and 2.52 kgs of CO2 emissions
• In a Honda Civic Hybrid 1.42 litres and 3.28 kgs of CO2 emissions
• In a Ford FG Falcon XT 2.5 litres and 5.75 kgs of CO2 emissions
If only half the estimated 3200 residents of the suburb drive this much excess distance, the sig-
nificance of these calculations becomes apparent. In this conservative scenario the residents of
the suburb of Robina Woods will use an extra 2672 litres of fuel and produce an extra 6146 kgs of
CO2 emissions per week in comparison to similar residents who live in a suburb with a grid struc-
ture road system.
N.B.
The ped shed and RDI maps are presented in the following section in landscape format. Whilst it
is recognised that this is not an ideal format, difficulties with the software precluded the images
with text being placed in a portrait format and the enhanced ability to read through the set of
maps when presented in a landscape format was thought to be the best compromise.

Bon
d U
nive
rsity
Mas
ter
of U
rban
Pla
nnin
g R
esea
rch
Pro
ject
The
Rob
ina
Res
iden
tial A
rchi
pel
ago
71
6.0
The
ped
sh
ed M
aps
Th
e r
esearc
h m
ap
s a
re p
resente
d t
og
eth
er
in t
his
sectio
n.
F
igu
re 6
.1: T
he p
ed
sh
ed
patt
ern
fro
m r
esid
en
ce 1
Resid
en
ce 1
was s
ele
cte
d,
as it
is c
losest
to
the P
ark
way M
ed
ical C
en
tre It
is a
lso
in
th
e
extr
em
e n
ort
hw
est
of
the s
tud
y a
rea a
nd
ad
ja-
cen
t to
a m
ajo
r ro
ad
inte
rsectio
n.
Resid
en
ce 1
ben
efits
fro
m its
po
sitio
n c
lose t
o t
he inte
rsec-
tio
n t
o r
each a
go
od
pen
etr
atio
n o
f th
e lo
cal
urb
an
str
eet
str
uctu
re.
Th
e r
esid
en
ce d
oes n
ot
fro
nt
on
to e
ith
er
road
an
d is s
ep
ara
ted
fro
m t
he r
oad
s b
y h
igh
fen
ces.
Th
e im
med
iate
terr
ain
aro
und
resi-
den
ce 1
has s
teep
slo
pes;
perm
eab
ility
be-
yo
nd
the R
ob
ina P
ark
way/C
helten
ham
Dri
ve
inte
rsectio
n is s
ub
ject
to t
raff
ic c
on
ditio
ns a
nd
the t
imin
g o
f th
e t
raff
ic lig
hts
. T
he m
ap
pin
g
an
aly
sis
in
dic
ate
s:
A p
ed
estr
ian
can
reach
on
e d
estin
atio
n w
ith
in
5 m
inu
tes. T
hey d
o n
ot
reach
an
y f
urt
her
des-
tin
atio
ns w
ith
in 1
0 m
inu
tes.
Th
ey c
an
reach
a
furt
her
fou
r d
estin
atio
ns w
ith
in 2
0 m
inu
tes.
A
ped
estr
ian
can
no
t re
ach
th
e f
ive r
em
ain
ing
destin
atio
ns w
ith
in 2
0 m
inu
tes.
1
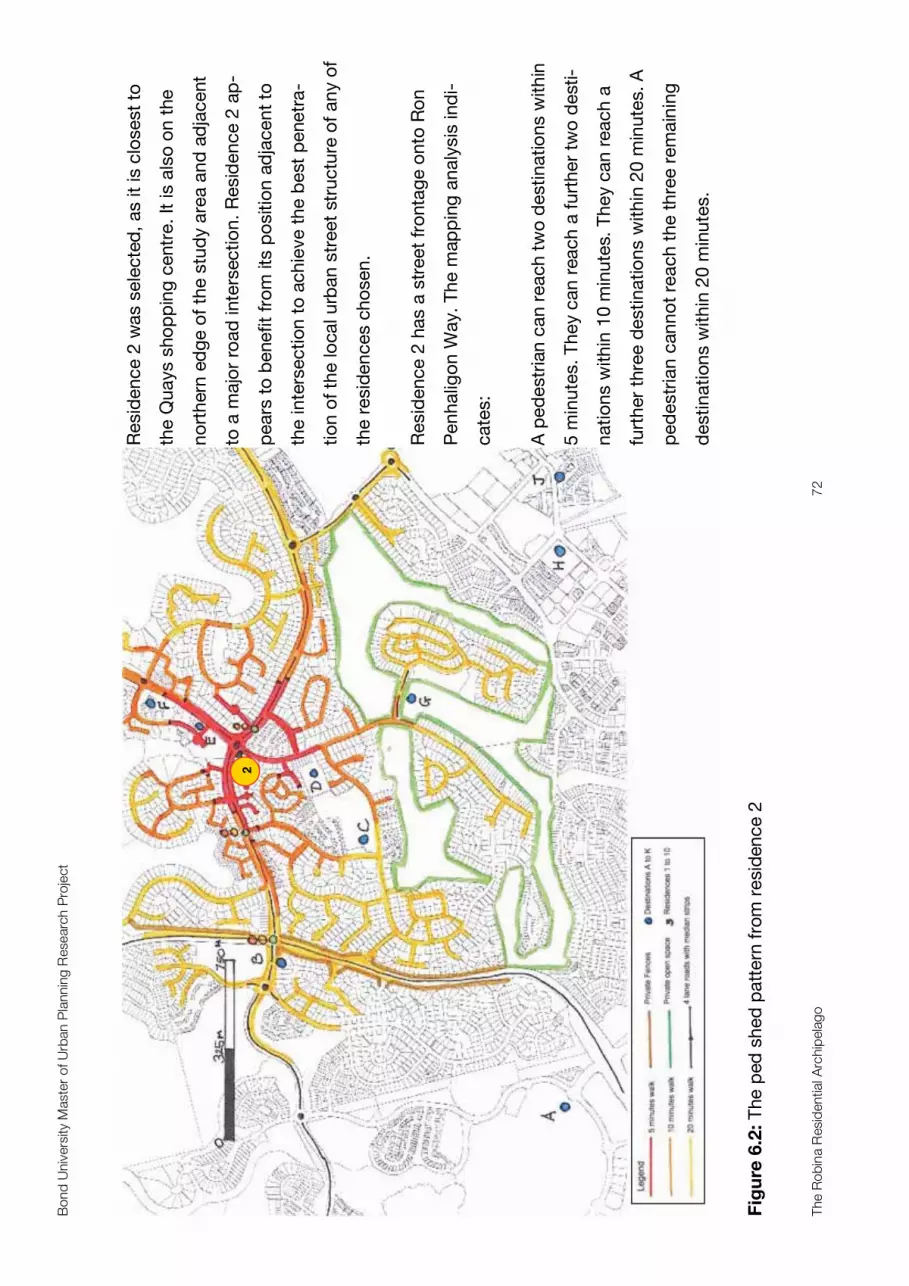
Bon
d U
nive
rsity
Mas
ter
of U
rban
Pla
nnin
g R
esea
rch
Pro
ject
The
Rob
ina
Res
iden
tial A
rchi
pel
ago
72
Fig
ure
6.2
: The p
ed
sh
ed
patt
ern
fro
m r
esid
en
ce 2
Resid
en
ce 2
was s
ele
cte
d,
as it
is c
losest
to
the Q
uays s
ho
pp
ing
centr
e.
It is a
lso
on
the
no
rth
ern
ed
ge o
f th
e s
tud
y a
rea a
nd
ad
jacent
to a
majo
r ro
ad
inte
rsectio
n.
Resid
en
ce 2
ap
-
pears
to
benefit
fro
m its
po
sitio
n a
dja
cen
t to
the in
ters
ectio
n t
o a
ch
ieve t
he b
est
penetr
a-
tio
n o
f th
e lo
cal u
rban
str
eet
str
uctu
re o
f an
y o
f
the r
esid
en
ces c
ho
sen
.
Resid
en
ce 2
has a
str
eet
fro
nta
ge o
nto
Ro
n
Pen
halig
on
Way.
Th
e m
ap
pin
g a
naly
sis
ind
i-
cate
s:
A p
ed
estr
ian
can
reach
tw
o d
estin
atio
ns w
ith
in
5 m
inu
tes. T
hey c
an
reach
a f
urt
her
two
desti-
natio
ns w
ith
in 1
0 m
inu
tes.
Th
ey c
an
reach
a
furt
her
thre
e d
estin
atio
ns w
ith
in 2
0 m
inu
tes. A
ped
estr
ian
can
no
t re
ach
th
e t
hre
e r
em
ain
ing
destin
atio
ns w
ith
in 2
0 m
inu
tes.
2
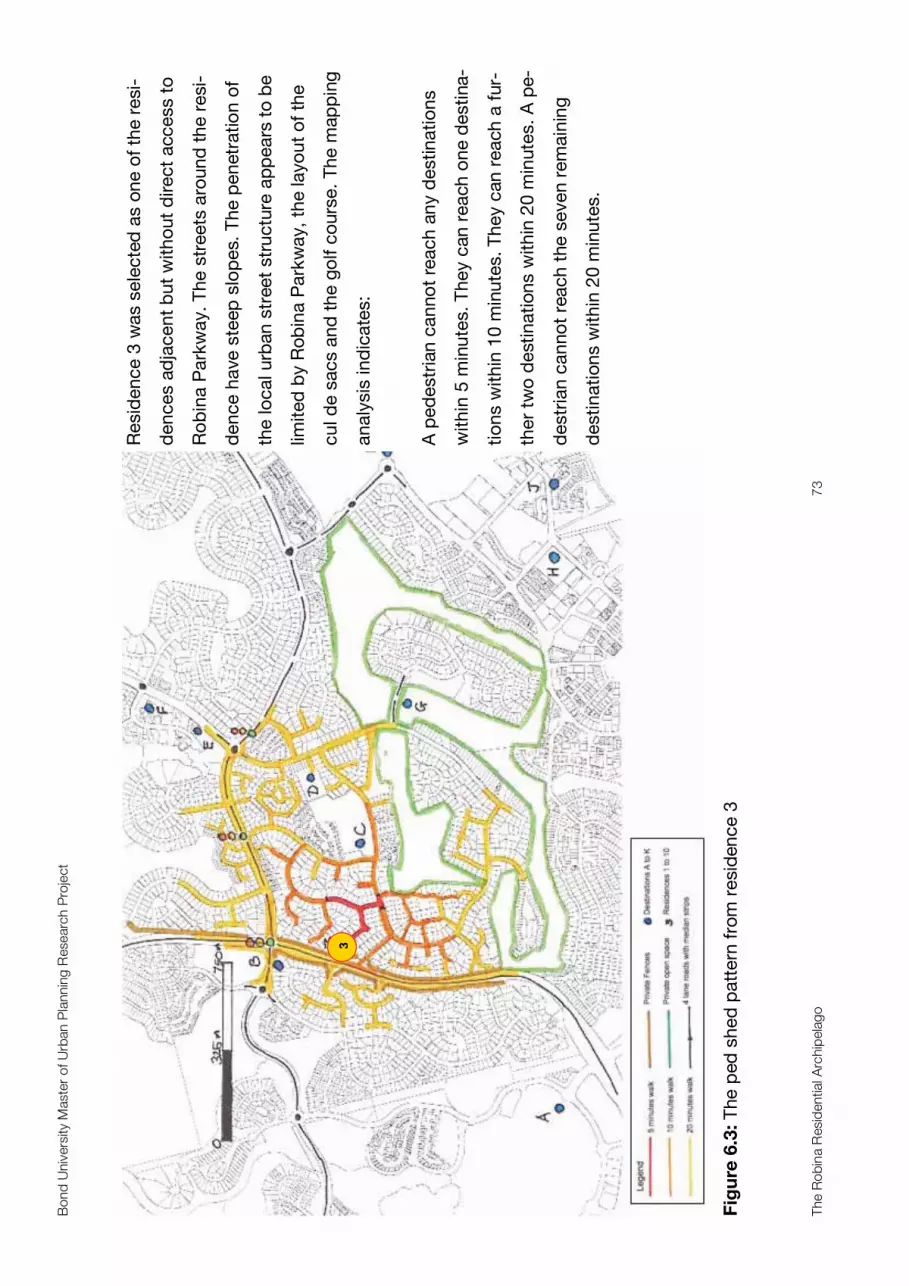
Bon
d U
nive
rsity
Mas
ter
of U
rban
Pla
nnin
g R
esea
rch
Pro
ject
The
Rob
ina
Res
iden
tial A
rchi
pel
ago
73
Fig
ure
6.3
: The p
ed
sh
ed
patt
ern
fro
m r
esid
en
ce 3
Resid
en
ce 3
was s
ele
cte
d a
s o
ne o
f th
e r
esi-
den
ces a
dja
cen
t b
ut
with
out
direct
access t
o
Ro
bin
a P
ark
way. T
he s
treets
aro
un
d t
he r
esi-
den
ce h
ave s
teep
slo
pes.
Th
e p
en
etr
atio
n o
f
the lo
cal urb
an
str
eet
str
uctu
re a
pp
ears
to
be
limited
by R
ob
ina P
ark
way,
the layo
ut
of
the
cu
l d
e s
acs a
nd
th
e g
olf c
ours
e.
Th
e m
ap
pin
g
an
aly
sis
in
dic
ate
s:
A p
ed
estr
ian
can
no
t re
ach
an
y d
estin
atio
ns
with
in 5
min
ute
s. T
hey c
an
reach
on
e d
estina-
tio
ns w
ith
in 1
0 m
inu
tes. T
hey c
an
reach
a f
ur-
ther
two
destin
atio
ns w
ith
in 2
0 m
inute
s.
A p
e-
destr
ian
can
no
t re
ach
the s
even
rem
ain
ing
destin
atio
ns w
ith
in 2
0 m
inu
tes.
3
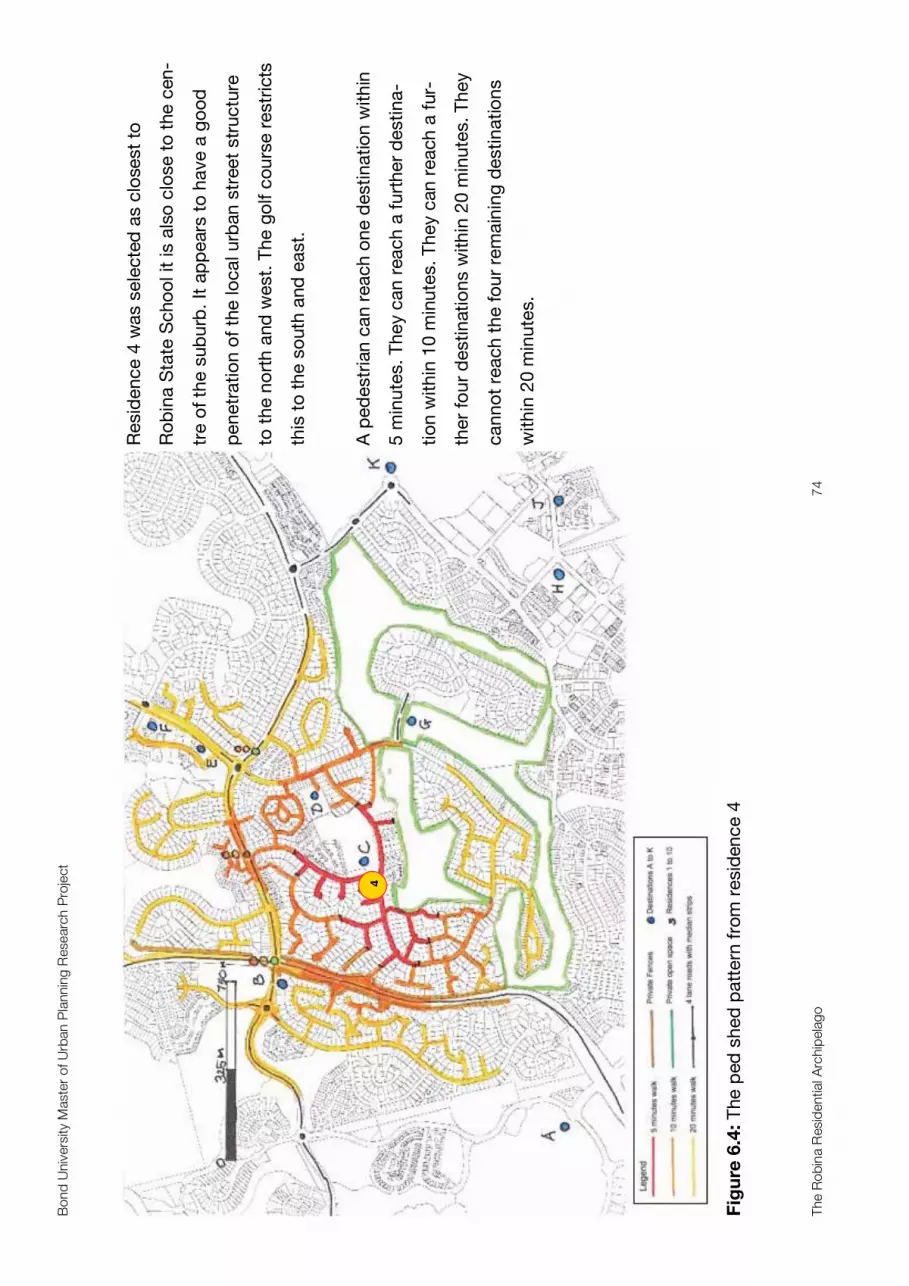
Bon
d U
nive
rsity
Mas
ter
of U
rban
Pla
nnin
g R
esea
rch
Pro
ject
The
Rob
ina
Res
iden
tial A
rchi
pel
ago
74
Fig
ure
6.4
: The p
ed
sh
ed
patt
ern
fro
m r
esid
en
ce 4
Resid
en
ce 4
was s
ele
cte
d a
s c
losest
to
Ro
bin
a S
tate
Scho
ol it is a
lso
clo
se t
o t
he c
en
-
tre o
f th
e s
ub
urb
. It
ap
pears
to
have a
go
od
pen
etr
atio
n o
f th
e lo
cal urb
an
str
eet
str
uctu
re
to t
he n
ort
h a
nd
west.
Th
e g
olf c
ou
rse r
estr
icts
this
to
th
e s
outh
and
east.
A p
ed
estr
ian
can
reach
on
e d
estin
atio
n w
ith
in
5 m
inu
tes. T
hey c
an
reach
a f
urt
her
destin
a-
tio
n w
ith
in 1
0 m
inu
tes. T
hey c
an
reach
a f
ur-
ther
fou
r d
estin
atio
ns w
ith
in 2
0 m
inu
tes. T
hey
can
no
t re
ach t
he f
ou
r re
main
ing
destin
atio
ns
with
in 2
0 m
inu
tes.
4
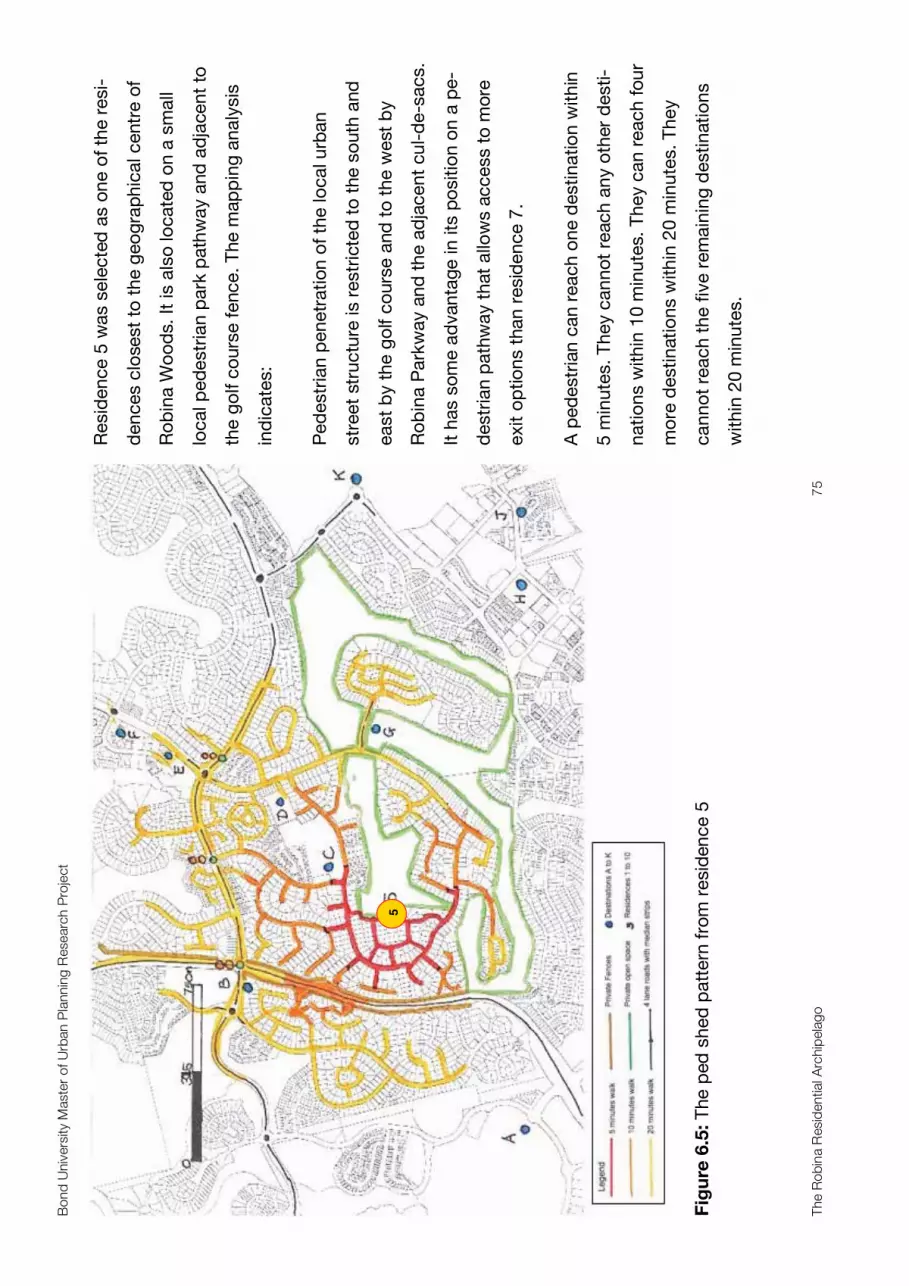
Bon
d U
nive
rsity
Mas
ter
of U
rban
Pla
nnin
g R
esea
rch
Pro
ject
The
Rob
ina
Res
iden
tial A
rchi
pel
ago
75
F
igu
re 6
.5: T
he p
ed
sh
ed
patt
ern
fro
m r
esid
en
ce 5
Resid
en
ce 5
was s
ele
cte
d a
s o
ne o
f th
e r
esi-
den
ces c
losest
to t
he g
eo
gra
ph
ical centr
e o
f
Ro
bin
a W
oo
ds.
It is a
lso
lo
cate
d o
n a
sm
all
local p
ed
estr
ian p
ark
path
way a
nd
ad
jacen
t to
the g
olf c
ours
e f
ence.
The m
ap
pin
g a
naly
sis
ind
icate
s:
Ped
estr
ian
pen
etr
atio
n o
f th
e lo
cal u
rban
str
eet
str
uctu
re is r
estr
icte
d t
o t
he s
outh
and
east
by t
he g
olf c
ours
e a
nd
to
th
e w
est
by
Ro
bin
a P
ark
way a
nd
th
e a
dja
cen
t cu
l-d
e-s
acs.
It h
as s
om
e a
dvan
tag
e in
its
po
sitio
n o
n a
pe-
destr
ian
path
way t
hat
allo
ws a
ccess t
o m
ore
exit o
ptio
ns t
han
resid
en
ce 7
.
A p
ed
estr
ian
can
reach
on
e d
estin
atio
n w
ith
in
5 m
inu
tes. T
hey c
an
no
t re
ach
an
y o
ther
desti-
natio
ns w
ith
in 1
0 m
inu
tes.
Th
ey c
an
reach
fo
ur
mo
re d
estin
atio
ns w
ith
in 2
0 m
inu
tes. T
hey
can
no
t re
ach t
he f
ive r
em
ain
ing
destin
atio
ns
with
in 2
0 m
inu
tes.
5
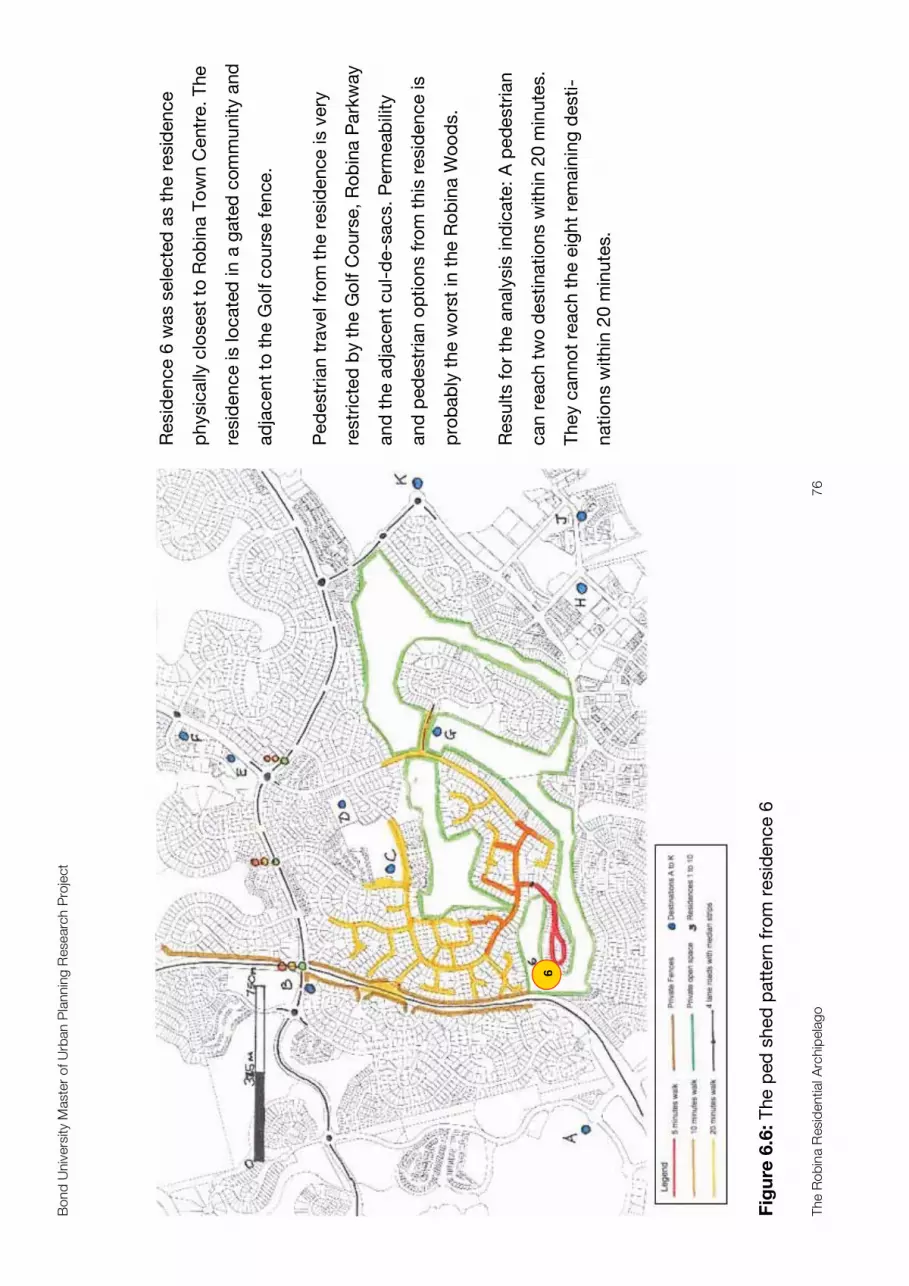
Bon
d U
nive
rsity
Mas
ter
of U
rban
Pla
nnin
g R
esea
rch
Pro
ject
The
Rob
ina
Res
iden
tial A
rchi
pel
ago
76
F
igu
re 6
.6: T
he p
ed
sh
ed
patt
ern
fro
m r
esid
en
ce 6
Resid
en
ce 6
was s
ele
cte
d a
s t
he r
esid
en
ce
ph
ysic
ally
clo
sest
to R
ob
ina T
ow
n C
entr
e. T
he
resid
en
ce is lo
cate
d in
a g
ate
d c
om
mu
nity a
nd
ad
jacen
t to
th
e G
olf c
ou
rse f
en
ce.
Ped
estr
ian
tra
vel fr
om
th
e r
esid
en
ce is v
ery
restr
icte
d b
y t
he G
olf C
ours
e,
Ro
bin
a P
ark
way
an
d t
he a
dja
cen
t cu
l-d
e-s
acs.
Perm
eab
ility
an
d p
ed
estr
ian
op
tio
ns f
rom
th
is r
esid
en
ce is
pro
bab
ly t
he w
ors
t in
the R
ob
ina W
oo
ds.
Resu
lts f
or
the a
naly
sis
in
dic
ate
: A
ped
estr
ian
can
reach
tw
o d
estinatio
ns w
ith
in 2
0 m
inu
tes.
Th
ey c
an
no
t re
ach
th
e e
igh
t re
main
ing
desti-
natio
ns w
ith
in 2
0 m
inu
tes.
6

Bon
d U
nive
rsity
Mas
ter
of U
rban
Pla
nnin
g R
esea
rch
Pro
ject
The
Rob
ina
Res
iden
tial A
rchi
pel
ago
77
F
igu
re 6
.7: T
he p
ed
sh
ed
patt
ern
fro
m r
esid
en
ce 7
Resid
en
ce 7
was s
ele
cte
d a
s c
lose t
o t
he
geo
gra
ph
ical cen
tre o
f th
e s
ub
urb
, ad
jacen
t to
the g
olf c
ours
e a
nd
betw
een
th
e t
hre
e d
estina-
tio
ns w
ith
in R
ob
ina w
oo
ds. D
esp
ite its
cen
tral-
ity t
he lim
ited
exit c
ho
ices f
rom
th
e s
treet
re-
str
ict
the p
enetr
atio
n o
f th
e lo
cal urb
an
str
eet
str
uctu
re w
ith
in t
en
min
ute
s.
Th
e m
ap
pin
g
an
aly
sis
in
dic
ate
s:
A p
ed
estr
ian
can
reach
on
e d
estin
atio
n w
ith
in
5 m
inu
tes. T
hey c
an
reach
a f
urt
her
two
desti-
natio
ns w
ith
in 1
0 m
inu
tes.
Th
ey c
an
reach
a
furt
her
thre
e d
estin
atio
ns w
ith
in 2
0 m
inu
tes. A
ped
estr
ian
can
no
t re
ach
th
e f
ou
r re
main
ing
destin
atio
ns w
ith
in 2
0 m
inu
tes.
7
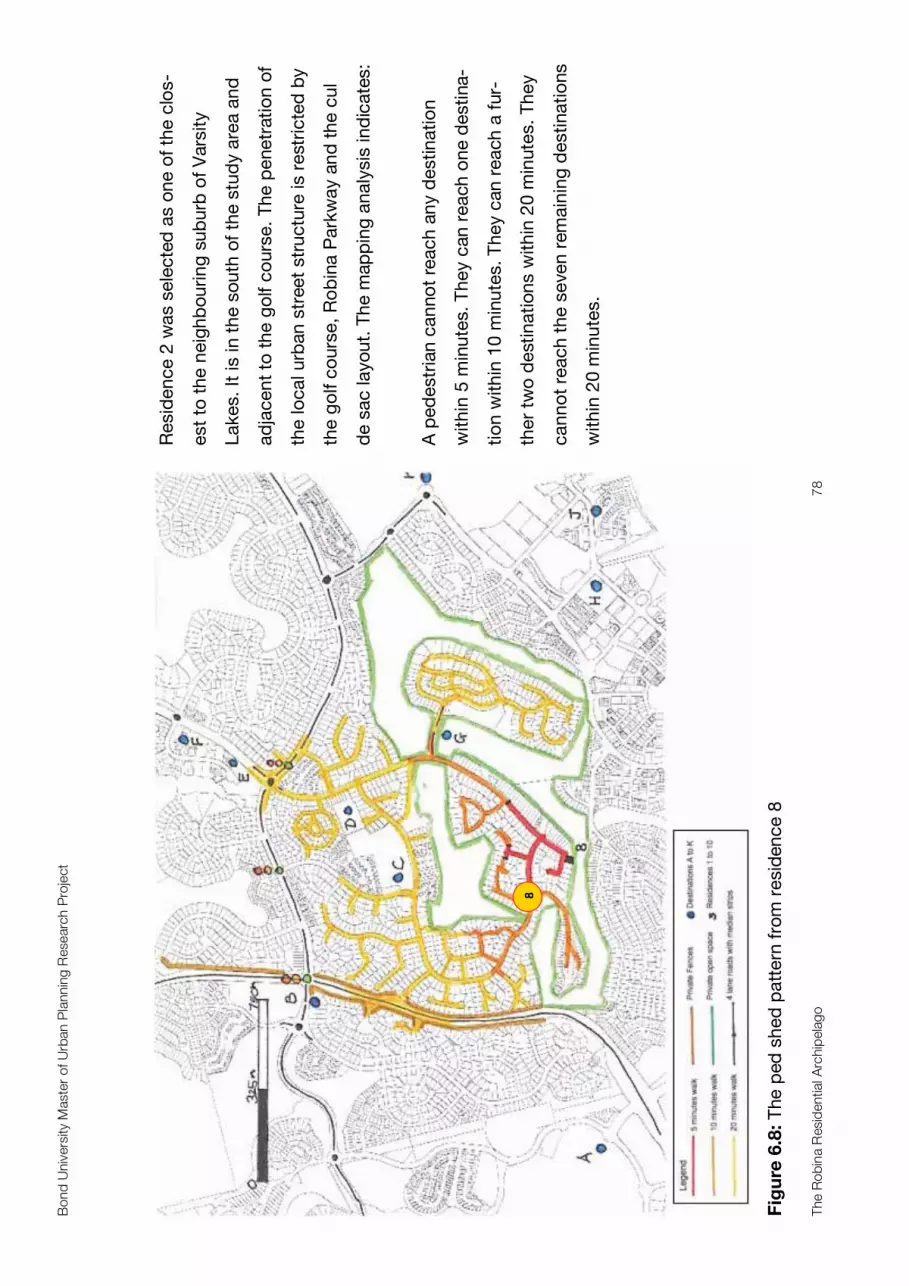
Bon
d U
nive
rsity
Mas
ter
of U
rban
Pla
nnin
g R
esea
rch
Pro
ject
The
Rob
ina
Res
iden
tial A
rchi
pel
ago
78
Fig
ure
6.8
: The p
ed
sh
ed
patt
ern
fro
m r
esid
en
ce 8
Resid
en
ce 2
was s
ele
cte
d a
s o
ne o
f th
e c
los-
est
to t
he n
eig
hb
ou
rin
g s
ub
urb
of
Vars
ity
Lakes.
It is in
th
e s
ou
th o
f th
e s
tud
y a
rea a
nd
ad
jacen
t to
th
e g
olf c
ours
e.
Th
e p
enetr
atio
n o
f
the lo
cal urb
an
str
eet
str
uctu
re is r
estr
icte
d b
y
the g
olf c
ours
e,
Ro
bin
a P
ark
way a
nd
th
e c
ul
de s
ac layo
ut.
Th
e m
ap
pin
g a
naly
sis
in
dic
ate
s:
A p
ed
estr
ian
can
no
t re
ach
an
y d
estin
atio
n
with
in 5
min
ute
s. T
hey c
an
reach
on
e d
estina-
tio
n w
ith
in 1
0 m
inu
tes. T
hey c
an
reach
a f
ur-
ther
two
destin
atio
ns w
ith
in 2
0 m
inute
s.
Th
ey
can
no
t re
ach t
he s
even
rem
ain
ing
destinatio
ns
with
in 2
0 m
inu
tes.
8

Bon
d U
nive
rsity
Mas
ter
of U
rban
Pla
nnin
g R
esea
rch
Pro
ject
The
Rob
ina
Res
iden
tial A
rchi
pel
ago
79
F
igu
re 6
.9: T
he p
ed
sh
ed
patt
ern
fro
m r
esid
en
ce 9
Resid
en
ce 9
was s
ele
cte
d a
s c
losest
to B
on
d
Un
ivers
ity.
It is a
lso
on
th
e e
aste
rn e
dg
e o
f th
e
stu
dy a
rea a
nd
ad
jacen
t to
th
e g
olf c
ou
rse.
Th
e p
enetr
atio
n o
f th
e lo
cal urb
an
str
eet
str
uc-
ture
is r
estr
icte
d b
y t
he c
au
sew
ay c
on
nectio
n
to t
he r
est
of
the s
ub
urb
an
d t
he b
arr
ier
of
the
go
lf c
ours
e. T
he m
ap
pin
g a
naly
sis
ind
icate
s:
A p
ed
estr
ian
can
reach
a d
estin
atio
n w
ith
in 5
min
ute
s. T
hey c
an
no
t re
ach a
furt
her
destina-
tio
n w
ith
in 1
0 m
inu
tes. T
hey c
an
reach
a f
ur-
ther
thre
e d
estin
atio
ns w
ith
in 2
0 m
inu
tes. A
ped
estr
ian
can
no
t re
ach
th
e s
ix r
em
ain
ing
destin
atio
ns w
ith
in 2
0 m
inu
tes.
9

Bon
d U
nive
rsity
Mas
ter
of U
rban
Pla
nnin
g R
esea
rch
Pro
ject
The
Rob
ina
Res
iden
tial A
rchi
pel
ago
80
Fig
ure
6.1
0: T
he p
ed
sh
ed
patt
ern
fro
m r
esid
en
ce 1
0
Resid
en
ce 1
0 w
as s
ele
cte
d a
s c
losest
to V
ar-
sity C
olle
ge it
is a
lso
ad
jacen
t to
th
e g
olf
co
urs
e a
nd
in
th
e s
ou
th o
f th
e s
tud
y a
rea. T
he
pen
etr
atio
n o
f th
e lo
cal urb
an
str
eet
str
uctu
re
is v
ery
po
or.
With
a c
on
ven
tio
nally
dra
wn
ped
sh
ed
it
sho
uld
be a
ble
to
access s
ix d
estina-
tio
ns in
ten
min
ute
s.
The m
ap
pin
g a
naly
sis
in
-
dic
ate
s:
A p
ed
estr
ian
can
no
t re
ach
an
y d
estin
atio
n
with
in 5
min
ute
s. T
hey c
an
reach
on
e d
estina-
tio
n w
ith
in 1
0 m
inu
tes. T
hey c
an
reach
a f
ur-
ther
two
destin
atio
ns w
ith
in 2
0 m
inute
s.
Th
ey
can
no
t re
ach t
he s
even
rem
ain
ing
destinatio
ns
with
in 2
0 m
inu
tes.
10
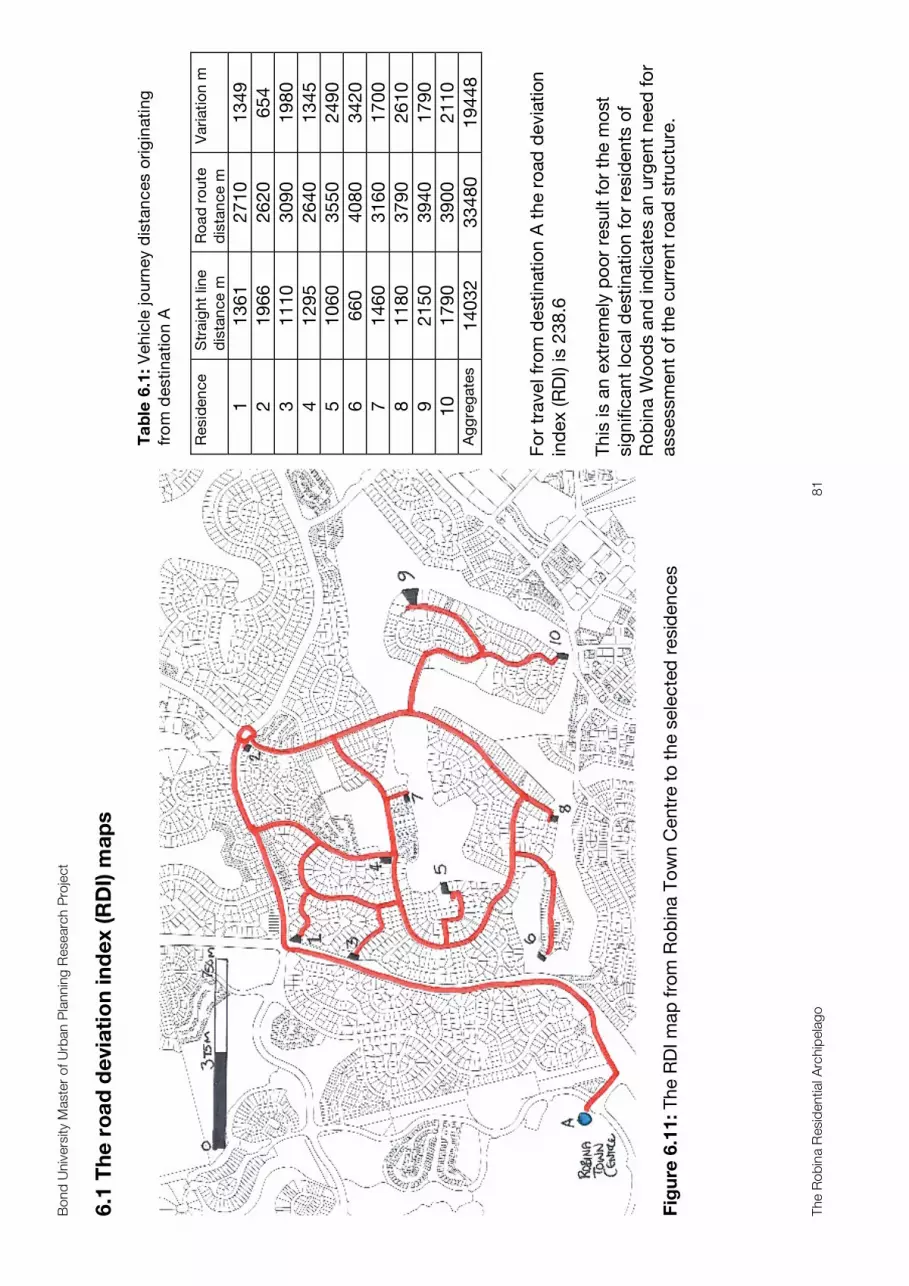
Bon
d U
nive
rsity
Mas
ter
of U
rban
Pla
nnin
g R
esea
rch
Pro
ject
The
Rob
ina
Res
iden
tial A
rchi
pel
ago
81
6.1
The
ro
ad d
evia
tio
n in
dex
(RD
I) m
aps
F
igu
re 6
.11:
Th
e R
DI m
ap
fro
m R
ob
ina T
ow
n C
en
tre t
o t
he s
ele
cte
d r
esid
en
ces
Ta
ble
6.1
: Veh
icle
jo
urn
ey d
ista
nc
es o
rig
inati
ng
fro
m d
esti
natio
n A
R
esid
en
ce
Str
aig
ht
line
dis
tan
ce
m
Ro
ad
ro
ute
dis
tan
ce
m
Vari
ati
on
m
1
13
61
2
71
0
13
49
2
19
66
2
62
0
65
4
3
11
10
3
09
0
19
80
4
12
95
2
64
0
13
45
5
10
60
3
55
0
24
90
6
66
0
40
80
3
42
0
7
14
60
3
16
0
17
00
8
11
80
3
79
0
26
10
9
21
50
3
94
0
17
90
10
1
79
0
39
00
2
11
0
Ag
gre
gate
s
14
03
2
33
48
0
19
44
8
Fo
r tr
avel fr
om
destin
atio
n A
th
e r
oad
devia
tio
n
ind
ex (R
DI) is 2
38
.6
Th
is is a
n e
xtr
em
ely
po
or
resu
lt f
or
the m
ost
sig
nific
an
t lo
cal d
estin
atio
n f
or
resid
en
ts o
f
Ro
bin
a W
oo
ds a
nd
ind
icate
s a
n u
rgent
need
fo
r
assessm
en
t o
f th
e c
urr
en
t ro
ad
str
uctu
re.
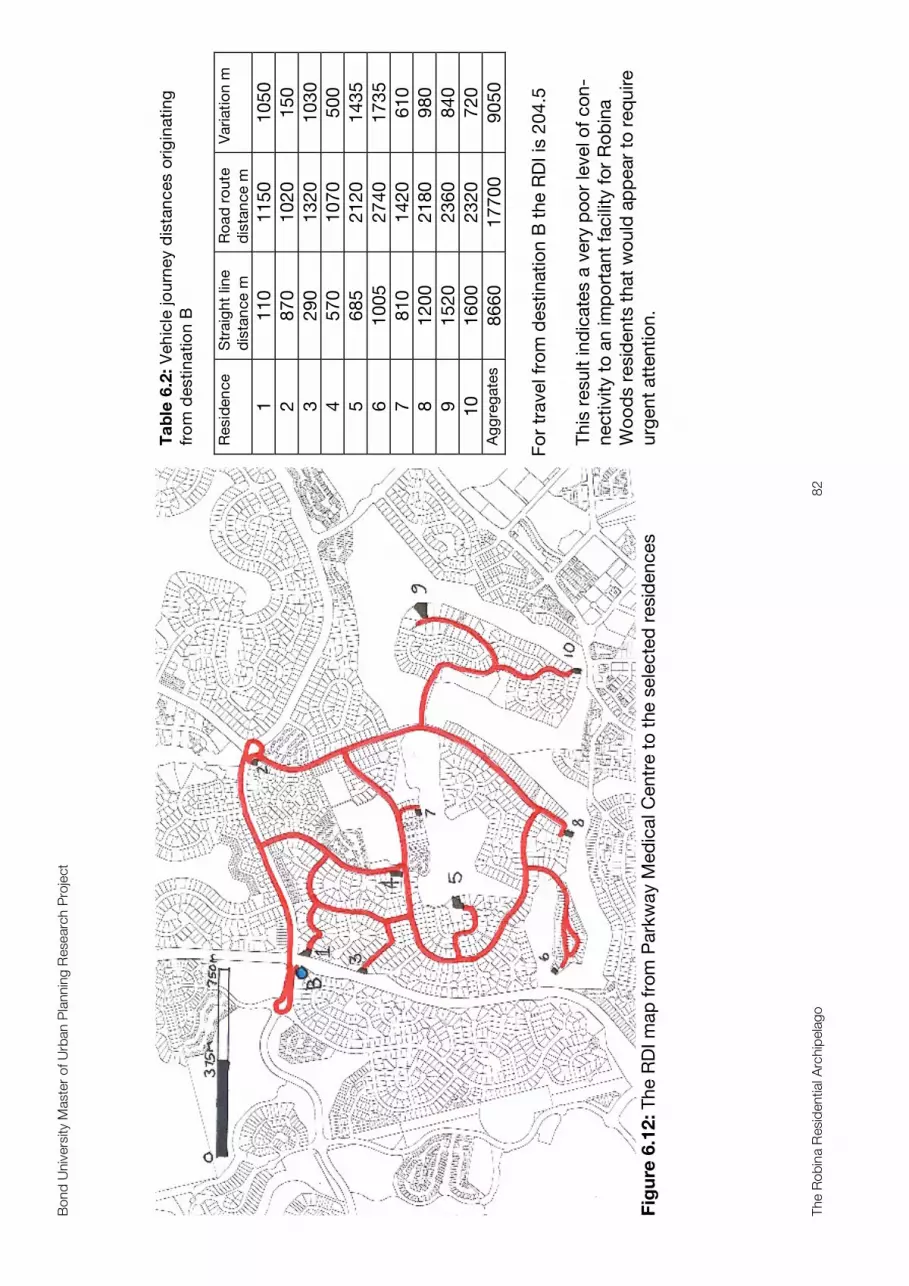
Bon
d U
nive
rsity
Mas
ter
of U
rban
Pla
nnin
g R
esea
rch
Pro
ject
The
Rob
ina
Res
iden
tial A
rchi
pel
ago
82
F
igu
re 6
.12:
Th
e R
DI m
ap
fro
m P
ark
way M
ed
ical C
en
tre t
o t
he s
ele
cte
d r
esid
en
ces
Ta
ble
6.2
: Veh
icle
jo
urn
ey d
ista
nc
es o
rig
inati
ng
fro
m d
esti
natio
n B
Resid
en
ce
Str
aig
ht
line
dis
tan
ce
m
Ro
ad
ro
ute
dis
tan
ce
m
Vari
ati
on
m
1
11
0
11
50
1
05
0
2
87
0
10
20
1
50
3
29
0
13
20
1
03
0
4
57
0
10
70
5
00
5
68
5
21
20
1
43
5
6
10
05
2
74
0
17
35
7
81
0
14
20
6
10
8
12
00
2
18
0
98
0
9
15
20
2
36
0
84
0
10
1
60
0
23
20
7
20
A
gg
reg
ate
s
86
60
1
77
00
9
05
0
Fo
r tr
avel fr
om
destin
atio
n B
the R
DI is
20
4.5
Th
is r
esu
lt in
dic
ate
s a
very
po
or
level o
f co
n-
nectivity t
o a
n im
po
rtan
t fa
cili
ty f
or
Ro
bin
a
Wo
od
s r
esid
en
ts t
hat
wo
uld
ap
pear
to r
eq
uire
urg
en
t att
en
tio
n.

Bon
d U
nive
rsity
Mas
ter
of U
rban
Pla
nnin
g R
esea
rch
Pro
ject
The
Rob
ina
Res
iden
tial A
rchi
pel
ago
83
F
igu
re 6
.13:
Th
e R
DI m
ap
fro
m R
ob
ina S
tate
Scho
ol to
th
e s
ele
cte
d r
esid
en
ces
Ta
ble
6.3
: Veh
icle
jo
urn
ey d
ista
nc
es o
rig
inati
ng
fro
m d
esti
natio
n C
R
esid
en
ce
Str
aig
ht
line
dis
tan
ce
m
Ro
ad
ro
ute
dis
tan
ce
m
Vari
ati
on
m
1
49
0
73
0
24
0
2
62
0
85
0
23
0
3
47
0
58
0
11
0
4
90
N
o jo
urn
ey
0
5
31
0
91
0
60
0
6
77
0
14
00
6
30
7
21
0
30
0
90
8
70
0
16
00
9
00
9
95
0
16
00
6
50
10
1
00
0
15
60
5
60
A
gg
reg
ate
s
55
20
9
53
0
40
10
Resid
en
ce 4
wo
uld
take lo
ng
er
to d
rive p
ast
a
sch
oo
l cro
ssin
g t
urn
in
to p
ark
ing
bay a
nd
park
the c
ar
than
cro
ss t
he r
oad
on
fo
ot.
Fo
r tr
avel fr
om
destin
atio
n C
th
e R
DI is
17
2.6
4
Th
is is a
go
od
resu
lt t
hat
co
uld
be b
ett
er
co
n-
sid
eri
ng
its
cen
tral p
ositio
n in
th
e s
ub
urb
.
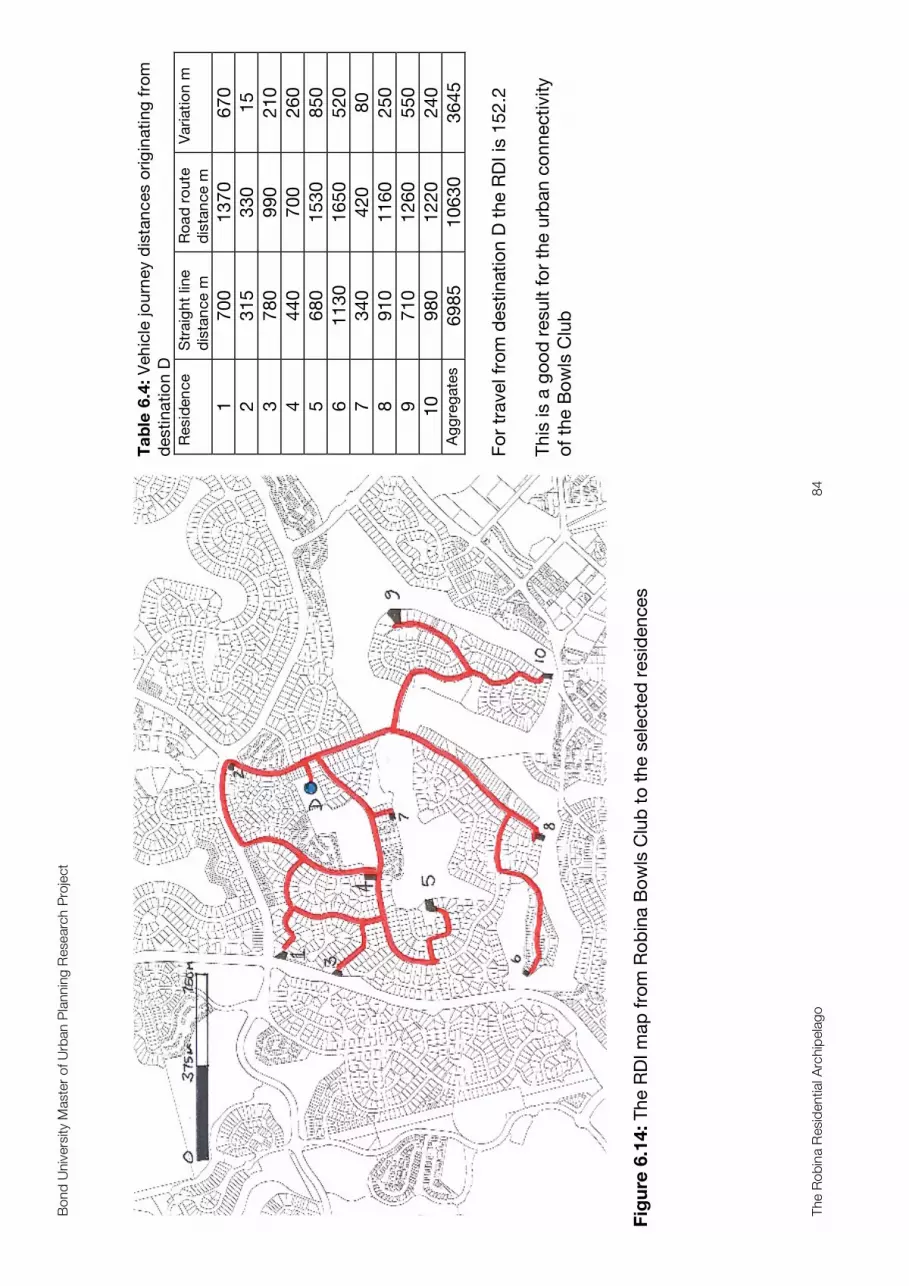
Bon
d U
nive
rsity
Mas
ter
of U
rban
Pla
nnin
g R
esea
rch
Pro
ject
The
Rob
ina
Res
iden
tial A
rchi
pel
ago
84
Fig
ure
6.1
4: T
he R
DI m
ap
fro
m R
ob
ina B
ow
ls C
lub
to
th
e s
ele
cte
d r
esid
en
ces
T
ab
le 6
.4: V
eh
icle
jo
urn
ey d
ista
nc
es o
rig
inati
ng
fro
m
desti
natio
n D
Resid
en
ce
Str
aig
ht
line
dis
tan
ce
m
Ro
ad
ro
ute
dis
tan
ce
m
Vari
ati
on
m
1
70
0
13
70
6
70
2
31
5
33
0
15
3
78
0
99
0
21
0
4
44
0
70
0
26
0
5
68
0
15
30
8
50
6
11
30
1
65
0
52
0
7
34
0
42
0
80
8
91
0
11
60
2
50
9
71
0
12
60
5
50
10
9
80
1
22
0
24
0
Ag
gre
gate
s
69
85
1
06
30
3
64
5
Fo
r tr
avel fr
om
destin
atio
n D
the R
DI is
15
2.2
Th
is is a
go
od
resu
lt f
or
the u
rban
co
nn
ectivity
of
the B
ow
ls C
lub
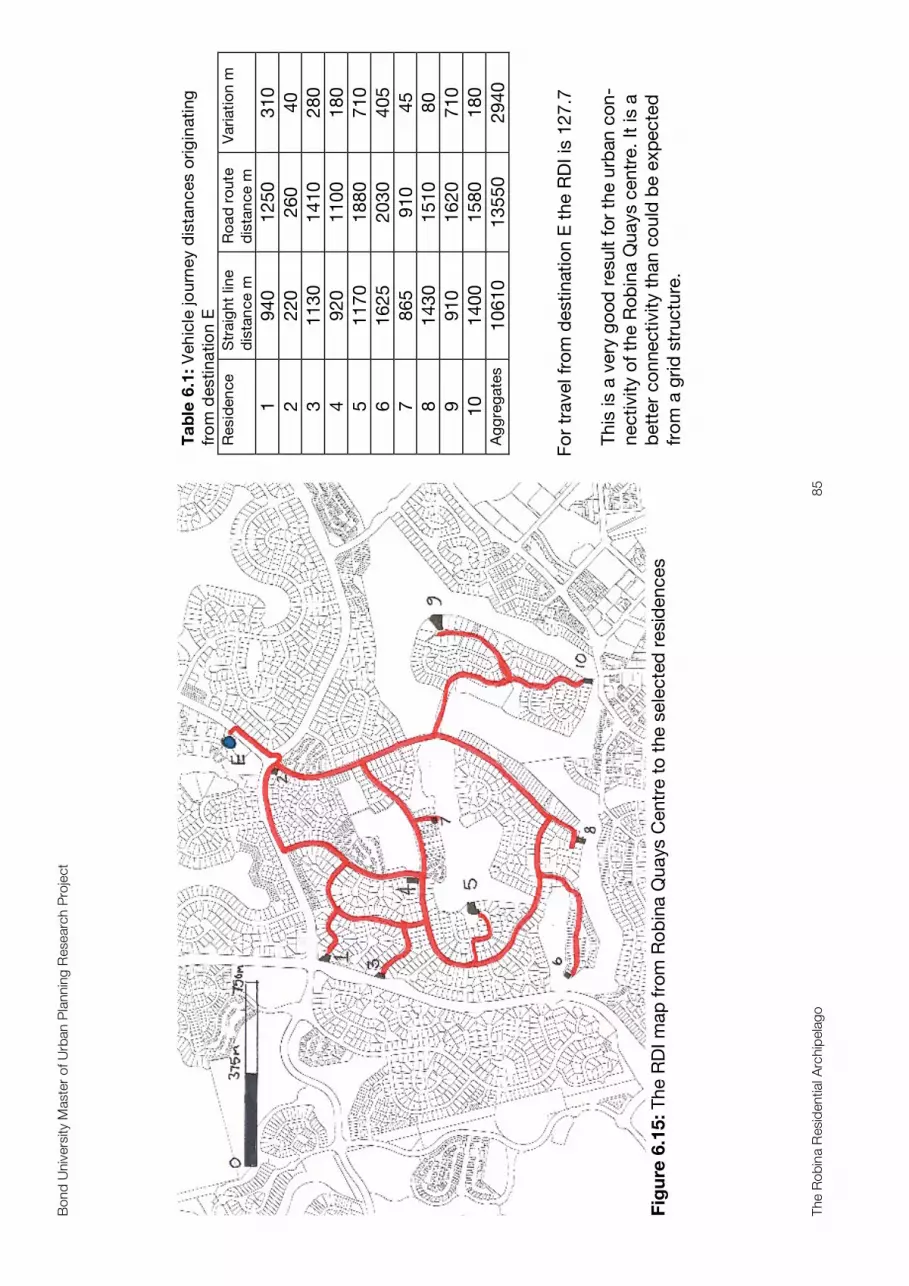
Bon
d U
nive
rsity
Mas
ter
of U
rban
Pla
nnin
g R
esea
rch
Pro
ject
The
Rob
ina
Res
iden
tial A
rchi
pel
ago
85
F
igu
re 6
.15:
Th
e R
DI m
ap
fro
m R
ob
ina Q
uays C
en
tre t
o t
he s
ele
cte
d r
esid
en
ces
Ta
ble
6.1
: Veh
icle
jo
urn
ey d
ista
nc
es o
rig
inati
ng
fro
m d
esti
natio
n E
Resid
en
ce
Str
aig
ht
line
dis
tan
ce
m
Ro
ad
ro
ute
dis
tan
ce
m
Vari
ati
on
m
1
94
0
12
50
3
10
2
22
0
26
0
40
3
11
30
1
41
0
28
0
4
92
0
11
00
1
80
5
11
70
1
88
0
71
0
6
16
25
2
03
0
40
5
7
86
5
91
0
45
8
14
30
1
51
0
80
9
91
0
16
20
7
10
10
1
40
0
15
80
1
80
A
gg
reg
ate
s
10
61
0
13
55
0
29
40
Fo
r tr
avel fr
om
destin
atio
n E
th
e R
DI is
12
7.7
Th
is is a
very
go
od
resu
lt f
or
the u
rban
co
n-
nectivity o
f th
e R
ob
ina Q
uays c
en
tre.
It is a
bett
er
co
nnectivity t
han
co
uld
be e
xp
ecte
d
fro
m a
gri
d s
tructu
re.

Bon
d U
nive
rsity
Mas
ter
of U
rban
Pla
nnin
g R
esea
rch
Pro
ject
The
Rob
ina
Res
iden
tial A
rchi
pel
ago
86
F
igu
re 6
.16:
Th
e R
DI m
ap
fro
m R
ob
ina V
illag
e t
o t
he s
ele
cte
d r
esid
en
ces
T
ab
le 6
.6: V
eh
icle
jo
urn
ey d
ista
nc
es o
rig
inati
ng
fro
m
desti
natio
n F
Resid
en
ce
Str
aig
ht
line
dis
tan
ce
m
Ro
ad
ro
ute
dis
tan
ce
m
Vari
ati
on
m
1
12
20
1
56
0
34
0
2
45
0
68
0
23
0
3
13
20
1
80
0
48
0
4
13
40
1
48
0
14
0
5
13
80
2
16
0
78
0
6
18
40
2
39
0
55
0
7
10
90
1
18
0
90
8
16
65
1
76
0
95
9
10
70
1
90
0
83
0
10
1
60
5
18
60
2
55
A
gg
reg
ate
s
12
98
0
16
77
0
37
90
Fo
r tr
avel fr
om
destin
atio
n F
th
e R
DI is
129
.2
Th
is is a
very
go
od
resu
lt f
or
the u
rban
co
n-
nectivity o
f th
e R
ob
ina V
illag
e.
It is a
bett
er
co
nn
ectivity t
han c
ou
ld b
e e
xp
ecte
d f
rom
a
gri
d s
tru
ctu
re.
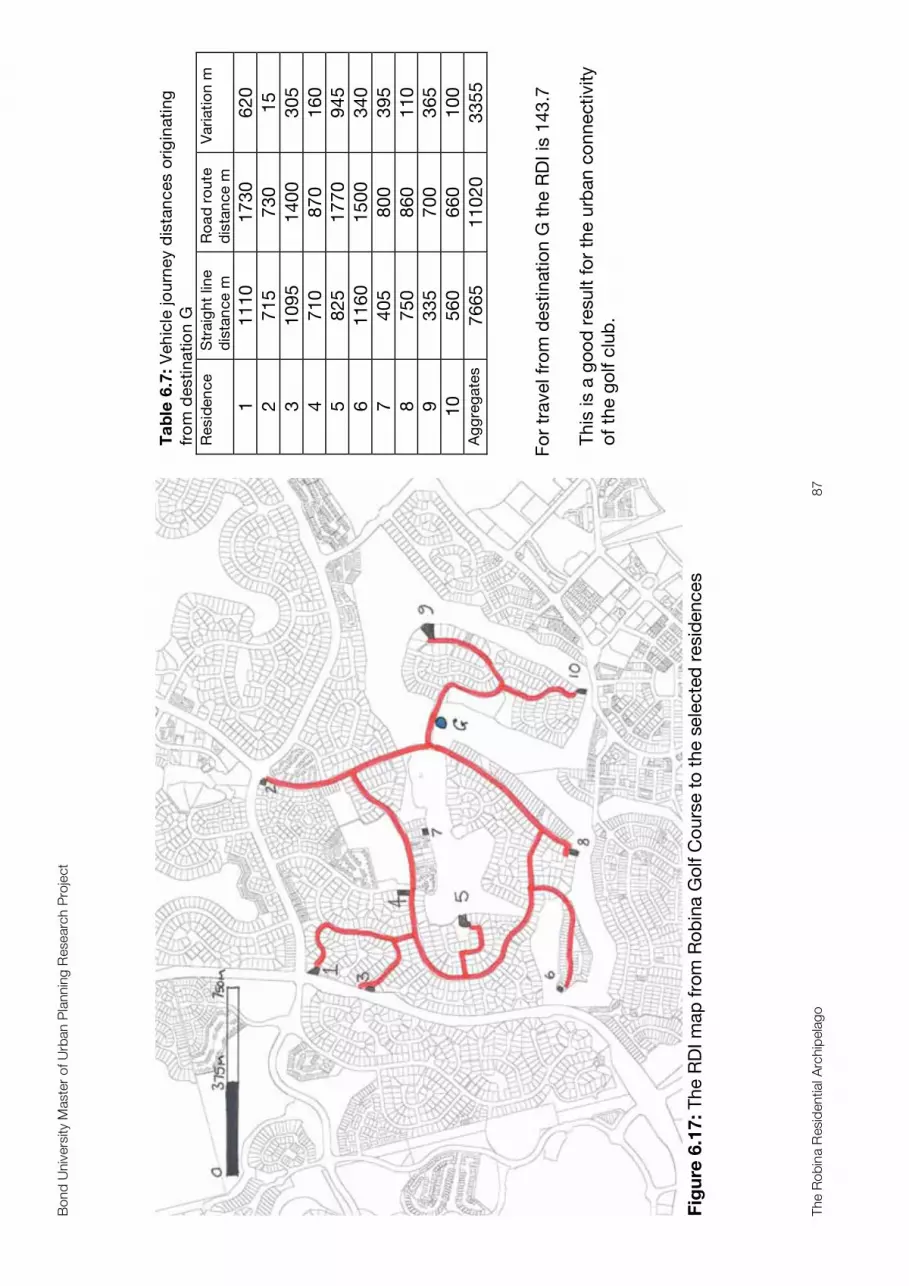
Bon
d U
nive
rsity
Mas
ter
of U
rban
Pla
nnin
g R
esea
rch
Pro
ject
The
Rob
ina
Res
iden
tial A
rchi
pel
ago
87
F
igu
re 6
.17:
Th
e R
DI m
ap
fro
m R
ob
ina G
olf C
ou
rse t
o t
he s
ele
cte
d r
esid
en
ces
Ta
ble
6.7
: Veh
icle
jo
urn
ey d
ista
nc
es o
rig
inati
ng
fro
m d
esti
natio
n G
Resid
en
ce
Str
aig
ht
line
dis
tan
ce
m
Ro
ad
ro
ute
dis
tan
ce
m
Vari
ati
on
m
1
11
10
1
73
0
62
0
2
71
5
73
0
15
3
10
95
1
40
0
30
5
4
71
0
87
0
16
0
5
82
5
17
70
9
45
6
11
60
1
50
0
34
0
7
40
5
80
0
39
5
8
75
0
86
0
11
0
9
33
5
70
0
36
5
10
5
60
6
60
1
00
A
gg
reg
ate
s
76
65
1
10
20
3
35
5
Fo
r tr
avel fr
om
destin
atio
n G
th
e R
DI is
14
3.7
Th
is is a
go
od
resu
lt f
or
the u
rban
co
nn
ectivity
of
the g
olf c
lub
.

Bon
d U
nive
rsity
Mas
ter
of U
rban
Pla
nnin
g R
esea
rch
Pro
ject
The
Rob
ina
Res
iden
tial A
rchi
pel
ago
88
F
igu
re 6
.18:
Th
e R
DI m
ap
fro
m V
ars
ity C
olle
ge t
o t
he s
ele
cte
d r
esid
en
ces
T
ab
le 6
.8: V
eh
icle
jo
urn
ey d
ista
nc
es o
rig
inati
ng
fro
m
desti
natio
n H
Resid
en
ce
Str
aig
ht
line
dis
tan
ce
m
Ro
ad
ro
ute
dis
tan
ce
m
Vari
ati
on
m
1
19
80
3
28
0
13
00
2
15
75
2
32
0
74
5
3
19
20
3
44
0
15
20
4
15
25
3
25
0
19
95
5
15
40
3
73
0
21
90
6
17
05
3
92
0
22
15
7
12
75
2
77
0
14
95
8
11
80
3
32
0
21
40
9
74
5
24
50
1
70
5
10
5
50
2
41
0
18
60
A
gg
reg
ate
s
13
99
5
30
89
0
17
16
5
Fo
r tr
avel fr
om
destin
atio
n H
th
e R
DI is
22
2.6
Th
is is a
n e
xtr
em
ely
po
or
resu
lt f
or
the u
rban
co
nn
ectivity o
f V
ars
ity C
olle
ge t
o R
ob
ina
Wo
od
s.
Co
nsid
eri
ng
its
im
po
rtan
ce t
o t
he
Ro
bin
a W
oo
ds c
om
mu
nity it
wo
uld
ap
pear
that
this
situ
atio
n r
eq
uir
es u
rgen
t att
en
tio
n.
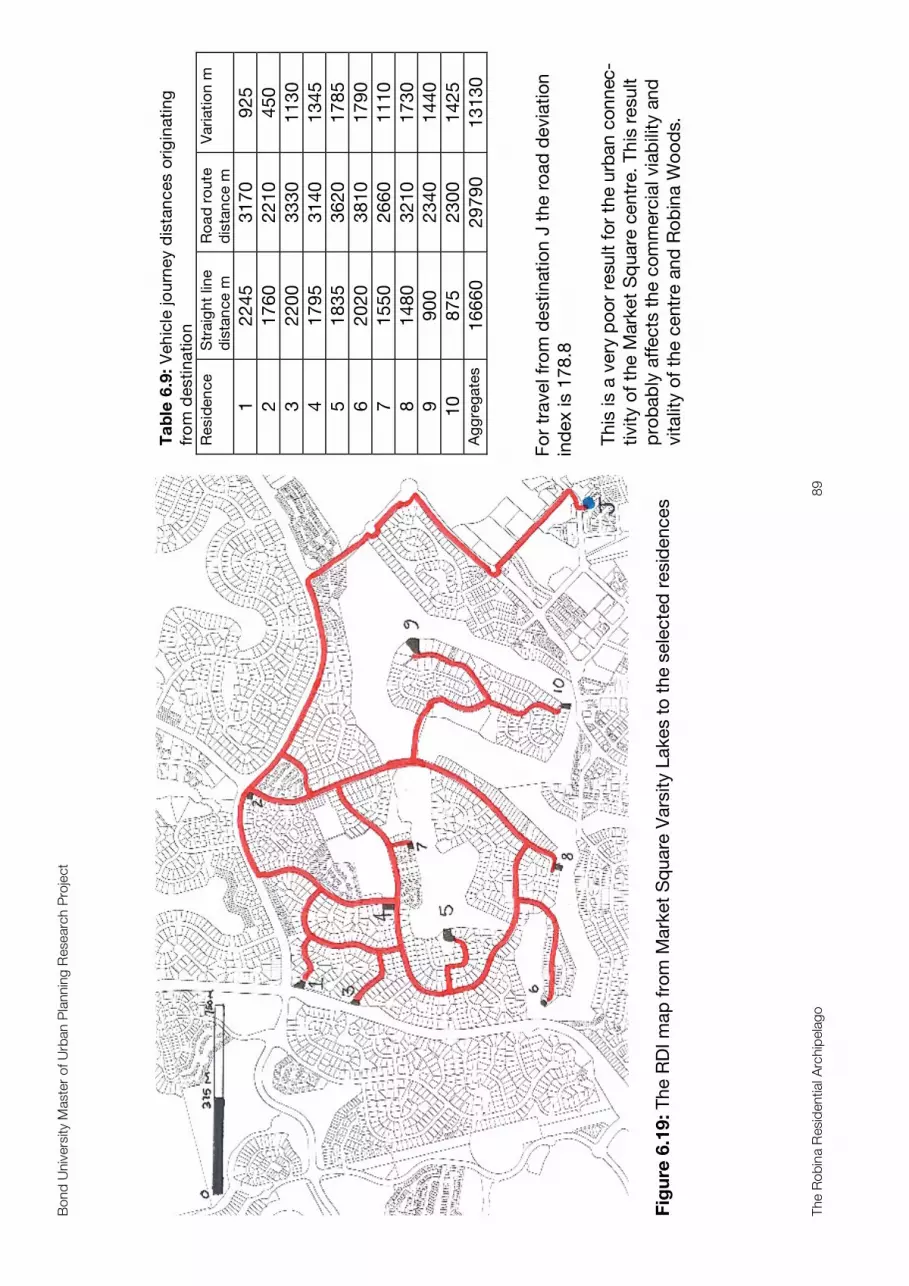
Bon
d U
nive
rsity
Mas
ter
of U
rban
Pla
nnin
g R
esea
rch
Pro
ject
The
Rob
ina
Res
iden
tial A
rchi
pel
ago
89
F
igu
re 6
.19:
Th
e R
DI m
ap
fro
m M
ark
et
Sq
uare
Vars
ity L
akes t
o t
he s
ele
cte
d r
esid
en
ces
Ta
ble
6.9
: Veh
icle
jo
urn
ey d
ista
nc
es o
rig
inati
ng
fro
m d
esti
natio
n
Resid
en
ce
Str
aig
ht
line
dis
tan
ce
m
Ro
ad
ro
ute
dis
tan
ce
m
Vari
ati
on
m
1
22
45
3
17
0
92
5
2
17
60
2
21
0
45
0
3
22
00
3
33
0
11
30
4
17
95
3
14
0
13
45
5
18
35
3
62
0
17
85
6
20
20
3
81
0
17
90
7
15
50
2
66
0
11
10
8
14
80
3
21
0
17
30
9
90
0
23
40
1
44
0
10
8
75
2
30
0
14
25
A
gg
reg
ate
s
16
66
0
29
79
0
13
13
0
Fo
r tr
avel fr
om
destin
atio
n J
th
e r
oad
devia
tio
n
ind
ex is 1
78.8
Th
is is a
very
po
or
resu
lt f
or
the u
rban
co
nn
ec-
tivity o
f th
e M
ark
et
Sq
uare
cen
tre.
Th
is r
esu
lt
pro
bab
ly a
ffects
th
e c
om
merc
ial via
bili
ty a
nd
vitalit
y o
f th
e c
entr
e a
nd
Ro
bin
a W
oo
ds.
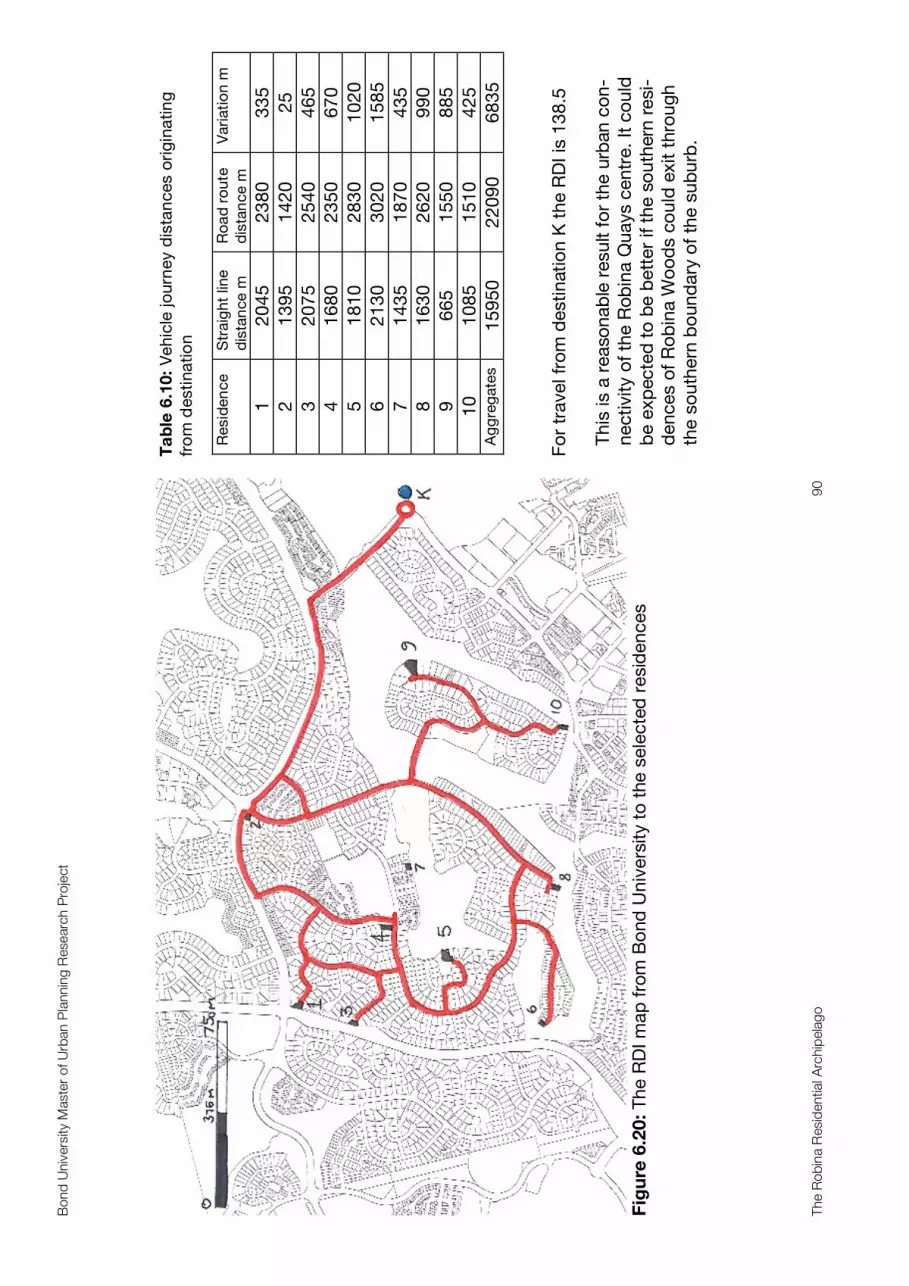
Bon
d U
nive
rsity
Mas
ter
of U
rban
Pla
nnin
g R
esea
rch
Pro
ject
The
Rob
ina
Res
iden
tial A
rchi
pel
ago
90
F
igu
re 6
.20:
Th
e R
DI m
ap
fro
m B
ond
Un
ivers
ity t
o t
he s
ele
cte
d r
esid
en
ces
T
ab
le 6
.10:
Ve
hic
le jo
urn
ey d
ista
nces o
rig
ina
tin
g
fro
m d
esti
natio
n
Resid
en
ce
Str
aig
ht
line
dis
tan
ce
m
Ro
ad
ro
ute
dis
tan
ce
m
Vari
ati
on
m
1
20
45
2
38
0
33
5
2
13
95
1
42
0
25
3
20
75
2
54
0
46
5
4
16
80
2
35
0
67
0
5
18
10
2
83
0
10
20
6
21
30
3
02
0
15
85
7
14
35
1
87
0
43
5
8
16
30
2
62
0
99
0
9
66
5
15
50
8
85
10
1
08
5
15
10
4
25
A
gg
reg
ate
s
15
95
0
22
09
0
68
35
Fo
r tr
avel fr
om
destin
atio
n K
th
e R
DI is
13
8.5
Th
is is a
reaso
nab
le r
esu
lt f
or
the u
rban
co
n-
nectivity o
f th
e R
ob
ina Q
uays c
en
tre.
It c
ou
ld
be e
xp
ecte
d t
o b
e b
ett
er
if t
he s
ou
thern
resi-
den
ces o
f R
ob
ina W
oo
ds c
ou
ld e
xit t
hro
ug
h
the s
ou
thern
bo
un
dary
of
the s
ub
urb
.

Bond University Master of Urban Planning Research Project
The Robina Residential Archipelago 91
7.0 Conclusions
The original research questions chosen to guide this research project were:
1. What is the current nature of the urban connectivity of Robina?
2. How does the current urban design and connectivity impact on the residents of the
suburbs?
3. What measures could be taken to improve the urban design and connectivity?
This research paper has set out, within the limits of its research, to describe the nature of
urban connectivity in Robina and in the case study area of Robina Woods. This was pri-
marily done utilising an analysis of the barriers to connectivity and mapping the ped
sheds and road deviation index with the maps in Section Six. The analysis of those maps
in Section Five presents a picture of the current urban connectivity through these maps.
Urban connectivity in the context of this research project has been defined as The degree
to which the urban form allows people to travel to retail, education, health, employment,
professional, social and recreational facilities from their homes on foot, by bicycle, public
transport or private vehicle.
The evidence gathered in this research project suggests that there is significant disrup-
tion to the urban connectivity of Robina Woods to its southern and western boundaries.
There is also cause for concern for the quality of the pedestrian environment. For such a
large and central suburb the provision of destinations, landmarks, public facilities and
streetscapes can be seen to be below what could be expected in a small rural Queen-
sland town with a similar population. The nature of this urban form has been caused by
its car dependent design that appears to have been driven more by marketing principles
and 20th Century planning conventions than sound new town planning.
The long-term sustainability of such an urban form, dependent as it is on the private vehi-
cle is questionable. The concentration of goods, services and employment in centres
such as Robina Town Centre makes the poor provision of these essentials within Robina
Woods a problem that will be difficult to address. Should society change significantly a
suburb without the goods services and employment necessary for a reasonably urbane

Bond University Master of Urban Planning Research Project
The Robina Residential Archipelago 92
society within its boundaries may become much less desirable. One scenario of this
would be if the working patterns moved more to part time and working from home, peo-
ple would find there is no where to go within the suburb.
7.1 The nature of the urban connectivity for the residents of Robina
The conclusion of this paper is that, in comparison to known best practice and examples
drawn from other residential examples, many residents of Robina have a low degree of
ability to travel by anything other than private vehicle to the amenities, facilities and
employment they need outside of their residential archipelagos. The ability to meet these
needs is also restricted by the variety, number and choice of destinations within their
suburbs. Walkability is severely restricted by the design and spatial layout of the street
patterns and the actual distances involved.
The efficiency of the road network is very poor, surprisingly so for Robina Town Centre,
considering the intent expressed by the developer in the Robina Profile 1999 (Robina
Land Corporation, 1999) to make it the premier shopping and commercial centre of the
Gold Coast. This has not yet been achieved. The adjacent suburb of Robina Woods has
an inefficient and problematic hierarchical road structure. A simple analysis of this struc-
ture indicates that a blockage along many points on Robina Parkway and Cheltenham
Drive would cause long diversions and delays for travellers due to a lack of permeability
and optional routes.
The urban connection to the neighbouring suburb of Varsity Lakes is extremely poor. The
barrier to urban connectivity that the Robina Woods Golf Course produces requires im-
mediate attention. It is not acceptable, in the view of the author, that private ownership
and limited special interests over such spatially strategic land should prevent suitable
outcomes for the many residents adjoining this key private open space. Originally it was a
useful marketing tool to draw residents to a green and leafy suburb. However, times
change and so do the obligations of developers and land owners. It would be hoped that
key routes could be opened especially to Varsity College and Market Square. The rede-
velopment of the golf course could be beneficial to all either in a modified form or as a
connecting urban environment that has learnt lessons from the past.
Bond University Master of Urban Planning Research Project
The Robina Residential Archipelago 93
There is an obvious need to improve the number of destinations within the suburbs, the
quality of streets and the sense of place in order to foster social capital in engaged
neighbourhoods and to engage, inform and involve the local community in setting goals
and finding solutions to the current and future sustainability of their suburbs.
7.2 The reasons for change to the urban connectivity of Robina There are many reasons why changing the urban form and its attendant low levels of
connectivity will be difficult, expensive, socially and politically divisive. However there are
significant and enduring reasons for addressing the issues that have arisen from over-
sight, poor planning and the marketing based urban design policies and practices of the
past.
These reasons for change are current and impending. They include:
• The current physical and mental health costs (Australian Local Government Asso-
ciation et al., 2008)
• The loss of social capital (Australian Local Government Association et al., 2008).
• The lack of mobility choices for people without cars, especially the disadvantaged,
younger, and older residents.
• The impending increase in the size and proportion of the older demographic of the
population with attendant demands on social and physical infrastructure.
• The changing demographic profile of the community that will see a need for a
wider range of housing choices than currently exists in suburbs like Robina
Woods.
• The inevitability of change in economic, social and environmental conditions best
met by a resilient urban form that can adapt to those changes
• The ageing populations forecast increased need for more support to enable it to
remain mobile and engaged in the community
• The lack of adaptability to change of an urban form dependent on the car for its
mobility

Bond University Master of Urban Planning Research Project
The Robina Residential Archipelago 94
7.3 The challenges for the future sustainability of Robina
There are high financial costs to be borne if no action is taken. Residential suburbs that
do not adapt may find themselves falling in desirability and value if they ignore the current
levels of urban connectivity. Financial costs of higher vehicle kilometres travelled for resi-
dents and services could become critical as fuel prices rise. The externalised costs of
underdeveloped suburbs will fall on future ratepayers who will be called on to repair and
maintain the physically extensive infrastructure network.
There are also the external forces of a restructuring economy currently facing a crisis of
confidence. The likely and possible effects of peak oil and climate change are still being
decided, but they are unlikely to support an inefficient and carbon fuel intensive urban
form dependent on the automobile for its existence. Even if the worst predictions of the
future costs of private transport and economic crisis do not eventuate, there is going to
be a level of stress on residents who live in suburbs like Robina. The long-term benefits of
improving urban connectivity are too high to be ignored by the public, politicians and
public servants forever.
There is, however, a need to raise awareness of the problem and the quality and visibility
of political debate. Engineers, architects, urban designers, planners, developers, financi-
ers, and politicians will need to engage in finding solutions rather than reacting to prob-
lems after they have occurred. In and of themselves no one profession or group is seen
as having the resources or abilities to solve the difficult problems that the current urban
form presents.
The author recognises that the designers and builders of Robina and Robina Woods had
different motivation to current writers in urban design, such as Llewellyn Davies. Although
it is surprising that the car dependent option was pursued considering that the evidence
was there in the 1980s that this may have been an unwise option. There is also troubling
evidence that nothing has been learnt from suburbs like Robina and car dependent de-
sign continues to dominate development in the Gold Coast and can be seen to be still
occurring in recent developments. The author believes it is not responsible to accept that,
Bond University Master of Urban Planning Research Project
The Robina Residential Archipelago 95
as events have already occurred, we are trapped and unable to do anything about the ur-
ban form. The findings of the lack of walkability and road connectivity in Robina Woods
should not be seen as an inescapable reality but an opportunity to improve and modify
the existing environment for the benefit of current and future generations.
7.4 The possible solutions for Robina residents
The evidence in this research paper is that there is now and will continue to be a need to
propose, examine and implement changes which can deliver better social, economic, en-
vironmental and health outcomes for the current and future residents of Robina and resi-
dential suburbs like it within the Gold Coast and Australia. The following suggestions are
by no means comprehensive or definitive answers to the problems of poor urban connec-
tivity. It is thought that the answer will lie in a cooperative and coordinated program of ac-
tion and policy from all stakeholders in the built environment including, the public and
politicians, planners, urban designers, architects, engineers, developers, educators and
financiers. The following suggestions are put forward as adaptations of the suggestions
of others and from the author’s own local observations of opportunities.
I. Redesign the method of calculating rates to reflect the extra costs of collecting
wastes and delivering infrastructure to low density areas with inefficient road sys-
tems that pass those costs on to ratepayers who live in better urban forms.
II. Levy a carbon charge in the rates to help pay for retrofitting of suburbs based on
the carbon footprint of households
III. Provide an advisory service and subsidies to residents who reduce their carbon
footprint or enter into on site water collection and waste processing
IV. Revitalisation of the residential suburbs to provide for a greater range of housing,
employment and social activities to help create sustainable neighbourhoods
V. Increasing population densities by utilising mixed-use redevelopment of low den-
sity development in new centres along transit corridors or at crossroads
VI. Setting finite limits on the urban footprint of the Gold Coast which will force a
change in development strategies by construction companies, rather than allowing

Bond University Master of Urban Planning Research Project
The Robina Residential Archipelago 96
them to demand continual expansion of that urban footprint as their preferred soft
option.
VII. Redevelopment of existing buildings, structures, infill, and conversion. (Williams et
al 1999 and 2000)
VIII. Reconfiguration of lots to provide larger development blocks at designated “vil-
lage” centres such as the Ron Penhaligon, Cheltenham and Cottesloe roundabout
and along transit corridors such as Robina Parkway
IX. Public funding of affordable housing redevelopment from low to higher density in
those village centres and along transit routes.
X. Utilising New Urbanist and Smart growth strategies to guide development
XI. Development of alternate road routes that open the western and southern boun-
daries
XII. Redevelopment or redesign of Robina Woods Golf Course to allow road and or
pedestrian routes to Varsity Lakes
XIII. The design of a master plan for the renewal of the suburb in partnership with de-
velopers to replace the current planning provisions and repeal of the act of parlia-
ment which authorises this development.
XIV. The provision of public amenities and destinations in that masterplan to make the
suburb a more resilient and adaptable community
7.5 The benefits for Robina residents and the wider community
The urban development pattern for Robina is by no means unique. Examples of similar or
worse urban connectivity can be seen throughout the Gold Coast and beyond. It is rea-
sonable to expect that similar barriers exist in other communities throughout Australia es-
pecially those new town developments and expansions of existing urban form built from
the 1960s onward.
The solutions to those problems need to be found by consensus and the involvement of
the community. This will help to raise awareness of urban design issues in the general
population much as was done during the recent water crises in South East Queensland.
The benefits of change need to be communicated to the wider population, some of those
benefits are seen as:

Bond University Master of Urban Planning Research Project
The Robina Residential Archipelago 97
• The improved physical and mental health of the residents
• Increased neighbourhood social capital and social activity
• Economic benefits from a more efficient public infrastructure and transport system
• Improved choices for use of time with reduced commuting times
• The compact city is the most favourable sustainable urban form (Elkin et al 1991,
Nolan and Stewart 1991)
• A more resilient and sustainable urban form will cope better with peak oil and cli-
mate change
• By developing polycentric suburbs in the Gold Coast, Robina will contribute to the
development of a less linear Gold Coast City
• Reduction of the need for multiple private vehicles for households in Robina with
the concurrent costs of vehicle ownership
• Reducing travel times within the suburb and to its neighbouring suburbs
• Reduction of Vehicle Kilometres Travelled (VKT) and a reduction in Greenhouse
Gas Emissions (GHG) by the suburbs
7.6 Designing a solution to car dependent suburb
Only representative partnerships of stakeholders can reach successful solutions to our
current problems. It is not realistic to expect the self interest of private firms to produce
optimal results for the wider community, as explained by Alan Greenspan (Nason, 2008)
in recent statements on the current banking failures in the US. There will be a need for
private and public capital to solve current problems, but the regulation of a robust design
process is needed to ensure the best results for the community as a whole.
The difficulties that present in re engineering the residential archipelago are substantial
and make the need for a sustained and coordinated, political and economic solution a
prerequisite in the design of any solutions. The above diagram in Figure 7.1 is a simplified
design cycle that shows the relationship between the components for a successful de-
sign solution. Like any design cycle it is acknowledged that there is no specific start or
finish point and that the cycle may be initiated at any point in its revolution.
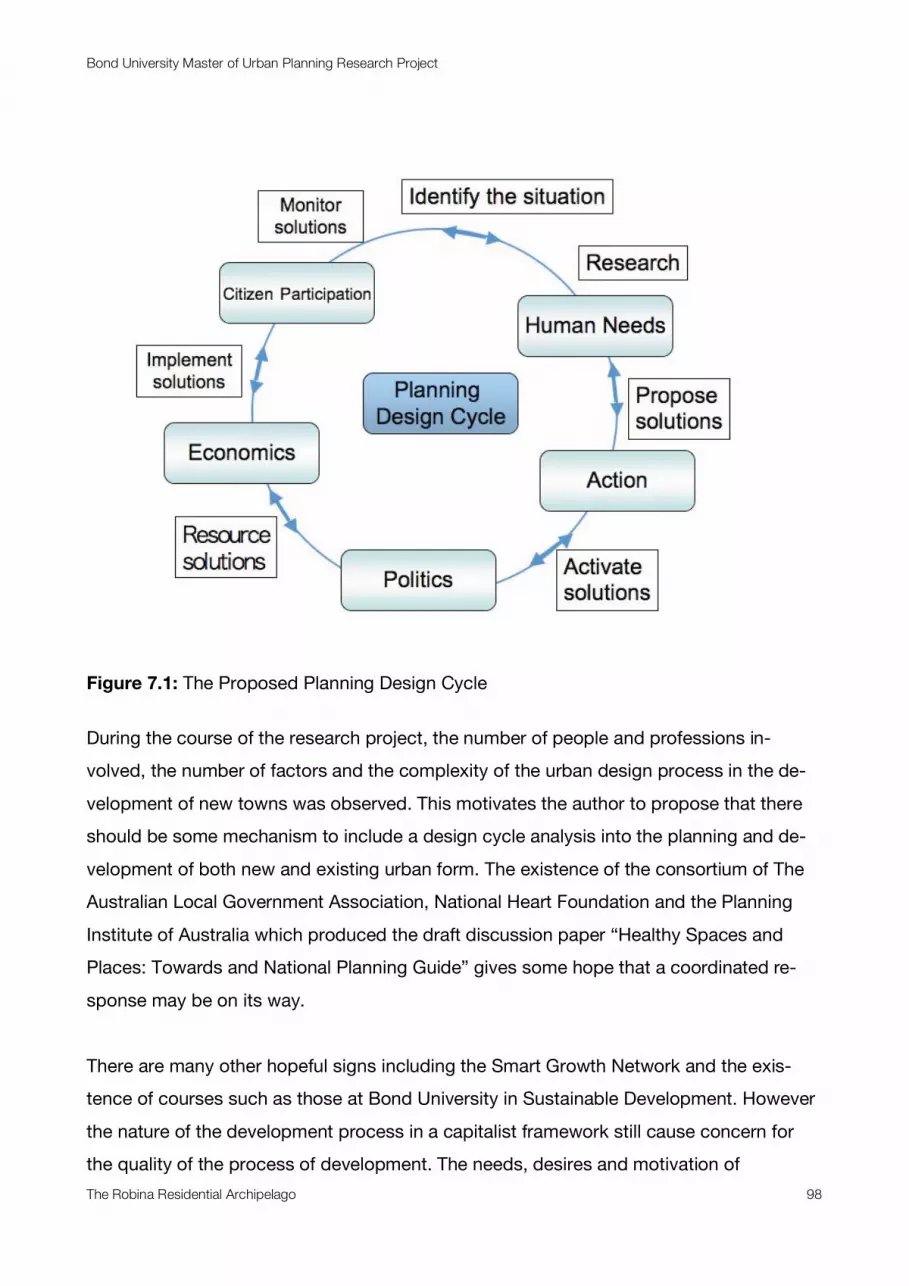
Bond University Master of Urban Planning Research Project
The Robina Residential Archipelago 98
Figure 7.1: The Proposed Planning Design Cycle
During the course of the research project, the number of people and professions in-
volved, the number of factors and the complexity of the urban design process in the de-
velopment of new towns was observed. This motivates the author to propose that there
should be some mechanism to include a design cycle analysis into the planning and de-
velopment of both new and existing urban form. The existence of the consortium of The
Australian Local Government Association, National Heart Foundation and the Planning
Institute of Australia which produced the draft discussion paper “Healthy Spaces and
Places: Towards and National Planning Guide” gives some hope that a coordinated re-
sponse may be on its way.
There are many other hopeful signs including the Smart Growth Network and the exis-
tence of courses such as those at Bond University in Sustainable Development. However
the nature of the development process in a capitalist framework still cause concern for
the quality of the process of development. The needs, desires and motivation of
Bond University Master of Urban Planning Research Project
The Robina Residential Archipelago 99
stakeholders do not and cannot coincide in the development of new towns or the renewal
or redevelopment of existing urban areas. This needs to be acknowledged and worked
with in a mature manner with healthy accompanying vigourous debate. The start point for
the design process is human needs, not minority interests or private profit. The notion of
the common good needs to be paramount in planning decisions.
7.7 Areas for further research
The focus of this research paper was intended to be on urban connectivity (see figure
2.3). Urban connectivity is seen as key to urban design and making places work
(Llewellyn Davies, 2007). The research conducted was limited in scope and only the fac-
tors of accessibility, barriers, destinations and proximity as they affect urban connectivity
were covered in any detail. During the course of the research it was noted that the follow-
ing aspects might require further research.
• Topographic and engineered barriers to urban connectivity in the case of Robina a
study of the topography of the area and its effect on route choices specifically the
difficulties of re engineering Robina Parkway. The effect of slopes on walkability
and a method to include this in a ped shed analysis. The role of Queensland De-
partment of Main Roads has not been pursued in this research project but ques-
tions about the role of the “Shaping Up” document arose during the case study
(Queensland Government, 2008). It would appear that there is a breakdown be-
tween policy and practice for the engineers who designed the current road struc-
tures
• A study of urban design in Robina, with an emphasis on its contribution to the aes-
thetics, spatial layout and the creation of public spaces. Designing for density, and
possible improvements to building codes for residential areas to encourage better
more active and vibrant streetscape is considered an important step in any retrofit-
ting of the residential areas.
Bond University Master of Urban Planning Research Project
The Robina Residential Archipelago 100
• A study of the conditions of walking surfaces, climate and shade provisions on the
paths and streets of Robina could contribute a context from which to consider a
policy and program of improvement.
• A study into the opinions of the residents of Robina with special regard to unearth-
ing their views on sustainability, community and their preferences for urban design
and connectivity.
• A study of conditions in Robina covering street lighting, street surveillance, feelings
of safety, and pedestrian vehicle conflicts. This should actively seek to survey resi-
dents for their opinions.
• A study of the mobility options and choices with a focus on pedestrian, cycling and
public transport priority for the residents of Robina, and to find alternatives if car
ownership is not possible in the future.
• A structured transport study to calculate the excess travel costs and increased car-
bon footprints of MPCs like Robina
• An investigation into the barriers created by planning schemes in producing optimal
urban design outcomes and the creation of urban design guides for laymen and
developers
• An investigation into the effects of the urban connectivity on the opportunity to par-
ticipate in an active healthy lifestyle for those people who have barriers to that op-
portunity through ill health, age, disability or income
In conclusion the combination of the Integrated Planning Act, the SEQRP and the GCPS
in tandem with the market urbanism evident in the development of Robina can be seen to
be a failed method for sustainable development of new settlements. Change in the way
urban development is financed, planned and realised is necessary to prevent a continu-
ance of the same mistakes. It does not make sense to design inefficient, car dependent
communities in the 21st Century, planning should start and end with the aim to benefit
people and not just private companies. The current financial crises clearly demonstrate
the need for public oversight and regulation for such an important area as sustainable de-
velopment.

101
8.0 References
Answers.com, (2008). Dictionary: Parkway. Retrieved 25th November 2008, from
http://www.answers.com/topic/parkway
Australian Local Government Association, National Heart Foundation of Australia,
Planning Institute of Australia, Corti, G., Sharpe, P., Granneer, M., et al.
(2008). Healthy Spaces and Places: Towards a National Planning Guide.
Unpublished manuscript.
Australian Bureau of Statistics, (2007). Regional Population Growth, Australia, 2006-
07. Retrieved 2nd November 2008, from
http://www.abs.gov.au/AUSSTATS/[email protected]/DetailsPage/3218.02006-
07?OpenDocument
ASPO International. (2008). What is Peak Oil? Uppsala, Sweden. Retrieved 20th
March 2008, from. http://www.peakoil.net/
Behan, K. Maoh, H. & Kanaroglou, P. (2007). Evaluating Smart Growth Strategies
with Simulations: Evidence from Hamilton, Ontario. Hamilton, Ontario: Centre
for Spatial Analysis: McMaster University.
Calthorpe, P. (2001). New Urbanism and the End of Sprawl. . Covelo, CA, USA:
Island Press.
Carmona, M., Heath, T., Oc, T., Tiesdell, S., (2003) Urban Places Urban Spaces.
Oxford: Architectural Press.
CBD Robina, (2008a). People, 2008. Retrieved 21st November 2008, from
http://www.robina.com.au/people.html
CBD Robina. (2008). Sustainability in Practice. Retrieved 25th May 2008, from
http://www.robina.com/sustainability-in-practice.html
Cervero, R. (2007). Transport and Land Use: Key issues in Metropolitan Planning
and Smart Growth. Berkeley USA: University of California.
Congress for the New Urbanism. (1996). Charter of the New Urbanism. Retrieved
15th September 2008 from http://www.cnu.org/charter
Department of Family and Community Services. (2000). Australian families:
circumstances and trends. Retrieved 20th October 2008, from
http://www.facs.gov.au/internet/facsinternet.nsf/via/research_dss/$file/facssheet6.pdf.
Dodson, J., & Sipe, N. (2005). Oil Vulnerability in the Australian City. Gold Coast:
Griffith University.
102
England, Phillipa. (2004). Integrated Planning in Queensland. Sydney: The
Federation Press.
Ewing, R, Bartholomew, K. Winkelman, S. Walters, J. & Chen, D. (2008). Growing
Cooler The Evidence on Urban Development and Climate Change.
Washington D.C.: Urban Land Institute.
Frank L., Andresen M., and Schmidt T. (2004). Obesity relationships with community
design, physical activity and time spent in cars. American Journal of
Preventative Medicine, 2004:27(2)
Garnaut, R. (2008). Issues Paper - Forum 5, Transport, Planning and the Built
Environment: Canberra ACT: Garnaut review secretariat.
Gebel, K. Baumann, A. and Owen N. (2007). A National Heart Foundation of
Australia evidence paper. Creating built environments for active living -
Walking. unpublished paper.
Giles-Corti B., and Donovan R. (2002). The relative influence of individual, social,
and physical environment determinants of physical activity. Social Science
and Medicine 54 (2002) 1793 – 1812.
Gold Coast City Council. (2007). Draft Local Growth Management Strategy. Gold
Coast: GCCC Department of Planning Building and the Environment.
Retrieved 15th November 2008, from
http://www.goldcoast.qld.gov.au/t_standard2.aspx?PID=6789.
Gold Coast City Council. (2008). Heritage Tours, planned communities, Robina.
Retrieved 25th October 2008, from
http://www.goldcoast.qld.gov.au/t_standard.aspx?pid=1073
Gold Coast City Council. (2007). Robina Statistical Profile. Retrieved 15th
October
2008, from http://www.goldcoast.qld.gov.au/t_standard2.aspx?pid=250
Green, B. (2008, October/November). Hip pocket contrasts. Brisbane: Royal
Automobile Club of Queensland. The Road Ahead.
Haverfield, F. (1913). Ancient Town Planning. Paper presented at the London
Conference on Town-planning. Oxford: Oxford University Press.
Ip, F. (2007). Municipal Population Estimates 2007. Retrieved 25th November 2008,
from. http://www.bcstats.gov.bc.ca/data/pop/pop/mun/Mun2007txt.pdf
Jenks, M. & Dempsey, N. (2005). Future Forms and Design for Sustainable Cities.
Burlington, MA: Elsevier.
Llewellyn Davies. (2007). Urban Design Compendium 1. London: English
Partnerships
103
Maxmoment International Internet Application Developers. (2008). Welcome to
Robina woods. Retrieved 15th November 2008, from
http://www.robinawoods.com.au/customsidemenu/032347/home.cfm?mobject
id=0F3FE994-BB53-4EBF-AFF3FBA160AAE676-032347&sobjectid=0
McCarthy, J. (2008, 25-26 October 2008). Money fuels land battle. Brisbane: The
Courier Mail, p. 55.
Metropolitan Council. (2003). Green Streets Innovative Solutions for Stormwater and
Stream Crossings (Vol. Metropolitan Council). Portland US-OR.
Ministry of the Environment New Zealand. (2001). The value of connectivity.
Retrieved 5th November 2008, from
http://www.mfe.govt.nz/publications/urban/value-urban-design-summary-
jun05/html/page5.html
Nason, D. (2008). 'I made a mistake' admits Alan Greenspan. The Australian 25th
October 2008. Retrieved 21st November 2008 from
http://www.theaustralian.news.com.au/business/story/0,,24548000-
20142,00.html
Newman P., and Kenworthy J. (1999). Cities and Sustainability: Overcoming
automobile dependence. Washington D.C.: Island Press.
Pitot, M., Yigitcanlar, T., Sipe, N., & Evans, R. (2005). Land Use and Public
Transport Accessibility Index (LUPTAI) Tool- The development and pilot
application of LUPTAI for the Gold Coast. Gold Coast: Queensland Transport.
Queensland Government. (2005). South East Queensland Regional Plan 2005 -
2026. Retrieved 25th November 2008 from http://www.dip.qld.gov.au/seq.
Queensland Government. (2008a). Shaping Up. Retrieved 15th November 2008 from.
http://www.transport.qld.gov.au/resources/file/eb85c60cd9e2978/Pdf_shaping_up.pdf
Queensland Government. (2008b). Sustainability as defined by the Queensland
Government. Retrieved 18th March 2008, from.
http://www.epa.qld.gov.au/environmental_management/sustainability/
Queensland Government Office of Urban Management. (2005). South East
Queensland Regional Plan 2005 - 2026. Retrieved 3rd April 2008 from.
http://www.dip.qld.gov.au/regional-planning/regional-plan-s.html.
Robina Land Corporation. (1999). Robina Profile. Gold Coast: Gold Coast City
Council Local Studies Library.
RP DATA. (2007). Suburb profile Robina Qld 4226. Retrieved 2nd November 2007
from http://reareports.realestate.com.au/cgi-

104
bin/getmedia.cgi?system=photoupload&media=bne9-sv.rpdata.net.au:rea/pdf/REA-
Free-Suburb-Profile-54000515200711.pdf
Shed, P. (2008). Ped Shed walkable urban design and sustainable placemaking.
Retrieved 12th November 2008, from http://pedshed.net/?page_id=5
Shepherd, K. (2007). 15 Green Cities. Retrieved 28th November 2008, from
http://www.grist.org/news/maindish/2007/07/19/cities/
Smart Growth Online. (2007). Smart Growth Network. Retrieved 11th November
2008, from http://www.smartgrowth.org/sgn/default.asp
Stevenson J., Bauman A., Armstrong T., Smith B., and Bellew B. (2000). The costs
of illness attributable to physical inactivity in Australia. Canberra:
Commonwealth Department of Health and Aged Care.
Timeforchange.org. (2008). What is a carbon footprint - definition? Retrieved 20th
November 2008 from http://timeforchange.org/what-is-a-carbon-footprint-
definition
Thompson, S. (2007). Introduction to Planning Australia. In Susan Thompson (Ed.),
Planning Australia (First edition ed.). New York: Cambridge University Press.
Trentacoste, M. (1999). Pedestrian Safety in Australia. Retrieved 30th November
2008 from http://www.tfhrc.gov/safety/pedbike/pubs/99093.pdf.
Urban Design Alliance of Queensland (UDAL Qld). (2005). An Agenda for Urban
Quality in Queensland. Brisbane. UDAL Qld.
U.S. Transportation Research Board (2005). Does the built environment influence
physical activity? Washington D.C.: (TRB Special Report 282), prepared by
the Committee on Physical Activity, Health Transportation and Land use,
Transportation Research Board, Institute of Medicine of the National
Academies Transportation Research Board.