Embed Size (px)
Citation preview
The relationship between wave and geometrical optics modelsof coded aperture type x-ray phase contrast imaging systems
Peter R.T. Munro, Konstantin Ignatyev, Robert D. Speller, and Alessandro OlivoDepartment of Medical Physics and Bioengineering, University College London, Malet Place,Gower Street, London WC1E 6BT
AbstractX-ray phase contrast imaging is a very promising technique which may lead to significantadvancements in medical imaging. One of the impediments to the clinical implementation of thetechnique is the general requirement to have an x-ray source of high coherence. The radiationphysics group at UCL is currently developing an x-ray phase contrast imaging technique whichworks with laboratory x-ray sources. Validation of the system requires extensive modelling ofrelatively large samples of tissue. To aid this, we have undertaken a study of when geometricaloptics may be employed to model the system in order to avoid the need to perform acomputationally expensive wave optics calculation. In this paper, we derive the relationshipbetween the geometrical and wave optics model for our system imaging an infinite cylinder. Fromthis model we are able to draw conclusions regarding the general applicability of the geometricaloptics approximation.
1. IntroductionIt is hoped that x-ray Phase Contrast Imaging (XPCi) will provide a generationalimprovement in the effectiveness of mammography [1]. To our knowledge, the only in vivomammography program is in progress in Trieste, Italy, using the SYRMEP beam line [2].This program has provided mammograms of improved spatial resolution and detail visibilitycompared with conventional mammography. It cannot, however, be considered a viable toolfor clinical screening due to its reliance on a synchrotron source.
An alternative XPCi technique employing laboratory sources was suggested by Olivo et. al[3, 4] in 2007. This technique is known as coded aperture XPCi and has since been undercontinuous development within the radiation physics group at UCL (see references [5, 6, 3]for example). This technique has been demonstrated experimentally and validatedtheoretically in the aforementioned references. We are now building a pre-prototype codedaperture XPCi system in order to demonstrate the efficacy of the technique using in vitrohuman breast tissue samples. In order to design the system and verify the experiments, it isnecessary to model the entire imaging system, including the interaction of x-rays with tissue.The small refractive index contrast of tissue combined with the unpolarised x-ray sourcemean that a full electromagnetic calculation for the scattered x-rays can be avoided.Furthermore, the short wavelength of x-rays relative to typical cell structure dimensionsmeans that a geometrical optics model is often sufficient. This is important as a rigorous
© 2010 Optical Society of America
OCIS codes: (050.1960) Diffraction theory; (080.0080) Geometric optics; (110.7440) X-ray imaging; (340.7430) X-ray codedapertures.
Europe PMC Funders GroupAuthor ManuscriptOpt Express. Author manuscript; available in PMC 2013 May 03.
Published in final edited form as:Opt Express. 2010 March 1; 18(5): 4103–4117.
Europe PM
C Funders A
uthor Manuscripts
Europe PM
C Funders A
uthor Manuscripts

scalar calculation of the scattered field would require prohibitively large computationalresources. In this paper, we thus attempt to establish conditions under which a geometricaloptics approximation can be employed to model a coded aperture XPCi system.
As with models of other, related imaging systems [7, 8, 9, 10, 11], we consider phase objectswhose optical thickness is at least piece-wise smooth. Work was done by Peterzol et. al [12]to determine the limits of validity of the geometrical optics approximation for free spacepropagation type XPCi systems. Such an analysis has not been performed for coded apertureXPCi systems. The link between geometrical and wave optics is by no means a new area ofresearch. Keller [13] was the first to show that geometrical optics need not be limited tomodelling objects with smoothly varying refractive index. He showed that geometricaloptics is an approximation to wave optics which can be made more accurate by the inclusionof higher order terms. A good account of this technique is given by James [14]. In this paperwe calculate higher order terms to show how the geometrical optics and wave opticssolutions vary in predicting coded aperture XPCi images. The paper is arranged as follows.We first present the wave optics model and show how it can be implemented efficiently. Wethen derive the geometric optics model before showing how a source of finite width can beintroduced into the system. We then apply the developed theory to the particular example ofan infinite cylinder. By employing the stationary phase approximation to the diffractionintegrals which result from the wave optics model, we derive the geometrical optics model,thus showing how the two models are related. Finally we show some numerical examplesand show conditions under which the geometrical optics model may be accuratelyemployed.
2. Wave optics modelWe consider first the wave optics model of the imaging system depicted in Fig. 1. Normallya sample would be placed on the detector side of the sample apertures however we initiallyconsider the sample free case. Following the method employed by Olivo and Speller [16] weuse Fresnel-Kirchhoff diffraction theory to calculate the field incident upon the detectorapertures. We consider initially a single point source at position (xs,0, −zso) emitting aspherical wave at wavelength λ. Previous experiments have shown [16] that modelling thesystem at the source’s average energy gives a good prediction of the image. The assumptionof a point source will be relaxed later. Assuming the exp(−iωt) sign convention, the field atposition P = (x,y,zod) may be given by [16]:
(1)
where
(2)
and represents the transmitting regions of the sample apertures. In addition, x, ξ and z aredefined in Fig. 1 and (ξ,ψ,z) and (x,y,z) form right handed coordinate systems. Theintegration over ψ can be performed by noting that the apertures have no dependence uponψ. We must thus evaluate:
(3)
Munro et al. Page 2
Opt Express. Author manuscript; available in PMC 2013 May 03.
Europe PM
C Funders A
uthor Manuscripts
Europe PM
C Funders A
uthor Manuscripts

evaluating this integral with limits at +∞ contradicts the Fresnel approximation used toobtain Eq. (1) and should be solved using the theory of distributions [15]. This problem canhowever be avoided by noting that the kernel of the integral in Eq. (3) is a rapidly oscillatingfunction which lends itself to asymptotic evaluation by the method of stationary phase.According to the method of stationary phase [14, Pgs. 29-34], an integral of the form:
(4)
where g(x) has a single first order stationary point, x0, such that g′ (x0) = 0, g′′ (x0) ≠ 0, canbe approximated as:
(5)
in the limit of large k. Applying this approximation to Eq. (3) we find that
(6)
the role of this term is to ensure energy conservation and give the incident field the correctphase relationship with y. This result is also obtainable using Fourier theory applied todistributions [15] which reveals that Eq. (6) is in fact the solution to Eq. (3) [17]. Thisenables us to write Eq. (1) as:
(7)
where we now introduce the periodic function T(ξ) to represent the transmission function ofthe sample aperture. It is now easy to include the effect of a phase object with phasefunction ϕ (ξ) by following an approach similar to that of Arfelli et. al [18]. The total field atthe detector apertures may be found according to:
(8)
where is the extent of the object.
3. Efficient evaluation of wave optics fieldWe now turn our attention to how the expression in Eq. (7) may be efficiently evaluated. AsT(ξ) is a periodic function with period L, it can be represented as a complex Fourier serieswritten in general as:
(9)
which upon substitution into Eq. (7) yields
(10)
Munro et al. Page 3
Opt Express. Author manuscript; available in PMC 2013 May 03.
Europe PM
C Funders A
uthor Manuscripts
Europe PM
C Funders A
uthor Manuscripts

As also suggested by Engelhardt et. al [10], the Fast Fourier Transform (FFT) can be used toefficiently evaluate this expression. In particular, starting with the definition of the discreteFourier transform [19]:
(11)
by allowing x′zso/(zso + zod) to take on values κL/(2N) the summation in Eq. (10) may beevaluated, for a finite number of terms, by constructing a vector of the form:
(12)
where
(13)
and finally taking the Fourier transform of the vector in Eq. (12). Noting also that thecoefficients Cn may also be evaluated using the FFT, Eq. (10) may be evaluated veryefficiently.
The second term in Eq. (8) must, in general, be evaluated numerically unless the object has aphase function permitting analytic evaluation. It was found that Gaussian Quadratureintegration [19] provided accurate results.
4. Geometrical optics modelOlivo and Speller [6, 20] have previously used geometrical optics to model the codedaperture XPCi system. Their approach used a “forward” technique where photons emitted bythe source were traced through the system. Photons could be blocked by an aperture,refracted by a sample or both. The number of photons reaching a particular pixel representthe signal detected by that pixel. We now consider the ray optics approach in a more formalmanner in order to relate it to the wave optics approach. For the remainder of this section weconsider only non-trivial rays which are transmitted by the sample aperture. We considerhere a first order geometrical optics. It has been shown by Keller [13] and later by James[14] that geometrical optics may be extended to include higher order terms which representwhat is usually termed diffraction. Here we consider only the first order terms of thegeometrical optics approximation. The trajectory of a light ray is described by theexpression [21]:
(14)
where r is the position vector of a point on the ray, s the length of the ray, n the refractiveindex of the medium and defines a wave front of constant phase, ie, . It isevident from this that we assume rays are deflected in the ξ direction only. Consider a phaseobject as depicted in Fig. 2. We define the phase function, ϕ (ξ), as
(15)
Munro et al. Page 4
Opt Express. Author manuscript; available in PMC 2013 May 03.
Europe PM
C Funders A
uthor Manuscripts
Europe PM
C Funders A
uthor Manuscripts

where n(ξ,z) is the refractive index at position (ξ,z) and we have assumed that rays makeonly small angles, θi, with the z-axis. The angle by which the ray is deflected in then givenby:
(16)
With reference to Fig. 1, we can say that a ray emitted at angle θi to the z-axis will interceptthe ξ-axis at position ξ = zso tan(θi) and, if deflected by an object, will intercept the x-axis atposition
(17)
The phase of the ray at the detector apertures is calculated by taking into account the phaseintroduced by the object and the distance travelled in free space according to the Fresnelapproximation. The amplitude of the ray must be such that energy is conserved. Inparticular, the time average power propagating in a small pencil of rays emanating from thesource must remain constant. The ratio between ray amplitudes at z = zod and z = 0 is thusgiven by:
(18)
5. Modelling a finite size sourceSecs. (2)-(4) show how to calculate the field incident upon the detector apertures. Thedetected signal is found by integrating the intensity of x-rays transmitted by the detectorapertures and incident upon a particular pixel. In general, the pth transmitting region of thedetector apertures is given by [pLM − LM/4+dL, pLM +LM/4+dL] where dL is thedisplacement of the detector apertures relative to the projection of the sample apertures asshown in Fig. 1 and M = (zod + zso)/zso is the system magnification. We assume that thepixels are aligned as shown in Fig. 1 such that a single pixel entirely covers a singletransmitting region of the detector apertures. Before calculating the signal detected by eachpixel, we introduce a source of finite size in the x̄ direction. The brightness is described byP(x̄) which we will take to have a Gaussian profile. We can then take the signal of the pthpixel to be given by:
(19)
where, for mathematical convenience we have assumed that the source brightness profilelimits the effective source size rather than the limits of integration. By making thesubstitution P(x̄) = exp(−(x̄/σ)2), Eq. (19) may be expressed as:
(20)
where
(21)
and erf(z) is the error function
Munro et al. Page 5
Opt Express. Author manuscript; available in PMC 2013 May 03.
Europe PM
C Funders A
uthor Manuscripts
Europe PM
C Funders A
uthor Manuscripts
(22)
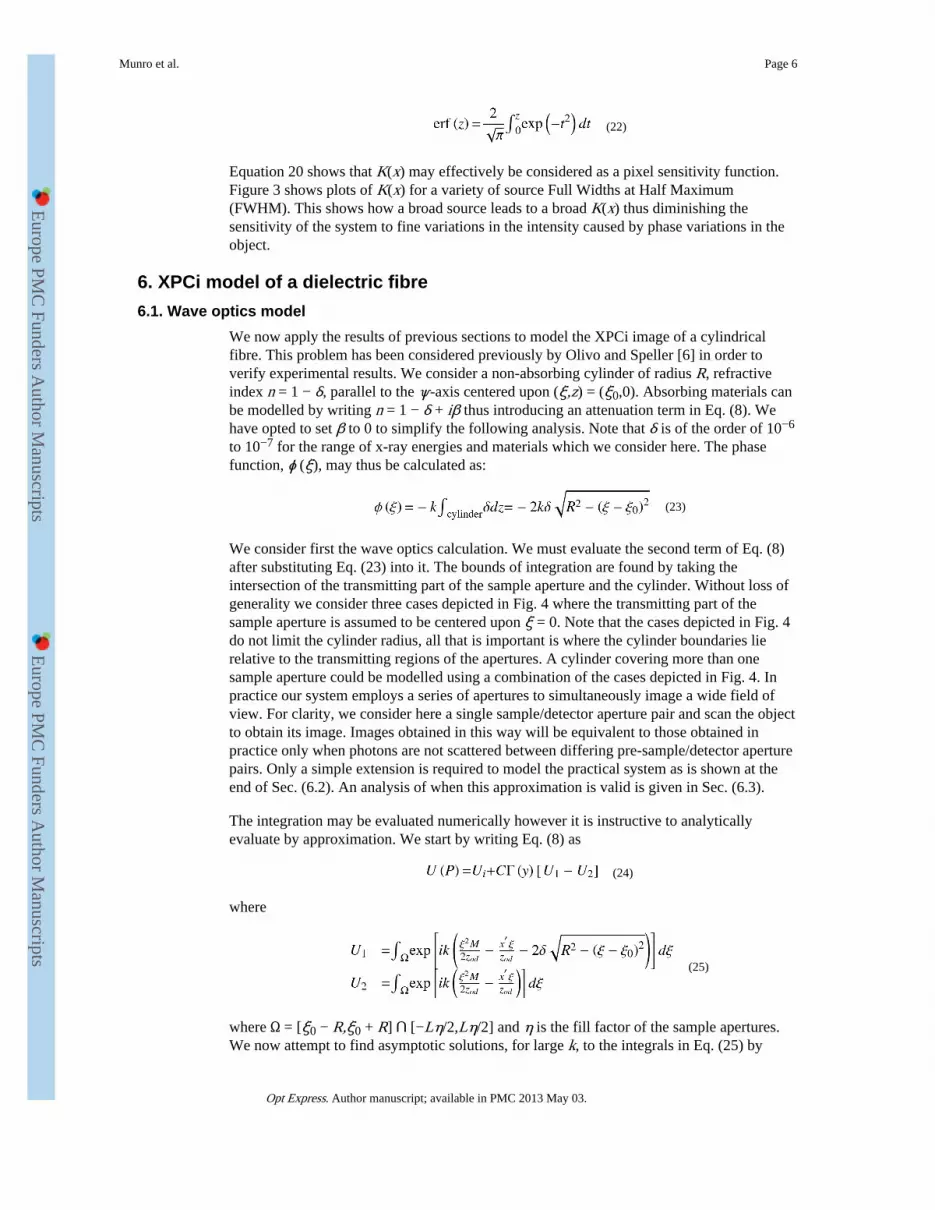
Equation 20 shows that K(x) may effectively be considered as a pixel sensitivity function.Figure 3 shows plots of K(x) for a variety of source Full Widths at Half Maximum(FWHM). This shows how a broad source leads to a broad K(x) thus diminishing thesensitivity of the system to fine variations in the intensity caused by phase variations in theobject.
6. XPCi model of a dielectric fibre6.1. Wave optics model
We now apply the results of previous sections to model the XPCi image of a cylindricalfibre. This problem has been considered previously by Olivo and Speller [6] in order toverify experimental results. We consider a non-absorbing cylinder of radius R, refractiveindex n = 1 − δ, parallel to the ψ-axis centered upon (ξ,z) = (ξ0,0). Absorbing materials canbe modelled by writing n = 1 − δ + iβ thus introducing an attenuation term in Eq. (8). Wehave opted to set β to 0 to simplify the following analysis. Note that δ is of the order of 10−6
to 10−7 for the range of x-ray energies and materials which we consider here. The phasefunction, ϕ (ξ), may thus be calculated as:
(23)
We consider first the wave optics calculation. We must evaluate the second term of Eq. (8)after substituting Eq. (23) into it. The bounds of integration are found by taking theintersection of the transmitting part of the sample aperture and the cylinder. Without loss ofgenerality we consider three cases depicted in Fig. 4 where the transmitting part of thesample aperture is assumed to be centered upon ξ = 0. Note that the cases depicted in Fig. 4do not limit the cylinder radius, all that is important is where the cylinder boundaries lierelative to the transmitting regions of the apertures. A cylinder covering more than onesample aperture could be modelled using a combination of the cases depicted in Fig. 4. Inpractice our system employs a series of apertures to simultaneously image a wide field ofview. For clarity, we consider here a single sample/detector aperture pair and scan the objectto obtain its image. Images obtained in this way will be equivalent to those obtained inpractice only when photons are not scattered between differing pre-sample/detector aperturepairs. Only a simple extension is required to model the practical system as is shown at theend of Sec. (6.2). An analysis of when this approximation is valid is given in Sec. (6.3).
The integration may be evaluated numerically however it is instructive to analyticallyevaluate by approximation. We start by writing Eq. (8) as
(24)
where
(25)
where Ω = [ξ0 − R,ξ0 + R] ∩ [−Lη/2,Lη/2] and η is the fill factor of the sample apertures.We now attempt to find asymptotic solutions, for large k, to the integrals in Eq. (25) by
Munro et al. Page 6
Opt Express. Author manuscript; available in PMC 2013 May 03.
Europe PM
C Funders A
uthor Manuscripts
Europe PM
C Funders A
uthor Manuscripts
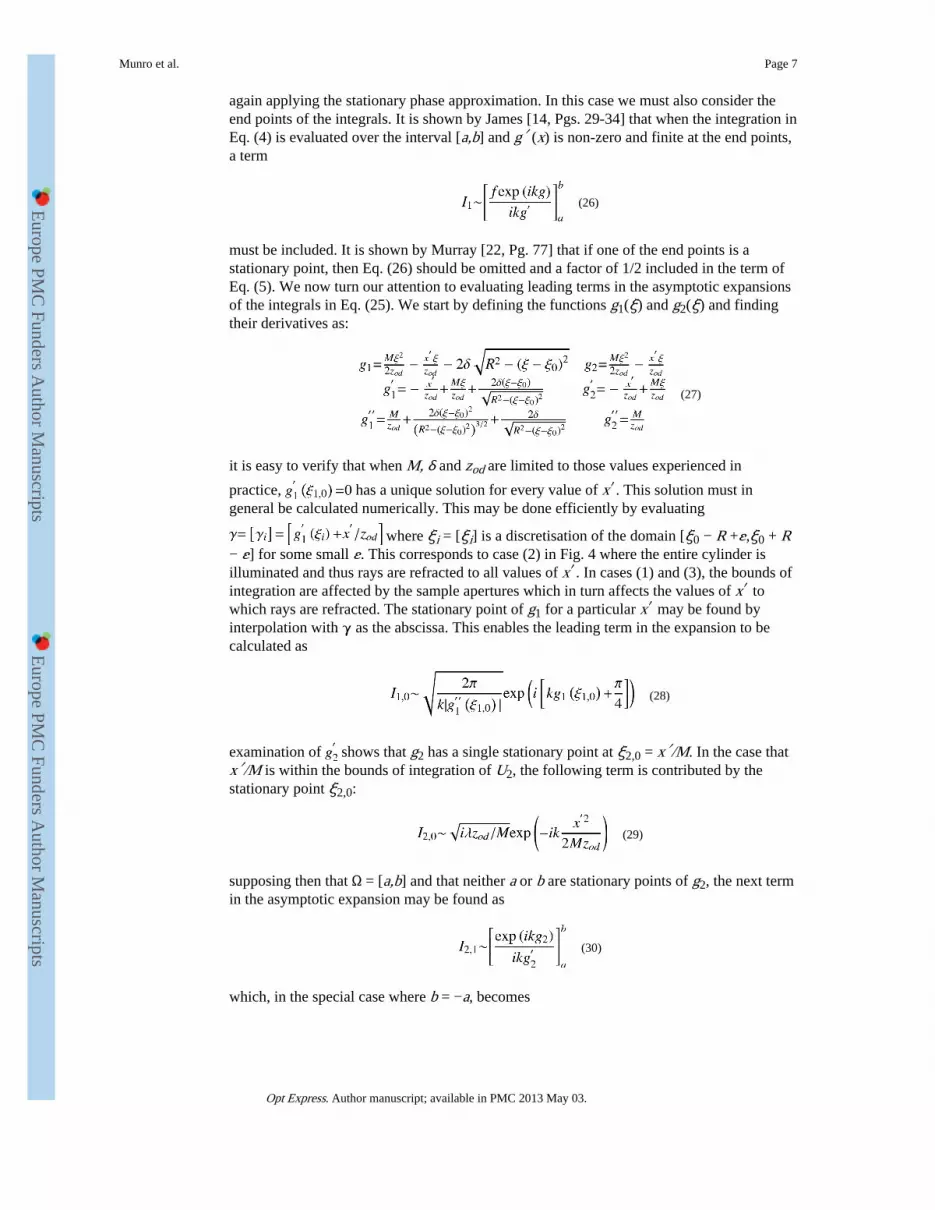
again applying the stationary phase approximation. In this case we must also consider theend points of the integrals. It is shown by James [14, Pgs. 29-34] that when the integration inEq. (4) is evaluated over the interval [a,b] and g′ (x) is non-zero and finite at the end points,a term
(26)
must be included. It is shown by Murray [22, Pg. 77] that if one of the end points is astationary point, then Eq. (26) should be omitted and a factor of 1/2 included in the term ofEq. (5). We now turn our attention to evaluating leading terms in the asymptotic expansionsof the integrals in Eq. (25). We start by defining the functions g1(ξ) and g2(ξ) and findingtheir derivatives as:
(27)
it is easy to verify that when M, δ and zod are limited to those values experienced in
practice, has a unique solution for every value of x′. This solution must ingeneral be calculated numerically. This may be done efficiently by evaluating
where ξi = [ξi] is a discretisation of the domain [ξ0 − R +ε,ξ0 + R− ε] for some small ε. This corresponds to case (2) in Fig. 4 where the entire cylinder isilluminated and thus rays are refracted to all values of x′. In cases (1) and (3), the bounds ofintegration are affected by the sample apertures which in turn affects the values of x′ towhich rays are refracted. The stationary point of g1 for a particular x′ may be found byinterpolation with γ as the abscissa. This enables the leading term in the expansion to becalculated as
(28)
examination of shows that g2 has a single stationary point at ξ2,0 = x′/M. In the case thatx′/M is within the bounds of integration of U2, the following term is contributed by thestationary point ξ2,0:
(29)
supposing then that Ω = [a,b] and that neither a or b are stationary points of g2, the next termin the asymptotic expansion may be found as
(30)
which, in the special case where b = −a, becomes
Munro et al. Page 7
Opt Express. Author manuscript; available in PMC 2013 May 03.
Europe PM
C Funders A
uthor Manuscripts
Europe PM
C Funders A
uthor Manuscripts
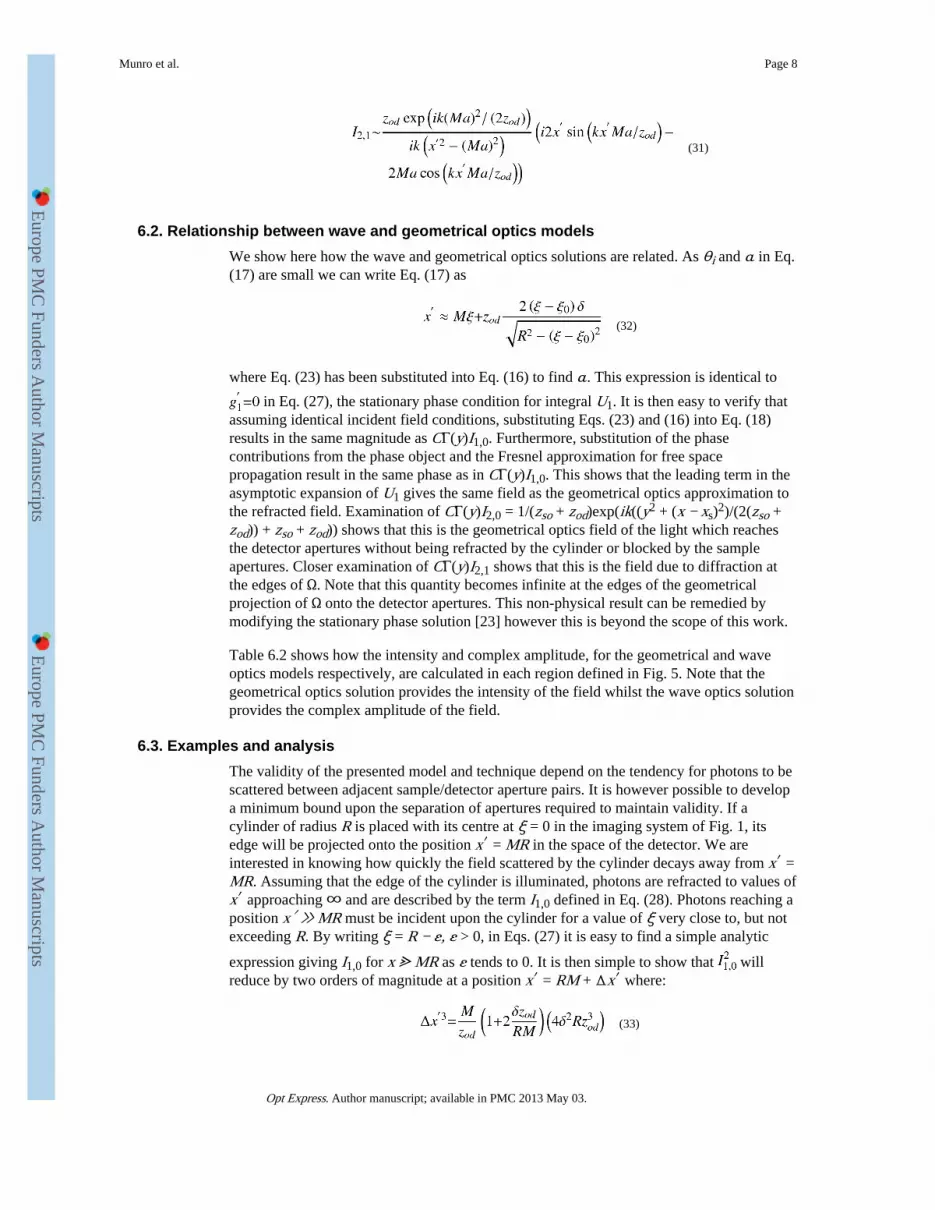
(31)
6.2. Relationship between wave and geometrical optics modelsWe show here how the wave and geometrical optics solutions are related. As θi and α in Eq.(17) are small we can write Eq. (17) as
(32)
where Eq. (23) has been substituted into Eq. (16) to find α. This expression is identical to
in Eq. (27), the stationary phase condition for integral U1. It is then easy to verify thatassuming identical incident field conditions, substituting Eqs. (23) and (16) into Eq. (18)results in the same magnitude as CΓ(y)I1,0. Furthermore, substitution of the phasecontributions from the phase object and the Fresnel approximation for free spacepropagation result in the same phase as in CΓ(y)I1,0. This shows that the leading term in theasymptotic expansion of U1 gives the same field as the geometrical optics approximation tothe refracted field. Examination of CΓ(y)I2,0 = 1/(zso + zod)exp(ik((y2 + (x − xs)2)/(2(zso +zod)) + zso + zod)) shows that this is the geometrical optics field of the light which reachesthe detector apertures without being refracted by the cylinder or blocked by the sampleapertures. Closer examination of CΓ(y)I2,1 shows that this is the field due to diffraction atthe edges of Ω. Note that this quantity becomes infinite at the edges of the geometricalprojection of Ω onto the detector apertures. This non-physical result can be remedied bymodifying the stationary phase solution [23] however this is beyond the scope of this work.
Table 6.2 shows how the intensity and complex amplitude, for the geometrical and waveoptics models respectively, are calculated in each region defined in Fig. 5. Note that thegeometrical optics solution provides the intensity of the field whilst the wave optics solutionprovides the complex amplitude of the field.
6.3. Examples and analysisThe validity of the presented model and technique depend on the tendency for photons to bescattered between adjacent sample/detector aperture pairs. It is however possible to developa minimum bound upon the separation of apertures required to maintain validity. If acylinder of radius R is placed with its centre at ξ = 0 in the imaging system of Fig. 1, itsedge will be projected onto the position x′ = MR in the space of the detector. We areinterested in knowing how quickly the field scattered by the cylinder decays away from x′ =MR. Assuming that the edge of the cylinder is illuminated, photons are refracted to values ofx′ approaching ∞ and are described by the term I1,0 defined in Eq. (28). Photons reaching aposition x′ ≫ MR must be incident upon the cylinder for a value of ξ very close to, but notexceeding R. By writing ξ = R − ε, ε > 0, in Eqs. (27) it is easy to find a simple analytic
expression giving I1,0 for x ⪢ MR as ε tends to 0. It is then simple to show that willreduce by two orders of magnitude at a position x′ = RM + Δx′ where:
(33)
Munro et al. Page 8
Opt Express. Author manuscript; available in PMC 2013 May 03.
Europe PM
C Funders A
uthor Manuscripts
Europe PM
C Funders A
uthor Manuscripts
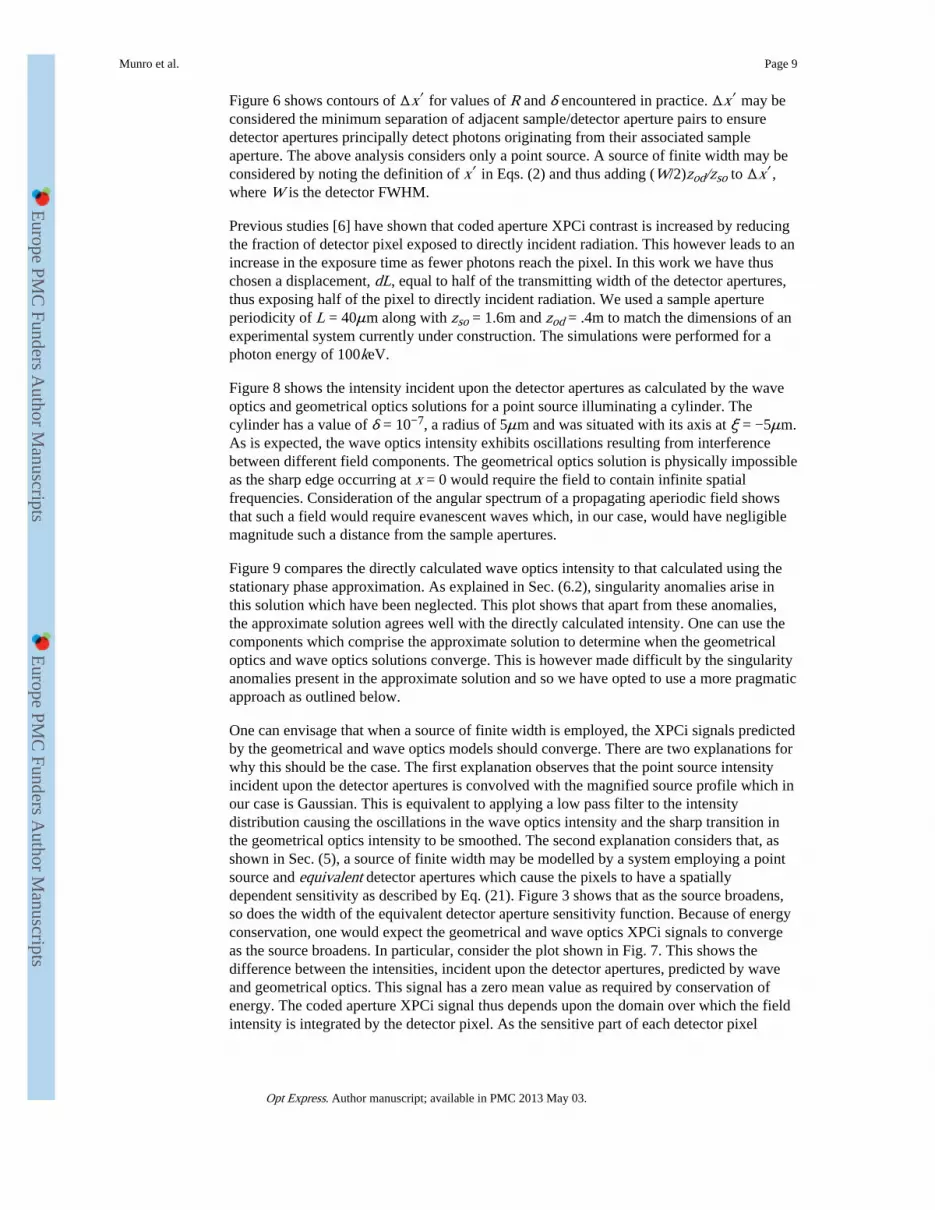
Figure 6 shows contours of Δx′ for values of R and δ encountered in practice. Δx′ may beconsidered the minimum separation of adjacent sample/detector aperture pairs to ensuredetector apertures principally detect photons originating from their associated sampleaperture. The above analysis considers only a point source. A source of finite width may beconsidered by noting the definition of x′ in Eqs. (2) and thus adding (W/2)zod/zso to Δx′,where W is the detector FWHM.
Previous studies [6] have shown that coded aperture XPCi contrast is increased by reducingthe fraction of detector pixel exposed to directly incident radiation. This however leads to anincrease in the exposure time as fewer photons reach the pixel. In this work we have thuschosen a displacement, dL, equal to half of the transmitting width of the detector apertures,thus exposing half of the pixel to directly incident radiation. We used a sample apertureperiodicity of L = 40μm along with zso = 1.6m and zod = .4m to match the dimensions of anexperimental system currently under construction. The simulations were performed for aphoton energy of 100keV.
Figure 8 shows the intensity incident upon the detector apertures as calculated by the waveoptics and geometrical optics solutions for a point source illuminating a cylinder. Thecylinder has a value of δ = 10−7, a radius of 5μm and was situated with its axis at ξ = −5μm.As is expected, the wave optics intensity exhibits oscillations resulting from interferencebetween different field components. The geometrical optics solution is physically impossibleas the sharp edge occurring at x = 0 would require the field to contain infinite spatialfrequencies. Consideration of the angular spectrum of a propagating aperiodic field showsthat such a field would require evanescent waves which, in our case, would have negligiblemagnitude such a distance from the sample apertures.
Figure 9 compares the directly calculated wave optics intensity to that calculated using thestationary phase approximation. As explained in Sec. (6.2), singularity anomalies arise inthis solution which have been neglected. This plot shows that apart from these anomalies,the approximate solution agrees well with the directly calculated intensity. One can use thecomponents which comprise the approximate solution to determine when the geometricaloptics and wave optics solutions converge. This is however made difficult by the singularityanomalies present in the approximate solution and so we have opted to use a more pragmaticapproach as outlined below.
One can envisage that when a source of finite width is employed, the XPCi signals predictedby the geometrical and wave optics models should converge. There are two explanations forwhy this should be the case. The first explanation observes that the point source intensityincident upon the detector apertures is convolved with the magnified source profile which inour case is Gaussian. This is equivalent to applying a low pass filter to the intensitydistribution causing the oscillations in the wave optics intensity and the sharp transition inthe geometrical optics intensity to be smoothed. The second explanation considers that, asshown in Sec. (5), a source of finite width may be modelled by a system employing a pointsource and equivalent detector apertures which cause the pixels to have a spatiallydependent sensitivity as described by Eq. (21). Figure 3 shows that as the source broadens,so does the width of the equivalent detector aperture sensitivity function. Because of energyconservation, one would expect the geometrical and wave optics XPCi signals to convergeas the source broadens. In particular, consider the plot shown in Fig. 7. This shows thedifference between the intensities, incident upon the detector apertures, predicted by waveand geometrical optics. This signal has a zero mean value as required by conservation ofenergy. The coded aperture XPCi signal thus depends upon the domain over which the fieldintensity is integrated by the detector pixel. As the sensitive part of each detector pixel
Munro et al. Page 9
Opt Express. Author manuscript; available in PMC 2013 May 03.
Europe PM
C Funders A
uthor Manuscripts
Europe PM
C Funders A
uthor Manuscripts

increases, or equivalently, as the source broadens, the geometrical and wave optics signalsthus tend to converge.
Previous studies [6] have shown that the maximum XPCi signal for a cylindrical objectusing the system described in this section occurs when the cylinder is positioned atapproximately ξ0 = −R. This is demonstrated in Fig. 10 where wave and geometrical opticssignal traces have been plotted for a cylinder of radius 5μm and δ = 10−6. The signals havebeen normalised by the signal for the object free case. These plots demonstrate how thesignal traces converge as the FWHM of the source increases. It also shows how the peak ofeach trace is in the vicinity of ξ0 = −R, as expected. Simulations run over a range of radii,values of δ and source FWHM show that the peak of the signal trace does indeed occur inthe region of ξ0 = R. This is suggests a good way of assessing the difference between thewave and geometrical optics XPCi signals as the two signals are likely to vary most at the
peak. We thus calculate an error term, ε(−R), where , andIWO(ξ0) and IGO(ξ0) are the XPCi signals for the geometrical and wave optics (full
expression evaluated numerically) cases respectively, for a cylinder at position ξ0. and
are the object free XPCi signals for the geometrical and wave optics cases respectively.
Before proceeding to calculate ε it is useful to note that some approximations can providefurther insight into the problem. In the case of ξ0 = −R, g1 in Eq. (27) can be well
approximated by for x′ > −MR, but not too close to −MR. This
approximate form leads to a solution of for the stationary point of g1.
Substitution of ξ1,0 back into the approximate forms of g1 and show that both of thesefunctions have a dependence upon δ2R rather than each of these independently. Thissuggests that it is reasonable to expect ε for a particular source FWHM to be constant forconstant values of δ2R. This is indeed the case as was verified by a large number ofsimulations, a small selection of which are shown in Fig. 11. This significantly simplifies thetask of determining the source size for which the geometrical and wave optics signalsconverge. Figure 12 is a contour plot of ε as a function of source FWHM and δ2R. Theimportant conclusion which we can draw from this is that for our particular choice of zodand zso, as we expect a source to have a FWHM of around 50μm, the geometrical opticsmodel will provide results consistent with those of the wave optics model. This result willmake it feasible to model much larger objects.
7. ConclusionsIn this paper we have outlined the two most widely used techniques for modelling XPCisystems: wave and geometrical optics. We have used the theory developed to model theimage of an infinite cylinder in a coded aperture XPCi system. This problem has practicalsignificance as it can be tested experimentally. For this particular problem, we show how thegeometric and wave optics models are related. we then show how this theory can be used todevelop a guide for when the two techniques can be trusted to give consistent results.
AcknowledgmentsWe would like to thank Dr Elizabeth Skelton, Imperial College London, for correcting our implementation of thestationary phase approximation.
This work was supported by the Wellcome Trust (085856/Z/08/Z). A. Olivo is supported by a Career AccelerationFellowship awarded by the UK Engineering and Physical Sciences Research Council (EP/G004250/1).
Munro et al. Page 10
Opt Express. Author manuscript; available in PMC 2013 May 03.
Europe PM
C Funders A
uthor Manuscripts
Europe PM
C Funders A
uthor Manuscripts

References and links1. Lewis R. Medical phase contrast x-ray imaging: current status and future prospects. Phys. Med.
Biol. 2004; 49(16):3573–3583. [PubMed: 15446788]
2. Castelli E, Arfelli F, Dreossi D, Longo R, Rokvic T, Cova M, Quaia E, Tonutti M, Zanconati F,Abrami A, Chenda V, Menk R, Quai E, Tromba G, Bregant P, de Guarrini F. Clinicalmammography at the SYRMEP beam line. Nucl. Instrum. Meth. A. 2007; 572(1):237–240.
3. Olivo A, Speller R. A coded-aperture technique allowing x-ray phase contrast imaging withconventional sources. Appl. Phys. Lett. 2007; 91(7):074–106.
4. Olivo, A.; Speller, R. Phase contrast imaging. International Patent WO/2008/029107. 2008.
5. Olivo A, Bohndiek SE, Griffiths JA, Konstantinidis A, Speller RD. A non-free-space propagation x-ray phase contrast imaging method sensitive to phase effects in two directions simultaneously.Appl. Phys. Lett. 2009; 94(4)
6. Olivo A, Speller R. Modelling of a novel x-ray phase contrast imaging technique based on codedapertures. Phys. Med. Biol. 2007; 52(22):6555–6573. [PubMed: 17975283]
7. Gureyev T, Wilkins S. On x-ray phase imaging with a point source. J. Opt. Soc. Am. A. 1998;15(3):579–585.
8. Pfeiffer F, Weitkamp T, Bunk O, David C. Phase retrieval and differential phase-contrast imagingwith low-brilliance X-ray sources. Nat. Phys. 2006; 2(4):258–261.
9. Engelhardt M, Baumann J, Schuster M, Kottler C, Pfeiffer F, Bunk O, David C. High-resolutiondifferential phase contrast imaging using a magnifying projection geometry with a microfocus x-raysource. Appl. Phys. Lett. 2007; 90(22):224101. pages 3.
10. Engelhardt M, Kottler C, Bunk o. David C, Schroer C, Baumann J, Schuster m. Pfeiffer F. Thefractional Talbot effect in differential x-ray phase-contrast imaging for extended andpolychromatic x-ray sources. J. Microsc. 2008; 232:145–157. [PubMed: 19017212]
11. Momose A, Kawamoto S, Koyama I, Hamaishi Y, Takai K, Suzuki Y. Demonstration of X-RayTalbot Interferometry. Jpn. J. Appl. Phys. 2. 2003; 42(Part 2, No. 7 B):L866–L868.
12. Peterzol A, Olivo A, Rigon L, Pani S, Dreossi D. The effects of the imaging system on the validitylimits of the ray-optical approach to phase contrast imaging. Med. Phys. 2005; 32(12):3617–3627.[PubMed: 16475760]
13. Keller JB. Geometrical Theory of Diffraction. J. Opt. Soc. Am. A. 1962; 52(2):116–130.
14. James, G. Geometrical theory of diffraction for electromagnetic waves. Peter Peregrinus Ltd.;1976.
15. Arsac, J. Fourier transforms and the theory of distributions. Prentice-Hall: 1966.
16. Olivo A, Speller R. Experimental validation of a simple model capable of predicting the phasecontrast imaging capabilities of any x-ray imaging system. Phys. Med. Biol. 2006; 51(12):3015–3030. [PubMed: 16757859]
17. Erdélyi, A., editor. Tables of integral transforms: based, in part, on notes left by Harry Batemanand compiled by the staff of the Bateman Manuscript Project. Vol. I. McGraw-Hill; New York;London: 1954.
18. Arfelli F, Assante M, Bonvicini V, Bravin A, Cantatore G, Castelli E, Dalla Palma L, Di MichielM, Longo R, Olivo A, Pani S, Pontoni D, Poropat P, Prest M, Rashevsky A, Tromba G, Vacchi A,Vallazza E, Zanconati F. Low-dose phase contrast x-ray medical imaging. Phys. Med. Biol. 1998;43(10):2845–2852. [PubMed: 9814522]
19. Arfken, G. Mathematical Methods for Physicists. 3rd ed.. Academic Press; Boston: 1985.
20. Olivo A, Speller R. Image formation principles in coded-aperture based x-ray phase contrastimaging. Phys. Med. Biol. 2008; 53(22):6461–6474. [PubMed: 18941282]
21. Born, M.; Wolf, E. Principles of Optics. seventh ed.. Cambridge University Press; Cambridge:1999.
22. Murray, J. Asymptotic analysis. Springer Verlag; 1984.
23. Buchal R, Keller J. Boundary layer problems in diffraction theory. Commun. Pur. Appl. Math.1960; 13:85–114.
Munro et al. Page 11
Opt Express. Author manuscript; available in PMC 2013 May 03.
Europe PM
C Funders A
uthor Manuscripts
Europe PM
C Funders A
uthor Manuscripts

Fig. 1.Schematic diagram of imaging system including reference frames used in the paper. Notethat (x̄,ȳ,z), (ξ,ψ,z) and (x,y,z) all form right handed coordinate systems. The imagingsystem is assumed to have no y dependence. Note that dL is defined by the displacementbetween the detector apertures and the projection of the sample apertures onto the detectorapertures.
Munro et al. Page 12
Opt Express. Author manuscript; available in PMC 2013 May 03.
Europe PM
C Funders A
uthor Manuscripts
Europe PM
C Funders A
uthor Manuscripts

Fig. 2.Diagram illustrating the phase function ϕ (ξ) of a phase object of extent zob in the zdirection.
Munro et al. Page 13
Opt Express. Author manuscript; available in PMC 2013 May 03.
Europe PM
C Funders A
uthor Manuscripts
Europe PM
C Funders A
uthor Manuscripts

Fig. 3.Plot of K(x) for some values of source FWHM, given in the legend in μm. Values of M =1.25 and L = 40μm were used.
Munro et al. Page 14
Opt Express. Author manuscript; available in PMC 2013 May 03.
Europe PM
C Funders A
uthor Manuscripts
Europe PM
C Funders A
uthor Manuscripts

Fig. 4.Three cases which must be considered in order to evaluate the integral in Eq. (8).
Munro et al. Page 15
Opt Express. Author manuscript; available in PMC 2013 May 03.
Europe PM
C Funders A
uthor Manuscripts
Europe PM
C Funders A
uthor Manuscripts

Fig. 5.Diagram illustrating the three regions which must be considered when analysing the fieldincident upon the detector apertures.
Munro et al. Page 16
Opt Express. Author manuscript; available in PMC 2013 May 03.
Europe PM
C Funders A
uthor Manuscripts
Europe PM
C Funders A
uthor Manuscripts

Fig. 6.Contours of Δx′ for a variety of values of R and δ. This diagram effectively shows theminimum separation required between adjacent sample/detector aperture pairs to ensuredetector apertures principally detect photons originating from their associated sampleaperture.
Munro et al. Page 17
Opt Express. Author manuscript; available in PMC 2013 May 03.
Europe PM
C Funders A
uthor Manuscripts
Europe PM
C Funders A
uthor Manuscripts
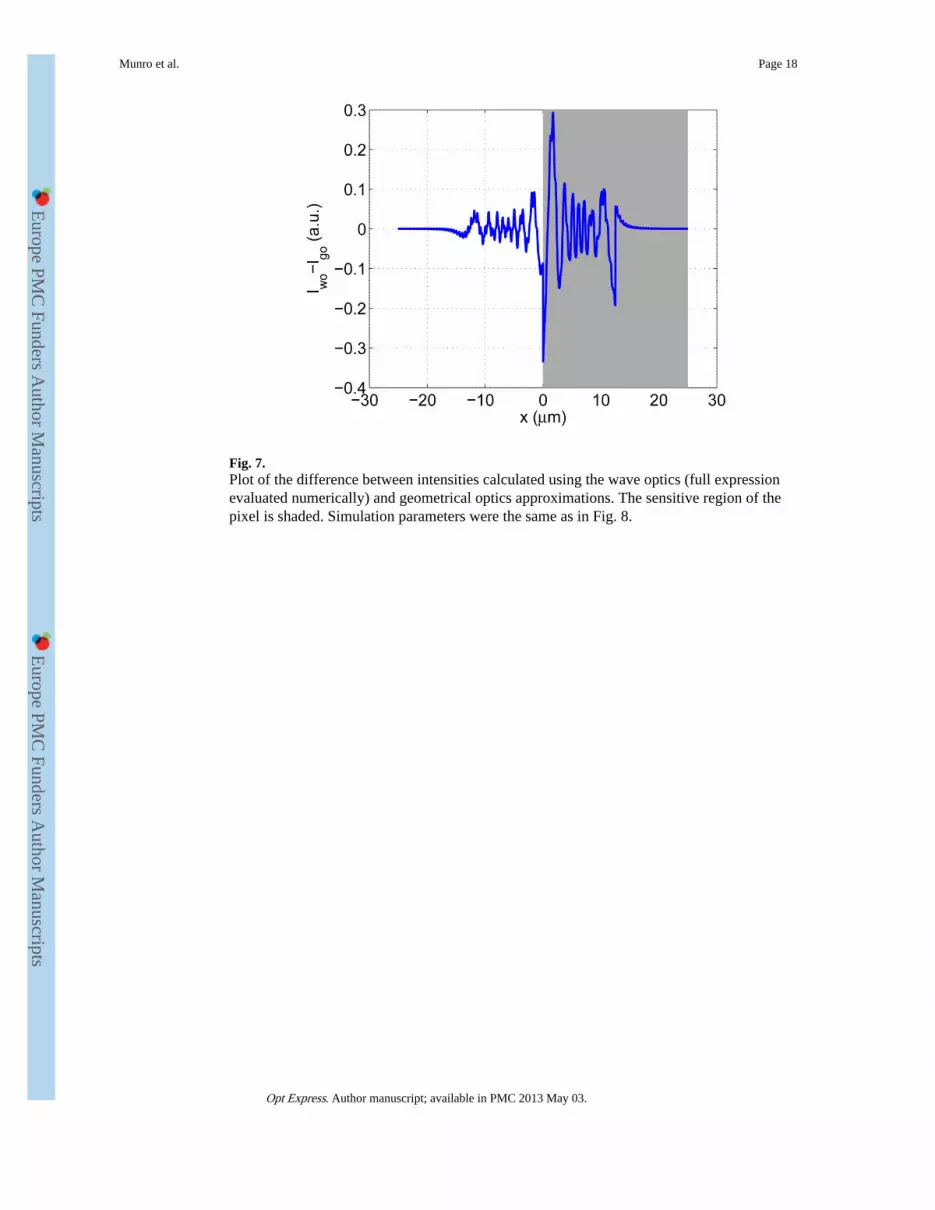
Fig. 7.Plot of the difference between intensities calculated using the wave optics (full expressionevaluated numerically) and geometrical optics approximations. The sensitive region of thepixel is shaded. Simulation parameters were the same as in Fig. 8.
Munro et al. Page 18
Opt Express. Author manuscript; available in PMC 2013 May 03.
Europe PM
C Funders A
uthor Manuscripts
Europe PM
C Funders A
uthor Manuscripts
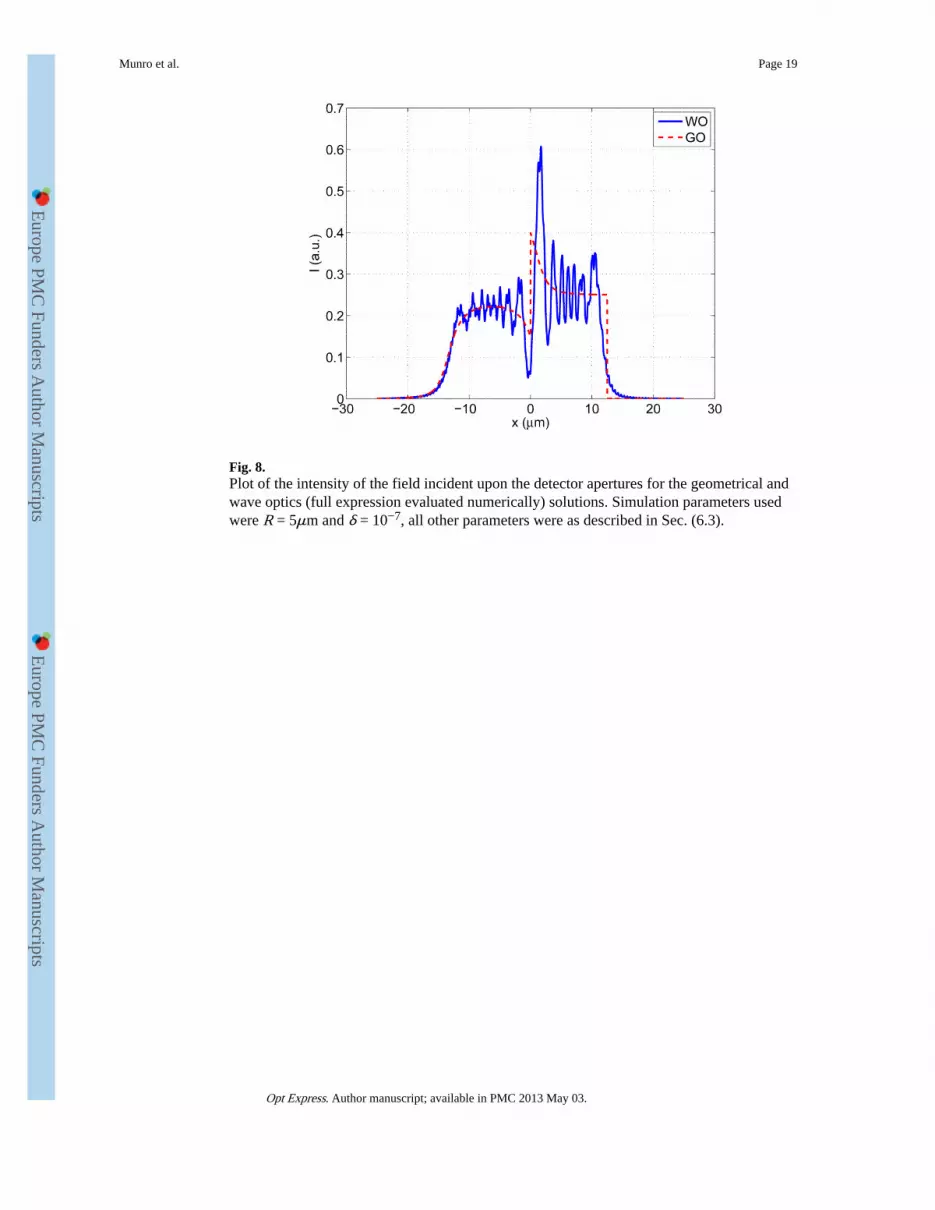
Fig. 8.Plot of the intensity of the field incident upon the detector apertures for the geometrical andwave optics (full expression evaluated numerically) solutions. Simulation parameters usedwere R = 5μm and δ = 10−7, all other parameters were as described in Sec. (6.3).
Munro et al. Page 19
Opt Express. Author manuscript; available in PMC 2013 May 03.
Europe PM
C Funders A
uthor Manuscripts
Europe PM
C Funders A
uthor Manuscripts
Fig. 9.Plot of the intensity of the field incident upon the detector apertures as calculated using theexact and approximate wave optics formulations. Simulation parameters were the same as inFig. 8.
Munro et al. Page 20
Opt Express. Author manuscript; available in PMC 2013 May 03.
Europe PM
C Funders A
uthor Manuscripts
Europe PM
C Funders A
uthor Manuscripts
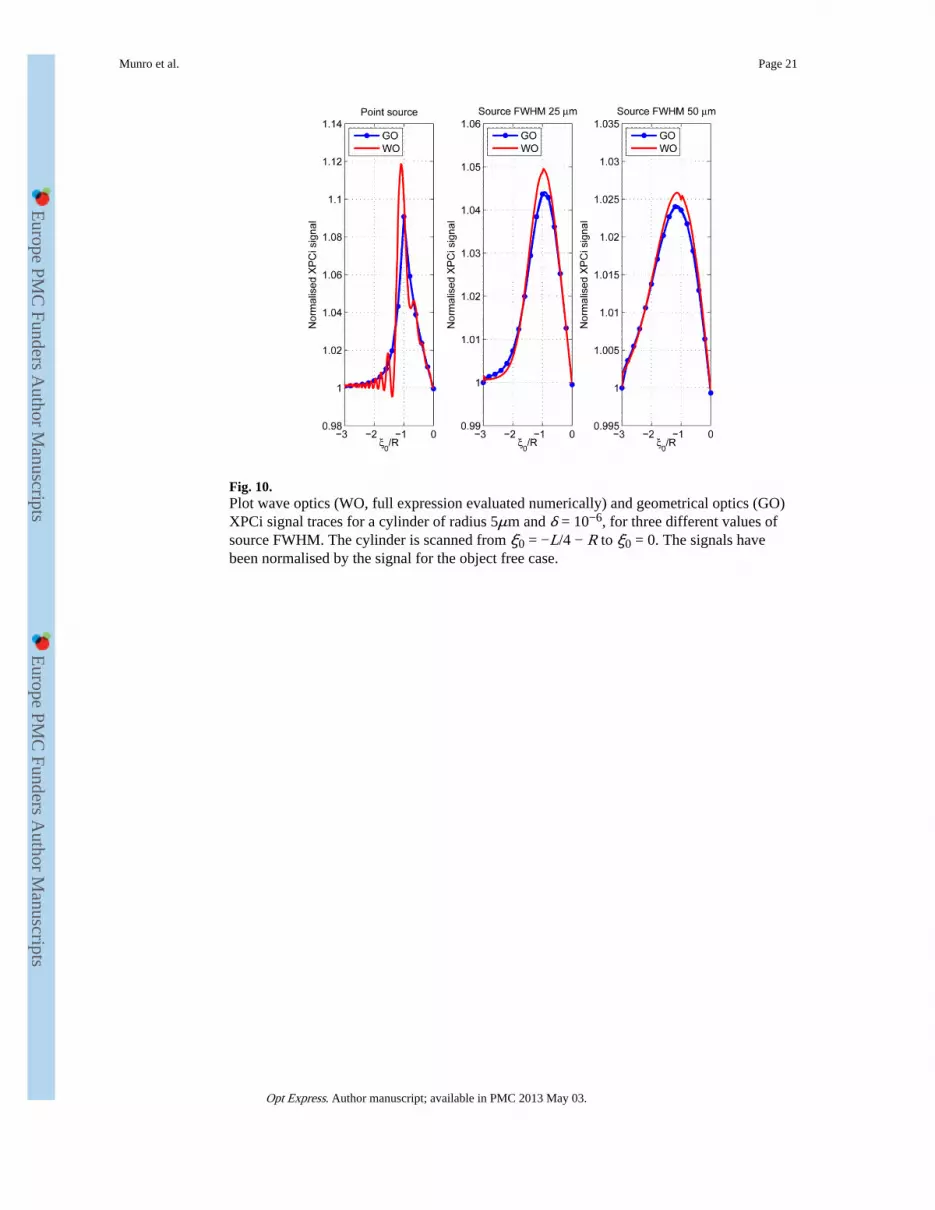
Fig. 10.Plot wave optics (WO, full expression evaluated numerically) and geometrical optics (GO)XPCi signal traces for a cylinder of radius 5μm and δ = 10−6, for three different values ofsource FWHM. The cylinder is scanned from ξ0 = −L/4 − R to ξ0 = 0. The signals havebeen normalised by the signal for the object free case.
Munro et al. Page 21
Opt Express. Author manuscript; available in PMC 2013 May 03.
Europe PM
C Funders A
uthor Manuscripts
Europe PM
C Funders A
uthor Manuscripts

Fig. 11.Plots of ε against δ2R for three different values of δ and a point source (left) and a source ofFWHM 50μm.
Munro et al. Page 22
Opt Express. Author manuscript; available in PMC 2013 May 03.
Europe PM
C Funders A
uthor Manuscripts
Europe PM
C Funders A
uthor Manuscripts
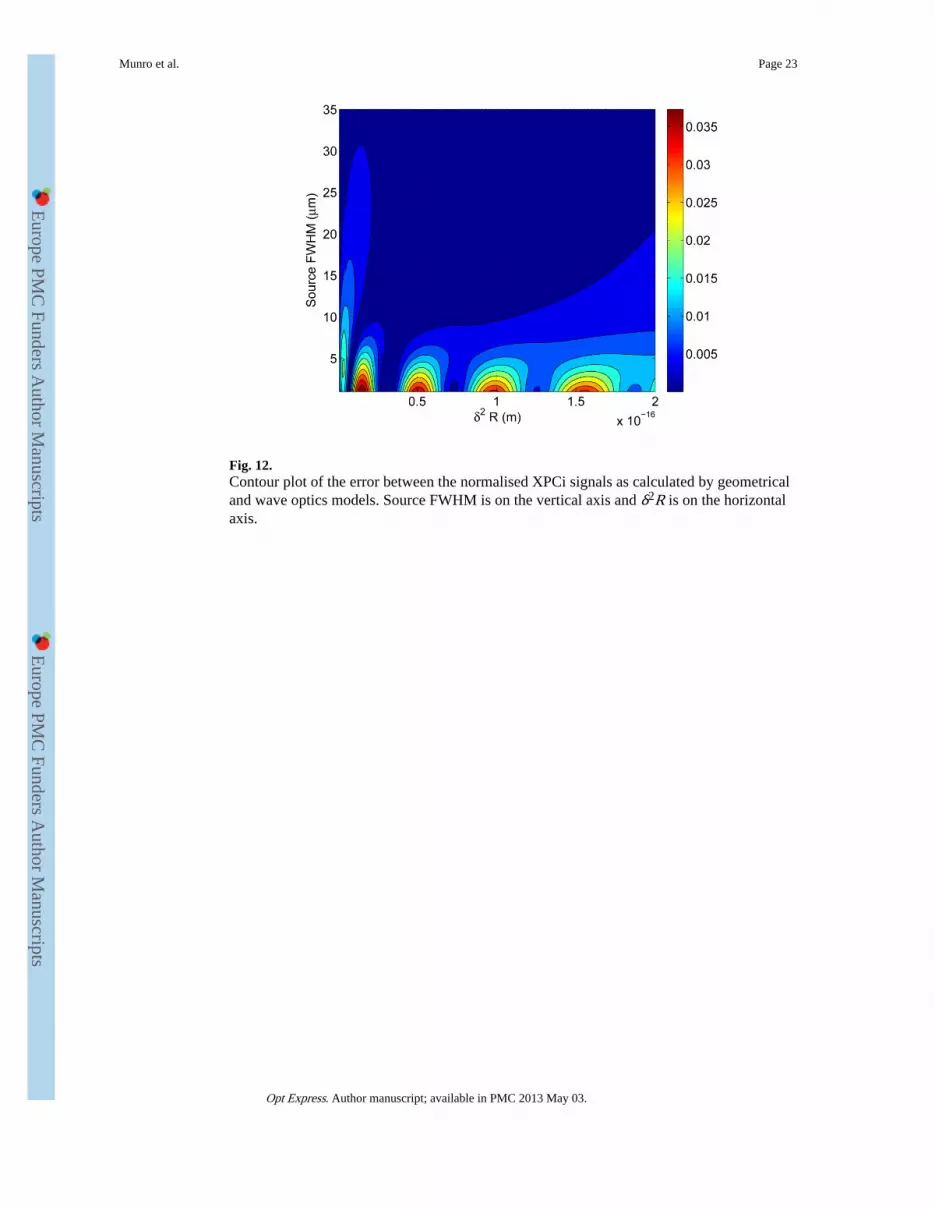
Fig. 12.Contour plot of the error between the normalised XPCi signals as calculated by geometricaland wave optics models. Source FWHM is on the vertical axis and δ2R is on the horizontalaxis.
Munro et al. Page 23
Opt Express. Author manuscript; available in PMC 2013 May 03.
Europe PM
C Funders A
uthor Manuscripts
Europe PM
C Funders A
uthor Manuscripts

Europe PM
C Funders A
uthor Manuscripts
Europe PM
C Funders A
uthor Manuscripts
Munro et al. Page 24
Table 1
Summary of components contributing to the field and intensity in the different regions for the case of waveand geometrical optics solutions respectively. Note that objects illuminated by adjacent sample apertures may
be modelled by replacing each term I1,0 and with summations, and , over all objects irespectively.
Region I Region II Region III
Geometrical optics, |U|2 I1,02 I1,0
2 + I2,02 I1,0
2
Wave optics, U Ui+I1,0−I2,0−I2,1 Ui+I1,0−I2,1 Ui+I1,0−I2,1
Opt Express. Author manuscript; available in PMC 2013 May 03.


