Embed Size (px)
Citation preview
Forschungsinstitut zur Zukunft der ArbeitInstitute for the Study of Labor
DI
SC
US
SI
ON
P
AP
ER
S
ER
IE
S
The Preference Survey Module:A Validated Instrument for MeasuringRisk, Time, and Social Preferences
IZA DP No. 9674
January 2016
Armin FalkAnke BeckerThomas DohmenDavid HuffmanUwe Sunde
The Preference Survey Module:
A Validated Instrument for Measuring Risk, Time, and Social Preferences
Armin Falk
University of Bonn, DIW, CEPR, CESifo, INET and IZA
Anke Becker University of Bonn
Thomas Dohmen
University of Bonn, Maastricht University, ROA, DIW and IZA
David Huffman University of Pittsburgh
and IZA
Uwe Sunde
University of Munich, CEPR, CESifo, DIW and IZA
Discussion Paper No. 9674 January 2016
IZA
P.O. Box 7240 53072 Bonn
Germany
Phone: +49-228-3894-0 Fax: +49-228-3894-180
E-mail: [email protected]
Any opinions expressed here are those of the author(s) and not those of IZA. Research published in this series may include views on policy, but the institute itself takes no institutional policy positions. The IZA research network is committed to the IZA Guiding Principles of Research Integrity. The Institute for the Study of Labor (IZA) in Bonn is a local and virtual international research center and a place of communication between science, politics and business. IZA is an independent nonprofit organization supported by Deutsche Post Foundation. The center is associated with the University of Bonn and offers a stimulating research environment through its international network, workshops and conferences, data service, project support, research visits and doctoral program. IZA engages in (i) original and internationally competitive research in all fields of labor economics, (ii) development of policy concepts, and (iii) dissemination of research results and concepts to the interested public. IZA Discussion Papers often represent preliminary work and are circulated to encourage discussion. Citation of such a paper should account for its provisional character. A revised version may be available directly from the author.
IZA Discussion Paper No. 9674 January 2016
ABSTRACT
The Preference Survey Module: A Validated Instrument for Measuring Risk, Time, and Social Preferences
This paper presents an experimentally validated survey module to measure six key economic preferences – risk aversion, discounting, trust, altruism, positive and negative reciprocity – in a reliable, parsimonious and cost-effective way. The survey instruments included in the module were the best predictors of preferences revealed in incentivized choice experiments. We also offer a streamlined version of the module that has been optimized and piloted for applications where time efficiency and simplicity are paramount, such as international telephone surveys. JEL Classification: C81, C83, C90 Keywords: survey validation, experiment, preference measurement Corresponding author: Thomas Dohmen Department of Economics University of Bonn Adenauerallee 24-42 53113 Bonn Germany E-mail: [email protected]
1 Introduction
This paper develops a concise, experimentally-validated survey module for measur-
ing risk aversion, time discounting, trust, altruism, positive and negative reciprocity.
These preferences affect individuals’ choices in myriad situations.1 The module is a
convenient tool for obtaining standardized measures in all popular methods of data
collection. It is therefore a useful tool in a wide range of applications, not least
because preference measures can allow for improved prediction of many important
economic behaviors, or can provide control variables if researchers want to identify
causal effects of other factors that are correlated with preferences.
The module provides a valuable contribution in several respects. First, while
incentivized experiments are generally viewed as the gold standard for eliciting pref-
erences, because they measure actual behavior in a controlled way, they are expensive
and time consuming; our survey module is developed based on its ability to capture
behavior in incentivized experiments. It thus provides a low cost way to measure
preferences in large representative samples, while retaining key advantages of the
experimental approach.2
Second, while some existing survey measures have been shown to predict behavior
in experiments, these have typically been developed for different individual studies,
based on intuitive plausibility, which has led to a large set of diverse measures. Our
approach takes the natural next step, assessing which of a wide array of candidate
1 For example, risk aversion, time preferences, altruism, trust, positive reciprocity and negativereciprocity have all been shown to predict a wide range of choices at the individual level, in-cluding, e.g., financial decision-making, educational choices, labor market behavior, charitablegiving, social norm enforcement, and health outcomes (see, e.g., Dohmen et al., 2009; Dohmenet al., 2011; Fehr et al., 2002; Kirby et al., 1999; Komlos et al., 2004; Rose-Ackerman, 1996;Smith et al., 2005; Tanaka et al., 2010) and are associated with important life outcomes at theindividual level (e.g., Becker et al., 2012) as well as with economic outcomes at the organizationlevel (e.g., LaPorta et al., 1997) and the aggregate level (e.g., Beugelsdijk et al., 2004; Knackand Keefer, 1997; Zak and Knack, 2001).
2 An alternative methodology is to use life outcomes as a proxy for preferences. While this hasthe advantage of involving real (typically self-reported) behavior, for potentially large stakes,a disadvantage is that a given life outcome may depend on many personal and environmentalfactors besides the preference of interest. By contrast, both experiments and survey measurescan pose individuals with carefully designed scenarios and choice options, which can isolate aparticular preference with a reasonably high degree of precision, and which are held exactly thesame across respondents. This can help eliminate a major source of unobserved heterogeneitythat affects the inference of preferences from life outcomes.
1
measures are the best predictors.3 Specifically, for each preference, we evaluate the
ability of roughly 30 different survey measures to predict behavior in corresponding
incentivized choice experiments. We include measures developed in previous studies,
as well as novel measures. We select the survey items that are jointly the best
predictors.
Third, the previous literature has used a wide variety of different types of prefer-
ence measures, with different formats, wordings, and elicitation modes. This poses
a substantial obstacle to the comparability of results across studies. Our preference
module provides a new tool for measuring preferences in a standardized way. In
psychology, this type of problem has been at least partially addressed by the de-
velopment of a standard set of measures - in particular the so-called Big Five and
Locus of Control - which are conceptualized to be key personality traits and relevant
for many settings (Costa and McCrae, 1992; Rotter, 1966). Our module captures a
set of preferences identified by economic theory as being fundamental determinants
of behavior in many contexts. If the module is widely adopted, it will help enhance
comparability across studies and may thereby accelerate scientific progress.
In developing the survey module we took several additional considerations into
account: We strove to reduce measurement error in the experimental preference
measures by having subjects participate in more than one experiment for a given
preference and averaging over the choice-based preference measures. We designed
the validation to limit spurious interdependencies in decision-making and response
behavior by never asking survey questions relating to a particular preference in
the same session in which the respective preference elicitation experiment was con-
ducted; surveys and experiments were conducted one week apart. We restricted
the subject pool to subjects who had never participated in an experiment before.
This rules out possible biases in behavior due to experiences gained in previous
3 Fehr et al. (2003), for example, examine six different attitudinal trust questions in terms of theirability to predict behavior in an investment game as introduced by Berg et al. (1995), and findthat self-rated trusting behavior and willingness to trust strangers are most strongly associatedwith behavior in the incentivized experiment. Dohmen et al. (2011) show that self-rated willing-ness to take risk “in general” is significantly correlated with decisions in an incentivized lotterychoice experiment. Vischer et al. (2013) relate answers to a survey question asking respondentsto rate their general level of impatience to behavior in an experiment involving inter-temporaltrade-offs.
2

experiments.
When selecting the module items, we considered all possible linear combina-
tions of survey items intended to measure a particular preference, and chose the
combination that best explained behavior in the respective experimental preference
elicitation task. The selection of a best-subset regression model from the candidate
family entailed the well-known trade-off between parsimony and explanatory power
that is inherent to model selection in statistics. We used standard model selection
criteria to guide our choice, and, in addition, took into account the risk of overfit-
ting by evaluating out-of-sample predictive power, or alternatively by conducting
cross-validation procedures.
The selected module involves two survey items for the elicitation of each prefer-
ence. The preference module is symmetric, in that most preferences are measured
with one quantitative and one qualitative item. The single best predictor of behav-
ior for a given preference tends to be quantitative: a hypothetical version of the
experiment itself. The second survey item that is typically selected is a qualitative
question, asking about a general orientation in the relevant preference dimension.
The module thus offers an attractive balance between measures that allow for infer-
ring (cardinal) preference parameters, and subjective measures that capture other
contexts besides choices about financial rewards.
It turns out that some of the survey items that are selected by our methodology
have been shown to be behaviorally valid in various populations by previous studies.
For example, the same qualitative measure of risk preference that is selected for our
module has been shown to predict behavior in an incentivized risk experiment with
a representative sample of German adults (Dohmen et al., 2011). Notably, the corre-
lation between the survey measure and experiment observed in their representative
sample is virtually the same as that found in our validation exercise. Other research
shows that the same survey question about risk preference predicts behavior in in-
centivized experiments in 30 different countries (Vieider et al., 2015). Thus, there
are strong indications that the types of measures selected for our module have good
predictive power in representative and cross-cultural samples.
We also develop a second, streamlined version of the preference module. It has
3
slightly weaker explanatory power, but is ideally suited for applications in which
time efficiency, simplicity and cultural neutrality are of paramount importance. A
prime example is a large-scale international survey among respondents that are rep-
resentative of the entire population. When developing this streamlined module,
we discarded the more complex hypothetical experiments. After selecting the items
with highest explanatory power from the modified battery of questions, we tested the
performance of the resulting module in an international pilot study.4 The stream-
lined module is implementable within tight time constraints, and detailed feedback
elicited from respondents was encouraging in terms of confirming a common un-
derstanding of the preference module across a very diverse set of cultures. The
feedback led to a few minor wording changes that are incorporated in this version
of the module.
We are confident that both versions of the preference module will prove use-
ful to scientists interested in measuring economic preferences. In order to make
the preference module easily accessible to researchers, we have launched a website
(www.global-preferences.org), from which the preference module can be downloaded.
We also provide the streamlined version of the preference module in more than 90
languages. Supplementary material and detailed information on the construction
of the module, including the design and instructions of the experiment, the set of
survey items included in the questionnaires that participants filled in, z-tree files,
and detailed regression tables.
The remainder of the paper is organized as follows. Section 2 describes the design
of the validation study and the procedures to elicit preferences in experiments and
surveys. Section 3 explains the process and the criteria for the selection of items.
It also presents the preference module with two items for measuring each of the six
preferences, which performs best in out-of-sample prediction. Section 4 discusses
additional important properties of the preference module, such as explanatory power
and its suitability for non-student subject pools. Section 5 proposes the streamlined
version of the preference module and discusses its applicability in representative and
4 The pilot study was run in 22 countries in Southeast Asia, Central Asia, East Africa, EasternEurope and the Middle East.
4
cross-cultural samples. Section 6 concludes.
2 Design of the Validation Study
2.1 Procedural Details
409 subjects participated in our study. Subjects were students from the University
of Bonn, who were recruited using ORSEE (Greiner 2004). They were required to
have never taken part in an experiment before in order to minimize potential con-
founds due to earlier experiences in (similar) experiments. Subjects signed up for
two laboratory sessions. These were scheduled one week apart and run at the Labo-
ratory for Experimental Economics at the University of Bonn in winter 2010/2011.
Both sessions consisted of incentivized experiments and non-incentivized surveys,
programmed in zTree (Fischbacher 2007). Each session lasted about two hours.
Payoffs earned in the incentivized experiments were paid out to subjects at the end
of each session.5 Average earnings over both sessions amounted to 64 Euros (corre-
sponding to approximately 83 US-dollars at the time of the experiment), including
a fixed fee of 10 Euros for participating in both sessions.
In order to minimize spillovers between the experimental and the survey mea-
sures, e.g., because individuals might try to avoid cognitive dissonance (Festinger,
1957) and strive for giving consistent responses (Falk and Zimmermann, 2015, and
Falk and Zimmermann, forthcoming), we never ran survey and experiment for the
same preference during the same session. More specifically, we conducted all ex-
periments relating to social preferences and all surveys relating to time discounting
and risk taking in one session. The other session then contained the experiments
relating to time discounting and risk taking as well as the surveys on social prefer-
ences. In addition, we reversed the order of experimental and survey elicitation of
preferences for about half of our subjects. This design feature takes care of poten-
tial order effects, i.e., differences in behavior or responses due to differences in the
5 The payments resulting from the choice experiments on time discounting were delivered to thesubjects in cash via regular mail, either at the same day of the session or 12 months later,depending on the payoff relevant choice.
5
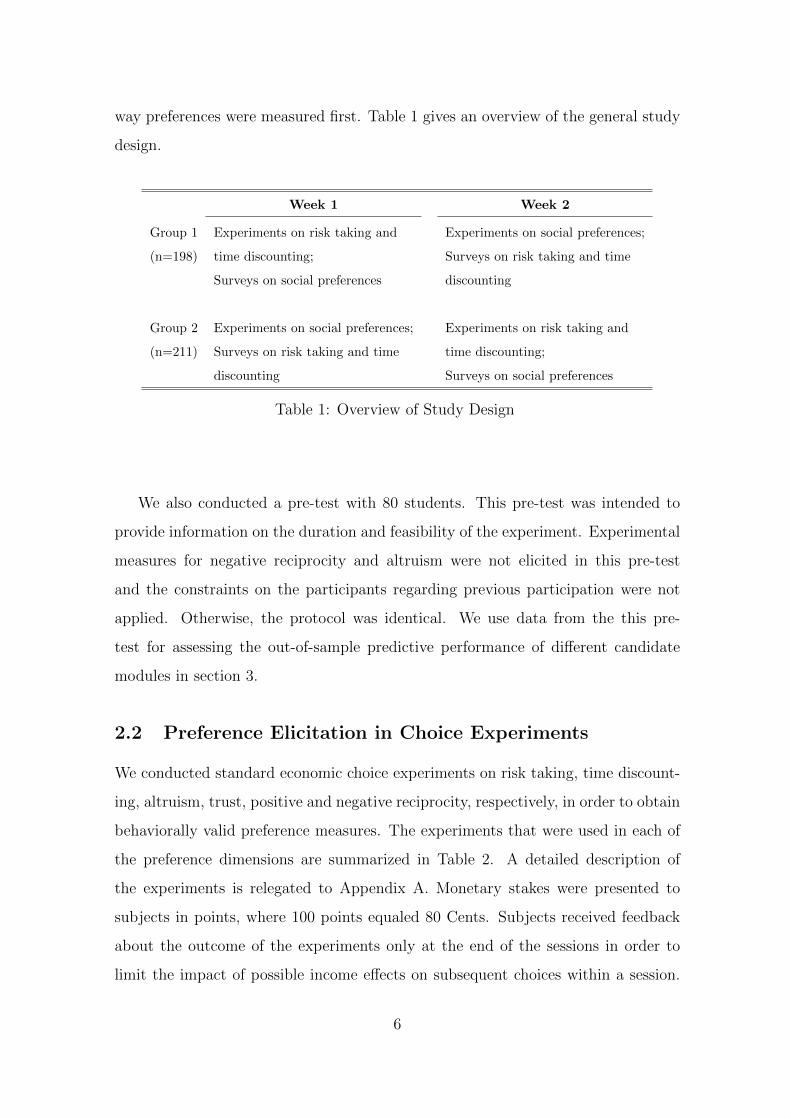
way preferences were measured first. Table 1 gives an overview of the general study
design.
Week 1 Week 2
Group 1 Experiments on risk taking and Experiments on social preferences;
(n=198) time discounting; Surveys on risk taking and time
Surveys on social preferences discounting
Group 2 Experiments on social preferences; Experiments on risk taking and
(n=211) Surveys on risk taking and time time discounting;
discounting Surveys on social preferences
Table 1: Overview of Study Design
We also conducted a pre-test with 80 students. This pre-test was intended to
provide information on the duration and feasibility of the experiment. Experimental
measures for negative reciprocity and altruism were not elicited in this pre-test
and the constraints on the participants regarding previous participation were not
applied. Otherwise, the protocol was identical. We use data from the this pre-
test for assessing the out-of-sample predictive performance of different candidate
modules in section 3.
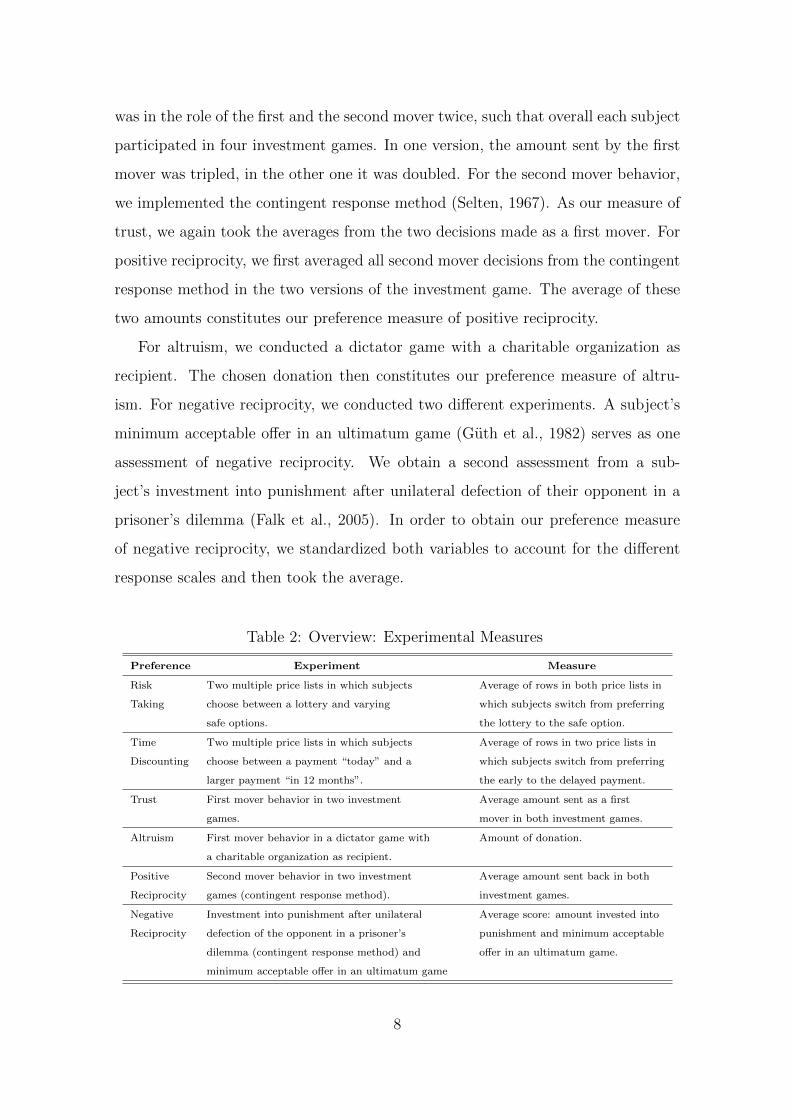
2.2 Preference Elicitation in Choice Experiments
We conducted standard economic choice experiments on risk taking, time discount-
ing, altruism, trust, positive and negative reciprocity, respectively, in order to obtain
behaviorally valid preference measures. The experiments that were used in each of
the preference dimensions are summarized in Table 2. A detailed description of
the experiments is relegated to Appendix A. Monetary stakes were presented to
subjects in points, where 100 points equaled 80 Cents. Subjects received feedback
about the outcome of the experiments only at the end of the sessions in order to
limit the impact of possible income effects on subsequent choices within a session.
6
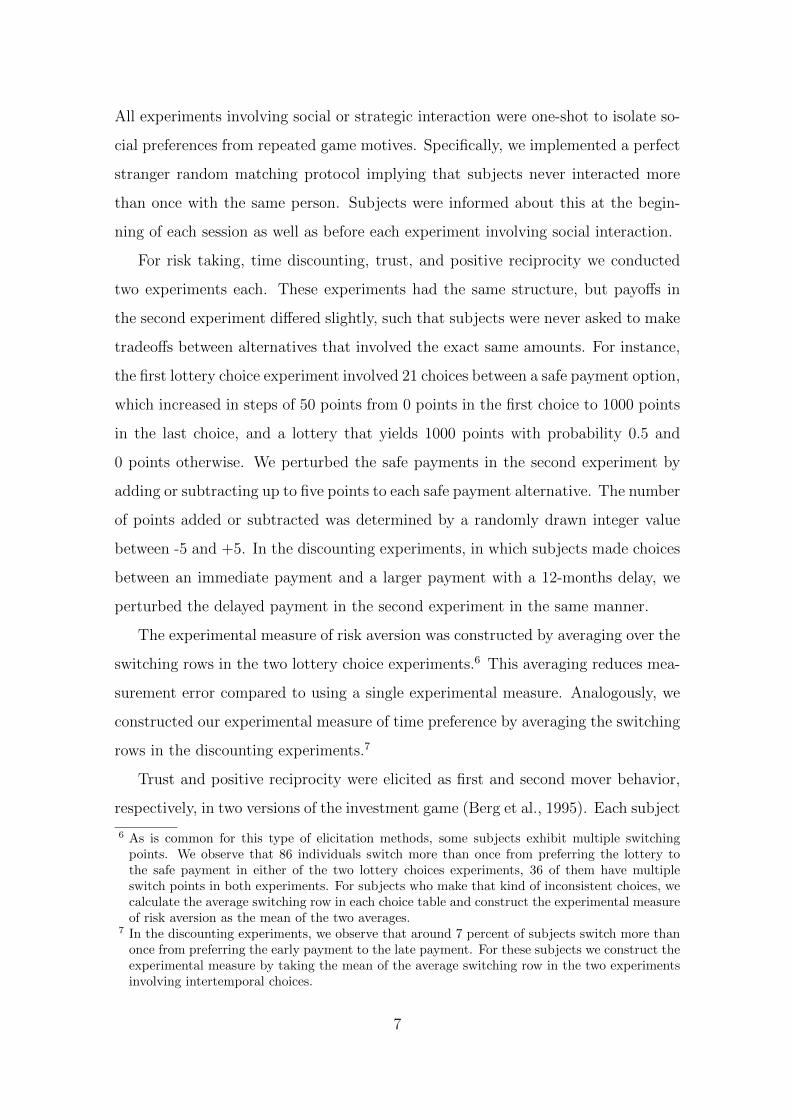
All experiments involving social or strategic interaction were one-shot to isolate so-
cial preferences from repeated game motives. Specifically, we implemented a perfect
stranger random matching protocol implying that subjects never interacted more
than once with the same person. Subjects were informed about this at the begin-
ning of each session as well as before each experiment involving social interaction.
For risk taking, time discounting, trust, and positive reciprocity we conducted
two experiments each. These experiments had the same structure, but payoffs in
the second experiment differed slightly, such that subjects were never asked to make
tradeoffs between alternatives that involved the exact same amounts. For instance,
the first lottery choice experiment involved 21 choices between a safe payment option,
which increased in steps of 50 points from 0 points in the first choice to 1000 points
in the last choice, and a lottery that yields 1000 points with probability 0.5 and
0 points otherwise. We perturbed the safe payments in the second experiment by
adding or subtracting up to five points to each safe payment alternative. The number
of points added or subtracted was determined by a randomly drawn integer value
between -5 and +5. In the discounting experiments, in which subjects made choices
between an immediate payment and a larger payment with a 12-months delay, we
perturbed the delayed payment in the second experiment in the same manner.
The experimental measure of risk aversion was constructed by averaging over the
switching rows in the two lottery choice experiments.6 This averaging reduces mea-
surement error compared to using a single experimental measure. Analogously, we
constructed our experimental measure of time preference by averaging the switching
rows in the discounting experiments.7
Trust and positive reciprocity were elicited as first and second mover behavior,
respectively, in two versions of the investment game (Berg et al., 1995). Each subject
6 As is common for this type of elicitation methods, some subjects exhibit multiple switchingpoints. We observe that 86 individuals switch more than once from preferring the lottery tothe safe payment in either of the two lottery choices experiments, 36 of them have multipleswitch points in both experiments. For subjects who make that kind of inconsistent choices, wecalculate the average switching row in each choice table and construct the experimental measureof risk aversion as the mean of the two averages.
7 In the discounting experiments, we observe that around 7 percent of subjects switch more thanonce from preferring the early payment to the late payment. For these subjects we construct theexperimental measure by taking the mean of the average switching row in the two experimentsinvolving intertemporal choices.
7
was in the role of the first and the second mover twice, such that overall each subject
participated in four investment games. In one version, the amount sent by the first
mover was tripled, in the other one it was doubled. For the second mover behavior,
we implemented the contingent response method (Selten, 1967). As our measure of
trust, we again took the averages from the two decisions made as a first mover. For
positive reciprocity, we first averaged all second mover decisions from the contingent
response method in the two versions of the investment game. The average of these
two amounts constitutes our preference measure of positive reciprocity.
For altruism, we conducted a dictator game with a charitable organization as
recipient. The chosen donation then constitutes our preference measure of altru-
ism. For negative reciprocity, we conducted two different experiments. A subject’s
minimum acceptable offer in an ultimatum game (Guth et al., 1982) serves as one
assessment of negative reciprocity. We obtain a second assessment from a sub-
ject’s investment into punishment after unilateral defection of their opponent in a
prisoner’s dilemma (Falk et al., 2005). In order to obtain our preference measure
of negative reciprocity, we standardized both variables to account for the different
response scales and then took the average.
Table 2: Overview: Experimental Measures
Preference Experiment Measure
Risk Two multiple price lists in which subjects Average of rows in both price lists in
Taking choose between a lottery and varying which subjects switch from preferring
safe options. the lottery to the safe option.
Time Two multiple price lists in which subjects Average of rows in two price lists in
Discounting choose between a payment “today” and a which subjects switch from preferring
larger payment “in 12 months”. the early to the delayed payment.
Trust First mover behavior in two investment Average amount sent as a first
games. mover in both investment games.
Altruism First mover behavior in a dictator game with Amount of donation.
a charitable organization as recipient.
Positive Second mover behavior in two investment Average amount sent back in both
Reciprocity games (contingent response method). investment games.
Negative Investment into punishment after unilateral Average score: amount invested into
Reciprocity defection of the opponent in a prisoner’s punishment and minimum acceptable
dilemma (contingent response method) and offer in an ultimatum game.
minimum acceptable offer in an ultimatum game
8
2.3 Preference Elicitation in Surveys
In the survey, we asked both quantitative and qualitative questions to measure a
given preference. In total, we included 199 survey items.8 Many survey items were
taken or adapted from existing surveys, like the German Socio-Economic Panel
Study (SOEP) or the National Longitudinal Study of Youth (NLSY), or from pre-
vious research (e.g., Weber et al., 2002; Perugini et al., 2003). Additionally, we
designed and included a number of new items. Each battery of survey questions on
a particular preference began with a qualitative measure, asking respondents to self-
assess their preference “in general” on an 11-point scale.9 Next, respondents were
asked to state how they believe others judge them with respect to that preference
and to compare their preference to the attitude of others. Then, respondents had
to assess their attitude in qualitative terms with respect to different domains, e.g.,
financial decision-making. Subsequently, subjects were confronted with a battery of
additional qualitative and quantitative survey items.
Quantitative items typically included a hypothetical version of the incentivized
choice experiment. Since the multiple price lists used in the lottery choice experi-
ment and in the inter-temporal choice experiment involve 30 choices and are rather
time-consuming, we also included an alternative elicitation procedure in which sub-
jects only had to make five sequential choices. In the five-question measure of risk
preference all subjects first decided between the lottery versus a safe payment that
slightly exceeds the expected value of the lottery. In the second decision (and all
subsequent decisions) the lottery remained the same. If the participant had chosen
the safe option in the first question, the safe option in the subsequent decision was
smaller. If the participant had opted for the lottery, the safe payment increased. In
the same manner, the safe option was increased or decreased in the third decision
when the lottery or the safe payment were preferred in the second decision, respec-
tively. This procedure was repeated five times. Figure 2 in the Appendix illustrates
the method underlying this condensed quantitative measure, which is commonly re-
8 Section A in the online appendix gives a list of all survey items we used in our study.9 An example of this type of question is the general risk question that was validated in Dohmen
et al. (2011).
9

ferred to as an “unfolding brackets” method.10 For the case of time discounting, an
analogous unfolding brackets elicitation was used in which the early option was iden-
tical in every choice while the delayed option varied. The procedures are described
in detail in Appendix E (for risk taking) and Appendix F (for time discounting). Fi-
nally, we asked all subjects to rate the reliability of their answers in the survey part.
Before running the item selection procedure for the preference module, we restricted
the pool of items to include only those items that are widely applicable, i.e., that
are not limited to certain subject pools, e.g., university students.11 In particular, we
excluded items that refer to betting on horses, gambling, drug consumption, risky
sports, taking a hitchhiker, or that require respondents to be employed.12
3 The Preference Module
3.1 Item Selection Procedure
Our aim was to develop a survey preference module that contains the set of items
for each preference that best capture revealed preferences in incentivized laboratory
experiments, in the sense of an optimal tradeoff between explanatory power and
parsimony. While previous studies have typically focused on identifying survey
measures that are significantly correlated with experimental preference measures,
our approach is to identify the combination of survey items from an extensive battery
of alternative survey items that best predicts choices in incentivized experimental
preference elicitation tasks.
In order to identify the best linear combination of items for measuring a par-
ticular preference, we regressed each experimental preference measure on different
combinations of the respective survey items. In the spirit of best subset selection,
we considered all possible combinations of survey items as regressors.13 We then
10 In psychology this approach is also referred to as the “staircase method” (Cornsweet 1962).11 In our initial selection of the battery of candidate questions we had still included items that
relate to very particular contexts, despite the fact that our ex ante choice of items was guidedby judgments about applicability and relevance in diverse populations.
12 Some of these items might work well for particular sub-samples of the population, but will mostlikely be uninformative and inappropriate for large fractions of more general population samples.
13 Alternative selection procedures commonly applied in, e.g., personality psychology are stepwise
10

took into account statistical model selection criteria, based on explanatory power
and prediction error, in order to identify the preferred combination of survey items
for each preference.14
We implemented the selection procedure using a stepwise approach. In the first
step, we ran OLS regressions and identified for every number of regressors the best
model in terms of explanatory power, using an R2 criterion.15 In the second step,
we considered all models selected in the first step, i.e., one model for any number
of regressors, and used information criteria to narrow down the number of candi-
date models.16 Since these information criteria differ with respect to the extent to
which the inclusion of additional regressors is penalized, the different information
criteria will not necessarily all favor the same model. In our case, the two-item and
three-item models were among the set of candidate modules for each preference,
in the sense that they were reasonably close according to the different information
selection procedures, including forward selection and backward elimination procedures. In for-ward selection approaches the analysis starts with the null model and chooses the predictorvariable which explains the highest share of variance in the dependent variable. Given this pre-dictor, the next variable is selected applying the same criterion. This process is repeated untilno additional predictor variables can be found that meet a certain criterion, e.g., an F -statisticabove a certain threshold (compare, e.g., Kadane and Lazar, 2004). In backward selection ap-proaches the analysis starts with the model that includes all potential predictor variables andthen, one by one, eliminates variables from the model that perform worst according to a pre-determined criterion. Again, this procedure is repeated until only predictor variables are left inthe model that fulfill a certain criterion. Clearly, the resulting model in both forward selectionand backward elimination procedures strongly depends on the order of selecting (eliminating)items. Consequently, they do not necessarily result in the same model (see also Graybill, 1976).Stepwise regression approaches combine backward elimination and forward selection proceduresand mitigate the problem of order dependence. However, all three approaches share the featurethat not all possible models are evaluated. A further potential alternative would be to use theso-called Lasso-technique as introduced by Tibshirani (1996). Lasso is particular useful whenbest subset selection is not feasible, e.g., when there are more potential explanatory variablesthan observations, which is not the case in our setting in which we consider linear models onlythat are additively separable in explanatory variables. In fact, in this case Lasso selects largelythe same modules. We deliberately did not consider non-linear and fully interacted predictionmodels for reasons of simplicity, to facilitate applicability and interpretation of the preferencemodule, and to enhance comparability of results across studies.
14 Another important ex ante criterion was cost efficiency, i.e., considering the tradeoff betweenpredictive power and conciseness of the module. It turned out, however, that the statisticalcriteria were not in conflict with the cost criterion as favored combinations are parsimonious interms of the number of items.
15 In the following we will only report results from OLS regressions. However, all results reportedhere are robust to estimating Ordered Probit models and selecting items using the criteria ofmaximum log-likelihood or Pseudo-R2.
16 Naturally, R2 will increase with the number of regressors, but adding regressors may result inoverfitting. Different criteria such as adjusted R2, the Akaike information criterion (AIC), orthe Bayesian information criterion (BIC) contain a penalty term for the number of items.
11

criteria.17 Since we value brevity of the preference module, we favor the Bayesian
information criterion (BIC), which contains a larger penalty for additional regressors
than the Akaike information criterion (AIC). According to the BIC, the two-item
model is superior for altruism, negative reciprocity and trust, while the three-item
model is selected for risk taking, time discounting and positive reciprocity.18
In the final step, we considered the predictive power of our candidate modules, in
order to identify the preferred preference module. Whenever possible, we considered
out-of-sample predictive power, making use of a truly independent sample of 80
subjects for whom we had collected data on the same experimental and survey
measures on risk taking, time discounting, positive reciprocity and trust. For each of
these preferences we determined the predicted values of the respective experimental
preference measure according to the candidate models that differ with respect of
the number of items.19 For each preference, we then assessed the predictive power
of the different candidate models by comparing their mean squared prediction error
(MSPE). For all four preference dimensions, the MSPE is minimized for the model
with two items.
Since data on altruism and negative reciprocity is lacking in our independent
sample, we evaluated the predictive power of the models with different numbers of
items for these preference dimensions based on cross-validation using the original
sample.20 In line with our out-of-sample prediction results for the other four pref-
17 In particular, in our case, the one-item module is never selected, irrespective of whether we con-sider AIC or BIC. Many previous studies have relied on only one item, which suggests that manyof the results in previous literature understate the strengths of correlations between differentpreference dimensions or the strength of estimated relationships between preferences and out-come variables, due to attenuation bias that results from measurement error. Moreover, studiesusing survey measures of preferences are often not based on survey preference measures thatexhibit the highest correlation with the experimental preference measure (cf. Online AppendixC). The pairwise correlations of single items with the experimental preference measure are alsoinformative with respect to comparability of results across existing studies that are based onsingle but different measures.
18 The AIC, on the other hand, favors the two-item module only in the case of positive reciprocity.19 Predicted values were calculated as the product of the vector of observed answers to the specific
preference module and the vector of estimated coefficients from the regression of the experimentalpreference measure on the respective preference module in the main sample on which the selectionprocedure was based.
20 Our cross-validation procedure entails that the sample is randomly split into k partitions. Onepartition is used as a validation sample, whereas the remaining k − 1 samples are used as the“training” sample.
12
erences, the cross validation errors are smallest when using the two-item models for
negative reciprocity and altruism.21 As a result, we prefer two-item models for each
preference dimension.
3.2 Survey Items Contained in the Preference Module
Table 3 displays the items that were selected for the preference module with two
survey questions for each preference dimension. Appendix B presents the wording
of the survey items in the preference module, translated from German to English;
the original wording of the items in German is provided in section D in the online
appendix.
A notable feature of the preference module is its symmetry: For most preference
dimensions, it contains a measure based on a hypothetical choice experiment and
a qualitative item.22 These two types of measures are complementary in the sense
that the quantitative measure is akin to the standard revealed preference approach
whereas the qualitative item is a subjective self-assessment. Previous research has
shown that subjective assessments with abstract framings can lead to strong all-
around predictors of life choices across many different life contexts. For example,
a general assessment of willingness to take risks can predict a range of behaviors
ranging from holding risky assets, to being self-employed, to smoking (Dohmen et
al., 2011). Quantitative survey measures that involve explicit monetary stakes are
no exception, as they are somewhat tied to the context of financial decision making
by construction; they may be better predictors of financial decisions in life than
qualitative measures of a general disposition, but less predictive of choice in other
domains. The preference module has an attractive balance between both approaches.
Table 3 also documents the correlations between the module items and the re-
spective behavioral measures. The last column of Table 3 provides estimated OLS
coefficients obtained from a multivariate regression of the standardized experimen-
tal preference measure on standardized measures of the two survey items for the
respective preference dimension. In applications, these coefficients can be used to
21 Our results obtain using k = 5 or using k = 10 partitions.22 The only exception is positive reciprocity.
13
calculate weights, and then construct measures for each preference as the weighted
sum of the two items that capture the respective preference.
4 Properties of the Preference Module
4.1 Correlation between Survey Preference Measures and
Experimental Preference Measures
As a first indication of the quality of the preference module, we present the corre-
lations between the experimental preference measure and its predicted value based
on the two survey items. The correlations are 0.4079 for risk taking, 0.5861 for time
discounting, 0.6748 for trust, 0.4235 for altruism, 0.5771 for positive reciprocity, and
0.3729 for negative reciprocity. One might be inclined to evaluate these correlations
against a benchmark of 1. This benchmark would only be appropriate, however,
if the experimental preference measures and the survey based preference measures
were measured without error and perfectly aligned with the respective underlying
preference. The assumption that there is no measurement error is unlikely to be
correct in the case of preference measures. For example, measuring preference pa-
rameters that are inherently continuous on a discrete grid, the typical approach in
choice experiments, gives rise to measurement error (see Einav et al., 2012).
With measurement error, the correlation between the experimental preference
measure and a candidate item from our battery of survey questions would be smaller
than one, even if the survey item measured the underlying preference equally well
as the experimental measure. It seems therefore more adequate to consider a bench-
mark that recognizes the consequences of measurement error. An obvious bench-
mark is the correlation θ between two measurements that arise from the repetition
of the exact same experiment because the best predictor of behavior in an exper-
iment is arguably a prior choice in the same experiment. In what follows, we use
a test-retest sample to measure θ. This test-retest correlation then becomes our
benchmark for the highest possible correlation one might achieve between survey
measures and experiment, should the two be perfectly aligned. We compare the
14

Preference
Item
Desc
rip
tion
Corr
elati
on
OL
SC
oeff
.
Ris
kri
skqu
ant
Mu
ltip
lep
rice
list
(31
hyp
oth
etic
al
choic
esb
etw
een
alo
tter
yan
da
safe
op
tion
)0.4
095***
0.2
758***
Takin
gri
skqu
al
How
do
you
see
you
rsel
f:A
reyou
ap
erso
nw
ho
isgen
erally
willin
gto
take
risk
s,or
do
you
try
toavoid
takin
gri
sks?
0.3
524***
0.2
034***
Tim
eti
me
qu
ant
Lis
tof
25
hyp
oth
etic
al
choic
esb
etw
een
an
earl
yp
aym
ent
“to
day”
an
da
del
ayed
paym
ent
“in
12
month
s”0.5
826***
0.4
849***
Dis
cou
nti
ng
tim
equ
al
Inco
mp
ari
son
tooth
ers,
are
you
ap
erso
nw
ho
isgen
erall
yw
illin
gto
giv
eu
pso
met
hin
gto
day
inord
erto
ben
efit
-0.4
039***
-0.1
712***
from
that
inth
efu
ture
?
Tru
sttr
ust
qu
ant
Hyp
oth
etic
al
inves
tmen
tgam
e:fi
rst
mover
beh
avio
r0.6
201***
0.6
289***
tru
stqu
al
Sel
f-ass
essm
ent:
As
lon
gas
Iam
not
convin
ced
oth
erw
ise,
Iass
um
eth
at
peo
ple
have
on
lyth
eb
est
inte
nti
on
s.0.2
829***
0.1
331***
Alt
ruis
malt
rqu
ant
You
won
1,0
00
Eu
roin
alo
tter
y.C
on
sid
erin
gyou
rcu
rren
tsi
tuati
on
,h
ow
mu
chw
ou
ldyou
don
ate
toch
ari
ty?
0.3
913***
0.1
845***
alt
rqu
al
How
do
you
ass
ess
you
rw
illin
gn
ess
tosh
are
wit
hoth
ers
wit
hou
tex
pec
tin
ganyth
ing
inre
turn
wh
enit
com
esto
chari
ty?
0.3
845***
0.3
210***
Posi
tive
posr
ecip
qu
ant1
Hyp
oth
etic
al
inves
tmen
tgam
e:se
con
dm
over
beh
avio
r0.5
560***
0.4
857***
Rec
ipro
city
posr
ecip
qu
ant2
Hyp
oth
etic
al
scen
ari
o:
Wh
ich
bott
leof
win
ed
oyou
giv
eas
ath
an
k-y
ou
gif
t?0.3
530***
0.1
640***
Neg
ati
ve
neg
reci
pqu
ant
Min
imu
macc
epta
ble
off
erin
hyp
oth
etic
al
ult
imatu
mgam
e0.3
416***
0.3
284***
Rec
ipro
city
neg
reci
pqu
al
How
do
you
see
you
rsel
f:A
reyou
ap
erso
nw
ho
isgen
erall
yw
illin
gto
pu
nis
hu
nfa
irb
ehavio
rev
enif
this
isco
stly
?0.1
609***
0.1
479***
See
Ap
pen
dix
Bfo
rth
eex
act
word
ings
of
the
surv
eyqu
esti
on
s.T
he
colu
mn
“C
orr
elati
on
”d
isp
lays
Sp
earm
an
corr
elati
on
sb
etw
een
the
surv
eyit
eman
dth
ere
spec
tive
exp
erim
enta
l
mea
sure
.T
he
fin
al
colu
mn
dis
pla
ys
OL
Sco
effici
ents
ina
regre
ssio
nof
the
stan
dard
ized
exp
erim
enta
lm
easu
reon
the
stan
dard
ized
mod
ule
item
s.F
or
det
ails
see
the
regre
ssio
nta
ble
sin
sect
ion
Bin
the
on
lin
eap
pen
dix
.***,
**,
an
d*
den
ote
sign
ifica
nce
at
the
10-,
5-,
an
d1-p
erce
nt
level
,re
spec
tivel
y.
Tab
le3:
The
Pre
fere
nce
Module
15
actual explanatory power of the survey measures to this revised benchmark.
In order to assess the size of measurement error in the experimental preference
measures, we conducted additional experiments with 44 subjects, who participated
in preference elicitation experiments twice. The experimental sessions were sched-
uled one week apart (there was no perturbation of experimental parameters across
sessions). The data on two identical experimental measures elicited one week apart
allow us to compute the test-retest correlations (i.e., θ) between two experimental
measures of the same underlying preference.
We estimate the test-retest correlation (more precisely, the square of the cor-
relation) by regressing the preference measure revealed in the experiments in the
first session on the respective preference measure obtained in the second session and
calculating the R2 for this regression. The share of variance that can be explained
by the second experimental measure is substantially lower than 1, indicating the
presence of measurement error in the experimental measures. The correlations are
0.3469 for risk taking, 0.6715 for discounting, 0.5986 for trust, and 0.4203, 0.4336,
0.4446 for altruism, positive reciprocity and negative reciprocity respectively.23 The
R2-values of these regressions serve as a sensible benchmark against which to evalu-
ate the explanatory power of our preference module, since these values measure the
explanatory power for behavior in the experiments of an identical repeated measure
of the experiment itself. Compared to this benchmark, our survey module achieves
high explanatory power.
4.2 Out-of-Sample Prediction
After having established the superiority of the two item survey module in out-
of-sample prediction relative to longer modules in the previous section, we now
discuss the out-of-sample performance of the two item survey module in absolute
terms. For the subjects in our pretest panel we used their survey responses to
predict their choices in the four experimental preference elicitation tasks (measuring
risk and time preferences, trust and positive reciprocity), and regressed the actual
23 A more detailed regression table is relegated to section B in the online appendix.
16
choices on the predicted choices. If our preference module reliably captures the
preferences of individuals in this sample, one would expect the intercept of the
regression of actual on predicted choices to be zero and the coefficient of the predicted
value to be 1. In fact, we cannot reject the hypothesis that the constant is zero
and the slope coefficient equals one for all preferences, except for trust, at the
10 percent significance level. For trust, we find that the slope coefficient is not
statistically different from one if we suppress the constant in the regression. It
is also reassuring that predicted and actual choices are strongly and statistically
significantly correlated. The correlations are 0.2919 for risk preferences, 0.5868 for
time discounting, 0.2629 for trust, and 0.4424 for positive reciprocity.
4.3 Validity in Non-Student Samples
Conceptually, the module will be behaviorally relevant for non-students as long as
the correlations between survey items and experiments are similar to those in our
student sample. While the distributions of preferences may differ for students and
non-students, there is no particular reason to think that the correlation structure
should differ. Even if it does, it seems likely that the same types of survey items
would still be selected as best predictors for non-students as for students; in the
student sample the top two predictors are typically superior to other measures by a
substantial margin. Moreover, the quantitative survey items in the module closely
resemble the experimental measures that are widely used to elicit preferences in non-
student samples. Hence, there is no compelling reason why the correlations between
these hypothetical and incentivized measures should exist only among students.
Empirically, there is evidence that survey measures are significantly correlated
with experimental preference measures in representative, non-student samples. For
example, Fehr et al. (2003) used a representative sample of adults, and documented
a significant correlation between subjects’ behavior in an incentivized investment
game, and survey measures on trust of the type contained in our preference mod-
ule. Likewise it has been shown that answers to the qualitative survey question to
elicit risk attitudes, contained in our preference module, are significantly correlated
17
with incentivized lottery choices in a large representative subject pool (Dohmen et
al., 2011). In fact, they report a correlation coefficient between the survey measure
and behavior in the lottery choice experiment in their representative sample that
is almost identical to the one in our validation sample consisting of students.24 It
is also notable that the correlation is not significantly different for students versus
non-students in their representative sample. Similarly, Ziegelmeyer and Ziegelmeyer
(2012) predict risk-taking behavior in an alternative lottery choice experiment (Holt
and Laury, 2002) using the same survey item that is part of our module. In ad-
dition, the qualitative survey risk measure contained in our preference module has
previously been administered in the German Socio-Economic Panel Study, and other
large representative surveys in the US, Asia and Australia as well as in other Eu-
ropean countries. Various studies have documented that answers to this question
are related to risky behaviors in many contexts of life, for example, occupational
choice and self-employment, geographical mobility, ownership of risky assets, as well
as smoking (see, e.g., Barasinska et al., 2012; Bauernschuster et al. 2014; Bonin et
al., 2007; Caliendo et al., 2009; Dohmen et al., 2011; Fouarge et al., 2014; Jaeger et
al., 2010). These findings illustrate that the types of survey items selected in our
preference module provide behaviorally valid preference measures in non-student
samples.
There is also evidence that items from our preference survey module are valid
across cultures. For example, recent empirical work by Vieider et al. (2015) uses
the same qualitative measure of risk attitudes that is included in our module and
documents that it correlates with incentivized lottery choice experiments conducted
in 30 different countries. In addition, Hardeweg et al. (2013) replicate the validation
exercise of Dohmen et al. (2011) and confirm the significant relationship between
this risk question and incentivized lottery choices for a representative sample of
900 inhabitants of rural Northern Thailand. Ding et al. (2010) corroborate these
results for a sample of 121 Beijing University students. Taken together, this evidence
24 The correlations are 0.25 in the representative sample of Dohmen et al. (2011), and 0.24 in ourvalidation sample if we focus on the same survey measure for predicting behavior in a single riskexperiment (as shown above, the correlation is even higher for the validation sample if we usechoices from both risk aversion experiments).
18
suggests that the survey module can provide a useful tool for preference elicitation
also in an international context.
5 A Streamlined Version of the Preference Mod-
ule
Our survey module offers a reliable, easily implementable and low cost alternative
to conducting incentivized experiments. Nevertheless, there are applications for
which our module will not be ideal, as some of the quantitative items either require
instructions that are as complex as corresponding experiments (e.g., the hypothetical
investment game) or entail a considerable number of decisions (e.g., multiple price
lists for eliciting risk and time preferences). Particularly if time constraints are severe
or if respondents have limited cognitive capacity, an even simpler and shorter module
seems useful, even though it might come at some costs in terms of lower explanatory
power. A streamlined module is also particularly useful for measuring preferences in
large scale, representative, and cross cultural surveys, as these may use telephone,
have severe time constraints, and cover a subject pool that is heterogeneous in
terms of education and cognitive capacity. With this in mind, when developing the
streamlined version we also paid particular attention to ensuring that the preference
survey measures can be implemented across different cultural backgrounds, and are
understandable and measure the same preference across different cultures.
Streamlining the module involved two major steps, that led to adjustments of
the module, which are described in detail in Appendix C. First, we discarded the
hypothetical versions of our experimental preference elicitation tasks, which are typ-
ically time-consuming, as they involve a large number of choices or require rather
complex instructions that do not seem advisable in telephone surveys. We then
implemented the selection procedure described in section 3 on the set of remaining
survey items. As this restricted set included simpler analogues of the discarded
items, this restriction ultimately only led to a minimal reduction in explanatory
power (R2) (see Appendix C). For example, in the case of risk taking and time dis-
19

counting the “staircase” measures measures were selected. These measures are very
comparable to the quantitative measures based on the multiple price lists for lottery
choices and intertemporal choice respectively, yet their implementation is much more
time-efficient, as the “staircase” procedures only require five interdependent choices
(lottery vs. safe payments and early vs. delayed payments, respectively).25 Since
these preference measures are highly correlated with the respective multiple price
list measure and with the respective experimental preference measure (see section
C in the online appendix), the reduction in explanatory power of the streamlined
version compared to the original version in terms of R2 is only 0.02 in the case of
risk taking and 0.04 in the case of time discounting.
Second, we tested the resulting preference module, which is based on the modified
set of candidate measures, in an in-depth pilot study in 22 countries. In collabora-
tion with Gallup Europe, we surveyed respondents from 10 countries in central Asia
(Armenia, Azerbaijan, Belarus, Georgia, Kazakhstan, Kyrgyzstan, Russia, Tajik-
istan, Turkmenistan, Uzbekistan), 2 countries in South-East Asia (Bangladesh and
Cambodia), 5 countries in Southern and Eastern Europe (Croatia, Hungary, Poland,
Romania, Turkey), 4 countries in the Middle East and North Africa (Algeria, Jor-
dan, Lebanon, and Saudi-Arabia), and 1 country in Eastern Africa (Kenya).26 In
each country, the sample size was 10 to 15 people. Overall, more than 220 interviews
were conducted. In most countries, the sample was mixed in terms of gender, age,
educational background, and area of residence (urban vs. rural). For all items in-
volving hypothetical monetary amounts we adjusted the stake sizes for each country
in terms of their real value such that they represent the same share of a country’s
median income in local currency as the share of the amount in Euro of the Ger-
man median income, where our validation study had been conducted. Monetary
25 The staircase procedures are presented in detail in Appendix E and Appendix F.26 Gallup Europe ensured that the items of the preference module were translated into the major
languages of each target country, using state-of-the-art techniques. The translation processinvolved three steps. As a first step, a translator suggested an English, Spanish or Frenchversion of a German item, depending on the region. A second translator, being proficient inboth the target language and in English, French, or Spanish, then translated the item intothe target language. Finally, a third translator would review the item in the target languageand translate it back into the original language. If differences between the original item andthe back-translated item occurred, the process was adjusted and repeated until all translatorsagreed on a final version.
20
amounts used in the validation study with the German sample were rounded num-
bers to facilitate easy calculations (e.g., the expected return of a lottery with equal
chances of winning and losing) and to allow for easy comparisons (e.g., 100 Euro
today versus 107.50 in 12 months). To proceed in a similar way in all countries,
monetary amounts were always adjusted to the next “round and easy” number after
adjusting the amounts in terms of their real values.27 In order to detect potential
difficulties in the understanding of module items and differences in the respondents’
interpretation, respondents were explicitly asked to give extensive feedback with re-
spect to the appropriateness and understandability of the module. In particular, we
asked respondents to rephrase the meaning of the items in their own words and to
state any difficulties in understanding the items.28 If they encountered difficulties
in understanding or interpreting items, respondents were asked to make suggestions
on how to modify the wording of the item in order to attain the desired meaning.
Overall, the understanding and implementability of our module was very good.
Nevertheless, respondents’ feedback induced some additional changes to some items.
In terms of wording changes, the use of the term “lottery” in hypothetical risky
choices was troubling to some Muslim participants, and some refused to answer the
item completely since gambling is a taboo (haram) in Islam. As a consequence,
we dropped the term “lottery” and replaced it with the more neutral but equally
accurate term “random draw”. Second, the term “charity” caused confusion in
Eastern Europe and Central Asia, so it was replaced it with “good cause”. Third,
some respondents had difficulties answering the question asking about one’s will-
ingness to punish unfair behavior without knowing who was treated unfairly. We
therefore decided to split the question into two separate items, one item asking for
one’s willingness to punish unfair behavior towards others, and another asking for
one’s willingness to punish unfair behavior towards oneself. Fourth, some partici-
pants, especially in countries with current or relatively recent phases of volatile and
high inflation rates, stated that their answer to questions involving intertemporal
27 While this necessarily resulted in some (minor) variations in the real stake size between coun-tries, it minimized cross-country differences in the understanding the quantitative items due todifficulties in assessing the involved monetary amounts.
28 For example, respondent were explicitly asked to explain a “50-percent chance” in their ownwords and give their own interpretation of “safe payment”.
21
tradeoffs would depend on the rate of inflation, or said that they would always
take the immediate payment due to uncertainty with respect to future inflation.
Therefore, we added the following phrase to each question involving hypothetical
choices between immediate and future monetary amounts: “Please assume there is
no inflation, i.e., future prices are the same as today’s prices.” The final version
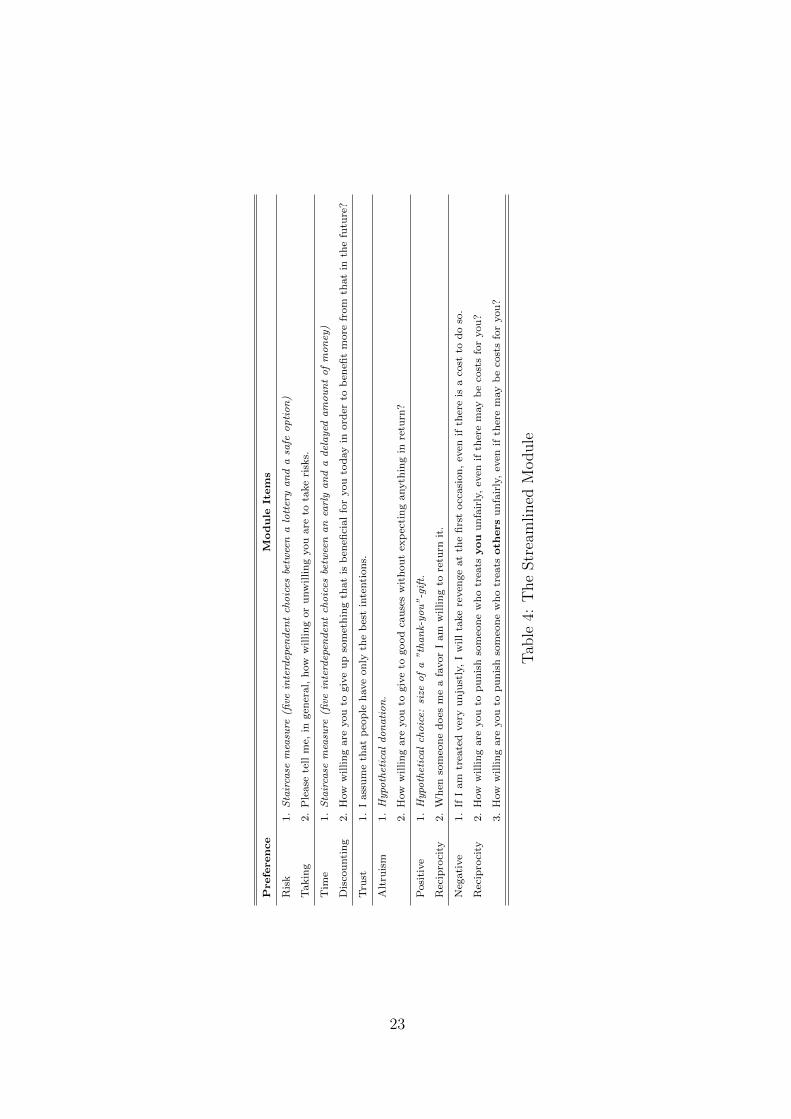
of the streamlined preference module is presented in Table 4. Finally, the survey
questions were brought into a format that is consistent with the Gallup World Poll
questionnaire style. For example, the first question of the module, which happened
to be the qualitative survey question on risk taking, was commenced by the request
“Please tell me”. The complete module version including exact wordings is relegated
to Section D in the appendix.
22
Preference
Module
Item
s
Ris
k1.
Sta
irca
sem
easu
re(fi
vein
terd
epen
den
tch
oic
esbe
twee
na
lott
ery
an
da
safe
op
tio
n)
Takin
g2.
Ple
ase
tell
me,
ingen
eral,
how
wil
lin
gor
unw
illin
gyou
are
tota
ke
risk
s.
Tim
e1.
Sta
irca
sem
easu
re(fi
vein
terd
epen
den
tch
oic
esbe
twee
na
nea
rly
an
da
del
ayed
am
ou
nt
of
mo
ney
)
Dis
cou
nti
ng
2.
How
willin
gare
you
togiv
eu
pso
met
hin
gth
at
isb
enefi
cial
for
you
tod
ay
inord
erto
ben
efit
more
from
that
inth
efu
ture
?
Tru
st1.
Iass
um
eth
at
peo
ple
have
on
lyth
eb
est
inte
nti
on
s.
Alt
ruis
m1.
Hypo
thet
ica
ld
on
ati
on
.
2.
How
willin
gare
you
togiv
eto
good
cau
ses
wit
hou
tex
pec
tin
ganyth
ing
inre
turn
?
Posi
tive
1.
Hypo
thet
ica
lch
oic
e:si
zeo
fa
”th
an
k-yo
u”
-gif
t.
Rec
ipro
city
2.
Wh
enso
meo
ne
does
me
afa
vor
Iam
willin
gto
retu
rnit
.
Neg
ati
ve
1.
IfI
am
trea
ted
ver
yu
nju
stly
,I
will
take
reven
ge
at
the
firs
tocc
asi
on
,ev
enif
ther
eis
aco
stto
do
so.
Rec
ipro
city
2.
How
wil
lin
gare
you
top
un
ish
som
eon
ew
ho
trea
tsyou
un
fair
ly,
even
ifth
ere
may
be
cost
sfo
ryou
?
3.
How
willin
gare
you
top
un
ish
som
eon
ew
ho
trea
tsoth
ers
un
fair
ly,
even
ifth
ere
may
be
cost
sfo
ryou
?
Tab
le4:
The
Str
eam
lined
Module
23
6 Conclusion
This paper presents an experimentally validated survey module to measure six key
economic preferences – risk aversion, discounting, trust, altruism, positive and neg-
ative reciprocity – in a reliable, parsimonious and cost-effective way. The paper
offers two versions of the module. One provides the maximum explanatory power,
subject to having a parsimonious number of survey items (two items) per prefer-
ence. We strongly recommend this tool for eliciting preferences in small to medium-
scale studies among (fairly) educated respondents, such as lab experiments and field
experiments. This version of the module is also well-suited for surveys that use
detailed questionnaires or that are based on written or computer-assisted personal-
ized interviews (CAPI). The other version of the module is a more streamlined one
that prioritizes time efficiency, and simplicity, at the expense of a modest reduction
in explanatory power. This streamlined version of the module is particularly use-
ful in the context of large-scale international surveys among respondents sampled
from the entire age and education spectrum and covering individuals from diverse
socio-economic backgrounds.
The streamlined version of the module is also well-suited for all kinds of survey
modes, including telephone surveys. Indeed, it has now been successfully imple-
mented within framework of the Gallup World Poll 2012, a major international
survey. This has yielded the Global Preference Survey (GPS) data, which has pref-
erence measures for more than 80,000 drawn as representative samples in each of
76 countries worldwide (see Falk et al., 2015, for a detailed description of this data
set). Importantly, these data reveal the behavioral validity of our preference module
(Falk et al., 2015). For example, more risk tolerant individuals are more likely to
become self-employed and are more likely to smoke. Likewise, patient individuals
are more likely to save and have higher educational attainment around the world.
Finally, social preferences are strongly correlated with a broad range of prosocial
behaviors and outcomes such as donating, volunteering time, assisting strangers,
helping friends and relatives, or family structure.
Both versions of the preference module share several desirable features. First,
24
the module items are experimentally validated. The ability of the items to explain
behavior in incentivized choice experiments helps ensure that they are meaningful for
predicting choices under real incentives, mitigating one of the major concerns about
hypothetical questions. The selected items are not just significant predictors of be-
havior, but are jointly the best predictors out of a large set of alternative measures.
The validation is based on a consistent research design across preferences, and ap-
plies state-of-the-art experimental techniques and transparent, quantitative criteria
for module selection. Second, the modules consist of a balanced mix of qualitative
self-assessments and questions involving quantitative hypothetical trade-offs. This
gives the module an attractive balance between different approaches to assessing
preferences. Third, the module has a wide range of possible applications. The two
versions can be implemented in various survey modes, including modes with tight
time constraints. Some module items have already been validated in representative
samples, and in different countries. We additionally conducted an international pilot
in order to verify comprehension and implementability of the module across very
different cultures. Thus, the two versions of the module can be applied to a range of
different subject pools, from lab experiments, to large representative samples, or to
samples that are culturally very heterogeneous. Fourth, by providing an attractive
and low cost approach to measuring preferences the module has the potential for
widespread adoption, with potentially significant positive externalities in terms of
easier comparison of results across studies.
25

References
Barasinska, N., D. Schafer, and A. Stephan (2012): “Individual risk atti-
tudes and the composition of financial portfolios: Evidence from German house-
hold portfolios,” The Quarterly Review of Economics and Finance, 52(1), 1–14.
Bauernschuster, S., O. Falck, S. Heblich, J. Suedekum, and A. Lameli
(2014): “Why are educated and risk-loving persons more mobile across regions?,”
Journal of Economic Behavior & Organization, 98, 56–69.
Becker, A., T. Deckers, T. Dohmen, A. Falk, and F. Kosse (2012): “The
Relationship Between Economic Preferences and Psychological Personality Mea-
sures,” Annual Review of Economics, 4, 453–478.
Berg, J., J. Dickhaut, and K. McCabe (1995): “Trust, Reciprocity, and Social
History,” Games and Economic Behavior, 10(1), 122–142.
Beugelsdijk, S., H. de Groot, and A. van Schaik (2004): “Trust and Eco-
nomic Growth: A Robustness Analysis,” Oxford Economic Papers, 56(1), 118–
134.
Bonin, H., T. Dohmen, A. Falk, D. Huffman, and U. Sunde (2007): “Cross-
sectional earnings risk and occupational sorting: The role of risk attitudes,”
Labour Economics, 14(6), 926–937.
Caliendo, M., F. M. Fossen, and A. S. Kritikos (2009): “Risk attitudes of
nascent entrepreneurs: new evidence from an experimentally validated survey,”
Small Business Economics, 32(2), 153–167.
Cornsweet, T. N. (1962): “The Staircase-Method in Psychophysics,” American
Journal of Psychology, 75(3), 485–491.
Costa, P. T., and R. R. McCrae (1992): Revised NEO Personality Inventory
(NEO PI-R) and NEO Five-Factor Inventory (NEO-FFI) Professional Manual.
Odessa, FL: Psychological Assessment Resources.
26
Ding, X., J. Hartog, and Y. Sun (2010): “Can We Measure Risk Attitudes in
a Survey?,” IZA Discussion Paper No. 4807.
Dohmen, T., A. Falk, D. Huffman, and U. Sunde (2009): “Homo Recipro-
cans: Survey Evidence on Behavioral Outcomes,” Economic Journal, 119(536),
592–612.
(2010): “Are Risk Aversion and Impatience Related to Cognitive Ability,”
American Economic Review, 100(3), 1238–1260.
Dohmen, T., A. Falk, D. Huffman, U. Sunde, J. Schupp, and G. Wagner
(2011): “Individual Risk Attitudes: Measurement, Determinants, and Behavioral
Consequences,” Journal of the European Economic Association, 9(3), 522–550.
Einav, L., A. Finkelstein, I. Pascu, and M. R. Cullen (2012): “How Gen-
eral Are Risk Preferences? Choices under Uncertainty in Different Domains,”
American Economic Review, 102(6), 2606–2638.
Falk, A., A. Becker, T. Dohmen, B. Enke, D. Huffman, and U. Sunde
(2015): “The Nature and Predictive Power of Preferences: Global Evidence,” IZA
Discussion Paper No. 9504.
Falk, A., E. Fehr, and U. Fischbacher (2005): “Driving Forces Behind Infor-
mal Sanctions,” Econometrica, 73(6), 2017–2030.
Falk, A., and F. Zimmermann (2015): “Information Processing and Commit-
ment,” Working Paper.
(forthcoming): “Consistency as a Signal of Skills,” Management Science.
Fehr, E., U. Fischbacher, and S. Gachter (2002): “Strong Reciprocity, Hu-
man Cooperation, and the Enforcement of Social Norms,” Human Nature, 13(1),
1–25.
Fehr, E., U. Fischbacher, B. Rosenbladt, J. Schupp, and G. Wagner
(2003): “A Nation-Wide Laboratory: Examining Trust and Trustworthiness by
27
Integrating Behavioral Experiments into Representative Surveys,” Mimeo, Insti-
tute for Empirical Research in Economics.
Fehr, E., and S. Gachter (2000): “Cooperation and Punishment in Public
Goods Experiments,” American Economic Review, 90(4), 980–994.
Festinger, L. (1957): A Theory of Cognitive Dissonance. Stanford: Stanford
University Press.
Fischbacher, U. (2007): “zTree: Zurich Toolbox for Ready-made Economic Ex-
periments,” Experimental Economics, 10, 171–178.
Fouarge, D., B. Kriechel, and T. Dohmen (2014): “Occupational Sorting
of School Graduates: The Role of Economic Preferences,” Journal of Economic
Behavior & Organization, 106, 335–351.
Graybill, F. (1976): Theory and Application of the Linear Model. Wadsworth,
Belmont, California, USA.
Greiner, B. (2004): “An Online Recruitment System for Economic Experiments,”
Forschung und wissenschaftliches Rechnen, 63, 79–93.
Guth, W., R. Schmittberger, and B. Schwarze (1982): “An Experimental
Analysis of Ultimatum Bargaining,” Journal of Economic Behavior and Organi-
zation, 3(4), 367–388.
Hardeweg, B., L. Menkhoff, and H. Waibel (2013): “Experimentally-
Validated Survey Evidence on Individual Risk Attitudes in Rural Thailand,”
Economic Development and Cultural Change, 61(4), 859–888.
Holt, C. A., and S. K. Laury (2002): “Risk Aversion and Incentive Effects,”
American Economic Review, 92(5), 1644–1655.
Jaeger, D. A., T. Dohmen, A. Falk, D. Huffman, U. Sunde, and H. Bonin
(2010): “Direct Evidence on Risk Attitudes and Migration,” The Review of Eco-
nomics and Statistics, 92(3), 684–689.
28

Kadane, J., and N. Lazar (2004): “Methods and Criteria for Model Selection,”
Journal of the American Statistical Association, 99(465), 279–290.
Kirby, K., N. Petry, and W. Bickel (1999): “Heroin Addicts Have Higher
Discount Rates For Delayed Rewards Than Non-Drug-Using Controls,” Journal
of Experimental Psychology, 128(1), 78–87.
Knack, S., and P. Keefer (1997): “Does Social Capital Have An Economic
Payoff? A Cross-Country Investigation,” Quarterly Journal of Economics, 112(4),
1251–1288.
Komlos, J., P. Smith, and B. Bogin (2004): “Obesity and the Rate of Time
Preference: Is There a Connection?,” Journal of Biosocial Science, 36(2), 209–
219.
LaPorta, R., F. L. de Silanes, A. Shleifer, and R. Vishny (1997): “Trust
in Large Organizations,” American Economic Review (Papers and Proceedings),
87(2), 333–338.
Perugini, M., M. Gallucci, F. Presaghi, and A. Ercolani (2003): “The
Personal Norm of Reciprocity,” European Journal of Personality, 17(4), 251–283.
Rose-Ackerman, S. (1996): “Altruism, Non-Profits, and Economic Theory,”
Journal of Economic Literature, 34(2), 701–728.
Rotter, J. B. (1966): “Generalized Expectancies for Internal versus External Con-
trol of Reinforcement,” Psychological Monographs: General and Applied, 80(1),
1–28.
Selten, R. (1967): “Die Strategiemethode zur Erforschung des eingeschrankt ra-
tionalen Verhaltens im Rahmen eines Oligopolexperimentes,” in Beitrage zur ex-
perimentellen Wirtschaftsforschung, ed. by H. Sauermann. J.C.B. Mohr (Paul
Siebeck), Tubingen.
29
Smith, P., B. Bogin, and D. Bishai (2005): “Are Time Preference and Body
Mass Index Associated? Evidence from the National Longitudinal Survey of
Youth,” Economics and Human Biology, 3(2), 259–270.
Tanaka, T., C. Camerer, and Q. Nguyen (2010): “Risk and Time Preferences:
Linking Experimental and Household Survey Data from Vietnam,” American Eco-
nomic Review, 100(1), 557–571.
Tibshirani, R. (1996): “Regression Shrinkage and Selection via the Lasso,” Jour-
nal of the Royal Statistical Society. Series B (Methodological), 58(1), 267–288.
Vieider, F. M., M. Lefebre, R. Bouchouicha, T. Chmura, R. Hakimov,
M. Krawczyk, and P. Martinsson (2015): “Common Components of Risk
and Uncertainty Attitudes across Contexts and Domains: Evidence from 30 Coun-
tries,” Journal of the European Economic Association, 13(1), 421–452.
Vischer, T., T. Dohmen, A. Falk, D. Huffman, J. Schupp, U. Sunde, and
G. Wagner (2013): “Validating an Ultra-Short Survey Measure of Patience,”
Economics Letters, 120(2), 142–145.
Weber, E., A.-R. Blais, and N. Betz (2002): “A Domain-Specific Risk Attitude
Scale: Measuring Risk Perceptions and Risk Behaviors,” Journal of Behavioral
Decision Making, 15(4), 263–290.
Zak, P., and S. Knack (2001): “Trust and Growth,” Economic Journal, 111(470),
295–321.
Ziegelmeyer, F., and M. Ziegelmeyer (2012): “Parenting is a Risky Busi-
ness: Parental Risk Attitudes in Small Stakes Decisions on Their Child’s Behalf,”
Unpublished Manuscript.
30
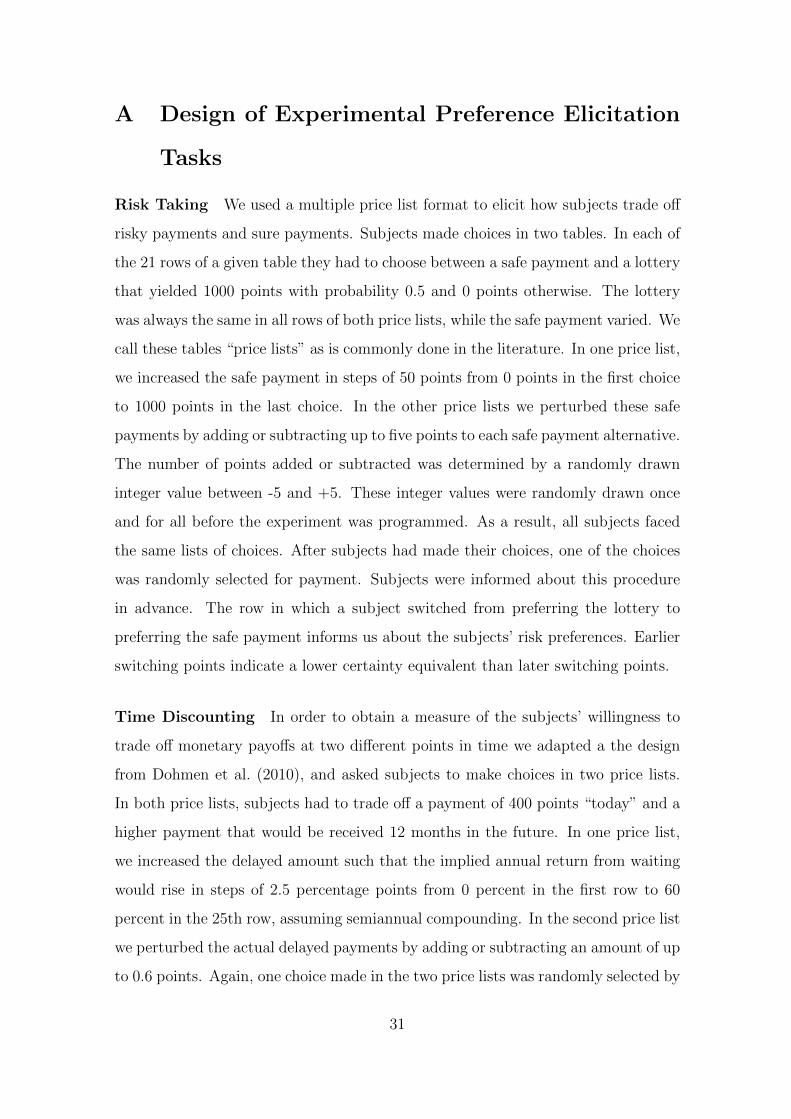
A Design of Experimental Preference Elicitation
Tasks
Risk Taking We used a multiple price list format to elicit how subjects trade off
risky payments and sure payments. Subjects made choices in two tables. In each of
the 21 rows of a given table they had to choose between a safe payment and a lottery
that yielded 1000 points with probability 0.5 and 0 points otherwise. The lottery
was always the same in all rows of both price lists, while the safe payment varied. We
call these tables “price lists” as is commonly done in the literature. In one price list,
we increased the safe payment in steps of 50 points from 0 points in the first choice
to 1000 points in the last choice. In the other price lists we perturbed these safe
payments by adding or subtracting up to five points to each safe payment alternative.
The number of points added or subtracted was determined by a randomly drawn
integer value between -5 and +5. These integer values were randomly drawn once
and for all before the experiment was programmed. As a result, all subjects faced
the same lists of choices. After subjects had made their choices, one of the choices
was randomly selected for payment. Subjects were informed about this procedure
in advance. The row in which a subject switched from preferring the lottery to
preferring the safe payment informs us about the subjects’ risk preferences. Earlier
switching points indicate a lower certainty equivalent than later switching points.
Time Discounting In order to obtain a measure of the subjects’ willingness to
trade off monetary payoffs at two different points in time we adapted a the design
from Dohmen et al. (2010), and asked subjects to make choices in two price lists.
In both price lists, subjects had to trade off a payment of 400 points “today” and a
higher payment that would be received 12 months in the future. In one price list,
we increased the delayed amount such that the implied annual return from waiting
would rise in steps of 2.5 percentage points from 0 percent in the first row to 60
percent in the 25th row, assuming semiannual compounding. In the second price list
we perturbed the actual delayed payments by adding or subtracting an amount of up
to 0.6 points. Again, one choice made in the two price lists was randomly selected by
31
the computer for payment. Subjects were informed about this procedure in advance.
We also notified subjects ex ante about the payment mode. In particular, they
were told that any payment resulting from this experiment would be delivered to
them via regular mail. If they chose the payment “today” the respective amount
would be sent on the same day. If they chose the payment “in 12 months”, it would
be sent to them exactly 12 months after the experiment. By keeping the payoff mode
identical over all time horizons we can rule out concerns about differential credibility
of payments dependent on timing, or simply a taste for a certain payoff mode, as
drivers of decision making. These features were made very salient to subjects: To
enhance credibility an envelope was placed in each cubicle and subjects had to write
on the envelope the address to which they wanted the payment delivered. In order
to allow us to identify the relevant payment they also had to note their identification
number on the envelope. No participant expressed any concern with respect to this
procedure.
The row in which a subject switched from preferring the earlier payment to the
larger delayed payment (or, equivalently, the implied annual rate of return in the
switching row) provides a measure of impatience.
Trust We conducted two versions of the Investment Game as introduced by Berg
et al. (1995). We refer to this as the Trust Game. In one version of this game
the amount sent by the first to the second mover was doubled by the experimenter,
in the second version the amount was tripled. In every version of this experiment
both subjects were endowed with 500 points. The choice set of the first mover
was restricted to amounts in {0, 50, 100, ..., 500}, because we applied the contingent
response method for the second mover. Each subject acted in the role of the first
and second mover in each version, such that overall each subject took part in four
Investment Games. All outcomes of the four decisions of the Investment Games
were payoff relevant. The average amount sent as a first mover in the two versions
serves as our measure of the subjects’ willingness to trust strangers.
32
Altruism Subjects were endowed with 300 points and had to decide how many
of these points to assign to a charitable organization. We gave them a list of
well-established and well-known charitable organizations with various purposes but
they could also name a different charitable organization to which they wanted the
money to be donated. The list of charitable organizations included: Brot fur die
Welt, Kindernothilfe, German Red Cross, Welthungerhilfe, Bund fur Umwelt und
Naturschutz Deutschland, Greenpeace, Terre des Hommes, and Aktion Mensch. At
the end of the laboratory session we gave the subjects an address of a website on
which they could look up all donations made to the charitable organizations. Sub-
jects were informed again about the possibility to check their donation after all
sessions had been conducted and the money had been transferred to the charitable
organizations. This was done in order to ensure credibility and transparency of the
procedure. The amount an individual transferred to charity serves as a measure of
their altruistic inclination.
Positive Reciprocity We elicited positive reciprocity from second mover behav-
ior in the Trust Games described above. The use of the contingent response method
for second mover behavior allowed us to measure how much a subject wanted to
send back for each possible amount sent to them by the first mover. The payoff
relevant choice was the one corresponding to the actual choice made by the first
mover. Average second mover behavior in the Investment Games then constitutes
our behavioral measure of the individual’s willingness to reciprocate positively. Sub-
jects were informed about their opponents’ decisions and the resulting payoffs at the
end of the laboratory session.
Negative Reciprocity We conducted two different types of experimental game
in order to elicit subjects’ willingness to reciprocate negatively. First, subjects took
part in two Ultimatum Games as introduced by Guth et al., 1982. Subjects were
randomly assigned the role of the proposer in one game and the role of the responder
in the other game. Proposers had to decide how many of 500 points they wanted
to offer to the responder. Responders, in turn, had to indicate their minimum
33
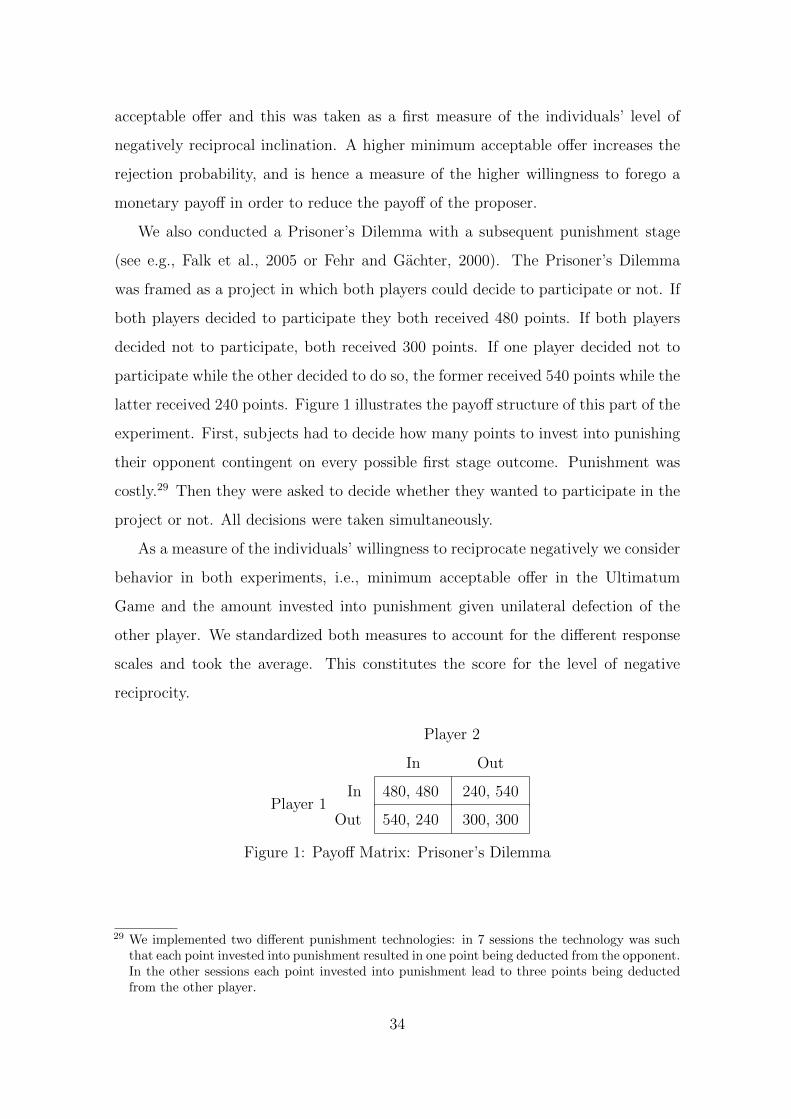
acceptable offer and this was taken as a first measure of the individuals’ level of
negatively reciprocal inclination. A higher minimum acceptable offer increases the
rejection probability, and is hence a measure of the higher willingness to forego a
monetary payoff in order to reduce the payoff of the proposer.
We also conducted a Prisoner’s Dilemma with a subsequent punishment stage
(see e.g., Falk et al., 2005 or Fehr and Gachter, 2000). The Prisoner’s Dilemma
was framed as a project in which both players could decide to participate or not. If
both players decided to participate they both received 480 points. If both players
decided not to participate, both received 300 points. If one player decided not to
participate while the other decided to do so, the former received 540 points while the
latter received 240 points. Figure 1 illustrates the payoff structure of this part of the
experiment. First, subjects had to decide how many points to invest into punishing
their opponent contingent on every possible first stage outcome. Punishment was
costly.29 Then they were asked to decide whether they wanted to participate in the
project or not. All decisions were taken simultaneously.
As a measure of the individuals’ willingness to reciprocate negatively we consider
behavior in both experiments, i.e., minimum acceptable offer in the Ultimatum
Game and the amount invested into punishment given unilateral defection of the
other player. We standardized both measures to account for the different response
scales and took the average. This constitutes the score for the level of negative
reciprocity.
Player 1
Player 2
In Out
In 480, 480 240, 540
Out 540, 240 300, 300
Figure 1: Payoff Matrix: Prisoner’s Dilemma
29 We implemented two different punishment technologies: in 7 sessions the technology was suchthat each point invested into punishment resulted in one point being deducted from the opponent.In the other sessions each point invested into punishment lead to three points being deductedfrom the other player.
34

B The Preference Module
1. Risk Taking
(a) List of 31 hypothetical choices between a lottery (300 Euro with a 50-
percent chance and 0 Euro with a 50-percent chance) and varying safe
options (starting at 0 Euro and increasing to 300 Euro in increments of
10 Euro)
(b) How do you see yourself: are you a person who is generally willing to
take risks, or do you try to avoid taking risks? Please use a scale from 0
to 10, where a 0 means you are “completely unwilling to take risks” and
a 10 means you are “very willing to take risks”. You can also use the
values in-between to indicate where you fall on the scale.
2. Time Discounting
(a) List of 25 hypothetical choices between an early payment “today” (100
Euro) and a varying delayed payment “in 12 months” (100.0/103.0/106.1/
109.2/112.4/115.6/118.8/122.1/125.4/128.8/132.3/135.7/139.2/ 142.8/
146.4/150.1/153.8/157.5 161.3/165.1/169.0/172.9/176.9/180.9/185 Euro).
(b) In comparison to others, are you a person who is generally willing to give
up something today in order to benefit from that in the future or are you
not willing to do so? Please use a scale from 0 to 10, where a 0 means you
are “completely unwilling to give up something today” and a 10 means
you are “very willing to give up something today”. You can also use the
values in-between to indicate where you fall on the scale.
3. Trust
(a) Please consider the following situation: You and another person, whom
you do not know, both participate in a study where you can decide on
how to assign a certain amount of money and thereby determine the
outcome. The rules are as follows. Both participants get an account with
20 Euros. At the beginning, both participants thus own 20 Euros. The
35

other person decides first. She can transfer money to your account. She
can transfer any amount: 0, 1, 2 Euro, etc. up to 20 Euro. Each Euro
that she transfers to you is tripled by the conductors of the study and
booked to your account. After this first stage the other person therefore
has 20 Euro minus the amount she transferred to you in her account. You
have 20 Euro plus the tripled amount of the transfer of the other person
on your account. Now you get to decide: you have the opportunity to
transfer money back to the other person. You can transfer any amount up
to 80 Euro, depending on how much you have in your account. This will
be the end of the study and the account balances will be final. The other
person has in her account 20 Euros minus the amount she transferred to
you plus the amount you transferred back. You have 20 Euro plus the
tripled amount of what the other person transferred to you minus the
amount you transferred back to her. We would like to know how much
you would choose to transfer back to the other person, for a given transfer
of her to you.
Suppose you were assigned the role of the other person. Which amount
would you choose to transfer?
(b) How well does the following statement describe you as a person? As long
as I am not convinced otherwise, I assume that people have only the best
intentions. Please use a scale from 0 to 10, where 0 means “does not
describe me at all” and a 10 means “describes me perfectly”. You can
also use the values in-between to indicate where you fall on the scale.
4. Altruism
(a) Imagine the following situation: you won 1,000 Euro in a lottery. Con-
sidering your current situation, how much would you donate to charity?
(Values between 0 and 1000 are allowed)
(b) How do you assess your willingness to share with others without expecting
anything in return when it comes to charity? Please use a scale from 0
to 10, where 0 means you are “completely unwilling to share” and a 10
36

means you are “very willing to share”. You can also use the values in-
between to indicate where you fall on the scale.
5. Positive Reciprocity
(a) Please consider the following situation: You and another person, whom
you do not know, both participate in a study where you can decide on
how to assign a certain amount of money and thereby determine the
outcome. The rules are as follows. Both participants get an account with
20 Euros. At the beginning, both participants thus own 20 Euros. The
other person decides first. She can transfer money to your account. She
can transfer any amount: 0, 1, 2 Euro, etc. up to 20 Euro. Each Euro
that she transfers to you is tripled by the conductors of the study and
booked to your account. After this first stage the other person therefore
has 20 Euro minus the amount she transferred to you in her account. You
have 20 Euro plus the tripled amount of the transfer of the other person
on your account. Now you get to decide: you have the opportunity to
transfer money back to the other person. You can transfer any amount up
to 80 Euro, depending on how much you have in your account. This will
be the end of the study and the account balances will be final. The other
person has in her account 20 Euros minus the amount she transferred to
you plus the amount you transferred back. You have 20 Euro plus the
tripled amount of what the other person transferred to you minus the
amount you transferred back to her. We would like to know how much
you would choose to transfer back to the other person, for a given transfer
of her to you.
Suppose the other person transfers 5/10/15/20 Euro to your account.
After the first stage you then own 20+3*5/10/15/20=35/50/65/80 Euro,
the other person owns 20-5/10/15/20=15/10/5/0 Euro. What amount
do you choose to transfer back?
(b) Imagine the following situation: you are shopping in an unfamiliar city
and realize you lost your way. You ask a stranger for directions. The
37

stranger offers to take you with their car to your destination. The ride
takes about 20 minutes and costs the stranger about 20 Euro in total.
The stranger does not want money for it. You carry six bottles of wine
with you. The cheapest bottle costs 5 Euro, the most expensive one 30
Euro. You decide to give one of the bottles to the stranger as a thank-you
gift. Which bottle do you give?
Respondents can choose from the following options: The bottle for 5, 10,
15, 20, 25, or 30 Euro)
6. Negative Reciprocity
(a) Imagine the following situation: together with a person whom you do not
know you won 100 Euro in a lottery. The rules stipulate the following:
One of you has to make a proposal about how to divide the 100 Euro
between you two. The other one gets to know the proposal and has to
decide between two options. He or she can accept the proposal or reject
it. If he or she accepts the proposal, the money is divided according to
the proposal. If he or she rejects the proposal, both receive nothing.
Suppose that the other person offered the following split: 50 Euro for you
and 50 Euro for himself/herself. Do you accept this split? If you do, you
will receive 50 Euro and the other person will receive 50 Euro. If you
reject, both of you receive 0 Euro.
Note that individuals answered a total of 5 questions that use the same
wording but vary the amount that was offered by the other person. These
amounts were 50, 40, 30, 20, and 10.
(b) How do you see yourself: Are you a person who is generally willing to
punish unfair behavior even if this is costly? Please use a scale from 0
to 10, where 0 means you are “not willing at all to incur costs to punish
unfair behavior” and a 10 means you are “very willing to incur costs
to punish unfair behavior”. You can also use the values in-between to
indicate where you fall on the scale.
38
C Development of Streamlined Version of the Pref-
erence Module
In this appendix, we document the steps involved in streamlining the module for
each preference domain.
C.1 Risk Taking
For the sub-module for risk taking, we discarded the multiple price list measure from
the set of candidate items, and ran the selection procedure described in section 3
on the restricted set of items. The “staircase” procedure for a hypothetical lottery
choice (see Appendix E) was selected. This quantitative measure is very comparable
to the choice list measure, as it contains the same lottery. Yet, it is much more time-
efficient to use “staircase” procedure, as it only requires five interdependent choices
between a lottery and a safe payment. The other item selected for risk was the
same qualitative measure selected in the original module. The resulting reduction
in explanatory power of the streamlined version compared to the original version
in terms of R2 is only 0.02. Since the term “lottery” in the description of the
hypothetical risky choices was troubling to some Muslim participants in our pilot
study, we replaced the term “lottery” with the more neutral but equally accurate
term “random draw”.
C.2 Time discounting
For the sub-module for time discounting, we discarded the multiple price list measure
from the set of candidate items, and ran the selection procedure described in section
3 on the restricted set of items. The “staircase” procedure for intertemporal choice
(see Appendix F) was selected. This quantitative measure mirrors the hypothetical
choice list for the same intertemporal trade-off as in the original version of the
module, as it contains the same monetary amount for the early payment. Yet,
it is much more time-efficient to use “staircase” procedure, since it only requires
five interdependent choices between an early payment and a delayed payment. The
39
other item selected for time discounting is again a subjective self-assessment, albeit a
slightly different one than in the original module version. Instead of the item asking
for a self-assessment of one’s willingness to abstain from something today in order
to benefit from that in the future in comparison to others, the item selected asks for
the same self-assessment in general. Since this change was only minor relative to the
original module we modified the sub-module accordingly. The resulting reduction of
0.04 in adjusted R2 compared to the original module version is again rather modest.
Since some participants in our pilot study stated that their answer in questions
involving intertemporal tradeoffs would depend on the rate of inflation, or said that
they would always take the immediate payment due to uncertainty with respect to
future inflation, we added the following phrase to each question involving hypotheti-
cal choices between immediate and future monetary amounts: “Please assume there
is no inflation, i.e., future prices are the same as today’s prices.”
C.3 Trust
We discarded the hypothetical investment game, which involves rather lengthy and
complex instructions. Since there was no adequate and implementable alternative
for the hypothetical experiment, and since trust has been widely measured using
qualitative measures, we opted for a one-item sub-module for trust.
C.4 Altruism
Sine the term “charity” caused confusion in Eastern Europe and Central Asia, we
replaced it with “good cause”.
C.5 Positive Reciprocity
For positive reciprocity, we discarded the hypothetical choices as a second mover in
the investment games before running the selection procedure. Corresponding to the
original sub-module, the procedure selected the quantitative item measuring one’s
willingness to reciprocate by asking for which wine bottle (a cheaper or a more
expensive one) one would give to a stranger in order to reciprocate kindness in a
40

hypothetical scenario. Since giving a bottle of wine is a very common and popular
gesture in Western industrialized societies but very uncommon or even inappropriate
in other cultures, e.g., Muslim societies, we replaced “bottles of wine” with the more
neutral term “thank-you-gift”. As a second item, the selection procedure picked a
simple subjective self-assessment: “When someone does me a favor I am willing to
return it”. The resulting modified sub-module for positive reciprocity comes with a
reduction in adjusted R2 to 0.19 in our experimental subject pool.
C.6 Negative Reciprocity
In the case of negative reciprocity we discarded the hypothetical experiment. The
item selection procedure resulted in selecting two qualitative self-assessments, the
first of them being the “general willingness to punish”-item that was also included
in our original module version. In this case, there was a reduction in adjusted R2 by
0.0975 relative to our original module. Since the second item strongly resembled the
first item (“general willingness to punish”), we decided to instead include an item
asking for one’s willingness to take revenge, thereby adding a more emotional and
less neutral item to the sub-module. This change resulted in a negligible reduction
of adjusted R2 of 0.0047).
Since some respondents in our pilot study stated that they had difficulties answer-
ing the question asking about one’s willingness to punish unfair behavior because
they did not understand who was treated unfairly, we decided to split the ques-
tion into two separate items, one item asking for one’s willingness to punish unfair
behavior towards others, and another asking for one’s willingness to punish unfair
behavior towards oneself.
41
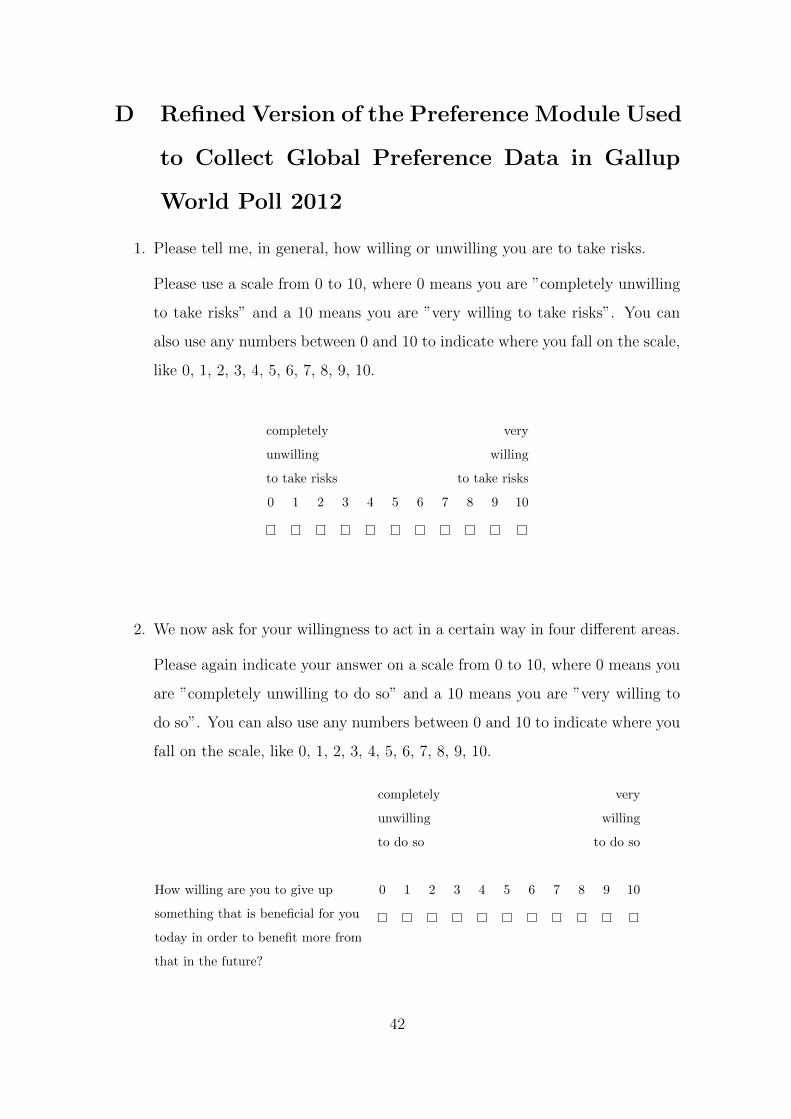
D Refined Version of the Preference Module Used
to Collect Global Preference Data in Gallup
World Poll 2012
1. Please tell me, in general, how willing or unwilling you are to take risks.
Please use a scale from 0 to 10, where 0 means you are ”completely unwilling
to take risks” and a 10 means you are ”very willing to take risks”. You can
also use any numbers between 0 and 10 to indicate where you fall on the scale,
like 0, 1, 2, 3, 4, 5, 6, 7, 8, 9, 10.
completely very
unwilling willing
to take risks to take risks
0 1 2 3 4 5 6 7 8 9 10
2. We now ask for your willingness to act in a certain way in four different areas.
Please again indicate your answer on a scale from 0 to 10, where 0 means you
are ”completely unwilling to do so” and a 10 means you are ”very willing to
do so”. You can also use any numbers between 0 and 10 to indicate where you
fall on the scale, like 0, 1, 2, 3, 4, 5, 6, 7, 8, 9, 10.
completely very
unwilling willing
to do so to do so
How willing are you to give up 0 1 2 3 4 5 6 7 8 9 10
something that is beneficial for you
today in order to benefit more from
that in the future?
42

How willing are you to punish 0 1 2 3 4 5 6 7 8 9 10
someone who treats you unfairly,
even if there may be costs for you?
How willing are you to punish 0 1 2 3 4 5 6 7 8 9 10
someone who treats others unfairly,
even if there may be costs for you?
How willing are you to give to good 0 1 2 3 4 5 6 7 8 9 10
causes without expecting anything
in return?
3. How well do the following statements describe you as a person?
Please indicate your answer on a scale from 0 to 10. A 0 means ”does not
describe me at all” and a 10 means ”describes me perfectly”. You can also use
any numbers between 0 and 10 to indicate where you fall on the scale, like 0,
1, 2, 3, 4, 5, 6, 7, 8, 9, 10.
does not describe describes me
me at all perfectly
When someone does me a favor 0 1 2 3 4 5 6 7 8 9 10
I am willing to return it.
If I am treated very unjustly, I will 0 1 2 3 4 5 6 7 8 9 10
take revenge at the first occasion,
even if there is a cost to do so.
I assume that people have only 0 1 2 3 4 5 6 7 8 9 10
the best intentions.
4. Please imagine the following situation: You can choose between a sure payment
of a particular amount of money, or a draw, where you would have an equal
chance of getting 300 Euro or getting nothing. We will present to you five
different situations.
43

4.1 What would you prefer: a draw with a 50 percent chance of receiving
300 Euro, and the same 50 percent chance of receiving nothing, or the
amount of 160 Euro as a sure payment?
= 50/50 chance → Go to question 4.17
= Sure payment → Go to question 4.2
4.2 Would you prefer the 50/50 chance or the amount of 80 Euro as a sure
payment?
= 50/50 chance → Go to question 4.10
= Sure payment → Go to question 4.3
4.3 Would you prefer the 50/50 chance or the amount of 40 Euro as a sure
payment?
= 50/50 chance → Go to question 4.4
= Sure payment → Go to question 4.7
4.4 Would you prefer the 50/50 chance or the amount of 60 Euro as a sure
payment?
= 50/50 chance → Go to question 4.5
= Sure payment → Go to question 4.6
4.5 Would you prefer the 50/50 chance or the amount of 70 Euro as a sure
payment?
= 50/50 chance → Go to question 5
= Sure payment → Go to question 5
4.6 Would you prefer the 50/50 chance or the amount of 50 Euro as a sure
payment?
= 50/50 chance → Go to question 5
= Sure payment → Go to question 5
4.7 Would you prefer the 50/50 chance or the amount of 20 Euro as a sure
payment?
= 50/50 chance → Go to question 4.8
= Sure payment → Go to question 4.9
44

4.8 Would you prefer the 50/50 chance or the amount of 30 Euro as a sure
payment?
= 50/50 chance → Go to question 5
= Sure payment → Go to question 5
4.9 Would you prefer the 50/50 chance or the amount of 10 Euro as a sure
payment?
= 50/50 chance → Go to question 5
= Sure payment → Go to question 5
4.10 Would you prefer the 50/50 chance or the amount of 120 Euro as a sure
payment?
= 50/50 chance → Go to question 4.14
= Sure payment → Go to question 4.11
4.11 Would you prefer the 50/50 chance or the amount of 100 Euro as a sure
payment?
= 50/50 chance → Go to question 4.13
= Sure payment → Go to question 4.12
4.12 Would you prefer the 50/50 chance or the amount of 90 Euro as a sure
payment?
= 50/50 chance → Go to question 5
= Sure payment → Go to question 5
4.13 Would you prefer the 50/50 chance or the amount of 110 Euro as a sure
payment?
= 50/50 chance → Go to question 5
= Sure payment → Go to question 5
4.14 Would you prefer the 50/50 chance or the amount of 140 Euro as a sure
payment?
= 50/50 chance → Go to question 4.15
= Sure payment → Go to question 4.16
45

4.15 Would you prefer the 50/50 chance or the amount of 150 Euro as a sure
payment?
= 50/50 chance → Go to question 5
= Sure payment → Go to question 5
4.16 Would you prefer the 50/50 chance or the amount of 130 Euro as a sure
payment?
= 50/50 chance → Go to question 5
= Sure payment → Go to question 5
4.17 Would you prefer the 50/50 chance or the amount of 240 Euro as a sure
payment?
= 50/50 chance → Go to question 4.25
= Sure payment → Go to question 4.18
4.18 Would you prefer the 50/50 chance or the amount of 200 Euro as a sure
payment?
= 50/50 chance → Go to question 4.22
= Sure payment → Go to question 4.19
4.19 Would you prefer the 50/50 chance or the amount of 180 Euro as a sure
payment?
= 50/50 chance → Go to question 4.20
= Sure payment → Go to question 4.21
4.20 Would you prefer the 50/50 chance or the amount of 190 Euro as a sure
payment?
= 50/50 chance → Go to question 5
= Sure payment → Go to question 5
4.21 Would you prefer the 50/50 chance or the amount of 170 Euro as a sure
payment?
= 50/50 chance → Go to question 5
= Sure payment → Go to question 5
46

4.22 Would you prefer the 50/50 chance or the amount of 220 Euro as a sure
payment?
= 50/50 chance → Go to question 4.23
= Sure payment → Go to question 4.24
4.23 Would you prefer the 50/50 chance or the amount of 230 Euro as a sure
payment?
= 50/50 chance → Go to question 5
= Sure payment → Go to question 5
4.24 Would you prefer the 50/50 chance or the amount of 210 Euro as a sure
payment?
= 50/50 chance → Go to question 5
= Sure payment → Go to question 5
4.25 Would you prefer the 50/50 chance or the amount of 280 Euro as a sure
payment?
= 50/50 chance → Go to question 4.29
= Sure payment → Go to question 4.26
4.26 Would you prefer the 50/50 chance or the amount of 260 Euro as a sure
payment?
= 50/50 chance → Go to question 4.27
= Sure payment → Go to question 4.28
4.27 Would you prefer the 50/50 chance or the amount of 270 Euro as a sure
payment?
= 50/50 chance → Go to question 5
= Sure payment → Go to question 5
4.28 Would you prefer the 50/50 chance or the amount of 250 Euro as a sure
payment?
= 50/50 chance → Go to question 5
= Sure payment → Go to question 5
47

4.29 Would you prefer the 50/50 chance or the amount of 300 Euro as a sure
payment?
= 50/50 chance → Go to question 4.31
= Sure payment → Go to question 4.30
4.30 Would you prefer the 50/50 chance or the amount of 290 Euro as a sure
payment?
= 50/50 chance → Go to question 5
= Sure payment → Go to question 5
4.31 Would you prefer the 50/50 chance or the amount of 310 Euro as a sure
payment?
= 50/50 chance → Go to question 5
= Sure payment → Go to question 5
5. Please think about what you would do in the following situation.
You are in an area you are not familiar with, and you realize that you lost
your way. You ask a stranger for directions. The stranger offers to take you
to your destination. Helping you costs the stranger about 20 Euro in total.
However, the stranger says he or she does not want any money from you.
You have 6 presents with you. The cheapest present costs 5 Euro, the most
expensive one costs 30 Euro. Do you give one of the presents to the stranger
as a ”thank-you”-gift? If so, which present do you give to the stranger?
no present
the present worth 5 Euro
the present worth 10 Euro
the present worth 15 Euro
the present worth 20 Euro
the present worth 25 Euro
the present worth 30 Euro
48

6. Imagine the following situation: Today you unexpectedly received 1,000 Euro.
How much of this amount would you donate to a good cause? (Values between
0 and 1,000 are allowed)
7. Suppose you were given the choice between receiving a payment today or a
payment in 12 months. We will now present to you 5 situations. The payment
today is the same in each of these situations. The payment in 12 months is
different in every situation. For each of these situations we would like to know
which you would choose. Please assume there is no inflation, i.e. future prices
are the same as today’s prices.
7.1 Please consider the following: would you rather receive 100 Euro today
or 154 Euro in 12 months?
= Today → Go to question 7.17
= In 12 months → Go to question 7.2
7.2 Would you rather receive 100 Euro today or 125 Euro in 12 months?
= Today → Go to question 7.10
= In 12 months → Go to question 7.3
7.3 Would you rather receive 100 Euro today or 112 Euro in 12 months?
= Today → Go to question 7.7
= In 12 months → Go to question 7.4
7.4 Would you rather receive 100 Euro today or 106 Euro in 12 months?
= Today → Go to question 7.6
= In 12 months → Go to question 7.5
7.5 Would you rather receive 100 Euro today or 103 Euro in 12 months?
= Today [Final question]
= In 12 months [Final question]
7.6 Would you rather receive 100 Euro today or 109 Euro in 12 months?
= Today [Final question]
= In 12 months [Final question]
49
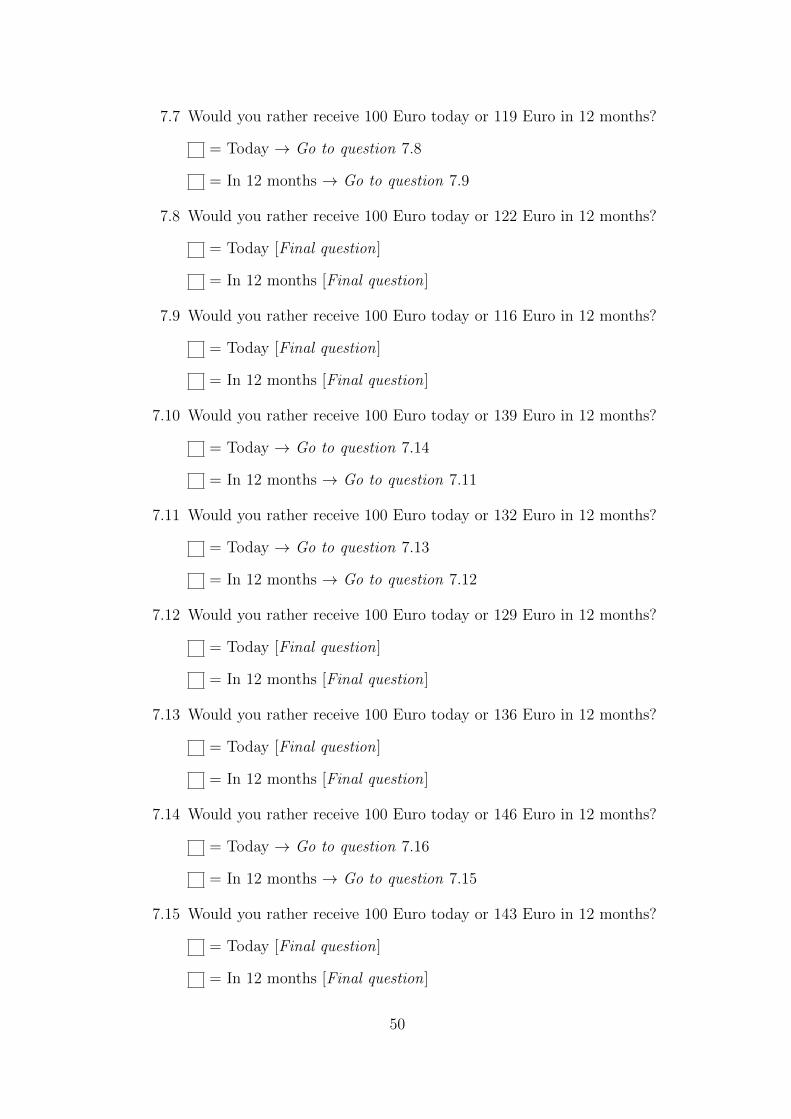
7.7 Would you rather receive 100 Euro today or 119 Euro in 12 months?
= Today → Go to question 7.8
= In 12 months → Go to question 7.9
7.8 Would you rather receive 100 Euro today or 122 Euro in 12 months?
= Today [Final question]
= In 12 months [Final question]
7.9 Would you rather receive 100 Euro today or 116 Euro in 12 months?
= Today [Final question]
= In 12 months [Final question]
7.10 Would you rather receive 100 Euro today or 139 Euro in 12 months?
= Today → Go to question 7.14
= In 12 months → Go to question 7.11
7.11 Would you rather receive 100 Euro today or 132 Euro in 12 months?
= Today → Go to question 7.13
= In 12 months → Go to question 7.12
7.12 Would you rather receive 100 Euro today or 129 Euro in 12 months?
= Today [Final question]
= In 12 months [Final question]
7.13 Would you rather receive 100 Euro today or 136 Euro in 12 months?
= Today [Final question]
= In 12 months [Final question]
7.14 Would you rather receive 100 Euro today or 146 Euro in 12 months?
= Today → Go to question 7.16
= In 12 months → Go to question 7.15
7.15 Would you rather receive 100 Euro today or 143 Euro in 12 months?
= Today [Final question]
= In 12 months [Final question]
50
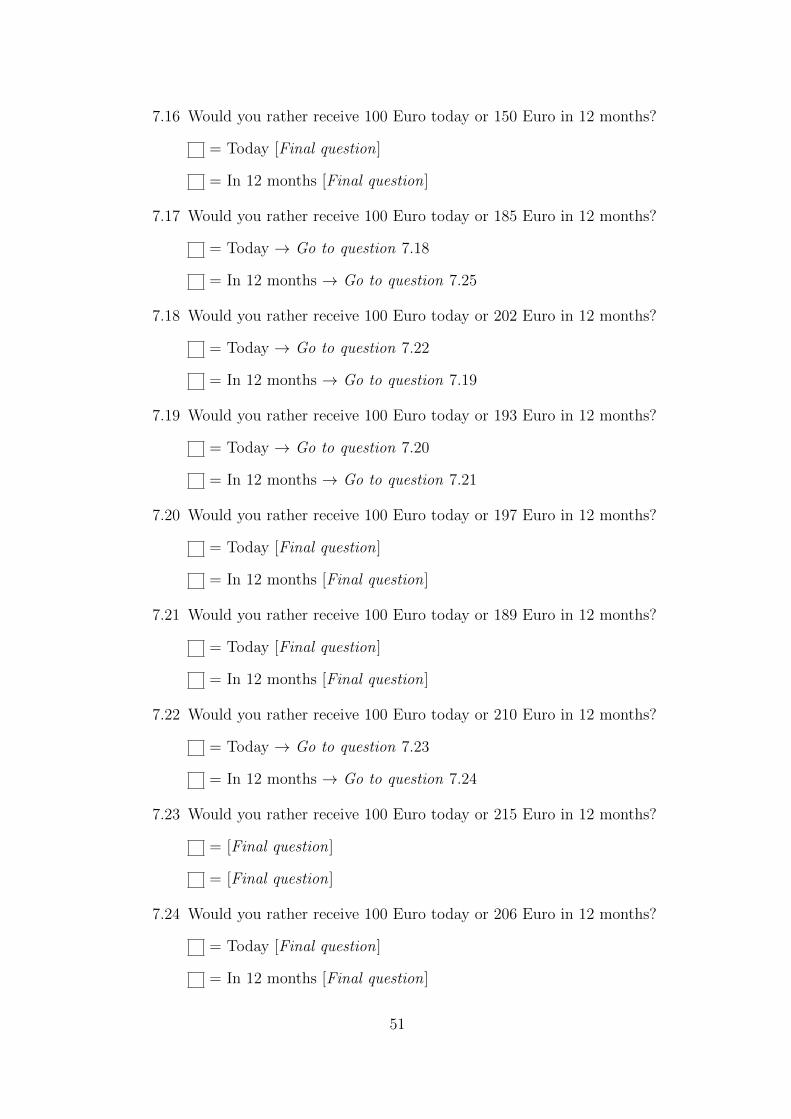
7.16 Would you rather receive 100 Euro today or 150 Euro in 12 months?
= Today [Final question]
= In 12 months [Final question]
7.17 Would you rather receive 100 Euro today or 185 Euro in 12 months?
= Today → Go to question 7.18
= In 12 months → Go to question 7.25
7.18 Would you rather receive 100 Euro today or 202 Euro in 12 months?
= Today → Go to question 7.22
= In 12 months → Go to question 7.19
7.19 Would you rather receive 100 Euro today or 193 Euro in 12 months?
= Today → Go to question 7.20
= In 12 months → Go to question 7.21
7.20 Would you rather receive 100 Euro today or 197 Euro in 12 months?
= Today [Final question]
= In 12 months [Final question]
7.21 Would you rather receive 100 Euro today or 189 Euro in 12 months?
= Today [Final question]
= In 12 months [Final question]
7.22 Would you rather receive 100 Euro today or 210 Euro in 12 months?
= Today → Go to question 7.23
= In 12 months → Go to question 7.24
7.23 Would you rather receive 100 Euro today or 215 Euro in 12 months?
= [Final question]
= [Final question]
7.24 Would you rather receive 100 Euro today or 206 Euro in 12 months?
= Today [Final question]
= In 12 months [Final question]
51

7.25 Would you rather receive 100 Euro today or 169 Euro in 12 months?
= Today → Go to question 7.29
= In 12 months → Go to question 7.26
7.26 Would you rather receive 100 Euro today or 161 Euro in 12 months?
= Today → Go to question 7.28
= In 12 months → Go to question 7.27
7.27 Would you rather receive 100 Euro today or 158 Euro in 12 months?
= Today [Final question]
= In 12 months [Final question]
7.28 Would you rather receive 100 Euro today or 165 Euro in 12 months?
= Today [Final question]
= In 12 months [Final question]
7.29 Would you rather receive 100 Euro today or 177 Euro in 12 months?
= Today → Go to question 7.31
= In 12 months → Go to question 7.30
7.30 Would you rather receive 100 Euro today or 173 Euro in 12 months?
= Today [Final question]
= In 12 months [Final question]
7.31 Would you rather receive 100 Euro today or 181 Euro in 12 months?
= Today [Final question]
= In 12 months [Final question]
52

E Staircase Risk
The staircase procedure for eliciting risk preferences consists of a sequence of lottery
choices. Everybody starts with the same first question. The choice for the lottery
or the safe payment option then determines the next question in the sequence. This
procedure is repeated four times. Subjects were instructed as follows:
Please imagine the following situation: You can choose between a sure payment
and a lottery. The lottery gives you a 50 percent chance of receiving 300 Euro.
With an equally high chance you receive nothing. Now imagine you had to choose
between the lottery and a sure payment. We will present to you five different sit-
uations. The lottery is the same in all situations. The sure payment is different in
every situation.
1. What would you prefer: a 50 percent chance of winning 300 Euro when at the
same time there is 50 percent chance of winning nothing, or would you rather
have the amount of 160 Euro as a sure payment?
(a) lottery → go to question 17
(b) sure payment → go to question 2
2. What would you prefer: a 50 percent chance of winning 300 Euro when at the
same time there is 50 percent chance of winning nothing, or would you rather
have the amount of 80 Euro as a sure payment?
(a) lottery → go to question 10
(b) sure payment → go to question 3
3. What would you prefer: a 50 percent chance of winning 300 Euro when at the
same time there is 50 percent chance of winning nothing, or would you rather
have the amount of 40 Euro as a sure payment?
(a) lottery → go to question 4
(b) sure payment → go to question 7
53

4. What would you prefer: a 50 percent chance of winning 300 Euro when at the
same time there is 50 percent chance of winning nothing, or would you rather
have the amount of 60 Euro as a sure payment?
(a) lottery → go to question 5
(b) sure payment → go to question 6
5. What would you prefer: a 50 percent chance of winning 300 Euro when at the
same time there is 50 percent chance of winning nothing, or would you rather
have the amount of 70 Euro as a sure payment?
(a) lottery
(b) sure payment
6. What would you prefer: a 50 percent chance of winning 300 Euro when at the
same time there is 50 percent chance of winning nothing, or would you rather
have the amount of 50 Euro as a sure payment?
(a) lottery
(b) sure payment
7. What would you prefer: a 50 percent chance of winning 300 Euro when at the
same time there is 50 percent chance of winning nothing, or would you rather
have the amount of 20 Euro as a sure payment?
(a) lottery → go to question 8
(b) sure payment → go to question 9
8. What would you prefer: a 50 percent chance of winning 300 Euro when at the
same time there is 50 percent chance of winning nothing, or would you rather
have the amount of 30 Euro as a sure payment?
(a) lottery
(b) sure payment
54

9. What would you prefer: a 50 percent chance of winning 300 Euro when at the
same time there is 50 percent chance of winning nothing, or would you rather
have the amount of 10 Euro as a sure payment?
(a) lottery
(b) sure payment
10. What would you prefer: a 50 percent chance of winning 300 Euro when at the
same time there is 50 percent chance of winning nothing, or would you rather
have the amount of 120 Euro as a sure payment?
(a) lottery → go to question 14
(b) sure payment → go to question 11
11. What would you prefer: a 50 percent chance of winning 300 Euro when at the
same time there is 50 percent chance of winning nothing, or would you rather
have the amount of 100 Euro as a sure payment?
(a) lottery → go to question 13
(b) sure payment → go to question 12
12. What would you prefer: a 50 percent chance of winning 300 Euro when at the
same time there is 50 percent chance of winning nothing, or would you rather
have the amount of 90 Euro as a sure payment?
(a) lottery
(b) sure payment
13. What would you prefer: a 50 percent chance of winning 300 Euro when at the
same time there is 50 percent chance of winning nothing, or would you rather
have the amount of 110 Euro as a sure payment?
(a) lottery
(b) sure payment
55

14. What would you prefer: a 50 percent chance of winning 300 Euro when at the
same time there is 50 percent chance of winning nothing, or would you rather
have the amount of 140 Euro as a sure payment?
(a) lottery → go to question 15
(b) sure payment → go to question 16
15. What would you prefer: a 50 percent chance of winning 300 Euro when at the
same time there is 50 percent chance of winning nothing, or would you rather
have the amount of 150 Euro as a sure payment?
(a) lottery
(b) sure payment
16. What would you prefer: a 50 percent chance of winning 300 Euro when at the
same time there is 50 percent chance of winning nothing, or would you rather
have the amount of 130 Euro as a sure payment?
(a) lottery
(b) sure payment
17. What would you prefer: a 50 percent chance of winning 300 Euro when at the
same time there is 50 percent chance of winning nothing, or would you rather
have the amount of 240 Euro as a sure payment?
(a) lottery → go to question 25
(b) sure payment → go to question 18
18. What would you prefer: a 50 percent chance of winning 300 Euro when at the
same time there is 50 percent chance of winning nothing, or would you rather
have the amount of 200 Euro as a sure payment?
(a) lottery → go to question 22
(b) sure payment → go to question 19
56

19. What would you prefer: a 50 percent chance of winning 300 Euro when at the
same time there is 50 percent chance of winning nothing, or would you rather
have the amount of 180 Euro as a sure payment?
(a) lottery → go to question 20
(b) sure payment → go to question 21
20. What would you prefer: a 50 percent chance of winning 300 Euro when at the
same time there is 50 percent chance of winning nothing, or would you rather
have the amount of 190 Euro as a sure payment?
(a) lottery
(b) sure payment
21. What would you prefer: a 50 percent chance of winning 300 Euro when at the
same time there is 50 percent chance of winning nothing, or would you rather
have the amount of 170 Euro as a sure payment?
(a) lottery
(b) sure payment
22. What would you prefer: a 50 percent chance of winning 300 Euro when at the
same time there is 50 percent chance of winning nothing, or would you rather
have the amount of 220 Euro as a sure payment?
(a) lottery → go to question 23
(b) sure payment → go to question 24
23. What would you prefer: a 50 percent chance of winning 300 Euro when at the
same time there is 50 percent chance of winning nothing, or would you rather
have the amount of 230 Euro as a sure payment?
(a) lottery
(b) sure payment
57

24. What would you prefer: a 50 percent chance of winning 300 Euro when at the
same time there is 50 percent chance of winning nothing, or would you rather
have the amount of 210 Euro as a sure payment?
(a) lottery
(b) sure payment
25. What would you prefer: a 50 percent chance of winning 300 Euro when at the
same time there is 50 percent chance of winning nothing, or would you rather
have the amount of 280 Euro as a sure payment?
(a) lottery → go to question 29
(b) sure payment → go to question 26
26. What would you prefer: a 50 percent chance of winning 300 Euro when at the
same time there is 50 percent chance of winning nothing, or would you rather
have the amount of 260 Euro as a sure payment?
(a) lottery → go to question 27
(b) sure payment → go to question 28
27. What would you prefer: a 50 percent chance of winning 300 Euro when at the
same time there is 50 percent chance of winning nothing, or would you rather
have the amount of 270 Euro as a sure payment?
(a) lottery
(b) sure payment
28. What would you prefer: a 50 percent chance of winning 300 Euro when at the
same time there is 50 percent chance of winning nothing, or would you rather
have the amount of 250 Euro as a sure payment?
(a) lottery
(b) sure payment
58

29. What would you prefer: a 50 percent chance of winning 300 Euro when at the
same time there is 50 percent chance of winning nothing, or would you rather
have the amount of 300 Euro as a sure payment?
(a) lottery → go to question 31
(b) sure payment → go to question 30
30. What would you prefer: a 50 percent chance of winning 300 Euro when at the
same time there is 50 percent chance of winning nothing, or would you rather
have the amount of 290 Euro as a sure payment?
(a) lottery
(b) sure payment
31. What would you prefer: a 50 percent chance of winning 300 Euro when at the
same time there is 50 percent chance of winning nothing, or would you rather
have the amount of 310 Euro as a sure payment?
(a) lottery
(b) sure payment
The staircase procedure is illustrated in Figure 2.
59
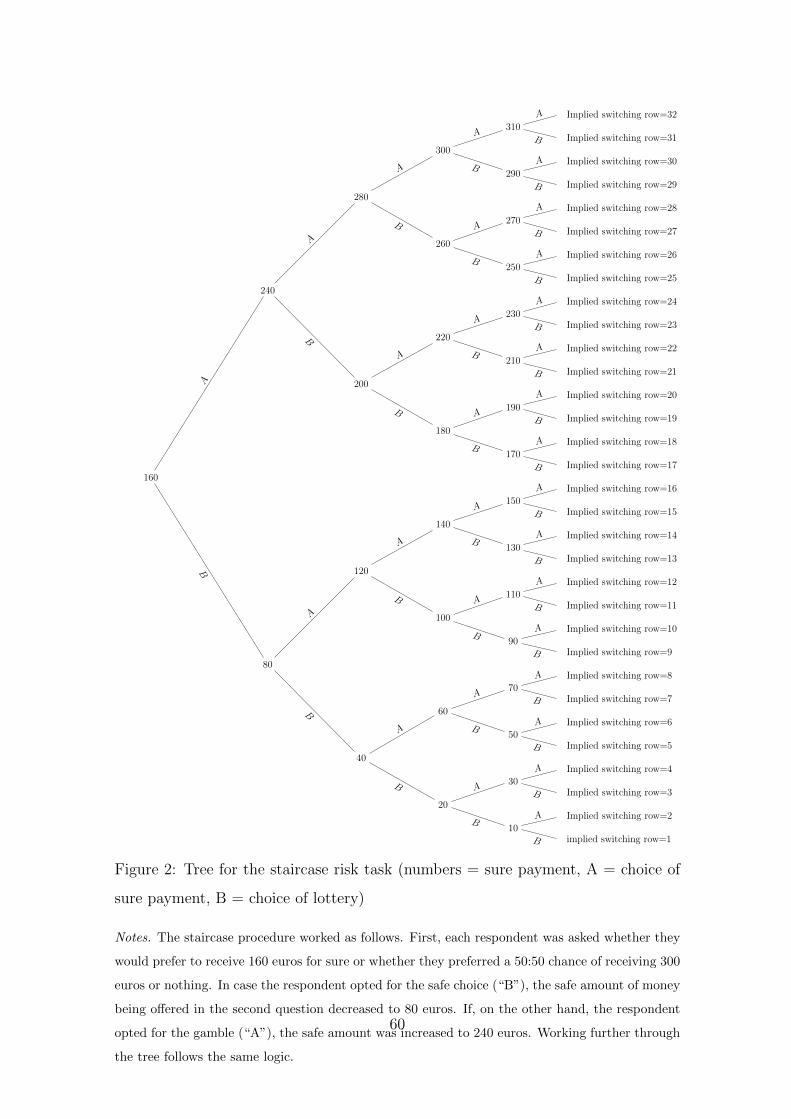
160
80
40
20
10implied switching row=1B
Implied switching row=2AB
30Implied switching row=3B
Implied switching row=4A
AB
60
50Implied switching row=5B
Implied switching row=6AB
70Implied switching row=7B
Implied switching row=8A
A
A
B
120
100
90Implied switching row=9B
Implied switching row=10AB
110Implied switching row=11B
Implied switching row=12A
AB
140
130Implied switching row=13B
Implied switching row=14AB
150Implied switching row=15B
Implied switching row=16A
A
A
A
B
240
200
180
170Implied switching row=17B
Implied switching row=18AB
190Implied switching row=19B
Implied switching row=20A
AB
220
210Implied switching row=21B
Implied switching row=22AB
230Implied switching row=23B
Implied switching row=24A
A
A
B
280
260
250Implied switching row=25B
Implied switching row=26AB
270Implied switching row=27B
Implied switching row=28A
AB
300
290Implied switching row=29B
Implied switching row=30AB
310Implied switching row=31B
Implied switching row=32A
A
A
A
A
Figure 2: Tree for the staircase risk task (numbers = sure payment, A = choice of
sure payment, B = choice of lottery)
Notes. The staircase procedure worked as follows. First, each respondent was asked whether they
would prefer to receive 160 euros for sure or whether they preferred a 50:50 chance of receiving 300
euros or nothing. In case the respondent opted for the safe choice (“B”), the safe amount of money
being offered in the second question decreased to 80 euros. If, on the other hand, the respondent
opted for the gamble (“A”), the safe amount was increased to 240 euros. Working further through
the tree follows the same logic.
60

F Staircase Time
Start with the first question. Depending on whether the participant chooses the ear-
lier or the delayed option, go to the respective next question. This procedure is
repeated four times.
Suppose you were given the choice between the following: receiving a payment
today or a payment in 12 months. We will now present to you five situations. The
payment today is the same in each of these situations. The payment in 12 months
is different in every situation. For each of these situations we would like to know
which you would choose.
1. Would you rather receive 100 Euro today or 153.8 Euro in 12 months?
(a) today → go to question 17
(b) in 12 months → go to question 2
2. Would you rather receive 100 Euro today or 125.4 Euro in 12 months?
(a) today → go to question 10
(b) in 12 months → go to question 3
3. Would you rather receive 100 Euro today or 112.4 Euro in 12 months?
(a) today → go to question 7
(b) in 12 months → go to question 4
4. Would you rather receive 100 Euro today or 106.1 Euro in 12 months?
(a) today → go to question 6
(b) in 12 months → go to question 5
5. Would you rather receive 100 Euro today or 103.0 Euro in 12 months?
(a) today
(b) in 12 months
61

6. Would you rather receive 100 Euro today or 109.2 Euro in 12 months?
(a) today
(b) in 12 months
7. Would you rather receive 100 Euro today or 118.8 Euro in 12 months?
(a) today → go to question 8
(b) in 12 months → go to question 9
8. Would you rather receive 100 Euro today or 122.1 Euro in 12 months?
(a) today
(b) in 12 months
9. Would you rather receive 100 Euro today or 115.6 Euro in 12 months?
(a) today
(b) in 12 months
10. Would you rather receive 100 Euro today or 139.2 Euro in 12 months?
(a) today → go to question 14
(b) in 12 months → go to question 11
11. Would you rather receive 100 Euro today or 132.3 Euro in 12 months?
(a) today → go to question 13
(b) in 12 months → go to question 12
12. Would you rather receive 100 Euro today or 128.8 Euro in 12 months?
(a) today
(b) in 12 months
13. Would you rather receive 100 Euro today or 135.7 Euro in 12 months?
(a) today
62

(b) in 12 months
14. Would you rather receive 100 Euro today or 146.4 Euro in 12 months?
(a) today → go to question 16
(b) in 12 months → go to question 15
15. Would you rather receive 100 Euro today or 142.8 Euro in 12 months?
(a) today
(b) in 12 months
16. Would you rather receive 100 Euro today or 150.1 Euro in 12 months?
(a) today
(b) in 12 months
17. Would you rather receive 100 Euro today or 185.0 Euro in 12 months?
(a) today → go to question 18
(b) in 12 months → go to question 25
18. Would you rather receive 100 Euro today or 201.6 Euro in 12 months?
(a) today → go to question 22
(b) in 12 months → go to question 19
19. Would you rather receive 100 Euro today or 193.2 Euro in 12 months?
(a) today → go to question 20
(b) in 12 months → go to question 21
20. Would you rather receive 100 Euro today or 197.4 Euro in 12 months?
(a) today
(b) in 12 months
21. Would you rather receive 100 Euro today or 189.1 Euro in 12 months?
63

(a) today
(b) in 12 months
22. Would you rather receive 100 Euro today or 210.3 Euro in 12 months?
(a) today → go to question 23
(b) in 12 months → go to question 24
23. Would you rather receive 100 Euro today or 214.6 Euro in 12 months?
(a) today
(b) in 12 months
24. Would you rather receive 100 Euro today or 205.9 Euro in 12 months?
(a) today
(b) in 12 months
25. Would you rather receive 100 Euro today or 169.0 Euro in 12 months?
(a) today → go to question 29
(b) in 12 months → go to question 26
26. Would you rather receive 100 Euro today or 161.3 Euro in 12 months?
(a) today → go to question 28
(b) in 12 months → go to question 27
27. Would you rather receive 100 Euro today or 157.5 Euro in 12 months?
(a) today
(b) in 12 months
28. Would you rather receive 100 Euro today or 165.1 Euro in 12 months?
(a) today
(b) in 12 months
64

29. Would you rather receive 100 Euro today or 176.9 Euro in 12 months?
(a) today → go to question 31
(b) in 12 months → go to question 30
30. Would you rather receive 100 Euro today or 172.9 Euro in 12 months?
(a) today
(b) in 12 months
31. Would you rather receive 100 Euro today or 180.9 Euro in 12 months?
(a) today
(b) in 12 months
The staircase procedure is illustrated in Figure 3.
65
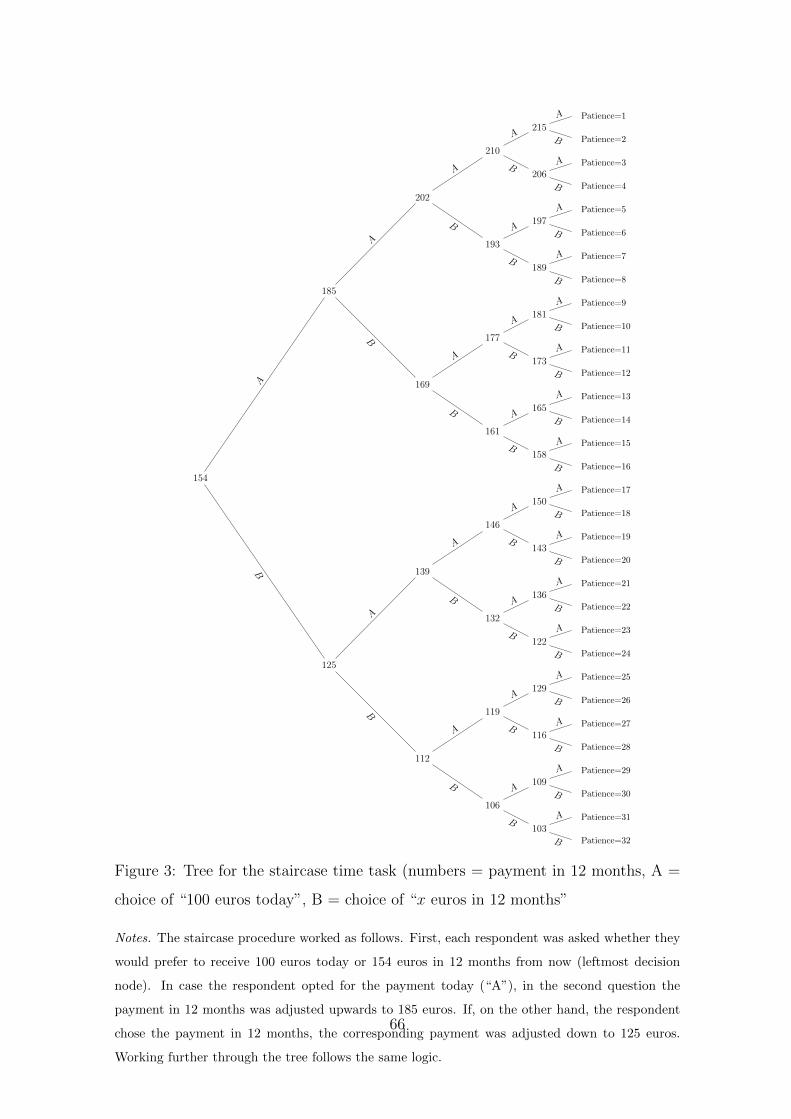
154
125
112
106
103Patience=32B
Patience=31AB
109Patience=30B
Patience=29A
AB
119
116Patience=28B
Patience=27AB
129Patience=26B
Patience=25A
A
A
B
139
132
122Patience=24B
Patience=23AB
136Patience=22B
Patience=21A
AB
146
143Patience=20B
Patience=19AB
150Patience=18B
Patience=17A
A
A
A
B
185
169
161
158Patience=16B
Patience=15AB
165Patience=14B
Patience=13A
AB
177
173Patience=12B
Patience=11AB
181Patience=10B
Patience=9A
A
A
B
202
193
189Patience=8B
Patience=7AB
197Patience=6B
Patience=5A
AB
210
206Patience=4B
Patience=3AB
215Patience=2B
Patience=1A
A
A
A
A
Figure 3: Tree for the staircase time task (numbers = payment in 12 months, A =
choice of “100 euros today”, B = choice of “x euros in 12 months”
Notes. The staircase procedure worked as follows. First, each respondent was asked whether they
would prefer to receive 100 euros today or 154 euros in 12 months from now (leftmost decision
node). In case the respondent opted for the payment today (“A”), in the second question the
payment in 12 months was adjusted upwards to 185 euros. If, on the other hand, the respondent
chose the payment in 12 months, the corresponding payment was adjusted down to 125 euros.
Working further through the tree follows the same logic.
66


