Embed Size (px)
Citation preview

CCAMLR Science, Vol. 13 (2006): 1–25
1
The PaTagonian TooThfish (Dissostichus eleginoiDes) fishery in The Kerguelen islands (indian oCean seCTor of The souThern oCean)
C. Lord, G. Duhamel and P. Pruvost Muséum national d’Histoire naturelle
Département des milieux et peuplements aquatiques USM 403, CP 26, 43 rue Cuvier 75231 Paris Cedex 05, France Email – [email protected]
Abstract
Patagonian toothfish (Dissostichus eleginoides) have been fished in the Kerguelen Islands zone for 20 years, firstly with trawlers and more recently with longliners. This is the oldest fishery targeting D. eleginoides in the Indian Ocean sector of the Southern Ocean. However illegal, unreported and unregulated (IUU) fishing has occurred in the area since 1997. A generalised linear model (GLM) analysis was performed using statistical data from the legal fishery to assess the trends in and the factors affecting catch-per-unit-effort (CPUE) in both the trawl and the longline fisheries. The most recent trends show a decrease in CPUE, indicating probable local overfishing. The expansion of the bathymetric range of the fishery to increasingly deeper waters seems to have partially masked this situation. In addition, some biological data (such as depth distribution, timing and area of spawning, and movements between geographical sectors) on the adult section of the exploited population have been obtained from scientific observation programs conducted by fishery observers on board fishing vessels.
Resume
La légine australe (Dissostichus eleginoides) fait l’objet d’exploitation dans la zone des îles Kerguelen depuis 20 ans, d’abord avec des chalutiers puis des palangriers. C’est la pêcherie la plus ancienne du secteur indien de l’océan Austral. Cette dernière, depuis 1997, a cependant été confrontée au problème de la pêche INN (illégale, non déclarée et non réglementée). Une analyse GLM (modèle linéaire généralisé), effectuée à partir des données statistiques de la pêche légale, permet d’apprécier les facteurs qui influencent la capture par unité d’effort (CPUE) pour chacun des métiers exercés. Les séries temporelles les plus récentes montrent des tendances à la baisse, peut-être indicatrices d’épuisement local. L’extension bathymétrique de la pêcherie vers des zones de plus en plus profondes semble avoir masqué temporairement ce phénomène. Par ailleurs des aspects biologiques intéressants (distribution bathymétrique, reproduction, mouvements entre secteurs géographiques…) relatifs à la partie adulte de la population exploitée ont pu être tirés des données récoltées par les observateurs de pêche embarqués sur les navires de pêche.
Резюме
Промысел патагонского клыкача (Dissostichus eleginoides) велся в районе о-вов Кергелен на протяжении 20 лет – сначала траулерами, а в последнее время ярусоловами. Это самый продолжительный направленный промысел D. eleginoides в индоокеанском секторе Южного океана. Однако незаконный, незарегистрированный и нерегулируемый (ННН) промысел ведется в этом районе с 1997 г. Был проведен анализ по обобщенной линейной модели (GL-модели), в котором использовались статистические данные законного промысла в целях оценки факторов, влияющих на CPUE (улов на единицу усилия), и тенденций CPUE тралового и ярусного промыслов. Самые последние тенденции показывают снижение CPUE, что свидетельствует о возможном локальном перелове. Как представляется, расширение батиметрического диапазона промысла во все более глубокие воды отчасти маскирует эту ситуацию. Кроме того, в результате программ научного наблюдения, выполненных промысловыми наблюдателями на борту рыболовных судов, был получен ряд биологических данных (такие как распределение по глубинам, время и район нереста и перемещение между географическими секторами) по взрослому компоненту эксплуатируемой популяции.

Lord et al.
2
introduction
There are four Patagonian toothfish (Dissostichus eleginoides) fisheries established in the Indian Ocean sector of the Southern Ocean. In order of quantity of landings, they are situated around the Kerguelen Islands (CCAMLR Division 58.5.1), Heard and McDonald Islands (Division 58.5.2), Crozet Islands (Subarea 58.6) and Prince Edward and Marion Islands (Subareas 58.6 and 58.7) (CCAMLR, 1994, 2004). In this same geographical sector, Ob and Lena Banks (Division 58.4.4) also constitute a fish-ing ground for this species. The Kerguelen Islands were the first to be exploited after large concen-trations of D. eleginoides were discovered in the high seas, on the islands’ western shelf, by former USSR trawlers in 1984/85. The longliners joined the fishery in 1990/91 and are currently the only vessels operating in the fishery, having replaced the trawlers completely in 2001/02. Legal catches have been approximately 5 000 tonnes per year since 1993/94. In addition to this regulated legal fishing, this zone (Division 58.5.1) has been the object of illegal, unreported and unregulated (IUU) fishing, especially between 1997/98 and 2003/04. This has undoubtedly led to uncertainty as to the actual removals, which have most probably been underestimated for this period. The fishery has undergone significant changes in terms of yield since its inception (Figure 1).
There have been relatively few studies of this fishery (Ashford et al., 2005a, 2005b; Bez et al., 2006; Duhamel, 1988, 1991, 1992, 1993, 2003) and a global analysis did not exist prior to this study. Here, a generalised linear model (GLM) analysis is used to give a general view of the patterns observed in the unstandardised catch-per-unit-effort (CPUE)
from fishing logbooks. The aim was to detect the factors affecting the trends in CPUE from 1979 to 2004 and to explain the different phases that the fishery has undergone during this period. The GLM was not used to produce standardised CPUE indices to assess the state of the stock or to define the current status of the population. Additional biological data from on-board observers on sexual maturation and spawning, and fish size distribu-tion according to depth, sexual maturity and area are also presented.
Material and methods
Statistical fishery data
Statistical data from the legal and regulated fishery around the Kerguelen Islands (recorded in fishing logbooks) was initially entered in a single-table database called ‘Kerpêche’ for trawlers (split-years – 1 July to 30 June – 1979/80 to 2000/01) and in Excel tables for longliners (1990/91 to 2003/04). All these data have been transferred to an Access relational multi-table database. The data analysis undertaken will help determine the factors influ-encing the trend in CPUE for D. eleginoides, both for trawlers (kg/hour trawling) and for longliners (g/hook hauled) from the beginning of the fish-ery. As two fishing methods have been used in the D. eleginoides fishery (from trawlers to longliners), the analysis has been divided into two. Indeed, it is impossible to compare these two highly different methods (one sweeps the sea floor, the other one attracts fish). Moreover, targeted fishing depths are different for each fishing technique.
Resumen
Desde hace 20 años la austromerluza negra (Dissostichus eleginoides) ha sido el objeto de la explotación en las Islas Kerguelén, primero con arrastreros y más recientemente con barcos palangreros. Esta es la pesquería más antigua de D. eleginoides en el sector del Océano Índico dentro del Océano Austral. No obstante, desde 1997 el área ha sido objeto de la pesca ilegal, no declarada y no reglamentada (INDNR). Se efectuó un análisis con un GLM (modelo lineal generalizado) a partir de los datos estadísticos de la pesca legal para evaluar los factores que afectan la captura por unidad de esfuerzo (CPUE) así como las tendencias de este índice, tanto en la pesca de arrastre como en la de palangre. Las tendencias más recientes muestran un descenso en la CPUE, lo que probablemente se debe a una pesca excesiva a nivel local. La expansión del rango batimétrico de la pesca a zonas cada vez más profundas parece haber enmascarado parcialmente este fenómeno. Además, se han obtenido algunos datos biológicos (tales como la distribución batimétrica, época y zona de desove, y desplazamiento entre sectores geográficos) sobre la proporción adulta de la población explotada de los programas de observación científica llevados a cabo por los observadores de la pesquería a bordo de los barcos de pesca.
Keywords: Patagonian toothfish, Dissostichus eleginoides, Kerguelen Islands, trawl fishery, longline fishery, CPUE (catch-per-unit-effort), GLM analysis, CCAMLR

3
Patagonian toothfish fishery in the Kerguelen Islands
Relationships between CPUE and the differ-ent factors have been statistically analysed using a GLM (Burnham and Anderson, 1998).
The GLM is of the type:
Variable to analyse = α + β1 factor 1+ β2 factor 2+ … + βn factor n
where α is the intercept point, and β is the slope coefficient.
Data analysis was undertaken using the soft-ware Statistica (version 6.1). As the data distribu-tion is not normal (this has been verified using the Kolmogorov–Smirnov test and the normal prob-ability plot), the GLM analyses were undertaken using a Poisson distribution with a logarithmic link.
The fit of the data to the model was tested by dividing Pearson’s X2 by the number of degrees of freedom of X2.
The simplest model that best explains the vari-ability observed is chosen with the calculated quasi Akaike Information criterion (QAIC). The AIC gives an estimate of the relative distance between the adjusted model and the actual mechanism, which generated the observed data.
QAIC = [(- 2 Log £)/c] + 2 np
£ function of probability
c correction factor = Pearson’s X2/degrees of free-dom of X2
np number of parameters (continuous and fac-torial variables).
The various factors are withdrawn one by one for different GLMs. The QAIC is calculated for each model. The lowest value of the QAIC indi-cates which model to choose. All the parameters have been tested for each analysis. The statistical threshold of significance used was 5%. The para-meters having a probability less than or equal to this threshold are retained in the model. The inter-actions between the various factors were not taken into account because the data are too heterogeneous and the samples so unbalanced. This model gives qualitative results and the variances explained by the various components are not presented.
Biological data derived from fishery monitoring
Sexual maturation and spawning
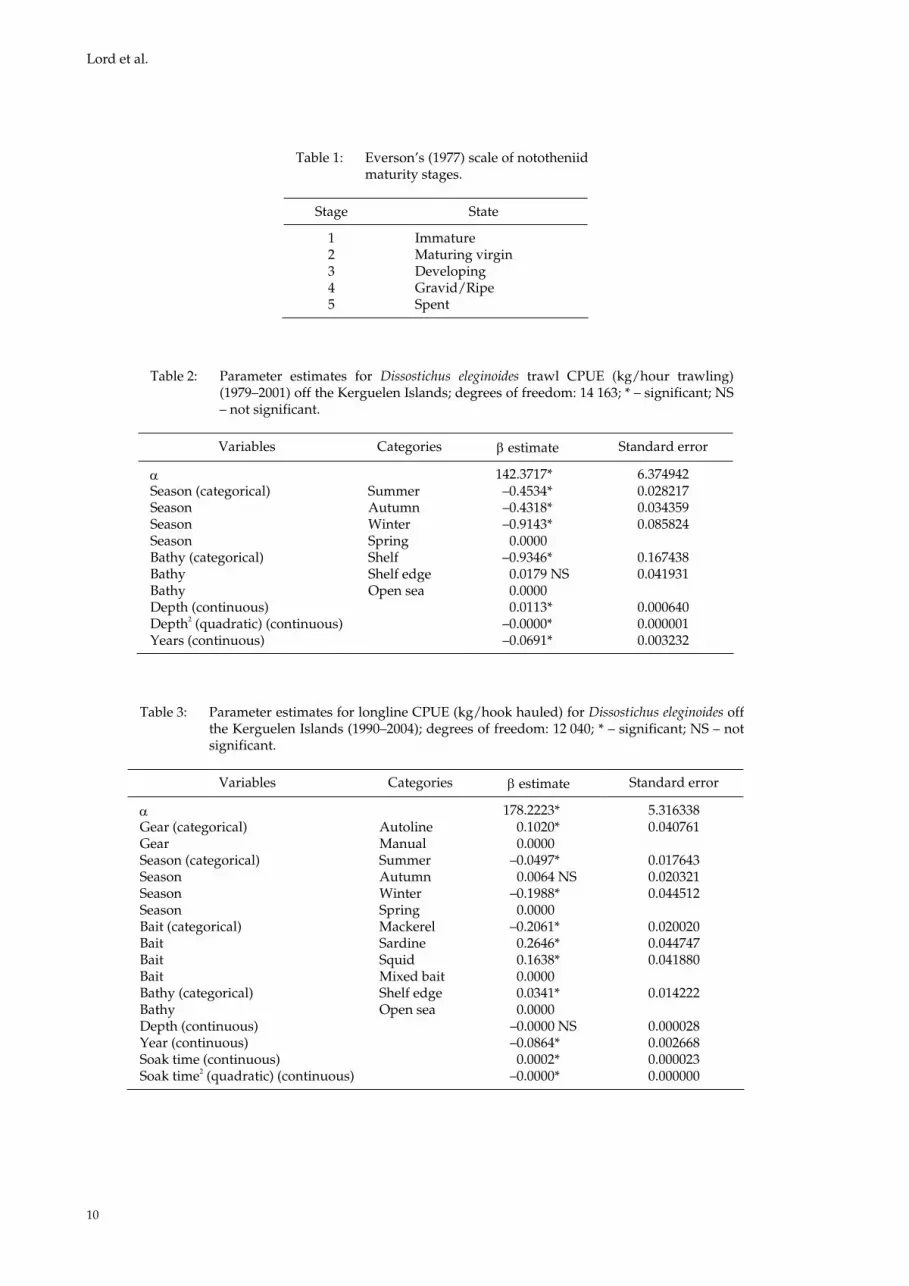
The data available are from sequential random sampling of lengths (total length to the nearest cm below) and maturity stages (according to Everson’s (1977) scale) of male and female fish caught during the 2002/03 and 2003/04 longline fishing seasons (Table 1).
Firstly, size-at-sexual-maturity was estimated, for males and females, by plotting the percentages of stages 1–2 (juveniles without developed gonads) and stages 3 to 5 (fish engaged in the annual repro-duction cycle) against length of fish. The size-at-sexual-maturity is taken as being the length at which 50% of fish are at stages 3 to 5. This calcula-tion was made for the 2003/04 data and for three geographical sectors (northwest, west and Skif) (Figure 2).
Secondly, the development of maturity stages during the year was studied to determine the spawning period. Mature animals (stages 3 to 5) only were studied for a period ranging from March to August, as this period is thought to cover the spawning period. The analyses were made using the most recent data (2003/04). They were grouped into three periods per month (1–10, 11–20, 21–end of the month). The transition from stage 3 (matur-ing) to stage 4 (ripe), then to stage 5 (recovery) gives a good estimate of the exact spawning period (the transition is estimated visually).
Size distribution according to depth, sexual maturity and geographical sector
Two different studies were undertaken: the first analyses the average size of individual fish accord-ing to three depth ranges (500–1 000, 1 000–1 500 and >1 500 m); the second also analyses the aver-age size of the fish sampled, and also their sexual maturity stage according to geographical sectors chosen around the Kerguelen Islands shelf (eastern, northwestern, western and Skif sectors) (Figure 2).
Statistical analysis was carried out using Statistica software (version 6.1). The normality of the data of each sample was tested graphically with the ‘normal probability plot’. All data were found to be normally distributed according to the normal probability plot. However, low values of total length provide a poor fit to the normal prob-ability plot. This can be explained by the fact that longlining is a selective fishing method. Fish under 30 cm in total length are never caught because the hooks used are too big.

Lord et al.
4
Once the normality was checked, variance analyses (ANOVA) were carried out to determine whether there are significant differences between the size of the animals caught at different depths and in different sectors. The results for the two years analysed are compared, but a statistical analy-sis between the two years is impossible, since the samples are not orthogonal (the number of animals caught in each sample changes from one year to the other).
results
Trawling (1979 to 2001)
The first model described CPUE (kg/hour trawling) (Table 2):
CPUE (kg/h) = α + β1 season (summer) + β2 season (autumn) + β3 season (winter) + β4 season (spring) + β5 bathy (shelf) + β6 bathy (shelf edge) + β7 bathy (high seas) + β8 depth + β9 depth2 + β10 year.
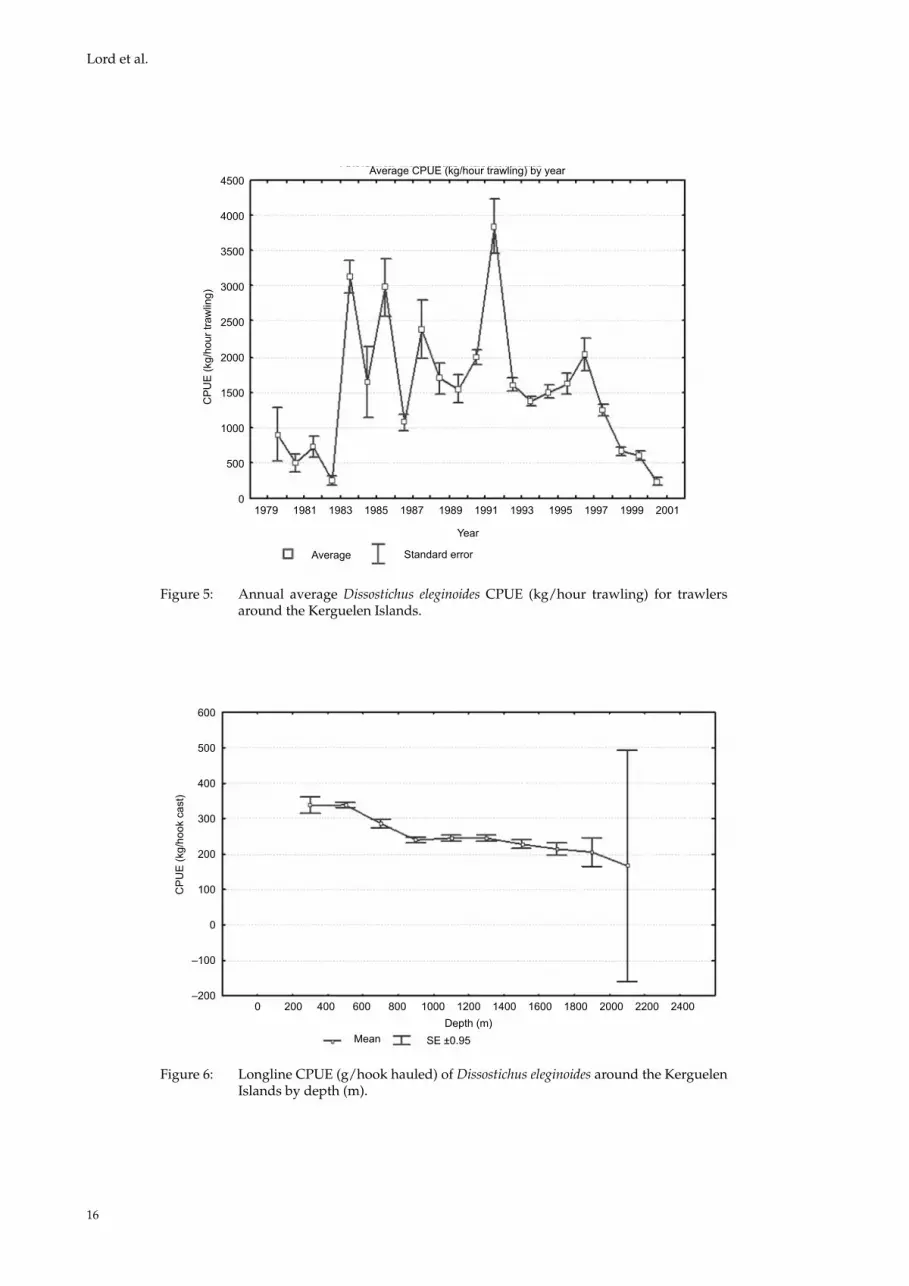
There are 11 parameters in this model (the vessels have not been taken into account in this analysis because the number of parameters was then too high and the results were barely useable). The estimate of the coefficients β shows the effect of a factor on CPUE. The p value indicates whether the effect is significant (p < 5%). According to the QAIC, the model that best explains the variability of CPUE (kg/h) is the complete one; all explana-tory variables have an effect on the trend in CPUE. For the factorial variable ‘Season’, spring is the ref-erence (β = 0). The estimate of the coefficient β for the three other seasons represents the slopes of the lines between these seasons and the reference sea-son. According to the model, spring has the high-est CPUE. Thereafter CPUE decreases from sum-mer to winter (Figure 3). For the factorial variable ‘bathymetry’, the open sea is taken as the reference point. There is no significant difference between CPUE on the open ocean and on the shelf break (p >> 5%), whereas it is lower on the Kerguelen shelf itself. Depth is a continuous variable; it has a quadratic effect, which means that there is an opti-mum depth range (350–800 m) at which to trawl to improve the CPUE (Figure 4). Trawl CPUE fluctu-ated a good deal between 1983 and 1991, ranging from 1 tonne/hour to 3 tonnes/hour. Finally, the model showed that the CPUE has shown a decreas-ing trend during the most recent fishing years. Indeed, it was about 4 tonnes/hour at the begin-ning of the 1990s and was, at the end of the trawl fishing period, about 0.25 tonnes/hour (Figure 5).
Longline (1990 to 2004)
When this fishery started, the fishing logs were not kept in a very complete manner. There are therefore a great deal of missing data concerning by-catch and the number of birds killed. These data have been regularly available only since the 1997/98 fishing season. As the first model has to be the most complete possible, it is based only on data for the years 1997 to 2003; the effects of all the fac-tors can then be studied. This model explains the variability of the CPUE (g/hook hauled) according to the factors quoted below. For the longline model, the ‘bathy’ factor only has two classes which are the shelf break and the open sea, since longliners never fish on the shelf itself.
CPUE (g/hook hauled) = α + β1 gear (autoline) + β2 gear (manual system) + β3 season (summer) + β4 season (autumn) + β5 season (winter) + β6 season (spring) + β7 bait (mackerel) + β8 bait (sardine) + β9 bait (squid) + β10 bait (mixed) + β11 bathy (shelf break) + β12 bathy (open sea) + β13 depth + β14 depth2 + β15 years + β16 time + β17 time2 + β18 n dead birds + β19 n by-catches.
This model has 20 parameters. The number of birds killed and the by-catch are retained in the model, but their effect is not significant since the p value is greater than 5%. For the period from 1997 to 2004, the effect of the number of birds killed and of by-catch on the CPUE is non-significant. The effect of all the other factors can then be analysed over all the fishing years, that is from 1990 to 2004, if the number of birds killed and of by-catch are not taken into account. The model then has 18 para-meters. According to the QAIC, the most appro-priate model excludes depth squared, which then has a linear instead of a quadratic effect (the final model uses 17 parameters) (Table 3).
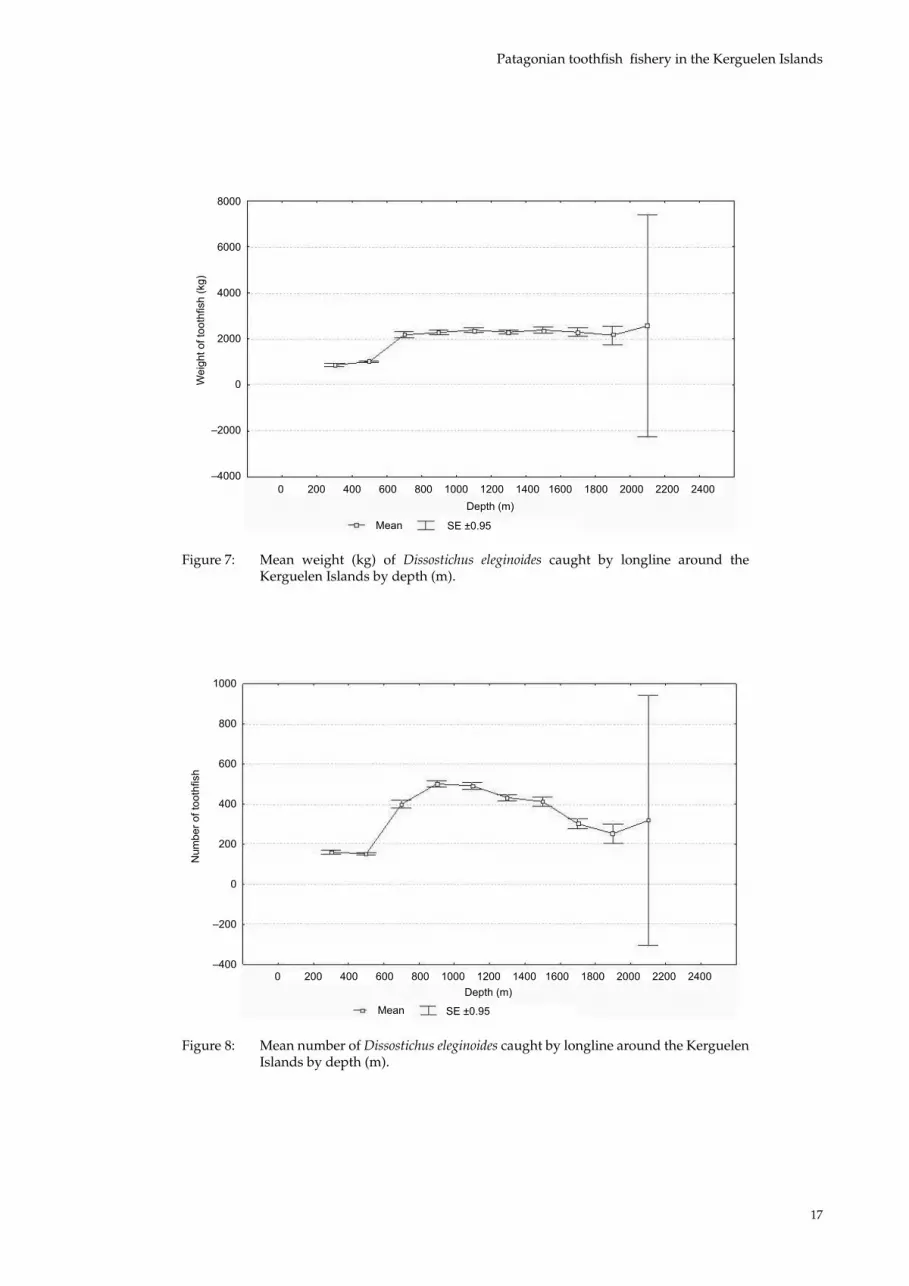
However, this result is difficult to explain because in the model, β13 (depth) is nil (slightly negative) and the value p can be used to reject the hypothesis that depth has an effect on CPUE. Graphically, it is clear that the effect is non- quadratic (Figure 6). The non-significant effect of depth is certainly due to the high variability of the data sampled from depths greater than 2 000 m. If these values are excluded, it can be seen that CPUE decreases with increasing depth. To under-stand this effect, the weight and the number of fish caught has to be analysed in relation to depth. The weight of fish caught does not increase much with depth from 800 m (Figure 7), whereas depth has a quadratic effect on the number of fish caught (Figure 8), there is an optimum depth (between 800 and 1 400 m) at which to fish to catch the greatest number of fish. Beyond a certain depth, the catch

5
Patagonian toothfish fishery in the Kerguelen Islands
of fish decreases. These results clearly show that CPUE (g/hook) remains stable to a certain depth and then decreases. There are very few data for depths of more than 2 000 m, which is why there is such a high variability at this point.
As regards the other parameters explaining trends in CPUE over the years, it seems that an auto-liner is more efficient than a manual one. In spite of the fact that the baiting percentage is best with a manual system, the autoline gives a better yield. As for the trawler, CPUE is highest in spring (no sig-nificant difference with autumn), slightly lower in summer and very low in winter. The bait used also has an effect on the catch. According to the differ-ent models examined, it seems that mackerel and mixed bait are less effective than sardine or squid. As for trawling, longline CPUE, after fluctuating significantly at the beginning, shows a decreasing trend as the years pass. Over the four last fishing seasons the decrease has been continuous (Figure 9) (SC-CAMLR, 2005).
The last factor that explains variability is the time for which the longline is left on the sea floor. The effect is quadratic; the optimal time for which the longline should be left on the sea floor to increase the catch is between one and a half days and four days (Figure 10).
The data series shows that the average depth of the longline has increased since 1998. Average fish-ing depth was initially 500 m; it is now more than 1 000 m (Figure 11).
Data on the weight and number of fish caught are available for longline fishing, allowing trends in the fish weight/number ratio (equivalent to mean weight of fish) to be analysed. Over the whole of the time series, there is a decrease in the mean size of fish (Figure 12) (the data for 1992/93 have not been taken into account).
Aspects of D. eleginoides biology
Size-frequency distribution by depth caught
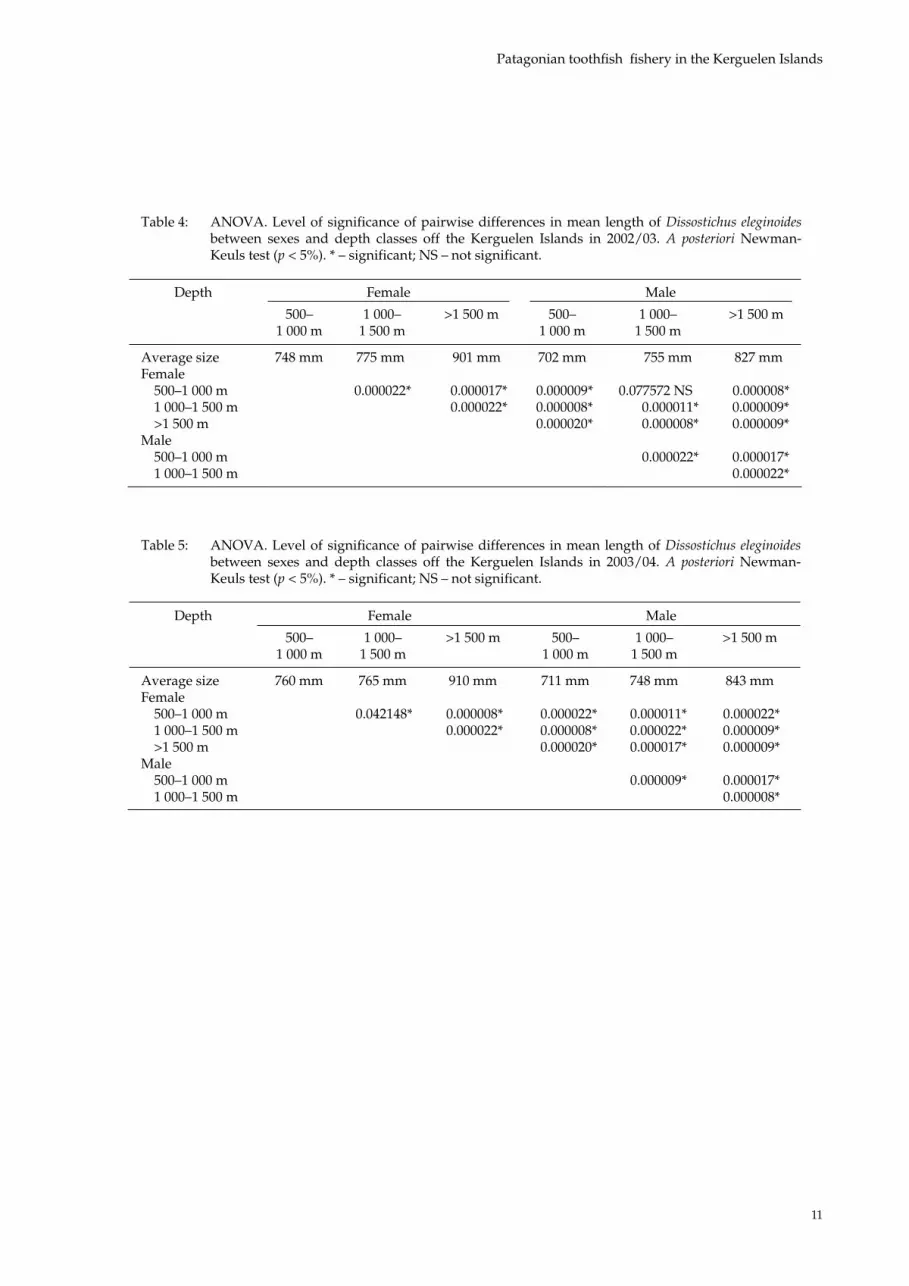
The 2002/03 data have been analysed for size-frequency distribution. There are very few fish under 40 cm in total length in the sample; this is due to the selectivity of the longline and also because the legal fishing depth is greater than 500 m. ANOVA has been used to highlight the differences between the average size of the animals sampled in differ-ent depth ranges. The ANOVA can also highlight the differences in average size between males and females (Table 4). There is significant difference between the average size of females in the three
depth ranges; the smallest females are found in shal-low waters, whereas the largest females are found at depths exceeding 1 500 m. This result is the same for males. There is also a difference between males and females: for a given depth, females are always significantly larger than males.
The same analysis as that undertaken with the 2002/03 data has been carried out with respect to the 2003/04 data; the results are quite similar, with very little difference in the average sizes found between years (Table 5).
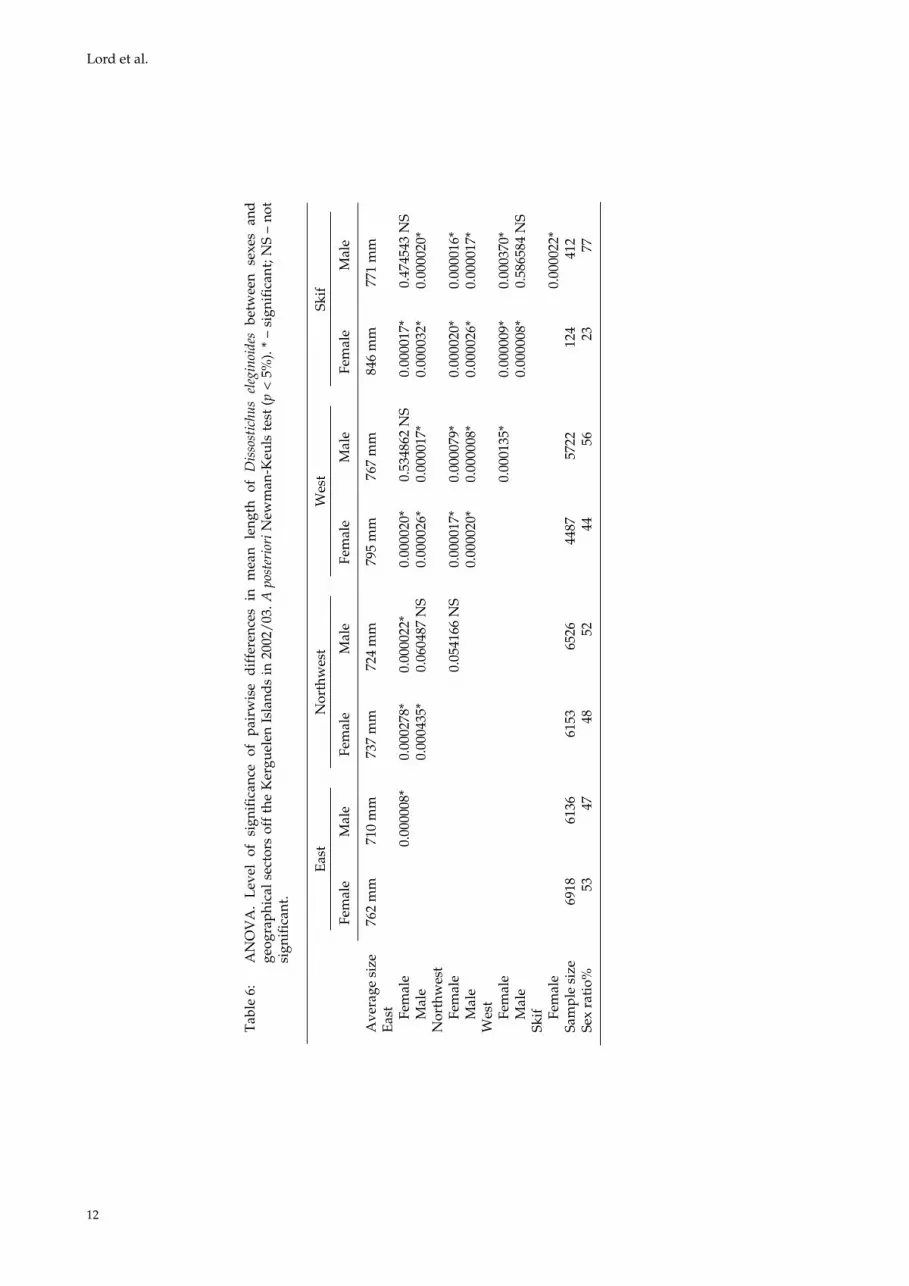
Sex ratio and sexual maturity stages by size-frequency distribution and geographical sector
The size-frequency distribution associated with sex ratio and the percentage of fish in each of the five maturity stages for each geographical sector indicates that in the eastern sector (in 2002/03) the sex ratio is balanced, slightly higher for females (53%), and that the sampled D. eleginoides popu-lation essentially comprises juveniles (stages 1 and 2), irrespective of their size. In the northwest-ern sector, the sex ratio is also balanced, with the percentage of males being slightly higher (52%), but the population contains a larger number of maturing animals (stages 2 and 3). In the western sector, the population is represented by mature males (56%) and females, i.e. reproducing adults (stages 3 and 4). Finally, in the Skif sector, where stages 3 and 4 also occur, the percentage of males is even greater than in the western sector (77%), although the sampling effort was low. The average size of females and males in the different sectors were compared by means of an ANOVA (Table 6). The results show for both sexes that fish sampled in the western sector (and Skif sector) have a signifi-cantly larger average size than in the eastern sector (all fish were sampled between 500 and 1 500 m in each sector).
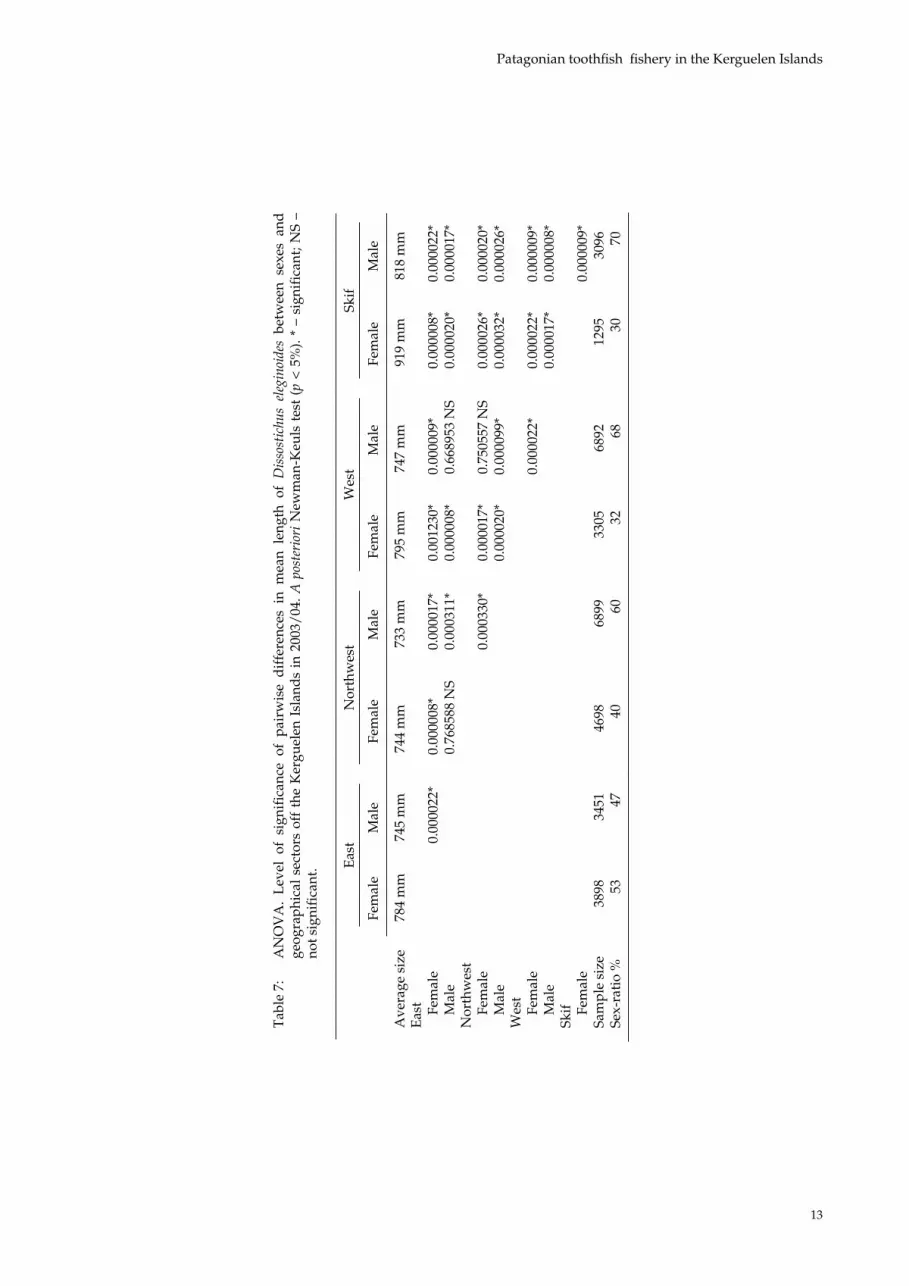
The same study undertaken using 2003/04 data shows similar results as for 2002/03. Interestingly, in the Skif sector, a representative sampling shows that this area contains the largest D. eleginoides individuals. The ANOVA (Table 7) shows that fish present in the samples are larger and more mature from east to west.
These data assume that all fish were independ-ently sampled from the overall population. This is not necessarily true; sampling fish by trawl-ing leads to the underestimation of variances for statistical tests and therefore exaggerates signifi-cance levels, showing more significant differences

Lord et al.
6
than really exist. This is more important for depth than sex because sex varies within hauls but depth is constant for each haul.
Spawning period and size-at-sexual-maturity
Sequential analysis of maturation stages enables the beginning of the spawning period (fish in stage 4) to be determined. Spawning occurs be-tween late April/May and mid-July for females (Figure 13), but begins later for males (end of May), and is still occurring at the beginning of August (Figure 14). This shows that there is a synchronous period around mid-June. The second 10-day period of July shows that female reproduction is virtually complete, which is not (wholly) the case for males.
Finally, it is interesting to note that for these two consecutive years, males reach maturity at a smaller size than females. The average size-at-first-maturity was graphically estimated as being 63 cm for males and 85 cm for females (Figures 15 and 16), and there is no significant geographically depend-ant size difference.
discussion
These are the first statistical analyses (GLMs) of the trends in CPUE for trawlers (SC-CAMLR, 2003, 2004) in the Kerguelen fishery. A lower CPUE in winter can be explained by the fact that weather conditions at this time of the year are harsh and are therefore not ideal for fishing, and/or the fish are less abundant because of possible spawning migrations; reproduction takes place at this time. In spring, the return of fish after spawning and of juveniles to the fishing grounds increases CPUE. The optimum fishing depth ranges from 300 to 600 m, which corresponds to the shelf break. This area is probably more suitable for trawling. From 1979 to 1983, the fishery targeted mackerel icefish (Champsocephalus gunnari) and marbled rockcod (Notothenia rossii), and D. eleginoides was a by-catch. This is reflected in the low CPUE during this period as shown in Figure 3. After 1983, the fishery tar-geted D. eleginoides, and until 1992 CPUE increased, albeit showing many fluctuations. The best yields are taken over the shelf break in spring. In 1997, a strong decreasing trend in CPUE is observed. The hypothesis of a causal relationship between CPUE and exploited biomass allows interpretation of the observed trends, even if this hypothesis is biased (Hilborn and Walters, 1987; Rahikainen and Kuikka, 2002). During the last 10 years of trawling, the fishing effort was essentially concentrated in two sectors (north and northwestern edge of the
shelf). It is therefore possible to surmise that there had been a local depletion of the stock which was exacerbated by additional catches, both legal and illegal. The effects of illegal fishing have conse-quences for the rest of the stock exploited by legal trawlers and longliners. Illegal fishing began in 1997, and has represented up to 70% of the total D. eleginoides catch in Kerguelen (Figure 1); more-over legal fishing also expanded to neighbouring fishing grounds such as Heard and Crozet Islands as well as Ob and Lena Banks (Area 58) (CCAMLR, 1994, 2004) at this time. It has been shown that between the Indian and the Atlantic sectors of the Southern Ocean, the D. eleginoides populations are genetically different (Appleyard et al., 2002), but within the Indian Ocean sector, there is no evidence of the presence of genetically different D. eleginoides populations between the different fishing grounds (Appleyard et al., 2004). Tagging–recapture experi-ments (Williams et al., 2002) have shown that fish tagged in the Heard Island EEZ, south of Kerguelen, have been recaptured in Crozet and Kerguelen, showing that the fish can migrate from one fish-ing ground to another in Area 58. However, with these experiments, it is not possible to estimate the proportion of migrating and sedentary fish popu-lations. Considering the fact that D. eleginoides show important migration flows (metapopula-tion), and that the stock is probably unique to the Indian Ocean sector, the spread of the fishing activ-ity to Area 58 could explain the decreasing trend in CPUE at Kerguelen.
Longliners have also shown a downward trend in CPUE (g/hook) from the inception of the fish-ery to the present. Two phases can be shown in the evolution of the CPUE: the first, from 1991 to 1998, corresponds to the period when longliners fished at a depth of 500 to 600 m (Duhamel, 1992, 1993). In the second phase, from 1999 to 2004, longliners targeted much deeper fishing zones over 1 000 m. Apart from a learning phase, when fishing effi-ciency would have increased (first 2–3 years), a phe-nomenon of partial depletion of the stock frequent-ing the targeted depths also seems to be apparent from the CPUE series with the effect being offset in time, which leads to the trends being interpreted as being a gradual depletion masked by the constant expansion of the areas fished following the pattern below:
(i) trawling on the edge (upper slope) of the shelf (1984/85–2000/01), essentially in the north and the northwestern sectors (1992/93–2000/01);
(ii) longliners (legal fishing) in deep waters in the western sector only (1990/91–1997/98);

7
Patagonian toothfish fishery in the Kerguelen Islands
(iii) longliners (both legal and illegal fishing in the Kerguelen sector and elsewhere) in all deep waters (1998/99–2003/04).
The expansion of the fishery towards deeper fishing grounds has temporarily counterbalanced the decrease in CPUE observed for both trawlers and longliners fishing on shelf break; it is however now impossible to find new fishing grounds for the fishery since the whole of the accessible stock is now being exploited. GLM analyses indeed show that beyond 1 500 m, CPUE decreases sharply as the higher mean weight of fish fails to make up for the smaller number caught. A sequential analy-sis of the weight/number ratio gives an indica-tion of the trends in average size of fish caught. This ratio decreases with the years, which shows that the average size of the fish caught is smaller. Moreover, the fishery targets much deeper zones where fish are adult and much larger. The stock then suffers from a loss of older animals; the fish-ing effort is then concentrated on still younger fish. The size-frequency distribution series available for the Kerguelen Islands reflects this situation: in 1990/91, the average size of the fish sampled (using longliners) in the western sector was 98.7 cm for females and 88.1 cm for males (Duhamel, 1992); in 2003/04 these values fell to 79.5 cm for females and to 74.7 cm for males. The present situation is the result of a full exploitation of the stock, that is legal local fishing added to illegal catches and the expansion of the fishery to encompass the whole of Area 58.
GLM results for longliners show that it is best to use an autoliner baited with squid or sardine and to leave the longline on the sea floor for two to four days. If the soak time is too long, the fish caught will be eaten by predators (sperm whale) and the bait will start to disintegrate, thus not attracting any more fish. The GLM for longliners has also shown that season has an effect on CPUE, which is lower in winter, probably because the weather conditions are harsh. Moreover, the reproduction period of the adult fish (which are targeted by longline fishing), with occurrence of stage 4, takes place in winter, from May to July (as shown in the biological results). In stage 4, the abdominal cavity is totally occupied by the gonads, therefore the reproducing fish eat less, and the longline fishing technique becomes less efficient. During this period, spawning migrations are probably partly responsible for the low fishing efficiency. Adult spawners seem to concentrate in the westernmost area of the Kerguelen shelf (west-ern and Skif sectors). A geographical analysis of the maturation stages suggests that the eastern part of the Kerguelen slope is a recruitment zone (juve-niles, balanced sex ratio) and that the deep western
part of the shelf (especially Skif) houses spawn-ing adults (larger and mature fish, unbalanced sex ratio). The D. eleginoides post-spawners in South Georgia (Atlantic sector of the Southern Ocean), where the spawning period seems to occur later in the year, aggregate on the slope of a bank beyond the shelf (Shag Rocks bank) also in the west of the area (Agnew et al., 1999). Because of the similarity of the spawning strategy, it would be interesting to compare both populations. A new estimate of the size of the fish (male and female) at their first sexual maturity stage has been made using data from the two most recent fishing years. In 1987 (Duhamel, 1987), this was estimated to be 56 cm for males and 80 cm for females, but the sampling (done with trawlers) included very few adults. Then, in spring 1990/91 (Duhamel, 1991), a new estimate was obtained using fish sampled by longliners (65 cm for males and 80 cm for females). The most recent and accurate estimate in the present work (63 cm for males and 85 cm for females) shows that the longline fishery essentially targets the adult part of the stock, since less than 10% of the fish caught by longliners are less than 60 cm in total length.
There has only been one biomass survey under-taken since the start of the D. eleginoides fishery in the Kerguelen area. This took place in 1987 (‘Skalp’ campaign; Duhamel, 1988), and only cov-ered depths between 100 and 500 m. D. eleginoides biomass was estimated to be 105 000 tonnes and the legal annual landings averaged 5 000 tonnes. However, this evaluation should be considered as partial as only the juvenile part of the stock was targeted. Since then, no surveys of the Kerguelen area have been carried out because of the lack of finance and also for logistical reasons. Subsequent removals of D. eleginoides have often amounted to more than 10 000 tonnes per year (by both legal and illegal fishing) (between 1998 and 2003; see Figure 1). The recent, continuous CPUE downward trends observed indicate that a biomass assessment should be undertaken in order to revise the status of the stock. Adjacent stocks are being assessed (Heard/McDonald, Marion/Prince Edward). Thus, in the Prince Edward Islands, where significant illegal fishing takes place, Brandão et al. (2002) observed a decreasing trend in CPUE. In this area, the production model based on the age structure of the population (ASPM) shows that the spawning biomass has been overfished and remains at only a very small percentage of its pre-exploitation level. Simulations suggest that the annual fishing quota be reduced to 400 tonnes maximum for the Prince Edward Islands. Although the Prince Edward area is much smaller than the Kerguelen area, these results suggest that a management policy should be put in place, especially since very little is known

Lord et al.
8
about the recruitment processes. The metapopu-lation hypothesis proposed as a result of the tag-ging program at Heard and McDonald Islands and the results of genetic studies (Williams et al., 2002) raises the question as to whether this most remote stock in the spawning area might not be the precursor of stock depletion which could affect first the Prince Edward Islands, then Crozet and, finally the Kerguelen Plateau (Kerguelen Islands and Heard Island shelves). The actual state of the stock is unknown; the present biomass needs to be evaluated to check whether the fluctuations in CPUE trends are correct. A research trawl survey could be carried out using the swept-area method (Sparre et al., 1989). Scientists would then have suf-ficient information to carry out this survey and so to implement additional conservation measures (Duhamel, 1995) required to manage this exploited population.
Conclusion
The Kerguelen D. eleginoides fishery has under-gone three exploitation phases between 1979 and the present (trawl fishery on the shelf break, long-line fishery on the slope and currently, deep-sea longline fishery). All fishing grounds have been exploited over the years and no more are avail-able.
CPUE is influenced by a series of factors which have had major impacts on catch rates. The GLM analysis helped explain the global patterns observed in the CPUE trends between 1979 and 2004.
A geographical analysis of biological para-meters of the targeted population of D. eleginoides allows the location of the spawning grounds to be pinpointed and about annual and ontogenetic movements of the fish for this area of the Kerguelen Plateau.
A biomass evaluation needs to be carried out as soon as possible to assess the stock and understand the observed trends.
acknowledgements
The authors thank Christophe Barbraud for his help with the statistical treatment of the data (GLM analyses) and are grateful to P. Keith, F. Meunier and T. Oberdorff for re-reading this work and for their support.
references
Agnew, D.J., L. Heaps, C. Jones, A. Watson, K. Berkieta and J. Pearce. 1999. Depth distri-bution and spawning pattern of Dissostichus eleginoides at South Georgia. CCAMLR Science, 6: 19–36.
Appleyard, S.A., R.D. Ward and R. Williams. 2002. Population structure of the Patagonian tooth-fish around Heard, McDonald and Macquarie Islands. Ant. Sci., 14: 364–373.
Appleyard, S.A., R. Williams and R.D. Ward. 2004. Population genetic structure of Patagonian toothfish in the West Indian Ocean sector of the Southern Ocean. CCAMLR Science, 11: 21–32.
Ashford, J., G. Duhamel, C. Jones and S. Bobko. 2005a. Age, growth and mortality of Patagonian toothfish (Dissostichus eleginoides) caught off Kerguelen. CCAMLR Science, 12: 29–41.
Ashford, J.R., C.M. Jones, E. Hofmann, I. Everson, C. Moreno, G. Duhamel, R. Williams. 2005b. Can otolith elemental signatures record the capture site of Patagonian toothfish (Dissostichus eleginoides), a fully marine fish in the Southern Ocean? Can. J. Fish. Aquat. Sci., 62 (12): 2832–2840.
Bez, N., E. De Oliveira and G. Duhamel. 2006. Repetitive fishing, local depletion, and fishing efficiencies in the Kerguelen Islands fisheries. ICES J. Mar. Sci., 63 (3): 532–542.
Brandão, A., D.S. Butterworth, B.P. Watkins and D.G.M. Miller. 2002. A first attempt at an assess-ment of the Patagonian toothfish (Dissostichus eleginoides) resource in the Prince Edward Islands EEZ. CCAMLR Science, 9: 11–32.
Burnham, K.P. and D.R. Anderson. 1998. Model Selection and Multimodel Inference: a Practical Information Theoretic Approach. Second edition: 60–64.
CCAMLR. 1994. Statistical Bulletin, Vol. 6 (1984–1993). CCAMLR, Hobart, Australia: 112 pp.
CCAMLR. 2004. Statistical Bulletin, Vol. 16 (1994–2003). CCAMLR, Hobart, Australia: 175 pp.
Duhamel, G. 1987. Ichthyofaune des secteurs indien occidental et atlantique oriental de l‘océan Austral: biogéographie, cycles biologiques et dynamique des populations. Thèse de doctorat d’État, Université Pierre et Marie Curie, Paris VI: 687 pp.

9
Patagonian toothfish fishery in the Kerguelen Islands
Duhamel, G. 1988. Distribution, abundance and evaluation of the biomass of nototheniid and channichthyid species on the Kerguelen shelf (Division 58.5.1) during the summer seasons (February to April) 1987 and 1988. Document WG-FSA-88/22 Rev. 1. CCAMLR, Hobart, Australia.
Duhamel, G. 1991. Biology and harvesting of Dissostichus eleginoides around Kerguelen Islands (Division 58.5.1). Document WG-FSA-91/9. CCAMLR, Hobart, Australia.
Duhamel, G. 1992. Exploratory longline fishing around the Kerguelen Islands (Division 58.5.1). Description of the fishing effort, catchability and target size of Dissostichus eleginoides. Docu-ment WG-FSA-92/31 Rev. 1. CCAMLR, Hobart, Australia.
Duhamel, G. 1993. The Dissostichus eleginoides fishery in Division 58.5.1 (Kerguelen Islands). Document WG-FSA-93/15. CCAMLR, Hobart, Australia.
Duhamel, G. 1995. Gestion des pêches aux îles Kerguelen. Recherche Marine, 13: 16–17.
Duhamel, G. 2003. La légine, pêcherie conflictuelle. Pêche légale et braconnage organisé. Cas du secteur indien de l’océan Austral. In: Exploitation et surexploitation des ressources marines vivan-tes. Rapport sur la Science et la Technologie n° 17. Académie des Sciences éditions Tec & Doc Lavoisier Paris: 177–187.
Everson, I. 1977. Fish. In: The Living Resources of the Southern Ocean. FAO GLO/SO/77/1, Rome: 75–112.
Hilborn, R. and C.J. Walters. 1987. A general model for simulation of stock and fleet dynamics in spatially heterogeneous fisheries. Can. J. Fish. Aquat. Sci., 44 (7): 1366–1369.
Rahikainen, M. and S. Kuikka. 2002. Fleet dynam-ics of herring trawlers – change in gear size and implications for interpretation of catch per unit effort. Can. J. Fish. Aquat. Sci., 59 (3): 531–541.
SC-CAMLR. 2003. Report of the Working Group on Fish Stock Assessment. In: Report of the Twenty-second Meeting of the Scientific Committee (SC-CAMLR-XXII), Annex 5. CCAMLR, Hobart, Australia: 287–547.
SC-CAMLR. 2004. Report of the Working Group on Fish Stock Assessment. In: Report of the Twenty-third Meeting of the Scientific Committee (SC-CAMLR-XXIII), Annex 5. CCAMLR, Hobart, Australia: 339–658.
SC-CAMLR. 2005. Report of the Working Group on Fish Stock Assessment. In: Report of the Twenty-fourth Meeting of the Scientific Committee (SC-CAMLR-XXIV), Annex 5. CCAMLR, Hobart, Australia: 289–561.
Sparre, P., E. Ursine and V.C. Venema. 1989. Introduction to tropical fish stock assessment – Part 1: Manual. FAO Fish. Tech. Pap., 306/1: 1–337.
Williams, R., G.N. Tuck, A.J. Constable and T. Lamb. 2002. Movement, growth and available abun-dance to the fishery of Dissostichus eleginoides Smitt, 1898 at Heard Island, derived from tag-ging experiments. CCAMLR Science, 9: 33–48.
Lord et al.
10
Table 1: Everson’s (1977) scale of nototheniid maturity stages.
Stage State
1 Immature 2 Maturing virgin 3 Developing 4 Gravid/Ripe 5 Spent
Table 2: Parameter estimates for Dissostichus eleginoides trawl CPUE (kg/hour trawling)(1979–2001) off the Kerguelen Islands; degrees of freedom: 14 163; * – significant; NS– not significant.
Variables Categories estimate Standard error
142.3717* 6.374942 Season (categorical) Summer –0.4534* 0.028217 Season Autumn –0.4318* 0.034359 Season Winter –0.9143* 0.085824 Season Spring 0.0000 Bathy (categorical) Shelf –0.9346* 0.167438 Bathy Shelf edge 0.0179 NS 0.041931 Bathy Open sea 0.0000 Depth (continuous) 0.0113* 0.000640 Depth2 (quadratic) (continuous) –0.0000* 0.000001 Years (continuous) –0.0691* 0.003232
Table 3: Parameter estimates for longline CPUE (kg/hook hauled) for Dissostichus eleginoides offthe Kerguelen Islands (1990–2004); degrees of freedom: 12 040; * – significant; NS – not significant.
Variables Categories estimate Standard error
178.2223* 5.316338 Gear (categorical) Autoline 0.1020* 0.040761 Gear Manual 0.0000 Season (categorical) Summer –0.0497* 0.017643 Season Autumn 0.0064 NS 0.020321 Season Winter –0.1988* 0.044512 Season Spring 0.0000 Bait (categorical) Mackerel –0.2061* 0.020020 Bait Sardine 0.2646* 0.044747 Bait Squid 0.1638* 0.041880 Bait Mixed bait 0.0000 Bathy (categorical) Shelf edge 0.0341* 0.014222 Bathy Open sea 0.0000 Depth (continuous) –0.0000 NS 0.000028 Year (continuous) –0.0864* 0.002668 Soak time (continuous) 0.0002* 0.000023 Soak time2 (quadratic) (continuous) –0.0000* 0.000000
11
Patagonian toothfish fishery in the Kerguelen Islands
Table 4: ANOVA. Level of significance of pairwise differences in mean length of Dissostichus eleginoidesbetween sexes and depth classes off the Kerguelen Islands in 2002/03. A posteriori Newman-Keuls test (p < 5%). * – significant; NS – not significant.
Female MaleDepth
500–1 000 m
1 000– 1 500 m
>1 500 m 500– 1 000 m
1 000– 1 500 m
>1 500 m
Average size 748 mm 775 mm 901 mm 702 mm 755 mm 827 mm Female
500–1 000 m 0.000022* 0.000017* 0.000009* 0.077572 NS 0.000008* 1 000–1 500 m 0.000022* 0.000008* 0.000011* 0.000009* >1 500 m 0.000020* 0.000008* 0.000009*
Male 500–1 000 m 0.000022* 0.000017* 1 000–1 500 m 0.000022*
Table 5: ANOVA. Level of significance of pairwise differences in mean length of Dissostichus eleginoidesbetween sexes and depth classes off the Kerguelen Islands in 2003/04. A posteriori Newman-Keuls test (p < 5%). * – significant; NS – not significant.
Female Male Depth
500–1 000 m
1 000– 1 500 m
>1 500 m 500– 1 000 m
1 000– 1 500 m
>1 500 m
Average size 760 mm 765 mm 910 mm 711 mm 748 mm 843 mm Female
500–1 000 m 0.042148* 0.000008* 0.000022* 0.000011* 0.000022* 1 000–1 500 m 0.000022* 0.000008* 0.000022* 0.000009* >1 500 m 0.000020* 0.000017* 0.000009*
Male 500–1 000 m 0.000009* 0.000017* 1 000–1 500 m 0.000008*
Lord et al.
12
Tab
le 6
: A
NO
VA
. L
evel
of
sign
ific
ance
of
pair
wis
e d
iffe
renc
es i
n m
ean
leng
th o
f D
isso
stic
hus
eleg
inoi
des
betw
een
sexe
s an
d
geog
raph
ical
sec
tors
off
the
Ker
guel
en I
slan
ds
in 2
002/
03. A
pos
teri
ori N
ewm
an-K
euls
tes
t (p
< 5
%).
* –
sign
ific
ant;
NS
–no
t si
gnif
ican
t.
Eas
tN
orth
wes
tW
est
Skif
Fem
ale
Mal
e Fe
mal
e M
ale
Fem
ale
Mal
e Fe
mal
e M
ale
Ave
rage
siz
e 76
2 m
m
710
mm
73
7 m
m
724
mm
79
5 m
m
767
mm
84
6 m
m
771
mm
E
ast
Fem
ale
0.
0000
08*
0.00
0278
* 0.
0000
22*
0.00
0020
* 0.
5348
62 N
S 0.
0000
17*
0.47
4543
NS
Mal
e
0.
0004
35*
0.06
0487
NS
0.00
0026
* 0.
0000
17*
0.00
0032
* 0.
0000
20*
Nor
thw
est
Fem
ale
0.
0541
66 N
S 0.
0000
17*
0.00
0079
* 0.
0000
20*
0.00
0016
* M
ale
0.00
0020
* 0.
0000
08*
0.00
0026
* 0.
0000
17*
Wes
t
Fe
mal
e
0.00
0135
* 0.
0000
09*
0.00
0370
* M
ale
0.00
0008
* 0.
5865
84 N
S Sk
if
Fem
ale
0.
0000
22*
Sam
ple
size
69
18
6136
61
53
6526
44
87
5722
12
4 41
2 Se
x ra
tio%
53
47
48
52
44
56
23
77
13
Patagonian toothfish fishery in the Kerguelen Islands
Tab
le 7
: A
NO
VA
. L
evel
of
sign
ific
ance
of
pair
wis
e d
iffe
renc
es i
n m
ean
leng
th o
f D
isso
stic
hus
eleg
inoi
des
betw
een
sexe
s an
d
geog
raph
ical
sec
tors
off
the
Ker
guel
en I
slan
ds
in 2
003/
04. A
pos
teri
ori
New
man
-Keu
ls t
est
(p <
5%
). *
– si
gnif
ican
t; N
S –
not s
igni
fica
nt. E
ast
Nor
thw
est
Wes
tSk
if
Fem
ale
Mal
e Fe
mal
e M
ale
Fem
ale
Mal
e Fe
mal
e M
ale
Ave
rage
siz
e 78
4 m
m
745
mm
74
4 m
m
733
mm
79
5 m
m
747
mm
91
9 m
m
818
mm
E
ast
Fem
ale
0.
0000
22*
0.00
0008
* 0.
0000
17*
0.00
1230
* 0.
0000
09*
0.00
0008
* 0.
0000
22*
Mal
e
0.
7685
88 N
S 0.
0003
11*
0.00
0008
* 0.
6689
53 N
S 0.
0000
20*
0.00
0017
* N
orth
wes
t
Fe
mal
e
0.00
0330
* 0.
0000
17*
0.75
0557
NS
0.00
0026
* 0.
0000
20*
Mal
e
0.
0000
20*
0.00
0099
* 0.
0000
32*
0.00
0026
* W
est
Fem
ale
0.
0000
22*
0.00
0022
* 0.
0000
09*
Mal
e
0.
0000
17*
0.00
0008
* Sk
if
Fem
ale
0.
0000
09*
Sam
ple
size
38
98
3451
46
98
6899
33
05
6892
12
95
3096
Se
x-ra
tio
%
53
47
40
60
32
68
30
70

Lord et al.
14
0
5000
10000
15000
20000
1971 1973 1975 1977 1979 1981 1983 1985 1987 1989 1991 1993 1995 1997 1999 2001 2003 2005
Years
Ton
nes
legal fishing illegal fishing
EEZTrawl Longline
0
5000
10000
15000
20000
1971 1973 1975 1977 1979 1981 1983 1985 1987 1989 1991 1993 1995 1997 1999 2001 2003 2005
Years
Ton
nes
legal fishing illegal fishing
EEZTrawl Longline
Years
Figure 1: Dissostichus eleginoides catches (tonnes per year) at Kerguelen. EEZ – establishment of the Exclusive Economic Zone.
Figure 2: Map of the different geographical sectors in the northern part of the Kerguelen Plateau (French and Australian Exclusive Economic Zones have been marked) (map taken from a fishing logbook).
Northwestern sector
Western sector
Eastern sector
Skif sector

15
Patagonian toothfish fishery in the Kerguelen Islands
Figure 3: Dissostichus eleginoides trawl CPUE (kg/hour trawling) by season (1 – summer, 2 – autumn, 3 – winter, 4 – spring) around the Kerguelen Islands.
Season
Mean SE ±0.95
1 2 3 4
2600
2400
2200
2000
1800
1600
1400
1200
1000
800
600
CP
UE
(kg/
hour
)
Depth (m)
Mean SE ±0.95
0 100 200 300 400 500 600 700 800 900 1000 1100
2800
2600
2400
2200
2000
1800
1600
1400
1200
1000
800
600
400
200
0
–200
CP
UE
(kg/
hour
)
Figure 4: Dissostichus eleginoides trawl CPUE (kg/hour trawling) by depth around the Kerguelen Islands.
Lord et al.
16
Figure 5: Annual average Dissostichus eleginoides CPUE (kg/hour trawling) for trawlers around the Kerguelen Islands.
Year
Average Standard error
1979 1981 1983 1985 1987 1989 1991 1993 1995 1997 1999 2001
4500
4000
3500
3000
2500
2000
1500
1000
500
0
CP
UE
(kg/
hour
traw
ling)
Average CPUE (kg/hour trawling) by year
Figure 6: Longline CPUE (g/hook hauled) of Dissostichus eleginoides around the Kerguelen Islands by depth (m).
Depth (m)Mean SE ±0.95
0 200 400 600 800 1000 1200 1400 1600 1800 2000 2200 2400
600
500
400
300
200
100
0
–100
–200
CP
UE
(kg/
hook
cas
t)
17
Patagonian toothfish fishery in the Kerguelen Islands
Figure 7: Mean weight (kg) of Dissostichus eleginoides caught by longline around the Kerguelen Islands by depth (m).
Depth (m)
Mean SE ±0.95
0 200 400 600 800 1000 1200 1400 1600 1800 2000 2200 2400
8000
6000
4000
2000
0
–2000
–4000
Wei
ght o
f too
thfis
h (k
g)
Figure 8: Mean number of Dissostichus eleginoides caught by longline around the Kerguelen Islands by depth (m).
Depth (m)
Mean SE ±0.95
0 200 400 600 800 1000 1200 1400 1600 1800 2000 2200 2400
1000
800
600
400
200
0
–200
–400
Num
ber o
f too
thfis
h

Lord et al.
18
Figure 10: Number of Dissostichus eleginoides caught by longline around the Kerguelen Islands versus soak time.
Soak time (mn)Mean SE ±0.95
–2000 0 2000 4000 6000 8000 10000 12000
1600
1400
1200
1000
800
600
400
200
0
–200
–400
–600
Num
ber o
f too
thfis
h
–1000 1000 3000 5000 7000 9000 11000
Figure 9: Annual average Dissostichus eleginoides CPUE (g/hook) for longliners around the Kerguelen Islands.
Year
Average Standard error
1990 1992 1994 1996 1998 2000 2002
600
550
500
450
400
350
300
250
200
150
CP
UE
(kg/
hook
cas
t)Average CPUE (g/hook cast) by year

19
Patagonian toothfish fishery in the Kerguelen Islands
Figure 11: Kerguelen Island mean longline depth (m) fished by year.
Year 1990 1991 1992 1993 1994 1995 1996 1997 1998 1999 2000 2001 2002 2003
1200
1100
1000
900
800
700
600
500
400
Dep
th (m
)
Mean SE ±0.95
Figure 12: Mean weight/number of Dissostichus eleginoides caught by longline by year around the Kerguelen Islands.
Year 1990 1991 1992 1993 1994 1995 1996 1997 1998 1999 2000 2001 2002 2003
10
8
6
4
2
0
–2
Wei
ght/n
umbe
r
Mean SE ±0.95

Lord et al.
20
Figure 13: Sexual maturity stages (3, 4, 5) for Dissostichus eleginoides females from the western and the Skif sectors off the Kerguelen Islands by 10-day period from March to August in 2003/04.
0%
10%
20%
30%
40%
50%
60%
70%
80%
90%
100%
2-03
1-04
3-04
2-05
1-06
3-06
2-07
1-08
10 day periods
stage 5
stage 4
stage 3
10-day period
2-03
100%
90%
80%
70%
60%
50%
40%
30%
20%
10%
0%
1-08
2-07
3-06
1-06
2-05
3-04
1-04
stage 5
stage 4
stage 3
Figure 14: Sexual maturity stages (3, 4, 5) for Dissostichus eleginoides males from the western and the Skif sectors off the Kerguelen Islands by 10-day period from March to August in 2003/04.
0%
10%
20%
30%
40%
50%
60%
70%
80%
90%
100%
2-03
1-04
3-04
2-05
1-06
3-06
2-07
1-08
10 day periods
stage 5
stage 4
stage 3
10-day period
2-03
100%
90%
80%
70%
60%
50%
40%
30%
20%
10%
0%
1-08
2-07
3-06
1-06
2-05
3-04
1-04
stage 5
stage 4
stage 3

21
Patagonian toothfish fishery in the Kerguelen Islands
Figure 15: Percentage of mature Dissostichus eleginoides males by length and area off the Kerguelen Islands. Assessment of length-at-first-maturity (63 cm) (<50% stages 1, 2; >50% stages 3, 4, 5).
Male
0
10
20
30
40
50
60
70
80
90
100
40 45 50 55 60 65 70 75 80 85 90 95 100 105 110
Total length (cm)
% m
atur
e in
divi
dual
s
NW sector W sector Skif sector
Figure 16: Percentage of mature Dissostichus eleginoides females by length and area off the Kerguelen Islands. Assessment of length-at-first-maturity (85 cm) (<50% stages 1, 2; >50% stages 3, 4, 5).
Female
0
10
20
30
40
50
60
70
80
90
100
40 45 50 55 60 65 70 75 80 85 90 95 100 105 110 115 120
Total length (cm)
% m
atur
e in
divi
dual
s
NW sector W sector Skif sector

Lord et al.
22
Liste des tableaux
Tableau 1: Stades de maturité des Nototheniidés selon l’échelle d’Everson (1977).
Tableau 2: Estimation des paramètres de la CPUE de la pêche au chalut de Dissostichus eleginoides (kg/heure de chalutage) (1979–2001) au large des îles Kerguelen ; degrés de liberté : 14 163; * – significatif ; NS – non significatif.
Tableau 3: Estimation des paramètres de la CPUE de la pêche à la palangre (kg/hameçon remonté) de Dissostichus eleginoides au large des îles Kerguelen (1990–2004); degrés de liberté : 12 040; * – significatif ; NS – non significatif.
Tableau 4: ANOVA. Seuil de signification des différences par paires des longueurs moyennes de Dissostichus eleginoides entre les sexes et entre les intervalles de profondeur au large des îles Kerguelen en 2002/03. Test de Newman-Keuls, a posteriori (p < 5%). * – significatif ; NS – non significatif.
Tableau 5: ANOVA. Seuil de signification des différences par paires des longueurs moyennes de Dissostichus eleginoides entre les sexes et entre les intervalles de profondeur au large des îles Kerguelen en 2003/04. Test de Newman-Keuls, a posteriori (p < 5%). * – significatif ; NS – non significatif.
Tableau 6: ANOVA. Seuil de signification des différences par paires des longueurs moyennes de Dissostichus eleginoides entre les sexes et entre les secteurs géographiques au large des îles Kerguelen en 2002/03. Test de Newman-Keuls, a posteriori (p < 5%). * – significatif ; NS – non significatif.
Tableau 7: ANOVA. Seuil de signification des différences par paires des longueurs moyennes de Dissostichus eleginoides entre les sexes et entre les secteurs géographiques au large des îles Kerguelen en 2003/04. Test de Newman-Keuls, a posteriori (p < 5%). * – significatif ; NS – non significatif.
Liste des figures
Figure 1: Captures (tonnes par année) de Dissostichus eleginoides aux Kerguelen. EEZ : établissement de la zone économique exclusive.
Figure 2: Carte des différents secteurs géographiques de la partie nord du plateau de Kerguelen (les zones économiques exclusives française et australienne sont indiquées) (carte tirée d’un carnet de pêche).
Figure 3: CPUE de chalutage de Dissostichus eleginoides (kg/heure de chalutage) par saison (1 – été, 2 – automne, 3 – hiver, 4 – printemps) autour des îles Kerguelen.
Figure 4: CPUE de chalutage de Dissostichus eleginoides (kg/ heure de chalutage) selon la profondeur autour des îles Kerguelen.
Figure 5: Moyenne annuelle de la CPUE de Dissostichus eleginoides (kg/heure de chalutage) des chalutiers autour des îles Kerguelen.
Figure 6: CPUE de pêche à la palangre (g/hameçon remonté) de Dissostichus eleginoides autour des îles Kerguelen selon la profondeur (m).
Figure 7: Poids moyen (kg) de Dissostichus eleginoides capturé à la palangre autour des îles Kerguelen selon la profondeur (m).
Figure 8: Nombre moyen de Dissostichus eleginoides capturé à la palangre autour des îles Kerguelen selon la profondeur (m).
Figure 9: CPUE moyenne annuelle de Dissostichus eleginoides (g/hameçon) des palangriers autour des îles Kerguelen.
Figure 10: Nombre de Dissostichus eleginoides capturé à la palangre autour des îles Kerguelen par rapport au temps d’immersion.
Figure 11: Profondeur moyenne (m) de pêche à la palangre aux îles Kerguelen par année.

23
Patagonian toothfish fishery in the Kerguelen Islands
Figure 12: Poids moyen/nombre de Dissostichus eleginoides capturé à la palangre par année autour des îles Kerguelen.
Figure 13: Stades de maturité sexuelle (3, 4, 5) des femelles de Dissostichus eleginoides du secteur ouest et du secteur Skif au large des îles Kerguelen par période de 10 jours de mars à août en 2003/04.
Figure 14: Stades de maturité sexuelle (3, 4, 5) des mâles de Dissostichus eleginoides du secteur ouest et du secteur Skif au large des îles Kerguelen par périodes de 10 jours de mars à août en 2003/04.
Figure 15: Pourcentage de mâles matures de Dissostichus eleginoides par longueur et secteur au large des îles Kerguelen. Evaluation de la longueur à la première maturité (63 cm) (<50% stades 1, 2; >50% stades 3, 4, 5).
Figure 16: Pourcentage de femelles matures de Dissostichus eleginoides par longueur et secteur au large des îles Kerguelen. Evaluation de la longueur à la première maturité (85 cm) (<50% stades 1, 2; >50% stades 3, 4, 5).
Список таблиц
Табл. 1: Шкала стадий половозрелости нототениевых по Эверсону (Everson, 1977).
Табл. 2: Оценки параметров для CPUE тралового промысла Dissostichus eleginoides (кг/час траления) (1979–2001 гг.) у о-вов Кергелен; степеней свободы: 14 163; * – значимый; NS – незначимый.
Табл. 3: Оценки параметров для CPUE ярусного промысла Dissostichus eleginoides (кг/выбранных крючков) у о-вов Кергелен (1990–2004 гг.); степеней свободы: 12 040; * – значимый; NS – незначимый.
Табл. 4: ANOVA. Уровень значимости попарных разностей средней длины Dissostichus eleginoides между полами и классами глубин у о-вов Кергелен в 2002/03 г. Апостериорный критерий Ньюмана-Кеулса (p < 5%). * – значимый; NS – незначимый.
Табл. 5: ANOVA. Уровень значимости попарных разностей средней длины Dissostichus eleginoides между полами и классами глубин у о-вов Кергелен в 2003/04 г. Апостериорный критерий Ньюмана-Кеулса (p < 5%). * – значимый; NS – незначимый.
Табл. 6: ANOVA. Уровень значимости попарных разностей средней длины Dissostichus eleginoides между полами и географическими секторами у о-вов Кергелен в 2002/03 г. Апостериорный критерий Ньюмана-Кеулса (p < 5%). * – значимый; NS – незначимый.
Табл. 7: ANOVA. Уровень значимости попарных разностей средней длины Dissostichus eleginoides между полами и географическими секторами у о-вов Кергелен в 2003/04 г. Апостериорный критерий Ньюмана-Кеулса (p < 5%). * – значимый; NS – незначимый.
Список рисунков
Рис. 1: Уловы Dissostichus eleginoides (т в год) у Кергелена. «EEZ» – создание Исключительной экономической зоны.
Рис. 2: Карта различных географических секторов в северной части плато Кергелен (отмечены исключительные экономические зоны Франции и Австралии) (карта взята из промыслового журнала).
Рис. 3: CPUE тралового промысла Dissostichus eleginoides (кг/час траления) по сезонам (1 – лето, 2 – осень, 3 – зима, 4 – весна) вокруг о-вов Кергелен.
Рис. 4: CPUE тралового промысла Dissostichus eleginoides (кг/час траления) по глубинам вокруг о-вов Кергелен.
Рис. 5: Средний годовой CPUE траулеров (кг/час траления) при промысле Dissostichus eleginoides вокруг о-вов Кергелен.
Lord et al.
24
Рис. 6: CPUE ярусного промысла Dissostichus eleginoides (г/выбранных крючков) вокруг о-вов Кергелен, по глубине (м).
Рис. 7: Средний вес (кг) Dissostichus eleginoides, пойманных при ярусном промысле вокруг о-вов Кергелен, по глубине (м).
Рис. 8: Среднее количество Dissostichus eleginoides, пойманных при ярусном промысле вокруг о-вов Кергелен, по глубине (м).
Рис. 9: Средний годовой CPUE ярусоловов (г/крючок) при промысле Dissostichus eleginoides вокруг о-вов Кергелен.
Рис. 10: Количество Dissostichus eleginoides, пойманных при ярусном промысле вокруг о-вов Кергелен, относительно времени застоя.
Рис. 11: Средняя глубина ведения ярусного промысла (м) у о-вов Кергелен, по годам.
Рис. 12: Средний вес/количество Dissostichus eleginoides, пойманных при ярусном промысле вокруг о-вов Кергелен, по годам.
Рис. 13: Стадии половозрелости (3, 4, 5) самок Dissostichus eleginoides из западного сектора и сектора Скиф у о-вов Кергелен по 10-дневным периодам с марта по август 2003/04 г.
Рис. 14: Стадии половозрелости (3, 4, 5) самцов Dissostichus eleginoides из западного сектора и сектора Скиф у о-вов Кергелен по 10-дневным периодам с марта по август 2003/04 г.
Рис. 15: Процент зрелых самцов Dissostichus eleginoides по длине и району у о-вов Кергелен. Оценка длины при достижении половозрелости (63 см) (<50% стадии 1, 2; >50% стадии 3, 4, 5).
Рис. 16: Процент зрелых самок Dissostichus eleginoides по длине и району у о-вов Кергелен. Оценка длины при достижении половозрелости (85 см) (<50% стадии 1, 2; >50% стадии 3, 4, 5).
Lista de las tablas
Tabla 1: Estadios de madurez de nototénidos de acuerdo con la escala de Everson (1977).
Tabla 2: Valores estimados de la CPUE (kg/hora de arrastre) de la pesca de arrastre de Dissostichus eleginoides (1979–2001) frente a las Islas Kerguelén; grados de libertad: 14 163; * – significativo; NS – no significativo.
Tabla 3: Valores estimados de la CPUE (kg/anzuelos recuperados) de la pesca de palangre de Dissostichus eleginoides frente a las Islas Kerguelén (1990–2004); grados de libertad: 12 040; * – significativo; NS – no significativo.
Tabla 4: ANOVA. Nivel de significación de las diferencias entre pares de tallas medias de Dissostichus eleginoides por sexo e intervalo de profundidad frente a las Islas Kerguelén en 2002/03. Prueba de Newman-Keuls a posteriori (p < 5%). * – significativo; NS – no significativo.
Tabla 5: ANOVA. Nivel de significación de las diferencias entre pares de tallas medias de Dissostichus eleginoides por sexo e intervalo de profundidad frente a las Islas Kerguelén en 2003/04. Prueba de Newman-Keuls a posteriori (p < 5%). * – significativo; NS – no significativo.
Tabla 6: ANOVA. Nivel de significación de las diferencias entre parejas de tallas medias de Dissostichus eleginoides por sexo y sector geográfico frente a las Islas Kerguelén en 2002/03. Prueba de Newman-Keuls a posteriori (p < 5%). * – significativo; NS – no significativo.
Tabla 7: ANOVA. Nivel de significación de las diferencias entre pares de tallas medias de Dissostichus eleginoides por sexo y sector geográfico frente a las Islas Kerguelén en 2003/04. Prueba de Newman-Keuls a posteriori (p < 5%). * – significativo; NS – no significativo.

25
Patagonian toothfish fishery in the Kerguelen Islands
Lista de las figuras
Figura 1: Capturas de Dissostichus eleginoides (toneladas por año) en Kerguelén. ZEE – establecimiento de la Zona de Exclusividad Económica.
Figura 2: Mapa de los distintos sectores geográficos al norte de la plataforma de Kerguelén (se han marcado las zonas de exclusividad económica francesa y australiana) (Mapa tomado de una bitácora de pesca).
Figura 3: CPUE (kg/hora de arrastre) de la pesca de arrastre de Dissostichus eleginoides por temporada (1 – verano, 2 – otoño, 3 – invierno, 4 – primavera) alrededor de las Islas Kerguelén.
Figura 4: CPUE (kg/hora de arrastre) de la pesca de arrastre de Dissostichus eleginoides, en función de la profundidad, alrededor de las Islas Kerguelén.
Figura 5: Promedio del CPUE (kg/hora de arrastre) anual de Dissostichus eleginoides de los arrastreros que operan alrededor de las Islas Kerguelén.
Figura 6: CPUE (g/anzuelos recuperados) de la pesca de palangre de Dissostichus eleginoides alrededor de las Islas Kerguelén, en función de la profundidad (m).
Figura 7: Peso promedio (kg) de Dissostichus eleginoides capturado por palangreros alrededor de las Islas Kerguelén, en función de la profundidad (m).
Figura 8: Número promedio de ejemplares de Dissostichus eleginoides capturado por palangreros alrededor de las Islas Kerguelén, en función de la profundidad (m).
Figura 9: Promedio del CPUE (g/anzuelos) anual de Dissostichus eleginoides de los palangreros alrededor de las Islas Kerguelén.
Figura 10: Número de ejemplares de Dissostichus eleginoides capturado por palangreros alrededor de las Islas Kerguelén, en función del tiempo de inmersión.
Figura 11: Profundidad promedio (m) anual explotada por los palangreros en Isla Kerguelén.
Figura 12: Peso promedio/número de ejemplares de Dissostichus eleginoides capturado anualmente por palangreros alrededor de las Islas Kerguelén.
Figura 13: Estadios de madurez sexual (3, 4, 5) de las hembras de Dissostichus eleginoides de los sectores oeste y Skif frente a las Islas Kerguelén, por períodos de 10 días, desde marzo hasta agosto en 2003/04.
Figura 14: Estadios de madurez sexual (3, 4, 5) de los machos de Dissostichus eleginoides de los sectores oeste y Skif frente a las Islas Kerguelén, por períodos de 10 días, desde marzo hasta agosto en 2003/04.
Figura 15: Porcentaje de Dissostichus eleginoides machos maduros por talla y área frente a las Islas Kerguelén. Evaluación de la talla en la primera madurez (63 cm) (<50% estadios 1, 2; >50% estadios 3, 4, 5).
Figura 16: Porcentaje de Dissostichus eleginoides hembras maduras por talla y área frente a las Islas Kerguelén. Evaluación de la talla en la primera madurez (85 cm) (<50% estadios 1, 2; >50% estadios 3, 4, 5).


