Embed Size (px)
Citation preview
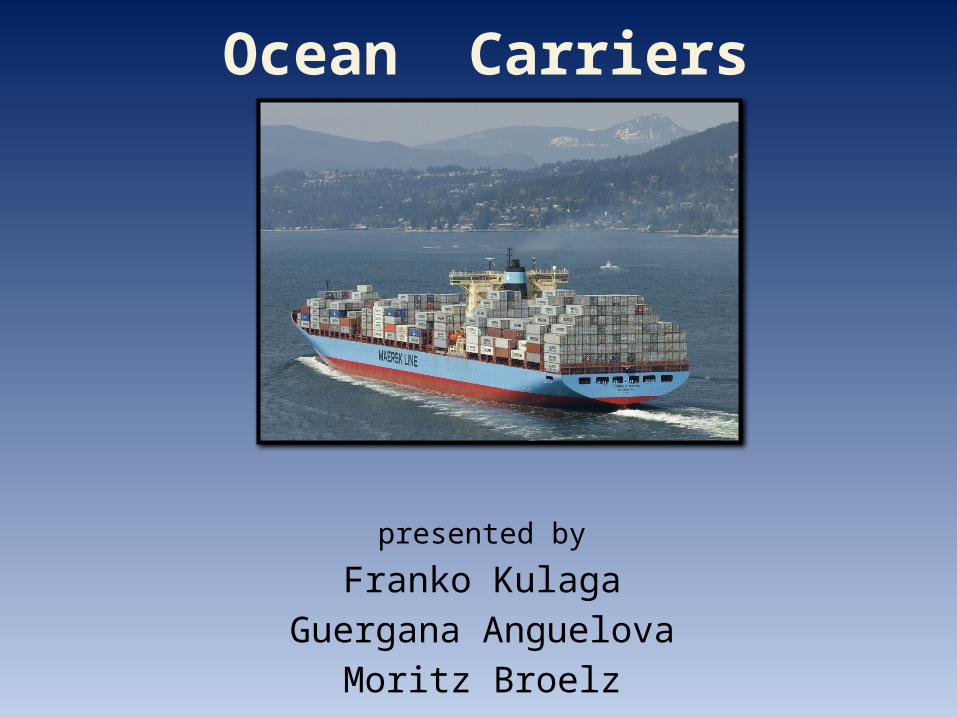
Ocean Carriers
presented byFranko Kulaga
Guergana AnguelovaMoritz Broelz

Agenda
IntroductionProject FactorsMethodologyResultsSensitivity AnalysisRecommendationsDiscussion
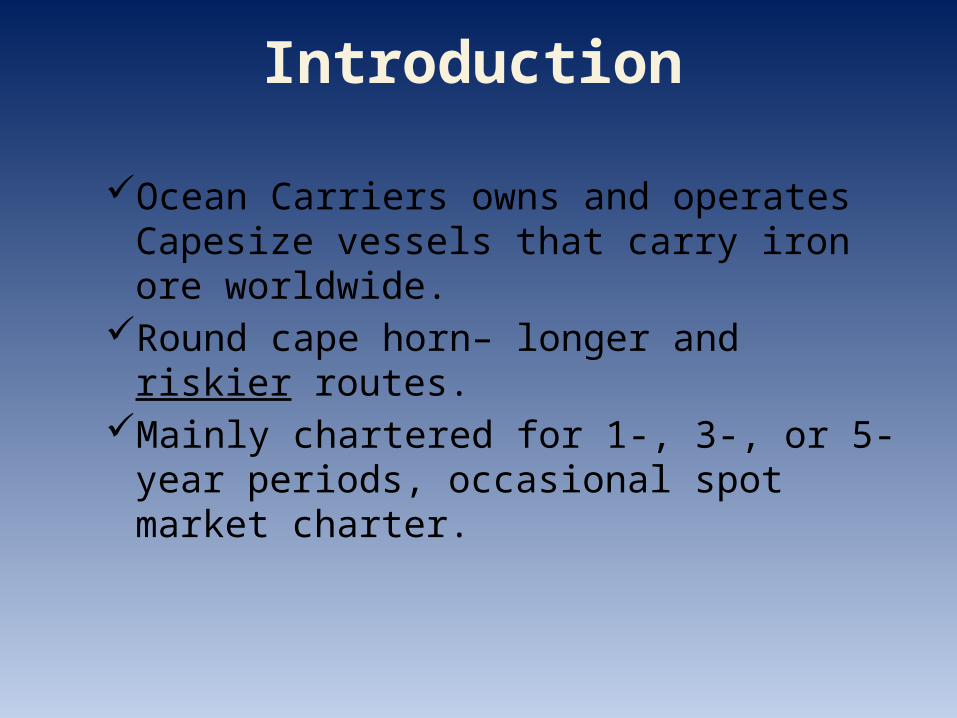
Introduction
Ocean Carriers owns and operates Capesize vessels that carry iron ore worldwide.
Round cape horn– longer and riskier routes.
Mainly chartered for 1-, 3-, or 5-year periods, occasional spot market charter.
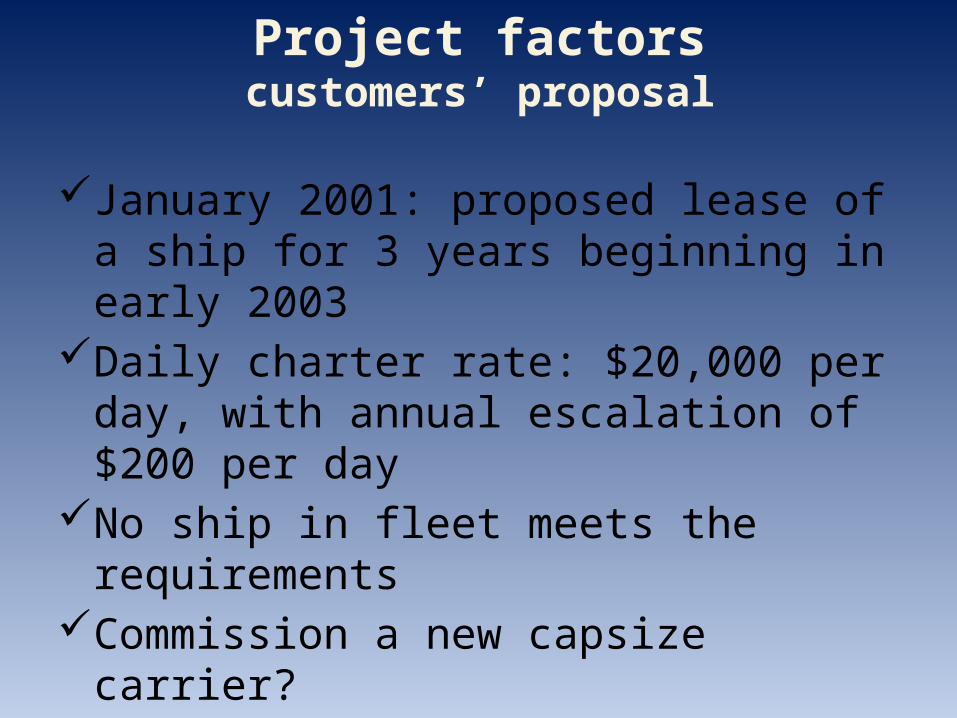
January 2001: proposed lease of a ship for 3 years beginning in early 2003
Daily charter rate: $20,000 per day, with annual escalation of $200 per day
No ship in fleet meets the requirements
Commission a new capsize carrier?
Option 1: Ocean carriers is US firm (35% tax)
Option 2: Ocean carriers is HK firm (0% tax)
Project factorscustomers’ proposal
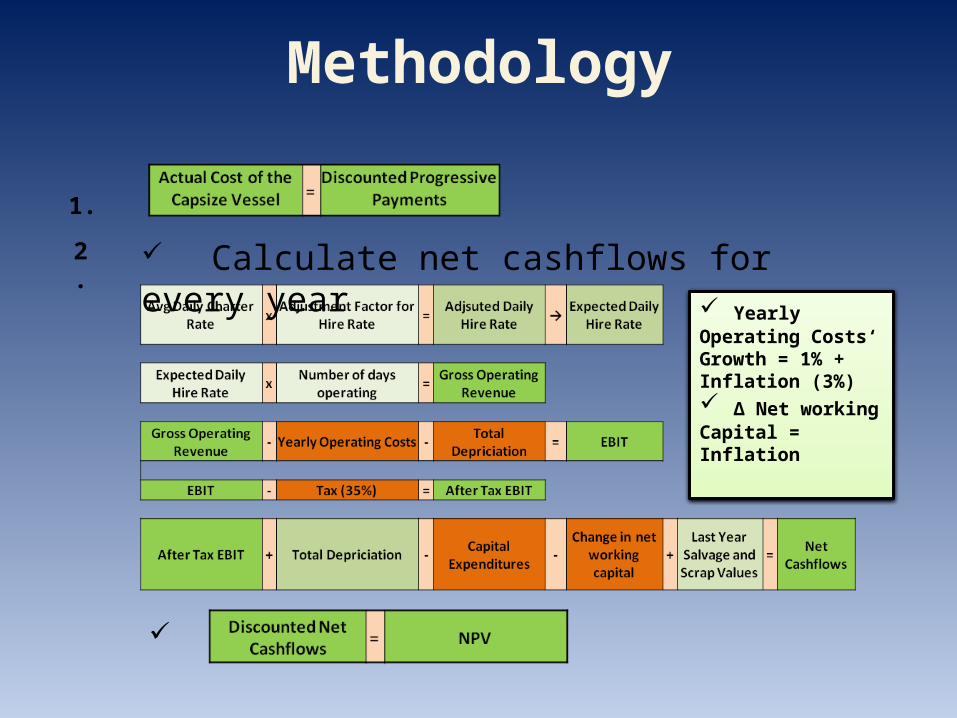
Methodology
Yearly Operating Costs‘ Growth = 1% + Inflation (3%) ∆ Net working Capital = Inflation
1.2.
Calculate net cashflows for every year
Results
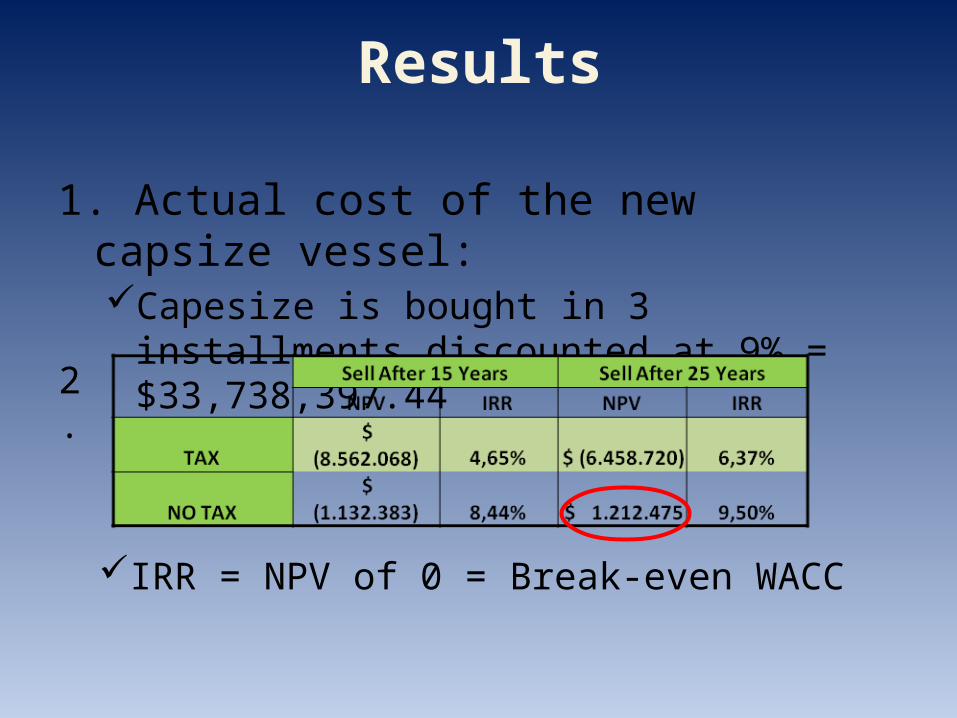
1. Actual cost of the new capsize vessel:Capesize is bought in 3 installments discounted at 9% = $33,738,397.44
IRR = NPV of 0 = Break-even WACC
2.
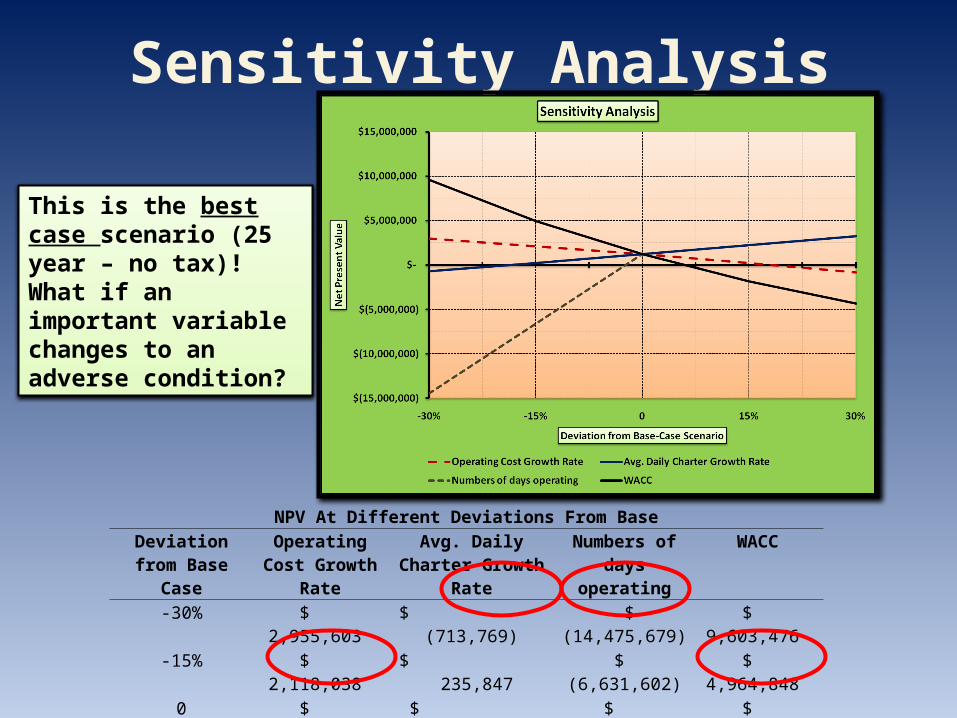
NPV At Different Deviations From BaseDeviation from Base
Case
Operating Cost Growth
Rate
Avg. Daily Charter Growth
Rate
Numbers of days
operating
WACC
-30% $ 2,955,603
$ (713,769)
$ (14,475,679)
$ 9,603,476
-15% $ 2,118,038
$ 235,847
$ (6,631,602)
$ 4,964,848
0 $ 1,212,475
$ 1,212,475
$ 1,212,475
$ 1,212,475
15% $ 232,610
$ 2,216,939
N/A $ (1,844,225)
30% $ (828,474)
$ 3,250,087
N/A $ (4,349,700)
Range $ 3,784,076
$ 3,963,856
$ 15,688,155
$ 13,953,176
Sensitivity Analysis
This is the best case scenario (25 year – no tax)! What if an important variable changes to an adverse condition?
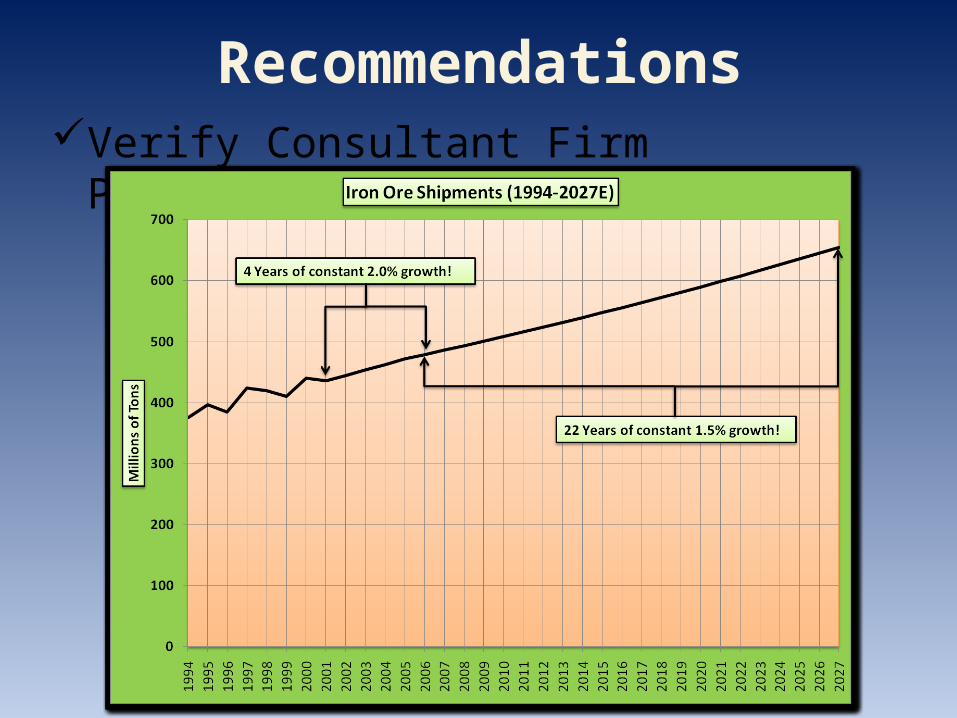
RecommendationsVerify Consultant Firm Projections!
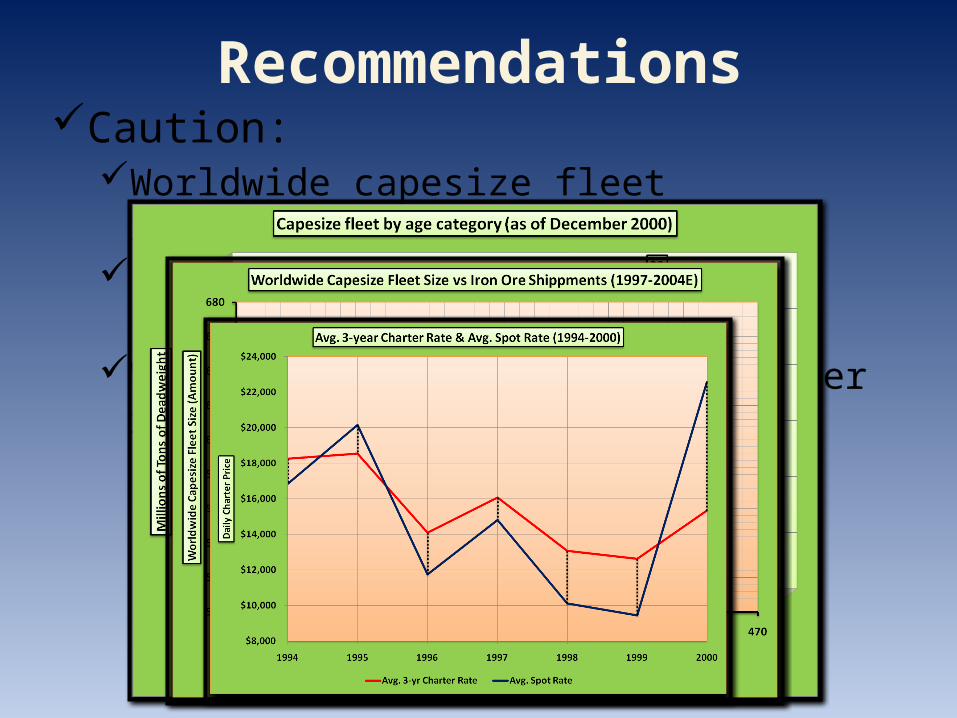
RecommendationsCaution:
Worldwide capesize fleet relatively new
In market downturn -> excess capacity (supply)!
What would happen to spot-charter rates?
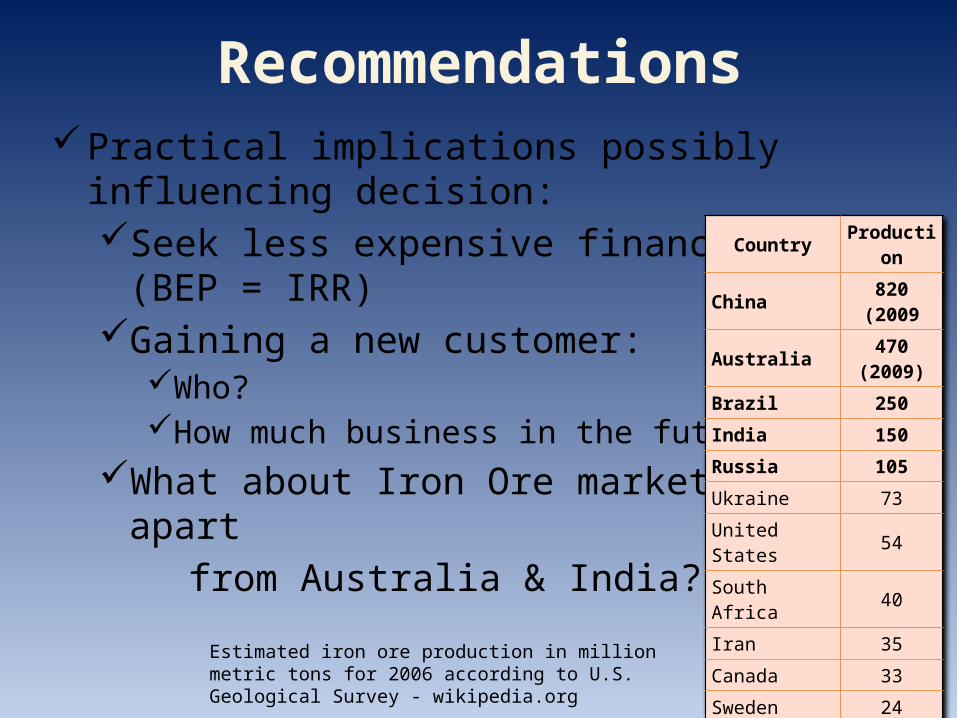
RecommendationsPractical implications possibly influencing decision:Seek less expensive financing (BEP = IRR)
Gaining a new customer:Who?How much business in the future?
What about Iron Ore markets apart
from Australia & India?
Country Production
China 820 (2009
Australia 470 (2009)
Brazil 250India 150Russia 105Ukraine 73United States 54
South Africa 40
Iran 35Canada 33Sweden 24Venezuela 20Kazakhstan 15Mauritania 11Other countries 43
Total world 1690
Estimated iron ore production in million metric tons for 2006 according to U.S. Geological Survey - wikipedia.org
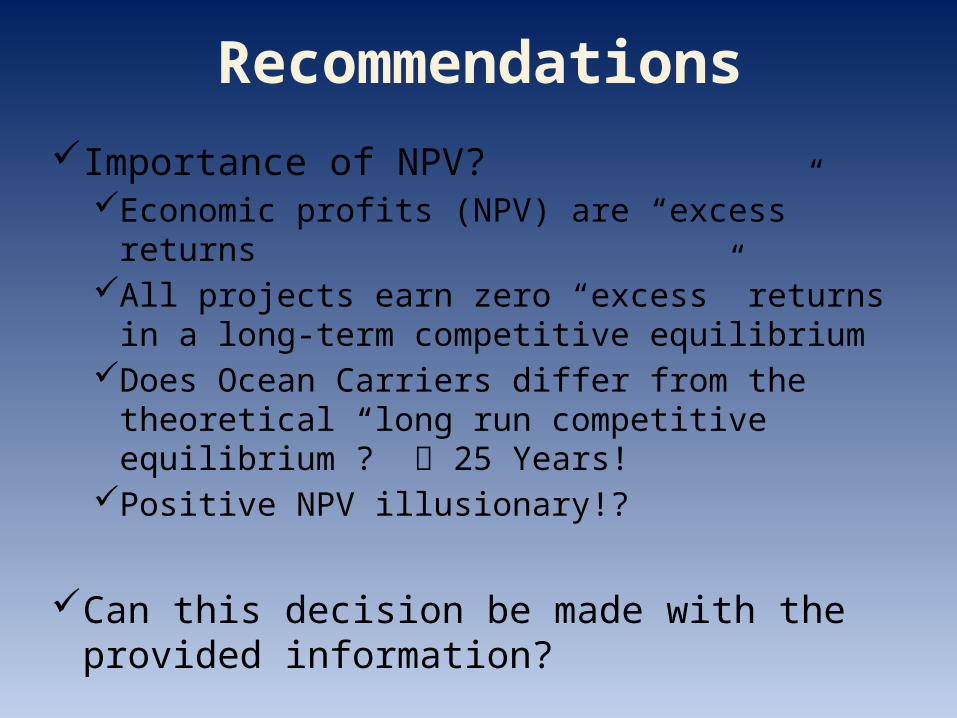
RecommendationsImportance of NPV?
Economic profits (NPV) are “excess” returns
All projects earn zero “excess” returns in a long-term competitive equilibrium
Does Ocean Carriers differ from the theoretical “long run competitive equilibrium”? 25 Years!
Positive NPV illusionary!?
Can this decision be made with the provided information?

Discussion
Any questions


