Embed Size (px)
Citation preview
THE OPEN UNIVERSITY OF TANZANIA
FACTS AND FIGURES 2009/2010
The Directorate of Planning and Development
June 2010

2
CONTENTS
FOREWORD ............................................................................................................................................................. 3
EXECUTIVE SUMMARY ....................................................................................................................................... 4
ACKNOWLEDGMENT ........................................................................................................................................... 5
LIST OF TABLES .................................................................................................................................................... 6
LIST OF FIGURES ................................................................................................................................................... 6
ABBREVIATIONS ................................................................................................................................................... 7
1.1 UNDERGRADUATE ENROLMENT ............................................................................................................ 8
1.1.1 Enrolment at Undergraduate level by Gender ......................................................................................... 8
1.1.2 Enrolment into Various Faculties at the Undergraduate level ............................................................... 13
1.1.3 Students’ Admission by Regional Centres ............................................................................................ 16
1.1.4 Postgraduate Enrolment ........................................................................................................................ 25
1.1.5 Enrolment into Non-Degree Programmes ............................................................................................. 27
2.1 UNDERGRADUATE PROGRAMMES ....................................................................................................... 29
3.1 POST GRADUATE PROGRAMMES .......................................................................................................... 30
4.1 GRADUATES BY PROGRAMMES ............................................................................................................ 32
5.1 GRADUATES BY REGIONS ...................................................................................................................... 35
6.1 ACADEMIC STAFF ..................................................................................................................................... 38
6.1.1 Academic Staff by Qualification and Gender ........................................................................................ 38
6.1.2 Academic Staff by Rank and Gender .................................................................................................... 40
6.1.3 Staff Recruitment .................................................................................................................................. 47
7.1 SOURCES OF FUNDS ................................................................................................................................. 51
7.1.1 Government Subvention: Recurrent and Development Subvention ...................................................... 51
7.1.2 Tuition Fees ........................................................................................................................................... 52
7.1.3 Donor Funds and Research Grants ........................................................................................................ 53
7.1.4 Income Generating Units....................................................................................................................... 56
8.1 PUBLICATIONS .............................................................................................................................................. 57
3
FOREWORD
The six edition of the Facts and Figures Booklet contains the most authoritative and comprehensive statistical information of the Open University of
Tanzania. This information is extremely crucial in feeding the OUT management with vital inputs which facilitates strategic planning, coordination,
implementation, and evaluation of various activities. This book also provides valuable information to key stakeholders who are engaged in learning,
delivery and advancement of higher education in Tanzania and elsewhere in the world.
In preparing this edition, we have carefully revised the previous one and added some new sections. For the first time, we have introduced sections
on the sources of revenues (i.e., internal and donor funds) and expenditures. Otherwise, we continue to publish enrolment figures for non-degree,
undergraduate and postgraduate programmes disaggregated by gender and regional centres. We also provide information on the number of
graduates in each programme and year of graduation as well as staff position and recruitment.
Clearly, judging from enrolments figures, The Open University of Tanzania remains one of the largest Higher Learning Institution in Tanzania. It is
particularly gratifying to note the rapid growth in student enrolment which has necessitated the need to increase both the number and quality of
academic, administrative and technical staff as evidenced by the various tables and figures presented herein. In an effort to strengthen the quality of
the programmes, the OUT has recently launched a Quality Control and Assurance department and the Directorate of Examination Syndicate.
It is my sincere hope that the information contained in this booklet will provide a useful and clear roadmap in guiding staff, students, potential
applicants as well as other stakeholders for various purposes. Last but not least, the OUT would like to underscore that every effort has been taken
on board to ensure that the information presented herein at the time when this booklet went to press was accurate and remains so. The OUT,
however, welcomes opinions and suggestions to enrich the contents of this booklet
Prof. Tolly S.A. Mbwette Dar es Salaam
Vice Chancellor June, 2010
4
EXECUTIVE SUMMARY
The OUT operates through a network of twenty thee Regional Centers and six Coordinating Centres spread throughout the United Republic of
Tanzania and beyond. Our ambition is to become one of the leading world-class universities in the delivery of affordable quality education through
open and distance learning, dynamic knowledge generation and application.
Over the last fifteen years, about 40% of enrolled students have been studying the degree in education; 17% in law; 15% in business management;
7% in Arts and Social Sciences; and 7% in pure sciences. Over 60% of undergraduate students at the OUT are studying for degrees in three major
fields: Education, Law and Business Management.
More than 30 % of enrolled students come from the following regions: Arusha, Dodoma, Iringa, Kilimanjaro, Mbeya, Morogoro, Mwanza, and
Tanga. Of these nine regions, each of which has a cumulative enrolment of more than 1000 students since 1994, Arusha has the highest cumulative
enrolment followed by Kilimanjaro. In short, ten regional centres (i.e., Dar es Salaam and nine regions mentioned earlier) recruit more than 70% of
undergraduate students.
In general, the faculty of education has the highest number of female undergraduate students, followed by the faculty of arts and social sciences. The
faculty of law has the lowest ratio. Although the proportion of female student in annual total enrolment has always been below 30%, it has,
nevertheless, increased over the years albeit gradually. Just like in the degree programmes, no more than 40% of female students are admitted into
non-degree programmes.
In the overall, however, education programmes have the largest concentration of postgraduate population. Out of three education programmes
(PGDE, M.Dist.Ed and M.Ed) currently on offer, PGDE is the most popular compared to the others. Science programmes have the lowest annual
student enrolment.
Over the last six years, the OUT has mobilized funds from various donors in its endeavour to implement different programmes. Although the
accumulated fund in the year 2005 was less than a half of that mobilized in the year 2004, the overall trend indicates an upward path even when the
rate of inflation is taken account. Compared to 2005, donor funds almost quadrupled in 2006, it increased more than twenty times in 2007, and more
than seventy times in 2009.

5
ACKNOWLEDGMENT
The production of this booklet is a combined effort of many individuals at various capacities. I would like to take this opportunity to first recognize
their efforts and secondly to record my deepest appreciation for the work done.
I would like to extend my profound gratitude to the Directorate of Planning and Development for its tireless effort in coordinating the preparation
and publication of this booklet. I thank the Open University of Tanzania statistician for collecting the data from various faculties and units within
the University.
I wish to thank Deans of faculties, Directors of Institutes / Directorates and the Admission Office for their unqualified support and cooperation in
providing relevant inputs. Without their support, this work would not have been completed. I commend the Editor for the good editorial work and
ensuring that the text is of high professional standard. The office of Director of Communications and Marketing is thanked for typesetting and
printing the booklet. Lastly, to all staff who in one way or another have enormously contributed to the development of this product, however, due to
limitation of space, their departments/sections are not mentioned here. I thank all of you!
Prof. Lughano Kusiluka Dar es Salaam
Deputy Vice Chancellor (Resources Management) June, 2010

6
LIST OF TABLES
Table 1: Admission into Undergraduate Programmes ..................................................................................................... 10
Table 2: Undergraduate Female Students as a % of Total Undergraduate Students ........................................................ 12
Table 3: Undergraduate Students Admission into Various faculties ................................................................................ 14
Table 4: Percentage of Female Undergraduate Students in of Total Admission .............................................................. 15
Table 5: Admission by Regional/Country/Coordination Centre ...................................................................................... 17
Table 6: Undergraduate Female Admission as a % Total Admission in Regional Centers and Countries....................... 23
Table 7: Admission of Postgraduate Students into Various Programmes ........................................................................ 26
Table 9: Admission into Various Non-Degree Programmes............................................................................................ 28
Table 10: Female Students as a % of Total admission into Non-Degree Programmes .................................................... 29
Table 11: Undergraduate Degree Programmes ................................................................................................................ 29
Table 12: Postgraduate Degree Programs ........................................................................................................................ 31
Table 13: Distribution of Graduands by Programme ....................................................................................................... 33
Table 14: Distribution of Graduands at the Level of Regional Centres ........................................................................... 36
Table 15: Distribution of Graduands at Global Level ...................................................................................................... 38
Table 16: Academic Staff by Qualification ..................................................................................................................... 38
Table 17: Percentage of Females to Total Academic Staff .............................................................................................. 39
Table 18: Academic Staff by Rank .................................................................................................................................. 40
Table 19: Female Academic Staff as a Percentage of Total Academic Staff by Rank ..................................................... 41
Table 20: Academic Staff-Student Ratio ......................................................................................................................... 44
Table 21: Staff Recruitment ............................................................................................................................................. 50
Table 22: Recurrent and Development Subvention ......................................................................................................... 51
Table 23: Disaggregation of Recurrent Subvention ......................................................................................................... 51
Table 24: Tuition Fees ..................................................................................................................................................... 52
Table 25: Grants from International Donors .................................................................................................................... 55
Table 26: Income Generating Unit .................................................................................................................................. 56
Table 27: Production of Study Materials ......................................................................................................................... 58
LIST OF FIGURES
Figure 1: Admission by Gender ......................................................................................................................................... 8
Figure 2: Female Admission into the selected undergraduate Programmes ....................................................................... 9
Figure 3 Average Percentage of Female Undergraduate 1994-2008/09 .......................................................................... 13
Figure 4: Graduands by Regional Centers ....................................................................................................................... 35
Figure 5: The percentage of PE and OC in Actual Recurrent Allocation ........................................................................ 52
Figure 6: External Financial Support from Various Donors ............................................................................................ 54

7
ABBREVIATIONS
OUT Open University of Tanzania
BA (Gen.) Bachelor of Arts (General)
B.A. (Ed.) Bachelor of Arts (Education)
B.A. (SW) Bachelor of Arts (Social Work)
B.A. (Soc.) Bachelor of Arts (Sociology)
B.A.T Bachelor of Arts (Tourism)
B.A.J Bachelor of Arts (Journalism)
B.A.(Mass Com.) Bachelor of Arts (Mass Communication)
B. Ed. Bachelor of Education
B. Ed. (SE) Bachelor of Education (Special Education)
B.Com.(Gen.) Bachelor of Commerce (General)
B.Com (Ed.) Bachelor of Commerce (Education)
BBA (Gen.) Bachelor of Business Administration (General)
BBA (Ed.) Bachelor of Business Administration (Education)
LL.B Bachelor of Law
B.Sc.(Gen.) Bachelor of Science (General)
B.Sc. (Ed.) Bachelor of Science (Education)
B.Sc. (ICT) Bachelor of Science (Information and Communication Technology)
B.Sc.(ES) Bachelor of Science (Environmental Studies)
PGDE Postgraduate Diploma in Education
PGDL Postgraduate Diploma in Law
MA (SW) Master of Arts (Social Work)
MA Master of Arts
M.Ed Master of Education
M.Dist.Ed Master in Distance Education
M.Sc Master of Science
M.Sc. (CED) Master of Science in Community Education Development
M.CED Masters in Community Education Development
LL.M Master of Law
LL.M IT & T Master of Law in Information Technology and Telecommunication
Ph.D Doctor of Philosophy
CPPH Certificate in Poultry Production and Health
DPPH Diploma in Poultry Production and Health
CCDE Certificate Course in Distance Education
CYP-Dip. Diploma in Commonwealth Youth Programme
ODDEOL Diploma in Distance Education and Open Learning
OFC Certificate in Foundation Course
CPTE Certificate in Primary Teachers Education
DPTE Diploma in Primary Teachers Education
Hon. Degree Honorary Degree
FASS Faculty of Arts and Social Sciences
FED Faculty of Education
FBM Faculty of Business Management
FLW Faculty of Law
FSTES Faculty of Science, Technology and Environmental Studies
DRPC Directorate of Research, Publications and Consultancy
U.S.A United States of America
F Female
M Male
T Total

8
1.1 Undergraduate Enrolment
The undergraduate programmes are the blood vessels in the heart of the OUT’s operation. The OUT attracts students from the highly heterogeneous
groups of applicants across the country and beyond. Indeed, the OUT admission policy accords priority on academic merits, and in any case, it does
not discriminate students on the basis of gender, colour, race, religion, nationality, partisanship in politics, sexual orientation or physical disabilities.
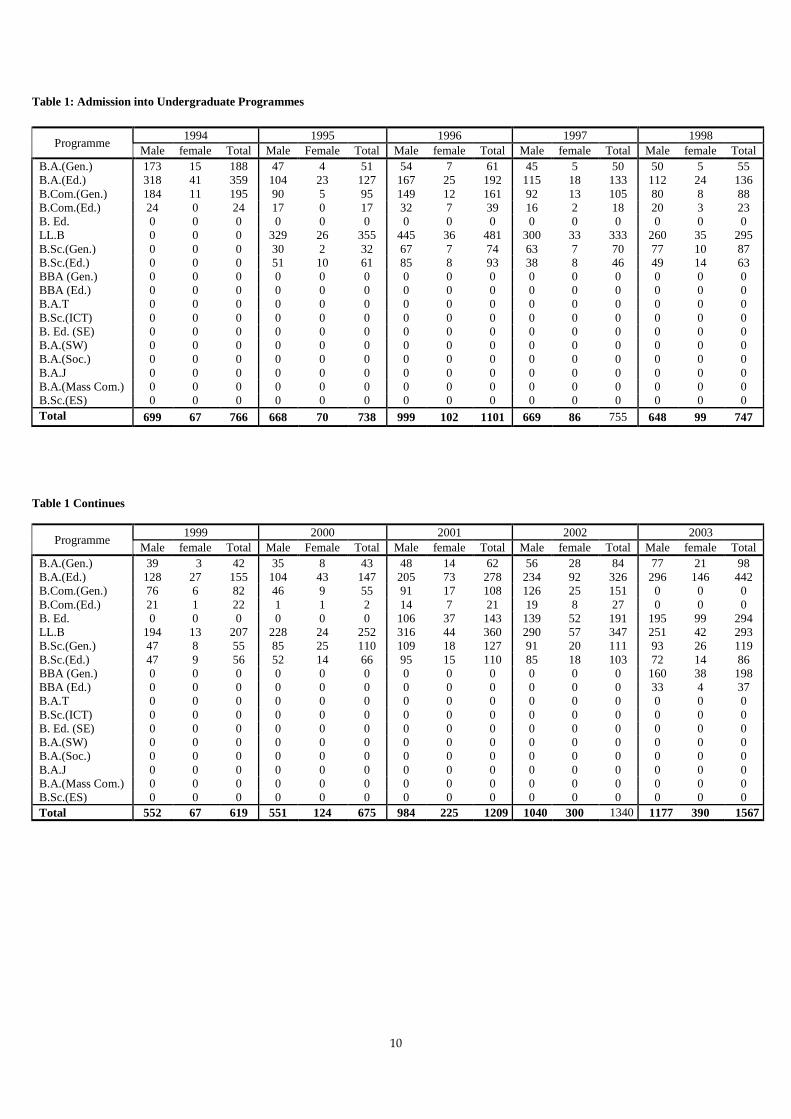
The enrolment of undergraduate students has witnessed a volatile trend over the past 15 years. Table 1 shows that between 1994 and 1996, students’
enrolment rose by 43.7% after which it dropped drastically from 1101 to 755 between 1996 and 1997 respectively. Moreover, from 1997 until the
late 1990s, enrolment continued to fall gradually before rebounding slightly in the year 2000.
A cursory glance at Table 1 suggests that the introduction of an LLB programme in 1995 contributed significantly to the rapid growth of
undergraduate enrolment up to 1996. Indeed, the enrolment trajectory of the undergraduate programme from the mid 1990s appears to have been
largely manipulated by students who opted for the LLB programme. Subsequently, it is not implausible to argue that a fall in enrolment in the LLB
program between 1997 and 1999 was undoubtedly manifested in the overall lower enrolment during the late 1990s.
Interestingly, it is striking once again to note that the upsurge in enrolment during the post 2000s is a typical reflection of admitted students into the
LLB programme. In particular, the admission into the LLB programme jumped quickly from 252 to 360 between 2000 and 2001; an increase of
40%. Accordingly, total enrolment into the undergraduate programme also climbed considerably by 79% during the same period. The enrolment
trend, however, recorded a sudden drop 2002 although it was quickly reversed in 2003, in which it grew by 16% following the introduction of BBA
programme.
The year 2005 saw the sharpest increase in undergraduate enrolment following the introduction of two programmes: BA (Tourism) and B.Ed
(Special Education). Specifically, total enrolment peaked up remarkably from 1920 to 2692 during the years 2004 and 2005; an increase of about
40%. Thereafter, in the year 2006, it went up slightly by 28% despite the introduction of three programmes, viz: BSc (ICT), BA (Social Works) and
BA (Sociology). It then increased by 68%; from 3467 to 5668 between 2006 and 2007 before plummeting precipitously to 2565 during the 2007/08
academic year; the lowest ever enrolment to be recorded during the 2000s.
A number of reasons could be advanced to account for lower enrolment during the academic year 2007/08. First, multiple admission process was
introduced for the first time in the calendar year 2007. Hitherto, admission process was carried out once in January. This implies that the depth and
breadth of enrolment catchment’s pool for 2007/08 academic year was not only shallow but also it was narrowed by students who got admission in
January 2007. The second reason could be connected to the rivalries from other universities which offer degree programmes in 3 years, whereas the
OUT programmes take a little bit longer to complete.
1.1.1 Enrolment at Undergraduate level by Gender
Figure 1 uses data from Table 1 to illustrate the trend in admission by gender for the last 15 years. It is clear from Figure 1 that female enrolment is
constantly below male counterpart.
0
500
1000
1500
2000
2500
3000
3500
4000
4500
19941995
19961997
19981999
20002001
20022003
20042005
20062007
2007/0
8
2008/0
9
Years
Ad
mis
sio
n b
y g
en
de
r
MALE FEMALE
Figure 1: Admission by Gender
It is curious, albeit, to note that female enrolment always tends to mimic male enrolment. Statistically speaking, such a co-movement is a replica of
the population on which the sample is drawn. In other words, if the population has more male applicants than female; and assuming that each
applicant has an equal chance of being selected, then the plot presented in Figure 1 is inevitable. Figure 1, nonetheless, conceals remarkable
differences which are overtly pronounced at programme levels. In particular, at the disaggregate level, it seems that the following programmes are
the most popular to both male and female students: LLB, BA (Ed), B.Com, BA (Gen).

9
19
95
19
96
19
97
19
98
19
99
20
00
20
01
20
02
20
03
20
04
20
05
20
06
20
07
20
07
/08
20
08
/09
0
50
100
150
200
250
300
350
400
450
500
Enrolment
Years
LLB BA (Ed) Bcom (Gen) BA (Gen)
Figure 2: Female Admission into the selected undergraduate Programmes
Figure 2 depicts female enrolment in the selected programme that appeared to attract more students than others. It is clear from Figure 2 that both
LLB and BA (Ed) programmes attracted roughly equal female students up to the year 1999. This trend, was however, considerably altered
beginning the year 2000, where more female students were admitted in the BA (Ed) than in the LLB programme. The reason for this expansion
could be linked to the impact of Education Sector Development Programme (ESDP) in which Primary Education Development Programme (PEDP)
and Secondary Education Development Programme (SEDP) occupied top priorities in the overall programme implementation. Part of the
programme execution was geared towards enhancing capacity building in which teachers were required to pursue further training under the
sponsorship of the Ministry of Education and Vocational Training (MoEVT). Inexorably, it is not irrational to argue that the impacts of such reform
were reflected in the enrolment expansion at the OUT.
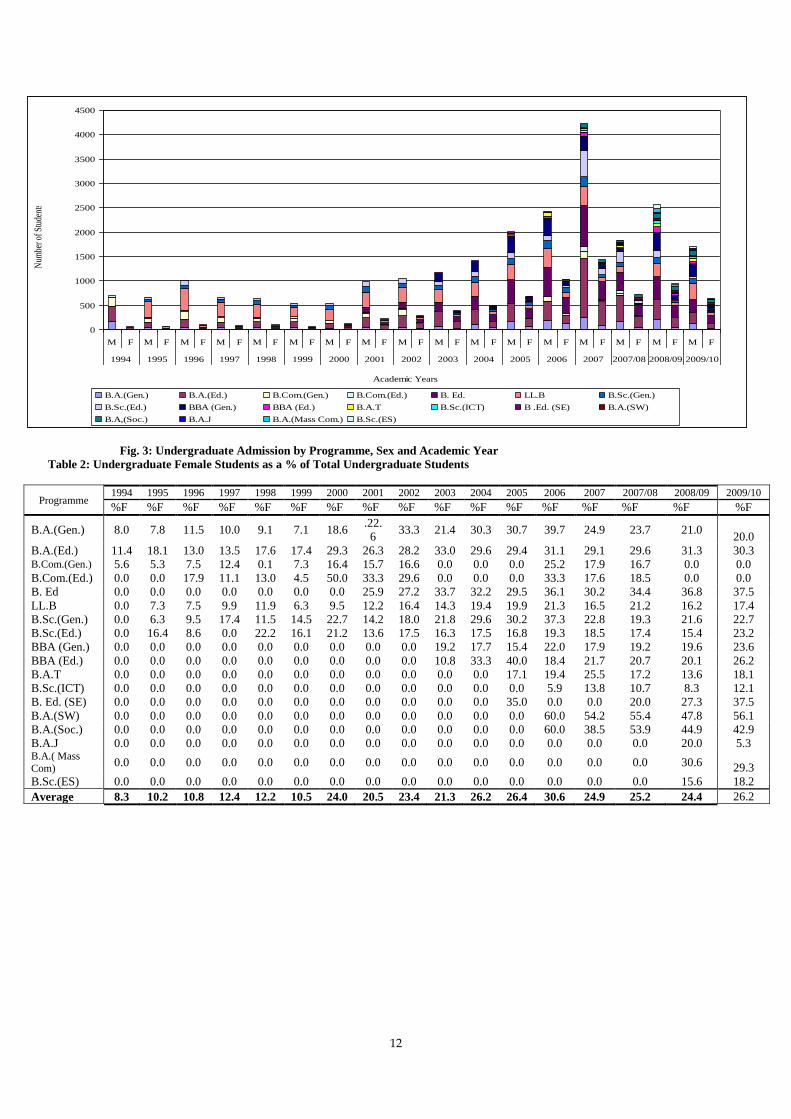
Table 2 gives the percentage of female students in various undergraduate programmes from the year 1994 up to 2008/09. The first thing worth
noting is that the average female enrolment for all undergraduate programmes remains well below a quarter of the total enrolment over the last 15
years. It is, however, intriguing to spot that between 1994 and 2006, more female students joined in programmes that contain education component.
Some of the reasons for this enrolment trend have been elucidated in the earlier paragraphs—in particular, the role of PEDP and SEDP cannot be
overemphasized. This trend was overturned in 2006 whereby more female students choose to pursue BA (Social Works) and BA (Sociology) and
consistently maintained the same path for academic year 2007, 2007/08 and 2008/09. In the meantime, the lowest percentage of female was
registered in B.Com programme.
All in all, during the last fifteen years, about 40% of enrolled students have been studying the degree in education; 17% have been enrolled in LLB
programme; about 15% in business management; 7% in Arts and Social Sciences; and 7% in pure sciences. Strictly speaking, over 60% of
undergraduate students at the OUT are studying for degrees in three major fields: Education, Law and Business Management.
10
Table 1: Admission into Undergraduate Programmes
Programme 1994 1995 1996 1997 1998
Male female Total Male Female Total Male female Total Male female Total Male female Total
B.A.(Gen.) 173 15 188 47 4 51 54 7 61 45 5 50 50 5 55
B.A.(Ed.) 318 41 359 104 23 127 167 25 192 115 18 133 112 24 136
B.Com.(Gen.) 184 11 195 90 5 95 149 12 161 92 13 105 80 8 88
B.Com.(Ed.) 24 0 24 17 0 17 32 7 39 16 2 18 20 3 23
B. Ed. 0 0 0 0 0 0 0 0 0 0 0 0 0 0 0
LL.B 0 0 0 329 26 355 445 36 481 300 33 333 260 35 295
B.Sc.(Gen.) 0 0 0 30 2 32 67 7 74 63 7 70 77 10 87
B.Sc.(Ed.) 0 0 0 51 10 61 85 8 93 38 8 46 49 14 63
BBA (Gen.) 0 0 0 0 0 0 0 0 0 0 0 0 0 0 0
BBA (Ed.) 0 0 0 0 0 0 0 0 0 0 0 0 0 0 0
B.A.T 0 0 0 0 0 0 0 0 0 0 0 0 0 0 0
B.Sc.(ICT) 0 0 0 0 0 0 0 0 0 0 0 0 0 0 0
B. Ed. (SE) 0 0 0 0 0 0 0 0 0 0 0 0 0 0 0
B.A.(SW) 0 0 0 0 0 0 0 0 0 0 0 0 0 0 0
B.A.(Soc.) 0 0 0 0 0 0 0 0 0 0 0 0 0 0 0
B.A.J 0 0 0 0 0 0 0 0 0 0 0 0 0 0 0
B.A.(Mass Com.) 0 0 0 0 0 0 0 0 0 0 0 0 0 0 0
B.Sc.(ES) 0 0 0 0 0 0 0 0 0 0 0 0 0 0 0
Total 699 67 766 668 70 738 999 102 1101 669 86 755 648 99 747
Table 1 Continues
Programme 1999 2000 2001 2002 2003
Male female Total Male Female Total Male female Total Male female Total Male female Total
B.A.(Gen.) 39 3 42 35 8 43 48 14 62 56 28 84 77 21 98
B.A.(Ed.) 128 27 155 104 43 147 205 73 278 234 92 326 296 146 442
B.Com.(Gen.) 76 6 82 46 9 55 91 17 108 126 25 151 0 0 0
B.Com.(Ed.) 21 1 22 1 1 2 14 7 21 19 8 27 0 0 0
B. Ed. 0 0 0 0 0 0 106 37 143 139 52 191 195 99 294
LL.B 194 13 207 228 24 252 316 44 360 290 57 347 251 42 293
B.Sc.(Gen.) 47 8 55 85 25 110 109 18 127 91 20 111 93 26 119
B.Sc.(Ed.) 47 9 56 52 14 66 95 15 110 85 18 103 72 14 86
BBA (Gen.) 0 0 0 0 0 0 0 0 0 0 0 0 160 38 198
BBA (Ed.) 0 0 0 0 0 0 0 0 0 0 0 0 33 4 37
B.A.T 0 0 0 0 0 0 0 0 0 0 0 0 0 0 0
B.Sc.(ICT) 0 0 0 0 0 0 0 0 0 0 0 0 0 0 0
B. Ed. (SE) 0 0 0 0 0 0 0 0 0 0 0 0 0 0 0
B.A.(SW) 0 0 0 0 0 0 0 0 0 0 0 0 0 0 0
B.A.(Soc.) 0 0 0 0 0 0 0 0 0 0 0 0 0 0 0
B.A.J 0 0 0 0 0 0 0 0 0 0 0 0 0 0 0
B.A.(Mass Com.) 0 0 0 0 0 0 0 0 0 0 0 0 0 0 0
B.Sc.(ES) 0 0 0 0 0 0 0 0 0 0 0 0 0 0 0
Total 552 67 619 551 124 675 984 225 1209 1040 300 1340 1177 390 1567
11
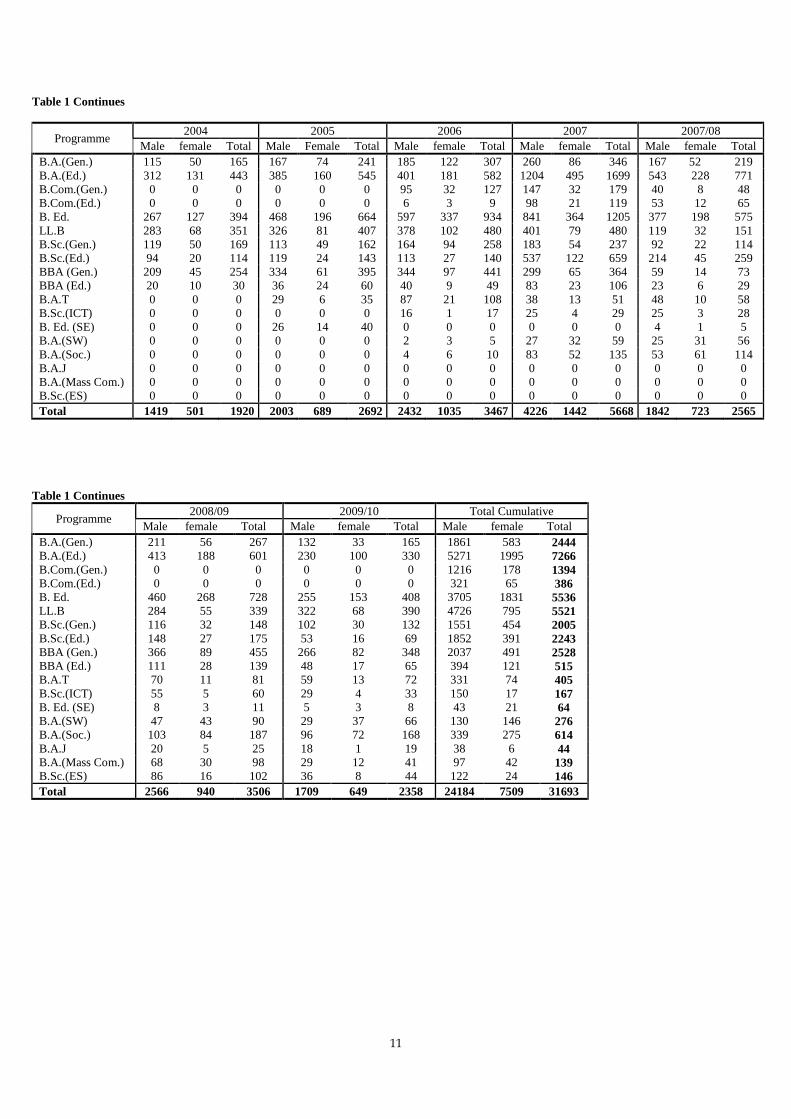
Table 1 Continues
Programme 2004 2005 2006 2007 2007/08
Male female Total Male Female Total Male female Total Male female Total Male female Total
B.A.(Gen.) 115 50 165 167 74 241 185 122 307 260 86 346 167 52 219
B.A.(Ed.) 312 131 443 385 160 545 401 181 582 1204 495 1699 543 228 771
B.Com.(Gen.) 0 0 0 0 0 0 95 32 127 147 32 179 40 8 48
B.Com.(Ed.) 0 0 0 0 0 0 6 3 9 98 21 119 53 12 65
B. Ed. 267 127 394 468 196 664 597 337 934 841 364 1205 377 198 575
LL.B 283 68 351 326 81 407 378 102 480 401 79 480 119 32 151
B.Sc.(Gen.) 119 50 169 113 49 162 164 94 258 183 54 237 92 22 114
B.Sc.(Ed.) 94 20 114 119 24 143 113 27 140 537 122 659 214 45 259
BBA (Gen.) 209 45 254 334 61 395 344 97 441 299 65 364 59 14 73
BBA (Ed.) 20 10 30 36 24 60 40 9 49 83 23 106 23 6 29
B.A.T 0 0 0 29 6 35 87 21 108 38 13 51 48 10 58
B.Sc.(ICT) 0 0 0 0 0 0 16 1 17 25 4 29 25 3 28
B. Ed. (SE) 0 0 0 26 14 40 0 0 0 0 0 0 4 1 5
B.A.(SW) 0 0 0 0 0 0 2 3 5 27 32 59 25 31 56
B.A.(Soc.) 0 0 0 0 0 0 4 6 10 83 52 135 53 61 114
B.A.J 0 0 0 0 0 0 0 0 0 0 0 0 0 0 0
B.A.(Mass Com.) 0 0 0 0 0 0 0 0 0 0 0 0 0 0 0
B.Sc.(ES) 0 0 0 0 0 0 0 0 0 0 0 0 0 0 0
Total 1419 501 1920 2003 689 2692 2432 1035 3467 4226 1442 5668 1842 723 2565
Table 1 Continues
Programme 2008/09 2009/10 Total Cumulative
Male female Total Male female Total Male female Total
B.A.(Gen.) 211 56 267 132 33 165 1861 583 2444
B.A.(Ed.) 413 188 601 230 100 330 5271 1995 7266
B.Com.(Gen.) 0 0 0 0 0 0 1216 178 1394
B.Com.(Ed.) 0 0 0 0 0 0 321 65 386
B. Ed. 460 268 728 255 153 408 3705 1831 5536
LL.B 284 55 339 322 68 390 4726 795 5521
B.Sc.(Gen.) 116 32 148 102 30 132 1551 454 2005
B.Sc.(Ed.) 148 27 175 53 16 69 1852 391 2243
BBA (Gen.) 366 89 455 266 82 348 2037 491 2528
BBA (Ed.) 111 28 139 48 17 65 394 121 515
B.A.T 70 11 81 59 13 72 331 74 405
B.Sc.(ICT) 55 5 60 29 4 33 150 17 167
B. Ed. (SE) 8 3 11 5 3 8 43 21 64
B.A.(SW) 47 43 90 29 37 66 130 146 276
B.A.(Soc.) 103 84 187 96 72 168 339 275 614
B.A.J 20 5 25 18 1 19 38 6 44
B.A.(Mass Com.) 68 30 98 29 12 41 97 42 139
B.Sc.(ES) 86 16 102 36 8 44 122 24 146
Total 2566 940 3506 1709 649 2358 24184 7509 31693
12
0
500
1000
1500
2000
2500
3000
3500
4000
4500
M F M F M F M F M F M F M F M F M F M F M F M F M F M F M F M F M F
1994 1995 1996 1997 1998 1999 2000 2001 2002 2003 2004 2005 2006 2007 2007/08 2008/09 2009/10
Academic Years
Num
ber o
f Stu
dent
s
B.A.(Gen.) B.A.(Ed.) B.Com.(Gen.) B.Com.(Ed.) B. Ed. LL.B B.Sc.(Gen.)
B.Sc.(Ed.) BBA (Gen.) BBA (Ed.) B.A.T B.Sc.(ICT) B .Ed. (SE) B.A.(SW)
B.A,(Soc.) B.A.J B.A.(Mass Com.) B.Sc.(ES)
Fig. 3: Undergraduate Admission by Programme, Sex and Academic Year
Table 2: Undergraduate Female Students as a % of Total Undergraduate Students
Programme 1994 1995 1996 1997 1998 1999 2000 2001 2002 2003 2004 2005 2006 2007 2007/08 2008/09 2009/10
%F %F %F %F %F %F %F %F %F %F %F %F %F %F %F %F %F
B.A.(Gen.) 8.0 7.8 11.5 10.0 9.1 7.1 18.6 .22.
6 33.3 21.4 30.3 30.7 39.7 24.9 23.7 21.0
20.0
B.A.(Ed.) 11.4 18.1 13.0 13.5 17.6 17.4 29.3 26.3 28.2 33.0 29.6 29.4 31.1 29.1 29.6 31.3 30.3 B.Com.(Gen.) 5.6 5.3 7.5 12.4 0.1 7.3 16.4 15.7 16.6 0.0 0.0 0.0 25.2 17.9 16.7 0.0 0.0
B.Com.(Ed.) 0.0 0.0 17.9 11.1 13.0 4.5 50.0 33.3 29.6 0.0 0.0 0.0 33.3 17.6 18.5 0.0 0.0
B. Ed 0.0 0.0 0.0 0.0 0.0 0.0 0.0 25.9 27.2 33.7 32.2 29.5 36.1 30.2 34.4 36.8 37.5
LL.B 0.0 7.3 7.5 9.9 11.9 6.3 9.5 12.2 16.4 14.3 19.4 19.9 21.3 16.5 21.2 16.2 17.4
B.Sc.(Gen.) 0.0 6.3 9.5 17.4 11.5 14.5 22.7 14.2 18.0 21.8 29.6 30.2 37.3 22.8 19.3 21.6 22.7
B.Sc.(Ed.) 0.0 16.4 8.6 0.0 22.2 16.1 21.2 13.6 17.5 16.3 17.5 16.8 19.3 18.5 17.4 15.4 23.2
BBA (Gen.) 0.0 0.0 0.0 0.0 0.0 0.0 0.0 0.0 0.0 19.2 17.7 15.4 22.0 17.9 19.2 19.6 23.6
BBA (Ed.) 0.0 0.0 0.0 0.0 0.0 0.0 0.0 0.0 0.0 10.8 33.3 40.0 18.4 21.7 20.7 20.1 26.2
B.A.T 0.0 0.0 0.0 0.0 0.0 0.0 0.0 0.0 0.0 0.0 0.0 17.1 19.4 25.5 17.2 13.6 18.1
B.Sc.(ICT) 0.0 0.0 0.0 0.0 0.0 0.0 0.0 0.0 0.0 0.0 0.0 0.0 5.9 13.8 10.7 8.3 12.1
B. Ed. (SE) 0.0 0.0 0.0 0.0 0.0 0.0 0.0 0.0 0.0 0.0 0.0 35.0 0.0 0.0 20.0 27.3 37.5
B.A.(SW) 0.0 0.0 0.0 0.0 0.0 0.0 0.0 0.0 0.0 0.0 0.0 0.0 60.0 54.2 55.4 47.8 56.1
B.A.(Soc.) 0.0 0.0 0.0 0.0 0.0 0.0 0.0 0.0 0.0 0.0 0.0 0.0 60.0 38.5 53.9 44.9 42.9
B.A.J 0.0 0.0 0.0 0.0 0.0 0.0 0.0 0.0 0.0 0.0 0.0 0.0 0.0 0.0 0.0 20.0 5.3 B.A.( Mass
Com) 0.0 0.0 0.0 0.0 0.0 0.0 0.0 0.0 0.0 0.0 0.0 0.0 0.0 0.0 0.0 30.6 29.3
B.Sc.(ES) 0.0 0.0 0.0 0.0 0.0 0.0 0.0 0.0 0.0 0.0 0.0 0.0 0.0 0.0 0.0 15.6 18.2
Average 8.3 10.2 10.8 12.4 12.2 10.5 24.0 20.5 23.4 21.3 26.2 26.4 30.6 24.9 25.2 24.4 26.2
13
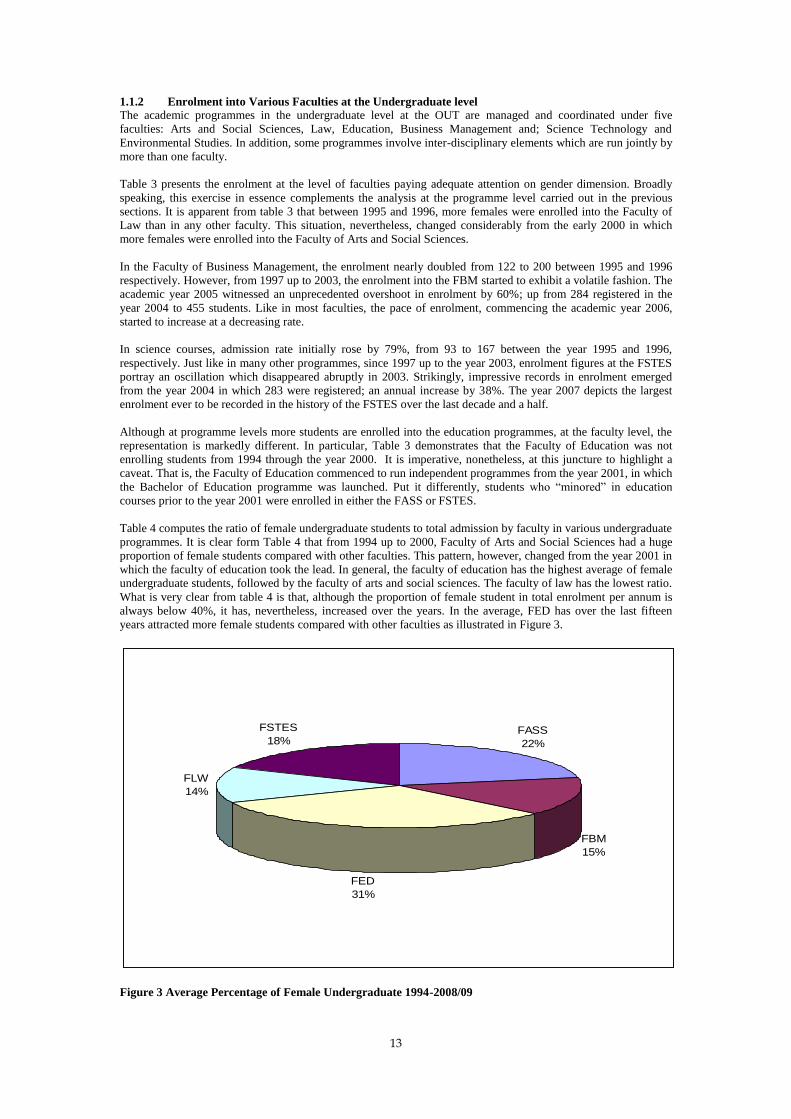
1.1.2 Enrolment into Various Faculties at the Undergraduate level
The academic programmes in the undergraduate level at the OUT are managed and coordinated under five
faculties: Arts and Social Sciences, Law, Education, Business Management and; Science Technology and
Environmental Studies. In addition, some programmes involve inter-disciplinary elements which are run jointly by
more than one faculty.
Table 3 presents the enrolment at the level of faculties paying adequate attention on gender dimension. Broadly
speaking, this exercise in essence complements the analysis at the programme level carried out in the previous
sections. It is apparent from table 3 that between 1995 and 1996, more females were enrolled into the Faculty of
Law than in any other faculty. This situation, nevertheless, changed considerably from the early 2000 in which
more females were enrolled into the Faculty of Arts and Social Sciences.
In the Faculty of Business Management, the enrolment nearly doubled from 122 to 200 between 1995 and 1996
respectively. However, from 1997 up to 2003, the enrolment into the FBM started to exhibit a volatile fashion. The
academic year 2005 witnessed an unprecedented overshoot in enrolment by 60%; up from 284 registered in the
year 2004 to 455 students. Like in most faculties, the pace of enrolment, commencing the academic year 2006,
started to increase at a decreasing rate.
In science courses, admission rate initially rose by 79%, from 93 to 167 between the year 1995 and 1996,
respectively. Just like in many other programmes, since 1997 up to the year 2003, enrolment figures at the FSTES
portray an oscillation which disappeared abruptly in 2003. Strikingly, impressive records in enrolment emerged
from the year 2004 in which 283 were registered; an annual increase by 38%. The year 2007 depicts the largest
enrolment ever to be recorded in the history of the FSTES over the last decade and a half.
Although at programme levels more students are enrolled into the education programmes, at the faculty level, the
representation is markedly different. In particular, Table 3 demonstrates that the Faculty of Education was not
enrolling students from 1994 through the year 2000. It is imperative, nonetheless, at this juncture to highlight a
caveat. That is, the Faculty of Education commenced to run independent programmes from the year 2001, in which
the Bachelor of Education programme was launched. Put it differently, students who “minored” in education
courses prior to the year 2001 were enrolled in either the FASS or FSTES.
Table 4 computes the ratio of female undergraduate students to total admission by faculty in various undergraduate
programmes. It is clear form Table 4 that from 1994 up to 2000, Faculty of Arts and Social Sciences had a huge
proportion of female students compared with other faculties. This pattern, however, changed from the year 2001 in
which the faculty of education took the lead. In general, the faculty of education has the highest average of female
undergraduate students, followed by the faculty of arts and social sciences. The faculty of law has the lowest ratio.
What is very clear from table 4 is that, although the proportion of female student in total enrolment per annum is
always below 40%, it has, nevertheless, increased over the years. In the average, FED has over the last fifteen
years attracted more female students compared with other faculties as illustrated in Figure 3.
FASS
22%
FBM
15%
FED
31%
FLW
14%
FSTES
18%
Figure 3 Average Percentage of Female Undergraduate 1994-2008/09

14
Table 3: Undergraduate Students Admission into Various faculties
Programme 1994 1995 1996 1997 1998
Male female Total Male female Total Male female Total Male female Total Male female Total
FASS 491 56 547 151 27 178 221 32 253 160 23 183 162 29 191
FBM 208 11 219 107 5 112 181 19 200 108 15 123 100 11 111
FED 0 0 0 0 0 0 0 0 0 0 0 0 0 0 0
FLW 0 0 0 329 26 355 445 36 481 300 33 333 260 35 295
FSTES 0 0 0 81 12 93 152 15 167 101 15 116 126 24 150
Total 699 67 766 668 70 738 999 102 1101 669 86 755 648 99 747
Table 3: Continues
Programme 1999 2000 2001 2002 2003
Male female Total Male female Total Male female Total Male female Total Male female Total
FASS 167 30 197 139 51 190 253 87 340 290 120 410 373 167 540
FBM 97 7 104 47 10 57 105 24 129 145 33 178 193 42 235
FED 0 0 0 0 0 0 106 37 143 139 52 191 195 99 294
FLW 194 13 207 228 24 252 316 44 360 290 57 347 251 42 293
FSTES 94 17 111 137 39 176 204 33 237 176 38 214 165 40 205
Total 552 67 619 551 124 675 984 225 1209 1040 300 1340 1177 390 1567
Table 3: Continues
Programme 2004 2005 2006 2007 2007/08
Male female Total Male female Total Male female Total Male female Total Male female Total
FASS 427 181 608 581 240 821 679 333 1012 1612 678 2290 836 382 1218
FBM 229 55 284 370 85 455 485 141 626 627 141 768 175 40 215
FED 267 127 394 494 210 704 596 337 933 841 364 1205 381 199 580
FLW 283 68 351 326 81 407 378 102 480 401 79 480 119 32 151
FSTES 213 70 283 232 73 305 287 122 409 745 180 925 331 70 401
Total 1419 501 1920 2003 689 2692 2425 1035 3460 4226 1442 5668 1842 723 2565
Table 3: Continues
Programme 2008/09 2009/10 Grand Total
Male female Total Male female Total Male female Total
FASS 932 417 1349 593 268 861 8067 3121 11188
FBM 477 117 594 314 99 413 3968 855 4823
FED 468 271 739 260 156 416 3748 1852 5600
FLW 284 55 339 322 68 390 4726 795 5521
FSTES 405 80 485 220 58 278 3675 886 4561
Total 2566 940 3506 1709 649 2358 24184 7509 31693
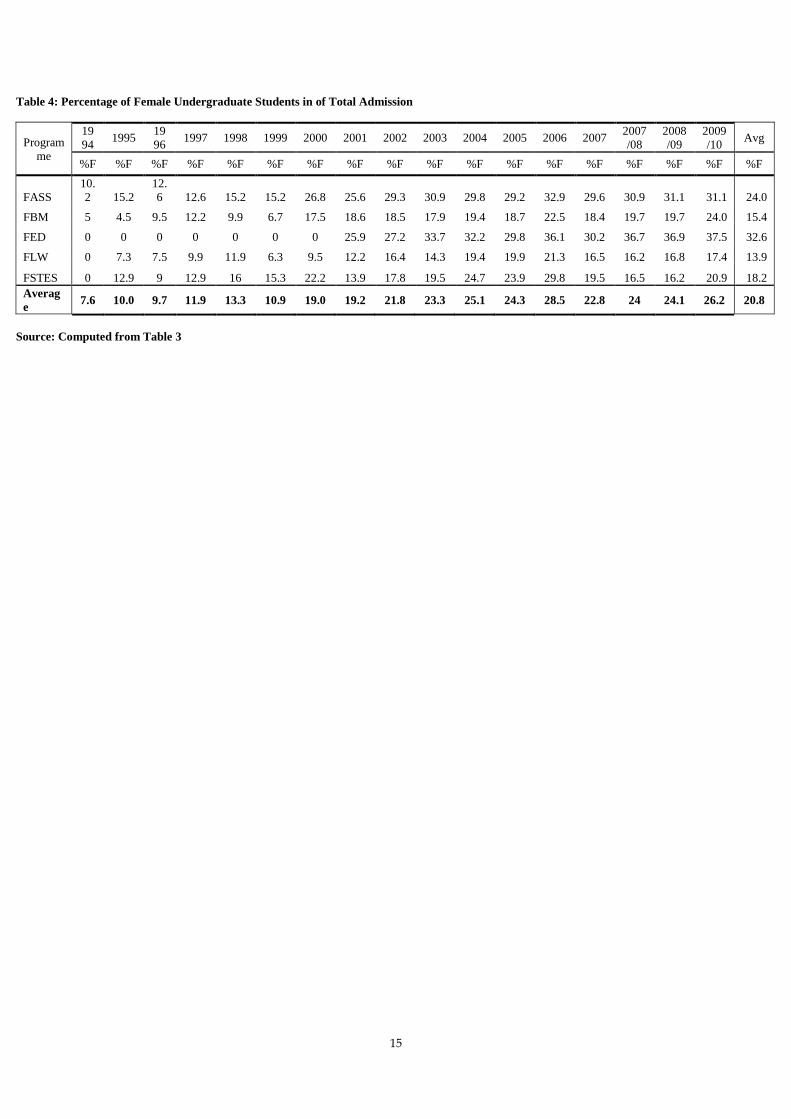
15
Table 4: Percentage of Female Undergraduate Students in of Total Admission
Program
me
19
94 1995
19
96 1997 1998 1999 2000 2001 2002 2003 2004 2005 2006 2007
2007
/08
2008
/09
2009
/10 Avg
%F %F %F %F %F %F %F %F %F %F %F %F %F %F %F %F %F %F
FASS
10.
2 15.2
12.
6 12.6 15.2 15.2 26.8 25.6 29.3 30.9 29.8 29.2 32.9 29.6 30.9 31.1 31.1 24.0
FBM 5 4.5 9.5 12.2 9.9 6.7 17.5 18.6 18.5 17.9 19.4 18.7 22.5 18.4 19.7 19.7 24.0 15.4
FED 0 0 0 0 0 0 0 25.9 27.2 33.7 32.2 29.8 36.1 30.2 36.7 36.9 37.5 32.6
FLW 0 7.3 7.5 9.9 11.9 6.3 9.5 12.2 16.4 14.3 19.4 19.9 21.3 16.5 16.2 16.8 17.4 13.9
FSTES 0 12.9 9 12.9 16 15.3 22.2 13.9 17.8 19.5 24.7 23.9 29.8 19.5 16.5 16.2 20.9 18.2
Averag
e 7.6 10.0 9.7 11.9 13.3 10.9 19.0 19.2 21.8 23.3 25.1 24.3 28.5 22.8 24 24.1 26.2 20.8
Source: Computed from Table 3
16
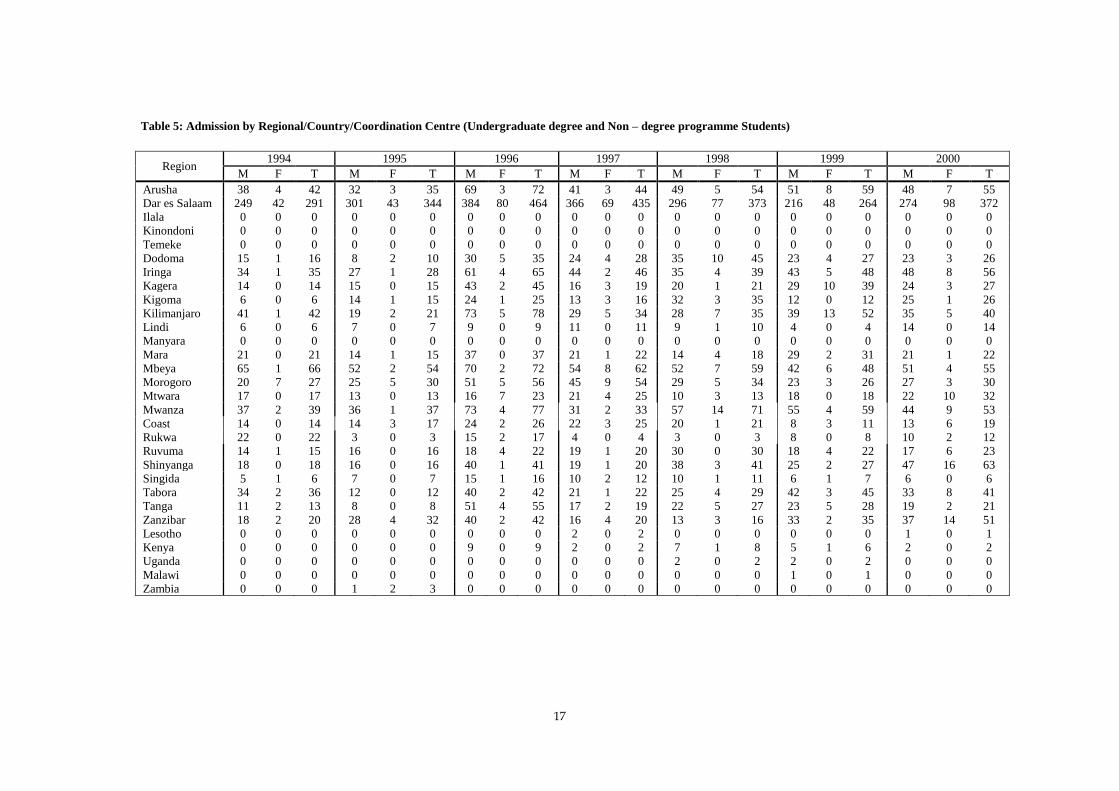
1.1.3 Students’ Admission by Regional Centres
Regional Centers are the heart of the University’s success, giving students and academics the benefits of belonging
to both a large institution and interdisciplinary academic community. Table 5 summarizes students’ admission by
regional/country/coordination centre taking into account gender element. In general, Dar es Salaam regional
centres dominate the admission picture over the last decade or so. With the exception of the year 2001, 2002, 2003
and 2007, in the remaining years, the enrolment at the Dar es Salaam regional centres has been well above 30%.
The lowest percentage (i.e, 14%) was recorded in the academic year 2007/08. Yet, when the academic year 2007
and 2007/08 are taken together as one academic year, the annual enrolment is more than 40%
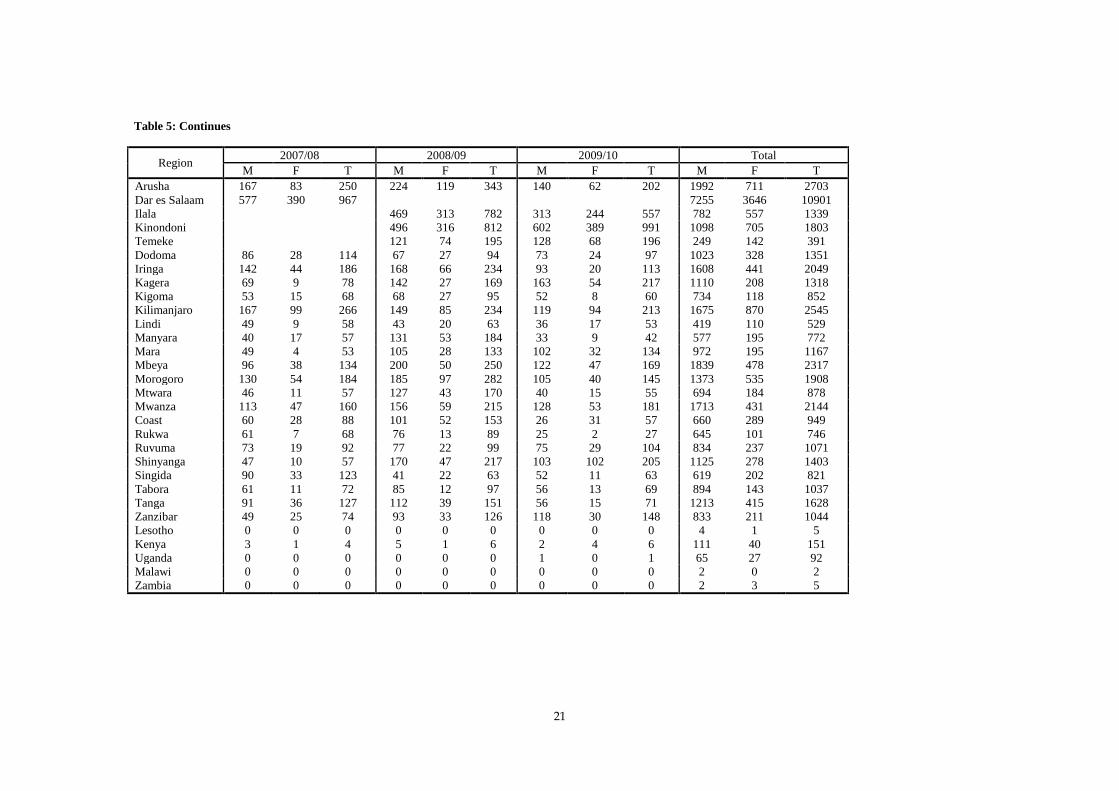
It is also revealed from Table 5 that more than 30 % of enrolled students come from the following regions: Arusha,
Dodoma, Iringa, Kilimanjaro, Mbeya, Morogoro, Mwanza, and Tanga. Of these nine regions, which have
cumulative enrolment of more than 1000 students since 1994, Arusha has the highest cumulative enrolment
followed by Kilimanjaro. The standard deviation shows that variability in enrolment across these regions from
1994 up to the year 2001 was fairly stable; revolving around 3.5. Between 2002 and 2007, enrolment volatility as
measured by standard deviation appears to revolve within 5-10 band. In short, ten regional centres (i.e., Dar es
Salaam and nine regions mentioned earlier) recruit more than 70% of undergraduate students.
There is, however, serious gender disparity in admission across regions. In 1994 for example, while total
admission in Mbeya was 66; out of these, there was only 1 female student. Other regions, which displayed similar
trend are: Dodoma, Iringa, Kilimanjaro, Ruvuma and Singida. In the extreme case, the following regions had no
female students in the year 1994: Kagera, Kigoma, Lindi, Mara, Coast, Rukwa and Shinyanga. Social factors as
well as asymmetry information about the OUT programmes could be the reasons for that phenomenon. This
situation has changed in recent years where the following regions have been consistently ranked in the top ten for
attracting female students: Dar es Salaam, Kilimanjaro, Mbeya, Mwanza, Morogoro and Tanga (see table 6)
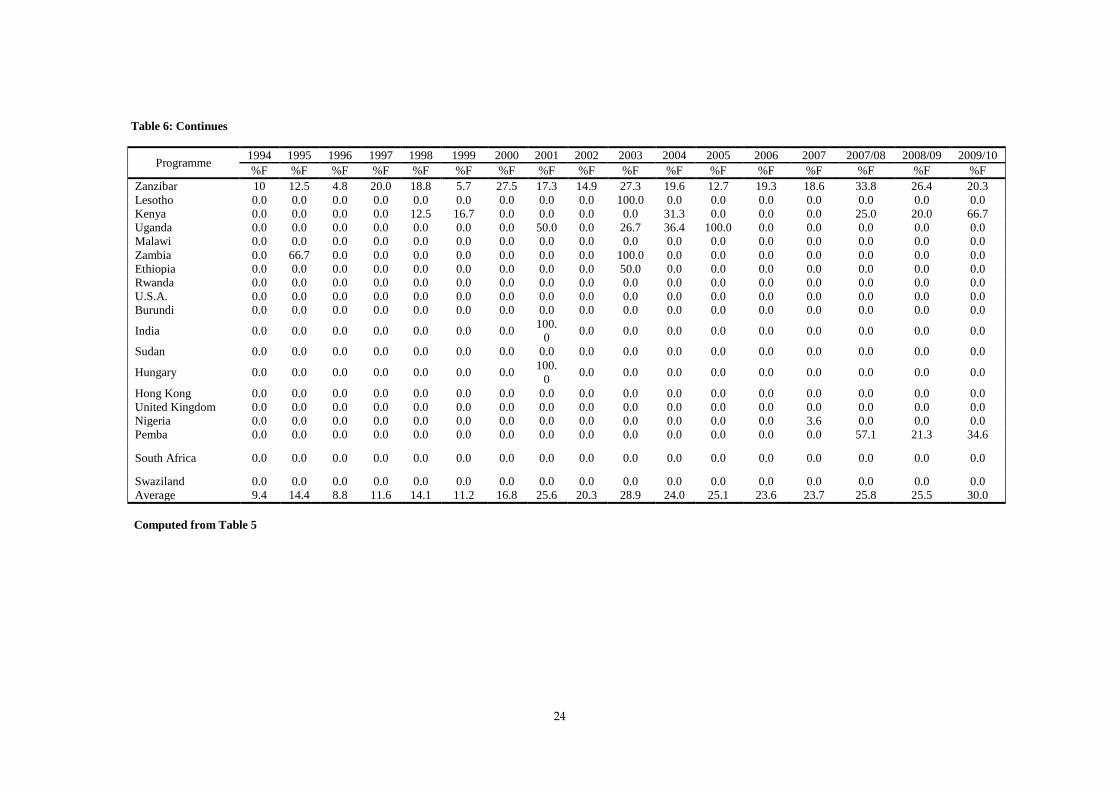
On the average, however, the percentage of female students as displayed in Table 6 is less than 15% over the last
15 years. There are, nonetheless, several sporadic increases in enrolment in some academic years due to
International students. For example, in 1995, the enrolment rate rose to 14.4% from 9.4 recorded in 1994 attributed
largely by CYP Diploma students from Zambia. In 1998 again, the percentage increased to 14.1% from 11.6%
recorded in 1997 due to students from Kenya. It also rose to 25.5% in 2001 mainly due to students from Uganda.
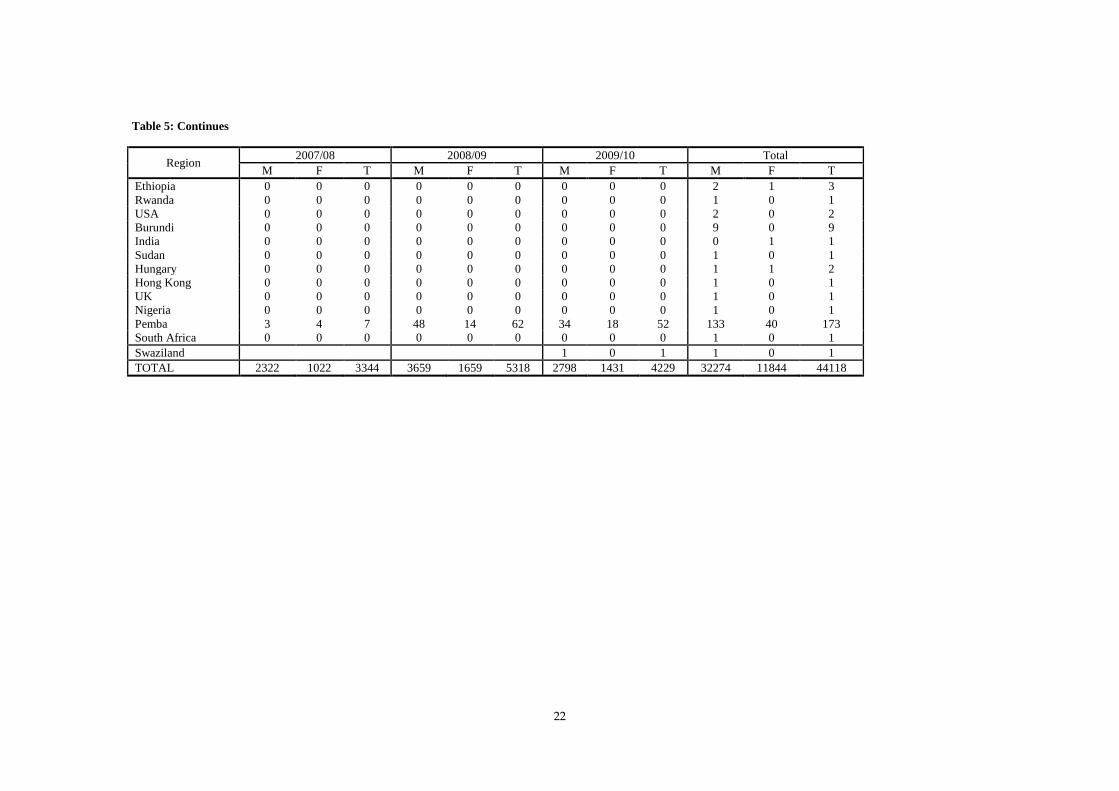
The OUT admitted international students from the following countries: Zambia (three students in 1995; one
student in 2003; and one student in 2004); Kenya (nine students in 1996; two students in 1997; eight students in
1998; six students 1999; two students in 2000; one student 2001; fifty eight students in 2002; forty eight students
in 2004) , Uganda (two students in 1998; two students in 1999; one student in 2001; sixty students in 2003; twenty
two students in 2004; two students 2005; one student in 2007). Just like in Tanzania, gender disparity features
prominently in all these countries; more male than female International students have been admitted in the OUT.
17
Table 5: Admission by Regional/Country/Coordination Centre (Undergraduate degree and Non – degree programme Students)
Region 1994 1995 1996 1997 1998 1999 2000
M F T M F T M F T M F T M F T M F T M F T
Arusha 38 4 42 32 3 35 69 3 72 41 3 44 49 5 54 51 8 59 48 7 55
Dar es Salaam 249 42 291 301 43 344 384 80 464 366 69 435 296 77 373 216 48 264 274 98 372
Ilala 0 0 0 0 0 0 0 0 0 0 0 0 0 0 0 0 0 0 0 0 0
Kinondoni 0 0 0 0 0 0 0 0 0 0 0 0 0 0 0 0 0 0 0 0 0
Temeke 0 0 0 0 0 0 0 0 0 0 0 0 0 0 0 0 0 0 0 0 0
Dodoma 15 1 16 8 2 10 30 5 35 24 4 28 35 10 45 23 4 27 23 3 26
Iringa 34 1 35 27 1 28 61 4 65 44 2 46 35 4 39 43 5 48 48 8 56
Kagera 14 0 14 15 0 15 43 2 45 16 3 19 20 1 21 29 10 39 24 3 27
Kigoma 6 0 6 14 1 15 24 1 25 13 3 16 32 3 35 12 0 12 25 1 26
Kilimanjaro 41 1 42 19 2 21 73 5 78 29 5 34 28 7 35 39 13 52 35 5 40
Lindi 6 0 6 7 0 7 9 0 9 11 0 11 9 1 10 4 0 4 14 0 14
Manyara 0 0 0 0 0 0 0 0 0 0 0 0 0 0 0 0 0 0 0 0 0
Mara 21 0 21 14 1 15 37 0 37 21 1 22 14 4 18 29 2 31 21 1 22
Mbeya 65 1 66 52 2 54 70 2 72 54 8 62 52 7 59 42 6 48 51 4 55
Morogoro 20 7 27 25 5 30 51 5 56 45 9 54 29 5 34 23 3 26 27 3 30
Mtwara 17 0 17 13 0 13 16 7 23 21 4 25 10 3 13 18 0 18 22 10 32
Mwanza 37 2 39 36 1 37 73 4 77 31 2 33 57 14 71 55 4 59 44 9 53
Coast 14 0 14 14 3 17 24 2 26 22 3 25 20 1 21 8 3 11 13 6 19
Rukwa 22 0 22 3 0 3 15 2 17 4 0 4 3 0 3 8 0 8 10 2 12
Ruvuma 14 1 15 16 0 16 18 4 22 19 1 20 30 0 30 18 4 22 17 6 23
Shinyanga 18 0 18 16 0 16 40 1 41 19 1 20 38 3 41 25 2 27 47 16 63
Singida 5 1 6 7 0 7 15 1 16 10 2 12 10 1 11 6 1 7 6 0 6
Tabora 34 2 36 12 0 12 40 2 42 21 1 22 25 4 29 42 3 45 33 8 41
Tanga 11 2 13 8 0 8 51 4 55 17 2 19 22 5 27 23 5 28 19 2 21
Zanzibar 18 2 20 28 4 32 40 2 42 16 4 20 13 3 16 33 2 35 37 14 51
Lesotho 0 0 0 0 0 0 0 0 0 2 0 2 0 0 0 0 0 0 1 0 1
Kenya 0 0 0 0 0 0 9 0 9 2 0 2 7 1 8 5 1 6 2 0 2
Uganda 0 0 0 0 0 0 0 0 0 0 0 0 2 0 2 2 0 2 0 0 0
Malawi 0 0 0 0 0 0 0 0 0 0 0 0 0 0 0 1 0 1 0 0 0
Zambia 0 0 0 1 2 3 0 0 0 0 0 0 0 0 0 0 0 0 0 0 0

18
Table 5 Continues
Region 1994 1995 1996 1997 1998 1999 2000
M F T M F T M F T M F T M F T M F T M F T
Ethiopia 0 0 0 0 0 0 0 0 0 0 0 0 0 0 0 0 0 0 1 0 1
Rwanda 0 0 0 0 0 0 0 0 0 0 0 0 0 0 0 0 0 0 0 0 0
USA 0 0 0 0 0 0 0 0 0 0 0 0 1 0 1 0 0 0 0 0 0
Burundi 0 0 0 0 0 0 0 0 0 3 0 3 2 0 2 0 0 0 0 0 0
India 0 0 0 0 0 0 0 0 0 0 0 0 0 0 0 0 0 0 0 0 0
Sudan 0 0 0 0 0 0 0 0 0 0 0 0 0 0 0 0 0 0 0 0 0
Hungary 0 0 0 0 0 0 1 0 1 0 0 0 0 0 0 0 0 0 0 0 0
Hong Kong 0 0 0 0 0 0 0 0 0 0 0 0 0 0 0 1 0 1 0 0 0
UK 0 0 0 0 0 0 0 0 0 0 0 0 0 0 0 0 0 0 1 0 1
Nigeria 0 0 0 0 0 0 0 0 0 0 0 0 0 0 0 0 0 0 0 0 0
Pemba 0 0 0 0 0 0 0 0 0 0 0 0 0 0 0 0 0 0 0 0 0
South Africa 0 0 0 0 0 0 0 0 0 0 0 0 0 0 0 0 0 0 0 0 0 TOTAL 699 67 766 668 70 738 1193 136 1329 851 127 978 839 159 998 756 124 880 843 206 1049

19
Table 5: Continues
Region 2001 2002 2003 2004 2005 2006 2007
M F T M F T M F T M F T M F T M F T M F T
Arusha 69 20 89 115 31 146 106 32 138 118 36 154 172 60 232 181 85 266 372 150 522
Dar es Salaam 323 123 446 328 176 504 454
26
0 714 571
33
1 902 772 494 1266 962 730 1692 1182 684 1866
Ilala 0 0 0 0 0 0 0 0 0 0 0 0 0 0 0 0 0 0 0 0 0
Kinondoni 0 0 0 0 0 0 0 0 0 0 0 0 0 0 0 0 0 0 0 0 0
Temeke 0 0 0 0 0 0 0 0 0 0 0 0 0 0 0 0 0 0 0 0 0
Dodoma 69 9 78 56 17 73 46 16 62 74 21 95 69 18 87 119 53 172 206 86 292
Iringa 86 21 107 58 20 78 86 37 123 100 47 147 152 43 195 161 41 202 270 77 347
Kagera 20 3 23 45 8 53 46 7 53 79 13 92 109 16 125 111 22 133 165 30 195
Kigoma 33 2 35 43 3 46 53 10 63 46 7 53 57 10 67 62 12 74 141 15 156
Kilimanjaro 57 12 69 49 24 73 88 36 124 102 58 160 136 85 221 163 116 279 381 223 604
Lindi 31 6 37 24 6 30 28 5 33 30 8 38 29 13 42 24 11 35 65 14 79
Manyara 0 0 0 0 0 0 19 5 24 32 7 39 76 16 92 59 25 84 187 63 250
Mara 63 19 82 69 11 80 59 8 67 77 18 95 71 11 82 91 16 107 129 39 168
Mbeya 85 16 101 79 16 95 116 33 149 109 39 148 126 35 161 192 72 264 328 102 430
Morogoro 52 10 62 62 22 84 75 26 101 80 27 107 123 41 164 119 52 171 222 129 351
Mtwara 39 6 45 16 6 22 25 7 32 21 8 29 61 13 74 70 26 96 132 25 157
Mwanza 82 11 93 113 23 136 117 30 147 130 27 157 148 42 190 159 56 215 234 47 281
Coast 35 10 45 17 5 22 30 11 41 42 21 63 56 28 84 63 32 95 115 53 168
Rukwa 16 1 17 32 5 37 39 4 43 46 4 50 75 14 89 79 13 92 131 34 165
Ruvuma 23 7 30 40 9 49 59 13 72 35 13 48 80 20 100 85 42 127 155 47 202
Shinyanga 92 16 108 41 6 47 53 10 63 90 13 103 125 20 145 72 6 78 129 25 154
Singida 49 11 60 40 12 52 38 13 51 56 20 76 58 17 75 62 27 89 74 30 104
Tabora 61 12 73 55 10 65 42 6 48 46 13 59 70 8 78 75 18 93 136 20 156
Tanga 50 25 75 93 31 124 98 36 134 82 29 111 124 43 167 131 63 194 225 78 303
Zanzibar 62 13 75 57 10 67 40 15 55 41 10 51 48 7 55 61 19 80 79 18 97
Lesotho 0 0 0 0 0 0 0 1 1 0 0 0 1 0 1 0 0 0 0 0 0
Kenya 1 0 1 41 17 58 0 0 0 33 15 48 0 0 0 0 0 0 1 0 1
Uganda 1 1 2 0 0 0 44 16 60 14 8 22 0 2 2 0 0 0 1 0 1
Malawi 0 0 0 0 0 0 0 0 0 1 0 1 0 0 0 0 0 0 0 0 0
Zambia 0 0 0 0 0 0 0 1 1 1 0 1 0 0 0 0 0 0 0 0 0

20
Table 5: Continues
Region 2001 2002 2003 2004 2005 2006 2007
M F T M F T M F T M F T M F T M F T M F T
Ethiopia 0 0 0 0 0 0 1 1 2 0 0 0 0 0 0 0 0 0 0 0 0
Rwanda 0 0 0 0 0 0 1 0 1 0 0 0 0 0 0 0 0 0 0 0 0 USA 0 0 0 0 0 0 1 0 1 0 0 0 0 0 0 0 0 0 0 0 0
Burundi 1 0 1 1 0 1 0 0 0 0 0 0 2 0 2 0 0 0 0 0 0
India 0 1 1 0 0 0 0 0 0 0 0 0 0 0 0 0 0 0 0 0 0 Sudan 1 0 1 0 0 0 0 0 0 0 0 0 0 0 0 0 0 0 0 0 0
Hungary 0 1 1 0 0 0 0 0 0 0 0 0 0 0 0 0 0 0 0 0 0
Hong Kong 0 0 0 0 0 0 0 0 0 0 0 0 0 0 0 0 0 0 0 0 0 UK 0 0 0 0 0 0 0 0 0 0 0 0 0 0 0 0 0 0 0 0 0
Nigeria 0 0 0 0 0 0 0 0 0 0 0 0 1 0 1 0 0 0 0 0 0
Pemba 0 0 0 0 0 0 0 0 0 0 0 0 0 0 0 21 3 24 27 1 28 South Africa 0 0 0 0 0 0 0 0 0 0 0 0 1 0 1 0 0 0 0 0 0
TOTAL 1401 356 1757 1474 468 1942
176
4 640
240
4
205
6 793
284
9 2742 1056 3798 3122
154
0 4662 5087 1990 7077
21
Table 5: Continues
Region 2007/08 2008/09 2009/10 Total
M F T M F T M F T M F T
Arusha 167 83 250 224 119 343 140 62 202 1992 711 2703
Dar es Salaam 577 390 967 7255 3646 10901
Ilala 469 313 782 313 244 557 782 557 1339
Kinondoni 496 316 812 602 389 991 1098 705 1803
Temeke 121 74 195 128 68 196 249 142 391
Dodoma 86 28 114 67 27 94 73 24 97 1023 328 1351
Iringa 142 44 186 168 66 234 93 20 113 1608 441 2049
Kagera 69 9 78 142 27 169 163 54 217 1110 208 1318
Kigoma 53 15 68 68 27 95 52 8 60 734 118 852
Kilimanjaro 167 99 266 149 85 234 119 94 213 1675 870 2545
Lindi 49 9 58 43 20 63 36 17 53 419 110 529
Manyara 40 17 57 131 53 184 33 9 42 577 195 772
Mara 49 4 53 105 28 133 102 32 134 972 195 1167
Mbeya 96 38 134 200 50 250 122 47 169 1839 478 2317
Morogoro 130 54 184 185 97 282 105 40 145 1373 535 1908
Mtwara 46 11 57 127 43 170 40 15 55 694 184 878
Mwanza 113 47 160 156 59 215 128 53 181 1713 431 2144
Coast 60 28 88 101 52 153 26 31 57 660 289 949
Rukwa 61 7 68 76 13 89 25 2 27 645 101 746
Ruvuma 73 19 92 77 22 99 75 29 104 834 237 1071
Shinyanga 47 10 57 170 47 217 103 102 205 1125 278 1403
Singida 90 33 123 41 22 63 52 11 63 619 202 821
Tabora 61 11 72 85 12 97 56 13 69 894 143 1037
Tanga 91 36 127 112 39 151 56 15 71 1213 415 1628
Zanzibar 49 25 74 93 33 126 118 30 148 833 211 1044
Lesotho 0 0 0 0 0 0 0 0 0 4 1 5
Kenya 3 1 4 5 1 6 2 4 6 111 40 151
Uganda 0 0 0 0 0 0 1 0 1 65 27 92
Malawi 0 0 0 0 0 0 0 0 0 2 0 2
Zambia 0 0 0 0 0 0 0 0 0 2 3 5
22
Table 5: Continues
Region 2007/08 2008/09 2009/10 Total
M F T M F T M F T M F T
Ethiopia 0 0 0 0 0 0 0 0 0 2 1 3
Rwanda 0 0 0 0 0 0 0 0 0 1 0 1
USA 0 0 0 0 0 0 0 0 0 2 0 2
Burundi 0 0 0 0 0 0 0 0 0 9 0 9
India 0 0 0 0 0 0 0 0 0 0 1 1
Sudan 0 0 0 0 0 0 0 0 0 1 0 1
Hungary 0 0 0 0 0 0 0 0 0 1 1 2
Hong Kong 0 0 0 0 0 0 0 0 0 1 0 1
UK 0 0 0 0 0 0 0 0 0 1 0 1
Nigeria 0 0 0 0 0 0 0 0 0 1 0 1
Pemba 3 4 7 48 14 62 34 18 52 133 40 173
South Africa 0 0 0 0 0 0 0 0 0 1 0 1
Swaziland 1 0 1 1 0 1
TOTAL 2322 1022 3344 3659 1659 5318 2798 1431 4229 32274 11844 44118

23
Table 6: Undergraduate Female Admission as a % Total Admission in Regional Centers and Countries
Programme 1994 1995 1996 1997 1998 1999 2000 2001 2002
200
3 2004 2005 2006 2007 2007/08 2008/09 2009/10
%F %F %F %F %F %F %F %F %F %F %F %F %F %F %F %F %F
Arusha 9.5 8.6 4.2 6.8 9.3 13.6 12.7 22.5 21.2 23.2 23.4 25.9 27.2 28.7 33.2 34.8 30.7
D’Salaam 14.4 12.5 17.2 15.9 20.6 18.2 26.3 27.6 34.9 36.4 36.7 39.0 38.3 38.7 40.3 0.0 0.0
Dodoma 6.3 20 14.3 14.3 22.2 14.8 11.5 11.5 23.3 25.8 22.1 20.7 30.5 29.5 24.6 28.3 24.7
Ilala 0.0 0.0 0.0 0.0 0.0 0.0 0.0 0.0 0.0 0.0 0.0 0.0 0.0 0.0 0.0 40.1 43.8
Iringa 2.9 3.6 6.2 4.3 10.3 10.4 14.3 19.6 25.6 30.1 32.0 22.1 19.9 22.2 23.7 26.5 17.7
Kagera 0.0 0.0 4.4 15.8 4.8 25.6 11.1 13.0 15.1 13.2 14.1 12.8 15.5 15.4 11.5 16.1 24.9
Kigoma 0.0 6.7 4.0 18.8 8.6 0.0 3.8 5.7 6.5 15.9 13.2 14.9 18.6 9.6 22.1 24.5 13.3
Kilimanjaro 2.4 9.5 6.4 14.7 20.0 25.0 12.5 17.4 32.9 29.0 36.3 38.5 38.6 36.6 37.2 36.3 44.1
Kinondoni 0.0 0.0 0.0 0.0 0.0 0.0 0.0 0.0 0.0 0.0 0.0 0.0 0.0 0.0 0.0 38.3 39.3
Lindi 0.0 0.0 0.0 0.0 10.0 0.0 0.0 16.2 20.0 15.2 21.1 31.0 31.6 17.7 15.5 25.5 32.1
Manyara 0.0 0.0 0.0 0.0 0.0 0.0 0.0 0.0 0.0 20.8 17.9 17.4 15.8 25.2 29.8 19.8 21.4
Mara 0.0 6.7 0.0 4.5 22.2 6.5 4.5 23.2 13.8 11.9 18.9 13.4 11.0 23.2 7.5 15.4 23.9
Mbeya 1.5 3.7 2.8 12.9 11.9 12.5 7.3 15.8 16.8 22.1 26.4 21.7 23.9 23.7 28.4 20.1 27.8
Morogoro 25.9 16.7 8.9 16.7 14.7 11.5 10.0 16.1 26.2 25.7 25.2 25.0 28.5 36.8 29.3 25.8 27.6
Mtwara 0.0 0.0 30.4 16.0 23.1 0.0 31.3 13.3 27.3 21.9 27.6 17.6 26.3 15.9 19.3 22.6 27.3
Mwanza 5.1 2.7 5.2 6.1 19.7 6.8 17.0 11.8 16.9 20.4 17.2 22.1 16.6 16.7 29.4 27.5 29.3
Coast 0.0 17.6 7.7 12.0 4.8 27.3 31.6 22.2 22.7 26.8 33.3 33.3 26.2 31.5 31.8 34.7 54.4
Rukwa 0.0 0.0 11.8 0.0 0.0 0.0 16.7 5.9 13.5 9.3 8.0 15.7 17.3 20.6 10.3 13.6 7.4
Ruvuma 6.7 0.0 18.2 5.0 0.0 18.2 26.1 23.3 18.4 18.1 27.1 20.0 26.7 23.3 20.7 22.4 27.9
Shinyanga 0 0.0 2.4 5.0 7.3 7.4 25.4 14.8 12.8 15.9 12.6 13.8 6.9 16.2 17.6 14.7 49.8
Singida 16.7 0.0 6.3 16.7 9.1 14.3 0.0 18.3 23.1 25.5 26.3 22.7 26.2 28.8 26.8 33.3 17.5
Tabora 5.6 0.0 4.8 4.5 13.8 6.7 19.5 16.4 15.4 12.5 22.0 10.3 20.6 12.8 15.3 12.4 18.8
Tanga 15.4 0.0 7.3 10.5 18.5 17.9 9.5 33.3 25.0 26.9 26.1 25.7 33.1 25.7 28.3 25.8 21.1
Temeke 0.0 0.0 0.0 0.0 0.0 0.0 0.0 0.0 0.0 0.0 0.0 0.0 0.0 0.0 0.0 35.8 34.7
Computed from Table 5
24
Table 6: Continues
Programme 1994 1995 1996 1997 1998 1999 2000 2001 2002 2003 2004 2005 2006 2007 2007/08 2008/09 2009/10
%F %F %F %F %F %F %F %F %F %F %F %F %F %F %F %F %F
Zanzibar 10 12.5 4.8 20.0 18.8 5.7 27.5 17.3 14.9 27.3 19.6 12.7 19.3 18.6 33.8 26.4 20.3
Lesotho 0.0 0.0 0.0 0.0 0.0 0.0 0.0 0.0 0.0 100.0 0.0 0.0 0.0 0.0 0.0 0.0 0.0
Kenya 0.0 0.0 0.0 0.0 12.5 16.7 0.0 0.0 0.0 0.0 31.3 0.0 0.0 0.0 25.0 20.0 66.7
Uganda 0.0 0.0 0.0 0.0 0.0 0.0 0.0 50.0 0.0 26.7 36.4 100.0 0.0 0.0 0.0 0.0 0.0
Malawi 0.0 0.0 0.0 0.0 0.0 0.0 0.0 0.0 0.0 0.0 0.0 0.0 0.0 0.0 0.0 0.0 0.0
Zambia 0.0 66.7 0.0 0.0 0.0 0.0 0.0 0.0 0.0 100.0 0.0 0.0 0.0 0.0 0.0 0.0 0.0
Ethiopia 0.0 0.0 0.0 0.0 0.0 0.0 0.0 0.0 0.0 50.0 0.0 0.0 0.0 0.0 0.0 0.0 0.0
Rwanda 0.0 0.0 0.0 0.0 0.0 0.0 0.0 0.0 0.0 0.0 0.0 0.0 0.0 0.0 0.0 0.0 0.0
U.S.A. 0.0 0.0 0.0 0.0 0.0 0.0 0.0 0.0 0.0 0.0 0.0 0.0 0.0 0.0 0.0 0.0 0.0
Burundi 0.0 0.0 0.0 0.0 0.0 0.0 0.0 0.0 0.0 0.0 0.0 0.0 0.0 0.0 0.0 0.0 0.0
India 0.0 0.0 0.0 0.0 0.0 0.0 0.0 100.
0 0.0 0.0 0.0 0.0 0.0 0.0 0.0 0.0 0.0
Sudan 0.0 0.0 0.0 0.0 0.0 0.0 0.0 0.0 0.0 0.0 0.0 0.0 0.0 0.0 0.0 0.0 0.0
Hungary 0.0 0.0 0.0 0.0 0.0 0.0 0.0 100.
0 0.0 0.0 0.0 0.0 0.0 0.0 0.0 0.0 0.0
Hong Kong 0.0 0.0 0.0 0.0 0.0 0.0 0.0 0.0 0.0 0.0 0.0 0.0 0.0 0.0 0.0 0.0 0.0
United Kingdom 0.0 0.0 0.0 0.0 0.0 0.0 0.0 0.0 0.0 0.0 0.0 0.0 0.0 0.0 0.0 0.0 0.0
Nigeria 0.0 0.0 0.0 0.0 0.0 0.0 0.0 0.0 0.0 0.0 0.0 0.0 0.0 3.6 0.0 0.0 0.0
Pemba 0.0 0.0 0.0 0.0 0.0 0.0 0.0 0.0 0.0 0.0 0.0 0.0 0.0 0.0 57.1 21.3 34.6
South Africa 0.0 0.0 0.0 0.0 0.0 0.0 0.0 0.0 0.0 0.0 0.0 0.0 0.0 0.0 0.0 0.0 0.0
Swaziland 0.0 0.0 0.0 0.0 0.0 0.0 0.0 0.0 0.0 0.0 0.0 0.0 0.0 0.0 0.0 0.0 0.0
Average 9.4 14.4 8.8 11.6 14.1 11.2 16.8 25.6 20.3 28.9 24.0 25.1 23.6 23.7 25.8 25.5 30.0
Computed from Table 5
25
1.1.4 Postgraduate Enrolment
The OUT has since 2001 been running a number of postgraduate courses leading to the award of Postgraduate
Diplomas, Masters and PhD degrees. Table 7 presents the admission of postgraduate students by programme with
special focus on gender aspect. It can be seen from table 7 that the enrolment of postgraduate students has
consistently been rising since the year 2001 up to 2007 before dropping gruffly in the year 2008
The MBA program is the most popular with the total enrolment of 3194 since 2002. In this programme, the annual
enrolment increased by more than tenfold between 2002 and 2004, largely because of the introduction of
coursework and dissertation components; and face to face mode of teaching and learning. Like in many
programmes, the MBA enrolment reached a pinnacle in the year 2007 and registered a downturn after that year.
On the contrary, while the LLB programme attracts the huge proportion of students, it is ironic to notice that LLM
is one of the least popular courses. It can also be seen from Table 7 that postgraduate diploma in law attracts more
students than LLM programme; cumulatively nearly nine times larger than the enrolment into the LLM.
In the overall, however, education programmes has the largest concentration of postgraduate population. Out of
three education programmes (PGDE, M.Dist.Ed and M.Ed) currently on offer, PGDE is more popular than others.
Science programmes have the lowest per annum and cumulative enrolment.
The PhD enrolment has declined over the years. It first rose from 24 to 25 between 2001 and 2002. Majority of
students under the two cohorts are mainly the OUT staff some of whom are still engaged in research. Although the
enrolment increased slightly in 2007 such an increase is still lower than enrolment registered in the early 2000s.
Table 8 shows that more female are admitted in the education programmes (PGDE, M.Dist.Ed and M.Ed). The
female participation rate in the MA programme is very low compared with male. Table 8 indicates that since 2001
the MA programme registered female two academic years: 2007 and 2008/09. At the PhD level, there were no
female students since the academic year 2005.

26
Table 7: Admission of Postgraduate Students into Various Programmes
Programme 2001 2002 2003 2004 2005
Male female Total Male female Total Male female Total Male female Total Male female Total
PGDE 17 2 19 23 5 28 37 7 44 40 5 45 42 12 54
M.Dist.
Ed. 3 2 5 9 5 14 29 1 30 29 6 35 28 10 38
M.Ed 18 4 22 7 2 9 4 1 5 0 0 0 1 0 1
MA 1 0 1 23 0 23 4 0 4 5 0 5 0 0 0
MBA 0 0 0 12 0 12 10 2 12 198 38 236 240 29 269
MSc 2 1 3 2 1 3 0 2 2 2 1 3 2 1 3
PGDL 14 1 15 7 1 8 12 0 12 15 0 15 23 0 23
LLM 8 0 8 1 0 1 1 2 3 2 0 2 2 1 3
Ph.D 21 3 24 22 3 25 11 1 12 9 3 12 2 0 2
LL.M IT
& T - - - - - - - - - - - - - - -
M. CED - - - - - - - - - - - - - - -
Total 84 13 97 106 17 123 108 16 124 300 53 353 340 53 393
Table 7: Continues
Programme 2006 2007 2008 2008/09 2009/10 Total
M F T M F T M F T M F T M F T M F T
PGDE 61 5 66 34 18 52 43 11 54 37 10 47 91 69 160 425 144 569
M.Dist. Ed. 0 0 0 78 51 129 16 4 20 10 4 14 3 1 4 205 84 289
M.Ed 39 13 52 40 10 50 88 52 140 55 35 90 179 90 269 431 207 638
MA 1 0 1 20 10 30 0 0 0 79 24 103 106 52 158 239 86 325
MBA 319 34 353 684 173 857 277 56 333 392 101 493 492 137 629 2624 570 3194
MSc 0 1 1 0 1 1 2 0 2 0 0 0 1 1 2 11 9 20
PGDL 30 4 34 51 9 60 36 5 41 15 5 20 40 7 47 243 32 275
LLM 3 1 4 2 1 3 3 1 4 0 0 0 0 0 0 22 6 28
Ph.D 3 0 3 2 0 2 11 4 15 0 0 0 41 8 49 122 22 144
LL.M IT
& T - - - - - - - - - - - - 60 19 79 60 19 79
M. CED - - - - - - - - - - - - 226 159 385 226 159 385
Total 456 58 514 911 273 1184 476 133 609 588 179 767 1239 543 1782 4608 1338 5946
Table 8: Female Postgraduate Students as a Percentage of Total Admission by Programme
Programme 2001 2002 2003 2004 2005 2006 2007 2008 2008/09 2009/10
%female %female %female %female %female %female %female %female %female %female
PGDE 10.5 17.9 15.9 11.1 22.2 7.6 34.6 20.4 21.3 43.1
M.Dist. Ed. 40.0 35.7 3.3 17.1 26.3 0.0 39.5 20.0 28..6 25.0
M.Ed 18.2 22.2 20.0 0.0 0.0 25.0 20.0 37.1 38.9 33.5
MA 0.0 0.0 0.0 0.0 0.0 0.0 3.3 0.0 23.3 32.9
MBA 0.0 0.0 16.7 16.1 10.8 9.6 20.2 16.8 20.5 21.8
MSc 33.3 33.3 100.0 33.3 33.3 100.0 100.0 0.0 0.0 50.0
PGDL 6.7 12.5 0.0 0.0 0.0 11.8 15.0 12.2 25.0 14.9
LLM 0.0 0.0 66.7 0.0 33.3 25.0 33.3 25.0 0.0 0.0
Ph.D 12.5 12.0 8.3 25.0 0.0 0.0 0.0 26.7 0.0 16.3
LL.M IT &
T - - - - - - - - - 24.1
M. CED - - - - - - - - - 41.3
Average 20.2 22.3 33.0 20.5 25.2 29.8 33.2 22.6 26.3 30.3
27
1.1.5 Enrolment into Non-Degree Programmes
The University, through the Institute of Continuing Education, has developed a rich diversity of non-degree
programmes. Some of these programmes lay the foundation for undergraduate studies; while others have been
designed to sharpen and enhance professional competencies.
Table 9 gives the admission snapshot into the non-degree programmes. Of these, the foundation course attracts
more students than others for obvious reason: it is a bridging course that prepares students who otherwise would
not have qualified for a direct entry into the undergraduate programme. The OFC enrolment has exhibited an
increasing trend since its inception in 1996; although it has declined in the academic year 2000/08. Even though,
when the academic years 2008 and 2008/09 are taken together as a single academic year, the enrolment is still far
higher than the previous years.
The enrolment in the Certificate Course in Distance Education has, in the overall been falling since the year 2000.
There is an outlier, however, in the year 2003 where there was an explosion of enrolment from 4 registered in 2002
to 33 students in 2003. The reason for this rapid growth was mainly attributed to publicity carried out by Tanga’
DRC who managed to motivate staff of the Korogwe Teachers’ college to join the programme. This calls for
renewed publicity and marketization of the CCDE to the general public.
At Diploma level, enrolment into the Commonwealth Youth Programme (CYP) has been fairly stable since it was
launched in the year 2000. With an exception of academic year 2008, the OUT has, on the average, been enrolling
annually a batch of thirty students into the CYP programme. In its nine year of existence, CYP programme has
proudly been able to produce more than 600 professionals, who are fully engaged in Community works across the
East Africa Region.
The enrolment in the Ordinary Diploma in Distance Education and Open Learning is relatively small, yet large
enough to allow close interaction between a lecturer and students. In the academic year 2008/09, enrolment rose by
50%. A lot remains to be desired from distance education non-degree programmes as depicted in Table 9. In
particular, it seems there is missing link between CCDE and ODDEOL. For example, the total number of students
enrolled in CCDE since 2006 is 7, while those admitted in ODDEOL is 61.
The OUT has since the academic year 2008/09 launched a Diploma in Primary Teachers’ Education (DPTE).
Thanks to the Open University, UK, for the generous financial support to initiate this programme. It is too early to
analyse and decipher the enrolment trend and synthesize a definitive conclusion on the performance of the DPTE.
Nevertheless, there is a clear indication that this programme will prove a success in the future, as more teachers
upgrade their competencies.
Table 10 gives the percentage of female in total admission for non-degree programmes. The highest percentage is
displayed in the OFC programme. In the overall, the emerging picture in non-degree programmes is more or less
the same with degree programmes. That is, on the average, just like in the degree programmes, no more than 40%
of female are admitted into non-degree programmes.
.

28
Table 9: Admission into Various Non-Degree Programmes
Programme 1996 1997 1998 1999 2000
Male female Total Male female Total Male female Total Male female Total Male female Total
OFC 194 34 228 182 41 223 191 60 251 204 57 261 217 59 276
CYP-
Diploma 45 13 58
CCDE 30 10 40
ODDEOL
DPTE
CPPH
Total 194 34 228 182 41 223 191 60 251 204 57 261 292 82 374
Table 9: Continues
Programme 2001 2002 2003 2004 2005
Male female Total Male female Total Male female Total Male female Total Male female Total
OFC 360 122 482 353 141 494 476 213 689 562 260 822 690 359 1049
CYP-
Diploma 82 28 110 78 26 104 86 29 115 68 28 96 41 12 53
CCDE 8 1 9 3 1 4 25 8 33 2 1 3 2 0 2
ODDEOL
DPTE
CPPH
Total 450 151 601 434 168 602 587 250 837 632 289 921 733 371 1104
Table 9: Continues
Progra
mme
2006 2007 2008 2008/09 2009/10 Total
M F T M F T M F T M F T M F T M F T
OFC 651 49
0 1141 833 537 1370 463
28
7
75
0 750 520 1270 739 532 1271 6865 3712 10577
ODCYP 23 10 33 22 7 29 11 5 16 22 10 32 27 8 35 505 176 681
CCDE 1 3 4 0 0 0 1 2 3 0 0 0 2 2 4 74 28 102
ODDE
OL 15 2 17 5 5 10 8 4 12 17 5 22 38 16 54 83 32 115
ODPTE 304 184 488 277 220 497 581 404 985
ODPPH 5 4 9 5 4 9
CPPH 1 0 1 0 0 0 0 0 0 1 0 1 2 0 2
Total 690 505 1195 861 549 1410 483 298 781 1093 719 1812 1089 782 1871 8115 4356 12471

29
Table 10: Female Students as a % of Total admission into Non-Degree Programmes
Programme 1996 1997 1998 1999 2000 2001 2002 2003 2004 2005 2006 2007 2007/08 2008/09 2009/10
%F %F %F %F %F %F %F %F %F %F %F %F %F %F %F
OFC 14.9 18.4 23.9 21.8 21.4 25.3 28.5 30.9 31.6 34.2 42.8 39.2 38.3 40.9 35.1
ODCYP 22.4 25.5 25.0 25.2 29.2 22.6 31.3 21.4 31.3 31.3 25.8
CCDE 25.0 11.1 25.0 24.2 33.3 0.0 75.0 0.0 66.7 0.0 27.5
ODDEOL 13.6 50.0 33.3 22.7 27.8
ODPTE 37.7 41.0
ODPPH 44.4
CPPH 0.0 0.0 0.0 0.0
Total 14.9 18.4 23.9 21.8 22.9 20.6 26.2 26.8 31.4 28.4 40.7 36.9 42.4 33.2 33.6
Computed from Table 9
2.1 Undergraduate Programmes
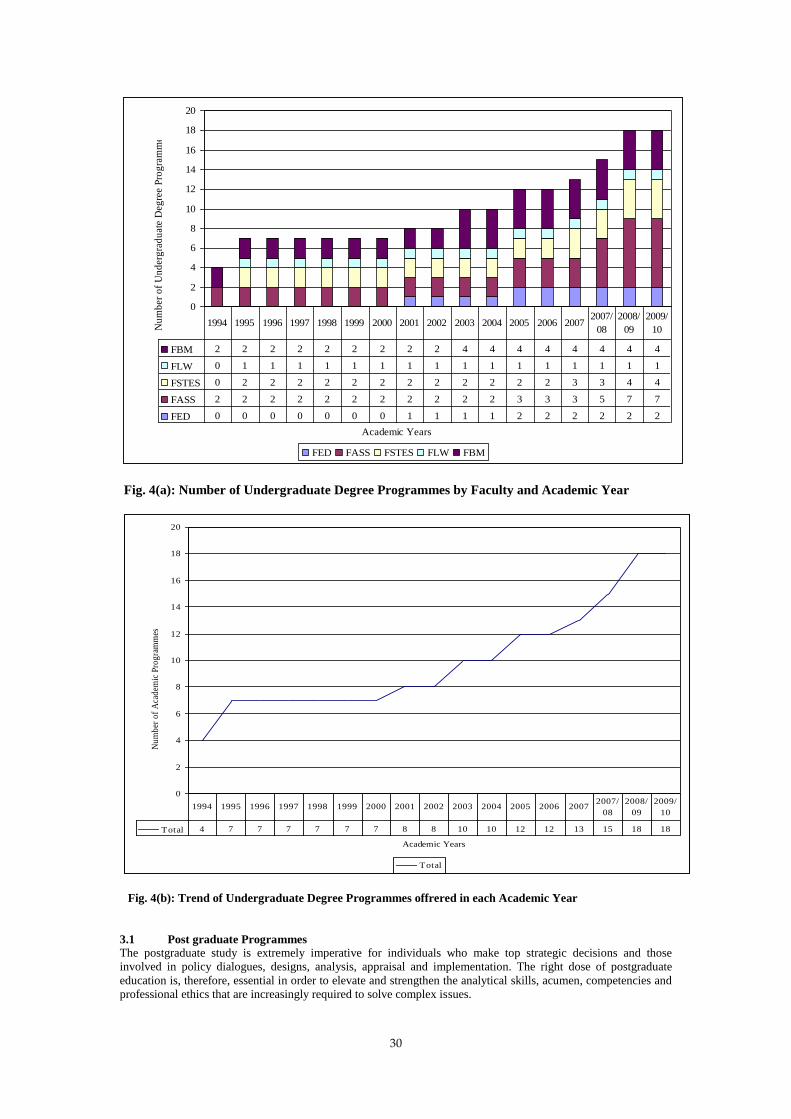
The number of undergraduate programmes has risen from 4 to 18 between the academic years 1994 and 2009/10
respectively. The BA (General), BA (Ed) and B.Com and B.Com (Ed) are the oldest courses. The Bachelor of
Business Administration commenced in the academic year 2003. New programmes which were launched in the
academic year 2008/09 are: Bachelor of Arts in Journalism, Bachelor of Arts in Mass communication and
Bachelor of Science in Environmental Studies.
Table 11 illustrates the number of undergraduate programmes since 1994. Faculty of Arts and Social Sciences
offer more programmes than other faculties—the number of programmes is nearly four times larger than that found
in the Faculty of Education. Although Faculty of Education enrols majority of students compared with other
faculties, it nonetheless offers little menu of undergraduate courses. The expansion in enrolment in the faculty of
law has not kept abreast with the development of new academic programmes. Clearly, there is an urgent need to
revisit the LLB programme with a view to introduce more specialized programmes.
Table 11: Undergraduate Degree Programmes
Year Faculties
Total FED FASS FSTES FLW FBM
1994 0 2 0 0 2 4
1995 0 2 2 1 2 7
1996 0 2 2 1 2 7
1997 0 2 2 1 2 7
1998 0 2 2 1 2 7
1999 0 2 2 1 2 7
2000 0 2 2 1 2 7
2001 1 2 2 1 2 8
2002 1 2 2 1 2 8
2003 1 2 2 1 4 10
2004 1 2 2 1 4 10
2005 2 3 2 1 4 12
2006 2 3 2 1 4 12
2007 2 3 3 1 4 13
2007/08 2 5 3 1 4 15
2008/09 2 7 4 1 4 18
2009/10 2 7 4 1 4 18
30
0
2
4
6
8
10
12
14
16
18
20
Academic Years
Nu
mb
er o
f U
nd
erg
rad
uat
e D
egre
e P
rog
ram
mes
FED FASS FSTES FLW FBM
FBM 2 2 2 2 2 2 2 2 2 4 4 4 4 4 4 4 4
FLW 0 1 1 1 1 1 1 1 1 1 1 1 1 1 1 1 1
FSTES 0 2 2 2 2 2 2 2 2 2 2 2 2 3 3 4 4
FASS 2 2 2 2 2 2 2 2 2 2 2 3 3 3 5 7 7
FED 0 0 0 0 0 0 0 1 1 1 1 2 2 2 2 2 2
1994 1995 1996 1997 1998 1999 2000 2001 2002 2003 2004 2005 2006 20072007/
08
2008/
09
2009/
10
Fig. 4(a): Number of Undergraduate Degree Programmes by Faculty and Academic Year
0
2
4
6
8
10
12
14
16
18
20
Academic Years
Nu
mb
er o
f A
cad
emic
Pro
gra
mm
es
Total
Total 4 7 7 7 7 7 7 8 8 10 10 12 12 13 15 18 18
1994 1995 1996 1997 1998 1999 2000 2001 2002 2003 2004 2005 2006 20072007/
08
2008/
09
2009/
10
Fig. 4(b): Trend of Undergraduate Degree Programmes offrered in each Academic Year
3.1 Post graduate Programmes
The postgraduate study is extremely imperative for individuals who make top strategic decisions and those
involved in policy dialogues, designs, analysis, appraisal and implementation. The right dose of postgraduate
education is, therefore, essential in order to elevate and strengthen the analytical skills, acumen, competencies and
professional ethics that are increasingly required to solve complex issues.

31
The Open University of Tanzania started to run the Postgraduate programmes in 2001. The first batch of
Postgraduate students were enrolled in Postgraduate Diploma in Education, Postgraduate Diploma in Law, Master
in Distance Education, Master of Education, Master of Arts, Master of Science, Master of Laws, and PhD in
various fields. Out of 97 enrolled students 13 were female. This figure is less than 15% of enrolled students in that
particular year.
Table 12 gives the number of postgraduate programmes across various faculties. The Faculty of Arts and Social
Sciences offers more programmes than others. Faculty of business management, despite having many more
students than others, it has fewer postgraduate programmes. Certainly, there is a need to introduce new specialized
programmes in Banking and Financial services, Financial Risk management, investment banking and finance in
order to robustly accelerate the development of the vibrant financial industry in the country.
Table 12: Postgraduate Degree Programmes
Year Faculties
Total
FED FASS FSTES FLW FBM
2001 4 3 2 3 0 12
2002 4 3 2 3 1 13
2003 4 3 2 3 1 13
2004 4 3 2 3 1 13
2005 4 3 2 3 2 14
2006 6 9 7 3 2 27
2007 6 9 7 3 2 27
2008 6 9 7 3 2 27
2009 6 9 7 4 2 28
0
5
10
15
20
25
30
Academic Years
Nu
mb
er o
f P
ost
gra
du
ate
Pro
gra
mm
es
FED FASS FSTES FLW FBM
FBM 0 1 1 1 2 2 2 2 2
FLW 3 3 3 3 3 3 3 3 4
FSTES 2 2 2 2 2 7 7 7 7
FASS 3 3 3 3 3 9 9 9 9
FED 4 4 4 4 4 6 6 6 6
2001 2002 2003 2004 2005 2006 2007/08 2008/09 2009/10
Fig. 5(a): Postgraduate Programmes by Academic Year
32
0
5
10
15
20
25
30
Academic Years
Nu
mb
er
of
Pro
gra
mm
es
Total
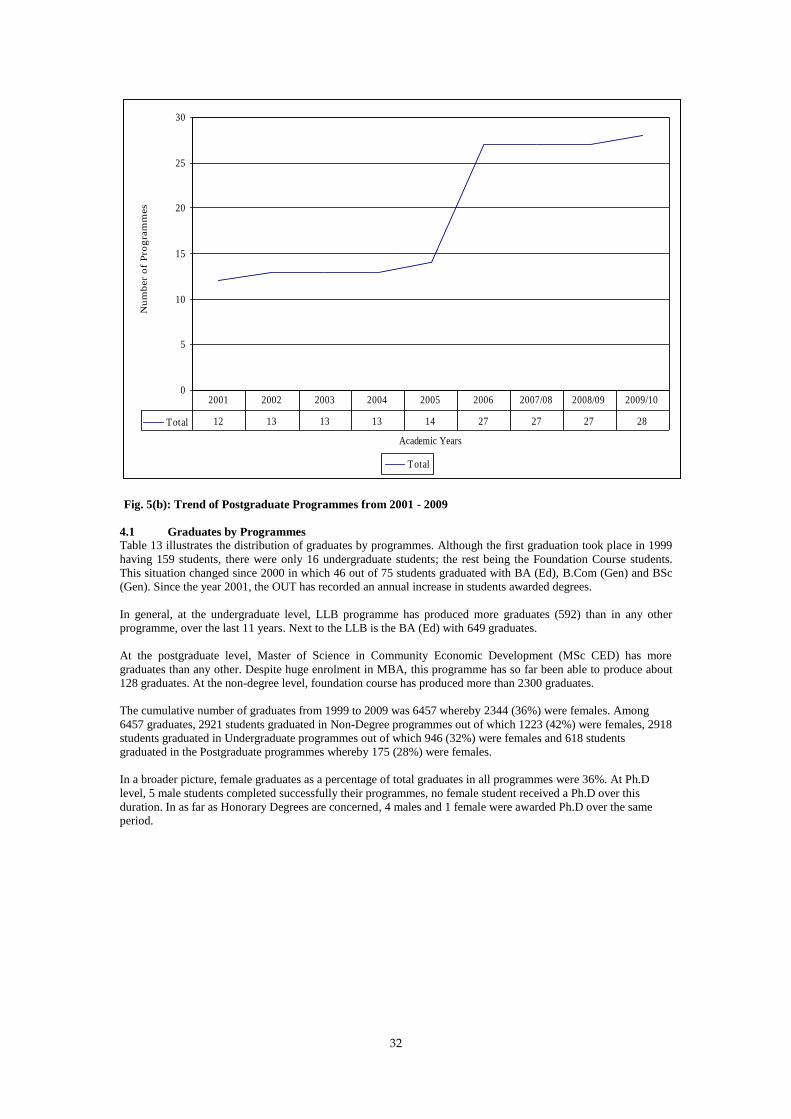
Total 12 13 13 13 14 27 27 27 28
2001 2002 2003 2004 2005 2006 2007/08 2008/09 2009/10
Fig. 5(b): Trend of Postgraduate Programmes from 2001 - 2009
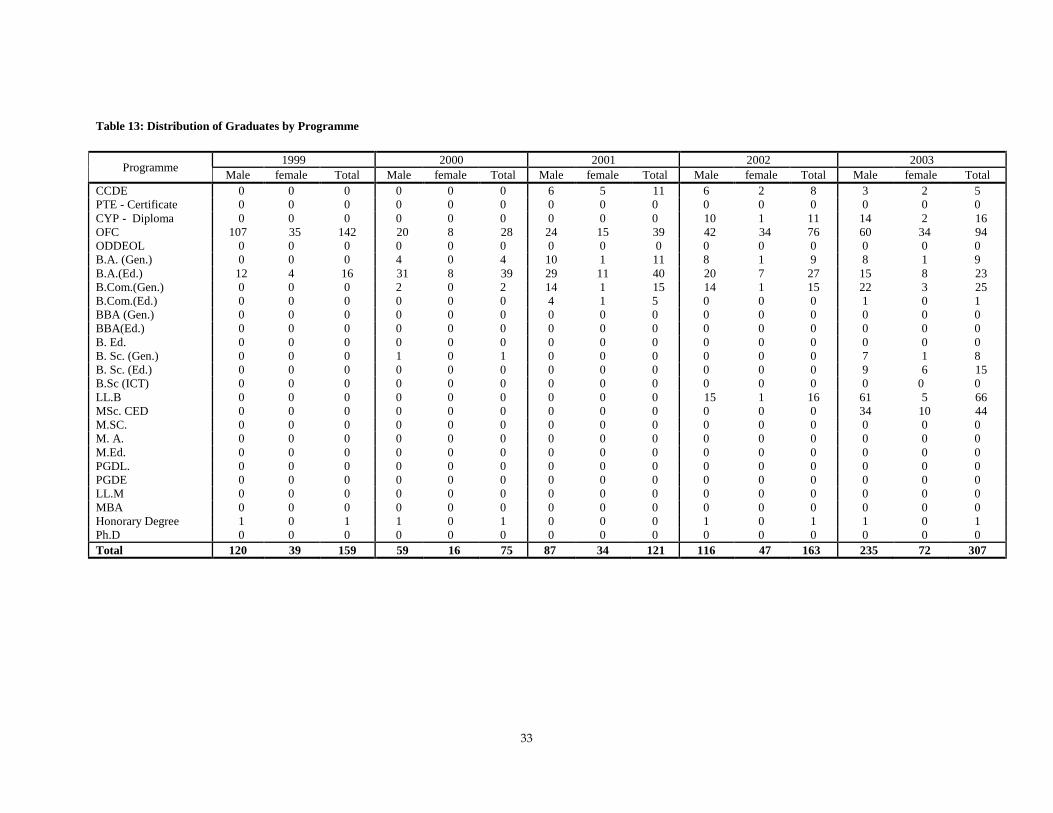
4.1 Graduates by Programmes
Table 13 illustrates the distribution of graduates by programmes. Although the first graduation took place in 1999
having 159 students, there were only 16 undergraduate students; the rest being the Foundation Course students.
This situation changed since 2000 in which 46 out of 75 students graduated with BA (Ed), B.Com (Gen) and BSc
(Gen). Since the year 2001, the OUT has recorded an annual increase in students awarded degrees.
In general, at the undergraduate level, LLB programme has produced more graduates (592) than in any other
programme, over the last 11 years. Next to the LLB is the BA (Ed) with 649 graduates.
At the postgraduate level, Master of Science in Community Economic Development (MSc CED) has more
graduates than any other. Despite huge enrolment in MBA, this programme has so far been able to produce about
128 graduates. At the non-degree level, foundation course has produced more than 2300 graduates.
The cumulative number of graduates from 1999 to 2009 was 6457 whereby 2344 (36%) were females. Among
6457 graduates, 2921 students graduated in Non-Degree programmes out of which 1223 (42%) were females, 2918
students graduated in Undergraduate programmes out of which 946 (32%) were females and 618 students
graduated in the Postgraduate programmes whereby 175 (28%) were females.
In a broader picture, female graduates as a percentage of total graduates in all programmes were 36%. At Ph.D
level, 5 male students completed successfully their programmes, no female student received a Ph.D over this
duration. In as far as Honorary Degrees are concerned, 4 males and 1 female were awarded Ph.D over the same
period.
33
Table 13: Distribution of Graduates by Programme
Programme 1999 2000 2001 2002 2003
Male female Total Male female Total Male female Total Male female Total Male female Total
CCDE 0 0 0 0 0 0 6 5 11 6 2 8 3 2 5
PTE - Certificate 0 0 0 0 0 0 0 0 0 0 0 0 0 0 0
CYP - Diploma 0 0 0 0 0 0 0 0 0 10 1 11 14 2 16
OFC 107 35 142 20 8 28 24 15 39 42 34 76 60 34 94
ODDEOL 0 0 0 0 0 0 0 0 0 0 0 0 0 0 0
B.A. (Gen.) 0 0 0 4 0 4 10 1 11 8 1 9 8 1 9
B.A.(Ed.) 12 4 16 31 8 39 29 11 40 20 7 27 15 8 23
B.Com.(Gen.) 0 0 0 2 0 2 14 1 15 14 1 15 22 3 25
B.Com.(Ed.) 0 0 0 0 0 0 4 1 5 0 0 0 1 0 1
BBA (Gen.) 0 0 0 0 0 0 0 0 0 0 0 0 0 0 0
BBA(Ed.) 0 0 0 0 0 0 0 0 0 0 0 0 0 0 0
B. Ed. 0 0 0 0 0 0 0 0 0 0 0 0 0 0 0
B. Sc. (Gen.) 0 0 0 1 0 1 0 0 0 0 0 0 7 1 8
B. Sc. (Ed.) 0 0 0 0 0 0 0 0 0 0 0 0 9 6 15
B.Sc (ICT) 0 0 0 0 0 0 0 0 0 0 0 0 0 0 0
LL.B 0 0 0 0 0 0 0 0 0 15 1 16 61 5 66
MSc. CED 0 0 0 0 0 0 0 0 0 0 0 0 34 10 44
M.SC. 0 0 0 0 0 0 0 0 0 0 0 0 0 0 0
M. A. 0 0 0 0 0 0 0 0 0 0 0 0 0 0 0
M.Ed. 0 0 0 0 0 0 0 0 0 0 0 0 0 0 0
PGDL. 0 0 0 0 0 0 0 0 0 0 0 0 0 0 0
PGDE 0 0 0 0 0 0 0 0 0 0 0 0 0 0 0
LL.M 0 0 0 0 0 0 0 0 0 0 0 0 0 0 0
MBA 0 0 0 0 0 0 0 0 0 0 0 0 0 0 0
Honorary Degree 1 0 1 1 0 1 0 0 0 1 0 1 1 0 1
Ph.D 0 0 0 0 0 0 0 0 0 0 0 0 0 0 0
Total 120 39 159 59 16 75 87 34 121 116 47 163 235 72 307

34
Table 13: Continues
Programme 2004 2005 2006 2007 2008 2009
Male female Total Male female Total Male female Total Male female Total Male female Total Male female Total
CCDE 6 1 7 1 1 2 0 0 0 0 0 0 0 0 0 0 0 0
PTE - Certificate 0 0 0 0 0 0 0 0 0 202 86 288 21 18 39 0 0 0
CYP - Diploma 31 22 53 25 11 36 9 6 15 29 12 41 13 8 21 13 9 22
OFC 122 67 189 198 166 364 218 165 383 193 204 397 285 287 572 37 18 55
ODDEOL 0 0 0 0 0 0 0 0 0 0 0 0 2 1 3 1 3 4
B.A. (Gen.) 12 3 15 6 2 8 18 4 22 21 2 23 29 18 47 53 39 92
B.A. (Tourism) 23 9 32
B.A.(Ed.) 27 8 35 35 18 53 34 27 61 64 33 97 41 37 78 103 77 180
B.Com.(Gen.) 30 7 37 50 14 64 18 5 23 6 2 8 8 4 12 54 41 95
B.Com.(Ed.) 5 0 5 3 1 4 1 2 3 4 2 6 4 0 4 0 0 0
BBA (Gen.) 0 0 0 0 0 0 26 11 37 22 18 40 45 31 76 120 57 177
BBA(Ed.) 0 0 0 0 0 0 1 0 1 0 0 0 0 0 0 3 3 6
B. Ed. 0 0 0 6 3 9 7 15 22 36 42 78 39 37 76 109 154 263
B. Sc. (Gen.) 16 4 20 16 6 22 15 8 23 19 11 30 25 14 39 33 16 49
B. Sc. (Ed.) 10 2 12 6 2 8 3 3 6 14 7 21 3 4 7 12 8 20
B.Sc (ICT) 0 0 0 104 12 116 0 0 0 0 0 0 9 1 10 6 0 6
LL.B 71 11 82 59 33 92 81 7 88 78 17 95 58 11 69 43 16 59
MSc. CED 0 0 0 0 0 0 0 0 0 61 43 104 0 0 0 127 42 169
M.SC. 0 0 0 1 0 1 0 0 0 2 0 2 1 0 1 0 0 0
M. A. 4 0 4 2 0 2 1 0 1 2 0 2 2 2 4 0 0 0
M.Ed. 0 0 0 0 1 1 0 0 0 2 0 2 2 0 2 2 1 3
PGDL. 0 0 0 0 0 0 0 0 0 4 0 4 3 1 4 2 1 3
PGDE 0 0 0 0 0 0 1 2 3 6 1 7 7 3 10 5 1 6
LL.M 0 0 0 0 0 0 1 0 1 2 0 2 2 0 2 1 0 1
MBA 0 0 0 0 0 0 0 0 0 6 3 9 18 4 22 71 26 97
Honorary Degree 0 0 0 0 0 0 0 1 1 0 0 0 0 0 0 0 0 0
Ph.D 0 0 0 0 0 0 4 0 4 0 0 0 3 0 3 1 0 1
Total 334 125 459 512 270 782 438 256 694 773 483 1256 620 481 1101 819 521 1340
35
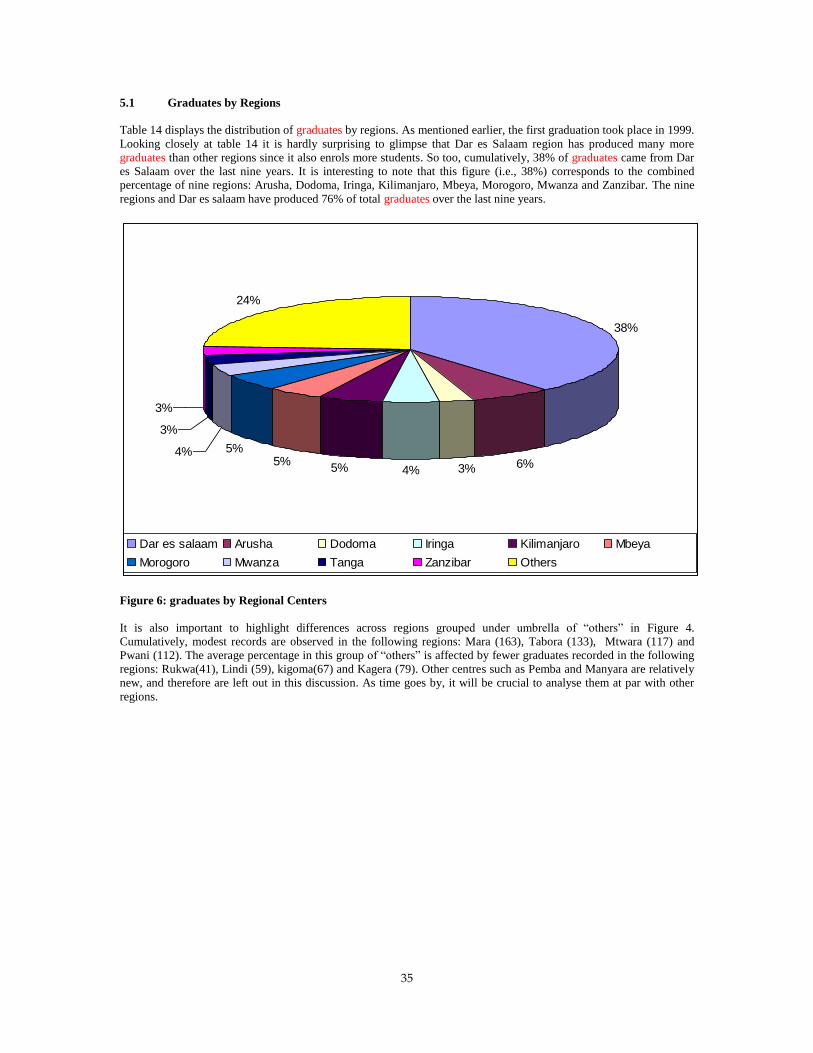
5.1 Graduates by Regions
Table 14 displays the distribution of graduates by regions. As mentioned earlier, the first graduation took place in 1999.
Looking closely at table 14 it is hardly surprising to glimpse that Dar es Salaam region has produced many more
graduates than other regions since it also enrols more students. So too, cumulatively, 38% of graduates came from Dar
es Salaam over the last nine years. It is interesting to note that this figure (i.e., 38%) corresponds to the combined
percentage of nine regions: Arusha, Dodoma, Iringa, Kilimanjaro, Mbeya, Morogoro, Mwanza and Zanzibar. The nine
regions and Dar es salaam have produced 76% of total graduates over the last nine years.
38%
6%3%4%5%5%
5%4%
3%
3%
24%
Dar es salaam Arusha Dodoma Iringa Kilimanjaro Mbeya
Morogoro Mwanza Tanga Zanzibar Others
Figure 6: graduates by Regional Centers
It is also important to highlight differences across regions grouped under umbrella of “others” in Figure 4.
Cumulatively, modest records are observed in the following regions: Mara (163), Tabora (133), Mtwara (117) and
Pwani (112). The average percentage in this group of “others” is affected by fewer graduates recorded in the following
regions: Rukwa(41), Lindi (59), kigoma(67) and Kagera (79). Other centres such as Pemba and Manyara are relatively
new, and therefore are left out in this discussion. As time goes by, it will be crucial to analyse them at par with other
regions.
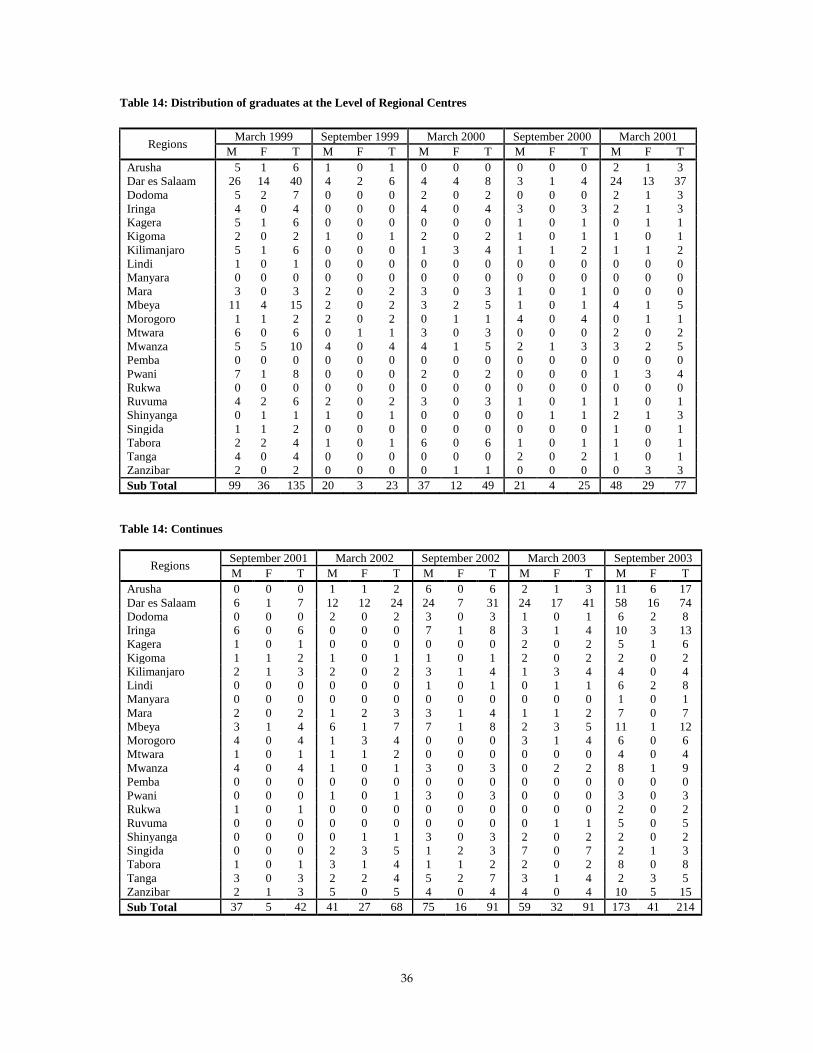
36
Table 14: Distribution of graduates at the Level of Regional Centres
Regions March 1999 September 1999 March 2000 September 2000 March 2001
M F T M F T M F T M F T M F T
Arusha 5 1 6 1 0 1 0 0 0 0 0 0 2 1 3
Dar es Salaam 26 14 40 4 2 6 4 4 8 3 1 4 24 13 37
Dodoma 5 2 7 0 0 0 2 0 2 0 0 0 2 1 3
Iringa 4 0 4 0 0 0 4 0 4 3 0 3 2 1 3
Kagera 5 1 6 0 0 0 0 0 0 1 0 1 0 1 1
Kigoma 2 0 2 1 0 1 2 0 2 1 0 1 1 0 1
Kilimanjaro 5 1 6 0 0 0 1 3 4 1 1 2 1 1 2
Lindi 1 0 1 0 0 0 0 0 0 0 0 0 0 0 0
Manyara 0 0 0 0 0 0 0 0 0 0 0 0 0 0 0
Mara 3 0 3 2 0 2 3 0 3 1 0 1 0 0 0
Mbeya 11 4 15 2 0 2 3 2 5 1 0 1 4 1 5
Morogoro 1 1 2 2 0 2 0 1 1 4 0 4 0 1 1
Mtwara 6 0 6 0 1 1 3 0 3 0 0 0 2 0 2
Mwanza 5 5 10 4 0 4 4 1 5 2 1 3 3 2 5
Pemba 0 0 0 0 0 0 0 0 0 0 0 0 0 0 0
Pwani 7 1 8 0 0 0 2 0 2 0 0 0 1 3 4
Rukwa 0 0 0 0 0 0 0 0 0 0 0 0 0 0 0
Ruvuma 4 2 6 2 0 2 3 0 3 1 0 1 1 0 1
Shinyanga 0 1 1 1 0 1 0 0 0 0 1 1 2 1 3
Singida 1 1 2 0 0 0 0 0 0 0 0 0 1 0 1
Tabora 2 2 4 1 0 1 6 0 6 1 0 1 1 0 1
Tanga 4 0 4 0 0 0 0 0 0 2 0 2 1 0 1
Zanzibar 2 0 2 0 0 0 0 1 1 0 0 0 0 3 3
Sub Total 99 36 135 20 3 23 37 12 49 21 4 25 48 29 77
Table 14: Continues
Regions September 2001 March 2002 September 2002 March 2003 September 2003
M F T M F T M F T M F T M F T
Arusha 0 0 0 1 1 2 6 0 6 2 1 3 11 6 17
Dar es Salaam 6 1 7 12 12 24 24 7 31 24 17 41 58 16 74
Dodoma 0 0 0 2 0 2 3 0 3 1 0 1 6 2 8
Iringa 6 0 6 0 0 0 7 1 8 3 1 4 10 3 13
Kagera 1 0 1 0 0 0 0 0 0 2 0 2 5 1 6
Kigoma 1 1 2 1 0 1 1 0 1 2 0 2 2 0 2
Kilimanjaro 2 1 3 2 0 2 3 1 4 1 3 4 4 0 4
Lindi 0 0 0 0 0 0 1 0 1 0 1 1 6 2 8
Manyara 0 0 0 0 0 0 0 0 0 0 0 0 1 0 1
Mara 2 0 2 1 2 3 3 1 4 1 1 2 7 0 7
Mbeya 3 1 4 6 1 7 7 1 8 2 3 5 11 1 12
Morogoro 4 0 4 1 3 4 0 0 0 3 1 4 6 0 6
Mtwara 1 0 1 1 1 2 0 0 0 0 0 0 4 0 4
Mwanza 4 0 4 1 0 1 3 0 3 0 2 2 8 1 9
Pemba 0 0 0 0 0 0 0 0 0 0 0 0 0 0 0
Pwani 0 0 0 1 0 1 3 0 3 0 0 0 3 0 3
Rukwa 1 0 1 0 0 0 0 0 0 0 0 0 2 0 2
Ruvuma 0 0 0 0 0 0 0 0 0 0 1 1 5 0 5
Shinyanga 0 0 0 0 1 1 3 0 3 2 0 2 2 0 2
Singida 0 0 0 2 3 5 1 2 3 7 0 7 2 1 3
Tabora 1 0 1 3 1 4 1 1 2 2 0 2 8 0 8
Tanga 3 0 3 2 2 4 5 2 7 3 1 4 2 3 5
Zanzibar 2 1 3 5 0 5 4 0 4 4 0 4 10 5 15
Sub Total 37 5 42 41 27 68 75 16 91 59 32 91 173 41 214
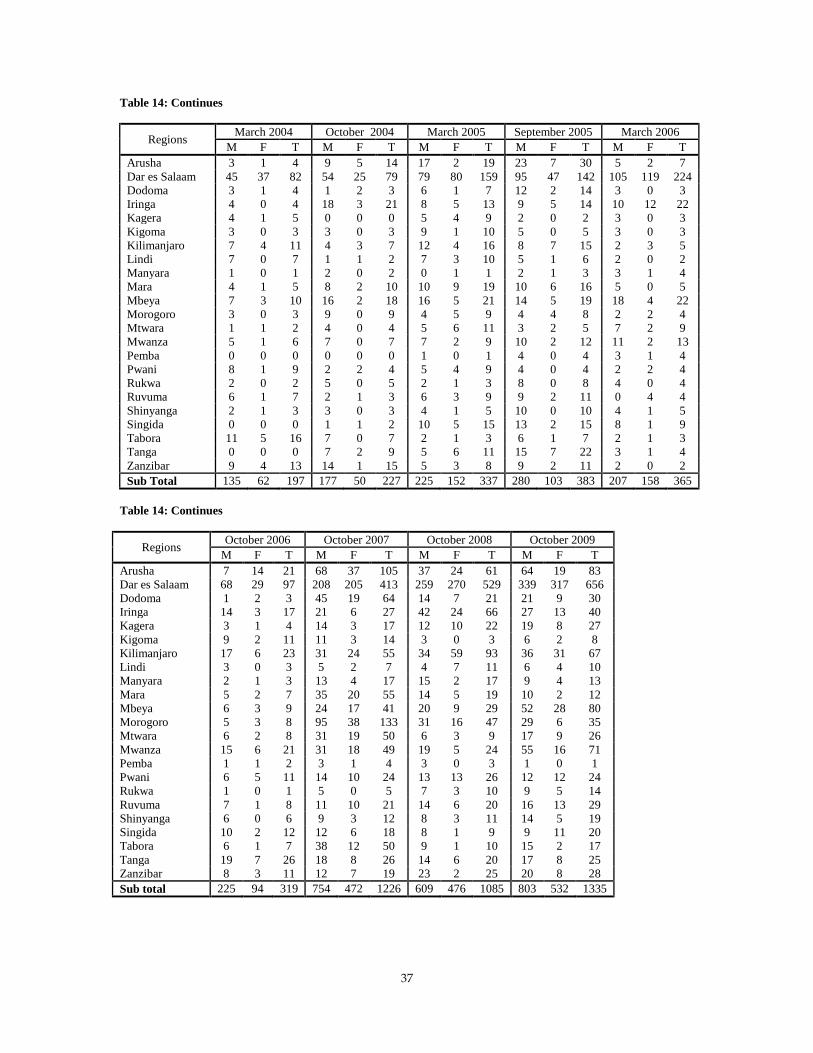
37
Table 14: Continues
Regions March 2004 October 2004 March 2005 September 2005 March 2006
M F T M F T M F T M F T M F T
Arusha 3 1 4 9 5 14 17 2 19 23 7 30 5 2 7
Dar es Salaam 45 37 82 54 25 79 79 80 159 95 47 142 105 119 224
Dodoma 3 1 4 1 2 3 6 1 7 12 2 14 3 0 3
Iringa 4 0 4 18 3 21 8 5 13 9 5 14 10 12 22
Kagera 4 1 5 0 0 0 5 4 9 2 0 2 3 0 3
Kigoma 3 0 3 3 0 3 9 1 10 5 0 5 3 0 3
Kilimanjaro 7 4 11 4 3 7 12 4 16 8 7 15 2 3 5
Lindi 7 0 7 1 1 2 7 3 10 5 1 6 2 0 2
Manyara 1 0 1 2 0 2 0 1 1 2 1 3 3 1 4
Mara 4 1 5 8 2 10 10 9 19 10 6 16 5 0 5
Mbeya 7 3 10 16 2 18 16 5 21 14 5 19 18 4 22
Morogoro 3 0 3 9 0 9 4 5 9 4 4 8 2 2 4
Mtwara 1 1 2 4 0 4 5 6 11 3 2 5 7 2 9
Mwanza 5 1 6 7 0 7 7 2 9 10 2 12 11 2 13
Pemba 0 0 0 0 0 0 1 0 1 4 0 4 3 1 4
Pwani 8 1 9 2 2 4 5 4 9 4 0 4 2 2 4
Rukwa 2 0 2 5 0 5 2 1 3 8 0 8 4 0 4
Ruvuma 6 1 7 2 1 3 6 3 9 9 2 11 0 4 4
Shinyanga 2 1 3 3 0 3 4 1 5 10 0 10 4 1 5
Singida 0 0 0 1 1 2 10 5 15 13 2 15 8 1 9
Tabora 11 5 16 7 0 7 2 1 3 6 1 7 2 1 3
Tanga 0 0 0 7 2 9 5 6 11 15 7 22 3 1 4
Zanzibar 9 4 13 14 1 15 5 3 8 9 2 11 2 0 2
Sub Total 135 62 197 177 50 227 225 152 337 280 103 383 207 158 365
Table 14: Continues
Regions October 2006 October 2007 October 2008 October 2009
M F T M F T M F T M F T
Arusha 7 14 21 68 37 105 37 24 61 64 19 83
Dar es Salaam 68 29 97 208 205 413 259 270 529 339 317 656
Dodoma 1 2 3 45 19 64 14 7 21 21 9 30
Iringa 14 3 17 21 6 27 42 24 66 27 13 40
Kagera 3 1 4 14 3 17 12 10 22 19 8 27
Kigoma 9 2 11 11 3 14 3 0 3 6 2 8
Kilimanjaro 17 6 23 31 24 55 34 59 93 36 31 67
Lindi 3 0 3 5 2 7 4 7 11 6 4 10
Manyara 2 1 3 13 4 17 15 2 17 9 4 13
Mara 5 2 7 35 20 55 14 5 19 10 2 12
Mbeya 6 3 9 24 17 41 20 9 29 52 28 80
Morogoro 5 3 8 95 38 133 31 16 47 29 6 35
Mtwara 6 2 8 31 19 50 6 3 9 17 9 26
Mwanza 15 6 21 31 18 49 19 5 24 55 16 71
Pemba 1 1 2 3 1 4 3 0 3 1 0 1
Pwani 6 5 11 14 10 24 13 13 26 12 12 24
Rukwa 1 0 1 5 0 5 7 3 10 9 5 14
Ruvuma 7 1 8 11 10 21 14 6 20 16 13 29
Shinyanga 6 0 6 9 3 12 8 3 11 14 5 19
Singida 10 2 12 12 6 18 8 1 9 9 11 20
Tabora 6 1 7 38 12 50 9 1 10 15 2 17
Tanga 19 7 26 18 8 26 14 6 20 17 8 25
Zanzibar 8 3 11 12 7 19 23 2 25 20 8 28
Sub total 225 94 319 754 472 1226 609 476 1085 803 532 1335
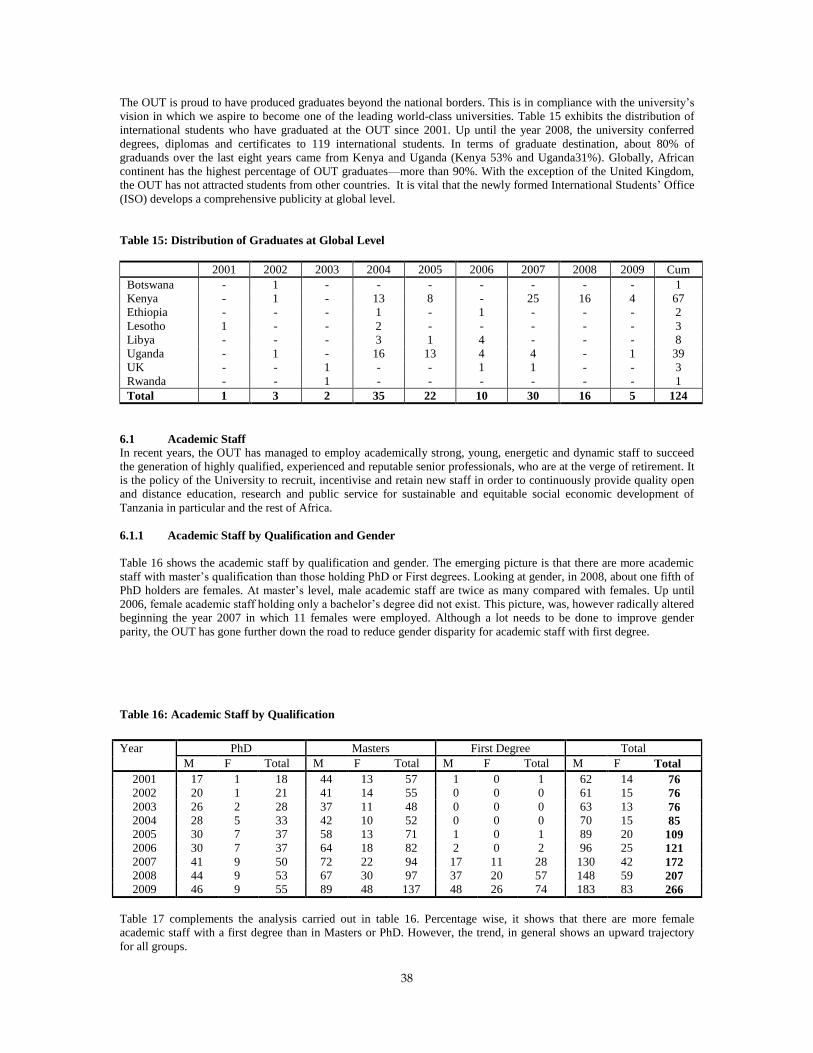
38
The OUT is proud to have produced graduates beyond the national borders. This is in compliance with the university’s
vision in which we aspire to become one of the leading world-class universities. Table 15 exhibits the distribution of
international students who have graduated at the OUT since 2001. Up until the year 2008, the university conferred
degrees, diplomas and certificates to 119 international students. In terms of graduate destination, about 80% of
graduands over the last eight years came from Kenya and Uganda (Kenya 53% and Uganda31%). Globally, African
continent has the highest percentage of OUT graduates—more than 90%. With the exception of the United Kingdom,
the OUT has not attracted students from other countries. It is vital that the newly formed International Students’ Office
(ISO) develops a comprehensive publicity at global level.
Table 15: Distribution of Graduates at Global Level
2001 2002 2003 2004 2005 2006 2007 2008 2009 Cum
Botswana - 1 - - - - - - - 1
Kenya - 1 - 13 8 - 25 16 4 67
Ethiopia - - - 1 - 1 - - - 2
Lesotho 1 - - 2 - - - - - 3
Libya - - - 3 1 4 - - - 8
Uganda - 1 - 16 13 4 4 - 1 39
UK - - 1 - - 1 1 - - 3
Rwanda - - 1 - - - - - - 1
Total 1 3 2 35 22 10 30 16 5 124
6.1 Academic Staff
In recent years, the OUT has managed to employ academically strong, young, energetic and dynamic staff to succeed
the generation of highly qualified, experienced and reputable senior professionals, who are at the verge of retirement. It
is the policy of the University to recruit, incentivise and retain new staff in order to continuously provide quality open
and distance education, research and public service for sustainable and equitable social economic development of
Tanzania in particular and the rest of Africa.
6.1.1 Academic Staff by Qualification and Gender
Table 16 shows the academic staff by qualification and gender. The emerging picture is that there are more academic
staff with master’s qualification than those holding PhD or First degrees. Looking at gender, in 2008, about one fifth of
PhD holders are females. At master’s level, male academic staff are twice as many compared with females. Up until
2006, female academic staff holding only a bachelor’s degree did not exist. This picture, was, however radically altered
beginning the year 2007 in which 11 females were employed. Although a lot needs to be done to improve gender
parity, the OUT has gone further down the road to reduce gender disparity for academic staff with first degree.
Table 16: Academic Staff by Qualification
Year PhD Masters First Degree Total
M F Total M F Total M F Total M F Total
2001 17 1 18 44 13 57 1 0 1 62 14 76
2002 20 1 21 41 14 55 0 0 0 61 15 76
2003 26 2 28 37 11 48 0 0 0 63 13 76
2004 28 5 33 42 10 52 0 0 0 70 15 85
2005 30 7 37 58 13 71 1 0 1 89 20 109
2006 30 7 37 64 18 82 2 0 2 96 25 121
2007 41 9 50 72 22 94 17 11 28 130 42 172
2008 44 9 53 67 30 97 37 20 57 148 59 207
2009 46 9 55 89 48 137 48 26 74 183 83 266
Table 17 complements the analysis carried out in table 16. Percentage wise, it shows that there are more female
academic staff with a first degree than in Masters or PhD. However, the trend, in general shows an upward trajectory
for all groups.
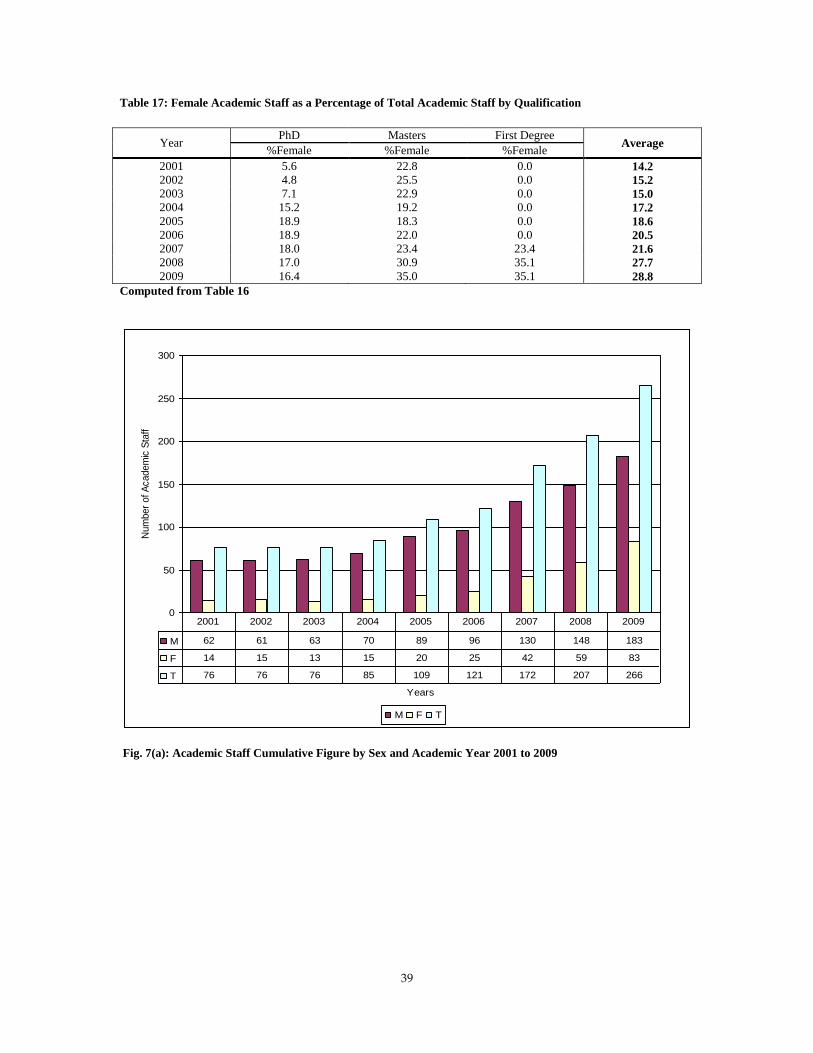
39
Table 17: Female Academic Staff as a Percentage of Total Academic Staff by Qualification
Year PhD Masters First Degree
Average %Female %Female %Female
2001 5.6 22.8 0.0 14.2
2002 4.8 25.5 0.0 15.2
2003 7.1 22.9 0.0 15.0
2004 15.2 19.2 0.0 17.2
2005 18.9 18.3 0.0 18.6
2006 18.9 22.0 0.0 20.5
2007 18.0 23.4 23.4 21.6
2008 17.0 30.9 35.1 27.7
2009 16.4 35.0 35.1 28.8
Computed from Table 16
0
50
100
150
200
250
300
Years
Num
ber
of A
cadem
ic S
taff
M F T
M 62 61 63 70 89 96 130 148 183
F 14 15 13 15 20 25 42 59 83
T 76 76 76 85 109 121 172 207 266
2001 2002 2003 2004 2005 2006 2007 2008 2009
Fig. 7(a): Academic Staff Cumulative Figure by Sex and Academic Year 2001 to 2009
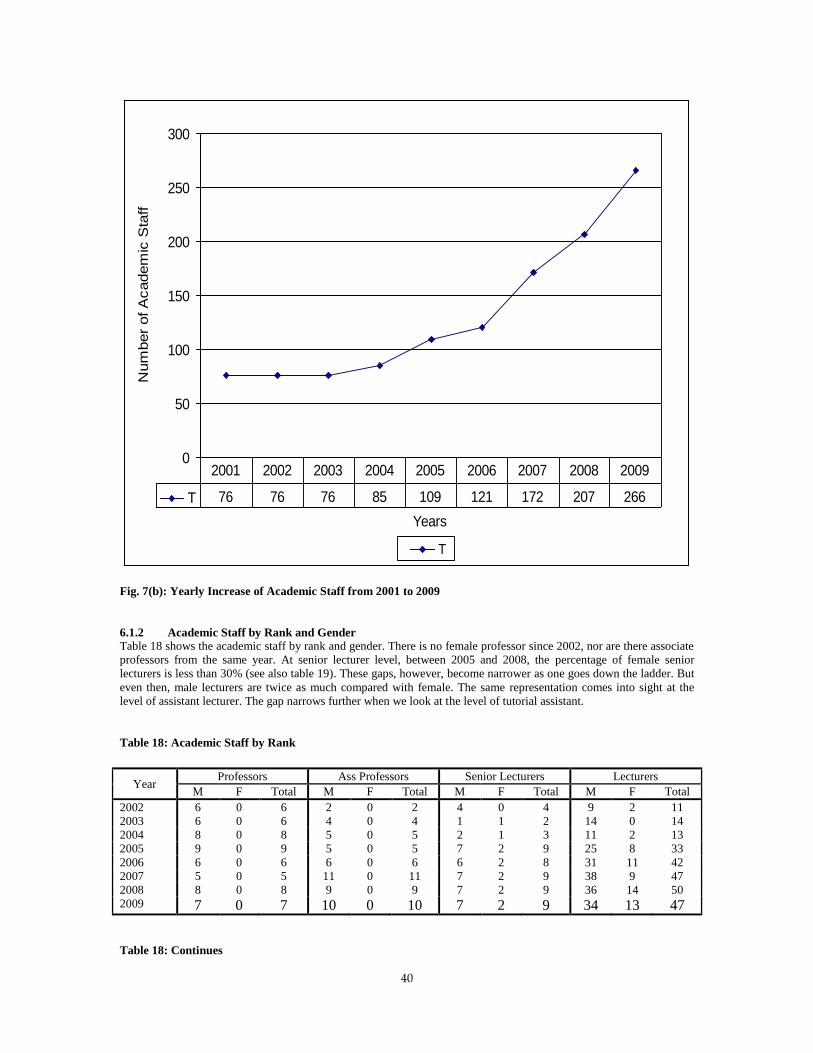
40
0
50
100
150
200
250
300
Years
Num
ber
of A
cadem
ic S
taff
T
T 76 76 76 85 109 121 172 207 266
2001 2002 2003 2004 2005 2006 2007 2008 2009
Fig. 7(b): Yearly Increase of Academic Staff from 2001 to 2009
6.1.2 Academic Staff by Rank and Gender
Table 18 shows the academic staff by rank and gender. There is no female professor since 2002, nor are there associate
professors from the same year. At senior lecturer level, between 2005 and 2008, the percentage of female senior
lecturers is less than 30% (see also table 19). These gaps, however, become narrower as one goes down the ladder. But
even then, male lecturers are twice as much compared with female. The same representation comes into sight at the
level of assistant lecturer. The gap narrows further when we look at the level of tutorial assistant.
Table 18: Academic Staff by Rank
Year Professors Ass Professors Senior Lecturers Lecturers
M F Total M F Total M F Total M F Total
2002 6 0 6 2 0 2 4 0 4 9 2 11
2003 6 0 6 4 0 4 1 1 2 14 0 14
2004 8 0 8 5 0 5 2 1 3 11 2 13
2005 9 0 9 5 0 5 7 2 9 25 8 33
2006 6 0 6 6 0 6 6 2 8 31 11 42
2007 5 0 5 11 0 11 7 2 9 38 9 47
2008 8 0 8 9 0 9 7 2 9 36 14 50
2009 7 0 7 10 0 10 7 2 9 34 13 47
Table 18: Continues

41
Year Ass Lecturers Tutorial Assistant Total
M F Total M F Total M F Total
2002 38 14 52 1 0 1 60 16 76
2003 37 11 48 2 0 2 65 11 76
2004 35 12 47 0 0 0 62 14 76
2005 44 9 53 0 0 0 91 18 109
2006 45 12 57 2 0 2 97 24 121
2007 54 19 73 16 11 27 131 41 172
2008 51 23 74 37 20 57 148 59 207
2009 72 41 113 53 27 80 183 83 266
Table 19: Female Academic Staff as a Percentage of Total Academic Staff by Rank
year Professors
Associate
Professors
Senior
Lecturers Lecturers
Assistant
Lecturers
Tutorial
Assistants Average
%female %female %female %female %female %female
2002 0.0 0.0 0.0 18.2 26.9 0.0 22.6
2003 0.0 0.0 50.0 0.0 22.9 0.0 36.5
2004 0.0 0.0 33.3 15.4 25.5 0.0 24.6
2005 0.0 0.0 25.0 24.2 17.0 0.0 22.1
2006 0.0 0.0 25.0 26.2 21.1 0.0 24.1
2007 0.0 0.0 22.2 19.1 26.0 40.7 27.0
2008 0.0 0.0 22.2 28.0 31.5 35.7 29.4
2009 0.0 0.0 22.2 27.7 36.3 33.8 30.0
Computed from Table 18
Table 21 portrays the academic staff-student ratio. Clearly, the emerging picture is that academic
staff are overwhelmed by the increased enrolment. It is worth putting a caveat that not all
academic staff are fully involved in teaching. Put differently, some academic staff are
simultaneously engaged in administrative and teaching duties; hence, they play a limited role in
teaching cycles. Justifiably, it suffices to conclude that the OUT needs to recruit more academic
staff in order to meet the standard student-staff ratio of 1:35.
0
20
40
60
80
100
120
Academic Year
Nu
mb
er o
f A
cad
emic
Sta
ff
Full Prof. Associate. Prof. Senior Lecturer Lecturer Assistant. Lecturer Tutorial Assistant
Full Prof. 6 6 6 8 9 6 5 8 7
Associate. Prof. 2 2 4 5 5 6 11 9 10
Senior Lecturer 4 4 2 3 9 8 9 9 9
Lecturer 11 11 14 13 33 42 47 50 47
Assistant. Lecturer 52 52 48 56 52 57 73 74 113
Tutorial Assistant 1 1 2 0 1 2 27 57 80
2001 2002 2003 2004 2005 2006 2007 2008 2009

42
Fig. 8(a): Academic Staff by Rank and Year
0
50
100
150
200
250
300
Academic Years
Nu
mb
er
of
Acad
em
ic S
taff
T
T 76 76 76 85 109 121 172 207 266
2001 2002 2003 2004 2005 2006 2007 2008 2009
Fig. 8(b Yearly Academic Staff Recruitment
Table 20: Academic Staff Profile by Age and Sex 2009
Group Age range in years Numbers of Academic Staff
Total Male Female
I ≤30 19 18 37
II 31 – 35 43 20 63
III 36 – 40 32 19 51
IV 41 – 45 18 9 27
V 46 – 50 18 2 20
VI 51 – 55 17 10 27
VII 56 – 60 12 4 16
VIII 61 – 65 16 1 17
IX 66 - 70 6 0 6
X ≥71 2 0 2
TOTAL 183 83 266
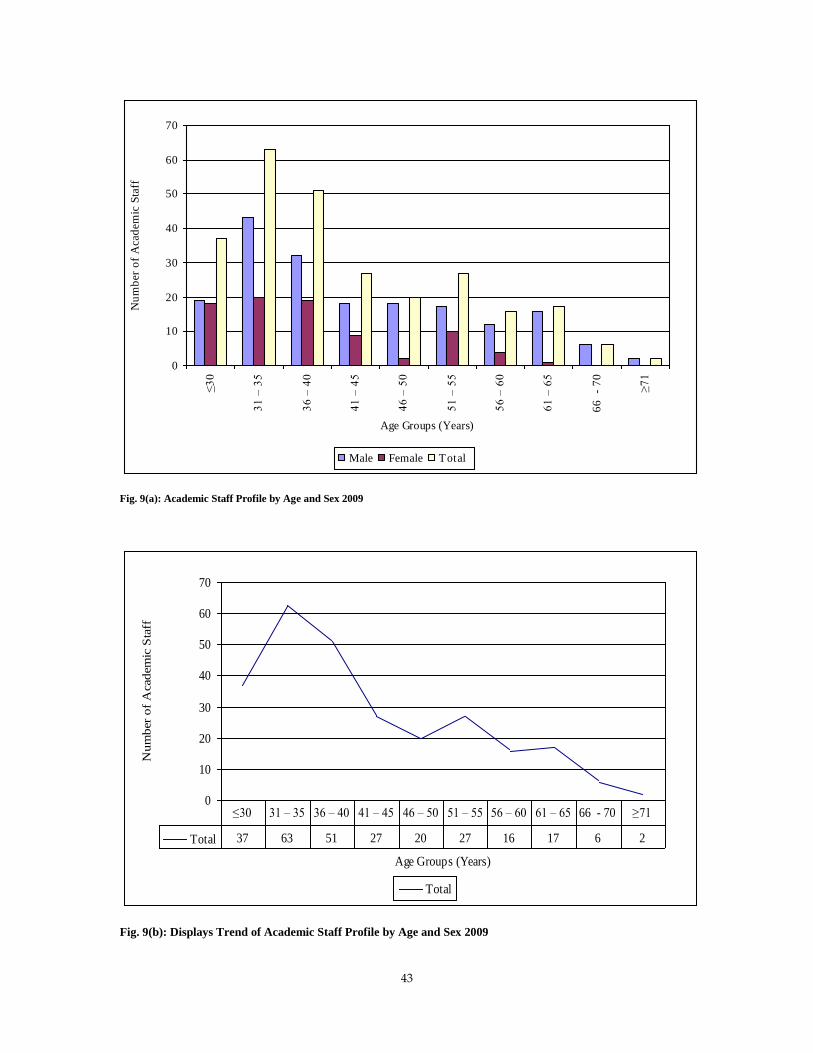
43
0
10
20
30
40
50
60
70
≤3
0
31
– 3
5
36
– 4
0
41
– 4
5
46
– 5
0
51
– 5
5
56
– 6
0
61
– 6
5
66
-
70
≥7
1
Age Groups (Years)
Nu
mb
er
of
Acad
em
ic S
taff
Male Female Total
Fig. 9(a): Academic Staff Profile by Age and Sex 2009
0
10
20
30
40
50
60
70
Age Groups (Years)
Num
ber
of
Academ
ic S
taff
Total
Total 37 63 51 27 20 27 16 17 6 2
≤30 31 – 35 36 – 40 41 – 45 46 – 50 51 – 55 56 – 60 61 – 65 66 - 70 ≥71
Fig. 9(b): Displays Trend of Academic Staff Profile by Age and Sex 2009

44
Table 21: Academic Staff-Student Ratio
Year Active Students (estimated as 60% of
the total enrolment) Academic Staff
Academic Staff Student
Ratio
1994 4596 5 1:919
1995 902 17 1:53
1996 1700 25 1:68
1997 2287 59 1:39
1998 2885 69 1:42
1999 3413 66 1:52
2000 4043 52 1:78
2001 5187 65 1:80
2002 6426 113 1.57
2003 7888 116 1:68
2004 8,454 128 1:66
2005 10,584 174 1:61
2006 13,142 205 1:64
2007 13,800 161 1:86
2007/08 15,200 200 1:76
2008/09 18,900 246 1:77
2009/10 21,600 305 1:71
Table 22: Administrative Staff by Qualifications and Sex 2009
PhD Masters PGD 1st Degree ADV. DIP OD
M F T M F T M F T M F T M F T M F T
0 0 0 11 6 17 3 2 5 20 11 31 7 3 10 12 35 47
Table 22 Contd…
Certificate Form VI Form IV Std VIII STD VII TOTAL
M F T M F T M F T M F T M F T M F T
38 64 102 8 5 13 20 38 58 1 0 1 4 1 5 124 165 289

45
0
20
40
60
80
100
120
PhD Masters PGD 1st Degree Adv Dip OD Certificate Form VI Form IV STD VIII STD VII
Qualification
Nu
mb
er o
f A
dm
inis
trati
ve S
taff
Total
Fig. 10(a): Administrative Staff by Qualifications 2009
0
20
40
60
80
100
120
Qualification
Nu
mb
er
of
Ad
min
istr
ati
ve S
taff
Total
Total 0 17 5 31 10 47 102 13 58 1 5
PhD Masters PGD 1st Degree Adv. Dip OD Certificate Form VI Form IV Std VIII STD VII
Fig. 10(b): Administrative Staff Trend 2009
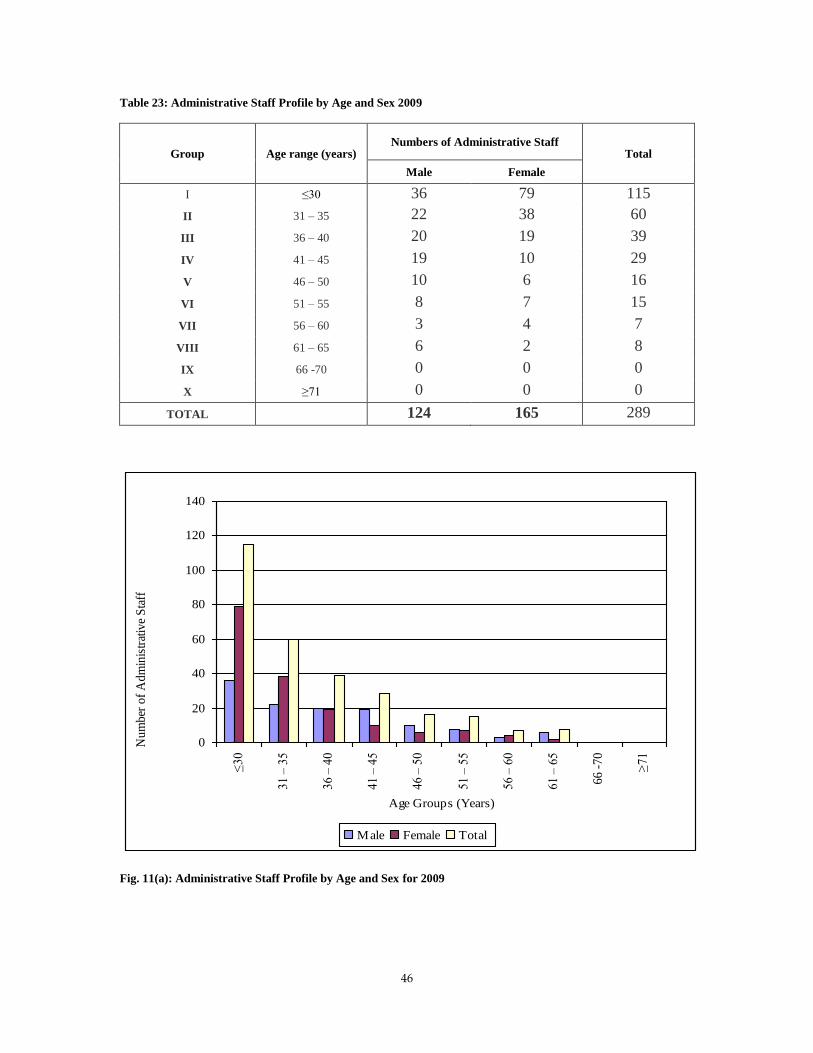
46
Table 23: Administrative Staff Profile by Age and Sex 2009
Group Age range (years) Numbers of Administrative Staff
Total
Male Female
I ≤30 36 79 115
II 31 – 35 22 38 60
III 36 – 40 20 19 39
IV 41 – 45 19 10 29
V 46 – 50 10 6 16
VI 51 – 55 8 7 15
VII 56 – 60 3 4 7
VIII 61 – 65 6 2 8
IX 66 -70 0 0 0
X ≥71 0 0 0
TOTAL 124 165 289
0
20
40
60
80
100
120
140
≤30
31 –
35
36 –
40
41 –
45
46 –
50
51 –
55
56 –
60
61 –
65
66 -
70
≥71
Age Groups (Years)
Num
ber
of
Adm
inis
trat
ive
Sta
ff
Male Female Total
Fig. 11(a): Administrative Staff Profile by Age and Sex for 2009
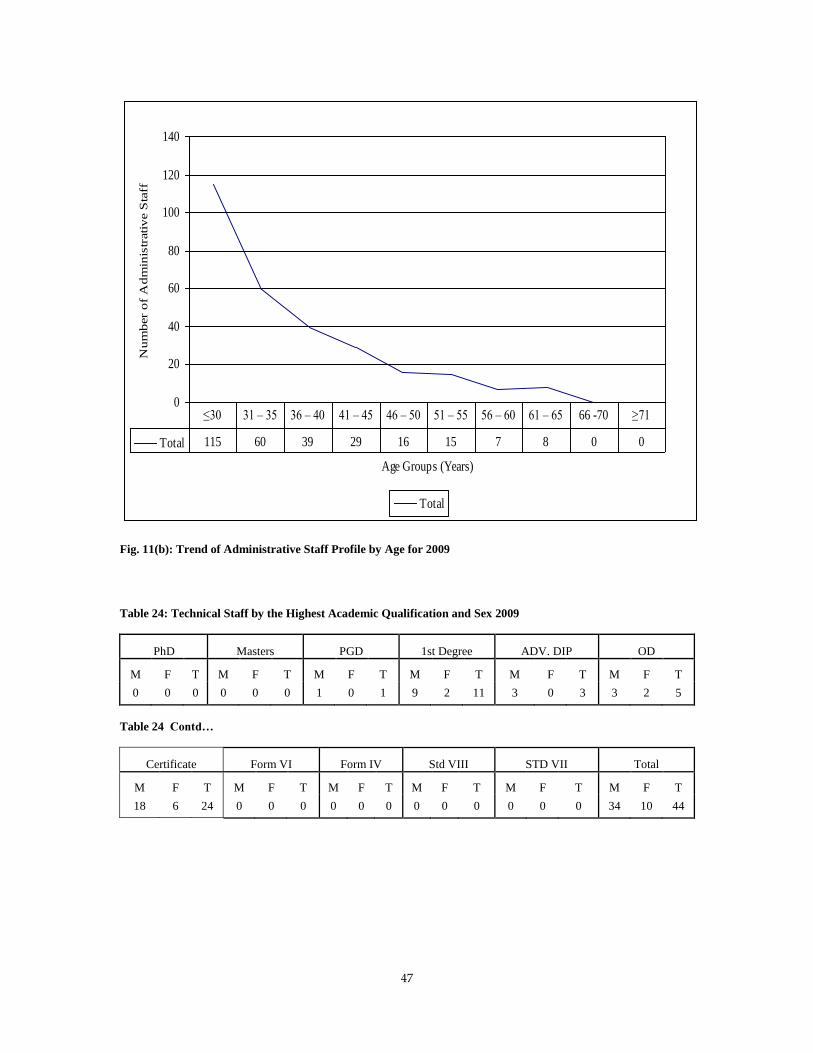
47
0
20
40
60
80
100
120
140
Age Groups (Years)
Nu
mb
er
of
Ad
min
istr
ativ
e S
taff
Total
Total 115 60 39 29 16 15 7 8 0 0
≤30 31 – 35 36 – 40 41 – 45 46 – 50 51 – 55 56 – 60 61 – 65 66 -70 ≥71
Fig. 11(b): Trend of Administrative Staff Profile by Age for 2009
Table 24: Technical Staff by the Highest Academic Qualification and Sex 2009
PhD Masters PGD 1st Degree ADV. DIP OD
M F T M F T M F T M F T M F T M F T
0 0 0 0 0 0 1 0 1 9 2 11 3 0 3 3 2 5
Table 24 Contd…
Certificate Form VI Form IV Std VIII STD VII Total
M F T M F T M F T M F T M F T M F T
18 6 24 0 0 0 0 0 0 0 0 0 0 0 0 34 10 44

48
0
5
10
15
20
25
30
Qualif ications
Num
ber o
f T
echnic
al S
taff
Total
Total 0 0 1 11 3 5 24 0 0 0 0
Ph.D Mastres PGD1st
DegreeAdv Dip OD Cert Form VI Form IV Std VIII Std VII
Fig. 12(a): Technical Staff by the Highest Qualification for 2009
0
5
10
15
20
25
30
Qualif ications
Num
ber
of tr
chnic
al sta
ff
Total
Total 0 0 1 11 3 5 24 0 0 0 0
Ph.D Mastres PGD1st
DegreeAdv Dip OD Cert Form VI Form IV Std VIII Std VII
Fig. 12(b): Technical Staff Trend for 2009
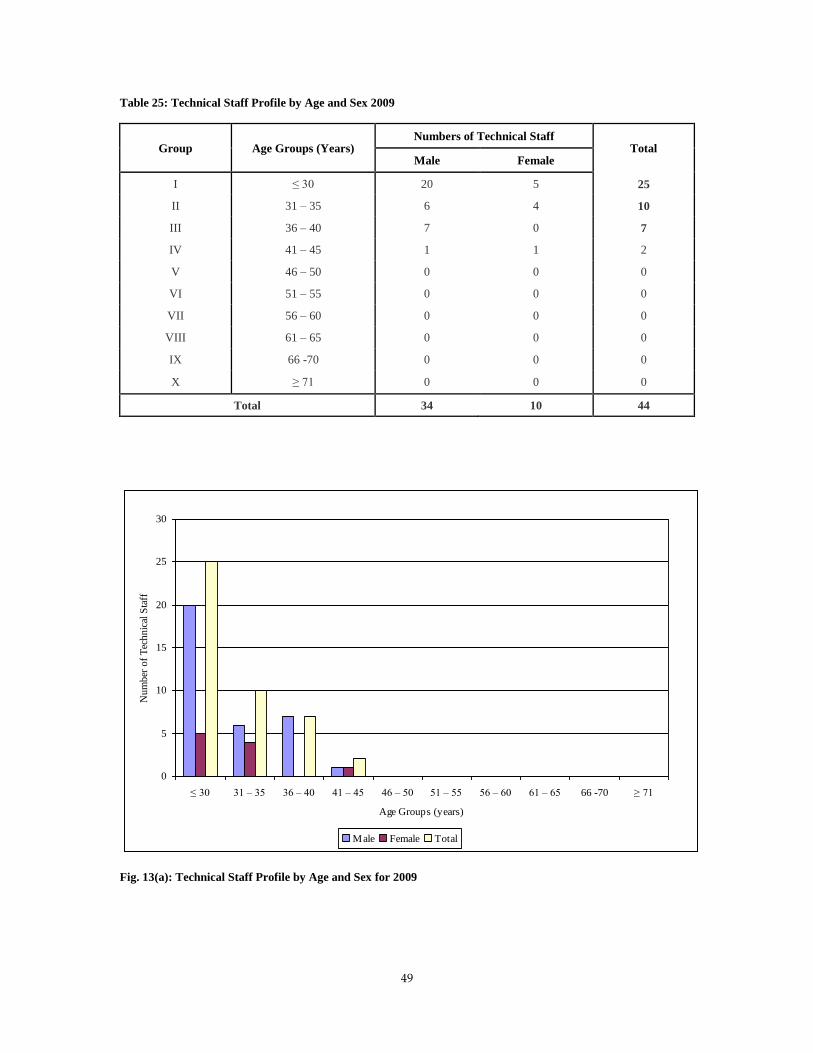
49
Table 25: Technical Staff Profile by Age and Sex 2009
Group Age Groups (Years) Numbers of Technical Staff
Total Male Female
I ≤ 30 20 5 25
II 31 – 35 6 4 10
III 36 – 40 7 0 7
IV 41 – 45 1 1 2
V 46 – 50 0 0 0
VI 51 – 55 0 0 0
VII 56 – 60 0 0 0
VIII 61 – 65 0 0 0
IX 66 -70 0 0 0
X ≥ 71 0 0 0
Total 34 10 44
0
5
10
15
20
25
30
≤ 30 31 – 35 36 – 40 41 – 45 46 – 50 51 – 55 56 – 60 61 – 65 66 -70 ≥ 71
Age Groups (years)
Nu
mb
er o
f T
ech
nic
al S
taff
Male Female Total
Fig. 13(a): Technical Staff Profile by Age and Sex for 2009
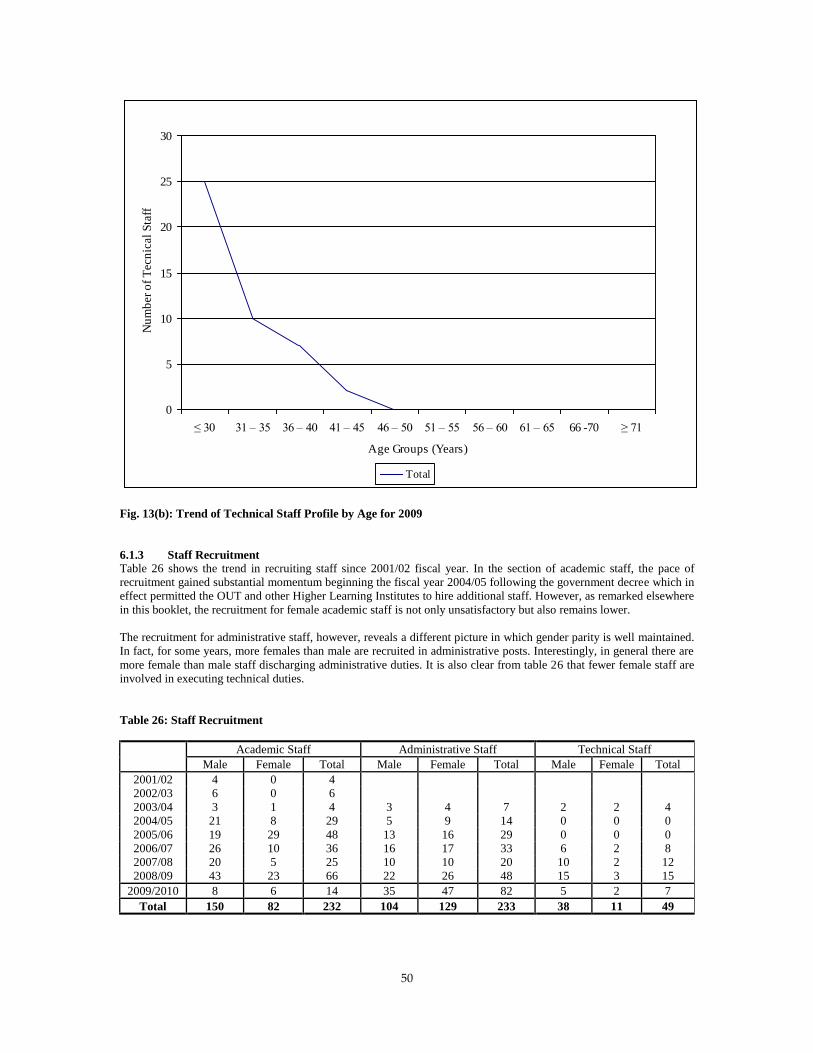
50
0
5
10
15
20
25
30
≤ 30 31 – 35 36 – 40 41 – 45 46 – 50 51 – 55 56 – 60 61 – 65 66 -70 ≥ 71
Age Groups (Years)
Nu
mb
er o
f T
ecn
ical
Sta
ff
Total
Fig. 13(b): Trend of Technical Staff Profile by Age for 2009
6.1.3 Staff Recruitment
Table 26 shows the trend in recruiting staff since 2001/02 fiscal year. In the section of academic staff, the pace of
recruitment gained substantial momentum beginning the fiscal year 2004/05 following the government decree which in
effect permitted the OUT and other Higher Learning Institutes to hire additional staff. However, as remarked elsewhere
in this booklet, the recruitment for female academic staff is not only unsatisfactory but also remains lower.
The recruitment for administrative staff, however, reveals a different picture in which gender parity is well maintained.
In fact, for some years, more females than male are recruited in administrative posts. Interestingly, in general there are
more female than male staff discharging administrative duties. It is also clear from table 26 that fewer female staff are
involved in executing technical duties.
Table 26: Staff Recruitment
Academic Staff Administrative Staff Technical Staff
Male Female Total Male Female Total Male Female Total
2001/02 4 0 4
2002/03 6 0 6
2003/04 3 1 4 3 4 7 2 2 4
2004/05 21 8 29 5 9 14 0 0 0
2005/06 19 29 48 13 16 29 0 0 0
2006/07 26 10 36 16 17 33 6 2 8
2007/08 20 5 25 10 10 20 10 2 12
2008/09 43 23 66 22 26 48 15 3 15
2009/2010 8 6 14 35 47 82 5 2 7
Total 150 82 232 104 129 233 38 11 49
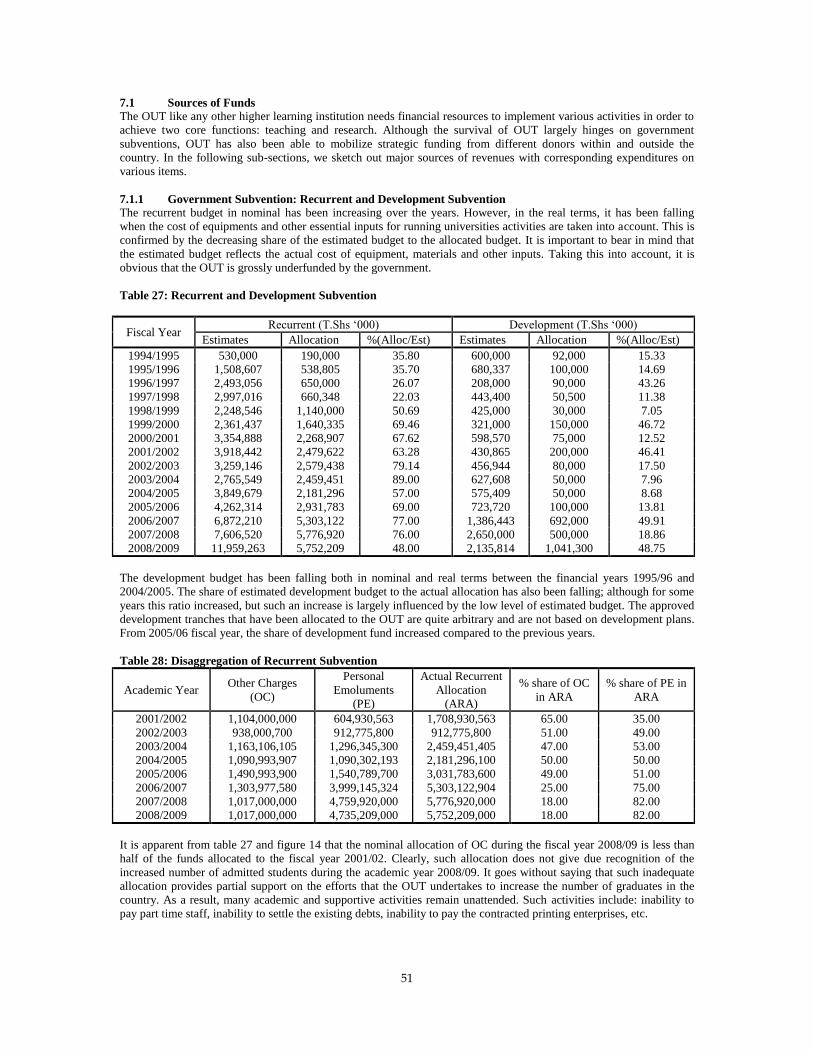
51
7.1 Sources of Funds
The OUT like any other higher learning institution needs financial resources to implement various activities in order to
achieve two core functions: teaching and research. Although the survival of OUT largely hinges on government
subventions, OUT has also been able to mobilize strategic funding from different donors within and outside the
country. In the following sub-sections, we sketch out major sources of revenues with corresponding expenditures on
various items.
7.1.1 Government Subvention: Recurrent and Development Subvention
The recurrent budget in nominal has been increasing over the years. However, in the real terms, it has been falling
when the cost of equipments and other essential inputs for running universities activities are taken into account. This is
confirmed by the decreasing share of the estimated budget to the allocated budget. It is important to bear in mind that
the estimated budget reflects the actual cost of equipment, materials and other inputs. Taking this into account, it is
obvious that the OUT is grossly underfunded by the government.
Table 27: Recurrent and Development Subvention
Fiscal Year Recurrent (T.Shs ‘000) Development (T.Shs ‘000)
Estimates Allocation %(Alloc/Est) Estimates Allocation %(Alloc/Est)
1994/1995 530,000 190,000 35.80 600,000 92,000 15.33
1995/1996 1,508,607 538,805 35.70 680,337 100,000 14.69
1996/1997 2,493,056 650,000 26.07 208,000 90,000 43.26
1997/1998 2,997,016 660,348 22.03 443,400 50,500 11.38
1998/1999 2,248,546 1,140,000 50.69 425,000 30,000 7.05
1999/2000 2,361,437 1,640,335 69.46 321,000 150,000 46.72
2000/2001 3,354,888 2,268,907 67.62 598,570 75,000 12.52
2001/2002 3,918,442 2,479,622 63.28 430,865 200,000 46.41
2002/2003 3,259,146 2,579,438 79.14 456,944 80,000 17.50
2003/2004 2,765,549 2,459,451 89.00 627,608 50,000 7.96
2004/2005 3,849,679 2,181,296 57.00 575,409 50,000 8.68
2005/2006 4,262,314 2,931,783 69.00 723,720 100,000 13.81
2006/2007 6,872,210 5,303,122 77.00 1,386,443 692,000 49.91
2007/2008 7,606,520 5,776,920 76.00 2,650,000 500,000 18.86
2008/2009 11,959,263 5,752,209 48.00 2,135,814 1,041,300 48.75
The development budget has been falling both in nominal and real terms between the financial years 1995/96 and
2004/2005. The share of estimated development budget to the actual allocation has also been falling; although for some
years this ratio increased, but such an increase is largely influenced by the low level of estimated budget. The approved
development tranches that have been allocated to the OUT are quite arbitrary and are not based on development plans.
From 2005/06 fiscal year, the share of development fund increased compared to the previous years.
Table 28: Disaggregation of Recurrent Subvention
Academic Year Other Charges
(OC)
Personal
Emoluments
(PE)
Actual Recurrent
Allocation
(ARA)
% share of OC
in ARA
% share of PE in
ARA
2001/2002 1,104,000,000 604,930,563 1,708,930,563 65.00 35.00
2002/2003 938,000,700 912,775,800 912,775,800 51.00 49.00
2003/2004 1,163,106,105 1,296,345,300 2,459,451,405 47.00 53.00
2004/2005 1,090,993,907 1,090,302,193 2,181,296,100 50.00 50.00
2005/2006 1,490,993,900 1,540,789,700 3,031,783,600 49.00 51.00
2006/2007 1,303,977,580 3,999,145,324 5,303,122,904 25.00 75.00
2007/2008 1,017,000,000 4,759,920,000 5,776,920,000 18.00 82.00
2008/2009 1,017,000,000 4,735,209,000 5,752,209,000 18.00 82.00
It is apparent from table 27 and figure 14 that the nominal allocation of OC during the fiscal year 2008/09 is less than
half of the funds allocated to the fiscal year 2001/02. Clearly, such allocation does not give due recognition of the
increased number of admitted students during the academic year 2008/09. It goes without saying that such inadequate
allocation provides partial support on the efforts that the OUT undertakes to increase the number of graduates in the
country. As a result, many academic and supportive activities remain unattended. Such activities include: inability to
pay part time staff, inability to settle the existing debts, inability to pay the contracted printing enterprises, etc.
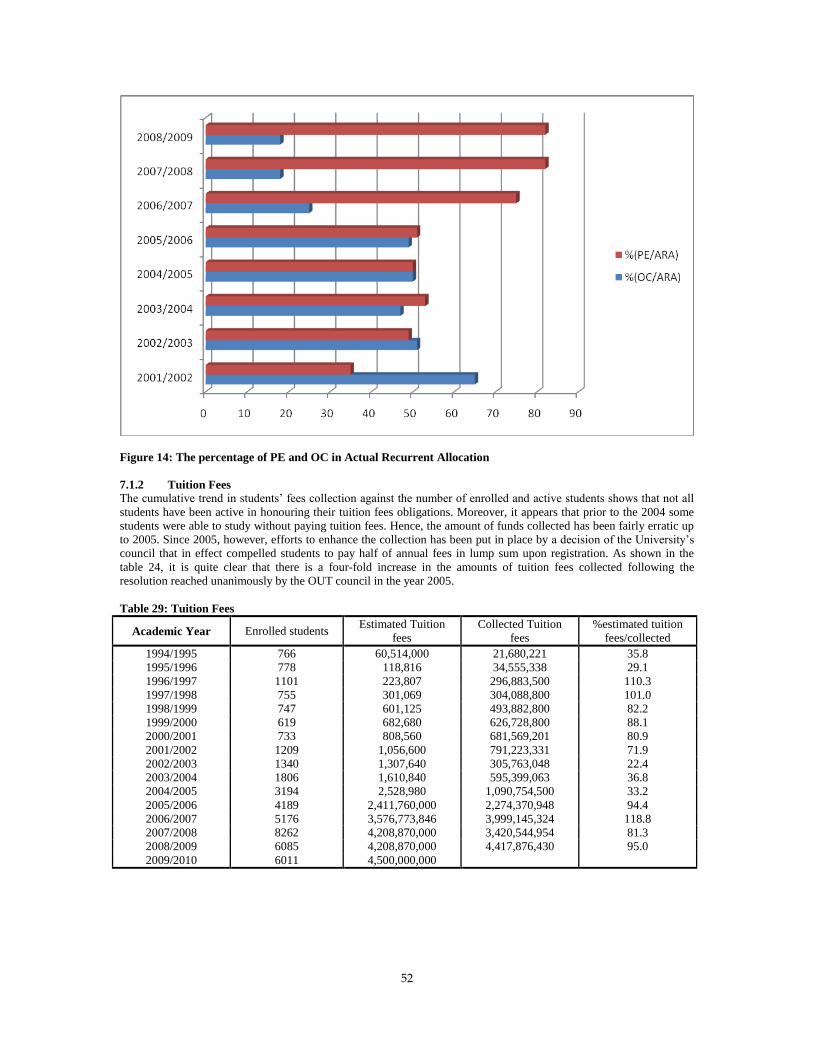
52
Figure 14: The percentage of PE and OC in Actual Recurrent Allocation
7.1.2 Tuition Fees
The cumulative trend in students’ fees collection against the number of enrolled and active students shows that not all
students have been active in honouring their tuition fees obligations. Moreover, it appears that prior to the 2004 some
students were able to study without paying tuition fees. Hence, the amount of funds collected has been fairly erratic up
to 2005. Since 2005, however, efforts to enhance the collection has been put in place by a decision of the University’s
council that in effect compelled students to pay half of annual fees in lump sum upon registration. As shown in the
table 24, it is quite clear that there is a four-fold increase in the amounts of tuition fees collected following the
resolution reached unanimously by the OUT council in the year 2005.
Table 29: Tuition Fees
Academic Year Enrolled students Estimated Tuition
fees
Collected Tuition
fees
%estimated tuition
fees/collected
1994/1995 766 60,514,000 21,680,221 35.8
1995/1996 778 118,816 34,555,338 29.1
1996/1997 1101 223,807 296,883,500 110.3
1997/1998 755 301,069 304,088,800 101.0
1998/1999 747 601,125 493,882,800 82.2
1999/2000 619 682,680 626,728,800 88.1
2000/2001 733 808,560 681,569,201 80.9
2001/2002 1209 1,056,600 791,223,331 71.9
2002/2003 1340 1,307,640 305,763,048 22.4
2003/2004 1806 1,610,840 595,399,063 36.8
2004/2005 3194 2,528,980 1,090,754,500 33.2
2005/2006 4189 2,411,760,000 2,274,370,948 94.4
2006/2007 5176 3,576,773,846 3,999,145,324 118.8
2007/2008 8262 4,208,870,000 3,420,544,954 81.3
2008/2009 6085 4,208,870,000 4,417,876,430 95.0
2009/2010 6011 4,500,000,000
53
7.1.3 Donor Funds and Research Grants
The OUT has immensely benefited from the generous support in terms of donor finance and research grants which have
played a monumental role in sustaining the core and other strategic functions. The OUT is highly grateful for the
financial contributions from various partners.
As mentioned earlier, over the last six years the OUT has mobilized funds from various donors in its endeavour to
implement different programmes. Although the accumulated fund in the year 2005 was less than a half of that
mobilized in the year 2004, the overall trend indicates an upward path even when the rate of inflation is taken account.
When the year 2005 is taken as a baseline, it is clear from Table 25 that during the year 2006, donor fund almost
quadrupled, it increased more than twenty times in 2007, and more than seventy times in 2009.
Figure 15 plots financial support from various donors. The World Bank ranks at the top followed by Swedish Internal
Development Agency in the second position. These two donors (i.e., World Bank and SIDA) have offered more than
three billions Tanzanian shillings. The World Bank supports the OUT in building capacity in the field of tourism,
Science education, postgraduate scholarships and procurement of textbooks. The overall objective of SIDA financial
support is to strengthen the educational delivery capacity through enhanced organisational development and effective
exploitation of ICT resources and services.
Other donors ranked in the top five positions are: SIDA, The Open University of UK, Association of Commonwealth
Universities(ACU), the Rockefeller Foundation of US and UNESCO. The Open University of UK generously
supported the integration of TESSA (Teachers Education in Sub-Saharan Africa) materials into the open and distance
learning style with a Tanzanian flavor. TESSA is a consortium of 18 teaching institutions in Africa, in which the OUT
is a member. TESSA offers a range of materials (Open Educational Resources) to support school based teacher
education and training. Through this venture, the OUT is now fully engaged in providing training all over the country
that leads to the award of Diploma for Primary Teachers Education (DPTE).
The Rockefeller foundation’s grant in the year 2004 had two major goals. The first goal involved a survey on the need
assessment that would ultimately enable the OUT to cascade the Community Economic Development (CED)
programme to the ward executive levels. USAID also provided a one time grant of US $ 99,925 to SNHU to support
establishment of the CED programme. Part of the grant was also allocated to carry out a survey on need assessment in
order to set out clear guides in supporting local government reforms programmes in terms of providing short training to
local government officials as part of capacity building.
The OUT also received grants from Commonwealth (CYP), London to facilitate training programme in Youth
Development and Work. The disbursed tranchees have been used to regularly review and update teaching and learning
materials, staff emoluments, workshops and seminars. The IUCEA has been pivotal in supporting research for a
number of academic staff under the umbrella of the Lake Victoria Research Initiative (VicRes). In short, VicRes is a
regional research initiative that is concerned with issues related to poverty eradication, sustainable livelihood and
natural resources management within the Lake Victoria Basin. The project aims to promote sustainable livelihood and
natural resources management in the Lake Victoria Basin and to re-invigorate research and stimulate discussions on
issues that affect people and environment of the Lake Victoria Basin. The following themes are rigorously researched
by OUT staff: Gender Tenure System and People Living in the Wetlands of Lake Victoria Basin; Pastoralist
transformation in Kagera sub-basin; Environmental Lead Pollution and Food safety in the Lake Victoria; Assessment
of land use/land cover changes in Lake Victoria basin; and Nutrition enhancement project in Lake Victoria basin
In 2005, the Australian government gave the OUT grant to develop learning materials for certificate and Diploma
course in Poultry production. In September 2005, German International also joined the Australian government to
support project on poultry production.
The David Anderson Africa Trust (DAAT) is a charity organization based in the United Kingdom. set up an Audio
Recording Studio which will be used to record into cassette degree courses and teaching instructions to be offered to
the visually impaired and print disabled students. Also for some years the organization has been supporting financially
10 women students studying at the Open University of Tanzania.
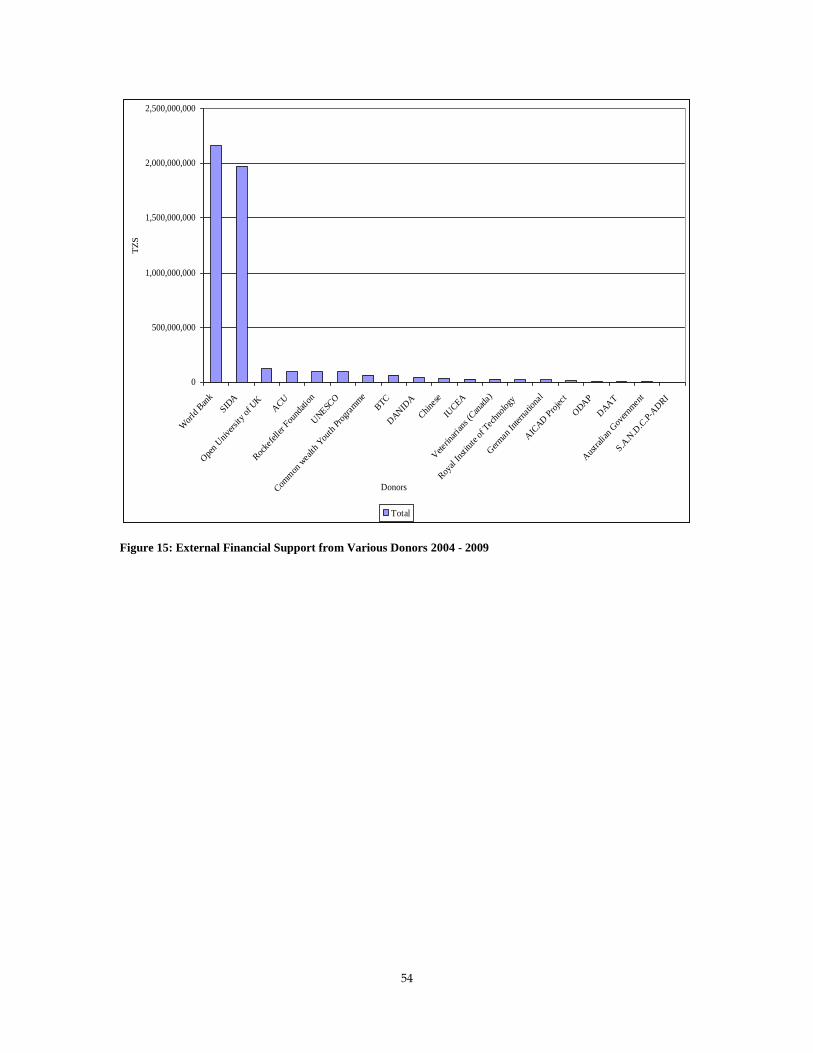
54
0
500,000,000
1,000,000,000
1,500,000,000
2,000,000,000
2,500,000,000
Wor
ld B
ank
SID
A
Ope
n U
nive
rsity
of U
KA
CU
Roc
kefe
ller F
ound
atio
n
UNESC
O
Com
mon
wea
lth Y
outh
Pro
gram
me
BTC
DAN
IDA
Chi
nese
IUCEA
Veter
inar
ians
(Can
ada)
Roy
al In
stitu
te o
f Tec
hnol
ogy
Ger
man
Intern
atio
nal
AIC
AD
Pro
ject
ODA
P
DAA
T
Aus
tralia
n G
over
nmen
t
S.A.N
.D.C
.P-A
DRI
Donors
TZ
S
Total
Figure 15: External Financial Support from Various Donors 2004 - 2009

55
Table 30: Grants from International Donors
Year Source of Grant Grant
2004 Rockefeller Foundation 94,500,000.00
106,355,000.00 Association of Commonwealth Universities(ACU) 11,855,000
2005
Australian Government 4,609,500.00
46,935,899.00
German International 21,504,000.00
Open University of UK 5,397,399.00
S.A.N.D.C.P-ADRI 3,570,000.00
Association of Commonwealth Universities(ACU) 11,855,000
2006
Open University of UK 89,496,298.20
167,190,186.72
Common wealth Youth Programme 19,264,312.00
Inter Universities Council for East Africa-IUCEA 10,926,386.52
AICAD Project 11,938,190.00
Association of Commonwealth Universities(ACU) 35,565,000
2007
Royal Institute of Technology 22,604,627.72
1,060,997,889.58
Common wealth Youth Programme 25,485,749.60
Inter Universities Council for East Africa-IUCEA 6,466,000.00
SIDA 890,607,349.26
ODAP 9,917,943.00
Open University of UK 5,830,000.00
UNESCO 88,231,220.00
Association of Commonwealth Universities(ACU) 11,855,000
2008
Common wealth Youth Programme 19,922,615.20
865,319,939.40
Veterinarians (Canada) 15,640,512.00
Inter Universities Council for East Africa-IUCEA 14,894,060.00
UNESCO 3,845,330.20
David Anderson Trust Fund-DAAT 6,481,105.00
SIDA 757,862,000.00
Open University of UK 22,964,317.00
Association of Commonwealth Universities(ACU) 23,710,000
2009
Veterinarians (Canada) 11,799,368.80
2,635,280,951.30
World Bank 2,157,172,582.50
SIDA 322,000,000.00
DANIDA 44,710,800.00
Chinese 35,565,000
BTC 64,033,200
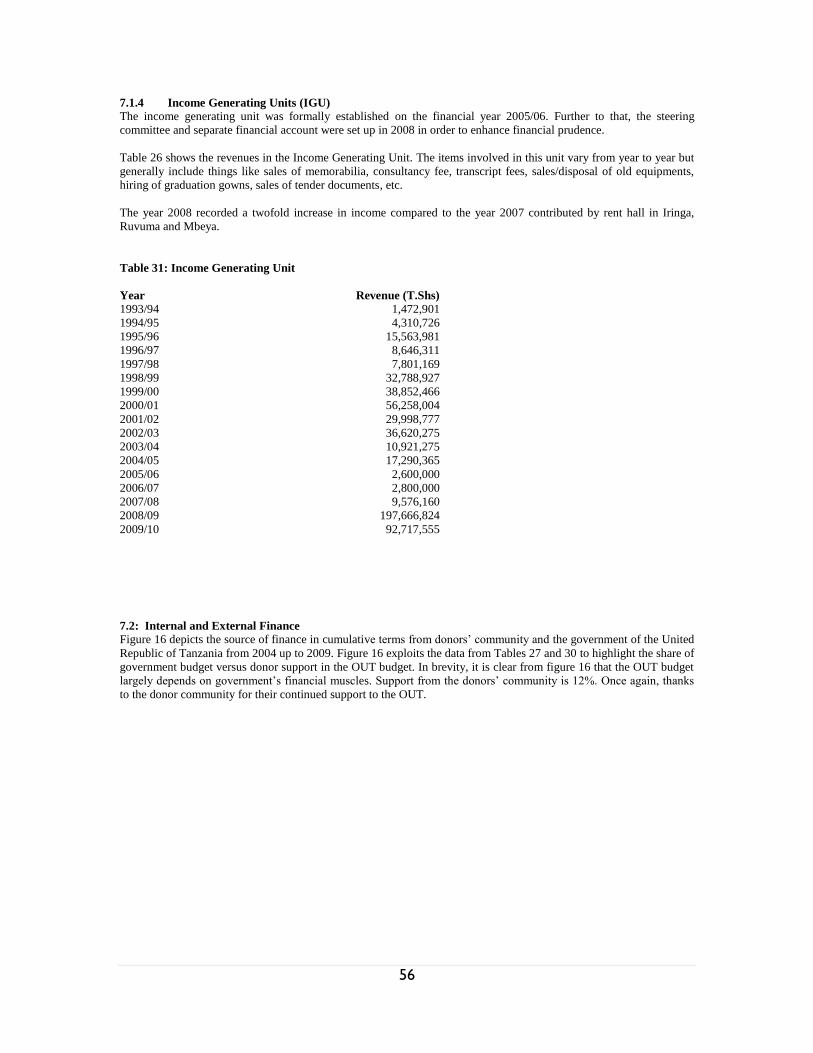
56
7.1.4 Income Generating Units (IGU)
The income generating unit was formally established on the financial year 2005/06. Further to that, the steering
committee and separate financial account were set up in 2008 in order to enhance financial prudence.
Table 26 shows the revenues in the Income Generating Unit. The items involved in this unit vary from year to year but
generally include things like sales of memorabilia, consultancy fee, transcript fees, sales/disposal of old equipments,
hiring of graduation gowns, sales of tender documents, etc.
The year 2008 recorded a twofold increase in income compared to the year 2007 contributed by rent hall in Iringa,
Ruvuma and Mbeya.
Table 31: Income Generating Unit
Year Revenue (T.Shs)
1993/94 1,472,901
1994/95 4,310,726
1995/96 15,563,981
1996/97 8,646,311
1997/98 7,801,169
1998/99 32,788,927
1999/00 38,852,466
2000/01 56,258,004
2001/02 29,998,777
2002/03 36,620,275
2003/04 10,921,275
2004/05 17,290,365
2005/06 2,600,000
2006/07 2,800,000
2007/08 9,576,160
2008/09 197,666,824
2009/10 92,717,555
7.2: Internal and External Finance
Figure 16 depicts the source of finance in cumulative terms from donors’ community and the government of the United
Republic of Tanzania from 2004 up to 2009. Figure 16 exploits the data from Tables 27 and 30 to highlight the share of
government budget versus donor support in the OUT budget. In brevity, it is clear from figure 16 that the OUT budget
largely depends on government’s financial muscles. Support from the donors’ community is 12%. Once again, thanks
to the donor community for their continued support to the OUT.
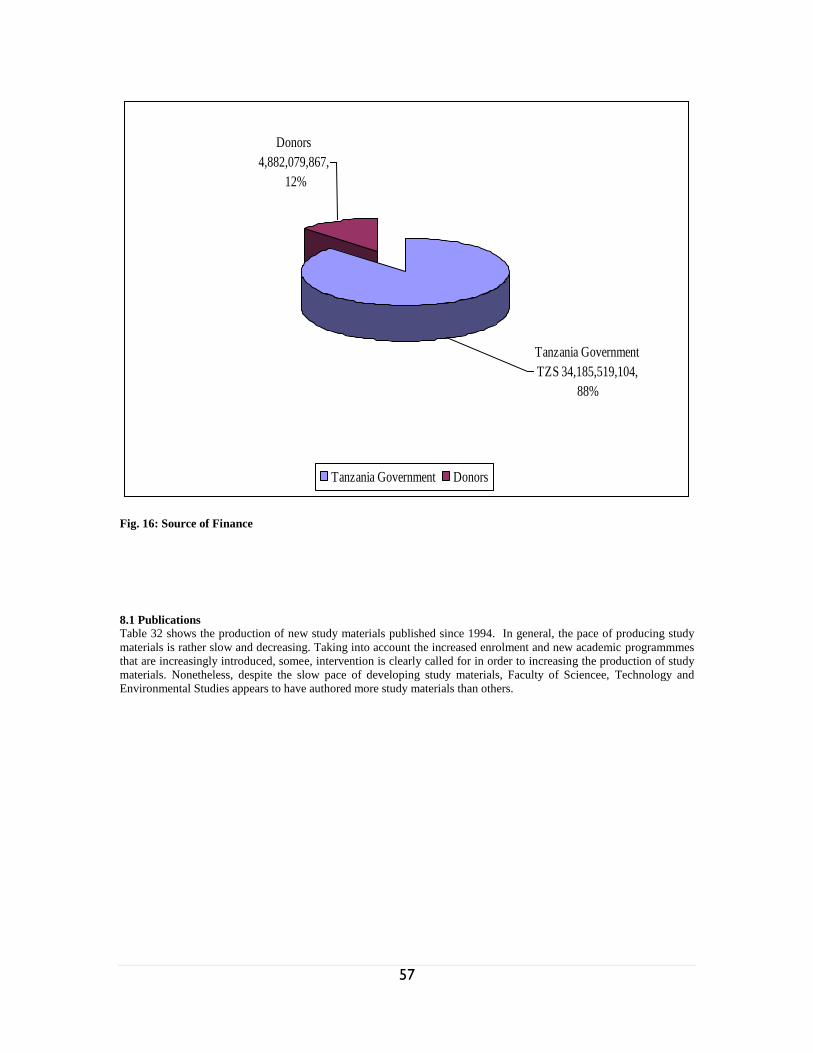
57
Tanzania Government
TZS 34,185,519,104,
88%
Donors
4,882,079,867,
12%
Tanzania Government Donors
Fig. 16: Source of Finance
8.1 Publications
Table 32 shows the production of new study materials published since 1994. In general, the pace of producing study
materials is rather slow and decreasing. Taking into account the increased enrolment and new academic programmmes
that are increasingly introduced, somee, intervention is clearly called for in order to increasing the production of study
materials. Nonetheless, despite the slow pace of developing study materials, Faculty of Sciencee, Technology and
Environmental Studies appears to have authored more study materials than others.
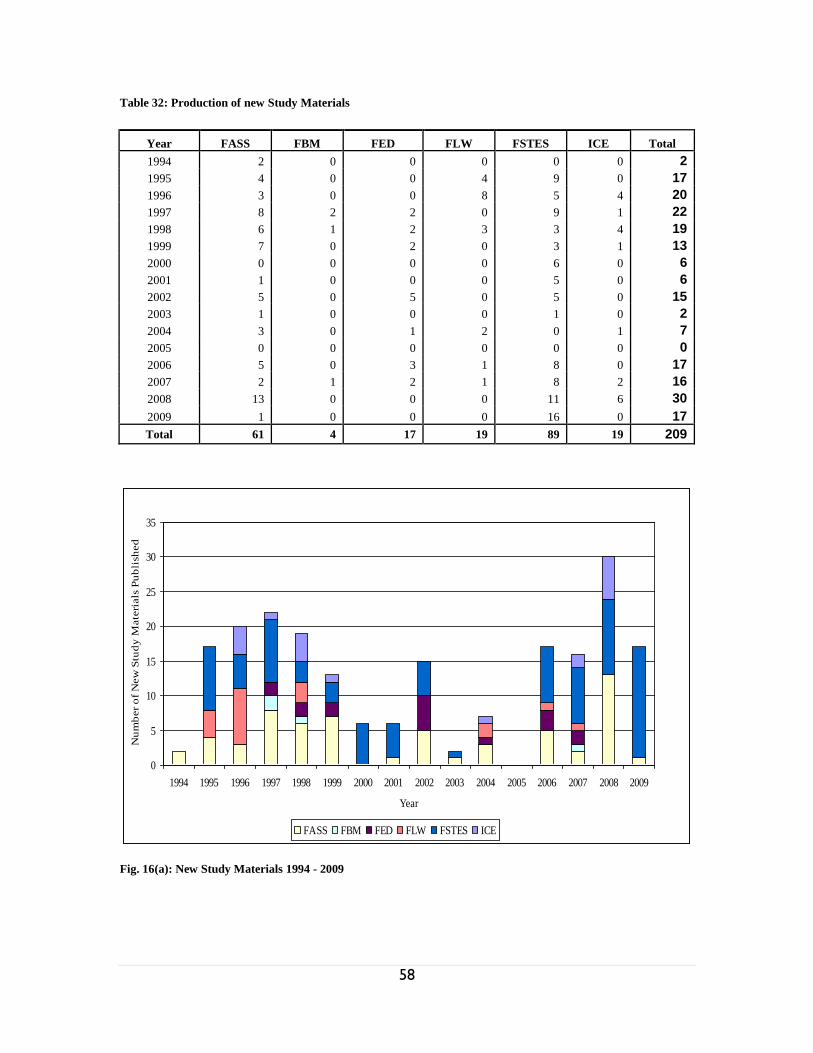
58
Table 32: Production of new Study Materials
Year FASS FBM FED FLW FSTES ICE Total
1994 2 0 0 0 0 0 2
1995 4 0 0 4 9 0 17
1996 3 0 0 8 5 4 20
1997 8 2 2 0 9 1 22
1998 6 1 2 3 3 4 19
1999 7 0 2 0 3 1 13
2000 0 0 0 0 6 0 6
2001 1 0 0 0 5 0 6
2002 5 0 5 0 5 0 15
2003 1 0 0 0 1 0 2
2004 3 0 1 2 0 1 7
2005 0 0 0 0 0 0 0
2006 5 0 3 1 8 0 17
2007 2 1 2 1 8 2 16
2008 13 0 0 0 11 6 30
2009 1 0 0 0 16 0 17
Total 61 4 17 19 89 19 209
0
5
10
15
20
25
30
35
1994 1995 1996 1997 1998 1999 2000 2001 2002 2003 2004 2005 2006 2007 2008 2009
Year
Nu
mb
er
of
New
Stu
dy
Mate
rials
Pu
bli
shed
FASS FBM FED FLW FSTES ICE
Fig. 16(a): New Study Materials 1994 - 2009
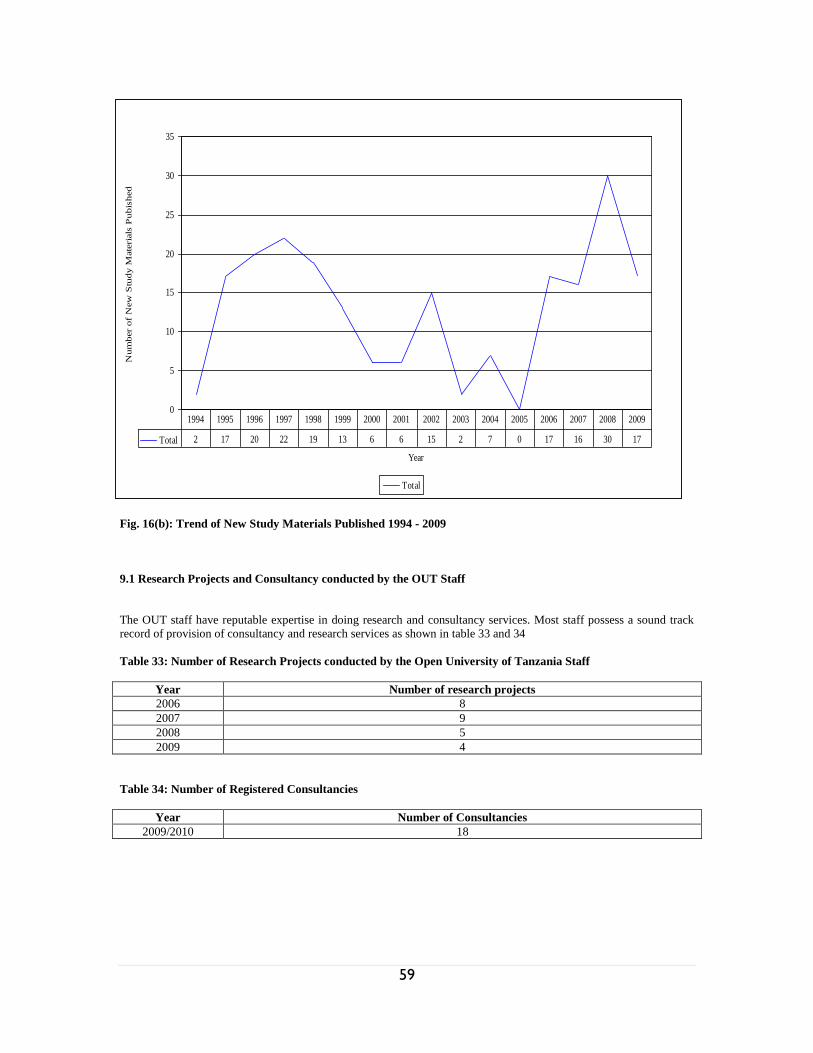
59
0
5
10
15
20
25
30
35
Year
Num
ber
of
New
Stu
dy M
ate
rials
Pubis
hed
Total
Total 2 17 20 22 19 13 6 6 15 2 7 0 17 16 30 17
1994 1995 1996 1997 1998 1999 2000 2001 2002 2003 2004 2005 2006 2007 2008 2009
Fig. 16(b): Trend of New Study Materials Published 1994 - 2009
9.1 Research Projects and Consultancy conducted by the OUT Staff
The OUT staff have reputable expertise in doing research and consultancy services. Most staff possess a sound track
record of provision of consultancy and research services as shown in table 33 and 34
Table 33: Number of Research Projects conducted by the Open University of Tanzania Staff
Year Number of research projects
2006 8
2007 9
2008 5
2009 4
Table 34: Number of Registered Consultancies
Year Number of Consultancies
2009/2010 18
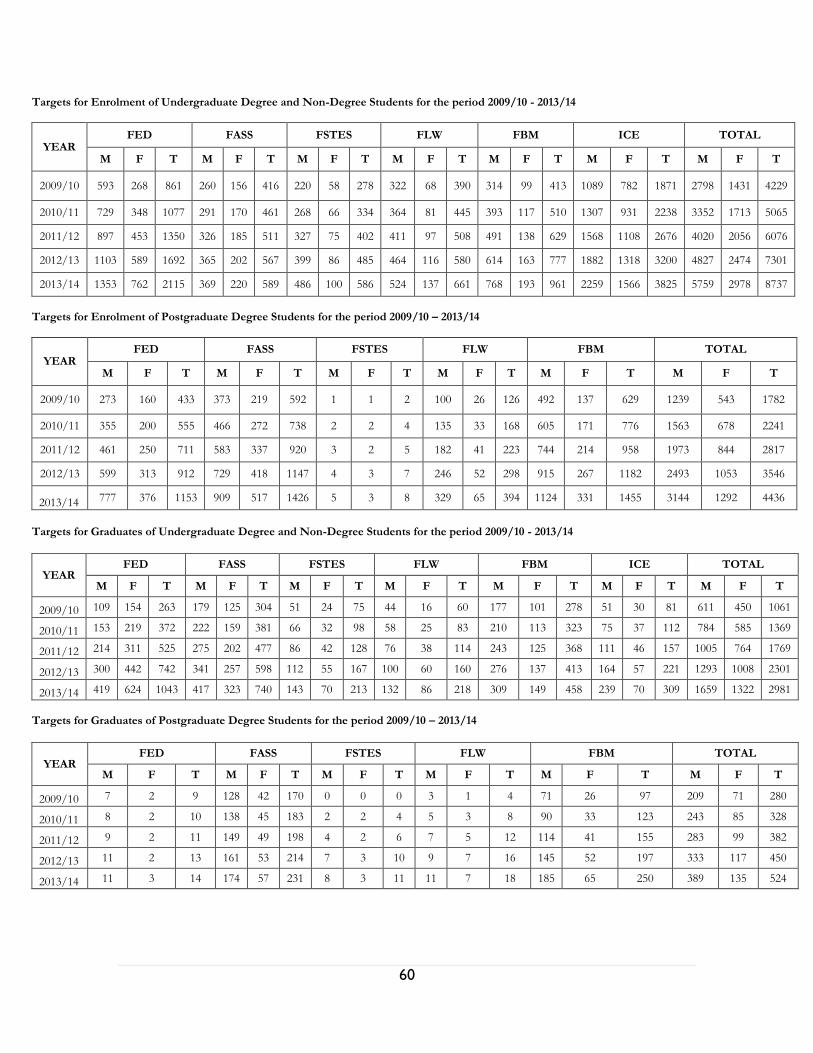
60
Targets for Enrolment of Undergraduate Degree and Non-Degree Students for the period 2009/10 - 2013/14
YEAR FED FASS FSTES FLW FBM ICE TOTAL
M F T M F T M F T M F T M F T M F T M F T
2009/10 593 268 861 260 156 416 220 58 278 322 68 390 314 99 413 1089 782 1871 2798 1431 4229
2010/11 729 348 1077 291 170 461 268 66 334 364 81 445 393 117 510 1307 931 2238 3352 1713 5065
2011/12 897 453 1350 326 185 511 327 75 402 411 97 508 491 138 629 1568 1108 2676 4020 2056 6076
2012/13 1103 589 1692 365 202 567 399 86 485 464 116 580 614 163 777 1882 1318 3200 4827 2474 7301
2013/14 1353 762 2115 369 220 589 486 100 586 524 137 661 768 193 961 2259 1566 3825 5759 2978 8737
Targets for Enrolment of Postgraduate Degree Students for the period 2009/10 – 2013/14
YEAR FED FASS FSTES FLW FBM TOTAL
M F T M F T M F T M F T M F T M F T
2009/10 273 160 433 373 219 592 1 1 2 100 26 126 492 137 629 1239 543 1782
2010/11 355 200 555 466 272 738 2 2 4 135 33 168 605 171 776 1563 678 2241
2011/12 461 250 711 583 337 920 3 2 5 182 41 223 744 214 958 1973 844 2817
2012/13 599 313 912 729 418 1147 4 3 7 246 52 298 915 267 1182 2493 1053 3546
2013/14 777 376 1153 909 517 1426 5 3 8 329 65 394 1124 331 1455 3144 1292 4436
Targets for Graduates of Undergraduate Degree and Non-Degree Students for the period 2009/10 - 2013/14
YEAR FED FASS FSTES FLW FBM ICE TOTAL
M F T M F T M F T M F T M F T M F T M F T
2009/10 109 154 263 179 125 304 51 24 75 44 16 60 177 101 278 51 30 81 611 450 1061
2010/11 153 219 372 222 159 381 66 32 98 58 25 83 210 113 323 75 37 112 784 585 1369
2011/12 214 311 525 275 202 477 86 42 128 76 38 114 243 125 368 111 46 157 1005 764 1769
2012/13 300 442 742 341 257 598 112 55 167 100 60 160 276 137 413 164 57 221 1293 1008 2301
2013/14 419 624 1043 417 323 740 143 70 213 132 86 218 309 149 458 239 70 309 1659 1322 2981
Targets for Graduates of Postgraduate Degree Students for the period 2009/10 – 2013/14
YEAR FED FASS FSTES FLW FBM TOTAL
M F T M F T M F T M F T M F T M F T
2009/10 7 2 9 128 42 170 0 0 0 3 1 4 71 26 97 209 71 280
2010/11 8 2 10 138 45 183 2 2 4 5 3 8 90 33 123 243 85 328
2011/12 9 2 11 149 49 198 4 2 6 7 5 12 114 41 155 283 99 382
2012/13 11 2 13 161 53 214 7 3 10 9 7 16 145 52 197 333 117 450
2013/14 11 3 14 174 57 231 8 3 11 11 7 18 185 65 250 389 135 524

61
Income Projection for the period 2009/10 - 2012/13
Academic Year
Recurrent Subvention Development Subvention
Tuition Fees Foreign Grants Other Incomes
OC PE
2009/2010 1,017,000,000 6,390,587,500 2,241,300,000 3,920,000,000 2,535,682,751 526,665,560
2010/2011 1,017,000,000 11,832,945,716 2,292,000,000 4,683,381,762 2,547,734,948 669,514,868
2011/2012 9,793,089,500 17,349,175,625 2,342,700,000 5,446,763,524 2,559,787,145 812,364,176
2012/2013 11,262,052,925 18,451,551,969 2,393,400,000 6,210,145,286 2,571,839,342 955,213,485
2013/2014 12,731,016,350 19,553,928,313 2,444,100,000 6,973,527,048 2,583,891,539 1,098,062,793


