Embed Size (px)
Citation preview

THE MODERATING EFFECTS OF HEALTHY VALUE CONGRUENCE ON THE
ROLE STRESSOR- STRAIN RELATIONSHIP
A Thesis
Presented to
The Faculty of the Division of Applied Behavioral Sciences
University of Baltimore
In Partial Fulfillment
Of the Requirements for the Degree of
Master of Science
by
Krystal N. Roach
August 2018

© 2018
Krystal N. Roach
ALL RIGHTS RESERVED

The Designated Thesis Committee Approves the Thesis Titled
THE MODERATING EFFECTS OF HEALTHY VALUE CONGRUENCE ON THE
ROLE STRESSOR- STRAIN RELATIONSHIP
by
Krystal N. Roach
APPROVED FOR THE DIVISION OF APPLIED BEHAVIORAL SCIENCES
UNIVERSITY OF BALTIMORE
August 2018
Sharon Glazer, Ph.D., Thesis Chair University of Baltimore
Terry A. Beehr, Ph.D., Second Reader Central Michigan University

ABSTRACT
THE MODERATING EFFECTS OF HEALTHY VALUE CONGRUENCE ON THE
ROLE STRESSOR- STRAIN RELATIONSHIP
by Krystal N. Roach
This study examines the moderating effects of healthy value congruence on the
relationship between role stressors (i.e., role ambiguity, role conflict, and role
overload) and outcome variables (i.e., burnout and turnover intention) in 98 nurses.
Utilizing a growth and deficiency needs foundation, it was proposed that individuals
who endorse healthy value types, would report lower levels of burnout and turnover
intention than individuals who endorsed unhealthy value types. Furthermore, based in
Person-Environment Fit theory, it was predicted that individuals who endorsed healthy
values to a similar extent that they perceived their organization endorsed healthy
values (i.e., value congruence) would report lower levels of burnout and turnover
intention than individuals whose healthy values were incongruent from the perceived
organizational values. Results indicated mixed findings. Although some value types
received support (e.g., benevolence), others did not relate to burnout and turnover
intention as proposed. Furthermore, although value congruence generally acted as a
buffer of the stressor-strain relationship, in some cases, it was related to higher levels
of poor outcomes. The findings of this study suggest that the stressor-strain
relationship depends on the context of the (a) stressors, (b) strains, and (c) values
studied.

ACKNOWLEDGEMENTS
Completing this thesis has been both the most challenging and satisfying thing I
have done in my life so far. First, I would like to thank my thesis advisor, Dr. Sharon
Glazer. I appreciate your feedback, motivation, and honesty. Throughout the process of
writing my thesis I learned so much about the writing process and myself, and it wouldn’t
have been possible without your help. Thank you for holding me accountable for my
work. Second, I would like to thank my second reader, Dr. Terry Beehr, for your keen
eye and encouragement, and all of the faculty at both University of Baltimore and Central
Michigan University, who have given me suggestions, and listened to me complain.
Third, thank you to Dr. Katherine Cameron, who encouraged me to pursue graduate
school and gave me the foundation that helped make it possible.
Next, I would like to thank my parents, Joseph and Loretta Roach, and my brother
Jonathan Roach. Throughout my life you have instilled the message that anything is
possible if you work hard enough and keep a positive outlook. I’m still working on
keeping a positive outlook, so I’m thankful to my family for reminding me that I would
finish my thesis, and for cheering me up when I felt poorly about myself. Thank you for
always accepting me for who I am and encouraging me to continue my education. I am
eternally grateful to have such a wonderful family.
I would also like to thank my friends. Briana Blyden, thank you for sending me
encouragement when I needed it the most and being such a great friend to me. Samantha
Wetzelberger, I would not have been able to scale the APA mountain if not for your skill,
and I would have been miserable without your company. Alyssa Gradus, thank you for
always making me laugh. Thank you to all of my close friends at University of Baltimore
and Central Michigan University.
Finally, thank you to everyone who has given me a kind word, support, or advice
during this thesis process, especially Ellie, Sylvia, Cyndi, and the Brittinghams; I
appreciate you all, and hope to keep making you proud!
v
TABLE OF CONTENTS
List of Tables ................................................................................................................... viii List of Figures ..................................................................................................................... x INTRODUCTION ...............................................................................................................1
LITERATURE REVIEW ....................................................................................................7 Understanding Occupational Stress ................................................................................ 8
Nurses and Stress ......................................................................................................... 8 Stressors and Strains...................................................................................................... 11
Stressors ..................................................................................................................... 11 Role Ambiguity ....................................................................................................... 11 Role Conflict .......................................................................................................... 12
Role Overload ........................................................................................................ 12 Strains ........................................................................................................................ 12
Burnout .................................................................................................................. 13 Turnover Intention ................................................................................................. 15
Theoretical Framework: Person-Environment Fit Theory ............................................ 16
The Transactional Model of Stress ............................................................................ 16 Beehr and Newman’s Facet Model of Occupational Stress ...................................... 17
Attraction-Selection-(Socialization)-Attrition ........................................................... 18 Values ............................................................................................................................ 20
Defining Values ......................................................................................................... 20 Basic Human Values ................................................................................................. 20
Healthy Values .......................................................................................................... 21 General Well-Being and Job-Related Anxiety .......................................................... 25 Value Congruence ..................................................................................................... 27
Alternative Frameworks ................................................................................................ 27 The Michigan Model ................................................................................................. 27 Job-Demands-Control Model .................................................................................... 28
Conservation of Resources ........................................................................................ 28 Measuring Person-Environment Fit .............................................................................. 30 Summary ....................................................................................................................... 31 Hypotheses and Research Questions ............................................................................. 31
METHODS ........................................................................................................................34 Procedure ....................................................................................................................... 34 Data Reduction .............................................................................................................. 35
Participants .................................................................................................................... 36 Measures........................................................................................................................ 36
Role Stressors ............................................................................................................ 38 Schwartz’s Values Survey ......................................................................................... 39 Burnout ...................................................................................................................... 40
vi
Turnover Intention ..................................................................................................... 40 Gerneal well-being .................................................................................................... 40
Job-Related Anxiety .................................................................................................. 41 Data Analysis ................................................................................................................ 41
RESULTS ..........................................................................................................................43 Correlational Analysis of Main Study Variables .......................................................... 43
Value Correlations ..................................................................................................... 43
Values and Outcomes ................................................................................................ 44 Values and Role Stressors ......................................................................................... 45 Personal Values and Burnout .................................................................................... 45 Personal Values and Turnover Intention ................................................................... 45
Two-Way Interaction Analyses ..................................................................................... 46 Burnout ...................................................................................................................... 46
Stimulation Value ................................................................................................... 46
Conformity Value ................................................................................................... 48 Security Value ........................................................................................................ 49
Turnover Intention ..................................................................................................... 52 Self-Direction Value .............................................................................................. 52 Stimulation Value ................................................................................................... 53
Security Value ........................................................................................................ 55 Three-Way Interaction Analyses .................................... ............................................... 56
Burnout ...................................................................................................................... 57 Conformity Value ................................................................................................... 58 Hedonism Value ..................................................................................................... 62
Tradition Value ...................................................................................................... 65
Turnover Intention ..................................................................................................... 65 Benevolence Value ................................................................................................. 66 Universalism Value ................................................................................................ 70
Tradition Value ...................................................................................................... 72 DISCUSSION ....................................................................................................................75
Stressor-Strain Relationships ........................................................................................ 76
Role Stressors ............................................................................................................ 76 General Well-Being and Job-Related Anxiety .......................................................... 78 Personal Healthy Values ............................................................................................ 79
Two-Way Interactions ................................................................................................... 81 Three-Way Interactions ................................................................................................. 83
Limitations .................................................................................................................... 86 Future Research ............................................................................................................. 88
Implications and Conclusion ......................................................................................... 88 REFERENCES ..................................................................................................................91
APPENDIX A- Copyright Permission............................................................................ 102 APPENDIX B- Value Items Used to Create Value Types ............................................. 103 APPENDIX C- Survey Items.......................................................................................... 104
vii

LIST OF TABLES
Table 1. Definitions of Values and Health Classification ............................................... 24
Table 2. Socio-Demographic Information of Nurses in Two Hospitals......................... 37
Table 3. Measures Utilized for the Current Study Based on Survey Administration ..... 38
Table 4. Example of Probing Analysis Using Median Split Technique for Three-Way
Interaction Effects .......................................................................................... 42
Table 5. Means, Standard Deviation, Reliabilities (on diagonal), and Intercorrelations
Between Role Stressors (T1), Anxiety (T2), Well-Being (T2), Burnout (T2),
and Turnover Intention (T2) .......................................................................... 44
Table 6. Means, Standard Deviations, and Cronbach’s Alpha Reliabilities among Ten
Value Types ................................................................................................... 44
Table 7. Intercorrelations between Schwartz 10 Personal Values, Role Stressors,
Anxiety, Well-Being, Burnout, and Turnover Intention ................................ 45
Table 8. Hierarchical Regression of Burnout on Role Overload (RO), Stimulation
Personal Value (STPV), and their Interaction ............................................... 47
Table 9. Hierarchical Regression of Burnout on Role Conflict (RC), Conformity
Personal Value (COPV), and their Interaction .............................................. 49
Table 10. Hierarchical Regression of Burnout on Role Conflict (RC), Role Overload
(RO), Security Personal Value (SEPV), and their Interaction ....................... 50
Table 11. Hierarchical Regression of Turnover Intention on Role Ambiguity (RA), Self-
Direction Personal Value (SDPV), and their Interaction ............................... 53
Table 12. Hierarchical Regression of Turnover Intention on Role Overload (RO),
Stimulation Personal Value (STPV), and their Interactions .......................... 54
Table 13. Hierarchical Regression of Turnover Intention on Role Overload (RO),
Security Personal Value (SEPV), and their Interaction ................................. 56
Table 14. Hierarchical Regression of Burnout on Role Ambiguity (RA), Conformity
Personal Value (COPV), Conformity Organization Value (COOV), and their
Interactions .................................................................................................... 59
viii

Table 15. Hierarchical Regression of Burnout on Role Overload (RO), Conformity
Personal Value (COPV), Conformity Organization Value (COOV), and their
Interaction ...................................................................................................... 61
Table 16. Hierarchical Regression of Burnout on Role Ambiguity (RA), Hedonism
Personal Value (HEPV), Hedonism Organization Value (HEOV), and their
Interaction ...................................................................................................... 63
Table 17. Hierarchical Regression of Burnout on Role Conflict (RC), Tradition Personal
Value (TRPV), Traditional Organization Value (TROV), and their Interaction
....................................................................................................................... 66
Table 18. Hierarchical Regression of Turnover Intention on Role Overload (RO),
Benevolence Personal Value (BEPV), Benevolence Organization Value
(BEOV), and their Interaction ....................................................................... 68
Table 19. Hierarchical Regression of Turnover Intention on Role Ambiguity (RA),
Universalism Personal Value (UNPV), Universalism Organization Value
(UNOV), and their Interaction ....................................................................... 71
Table 20. Hierarchical Regression of Turnover Intention on Role Ambiguity (RA),
Tradition Personal Value (TRPV), Tradition Organizational Value (TROV),
and their Interaction ....................................................................................... 73
ix

LIST OF FIGURES
Figure 1. Models of stressor-strain relationships tested in the current study .................. 5
Figure 2. Relations among ten value types, adopted from Sagiv and Schwartz (2000)
.........................................................................................................................21
Figure 3. Hypothesis 6: Three-way interaction hypotheses to be tested for predicting
burnout and turnover intention for values perceived as high and low in
organizational values ..................................................................................... 33
Figure 4. The relationship between role overload and burnout as moderated by personal
stimulation value. ........................................................................................... 48
Figure 5. The relationship between role conflict and burnout as moderated by personal
conformity value... ......................................................................................... 49
Figure 6. The relationship between role conflict and burnout as moderated by personal
security value. ................................................................................................ 51
Figure 7. The relationship between role overload and burnout as moderated by personal
security value. ................................................................................................ 52
Figure 8. The relationship between role ambiguity and turnover intention as moderated
by personal self-direction value. .................................................................... 54
Figure 9. The relationship between role overload and turnover intention as moderated by
personal stimulation value. ............................................................................ 55
Figure 10. The relationship between role overload and turnover intention as moderated by
personal security value. ................................................................................. 57
Figure 11. The relationship between role overload and burnout as moderated by personal
conformity value and organizational conformity value. ................................ 59
Figure 12. The relationship between role overload and burnout as moderated by personal
conformity value and organizational conformity value. ................................ 61
Figure 13. The relationship between role overload and burnout as moderated by personal
hedonism value and organizational hedonism value. .................................... 64
Figure 14. The relationship between role conflict and burnout as moderated by personal
tradition value and organizational tradition value. ........................................ 67
Figure 15. The relationship between role overload and turnover intention as moderated by
personal benevolence value and organizational benevolence value. ............. 69
x

Figure 16. The relationship between role overload and turnover intention as moderated by
personal universalism value and organizational universalism value. ............ 71
Figure 17. The relationship between role ambiguity and turnover intention as moderated
by personal tradition value and organizational tradition value. ..................... 74
xi

1
INTRODUCTION
The Person-Environment (P-E) fit theory stipulates that for a person to function
well in his or her environment, there must be a sense of congruence between (1)
characteristics or motivations of the person and (2) characteristics or needs of the
environment (Dewe, O’Driscoll, & Cooper, 2012). This conceptual framework is
frequently used to model stressor-strain relationships by assessing an individual’s
perception of fit between his or her own characteristics and the characteristics of the
organization (i.e., Person-Organization fit). Supplementary P-E fit, the focus of this
study, identifies fit based on characteristics (e.g., values) that individuals may have in
common with their organization. In comparison, complementary fit explains a mutually
beneficial relationship, where individual and organizational characteristics differ, but
provide something the other is lacking (Kristof, 1996; Kristof-Brown, Zimmerman, &
Johnson, 2005). Theoretically, when a person perceives a fit he or she should experience
greater well-being and fewer strains (Cooper, Dewe, & O’Driscoll, 2001).
Despite the publication of multiple studies focusing on “fit” (e.g., Dendaas, 2011;
Siegall & McDonald, 2004; Vandenberghe, 1999), several discrepancies in how
researchers conceptualize and analyze P-E fit have been identified (Verquer, Beehr, &
Wagner, 2003). For example, Verquer and colleagues (2003) note that some researchers
examine P-E fit using measures of goal congruence (i.e., the intersection of individual
and organizational goals), others by measures of personality-climate fit (i.e., the
similitude between personality characteristics and organizational climate), and others
using value congruence (i.e., the degree of fit between individual and organizational
values) measures. Value congruence has emerged as the most empirically examined
approach to supplementary P-E fit (Cable & Edwards, 2004; Hoffman, Bynum, Piccolo,
& Sutton, 2011; Verquer et al., 2003).
Values refer to goal-directed beliefs about what is important in life; they are
organized into a hierarchy of importance (some values are not endorsed at all and may
oppose one’s goals, whereas others may be of supreme importance), guide behavior, and
transcend specific situations (Schwartz, 1992). As motivational-cognitive states, values

2
might shape a person’s felt experiences in the organization and, as a result, frame a
person’s experiences of stressors and reactions to those stressors (Glazer, Simonovich,
Roach, & Carmona, accepted; Sagiv & Schwartz, 2000). Thus, when a person’s values
are attained, subjective well-being, conceptualized in both cognitive and affective forms,
will increase. The cognitive aspect of subjective well-being considers aspects, such as
satisfaction, whereas the affective aspect is focused on an individual’s feelings of
happiness or sadness (Argyle & Martin, 1991, as cited in Sagiv & Schwartz, 2000). This
research examines affective subjective well-being (henceforth referred to as subjective
well-being). Sagiv and Schwartz (2000) examined Schwartz’s (1992) 10 basic values (see
Table 1) and asserted that some values are “healthy,” and other values are “unhealthy.”
Healthy values are expected to increase an individual’s personal happiness, whereas
unhealthy values are expected to reduce subjective well-being.
Furthermore, when a person’s values are congruent with the organization’s
values, the person is more likely to feel committed, engaged, and satisfied, and to report
stronger positive emotional well-being, and weaker intention to leave (Edwards & Cable,
2009; O’Reilly, Chatman, & Caldwell, 1991; Verquer et al., 2003). In comparison, when
a person’s values are incompatible with the organization’s values, strains, such as
anxiety, lower satisfaction, and intention to leave the organization, develop for the person
(Boamah & Laschinger, 2016; Bocchino, Hartman, & Foley, 2003; Edwards & Cable,
2009; Leiter & Maslach, 2009; Vandenberghe, 1999; Yang, Che, & Spector, 2008). Thus,
it is reasonable to suggest that if healthy (vs. unhealthy) values and value congruence
positively relate with subjective well-being (Sagiv & Schwartz, 2000), then lack of
congruence (i.e., value incongruence) of healthy values (as defined by Sagiv & Schwartz,
2000) would moderate the stressor-strain relationship, such that the positive relationship
between stressors and both burnout and turnover intention would be stronger when values
are incongruent. Few studies have looked at healthy values (exceptions include
Buchanan, 2004; Sagiv & Schwartz, 2000) or value incongruence (an exception is
McCoy, 1986) as moderators of the relationship between stressors and strains, and none

3
have specifically examined congruence of healthy values. This study’s novel
contribution, therefore, is the examination of healthy value congruence.
This study’s focus on value (in)congruence and its implications on the stressor-
strain relationship is particularly pertinent to the nursing profession, as research reports
significant differences between the personal and professional values of nurses (Rassin,
2008). Nurses often enter the profession with the intent to enact values, such as altruism
(Rassin, 2008), only to learn that in reality they enter organizations, particularly hospitals,
that strive toward capital growth (Vandenberghe, 1999). However, in a study of 323
Israeli nurses, Rassin (2008) found that the importance ratings of some professional
values have shifted; nurses no longer viewed altruism and confidentiality as being highly
endorsed in the profession, likely due to organizational demands. When healthy values
are incongruent, the stressor-strain relationship may intensify.
Because nursing is a high touch, high stakes job, any negative implications of
work-related stressors can have dire consequences not only to the profession, but also to
the patients and the organization (Bao, Vedina, Moodie, & Dolan, 2013). Therefore,
investigating healthy value congruence in this population may reveal if value
incongruence intensifies the stressor-strain relationship. A secondary outcome from this
research may be information as to whether nurses’ healthy values are unaligned with their
perceptions of the organization’s values. Results from the study may support education
and training initiatives aimed at mitigating nurses’ strains, such as emphasizing realistic
job previews (Earnest, Allen, & Landis, 2011; Meglino & DeNisi, 1987). Indeed, realistic
job previews increase role clarity, thus reducing the ambiguity employees perceive
regarding their role (Earnest et al., 2011).
Understanding the role of healthy value congruence on the stressor-strain
relationship has practical implications for companies too, as companies aim to attract and
select promising candidates, and retain employees that perform well (Schneider, 1987).
The costs associated with the selection process and attrition (i.e., turnover) are quite high
(Glebbeek & Bax, 2004; Tracey & Hinklin, 2010), especially among healthcare
professions (Jones, 2005; Jones, 2008; Waldman, Kelly, Arora, & Smith, 2004). Prior

4
studies have shown that value incongruence in the nursing field yields burnout and
turnover intention (Leiter, Jackson, & Shaughnessy, 2009; Leiter, & Maslach, 2009). In
order to minimize burnout and turnover, organizations provide opportunities to socialize
new employees through training programs, performance feedback meetings, and
modeling of others’ behaviors. Through these socialization strategies, organizational
values are reinforced. And, when employees’ values align with organizational values they
are retained. When values do not align, employees often leave (on their own or with the
help of the company). However, it is not only the company that identifies alignment. The
employee does as well, such as when he or she decides to accept an offer, make efforts to
socialize into the company culture, and remain with or leave the company. It is the latter
point, retention, that I am examining. Specifically, I focus on whether a person’s
perceived healthy value congruence mitigates the extent to which stressors lead to
burnout and turnover intention (see Figure 1).
Figure 1 shows three types of relationships: direct effects, two-way interaction
(moderating) effects, and three-way interaction effects on the focal outcome variables. I
propose four direct effects models. First, stressors (identified at Time 1 or T1) will
directly relate to strains (identified at T1 and Time 2 or T2). Second, personal healthy
values (T1) will directly influence burnout and turnover intention (T2). Third, because
values shape perceptions of stimuli too (Schwartz, 1992), I also propose that healthy
values (T1) will directly relate to stressors (T1). Fourth, healthy values (T1) will directly
relate to general well-being and job-related anxiety (T2). The two-way moderating effects
model stipulates that personal healthy values (T1) explain when stressors (T1) relate to
strains (T2); endorsement of healthy values may protect nurses from negative
consequences of stressors. Finally, a three-way interaction model proposes that
congruence between (self-reported and perceived organizational) healthy values (T1)
moderates when stressors (T1) relate to strains (T2).

5
H3
H4
R2
H5
H6
Str
esso
rs
Str
ains
Per
son
al H
ealt
hy
Val
ues
Per
ceiv
ed
Org
aniz
atio
nal
Hea
lth
y V
alu
es
Ro
le A
mbig
uit
y
Role
Confl
ict
Role
Over
load
Burn
out
Turn
over
Inte
nti
on
1
1
2
2
3
Dir
ect
model
s/ef
fect
s
Moder
ator
model
s/ef
fect
s
Thre
e-w
ay i
nte
ract
ion m
odel
s/ef
fect
s H1, H
2
2
1
Gen
eral
Wel
l-B
ein
g
Job
-Rel
ated
Anx
iety
R1
1
Fig
ure
1. M
odel
s of st
ress
or-st
rain
rel
atio
nsh
ips
test
ed i
n t
he
curr
ent
study.

6
In addition to the main goal of testing the moderating effects of healthy values
congruence on the stressor-strain relationships, this study has several additional novel
contributions. First, this study examines stressors and values assessed at T1, and stressors
and strains assessed at T2. By utilizing a longitudinal survey design and thus temporally
controlling for stressors at T2, it will be possible to test the role of time in affecting
stressors’ (T1) impact on strains (T2), thus allowing for a more comprehensive
understanding of stressor-strain relationships (Zapf, Dormann, & Frese,1996). Second,
this study focuses on healthy values purported to promote well-being (Sagiv & Schwartz,
2000). Third, this study proposes a critical distinction in the current understanding of the
role of value congruence on stressor-strain relationships, such that this study proposes
(in)congruence of healthy values will moderate stressor-strain relationships.
In the remaining sections of this thesis, I present a literature review defining the
main concepts and variables of this study (i.e., stressors, strains, and healthy values and
value congruence as moderators) along with the theoretical framework that governed this
thesis. I also present other influential models of occupational stress research and the study
hypotheses. The study method and results follow the literature review, and then I discuss
findings in light of P-E fit and healthy values, as well as the implications for research and
practice.

7
LITERATURE REVIEW
Numerous studies have found support that role stressors (e.g., role ambiguity, role
conflict, and role overload) positively relate to burnout (e.g. Han, Han, An, & Lim, 2015;
Kim & Lee, 2009; Kim & Stoner, 2008) and turnover intention (e.g., Glazer & Beehr,
2005; Han et al., 2015; Hang-yue, Foley, & Loi, 2005). However, there has yet to be a
study to examine P-E congruence of healthy values as a buffer of the relationships
between role stressors and strains (i.e., burnout and turnover intention).
Studying the role of healthy values congruence on the stressor-strain relationship
could help companies better understand why healthcare costs are between $125 billion to
$190 billion per year and deaths per year from work-related stress are as high as 120,000
(Goh, Pfeffer, & Zenios, 2015). Although 80% of workers feel ‘stressed’ at work and
25% of individuals viewed their jobs as the most stressful thing in their lives (The
American Institute of Stress, n.d.), it is still not clear if some of the implications of
stressors could be mitigated by aligning employees’ values with the organization’s values
(i.e., value congruence).
The Person-Environment Fit theory forms the basis of the present study’s
conceptualization of value congruence as a moderator of the stressor-strain relationship.
The premise of P-E fit theory is that the effects of stressors on strains is a function of the
relationship between factors of the person and factors of the environment (Beehr &
Newman, 1978). Thus, the interaction between the person and the environment should
moderate the stressor-strain relationship, although this piece of the theoretical model has
been mostly ignored. In this thesis, I specifically examine if aspects of the person (self-
reported values), aspects of the environment, specifically the organization (person
perceived organizational values), and the congruence between the person and
environment influence when stressors relate to strains. I expect that when a person’s
endorsement of healthy values is congruent with their perceptions of the organization’s
endorsement of healthy values, the positive relationship between stressors and strains will
be weaker than when the values are incongruent. When a person endorses healthy values,
but perceives that the organization does not endorse healthy values, the positive

8
relationship between stressors and strains will be stronger. However, when a person does
not endorse healthy values and the person perceives that the organization also does not
endorse those values, despite congruence, the positive stressor-strain relationship will not
significantly change and it will also not significantly change when the person does not
endorse the healthy values, but the organization is perceived to do so. Thus, I assert that
the impact of stressors on strains intensifies when a person perceives that the organization
does not endorse the same healthy values. Given that the goals of this study were to
determine the influence of healthy value congruence on the stressor-strain relationship, it
is necessary to conceptualize occupational stress, and explain the importance of values
research in the nursing population.
Understanding Occupational Stress
Occupational stress is an umbrella term to describe the relationship between
stressors and strains in the workplace (Beehr & Glazer, 2005). Some researchers
erroneously use the term stress, when they mean either stressors or strains (Glazer &
Gyurak, 2008). For example, when reading results of the International Labour
Organisation (ILO), that 40% of job absenteeism could be attributed to stress (Hoel,
Sparks, & Cooper, 2001), it is difficult to determine whether stress refers to stressors,
strains, or both. These distinctions are vital because they allow researchers to make
connections across studies and contribute to further understanding in the field. For the
purpose of this study, stressors refer to aspects of work and the work environment that
demand, constrain, or challenge a person (Lazarus & Folkman, 1987). Strains refer to
stressor responses that negatively impact an individual’s physical and psychological
health (Beehr & Glazer, 2005; Glazer & Gyurak, 2008).
Nurses and Stress. Nurses are the focus of the present study, because the nature
of the job and their variety of experiences with various workplace stressors (McVicar,
2003; Wisdom, 1984), make them an ideal population to examine the study variables. For
example, in a confirmatory factor analysis of the Expanded Nursing Stress Scale, French,
Lenton, Walters, and Eyles (2000) identified nine distinct work-related stressors nurses
experience: (1) Death and dying, (2) Conflict with physicians, (3) Inadequate preparation,

9
(4) Problem with peers, (5) Problems with supervisors, (6) Workload, (7) Uncertainty
concerning treatment, (8) Patients and their families, and (9) Discrimination. Although
the present study does not examine stressors specific to nurses only (i.e., job-specific role
stressors; Beehr, Jex, Stacy, & Murray, 2000), but instead addresses stressors that are
generic across occupations, it does somewhat capture two of the nine job-specific
stressors salient to nurses: conflict and workload. Generic role stressors may be identified
in any job that is structured around roles (Glazer, 2005). Moreover, because this study’s
main focus is on variable relationships and not on the effects of profession-specific
stressors on strains, delving into professional stressors, while asking about organizational
(and not professional) values would lead to difficulty interpreting results. Generic role
stressors generalize beyond the occupation (Glazer, 2005), where workers in any
occupation can understand and rate their feelings of having ‘too much work for a single
person to accomplish.’ Generic stressors do not ignore occupation, as individuals rate
their perception of their unique job.
As this study uses a measure of generic role stressors, and controls for
occupational differences by only using hospital nurses, it would likely yield generalizable
results of variable relationships to other high stakes professions (Glazer, 2005).
Examining the stressor-strain relationship and its implications on nurses’ well-being are
important, as nurses’ experience with workplace stressors may affect their ability to care
for patients (Aiken, Clarke, Sloane, Sochalski, & Silber, 2002; Bao et al., 2013) and the
hospital’s overall effectiveness. Role stressors are a commonly studied and reported job
stressor within nursing literature (e.g., Chang & Hancock, 2003; Glazer & Beehr, 2005;
Glazer & Gyurak, 2008; Vredenburgh & Trinkaus, 1983), likely due to the characteristics
and expectations of the job. Although many professionals experience role stressors,
Glazer (2005) theorized several reasons that hospital nurses are “particularly vulnerable
to role related stressors (e.g., role conflict, role overload, and role ambiguity) and
subsequent strains” (p. 143). One such reason is the nature of nursing in hospitals, which
requires round-the-clock staffing (i.e., shiftwork). In a study of 397 Israeli nurses, Glazer
(2005) reasoned that nurses who worked fixed day shifts had higher role conflict and role

10
overload than partially rotating nurses because of the day shift-workers’ task conflict and
task overload built into the day shift in the form of more administrative work (e.g.,
medication ordering from the pharmacy and paperwork to complete for discharge) and
more interactions with others (e.g., staff, patients, and visitors; Glazer, 2005). Moreover,
several studies have found that shiftwork has a negative impact on well-being (Jamal &
Baba, 1997; Takahashi et al., 2005).
Nursing literature frequently examines burnout (Boamah & Laschinger, 2016;
Han et al. 2015; Leiter, Gascon & Martinez-Jarreta, 2009) and turnover intention (Kim &
Stoner, 2008; Siegall & McDonald, 2004). However, prior to the current study, little
research has recognized the implications of values on these specific strains (an exception
is Bao et al., 2013), and none have investigated the role that healthy value congruence
may have on the stressor-strain relationship. Bao et al. (2013) found that value
incongruence positively relates with turnover among nurses, which may be due to a
mismatch between individual values in the profession and organizational (hospital)
values. It is not simply the incongruence of values that influences strains, though; as this
study proposes, the healthiness of the values an individual endorses (Sagiv & Schwartz,
2000) pairs with value congruence to influence the stressor-strain relationship. Nurses are
likely to value helping behaviors (Glazer & Beehr, 2002), whereas the ultimate goal of
hospitals, though initially to serve the well-being of patients, has transformed into a
money-making industry (Vandenberghe, 1999). This proposed misalignment makes the
nursing profession a unique population to study the role value congruence plays on the
stressor-strain relationship. The role of value congruence on the stressor-strain
relationship has implications for individuals and organizations (Schneider, 1987). It is
reasonable to suggest that if value congruence influences employee hiring, job
satisfaction, and attrition (Schneider, Goldstein, & Smith, 1995) then it may also play a
role in influencing the other outcomes frequently related to variables such as attrition,
namely burnout (e.g., Goodman & Boss, 2002) and turnover intention (e.g., Beecroft,
Dorey, & Wenten, 2008).

11
Stressors and Strains
The present study examines role stressors (i.e., role ambiguity, role conflict, and
role overload) in relation to strains (i.e., burnout and turnover intention) as moderated by
value congruence. The purpose of this section is to define and describe these stressors
and strains.
Stressors. Stressors are stimuli that can, but do not necessarily, cause strain
responses in an individual (McGowan, Gardner, & Fletcher, 2006). One of the most
common categories of job stressors is work-related role stressors (Jex, 2002). Role
stressors are psychosocial demands, constraints, or opportunities that individuals perceive
in their work roles (Beehr & Glazer, 2005). When a person perceives his or her role in the
organization as confusing, conflicting, or overtaxing, the individual may develop strains
(or negative responses due to the stressors). As such, when individuals’ personal values
align with the organization’s values, people experience fewer role stressors in comparison
to those for whom person and organization values are less congruent (Verquer et al.,
2003). The present study examines three types of role stressors: role ambiguity, role
conflict, and role overload.
Role Ambiguity. Rizzo, House, and Lirtzman (1970) defined role ambiguity as
lack of clarity in role expectations, resulting in employee confusion. Nurses may
encounter role ambiguity in a variety of situations as they are consistently exposed to
situations without complete information or instruction due to the fast-paced nature of the
job. A study of recent nursing graduates found that nurses experience high levels of role
ambiguity when initially taking on their new role, but that role ambiguity tapered off
when measured 10 months later, replaced by role overload as the most evident role
stressor experienced by new nurses (Chang & Hancock, 2003). Additionally, a study on
nurses in relatively large hospitals in South Korea found that role ambiguity influenced
burnout in nurses (Han et al., 2015), suggesting a need to study the relationship between
role stressors and strains further; after all, burnout can lead to increased accidents, poor
patient-care, and increased turnover intention (Bao et al., 2013), which all lead to
monetary losses for the organization in legal fees and human capital costs.

12
Role Conflict. Role conflict refers to incongruence between a person’s
understanding of his or her role and others’ expectations of the role (Rizzo et al., 1970).
An individual could have multiple, yet conflicting, roles at an organization, such as
serving as a patient care provider and a nurse supervisor, resulting in inter-role conflict
(Beehr & Glazer, 2005). Research suggests that investment into conflicting roles can lead
an individual to overuse his or her supply of limited personal resources (e.g., cognitive
processing), leading to psychological strain, including burnout (Jawahar, Stone, &
Kisamore, 2007; Kim & Stoner, 2008). In addition, research has linked role conflict to
turnover intention (O’Driscoll & Beehr, 1994). This study seeks to reaffirm previous
findings that have shown a positive relationship between role conflict and both burnout
and turnover intention.
Role Overload. Role overload is an individual’s perception or actual experience
of having too many demands imposed on him or her (Jex, 2002), and it has been found to
be a predictor of psychological strain and turnover intention (O’Driscoll & Beehr, 1994).
Nurses may encounter role overload when unexpected tasks appear without warning (e.g.,
an unexpectedly large volume of patients in a unit without sufficient staffing to provide
patient care support). Jex (2002) explains that role overload not only refers to the actual
number of tasks (i.e., quantitative role overload), but also to task difficulty (i.e.,
qualitative role overload). This distinction is important because it clarifies why some
tasks may be perceived as manageable, when others are not and can become
overwhelming. Having an excessively high workload is not the same as not having the
knowledge to perform some work tasks; the resulting strains differ. For example, a
nursing student, who must assist in an emergency situation he or she has not been trained
for, may experience anxiety, or fear. The nurse who has this skillset, but has a full load of
additional patients for whom to care may feel drained, or inconvenienced. Although these
can both be examples of role overload, the focus of the current study is on quantitative
role overload.
Strains. Recent literature has begun to refer to stressor-induced effects as
outcome variables, instead of strains because not all stressors result in negative outcomes
13
for the individual or the organization (McGowan et al., 2006). For example, some
stressors can be viewed as challenges that motivate people to perform and not as
hindrances that constrain people from achieving their goals (Bakker & Demerouti, 2007).
However, strains will be used throughout this study to connote negative outcomes
resulting from stressors, and both burnout and turnover intention are undesirable
consequences. When faced with stressors, individuals will determine if the stressors are
threats and if they have the resources to cope with them (Lazarus & Folkman, 1987). If
stressors are threats and a person does not have the resources to cope with them, various
responses occur, typically in the form of strains that directly influence the well-being of
the individual (Beehr & Glazer, 2005). Strains refer to negative responses to unmanaged
stressors. There are three categories of strains: psychological, physiological, and
behavioral (Beehr & Glazer, 2005). Examples of psychological strains include dysphoria,
anxiety, depression, and burnout. Physiological strains involve fluctuations in an
individual’s well-being and can include headaches, heart attack, or insomnia. Finally,
behavioral strains involve an individual’s actual behavior and include substance abuse,
absenteeism, and actual employee turnover. The current study examines the relationship
between the psychological strains of burnout and turnover intention.
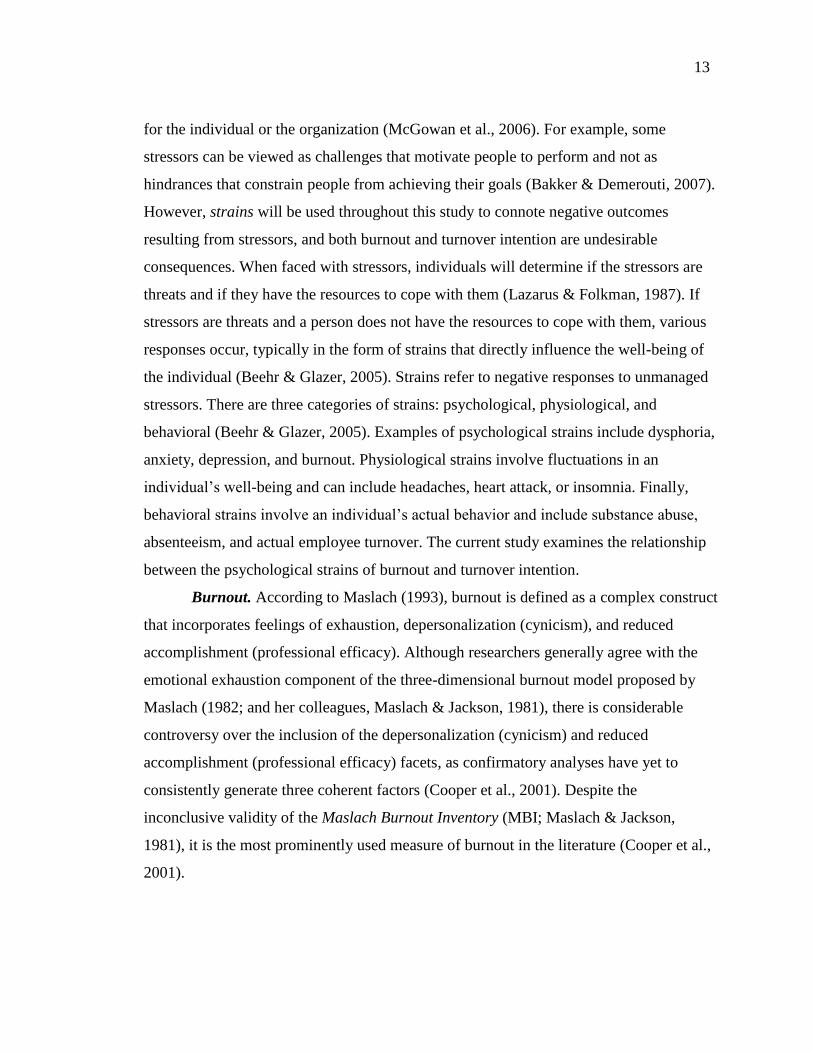
Burnout. According to Maslach (1993), burnout is defined as a complex construct
that incorporates feelings of exhaustion, depersonalization (cynicism), and reduced
accomplishment (professional efficacy). Although researchers generally agree with the
emotional exhaustion component of the three-dimensional burnout model proposed by
Maslach (1982; and her colleagues, Maslach & Jackson, 1981), there is considerable
controversy over the inclusion of the depersonalization (cynicism) and reduced
accomplishment (professional efficacy) facets, as confirmatory analyses have yet to
consistently generate three coherent factors (Cooper et al., 2001). Despite the
inconclusive validity of the Maslach Burnout Inventory (MBI; Maslach & Jackson,
1981), it is the most prominently used measure of burnout in the literature (Cooper et al.,
2001).

14
Furthermore, emotional exhaustion has been the most widely studied dimension
of the model (Maslach, 1993). Indeed, though much of the occupational stress research
regarding burnout utilizes the MBI or a later edition (i.e., MBI-General Scale; e.g.,
Boamah & Laschinger, 2016; Demerouti, Bakker, de Jonge, Janssen, & Schaufeli, 2001;
Leiter & Maslach, 2009). Some studies targeting burnout in nurses have used the MBI,
but only focused on the emotional exhaustion component of the measure (e.g., Aiken et
al., 2002; Aiken & Sloane, 1997; Gunusen, Ustun, & Erdem, 2014). Others’ research on
burnout in nurses (a) did not use the MBI or a later edition and (b) targeted only
emotional exhaustion (e.g., Sheward, Hunt, Hagen, & Macleod, 2004; Stordeur, D’hoore,
& Vandenberghe, 2001), highlighting the importance of this particular facet in burnout.
These findings suggest that emotional exhaustion is a crucial component of burnout; they
also highlight the need for a more comprehensive conceptualization of the term than what
Maslach’s (1993) model provides.
Past research initially made no definitional distinction between burnout and
tedium, only stating that burnout applied to human service workers and tedium applied to
nonservice workers (Shirom, 1989, as cited in Cooper et al., 2001). However, this small
distinction does not offer a full view of either concept. Rather, tedium is defined as an
occurrence of physical, emotional, and attitudinal fatigue (Pines & Kafry, 1978).
Although Maslach’s (1993) conceptualization of burnout captures the experience of
emotional exhaustion, it fails to capture the physical or attitudinal facets distinguishing
tedium. Thus, it is reasonable to suggest burnout (as Maslach, 1993, models) represents
one aspect of tedium.
Further, literature frequently mentions excessive workload as a severe stressor for
nursing populations, but does not clarify whether this workload is physical, emotional,
(e.g., Ugurlu et al., 2015), attitudinal (Potter et al., 2010), or a combination of all three of
these particular facets. Although nursing literature mentions burnout frequently, there is
an overwhelming focus on emotional exhaustion (e.g., Maslach, 1993). The focus on the
emotional component of exhaustion is not unfounded, as nurses frequently,
compassionately communicate with multiple patients in one shift, juggling life stories,

15
histories and current laments. Whereas a physician may speak briefly to a patient during
his or her shift, the nurse is expected to regularly check the patient’s vital signs, and
general well-being during a patient’s hospitalization. However, although emotional
exhaustion is relevant, the nursing field additionally requires long periods of physical
dexterity and cognitive processing, such as moving quickly from one patient to another to
administer multiple medications or perform procedures. Indeed, other forms of
exhaustion also characterize nurses’ experiences (e.g., Aiken et al., 2002; Aiken &
Sloane, 1997; Gunusen et al., 2014), namely mental and physical exhaustion. Therefore, I
employ a measure of tedium to address the emotional, mental, and physical exhaustion
components of burnout. The three-component measure of exhaustion positively relates
with burnout (Pines & Aronson, 1988) and with role stressors (Stout & Posner, 1984).
Thus, for the purpose of this study, I adopted Pines and Aronson’s (1988)
conceptualization of burnout as: “a state of physical, emotional, and mental exhaustion
caused by long-term involvement in situations that are emotionally demanding” (p. 9).
This definition may be disputed due to its focus on exhaustion (Cooper et al., 2001), but
such a focus is consistent with nurses’ experiences and prior studies’ attention.
Turnover Intention. Tett and Meyer (1993) defined turnover intention
(sometimes referred to as intention to leave) as an employees’ expectation to leave an
organization and/or their position. Although turnover intention is not the same as actual
turnover, Beecroft et al. (2008) found that turnover intention predicted actual turnover in
graduate nurses (see also Steel & Ovalle, 1984, for a meta-analysis on turnover intention
and actual turnover), making it an essential measure. Employee turnover is particularly
high in the nursing field (Beecroft, Santner, Lacy, Kunzman, & Dorsey, 2006; Kovner,
Brewer, Fatehi & Jun, 2014; Winfield, Melo, & Myrick, 2009), ranging from 6.3% to
33.5% (Baernholdt & Mark, 2009; Kovner et al., 2014), with as many as 50% of new
nurses leaving the job within one year of starting (Winfield et al., 2009). These statistics
are particularly problematic as turnover contributes to increased hiring costs without
payoff for the organization, making it crucial to examine potential antecedents of this
phenomenon within nurses.

16
Theoretical Framework: Person-Environment Fit Theory
The primary theoretical foundation of this study is the Person-Environment Fit
theory. The P-E Fit theory approach to occupational stress posits that dissimilarity
between the characteristics of the individual (e.g., individual values, personality, abilities)
and the environment (e.g., organizational values, demands, supplies) causes strain (Dewe
et al., 2012; Edwards & Cooper, 1990). In comparison, a “good fit” between an
individual and his or her organization promotes more positive outcomes, such as job
satisfaction (Dendaas, 2011; Yang et al., 2008). P-E fit theory is the foundational
framework for several occupational stress models. For example, the transactional model
of stress portends that aspects of the person and the environment interact to influence an
individual’s appraisal of stressors, potentially leading to strains (Lazarus, 1999, 2001).
The facet model of occupational stress depicts the stress process, emphasizing the
temporal element of stressors (e.g., acute, chronic) along with the interaction of aspects
of the person and the environment that evoke strains (Beehr & Newman, 1978). The
healthy values model focuses on aspects of a person’s cognitive state (the person
component of the P-E fit model) as a predictor of well-being (Sagiv & Schwartz, 2000).
Finally, the Attraction-Selection-Socialization-Attrition (AS(S)A) framework proposes
that when a person who is attracted to an organization, is selected to join it, and then
socialized to acclimate to it, he or she will be more similar to the organization and less
likely to leave it (Schneider, Smith, Taylor, & Fleenor, 1998).
The Transactional Model of Stress. The transactional model of stress is
markedly similar to P-E fit theory in that the person and the environment influence the
stressor-strain relationship (Lazarus, 1999, 2001). However, the transactional model
differs in that through the appraisal of stressors, we can forecast if strains will develop
(Lazarus, 1999, 2001). Lazarus’s (1999, 2001) theory differentiates between two types of
appraisal: primary appraisal and secondary appraisal. Primary appraisals are when a
person acknowledges that he or she has something “at stake” (Lazarus, 1999, p. 76), and
this can result in four appraisal types: harm/loss, threat, challenge, and benefit (Lazarus,
2001). The way in which an individual appraises a situation will determine how he or she

17
copes, and in turn, the strains or outcomes that develop. In comparison, Lazarus (1999)
defines secondary appraisals as “constantly changing cognitive and behavioral efforts a
person makes to manage specific external or internal demands that are appraised as
taxing or exceeding the resources of the person” (p. 110). These definitions of appraisal
are rooted in P-E fit theory; however, they are not the intended focus of the current study.
Instead, this study focuses on a different cognitive factor: values. The study of value
congruence at the most basic level posits a transactional relationship as congruence is
based on the person (i.e., the individual’s perception of his or her own values) and the
environment (i.e., the individual’s perception of his or her organization’s values) together
influencing the stressor-strain relationship.
Beehr and Newman’s Facet Model of Occupational Stress. Beehr and
Newman’s (1978) model depicts occupational stress through personal and environmental
facets that lead to consequences affecting the individual and organization. However, a
feature of this theory is its inclusion of a time facet, which is often overlooked in
occupational stress research and theory (Beehr, 1995), likely due to the facet’s lack of
clarity (Beehr, 1998). It is essential to study stressors over time because of the nature of
the study variables. While values remain relatively stable over time (Rokeach, 1973),
environmental conditions change (e.g., perception of role stressors), allowing for the
study of how values may influence stressor-strain outcomes. Role stressors, particularly
role ambiguity and role conflict, are chronic stressors, meaning they occur over time, thus
are associated with strains when studied in long-term research (Beehr, 1998). In
comparison, acute stressors occur in the short-term (e.g., a nurse meeting a new patient).
Additionally, the nature of the strains proposed by a lack of P-E fit suggest that
time plays a role in the stressor-strain relationship, as individuals simply do not
experience outcomes, such as burnout, overnight. Indeed, Leiter and Maslach (2009)
stipulated that burnout results from prolonged exposure to stressors over time. Although
researchers (e.g., Han et. al., 2015; Kim & Stoner, 2008; Siegall & McDonald, 2004)
examined the effects of stressors on burnout and turnover intention, most have not
examined the development of burnout and turnover intention due to on-going experiences

18
of stressors in a longitudinal-style design (an exception is Beehr et al.’s, 2000, study that
looked at chronic versus acute stressors in door-to-door booksellers and found that
chronic stressors had larger effect sizes on strains than acute stressors). Therefore, in this
study I test if exposure to stressors over time percolates into strains by testing whether
stressors at T1 influence burnout and turnover intention ratings at T2.
Attraction-Selection-(Socialization)-Attrition. The Attraction-Selection-
(Socialization)- Attrition (AS(S)A) framework is a four-part process used to explain the
tendency for employees to work at organizations that hold similar organizational values
to their own. This framework firmly links the Attraction-Selection-Attrition model with
research on socialization and suggests that the socialization process is a part of employee-
organization homogeneity (Schneider et al., 1998). The first step of the process is
attraction, which is the degree to which an applicant perceives an organization as an
appealing place of employment. The appeal may be due to the perception that the
organization endorses values that are consistent with the applicant’s values (i.e., value
congruence; Nameth & Staw, 1989 as cited by Edwards & Cable, 2009). Selection is the
organization’s method for choosing applicants who appear to have the qualifications
required for the organization. The applicant is also part of this step, as she or he decides
to join (or not) upon an offer. Both parties may consider if their values align with the
other.
After the selection process, employees are integrated into their new work
environment through the process of socialization. Organization’s reinforce its values
through implicit and explicit practices, policies, procedures, and rewards and sometimes
corrective actions (Van Maanen & Schein, 1979). If individuals do not feel comfortable
with the socialization process (e.g., training), they will likely leave the organization or the
organization will terminate the person. The attrition process can be influenced by value
congruence because individuals may leave the organization when they perceive that their
values are not aligned with the organization’s values (Cable & Parsons, 2001).
The AS(S)A framework is a work-based application of P-E fit through value
congruence. It is essential to include this framework because it highlights that value

19
congruence affects every stage of the cyclical job process, from job seeking to selection
and socialization, to retention or attrition. Thus, it is essential to examine the variable of
value congruence as it directly relates to the socialization and attrition facets of the
AS(S)A model.
Organizations that use training or employee performance feedback discussions to
socialize its incumbents are normally impressing upon the incumbents the organization’s
values by rewarding and disciplining on organizational processes and practices. Through
reinforcements and punishments, the processes and practices are instilled and inform
incumbents of the company values. Thus, values are a common construct measured in P-
E fit studies (Verquer et al., 2003). Indeed, because values are motivational states, which
influence a person’s experiences in the organization, organizations are keen on imparting
these values as swiftly as possible. However, personal values are not the same as
organizational values.
Personal values transcend situations and thus affect individuals’ interpretations of
stressors and outcomes (Schwartz, 1992). Interacting with perceived organizational
values, value congruence has direct effects on well-being. For example, in a study of
1,129 German adolescents, person-environment value congruence was positively
correlated with satisfaction with life, although effect sizes were low (Musiol & Boehnke,
2013). Additionally, in a study of 1,261 students and adults from Israel and former East
and West Germany, Sagiv and Schwartz (2000) found strong positive relationships
between value congruence and well-being. In this study that utilized Schwartz’s (1992)
10 basic values, the congruence of achievement and power (self-enhancement) values
was significantly stronger related to well-being than the congruence of universalism and
benevolence (self-transcendence) values. The findings of Sagiv and Schwartz’s (2000)
study suggest that the strength of the relationship between value congruence and well-
being may be influenced by the type of value (e.g., benevolence vs. power). This study
expands on the findings of Sagiv and Schwartz (2000), suggesting that categorizing
values as ‘healthy’ or ‘unhealthy’ may help explain the differences in the effect value
congruence has on stressor-strain relationships.

20
Values
Defining Values. Rokeach (1973) defined a value as “an enduring belief that a
specific mode of conduct or end-state of existence is personally or socially preferable to
an opposite or converse mode of conduct or end-state existence” (p. 5). Drawing on
Rokeach’s work, Schwartz (1992, 2012; Schwartz & Bilsky, 1987) defines values as
beliefs about desirable goals or guiding principles important in one’s life. Values are not
domain specific; across situations, values (a) motivate what people attend to, (b) how
stimuli are interpreted, and (c) how they respond to stimuli. People tend to strive to
reduce impediments to goal fulfillment and, therefore, when people are impeded from
fulfilling their values, they may experience a reduced sense of well-being (Sagiv &
Schwartz, 2000). Values are hierarchically ordered in people’s minds; therefore, values
that are more important, but blocked from fulfillment, will likely be more detrimental to
well-being than values that are lower on the hierarchy. The relative importance of values
differs between individuals and, therefore, represent a cognitive-motivational state that
differs from norms or attitudes (Schwartz, 1992, 2012).
Basic Human Values. Schwartz (1992) categorized 45 individual values into 10
basic human value types: Achievement, benevolence, conformity, hedonism, power,
security, self-direction, stimulation, tradition, and universalism (see Appendix B).
Schwartz proposed competing values structures that have been found consistently across
culturally distinct samples, although value strength differs (Schwartz & Bardi, 2001).
That is, the value types are represented around a circular continuum to emphasize that
some values are compatible and others conflicting with one another (see Figure 2).
Values that are incompatible have competing interests; some values promote growth and
self-expansion, and others self-protection. In other words, the value structure proposed by
Schwartz highlights that when an individual highly favors a particular value (e.g.,
benevolence) they are thus less likely to highly favor a value that competes with that
favored value (e.g., power), as these value structures have distinct, opposing
characteristics.

21
Figure 2. Relations among ten value types (adopted from Sagiv & Schwartz, 2000 with
copyright permission provided by John Wiley and Sons and Copyright Clearance Center).
Healthy Values. Sagiv and Schwartz (2000) classified 9 of the 10 value types
(hedonism was excluded), as either healthy or unhealthy. Values that positively relate
with happiness and well-being (e.g., achievement) were labeled as healthy values,
whereas values that decreased happiness and well-being were labeled as unhealthy values
(see Table 1). Although some of the hypotheses of this study were not fully supported,
Sagiv and Schwartz posed some theoretical explanations for the relationship between
(un)healthy values and well-being which are theoretically useful to understanding the
impact that healthy value congruence may have on the stressor-strain relationship. The
first explanation suggests that an individual’s attainment of subjective well-being
stimulates pursuit of healthy values, such that when a person is well, he or she tends to
endorse healthier values (Sagiv & Schwartz, 2000). This explanation forwards a reverse-
causal relationship from well-being to values. However, because most researchers have
found that values endure over time (Rokeach, 1973), and deeply held principles may

22
shape how people interpret stimuli and, consequently, develop (or not) strains, it is not an
explanation that supports the premise of the study, nor other studies. Instead, this study
proposes that because values shape cognition (Schwartz, 1992), and the cognitive
appraisal of stressors influences outcomes (Lazarus, 1999; Lazarus & Folkman, 1987),
values influence the extent to which role stressors relate to strains. The theoretical
explanation of growth and deficiency needs connects values to needs, and might better
explain why some values may be more likely to influence subjective well-being (Bilsky
& Schwartz. 1994).
Maslow (1955, as cited in Bilsky & Schwartz, 1994) proposed that individuals
seeks to satisfy deficiency needs (e.g., health, safety) when they feel deprived. In fact,
when these deficiency needs are satisfied, these needs become less important to the
individual, or even inactive. That is, deficiency needs represent a gap between a desired
standard and the individual’s current state. Once the gap between standards and reality is
closed, an individual no longer needs to seek these needs and can pursue higher-level
needs (i.e., growth needs). In comparison, growth-needs (e.g., self-actualization)
represent that which an individual seeks to satisfy even after high levels of satisfaction
have been obtained. In summary, although an individual may cease to pursue deficiency
needs once a perceptual gap between standards and reality closes, no such standard exists
for growth needs. Instead, the individual continues to pursue the need, even after the
needs are satisfied.
Bilsky and Schwartz (1994) built on Maslow’s (1954, 1955, as cited by Bilsky &
Schwartz, 1994) work that related values to needs, and classified (a) achievement, (b)
benevolence, (c) self-direction, (d) stimulation, and (e) universalism as growth needs
values, and (a) conformity, (b) security, and (c) power as deficiency needs. The research
by Bilsky and Schwartz (1994) proposed that values could be conceptualized as being
motivated by either growth or deficiency needs, and as values are motivating factors that
influence behaviors, individuals who endorse deficiency needs values will pursue
behaviors to compensate for deprivation. Sagiv and Schwartz (2000) further proposed

23
that specific values classified as either growth or deficiency needs may be theoretically
related to subjective well-being.
Goal realization relates to a positive perception of well-being (Sagiv & Schwartz,
2000). Thus, an individual who prioritizes growth needs values (e.g., benevolence) is
likely to have a higher perception of his or her well-being because he or she is actualizing
goals associated with such values. Values that are not actualized decrease in importance
because individuals seek to endorse values they are able to realize. In comparison,
deficiency needs values (e.g., power) are often endorsed to compensate for deficiencies.
Rather than contributing to positive well-being, actualizing these values simply reduces
an individual’s negligence of their basic needs. Said another way, individuals who
endorse deficiency values are unable to reap the positive benefits of goal-attainment
because they are solely aiming to reach a basic standard of functioning. Indeed, Sagiv and
Schwartz (2000) suggested that individuals who prioritized deficiency needs were more
likely to feel powerless, threatened, and unsafe, and thus report lower well-being than
individuals who endorsed growth needs values. Similar to Herzberg’s (1974)
motivational model, this study proposes that two separate outcome continua exist for
deficiency needs values (i.e., hygiene factors) and growth needs values (i.e., motivational
factors). Although prioritizing growth needs values is thought to increase perceived well-
being, prioritizing deficiency needs values decreases the perception of negative well-
being, instead of simply decreasing positive well-being. That is, individuals who attempt
to close the gap between basic human needs and reality by endorsing deficiency needs
values are not viewed as existing on the positive well-being continuum, but rather being
absent of positive well-being. Thus, although goal-attainment is an important piece in
understanding the motivational role of values, some values, though motivating, do not
promote well-being; people holding such values continue to strive to fulfill the deficient
need.
Based on the conceptualization of growth and deficiency needs values, Bilsky and
Schwartz (1994) classified (a) achievement, (b) benevolence, (c) self-direction, (d)
stimulation, and (e) universalism as growth (i.e., healthy) needs, and (f) conformity, (g)

24
power, and (h) security values as deficiency needs (i.e., unhealthy) values. Sagiv and
Schwartz (2000) later used similar reasoning to identify tradition as an unhealthy value.
Based on the conceptualization of grown and deficiency needs, Sagiv and Schwartz
added that the value of tradition is unhealthy, while excluding the value of hedonism
from healthy or unhealthy classifications (see Table 1).
Table 1
Definitions of Value Types and Health Classification
Values Goals
Health
Classification
Achievement Personal accomplishment according to social tenets. Healthy*
Benevolence Improving the wellbeing of the ‘in group.’ Caring,
trustworthiness, accountability, compassionate,
Healthy
Conformity Restraint of impulses that would violate social
norms. Compliance, self-control, courtesy.
Unhealthy
Hedonism Pleasure and sensuous gratification for oneself Unclassified
Power Status, control, and dominance. Unhealthy
Security Sanctuary, peace, and stability of society,
relationships and of self.
Unhealthy
Self-Direction Autonomous thought, choosing, and exploration,
curious.
Healthy*
Stimulation Excitement, novelty, and challenge in life. Healthy*
Tradition Reverence and commitment of cultural and religious
customs.
Unhealthy*
Universalism Appreciation and defense for all people and for the
environment.
Healthy
Note. *Asterisk represents values that were supported as influencing subjective well-
being in Sagiv and Schwartz’s (2000) Healthy Values model. Hedonism was excluded
from the healthy or unhealthy categorization, consistent previous research and theory
(Sagiv & Schwartz, 2000).
Whereas Sagiv and Schwartz (2000) analyzed the relationship between (a) value
congruence and well-being and (b) healthy values and well-being (in two
separate studies), the present study expands this previous work, by examining the
implications of a newly created variable, healthy values congruence. Indeed, Sagiv and
Schwartz (2000) conceptually propose, but do not test healthy value congruence. They
argued that no value types were inherently healthy or unhealthy, but that value

25
congruence with the environment (e.g., organization’s values) played a role in impacting
positive or negative outcomes. Drawing on previous research (Bilsky & Schwartz, 1994;
Sagiv & Schwartz, 2000), growth needs values are expected to positively correlate with
well-being.
I present two reasons for the anxiety-avoidant and anxiety-free values and their
association with health. It is possible that when someone endorses growth values (e.g.,
achievement) and is able to actualize these values, higher well-being and lower anxiety
ensues (Sagiv & Schwartz, 2000). However, when people do not achieve their goals to
actualize growth values (due to lack of resources or another cause), growth values
decrease in importance, and they strive toward deficiency values (e.g., power), which
may reduce inherent anxiety (Sagiv & Schwartz, 2000). Growth values are theorized to
positively correlate with measures of well-being, and negatively correlate with measures
of anxiety.
General Well-Being and Job-Related Anxiety. In their study of healthy value
priorities, Sagiv and Schwartz (2000) investigated healthy values using Schwartz’s
(1992) theory of basic values, which identified 10 value types that guide individuals in
life. To test the hypothesis that endorsing some value types may be more related to health
outcomes, Sagiv and Schwartz (2000) examined subjective well-being, using measures of
affective well-being and cognitive well-being. Values identified as healthy correlated
positively with subjective well-being, whereas values identified as unhealthy correlated
negatively with subjective well-being. Before examining healthy values as a moderator
variable in the relationship between role stressors and outcomes, the current study sought
to examine potential indicators of well-being (i.e., anxiety and general well-being), in
order to procure evidence that healthy values exist.
Wright, Cropanzano, and Bonett (2007) define well-being as an affective or
emotional experience that is related to healthy psychological functioning. The impact of
values on well-being have been examined in research, most notably by Sagiv and
Schwartz (2000), who proposed their theory of the existence of healthy and unhealthy
values. However, other research avenues have targeted how values may affect well-being.

26
In a study of 92 business students, Kasser and Ahuvia (2002) found that money, image,
and popularity values were related to lower well-being scores, even when an individual’s
environment supports these values. Furthermore, Burroughs and Rindfleisch (2002)
attempted to examine value incongruence in the materialism value, finding that the
interaction between materialism and cultural values (i.e., collectivism-oriented values)
significantly predicted psychological tension. They found that values focused in
materialism may not be beneficial for well-being, especially when they are incongruent
with generally-accepted cultural values.
Anxiety has been examined as a physio-psychological sensation, resulting from
an individual’s perception of stressors (Glazer & Beehr, 2005). That is, anxiety is an
initial reaction to perceived stressors. An example of anxiety is feeling tense. Job-related
anxiety adjusts the target of anxiety to focus on physiological and psychological feelings
about the job. Job-related anxiety has been examined in numerous studies, such as Glazer
and Kruse (2008) who found a positive relationship between job-related anxiety and
intention to leave in 506 Israeli nurses. In a summary of correlates of well-being, Warr
(1990) reported that anxiety is an affective state resulting from a combination of high
arousal and low pleasure. Further, anxiety was proposed as an indicator of well-being,
such that individuals had lower levels of affective well-being based on more negative
responses on either the arousal or pleasure dimensions. That is, anxiety represents an
indicator of less affective well-being.
Although general well-being and job-related anxiety only target affective well-
being, and thus fail to include cognitive well-being, it is arguable that they still present
indicators of subjective well-being, as examined in Sagiv and Schwartz’s (2000) study of
healthy values. In the present study, general well-being was conceptualized as a positive
indicator of well-being, whereas job related anxiety was examined as a negative indicator
of well-being, which is consistent with literature (Warr, 1990; Wright et al., 2007). Thus,
I propose that healthy values should positively correlate with general well-being and
negatively correlate with job related anxiety.

27
Value Congruence. Value congruence derives from the concept of P-E fit
(Bocchino et al., 2003; Edwards & Cooper, 1990) and refers to the degree to which an
individual’s values are similar to those of others or an organization (Cable & Edwards,
2004). For the most part, studies have shown that value incongruence plays an important
role in reducing well-being and motivation, and increasing strains and lethargy (Bao et
al., 2013; Edwards & Cooper, 1990; Verquer et al., 2003), though a small degree of
incongruence between the individual and organization may be motivating (Argyris, 1964,
as cited in Verquer et al., 2003). Individuals with similar values as their organization
typically (a) share the goals of the organization (Bao et al., 2013), (b) have a positive
psychological relationship to work (Leiter, Gascon et al., 2009), and (c) experience
greater subjective well-being (Sagiv & Schwartz, 2000) compared to people whose
values are not congruent with their organization.
Given the argument that personal healthy values are expected to buffer the
relationship between stressors and strains, and that incongruence of healthy values is
expected to intensify the stressor-strain relationships, the present study tests the
moderating effects of healthy values congruence on the stressor-strain relationship. In
particular, when an organization is perceived to maintain the same healthy values as the
person upholds, the negative effects of stressors on strains will be mitigated. In contrast,
when the person’s healthy values are met with a perception of the organization as not
upholding those values, the relationship between stressors and strains will intensify.
These expectations are predicated not only on research findings relating values or value
congruence with stress-related variables, but also on occupational stress and health
theories.
Alternative Frameworks
The focal theoretical basis for the present study is P-E Fit theory, however other
occupational stress frameworks, developed over the years, are presented as additional
support for the models employed in this study.
The Michigan Model. The Michigan Model, also known as the Institute of Social
Research model, developed in 1962, is one of the first models to examine occupational

28
stress (Mark & Smith, 2008). The Michigan model emphasizes personality and subjective
appraisal of stressors. The theory stipulates that an individual’s perception of the work
environment affects an individual’s physical and mental health. The focus on individual
perception overlaps with the P-E fit framework, but values are not personality nor do they
represent appraisal of stressors, rather they are beliefs of what is important, and therefore
guide how stressors are appraised, as becomes evident in whether strains ensue.
Job Demands-Control Model. In the Job Demands-Control (JDC) model,
Karasek (1979) argues that job demands and work control interact to affect the wellbeing
of employees. When job demands are high, but work control is low, a person’s job is said
to be in a high strain job. When job demands are low and work control is low, a person’s
job is said to be passive. A person’s job is considered active when job demands are high
and work control is high. Finally, a low-strain job is characterized by low demands and
high control (Dewe et al., 2012; Karasek, 1979). Some studies have found empirical
support for the JDC model, particularly as it relates to burnout (e.g., Demerouti et al.,
2001; Proost, De Witte, De Witte, & Evers, 2004). However, others have not found
support for the JDC model (e.g., Beehr, Glaser, Canali, & Wallwey, 2001). For example,
Bao et al. (2013) argued that balancing demands with sufficient resources does not
sufficiently explain why some individuals in the same environmental conditions
experience burnout though others do not. This rationale suggests that the environment is
not the sole influencer of stressor-strain relationships, but that the interaction between the
person and environment may interact with job demands to influence outcomes.
Combining the notion of control with that of P-E fit, I assert that one way an employee
may experience a sense of control over the work environment is when the personal values
and the values of the organization align. Thus, in line with the JDC, high job demands
and low value congruence could yield a high strain job. However, control is more
situational and dynamic than values, which transcend situations and are stable. Therefore,
the JDC model is an influential, but not the prime theoretical model guiding this study.
Conservation of Resources. The Conservation of Resources (COR) theory
(Hobfoll, 2001) is markedly similar to P-E fit theory, as both theories examine (a) the

29
interaction between the person and the environment, and (b) the relationship between
environmental demands and individual resources (Dewe et al., 2012). However, the
models differ methodologically in that P-E fit mostly focuses on measuring stressors
using individuals’ perceptions, whereas Hobfoll (2001) argues that COR theory
incorporates more objective measures of the environment, such that many resources (e.g.,
medical insurance, savings or emergency money) are determined objectively. COR
theory considers (a) subjective, (b) objective, and (c) sociocultural elements of stressors,
and also argues that the importance of subjective indicators of stressors has been
inaccurately inflated and as such, focuses on objective components of stressors (Hobfoll,
2001). Thus, although the COR theory’s basic premise, that stressors can cognitively
drain an individual’s resource reservoir, is valid and recognized in the transactional
model, COR theory does not adequately attend to individual differences that may affect
stressor appraisals (Lazarus, 2001), such as perceived value congruence.
Nonetheless, drawing on the COR theory, the current study labels healthy values
as resources. Hobfoll (2001) defined resources as anything important to the individual
that in turn supports his or her well-being, and specifically identified categories of (a)
personal or (b) environmental resources. Even though Hobfoll (2001) has identified
values as a resource, research has not clarified whether values are conceptually personal
or environmental resources. This study seeks to extend previous resource literature,
defining values as both personal and environmental resources, where personal healthy
values represent personal resources, and organizational healthy values represent
environmental resources. If personal and organizational healthy values each represent a
resource, then congruence of these values (i.e., value congruence) may serve as an
additional resource, mitigating the effects of stressors on well-being. Thus, I propose that
personal healthy values will buffer the stressor-strain relationship.
Moreover, focusing on healthy values can further help explain why some
individuals experience burnout and turnover intention, but other individuals are less
prone to these strains. Indeed, when an employee perceives that the organization does not
endorse healthy values any ameliorative impact personal healthy values would otherwise

30
have, may be compromised. Thus, studying perceptions of an organization’s healthy
values as a resource that promotes well-being and aligns with individuals’ healthy values
presents an opportunity to dive deeper into understanding how values impact the extent to
which role stressors affect strains.
Measuring Person-Environment Fit
Despite both theoretical and methodological drawbacks of the P-E Fit theory (see
Edwards & Cooper, 1990), its merits outweigh the drawbacks. P-E Fit theory focuses on
individuals’ perceptions of their own values and the values of the organization. Fit can be
measured subjectively, perceptually, or objectively (Kristof, 1996; Verquer et al., 2003).
Subjective P-E fit measures study how well the individual believes his or her
characteristics fit with the organization. In perceived P-E fit measures, respondents
describe or rate themselves on some characteristics and then describe or rate their
organization on similar characteristics, which are then used together to identify fit
(Verquer et al., 2003). Finally, objective fit involves a comparison of the individuals’
self-reported characteristics to the organization’s characteristics as reported by other
people deeply embedded within the organization (e.g., Head of Human Resources;
Verquer et al., 2003).
Researchers have argued that subjective fit measures are better correlates of self-
reported attitudinal outcomes than objective or perceived fit, because subjective fit and
self-reported outcomes directly reflect a person’s perceptions, whereas objective and
perceived fit are determined through calculations of self-reported attitudes and reports of
others’ attitudes (Kristof-Brown et al., 2005; Verquer et al., 2003). However, subjective
fit does not allow researchers to distinguish between individual and organizational values,
because the single measure fails to compute difference scores or correlations (Verquer et
al., 2003). Thus, the perceived fit measure identifies a more complex model of fit,
provides a fuller range of value perceptions, and enables researchers to observe the
degree and direction of incongruence (e.g., whether individual’s healthy values exceed
the organization’s perceived healthy values). Additionally, by employing a perceived,
instead of a subjective fit measure, I am potentially reducing a sense of onus on the

31
individual to better fit the organization, suggesting that perhaps the organization needs to
change to better fit the needs of its incumbents. This study utilizes a perceived measure of
P-E fit.
There are several ways to calculate perceived fit, including difference scores or
intra-individual correlations. The former, which utilizes absolute scores to determine fit,
is oftentimes discouraged in P-E fit research (see Edwards & Cooper, 1990). However,
the latter is consistent with the definition of values, stipulating that values are ordered in a
cognitive hierarchy based on their importance (Schwartz, 1992, 1994, 2012).
Summary
Even though past studies have linked burnout to turnover intention (Boamah &
Laschinger, 2016; Leiter, & Maslach, 2009), none have done so in a multifaceted model
that links role stressors to burnout and turnover, as moderated by healthy values
congruence. Thus, this study makes four important contributions. First, by using a
longitudinal survey design, I evaluate the implications of stressors on strains over time
(Beehr & Newman 1978; Zapf et al., 1996). Second, I test whether the value types
introduced in Sagiv and Schwartz (2000) values typology reflect healthy vs. unhealthy
values. Third, this study focuses on personal healthy values as a cognitive-motivational
trait that can mitigate when stressors influence strains (Sagiv & Schwartz, 2000). Finally,
extending studies that have looked solely at value congruence in relation to strain
(Boamah & Laschinger, 2016; Maslach & Leiter, 1997), or healthy values in relation to
well-being (Sagiv & Schwartz, 2000), I test if perceived organizational healthy values
interact with personal healthy values to moderate the stressor-strain relationship. That is,
I test if healthy values congruence buffers the stressor-strain relationship (see Figure 3).
Hypotheses and Research Questions
H1: (a) Role ambiguity, (b) role conflict, and (c) role overload at T1 will each positively
correlate with burnout at T2.
H2: (a) Role ambiguity, (b) role conflict, and (c) role overload at T1 will each positively
correlate with turnover intention at T2.

32
R1: Do healthy values (i.e., achievement, benevolence, self-direction, stimulation, and
universalism) negatively correlate with anxiety and positively correlate with well-
being, and do unhealthy values (i.e., conformity, power, security, and tradition)
positively correlate with anxiety and negatively correlate with well-being?
R2: Do each of the personal healthy values (i.e., achievement, benevolence, self-direction,
stimulation, and universalism) negatively relate to role stressors?
H3: Each personal healthy value (i.e., achievement, benevolence, self-direction,
stimulation, and universalism) will negatively relate with (a) burnout and (b) turnover
intention.
H4: Each healthy value congruence will negatively relate with (a) burnout and (b)
turnover intention.
H5: The positive effects of stressors (T1) on strains (T2) will be weaker due to
endorsement of healthy values. More specifically, each personal healthy value will
moderate the stressor-strain relationship, such that endorsing the healthy value will
buffer the relationship between the T1 role stressors (a. role ambiguity, b. role
conflict, and c. role overload) and T2 strains (d. burnout and e. turnover intention).
H6 : Healthy value congruence will moderate the stressor-strain relationships, such that
when healthy values are incongruent, particularly when the person endorses the
healthy values, but perceives that the organization does not, the positive relationship
between role stressors and strains will be stronger than when healthy values are
congruent. Said differently, healthy value congruence will buffer the positive
relationship between stressors and strains (see Figure 3).
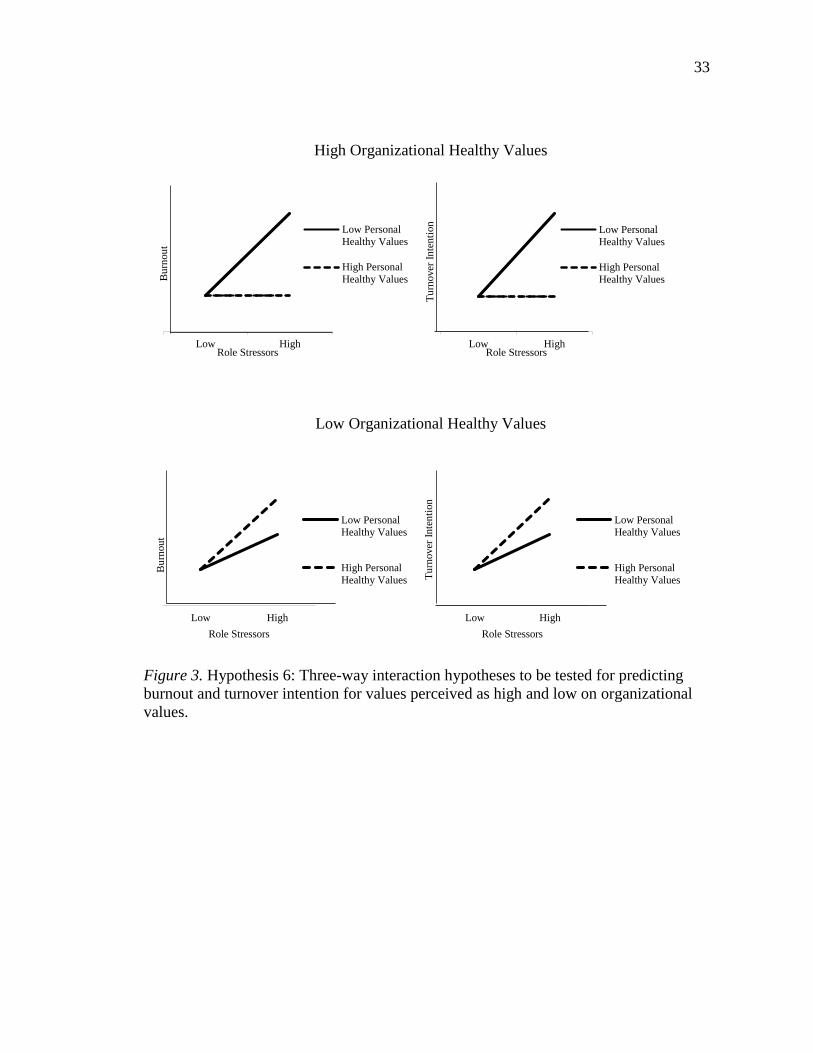
33
High Organizational Healthy Values
Low Organizational Healthy Values
Figure 3. Hypothesis 6: Three-way interaction hypotheses to be tested for predicting
burnout and turnover intention for values perceived as high and low on organizational
values.
Low High
Bu
rnou
t
Role Stressors
Low Personal
Healthy Values
High Personal
Healthy Values
Low High
Tu
rnover
In
ten
tion
Role Stressors
Low Personal
Healthy Values
High Personal
Healthy Values
Low High
Bu
rnou
t
Role Stressors
Low Personal
Healthy Values
High Personal
Healthy Values
Low High
Tu
rnover
In
ten
tion
Role Stressors
Low Personal
Healthy Values
High Personal
Healthy Values

34
METHODS
Procedure
Data used in the current study are archival, sourced from a larger project on stress
and leadership among nurses across cultures. This study was a longitudinal design with
two survey administrations separated by four to five weeks. Data were collected in June
and July 2010. The Principal Investigator presented the purpose and reasoning behind the
study to the nursing leadership team to aid in the understanding and acceptance of the
study in the hospital setting.
Researchers attended nursing leadership meetings to provide the surveys for
dissemination among the nurses. Paper surveys were given to participants, who were able
to take the survey home to complete. All participants were instructed to return surveys
sealed in provided envelopes to Chief Nursing Offices, addressed directly to the Principal
Investigator (who was not a member of the hospitals’ staff).
The original study maintained participant confidentiality through a unique coding
system that matched participants from T1 to T2. In each survey administration,
participants were asked to provide their parents’ given, middle, and last name initials to
generate a code (e.g., David William Mulder and Dana Katherine Anderson would yield
the code DWMDKA).
Additionally, all participants received a ticket to a local theater (a $10 value)
along with the first survey as a token of gratitude and motivator to complete the survey.
As an incentive to complete both surveys, 16 items (valued between $80 and $200) were
raffled in each hospital. To participate in the raffle, nurses had to mark on their T2 survey
that they were interested in participating in the raffle. Along with the T2 survey was a
raffle ticket. The nurse kept one half of the ticket and turned in the other half with his or
her survey. On the back of the submitted raffle ticket, nurses wrote their self-generated
code. Prior to drawing winners for the raffle, only nurses who had surveys matching for
T1 and T2 were entered into the raffle. Winners were informed by posting lists of self-
generated codes around the hospitals.
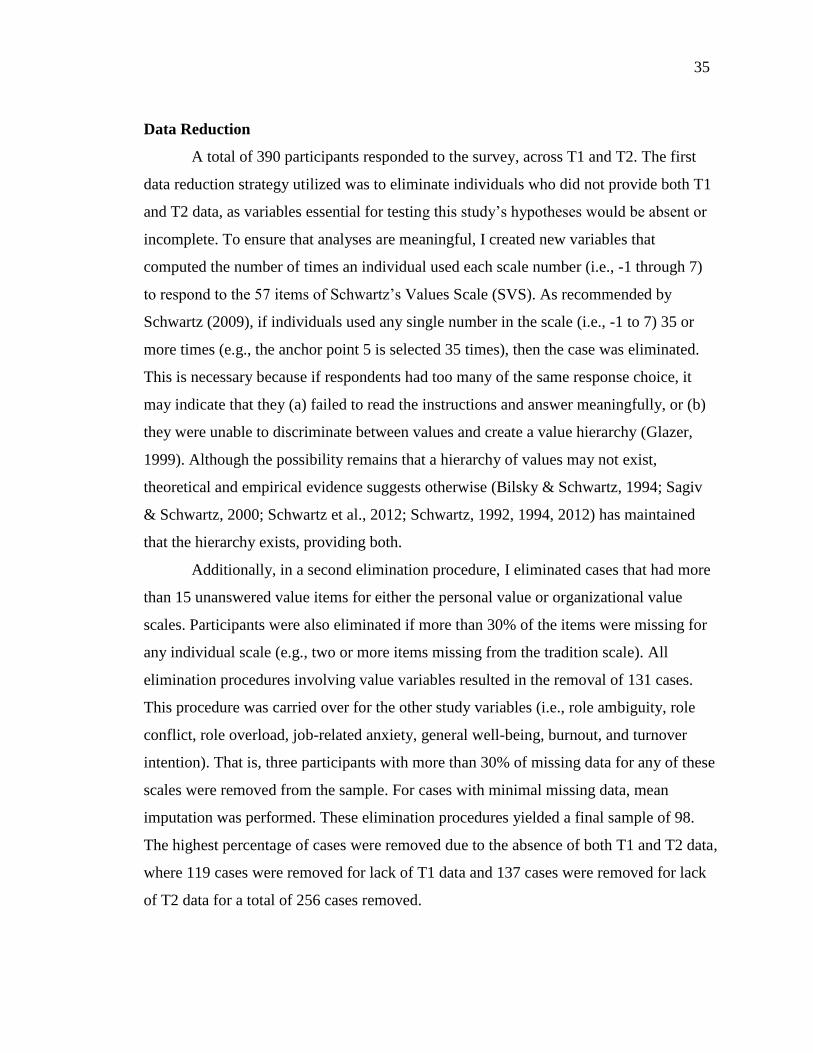
35
Data Reduction
A total of 390 participants responded to the survey, across T1 and T2. The first
data reduction strategy utilized was to eliminate individuals who did not provide both T1
and T2 data, as variables essential for testing this study’s hypotheses would be absent or
incomplete. To ensure that analyses are meaningful, I created new variables that
computed the number of times an individual used each scale number (i.e., -1 through 7)
to respond to the 57 items of Schwartz’s Values Scale (SVS). As recommended by
Schwartz (2009), if individuals used any single number in the scale (i.e., -1 to 7) 35 or
more times (e.g., the anchor point 5 is selected 35 times), then the case was eliminated.
This is necessary because if respondents had too many of the same response choice, it
may indicate that they (a) failed to read the instructions and answer meaningfully, or (b)
they were unable to discriminate between values and create a value hierarchy (Glazer,
1999). Although the possibility remains that a hierarchy of values may not exist,
theoretical and empirical evidence suggests otherwise (Bilsky & Schwartz, 1994; Sagiv
& Schwartz, 2000; Schwartz et al., 2012; Schwartz, 1992, 1994, 2012) has maintained
that the hierarchy exists, providing both.
Additionally, in a second elimination procedure, I eliminated cases that had more
than 15 unanswered value items for either the personal value or organizational value
scales. Participants were also eliminated if more than 30% of the items were missing for
any individual scale (e.g., two or more items missing from the tradition scale). All
elimination procedures involving value variables resulted in the removal of 131 cases.
This procedure was carried over for the other study variables (i.e., role ambiguity, role
conflict, role overload, job-related anxiety, general well-being, burnout, and turnover
intention). That is, three participants with more than 30% of missing data for any of these
scales were removed from the sample. For cases with minimal missing data, mean
imputation was performed. These elimination procedures yielded a final sample of 98.
The highest percentage of cases were removed due to the absence of both T1 and T2 data,
where 119 cases were removed for lack of T1 data and 137 cases were removed for lack
of T2 data for a total of 256 cases removed.

36
Participants
This study was conducted at two hospitals in northern California, United States
and consisted of licensed nurses and registered nurses. Response rates varied but were
relatively consistent such that, after data cleaning procedures, 44 nurses from Hospital 1
completed both surveys and 54 nurses completed both surveys from Hospital 2. For the
purpose of this study, analyses only focus on the 98 nurses from both hospitals (matched
through a self-generated unique code) who completed surveys at T1 and T2 . Due to the
small number of participants that responded to both T1 and T2 surveys within each
hospital, between-hospital comparisons were not analyzed, and p < .10 was used as the
cutoff for significance.
Demographic information, such as age, sex, number of months spent in position,
hours worked weekly, and ethnicity were measured. Participants varied in age, from 26 to
66 years, with a mean of 50.10 years (SD = 9.70). A majority of participants were female
(93.9%), which is consistent with the profession (U.S. Census Bureau, 2013), and many
identified as White, Caucasian, or of European descent (66.3%), or Asian (16.3%).
Additionally, a majority of participants identified their primary job duty as patient care
(67.3%), in comparison to non-direct care (32.7%).
Comparing the 98 participants in the current study to the full sample (N = 390),
the sample utilized for this study had a larger percentage of participants who reported
White, Caucasian, or European descent (63.3%). Additionally, the sample utilized for this
study (n = 98) had more complete demographic data than the full sample (see Table 2). A
full demographic comparison between the full sample of participants and the sample
utilized in this analysis can be viewed in Table 2.
Measures
Data were collected through two survey administrations (T1 & T2) and contained
several different measures, as this was part of a larger research project (a summary of
items used in the current study can be viewed in Appendices B and C). Although values
and burnout were only assessed at either T1 and T2, respectively, other measures were
assessed on both occasions (see Table 3). Values were deemed unnecessary to measure at
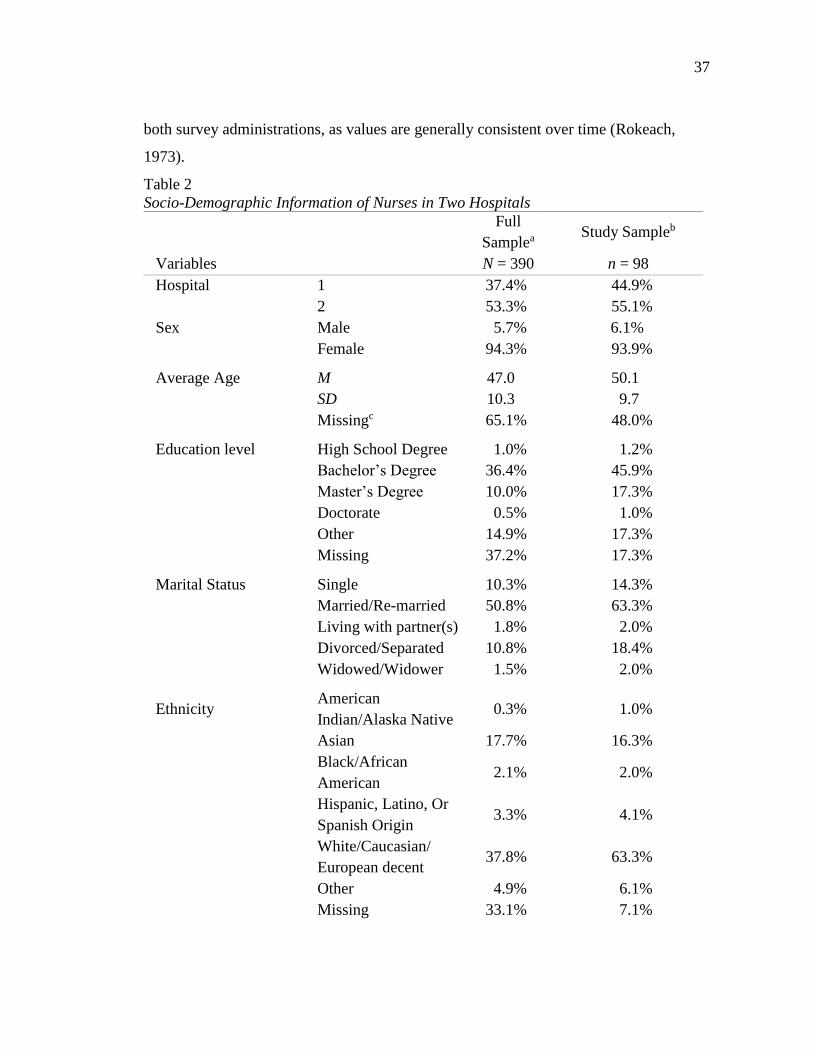
37
both survey administrations, as values are generally consistent over time (Rokeach,
1973).
Table 2
Socio-Demographic Information of Nurses in Two Hospitals
Full
Samplea Study Sampleb
Variables N = 390 n = 98
Hospital 1 37.4% 44.9%
2 53.3% 55.1%
Sex Male 5.7% 6.1% Female 94.3% 93.9%
Average Age M 47.0 50.1 SD 10.3 9.7
Missingc 65.1% 48.0%
Education level High School Degree 1.0% 1.2% Bachelor’s Degree 36.4% 45.9% Master’s Degree 10.0% 17.3% Doctorate 0.5% 1.0% Other 14.9% 17.3%
Missing 37.2% 17.3%
Marital Status Single 10.3% 14.3% Married/Re-married 50.8% 63.3% Living with partner(s) 1.8% 2.0% Divorced/Separated 10.8% 18.4% Widowed/Widower 1.5% 2.0%
Ethnicity American
Indian/Alaska Native 0.3% 1.0%
Asian 17.7% 16.3%
Black/African
American 2.1% 2.0%
Hispanic, Latino, Or
Spanish Origin 3.3% 4.1%
White/Caucasian/
European decent 37.8% 63.3%
Other 4.9% 6.1%
Missing 33.1% 7.1%

38
Number of dependent
children
None 29.2% 56.1%
1 17.7% 22.4%
2 15.9% 10.2%
3 7.4% 8.2%
4 2.8% 2.0%
Missing 26.4% 1.0%
Average Hours
Worked Per Week
1-20 hours a week 3.6% 4.0%
21-40 hours a week 20.8% 27.5%
41-80 hours a week 10.5% 17.2%
Missing 64.6% 51.0%
Primary Job Purpose Patient Care 59.5% 67.3%
Non-Direct Care 14.6% 32.7%
Supervise Others Yes 20.2% 16.3%
No 50.3% 66.4%
Missing 29.5% 3.1%
Note. M = Mean. SD = Standard deviation. aEntire sample of participants who responded
to surveys at Time 1 and Time 2 (including individuals with missing data). b Final sample
of participants included in the study. c Percentage of data coded as missing for individuals
who did not respond to question, or might have lacked accuracy (e.g., age entered as
400).
Table 3
Measures Utilized for the Current Study Based on Survey Administration
Time 1 measures Time 2 measures Time 1 and Time 2 measures
Values (57 items) Burnout (10 items) Role Stressors (10 items)
Job-Related Anxiety (4 items)*
General Well-Being (11 items)*
Turnover Intention (3 items)*
Note. *Although items were measured at both T1 and T2, only T2 scores will be utilized
to test the hypotheses.
Role Stressors (see Appendix C.1). Role stressors were examined as predictor
variables of burnout and turnover intention, thus utilizing T1 and T2 data. Ten items
sourced from Glazer and Beehr (2005) measured role conflict, role ambiguity, and role
overload and all items were averaged to form scores for each individual role stressor, a
process replicated from Glazer and Beehr (2005). Three items were used to measure role

39
ambiguity (e.g., “I have clear, planned goals and objectives for my job”-reverse coded),
three items examined role conflict (e.g., “I work with two or more groups who operate
quite differently”), and four items assessed role overload (e.g., “I receive an assignment
without the work force to complete it”), as examined in Glazer & Beehr, 2005). A
previous measure of role stressors contained five items for each measure, but on the basis
of a multi-country factor analysis, the principle investigator of the original study
shortened the survey to include a representative subset of items. Items on this scale were
rated on a 7-point Likert-type scale ranging from 1 ( “Strongly Disagree”) to 7 (
“Strongly Agree”). The Cronbach alpha reliabilities (T1 & T2) for the role ambiguity (α
=.88; α = .83), role conflict (α =.75; α = .81), and role overload (α =.89; α = .91) scales
were high. Together, the Cronbach alpha reliabilities for the role stressor index were high
for both T1 and T2 (α =.84; α = .86).
Schwartz’s Values Survey (see Appendix B and Appendix C.2). The Schwartz’s
Values Survey is a 57-value (e.g., Equality, Inner Harmony, Social Power, Pleasure,
Freedom, a Spiritual Life) measure that asks individuals to first rate their own values on
the extent to which they are “a guiding principle in my life” and then rate the hospital’s
values on the extent to which they are “a guiding principle” within the organization. The
nine-point rating scale ranged from “opposed to my values or to my organization” (-1)
and “not important” (0) to “of supreme importance” (7). This nonsymmetrical scale
compresses around the lower scale ratings, where ratings 1 and 2 are “unlabeled,” and
expands around higher scale ratings, where ratings 3 through 5 are “important” and “very
important.” Schwartz (2012) suggested this scalar modeling to “map the way people
think about values, as revealed in pre-tests” (p. 10).
Based on the recommendations of previous research (Schwartz, 1992), 45 of these
values were used to calculate19 value types. The reliability coefficients for each value
type, which ranged from .63 to .80 are consistent with previous findings where Cronbach
alpha scores ranged from 0.49 to 0.73 (Sagiv & Schwartz, 2000). Value types were then
grouped based on their designation as “healthy” or “unhealthy,” as defined by Sagiv and
Schwartz (2000). Five value types were designated as healthy: (a) achievement, (b)

40
benevolence, (c) self-direction, (d) stimulation, and (e) universalism, whereas four value
types were designated as unhealthy: (f) conformity, (g) power, (h) security, and (i)
tradition. As in previous research, the hedonism value type was not given a distinction
regarding health (Sagiv & Schwartz, 2000). Although value types are categorized into
healthy, unhealthy, or unclassified categories, each value type’s impact on the
relationship between role stressors and burnout and turnover intention were analyzed.
Burnout (see Appendix C.3). Ten items were used to assess burnout, which Pines
and Aronson (1988) refer to as tedium. An example item is “When you think about your
work overall, how often do you feel trapped?” Items were rated on a 7-point Likert-type
scale ranging from 1 ‘never’ to 7 ‘always.’ This measure was administered at T2 only.
The Cronbach’s alpha score for the burnout scale was high (α =.87).
Turnover Intention (see Appendix C.4). Turnover intention was measured using
three items adapted from Glazer and Beehr (2005). An example item is: “I will actively
look for a new job in the next year.” Items were assessed on a 7-point Likert-type scale
ranging from 1, ‘strongly disagree’ to 7, ‘strongly agree.’ Cronbach’s alpha coefficients
for T1 and T2, respectively, were high (α =.87; α = .86).
General well-being (see Appendix C.5). Eleven items were modified from
Goldberg and Hillier’s (1979) General Health Questionnaire (GHQ-12) to measure
physical and psychological distress. The original GHQ consists of twelve items, but the
original survey administration did not include the item “felt constantly under strain,”
because it does not operationalize strain and may confound results. “I” statements were
added to each item in order to remain consistent with other survey items. For example,
the statement “feeling unhappy or depressed” was reworded to “I have been feeling
unhappy or depressed.” Additionally, the scale was modified in order to remain
consistent with other measurement scales used in the survey. The 4-point scale ranging
from 1 ‘not at all’ to 4 ‘very often’ was altered to a seven-point Likert-type scale, ranging
from 1, ‘strongly disagree’ to 7, ‘strongly agree.’ The Cronbach’s alpha reliabilities for
the general well-being scale were strong at T1 and T2 (α =.83; α = .82).

41
Job-Related Anxiety (see Appendix C.6). Job-related anxiety was measured
using four items adapted from Parker and DeCotiis’ (1983, as cited in Glazer & Beehr,
2005) 15-item questionnaire. An example item is: “Sometimes when I think about my job
I get a tight feeling in my chest.” Items were assessed on a 7-point Likert-style scale
ranging from 1, ‘strongly disagree’ to 7, ‘strongly agree.’ The Cronbach alpha
reliabilities for the job-related anxiety measure were strong at both T1 (α =.92) and T2 (α
= .88). This study only utilizes T2 scores.
Data Analysis
Hypotheses 1 and 2 were tested using correlational analyses, controlling for
stressors at T2. Correlational analyses were also employed to address Research Question
1. Value variables were used in correlational analyses to test Research Question 2, and
Hypothesis 3.
Prior to testing the remaining hypotheses and research questions, interaction
variables were computed to test the two-way and three-way moderating effects of values
and value congruence, respectively. In each analysis, the predictors (i.e., role ambiguity,
role conflict, and role overload), as well as the proposed moderators (e.g., benevolence
personal value) were centered to reduce the influence of multicollinearity on results. I
created interaction variables between each role stressor (e.g., role ambiguity; RA), and
each personal value (PV) type (e.g., Achievement personal value or ACPV) to form two-
way interactions (e.g., RAxACPV) and each role stressor (e.g., RA), each personal value
type (e.g., ACPV) and each perceived organizational value type (e.g., Achievement
organizational value or ACOV) to form three-way interaction variables (e.g.,
RAxACPVxACOV).
In order to examine any significant three-way interactions, two-way interactions
between stressors and personal healthy values for high and low organizational healthy
value types were compared (Figure 3). Hypothesis 4 was examined using correlational
analyses. Both Hypothesis 5 and Hypothesis 6 were examined using moderated
regression analyses. Due to the small sample size, in order to probe the interaction
effects, a median split technique was employed, such that for two-way interactions,

42
participants were divided into two groups, one below the personal value type median and
one above the personal value type median (e.g., ACPV Low, ACPV High). In order to
probe three-way interactions, these two groups were also subjected to a median split once
more, such that one group was below the organizational value type median, and another
group was above the organizational value type median, forming four groups overall. An
example of the proposed probing technique for a three-way analysis is modeled in Table
4.
Table 4
Example of Probing Analysis Using Median Split Technique for Three-Way Interaction
Effects
Two-Way Interaction Slope Analysis Three-Way Interaction Slope Analysis
ACPVa Low ACOVb Low
ACOV High
ACPV High ACOV Low
ACOV High
Note. a Achievement Personal Value. b Achievement Organization Value.

43
RESULTS
Correlational Analysis of Main Study Variables
In order to test Hypotheses 1 and 2, I performed correlation analyses of the main
study variables, T1 and T2 role stressors and T2 strains (see Table 5). Hypothesis 1 stated
that role ambiguity, role conflict, and role overload at T1 would positively correlate with
burnout, after controlling for the same stressors at T2. Hypothesis 2 stated that role
ambiguity, role conflict, and role overload at T1 would positively correlate with T2
turnover intention, after controlling for the same stressors at T2. This study does not
utilize statistical forms of control, rather it utilizes temporal control. That is, this study
reduces the potential for common method bias because although all measures were
collected via self-report survey, T1 role stressors are temporally distinct from T2
outcomes. Correlating T2 role stressors with T2 outcome variables could possibly
compound on common method error, but to examine T1 role stressors with T2 outcomes
avoids this difficulty because temporally, T2 role stressors did not yet exist at T1
measurement (i.e., they were yet to be measured). Hypotheses 1 and 2 received mixed
support. T1 role conflict (r = .25, p < .05) and T1 role overload (r = .35, p < .01)
significantly correlated with T2 burnout, however the correlation with T1 role ambiguity
was not significant (r = .16, ns). Furthermore, T1 role ambiguity (r = .24, p < .05) and T1
role overload (r = .29, p < .01) significantly correlated with T2 turnover intention, but the
correlation with T1 role conflict (r = .14, ns) was not supported.
Next, to ensure job-related anxiety and well-being are indeed on opposing sides of
a spectrum to assess healthy and unhealthy values, their correlation was determined to be
strong and negative (r = -.57, p < .01). Additionally, anxiety and burnout (r = .51, p <
.01), and well-being and burnout (r = -.67, p < .01) yielded strong correlations, in the
expected directions.
Value Correlations. Value types were developed based on procedures suggested
in the Schwartz (2009) manual for proper use of the Schwartz Value Survey. Although 57
items are included in the Schwartz Value Survey, only 45 of the items are used to
determine the ten value types (see Appendix B). Means, standard deviations, and

44
Cronbach’s alpha scores for each of the values are presented in Table 6. Information
regarding organizational values will be presented later in this thesis for clarity.
Table 5
Means, Standard Deviation, Reliabilities (on diagonal), and Intercorrelations Between
Role Stressors (T1), Anxiety (T2), Well-Being (T2), Burnout (T2), and Turnover Intention
(T2)
Variables M SD 1 2 3 4 5 6 7
1. Role
Ambiguity
2.61 1.11 (.88)
2. Role Conflict 4.40 1.41 .41** (.75)
3. Role Overload 4.40 1.53 .29** .31** (.89)
4. Anxiety 3.44 1.53 .27** .31** .43** (.88)
5. Well-Being 5.43 .74 -.31** -.25* -.21* -.57** (.82)
6. Burnout 2.87 .84 .16 .25* .35** .51** -.67** (.87)
7. Turnover
Intention
2.57 1.40 .24* .14 .29** .32** -.28** .39** (.86)
Note. n = 98. **p < .01, *p < .05.
Table 6
Means, Standard Deviations and Cronbach’s Alpha Reliabilities among Ten Value Types
Variable M SD α
1. Achievement 4.77 0.94 .67
2. Benevolence 5.43 0.78 .69
3. Conformity 4.92 1.02 .65
4. Hedonism 4.05 1.50 .77
5. Power 2.77 1.38 .76
6. Security 4.82 0.98 .62
7. Self-Direction 4.83 0.93 .64
8. Stimulation 3.75 1.46 .76
9. Tradition 3.99 1.33 .72
10.Universalism 4.73 1.01 .80
Note. n = 98.
Values and Outcomes. Research question 1 asked if healthy value types (i.e.,
achievement, benevolence, self-direction, stimulation, and universalism) negatively
correlate with anxiety and positively correlate with general well-being whereas and if
unhealthy value types (i.e., conformity, power, security and tradition) positively correlate
with anxiety and negatively correlate with general well-being. Results of the correlational
analysis did not reveal any significant correlations, though the correlations for some
value types and both anxiety and well-being were in the intended direction (see Table 7).

45
Table 7
Intercorrelations between Schwartz 10 Personal Values, Role Stressors, Anxiety, Well-
Being, Burnout, and Turnover Intention
Variable RAa RC RO ANX GHQ BO TI
Achievementa -.14 .03 .09 .05 -.05 .13 -.05
Benevolence -.20* -.10 .00 -.02 .12 .06 -.26*
Conformity -.17† -.11 -.05 -.05 -.03 -.03 -.19†
Hedonism -.15 .06 -.02 .05 -.20† .20† .05
Power -.16 .02 -.04 .12 -.11 .04 -.01
Security -.28* -.13 -.16 -.05 -.01 .02 -.16
Self-Direction -.18† -.06 -.06 -.01 -.04 -.02 .01
Stimulation -.16 .06 -.10 -.06 .00 .02 .14
Tradition -.22* -.17† -.12 -.02 -.11 .12 -.02
Universalism -.23* -.06 -.07 -.04 .06 -.04 -.11
Note. n = 98. aAbbreviations on the horizonal axis are as follows: Role Ambiguity, Role
Conflict, Role Overload, Anxiety, General Well-Being, Burnout, and Turnover Intention.
*p < .05, †p < .10.
Values and Role Stressors. Research question 2 asked if personal healthy values
negatively relate with role stressors. Relationships varied across each role stressor and
healthy value type. Role ambiguity negatively correlated with benevolence (r = -.20, p <
.05), self-direction (r = -.18, p < .10), and universalism (r = -.23, p < .05) values (see
Table 7). However, neither role conflict nor role overload significantly correlated with
any of the healthy values, although the directions of the relationships were generally in
the proposed direction.
Personal Values and Burnout. Hypothesis 3 proposed that each personal healthy
value would negatively relate with (a) burnout and (b) turnover intention. Correlation
analyses revealed that none of the healthy value types (i.e., achievement, benevolence,
self-determination, stimulation, and universalism) significantly correlated with burnout
(see Table 7).
Personal Values and Turnover Intention. Correlation analyses between
personal values and turnover intention revealed some evidence in support for Hypotheses
3 (see Table 7). Analyses revealed a significant negative correlation between benevolence
value type and turnover intention (r = -.26, p < .01). Hypothesis 3 was mostly not
supported.

46
Two-Way Interaction Analyses
Hypothesis 5 proposed that the relationship between (a) each role stressor (i.e.,
role ambiguity, role conflict, and role overload) and burnout, and (b) each role stressor
(i.e., role ambiguity, role conflict, and role overload) and turnover intention would be less
positive for individuals with higher endorsement of each individual healthy value (i.e.,
achievement, benevolence, self-direction, stimulation, universalism) than for people with
lower endorsement of these healthy values. Regression analyses were performed for each
individual role stressor, where a single role stressor was entered in step 1 (e.g., role
ambiguity or RA), a single personal value was entered in step 2 (e.g., achievement or
AC), and the interaction between the role stressor and the value was entered in step 3
(e.g., RAxAC). These analyses were conducted to predict both burnout and turnover
intention, yielding 60 regression analyses. Of those 60 analyses, only one yielded
significant interaction results supporting the hypothesis, whereas six yielded significant
results that opposed the hypothesis entirely.
Burnout. Burnout was regressed on each of role ambiguity, role conflict, and role
overload, each personal value type, and the role stressor-personal value interactions.
Results show that role ambiguity did not contribute a significant amount of variance to
the prediction of burnout, but role conflict accounted for 5.4% of the variance in burnout
(F (1, 96) = 6.55, p < .05) and role overload accounted for 12.2% of the variance in
burnout (F (1, 96) = 13.32, p < .05).
Hypothesis 5 proposed that healthy personal values would act as a moderator for
the relationship between role stressors (i.e., role ambiguity, role conflict, and role
overload) and burnout, such that individuals who endorsed healthy values more, would
experience less burnout. Multiple regression analyses revealed that the only healthy PV
that yielded significant results as a moderator was the stimulation value.
Stimulation Value. Burnout was regressed on each of the three role stressors,
stimulation PV, and the stressor-value interaction yielding a significant regression model
(R2 = .159, F (3,94) = 5.93, p < .01). Most of the variance in burnout was accounted for
by role overload (R2 = .122, p < .01), but the interaction term of role overload and

47
stimulation PV contributed an additional 3.7% of unique variance in the prediction of
burnout (ß =.24, ∆F (1, 95) = 4.15, p < .05; see Table 8).
Table 8
Hierarchical Regression of Burnout on Role Overload (RO), Stimulation Personal Value
(STPV), and their Interaction
Outcome
Burnout
Variables R2 ∆R2 ß
Step 1 .122** .122** .349**
RO
Step 2 .122** .000 .013
STPV
Step 3 .159** .037* .235*
ROxSTPV
Note. n = 98. **p < .01, *p < .05.
Simple slopes analyses, using a median split technique, were conducted for the
relationship between role overload and burnout, for low (below the median) and high
(above the median) stimulation personal values. The median split technique was used for
all slope analyses due to small sample size and a large amount of data points clustered
around the mean. Simple slope analyses were conducted using raw mean scores for
stimulation value (i.e., non-centered), in order to make slopes more interpretable by using
the original survey metric. The simple slope analyses revealed a significant positive
association between role overload and burnout when personal stimulation values were
high (b = .29, SEb = .07, ß = .49, t (54) = 4.16, p < .01), but a nonsignificant, although
smaller, positive association when personal stimulation values were low (b = .06, SEb =
.08, ß = .12, t (40) = .78, ns). A graphical depiction of the two-way interaction can be
seen in Figure 4. This interaction failed to support Hypothesis 5.

48
Low Stimulation: b = .06, ns High Stimulation: b = .29, p < .01
Figure 4. The relationship between role overload and burnout as moderated by personal
stimulation value. Stimulation values were dummy coded to split respondents who were
above or below the median on the stimulation value moderator variable.
Conformity Value. Interaction effects were also found for some personal values
proposed as unhealthy. Burnout was regressed on each of the three role stressors and
conformity PV, revealing significant effects for the role conflict analysis (R2 = .124, F
(3,94) = 4.43, p < .01; see Table 9). The interaction term of role conflict and conformity
PV contributed 5% of unique variance in the prediction of burnout (ß = -.26, ∆F (1, 94) =
5.41, p < .05).
Simple slopes analyses using a median split technique were conducted for the
relationship between role conflict and burnout, for low (below the median) and high
(above the median) conformity personal values. Simple slopes analyses were conducted
using raw mean scores for conformity (i.e., non-centered). The simple slope analyses
revealed a nonsignificant positive association between role overload and burnout when
personal conformity values were high (b = .04, SEb = .10, ß = .06, t (43) = .41, ns), but a
significant, stronger positive association when personal conformity values were low (b =
.23, SEb = .07, ß = .143 t (51) = 3.36, p < .05). A graphical depiction of the two-way
interaction can be seen in Figure 5. This interaction failed to support Hypothesis 5
0
0.5
1
1.5
2
2.5
3
3.5
4
4.5
5
Low Role Overload High Role Overload
Bu
rnou
t Low Stimulation
PVHigh Stimulation
PV

49
Table 9
Hierarchical Regression of Burnout on Role Conflict (RC), Conformity Personal Value
(COPV), and their Interaction
Outcome
Burnout
Variables R2 ∆R2 ß
Step 1 .064* .064* .25*
RC
Step 2 .074* .010 -.01
COPV
Step 3 .124** .050* -.26*
RCxCOPV
Note. n = 98. *p < .05.
Low Conformity: b = .23 p < .05 High Conformity: b = .04, ns
Figure 5. The relationship between role conflict and burnout as moderated by personal
conformity value. Conformity values were dummy coded to split respondents who were
above or below the median on the conformity value moderator variable.
Security value. Moderated multiple regressions of burnout on each of role conflict
and role overload, as well as the unhealthy security PV were significant. Burnout was
1
1.5
2
2.5
3
3.5
4
4.5
5
Low Role Conflict High Role Conflict
Burn
out Low Conformity
PV
High Conformity
PV

50
regressed on role conflict, security PV, and their interaction. The regression model was
significant (R2 = .113, F (3,94) = 3.99, p < .05; see Table 10). The interaction term of role
conflict and security PV contributed a significant 4.9% of unique variance in the
prediction of burnout (ß = -.24, ∆F (1, 94) = 5.15, p < .05).
Table 10
Hierarchical Regression of Burnout on Role Conflict (RC), Role Overload (RO), Security
Personal Value (SEPV), and their Interaction
Outcome
Burnout
Variables R2 ∆R2 ß
Role Conflict (RC)
Step 1 .064* .064* .25*
RC
Step 2 .064* .000 -.02
SEPV
Step 3 .113* .049* -.24*
RCxSEPV
Role Overload (RO)
Step 1 .122** .122** .35**
RO
Step 2 .122** .000 .02
SEPV
Step 3 .169** .047* -.23*
ROxSEPV
Note. n = 98. **p < .01, *p < .05.
Simple slopes analyses using a median split technique were conducted for the
relationship between role conflict and burnout for low (below the median) and high
(above the median) security PV. Simple slopes analyses were conducted using raw mean
scores for security (i.e., non-centered). When personal security value endorsement was
high, there was a smaller positive nonsignificant association between role conflict and
burnout (b = .08, SEb = .07, ß = .16, t (45) = 1.07, ns), whereas when personal value
endorsement of security was low, there was a stronger positive, significant relationship

51
between role conflict and burnout (b = .27, SEb = .10, ß = .37 t (49) = 3.36, p < .01). The
two-way interaction is presented in Figure 6. This interaction failed to support
Hypothesis 5.
Low Security: b = .27, p < .01 High Security: b = .08, ns
Figure 6. The relationship between role conflict and burnout as moderated by personal
security value. Security values were dummy coded to split respondents who were above
or below the median on the security value moderator variable.
Second, burnout was regressed on role overload, security PV, and their
interaction, yielding a significant model (R2 = .169, F (3,94) = 6.36, p < .01; see Table
10). Although most of the variance in the model was accounted for by role overload (R2 =
.122, p < .01), the interaction term of role overload and security PV contributed 4.7% of
unique variance in the prediction of burnout (ß = -.23, ∆F (1, 94) = 5.28, p < .05).
Simple slopes analysis for the relationship between role overload and burnout
revealed that the relationship was significant at both the low and high levels of personal
security value endorsement. Specifically, when security value endorsement was high, the
relationship between role overload and burnout was weaker (b = .18, SEb = .07, ß = .38 t
(45) = 2.75 p < .01) than when security value endorsement was low (b = .22, SEb = .09, ß
= .34 t (49) = 2.56, p < .05; see Figure 7). This interaction failed to support Hypothesis 5.
1
1.5
2
2.5
3
3.5
4
4.5
5
Low Role Conflict High Role Conflict
Burn
out
Low Security PV
High Security PV

52
Low Security: b = .22, p < .05 High Security: b = .18, p < .01
Figure 7. The relationship between role overload and burnout as moderated by personal
security value. Security values were dummy coded to split respondents who were above
or below the median on the security value moderator variable.
Turnover Intention. In terms of overall effects of role stressors, role ambiguity
contributed a significant amount of variance to the prediction of burnout (R2= .056, F (1,
96) = 5.64, p < .05), but role conflict did not contribute meaningful variance, and role
overload accounted for 8.5% of the variance in turnover intention (F (1, 96) = 8.92, p <
05). No significant main effects were observed for any of the healthy values. Contrary to
the burnout analyses, some of the healthy values, particularly benevolence and
stimulation value types yielded significant variance to explain turnover intention.
Self-Direction Value. The full model of self-direction PV, role ambiguity, and
their interaction significantly contributed 13.3% to the prediction of turnover intention (F
(3, 94) = 4.79, p < .01; see Table 11). The interaction term consisting of role ambiguity
and self-direction PV accounted for 6.5% of unique variance (ß = .27, ∆F (1, 94) = 7.00,
p < .05). After performing a median split of the non-centered self-direction value data,
where low self-direction was below the median and high self-direction was above the
self-direction PV median, simple slopes analyses were used to probe the interaction
0
0.5
1
1.5
2
2.5
3
3.5
4
4.5
5
Low Role Overload High Role Overload
Bu
rnou
t Low Security
PVHigh Security
PV

53
effects. When there was high endorsement of self-direction value, the positive
relationship between role ambiguity and turnover intention was weaker (b = .19, SEb =
.49, ß = .44, t (49) = 2.09, ns) than the significant positive relationship when endorsement
of self-direction was low (b = .35, SEb = .24, ß = .59, t (44) = 2.97, p < .05). The two-
way interaction is presented in Figure 8. This interaction supported Hypothesis 5.
Table 11
Hierarchical Regression of Turnover Intention on Role Ambiguity (RA), Self-Direction
Personal Value (SDPV), and their Interaction
Outcome
Turnover Intention
Variables R2 ∆R2 ß
Step 1 .056* .056* .236*
RA
Step 2 .068* .013 .112
SDPV
Step 3 .133** .065* .271*
RAxSDPV
Note. n = 98. *p < .05.
Stimulation Value. The overall model consisting of role overload, stimulation
PV, and the interaction variable significantly accounted for 21.3% of variance in
predicting turnover intention (F (3, 94) = 8.51, p < .01) The interaction between role
overload and stimulation PV accounted for a significant 5.5% of the variance in turnover
intention (ß = .29, ∆F (1, 95) = 6.59, p < .05; see Table 12).
Simple slopes analyses using a median split technique were conducted for role
overload and turnover intention for low (below the median) and high (above the median)
stimulation PV. Simple slopes analyses were conducted using raw mean scores for
security (i.e., non-centered). When the personal value endorsement of stimulation was
high, there was a significant, stronger relationship with turnover intention (b = .43, SEb =
.11, ß = .466, t (54) = 3.87, p < .01), in comparison to the nonsignificant positive
relationship with turnover intention for low endorsement of stimulation value (b = .10,

54
SEb = .14, ß = .113 t (40) = .72, ns). The two-way interaction is presented in Figure 9.
This interaction failed to support Hypothesis 5.
Low Self-Direction: b = .35, p < 05 High Self-Direction: b = .19, ns
Figure 8. The relationship between role ambiguity and turnover intention as moderated
by personal self-direction value. Self-direction values were dummy coded to split
respondents who were above or below the median on the self-direction value moderator
variable.
Table 12
Hierarchical Regression of Turnover Intention on Role Overload (RO), Stimulation
Personal Value (STPV), and their Interactions
Outcome
Turnover Intention
Variables R2 ∆R2 ß
Step 1 .085** .085** .29**
RO
Step 2 .158** .073** .27**
STPV
Step 3 .213** .055* .29*
ROxSTPV
Note. n = 98. **p < .01, *p < .05.
1
1.5
2
2.5
3
3.5
4
4.5
5
Low Role Ambiguity High Role Ambiguity
Turn
over
Inte
nti
on
Low Self-
Direction PV
High Self-
Direction PV

55
Low Stimulation: b = .10, ns High Stimulation: b = .43, p < .01
Figure 9. The relationship between role overload and turnover intention as moderated
by personal stimulation value. Stimulation values were dummy coded to split respondents
who were above or below the median on the stimulation value moderator variable.
Security Value. Results for models including role ambiguity and role conflict did
not reveal any significant findings (see Table 13), but the overall model consisting of role
overload, security PV, and the interaction variable significantly contributed 12.1% to the
prediction of turnover intention (F (3, 94) = 4.30, p < .01; see Table 13). Although most
of the variance was accounted for by role overload (R2 = .085, p < .01) and the main
effect of security PV did not contribute any significant variance to the prediction of
turnover intention, the interaction term consisting of role overload and security PV
accounted for an additional 2.7% of marginally significant variance (ß = -.18, ∆F (1, 94)
= 2.94, p < .10).
Simple slopes analyses using a median split technique were conducted for role
overload and turnover intention for low (below the median) and high (above the median)
security PV. Simple slopes analyses were conducted using raw median scores for security
(i.e., non-centered). When the personal value endorsement of security was high, there
was a significant, stronger positive relationship with turnover intention (b = .29, SEb =
.13, ß = .32, t (48) = 2.30, p < .05), in comparison to the positive relationship with
1
1.5
2
2.5
3
3.5
4
4.5
5
Low Role Overload High Role Overload
Turn
over
Inte
nti
on
Low
Stimulation PVHigh
Stimulation PV

56
turnover intention for low endorsement of security value (b = .26, SEb = .14, ß = .22 t
(46) = 1.89, p < .10). However, the interaction graph presented in Figure 10 shows that
although there was a stronger positive relationship with turnover intention for high
endorsement of security values, turnover intention scores were overall higher for low
endorsement of security values. The two-way interaction presented in Figure 10 provided
mixed support for Hypothesis 5.
Table 13
Hierarchical Regression of Turnover Intention on Role Overload (RO), Security Personal
Value (SEPV), and their Interaction
Outcome
Turnover Intention
Variables R2 ∆R2 ß
Step 1 .085** .085** .29**
RO
Step 2 .093* .008 -.09
SEPV
Step 3 .121** .027† -.18†
RCxSEPV
Note. n = 98. **p < .01, †p < .10.
Three-Way Interaction Analyses
Three-way interaction analyses were conducted in order to examine the effects of
healthy value congruence between personal values and perceived organizational values
on both (a) burnout and (b) turnover intention. I proposed that the effects of stressors on
strains will be intensified when an individual perceives that the organization does not
endorse similar healthy values (Hypothesis 6).
Individual regression analyses were conducted such that each individual role
stressor was entered in step 1 (e.g., role ambiguity; RA), and each personal value and
organizational value was entered in step 2 (e.g., achievement personal value or ACPV
and achievement organizational value or ACOV). In step 3, two-way interaction variables
were entered between each role stressor and the personal and organizational values (i.e.,
RAxACPV and RAxACOV), and the interaction between the personal and organizational

57
values (e.g., ACPVxACOV). Finally, in step 4 the three-way interaction variable between
role stressors, personal values and organizational values (e.g., RAxACPVxACOV) was
entered into the hierarchical regression. These procedures yielded a total of 60
hierarchical regression analyses, and a total of seven significant three-way interaction
analyses, four for burnout, and three for turnover intention.
Low Security: b = .26, p < .10 High Security: b = .29, p < .05
Figure 10. The relationship between role overload and turnover intention as moderated
by personal security value. Security values were dummy coded to split respondents who
were above or below the median on the security value moderator variable.
Burnout. Three-way interaction analyses sought to examine the role of value
congruence in buffering the relationships between role stressors and turnover and
burnout. Results revealed that healthy values congruence did not significantly interact
with any of the role stressors. That is, the three-way interactions between the three role
stressor variables, the healthy personal values (i.e., achievement, benevolence, self-
determination, stimulation, and universalism), and the corresponding perceived
organizational healthy values, were not significant in predicting burnout. Therefore,
Hypothesis 6, regarding healthy values, was not supported regarding burnout as a
criterion variable. However, exploratory analyses revealed four significant three-way
interactions involving unhealthy values for predicting burnout.
1
1.5
2
2.5
3
3.5
4
4.5
5
Low Role Overload High Role Overload
Turn
over
Inte
nti
on
Low Security
PV
High Security
PV

58
Conformity Value. Two of the significant three-way interactions were related to
the conformity value. First, in examining the extent that role ambiguity predicts burnout,
the overall model contributed 10.5% of variance (though nonsignificant) in the prediction
of burnout. The three-way interaction term between role ambiguity, conformity PV, and
conformity OV contributed 4.2% of unique variance in burnout (ß = -.28, F (1, 90) =
4.22, p < .05; see Table 14).
Simple slopes analyses using a median split technique were conducted for role
ambiguity and burnout in a two-step process in order to examine the three-way
interaction (see Figure 11). First, a median-split was conducted for individuals who had
low (below the median) and high (above the median) conformity PV. Second, of these
two groups, individuals were further separated into low (below the median) and high
(above the median) perceived conformity OV. The simple slopes interaction figure was
created using uncentered data.
When the perceived organizational endorsement of conformity was low and the
personal value endorsement of conformity was low (i.e., value congruence; b = .18, SEb
= .16, ß = .22, t (24) = 1.25, ns), there was a slightly stronger relationship with burnout
than when perceived organizational endorsement of conformity was low and personal
endorsement of conformity was high (i.e., value incongruence; b = .15, SEb = .14, ß =
.22, t (21) = 1.04, ns). In comparison, when perceived organizational endorsement of
conformity was high and personal endorsement of conformity was high (i.e., value
congruence; b = -.17, SEb = .15, ß = -.23, t (24) = -1.18, ns) there was a weaker negative
relationship with burnout than when perceived organizational endorsement of conformity
was high and personal endorsement of conformity was low (i.e., value incongruence; b =
.19, SEb = .15, ß = .27, t (21) = 1.24, ns). Figure 11 shows a graphical depiction of this
three-way interaction, which partially supports Hypothesis 6.
Second, in examining the relationship between role overload and burnout, the
overall model contributed 20.3% of the variance in the prediction of burnout (p < .01).
The three-way interaction term, which examined the interaction between role overload,
conformity PV, conformity OV, contributed 3.1% of unique variance in predicting

59
Table 14
Hierarchical Regression of Burnout on Role Ambiguity (RA), Conformity Personal Value
(COPV), Conformity Organization Value (COOV), and their Interactions
Outcome
Burnout
Variables R2 ∆R2 ß
Step 1 .027 .027 .16
RA (a)
Step 2 .045 .018 -.06
COPV (b)
COOV (c)
Step 3 .063 .017 -.10
axb
axc
bxc
Step 4 .105 .042* -.28*
axbxc
Note. n = 98. *p < .05.
Low Conformity PV, Low Conformity OV: b = .18, ns
High Conformity PV, Low Conformity OV: b = .15, ns
1
1.5
2
2.5
3
3.5
4
4.5
5
Low Role Ambiguity High Role Ambiguity
Burn
out
Low Confomity OV
Low Conformity
PV
High Conformity
PV

60
Low Conformity PV, High Conformity OV: b = .19, ns
High Conformity PV, High Conformity OV: b = -.17, ns
Figure 11. The relationship between role overload and burnout as moderated by personal
conformity value and organizational conformity value. Conformity values were dummy
coded to split respondents who were above or below the median on the conformity PV
and conformity OV moderator variables.
burnout (ß = -.31, F (1, 90) = 3.51, p < .10; see Table 15). When the perceived
organizational endorsement of conformity was low and the personal value endorsement
of conformity was high (i.e., value incongruence; b = .21, SEb = .10, ß = .44, t (21) =
.2.24, p < .05), there was a slightly weaker positive relationship with burnout than when
perceived organizational endorsement was low and personal endorsement was low (i.e.,
value congruence; b = .22, SEb = .11, ß = .39, t (24) = 2.09, p < .05). In comparison,
when perceived organizational endorsement of conformity was high and the personal
value endorsement of conformity was low (i.e., value incongruence; b = .19, SEb = .12, ß
= .32, t (21) = 1.60, ns) there was a stronger relationship with burnout than when
perceived organizational endorsement was high and personal conformity was high (i.e.,
value congruence; b = .10, SEb = .10, ß = .20, t (24) = .99, ns). This exploratory analysis
partially supports Hypothesis 6 (see Figure 12).
1
1.5
2
2.5
3
3.5
4
4.5
5
Low Role Ambiguity High Role Ambiguity
Burn
out
High Conformity OV
Low Conformity
PV
High Conformity
PV

61
Table 15
Hierarchical Regression of Burnout on Role Overload (RO), Conformity Personal Value
(COPV), Conformity Organization Value (COOV), and their Interaction
Outcome
Burnout
Variables R2 ∆R2 ß
Step 1 .122 ** .122** .35**
RO (a)
Step 2 .139 ** .017 -.07
COPV (b)
COOV (c)
Step 3 .172 ** .033 -.23
axb
axc
bxc
Step 4 .203 ** .031† -.31†
axbxc
Note. n = 98. **p < .01, † p < .10.
Low Conformity PV, Low Conformity OV: b = .22, p < .05
High Conformity PV, Low Conformity OV: b = .21, p < .05
1
1.5
2
2.5
3
3.5
4
4.5
5
Low Role Overload High Role Overload
Burn
out
Low Conformity OV
Low Conformity
PV
High Conformity
PV

62
Low Conformity PV, High Conformity OV: b = .19, ns
High Conformity PV, High Conformity OV: b = .10, ns
Figure 12. The relationship between role overload and burnout as moderated by personal
conformity value and organizational conformity value. Conformity values were dummy
coded to split respondents who were above or below the median on the conformity PV
and conformity OV moderator variables.
Hedonism Value. In examining the relationship between role ambiguity predicted
burnout, the overall model accounted for 11.6% of variance in burnout, but this was not
significant. However, the three-way interaction term between role ambiguity, hedonism
PV, and hedonism OV contributed 3.0% of unique variance in the prediction of burnout
(ß = .45, F(1, 90) = 3.01, p < .10; see Table 16).
Simple slopes analyses using a median split technique were conducted for role
ambiguity and burnout in a two-step process in order to examine the three-way
interaction. First, a median-split was conducted for individuals who had low (below the
median) and high (above the median) hedonism personal values. Second, of these two
groups, individuals were further separated into low (below the median) and high (above
the median) perceived hedonism organizational values. Per Figure 13, when perceived
organizational value endorsement of hedonism was low and the personal value
endorsement of hedonism was low (i.e., value congruence; b = .29, SEb = .104, ß = .49, t
1
1.5
2
2.5
3
3.5
4
4.5
5
Low Role Overload High Role Overload
Burn
out
High Conformity OV
Low Conformity
PV
High Conformity
PV

63
(26) =2.82, p < .05), there was a stronger positive relationship with burnout than when
perceived organizational value endorsement of hedonism was low and the personal value
endorsement of hedonism was high (i.e., value incongruence; b = -.16, SEb = .18, ß = -
.22, t (17) = -.92, ns). In comparison, when the perceived organizational value
endorsement of hedonism was high and the personal value endorsement of hedonism was
high (i.e., value congruence; b = .27, SEb = 17, ß = .28, t (31) = 1.61, ns), there was a
stronger positive relationship with burnout than when the organizational value
endorsement was high and the personal value endorsement was low (i.e., value
incongruence; b = .15, SEb = .19, ß = .18, t (19) = .781, ns). The exploratory analysis fails
to support Hypothesis 6.
Table 16
Hierarchical Regression of Burnout on Role Ambiguity (RA), Hedonism Personal Value
(HEPV), Hedonism Organization Value (HEOV), and their Interaction
Outcome
Burnout
Variables R2 ∆R2 ß
Step 1 .027 .027 .16
RA (a)
Step 2 .078† .051† .05
HEPV (b)
HEOV (c)
Step 3 .086 .009 .01
axb
axc
bxc
Step 4 .116 .030† .45†
axbxc
Note. n = 98. †p < .10.

64
Low Hedonism PV, Low Hedonism OV: b = .29, p < .05
High Hedonism PV, Low Hedonism OV: b = -.16, ns
Low Hedonism PV, High Hedonism OV: b = .15, ns
High Hedonism PV, High Hedonism OV: b = .27, ns
Figure 13. The relationship between role overload and burnout as moderated by personal
hedonism value and organizational hedonism value. Hedonism values were dummy
coded to split respondents who were above or below the median on the hedonism PV and
hedonism OV moderator variables.
1
1.5
2
2.5
3
3.5
4
4.5
5
Low Role Ambiguity High Role Ambiguity
Burn
out
Low Hedonism OV
Low Hedonism PV
High Hedonism PV
1
1.5
2
2.5
3
3.5
4
4.5
5
Low Role Ambiguity High Role Ambiguity
Burn
out
High Hedonism PV
Low Hedonism PV
High Hedonism PV

65
Tradition value. In examining the relationship between role conflict and burnout,
the overall model accounted for 16.0% of variance in burnout (p < .05). The three-way
interaction between role conflict, tradition PV, and tradition OV contributed 3.4% of
unique variance in the prediction of burnout (ß = .31, F(1, 90) = 3.69, p < .10; see
Table 17). Simple slopes analyses using a median split technique were conducted for role
conflict and burnout in a two-step process in order to examine the three-way interaction.
First, a median-split was conducted for individuals who had low (below the median) and
high (above the median) tradition personal values. Second, of these two groups,
individuals were further separated into low (below the median) and high (above the
median) perceived tradition organizational values. Per Figure 14, when the perceived
organizational endorsement of tradition was low and the personal value endorsement of
tradition was low (i.e., value congruence; b = .22, SEb = .10, ß = .35, t (38) =2.34, p <
.05), there was a stronger positive relationship with burnout than when perceived
organizational endorsement of tradition was low and the personal value endorsement was
high (i.e., value incongruence; b = -.11, SEb = .22, ß = -.17, t (10) = .17, ns). In
comparison, when the perceived organizational endorsement of tradition was high, and
the personal value endorsement of tradition was high (i.e., value congruence; b = .18, SEb
= .09, ß = .31, t (34) = 1.91, p < .10), the relationship with burnout exhibited the same
slope as when organizational endorsement of tradition was high, and the personal
endorsement of tradition was low (i.e., value incongruence; b = .18, SEb = .20, ß = .28, t
(11) = .92, ns). This exploratory interaction fails to support Hypothesis 5.
Turnover Intention. Continuing the tests of hypothesis 6, three-way interaction
analyses also sought to examine the role of value congruence in buffering the
relationships between role stressors and turnover intention. Results revealed that some
healthy values congruence significantly interacted with the role stressors. That is, the
three-way interaction between the role stressor variables (i.e., role ambiguity, role
conflict, and role overload), the healthy personal values (i.e., achievement, benevolence,
self-determination, stimulation, and universalism), and perceived organizational healthy
values, significantly predicted turnover intention. In addition, exploratory analyses found

66
that some three-way interactions between unhealthy value congruence and role stressors
in predicting turnover intention were also found. Overall, results revealed three
significant three-way interactions for predicting turnover intention for congruence of
values classified as healthy or unhealthy.
Table 17
Hierarchical Regression of Burnout on Role Conflict (RC), Traditional Personal Value
(TRPV), Traditional Organization Value (TROV), and their Interaction
Outcome
Burnout
Variables R2 ∆R2 ß
Step 1 .064* .064* .25*
RC (a)
Step 2 .091* .027 .04
TRPV (b)
TROV (c)
Step 3 .125† .034 .13
axb
axc
bxc
Step 4 .160* .034† .31†
axbxc
Note. n = 98. *p < .05, †p < .10.
Benevolence Value. In examining the relationship between role conflict and
turnover intention, the overall model accounted for 19.0% of variance in turnover
intention (p < .01). The three-way interaction, which examined role conflict, benevolence
PV, and benevolence OV contributed 2.7% of unique variance in the prediction of
burnout (ß = -.53, F(1, 90) = 3.04, p < .10; see Table 18).
Simple slopes analyses using a median split technique were conducted for role
overload and turnover intention in a two-step process in order to examine the three-way
interaction. First, a median-split was conducted for individuals who had low (below the
median) and high (above the median) benevolence personal values. Second, of these two
groups, individuals were further separated into low (below the median) and high (above
the median) perceived benevolence organizational values. When the perceived

67
Low Tradition PV, Low Tradition OV: b = .22, p < .05
High Tradition PV, Low Tradition OV: b = -.11, ns
Low Tradition PV, High Tradition OV: b = .18, ns
High Tradition PV, High Tradition OV: b = .18, p < .10
Figure 14. The relationship between role conflict and burnout as moderated by personal
tradition value and organizational tradition value. Tradition values were dummy coded to
split respondents who were above or below the median on the tradition PV and tradition
OV moderator variables.
1
1.5
2
2.5
3
3.5
4
4.5
5
Low Role Conflict High Role Conflict
Burn
out
Low Tradition OV
Low Tradition PV
High Tradition PV
1
1.5
2
2.5
3
3.5
4
4.5
5
Low Role Conflict High Role Conflict
Burn
out
High Tradition OV
Low Tradition PV
High Tradition PV

68
organizational value endorsement of benevolence was low and the personal value
endorsement of benevolence was low (i.e., value congruence; b = .21, SEb = .18, ß = .22,
t (26) =1.15, ns), there was a weaker positive relationship with turnover intention than
when perceived organizational value endorsement was low and personal value
endorsement was high (i.e., value incongruence; b = .54, SEb = .17, ß = .59, t (19) = 3.16,
p < .05). However, Figure 15 shows low perceived benevolence organizational values
paired with low benevolence personal values (i.e., value congruence) is related to higher
reports of turnover intention overall, although low perceived benevolence organizational
values and low benevolence personal values has a weaker slope. In comparison, when the
perceived organizational benevolence endorsement was high and the personal
endorsement of benevolence was high (i.e., value congruence; b = .09, SEb = .15, ß = .12,
t (28) = .62, ns) there was a slightly weaker relationship with turnover intention than
when perceived organizational endorsement was high and personal endorsement was low
(i.e., value incongruence; b = .11, SEb = .22, ß = .12, t (17) = .50, ns). These findings
partially support Hypothesis 6. The three-way interaction is presented in Figure 15.
Table 18
Hierarchical Regression of Turnover Intention on Role Overload (RO), Benevolence
Personal Value (BEPV), Benevolence Organization Value (BEOV), and their Interaction
Outcome
Turnover Intention
Variables R2 ∆R2 ß
Step 1 .085** .064** .29**
RO (a)
Step 2 .137** .052† .05
BEPV (b)
BEOV (c)
Step 3 .163* .025 .07
axb
axc
bxc
Step 4 .190** .027† -.53†
axbxc
Note. n = 98. **p < .01, †p < .10.

69
Low Benevolence PV, Low Benevolence OV: b = .21, ns
High Benevolence PV, Low Benevolence OV: b = .54, p < .05
Low Benevolence PV, High Benevolence OV: b = .11, ns
High Benevolence PV, High Benevolence OV: b = .09, ns
Figure 15. The relationship between role overload and turnover intention as moderated
by personal benevolence value and organizational benevolence value. Benevolence
values were dummy coded to split respondents who were above or below the median on
the benevolence PV and benevolence OV moderator variables.
1
1.5
2
2.5
3
3.5
4
4.5
5
Low Role Overload High Role Overload
Turn
over
Inte
nti
on
Low Benevolence OV
Low Benevolence
PV
High Benevolence
PV
1
1.5
2
2.5
3
3.5
4
4.5
5
Low Role Overload High Role Overload
Turn
over
Inte
nti
on
High Benevolence OV
Low Benevolence
PV
High Benevolence
PV

70
Universalism Value. In examining the relationship between role ambiguity and
turnover intention, the overall model accounted for 11.8% (ns) of variance in turnover
intention, which was not significant. The three-way interaction term, which examined
personal and organizational universalism value congruence was significant. That is, the
interaction between role ambiguity, personal universalism value, and perceived
organizational universalism value contributed 3.7% of unique variance in the prediction
of turnover intention (ß = -.25, F (1, 90) = 3.81, p < .10; see Table 19).
Simple slopes analyses using a median split technique were conducted for role
ambiguity and turnover intention in a two-step process in order to examine the three-way
interaction. First, a median-split was conducted for individuals who had low (below the
median) and high (above the median) universalism personal values. Second, of these two
groups, individuals were further separated into low (below the median) and high (above
the median) perceived universalism organizational values. When the perceived
organizational value endorsement of universalism was low and the personal value
endorsement of universalism was low (i.e., value congruence; b = .35, SEb = .19, ß = .30,
t (35) =1.85, p < .10), there was a slightly stronger positive relationship with turnover
intention than when perceived organizational value endorsement was low and personal
value endorsement was high (i.e., value incongruence; b = .33, SEb = .35, ß = .25, t (13) =
.93, ns). In comparison, when the perceived organizational endorsement of universalism
was high and personal value endorsement of universalism was low high (i.e., value
congruence; b = .10, SEb = .26, ß = .08, t (23) = .41, ns), there was a weaker relationship
with turnover intention than when perceived organizational endorsement was high and
personal universalism endorsement was low (i.e., value incongruence; b = .50, SEb = .42,
ß = .27, t (19) = 1.21, ns).
The three-way interaction model partially supports Hypothesis 6, such that
individuals who highly endorse universalism and perceive that the organization also
highly endorses universalism (i.e., value congruence) have lower reports of turnover
intention, in comparison to perceived organizational and personal universalism values
that are not congruent. The three-way interaction is presented in Figure 16.

71
Table 19
Hierarchical Regression of Turnover Intention on Role Ambiguity (RA), Universalism
Personal Value (UNPV), Universalism Organization Value (UNOV), and their
Interaction
Outcome
Turnover Intention
Variables R2 ∆R2 ß
Step 1 .056* .056* .24†
RA (a)
Step 2 .063 .008 .07
UNPV (b)
UNOV (c)
Step 3 .081 .017 -.06
axb
axc
bxc
Step 4 .118 .037† -.25†
axbxc
Note. n = 98. *p < .05, †p < .10.
Low Universalism PV, Low Universalism OV: b = .35, p < .10
High Universalism PV, Low Universalism OV: b = .33, ns
1
1.5
2
2.5
3
3.5
4
4.5
5
Low Role Ambiguity High Role Ambiguity
Tu
rno
ver
In
ten
tio
n
Low Universalism OV
Low Universalism
PV
High Universalism
PV

72
Low Universalism PV, High Universalism OV: b = .50, ns
High Universalism PV, High Universalism OV: b = .10, ns
Figure 16. The relationship between role overload and turnover intention as moderated
by personal universalism value and organizational universalism value. Universalism
values were dummy coded to split respondents who were above or below the median on
the universalism PV and universalism OV moderator variables.
Tradition Value. In examining the relationship between role ambiguity and
turnover intention, the overall model accounted for 16.3% of variance in turnover
intention (p < .05). The three-way interaction term, which examined role conflict,
tradition PV, and tradition OV contributed 3.4% of unique variance in the prediction of
burnout (ß = -.29, F (1, 90) = 3.62, p < .10; see Table 20).
Simple slopes analyses using a median split technique were conducted for role ambiguity
and turnover intention in a two-step process in order to examine the three-way
interaction. First, a median-split was conducted for individuals who had low (below the
median) and high (above the median) tradition personal values. Second, of these two
groups, individuals were further separated into low (below the median) and high (above
the median) perceived tradition organizational values. When the perceived organizational
endorsement of tradition was low and the personal value endorsement of tradition was
low (i.e., value congruence; b = .28, SEb = .20, ß = .23, t (34) =1.40, ns), there was a
slightly stronger positive relationship with turnover intention than when perceived
1
1.5
2
2.5
3
3.5
4
4.5
5
Low Role Ambiguity High Role Ambiguity
Turn
over
Inte
nti
on
High Universalism OV
Low Universalism
PV
High Universalism
PV

73
organizational endorsement was low and personal value endorsement was high (i.e.,
value incongruence; b = .22, SEb = .28, ß = .22, t (13) = .77, ns). Similarly, when
perceived organizational endorsement of tradition was high and personal endorsement of
tradition was high (i.e., value congruence; b = .38, SEb = .25, ß = .26, t (35) = 1.55, ns)
there was a stronger relationship with turnover intention than when perceived
organizational endorsement was high and personal value endorsement was low (i.e.,
value incongruence; b = .20, SEb = .68, ß = .09, t (10) = .29, ns). The exploratory three-
way interaction is presented in Figure 17 and fails to support Hypothesis 6.
Table 20
Hierarchical Regression of Turnover Intention on Role Ambiguity (RA), Tradition
Personal Value (TRPV), Tradition Organizational Value (TROV), and their Interaction
Outcome
Turnover Intention
Variables R2 ∆R2 ß
Step 1 .056* .056* .24*
RA (a)
Step 2 .081* .026 .16
TRPV (b)
TROV (c)
Step 3 .129* .047 -.09
axb
axc
bxc
Step 4 .163* .034† -.29†
axbxc
Note. n = 98. *p < .05, †p < .10.
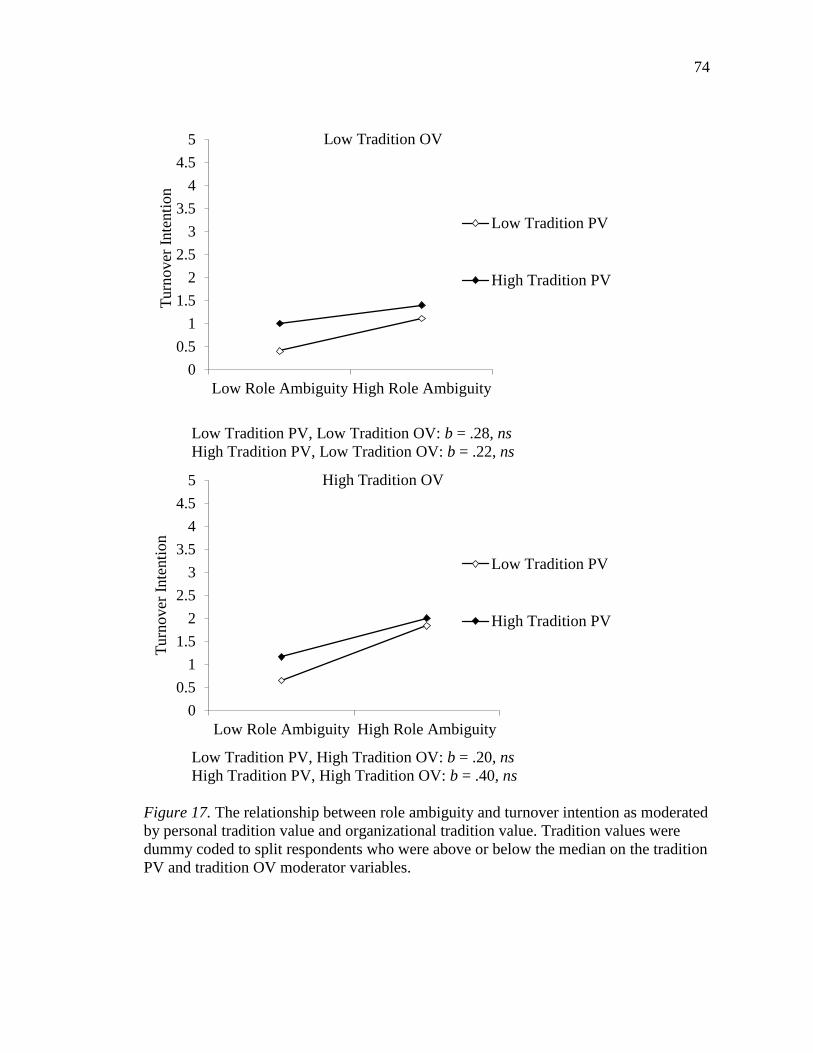
74
Low Tradition PV, Low Tradition OV: b = .28, ns
High Tradition PV, Low Tradition OV: b = .22, ns
Low Tradition PV, High Tradition OV: b = .20, ns
High Tradition PV, High Tradition OV: b = .40, ns
Figure 17. The relationship between role ambiguity and turnover intention as moderated
by personal tradition value and organizational tradition value. Tradition values were
dummy coded to split respondents who were above or below the median on the tradition
PV and tradition OV moderator variables.
0
0.5
1
1.5
2
2.5
3
3.5
4
4.5
5
Low Role Ambiguity High Role Ambiguity
Turn
over
Inte
nti
on
Low Tradition OV
Low Tradition PV
High Tradition PV
0
0.5
1
1.5
2
2.5
3
3.5
4
4.5
5
Low Role Ambiguity High Role Ambiguity
Turn
over
Inte
nti
on
High Tradition OV
Low Tradition PV
High Tradition PV

75
DISCUSSION
The purpose of this study was to examine the moderating role of healthy value
congruence on the stressor-strain relationship. Specifically, this study examined the
premise of healthy values, namely that certain values could either negatively or positively
affect burnout and turnover intention. In particular, this study also aimed to examine the
effects of personal and organizational value congruence on the relationship between
stressors (i.e., role ambiguity, role conflict, and role overload), and outcomes (i.e.,
burnout and turnover intention). Consistent with Sagiv and Schwartz (2000), this study
presents empirical evidence that values can be related to health, such that some values
(e.g., security) may be more influential in buffering the stressor-strain relationship,
dependent on the stressors and outcomes examined. Furthermore, results support the
foundational idea of P-E fit theory, such that individuals who held certain values were
less negatively impacted by the stressor-strain relationship when personal values were
more aligned with organizational values (i.e., value congruence). However, some of the
person-organization value alignments moderated the stressor-strain relationship in
unexpected ways.
The current study extends prior research on healthy values which has examined
either the notion that some values are healthy via correlational analyses of values and
well-being variables (Kasser & Ahuvia, 2002; Sagiv & Schwartz, 2000), or the notion of
value congruence in relation to well-being (Sagiv & Schwartz, 2000). The current study
attempts to confirm the idea of healthy values, but examines healthy and unhealthy value
congruence as a moderator of the stressor strain relationship, not just as a predictor of
strains. Sagiv and Schwartz (2000) examined the impact of healthy values and value
congruence in two studies of subjective well-being within adults and students from Israel
and the former East and West Germany. Their study concluded that both value
congruence and healthy values may be important in better understanding stressor-strain
relationships. However, to my knowledge, no study thus far has addressed a three-way
moderation effect of healthy value congruence on potential outcomes, specifically
burnout and turnover intention. Thus, the present study targets a gap in the literature by

76
examining the impact of healthy value congruence on the relationship between role
stressors and outcome variables.
Stressor-Strain Relationships
Role Stressors. Hypotheses 1 and 2, which proposed that each of the three role
stressors examined (i.e., role ambiguity, role conflict, and role overload) would positively
correlate with (1) burnout and (2) turnover intention, received mixed support. Role
conflict and role overload positively correlated with burnout, but role ambiguity did not
significantly correlate with the outcomes, although results were in the proposed positive
direction. This finding is contrary to the literature, which generally indicates a significant
positive relationship between role ambiguity and burnout (e.g., Tunc & Kutanis, 2009). It
is possible that this difference in the significance is related to the measure of burnout,
such that many studies examine burnout utilizing the MBI (Cooper et al., 2001). Perhaps
burnout as assessed by Pines and Aronson’s (1988) measure may examine a different
area in the burnout construct than the MBI, thus resulting in different observed
relationships. Indeed, meta-analytic findings suggest that role ambiguity has the highest
corrected weighted mean correlation with the depersonalization facet of the MBI,
whereas the correlations found for the relationship between role ambiguity and the
emotional exhaustion and personal accomplishment facets of the MBI were meaningfully
smaller in magnitude, although the correlation was still positive (Lee & Ashforth, 1996).
A more recent meta-analysis purports that the correlations between role ambiguity
and the facets of burnout are more consistent across facets (Alarcon, 2011), but still, the
reduced personal accomplishment facet has a higher correlation with role ambiguity than
that of role conflict. Although the relationship between role ambiguity and burnout is
frequently reported with moderate to high correlation coefficients (Maslach, Schaufeli, &
Leiter, 2001), it is possible that Pines and Aronson’s (1988) measure, utilized in this
study, does not adequately assess the depersonalization facet from the burnout construct,
thus reducing the observed relationship between role ambiguity and burnout. However,
based on the positive direction of the correlations, which is consistent with prior research,
it is also arguable that the lack of significance resulted from small sample size, and

77
sampling error, instead of a lack of construct relationship. That is, because the statistical
relationship observed is small in magnitude, the sample in this study may not have had
enough power for the correlation to reach significance.
Comparably, role ambiguity and role overload significantly correlated with
turnover intention, but role conflict did not significantly correlate with turnover intention,
although once again, the correlation was in the proposed positive direction. The positive
relationships between role ambiguity and turnover intention (e.g., O’Driscoll & Beehr,
1994) and role overload and turnover intention are commonly supported in research
literature (e.g., Vandenberghe, Panaccio, Bentein, Mignonac, & Roussel, 2011).
Additionally, research frequently reports positive significant relationships between role
conflict and turnover intention (e.g., O’Driscoll & Beehr, 1994; Vandenberghe et al.,
2011), contrary to the findings of this study. However, because the results are similarly in
a positive direction, as hypothesized, it is possible that this relationship is not significant
because of low statistical power due to small sample size.
Further, although not the intended premise of the study, an important finding is
that role overload accounted for the most variance in burnout in comparison to role
ambiguity or role conflict. This is relevant for the study of burnout because it suggests
that role overload may be more important than role ambiguity or role conflict in
predicting burnout. Similarly, role overload accounted for the most variance in turnover
intention, in comparison to role ambiguity and role conflict. This finding is meaningful to
research within the field of occupational health psychology because frequently, when role
stressors are measured, only measurements of role ambiguity and role conflict are
examined (an exception is Glazer & Beehr, 2005). Although work overload is sometimes
examined in studies that examine role stress, work overload is conceptually different
from role overload, which concerns the explicit and implicit roles that individuals take in
their jobs. The findings of this study suggest that for the outcomes of burnout and
turnover intention, role overload may be an important factor to further study and attempt
to reduce in the workplace.

78
General Well-Being and Job-Related Anxiety. General well-being and job-
related anxiety did not significantly correlate with any of the proposed healthy or
unhealthy values, thus failing to provide evidence for Research Question 1. Although
values are not assumed to be inherently healthy or unhealthy, prior research (Sagiv &
Schwartz, 2000) has proposed that a relationship exists between value types and well-
being, such that certain values (e.g., achievement, benevolence) could be classified as
healthy because they were related to subjective well-being, measured in this study as
general well-being, and job-related anxiety. Results did not reveal any significant
correlations, but the correlations for some value types and both anxiety and well-being
were in the intended direction, supporting the theoretical foundation proposed by Sagiv
and Schwartz (2000). Still, these findings are not overall consistent with the subjective
well-being foundation of healthy values, perhaps supporting the proposition that the
healthiness of values depends on the environment, and not the inherent healthiness of
certain value types, as Sagiv and Schwartz (2000) suggested.
Although correlations were nonsignificant, some were in opposite directions of
theory and the healthy vs. unhealthy categorization of value types (Sagiv & Schwartz,
2000). It is suggested that this may indicate that these relationships occurred for two
possibly interrelated reasons: (a) differential relationships between study variables and
(b) differences in the Sagiv and Schwartz (2000) healthy vs. unhealthy value type
distinction. To address the first point, the study that identified values as healthy or
unhealthy used affective and cognitive measures of well-being (Sagiv & Schwartz, 2000).
That is, Sagiv and Schwartz’s study utilized three measures to examine subjective well-
being: (a) the positive/negative affect scale (Bradburn, 1969, as cited in Sagiv &
Schwartz, 2000), (b) the General Mental Health Scale (Becker, 1989 as cited in Sagiv &
Schwartz, 2000), and (c) the satisfaction-with-life scale (Diener, Emmons, Larsen, &
Griffin, 1985, as cited in Sagiv & Schwartz, 2000). It is possible that a different
relationship between the values and outcomes measured in this study were found because
of the variables used to represent well-being. That is, in the Sagiv and Schwartz study,
affective and cognitive measures were used to model subjective well-being, whereas in

79
this study, well-being was examined using a measure of general well-being, and job-
related anxiety. It is possible that these outcomes may have differing relationships with
the values variables, such that the outcome itself may matter when assessing the
healthiness of a value. As the current study used a similar, but still different measure of
well-being (i.e., general well-being and job-related anxiety), results may differ from those
of the Sagiv and Schwartz study.
Although the examination of different outcomes is a plausible explanation for the
difference in results in comparison to the research of Sagiv and Schwartz (2000), other
potential reasons exist. Thus, I suggest a second possible reason for the different findings,
in that the results in this study could be due to the context of the sample used. That is,
prior research has proposed that the environment plays a role in impacting the
relationship between healthy values and outcomes (Sagiv & Schwartz, 2000), so a
different environment (i.e., sample) could produce different outcomes. The current study
utilizes a sample of nurses in U.S. hospitals, whereas Sagiv and Schwartz utilized general
adult and student samples from Israel and former East and West Germany. It is possible
that in the sample of nurses utilized in the current study, value types have a different
relationship with well-being due to the contextual setting, hospitals. Endorsing a
particular value type (e.g., benevolence) may have a different meaning and relationship
with well-being in the context of a hospital than in the context of life in general. It is
possible that if this study were conducted in a general context, results may be more
consistent with Sagiv and Schwartz. That said, it is important to examine how
relationships among variables may differ based on the context, which may suggest
differential interventions based on organization, or occupation (e.g., nurses).
Personal Healthy Values. Although significant correlations between role
stressors and personal healthy values were found, the overall results do not provide
sufficient evidence for research question 2, which asked if personal healthy values
negatively relate with role stressors. Interestingly, the significant correlations between
some unhealthy values and the role stressors are not in the intended direction, but instead
opposite to theory. For example, tradition, a proposed unhealthy value, negatively

80
correlated with role ambiguity and role conflict. Although these preliminary findings do
not support the healthy or unhealthy value categorization (Sagiv & Schwartz, 2000),
findings still show that certain value types negatively correlate with role stressors,
supporting the premise that values may be healthy or unhealthy.
Still, caution is warranted in drawing conclusions, as this study utilized
correlational analyses of cross-sectional data between values and role stressors (only role
stressors were collected at both time points); the true direction of the relationship cannot
be ascertained. The correlation could instead imply that as role stressors increase, certain
values become less important to an individual. The later relationship is less likely due to
the conceptualized function of values, as relatively stable over time (Rokeach, 1973).
Thus, it would be less likely for relatively dynamic role stressors to influence a sizable
change in theoretically static values.
Regarding the relationship between personal healthy values and burnout and
turnover intention, only one significant correlation was revealed. Thus, Hypothesis 3 was
not supported. This finding is contrary to theory (Sagiv & Schwartz, 2000), which argues
that value types can be healthy or unhealthy. I propose that the lack of significant
correlations for burnout may be a result of the measure used to assess burnout. It is also
possible that burnout should be treated as a facet-level construct and not examined as an
overall score. The MBI (Maslach & Jackson, 1981) included instructions that each facet
(emotional exhaustion, reduced accomplishment, and depersonalization) should receive
its own individual score, rather than calculated as an overall burnout score. The Pines and
Aronson (1988) measure utilized for this study does not have the same stipulation, nor
does it include individual facets, and thus one composite score is calculated for burnout.
It is possible that the measure assesses different facets of burnout and that these facets
have differential correlations with healthy values. However, when combined in a
composite measure, these correlations may be overlooked. Unfortunately, because the
measure used has no facets, this study is unable to detect if the results are due to the
measure of burnout utilized, or the actual relationship between burnout and value types
endorsed.

81
The lack of a significant negative relationship between personal healthy values
and turnover is not surprising, as turnover intention is not exclusively linked to health
variables. It is arguable that turnover intention is not negatively related to personal
healthy values due to the various cognitions that influence the intention to turnover. Hom,
Mitchell, Lee, and Griffeth (2012) proposed that there are four types of individuals in
organizations: (1) enthusiastic stayers, (2) enthusiastic leavers, (3) reluctant stayers, and
(4) reluctant leavers, and that individuals in these categories may have different
motivation and organizational attitudes. Although turnover intention and actual employee
turnover is frequently reported as problematic within literature, especially concerning
nurses (e.g., Beecroft et al., 2006; Kovneret al., 2014; Winfield et al., 2009), we are
unable to completely connect it to its causes. Literature commonly finds a positive
relationship between role stressors and turnover intention, suggesting that as role
stressors increase, so does employee turnover intention (e.g., O’Driscoll & Beehr, 1994)
However, this may not be the relationship for all individuals. That is, correlational
relationships could be muddled by individuals who are reluctant leavers, or people who
wish to stay in the job, but for some reason cannot. These people may not experience
high role stressors, but still may intend to leave the organization for personal (e.g.,
moving to a different location) or organizational (e.g., pay) reasons. Current turnover
intention measures, including the one utilized in this study, assess employees intention to
leave, but not the reasons for such intentions.
Two-Way Interactions
Concerning the outcome of burnout, Hypothesis 5 suggested that proposed
healthy values (i.e., achievement, benevolence, self-direction, stimulation and
universalism) values would buffer the relationship between role stressors and burnout.
This hypothesis was not supported. Indeed, individuals who reported high stimulation PV
reported higher levels of burnout. This finding might be a function of the context of the
present study, hospital nurses. Individuals who are high in stimulation seek adventure and
engagement (Schwartz, 1992). However, when role overload is high, these individuals
may be too busy working, thereby leaving no time to seek adventure.

82
Buffering effects were found for both conformity and security values, which were
proposed as unhealthy values (Sagiv & Schwartz, 2000). Individuals who reported high
endorsement of conformity and security values also reported lower levels of burnout. In
the case of conformity, high conformity PV appeared to protect individuals experiencing
role conflict from experiencing high levels of burnout. It is possible that the nurse may
simply follow protocol to cope with role conflict. Comparably, individuals who have low
security PV are exposing themselves to have greater burnout.
In a hospital context, both conformity and security are requirements, as evidenced
by the rules and regulations nurses are expected to follow (American Nurses Association,
2015). Thus, it is perhaps the match with the environment and not the healthiness of a
value that is important. That said, these findings support the premise of Hypothesis 5, in
that value types can moderate the relationship between role stressors and burnout, but
also supports the theory that the healthiness of values may be fluid and variable, or
dependent on context. That is, value types are not inherently healthy nor unhealthy, and
may in fact depend on environmental or situational factors (Sagiv & Schwartz, 2000).
Indeed, Sagiv and Schwartz (2000) proposed that conformity and security acted as
unhealthy values, such that highly endorsing these value types would relate to more
negative outcomes. However, in the present study, highly endorsing conformity and
security value types related to lower reports of burnout.
Regarding turnover intention, results similarly supported the premise of
Hypothesis 5, in that value types can moderate the relationship between role stressors and
outcomes. Results revealed that self-direction moderated the relationship between role
ambiguity and turnover intention such that those who had low endorsement of self-
direction reported higher levels of turnover intention. This result directly supports the
healthiness distinction of self-direction value (Sagiv & Schwartz, 2000). That said, values
that were hypothesized to be healthy were also found to lead to higher reports of turnover
intention. Stimulation value, a hypothesized healthy value, moderated the relationship
between role overload and turnover intention, such that individuals who highly endorsed
stimulation values, also reported higher rates of turnover intention. Indeed, as role

83
overload increased, individuals who reported low stimulation PV endorsement were
nearly unaffected in their reports of turnover intention. It is possible that the role overload
reported is due to mundane, repetitive tasks rather than a variety of stimulating tasks, thus
negatively impacting individuals who report high stimulation PV.
A novel contribution of this study is finding that value types may differentially
impact the relationship between role stressors and outcomes, depending on both the
individual role stressor and the outcome examined. Although a value type (e.g.,
stimulation) moderates the relationship between one role stressor (e.g., role overload) and
an outcome (e.g., burnout), this does not mean the value type will moderate the stressor-
strain relationship when other role stressors or strains are examined. This is important
because it shows that the influence of healthy values is not a universal panacea on the
stressor-strain process, as suggested, but not fully examined, in Sagiv and Schwartz
(2000). Although values types may buffer the relationship between stressors and
outcomes in some situations, in other situations, the effects are negligible.
Three-Way Interactions
Hypothesis 6 was not supported concerning the relationship between role stressors
and burnout, such that healthy value congruence did not act as a meaningful moderator.
However, congruence in unhealthy values significantly interacted with stressors.
Specifically, for the conformity value, value congruence moderated the relationship
between role overload and burnout. When both the perceived organizational conformity
and personal conformity value types were high, there were lower burnout scores,
however, the effects were negligible when both perceived organizational conformity and
personal conformity were low. In this analysis, the interaction between high conformity
PV in a high conformity OV context with role overload resulted in the lowest levels of
burnout. Comparably, when conformity value congruence was used as a moderator of the
relationship between role ambiguity and burnout, low conformity PV in a low conformity
OV (i.e., value congruence) context protected the individual from burnout due to role
ambiguity. However, there were differences when examining the high conformity OV
condition. High conformity PV endorsement in a high conformity OV (i.e., value

84
congruence) context protected the individual from burnout due to role ambiguity, but low
conformity PV endorsement in a high conformity OV context increased burnout. It is
possible that a nurse who reports low conformity PV does not fit the hospital
environment which tends to require conformity.
The Hedonism value, which was not designated as either a healthy or an
unhealthy value, also moderated the role ambiguity-burnout relationship, such that in a
low hedonism OV context, nurses with high hedonism PV had greater burnout than
nurses with low hedonism PV. Furthermore, in the context of high hedonism OV, having
high hedonism PV increased burnout as role ambiguity increased, but the slope was not
significant. It is possible that nurses who value hedonism thrive in environments that are
ambiguous, but not environments that endorse hedonism.
In examining the relationship between role ambiguity and turnover intention,
universalism value congruence was supported in the direction proposed, such that when
the individual’s personal endorsement of universalism and perception of the
organization’s endorsement of universalism values was congruent, turnover intention was
low. In contrast, when both personal and perceived organizational values were low,
turnover intention did not differ from when perceived OV of universalism was low and
PV was high. This finding suggests that in the context of nursing, there might be a good
match between individuals who report high universalism PV and perceive high
universalism OV endorsement. In comparison to the universalism value congruence
relationship, the relationship between role overload and turnover intention was buffered
by benevolence value congruence. When benevolence OV was low and benevolence PV
was low, as well as when benevolence OV and PV were both high, turnover intention due
to role overload was lower than when benevolence PV opposed benevolence OV. It
appears that nurses who have a low value for benevolence may be working in the wrong
work environment, which explains their greater turnover intention. These findings, again,
support the idea that context matters.
In short, when the congruence between each OV and PV value was examined, it
was congruence with context-relevant values that were supported, rather than healthiness

85
of values. Indeed, benevolence and universalism values are important contextual values
in hospitals and congruence on those values moderated specific stressor-outcome
relationships (e.g., role overload and turnover intention). The expectation that healthy
value congruence would mitigate strains in all instances was not supported and therefore,
the extent to which a person’s values align with an organization’s values appears to have
minimal impact on individuals’ psychological strain response (burnout) and behavioral
intentions (turnover intention) as a whole. Results revealed that values differentially
predicted burnout and turnover intention, and that the congruence of organizational and
personal values did not always moderate the relationship between role stressors and
outcomes. Moreover, these findings suggest that value congruence may buffer stressor-
strain relationships only when the value assessed is relevant to the context.
Across the value types examined, value congruence had different impacts on the
relationship between role stressors and outcomes. Interestingly, value congruence did not
always lead to the reduction of poor outcomes, which is contrary to research, which
suggests that value congruence may act as a buffer in stressor-strain relationships (Bao et
al., 2013; Sagiv & Schwartz, 2000). Although value congruence generally had a buffering
impact on the relationship between role stressors and outcomes, this was not always the
case; in fact, in some cases individuals who reported that they endorsed a value highly
and perceived that the organization highly endorsed the value (i.e., value congruence) had
the strongest stressor-outcome relationship. Indeed, when value congruence does
moderate stressor-outcome relationships, it might mitigate deleterious outcomes, but it
might also intensify them. This intensification might occur because of the specific
personal value endorsed. An alternative explanation may be that that objective context
matters when examining value congruence; matching PVs and OVs alone might not
explain when stressors relate to strains.
A novel contribution of these three-way interactions is the acknowledgement that
both the type of values endorsed, and the congruence of personal and perceived
organizational values matter as moderators in the relationship between role stressors and
outcomes. Results from this study suggest that a value’s healthiness may not be absolute,

86
but flexible based on characteristics of the environment, as proposed by previous research
(Sagiv & Schwartz, 2000). That is, endorsement of a particular value may be healthy in
one context and yield positive outcomes, but the same value may be unhealthy in another
context and yield undesirable outcomes. Further, it appears that not only might value
congruence play a role in the moderating stressor-strain relationships, but that the type of
value in context does too.
Limitations
The current study is not without limitations, which may influence further
improvement in occupational health research studies. First, the measure used to examine
role ambiguity, is speculated to instead measure role clarity. Although role ambiguity is
thought to be the conceptual opposite of role clarity, research could benefit from
examining role ambiguity with items that specifically target the concept, instead of the
conceptual opposite.
Second, this study is limited by its small sample size. Although data were
collected from many participants, those who did not participate in both survey
administrations and/or individuals who could not rate their values appropriately on a
hierarchy, reduced the sample dramatically. Sample size limited the analyses, both in
power and in complexity (Dawson & Richter, 2006). Although it was the goal of this
study to examine both two-way and three-way interactions, the sample is likely too small
to rule out issues, such as capitalizing on error. Indeed, slope analyses, which were
performed to probe significant interaction effects, resulted in a small number of
participants within each group (e.g., Low COPV, High COPV, Low COOV, High
COOV). As such, the magnitude, and significance of these relationships may not reflect
the actual nature, as significance testing is solely influenced by two things: (a) the
magnitude of a correlation, and (b) the number of participants in a study. Thus, the small
sample size limited the interpretation of the data. Future research should examine the
impact of healthy values congruence with a larger sample size which would be capable of
the statistical rigor two-way and three-way interaction analyses require.

87
Although this study does have a temporal benefit in comparing role stressors at
T1 to strain variables at T2, which helps reduce the likelihood of common method
variance, burnout was not measured at T1, making it impossible to observe effect in
burnout. Thus, burnout results may be dependent on stressors other than those examined
in this study. Further, because this study is non-experimental, causal conclusions on the
relationship between role stressors and strains cannot be inferred. Future research should
examine the relationships longitudinally, collecting information on each variable of
interest at every time point for consistency and further clarity into the nature of the
relationships between role stressors, values congruence, burnout, and turnover intention.
A final limitation in this study is the usage of many regression analyses. Such
high usage allowed for a clearer interpretation of the specific factors, such as individual
role stressors, or individual personal values, that may have impacted outcomes. However,
this comes at the cost of potentially inflating the variance accounted for by each
individual indicator. Furthermore, this study used p < .10 as a cutoff level due to small
sample size. This decision combined with the large number of analyses risked more Type
I error. Future research should further clarify the role of healthy values in order to (a)
clarify which, if any, personal values are healthy, and under which conditions, and (b)
create composite-type variables that can be utilized in regression analyses more easily.
Despite these limitations, the current study presents several advantages over prior
research in the field. First, this study evaluates the impact of stressors on strains over time
utilizing a longitudinal design. Second, I examine 10 healthy vs. unhealthy values per
Sagiv and Schwartz (2000)). Finally, this is the first study that has examined the
interaction between role stressors and healthy values congruence in relation to burnout
and turnover intention. Results from this study suggest that although value health
classifications did not generally align with previous research (i.e., Sagiv & Schwartz,
2000), the value type itself, along with the congruence between organizational values and
personal values play a role in the relationship between role stressors and outcomes.

88
Future Research
Future research should continue to examine the relationships between role
stressors, outcome variables and values, but also expand to research other occupations in
other organizational contexts. This study meaningfully adds to the understanding of the
stress-process; however, it is impossible to discern if these results are related to sample
characteristics (e.g., nursing profession) or are actually the result of relationships between
role stressors, burnout, and turnover intention. Additionally, future research should
examine the impact of healthy values and value congruence relationships using Schwartz
and colleagues’ (2012) updated conceptualization of value types, which expanded the 10
Schwartz value types to 19 value types. Conceptually disentangling value types may
allow researchers to better understand the nature of healthy values. Results revealed that
further research on the concept of healthy values is necessary, and it may be useful to use
the 19-value type conceptualization of values, in comparison to the broader 10 value
types. Future research should continue to test if healthy value types truly exist, and in
what contexts they impact the stressor-outcome process. As part of examining if healthy
value types exist, future research should also asses well-being at T2 and value types at
T2.
Finally, future research might further examine the physical exhaustion component
of burnout, as I have attempted in this study, as well as the cognitive component of
burnout. Current measures may be inadequate to assess the physical component of
burnout. This is problematic at both the research and practitioner level as: (a)
relationships between burnout and other factors may go unreported or underreported
because the physical component is not adequately measured, and (b) attempts to target
individuals at risk for burnout may be unsuccessful as instruments may not capture the
experience of individuals who feel extreme physical exhaustion.
Implications and Conclusion
The current study demonstrates the importance of examining an individual’s
personal values, along with their congruence with organizational values in investigating
the impact of stressors on outcomes. The results of this study provide some support for

89
the combined effects of both personal healthy values and value congruence. Although
healthy values and value congruence have been examined separately (e.g., Sagiv &
Schwartz, 2000), fewer studies have examined the joint impact of specific values and
value congruence/value incongruence (e.g., Burroughs & Rindfleisch, 2002), and little is
currently known about the relationship between various value types and congruence of
personal and organizational healthy values within a specific organizational context. This
study provides some evidence to support the idea that both the individual value types a
person endorses and the congruence of those value types with what is perceived as the
organization’s endorsement of the same values are important in influencing the
relationships between role stressors and outcome variables.
The findings of differential relationships between role stressors, personal values,
and outcomes express, at a minute level, the vast potential for moderators of the
relationship between stressors and outcomes. Results of this study indicate that although
some specific values may significantly interact with stressors to account for variance in
outcomes, the specific value type endorsed does matter. That is, although one value type
does not impact all relationships between role stressors, burnout, and turnover intention,
some value types may be better to endorse in some situations, in comparison to others.
Similarly, although value congruence generally reduced the magnitude of the relationship
between stressors and poor outcomes, this was not always the case, nor was it always
significant. It is suggested that some value congruence relationships were significant over
others because of the context. That is, both the value type endorsed and value congruence
within a specific context matter in better understanding the stress process. Thus, this
study suggests that researchers and practitioners should potentially consider the
healthiness of personal values and organizational values, as well as value congruence in
context when investigating occupational health variables.
Further, due to the role overload findings, it is suggested that researchers and
practitioners should include role overload when examining role stress. It is possible that
the amount of variance role overload had in predicting burnout and turnover intention
over and above role ambiguity and role conflict may be meaningful, and applicable to

90
interventions that target burnout and turnover intention. Practically, the relationship
between role overload and burnout suggests that organization interventions that aim to
reduce employee burnout and turnover intention may benefit from programs and training
that target reducing role overload. That said, role stressors had differential relationships
based on the outcome examined. Therefore, reducing role overload may not act as a
universal strategy to reducing all employee strains. Zapf et al. (1996) argued that there
are numerous personal and environmental factors (some perhaps not yet identified) that
may influence strains. Thus, it is suggested that although role overload accounted for the
largest amount of variance in both burnout and turnover intention in this study,
management should not simply assume that role overload is the problem within the
organization. Instead, organizational interventions should be individually tailored to meet
the needs of the employees, as an intervention to target role overload when role overload
is low may be less effective than an intervention that targets a stressor that employees
rated highly. Management in organizations should consider the cost and potential of
employee and organizational benefit when developing interventions that target
occupational stress.
Additionally, results indicating that role stressors differentially predicted
outcomes have implications for the measurement of role stress. Role ambiguity, role
conflict, and role overload are frequently examined separately, as different types of role
stressors (e.g., Glazer & Beehr, 2005). However, role stressors have also been
conceptualized as an overall composite, combining each of the three (or sometimes two
when role overload is not examined) types of role stressors. Findings that role stressors
examined separately predict outcomes to a different degree suggests that composite
inventories may mask individual variance among predictors. Organizational resources
could be wasted in broadly targeting the reduction of role stressors in general, instead of
focusing interventions on the specific role stressors that are having the most influential
effects on individual and organizational outcomes.

91
REFERENCES
Aiken, L. H., Clarke, S. P., Sloane, D. M., Sochalski, J., & Silber, J. (2002). Hospital
nurse staffing and patient mortality, nurse burnout, and job dissatisfaction.
Journal of the American Medical Association, 288, 1987-1993.
Aiken, L. H., & Sloane, D. M. (1997) Effects of organizational innovations in AIDS care
on burnout among hospital nurses. Work and Occupations, 24, 455-477.
Alarcon, G. M. (2011). A meta-analysis of burnout with job demands, resources, and
attitudes. Journal of Vocational Behavior, 79, 549-562.
American Nurses Association. (2015). Code of ethics for nurses with interpretive
statements. Retrieved from https://www.nursingworld.org/coe-view-only.
Baernholdt, M., & Mark, B. A. (2009). The nurse work environment, job satisfaction and
turnover rates in rural and urban nursing units. Journal of Nursing Management,
17, 994-1001.
Bakker, A. B., & Demerouti, E. (2007). The Job Demands-Resource model: State of the
art. Journal of Managerial Psychology, 22, 309-328.
Bao, Y., Vedina, R., Moodie, S., & Dolan, S. (2013). The relationship between value
incongruence and individual and organizational well-being outcomes: An
exploratory study among Catalan nurses. Journal of Advanced Nursing, 69, 631-
641.
Beecroft, P. C., Dorey, F., & Wenten, M. (2008). Turnover intention in new graduate
nurses: A multivariate analysis. Journal of Advanced Nursing, 62, 41-52.
Beecroft, P.C., Santner, S., Lacy, M. L., Kunzman, L., & Dorsey, F. (2006) New graduate
nurses’ perceptions of mentoring: Six-year programme evaluation. Journal of
Advanced Nursing, 55, 736-747.
Beehr, T. A. (1995). Psychological stress in the workplace. London, UK: Routledge.
Beehr, T. A. (1998). An organizational psychology meta-model of occupational stress. In
C. L. Cooper (Ed.), Theories of organizational stress (pp. 6-27). New York, NY:
Oxford University Press.
Beehr, T. A., Glaser, K. M., Canali. K. G., & Wallwey, D. A. (2001). Back to basics: Re-
examination of the demand-control theory of occupational stress. Work & Stress,
15, 115-130.

92
Beehr, T. A., & Glazer, S. (2005). Organizational role stress. In J. Barling, K. Kelloway,
& M. Frone (Eds.), Handbook of work stress (pp. 7-33). Thousand Oaks, CA:
Sage.
Beehr, T. A., Jex, S. M., Stacy, B. A., & Murray, M. A. (2000). Work stressors and
coworker support as predictors of individual strain and job performance.
Personnel Psychology, 21, 391–405.
Beehr, T. A., & Newman, J. E. (1978). Job stress, employee health, and organizational
effectiveness: A facet analysis, model, and literature review. Personnel
Psychology, 31, 665-699.
Bilsky, W., & Schwartz, S. H. (1994). Values and personality. European Journal of
Personality, 8, 163-181.
Boamah, S. A., & Laschinger, H. (2016). The influence of areas of worklife fit and work-
life interferences on burnout and turnover intentions among new graduate nurses.
Journal of Nursing Management, 24, 164-174.
Bocchino, C. C., Hartman, B. W., & Foley, P. F. (2003). The relationship between
person-organization congruence, perceived violations of the psychological
contract, and occupational stress symptoms. Consulting Psychology Journal:
Practice and Research, 55, 203-214.
Buchanan, T. G. (2004). Values as moderators of stressor-strain relationships among
urban school teachers (Unpublished master’s thesis). San Jose State University,
California.
Burroughs, J. E., & Rindfleisch, A. (2002). Materialism and well-being: A conflicting
values perspective. Journal of Consumer Research, 29, 348-370.
Cable, M. D., & Edwards, J. R. (2004). Complementary and supplementary fit: A
theoretical and empirical integration. Journal of Applied Psychology, 89, 822-834.
Cable, M. D., & Parsons, C. K. (2001). Socialization tactics and person-organization fit.
Personnel Psychology, 54, 1-23.
Chang, E., & Hancock, K. (2003). Role stress and role ambiguity in new nursing
graduates in Australia. Nursing and Health Sciences, 5, 155-163.
Cooper, C. L., Dewe, P. J., & O’Driscoll, M. P. (2001). A special form of strain: Job-
related burnout. Organizational stress: A review and critique of theory, research,
and applications (pp. 79-116). Thousand Oaks, CA: Sage.

93
Dawson, J. F., & Richter, A. W. (2006). Probing three-way interaction in moderated
multiple regression: Development and application of a slope difference test.
Journal of Applied Psychology, 4, 917-926.
Demerouti, E., Bakker, A. B., de Jonge, J., Janssen, P. P. M., & Schaufeli, W. B. (2001).
Burnout and engagement at work as a function of demands and control.
Scandinavian Journal of Work Environment & Health, 27, 279-286.
Dendaas, N. (2011). Environmental congruence and work-related stress in acute care
hospital medical/surgical units: A descriptive, correlational study. Health
Environmental Research & Design Journal, 5, 23-42.
Dewe, P. J., O’Driscoll, M. P., & Cooper, C. L. (2012). Theories of psychological stress
at work. In R. J. Gatchel & I. Z. Schilz (Eds.) Handbook of occupational health
and wellness, (pp. 23-38). New York, NY: Springer.
Earnest, D. R., Allen, D. G., & Landis, R. S. (2011). Mechanisms linking realistic job
previews with turnover: A meta-analytic path analysis. Personnel Psychology, 64,
865-897.
Edwards, J. R., & Cable, D. M. (2009). The value of value congruence. Journal of
Applied Psychology, 94, 654-677.
Edwards, J. R., & Cooper, C. L. (1990). The person-environment fit approach to stress:
Recurring problems and some suggested solutions. Journal of Organizational
Behavior, 11, 293-307.
French, S. E., Lenton, R., Walters, V., & Eyles, J. (2000). An empirical evaluation of an
expanded nursing stress scale. Journal of Nursing Measurement, 8, 161- 178.
Glazer, S. (1999). A cross-cultural study of job stress among nurses (Doctoral
dissertation). Retrieved from University Microfilms International. (9925510).
Glazer, S. (2005). Six of one, half a dozen of the other: Problems with working fixed and
rotating shifts. International Journal of Stress Management, 12, 142-163.
Glazer, S., & Beehr, T. A. (2002). Similarities and differences in human values between
nurses in four countries. International Journal of Cross Cultural Management, 2,
185-202.
Glazer, S., & Beehr, T. A. (2005). Consistency of implications of three role stressors
across four countries. Journal of Organizational Behavior, 26, 467-487.
Glazer, S., & Gyurak, A. (2008). Sources of occupational stress among nurses in five
countries. International Journal of Intercultural Relations, 32, 49-66.

94
Glazer, S., & Kruse, B. (2008). The role of organizational commitment in occupational
stress models. International Journal of Stress Management, 15, 329-344.
Glazer, S., Simonovich, H., Roach, K., & Carmona, C. R. (accepted). Acculturation and
adjustment as a function of perceived and objective value congruence.
International Journal of Psychology.
Glebbeek, A. C., & Bax, E. H. (2004). Is high employee turnover really harmful? An
empirical test using company records. Academy of Management Journal, 47, 277-
286.
Goh, J., Pfeffer, J., & Zenios, S. A. (2015). The relationship between workplace stressors
and mortality and health costs in the United States. Management Science, 62, 608-
628.
Goldberg, D. P., & Hillier, V. F. (1979). A scaled version of the General Health
Questionnaire. Psychological Medicine, 9, 139-145.
Goodman, E. A., & Boss, R. W. (2002). The phase model of burnout and employee
turnover. Journal of Health and Human Services Administration, 25, 33-47.
Gunusen, N. P., Ustun, B., & Erdem, S. (2014). Work stress and emotional exhaustion in
nurses: The mediating role of internal locus of control. Research and Theory for
Nursing Practice, 28, 260-268.
Han. S., Han, J., An, Y., & Lim, S. (2015). Effects of role stress on nurses’ turnover
intentions: The mediating effects of organizational commitment and burnout.
Japan Journal of Nursing Science, 12, 287-296.
Hang-yue, N., Foley, S., & Loi, R. (2005). Work role stressors and turnover intention: A
study of professional clergy in Hong Kong. International Journal of Human
Resource Management, 16, 2133-2146.
Herzberg, F. (1974). Motivation-hygiene profiles: Pinpointing what ails the organization.
Organizational Dynamics, 3, 18-29.
Hobfoll, S. E. (2001). The influence of culture, community and the nested-self in the
stress process: Advancing conservation of resources theory. Applied Psychology:
An International Review, 50, 337–421.
Hoel, H., Sparks, K., & Cooper, C. (2001). The cost of violence/stress at work and the
benefits of a violence/stress-free working environment. Retrieved from the
International Labour Organisation website:
http://www.ilo.org/wcmsp5/groups/public/---ed_protect/---protrav/---
safework/documents/publication/wcms_108532.pdf

95
Hoffman, B. J., Bynum, B. H., Piccolo, R. F., & Sutton, A. W. (2011). Person-
organization value congruence: How transformational leaders influence work
group effectiveness. Academy of Management Journal, 54, 779-796.
Hom, P. W., Mitchell, T. R., Lee, T. W., & Griffeth, R. W. (2012). Reviewing employee
turnover: Focusing on proximal withdrawal states and an expanded criterion.
Psychological Bulletin, 138, 831-858.
Jamal, M., & Baba, V. V. (1997). Shiftwork, burnout, and well-being: A study of
Canadian nurses. International Journal of Stress Management, 4, 197-204.
Jawahar, I. M., Stone, T. H., & Kisamore, J. L. (2007). Role conflict and burnout: The
direct and moderating effects of political skill and perceived organizational
support on burnout dimensions. International Journal of Stress Management, 14,
142-159.
Jex, S. M. (2002). Organizational psychology: A scientist-practitioner approach. New
York, NY: Wiley.
Jones, C. B. (2005). The costs of nurse turnover, part 2: Application of the nursing
turnover cost calculation methodology. Journal of Nursing Administration, 35,
41-49.
Jones, C. B. (2008). Revisiting nurse turnover costs: Adjusting for inflation. Journal of
Nursing Administration, 38, 11-18.
Karasek, R. A. (1979). Job demands, job decision latitude, and mental strain:
Implications for job redesign. Administrative Science Quarterly, 24, 285–308.
Kasser, T., & Ahuvia, A. (2002). Materialistic values and well-being in business students.
European Journal of Social Psychology, 32, 137-146.
Kim, H., & Lee, S. (2009). Supervisory communication, burnout, and turnover intention
among social workers in health care settings. Social Work in Health Care, 48,
364-385.
Kim, H., & Stoner, M. (2008). Burnout and turnover intention among social workers:
Effects of role stress, job autonomy, and social support. Administration in Social
Work, 32, 5-25.
Kovner, C. T., Brewer, C. S., Fatehi, G., & Jun, J. (2014). What does nurse turnover rate
mean and what is the rate? Policy, Politics & Nursing Practice, 15, 3-4.

96
Kristof, A. L. (1996). Person-organization fit: An integrative review of its
conceptualizations, measurement, and implications. Personnel Psychology, 49, 1-
49.
Kristof-Brown, A. L., Zimmerman, R. D., & Johnson, E. C. (2005). Consequences of
individuals’ fit at work: A meta-analysis of person-job, person-organization,
person-group, and person-supervisor fit. Personnel Psychology, 58, 281-342.
Lazarus, R. S. (1999). Stress and emotion: A new synthesis. London: Free Association.
Lazarus, R. S. (2001). Relational meaning and discrete emotions. In K. Scherer, A.
Schorr, & T. Johnstone (Eds.), Appraisal processes in emotion: Theory, methods,
research (pp. 37–67). New York: Oxford University Press.
Lazarus, R. S., & Folkman, S. (1987). Transactional theory and research on emotions and
coping. European Journal of Personality, 1, 141-169.
Lee, R. T., & Ashforth, B. E. (1996). A meta-analytic examination of the correlates of the
three dimensions of job burnout. Journal of Applied Psychology, 81, 123-133.
Leiter, M. P., Gascon, S., & Martinez-Jarreta, B. (2009). Value congruence, burnout, and
culture: Similarities and contrasts for Canadian and Spanish nurses. In A. G.
Antonious, C. L. Cooper, G. P. Chrousos, C. D. Spielberger, & M. W. Eysenck
(Eds.), Handbook of managerial behavior and occupational health (pp. 241-251).
Northampton, MA: Edward Elgar.
Leiter, M. P., Jackson, N. J., & Shaughnessy, K. (2009). Contrasting burnout, turnover
intention, control, value congruence and knowledge sharing between Baby
Boomers and Generation X. Journal of Nursing Management, 17, 100-109.
Leiter, M. P., & Maslach C. (2009). Nurse turnover: The mediating role of burnout.
Journal of Nursing Management, 17, 331-339.
Mark, G. M., & Smith, A. P. (2008). Stress models: A review and suggested new
direction. Journal of Occupational Health Psychology, 3, 111-144.
Maslach, C. (1982). Understanding burnout: Definitional issues in analyzing a complex
phenomenon. In W. S. Paine (Ed.), Job stress and burnout (pp. 29-40). Beverly
Hills, CA: Sage.
Maslach, C. (1993). Burnout: A multidimensional perspective. In W. B. Schaufeli, C.
Maslach, & T. Marek (Eds.), Professional burnout: Recent developments in
theory and research (pp. 19-32). Washington, DC: Taylor & Francis.

97
Maslach, C., & Jackson, S. E. (1981). The measurement of experienced burnout. Journal
of Organizational Behavior, 2, 99-113.
Maslach, C., Schaufeli, W. B., & Leiter, M. P. (2001). Job burnout. Annual Review of
Psychology, 52, 397-422.
McCoy, W. J. (1986). Value incongruence and occupational stress and strain: An
exploratory study. Retrieved from University Microfilms International.
(8620614).
McGowan, J., Gardner, D., & Fletcher, R. (2006). Positive and negative affective
outcomes of occupational stress. New Zealand Journal of Psychology, 35, 92-98.
McVicar, A. (2003). Workplace stress in nursing: A literature review. Journal of
Advanced Nursing, 44, 633-642.
Meglino, B. M., & DeNisi, A. S. (1987) Realistic job previews: Some thoughts on their
more effective use in managing the flow of human resources. Human Resource
Planning, 10, 157-167.
Musiol, A., & Boehnke, K. (2013). Person-environment value congruence and
satisfaction with life. International Journal of Humanities and Social Science, 3,
57-65.
O'Driscoll, M. P., & Beehr, T. A. (1994). Supervisor behaviors, role stressors and
uncertainty as predictors of personal outcomes for subordinates. Journal of
Organizational Behavior, 15, 141-155.
O’Reilly, C. A., Chatman, J., & Caldwell, D. F. (1991). People and organizational
culture: A profile comparison approach to assessing person-organizational fit.
Academy of Management Journal, 34, 487-516.
Parker, D. F., & DeCotiis, T. A. (1983). Organizational determinants of job stress.
Organizational Behavior and Human Performance, 32, 160-177.
Pines, A. M., & Aronson, E. (1988). Career burnout: Causes and cures. New York, NY:
Free Press.
Pines, A. M., & Kafry, D. (1978). Occupational tedium in the social services. Social
Work, 23, 499-507.
Potter, P., Deshields, T., Divanbeigi, J., Berger, J., Cipriano, D., Norris, L., & Olsen. S.
(2010). Compassion fatigue and burnout: Prevalence among oncology nurses.
Clinical Journal of Oncology Nursing, 14, 56-62.

98
Proost, K., De Witte, H., De Witte, K., & Evers, G. (2004). Burnout among nurses:
Extending the job demand-control-support model with work-home interference.
Psychologica Belgica, 44, 269-288.
Rassin, M. (2008). Nurses’ professional and personal values. Nursing Ethics, 15, 614-
630.
Rizzo, J. R., House, R. J., & Lirtzman, S. I. (1970). Role conflict and ambiguity in
complex organizations. Administrative Science Quarterly, 2, 150-163.
Rokeach, M. (1973). The nature of human values. New York, NY: Free Press.
Sagiv, L., & Schwartz, S. H. (2000). Value priorities and subjective well-being: Direct
relations and congruity effects. European Journal of Social Psychology, 30, 177-
198.
Schneider, B. (1987). The people make the place. Personnel Psychology, 40, 437-453.
Schneider, B., Goldstein, H., & Smith, B. D. (1995). The ASA framework: An update.
Personnel Psychology, 48, 747-773.
Schneider, B., Smith, D. B., Taylor, S., & Fleenor, J. (1998). Personality and
organizations: A test of the homogeneity of personality hypothesis. Journal of
Applied Psychology, 83, 462-470.
Schwartz, S. H. (1992). Universals in the content and structure of values: Theory and
empirical tests in 20 countries. In M. Zanna (Ed.), Advances in experimental
social psychology New York, NY: Academic Press.
http://dx.doi.org/10.1016/S0065-2601(08)60281-6
Schwartz, S. H. (1994). Are there universal aspects in the content and structure of values?
Journal of Social Issues, 50, 19-46.
Schwartz, S. H. (2012). An overview of the Schwartz theory of basic values. Online
Readings in Psychology and Culture, 2, 1-20.
Schwartz, S. H. (2009). Draft users’ manual: Proper use of the Schwartz Value Survey,
version 14 January 2009, compiled by Romie F. Littrell. Auckland, New Zealand:
Centre for Cross Cultural Comparisons. Retrieved June 29, 2017 from
http://www.crossculturalcentre.homestead.com
Schwartz, S. H., & Bardi, A. (2001). Value hierarchies across cultures. Journal of Cross-
Cultural Psychology, 32, 268-290.
Schwartz, S. H., & Bilsky, W. (1987). Toward a universal psychological structure of
human values. Journal of Personality and Social Psychology, 53, 550-662.

99
Schwartz, S. H., Cieciuch, J., Vecchione, M., Davidov, E., Fischer, R., Beierlein, C., …
Konty, M. (2012). Refining the theory of basic individual values. Journal of
Personality and Social Psychology, 103, 663-688.
Sheward, L., Hunt, J., Hagen, S., & Macleod, M. (2004). The relationship between UK
hospital nurse staffing and emotional exhaustion and job dissatisfaction. Journal
of Nursing Management, 13, 51-60.
Siegall, M., & McDonald, T. (2004). Person-organization value congruence, burnout and
diversion of resources. Personnel Review, 33, 291-301.
Steel, R. P., & Ovalle, N. K. (1984). A review and meta-analysis of research on the
relationship between behavioral and employee turnover. Journal of Applied
Psychology, 69, 673-686.
Stordeur, S., D’hoore, W., & Vandenberghe, C. (2001). Leadership, organizational stress,
and emotional exhaustion among hospital nursing staff. Journal of Advanced
Nursing, 35, 533-542.
Stout, J. K., & Posner, J. L. (1984). Stress, role ambiguity, and role conflict.
Psychological Reports, 55, 747-753.
Takahashi, M., Taniqawa, T., Tachibana, N., Mutou, K., Kage, Y., Smith, L., & Iso, H.
(2005). Modifying effects of perceived adaptation to shift work on health,
wellbeing, and alertness on the job among nuclear power plant operators.
Industrial Health, 43, 171-178.
Tett, R. P., & Meyer, J. P. (1993). Job satisfaction, organizational commitment, turnover
intention, and turnover: Path analysis based on meta-analytic findings. Personnel
Psychology, 46, 259-293.
The American Institute of Stress. (n.d.). Workplace stress. Retrieved from:
http://www.stress.org/workplace-stress/
Tracey, J. B., & Hinkin, T. R. (2010). Contextual factors and cost profiles associated with
employee turnover. In C. Enz (Ed.), In The Cornell School of Hotel
Administration handbook of applied hospitality strategy (pp. 736-753). Los
Angeles, CA: Sage.
Tunc, T., & Kutanis, R. O. (2007). Role conflict, role ambiguity, and burnout in nurse
and physicians at a university hospital in Turkey. Nursing & Health Sciences, 11,
410-416.

100
Ugurlu, Z., Karahan, A., Unlu, H. M., Abbasoglu, A., Elbas, N. O., Isik, S. A., & Tepe,
A. (2015). The effects of workload and working conditions on operating room
nurses and technicians. Workplace Health & Safety, 63, 399-407.
U.S. Census Bureau. (2013). Men in nursing occupations: American community survey
highlight report. Retrieved from https://www.census.gov/content/ dam/Census/
library/working-papers/2013/acs/2013_Landivar_02.pdf
Van Maanen, J. E., & Schien, E. H. (1979). Toward a theory of organizational
socialization. In B. M. Staw (Ed.), Research in organizational behavior (Vol 1,
pp. 209-264). Greenwich, CT: JAI Press.
Vandenberghe, C. (1999). Organizational culture, person-culture fit and turnover: A
replication in the health care industry. Journal of Organizational Behavior, 20,
175–184.
Vandenberghe, C., Panaccio, A., Bentein, K., Mignonac, K., & Roussel, P. (2011).
Assessing longitudinal change of and dynamic relationships among role stressors,
job attitudes, turnover intention, and well-being in neophyte newcomers. Journal
of Organizational Behavior, 32, 652-671.
Verquer, M. L., Beehr, T. A., & Wagner, S. H. (2003). A meta-analysis of relations
between person-organization fit and work attitudes. Journal of Vocational
Behavior, 63, 473-489.
Vredenburgh, D. J., & Trinkaus, R. J. (1983). An analysis of role stress among hospital
nurses. Journal of Vocational Behavior, 22, 82-95.
Waldman, J. D., Kelly, F., Arora, S., & Smith, H. L. (2004). The shocking cost of
turnover in health care. Health Care Management Review, 29, 2-7.
Warr, P. (1990). The measurement of well-being and other aspects of mental health.
Journal of Occupational Psychology, 63, 193-210.
Winfield, C., Melo, K., & Myrick, F. (2009). Meeting the challenge of new graduate role
transition: Clinical nurse educators leading the change. Journal for Nurses in Staff
Development, 25, 7-13.
Wisdom, B. (1984). Primary sources of hospital administrator stress. Journal of
Occupational Behavior, 5, 229-232.
Wright, T. A., Cropanzano, R., & Bonett, D. G. (2007). The moderating role of employee
positive well being on the relation between job satisfaction and job performance.
Journal of Occupational Healthy Psychology, 12, 93-104.

101
Yang, L., Che, H., & Spector, P. E. (2008). Job stress and well-being: An examination
from the view of person-environment fit. Journal of Occupational Psychology,
81, 567-587.
Zapf, D., Dorman, C., & Frese, M. (1996). Longitudinal studies in organizational stress
research: a review of the literature with reference to methodological issues.
Journal of Occupational Health Psychology, 1, 145-169.

102
Appendix A
Copyright Permission
This Agreement between Krystal ("You") and John Wiley and Sons ("John Wiley and
Sons") consists of your license details and the terms and conditions provided by John
Wiley and Sons and Copyright Clearance Center.
License Number 4313701418705
License date Mar 21, 2018
Licensed Content
Publisher
John Wiley and Sons
Licensed Content
Publication
European Journal of Social Psychology
Licensed Content Title Value priorities and subjective well‐being: direct relations
and congruity effects
Licensed Content Author Lilach Sagiv, Shalom H. Schwartz
Licensed Content Date Mar 9, 2000
Licensed Content
Volume
30
Licensed Content Issue 2
Licensed Content Pages 22
Type of use Dissertation/Thesis
Requestor type University/Academic
Format Print and electronic
Portion Figure/table
Number of figures/tables 1
Original Wiley
figure/table number(s)
Figure 1. Theoretical model of relations among ten motivational
types of values
Will you be translating? No
Title of your thesis /
dissertation
THE MODERATING EFFECTS OF HEALTHY VALUE
CONGRUENCE ON THE ROLE STRESSOR- STRAIN
RELATIONSHIP

103
Appendix B
Values used to Create Value Types (Schwartz, 1992; Schwartz & Sagiv, 1995)
Value Type Items on Survey
Achievement Ambitious, Influential, Capable, Successful.
Benevolence Loyal, Honest, Helpful, Responsible, Forgiving.
Conformity Politeness, Self-Discipline, Honoring of Parents and Elders,
Obedient.
Hedonism Pleasure, Enjoying Life, Self-Indulgent.
Power Social Power, Wealth, Authority, Preserving My Public Image.
Security Social Order, National Security, Reciprocation of Favors,
Family Security, Clean.
Self-Direction Freedom, Creativity, Independent, Choosing Own Goals,
Curious.
Stimulation An Exciting Life, A Varied Life, Daring.
Tradition Respect for Tradition, Moderate, Humble, Accepting My Portion
in Life, Devout.
Universalism Equality, A World at Peace, Unity with Nature, Wisdom, A
World of Beauty, Social Justice, Broadminded, Protecting the
Environment.

104
Appendix C
Survey Items
1. Role Stressors
Role Ambiguity
1. I have clear, planned goals and objectives for my job.
2. I know exactly what is expected of me.
3. Explanation is clear of what has to be done.
Role Conflict
1. I work with two or more groups who operate quite differently.
2. I receive incompatible requests from two or more people.
3. I do thinks that are apt to be accepted by one person and not accepted by another.
Role Overload
1. I receive an assignment without the manpower to complete it.
2. It seems like I have too much work to for one person to complete.
3. On my present job, the amount of work seems to interfere with how well I can do
the job.
4. I often notice a marked increase in my workload.
2. Schwartz’s Values Survey Items (Schwartz, 1992)
1. EQUALITY (equal opportunity for
all)
2. INNER HARMONY (at peace
with myself)
3. SOCIAL POWER (control over
others, dominance)
4. PLEASURE (gratification of
desires)
5. FREEDOM (freedom of action and
thought)
6. A SPIRITUAL LIFE (emphasis on
spiritual not material matters)
7. SENSE OF BELONGING (feeling
that others care about me)
8. SOCIAL ORDER (stability of
society)
9. AN EXCITING LIFE (stimulating
experiences)
10. MEANING IN LIFE (a purpose in
life)
11. POLITENESS (courtesy, good
manners)
12. WEALTH (material possessions,
money)
13. NATIONAL SECURITY
(protection of my nation from
enemies)
14. SELF RESPECT (belief in one’s
own worth)
15. RECIPROCATION OF FAVORS
(avoidance of indebtedness)
16. CREATIVITY (uniqueness,
imagination)

105
17. A WORLD AT PEACE (free of
war and conflict)
18. RESPECT FOR TRADITION
(preservation of time-honored
customs)
19. MATURE LOVE (deep emotional
& spiritual intimacy)
20. SELF-DISCIPLINE (self-
restraint, resistance to temptation)
21. PRIVACY (the right to have a
private sphere)
22. FAMILY SECURITY (safety for
loved ones)
23. SOCIAL RECOGNITION
(respect, approval by others)
24. UNITY WITH NATURE (fitting
into nature)
25. A VARIED LIFE (filled with
challenge, novelty and change)
26. WISDOM (a mature
understanding of life)
27. AUTHORITY (the right to lead or
command)
28. TRUE FRIENDSHIP (close,
supportive friends)
29. A WORLD OF BEAUTY (beauty
of nature and the arts)
30. SOCIAL JUSTICE (correcting
injustice, care for the weak)
31. INDEPENDENT (self-reliant,
self-sufficient)
32. MODERATE (avoiding extremes
of feeling & action)
33. LOYAL (faithful to my friends,
group)
34. AMBITIOUS (hard-working,
aspiring)
35. BROADMINDED (tolerant of
different ideas and beliefs)
36. HUMBLE (modest, self-effacing)
37. DARING (seeking adventure,
risk)
38. PROTECTING THE
ENVIRONMENT (preserving
nature)
39. INFLUENTIAL (having an
impact on people and events)
40. HONORING OF PARENTS
AND ELDERS (showing respect)
41. CHOOSING OWN GOALS
(selecting own purposes)
42. HEALTHY (not being sick
physically or mentally)
43. CAPABLE (competent, effective,
efficient)
44. ACCEPTING MY PORTION IN
LIFE (submitting to life’s
circumstances)
45. HONEST (genuine, sincere)
46. PRESERVING MY PUBLIC
IMAGE (protecting “face”)
47. OBEDIENT (dutiful, meeting
obligations)
48. INTELLIGENT (logical,
thinking)
49. HELPFUL (working for the
welfare of others)
50. ENJOYING LIFE (enjoying food,
sex, leisure, etc.)

106
51. DEVOUT (holding to religious
faith & belief)
52. RESPONSIBLE (dependable,
reliable)
53. CURIOUS (interested in
everything, exploring)
54. FORGIVING (willing to pardon
others)
55. SUCCESSFUL (achieving goals)
56. CLEAN (neat, tidy)
57. SELF-INDULGENT (doing
pleasant things)
3. Burnout Items (Pines & Aronson, 1988)
1. Tired
2. Disappointed with people
3. Hopeless
4. Trapped
5. Helpless
6. Depressed
7. Physically weak/Sickly
8. Worthless/Like a failure
9. Difficulties sleeping
10. “I’ve had it”
4. Turnover Intention Items (Glazer & Beehr, 2005)
1. I will actively look for a new job in the next year.
2. I often think about quitting.
3. I will probably look for a new job in the next year.
5. General Well-Being Items (Goldberg & Hillier, 1979)
1. I have been able to concentrate on what I am doing.
2. I have lost much sleep over worry.
3. I have felt that I am playing a useful part in things.
4. I have felt capable of making decisions about things.
5. I have felt I can’t overcome my difficulties.
6. I have been able to enjoy my normal day-to-day activities.
7. I have been able to face up to my problems.
8. I have been feeling unhappy or depressed.
9. I have been losing confidence in myself.
10. I have been thinking of myself as a worthless person.
11. I have been feeling reasonably happy, all things considered.
6. Job-Related Anxiety Items (Parker & DeCotiis, 1983)
1. Sometimes when I think about my job I get a tight feeling in my chest.
2. I have felt fidgety or nervous as a result of my job.
3. My job gets to me more than it should.
4. There are lots of times when my job drives me right up the wall.


