Embed Size (px)
Citation preview
MODERATING EFFECT OF CORPORATE PARENTING
ROLES ON THE RELATIONSHIP BETWEEN PRODUCT
DIVERSIFICATION STRATEGIES AND CORPORATE
PERFORMANCE OF LISTED COMPANIES ON BURSA
MALAYSIA
KHAWAJA KHALID MEHMOOD
DOCTOR OF PHILOSOPHY UNIVERSITI UTARA MALAYSIA
February 2015

MODERATING EFFECT OF CORPORATE PARENTING ROLES ON THE
RELATIONSHIP BETWEEN PRODUCT DIVERSIFICATION STRATEGIES
AND CORPORATE PERFORMANCE OF LISTED COMPANIES ON BURSA
MALAYSIA
By
KHAWAJA KHALID MEHMOOD
Thesis Submitted to School of Business Management,
Universiti Utara Malaysia, in Fulfilment of the Requirement for the Degree of Doctor of Philosophy

iv
PERMISSION TO USE In presenting this thesis in fulfilment of the requirements for a Post Graduate degree from the Universiti Utara Malaysia (UUM), I agree that the Library of this university may make it freely available for inspection. I further agree that permission for copying this thesis in any manner, in whole or in part, for scholarly purposes may be granted by my supervisor or in his absence, by the Dean of School of Business Management where I did my thesis. It is understood that any copying or publication or use of this thesis or parts of it for financial gain shall not be allowed without my written permission. It is also understood that due recognition shall be given to me and to the UUM in any scholarly use which may be made of any material in my thesis. Request for permission to copy or to make other use of materials in this thesis in whole or in part should be addressed to:
Dean of School of Business Management Universiti Utara Malaysia
06010 UUM Sintok Kedah Darul Aman
v
ABSTRACT Past research examining effect of product diversification strategy on corporate performance has produced inconclusive results. Equal ambiguity resides in the relative superiority and effects of related diversification strategy versus unrelated diversification strategy on corporate performance. Amidst, corporate parenting has been considered as a crucial issue related to diversification strategies. Primarily, this study attempted to reconcile paradox concerning diversification strategies – performance relationship by focusing on the moderating effect of corporate parenting roles on the relationship. Additionally, the study used multiple performance measures to enrich the investigation. Keeping in view the important role of Malaysian corporate sector in country’s growth and development, and proliferation of diversified companies in Malaysia, this study was conducted on Public Listed Companies (PLCs) listed on Bursa Malaysia’s Main Market. Secondary data was obtained mainly from companies’ annual reports, while primary data was collected through questionnaires sent to top managers of PLCs. This study utilised sample of 123 PLCs, and employed various statistical methods to draw conclusions using SPSS. The study reveals that product diversification strategy in total, does not affect corporate performance. Related diversification strategy positively affects Tobin’s q and price to book value, and unrelated diversification strategy negatively affects return on assets and price to book value. Synergy manager positively moderates relationship between related diversification strategy and Tobin’s q, and price to book value. Parental developer positively moderates relationship between related diversification strategy and all financial measures of corporate performance. Portfolio manager positively moderates relationship between unrelated diversification strategy and return on assets, and return on equity. Related diversifiers seem to outperform unrelated diversifiers on Tobin’s q and price to book value. Parental developers perform well against synergy managers on return on assets and return on equity. The findings contribute to relevant theories and recommend managers to adopt suitable corporate parenting roles while pursuing diversification strategies. Keywords: product diversification strategies, corporate parenting roles, corporate performance, Malaysian public listed companies.

vi
ABSTRAK Kajian terdahulu memperoleh dapatan bercampur-campur mengenai kesan strategi kepelbagaian terhadap prestasi syarikat. Kelebihan dan kesan strategi kepelbagaian produk berkait berbanding dengan strategi kepelbagaian produk tidak berkait terhadap prestasi syarikat adalah tidak dapat dipastikan. Namun begitu, adalah jelas bahawa kepimpinan syarikat induk telah dikenal pasti sebagai sangat penting dalam strategi kepelbagaian. Secara khususnya, kajian ini memberi fokus kepada ketidakjelasan strategi kepelbagaian berhubung dengan prestasi yang berkaitan dengan kesan kepimpinan syarikat induk iaitu sebagai perantara. Kajian ini turut menggunakan beberapa pengukur prestasi lain bagi meningkatkan keberkesanan kajian. Kajian ini dilakukan terhadap syarikat awam yang tersenarai di Bursa Malaysia berasaskan pemahaman tentang kepentingan sektor korporat dalam pertumbuhan dan pembangunan serta kesan syarikat menggunakan strategi kepelbagaian di Malaysia. Secara khususnya, data sekunder diperolehi daripada laporan tahunan syarikat dan data prima pula daripada soal selidik yang dihantar kepada pegawai kanan Syarikat Senaraian Awam (SSA) yang berkaitan. Kajian ini menggunakan sampel data daripada 123 SSA dan pelbagai kaedah statistik berasaskan SPSS dalam pembentukan rumusan berkaitan. Kajian ini turut mendapati bahawa strategi kepelbagaian tidak memberi kesan kepada prestasi syarikat korporat. Namun begitu, strategi kepelbagaian produk berkait memberi kesan positif kepada Tobin q dan harga kepada nilai buku, dan strategi kepelbagaian produk tidak berkait memberi kesan negatif kepada pulangan ke atas aset dan harga kepada nilai buku. Pengurus sinergi pula moderat secara positif hubungan antara strategi kepelbagaian produk berkait dengan Tobin q dan harga kepada nilai buku. Kepimpinan syarikat induk pula moderat secara positif hubungan strategi kepelbagaian dan semua ukuran kewangan koporat. Pengurus potfolio turut moderat secara positif hubungan antara strategi kepelbagaian tidak berkait dengan pulangan ke atas aset dan ekuiti. Syarikat yang menggunakan strategi kepelbagaian produk berkait didapati mengatasi prestasi syarikat yang menggunakan strategi kepelbagaian produk tidak berkait iaitu berasaskan Tobin q dan harga kepada nilai buku. Di samping itu, kepimpinan syarikat induk pula menunjukkan prestasi lebih baik berbanding dengan pengurus sinergi dalam aspek pulangan ke atas aset dan ekuiti. Dapatan kajian ini menyumbang kepada teori-teori yang berkaitan dan juga pengurus-pengurus iaitu dari aspek peranan kepimpinan syarikat induk dalam menentukan strategi kepelbagaian yang terbaik dan sesuai untuk diadaptasi. Kata kunci: strategi kepelbagaian produk, peranan kepimpinan syarikat induk, prestasi korporat, syarikat senaraian awam Malaysia.

vii
ACKNOWLEDGEMENTS All praises and thanks to Allah, the Most Gracious, the Most Merciful and Allah’s Prophet, Muhammad (S.A.W). This thesis has been product of extreme hard work. However, it could not have been accomplished without the support of several people. First and foremost, I would like to pay my big thanks and sincere appreciation to my supervisor Associate Prof. Dr. Haim Hilman Bin Abdullah for his guidance, support, patience, commitment and firm belief in my capability to complete this challenging task. He has always been there for me to help and pull me out of troubles and problems. My gratitude also goes to staff members of Othman Yeop Abdullah Graduate School of Business (OYA), College of Business (COB), and other UUM Staff for their help and support in different administrative matters. I am also thankful to my university (Bahauddin Zakariya University, Multan, Pakistan) for giving me opportunity to pursue this PhD through study leave with pay. I would also like to thank all the companies, respondents and secretaries who helped me in getting the desired response rate. I appreciate the cooperation of Malaysian Institute of Corporate Governance (MICG) for giving me the opportunity to attend one of the conferences and making discussions with certain respondents. Last but not least, I am grateful to my parents for their continued financial and social support, my wife and my kids; Aamin and Usman, for their love and patience they showed during the time period, without which this task could not have been completed.
viii
TABLE OF CONTENTS TITLE PAGE i CERTIFICATION OF THESIS WORK ii PERMISSION TO USE iv ABSTRACT v ABSTRAK vi ACKNOWLEDGEMENTS vii TABLE OF CONTENTS viii LIST OF TABLES xv LIST OF FIGURES xviii LIST OF ABBREVIATIONS xix CHAPTER ONE: INTRODUCTION 1 1.1 Introduction 1 1.2 Research Background 1
1.2.1 Overview of Past Research on Product Diversification – Performance Relationship 1
1.2.2 Why is there a Lack of Consensus on Product Diversification – Performance Relationship? 4
1.3 The Malaysian Context 6 1.3.1 Introduction 6 1.3.2 Past Studies on Product Diversification – Performance
Relationship in Malaysian Context 9 1.4 Problem Statements 12 1.5 Research Questions 16 1.6 Research Objectives 16 1.7 Significance of the Study 17 1.7.1 Theoretical Significance 18 1.7.2 Practical Significance 19 1.8 Scope of the Study 22 1.9 Organisation of the Thesis 23 1.10 Chapter Summary 24 CHAPTER TWO: LITERATURE REVIEW 25 2.1 Introduction 25 2.2 Corporate Sector in Malaysia 26
2.2.1 Public Listed Companies (PLCs) in Malaysia 29 2.3 Product Diversification Strategy 34
2.3.1 Definition and Types 34 2.3.1.1 Related Diversification Strategy 35 2.3.1.1.1 Definition 35 2.3.1.1.2 Examples of Related Diversification Strategy 36 2.3.1.1.3 Reasons to pursue Related Diversification
Strategy 36 2.3.1.2 Unrelated Diversification Strategy 39 2.3.1.2.1 Definition 39 2.3.1.2.2 Examples of Unrelated Diversification Strategy 40
ix
2.3.1.2.3 Reasons to pursue Unrelated Diversification Strategy 40
2.3.2 Theoretical Background for Product Diversification Strategy 41 2.3.2.1 Transaction Cost Economics (TCE) and Internal Capital Market 41 2.3.2.2 Market Power View 45 2.3.2.3 Resource Based View (RBV) 46 2.3.2.4 Agency Theory 49 2.3.2.5 Conclusion 50
2.3.3 Empirical Research on the Relationship between Product Diversification Strategy and Performance 51 2.3.3.1 Introduction and Background 51
2.3.3.2 Findings of Past Studies on the Relationship between Product Diversification Strategy and Performance 52 2.3.3.2.1 Product Diversification as Useful or
Non-Useful Strategy 53 2.3.3.2.2 The Insignificant Causal Link between Product Diversification Strategy and Performance 55 2.3.3.2.3 Curvilinear Relationship between Product
Diversification Strategy and Performance 56 2.3.3.2.4 Conclusion 57
2.3.3.3 Inconsistency in the Past Findings and the Design of Past Studies 59
2.3.3.3.1 Diversification Measures used by Past Studies in Product Diversification – Performance Research 59
2.3.3.3.2 Performance Measures used by Past Studies in Product Diversification – Performance Research 60 2.3.3.3.3 Contextual Differences among Past Studies on Product Diversification – Performance Research 60 2.3.3.3.4 Moderating Variables used by Past Studies in
Product Diversification – Performance Research 62 2.3.3.4 Conclusion 63
2.3.4 Related Diversification Strategy versus Unrelated Diversification Strategy 64 2.3.4.1 Introduction and Background 64 2.3.4.2 Studies Reporting Related Diversification Strategy
Dominated Unrelated Diversification Strategy 65 2.3.4.3 Studies Reporting Unrelated Diversification Strategy
Dominated Related Diversification Strategy 67 2.3.4.4 Conclusion 68
2.3.4.5 Moderating Variables used by Past Studies in Related/Unrelated Diversification Strategies – Performance Relationship 69 2.3.4.6 Conclusion 70 2.4 Corporate Parenting 71
2.4.1 Introduction 71 2.4.2 Value Addition by Corporate Parents 73
2.4.2.1 Corporate Parents’ Understanding of Businesses 74 2.4.2.2 Ways to Add Value 75 2.4.2.3 Management of Value Creation 76
x
2.4.3 Value Destruction by Corporate Parents 77 2.4.4 Corporate Parenting Roles 79
2.4.4.1 Portfolio Manager 82 2.4.4.2 Synergy Manager 84
2.4.4.3 Parental Developer 86 2.4.4.4 Conclusion 89 2.4.5 Research on Corporate Parenting 90 2.4.6 Theoretical Background for Corporate Parenting 91 2.4.6.1 Dynamic Capabilities Perspective (DCP) 92 2.4.6.2 Contingency Theory 94
2.5 Corporate Performance 96 2.5.1 Background 96
2.5.2 Performance Indicators used by Past Research on Product Diversification – Performance Relationship 97
2.5.3 Widely Used and Powerful Indicators of Financial Corporate Performance 97
2.5.4 Shortcomings of Financial Performance Indicators 100 2.5.5 Subjective Assessment of Corporate Performance 101
2.6 Chapter Summary 103 CHAPTER THREE: THEORETICAL FRAMEWORK, HYPOTHESES DEVELOPMENT AND RESEARCH METHODOLOGY 104 3.1 Introduction 104 3.2 Theoretical Framework 105 3.3 Research Hypotheses 106 3.4 Population and Unit of Analysis 118 3.5 Time Period of the Study 119 3.6 Measurement of Variables 121
3.6.1 Measurement of Product Diversification Strategy 121 3.6.2 Measurement of Corporate Parenting Roles 126
3.6.2.1 Development and Design of Questionnaire for Measuring Corporate Parenting Roles 127
3.6.3 Measurement of Corporate Performance 128 3.6.3.1 Measurement of Financial Corporate Performance 128
3.6.3.1.1 Accounting Measures of Performance 129 3.6.3.1.1.1 Return on Assets (ROA) 130 3.6.3.1.1.2 Return on Equity (ROE) 130 3.6.3.1.2 Market Measures of Performance 131 3.6.3.1.2.1 Tobin’s q 131 3.6.3.1.2.2 Price to Book Value (P/B Value) 132
3.6.3.2 Measurement of Subjective Corporate Performance 133 3.6.4 Control Variables and their Measurement 134
3.7 Data Collection and Sources 136 3.7.1 Secondary data 136 3.7.2 Administration of Questionnaires for Primary Data 137
3.8 Pilot Study and Questionnaire Pretesting 139 3.9 Chapter Summary 140 CHAPTER FOUR: FINDINGS & CONCLUSIONS 141 4.1 Introduction 141
xi
4.2 Sample Size and Respondent Companies 141 4.3 Analysis of Non-Response Bias 142 4.4 Data Analyses Procedures and Techniques 143 4.5 Meeting Assumptions for Multiple Regression Analysis 144 4.5.1 Outliers 145 4.5.2 Sample Size Adequacy 145 4.5.3 Normality 146 4.5.4 Linearity 146 4.5.5 Multicollinearity 147 4.5.6 Autocorrelation 147 4.5.7 Homoscedasticity 148 4.6 Validity and Reliability of Questionnaire 148
4.6.1 Exploratory Factor Analysis (EFA) 149 4.6.1.1 EFA of Subjective Corporate Performance (SCP) 149 4.6.1.2 EFA of Corporate Parenting Roles 152
4.6.2 Convergent Validity 156 4.6.3 Discriminant Validity 159 4.6.4 Reliability 160
4.7 Descriptive Statistics of the Variables 160 4.8 Hypotheses Testing 161
4.8.1 Testing Effect of Product Diversification Strategy (DT) on Corporate Performance (H1a1 to H1a4, and H1b) 161
4.8.2 Testing Moderator Hypotheses 163 4.8.3 Testing Moderator Effects of Corporate Parenting Roles on the Relationship between Diversification Strategies and Financial Corporate Performance 167
4.8.3.1 Testing Moderator Effect of Synergy Manager on the Relationship between Related Diversification Strategy and Financial Corporate Performance (H2ai1 to H2ai4) 167 4.8.3.1.1 Testing Moderator Effect of Synergy Manager
on the Relationship between Related Diversification Strategy and ROA (H2ai1) 167
4.8.3.1.2 Testing Moderator Effect of Synergy Manager on the Relationship between Related Diversification Strategy and ROE (H2ai2) 168
4.8.3.1.3 Testing Moderator Effect of Synergy Manager on the Relationship between Related Diversification Strategy and Tobin’s q (H2ai3) 170
4.8.3.1.4 Testing Moderator Effect of Synergy Manager on the Relationship between Related Diversification Strategy and P/B Value (H2ai4) 173
4.8.3.2 Testing Moderator Effect of Parental Developer on the Relationship between Related Diversification Strategy and Financial Corporate Performance (H2aii1 to H2aii4) 176 4.8.3.2.1 Testing Moderator Effect of Parental Developer on the Relationship between Related
Diversification Strategy and ROA (H2aii1) 176 4.8.3.2.2 Testing Moderator Effect of Parental Developer
on the Relationship between Related
Diversification Strategy and ROE (H2aii2) 179
xii
4.8.3.2.3 Testing Moderator Effect of Parental Developer
on the Relationship between Related
Diversification Strategy and Tobin’s q (H2aii3) 181
4.8.3.2.4 Testing Moderator Effect of Parental Developer
on the Relationship between Related
Diversification Strategy and P/B Value (H2aii4) 184 4.8.3.3 Testing Moderator Effect of Portfolio Manager on the
Relationship between Unrelated Diversification Strategy and Financial Corporate Performance (H2aiii1 to H2aiii4) 186 4.8.3.3.1 Testing Moderator Effect of Portfolio Manager on the Relationship between Unrelated
Diversification Strategy and ROA (H2aiii1) 187 4.8.3.3.2 Testing Moderator Effect of Portfolio Manager on the Relationship between Unrelated
Diversification Strategy and ROE (H2aiii2) 190 4.8.3.3.3 Testing Moderator Effect of Portfolio Manager on the Relationship between Unrelated
Diversification Strategy and Tobin’s q (H2aiii3) 192 4.8.3.3.4 Testing Moderator Effect of Portfolio Manager on the Relationship between Unrelated
Diversification Strategy and P/B Value (H2aiii4) 193 4.8.4 Testing Moderator Effects of Corporate Parenting Roles on the
Relationship between Diversification Strategies and Subjective Corporate Performance (H2bi, H2bii, H2biii) 195 4.8.4.1 Testing Moderator Effect of Synergy Manager on the
Relationship between Related Diversification Strategy and Subjective Corporate Performance (SCP) (H2bi) 195
4.8.4.2 Testing Moderator Effect of Parental Developer on the Relationship between Related Diversification Strategy and Subjective Corporate Performance (SCP) (H2bii) 197
4.8.4.3 Testing Moderator Effect of Portfolio Manager on the Relationship between Unrelated Diversification Strategy and Subjective Corporate Performance (SCP) (H2biii) 198
4.8.5 Conclusion for Tests of Moderator Hypotheses 201 4.8.6 Test of Significant Performance Differences among various
Company Groups using t-tests 203 4.8.6.1 Comparison of Related Diversifiers against Unrelated Diversifiers on Corporate Performance
(H3ai to H3aiv, and H3b) 203 4.8.6.2 Comparison of Parental Developers against Synergy
Managers on Corporate Performance (H3ci to H3civ, and H3d) 206
4.8.6.3 Conclusion 208 4.8.7 Summary of Hypotheses Tests’ Results 210
4.9 Chapter Summary 213 CHAPTER FIVE: DISCUSSIONS, IMPLICATIONS AND
RECOMMENDATIONS 214 5.1 Introduction 214
xiii
5.2 Overview of Study 214 5.3 Discussions on the Findings of Hypotheses Tests 215
5.3.1 Discussions on Hypothesis Findings: Test of Effect of Product Diversification Strategy on Corporate Performance (H1a1 to H1a4, and H1b) 216 5.3.2 Discussions on Hypothesis Findings: Test of Effect of Related Diversification Strategy on Corporate Performance (H1ai1 to H1ai4, and H1bi) 218 5.3.3 Discussions on Hypothesis Findings: Test of Effect of Unrelated Diversification Strategy on Corporate Performance (H1aii1 to H1aii4, and H1bii) 221 5.3.4 Discussions on Hypothesis Findings: Test of Synergy Manager as Moderator between Related Diversification Strategy and Corporate Performance (H2ai1 to H2ai4, and H2bi) 226 5.3.5 Discussions on Hypothesis Findings: Test of Parental Developer
as Moderator between Related Diversification Strategy and Corporate Performance (H2aii1 to H2aii4, and H2bii) 230
5.3.6 Discussions on Hypothesis Findings: Test of Portfolio Manager as Moderator between Unrelated Diversification Strategy and Corporate Performance (H2aiii1 to H2aiii4, and H2biii) 234
5.3.7 Conclusion on the Hypotheses Tests Results for Moderators 237 5.3.8 Discussions on Hypothesis Findings: t-test results for comparing Related Diversifiers against Unrelated Diversifiers on Corporate Performance Dimensions. (H3ai to H3aiv, and H3b) 240 5.3.9 Discussions on Hypothesis Findings: t-test results for
Comparing Dominant Parental Developers against Dominant Synergy Managers on Corporate Performance Dimensions (H3ci to H3civ, and H3d) 244
5.4 Discussions on Effect of Control Variables 246 5.5 Conclusions 248 5.6 Implications of the Study 251 5.6.1 Theoretical Implications 251
5.6.2 Practical Implications 254 5.6.3 Contribution to Malaysian Economic well-being and other Developing Countries 257
5.7 Limitations of the Study 258 5.8 Recommendations for Future Research 260 5.9 Chapter Summary 261 REFERENCES 262 APPENDICES 296 Appendix A: Formal Letter for the Questionnaire 297 Appendix B: Questionnaire 298 Appendix C: Worldscope Classification of Industry Groups 303 Appendix D: Demonstration of Product Diversification Score Calculation
using Entropy Measure 309 Appendix E: FTSE Bursa Malaysia Top 100 Index Top 5 and Bottom 5
Performers for July, 2014 316

xiv
Appendix F: List of All Excluded Companies 317 Appendix G: List of Respondent Companies 318 Appendix H: Replacement of Missing Values 322 Appendix I: Residual Plots for examining Linearity and Homoscedasticity 325 Appendix J: Descriptive Statistics of Variables 333 Appendix K: Frequency Distributions for Experience Level and Expertise 334 Appendix L: Pie Chart for Expertise 335 Appendix M: Correlation Tables for Correlations between Original
Interaction Terms and Relevant Independent Variable and Moderator Variable 336
Appendix N: Correlation Tables for Correlations between Centred Interaction Terms and Relevant Centred Independent Variable and Centred Moderator Variable 338
xv
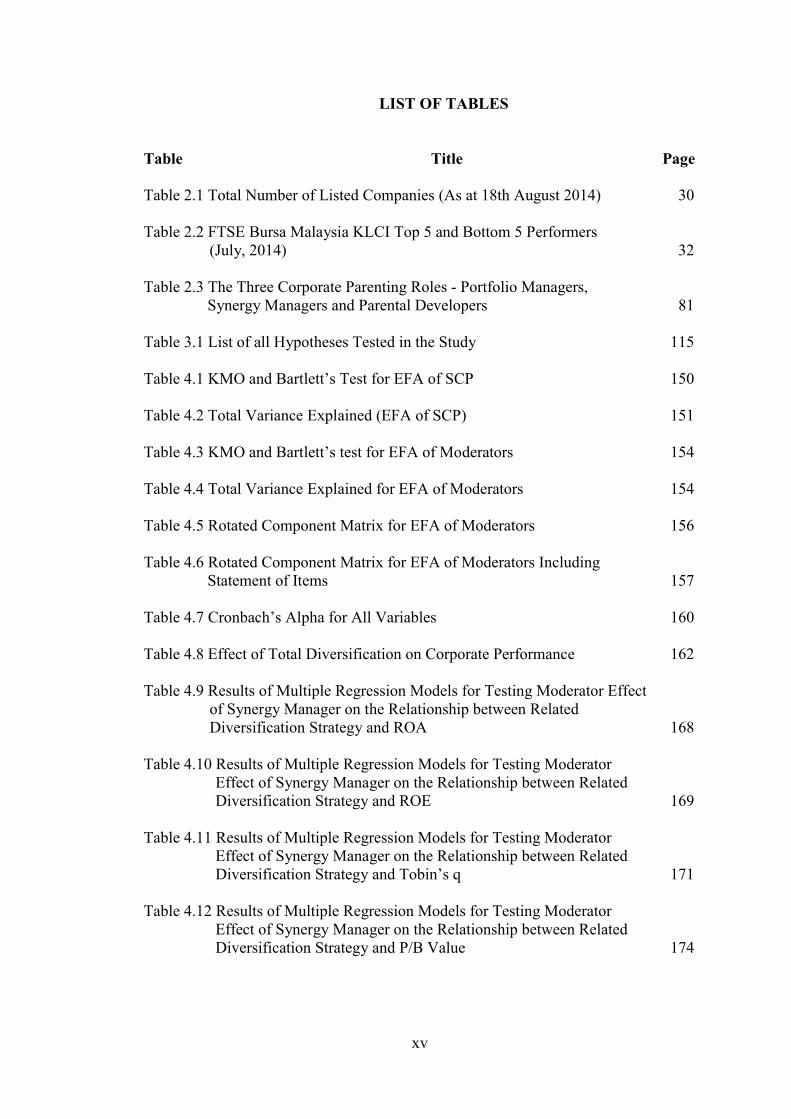
LIST OF TABLES
Table Title Page Table 2.1 Total Number of Listed Companies (As at 18th August 2014) 30 Table 2.2 FTSE Bursa Malaysia KLCI Top 5 and Bottom 5 Performers
(July, 2014) 32 Table 2.3 The Three Corporate Parenting Roles - Portfolio Managers,
Synergy Managers and Parental Developers 81 Table 3.1 List of all Hypotheses Tested in the Study 115 Table 4.1 KMO and Bartlett’s Test for EFA of SCP 150 Table 4.2 Total Variance Explained (EFA of SCP) 151 Table 4.3 KMO and Bartlett’s test for EFA of Moderators 154 Table 4.4 Total Variance Explained for EFA of Moderators 154 Table 4.5 Rotated Component Matrix for EFA of Moderators 156 Table 4.6 Rotated Component Matrix for EFA of Moderators Including
Statement of Items 157
Table 4.7 Cronbach’s Alpha for All Variables 160
Table 4.8 Effect of Total Diversification on Corporate Performance 162 Table 4.9 Results of Multiple Regression Models for Testing Moderator Effect
of Synergy Manager on the Relationship between Related Diversification Strategy and ROA 168
Table 4.10 Results of Multiple Regression Models for Testing Moderator
Effect of Synergy Manager on the Relationship between Related Diversification Strategy and ROE 169
Table 4.11 Results of Multiple Regression Models for Testing Moderator
Effect of Synergy Manager on the Relationship between Related Diversification Strategy and Tobin’s q 171
Table 4.12 Results of Multiple Regression Models for Testing Moderator
Effect of Synergy Manager on the Relationship between Related Diversification Strategy and P/B Value 174
xvi
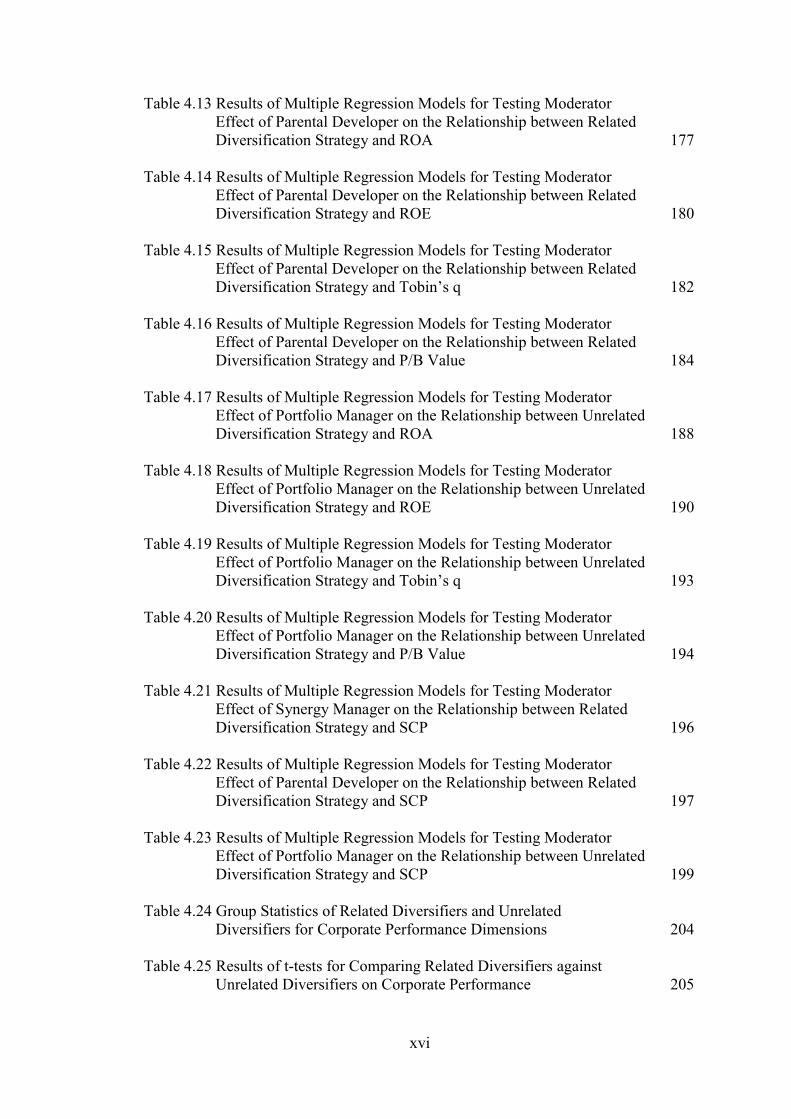
Table 4.13 Results of Multiple Regression Models for Testing Moderator Effect of Parental Developer on the Relationship between Related Diversification Strategy and ROA 177
Table 4.14 Results of Multiple Regression Models for Testing Moderator
Effect of Parental Developer on the Relationship between Related Diversification Strategy and ROE 180
Table 4.15 Results of Multiple Regression Models for Testing Moderator
Effect of Parental Developer on the Relationship between Related Diversification Strategy and Tobin’s q 182
Table 4.16 Results of Multiple Regression Models for Testing Moderator
Effect of Parental Developer on the Relationship between Related Diversification Strategy and P/B Value 184
Table 4.17 Results of Multiple Regression Models for Testing Moderator
Effect of Portfolio Manager on the Relationship between Unrelated Diversification Strategy and ROA 188
Table 4.18 Results of Multiple Regression Models for Testing Moderator
Effect of Portfolio Manager on the Relationship between Unrelated Diversification Strategy and ROE 190
Table 4.19 Results of Multiple Regression Models for Testing Moderator
Effect of Portfolio Manager on the Relationship between Unrelated Diversification Strategy and Tobin’s q 193
Table 4.20 Results of Multiple Regression Models for Testing Moderator
Effect of Portfolio Manager on the Relationship between Unrelated Diversification Strategy and P/B Value 194
Table 4.21 Results of Multiple Regression Models for Testing Moderator
Effect of Synergy Manager on the Relationship between Related Diversification Strategy and SCP 196
Table 4.22 Results of Multiple Regression Models for Testing Moderator
Effect of Parental Developer on the Relationship between Related Diversification Strategy and SCP 197
Table 4.23 Results of Multiple Regression Models for Testing Moderator
Effect of Portfolio Manager on the Relationship between Unrelated Diversification Strategy and SCP 199
Table 4.24 Group Statistics of Related Diversifiers and Unrelated
Diversifiers for Corporate Performance Dimensions 204 Table 4.25 Results of t-tests for Comparing Related Diversifiers against
Unrelated Diversifiers on Corporate Performance 205

xvii
Table 4.26 Group Statistics of Synergy Managers and Parental Developers for Corporate Performance Dimensions 207
Table 4.27 Results of t-tests for Comparing Synergy Managers against Parental Developers on Corporate Performance 208
Table 4.28 Summary of Hypotheses Tests Results 210
xviii
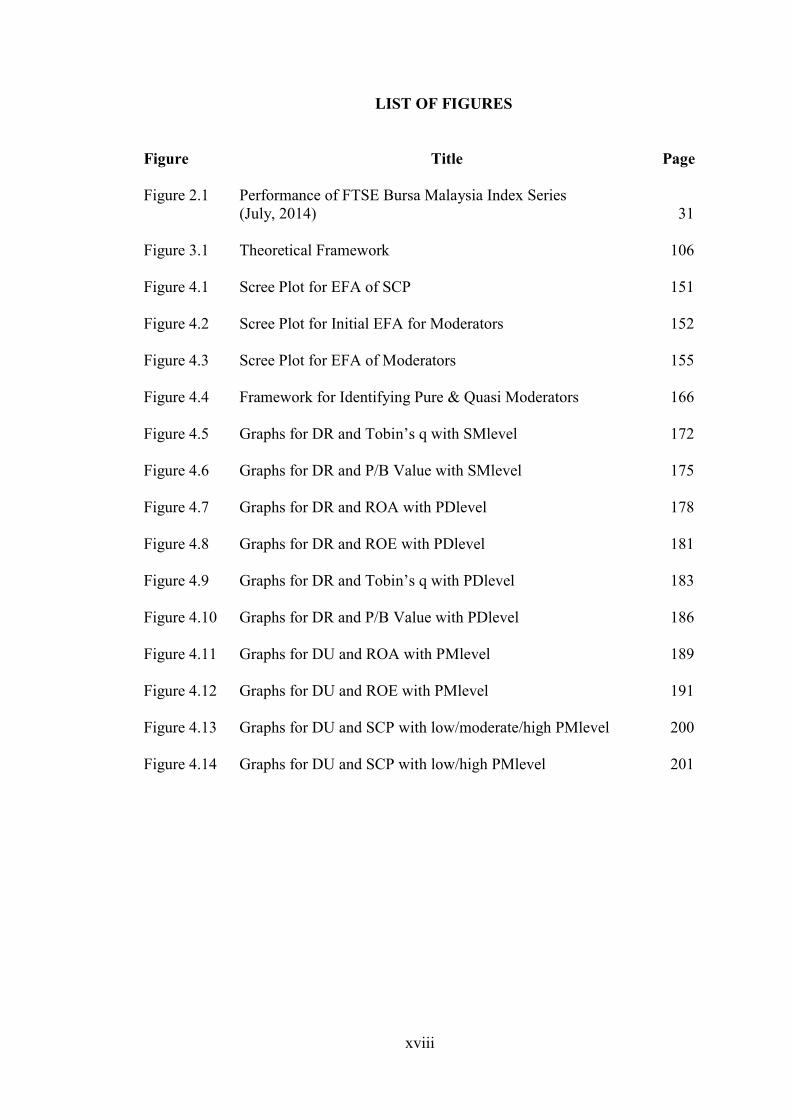
LIST OF FIGURES
Figure Title Page Figure 2.1 Performance of FTSE Bursa Malaysia Index Series (July, 2014) 31 Figure 3.1 Theoretical Framework 106 Figure 4.1 Scree Plot for EFA of SCP 151 Figure 4.2 Scree Plot for Initial EFA for Moderators 152 Figure 4.3 Scree Plot for EFA of Moderators 155 Figure 4.4 Framework for Identifying Pure & Quasi Moderators 166 Figure 4.5 Graphs for DR and Tobin’s q with SMlevel 172 Figure 4.6 Graphs for DR and P/B Value with SMlevel 175 Figure 4.7 Graphs for DR and ROA with PDlevel 178 Figure 4.8 Graphs for DR and ROE with PDlevel 181 Figure 4.9 Graphs for DR and Tobin’s q with PDlevel 183
Figure 4.10 Graphs for DR and P/B Value with PDlevel 186 Figure 4.11 Graphs for DU and ROA with PMlevel 189 Figure 4.12 Graphs for DU and ROE with PMlevel 191 Figure 4.13 Graphs for DU and SCP with low/moderate/high PMlevel 200 Figure 4.14 Graphs for DU and SCP with low/high PMlevel 201

xix
LIST OF ABBREVIATIONS
No. Abbreviation Meaning
1 ACE Access Certainty Efficiency
2 DR Related Diversification Strategy
3 DRCentred Related Diversification Centred Variable
4 DRPDCentred Centred Interaction term for Related Diversification and Parental Developer
5 DRSMCentred Centred Interaction term for Related Diversification and Synergy Manager
6 DT Product Diversification Strategy (Total Diversification)
7 DU Unrelated Diversification Strategy
8 DUCentred Unrelated Diversification Centred Variable
9 DUPMCentred Centred Interaction term for Unrelated Diversification and Portfolio Manager
10 EMAS Index Exchange Main Board All-Shares Index
11 EPU Economic Planning Unit
12 ETP Economic Transformation Programme
13 FTSE Financial Times Stock Exchange
14 GTP Government Transformation Programme
15 IPC Infrastructure Project Companies
16 IWK Indah Water Konsortium Sdn Bhd
17 KLCI Kuala Lumpur Composite Index
18 KLSE Kuala Lumpur Stock Exchange
19 LRT Light Rail Transit
20 MAICSA The Malaysian Institute of Chartered Secretaries and Administrators
21 MAS Malaysian Airline System
22 MASB Malaysian Accounting Standards Board
23 MATRADE Malaysia External Trade Development Corporation
24 MCMC The Malaysian Communications and Multimedia Commission
25 MESDAQ Malaysian Exchange of Securities Dealing and Automated Quotation
26 MIA Malaysian Institute of Accountants
27 MIDA Malaysian Investment Development Authority
xx
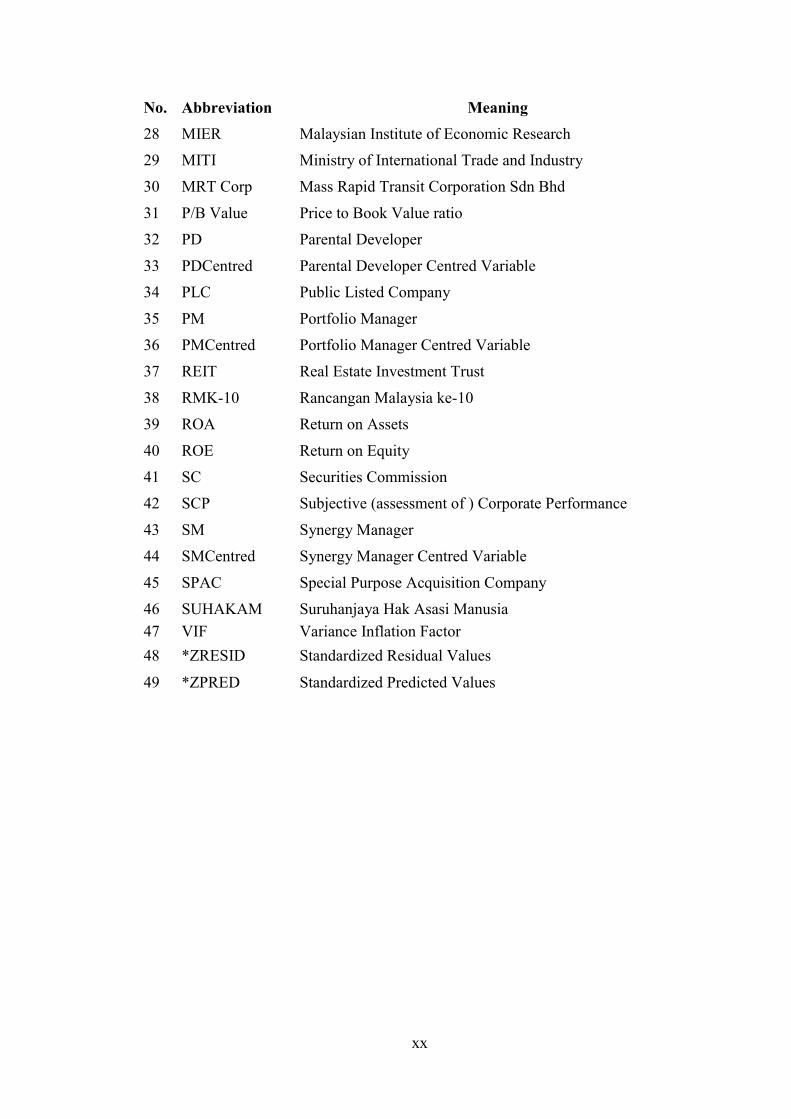
No. Abbreviation Meaning
28 MIER Malaysian Institute of Economic Research
29 MITI Ministry of International Trade and Industry
30 MRT Corp Mass Rapid Transit Corporation Sdn Bhd
31 P/B Value Price to Book Value ratio
32 PD Parental Developer
33 PDCentred Parental Developer Centred Variable
34 PLC Public Listed Company
35 PM Portfolio Manager
36 PMCentred Portfolio Manager Centred Variable
37 REIT Real Estate Investment Trust
38 RMK-10 Rancangan Malaysia ke-10
39 ROA Return on Assets
40 ROE Return on Equity
41 SC Securities Commission
42 SCP Subjective (assessment of ) Corporate Performance
43 SM Synergy Manager
44 SMCentred Synergy Manager Centred Variable
45 SPAC Special Purpose Acquisition Company
46 SUHAKAM Suruhanjaya Hak Asasi Manusia
47 VIF Variance Inflation Factor
48 *ZRESID Standardized Residual Values
49 *ZPRED Standardized Predicted Values
1
CHAPTER ONE
INTRODUCTION
1.1 Introduction
This chapter starts by providing a general overview and background of past research
on product diversification – performance relationship. Section 1.3 highlights the
contextual importance of the study as it points towards current challenging scenario
faced by Malaysian economy and the past research conducted on the topic in
Malaysian context. Section 1.4 presents problem statements of the study followed by
research questions and research objectives in proceeding sections. Section 1.7
discusses theoretical and practical significance of the study. Section 1.8 explains
scope of the study. The chapter concludes by providing organisation of thesis and
chapter summary in last two sections.
1.2 Research Background
1.2.1 Overview of Past Research on Product Diversification – Performance Relationship
To diversify or to remain focused is one of the most important questions for a
company’s strategist (Marinelli, 2011). In the West, the trend of diversifying into
different industries started in 1960’s which continued till 1970’s, but many companies
started to refocus and restructure themselves during 1980’s (David, 2011; Gupta,
Gollakota, & Srinivasan, 2007). Perspectives and theories such as market power view
(Palepu, 1985; Palich, Cardinal, & Miller, 2000; Saloner, 1985), resource based view
(Teece, 1982; Wernerfelt, 1984), internal capital market efficiency (Berger & Ofek,
2
1995; Bhide, 1993), transaction cost economics theory (Coase, 1937; Williamson,
1998), and agency theory (Amihud & Lev, 1981; Jensen, 1986) provide rationales for
increased diversification among the companies.
Research conducted in context of Asian economies also reported high levels of
product diversification in those economies (Claessens, Djankov, Fan, & Lang, 1998;
Lins & Servaes, 2002). Transaction cost economics and internal capital market
efficiency, in particular, provide reasons for high diversification of companies in
many Asian economies. Empirical studies by Chakrabarti, Singh, and Mahmood
(2007) and Mishra and Akbar (2007a) conducted in developing countries provide
support for these theories.
Over the last ten years, diversification record of companies in Malaysia also indicates
increased diversification on the part of Malaysian organisations (Ahmad, Ishak, &
Manaf, 2003; Ishak & Napier, 2006). Hence, product diversification has been the
choice of companies all over the world (Benito-Osorio, Guerras-Martin, & Zuniga-
Vicente, 2012; Datta, Rajagopalan, & Rasheed, 1991). Victory, however, is not
guaranteed by diversification strategy, and the success and failure records of many
diversified organisations all over the world call for refined investigation into the
subject of diversification strategies (Kruehler, Pidun, & Rubner, 2012).
In the field of research, the relationship between product diversification and
performance has been a common area among numerous scholars belonging to various
fields. However, by carefully studying the literature on this relationship, it can be
inferred that until recently, researchers are undecided regarding the effect of product
3
diversification strategies on performance (Asrarhaghighi, Rahman, Sambasivan, &
Mohamed, 2013; Benito-Osorio et al., 2012; Marinelli, 2011). The inconsistent
findings on the topic indicate ambiguity and complexity associated with it. There are
number of researches saying that product diversification is better and leads to high
performance; as well as sizable literature is available on the evidences of product
diversification as a strategy that destroys firm’s value or leads to poor performance
(Park, 2010; Tan, 2007).
Similarly, the performance of related versus unrelated diversification strategy also
remained an unsolved puzzle throughout four decades (Abdullah, 2009; Lahovnik,
2011). A large group of studies suggested that related diversification strategy
performed better than unrelated diversification (Mehmood & Hilman, 2013; Park,
2010; Tan, 2007). Similarly, there are considerable studies saying that unrelated
diversifiers outperform related diversifiers (Park, 2010; Yaghoubi, Abidin, &
Yaeghoobi, 2011).
Researchers have been studying the subject of product diversification with different
samples, data sources and analytical techniques (Benito-Osorio et al., 2012; Datta et
al., 1991; Mehmood & Hilman, 2013). In doing so, although past studies have been
improving on research designs and measurement models, but the evidences of
inconsistent and inconclusive findings on product diversification – performance
relationship call for more research into the topic.
4
1.2.2 Why is there a Lack of Consensus on Product Diversification – Performance Relationship?
The lack of consensus on product diversification – performance relationship could be
investigated by critically evaluating the design of previous researches. Number of
reasons such as reliance on different product diversification measurement
methodologies (Klier, 2009; Montgomery, 1982; Pitts & Hopkins, 1982), use of
diverse performance indicators (Datta et al., 1991; Dubofsky & Varadarajan, 1987),
contextual variations (Tan, 2007; Yaghoubi et al., 2011) and other factors such as
time period of studies might have contributed to discrepancies among findings of
previous studies in the area (Asrarhaghighi et al., 2013; Benito-Osorio et al., 2012;
Palich et al., 2000). Thus a variety of research designs and measurement
methodologies employed by previous researchers have complicated the product
diversification – performance issue.
Historically, Montgomery (1982), and Pitts and Hopkins (1982) argued that use of
different product diversification measurement techniques in product diversification –
performance research had considerable influence on the findings and conclusions.
Similarly, use of different indicators for corporate performance and greater reliance
on financial indicators of performance by past studies also complicated the issue. As
financial indicators or performance ratios might possess a substantial time lag
(Chavan, 2009; Smandek, Barthel, Winkler, & Ulbig, 2010), therefore, sole reliance
on these ratios points towards short sightedness of past studies. In contrast, subjective
assessment of corporate performance coupled with objective appraisal provides a
comprehensive framework for organisational evaluation (Jusoh & Parnell, 2008;
Punniyamoorthy & Murali, 2008).
5
Moreover, studies regarding product diversification – performance relationship were
conducted in diverse contexts and the findings of those studies were also diverse
(Benito-Osorio et al., 2012; George, 2007; Mehmood & Hilman, 2013). Importantly,
the findings of research regarding product diversification – performance relationship
conducted for Asian economies are mixed (Chakrabarti et al., 2007; Daud,
Salamudin, & Ahmad, 2009; Ishak & Napier, 2006; Lins & Servaes, 2002). Hence,
the inconsistency between findings of different researches in Asian context requires
more investigation into this relationship in the Asian context.
In fact, in order to understand this relationship better, there is a need to improve
research methods and follow modern perspectives in research (Asrarhaghighi et al.,
2013). Scholars have suggested that understanding of product diversification -
performance relationship could be enhanced by inclusion of additional variables into
the relationship (Daud et al., 2009; Gary, 2005; Marinelli, 2011) as this relationship
might be affected by number of other factors playing their role.
In past, apart from using multiple methodologies for measurement of diversification
construct, scholars have been studying determinants and repercussions of
diversification (Adner & Zemsky, 2006; Liu & Hsu, 2011) as well as improving the
insight on the topic by including different moderating and mediating variables into the
relationship. Specifically, certain researchers suggested that success of product
diversification strategy largely depended upon strategy implementation issues
(Dundas & Richardson, 1982; Hill, Hitt, & Hoskisson, 1992) particularly those related
to corporate parents (Campbell, Goold, & Alexander, 1995a; Oijen & Douma, 2000).
6
Recently, Nippa, Pidun, and Rubner (2011) have recommended using parenting
advantage as moderator between product diversification – performance relationship.
Based over the idea of corporate parenting (Campbell et al., 1995a; Goold, Campbell,
& Alexander, 1998) and keeping in view suggestions from previous scholars, this
study planned to use corporate parenting role (Johnson, Scholes, & Whittington,
2008; Johnson, Whittington, & Scholes, 2011) as moderator in product diversification
strategies – performance relationship. The moderating variable of Corporate Parenting
Role has been studied using the three categories of roles suggested by Johnson et al.
(2008, 2011): Portfolio Manager, Synergy Manager and Parental Developer. (Section
2.4.4 provides detailed explanation on the three corporate parenting roles).
1.3 The Malaysian Context
In the following subsections, an overview of the Malaysian economy and current
challenges are presented, followed by a glimpse of past research in product
diversification – performance relationship undertaken in Malaysian context.
1.3.1 Introduction
Malaysia is an industrial based economy that went through extensive structural shift
from heavy dependence on mining of tin, and rubber plantation to enormous industrial
and commercial units, since its independence in 1957 (Mun, 2007; Yaghoubi et al.,
2011). With the establishment of different agencies and government departments,
governments have been encouraging domestic and foreign investors towards entering
into Malaysian industrial sectors.
7
During 2011, Malaysian economy continued to grow, while relying majorly on
domestic demand and the real GDP grew by 5.1 % (Malaysian Institute of Economic
Research [MIER], 2012a). During the first quarter of 2012, sales accelerated in
various sectors of the economy like chemical products, wood and wood based
products, paper and paper based products, rubber products, metal products, electrical
& electronic products, and heavy machinery and transport (MIER, 2012b). GDP grew
by 4.5% in the first three quarters of 2013. As for 2014, although GDP growth rate is
predicted to cross 5.5% but 2014 is expected to be a challenging year characterizing
rising cost of living, toughening credit situations, increasing unemployment, and
damping real economic activity (MIER, 2014).
Currently, the Prime Minister Initiatives including: The Economic Transformation
Programme (ETP), Tenth Malaysia Plan (RMK-10), Government Transformation
Programme (GTP), and 1 Malaysia are in motion for realization of National
Economic Policy and Vision 2020 (Official Portal of the Office of the Prime Minister
of Malaysia, 2014).
According to IMF Staff Country Report (2012), Malaysia, being an open economy,
was affected through real and financial channels in 2008-09 global crises and its
potential growth slowed over the last decade. While in 2010, Malaysia made strong
recovery out of the 2008-09 global crises, the Report added that Malaysian economy
had been confronting a challenging global environment where external demand was
expected to slow down in consecutive years. Hence, as per latest IMF Staff Country
Report (2014), GDP grew by 4.7% in 2013 compared to 5.6% in 2012 in addition to
having a challenging future scenario. However, according to authorities, the economy
8
would expand about 5% – 5.5% in 2014, and that Malaysia is aware of the risks posed
by external global challenges and it already has in place far-reaching reform agenda
that will take it to high stage of economic growth and development (Ghaffour &
Ripin, 2014).
Malaysian manufacturing as well as service sectors are important contributors to
country’s GDP (Hassan, Muhammad, & Ismail, 2011; Naqshbandi & Idris, 2012).
The role of manufacturing sector has become more important since mid-1980’s as the
country has marked transformation from commodity based manufacturing to
industrial products manufacturing (Asid, 2010). During the last few years, Malaysian
manufacturing sector contributed around 25-32% to GDP and it is expected to remain
as a key sector during the Third Malaysian Industrial Master Plan, 2006 to 2020
(Hassan et al., 2011; Ministry of International Trade and Industry [MITI], 2013).
On the other hand, the service sector contributes more than 50% to country’s GDP
and has achieved tremendous growth in the past in various fields such as;
construction, education, healthcare, tourism, telecommunications and professional
services (Downe, Loke, Ho, & Taiwo, 2012; MITI, 2013; Naqshbandi & Idris, 2012).
During 2011 and 2012, agricultural sector also contributed to GDP for around 8%
(MITI, 2013). In future, it is important for these sectors to carefully manage their
business operations and set competitive priorities to successfully confront global
business scenarios (Hassan et al., 2011; Naqshbandi & Idris, 2012).
Hence, Malaysian economy is confronted by global challenges regarding its growth
targets and falling international demand and therefore, the current scenario clarifies
9
the important role of Malaysian corporate sector towards maintaining economic
balance and achieving growth targets. Therefore, in conclusion it can be argued that,
keeping in perspective the significant role of Malaysian corporate sector in the
country’s growth and development, the importance of product diversification strategy
decision, the implication of corporate parenting and its roles, and availability of
limited research on the topic, the importance and need of this study is evident.
Keeping in view the overall scenario and research objectives, this study has produced
useful conclusions and set forth strong recommendations for managers in general and
corporate planners/strategists of Malaysian Public Listed Companies (PLCs)
regarding their choice of diversification strategies and corporate parenting roles. As
this study was conducted for diversified PLCs (having multiple product/business
segments) listed on Main Market of Bursa Malaysia, therefore, the recommendations
are particularly useful for these companies, and they are expected to ultimately
improve the performance of Malaysian corporate sector. The study’s practical
significance is discussed in further detail in Section 1.7.2 of this chapter.
1.3.2 Past Studies on Product Diversification – Performance Relationship in Malaysian Context
While past research on product diversification – performance relationship has been
focusing more on Western economies such as US and Europe, comparatively lesser
studies have been conducted on this relationship with reference to emerging
economies such as Malaysia (Daud et al., 2009; Tan, 2007; Yaghoubi et al., 2011).
Past studies involving Malaysian corporate sector have reported extensive
10
diversification on the part of Malaysian companies (Ahmad et al., 2003; Claessens et
al., 1998; Ishak & Napier, 2006).
Ishak and Napier (2006) studied year 2000 data of 355 public limited companies in
Malaysia and found that more than half (54.6%) of them were diversified. Similarly,
Ahmad et al. (2003) studied 219 Malaysian companies listed on KLSE (Kuala
Lumpur Stock Exchange) in 1995 and also found that more than half (53.9%) of the
companies were diversified. Claessens et al. (1998) studied corporate diversification
in nine East Asian countries including Malaysia over the period 1991-1996. Their
data revealed that Malaysia ranked higher in the percentage of multi-segment firms
(70%) after Singapore (72%).
Past studies on product diversification – performance relationship in context of
Malaysia or other Asian countries produced mixed findings. Some studies indicated
significant diversification discount or negative impact of product diversification on
performance compared to those of single-segment firms (Claessens et al., 1998; Daud
et al., 2009; Lins & Servaes, 2002). The evidence from the developed countries shows
that diversification is not beneficial (Berger & Ofek, 1995; Hoechle, Schmid, Walter,
& Yermack, 2012; Lang & Stulz, 1994) but since Malaysia is seen as a country where
market imperfections still exist (Chakrabarti et al., 2007), the benefits of internal
capital market efficiency could apply here. But, study of Daud et al. (2009) doesn’t
report results in favour of this proposition.
However, other studies in Malaysian context produce results which are consistent
with transaction cost theory or internal market efficiency hypothesis, stating that
11
product diversification is beneficial in markets having least developed institutional
environments and reporting results against presence of significant diversification
discount (Chakrabarti et al., 2007; Ishak & Napier, 2006).
In can be argued that the study of Malaysian organisations with respect to product
diversification strategies could be enriched by inclusion of most important strategic
issues that might moderate the relationship between product diversification strategies
and performance. Unlike West, in most of the Asian countries, the diversification is at
the group level (Mishra & Akbar, 2007a; Zhao, 2010). According to George (2007)
and Guillen (2000), business groups in emerging economies are motivated to diversify
for getting internal market advantages from it such as obtaining capital, raw material
and technology from internal market.
Malaysian economy is also characterized by presence of business groups in corporate
sector, which function across a diversified range of activities within and across a
number of sectors such as plantation, construction, property development, diversified
manufacturing and trading as well as services (Thillainathan, 1999). This study
provides a test of the phenomenon by evaluating related diversification strategy and
unrelated diversification strategy separately.
Additionally, the study analyses corporate parenting roles of corporate level
managers. So, there are multiple objectives of the study. The study not only helps
examine the relative effects of related and unrelated diversification strategies on
corporate performance, but more importantly it enables us to explore whether
corporate parenting roles have a positive moderating effect on diversification
12
strategies and corporate performance relationship. Moreover, the study puts forward
strong conclusions as the measurement of corporate performance is done through
objective criteria using financial ratios as well as through subjective assessment of
corporate performance by company representatives.
1.4 Problem Statements
Past research in product diversification – performance relationship has been
multidirectional. It has either focused on examining the effect of product
diversification on performance or on comparing related diversification strategy with
unrelated diversification strategy on different performance measures. However, the
findings of research in these areas have been inconsistent and inconclusive
(Asrarhaghighi et al., 2013; Marinelli, 2011; Nippa et al., 2011).
Over the years, certain studies found product diversification as a valuable strategy
(Kuppuswamy & Villalonga, 2010; Miller, 2006; Mishra & Akbar, 2007a; Pandya &
Rao, 1998), while others did not find it beneficial and proved significant negative
effects of product diversification on performance (Afza, Slahudin, & Nazir, 2008;
Braakmann & Wagner, 2009; Daud et al., 2009; Hoechle et al., 2012).
Certain studies found curvilinear or inverted U-Shaped relationship between product
diversification and performance (Galván, Pindado, & De la Torre, 2007; Kahloul &
Hallara, 2010; Liu & Hsu, 2011; Palich et al., 2000). Interestingly, certain past studies
found no significant effect of product diversification on performance and attributed
performance to variables other than extent of product diversification (Chang &
13
Thomas, 1989; Çolak, 2010; Lloyd & Jahera Jr., 1994; Marinelli, 2011; Montgomery,
1985).
Similarly, in comparing related against unrelated diversifiers, certain researchers
found related diversifiers as better performers than unrelated diversifiers (Galván et
al., 2007; Markides & Williamson, 1996; Mishra & Akbar, 2007a; Rumelt, 1974,
1982). While, on the other hand, others concluded that unrelated diversifiers
performed better in comparison to related ones (Dubofsky & Varadarajan, 1987;
Lahovnik, 2011; Marinelli, 2011; Michel & Shaked, 1984).
Hence, there has been clear inconsistency among the findings of past studies in these
areas and this inconsistency provides initial motivation for this research. This
discrepancy could partly be attributed to number of reasons such as use of different
approaches to measure product diversification, use of different corporate performance
indicators, studies’ time periods and change of contexts etc. (Asrarhaghighi et al.,
2013; Datta et al., 1991; Palich et al., 2000).
Most importantly, certain researchers argue that product diversification strategies –
performance relationship being complex, must be examined through a perspective by
incorporating the impact of moderating variables in it which might actually change
the nature of this relationship (Datta et al., 1991; Hill et al., 1992; Martínez-Campillo
& Fernández-Gago, 2008; Mehmood & Hilman, 2013; Ravichandran, Liu, Han, &
Hasan, 2009). Although some past studies incorporated certain moderators into this
relationship (David, O’Brien, Yoshikawa, & Delios, 2010; Markides & Williamson,
1996; Martínez-Campillo & Fernández-Gago, 2008; Santalo & Becerra, 2004), but
14
there have been limited studies utilising crucial corporate strategy issues such as
corporate parenting advantage as moderator into this relationship (Campbell et al.,
1995a; Nippa et al., 2011).
Traditionally, although, researchers talked about corporate strategy, corporate value
addition, and corporate parenting styles (Campbell & Goold, 1988; Kruehler et al.,
2012; Mishra & Akbar, 2007b), but most of the explanation on the topic is purely
theoretical. Particularly, there has been theoretical focus on different corporate
parenting roles such as: strategic planning, financial control and strategic control
(Goold, Campbell, & Luchs, 1993a, 1993b) and portfolio manager, synergy manager
and parental developer (Johnson et al., 2008, 2011), but there are limited empirical
researches (Lange, Boivie, & Henderson, 2009; Oijen & Douma, 2000) studying
product diversification strategies and corporate parenting roles together.
Specifically, there is limited research examining corporate parenting roles as
moderators in product diversification strategies – performance relationship, thus
representing a research gap (Campbell et al., 1995a; Nippa et al., 2011). This study
aims to fill this research gap by examining effects of related and unrelated
diversification strategies on corporate performance by taking corporate parenting
roles as moderators in the relationship.
Furthermore, majority of past studies relied on financial performance indicators, for
instance, accounting ratios (Ibrahim & Kaka, 2007; Marinelli, 2011; Martínez-
Campillo & Fernández-Gago, 2008), market ratios (Chari, Devaraj, & David, 2008;
Hoechle et al., 2012; Schmid & Walter, 2008), or a combination of accounting and
15
market ratios (Daud et al., 2009; Fukui & Ushijima, 2006; Kahloul & Hallara, 2010)
in their investigations on the topic. There are lesser studies that used subjective
assessment of overall corporate performance, which represents another research gap.
To fill this gap, this study secures subjective assessment of corporate performance
along with financial performance indicators in order to make comprehensive
evaluation of diversification strategies on corporate performance.
Moreover limited studies and inconsistencies into these research areas in Asian
context also call for more investigation (Chakrabarti et al., 2007; Daud et al., 2009;
Ishak & Napier, 2006). This research is deemed important in Malaysian context as
there has been limited research on the topic in Malaysian context (Daud et al., 2009;
Yaghoubi et al., 2011), while at the same time Malaysia has always been
characterised by presence of a large number of diversified organisations (Ahmad et
al., 2003; Claessens et al., 1998; Ishak & Napier, 2006).
Although there is some research into Malaysian directors’ competences but research
about moderating effect of corporate parenting roles on product diversification
strategies – performance relationship with respect to Malaysian companies is almost
lacking (Alhaji & Yusoff, 2013; Yusoff & Amrstrong, 2012). Therefore, given its
research objectives, this study certainly pays a rich contribution to the understanding
of the relevant phenomenon regarding Malaysian companies while filling the
contextual gap on the topic.
16
1.5 Research Questions
Following research questions are formulated for this study.
1: Does extent of product diversification strategy significantly affect corporate
performance?
1a: Does extent of related diversification strategy significantly affect corporate
performance?
1b: Does extent of unrelated diversification strategy significantly affect corporate
performance?
2: Do corporate parenting roles positively moderate relationship between product
diversification strategies and corporate performance?
2a: Do synergy manager role and parental developer role positively moderate
relationship between related diversification strategy and corporate
performance?
2b: Does portfolio manager role positively moderate relationship between
unrelated diversification strategy and corporate performance?
3: How do related diversification strategy and unrelated diversification strategy
compare with each other concerning their effects on corporate performance?
1.6 Research Objectives
Following research objectives could be listed on the basis of the above mentioned
research questions.

17
1. To investigate whether extent of product diversification strategy significantly
affects corporate performance.
1a: To investigate whether extent of related diversification strategy significantly
affects corporate performance.
1b: To investigate whether extent of unrelated diversification strategy
significantly affects corporate performance.
2. To investigate whether corporate parenting roles positively moderate
relationship between product diversification strategies and corporate
performance.
2a: To investigate whether synergy manager role and parental developer role
positively moderate relationship between related diversification strategy and
corporate performance.
2b: To investigate whether portfolio manager role positively moderates
relationship between unrelated diversification strategy and corporate
performance.
3. To compare related and unrelated diversification strategies concerning their
effects on corporate performance.
1.7 Significance of the Study
This study demonstrates the importance of selecting related or unrelated
diversification strategies, corporate parenting roles and their possible combined effect
on corporate performance. It is anticipated that an appropriate combination of a
particular product diversification strategy and corporate parenting role will have a
18
positive effect on corporate performance. The theoretical and practical significance of
the study is evident on the basis of following arguments.
1.7.1 Theoretical Significance
This study addresses important issues and existing gaps in the literature concerning
the interaction between product diversification strategies and corporate parenting
roles for diversified companies. Although there are a number of studies examining
effect of product diversification strategies on performance but there is limited
research on the interrelationships between product diversification strategies, corporate
level competences or managerial styles and corporate performance (Hitt & Ireland,
1986; Liu & Hsu, 2011; Menz & Mattig, 2008).
Most notably, there was a research gap in form of absence of research on the
moderating effect of corporate parenting roles on product diversification -
performance relationship (Campbell et al., 1995a; Nippa et al., 2011). Hence, this
research has filled that gap by combining together factors of extreme strategic
importance, namely product diversification strategies, corporate parenting roles and
corporate performance into one research framework.
In this way, this research has explored significant relationships among crucial
variables of strategic nature and contributed to the relevant body of knowledge.
Specifically, this study has contributed to the literature on product diversification
strategies, corporate parenting and corporate performance along with paying
significant contribution in studying the nature of product diversification - performance
19
relationship through the perspective of corporate parenting roles. In another way, this
research has also contributed to the group of studies who examined product
diversification – performance relationship from the perspective of moderating
variables (Hill et al., 1992; Martínez-Campillo & Fernández-Gago, 2008;
Ravichandran et al., 2009) and has followed the suggestions of those scholars by
studying this relationship using moderators.
Apart from that, the findings of this research significantly contribute to resource based
view (RBV), dynamic capabilities perspective (DCP), contingency theory, transaction
cost economics (TCE) and market power view in particular. The findings have made
important advancements in linking RBV, TCE and market power view with the DCP.
This research also makes important contribution by discussing similarities and
differences in past studies on the relevant topic through its literature review.
Moreover, the use of comprehensive performance evaluation criteria based on
objective (financial) as well as subjective indicators further increases the significance
of the study. This research opens new avenues for future research into the relevant
fields and recommends possible research frameworks for future studies that could also
pay a significant contribution to the concerned body of knowledge.
1.7.2 Practical Significance
Several characteristics of this research point towards its practical significance. Firstly,
this research is significant in the sense that there are limited researches on the topic in
context of Malaysian corporate sector (Daud et al., 2009; Ishak & Napier, 2006).
20
Malaysian corporate sector plays a massive role in growth and development of
national economy. This research presents a strong set of guidelines with respect to
relevant variables for the managers in general and Malaysian managers in particular.
This research studies the effects of product diversification strategies (including related
as well as unrelated diversification) on corporate performance of Malaysian Public
Listed Companies (PLCs). The importance of this research signifies from this point
that it studies certain factors which are considered to be of extreme strategic
importance for any public listed company. Further, this study examines the
moderating effect of corporate parenting roles on diversification strategies –
performance relationship. The topic of corporate parenting including corporate
parenting roles is itself a crucial strategic and leadership issue faced by strategists of
public listed companies (Campbell et al., 1995a; Kruehler et al., 2012; Porter, 1987).
Hence, the interrelationships explored between diversification strategies, corporate
parenting roles and corporate performance based on the data for Malaysian PLCs
indicates its great significance for the Malaysian PLCs in particular. The guidelines
developed as a result of this research guide strategists in improving their managerial
decision making. The findings guide Malaysian CEOs, Directors and corporate
planners in their choice of product diversification strategies. Particularly, the insights
gained in the study regarding the relationship between product diversification
strategies and corporate parenting roles direct the strategists in understanding the
importance of corporate parenting and using most appropriate corporate parenting role
for adding value to their businesses.
21
The findings serve as an important guideline for Malaysian managers in particular
about the selection of type of diversification strategy and recommend them selecting
related diversification strategy for corporate expansion and growth. The results
suggest that corporate parenting role is a significant strategic factor in product
diversification – performance relationship. The results provide important directions to
managers about choice of appropriate corporate parenting role for a particular
diversification strategy.
Specifically, the research suggests that corporate managers must learn and adopt the
role of Synergy Manager and ideally Parental Developer while following related
diversification strategy. Corporate managers must understand and play the role of
Portfolio Manager while pursuing unrelated diversification strategy. In another way,
the findings point towards the importance of developing relevant corporate
management capabilities and adopting suitable corporate parenting roles according to
the type of diversification strategy. The managers can learn from the findings of this
study combined with discussion of relevant theories and interpretation of results.
As discussed before in a previous section that although Malaysia has successfully
come out of 2008-09 global financial crises but the economy is faced with external
environment challenges in maintaining its growth targets (IMF Staff Country Report,
2012). The discussions made and recommendations provided in this research would
certainly provide useful insights in managerial decision making on the relevant issues,
for Malaysian strategists in particular and other managers in general. It would help
improve the performance of Malaysian corporate sector.
22
It has been discussed before that Malaysian manufacturing and service sectors pay
significant contribution to Malaysia’s GDP. The recommendations provided through
this research regarding important corporate strategy issues would certainly help
manufacturing and service sectors improve their contribution to Malaysian GDP. This
would ultimately facilitate in achieving the target of GDP growth rate for concerned
years. The findings would guide capital investment decisions made by corporate
sector about investing in related or unrelated sectors and industry segments and help
achieve better economic balance. Similarly, through providing recommendations
about corporate diversification decisions, this research would also contribute in
achieving Economic Transformation Programme and Tenth Malaysia Plan (10th MP).
1.8 Scope of the Study
Research into corporate sector is always considered as of bigger scope. This study
focused on issues related to product diversification strategies, corporate parenting
roles and performance for diversified PLCs on Bursa Malaysia. It collected corporate
level primary data as well as secondary data for its analyses purposes. Secondary data
was collected through company annual reports, Worldscope Datastream and other
sources, whereas primary data was collected through questionnaires sent to top level
managers of Malaysian PLCs. The findings obtained through this research are
applicable to all diversified companies in general and Malaysian PLCs in particular.
The methodology presented in Chapter 3 as well as discussions made in Chapter 5
further magnify the scope of this study.
23
1.9 Organisation of the Thesis
This thesis is organised around five chapters. Chapter 1 presents overall introduction
and background of the study, along with other important contents like problem
statements, research objectives and research questions, and study’s scope and
significance.
Chapter 2 presents literature review. It mainly focuses on concepts, issues and past
researches on product diversification strategy and its types (related and unrelated
diversification strategy). It includes discussions about underpinning theories relating
to different variables. Additionally, it discusses the concept of corporate parenting and
elaborates literature available on three corporate parenting roles i.e. Portfolio
Manager, Synergy Manager and Parental Developer. Lastly, it discusses the variable
of Corporate Performance and how past researches have been measuring corporate
performance. The explanations include different indicators for measuring corporate
financial performance by past studies with a focus on subjective assessment of
corporate performance.
Chapter 3 presents research framework, hypotheses and research methodology. It
elaborates on the measurement of independent, dependent and moderating variables
along with instrument development and discusses population, unit of analysis, sources
of data and pilot study. Chapter 4 presents data analysis and findings of the study. It
discusses sample size, respondent companies, and methods of data analysis in the
beginning. Then, it presents methods and procedures to ensure validity and reliability
of the questionnaire along with commenting on descriptive statistics. After that, it
24
presents in detail the test results for simple linear regression analysis, moderated
regression analysis, and t-tests in a sequence as required by the research questions and
research objectives.
Chapter 5 is mainly devoted for conclusions and discussions on the results obtained in
Chapter 4. Additionally, it discusses implications of the study and its limitations, and
presents recommendations for the future research into relevant areas.
1.10 Chapter Summary
This chapter started by providing overall background and introduction of this research
by providing a brief history on past patterns of product diversification strategies, an
overview of relevant research in product diversification strategies and corporate
performance and gaps in the concerned literature. Then, it provided overview and
challenges confronted by Malaysian economy and its corporate sector to highlight the
importance of study in Malaysian context. Afterwards, it presented problem statement
of the research by focusing on various gaps in the relevant literature regarding
different concepts and issues and suggested how to fill those gaps. It was followed by
research questions and research objectives. The chapter then proceeded towards
explaining theoretical and practical significance of the study followed by its scope.
Organisation of thesis was explained in the end.
25
CHAPTER TWO
LITERATURE REVIEW
2.1 Introduction
This chapter is devoted to critical review of literature on various topics relevant to this
research. The chapter starts by presenting an overview of Malaysian corporate sector
including various regulatory bodies that govern PLCs in Malaysia along with
information about number of PLCs, market indices, and types of Bursa Malaysia
markets. Then, it provides basic conceptualization of Product Diversification Strategy
and its types in Section 2.3. It proceeds towards explaining motives for Product
Diversification Strategy with reference to its underpinning theories in Section 2.3.2.
This is followed by Sections 2.3.3 and 2.3.4 which provide detailed explanation and
critical analysis of past studies on product diversification strategy and performance
link. The chapter, then advances towards explaining the concept of Corporate
Parenting, its rationale and logic, the three Corporate Parenting Roles, and past
research conducted on corporate parenting along with theoretical underpinnings of
this concept. Lastly, it explains variable of Corporate Performance and makes critical
analysis of past studies employing various measures of corporate performance in
Section 2.5. In the end, a summary of the chapter is presented.
26
2.2 Corporate Sector in Malaysia
This section offers a brief explanation about the corporate sector of Malaysia. As the
unit of analysis in this study is Public Listed Company (PLC), therefore it starts with
presenting a short history and development of corporate sector in Malaysia, Bursa
Malaysia’s listing requirements for PLCs in brief, number of listed companies and
relevant market indices along with regulatory bodies governing PLCs in Malaysia.
Malaysia is presently consisting of 13 states and 3 federal territories. Under the
constitution of Malaysia, most of the matters of life are being governed by a uniform
body of federal law implemented by a system of national courts (Shuaib, 2012).
Although the legal system of Malaysia is predominantly based on English common
law, there are also other legal systems of secondary nature that affect certain sections
of the law, for instance customary law and Islamic law (Noordin & Supramaniam,
2013). In the early times, companies in Malaysia were controlled by the British
ownership, and corporate sector had largely been characterized by companies
involved in tin mining, plantation and timber, whereas currently it has transformed
itself into high technology industrial platform (Mun, 2007).
The development of corporate sector in Malaysia has been aided by several set of
policies made by past governments. For instance, along with policies for promoting
industrialization, export orientation, foreign direct investment and privatization, an
important policy has been to strengthen Bumiputra business community so as to
reduce poverty levels and to ensure equal ownership among various society groups
(Ishak & Napier, 2006). In last decade or so, governments have been attracting capital

27
inflows to the corporate sector by advocating economic power, appreciative
government policies, developed infrastructure, well educated workforce, vigorous
business environment and improved life quality (Malaysian Investment Development
Authority [MIDA], 2014).
In order to ensure government policy implementation, following framework of public
corporations and bodies prevail in Malaysia:
1. At first place, there is an organisation structure of ministries along with certain
government departments such as Royal Customs and Excise Department,
Immigration Department of Malaysia, Marine Department Malaysia and
Department of Statistics Malaysia (Noordin & Supramaniam, 2013). This
provides umbrella for policy making and sets parameters for policy and
system implementation and evaluation.
2. Certain statutory and regulatory bodies are also in place to ensure government
policy implementation and adherence. For instance, they are Bank Negara
Malaysia, Malaysian Investment Development Authority (MIDA),
MATRADE, The Inland Revenue Board of Malaysia, The Malaysian
Communications and Multimedia Commission (MCMC), Human Rights
Commission of Malaysia (SUHAKAM), and Intellectual Property Corporation
of Malaysia (Noordin & Supramaniam, 2013). These regulatory bodies work
in collaboration and ensure corporate sector’s adherence to policy issues, laws,
rules and regulations relating to conduct of business operations in Malaysia.
3. Thirdly, there exists a set of partly or fully owned government organisations
for the provision of certain basic and important products and services.

28
1Malaysia Development Berhad, Khazanah Nasional Berhad, MRT Corp and
Petronas are few among them. They are set to fulfil the objective of providing
certain goods and services of basic nature for general public welfare.
Hence, along with several privately owned corporations, these public sector
organisations and bodies attempt to keep balance over corporate ownership structure.
But over the years, there has been a shift in the corporate ownership structure,
corporate governance and possibly corporate managerial styles as reflected through
the privatization programme of past governments (Tan, 2008). Historically,
privatisation guidelines were released by the Economic Planning Unit (EPU) in 1985
and were followed by announcement of Privatisation Masterplan in 1991 (Nambiar,
2009).
Four major privatizations occurring in the past have been the privatisation of Kuala
Lumpur Light Rail Transit LRT, national sewerage company IWK, national car
company Proton, and national airline MAS (Tan, 2008). From an economic point of
view, although privatisation provides benefit to the economy, but in Malaysia it has
resulted in both, success and failure (Mun, 2007; Tan, 2008).
As this study is conducted for PLCs, therefore next Section discusses Bursa
Malaysia’s types of markets and number of PLCs, high and low performing PLCs and
regulatory bodies governing PLCs in Malaysia
29
2.2.1 Public Listed Companies (PLCs) in Malaysia
In Malaysia, PLCs are either listed on the Main Market or on the ACE (which is
abbreviation for Access, Certainty, Efficiency) Market of Bursa Malaysia Securities
Berhad. The foremost difference between Main Market and ACE Market is in their
listing requirements. For instance, for primary listing of local as well as foreign
companies, market capitalization of RM500 million at best is prescribed for listing for
Main Market, while there is no such requirement for listing on ACE Market
(SMEinfo, 2014)1. Other than that, there is difference between the two markets with
respect to profit level requirements, infrastructure project requirements, IPO price
level, public spread and Bumiputera Equity Requirement (SMEinfo, 2014). One of the
noteworthy qualitative criteria for listing on the ACE Market is Sponsorship – where
a Sponsor is required to judge company’s competency for listing and which needs to
stay with the company for at least three years after listing (Bursa Malaysia, 2011).
Currently, there are about 800 companies listed on the Main Market and over 100
companies listed on ACE Market of Bursa Malaysia. Table 2.1 provides summary of
listed companies on both markets from 2009 to 2014. The companies listed on the
Main Market are classified into following sectors: Industrial Products, Construction,
Consumer Products, Properties, REITs, Trading and Services, Finance, Technology,
Plantations, Mining, SPAC, Hotels, IPC, and Closed-End Funds. Certain companies
listed on Bursa Malaysia are categorized as PN17 companies. PN17 is about Practice
Note 17/2005 released by Bursa Malaysia.
1 Comprehensive detail and criteria about primary and secondary listing requirement of local and foreign companies is available on the website: www.smeinfo.com.my through following link: (http://www.smeinfo.com.my/index.php?option=com_content&view=article&id=1148&Itemid=1156, 2014)
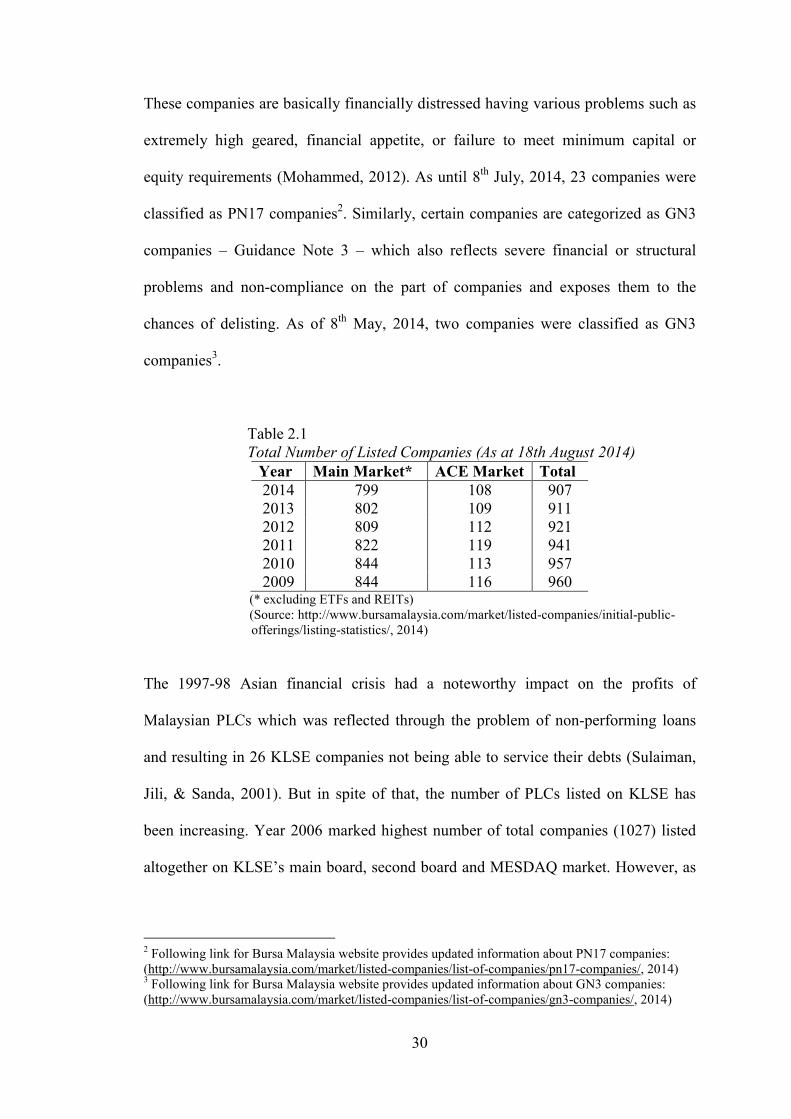
30
These companies are basically financially distressed having various problems such as
extremely high geared, financial appetite, or failure to meet minimum capital or
equity requirements (Mohammed, 2012). As until 8th July, 2014, 23 companies were
classified as PN17 companies2. Similarly, certain companies are categorized as GN3
companies – Guidance Note 3 – which also reflects severe financial or structural
problems and non-compliance on the part of companies and exposes them to the
chances of delisting. As of 8th May, 2014, two companies were classified as GN3
companies3.
Table 2.1 Total Number of Listed Companies (As at 18th August 2014)
Year Main Market* ACE Market Total 2014 799 108 907 2013 802 109 911 2012 809 112 921 2011 822 119 941 2010 844 113 957 2009 844 116 960
(* excluding ETFs and REITs) (Source: http://www.bursamalaysia.com/market/listed-companies/initial-public-
offerings/listing-statistics/, 2014)
The 1997-98 Asian financial crisis had a noteworthy impact on the profits of
Malaysian PLCs which was reflected through the problem of non-performing loans
and resulting in 26 KLSE companies not being able to service their debts (Sulaiman,
Jili, & Sanda, 2001). But in spite of that, the number of PLCs listed on KLSE has
been increasing. Year 2006 marked highest number of total companies (1027) listed
altogether on KLSE’s main board, second board and MESDAQ market. However, as
2 Following link for Bursa Malaysia website provides updated information about PN17 companies: (http://www.bursamalaysia.com/market/listed-companies/list-of-companies/pn17-companies/, 2014) 3 Following link for Bursa Malaysia website provides updated information about GN3 companies: (http://www.bursamalaysia.com/market/listed-companies/list-of-companies/gn3-companies/, 2014)
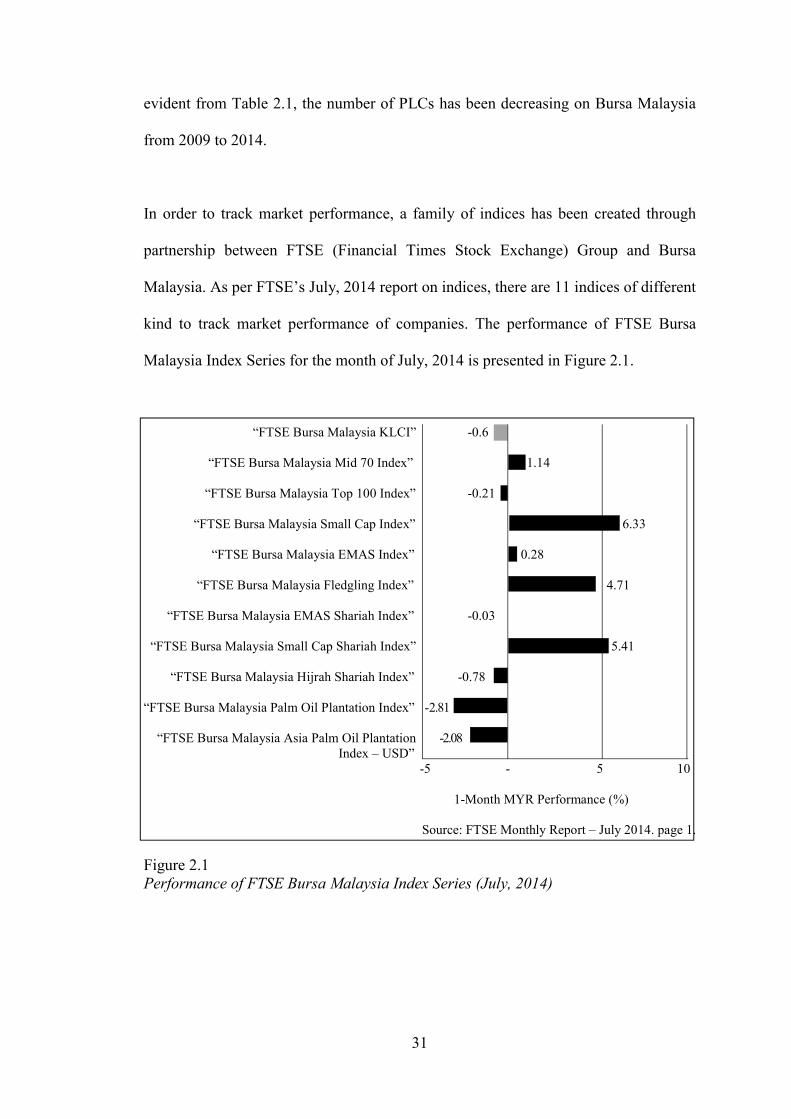
31
evident from Table 2.1, the number of PLCs has been decreasing on Bursa Malaysia
from 2009 to 2014.
In order to track market performance, a family of indices has been created through
partnership between FTSE (Financial Times Stock Exchange) Group and Bursa
Malaysia. As per FTSE’s July, 2014 report on indices, there are 11 indices of different
kind to track market performance of companies. The performance of FTSE Bursa
Malaysia Index Series for the month of July, 2014 is presented in Figure 2.1.
“FTSE Bursa Malaysia KLCI” -0.6
“FTSE Bursa Malaysia Mid 70 Index” 1.14
“FTSE Bursa Malaysia Top 100 Index” -0.21
“FTSE Bursa Malaysia Small Cap Index” 6.33
“FTSE Bursa Malaysia EMAS Index” 0.28
“FTSE Bursa Malaysia Fledgling Index” 4.71
“FTSE Bursa Malaysia EMAS Shariah Index” -0.03
“FTSE Bursa Malaysia Small Cap Shariah Index” 5.41
“FTSE Bursa Malaysia Hijrah Shariah Index” -0.78
“FTSE Bursa Malaysia Palm Oil Plantation Index” -2.81
“FTSE Bursa Malaysia Asia Palm Oil Plantation -2.08 Index – USD”
-5 - 5 10
1-Month MYR Performance (%)
Source: FTSE Monthly Report – July 2014. page 1.
Figure 2.1 Performance of FTSE Bursa Malaysia Index Series (July, 2014)
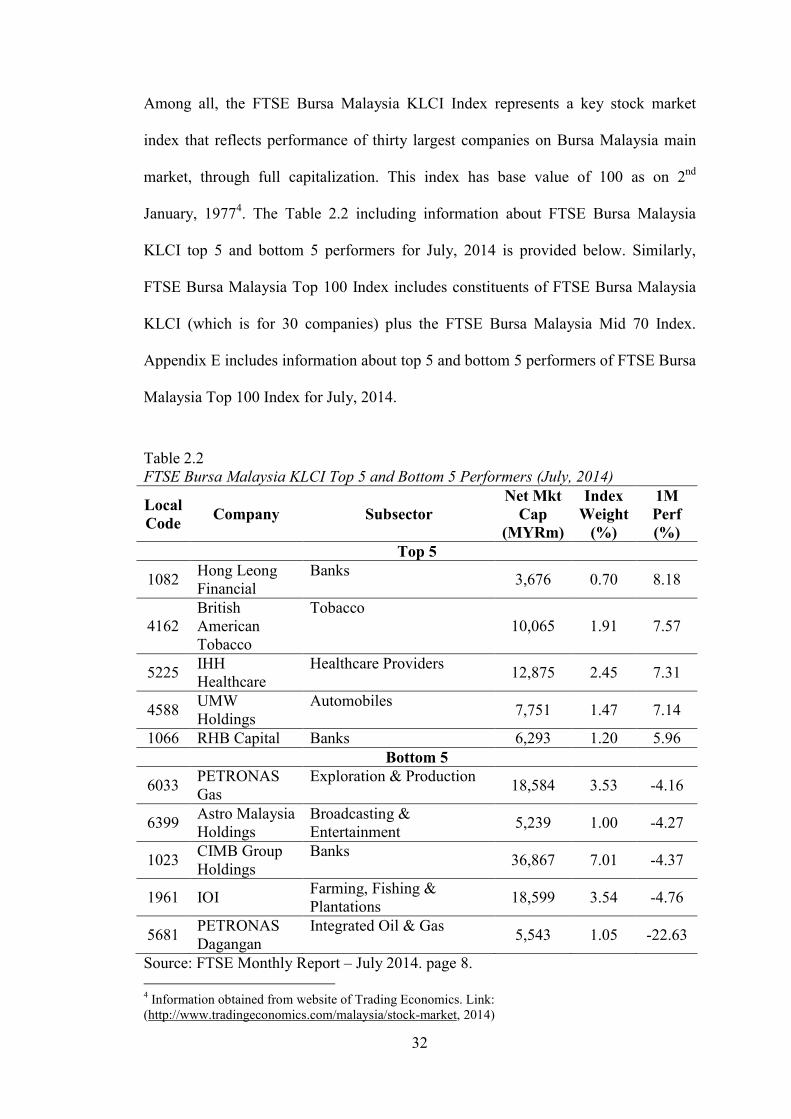
32
Among all, the FTSE Bursa Malaysia KLCI Index represents a key stock market
index that reflects performance of thirty largest companies on Bursa Malaysia main
market, through full capitalization. This index has base value of 100 as on 2nd
January, 19774. The Table 2.2 including information about FTSE Bursa Malaysia
KLCI top 5 and bottom 5 performers for July, 2014 is provided below. Similarly,
FTSE Bursa Malaysia Top 100 Index includes constituents of FTSE Bursa Malaysia
KLCI (which is for 30 companies) plus the FTSE Bursa Malaysia Mid 70 Index.
Appendix E includes information about top 5 and bottom 5 performers of FTSE Bursa
Malaysia Top 100 Index for July, 2014.
Table 2.2 FTSE Bursa Malaysia KLCI Top 5 and Bottom 5 Performers (July, 2014)
Local Code
Company Subsector Net Mkt
Cap (MYRm)
Index Weight
(%)
1M Perf (%)
Top 5
1082 Hong Leong Financial
Banks 3,676 0.70 8.18
4162 British American Tobacco
Tobacco 10,065 1.91 7.57
5225 IHH Healthcare
Healthcare Providers 12,875 2.45 7.31
4588 UMW Holdings
Automobiles 7,751 1.47 7.14
1066 RHB Capital Banks 6,293 1.20 5.96 Bottom 5
6033 PETRONAS Gas
Exploration & Production 18,584 3.53 -4.16
6399 Astro Malaysia Holdings
Broadcasting & Entertainment
5,239 1.00 -4.27
1023 CIMB Group Holdings
Banks 36,867 7.01 -4.37
1961 IOI Farming, Fishing & Plantations
18,599 3.54 -4.76
5681 PETRONAS Dagangan
Integrated Oil & Gas 5,543 1.05 -22.63
Source: FTSE Monthly Report – July 2014. page 8. 4 Information obtained from website of Trading Economics. Link: (http://www.tradingeconomics.com/malaysia/stock-market, 2014)
33
Further, PLCs in Malaysia are subject to control by several institutions and regulatory
bodies concerned with tax, stock market operations, business incorporation and other
matters (Ishak & Napier, 2006). Securities Commission (SC) is the most important
statutory body established under the Securities Commission Act 1993. In addition to
advising the Government and Bank Negara Malaysia, SC performs a set of extremely
crucial roles such as supervising exchanges, registering companies’ prospectuses,
regulating mergers/takeovers, and warranting suitable market conduct. It also acts as
liaison body between Bank Negara Malaysia, Ministry of International Trade and
other parties for various matters (Mah-Kamariyah & Koh, 2011).
The Companies Commission of Malaysia (Suruhanjaya Syarikat Malaysia-SSM) acts
as government agent to oversee various issues relating to corporations and other
businesses, and to facilitate the provision of corporate information and gathering of
payment/fee of different kind. Companies in Malaysia are required to adhere to
various acts like Securities Commission Act 1993 in principal and other acts like
Companies Act 1965, Registration of Businesses Act 1956, Kootu Funds
(Prohibition) Act 1971, and Trust Companies Act 1949 (Mah-Kamariyah & Koh,
2011). SSM justifies its existence through proper implementation of these acts.
The Inland Revenue Malaysia also acts as government agent to govern and collect
various taxes and loans from various institutions. Bursa Malaysia Securities Berhad
serves as self-regulatory body engaged primarily in the enforcement of listing
requirements for PLCs, making market observations and ensuring proper compliance
and conduct of PLCs (Malaysian Accounting Standards Board [MASB], 2014a). In
order to protect small investors and ensure accountability and transparency on the part
34
of PLCs, Bursa Malaysia has put in place a disclosure-based system along with
implementing Malaysian Code of Corporate Governance.
As a professional body, The Malaysian Institute of Chartered Secretaries and
Administrators (MAICSA) serves particular needs of the corporate sector through
providing education and training in good governance, ethics, undertaking research and
advocating sound corporate practices. In addition, companies in Malaysia are required
to follow standardized accounting and financial standards set forth by The Malaysian
Accounting Standards Board which is an independent authority set under the
Financial Reporting Act 1997 (MASB, 2014a). Hence, the combination of different
regulatory bodies, laws and acts provide a sound legal and regulatory framework for
PLCs in Malaysia to conduct their business operations.
This section discussed number and listing of PLCs on different markets of Bursa
Malaysia, indices for gauging performance of PLCs, and the role of different
government organisations and institutions governing PLCs in Malaysia. Next, the
review of literature on all relevant variables of this research starts from the following
section. The section 2.3 presents conceptualization of product diversification strategy
and its types, as well as it provides literature review regarding product diversification
– performance relationship along with other important contents.
2.3 Product Diversification Strategy
2.3.1 Definition and Types
Diversification or diversify is derived from the word diverse which means variety
(Read & Loewenstein, 1995). Applied to business context, product diversification
35
would mean organisation’s growth or expansion into related or unrelated industries
(Haberberg & Rieple, 2001; Robbins, Coulter, & Langton, 2007). Product
diversification strategy determines an organisation’s competitive scope (Porter, 1991).
Historically, Ansoff (1957) defined product diversification as a growth strategy
wherein an organisation departs from its existing product lines and existing market
structure to new ones. He added that compared with other strategies; product
development, market development, and market penetration, product diversification
resulted into major structural changes in an organisation as it required new skills,
techniques and facilities for its implementation.
As product diversification may drastically increase organisation’s scope (Coulter,
2005; Johnson et al., 2008), it could be argued that it is a risky strategy and
diversification decision carries extreme significance in any organisation. Product
diversification represents organisation’s strategic flexibility and it can be classified
into two types: related diversification and unrelated diversification (Abdullah, 2009;
Jones & Hill, 2010).
2.3.1.1 Related Diversification Strategy
2.3.1.1.1 Definition
Related diversification strategy is company’s expansion beyond existing products or
markets but within its current core of resources and capabilities (Grant, Butler, Hung,
& Orr, 2011; Johnson et al., 2008). In related diversification, company’s new business
activity is linked with current business activities (Harrison & John, 2010; Lahovnik,
36
2011; Thompson, Peteraf, Gamble, & Strickland III, 2012) and there might be great
commonality among various businesses with respect to resource requirements and key
value chain activities that they perform (Teece, 1982; Thompson et al., 2012). Hence,
in related diversification, an organisation enters into new industry segments which are
part of the same industry the organisation is already working in.
2.3.1.1.2 Examples of Related Diversification Strategy
The acquisition of Procter & Gamble’s Folger’s coffee business by Smuckers Co.
(manufacturer of peanut butter, jam and Crisco Oils) as well as entrance of Tyson
Foods into dog food business provide examples of related diversification strategy
(David, 2011). Similarly, Samsung, Cisco Systems and Honda are other examples of
companies following related diversification strategy (Harrison & John, 2010; Jones &
Hill, 2010)
2.3.1.1.3 Reasons to pursue Related Diversification Strategy
Scholars suggest that the primary motive behind related diversification strategy is
creation of synergy (David, 2011; Grant et al., 2011). Synergy exemplifies that for
two products A and B, the value produced by their combined manufacturing is more
than the value produced when the two outputs are manufactured independently
(Abdullah, 2009; Hill et al., 1992). In relatedly diversified businesses, synergy results
when the combined value created by different businesses working together exceeds
the value the same businesses would produce working alone (Gupta et al., 2007;
Morden, 2007).
37
Related diversifiers can enjoy different types of synergies such as operative synergies
and growth synergies, as well as synergy benefits might be available in form of scale
effects, capability enhancements and entry into new markets (Knoll, 2007; Morden,
2007). Tangible relatedness among organisational resources can result into synergy
creation through resource sharing while intangible relatedness provides opportunities
for managerial synergy (Harrison & John, 2010). In relatedly diversified firms, the
major sources of synergy can be in form of economies of scope, market power, and
internal governance benefits (Martin & Eisenhardt, 2001; Yaghoubi et al., 2011).
Related diversifiers gain scope economies in form of cost or differentiation
advantages by sharing their resources and capabilities across different businesses
(Galván et al., 2007; Haberberg & Rieple, 2001; Nayyar, 1993). Helfat and
Eisenhardt (2004) argued that a company using related diversification could benefit
from intra-temporal and inter-temporal economies of scope. P&G enjoys economies
of scope over its competitors as it shares its R&D cost and marketing cost across
different businesses (Jones & Hill, 2010).
However, benefits of economies of scope might be available when there are
significant commonalities among different businesses of an organisation and
opportunities exist for creating significant competitive advantage for certain
businesses of the organisation (Hoskisson, Hitt, & Ireland, 2009; Jones & Hill, 2010).
Economies of scope benefits might be available in form of operational relatedness in
highly related businesses, whereas these benefits are available through corporate
relatedness in moderately related businesses (Gupta et al., 2007; Hitt, Ireland, &
Hoskisson, 2011).
38
Related diversification strategy provides rationale to organisations through increased
market power as well (Dess, Lumpkin, Eisner, & McNamara, 2011; Hoskisson et al.,
2009). Market power exists when an organisation is able to sell its products at high
prices relative to competitors or reduce its costs in relation to competitors through
predatory pricing (George, 2007; Martin & Eisenhardt, 2001). Also, market power
can be attained by related diversifiers through multipoint competition as well as
through vertical integration (Hitt et al., 2011).
In multipoint competition, a relatedly diversified firm sells its products against
competitors in variety of product and market segments, thus putting competitive
pressures on them (Johnson et al., 2008), whereas in vertical integration, related
diversifiers gain greater bargaining power over suppliers and distributors through
backward and forward integration respectively (David, 2011; Gupta et al., 2007).
Yaghoubi et al. (2011) argue that related diversifiers gain increased bargaining power
over their buyers through mergers in same or similar industries which give them
opportunity to sell their products and services at high prices.
Related diversifiers also gain synergy benefits through internal governance
advantages whereby they could create an efficient internal market for rapidly
transferring capital and other assets among different businesses (Coase, 1937; Martin
& Eisenhardt, 2001; Williamson, 1971). Organisation can finance new promising
businesses and can transfer knowledge, personnel and training among different
businesses, thus creating its own labour market (Hall, 1995; Teece, 1982).
39
However, synergy creation programmes are risky and they might not always fulfil
expectations of management (Goold & Campbell, 1998; Haberberg & Rieple, 2001).
Synergy programmes in related businesses can drastically increase interdependence
among those businesses which might prove harmful if external business conditions
change and any of the businesses changes its business strategy or approach to market
(Hitt et al., 2011).
In relation to such scenario, there are firms who prefer to opt for unrelated
diversification strategy which although might not provide operative synergy benefits
but it gives them condition to reduce risk and provides them better flexibility to
exploit opportunities that exist in entirely different industries or sectors (Galván et al.,
2007; Grant et al., 2011)
2.3.1.2 Unrelated Diversification Strategy
2.3.1.2.1 Definition
Unrelated diversification strategy or conglomerate diversification is company’s
development of products beyond its existing strategic capability (Johnson et al., 2008;
Pearce II & Robinson Jr., 2011) and it results into new businesses which have no
relationship with existing or previous businesses (Grant et al., 2011; Thompson et al.,
2012). So, unrelated diversification takes an organisation away from its current
industries and business segments to entirely new ones.
40
2.3.1.2.2 Examples of Unrelated Diversification Strategy
Entry of IBM into water management business in 2009 and later, production of smart
phones by Dell Inc. are prominent examples of unrelated diversification strategy
(David, 2011). Similarly, Tata Group, Royal Philips, Hitachi and United Technologies
Corporation (UTC) represent examples of unrelatedly diversified organisations
(Harrison & John, 2010; Jones & Hill, 2010).
2.3.1.2.3 Reasons to pursue Unrelated Diversification Strategy
The literature on unrelated diversification strategy reveals that one of the primary
motives for using unrelated diversification strategy is to increase profitability and
reduce overall risk of a company (Grant et al., 2011; Michel & Shaked, 1984).
Unrelatedly diversified organisation reduces its overall risk by efficiently using its
capital to cross subsidize and manage various businesses with different risk profiles,
thus creating financial synergies (Berger & Ofek, 1995; Galván et al., 2007). This is
possible through efficient internal capital market the organisation governs, providing
itself advantages of financial economies (Hoskisson et al., 2009; Lim, Das, & Das,
2009).
Another form of financial economies available to unrelated diversifiers is through
business structuring (Bamford & West, 2010). According to this concept, an
organisation goes for unrelated diversification strategy when there are opportunities to
add value to undervalued businesses and the organisation uses its financial expertise
and strong corporate governance system to turn those businesses into profitable
41
entities for selling them at higher prices later on (Bamford & West, 2010; Johnson et
al., 2011).
2.3.2 Theoretical Background for Product Diversification Strategy
Previous scholars have been referring to different perspectives and theories on
benefits and drawbacks of product diversification, for instance; the transaction cost
economics and internal capital market efficiency (Bhide, 1993; Lins & Servaes, 1999;
Liu & Hsu, 2011; Williamson, 1971), market power view (George, 2007; Martin &
Eisenhardt, 2001), resource based view (Teece, 1982; Wernerfelt, 1984), and agency
theory (Aggarwal & Samwick, 2003; Amihud & Lev, 1981). While the first three
present product diversification as a useful strategy, the agency theory indicates a
negative influence of product diversification on performance. A general explanation
of each of these is presented in the following sections.
2.3.2.1 Transaction Cost Economics (TCE) and Internal Capital Market
TCE and concept of internal capital market provide powerful arguments for the drive
and benefits for product diversification strategy. TCE (Coase, 1937; Williamson,
1971) implies that managers have to choose between external markets and internal
organisational hierarchies for structuring and conducting business transactions and
they need to carefully compare the relative costs of conducting transactions inside the
organisation against those through external market (Liu & Hsu, 2011; Williamson,
1998). Providing the main idea of TCE, Coase (1937) argued that a firm would
continue diversification until a point was reached where the costs of conducing
42
additional transaction inside the firm were levelled to costs of conducting the same
transaction with outer market or they become equal to costs of conducting the same
transaction with another firm.
Under TCE assumptions, it could be argued that a diversified organisation might be
more efficient compared to a single segment firm and could make better investment
decisions because it has its own internal capital market (Berger & Ofek, 1995;
Kuppuswamy & Villalonga, 2010; Lins & Servaes, 1999) with the help of which, it
could make successful allocation of resources across different businesses to improve
its performance (Datta et al., 1991; Galván et al., 2007; Teece, 1982). Varanasi
(2005) added that diversification could lead to creation of interaction economies
through simultaneous supply of inputs and processes across different units.
Diversified organisation could also gain performance benefits by combining
businesses which have different flow of earnings (Berger & Ofek, 1995) or lowering
variation in year by year cash inflows (Bhide, 1993; Teece, 1982). Diversification
through backward and forward integration might lead to better performance through
savings in production and transaction costs because in industries where the
organisation is working might be engaged in customer-supplier relationships (Fukui &
Ushijima, 2006).
However, the benefits of TCE and internal capital market efficiency could be
conditional and might not apply to all multi-business organisations. In unrelatedly
diversified organisation, sharing of knowledge, implementing internal control
mechanisms and gaining cooperation among businesses could be difficult compared
43
to those following related diversification strategy and therefore, in unrelated ones,
governance costs and transaction costs could be greater (Abdullah, 2009; Busija,
O’Neill, & Zeithaml, 1997), which could erode internal market advantages. In related
diversifiers, excessive levels of diversification beyond optimal point could increase
the marginal cost of product diversification causing erosion of internal market
efficiency (Palich et al., 2000; Park, 2010).
Similarly, if an organisation has an inefficient internal capital market, its costs will
increase if changing industry conditions offer tremendous growth opportunities in one
segment and in that case it will be optimal for diversified organisations to refocus
(Campa & Kedia, 2002). Additionally, internal capital markets might also be
disadvantageous in related as well as unrelated diversifiers due to their slow reaction
time, high overhead costs, and continuous cross subsidization of badly performing
businesses (Berger & Ofek, 1995; Bhide, 1993).
Moreover, diversification benefits on the basis of TCE and internal capital market
efficiency are interpretable in light of different institutional contexts in various
countries as well as conditions in the external environment (Claessens et al., 1998;
Kuppuswamy & Villalonga, 2010). After the World War II, the pace of conglomerate
diversification increased because of the view that corporate headquarters were more
efficient in allocating resources and managing various strategic business units as
compared to external capital markets (Gupta et al., 2007; Nippa et al., 2011). But
diversification gave up its popularity during 1980’s and early 1990’s because of
development of external capital markets in developed economies, particularly in U.S.
(Bhide, 1993; Gupta et al., 2007).
44
In well developed economies, there are efficient product, labour, and capital markets
which provide incentives to organisations for external market transactions, and
therefore in developed economies, conglomerates might not be successful because
external market transaction costs are lower compared to internalization (Mishra &
Akbar, 2007a; Nippa et al., 2011). Therefore, organisations prefer external market
transactions in conditions when external markets perform well, because in that case
they might have lower transaction costs (Nippa et al., 2011; Williamson, 1971).
But, in developing countries, internal capital market could provide greater rewards as
external markets are not well developed (Fan, Huang, Oberholzer-Gee, Smith, &
Zhao, 2008) and in these conditions diversified group structure might be more
beneficial and diversification strategy (related or unrelated) might result in better
performance (Claessens et al., 1998; Mishra & Akbar, 2007a).
The arguments regarding TCE and internal capital market gained support during
2008-2009 crisis. For instance, in a research on American firms, Kuppuswamy and
Villalonga (2010) reported that value of conglomerate diversification increased during
the crisis due to ‘more-money’ and ‘smarter-money’ effect attached with internal
capital markets. Similarly, in a study of banking industry of nine countries, Elsas,
Hackethal, and Holzhäuser (2010) reported evidence against conglomerate discount
during sub-prime crisis starting in 2007. Hence, in agreement with Hall (1995) and
Park (2010), it could be added that diversification levels need to be managed carefully
keeping in view the external conditions and institutional context.
45
Summarizing the above discussion, it can be said that TCE and internal market
efficiency arguments provide support for the benefits of related and unrelated
diversification strategies in perspective of emerging economies such as Malaysia.
Thus, the perspectives laid by TCE and internal capital market have strong relevance
to this study as the present study has been conducted in Malaysian context where it
provided a test of TCE and internal market efficiency arguments.
2.3.2.2 Market Power View
Market power advantages could also provide strong motives to strategic decision
makers for pursuing product diversification strategy as highly diversified
organisations can enjoy their market power in several ways in contrast to focused
firms (Benito-Osorio et al., 2012; Park, 2010). For example, in contrast to a focused
firm, a diversified organisation with a variety of products and services possesses the
opportunity to cross-subsidize a weak product using profits attained from a strong
product, hence providing itself a better competitive advantage for the weak product
(Johnson et al., 2008; Lee, 2002; Palepu, 1985).
Further, a diversified organisation could use tactic of reciprocal buying and selling by
developing favourable reciprocal arrangements with organisations which are its
suppliers and customers at the same time (George, 2007; Palich et al., 2000). To
illustrate, an arrangement could be established where a company’s supplier could be
purchasing certain outputs from one of the business unit being acquired by the
company and this diversification would result into multiple relationships with other
46
organisations (buyers or suppliers) providing it greater market power and high
performance (George, 2007; Goddard, McKillop, & Wilson, 2008).
Moreover, diversified organisations might use income generated through one market
in another market for the purpose of predatory pricing i.e. price cutting (Goddard et
al., 2008; Klier, 2009). Using this, a diversified organisation could create entry
barriers for new entrants, and push existing rivals out of the market, thus bringing
itself a strong strategic position as well as safer business environment in concerned
industries (Palich et al., 2000; Saloner, 1985).
Another advantage of market power could be possible in form of ‘mutual
forbearance’, according to which multiproduct organisations would compete less
severely amongst themselves when they are competing in number of geographic
segments (Bernheim & Whinston, 1990; Martin & Eisenhardt, 2001). However,
according to Bernheim and Whinston (1990), this situation might also apply to single
product firms. Overall, the views expressed herein support the argument that related
or unrelated diversification strategy is beneficial for an organisation as it provides
increased market power.
2.3.2.3 Resource Based View (RBV)
The most commonly quoted view explaining motives and benefits of product
diversification strategy is the resource based view (Marinelli, 2011; Miller, 2006).
According to RBV (Teece, 1982; Wernerfelt, 1984) product diversification is guided
by resources and capabilities of an organisation. Therefore, the organisation
47
diversifies into similar or different industries if it possesses excessive resources and
capabilities that it could utilize profitably in those industries (Barney, 1991; Martin &
Sayrak, 2003; Wernerfelt, 1984). Related or unrelated diversification becomes more
rational in markets where sale of excess resources and capabilities outside the
organisation carries significant transaction costs and therefore diversification becomes
the best way to utilize them inside the organisation (Goddard et al., 2008; Teece,
1982).
Generally an organisation possesses different types of resources (tangible and
intangible) and capabilities and they could be used in different fashion (Fatima,
Rehman, & Ali, 2011; Gruber, Heinemann, Brettel, & Hungeling, 2010). For
example, in order to improve performance, an organisation could use excess cash for
lowering the prices, or buying competitors or suppliers/distributors, or it could exploit
other tangible resources such as using same distribution systems and foreign offices
for different businesses operating in different markets (Johnson, Scholes, &
Whittington, 2005; Tan, 2007).
The direction as well as level of diversification depends upon the package of its
available resources and competences, which determines its generalizability (Tallman
& Li, 1996; Yaghoubi et al., 2011). If the generalizability of those resources and
competences is greater, then level of diversification might as well be higher
(Silverman, 1999; Teece, 1982). For example, excess resources in form of special
knowledge drives an organisation towards related diversification strategy enabling it
to create economies of scope and improve performance (Montgomery, 1994; Palich et
al., 2000; Teece, 1982).
48
Related diversification is better in situations when organisation has excess resources
that could be used in related products and services or its technology permits
manufacturing of related outputs (Silverman, 1999; Tallman & Li, 1996). On the
other hand, organisation would prefer conglomerate diversification if excess
capabilities and resources are not potential enough for creating scope economies
among related operations, but are potential enough to create internal efficiencies
between unrelated businesses for managing performance (Ng, 2007; Tallman & Li,
1996).
In emerging economies, group affiliation provides opportunity to group affiliated
firms to share various resources such as cash, information and other tangible
resources for diversifying into related or unrelated areas and to build strong
competitive advantages in their respective markets (Carney, Gedajlovic, Heugens,
Essen, & Oosterhout, 2011; Zhao, 2010).
Over time, RBV has been enriched with new thoughts from different scholars. Barney
(1991) enriched the classical resource based view of the firm by incorporating idea of
sustained competitive advantage which implies that firm resources could provide the
firm long term competitive advantage if they (a) are valuable in terms of exploiting
opportunities and neutralizing threats in environment, (b) are rare among its potential
and current competitors (c) are not perfectly imitable and (d) do not possess close
substitutes.
In conclusion, it could be argued that pursuit of product diversification strategy is
mainly based on organisation’s strategic capability defined by combination of its
49
unique resources and core competences, and the direction of diversification (related or
unrelated) depends upon the nature of resources and competences it possesses. In
case, if the resources are related with one another, the motives and benefits available
to organisation would be in form of synergy effects or economies of scope through
related diversification. On the other hand, if the resources are not related, organisation
would then enjoy financial economies or other internal efficiencies through unrelated
diversification.
2.3.2.4 Agency Theory
Agency theory presents another perspective on diversification strategy (Montgomery,
1994; Zhao, 2010). Starting from Amihud and Lev’s (1981) main contributions, many
scholars consider agency problems as reasons for diversification discount (Afza et al.,
2008; George, 2007; Hoechle et al., 2012).
Agency theory is based on analysis of conflicts between principals and agents
(Jensen, 1986; Wu, 2012). The principal is one delegating the authority to the agent
(Eisenhardt, 1989; Lupia, 2001). The concept implies that risk aversive managers do
not pursue diversification for organisational betterment, rather than managers take
diversification decisions for reducing threat of professional reputation or job loss,
resulting in agency cost (Amihud & Lev, 1981; Hitt et al., 2011; Lane, Cannella Jr., &
Lubatkin, 1998) or possible diversification discount.
Further, managers might be desperate to implement diversification strategies (related
or unrelated) as it might provide them greater incentives, compensation and control
50
over resources as well as help them stabilize company earnings and reduce the
chances of bankruptcy for their own personal advantages (Aggarwal & Samwick,
2003; Jensen, 1986).
The agency cost is high when principal doesn’t share common interests with the agent
as well as he is unaware of the activities of the agent (Lupia, 2001; Nyberg, Fulmer,
Gerhart, & Carpenter, 2010). The agency cost could be reduced, however, through
alignment of managerial incentives or increase of monitoring and control by the
principals (Bryant & Davis, 2012; Nyberg et al., 2010).
In contrast to agency theory, stewardship theory proposes that managers do not
always act against the interests of organisation, rather certain managers acting as
stewards are socially driven and tend to increase organisation profitability through
better diversification decisions (Martinez-Campillo & Fernandez-Gago, 2008; Miller
& Sardais, 2011).
2.3.2.5 Conclusion
The above discussion of underpinning theories of diversification suggests that there
could be several motives, advantages or other repercussions of pursuing
diversification strategy. Diversifiers, in particular, related ones, might perform better
compared to single segment firms as they attain increased market power and resource
management benefits. In emerging economies, diversified organisations perform
better as they enjoy advantages of lower internal transaction costs and efficient
internal markets. As noted before, these benefits are not equally available to related
51
and unrelated diversifiers. For instance, the benefits discussed under RBV in terms of
synergy or economies of scope are only available to related diversifiers. This study
makes its contribution to these underpinning theories by investigating effect of
product diversification strategies on performance in context of emerging economy of
Malaysia. The theoretical implications of the study are elaborated in detail in Section
5.6.1 of Chapter 5.
2.3.3 Empirical Research on the Relationship between Product Diversification Strategy and Performance
2.3.3.1 Introduction and Background
Historically, product diversification – performance relationship has been subject of
research for numerous researchers belonging to strategic management, economics and
finance (Benito-Osorio et al., 2012; Mehmood & Hilman, 2013; Palich et al., 2000).
A number of attempts have been made to discover the mystery behind this
relationship but the relationship still remains a puzzle. Perhaps the interest of scholars
in product diversification effects on performance aroused in the course of
diversification trend that started in 1960’s and showed number of companies going
conglomerates, particularly in the U.S. The trend continued till 1970’s, but in 1980’s,
diversified companies began restructuring themselves by focusing on limited extent of
diversification (Goold & Luchs, 1993).
Porter (1987) analysed diversification record of several U.S. firms and found that
many of them pursued divestment during the 1950-1986 period. In U.S., many
unprofitable diversified businesses were converted into focused companies through
leveraged buyouts (Bruche, 2000). Fall of unrelated diversifiers in the period of
52
1980’s provides support to the proposition that diversification negatively impacted
corporate performance (Tan, 2007).
But, Dundas and Richardson (1982) found that certain conglomerates performed
successfully in that period and the defeat of unrelated diversification might be due to
strategy implementation problems. In the same way, Gottschalg and Meier (2005)
argued that Australia’s Wesfarmers and France’s Finalac were one of very successful
conglomerates in the world suggesting support for unrelated diversifiers. The
presence of successful conglomerates today such as General Electric (US), Bidvest
(South Africa), Wesfarmers (Australia) and ITC (India) doesn’t support generalization
of diversification discount on all unrelatedly diversified companies (Kenny, 2012).
2.3.3.2 Findings of Past Studies on the Relationship between Product Diversification Strategy and Performance
In empirical research on product diversification – performance relationship, past
studies have been focusing on; examining effect of product diversification on
performance, comparing related diversifiers with unrelated diversifiers, or comparing
focused companies with diversified companies on performance measures. By
carefully studying the literature on product diversification – performance relationship,
it can be inferred that throughout the history of research in this area, different studies
produced inconsistent findings on the topic and so far there is no consensus regarding
effect of diversification strategies on performance (Asrarhaghighi et al., 2013; Benito-
Osorio et al., 2012; Palich et al., 2000; Santalo & Becerra, 2004). The following
subsections present a critical analysis of findings of previous studies on the subject.
53
2.3.3.2.1 Product Diversification as Useful or Non-Useful Strategy
There are number of studies which suggested that product diversification was useful
strategy (Elsas et al., 2010; Kuppuswamy & Villalonga, 2010; Miller, 2006; Mishra &
Akbar, 2007a; Singh, Mathur, Gleason, & Etebari, 2001). Similarly, substantial
studies concluded that product diversification was an ineffective or non-useful
strategy (Daud et al., 2009; Fukui & Ushijima, 2006; Hoechle et al., 2012; Klein &
Saidenberg, 2010; Lins & Servaes, 2002). In each of the groups of studies (1. Group
of studies saying product diversification is useful and 2. Group of studies saying
product diversification is non-useful), the studies were heterogeneous with respect to
different aspects such as diversification measurement, performance indicators, time
periods, sample sizes, and contexts. In a way, this indicates robustness of results in
each group.
Firstly, in the group suggesting product diversification as useful strategy, researchers
relied on different types of diversification measurements, such as; entropy measure
(Singh et al., 2001), number of segments based on Standard Industrial Classification
codes (Kuppuswamy & Villalonga, 2010), diversification categories with respect to
Rumelt’s guidelines (Pandya & Rao, 1998), and diversification based on
technological relatedness (Miller, 2006).
Similarly, they used different types of performance indicators in their studies, for
instance; return on assets and return on equity (Singh et al., 2001), Tobin’s q (Miller,
2006), and combination of accounting and market measures like average market
return, average return on equity, and average return on assets (Pandya & Rao, 1998).
54
The studies were also different with respect to their sample sizes and time periods.
However, as indicated before, the conclusion of all these studies present support for
positive effect of product diversification strategy on performance, providing
robustness of the findings within the group.
The theoretical arguments in favour of product diversification presented by
underpinning theories of diversification such as market power view, resource based
view, transaction cost economies and internal capital market efficiency (presented in
previous sections) provide support for positive effect of diversification as revealed by
these studies. And, based on these studies’ results, it could be concluded that
diversified organisations perform better compared to focused ones as they enjoy the
benefits of lower internal transactions costs, efficient internal market, increased
market power and resource sharing.
In the same way, in the other group of studies concluding that product diversification
was not beneficial strategy, researchers used different ways for measuring product
diversification such as; number of businesses/product segments besides sales or asset
based Herfindahl Index (Berger & Ofek, 1995; Lang & Stulz, 1994), Input/Output
ratios and Herfindahl Index (Fukui & Ushijima, 2006), and number of segments in
North American Industry Classification System (Hoechle et al., 2012). Similarly, the
scholars used diverse performance indicators, for instance; Tobin’s q (Lang & Stulz,
1994), excess value (Hoechle et al., 2012; Lins & Servaes, 2002), or some
combination of accounting and market indicators (Daud et al., 2009; Fukui &
Ushijima, 2006).
55
Traditionally, research by Berger and Ofek (1995) employing a bigger sample of 3659
companies, as well as study by Lang and Stulz (1994) that covered the time period
from 1986 to 1991, supported negative effects of product diversification. Both of
these studies are well quoted in literature on product diversification – performance
relationship. Recent study by Hoechle et al. (2012) covering a longer time span
(1996-2005), and using greater than 4000 companies’ sample proved significant
diversification discount on excess value. The conclusion of all studies in this group
provides support for product diversification as ineffective strategy and the variation in
their research designs indicates robustness of these findings.
Thus, the overall conclusion of this group of studies does not support the arguments
laid by resource based view, transaction cost economies and internal capital market,
and market power view. The findings of this group actually point towards the
justifiability of agency theory which normally attaches a negative effect of
diversification on performance. In summarization, the research findings on the topic
are divided into separate groups with one group suggesting positive effects and the
other group suggesting negative effects of product diversification on performance.
Next few sub-sections discuss research findings which are even more different and
revealing.
2.3.3.2.2 The Insignificant Causal Link between Product Diversification Strategy and Performance
The review of past studies presented in the previous subsections reveals that some
studies either supported positive effects of product diversification strategy, while
other studies supported negative effects of product diversification strategy.
56
Interestingly, however, there had been certain studies that concluded that product
diversification did not significantly affect performance (Çolak, 2010; Marinelli, 2011;
Montgomery, 1985). In a more recent research, Marinelli (2011) suggested that
company performance (accounting or market based) was not dependent on product
diversification, rather it was related to factors other than internal capital market
efficiency and degree of relatedness among businesses.
His findings are consistent with Chang and Thomas (1989), Lloyd and Jahera Jr.
(1994), and Çolak (2010). Montgomery (1985) also found that product diversification
– performance relationship was not based on causality, and higher level of product
diversification would not lead to higher profits if one controlled for industry
concentration, industry profitability, and market share. Therefore, these studies do not
fully support arguments of TCE and market power view.
2.3.3.2.3 Curvilinear Relationship between Product Diversification Strategy and Performance
Furthermore, the literature review also depicts that numerous studies on this
relationship were designed upon assumption of linear relationship between product
diversification and performance (Park, 2010). Product diversification might increase
company performance to a certain extent, but later on excessive diversification might
actually produce inefficiencies causing performance to deteriorate (Galván et al.,
2007; Palich et al., 2000). Certain studies supported this proposition by establishing
that product diversification had curvilinear (inverted U-Shaped) effects on
performance (Galván et al., 2007; Kahloul & Hallara, 2010; Liu & Hsu, 2011; Menz
& Mattig, 2008).
57
In this regard, study by Palich et al. (2000) was important, as it assembled findings
from three decades of research. The study used meta-analytic data taken from fifty
five past studies to empirically test different models derived from the relevant
literature and concluded that moderate level of diversification led to greater
performance compared to either limited or broad diversification and therefore,
supported the curvilinear model. However, according to Park (2010), the inverted U-
Shaped hypothesis (Palich et al., 2000) looks ambiguous as it combines together the
effects of related and unrelated diversification strategies on performance, and a need
is there to test inverted U-shaped hypothesis separately for related as well as unrelated
diversification.
In conclusion, the suggested curvilinear effect of product diversification on
performance is comparatively a new finding. But it needs to be further tested in
context of underpinning theories by separating the effect of related diversification and
unrelated diversification. Only then, it would reveal the true nature of relationship
between diversification and performance.
2.3.3.2.4 Conclusion
While summarizing the discussion from Section 2.3.3.2.1 to Section 2.3.3.2.3, it could
be concluded that the results of research into product diversification – performance
relationship has been mixed. However, there were majority of past studies that
reported some sort of product diversification effects on performance as compared to
studies suggesting no effect. Further, there were more studies reporting linear
relationship between product diversification strategy and performance as compared to

58
studies suggesting curvilinear relationship between the two. Therefore, on this basis,
following hypothesis can be developed:
H1: Extent of Product Diversification Strategy significantly affects Corporate
Performance.
As discussed in Section 2.5 and Section 3.3 of this thesis, this study secured
subjective assessment of corporate performance as well along with measuring it
objectively through financial indicators. Hence, hypothesis H1 above is decomposed
further into two hypotheses below:
H1a: Extent of Product Diversification Strategy significantly affects Financial
Corporate Performance.
H1b: Extent of Product Diversification Strategy significantly affects Subjective
Corporate Performance.
In this study, Financial Corporate Performance is measured through return on assets
(ROA), return on equity (ROE), Tobin’s q, and price to book value ratio (P/B Value).
As the four financial measures/ratios cannot be averaged, therefore all hypotheses in
this study concerning Financial Corporate Performance are decomposed into four sub
hypotheses for the four ratios. They are stated in Table 3.1 of this thesis.
59
2.3.3.3 Inconsistency in the Past Findings and the Design of Past Studies
The critical review of studies examining product diversification – performance
relationship provides idea about complexity of this relationship as it reveals
inconsistencies in the findings. Number of reasons may account for unresolved
mystery in this relationship.
2.3.3.3.1 Diversification Measures used by Past Studies in Product Diversification – Performance Research
One of the key considerations in past research over this area has been the
measurement of diversification strategy, and the operationalization of this strategy has
been under debate over long time (Markides & Williamson, 1994; Montgomery,
1982; Nayyar, 1992; Pehrsson, 2006). Approaches to measure product diversification
range from categorical to continuous measures or a combination of the two
(Asrarhaghighi et al., 2013; Klier, 2009).
Some scholars have been measuring product diversification through Rumelt’s
approach (Busija et al., 1997; Dubofsky & Varadarajan, 1987; Ibrahim & Kaka, 2007;
Tan, Chang, & Lee, 2007), or Herfindahl Index (Çolak, 2010; Lang & Stulz, 1994;
Schmid & Walter, 2008), or Jacquemin and Berry’s (1979) Entropy measure (David
et al., 2010; Martínez-Campillo & Fernández-Gago, 2008; Ravichandran et al., 2009;
Santalo & Becerra, 2004), while others used simple count of business segments
(Çolak, 2010; George, 2007; Lang & Stulz, 1994). Every measurement technique
possesses its own characteristics and so far there is no one best measure of product
60
diversification. The inconsistency in the findings of different researches can partly be
attributed to different ways of measuring diversification.
2.3.3.3.2 Performance Measures used by Past Studies in Product Diversification – Performance Research
Similarly, different studies on the relationship used diverse measures of performance
which provided different results (Capar, 2003). Past studies have been using either
accounting based measures, or market based measures (Datta et al., 1991) or some
combination of accounting and market based measures in their research on the topic.
The discrepancies among performance measures in product diversification –
performance research also led to differing conclusions among those researches. A
critical review of performance approaches used by past studies is presented in Section
2.5.2 of this thesis.
2.3.3.3.3 Contextual Differences among Past Studies on Product Diversification – Performance Research
Most of the studies concerning the effect of product diversification on performance
were conducted in the context of United States, to a lesser extent United Kingdom
(Afza et al., 2008; Mehmood & Hilman, 2013; Tan, 2007), and much less in Asian
countries. Further, studies conducted in Asian economies produced mixed findings.
Study by Chakrabarti et al. (2007) involving six East Asian countries confirmed that
product diversification negatively impacted performance in more developed countries,
while it increased performance of only those companies working in least developed
countries. Internal capital market propositions and transaction cost theory provide
rationalization for this phenomenon (Fan et al., 2008; Tan, 2007).
61
However, Daud et al. (2009), while relying on sample of seventy companies in
Malaysia for the period 2001 – 2005, found that although different measures of
performance produced different results but particularly focused firms performed
better as compared to diversified firms. Afza et al. (2008) conducted study of
Pakistani organisations concerning product diversification and performance
relationship and the results were consistent with Daud et al. (2009). A study of largest
Japanese manufacturers (Fukui & Ushijima, 2006) and another study by Lins and
Servaes (2002) about organisations in seven Asian countries found that product
diversification was negatively related with performance. Curvilinear relationship
between product diversification and performance was found by Liu and Hsu (2011) in
a study of Taiwanese organisations.
On the other hand, study of Indian firms by Mishra and Akbar (2007a) revealed that
product diversification proved as valuable strategy but the benefits of diversification
were applicable largely to related diversifiers, supporting resource based view and
transaction cost economics. Study of Kuppuswamy and Villalonga (2010) provided
test of product diversification against internal capital market efficiency hypothesis
with reference to financial crisis of 2007-09, and concluded that unrelated product
diversification seemed beneficial for firms in 2007-09 financial crisis because during
the crisis, external capital markets became more expensive and access of diversified
organisations to internal capital market turned more rewarding. Additionally,
according to Kuppuswamy and Villalonga (2010), the diversification proved
beneficial as it provided debt co-insurance to diversified firms.
62
From this analysis, it could be concluded that even within Asian context, where the
capital markets are not well developed compared to those in advanced economies, the
findings of studies regarding product diversification effects on performance could not
be generalized over all Asian countries. Perhaps, the differences among the findings
could be attributed to other design characteristics.
2.3.3.3.4 Moderating Variables used by Past Studies in Product Diversification – Performance Research
As argued before, diversification is a complex construct and there appears to be no
simple relationship between product diversification and performance. The
inconsistency among the findings on product diversification – performance
relationship might be attributed to certain unknown variables in the relationship as
certain contingency variables might play their role in the relationship (Datta et al.,
1991; Mehmood & Hilman, 2013; Ravichandran et al., 2009). Martínez-Campillo and
Fernández-Gago (2008) suggested that for getting better insight into this relationship,
scholars must place necessary moderating variables in it.
In following the recommendations of these researchers, some past scholars used
certain moderating variables such as; market structure (Christensen & Montgomery,
1981), behavioural style of Chief Executive Officer in the company (Martínez-
Campillo & Fernández-Gago, 2008), organisational arrangements & control systems
(Hill et al., 1992), type of ownership (David et al., 2010), number of specialists in an
industry (Santalo & Becerra, 2004), spending on information technology
(Ravichandran et al., 2009), organisational structure (Markides & Williamson, 1996),
63
and business units’ relatedness (Galván et al., 2007) in their research on studying this
relationship.
Inclusion of those moderating variables enriched the understanding of this
relationship in different perspectives. For example, in 2010, study by David et al.
revealed that this relationship varied with respect to type of ownership – transactional
ownership and relational ownership. Specifically, the study revealed that transactional
ownership caused product diversification to affect profitability more positively and
relational ownership caused product diversification to affect growth more positively.
Another study by Martínez-Campillo and Fernández-Gago (2008) concluded that
performance of product diversification depended on behavioural style of CEO’s. They
report that CEOs tend to maximize profitability when they act as stewards in contrast
to when they act as agents in which case the profitability reduces. Santalo and Becerra
(2004) reported that product diversification – performance relationship seemed to be
based on number of specialist firms in an industry, wherein, the strategy led to good
performance only in industries where the number of specialist firms was less than
four.
2.3.3.4 Conclusion
From the above discussion, it could be concluded that relationship between product
diversification and performance could better be explored through adding certain
contingency variables or moderating variables into it. Although the incorporation of
certain moderators in the relationship by past studies provided us good insight into the
64
topic, yet the area doesn’t seem to be mature as certain variables of extreme strategic
importance remain untested. Hill et al. (1992) pointed out that success of product
diversification depended greatly on implementation issues. They add that product
diversification could not produce superior performance unless it is supported by
appropriate internal organisational arrangements.
In the same way, Goold and Campbell (1991) suggested that parenting influence or
parenting advantage was most important issue in corporate strategy. This study builds
its rationale by bringing diversification strategies and corporate parenting influence
(through corporate parenting roles) together in one research design as suggested by
previous scholars (Campbell et al., 1995a; Nippa et al., 2011).
2.3.4 Related Diversification Strategy versus Unrelated Diversification Strategy
2.3.4.1 Introduction and Background
Much like the mystery regarding product diversification effects on performance, the
ambiguity concerning superiority of related or unrelated diversification strategy
stands unresolved (Abdullah, 2009; Gary, 2005; Lahovnik, 2011; Mehmood &
Hilman, 2013). In 1974, Rumelt pioneered the study of comparing related
diversification with unrelated diversification strategy. He reported that related
diversification caused better performance compared to unrelated diversification. Later
on, these results were reconfirmed by Rumelt in 1982 and also by Christensen and
Montgomery in 1981. Afterwards, Michel and Shaked (1984) found opposite results
that unrelated diversification outperformed related diversification on market measures
of performance. Following this stream of research, numerous attempts have been
65
made to compare performance differences among related diversifiers and unrelated
diversifiers.
2.3.4.2 Studies Reporting Related Diversification Strategy Dominated Unrelated Diversification Strategy
There are number of researchers which concluded that related diversifiers
outperformed unrelated diversifiers (Galván et al., 2007; Markides & Williamson,
1996; Mishra & Akbar, 2007a; Rumelt, 1974, 1982). A deep analysis of these studies
reveals that they were diverse in terms of their design, methodologies, and contexts.
For instance, there is heterogeneity among these studies with respect to use of
performance indicators where some studies used accounting measures, others used
market measures, or a combination of those measures. This implies that related
diversifiers outperformed unrelated diversifiers on different measures of performance.
Use of multiple performance indicators in one study also led to differing conclusions
(Christensen & Montgomery, 1981; Varadarajan & Ramanujam, 1987). For example,
research of Varadarajan and Ramanujam (1987) employing return on equity (ROE),
return on capital (ROC), sales growth rate, and earnings per share growth rate as
performance indicators, revealed that although related diversifiers performed better as
compared to unrelated ones, but many unrelated businesses performed better than
related ones on ROC. Conclusions like this support inclusion of more than one
performance indicators for future researches to gain deeper understanding of the
phenomena.
66
Studies supporting superiority of related diversification strategy over unrelated
diversification strategy have also been heterogeneous with respect to context, time
frame and sample sizes. Concerning sample size, Berger and Ofek (1995) conducted
rich research by taking sample of 3659 firms including single segment and multi
segment firms, whereas Palepu’s study (1985) relied on sample of only 30 firms.
Palepu (1985) also took sample from food industry, whereas, on the other hand,
Varadarajan and Ramanujam (1987) did their research on firms belonging to different
sectors.
These studies were also heterogeneous with respect to measurement of diversification
strategy. Studies using simple categorical measures (Berger & Ofek, 1995; Mishra &
Akbar, 2007a) produced relatively straightforward conclusions, whereas studies
relying on diversification scheme of Rumelt (1974) produced mixed conclusions. This
was because Rumelt specified ten categories of product diversification on the basis of
four broad diversification categories; single business, dominant business, related
business and unrelated business (Klier, 2009).
Hence, studies relying on diversification schemes of Rumelt (1974) had to interpret
their findings with respect to multiple categories of product diversification. For
instance, Christensen and Montgomery (1981) revealed that unrelated diversifiers
were less successful as compared to related constrained diversifiers, and dominant
constrained diversifiers performed better on certain accounting indicators of
performance.
67
2.3.4.3 Studies Reporting Unrelated Diversification Strategy Dominated Related Diversification Strategy
In the same stream of research, comparing related versus unrelated diversification
strategy, there are sizable studies revealing that unrelated diversifiers perform better
as compared to related diversifiers (Dubofsky & Varadarajan, 1987; Lahovnik, 2011;
Marinelli, 2011; Michel & Shaked, 1984). As discussed before, findings of Michel
and Shaked (1984) – that unrelated diversification performed better than related
diversification – were in opposite to Rumelt (1974, 1982). Later, the results of Michel
and Shaked (1984) were confirmed by Dubofsky and Varadarajan (1987). Their
research was based on same sample used by Michel and Shaked (1984). However,
they introduced return on assets as another measure in the analysis but the results
were not statistically significant on that measure.
Lahovnik (2011) conducted his study in Slovenia and used four indicators of
corporate performance (return on assets, return on equity, return on sales, and value
added per employee). He concluded that unrelated diversification strategy performed
better than related diversification strategy on return on sales and results were opposite
on other three indicators of performance. Marinelli (2011) concluded that there was
no significant effect of product diversification on performance, and a comparison of
diversified firms revealed that unrelated diversifiers performed well in comparison to
related diversifiers. These studies (which supported superiority of unrelated
diversification over related diversification) were also heterogeneous with respect to
diversification measures and other design considerations such as performance
indicators, thus, providing robustness of results in their findings.

68
2.3.4.4 Conclusion
On the basis of the discussion made on product diversification strategies so far, it
could be argued that apparently there is an ambiguity regarding the effect of these
strategies on corporate performance. The ambiguity surrounds the argument that
whether related and unrelated diversification strategies impact performance positively
or negatively. However, the overall discussion suggests that there appears to be
certain kind of effect of diversification strategies on performance. Therefore,
following four hypotheses are proposed for two strategies and for each of the two
aspects of corporate performance:
H1ai: Extent of Related Diversification Strategy significantly affects Financial
Corporate Performance.
H1bi: Extent of Related Diversification Strategy significantly affects Subjective
Corporate Performance.
H1aii: Extent of Unrelated Diversification Strategy significantly affects Financial
Corporate Performance.
H1bii: Extent of Unrelated Diversification Strategy significantly affects Subjective
Corporate Performance.
Regarding the comparison between related diversification strategy and unrelated
diversification strategy, there is no strong consensus about the relative superiority of
either strategy over the other. Summarizing the discussion again, certain studies
suggested related diversification as better strategy than unrelated diversification,
69
while other studies suggested unrelated diversification as better strategy than related
diversification.
Thus, the following hypotheses are developed to reveal performance difference
among two groups of strategies:
H3a: A significant difference exists between Predominantly Related Diversifiers and
Predominantly Unrelated Diversifiers on Financial measures of Corporate
Performance.
H3b: A significant difference exists between Predominantly Related Diversifiers and
Predominantly Unrelated Diversifiers on Subjective Assessment of Corporate
Performance.
2.3.4.5 Moderating Variables used by Past Studies in Related/Unrelated Diversification Strategies – Performance Relationship
The above analysis reveals that although research efforts regarding relative effects of
related and unrelated diversification strategy on performance increased our general
understanding on the topic, but the conclusions were mixed. This suggests that
diversification strategies – performance relationship is not simple rather it is
contingent on certain other variables. In making improvements on this aspect, past
studies used certain moderating variables in the relationships between diversification
strategies and performance (Christensen & Montgomery, 1981, Hill et al., 1992;
Markides & Williamson, 1996; Ravichandran et al., 2009).
70
For instance, Christensen and Montgomery (1981) improved on the general
conclusion presented by Rumelt (1974) by stating that market structure and
characteristics played moderating role in product diversification – performance
relationship. Markides and Williamson (1996) found that relationship between related
diversification and performance was, in a way, dependent upon organisational
structures that could allow sharing and transfer of strategic assets and competences
across divisions.
In the same line, another study by Hill et al. (1992) revealed that related diversifiers
performed well if their organisational structure and control systems were designed to
facilitate cooperation, whereas, unrelated diversifiers could perform well if the
structure and control systems were designed to facilitate competition. A study by
Ravichandran et al. (2009) on the moderating effect of Information Technology
spending on related/unrelated diversification strategies and performance relationship
revealed that Information Technology spending moderated the relationship between
related diversification and firm performance.
2.3.4.6 Conclusion
On the basis of above discussion it can be concluded that better insights could be
gained by incorporating important moderating variables such as corporate parenting
roles between types of diversification strategies on one hand and corporate
performance on the other hand. Section 2.4.4 includes explanation on three corporate
parenting roles; portfolio manager, synergy manager and parental developer suggested
by Johnson et al. (2005, 2008, 2011), and Section 3.3 includes detailed listing of
71
hypotheses of the study. The hypotheses state in detail about what corporate parenting
role was supposed to be a moderator for which type of diversification strategy.
However a general hypothesis regarding the moderating effect of corporate parenting
roles for diversification strategies is formulated as below:
H2: Corporate Parenting Roles positively moderate relationship between Product
Diversification Strategies and Corporate Performance.
2.4 Corporate Parenting
This section starts by introducing the basic concept of corporate parenting. Then it
explains importance and ways of value addition by corporate parents along with
conditions in which corporate parents destroy value. After that, the section proceeds
towards explaining three corporate parenting roles and the past research conducted on
the topic of corporate parenting. Lastly, theoretical background for corporate
parenting is discussed in relation to dynamic capabilities perspective, and the
connection between corporate parenting roles and diversification strategy is discussed
using contingency theory.
2.4.1 Introduction
Corporate strategy determines and influences a company’s business portfolio and it is
about how corporate managers control different businesses (Porter, 1987). According
to Collis (1996), a company’s corporate strategy can be represented by a triangle in
which organisation’s vision, goals and objectives are surrounded by the three sides of
72
the triangle: resources, businesses and structure, systems and processes. He adds that
in an effective corporate strategy, corporate parents create value by providing
corporate level resources and capabilities to different businesses either by providing
them through structures, systems or processes or by making businesses share different
resources and activities between them.
In different organisations, corporate strategy could be well defined or ill defined.
According to Goold and Campbell (1994) and Porter (1987), few companies have a
clear corporate level strategy and corporate parents know what elements constitute a
corporate level strategy, but in others, parents are confused about the domain and
issues of corporate level strategy. Management buyouts and the failure of most of the
acquisitions in the past could be considered as evidences of weak corporate level
strategy (Goold & Campbell, 1991; Goold, Campbell, & Alexander, 1994a).
Structurally, a company’s corporate level is separate from its business level and it is
supposed to perform those activities that could facilitate overall value creation in a
diversified firm (Menz & Mattig, 2008; Mishra & Akbar, 2007b). Corporate parent
may be conceived as management level(s) above to the level of businesses where
corporate parent managers control and coordinate business level activities and provide
different types of services (Johnson et al., 2005, 2008; Mishra & Akbar, 2007b).
Because a company’s corporate level mostly has no external customers, but surely has
a cost, therefore, it should justify its presence through value addition to businesses
(Abdullah & Mehmood, 2013; Goold et al., 1998).
73
In an ideal situation, a parent might respond timely to the needs of a business by
providing the necessary resources and advice the businesses require (Sekulić, 2009).
Mere the existence of corporate parent might not ensure value creation, rather
corporate parents have to pass particular criteria for adding value into the businesses
(Campbell & Goold, 1988; Kruehler et al., 2012). In the next section, corporate parent
criteria for value addition are discussed along with different ways of value addition.
Another section looks at the other side of parenting – value destruction – and talks
about conditions in which corporate parents destroy value.
2.4.2 Value Addition by Corporate Parents
As already discussed, businesses in a corporate portfolio do not have choice of having
or not having corporate parent (Johnson et al., 2005, 2008). Therefore, satisfaction of
business unit managers regarding corporate parent activities may vary from one to
another organisation. Business unit managers usually have objections regarding the
costs of corporate parents and their intervention in the business unit affairs (Campbell
& Goold, 1988). Therefore, in order to justify the existence of corporate parents, their
value creation in businesses is very important (Alexander, Campbell, & Goold, 1994;
Kruehler et al., 2012). Corporate parents must strictly evaluate their performance and
existence on the criteria of value creation as it is considered as a fundamental question
in corporate strategy (Campbell & Goold, 1988; Goold & Campbell, 1994).
Many businesses in a diversified group might be better off as independent companies,
therefore, in order to justify existence of top level, corporate parent managers must
control those businesses to perform better as compared to they would perform as
74
independent businesses (Campbell, 2007; Sekulić, 2009). Corporate parents compete
against one another for the ownership of businesses and therefore, the mission of
corporate strategy at the group level is to add more value to the businesses compared
to the value potential rival parents would add to them (Campbell, 2007; Pearce II &
Robinson Jr., 2007). This implies that corporate parents must strive to be the best
owners of their business portfolio. This ambition of the corporate parents has been
called as quest for parenting advantage (Alexander et al., 1994; Campbell, Goold, &
Alexander, 1995b).
2.4.2.1 Corporate Parents’ Understanding of Businesses
In order to add best value to the businesses, corporate parents must develop sufficient
feel for their businesses (fit between businesses’ critical success factors and corporate
parent’s skills, resources and competences) and there must be a good fit between
corporate parent’s characteristics and the parenting opportunities offered by different
businesses (Alexander et al., 1994; Johnson et al., 2008). Corporate parents must
continuously evaluate the fit between these dimensions.
Particularly, corporate parents must be constantly observing needs of businesses in the
group, and developing the required competences, skills and resources as the
businesses demand, and instead they should avoid developing general management
practices (Campbell, 2007). This is strategically important because as the external
environment will change, businesses might need to change their strategic capability
and competitive advantage amidst requiring corporate parent managers to reconfigure
75
the set of resources and capabilities they possess (Abdullah & Mehmood, 2013;
Sekulić, 2009).
When the corporate parents are successful in reconfiguring their resources, skills and
competences, a corporate strategy, then evolves which correctly guides corporate
parents regarding the nature and direction of product diversification strategy given the
portfolio of businesses (Alexander et al., 1994; Kruehler et al., 2012). Hence, it can
be concluded that the extent of product diversification strategy must be based on
corporate parenting skills and their match with the requirements of the businesses
(Campbell, 2007).
2.4.2.2 Ways to Add Value
Corporate parents can create value for their businesses in several different ways.
Historically, Reinton and Foote (1988) argued that corporate managers could create
value in their businesses by using their experience and analytical skills to develop a
strong business strategy, pushing managers for putting more efforts, improving
management by careful appointment of key managers in corporate and business
levels, transferring skills across businesses and creating synergies, and by redefining
business units if the conditions call for it.
According to Johnson et al. (2008), value can be added through several ways such as:
by providing a common vision and purpose to the businesses which also clarifies
company intent and status to external stakeholders and restricts corporate parents
from going into unnecessary activities, by enabling business units to develop strategic
76
capabilities and creating synergies between them through coaching and facilitation,
through provision of central resources and services such as investment, human
resource advice and brokerage, by intervening in the business units for monitoring
and improving their performance when the situations demand. At times, corporate
parents can add value through business transformation where they can manage
business change process successfully (Goold & Campbell, 1994; Porter, 1987). But all
these conditions require corporate parents to meet the criteria of sufficient feel and fit
between their competences and business needs.
Goold and Campbell (1994) argued that in order to add value, corporate parents must
have a ‘parenting map’ which is developed through the information managers receive
about the businesses as well as through their personal experiences and observations
about the businesses. They add that parenting map enables parents to understand the
businesses well. It informs parents about important business aspects such as critical
success factors and risks faced by businesses and suitable performance targets for
each business. Further, they argue that diversification decisions must be taken on the
basis of parenting maps and diversification should be done in areas (related or
unrelated) where parenting maps could be used in all the businesses.
2.4.2.3 Management of Value Creation
Management of value creation can be simple or complex depending upon the
organisation structure. In a complex organisational structure, where there is a lot of
interdependency between various businesses, value creation by corporate parents
would become more challenging and important because there might be overlap and
77
sharing of responsibilities between business unit managers and corporate managers
(Goold & Campbell, 2002). Similarly, corporate parents must be cautious about
creating value in mature businesses as they might represent particular pitfalls and
opportunities (Goold, 1996).
Value creation by the corporate parents also requires trade-offs between significant
management issues like centralized leadership and autonomy of business units, long-
term strategic objectives and short-term financial goals, flexible strategies and tight
controls (Campbell & Goold, 1988). A wise choice among these alternatives may
ensure peaceful corporate culture.
Summarizing the discussion presented in this section, it can be said that existence of
corporate parent in every diversified organisation is a matter of opportunities and
pitfalls for various businesses in the group. In ideal situation, corporate parents
understand the conditions of businesses and their characteristics match the parenting
opportunities offered by those businesses, hence fulfilling the criteria of value
addition. However, value addition by the corporate parents might be done in different
ways depending upon the conditions faced by businesses.
2.4.3 Value Destruction by Corporate Parents
In the previous section, it has been argued that value creation is the underlying logic
of corporate parents and it is important for corporate level managers to have a
sufficient feel for their businesses and develop corporate level competences that could
be used to exploit parenting opportunities in different businesses. If however, parents
78
don’t have sufficient feel for the businesses, they might instead, destroy value
(Alexander et al., 1994; Sekulić, 2009). Similarly, product diversification strategies
might fail if the parents do not assess properly that how their skills would match the
nature of new businesses they are going to invest in (Goold et al., 1998; Kruehler et
al., 2012).
Failure of corporate parents in understanding the businesses and mismatch of
corporate level competences with the needs of businesses might lead to number of
ways through which the value could be destroyed (Collis, Young, & Goold, 2007;
Goold et al., 1998). To illustrate, corporate parents might focus on wrong strategic
issues, set inappropriate performance measurement methods, make wrong manager
appointments and might develop unrealistic expectations from business unit managers
for performance management and about synergy creation between businesses
(Abdullah & Mehmood, 2013; Alexander et al., 1994). According to Johnson et al.
(2008), corporate parents could destroy value by adding management costs (through
adding expensive staff and facilities), creating ‘bureaucratic fog’, and by providing a
parental ‘safety net’ to poor performing businesses by cross subsidizing them through
hard earned revenues of good performing businesses.
The real challenge for corporate level managers is to understand the conditions of a
business better as compared to business unit managers who are much more involved
with the business. Without doubts, business unit managers may be assumed to be
more knowledgeable about a business as compared to corporate parents regarding a
business’s capabilities, competitors, markets, customers and overall external
environment. In that condition it is challenging for corporate managers to excel
79
business managers in the knowledge about businesses. This phenomenon is referred to
as 10% versus 100% paradox (Goold et al., 1994a). It means that how can a chief
executive, who is using only 10% of his time in thinking about business strategies of a
business unit develop better insight about that business compared to its business unit
managers who are sparing 100% of their time to that business.
In their research, Goold and Campbell (1994) have found many cases of value
destroying parenting. It might be attributed to the reasons discussed before. Hence,
the focus of group level corporate parents must be as much as on minimizing value
destruction as it is on maximizing value addition (Campbell, 2007; Goold et al.,
1994a).
2.4.4 Corporate Parenting Roles
The criteria and conditions in which corporate parents create value in businesses have
been discussed in the previous sections. Though limited in number, but different
scholars in the past have provided their categorization of corporate parenting roles or
styles. In his classical article “From Competitive Advantage to Corporate Strategy”,
Porter (1987) argued that corporate strategy concepts or corporate parenting roles
could be categorized in four categories: portfolio management, restructuring,
transferring skills and sharing activities.
The first two roles were identical in the sense that they created shareholder value
through company’s relationship with autonomous business units. The other two roles
were concerned with value creation through sharing and transferring of skills and

80
other resources between businesses for creating synergies. Later, Reinton and Foote
(1988) presented three corporate parenting roles: controller, coach, and orchestrator.
According to them, corporate parents could also play other roles such as ‘surgeon’ or
‘architect’, when any business required transformation.
Goold and Campbell (1987) presented three corporate parenting styles: Strategic
Planning, Financial Control and Strategic Control. According to Goold et al. (1993a),
strategic planning style characterises long-term strategic orientation, corporate
managers are deeply involved in setting strategic priorities and formulating business
level strategies, budgets and targets are flexible and address strategic as well as
financial performance. In financial control style, corporate managers delegate
business strategy formulation to business unit managers, rely on tighter controls and
short-term criteria of achieving financial goals, and usually the businesses are
working in relatively stable business environments (Goold et al., 1993a).
Lastly, strategic control style seems like a combination of previous two styles.
Strategic control style is characterized by decentralized profit centres, divisional
coordination and higher business unit autonomy. Strategic control companies
maintain tight financial controls but they are also involved in business level planning
where they can review and challenge business unit strategies (Goold et al., 1993a,
1993b). Different categorizations of corporate parenting roles or styles provide an
idea about different ways corporate parents could add value to their businesses.
Corporate parents must however rely on any one dominant role for value addition for
a group of businesses, as different roles might have unique and conflicting
requirements (Johnson et al., 2008; Reinton & Foote, 1988).
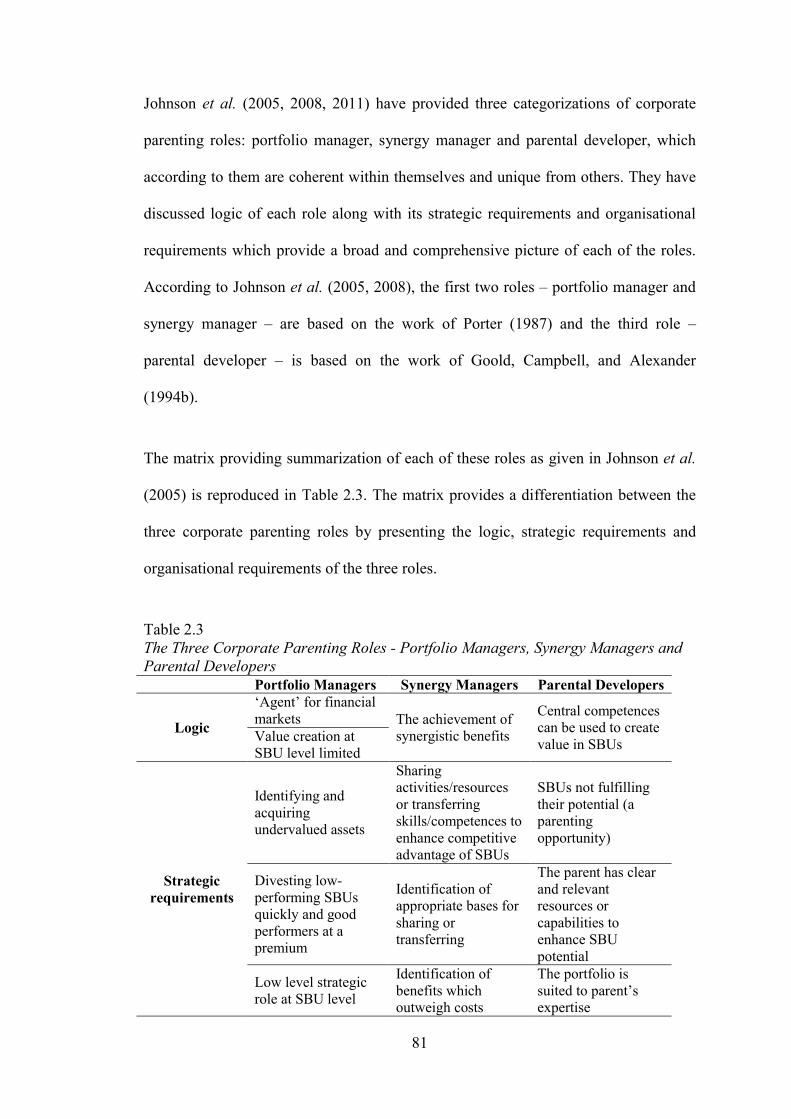
81
Johnson et al. (2005, 2008, 2011) have provided three categorizations of corporate
parenting roles: portfolio manager, synergy manager and parental developer, which
according to them are coherent within themselves and unique from others. They have
discussed logic of each role along with its strategic requirements and organisational
requirements which provide a broad and comprehensive picture of each of the roles.
According to Johnson et al. (2005, 2008), the first two roles – portfolio manager and
synergy manager – are based on the work of Porter (1987) and the third role –
parental developer – is based on the work of Goold, Campbell, and Alexander
(1994b).
The matrix providing summarization of each of these roles as given in Johnson et al.
(2005) is reproduced in Table 2.3. The matrix provides a differentiation between the
three corporate parenting roles by presenting the logic, strategic requirements and
organisational requirements of the three roles.
Table 2.3 The Three Corporate Parenting Roles - Portfolio Managers, Synergy Managers and Parental Developers
Portfolio Managers Synergy Managers Parental Developers
Logic
‘Agent’ for financial markets The achievement of
synergistic benefits
Central competences can be used to create value in SBUs
Value creation at SBU level limited
Strategic requirements
Identifying and acquiring undervalued assets
Sharing activities/resources or transferring skills/competences to enhance competitive advantage of SBUs
SBUs not fulfilling their potential (a parenting opportunity)
Divesting low-performing SBUs quickly and good performers at a premium
Identification of appropriate bases for sharing or transferring
The parent has clear and relevant resources or capabilities to enhance SBU potential
Low level strategic role at SBU level
Identification of benefits which outweigh costs
The portfolio is suited to parent’s expertise
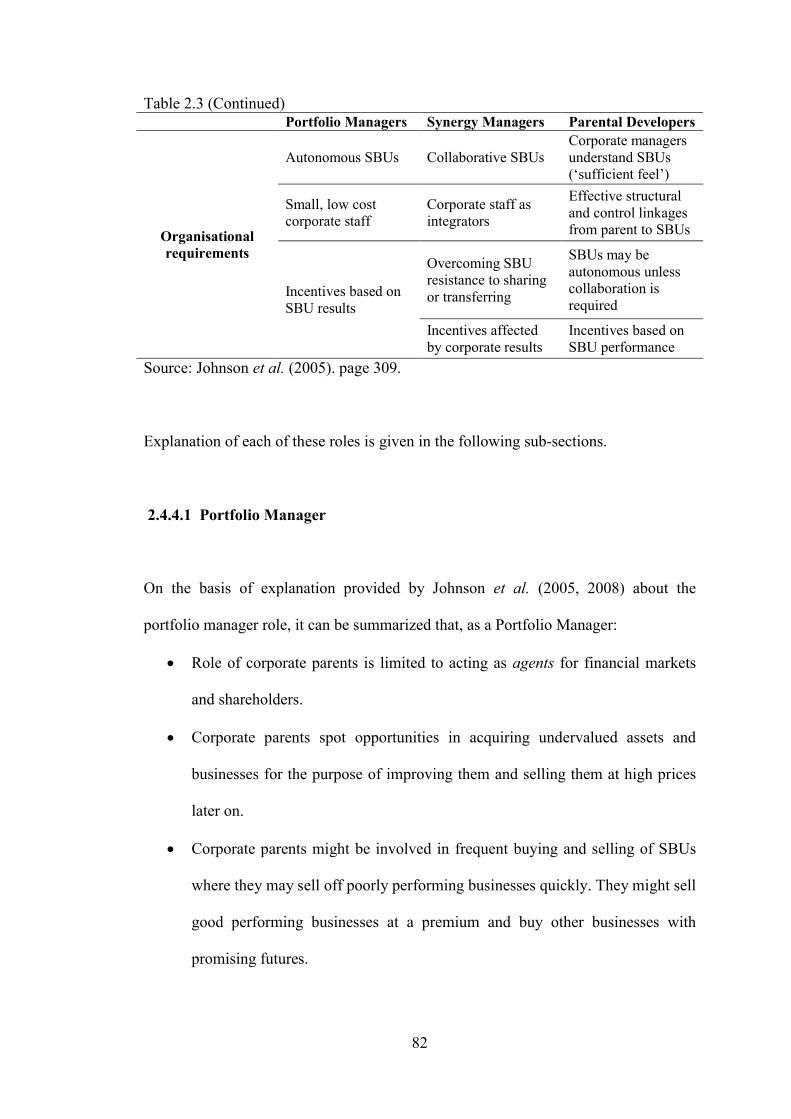
82
Table 2.3 (Continued)
Portfolio Managers Synergy Managers Parental Developers
Organisational requirements
Autonomous SBUs Collaborative SBUs Corporate managers understand SBUs (‘sufficient feel’)
Small, low cost corporate staff
Corporate staff as integrators
Effective structural and control linkages from parent to SBUs
Incentives based on SBU results
Overcoming SBU resistance to sharing or transferring
SBUs may be autonomous unless collaboration is required
Incentives affected by corporate results
Incentives based on SBU performance
Source: Johnson et al. (2005). page 309.
Explanation of each of these roles is given in the following sub-sections.
2.4.4.1 Portfolio Manager
On the basis of explanation provided by Johnson et al. (2005, 2008) about the
portfolio manager role, it can be summarized that, as a Portfolio Manager:
Role of corporate parents is limited to acting as agents for financial markets
and shareholders.
Corporate parents spot opportunities in acquiring undervalued assets and
businesses for the purpose of improving them and selling them at high prices
later on.
Corporate parents might be involved in frequent buying and selling of SBUs
where they may sell off poorly performing businesses quickly. They might sell
good performing businesses at a premium and buy other businesses with
promising futures.
83
Corporate parents do not involve themselves in the business level affairs of
various businesses and there is limited value creation at the business unit level
through corporate level resources and competences. Hence, corporate parents
rely on a decentralized organisation structure where all SBUs are autonomous.
There are, however strict evaluation criteria for business unit managers and
CEOs which promises them rewards on the basis of business unit performance
only.
As a portfolio manager, corporate managers can manage more number of
businesses and can afford to keep small size corporate staff with low cost.
Due to its inherent nature, portfolio manager role might be suitable for
conglomerates or unrelated diversifiers (Johnson et al., 2005, 2008).
Hence, on the basis of characteristics discussed for portfolio manager role, coupled
with arguments from Johnson et al. (2005, 2008), this study examines the effect of
Portfolio Manager role as a moderator variable between Unrelated Diversification
Strategy and Corporate Performance.
Therefore, following hypotheses are formulated:
H2aiii: Portfolio Manager Role positively moderates the relationship between
Unrelated Diversification Strategy and Financial Corporate Performance.
H2biii: Portfolio Manager Role positively moderates the relationship between
Unrelated Diversification Strategy and Subjective Corporate Performance.
84
2.4.4.2 Synergy Manager
The characteristics of Synergy Manager role as presented by Johnson et al. (2005) are
given in Table 2.3. On the basis of explanation provided by Johnson et al. (2005,
2008) about the Synergy Manager role, it can be summarized that, as a Synergy
Manager:
Corporate parents are supposed to make policies and procedures for mutual
sharing and transfer of resources and competences across businesses in their
portfolio for creation of synergies.
Corporate parents have to define common culture and also provide central
services and resources. They have to make sure that extent of collaboration
among different businesses is high.
Corporate parents have to make sure that the benefits of sharing assets and
competences for creating synergies outweigh the costs of sharing those assets
and competences.
Corporate parents have to manage resistances among business unit managers
against mutual sharing and cooperation.
Corporate parents have to assure that the corporate staff primarily works for
integration of different capabilities across businesses.
The incentives provided to different businesses in the portfolio are dependent
on the corporate results.
It was discussed in Chapter 2 that synergies could be of operational nature or financial
nature. Operational synergies require certain degree of relatedness and cooperation
between the business units of a firm (Gottschalg & Meier, 2005; Oijen & Douma,
85
2000), whereas, financial synergies could be created through unrelated diversification
as well by combining different cash flows of businesses (Gottschalg & Meier, 2005;
Hoskisson et al., 2009).
On the basis of explanation provided by Johnson et al. (2005, 2008) regarding
Synergy Manager role, it can be concluded that this role is concerned with creation of
operational synergies rather than financial synergies. Therefore, it requires certain
degree of relatedness among different businesses. Keeping this in view, this study
examines the effect of Synergy Manager as a moderator variable between Related
Diversification Strategy and Corporate Performance. Hence, following hypotheses are
formulated:
H2ai: Synergy Manager Role positively moderates the relationship between Related
Diversification Strategy and Financial Corporate Performance.
H2bi: Synergy Manager Role positively moderates the relationship between Related
Diversification Strategy and Subjective Corporate Performance.
Also, sub-section 2.3.1.1.3 discussed that synergy creation in relatedly diversified
businesses could be accomplished through achieving economies of scope benefits,
increased market power and internal governance benefits (Dess et al., 2011;
Haberberg & Rieple, 2001; Hall, 1995; Martin & Eisenhardt, 2001), but high degree
of relatedness among different businesses might not always promise synergy benefits
and therefore synergy programmes might prove unsuccessful due to different reasons
(Goold & Campbell, 1998; Haberberg & Rieple, 2001; Hitt et al., 2011).

86
Campbell (2007) argues that instead of putting efforts on synergy creation, managers
must be paying more attention to creating value using stand-alone influence.
Therefore, it can be said that in certain situations, among related diversifiers, Parental
Developer role proves more successful as compared to Synergy Manager role
(Campbell, 2007; Goold et al., 1994a). On the basis of this argument, following set of
hypotheses is proposed:
H3c: Among predominantly Related Diversifiers, those having corporate parents
adopting Parental Developer Role outperform others having corporate parents
adopting Synergy Manager Role on Financial measures of Corporate
Performance.
H3d: Among predominantly Related Diversifiers, those having corporate parents
adopting Parental Developer Role outperform others having corporate parents
adopting Synergy Manager Role on Subjective measure of Corporate
Performance.
The next sub-section provides detail about Parental Developer role.
2.4.4.3 Parental Developer
The basic difference between the three corporate parenting roles suggested by
Johnson et al. (2005, 2008) is the extent of corporate parent involvement in the
business affairs of different businesses. While the degree of corporate parent’s
involvement in business affairs is low in Portfolio Manager, it is considerably high in
Parental Developer. The conditions for adding value discussed in the previous
87
sections – about having sufficient feel for the businesses and match of corporate
parent’s resources, skills, competences with the parenting opportunities provided by
the businesses – are rather most important conditions for Parental Developer role.
Parental Developer role correspondents to stand-alone influence discussed by Goold
et al. (1994a) historically. According to Goold et al. (1994a), as a stand-alone
influence, corporate parents add value to businesses through activities like effective
strategy reviews, careful selection of business managers, better capital investment
decisions, and good budgetary controls. They add that, for doing this, corporate
managers must have sufficient feel for their businesses, they must possess the
necessary skills, resources and other characteristics to add value and there must be a
parenting opportunity offered by businesses.
On the basis of explanation provided by Johnson et al. (2005, 2008) about the
Parental Developer role, it can be summarized that, as a Parental Developer:
Corporate parents directly intervene in the business units’ affairs through
using their skills or knowledge for creating value. For example, corporate
managers in Cooper Industries add value to different businesses through
providing services like audit of manufacturing operations, improving
accounting activities of businesses and centralization of union negotiations
(Dess, Lumpkin, & Eisner, 2010).
Corporate managers understand well the critical success factors of their
businesses.
Corporate managers identify and help those businesses which provide them
parenting opportunities to add value in different ways.
88
Corporate parents possess those resources and competences which can be
really helpful in creating value in different businesses and therefore business
portfolio is well suited to corporate parent’s expertise.
Corporate managers develop effective structural and control linkages between
corporate centre and its businesses.
Corporate parents provide autonomy to their businesses in their business level
strategies unless they feel there is some need for them to intervene. This
happens when there exists a clear opportunity to add value through corporate
level resources and competences.
Corporate parents provide incentives to different businesses on the basis of
business unit performance.
The focus on synergy creation is lesser and is greater on direct value addition
by the parents. Hence, given the nature of involvement in this role, Parental
Developer is suggested for relatedly diversified businesses as the creation and
up gradation of corporate level resources and competences could be feasible
for set of related businesses (Johnson et al., 2005, 2008).
Therefore, keeping in view the above summarization of the role together with the
arguments from Johnson et al. (2005, 2008), this study examined the effect of
Parental Developer as a moderator variable between Related Diversification Strategy
and Corporate Performance. Hence, following hypotheses are formulated for this
purpose:
H2aii: Parental Developer Role positively moderates the relationship between Related
Diversification Strategy and Financial Corporate Performance.
89
H2bii: Parental Developer Role positively moderates the relationship between Related
Diversification Strategy and Subjective Corporate Performance.
2.4.4.4 Conclusion
Every corporate parenting role is based on its logic and characterises its own ways of
value creation and organisational setting. Corporate managers must understand the
strengths and weaknesses of different roles/styles and adopt the most appropriate one
(Campbell & Goold, 1988; Oijen & Douma, 2000). The selection of most appropriate
role will clarify importance of corporate level management whereas, wrong selection
will lead to excessive costs and weakening of business units (Oijen & Douma, 2000).
In certain situations, however, corporate parents may not dominantly play a particular
role and might be playing mixed parenting roles (Johnson et al., 2005).
On the basis of explanation provided by Johnson et al. (2005, 2008) about corporate
parenting roles, it can be said that selection of appropriate corporate parenting role
depends primarily upon extent of relatedness among business units. Oijen and Douma
(2000) argued that selection of corporate parenting role is contingent upon company’s
corporate level strategy. Caldart and Ricart (2006) conducted research on the
suitability of corporate parenting styles suggested by Goold and Campbell (1987)
with respect to nature of environment. They report that success of each style depends
upon characteristics of environment the company faces, and that strategic planning
style provides better results as compared to other two styles in less complex business
environments, whereas, in environment with high complexity and dynamism, strategic
control style outperforms other styles.
90
This study is based on the assumption that successful product diversification strategy
might require a particular corporate parenting role (Kruehler et al., 2012; Oijen &
Douma, 2000). Related diversification strategy might be successful if corporate
parents adopt Synergy Manager role or Parental Developer role, whereas, unrelated
diversification strategy could be successful if corporate parents adopt Portfolio
Manager role (Johnson et al., 2005, 2008; Porter, 1987). Further, research on top
managers’ competences or roles has been limited in Malaysian context (Alhaji &
Yusoff, 2013; Yusoff & Amrstrong, 2012) and therefore this research provides
information about the types of corporate parenting roles played by Malaysian
managers in their companies.
2.4.5 Research on Corporate Parenting
Parenting advantage and corporate parenting roles have a strong relevance with
product diversification strategies. While there is an abundance of literature on product
diversification – performance relationship (Palich et al., 2000) yet research in the area
of corporate parenting is very limited (Abdullah & Mehmood, 2013; Caldart & Ricart,
2006; Menz & Mattig, 2008; Oijen & Douma, 2000).
A research by Menz and Mattig (2008) on corporate level capabilities found that
diversified companies benefit from corporate level capabilities to ‘foster cross
business coordination’ and capabilities for ‘risk management’. However, authors used
proxies for measurement of corporate level capabilities which highlighted only
limited aspect of those capabilities instead of achieving their comprehensive
91
measurement through some primary data. Further, their study was conducted in
banking sector, and therefore the results could not be generalized across other sectors.
In another perspective, research by Lange et al. (2009) revealed that when well
established companies diversified into new industries (born by disorderly
technological changes), they caused the performance of their own new business units
become weaker as compared to independent businesses. In another study, Gottschalg
and Meier (2005) found that availability of corporate level resources as well as need
of business units for the corresponding corporate services act as moderators for value
addition in unrelated diversified firms. The scope of the study was however limited
due to exclusive focus on private equity firms and leveraged buyout associations.
The availability of limited researches on the topic, therefore, calls for more enquiries
into the subject. As stated before, research on corporate leadership, managerial
competences and parenting roles is extremely limited in Malaysian context (Alhaji &
Yusoff, 2013; Ansari, Ahmad, & Aafaqi, 2004; Yusoff & Amrstrong, 2012). In the
given scenario, examining the moderating role of corporate parenting roles in product
diversification – performance relationship carries extreme significance for Malaysia
in particular, and this has been the primary objective of this study.
2.4.6 Theoretical Background for Corporate Parenting
Theoretical underpinnings for corporate parenting could be traced back to dynamic
capabilities perspective. Further, the connection between product diversification
92
strategies and corporate parenting roles could be discussed in light of contingency
theory. Following sub-sections offer explanation on each of these theories.
2.4.6.1 Dynamic Capabilities Perspective (DCP)
According to certain scholars (Bowman & Ambrosini, 2003; Sohl, 2011) corporate
parenting and corporate value addition is largely rooted in the dynamic capabilities
perspective proposed by Teece, Pisano, and Shuen (1997). This perspective is
augmentation of resource based view and it presents evolutionary nature of
organisational capabilities and resources to create competitive advantage (Bitar &
Somers, 2004; Wang & Ahmed, 2007). In contrast to RBV which presents a static
scenario of organisation position and environment, dynamic capabilities perspective
addresses dynamic nature of environment and the need to constantly evolve and
improve organisational capacity to address changing businesses conditions (Bitar &
Somers, 2004; Zaidi & Othman, 2011).
In the term ‘dynamic capabilities’, ‘capabilities’ refer to management’s ability in
successfully aligning, integrating and reconfiguring organisational resources, skills,
internal and external competences to cope up with swiftly changing external
environments, whereas, ‘dynamic’ refers to management’s capacity to renovate
organisation’s competences to address changing business environment which
characterises high elements of uncertainty and challenges (Teece et al., 1997; Wang
& Ahmed, 2007; Zaidi & Othman, 2011).
93
Hence, the perspective holds that management can create sustainable competitive
advantage in ever changing business environments which the help of dynamic
capabilities it possesses (Johnson et al., 2008; Teece et al., 1997). However, dynamic
capabilities must be based on resources and competences which are rare, valuable,
robust and non-substitutable, making it difficult for competitors to imitate or build
them in short period of time (Barney, 1991; Symeou & Kretschmer, 2012)
Dynamic capabilities are based on organisation’s resource base and their development
is based on organisational learning encompassing coevolution of experience
accumulation, knowledge articulation, and knowledge codification processes
(Symeou & Kretschmer, 2012; Zollo & Winter, 2002). Bitar and Somers (2004) add
that development of dynamic capabilities is a collective activity and it requires
leveraging all organisational processes to achieve sustainable competitive advantage
through sharing of knowledge.
The performance of a diversified organisation largely depends upon existence of
corporate level distinctive competences (Hitt & Ireland, 1986; Sohl, 2011). The
success of related or unrelated diversification depends upon parenting strategy, and
therefore, a company’s corporate centre must actively seek rare, valuable, robust and
non-substitutable resources for its businesses and conduct those activities and
processes that could convert those resources into core competences leading to strong
and sustainable competitive advantage for their businesses (Bowman & Ambrosini,
2003; Kruehler et al., 2012). Hence, a company’s corporate level capability is
indicated in corporate management’s capacity to build, improve and alter
94
organisation’s asset base to create dynamic capabilities for its businesses (Bowman &
Ambrosini, 2003; Menz & Mattig, 2008).
Past literature on dynamic capabilities with reference to corporate parents argues that
alignment of corporate parent’s capabilities and degree of product diversification is
important for corporate performance (Johnson et al., 2005, 2008; Oijen & Douma,
2000; Porter, 1987). Limited studies have examined the interrelationships between
related or unrelated diversification strategy and corporate level competences, and
there is a need of more empirical researches into the topic (Hitt & Ireland, 1986; Liu
& Hsu, 2011; Menz & Mattig, 2008). Further, as mentioned before, the research about
directors’ competences and managerial roles in Malaysian context is limited. In fact, a
recent study by Yusoff and Amrstrong (2012) into the competences of Malaysian
directors found that among others, the directors’ competences in corporate planning
played significant role in planning their companies’ future.
This study enriches the body of knowledge on corporate level distinctive
competences, as corporate parenting roles are tested as moderating variables between
related/unrelated diversification strategy and performance relationship.
2.4.6.2 Contingency Theory
Contingency theory, also called as ‘it all depends theory’ argues that best methods are
always based on contingencies of the situation (Schoech, 2006). This theory was
developed by improving on the previous ideas provided by Frederick Taylor, Henri
Fayol and Max Weber which suggested that certain recommendations proved
95
effective under any circumstances (Matyusz, 2012). Alternatively, contingency theory
proposes that under different conditions, different solutions might prove useful
(Dobák & Antal, 2010; Matyusz, 2012). Hence, the theory negates universally
applicable management practices such as particular managerial styles to all situations.
Therefore, this theory has a strong relevance to this research with reference to
corporate parenting roles as this research hypothesizes that different corporate
parenting roles are suitable for different types of diversification strategies.
Contingency theory was initially discussed in the management literature in 1967 by
Lawrence and Lorsch and currently it is being used to relate research on several
management variables such as managerial decision making, organisation design,
environmental forces and technology (Matyusz, 2012; Schoech, 2006). Particularly,
the reference to this theory has been made several times by studies relating to
organisation structure, leadership and motivation (Baranyi, 2001; Beckford, 2002).
Contingency theory considers an organisation as a product of several interacting
elements where the demand of each element must be met keeping in view the broad
organisational context (Beckford, 2002). This would establish that an appropriate
combination of all organisation elements would help improve its performance. Past
studies conducted to examine the effect of certain moderating variables invariably
accept the validity of contingency theory (David et al., 2010; Hill et al., 1992;
Martínez-Campillo & Fernández-Gago, 2008; Ravichandran et al., 2009).
This research presents another test of contingency theory and provides arguments in
its support. Specifically, it adds to the validity of contingency theory by suggesting
96
that roles of Synergy Manager and Parental Developer are suitable for Related
Diversification Strategy. Further, although Unrelated Diversification Strategy has a
negative effect on Corporate Performance as revealed by the analyses, but the
negative effect is countered if this strategy is combined with Portfolio Manager role.
More is discussed on this matter and the contribution to contingency theory in
Chapter 5.
2.5 Corporate Performance
2.5.1 Background
In strategic management, ‘firm performance’ has been frequently used dependent
variable (Santos & Brito, 2012). Also, the link between strategy and performance has
been well researched area among researchers in the past (Jusoh & Parnell, 2008;
Wiersema & Bowen, 2011). Particularly, the performance of product diversification
strategies has been a popular area among various researchers (Galván et al., 2007;
Hoechle et al., 2012; Kahloul & Hallara, 2010; Palepu, 1985; Rumelt, 1974).
However, the construct of firm performance has passed through variety of
measurement techniques and obtained numerous indicators (Akkermans, 2010;
Asrarhaghighi et al., 2013). According to Denton (2005), one can develop a long list
of performance indicators used by researchers and categorize them into; financial
measures such as R&D expenditures, product cost, labour cost, and design cost, and
non-financial measures such as average time between innovations, customer
satisfaction, number of complaints, and new product development time.
97
2.5.2 Performance Indicators used by Past Research on Product Diversification – Performance Relationship
Most of the past studies examining product diversification effects on performance
used financial indicators of performance. Past researches could be divided into three
groups regarding their selection of performance indicators/ratios in this field. Firstly,
there are studies which used accounting ratios (Delios & Beamish, 1999; Hill et al.,
1992; Marinelli, 2011; Martínez-Campillo & Fernández-Gago, 2008). Secondly, there
are studies which used market ratios (Campa & Kedia, 2002; Hoechle et al., 2012;
Ishak & Napier, 2006; Schmid & Walter, 2008). Thirdly, many researches employed a
blend of accounting and market based performance ratios (Daud et al., 2009; Doukas
& Lang, 2003; Kahloul & Hallara, 2010; Pandya & Rao, 1998).
This analysis of performance ratios for studying effects of product diversification
strategies used by past studies reveals that, whereas use of different performance
indicators by certain studies produced different results (Michel & Shaked, 1984;
Rumelt, 1974), use of similar performance indicators by certain studies also produced
different results (Hoechle et al., 2012; Lins & Servaes, 2002; Miller, 2006; Mishra &
Akbar, 2007a). Therefore, in order to obtain deeper understanding of product
diversification effects on performance, one should employ variety of performance
measures.
2.5.3 Widely Used and Powerful Indicators of Financial Corporate Performance
In research on product diversification strategies, the analysis of accounting based
measures unfolds that although past studies employed variety of accounting based
measures of corporate performance, but certain measures remained dominant among
98
others in the field. Return on assets (ROA) and return of equity (ROE) are among
those measures that were used quite frequently by past studies in the research on
product diversification – performance relationship. According to Ross, Westerfield,
Jaffe, and Jordan (2011), ROA and ROE are best known and frequently used
measures of company profitability.
Recognizing the strength and importance of ROA in measuring company
performance, certain past studies on product diversification – performance
relationship relied on ROA as one of the measures of company performance (Ibrahim
& Kaka, 2007; Kahloul & Hallara, 2010; Lahovnik, 2011; Ravichandran et al., 2009).
A deeper analysis of past studies reveals that certain researches have rather
exclusively relied on ROA as indicator of company performance such as those
conducted by George (2007), Hill et al. (1992), and Chang and Thomas (1989).
In the same way, recognizing the strength and importance of ROE in measuring
company performance, certain past studies have relied on ROE as one of the measures
of company performance (Delios & Beamish, 1999; Ibrahim & Kaka, 2007;
Lahovnik, 2011). Additionally, the analysis of market based measures in this research
area reveals that Tobin’s q has been most accepted and widely used market measure
of performance (Fukui & Ushijima, 2006; Kahloul & Hallara, 2010; Ravichandran et
al., 2009). In fact, in acknowledging the power of Tobin’s q, certain past studies have
relied exclusively on it for measuring company performance (Chari et al., 2008;
Gomes & Livdan, 2004; Guo & Cao, 2011; Lang & Stulz, 1994).
99
In comparison to number of previous researches that used other market measures of
performance such as excess value, Tobin’s q, market adjusted return (Daud et al.,
2009; Guo & Cao, 2011; Kuppuswamy & Villalonga, 2010), there are few researches
that used ‘price to book value ratio’ as indicator of company performance,
representing a gap. But, this ratio is powerful market measure of corporate
performance as according to Berk, DeMarzo, and Harford (2009), it represents value
added by the management and offers feedback to company managers on the market’s
appraisal of their decisions. Hence, realizing this gap, the use of price to book value
ratio in this study is yet another differentiating feature of this research.
In context of Malaysia as well, these ratios being powerful, remained popular and
were used quite frequently to gauge performance of Malaysian PLCs. For instance,
researchers have used Price to Book Value (Chin, 2009), Tobin’s q (Kanapathy,
2005), or a combination of; Tobin’s q and ROA (Razak, Ahmad, & Joher, 2011;
Rokiah, 2010), ROA and Market to Book Value (Shahida & Sapiyi, 2013), and ROA,
ROE, and Tobin’s q (Amran & Ahmad, 2013) for measuring corporate performance
of Malaysian PLCs. Additionally, Price to Book Value has been considered by
Securities Commission Malaysia as one of the important yardsticks for estimating
companies’ performance (Hwa, 2014).
Similarly, Bursa Malaysia considers ROA and ROE as one of the key financial data
on corporate performance which could be used by investors to appraise companies’
performance (Bursa Malaysia, n.d.a, n.d.b). Thus, on the basis of above arguments,
this study relies on using ROA, ROE, Tobin’s q and P/B Value as four indicators of
100
Financial Corporate Performance which provides best blend of accounting and market
performance measures.
2.5.4 Shortcomings of Financial Performance Indicators
The financial performance measures have been extensively used in product
diversification – performance research which indicates practical as well as academic
importance of financial performance indicators. However, the problem with the
financial indicators is that they capture after-the-fact consequences (Chavan, 2009;
Denton, 2005; Smandek et al., 2010). Although accounting measures of performance
are widely used indicators of corporate performance, but they are subject to several
problems such as accounting manipulation, assets’ undervaluation and absence of
standardization in international accounting principles (Asrarhaghighi et al., 2013;
Chakravarthi, 1986). Alternatively, market measures of performance represent a
company’s external evaluation by stakeholders and forecast of company’s future
performance (Santos & Brito, 2012). But market measures of performance might also
not fully reflect corporate performance.
Sole reliance on financial measures of performance which encourage only short-term
behaviour at the cost of long-term value creation is usually perplexing and confusing
(Chavan, 2009; Ghosh & Mukherjee, 2006). Moreover, according to Venkatraman
and Ramanujam (1986), financial performance is only a subset of organisational
effectiveness and therefore it may not adequately capture strategy effects. In
supporting this view, Walters (1999) argues that being a multidimensional variable,
101
organisation’s effectiveness might provide different results to different researchers
measuring different aspects of it.
These arguments would imply that financial indicators of performance might not be
able to comprehensively evaluate product diversification strategy. Besides, reliance
on only profit based measures of performance has been criticized in the past;
especially in relevance to the service industry where the outputs are difficult to
measure and quantify (Brown & McDonnell, 1995). Certain scholars argue that
organisations as well as researchers must rely on multiple indicators of performance
in studying relationships among variables, and in so doing, their focus should be on
stakeholder issues rather than on shareholder issues only (Asrarhaghighi et al., 2013;
Micheli, Mura, & Agliati, 2011).
2.5.5 Subjective Assessment of Corporate Performance
Measurement of organisation’s performance through non-financial indicators might
provide insight that may not be available through financial indicators (Jusoh &
Parnell, 2008). Wall et al. (2004) confirmed validity of subjective measures of
performance against objective measures and recommended using combination of
objective and subjective measures of performance.
Keeping in view the short sightedness of single performance measure, many
organisations are relying on use of multiple measures of performance (Jusoh &
Parnell, 2008). In this regard, the Balance Scorecard (BSC) developed by Kaplan and
Norton (1992) is worth mentioning. It is a multidimensional performance evaluation
102
guide for a business and employs financial as well as non-financial criteria (Ghosh &
Mukherjee, 2006; Hepworth, 1998). Although BSC was supposed to overcome many
problems in business performance measurement (Kaplan & Norton, 1992), but every
business strategy is unique in its own and requires its own performance goals and
measures (Jusoh & Parnell, 2008).
Therefore, use of BSC might be practically limited to business level strategy and may
not be extended to corporate level strategy because a diversified organisation
represents a portfolio of businesses with each one having its own business level
strategy. In that condition, obtaining a balance scorecard for a corporate level strategy
that covers various businesses together would be difficult for any researcher.
Different studies in the past have obtained subjective assessment of firm performance
in strategy research (Nandakumar, Ghobadian, & O’Regan, 2010; Tan et al., 2007).
Given the fact that product diversification strategy might not necessarily provide
short-term benefits in terms of financial returns but it might immediately provide
returns as far as strategic or subjective performance is concerned, along with validity
of subjective performance measures, and lastly, in making agreement with the
researches using subjective assessment of performance, this study relied on measuring
organisation performance through objective (financial) as well as subjective measures.
This research design provided a comprehensive evaluation of diversification strategies
on corporate performance.
The next chapter discusses in detail the methods of measuring Financial Corporate
Performance as well as Subjective Corporate Performance.
103
2.6 Chapter Summary
This chapter was devoted to critical review of literature on the relevant theories and
past studies. It started by providing detail on Malaysian corporate sector along with
number of PLCs, governing bodies and Bursa Malaysia markets. Then, it presented
basic conceptualization and definition of product diversification strategy along with
its types. This was followed by explanation of underpinning theories of product
diversification. A critical analysis was presented on past researches conducted on
exploring effect of product diversification on performance followed by critical
discussion of researches examining relative superiority of related versus unrelated
diversification strategy.
Afterwards, the chapter provided detailed explanation of corporate parenting concept
and value addition/value destruction by corporate parents. Explanation on corporate
parenting roles was also provided, followed by past studies conducted in the area of
corporate parenting. This was followed by underpinning theories for corporate
parenting. Lastly, a critical review of corporate performance indicators used by
previous researches along with a foresight for the future research regarding subjective
assessment of corporate performance was presented.
104
CHAPTER THREE
THEORETICAL FRAMEWORK, HYPOTHESES DEVELOPMENT AND RESEARCH METHODOLOGY
3.1 Introduction
According to Cooper and Schindler (2006), research design expresses the strategy of
any research activity as it specifies procedures and methods for data collection, data
measurement and data analyses. Therefore, the quality of any research depends upon
good research design and well planned research methodology. This chapter presents
in detail the research design and methodology of this study by providing detail on
various aspects such as data collection, data measurement and data analyses, along
with presenting theoretical framework and hypotheses in the initial part.
The chapter starts by presenting theoretical framework of the study that shows the
concerned variables in the study and proposed relationships between them in Section
3.2. The chapter, then proceeds towards presenting hypotheses of the study,
population and unit of analysis, and time period of the study in Section 3.3, Section
3.4, and Section 3.5 respectively. Research hypotheses are decomposed into several
sub hypotheses for making clarity on the issues. Afterwards, a detailed explanation
follows regarding the measurement of independent variable, dependent variable and
moderating variable. Section 3.6.1 presents explanation about measurement of
Product Diversification Strategy including the techniques and formulae for its
measurement as well as justifications for using the proposed techniques.
105
Section 3.6.2 includes explanation on the measurement of Corporate Parenting Roles
along with design of questionnaire for measuring Corporate Parenting Roles. Section
3.6.3 provides detail on the measurement of Corporate Performance with its sub-
sections providing detail on the measurement of Financial as well as Subjective
Corporate Performance. These sub-sections include formulae to calculate different
ratios which are part of Financial Corporate Performance as well as they discuss
design of questionnaire sent to respondents for measuring Subjective Corporate
Performance.
This is followed by Section 3.6.4 which provides detail on the control variables of the
study along with justifications for using them. Section 3.7 and Section 3.8 include
explanation regarding data collection and data sources, and pilot study for
questionnaire pretesting. In the end, a summary of the chapter is presented.
3.2 Theoretical Framework
The theoretical framework proposed for this research is presented in Figure 3.1. This
framework is based on research questions and research objectives provided in Chapter
1. Figure 3.1 indicates that one of the objectives of this research is to test the effect of
Product Diversification Strategy, Related Diversification Strategy, and Unrelated
Diversification Strategy on Financial Corporate Performance (using one ratio at a
time) and Subjective Corporate Performance. Whereas the figure shows that primary
objective of this study is to test moderating effect of Synergy Manager and Parental
Developer on the relationship between Related Diversification Strategy and Financial
Corporate Performance (using one ratio at a time) and Subjective Corporate
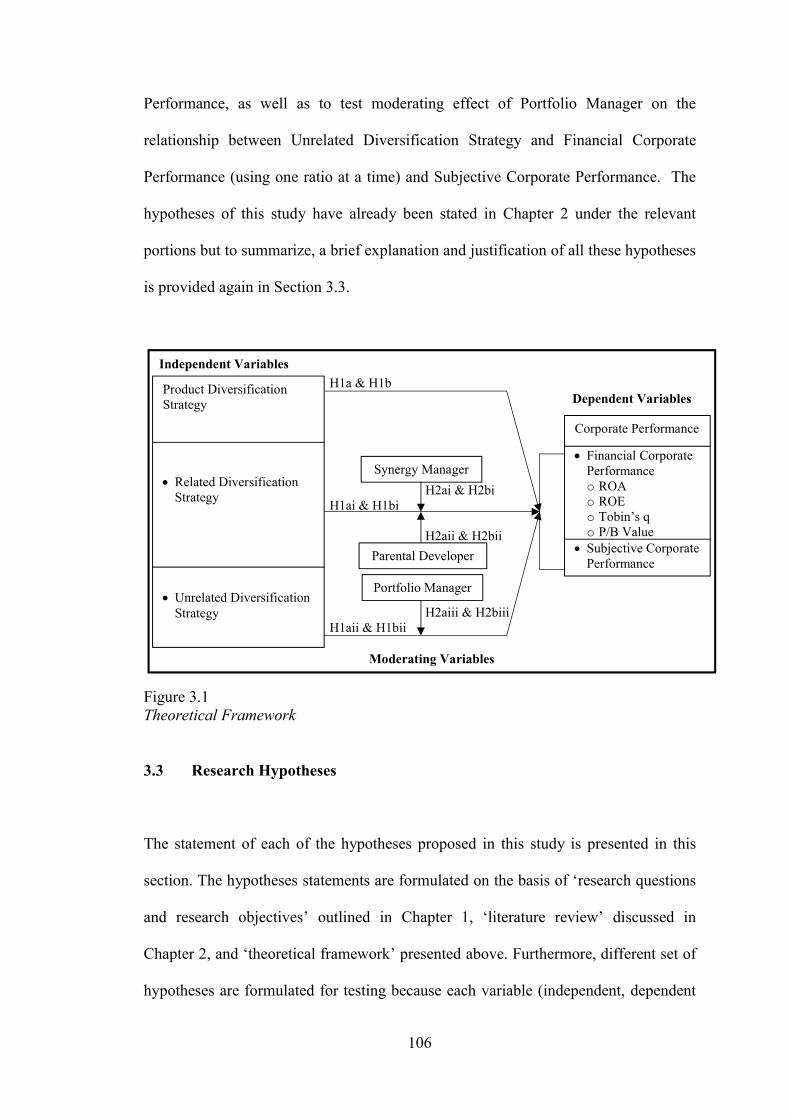
106
Independent Variables
H1a & H1b Dependent Variables H2ai & H2bi H1ai & H1bi H2aii & H2bii H2aiii & H2biii H1aii & H1bii
Moderating Variables
Performance, as well as to test moderating effect of Portfolio Manager on the
relationship between Unrelated Diversification Strategy and Financial Corporate
Performance (using one ratio at a time) and Subjective Corporate Performance. The
hypotheses of this study have already been stated in Chapter 2 under the relevant
portions but to summarize, a brief explanation and justification of all these hypotheses
is provided again in Section 3.3.
Figure 3.1 Theoretical Framework
3.3 Research Hypotheses
The statement of each of the hypotheses proposed in this study is presented in this
section. The hypotheses statements are formulated on the basis of ‘research questions
and research objectives’ outlined in Chapter 1, ‘literature review’ discussed in
Chapter 2, and ‘theoretical framework’ presented above. Furthermore, different set of
hypotheses are formulated for testing because each variable (independent, dependent
Synergy Manager
Corporate Performance
Financial Corporate Performance o ROA o ROE o Tobin’s q o P/B Value
Subjective Corporate Performance
Product Diversification Strategy Related Diversification
Strategy
Unrelated Diversification Strategy
Parental Developer
Portfolio Manager
107
as well as moderating variable) consists of sub variables. A brief detail and
justification is added with every hypothesis to clarify its need and significance for this
study.
A comprehensive discussion of studies supporting positive effects of product
diversification (Kuppuswamy & Villalonga, 2010; Miller, 2006; Mishra & Akbar,
2007a; Pandya & Rao, 1998) and negative effects of product diversification
(Braakmann & Wagner, 2009; Hoechle et al., 2012; Ibrahim & Kaka, 2007) has been
presented in Chapter 2. Moreover, the discussion also included review of studies
supporting curvilinear effect of product diversification on performance (Galván et al.,
2007; Liu & Hsu, 2011; Palich et al., 2000) as well as analysis of studies stating that
product diversification had no significant effect on performance (Chang & Thomas,
1989; Çolak, 2010; Lloyd & Jahera Jr., 1994; Marinelli, 2011; Montgomery, 1985).
A critical analysis of these studies reveals that there are more studies stating that
product diversification had some sort of effect on performance as compared to studies
concluding that there was no effect of product diversification on performance.
Moreover, greater studies have supported linear relationship between product
diversification and performance as compared to studies supporting curvilinear
relationship between the two. Among those studies which state that product
diversification had certain impact on performance, there are considerable studies
proving positive effects of product diversification on performance as well as there are
sizable studies proving negative effects of product diversification on performance.
108
Therefore, there lies greater ambiguity about whether product diversification is useful
or non-useful strategy. In light of this analysis, an initial hypothesis concerning any
effect of product diversification strategy on performance is presented below:
H1: Extent of Product Diversification Strategy significantly affects Corporate
Performance.
A critical review of performance indicators used in product diversification –
performance relationship research has been provided in the previous chapter. The
review concluded that until now, majority of the studies relied only upon financial
performance indicators. But as financial performance has been said to be a subset of
overall organisational effectiveness (Venkatraman & Ramanujam, 1986), scholars
have recommended that performance should be measured using multiple indicators of
performance reflecting broader stakeholder issues (Micheli et al., 2011) or emphasis
should also be laid on non-financial indicators of performance (Jusoh & Parnell,
2008).
Wall et al. (2004) recommended using a combination of objective and subjective
measures of performance in order to have better insight into the performance
construct. In this study, following the recommendations of these scholars, corporate
performance is measured objectively (using financial ratios) and subjectively and the
main hypothesis H1 above is divided into two sub-hypotheses as below:
H1a: Extent of Product Diversification Strategy significantly affects Financial
Corporate Performance.

109
H1b: Extent of Product Diversification Strategy significantly affects Subjective
Corporate Performance.
As stated before, many past studies established linear relationship between total
diversification and performance. It was concluded before that rich insight could be
gained into positive or negative nature of product diversification strategy by
decomposing diversification strategy into two types: related diversification strategy
and unrelated diversification strategy. Further, the use of multiple indicators of
performance (objective and subjective) in this study enable complete evaluation of
related and unrelated diversification strategies.
Following above discussion, the set of hypotheses for related and unrelated
diversification strategies and for various categories of corporate performance are
formulated as:
H1ai: Extent of Related Diversification Strategy significantly affects Financial
Corporate Performance.
H1bi: Extent of Related Diversification Strategy significantly affects Subjective
Corporate Performance.
H1aii: Extent of Unrelated Diversification Strategy significantly affects Financial
Corporate Performance.
H1bii: Extent of Unrelated Diversification Strategy significantly affects Subjective
Corporate Performance.
110
Hypotheses H1a and H1b, which include ‘extent of Product Diversification Strategy’,
are tested using the Total Diversification Score (DT) as obtained by using Entropy
Measure of Diversification. Total Diversification Score is the sum of Related
Diversification Score and Unrelated Diversification Score. Similarly, the hypotheses
that include ‘extent of Related Diversification Strategy’ are tested using Related
Diversification Score (DR) and the hypotheses that include ‘extent of Unrelated
Diversification Strategy’ are tested using Unrelated Diversification Score (DU). The
entropy measure of diversification (Jacquemin & Berry, 1979) used in this study
enables decomposition of Total Diversification Score into Related Diversification
Score and Unrelated Diversification Score (Complete details on measurement of
Independent Variables and entropy formulae are provided in Section 3.6.1).
It has been argued before that better insight could be gained into product
diversification – performance relationship with the inclusion of additional variables
(Daud et al., 2009; Gary, 2005; Marinelli, 2011) or moderators (Martínez-Campillo &
Fernández-Gago, 2008) into the relationship. Importantly, scholars suggested that
researchers should include important contingency variables in their research
frameworks when the purpose is to study relationship between related diversification
strategy and performance, as well as to study unrelated diversification strategy and
performance (Datta et al., 1991; Ravichandran et al., 2009). Nippa et al. (2011) have
suggested using parenting advantage as a moderating variable in product
diversification – performance relationship. Based on these arguments, following
general hypothesis is formulated. However, this hypothesis was only tested by
decomposing it into different hypotheses for different types of corporate parenting
111
roles and with different categories of corporate performance as discussed in the next
paragraphs.
H2: Corporate Parenting Roles positively moderate relationship between Product
Diversification Strategies and Corporate Performance.
The literature on diversification strategies points that the motives and benefits for
related diversification strategy and those for unrelated diversification strategy are
supposed to be different. As related diversification strategy entails expansion of a
company into related industry segments, therefore the motives behind related
diversification strategy could be creation of synergies or economies of scope benefits
(David, 2011; Grant et al., 2011; Helfat & Eisenhardt, 2004; Hill et al., 1992; Nayyar,
1993).
Oijen and Douma (2000), and Gottschalg and Meier (2005) stated that realization of
synergies, particularly operational synergies between businesses, require certain
degree of relatedness and cooperation between the businesses. On the basis of these
arguments, it is supposed that related diversification will positively contribute to
corporate performance if it is followed by synergy management efforts by corporate
parent managers (Johnson et al., 2005, 2008). Therefore, the role of Synergy Manager
is hypothesized to positively moderate relationship between Related Diversification
Strategy and Corporate Performance as stated below:
H2ai: Synergy Manager Role positively moderates the relationship between Related
Diversification Strategy and Financial Corporate Performance.
112
H2bi: Synergy Manager Role positively moderates the relationship between Related
Diversification Strategy and Subjective Corporate Performance.
Parental Developers are concerned with finding parenting opportunities in the
businesses and helping those businesses through resources and capabilities they
possess as corporate managers, such as a specialist skill in financial management
(Johnson et al., 2008). According to Johnson et al. (2005, 2008), this role is more
likely to be played in relatedly diversified companies as compared to unrelatedly
diversified companies. Naturally, it may seem easier for corporate parent managers to
develop or acquire resources, competences, and skills with the help of which they
could benefit related businesses as compared to possessing resources, competences or
skills to simultaneously add value to many unrelated businesses. On the basis of these
arguments, following hypotheses are formulated:
H2aii: Parental Developer Role positively moderates the relationship between Related
Diversification Strategy and Financial Corporate Performance.
H2bii: Parental Developer Role positively moderates the relationship between Related
Diversification Strategy and Subjective Corporate Performance.
As argued in sub-section 2.4.4.3, The Parental Developer Role seems to resemble
stand-alone parenting influence discussed by Goold et al. (1994a). As synergy
expectations, sometimes, might fail management expectations (Goold & Campbell,
1998), therefore, scholars have suggested that as compared to synergy management,
stand-alone influence or Parental Developer Role could perform better in related
organisations (Campbell, 2007; Goold et al., 1994a). As there are substantial
113
arguments for using Synergy Manager Role and Parental Developer Role as
moderators for relatedly diversified businesses, therefore, it could be hypothesized
that those relatedly diversified businesses in which corporate parents are acting as
Parental Developers outperform other related businesses where corporate parents are
acting as Synergy Managers. Hence, on this basis, following hypotheses are proposed:
H3c: Among predominantly Related Diversifiers, those having corporate parents
adopting Parental Developer Role outperform others having corporate parents
adopting Synergy Manager Role on Financial measures of Corporate
Performance.
H3d: Among predominantly Related Diversifiers, those having corporate parents
adopting Parental Developer Role outperform others having corporate parents
adopting Synergy Manager Role on Subjective measure of Corporate
Performance.
Management motives behind unrelated diversification strategy could be to decrease
overall risk of the company and to enhance profitability (Galván et al., 2007; Grant et
al., 2011). A company could use unrelated diversification strategy when it feels there
are opportunities to add value to certain undervalued businesses which are having
good future growth prospects and which it can invest in (Bamford & West, 2010).
These conditions characterise Portfolio Manager Role.
According to Johnson et al. (2005, 2008), Portfolio Manager Role is more suitable for
unrelatedly diversified organisations or conglomerates where a company is not
concerned about the relatedness of businesses in its portfolio. They add that being

114
portfolio managers, corporate parents only intervene through buying and selling of
businesses or provision or withdrawal of investment, hence acting as agents for
financial markets. On the basis of these arguments, following hypotheses are
formulated:
H2aiii: Portfolio Manager Role positively moderates the relationship between
Unrelated Diversification Strategy and Financial Corporate Performance.
H2biii: Portfolio Manager Role positively moderates the relationship between
Unrelated Diversification Strategy and Subjective Corporate Performance.
Lastly, a review of studies comparing performance effects of related versus unrelated
diversification strategy has also been presented in the previous chapter. There is
considerable support of related diversification strategy winning unrelated
diversification strategy (Berger & Ofek, 1995; Markides & Williamson, 1996; Mishra
& Akbar, 2007a; Rumelt, 1974, 1982), as well as there is substantial evidence
regarding unrelated diversification strategy outperforming related diversification
strategy (Dubofsky & Varadarajan, 1987; Marinelli, 2011; Michel & Shaked, 1984).
In this study, the objective is also to compare the two types of diversification
strategies on multiple indicators of performance (financial as well as subjective). In
light of this, following hypotheses are formulated.
H3a: A significant difference exists between Predominantly Related Diversifiers and
Predominantly Unrelated Diversifiers on Financial measures of Corporate
Performance.
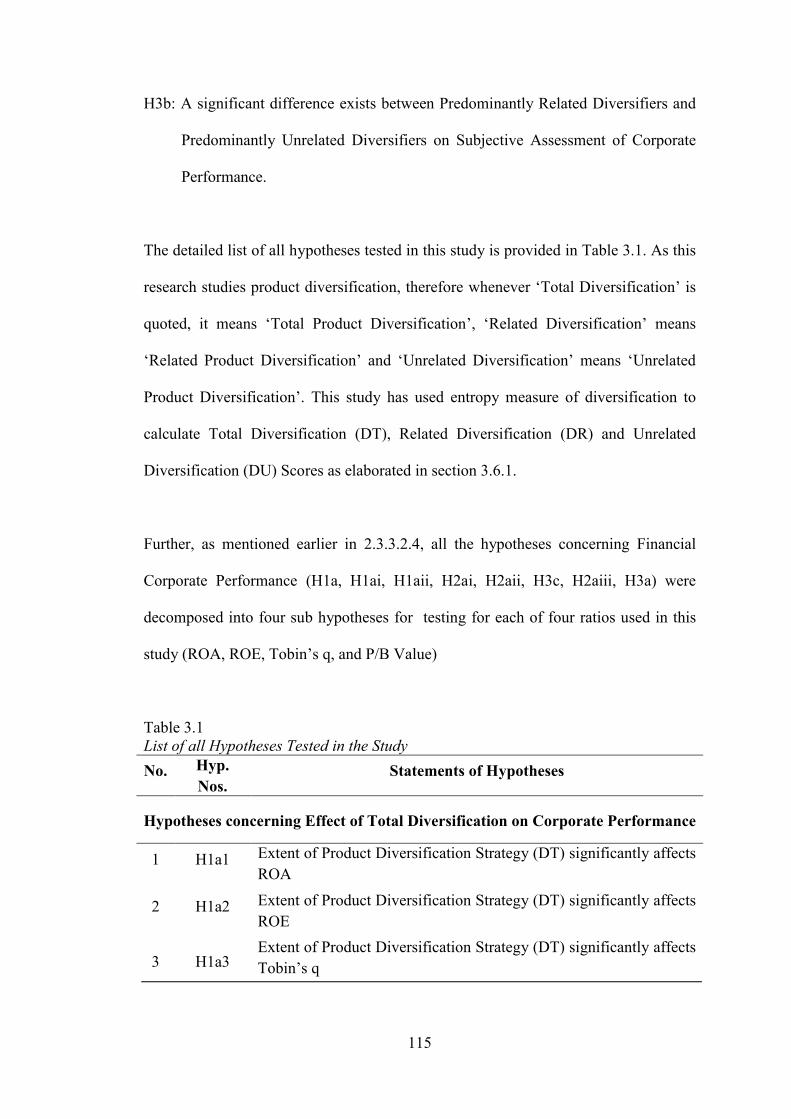
115
H3b: A significant difference exists between Predominantly Related Diversifiers and
Predominantly Unrelated Diversifiers on Subjective Assessment of Corporate
Performance.
The detailed list of all hypotheses tested in this study is provided in Table 3.1. As this
research studies product diversification, therefore whenever ‘Total Diversification’ is
quoted, it means ‘Total Product Diversification’, ‘Related Diversification’ means
‘Related Product Diversification’ and ‘Unrelated Diversification’ means ‘Unrelated
Product Diversification’. This study has used entropy measure of diversification to
calculate Total Diversification (DT), Related Diversification (DR) and Unrelated
Diversification (DU) Scores as elaborated in section 3.6.1.
Further, as mentioned earlier in 2.3.3.2.4, all the hypotheses concerning Financial
Corporate Performance (H1a, H1ai, H1aii, H2ai, H2aii, H3c, H2aiii, H3a) were
decomposed into four sub hypotheses for testing for each of four ratios used in this
study (ROA, ROE, Tobin’s q, and P/B Value)
Table 3.1 List of all Hypotheses Tested in the Study
No. Hyp.
Nos. Statements of Hypotheses
Hypotheses concerning Effect of Total Diversification on Corporate Performance
1 H1a1 Extent of Product Diversification Strategy (DT) significantly affects
ROA
2 H1a2 Extent of Product Diversification Strategy (DT) significantly affects
ROE
3 H1a3 Extent of Product Diversification Strategy (DT) significantly affects
Tobin’s q
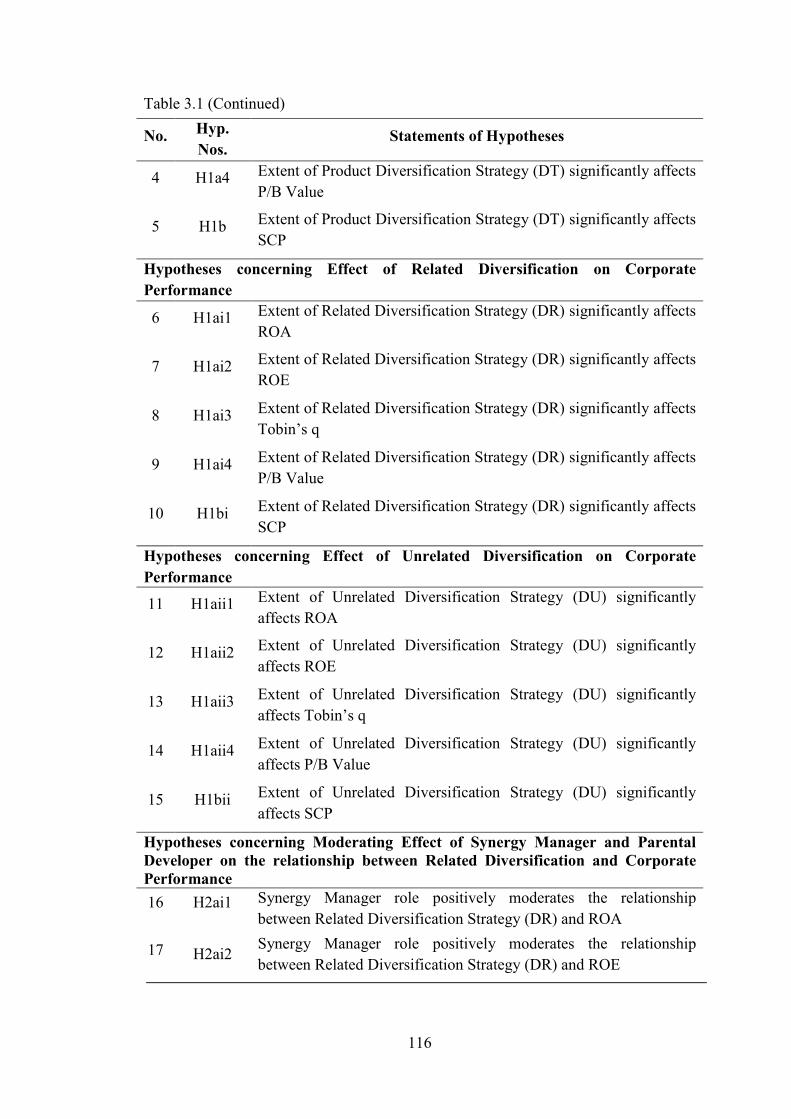
116
Table 3.1 (Continued)
No. Hyp.
Nos. Statements of Hypotheses
4 H1a4 Extent of Product Diversification Strategy (DT) significantly affects
P/B Value
5 H1b Extent of Product Diversification Strategy (DT) significantly affects
SCP
Hypotheses concerning Effect of Related Diversification on Corporate
Performance
6 H1ai1 Extent of Related Diversification Strategy (DR) significantly affects
ROA
7 H1ai2 Extent of Related Diversification Strategy (DR) significantly affects
ROE
8 H1ai3 Extent of Related Diversification Strategy (DR) significantly affects
Tobin’s q
9 H1ai4 Extent of Related Diversification Strategy (DR) significantly affects
P/B Value
10 H1bi Extent of Related Diversification Strategy (DR) significantly affects
SCP
Hypotheses concerning Effect of Unrelated Diversification on Corporate
Performance
11 H1aii1 Extent of Unrelated Diversification Strategy (DU) significantly
affects ROA
12 H1aii2 Extent of Unrelated Diversification Strategy (DU) significantly
affects ROE
13 H1aii3 Extent of Unrelated Diversification Strategy (DU) significantly
affects Tobin’s q
14 H1aii4 Extent of Unrelated Diversification Strategy (DU) significantly
affects P/B Value
15 H1bii Extent of Unrelated Diversification Strategy (DU) significantly
affects SCP
Hypotheses concerning Moderating Effect of Synergy Manager and Parental Developer on the relationship between Related Diversification and Corporate Performance
16 H2ai1 Synergy Manager role positively moderates the relationship
between Related Diversification Strategy (DR) and ROA
17 H2ai2 Synergy Manager role positively moderates the relationship
between Related Diversification Strategy (DR) and ROE
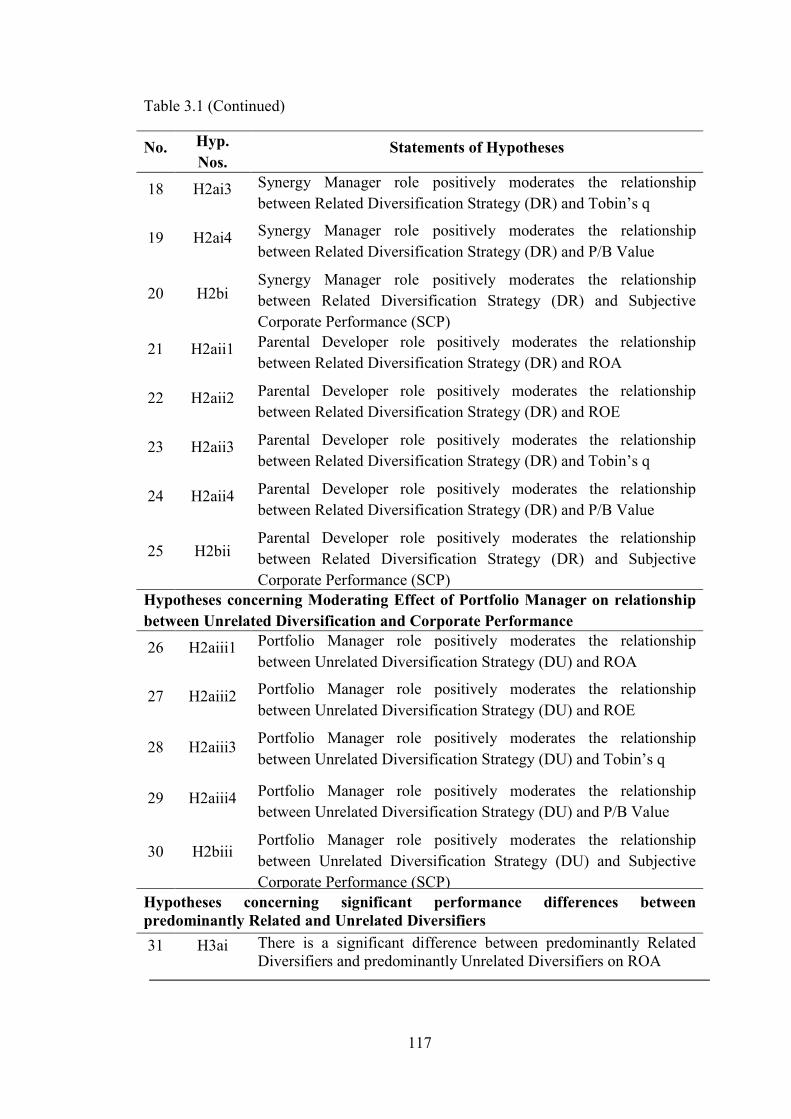
117
Table 3.1 (Continued)
No. Hyp.
Nos. Statements of Hypotheses
18 H2ai3 Synergy Manager role positively moderates the relationship
between Related Diversification Strategy (DR) and Tobin’s q
19 H2ai4 Synergy Manager role positively moderates the relationship
between Related Diversification Strategy (DR) and P/B Value
20 H2bi Synergy Manager role positively moderates the relationship
between Related Diversification Strategy (DR) and Subjective
Corporate Performance (SCP)
21 H2aii1 Parental Developer role positively moderates the relationship
between Related Diversification Strategy (DR) and ROA
22 H2aii2 Parental Developer role positively moderates the relationship
between Related Diversification Strategy (DR) and ROE
23 H2aii3 Parental Developer role positively moderates the relationship
between Related Diversification Strategy (DR) and Tobin’s q
24 H2aii4 Parental Developer role positively moderates the relationship
between Related Diversification Strategy (DR) and P/B Value
25 H2bii Parental Developer role positively moderates the relationship
between Related Diversification Strategy (DR) and Subjective
Corporate Performance (SCP) Hypotheses concerning Moderating Effect of Portfolio Manager on relationship
between Unrelated Diversification and Corporate Performance
26 H2aiii1 Portfolio Manager role positively moderates the relationship
between Unrelated Diversification Strategy (DU) and ROA
27 H2aiii2 Portfolio Manager role positively moderates the relationship
between Unrelated Diversification Strategy (DU) and ROE
28 H2aiii3 Portfolio Manager role positively moderates the relationship
between Unrelated Diversification Strategy (DU) and Tobin’s q
29 H2aiii4 Portfolio Manager role positively moderates the relationship
between Unrelated Diversification Strategy (DU) and P/B Value
30 H2biii Portfolio Manager role positively moderates the relationship
between Unrelated Diversification Strategy (DU) and Subjective
Corporate Performance (SCP)
Hypotheses concerning significant performance differences between predominantly Related and Unrelated Diversifiers
31 H3ai There is a significant difference between predominantly Related Diversifiers and predominantly Unrelated Diversifiers on ROA
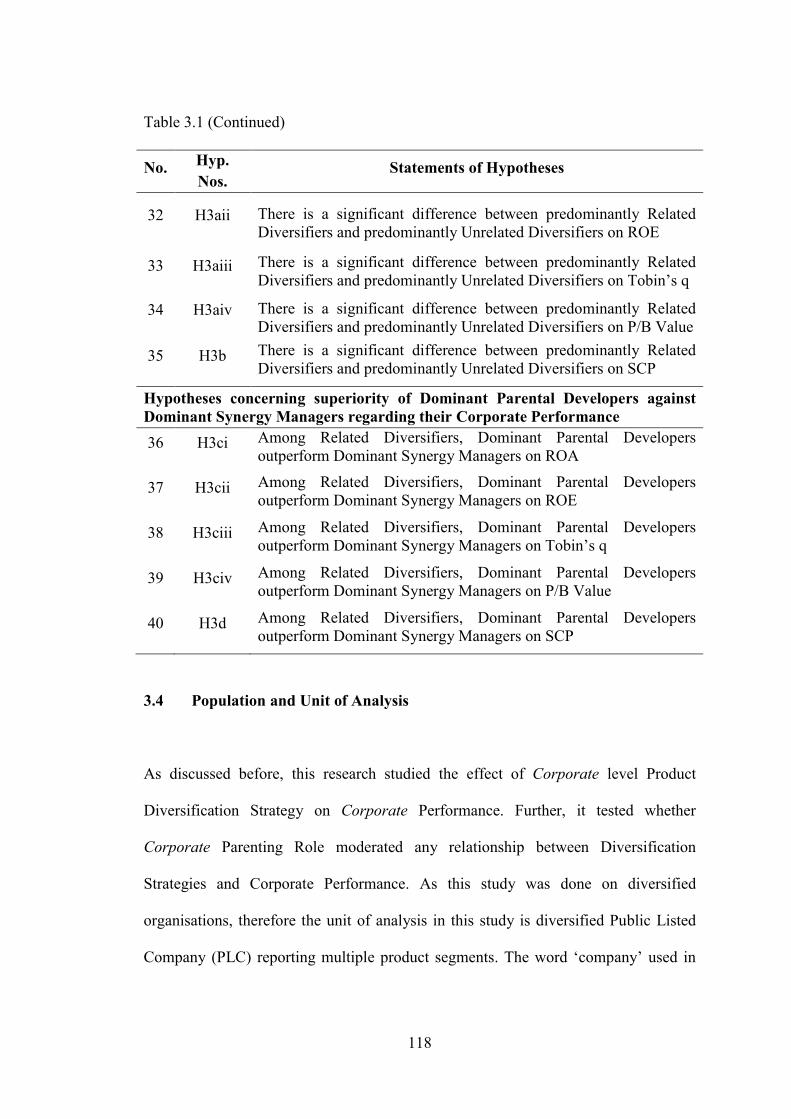
118
Table 3.1 (Continued)
No. Hyp.
Nos. Statements of Hypotheses
32 H3aii There is a significant difference between predominantly Related Diversifiers and predominantly Unrelated Diversifiers on ROE
33 H3aiii There is a significant difference between predominantly Related Diversifiers and predominantly Unrelated Diversifiers on Tobin’s q
34 H3aiv There is a significant difference between predominantly Related Diversifiers and predominantly Unrelated Diversifiers on P/B Value
35 H3b There is a significant difference between predominantly Related Diversifiers and predominantly Unrelated Diversifiers on SCP
Hypotheses concerning superiority of Dominant Parental Developers against Dominant Synergy Managers regarding their Corporate Performance
36 H3ci Among Related Diversifiers, Dominant Parental Developers outperform Dominant Synergy Managers on ROA
37 H3cii Among Related Diversifiers, Dominant Parental Developers outperform Dominant Synergy Managers on ROE
38 H3ciii Among Related Diversifiers, Dominant Parental Developers outperform Dominant Synergy Managers on Tobin’s q
39 H3civ Among Related Diversifiers, Dominant Parental Developers outperform Dominant Synergy Managers on P/B Value
40 H3d Among Related Diversifiers, Dominant Parental Developers outperform Dominant Synergy Managers on SCP
3.4 Population and Unit of Analysis
As discussed before, this research studied the effect of Corporate level Product
Diversification Strategy on Corporate Performance. Further, it tested whether
Corporate Parenting Role moderated any relationship between Diversification
Strategies and Corporate Performance. As this study was done on diversified
organisations, therefore the unit of analysis in this study is diversified Public Listed
Company (PLC) reporting multiple product segments. The word ‘company’ used in
119
this research for all Malaysian organisations actually represents a diversified business
group.
The population frame for this study consisted of all diversified PLCs listed on Bursa
Malaysia Main Market who reported multiple product segments for the required
years. Companies listed only on the Main Market of Bursa Malaysia were included in
the population frame as there are various differences in the listing requirements for
companies for Main Market versus ACE Market as discussed already in Chapter 2.
Hence, to maintain homogeneity among companies, only Main Market companies
were included in the analyses.
Furthermore, in Malaysia, companies are required to report their business/product
segments detail as per FRS 8 Operating Segments issued by MASB (Malaysian
Accounting Standards Board). Hence, a company was categorized as diversified
company if the number of product segments disclosed under FRS 8 Operating
Segments was more than 1 (David et al., 2010; Palepu, 1985; Santalo & Becerra,
2004). On similar grounds, companies reporting only 1 product segment were
considered as focused companies and were not included in the population frame and
hence they were not part of the analyses.
3.5 Time Period of the Study
This study has relied on three years data (2010 – 2012) in consistent with the work of
Hill et al. (1992), Afza et al. (2008), and Singh, Davidson, and Suchard (2003). As a
company’s strategy may change drastically over a long period of time, therefore in
120
diversification studies, a shorter time period is desirable (Daud et al., 2009). The
study is consistent with the work of Afza et al. (2008), Singh et al. (2003), and
Christensen and Montgomery (1981) in terms of relying on three years data for
various financial ratios.
Further, a three year average of all variables is calculated. It is because a three year
average of variables helps smooth out period by period variation in the variables
(Afza et al., 2008; Hill et al., 1992). And further, the calculation of three year average
for financial ratios is consistent with Afza et al. (2008) and Christensen and
Montgomery (1981) who also calculated three year averages for various financial
ratios for their studies. A three year average score of diversification using entropy
measure is also consistent with Hill et al. (1992).
An average of all secondary nature variables (except company age and experience) for
the three years is computed in this study and thus all the analyses are conducted with
it. Primary nature variables (Corporate Parenting Roles and Subjective Corporate
Performance) also secure respondents’ judgment with respect to three years. Hence,
there is a consistency between all the variables with respect to their time period.
There is another justification also for relying on three years data, 2010-2012. It is in
relation to calculation of diversification scores using entropy measure. It is discussed
and demonstrated in the later sections of the thesis that entropy measure of product
diversification makes use of data on companies’ reporting of business/product
segments in their annual reports. In Malaysia, companies are required to report their
business/product segments according to FRS 8 Operating Segments issued by MASB.
121
Now, FRS 8 has already replaced FRS 1142004 in 2009 and all companies in Malaysia
adhered to the new FRS 8 in their annual reports since 2010 (Benjamin, Muthaiyah,
Marathamuthu, & Murugaiah, 2010; MASB, 2014b; Malaysian Institute of
Accountants [MIA], 2010).
The rules and regulations regarding disclosure of business segments and other
relevant matters in FRS 8 Operating Segments significantly differ from those in FRS
1142004 (MASB, 2014b; MIA, 2010). This implies different number of and nature of
reported product segments along with other financial details in the two regulations.
Therefore, companies’ diversification scores calculated on the basis of new FRS 8
Operating Segments couldn’t be combined or averaged with the diversification scores
calculated using old FRS 1142004. Therefore, starting since 2010, reliance on the use of
2010-2012 data for which companies reported their business segments in accordance
with new FRS 8 Operating Segments is justified.
3.6 Measurement of Variables
This section provides detail on the measurement techniques, formulae and instruments
for all the variables studied in this research.
3.6.1 Measurement of Product Diversification Strategy
Approaches to measure product diversification have been subject of discussion and
debate over the last many years (Montgomery, 1982; Palepu, 1985; Pitts & Hopkins,
1982) and past researchers have employed many different ways for calculating
122
companies’ extent of product diversification. Product Diversification measures range
from categorical to continuous measures (Asrarhaghighi et al., 2013; Klier, 2009)
with each one serving a particular purpose. Continuous measures of product
diversification have an advantage that they provide ratio data and therefore, they can
be considered to be more accurate in measuring degree or extent of diversification
(Chari et al., 2008; Palepu, 1985). This study needed data about extent or degree of
diversification pursued by companies and therefore it required continuous measure of
diversification.
Further, the study was concerned with making categories of related diversifiers and
unrelated diversifiers for testing various hypotheses. Therefore, given the purpose of
this research and the nature of analyses, this study relied on ‘Entropy Measure’ of
product diversification (Jacquemin & Berry, 1979; Palepu, 1985). Use of entropy
measure is widespread in diversification literature and a number of past studies used
this measure of product diversification in related researches (David et al., 2010;
Kahloul & Hallara, 2010; Marinelli, 2011; Martinez-Campillo & Fernandez-Gago,
2008; Ravichandran et al., 2009).
The entropy measure not only measures degree of company’s total product
diversification, but also decomposes it into two components – degree of related
diversification and degree of unrelated diversification. Based on comparison of a
company’s score of related and unrelated diversification, a company can be
categorized as either ‘Predominantly Related Diversifier’ or ‘Predominantly
Unrelated Diversifier’. Hence, entropy measure provides continuous data as well as
possibility of categorizing companies into two categories.
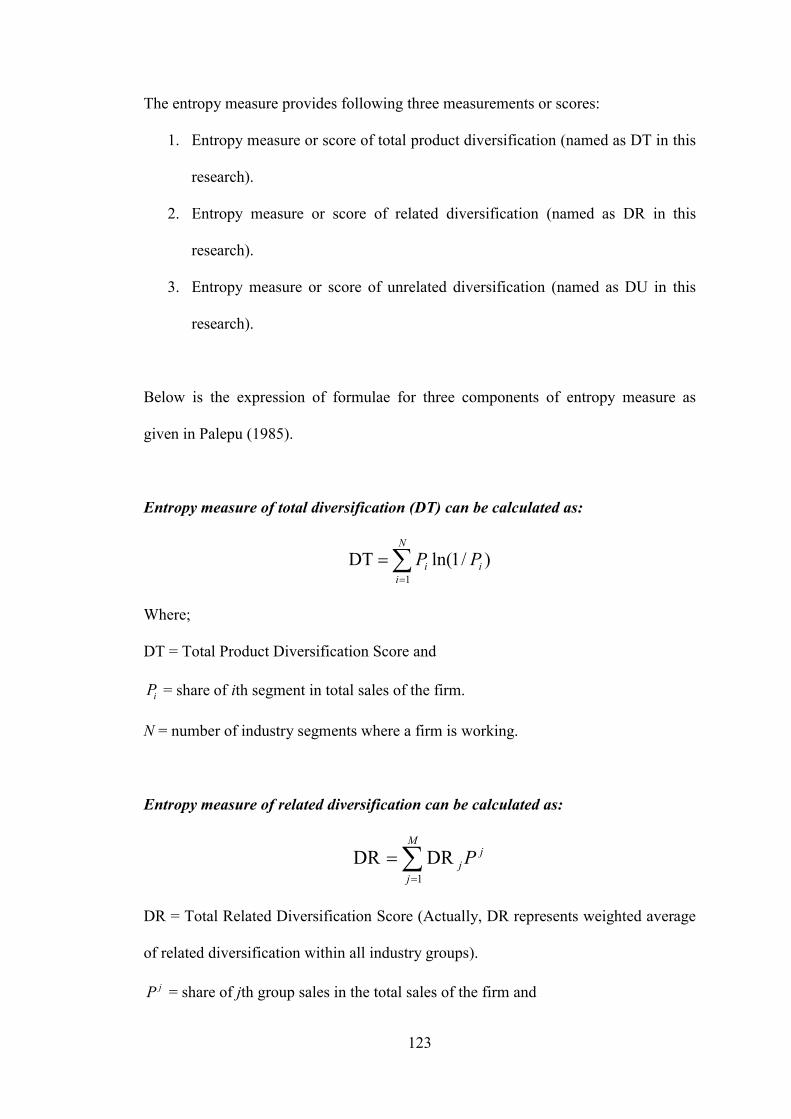
123
The entropy measure provides following three measurements or scores:
1. Entropy measure or score of total product diversification (named as DT in this
research).
2. Entropy measure or score of related diversification (named as DR in this
research).
3. Entropy measure or score of unrelated diversification (named as DU in this
research).
Below is the expression of formulae for three components of entropy measure as
given in Palepu (1985).
Entropy measure of total diversification (DT) can be calculated as:
N
iii PP
1
)/1ln(DT
Where;
DT = Total Product Diversification Score and
iP = share of ith segment in total sales of the firm.
N = number of industry segments where a firm is working.
Entropy measure of related diversification can be calculated as:
M
j
jj P
1
DRDR
DR = Total Related Diversification Score (Actually, DR represents weighted average
of related diversification within all industry groups).
jP = share of jth group sales in the total sales of the firm and
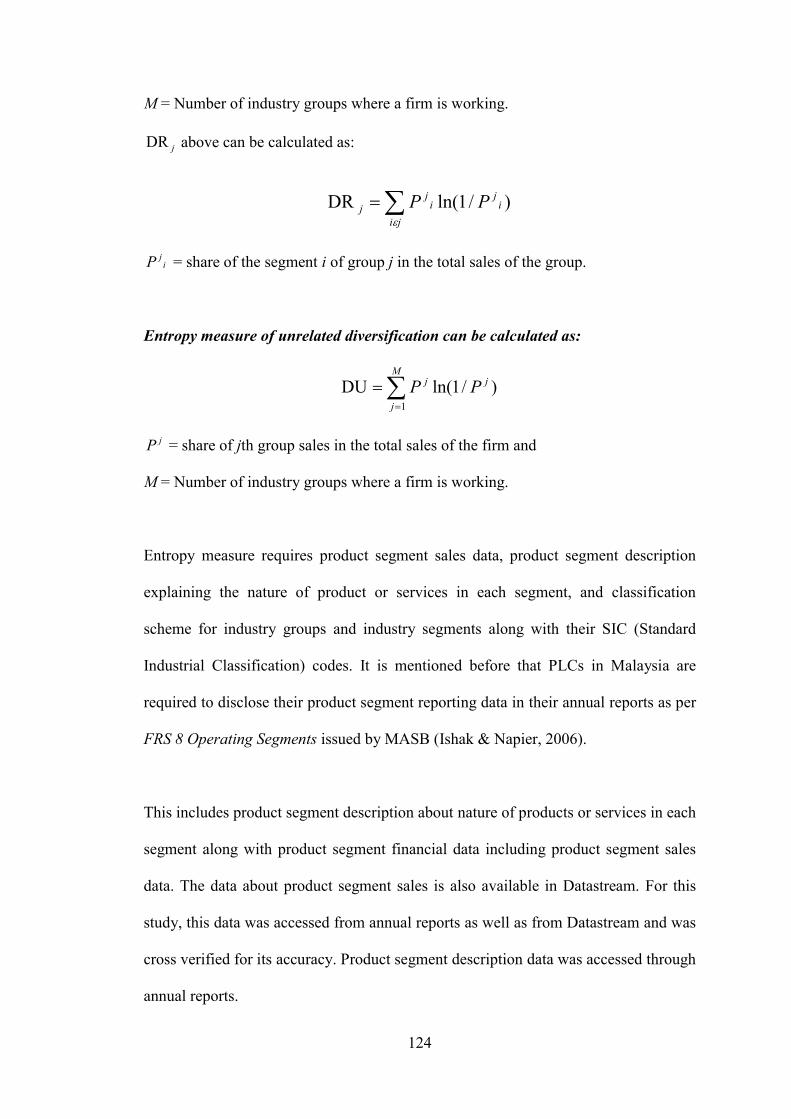
124
M = Number of industry groups where a firm is working.
jDR above can be calculated as:
ji
ij
ij
j PP
)/1ln(DR
ijP = share of the segment i of group j in the total sales of the group.
Entropy measure of unrelated diversification can be calculated as:
M
j
jj PP1
)/1ln(DU
jP = share of jth group sales in the total sales of the firm and
M = Number of industry groups where a firm is working.
Entropy measure requires product segment sales data, product segment description
explaining the nature of product or services in each segment, and classification
scheme for industry groups and industry segments along with their SIC (Standard
Industrial Classification) codes. It is mentioned before that PLCs in Malaysia are
required to disclose their product segment reporting data in their annual reports as per
FRS 8 Operating Segments issued by MASB (Ishak & Napier, 2006).
This includes product segment description about nature of products or services in each
segment along with product segment financial data including product segment sales
data. The data about product segment sales is also available in Datastream. For this
study, this data was accessed from annual reports as well as from Datastream and was
cross verified for its accuracy. Product segment description data was accessed through
annual reports.
125
SIC codes are used to differentiate among industry segments and industry groups. In
case of a four digit SIC code, the difference in the first two digits represents different
industries whereas the difference in the last two digits represents different segments in
a particular industry. Chari et al. (2008) provide detail about different components of
entropy measure. As per their arguments, related component of entropy measure (DR)
measures the diversity of company’s operations in different industry segments within
the same two-digit SIC code. Unrelated component of entropy measure (DU)
measures the diversity of company’s operations in different two-digit SIC codes.
Finally, total product diversification (DT) measures the extent of company’s
operations in different industries whether they are related or unrelated. Total
Diversification (DT) of a company is equal to sum of its related diversification (DR)
and unrelated diversification (DU).
During entropy score calculations, this study used Thomson Reuters Worldscope
categorization of industry groups which is available on the basis of four (4) digits SIC
codes5. This categorization is also provided in Appendix C. It is because the SIC
codes are not readymade for Malaysian PLCs. Therefore, SIC codes were assigned
manually to all product segments (based on Worldscope categorization of industries)
on the basis of product segment description available in companies’ annual reports. In
the procedure, if for any two product segments, the initial two digits of their SIC
codes were different, then the two segments belonged to different industries.
However, in so doing, if the two product segments had same first two digits in their
SIC codes but different last two digits in their SIC codes, then the two segments
belonged to the same industry.
5 Worldscope Database: Data Definitions Guide (Issue 14, 2012). Page 511-516.
126
Specifically, following procedure was adopted to calculate entropy scores for
diversification:
1. Initially, product segment detail disclosed in the annual reports under FRS 8
Operating Segments was studied for every company to reveal the number of
operating segments by product and their description.
2. Secondly, Worldscope classification of industry groups was used to assign
codes to the product segments based on their description.
3. After that, product segment external sales data was used to calculate
diversification scores using entropy formulae. Initially total diversification
score was calculated, followed by related diversification score and unrelated
diversification score. In the end, related and unrelated diversification scores
were added to compare with the total diversification score as a cross
verification.
Demonstration of product diversification scores calculation using entropy measure is
available in Appendix D for three companies (Pharmaniaga Berhad, Komarkcorp
Berhad, and Public Packages Holdings Berhad).
3.6.2 Measurement of Corporate Parenting Roles
Explanation about corporate parenting and corporate parenting roles has already been
provided in Section 2.4 of this thesis. As the information about corporate parenting
roles is not available through secondary sources, therefore, the measurement of
corporate parenting roles was done by collecting primary data with the help of
127
questionnaire. The development and design of questionnaire for measuring corporate
parent roles is discussed in the following sub-section.
3.6.2.1 Development and Design of Questionnaire for Measuring Corporate Parenting Roles
The questionnaire items designed for measuring corporate parenting roles are
provided in Part A of the questionnaire provided in Appendix B. Those items are
designed on the basis of dimensions provided by Johnson et al. (2005) for the three
corporate parenting roles: Portfolio Manager, Synergy Manager, and Parental
Developer.
Item numbers 1 to 3 are classification questions designed to categorize respondents
with respect to their designation, experience and area of expertise. Item numbers 4 to
17 are designed to measure Portfolio Manager Role. Item numbers 18 to 31 are
designed to measure Synergy Manager Role and item numbers 32 to 45 are designed
to measure Parental Developer Role. A total of 14 questions were employed to
measure each of the Corporate Parenting Role. In this way, a total of 42 questions
were used for measurement of Corporate Parenting Roles.
A 7-point Likert-type scale was used for all items from 4 to 45, and it ranged from
strongly disagree (1) to strongly agree (7). Likert scales are most frequently used in
business research, are more reliable, easy to administer and they contain alternatives
that normally range from 3 to 9 (Cooper & Schindler, 2008; Zikmund, 2003). A 7-
point Likert-type scale was used in this research as it provides better approximation of
normal response curve and ensures greater validity of information (Cooper &
128
Schindler, 2008). Every item required respondents to circle a particular position on
the scale keeping in view the conditions prevailing in their companies during last
three years. The design of questionnaire allowed for calculating mean scores for all
three corporate parenting roles and categorization of all companies in their dominant
corporate parenting roles.
3.6.3 Measurement of Corporate Performance
It has been argued in the previous two Chapters that most of the past studies relied
only on objective (financial) measures of corporate performance (mostly accounting
or market measures or their combination) and there are few studies that used
managers’ subjective assessment of corporate performance.
Studies like those of Nandakumar et al. (2010) and Tan et al. (2007) obtained
managers’ subjective assessment of firm performance and revealed significant
importance of obtaining such an assessment. Building on that idea, this study
attempted to differentiate itself by incorporating objective (financial) as well as
subjective assessment of corporate performance. Details about both categories of
performance are provided in the following sections.
3.6.3.1 Measurement of Financial Corporate Performance
It has been discussed in the previous chapters that past studies used different types of
financial measures for measuring corporate performance. Certain studies (Campa &
Kedia, 2002; Chang & Thomas, 1989; George, 2007; Guo & Cao, 2011; Markides &
129
Williamson, 1994) relied on only one indicator of corporate performance. But,
reliance on limited measures of financial performance may not provide detailed
insight into the topic. Therefore, in consistent with other past studies that used
combination of accounting and market based performance measures (Daud et al.,
2009; Fukui & Ushijima, 2006; Pandya & Rao, 1998; Ravichandran et al., 2009), this
study planned to measure objective or financial performance of companies through
accounting as well as market measures.
The following two sub-sections provide detail and justification for using various
accounting and market measures of performance. Further, data about accounting
measures (ROA, ROE) and market measures (Tobin’s q, P/B Value) of performance
was initially accessed from Datastream. However, it resulted in missing data for
different ratios and accounts for a number of companies. Therefore, all ratios were
calculated manually through formulae by taking observations from the companies’
annual reports for all years. Section 3.7.1 talks more about this. Formulae used to
calculate these ratios are discussed in the following sub-sections along with
justifications.
3.6.3.1.1 Accounting Measures of Performance
This study relied on using following accounting measures of corporate performance.
1. Return on Assets (ROA)
2. Return on Equity (ROE)
130
3.6.3.1.1.1 Return on Assets (ROA)
ROA provides measurement about how much profit is generated by per dollar of
assets (Ross et al., 2011). Generally, ROA can be computed by dividing Net Income
of a company by its Total Assets (Berk et al., 2009; Ross et al., 2011).
Following formula was used to calculate ROA as suggested by Ross, Westerfield, and
Jordan (2009), and Gitman and Zutter (2011).
Return on Assets (ROA) = Net Income / Total Assets
Previous researchers have also used same formula to calculate ROA (Afza et al.,
2008; Pandya & Rao, 1998). In consistent with the other variables’ data, an average of
three years (2010-2012) for each company was calculated for ROA.
3.6.3.1.1.2 Return on Equity (ROE)
In an accounting sense, ROE is the true bottom line measure of company’s
performance as it measures how much profit is being created by every dollar in equity
(Ross et al., 2011). A high ROE indicates that company is able to locate profitable
opportunities for investment (Berk et al., 2009) and vice versa.
Just like other ratios, a three year average (2010-2012) of ROE was calculated for all
companies using manual calculations. Following formula was used to calculate ROE
as suggested by Ross et al. (2009), and Gitman and Zutter (2011).

131
Return on Equity (ROE) = Net Income / Total Equity
Previous researchers have also used same formula to calculate ROE (Afza et al.,
2008; Pandya & Rao, 1998).
3.6.3.1.2 Market Measures of Performance
As discussed before, financial performance could be crafted using different
accounting methods or procedures. Therefore, reliance on only accounting measures
of performance might lead to misinterpretations. For this reason, this study also relied
on using market measures of performance along with accounting measures. Following
two ratios were calculated and the justifications and formulae for using these ratios
are provided in the proceeding sections.
1. Tobin’s q
2. Price to Book Value
3.6.3.1.2.1 Tobin’s q
Tobin’s q is better measure of company performance as it is implicitly adjusted to the
risk, is less susceptible to accounting distortions as it is based on stock market values,
and is forward looking because it not only incorporates current profitability but also
takes into account future profitability as gauged by the stock market valuation of
future cash flows (David et al., 2010; Kahloul & Hallara, 2010; Ravichandran et al.,
132
2009). Although there are slight variations in calculating Tobin’s q ratio but this study
calculated this ratio based on common practices.
Specifically, following formula was used to calculate this ratio as suggested by
Thomson Reuters (Lhoyd, personal communication, June 11, 2012) and as followed
by David et al. (2010), Kahloul and Hallara (2010), and Fukui and Ushijima (2006).
Tobin’s q = Market Value of Equity + Book Value of Liabilities
Book Value of Equity + Book Value of Liabilities
In parallel with other variables’ data, Tobin’s q was also calculated for three years
(2010-2012) and later, an average was calculated for these years.
3.6.3.1.2.2 Price to Book Value (P/B Value)
P/B Value (also called as ‘market to book value ratio’) is a ratio of ‘market value of
equity’ to ‘book value of equity’ (Berk et al., 2009; Ross et al., 2011). This ratio
provides comparison of market value of company’s investments to their cost, in which
sense a value less than 1 would show that the company has been unsuccessful in
creating value for its stockholders (Ross et al., 2011). Therefore, a value of greater
than 1 is considered favourable. Previous scholars have been relying on price to book
value or market to book value in diversification – performance research (Elsas et al.,
2010; Hill & Hansen, 1991) and following formula as used in this study represents its
calculation.
133
P/B Value = Market Price per Share
Book Value per Share
In consistent with data of other variables, an average of three years P/B Value was
obtained from 2010 to 2012. Section 3.7.1 discusses sources of all secondary data
used in this study.
3.6.3.2 Measurement of Subjective Corporate Performance
Measurement of Subjective Corporate Performance was done by adapting
questionnaire used by Tan et al. (2007) for measuring corporate performance
subjectively. They developed ten (10) questionnaire items from past studies
comprising those of Singh et al. (2001) and Venkatraman and Ramanujam (1986) for
measuring corporate performance.
The ten questionnaire items for measuring Subjective Corporate Performance are
given in the Part B of the questionnaire provided in Appendix B. Item numbers 46 to
55 provided on the last page of the questionnaire were designed to measure Subjective
Corporate Performance. They actually represent ten aspects of corporate performance
measured through Multiple Rating List Scale. A 7-point Multiple Rating List Scale
was used in this research which ranged from 1 (Low Performance) to 7 (High
Performance). Multiple Rating List Scale was suitable for this purpose as it can
appropriately secure responses on a series of up to ten aspects of a construct (Cooper
& Schindler, 2008) much like the ten performance aspects used in this research. The
134
respondents were required to encircle the most appropriate number on scale of 1 to 7
for each aspect of their corporate performance based on assessment of last three years.
3.6.4 Control Variables and their Measurement
In addition to examining the relationships between independent, dependent and
moderating variables in the study, the analyses also controlled certain variables found
by previous researches to be playing important role in the proposed relationships. Past
studies controlled number of variables suitable to their purpose.
Past studies considered certain variables to be important in studying product
diversification – performance relationship as they could also have an impact on
corporate performance. Therefore, this study controlled those important variables
namely size (Burgers, Padgett, Bourdeau, & Sun, 2009; Daud et al., 2009; Liu & Hsu,
2011; Marinelli, 2011), leverage (David et al., 2010; Liu & Hsu, 2011; Marinelli,
2011), age (Chakrabarti et al., 2007; George, 2007; Liu & Hsu, 2011), and experience
(Chan, 2010; Sohl, 2011).
Company size is significant factor to be controlled as it is related to degree of market
power a company enjoys and serves as a determinant of economies of scale benefits
(Chari et al., 2008; Galván et al., 2007). Similarly, in diversification studies, it is
important to control for leverage as it indicates company’s financial structure, it’s
willingness to accept higher risk and it might have profound impact on corporate
performance (Hall, 1995; Hoechle et al., 2012). In the same way, a company’s age is
135
also a determinant of its success and failure and controlling for age controls for any
experiential effects (Lange et al., 2009; Liu & Hsu, 2011).
Finally, managers’ experience could also be important factor in determining corporate
performance and controlling for experience also controls for experiential effects
(Chan, 2010; Sohl, 2011). It is better to control these factors in a study as according to
Liu and Hsu (2011), controlling for firm size controls for economies of scale factor,
controlling firm age controls for the experiential effect and controlling for firm
leverage provides control for firm’s financial structure.
The calculations of these control variables were also performed in accordance with
past studies. In consistent with Marinelli (2011) and Pan, Tsai, and Kuo (2010), Size
was calculated by taking Natural Log of Total Assets of the company. Leverage was
computed by taking ratio of Total Debt to Total Assets of the company in consistent
with David et al. (2010) and Dastidar (2009). In consistent with George (2007), Age
was calculated in terms of Number of Years since the company incorporated.
Experience was calculated by Number of Years of Manager’s Experience in
consistent with Yusoff and Amrstrong (2012).
For all the companies, an average of three years was computed for relevant control
variables just like for all other variables. The required information for calculating Size
and Leverage was obtained through company annual reports. Information about Age
(company’s year of incorporation) was obtained either through Datastream or
company annual reports or KLSE Annual Companies Handbook. Information about
Experience was obtained through questionnaire (item number 2).
136
3.7 Data Collection and Sources
This research relied on primary as well as secondary data. The collection of data and
its sources are discussed in the following sections.
3.7.1 Secondary Data
Secondary data was required for measuring Product Diversification Strategies and
Financial Corporate Performance. Initially, the data for various secondary nature
variables were accessed from Thomson Reuter’s Datastream. Although the product
segment data was available from the Datastream but the data for financial ratios of
many companies was missing. It is because Datastream relies on a uniform formula to
calculate various ratios for companies all over the world. In calculating ROA, for
example, it uses average of two years assets. Now, if for any company, the annual
report for any one year is missing for any reason such as change of accounting year
end, or listing status, then ROA would not be available in the Datastream for that
year. Reliance on Datastream data for financial ratios would have ended up in total
companies less than 100 for the analyses.
Therefore, the calculation of financial ratios was made manually (using Microsoft
Excel) by taking manual observation of various accounts from companies’ annual
reports. The formulae used for calculating these ratios are already discussed in
Section 3.6.3.1 along with their justifications. Product segment data, however, was
taken from Datastream as well as annual reports while making cross comparisons.
Certain guideline was also taken from Datastream about the sectorial classification of
137
companies which was used in classifying companies in basic sectors for calculating
entropy scores. Information about the industry groups, sectors and subsectors along
with their codes was taken from Thomson Reuters Worldscope Database – Data
Definitions Guide (2012) which proved quite useful in this regard.
Annual reports were downloaded from website of Bursa Malaysia
(www.bursamalaysia.com). The information about the market price per share required
to calculate P/B Value and Tobin’s q was obtained from Yahoo! Finance. Yahoo!
Finance provides valid, reliable and accurate data and scholars have been relying on
this data source for their studies (Giblin, 2013; Harper, 2011). Share price data was
also cross checked with SHAREINVESTOR.com and Bloomberg. Company age data
was taken from Datastream and KLSE Annual Companies Handbook. Company
websites were also visited to get information about certain key respondents, change of
address, product detail and contact numbers etc.
3.7.2 Administration of Questionnaires for Primary Data
Primary data (for measuring Corporate Parenting Roles and Subjective Corporate
Performance) was obtained through questionnaires mailed to CEOs, Executive
Directors, or other corporate level managers such as General Managers of companies,
working in Corporate Centres or Head Quarters.
Initially, a list of respondent managers for the companies was developed using the
information available on the company websites along with annual reports. The annual
reports include profile of all the directors of the company. Certain companies’ annual
138
reports also include information about the top management team. Capable
respondents for the questionnaire were identified by reading the directors’ profiles as
well as through information about the management team. In certain cases, phone calls
were made to the companies to identify the most appropriate respondent for the
questionnaire. Before sending questionnaires, it was ensured that all the respondents
were top level managers working at company headquarters rather than at company
subsidiaries and they were involved in the corporate strategy making and possessed
adequate knowledge about corporate management/parenting styles in the companies.
Initially, the questionnaires were mailed by post to all the 563 respondents (The total
number of diversified companies – reporting multiple product segments in their
reports were 563. Section 4.2 in Chapter 4 provides detail about population frame and
respondent companies). As gaining cooperation for survey from top level managers
like CEOs, Directors, COOs, CFOs and other similar managers is extremely hard,
therefore data was obtained from only one respondent in every company. To
encourage response rate, a formal letter explaining the purpose and objectives of the
study along with promise to maintain confidentiality was attached with the
questionnaires (Formal letter is available in Appendix A). Additionally, a reply paid
envelope was also enclosed with the questionnaire to facilitate good response rate.
Follow up calls were made about 2 to 3 weeks after sending the initial questionnaires.
The response rate was extremely slow overall as responding to survey questionnaires
has not been widely accepted practice among Malaysian managers (Jusoh & Parnell,
2008; Mohamad & Wheeler, 1996). Due to extremely slow response rate,
questionnaires were sent again and again by post or through emails as required by
139
respondents by taking the required information through phone calls. Finally, 136
companies ended up replying to the questionnaires.
3.8 Pilot Study and Questionnaire Pretesting
The questionnaire (provided in Appendix B) was designed to measure Corporate
Parenting Roles, to obtain Subjective Assessment of Corporate Performance as well
as to secure certain demographic information from the respondents. As discussed
before, the items for measurement of each of the Corporate Parenting Roles were
developed on the basis of dimensions provided by Johnson et al. (2005) for the three
Corporate Parenting Roles. Items for the measurement of Subjective Corporate
Performance were adapted from the work of Tan et al. (2007). Before collecting final
data, a pilot study was conducted for evaluating the questionnaire.
For ensuring content validity of the instrument, questionnaire was sent to an expert
panel comprising of academicians as well as industrialists. Content validity ensures
that an instrument includes a sufficient and representative combination of items to
measure a particular concept (Khalid, Hilman, & Kumar, 2012; Sekaran, 2003). The
views and opinions of experts were incorporated through making certain changes in
the questionnaire. Closely related to content validity, face validity represents the
degree to which a questionnaire seemingly reveals the content of a particular concept
(Bryman & Bell, 2003; Khalid et al., 2012).
For ensuring face validity, questionnaire was discussed with certain respondents
attending Annual Companies Secretaries Conference (January, 2013, Kuala Lumpur),
140
with help from MICG (Malaysian Institute of Corporate Governance) as well as it was
discussed with respondents on phone later on. The respondents were explained about
the purposes and objectives of the study, criteria about selecting respondent
companies/managers, likely analyses to be conducted and confidentiality of the
survey. The respondents expressed satisfaction over the design of questionnaire,
usefulness of the study, and its contribution ensuring the face validity of the
questionnaire.
As a pilot test, questionnaires were mailed to certain companies and 30 companies
turned up providing response for it. As sample size of 30 is too small to conduct
complex analysis, therefore, calculation of Cronbach’s alpha was possible which
resulted in Cronbach’s alpha ranging from as low as 0.759 to as high as 0.949.
3.9 Chapter Summary
This chapter started by presenting research framework and listing research
hypotheses. Then, it discussed population, unit of analysis and time period of the
study. Detailed information was presented on the measurement of Product
Diversification Strategies (independent variable), Corporate Parenting Roles
(moderating variable), Corporate Performance (dependent variable), and the control
variables. The formulae/techniques and instrumentation for measuring different
variables were discussed along with sources of primary and secondary data and
instrument validation.
141
CHAPTER FOUR
FINDINGS & CONCLUSIONS
4.1 Introduction
This chapter presents conclusions, findings, and results of all analyses along with
discussing sample, population and instrument testing. The chapter starts by discussing
sample size and respondent companies along with methods and techniques of data
analyses. Then, it proceeds towards discussing validity and reliability of the
questionnaire together with exploratory factor analysis. Section 4.8.1 presents results
of hypotheses testing regarding effect of Product Diversification Strategy on
Corporate Performance.
Section 4.8.3 and 4.8.4 present results of testing moderator hypotheses for the
moderating effect of corporate parenting roles on the relationship between
diversification strategies and corporate performance. Followed by this, Section 4.8.6
presents results of conducting t-tests for comparing different groups of companies on
various measures of Corporate Performance. Lastly, a summary table for all
hypotheses tests results is presented along with conclusions.
4.2 Sample Size and Respondent Companies
As mentioned before, in this study, companies listed on the Main Market of Bursa
Malaysia were included. Primary data was collected before secondary data. The
collection of primary data took a period of around one year (2013) as the respondents
142
were top level managers like CEOs, Executive Directors, Corporate Planners, General
Managers or others concerned with the task of corporate planning and strategy
making at company level. During 2013, around 800 companies remained listed on the
Main Market of Bursa Malaysia. Of those 800 companies, there were around 590
diversified companies which reported multiple product segments in their annual
reports. Among these, 27 companies were those which didn’t report any sales figures
for one or more of their product segments for the required years, and hence were
screened out. This left with a population frame of 563 companies.
Following previous sholars in this line of research (Azlina, 2013; Goll & Sambharya,
1995; Hill et al., 1992; Wan & Ong, 2005), the questionnaires were sent to all of these
companies and 136 companies replied questionnaires providing a response rate of
24.15%. However, 12 companies were excluded from the analyses due to various
reasons. The list of excluded companies along with the reasons of their exclusion is
available in Appendix F. One company was deleted as an outlier and finally,
conclusions are based on 123 companies. The list of 123 companies (including
managers’ names and designations) entering the final analyses is provided in
Appendix G.
4.3 Analysis of Non-Response Bias
While addressing the question about non-response bias, this study makes reference to
the studies done by Nor Aziah (2004), Etter and Perneger (1997), and Azlina (2013).
Etter and Perneger (1997) discuss two methods for examining non-response bias. The
first method compares characteristics of respondents and non-respondents. Second
method requires a comparative analysis based on the date of questionnaires returned.
143
Meanwhile, Nor Aziah (2004) and Azlina (2013) relied on surrogate method. They
compared the mean responses of the last 10% usable questionnaires received with the
remainder usable questionnaires. The late respondents represented non-respondents.
Similar to Azlina (2013) and Nor Aziah (2004), this study analysed non-response bias
by comparing the mean responses of last 12 returned questionnaires with the
remaining questionnaires. The last 12 returned questionnaires represented 10% of the
123 usable questionnaires. The independent samples t-tests conducted for this purpose
revealed no significant differences between early respondents and late respondents
regarding Synergy Manager Role (t = -0.609, p = 0.544), Parental Developer Role (t =
-0.349, p = 0.727), Portfolio Manager Role (t = -0.784, p = 0.434), and SCP (t =
-0.261, p = 0.797). Hence, the study shows no problem of non-response bias in the
analyses.
4.4 Data Analyses Procedures and Techniques
The data was analysed using descriptive and inferential statistics. Descriptive
statistics for mean, standard deviation, maximum and minimum values were
calculated for different variables along with certain pie charts and frequency
distribution tables to augment the analyses. After data cleaning and screening, factor
analysis was conducted to ensure validity of the instrument. Cronbach’s alpha was
calculated to test instrument reliability. The main analysis for moderation tests was
conducted using Moderated Regression Analysis (MRA). In similar past researches,
where moderating variable was included in research frameworks, a number of studies
used Moderated Regression as main tool for the analysis (Goll & Sambharya, 1995;
144
Hill et al., 1992; Hitt & Ireland, 1986; Martínez-Campillo & Fernández-Gago, 2008;
Nandakumar et al., 2010).
Moderation tests were further coupled with scatter plots/graphs and correlation
analysis. T-tests were conducted for comparing performance of difference groups of
companies. The results of all the tests are duly presented in form of suitable tables and
graphs as discussed by subsequent sections. The whole analyses were conducted using
SPSS.
4.5 Meeting Assumptions for Multiple Regression Analysis
Multiple regression analysis combines together various independent variables to study
their impact on a dependent variable (Azlina, 2013; Gujarati, 2006). There are usually
various econometric problems associated with multiple regression. These problems
need to be examined for ensuring that the interpretations of all regression models are
valid. There are seven major assumptions of multiple regression which are addressed
in this research and are discussed in this section. These are; outliers, sample size
adequacy, normality, linearity, homoscedasticity, autocorrelation, and
multicollinearity. The examination of these regression assumptions reveals that all
assumptions were met.
Moreover, before conducting any sort of analysis, the data was checked for any
missing values. Missing values were replaced using median of nearby 2 points. The
information about the missing values replacement is given in Appendix H.
145
4.5.1 Outliers
There were 124 companies in the beginning. The data was checked for any outliers
using Mahalanobis Distance. Mahalanobis Distance estimates each observation’s
position in comparison to centre of all observations on a set of variables and is
considered to be an effective method of removing outliers (Hair, Black, Babin, &
Anderson, 2009). There were 63 variables and by looking at chi-square table, the
value of chi-square for df = 63, p = 0.001 was 103.46. Hence, any company having
Mahalanobis value greater than this limit was removed from the analyses. Only one
company, KKB Engineering Bhd, crossed this limit (Mahalanobis value = 107.92)
and hence, it was deleted from the analyses. This resulted in no outliers left in the
analyses. Finally, 123 companies remained in the analyses.
4.5.2 Sample Size Adequacy
In this study, the unit of analysis is PLC. As mentioned above, 123 companies were
included in the analyses after data cleaning and screening. In determining appropriate
sample size, suggestions forwarded by Sekaran (2003) and Coakes, Steed, and Price
(2008) are followed in consistent with Azlina (2013). Sekaran (2003) suggested that
in a regression analysis, sample size must be ten times the number of variables, while
Coakes et al. (2008) argued that minimum sample size must be equal to five times the
number of variables. In this research, the maximum number of variables included in a
model is seven (7) as evident through Table 4.9 to Table 4.23. Hence, a sample of at
least 70 (10 x 7) companies was required and the minimum sample size could be 35
146
(5 x 7). As per these guidelines, the sample size of 123 was considered sufficient for
analyses.
4.5.3 Normality
Next, the data was checked for normality. Skewness and Kurtosis were used to assess
normality of variables (Curran, West, & Finch, 1996; Kim, 2013). Skewness measures
a distribution’s symmetry whereas kurtosis measures a distribution’s flatness or
peakedness (Hair et al., 2009).
According to Bassioni, Hassan, and Price (2008), Curran et al. (1996), and Kim
(2013), a distribution reasonably attains the standards of normality and could not be
called substantially non-normal if the skewness and kurtosis stay below the limits of 3
and 21 respectively. The normality test of all variables including dependent variables
revealed nearly all variables meeting these Skewness and Kurtosis limits of normality.
Hence, the assumption of normality of data was met for proceeding to the further
analyses.
4.5.4 Linearity
Linearity refers to the assumption that the changes in a dependent variable are
constant across a range of values for independent variables (Hair, Black, Babin, &
Anderson, 2010). A commonly followed method to examine the linearity of a data is
through residual plots, whereby standardized predicted value (*ZPRED) is plotted
against the standardized residual value (*ZRESID) (Azlina, 2013). Appendix I shows
147
the scatters for each of the regression models run in the analysis. Scatters demonstrate
no relationship (curvilinear relationship) between the standardized predicted values
and the standardized residual values. This provides evidence of meeting linearity
assumption (Azlina, 2013; Hair et al., 2009).
4.5.5 Multicollinearity
Multicollinearity or collinearity exists when one independent variable interacts highly
with two or more other independent variables in the multiple regressions and thus
distorts regression results (Cooper & Schindler, 2008). Variance Inflation Factor and
Tolerance Values are most effective indicators of multicollinearity, where VIF must
not exceed 10 and tolerance values must not be less than 0.1 (Hair et al., 2009). In this
study, for all the regressions, maximum VIF value has been 1.526 (which is less than
10) and minimum tolerance value has been 0.655 (which is more than 0.1). This
ensured that there was no multicollinearity among predictors.
4.5.6 Autocorrelation
Next, Durbin Watson test was conducted to examine autocorrelation so as to make
sure that all the observations were random and there was no significant correlation
among successive residuals. A Durbin Watson value between 1.5 – 2.5 is considered
to be satisfactory (Norusis, 1999). In this study, for all the regression models, this
value stayed between the limits with the minimum value of 1.563 and maximum value
of 2.296.
148
4.5.7 Homoscedasticity
Afterwards, the data was examined for any heteroscedasticity. If the variances of the
error terms (℮) are not constant over a range of independent variables, the data is said
to be heteroscedastic (Hair et al., 2009). Heteroscedasticity was also analysed for all
the regression models. Residual plots were developed by plotting standardized
residual values (*ZRESID) against standardized predicted values (*ZPRED). No
heteroscedasticity was found in any regression model as the plots did not demonstrate
any triangle-shaped, diamond-shaped, or non-linear-shaped pattern (Azlina, 2013;
Hair et al., 2010). To demonstrate homoscedasticity, the residual plots for all the
regressions models are shown in Appendix I.
4.6 Validity and Reliability of Questionnaire
This section discusses in detail the techniques used for examining and ensuring
validity and reliability of the questionnaire. It has been discussed already in the
Section 3.8 (Pilot Study and Questionnaire Pretesting) about how the instrument’s
face validity and content validity were ensured. Therefore, this section explains how
the construct validity of the instrument was addressed. Validity and reliability of four
variables (Three Corporate Parenting Roles – Synergy Manager, Parental Developer
and Portfolio Manager and Subjective Corporate Performance) is discussed here
through EFA and Cronbach’s alpha, as these variables were measured through
questionnaire.
149
4.6.1 Exploratory Factor Analysis (EFA)
Exploratory factor analysis was conducted to ensure instrument’s construct validity.
Basically, Exploratory Factor Analysis is used to reveal the nature of constructs
influencing a specific set of responses (DeCoster, 1998). Construct Validity is the
degree to which an instrument confirms a network of related hypotheses generated
from theory based on the concepts (Khalid et al., 2012; Zikmund, 2000). Construct
validity is assessed through convergent validity and discriminant validity. Convergent
validity is ensured when the variables measuring a particular construct correlate
highly with one another (Straub, Boudreau, & Gefen, 2004).
Whereas, an instrument is said to be having discriminant validity if by using similar
measures for researching different constructs results into relatively low inter
correlations (Cooper & Schindler, 2006; Khalid et al., 2012). In alignment with the
concept of construct validity, the purpose of EFA is also to discover the nature of
constructs that are affecting a specific set of responses (DeCoster, 1998). Hence, both
of these validities; convergent and discriminant validity can be assessed through EFA
(Ahmad, Omar, & Ramayah, 2012; Gefen & Straub, 2005).
4.6.1.1 EFA of Subjective Corporate Performance (SCP)
Subjective Corporate Performance was the only dependent variable that was measured
through the questionnaire. EFA of SCP was conducted so as to make sure that this
exercise results in extracting a single factor or component. Hence, EFA was
conducted by entering all the 10 items used to measure SCP in the variable list. The
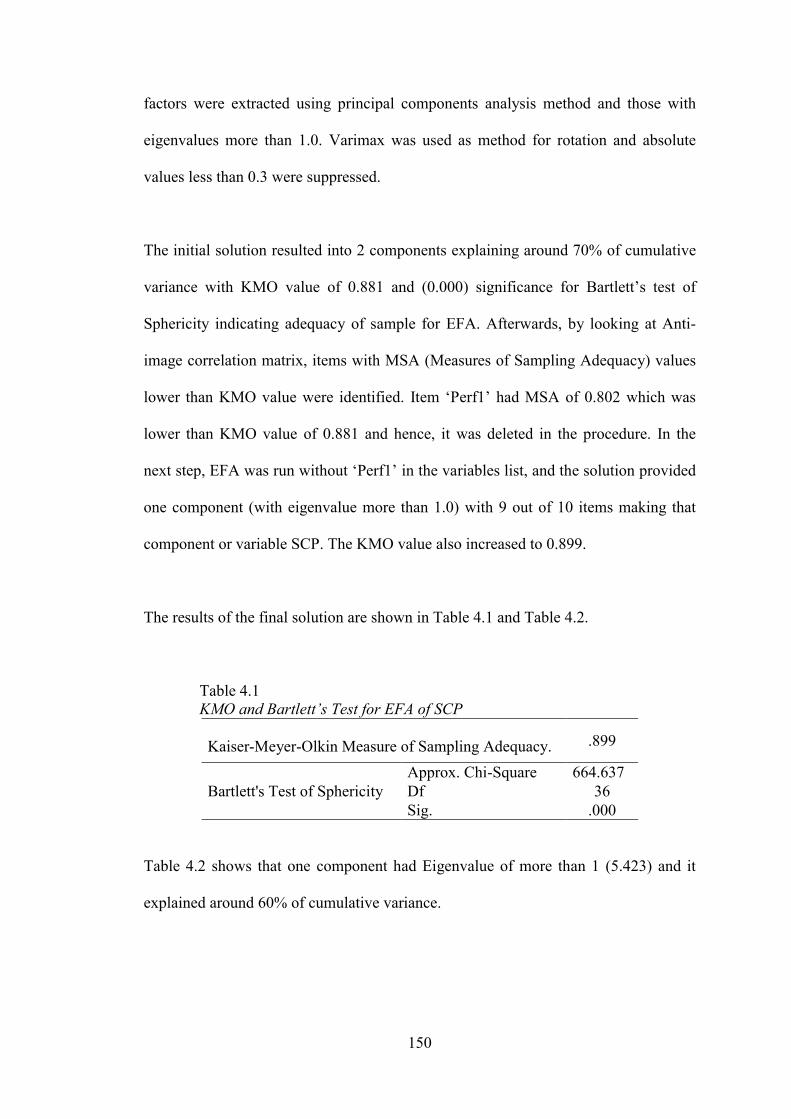
150
factors were extracted using principal components analysis method and those with
eigenvalues more than 1.0. Varimax was used as method for rotation and absolute
values less than 0.3 were suppressed.
The initial solution resulted into 2 components explaining around 70% of cumulative
variance with KMO value of 0.881 and (0.000) significance for Bartlett’s test of
Sphericity indicating adequacy of sample for EFA. Afterwards, by looking at Anti-
image correlation matrix, items with MSA (Measures of Sampling Adequacy) values
lower than KMO value were identified. Item ‘Perf1’ had MSA of 0.802 which was
lower than KMO value of 0.881 and hence, it was deleted in the procedure. In the
next step, EFA was run without ‘Perf1’ in the variables list, and the solution provided
one component (with eigenvalue more than 1.0) with 9 out of 10 items making that
component or variable SCP. The KMO value also increased to 0.899.
The results of the final solution are shown in Table 4.1 and Table 4.2.
Table 4.1 KMO and Bartlett’s Test for EFA of SCP
Kaiser-Meyer-Olkin Measure of Sampling Adequacy. .899
Bartlett's Test of Sphericity
Approx. Chi-Square 664.637 Df 36 Sig. .000
Table 4.2 shows that one component had Eigenvalue of more than 1 (5.423) and it
explained around 60% of cumulative variance.
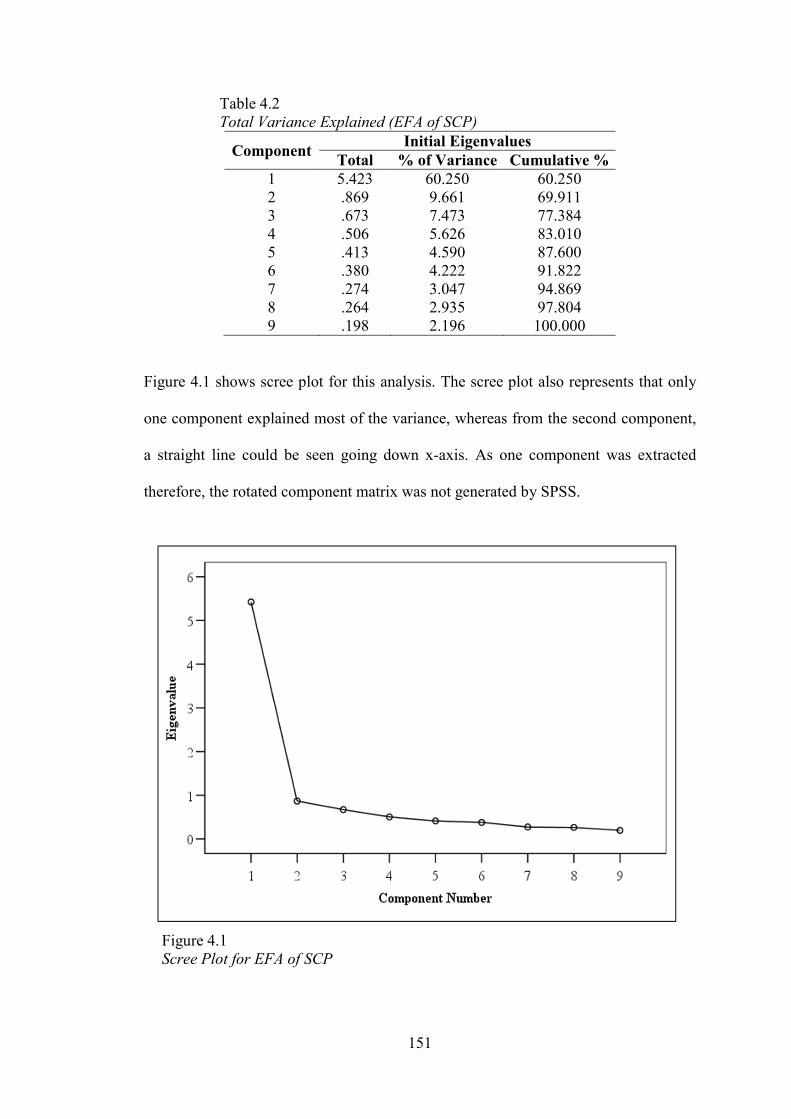
151
Table 4.2 Total Variance Explained (EFA of SCP)
Component Initial Eigenvalues
Total % of Variance Cumulative % 1 5.423 60.250 60.250 2 .869 9.661 69.911 3 .673 7.473 77.384 4 .506 5.626 83.010 5 .413 4.590 87.600 6 .380 4.222 91.822 7 .274 3.047 94.869 8 .264 2.935 97.804 9 .198 2.196 100.000
Figure 4.1 shows scree plot for this analysis. The scree plot also represents that only
one component explained most of the variance, whereas from the second component,
a straight line could be seen going down x-axis. As one component was extracted
therefore, the rotated component matrix was not generated by SPSS.
Figure 4.1 Scree Plot for EFA of SCP
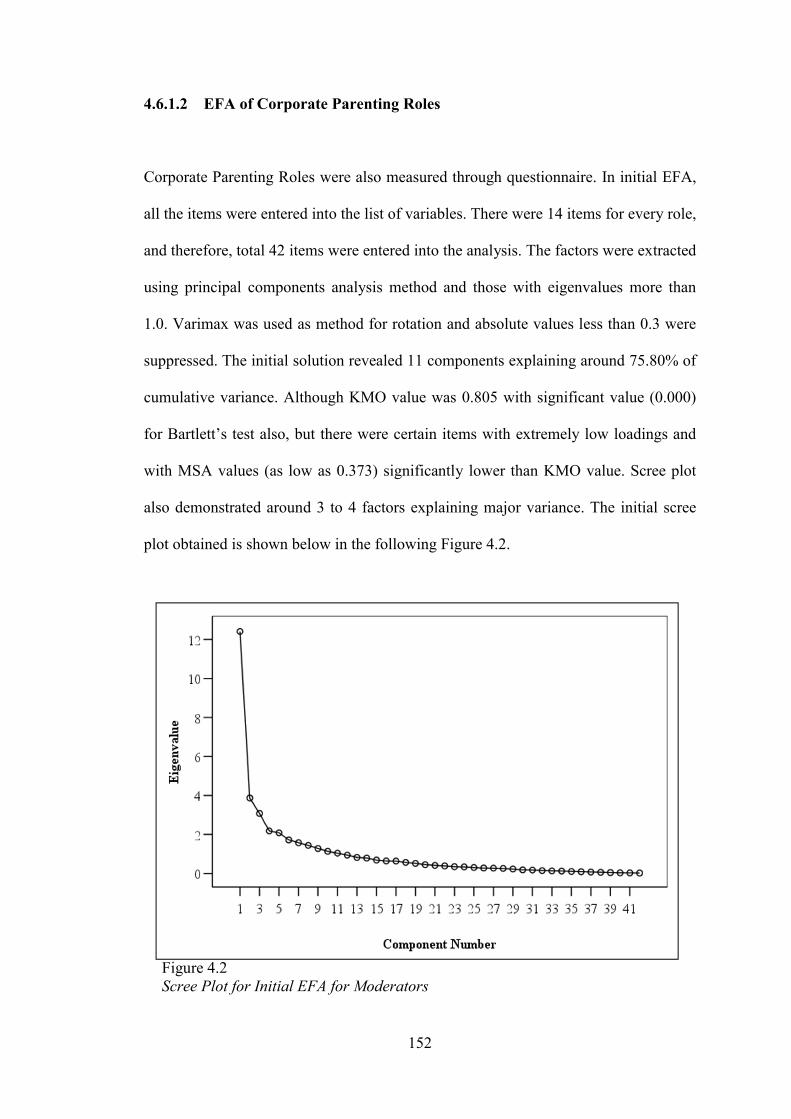
152
4.6.1.2 EFA of Corporate Parenting Roles
Corporate Parenting Roles were also measured through questionnaire. In initial EFA,
all the items were entered into the list of variables. There were 14 items for every role,
and therefore, total 42 items were entered into the analysis. The factors were extracted
using principal components analysis method and those with eigenvalues more than
1.0. Varimax was used as method for rotation and absolute values less than 0.3 were
suppressed. The initial solution revealed 11 components explaining around 75.80% of
cumulative variance. Although KMO value was 0.805 with significant value (0.000)
for Bartlett’s test also, but there were certain items with extremely low loadings and
with MSA values (as low as 0.373) significantly lower than KMO value. Scree plot
also demonstrated around 3 to 4 factors explaining major variance. The initial scree
plot obtained is shown below in the following Figure 4.2.
Figure 4.2 Scree Plot for Initial EFA for Moderators
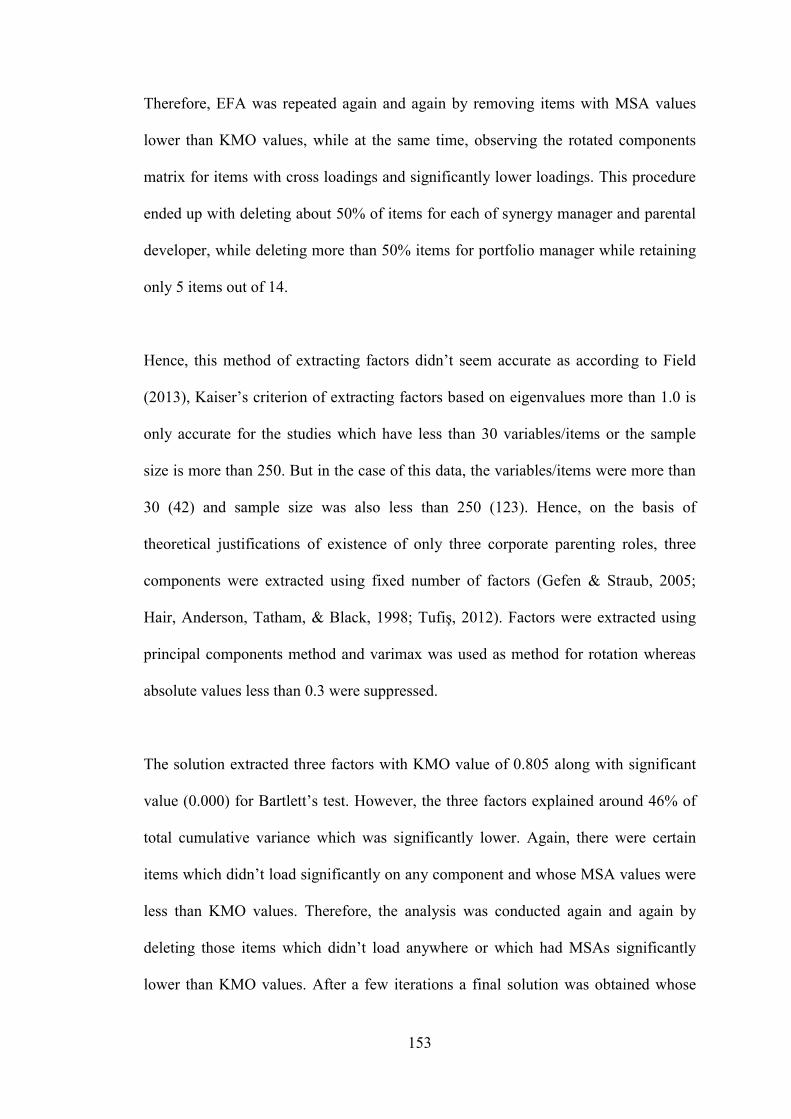
153
Therefore, EFA was repeated again and again by removing items with MSA values
lower than KMO values, while at the same time, observing the rotated components
matrix for items with cross loadings and significantly lower loadings. This procedure
ended up with deleting about 50% of items for each of synergy manager and parental
developer, while deleting more than 50% items for portfolio manager while retaining
only 5 items out of 14.
Hence, this method of extracting factors didn’t seem accurate as according to Field
(2013), Kaiser’s criterion of extracting factors based on eigenvalues more than 1.0 is
only accurate for the studies which have less than 30 variables/items or the sample
size is more than 250. But in the case of this data, the variables/items were more than
30 (42) and sample size was also less than 250 (123). Hence, on the basis of
theoretical justifications of existence of only three corporate parenting roles, three
components were extracted using fixed number of factors (Gefen & Straub, 2005;
Hair, Anderson, Tatham, & Black, 1998; Tufiş, 2012). Factors were extracted using
principal components method and varimax was used as method for rotation whereas
absolute values less than 0.3 were suppressed.
The solution extracted three factors with KMO value of 0.805 along with significant
value (0.000) for Bartlett’s test. However, the three factors explained around 46% of
total cumulative variance which was significantly lower. Again, there were certain
items which didn’t load significantly on any component and whose MSA values were
less than KMO values. Therefore, the analysis was conducted again and again by
deleting those items which didn’t load anywhere or which had MSAs significantly
lower than KMO values. After a few iterations a final solution was obtained whose
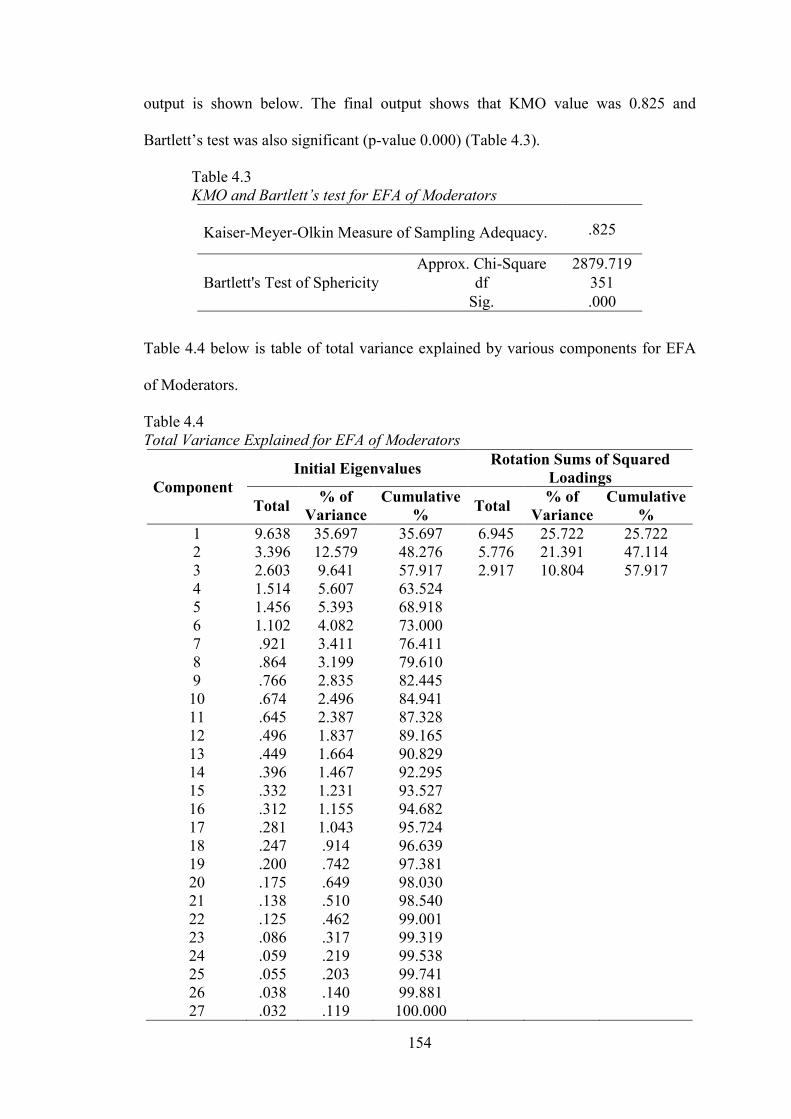
154
output is shown below. The final output shows that KMO value was 0.825 and
Bartlett’s test was also significant (p-value 0.000) (Table 4.3).
Table 4.3 KMO and Bartlett’s test for EFA of Moderators
Kaiser-Meyer-Olkin Measure of Sampling Adequacy. .825
Bartlett's Test of Sphericity
Approx. Chi-Square 2879.719 df 351
Sig. .000
Table 4.4 below is table of total variance explained by various components for EFA
of Moderators.
Table 4.4 Total Variance Explained for EFA of Moderators
Component Initial Eigenvalues
Rotation Sums of Squared Loadings
Total % of
Variance Cumulative
% Total
% of Variance
Cumulative %
1 9.638 35.697 35.697 6.945 25.722 25.722 2 3.396 12.579 48.276 5.776 21.391 47.114 3 2.603 9.641 57.917 2.917 10.804 57.917 4 1.514 5.607 63.524 5 1.456 5.393 68.918 6 1.102 4.082 73.000 7 .921 3.411 76.411 8 .864 3.199 79.610 9 .766 2.835 82.445 10 .674 2.496 84.941 11 .645 2.387 87.328 12 .496 1.837 89.165 13 .449 1.664 90.829 14 .396 1.467 92.295 15 .332 1.231 93.527 16 .312 1.155 94.682 17 .281 1.043 95.724 18 .247 .914 96.639 19 .200 .742 97.381 20 .175 .649 98.030 21 .138 .510 98.540 22 .125 .462 99.001 23 .086 .317 99.319 24 .059 .219 99.538 25 .055 .203 99.741 26 .038 .140 99.881 27 .032 .119 100.000
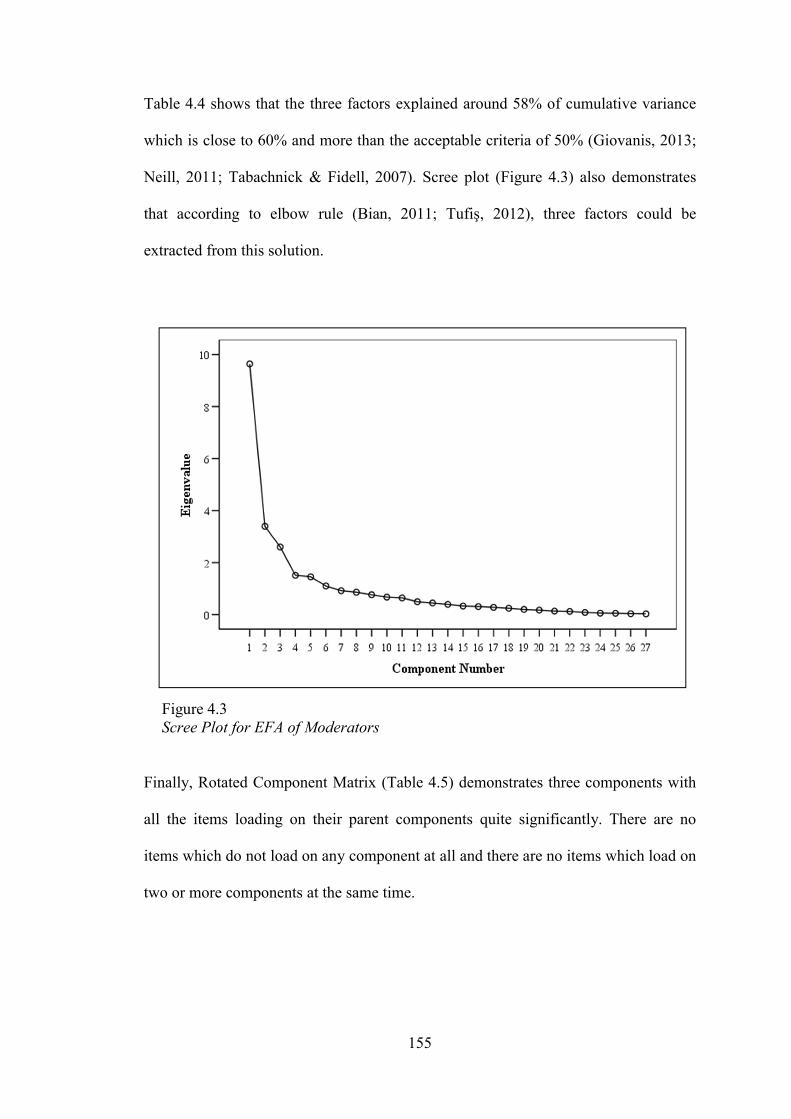
155
Table 4.4 shows that the three factors explained around 58% of cumulative variance
which is close to 60% and more than the acceptable criteria of 50% (Giovanis, 2013;
Neill, 2011; Tabachnick & Fidell, 2007). Scree plot (Figure 4.3) also demonstrates
that according to elbow rule (Bian, 2011; Tufiş, 2012), three factors could be
extracted from this solution.
Figure 4.3 Scree Plot for EFA of Moderators
Finally, Rotated Component Matrix (Table 4.5) demonstrates three components with
all the items loading on their parent components quite significantly. There are no
items which do not load on any component at all and there are no items which load on
two or more components at the same time.
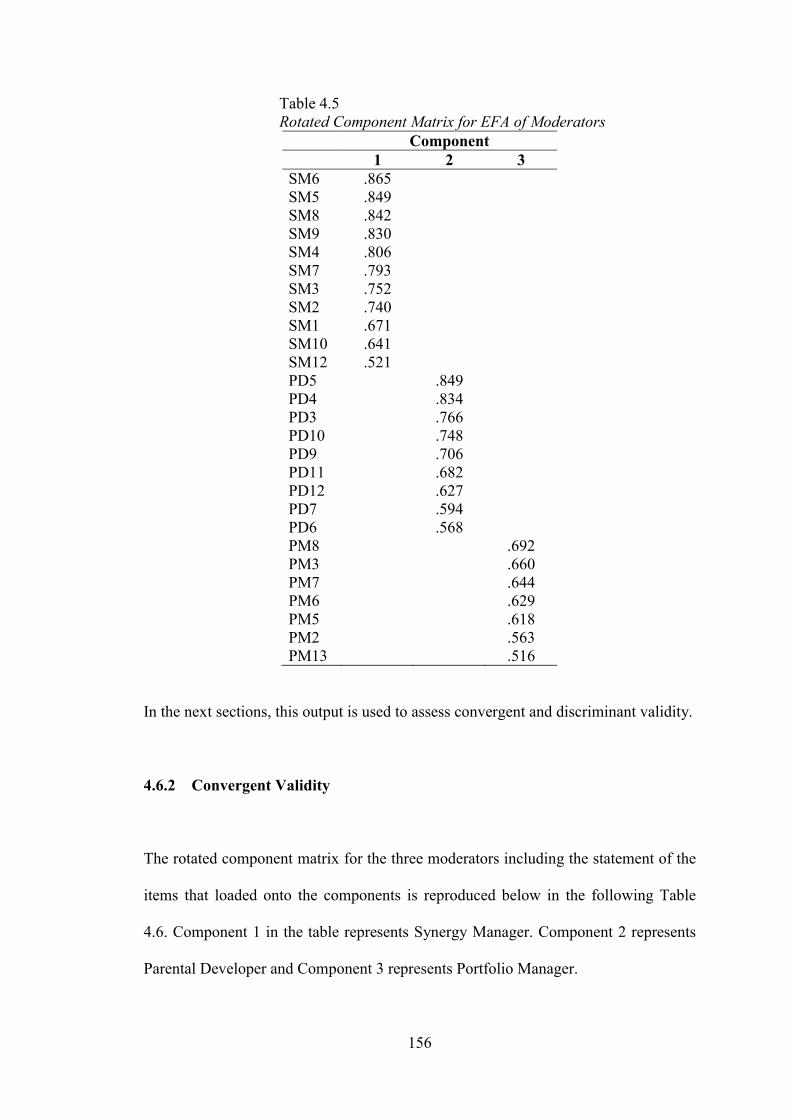
156
Table 4.5 Rotated Component Matrix for EFA of Moderators
Component 1 2 3
SM6 .865 SM5 .849 SM8 .842 SM9 .830 SM4 .806 SM7 .793 SM3 .752 SM2 .740 SM1 .671 SM10 .641 SM12 .521 PD5 .849 PD4 .834 PD3 .766 PD10 .748 PD9 .706 PD11 .682 PD12 .627 PD7 .594 PD6 .568 PM8 .692 PM3 .660 PM7 .644 PM6 .629 PM5 .618 PM2 .563 PM13 .516
In the next sections, this output is used to assess convergent and discriminant validity.
4.6.2 Convergent Validity
The rotated component matrix for the three moderators including the statement of the
items that loaded onto the components is reproduced below in the following Table
4.6. Component 1 in the table represents Synergy Manager. Component 2 represents
Parental Developer and Component 3 represents Portfolio Manager.
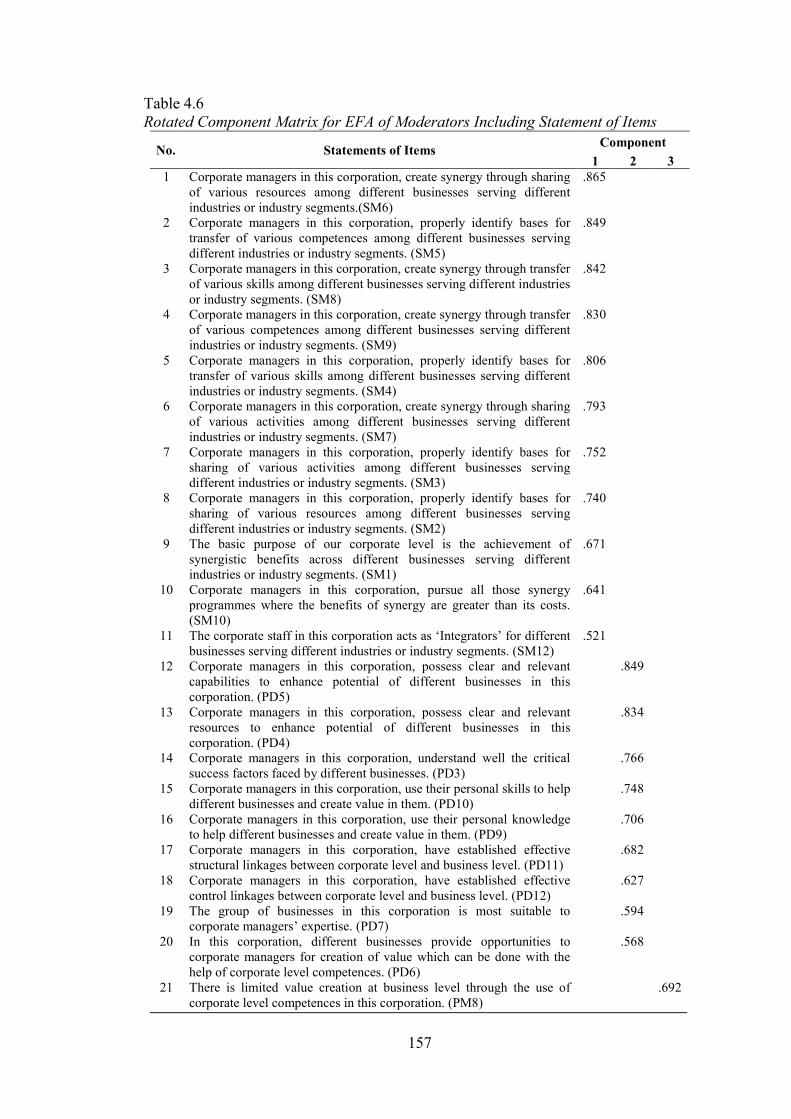
157
Table 4.6 Rotated Component Matrix for EFA of Moderators Including Statement of Items
No. Statements of Items Component
1 2 3 1 Corporate managers in this corporation, create synergy through sharing
of various resources among different businesses serving different industries or industry segments.(SM6)
.865
2 Corporate managers in this corporation, properly identify bases for transfer of various competences among different businesses serving different industries or industry segments. (SM5)
.849
3 Corporate managers in this corporation, create synergy through transfer of various skills among different businesses serving different industries or industry segments. (SM8)
.842
4 Corporate managers in this corporation, create synergy through transfer of various competences among different businesses serving different industries or industry segments. (SM9)
.830
5 Corporate managers in this corporation, properly identify bases for transfer of various skills among different businesses serving different industries or industry segments. (SM4)
.806
6 Corporate managers in this corporation, create synergy through sharing of various activities among different businesses serving different industries or industry segments. (SM7)
.793
7 Corporate managers in this corporation, properly identify bases for sharing of various activities among different businesses serving different industries or industry segments. (SM3)
.752
8 Corporate managers in this corporation, properly identify bases for sharing of various resources among different businesses serving different industries or industry segments. (SM2)
.740
9 The basic purpose of our corporate level is the achievement of synergistic benefits across different businesses serving different industries or industry segments. (SM1)
.671
10 Corporate managers in this corporation, pursue all those synergy programmes where the benefits of synergy are greater than its costs. (SM10)
.641
11 The corporate staff in this corporation acts as ‘Integrators’ for different businesses serving different industries or industry segments. (SM12)
.521
12 Corporate managers in this corporation, possess clear and relevant capabilities to enhance potential of different businesses in this corporation. (PD5)
.849
13 Corporate managers in this corporation, possess clear and relevant resources to enhance potential of different businesses in this corporation. (PD4)
.834
14 Corporate managers in this corporation, understand well the critical success factors faced by different businesses. (PD3)
.766
15 Corporate managers in this corporation, use their personal skills to help different businesses and create value in them. (PD10)
.748
16 Corporate managers in this corporation, use their personal knowledge to help different businesses and create value in them. (PD9)
.706
17 Corporate managers in this corporation, have established effective structural linkages between corporate level and business level. (PD11)
.682
18 Corporate managers in this corporation, have established effective control linkages between corporate level and business level. (PD12)
.627
19 The group of businesses in this corporation is most suitable to corporate managers’ expertise. (PD7)
.594
20 In this corporation, different businesses provide opportunities to corporate managers for creation of value which can be done with the help of corporate level competences. (PD6)
.568
21 There is limited value creation at business level through the use of corporate level competences in this corporation. (PM8)
.692
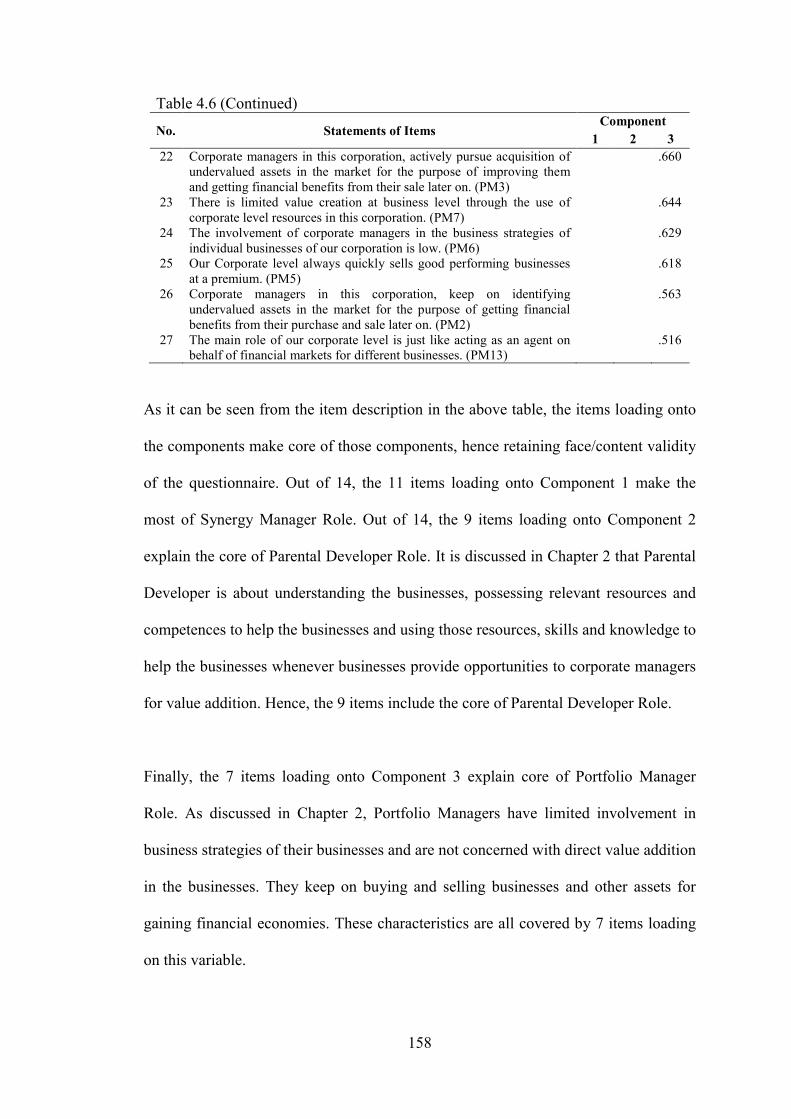
158
Table 4.6 (Continued)
No. Statements of Items Component
1 2 3
22 Corporate managers in this corporation, actively pursue acquisition of undervalued assets in the market for the purpose of improving them and getting financial benefits from their sale later on. (PM3)
.660
23 There is limited value creation at business level through the use of corporate level resources in this corporation. (PM7)
.644
24 The involvement of corporate managers in the business strategies of individual businesses of our corporation is low. (PM6)
.629
25 Our Corporate level always quickly sells good performing businesses at a premium. (PM5)
.618
26 Corporate managers in this corporation, keep on identifying undervalued assets in the market for the purpose of getting financial benefits from their purchase and sale later on. (PM2)
.563
27 The main role of our corporate level is just like acting as an agent on behalf of financial markets for different businesses. (PM13)
.516
As it can be seen from the item description in the above table, the items loading onto
the components make core of those components, hence retaining face/content validity
of the questionnaire. Out of 14, the 11 items loading onto Component 1 make the
most of Synergy Manager Role. Out of 14, the 9 items loading onto Component 2
explain the core of Parental Developer Role. It is discussed in Chapter 2 that Parental
Developer is about understanding the businesses, possessing relevant resources and
competences to help the businesses and using those resources, skills and knowledge to
help the businesses whenever businesses provide opportunities to corporate managers
for value addition. Hence, the 9 items include the core of Parental Developer Role.
Finally, the 7 items loading onto Component 3 explain core of Portfolio Manager
Role. As discussed in Chapter 2, Portfolio Managers have limited involvement in
business strategies of their businesses and are not concerned with direct value addition
in the businesses. They keep on buying and selling businesses and other assets for
gaining financial economies. These characteristics are all covered by 7 items loading
on this variable.

159
The items are also loading high onto their components. Hair et al. (2009) proposed a
criterion of minimum factor loading of 0.50 on its hypothesized construct for ensuring
the construct validity. Additionally, as per Comrey and Lee (1992) guidelines, any
loadings greater than 0.70 are considered excellent, loadings greater than 0.63 are
considered very good, loadings greater than 0.55 are considered good, loadings
greater than 0.45 are considered fair, and those loadings greater than 0.32 only are
considered poor.
Convergent validity is the extent to which scores on a particular instrument are
correlating with scores on the other instruments supposed to measure same construct
(Cooper & Schindler, 2006). It can be seen from the factor loadings for component 1
(termed as Synergy Manager) that all the loadings are higher than criterion of 0.50.
Lowest loading is 0.521, while highest loading is 0.865. This verifies convergent
validity of Component 1 (Synergy Manager). For Component 2 (termed as Parental
Developer), the factor loadings range from 0.568 to 0.849 which also confirm
convergent validity for Component 2 (Parental Developer). Lastly, for Component 3
(termed as Portfolio Manager), the factor loadings are ranging from 0.516 to 0.692
which also ensures the convergent validity of Component 3 (Portfolio Manager).
4.6.3 Discriminant Validity
Discriminant validity is the extent to which scores on a particular instrument are not
correlating with scores from other instruments supposed to measure different
constructs (Cooper & Schindler, 2006). Hence, given this definition, the absence of
any cross loadings among components in the rotated components matrix could verify
160
discriminant validity of the instrument. By looking again at the Table 4.5 for Rotated
Components Matrix, it can be observed that all the items are only loading onto their
respective components and there are no cross loadings between components. This
verifies discriminant validity of the instrument.
4.6.4 Reliability
Reliability is the extent to which a measurement instrument is stable or provides
consistent results, its items are homogeneous, and reveal the same basic construct
(Whitelaw, 2001; Zikmund, 2000). Cronbach’s alpha is most frequently used
indicator for assessing reliability (Cronbach, 1951) which must bare a minimum score
of 0.70 (Nunnaly, 1978). Cronbach’s alpha for all four variables measured through
questionnaire is shown below in the following Table 4.7.
Table 4.7 Cronbach’s Alpha for All Variables
No. Variable Cronbach’s Alpha
1 Portfolio Manager 0.747 2 Synergy Manager 0.939 3 Parental Developer 0.902 4 Subjective Corporate Performance 0.915
It can be seen that Cronbach’s alpha for all variables is more than a minimum limit of
0.70, hence verifying reliability of these scales.
4.7 Descriptive Statistics of the Variables
Descriptive statistics display basic characteristics of data and provide useful
information. Table of descriptive statistics explaining mean, standard deviation,
161
range, variance and other characteristics is provided in Appendix J. Moreover,
frequency distribution for the level of Experience is also provided in Appendix K. It
shows that highest percentage (32.5%) of managers was having experience from 1-5
years followed by 22.8 % of managers having experience from 11-15 years. Only one
manager had experience between 31-35 years.
Appendix K also displays frequency table for Expertise. By looking at the table, it
shows that many of the respondents (30) belonged to ‘other’ area of expertise
including risk management, corporate planning and corporate strategy formulation
(24.4%) followed by accounting (17.1%) and finance (15.4%). Pie chart of expertise
is also provided in Appendix L.
4.8 Hypotheses Testing
The tests of all hypotheses involving effect of independent variable(s) on dependent
variable(s) were conducted using simple linear regression or multiple linear
regression. For each regression model, important statistics such as adjusted R2, model
significance, beta values, t-statistics and significance of beta coefficients is shown. As
regression models and discussions include abbreviations, therefore a List of
Abbreviations is provided on page xix.
4.8.1 Testing Effect of Product Diversification Strategy (DT) on Corporate Performance (H1a1 to H1a4, and H1b)
As a first test, the effect of total diversification DT (extent of product diversification
strategy) on corporate performance was examined using simple linear regression.
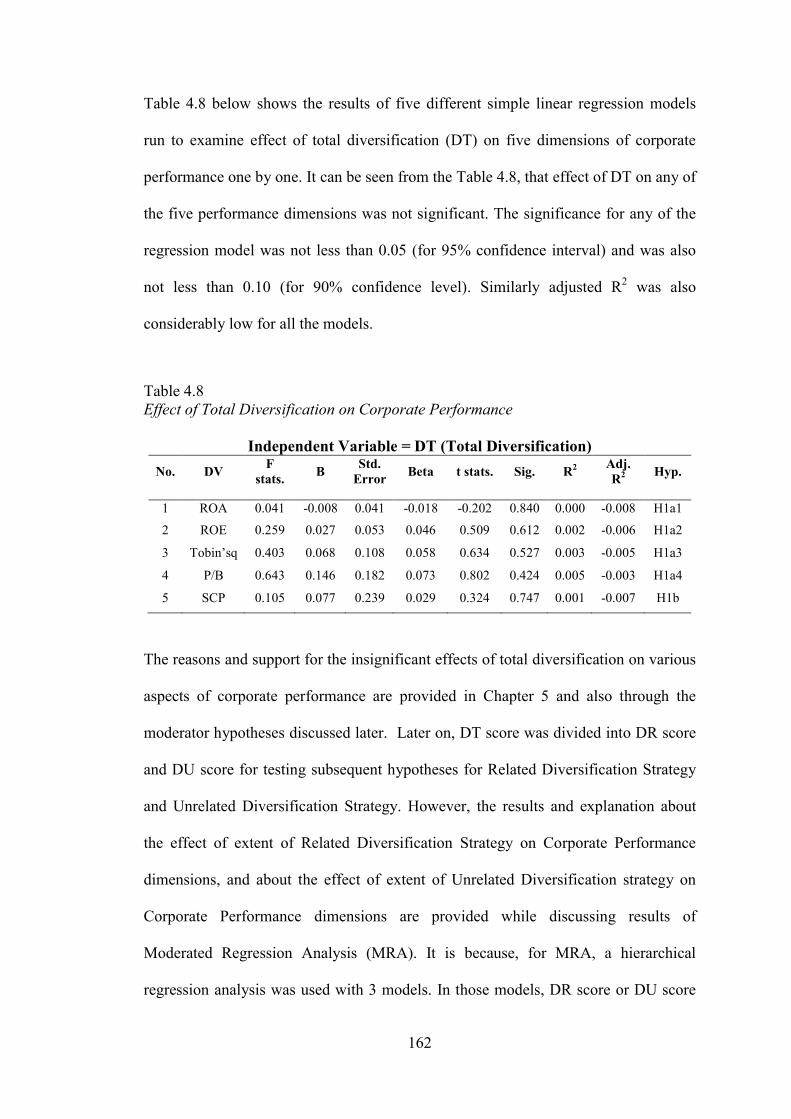
162
Table 4.8 below shows the results of five different simple linear regression models
run to examine effect of total diversification (DT) on five dimensions of corporate
performance one by one. It can be seen from the Table 4.8, that effect of DT on any of
the five performance dimensions was not significant. The significance for any of the
regression model was not less than 0.05 (for 95% confidence interval) and was also
not less than 0.10 (for 90% confidence level). Similarly adjusted R2 was also
considerably low for all the models.
Table 4.8 Effect of Total Diversification on Corporate Performance
Independent Variable = DT (Total Diversification)
No. DV F
stats. B
Std. Error
Beta t stats. Sig. R2 Adj. R2
Hyp.
1 ROA 0.041 -0.008 0.041 -0.018 -0.202 0.840 0.000 -0.008 H1a1
2 ROE 0.259 0.027 0.053 0.046 0.509 0.612 0.002 -0.006 H1a2
3 Tobin’sq 0.403 0.068 0.108 0.058 0.634 0.527 0.003 -0.005 H1a3
4 P/B 0.643 0.146 0.182 0.073 0.802 0.424 0.005 -0.003 H1a4
5 SCP 0.105 0.077 0.239 0.029 0.324 0.747 0.001 -0.007 H1b
The reasons and support for the insignificant effects of total diversification on various
aspects of corporate performance are provided in Chapter 5 and also through the
moderator hypotheses discussed later. Later on, DT score was divided into DR score
and DU score for testing subsequent hypotheses for Related Diversification Strategy
and Unrelated Diversification Strategy. However, the results and explanation about
the effect of extent of Related Diversification Strategy on Corporate Performance
dimensions, and about the effect of extent of Unrelated Diversification strategy on
Corporate Performance dimensions are provided while discussing results of
Moderated Regression Analysis (MRA). It is because, for MRA, a hierarchical
regression analysis was used with 3 models. In those models, DR score or DU score
163
was entered that provided results of required hypotheses. It is elaborated further in the
next section.
4.8.2 Testing Moderator Hypotheses
As discussed before, the tests of moderators were done using Moderated Regression
Analysis (MRA). Initially, for the analysis, primary nature variables were computed
by taking a mean of all the items loading onto the particular components during EFA.
Moderated Regression Analysis was conducted using interaction terms for moderators
and independent variables, as proposed by Hair et al. (2009) and Sharma, Durand, and
Gur-Arie (1981). Interaction terms are usually developed by multiplying the
independent variable with the moderating variable. However, while doing that, a
common problem faced by the researchers is that of multicollinearity.
Specifically, multicollinearity develops between those interaction terms and the
corresponding independent and moderator variables. In this study, three interaction
terms were created for moderators’ tests as follows:
1. DRSM = By multiplying DR with SM (Synergy Manager)
2. DRPD = By multiplying DR with PD (Parental Developer)
3. DUPM = By multiplying DU with PM (Portfolio Manager)
As expected earlier, development of these interaction terms produced
multicollinearity between interaction terms and their corresponding independent and
moderating variables. Correlations’ tables showing high correlation between
164
interaction terms and their independent and moderator variables are provided in
Appendix M.
Firstly, it can be seen from those Appendices that correlation between DRxSM and
DR was high (0.983**), correlation between DRxPD and DR was also high (0.991**)
and correlations between DUxPM and DU and between DUPM and PM (Portfolio
Manager) were also high at 0.942** and 0.270** (significant though not high)
respectively. Initial regression models run with these terms also showed high
multicollinearity with VIF crossing the limit of 10.
Hence, in order to solve this problem, the concerned variables were centred around
mean (Aiken & West, 1991; Lehmann et al., 2001; Shieh, 2011). A centred variable is
created by subtracting the variable mean from every observation of that variable. In
this way, DR was transformed into DRCentred, DU into DUCentred, SM into
SMCentred, PD into PDCentred and PM into PMCentred. The new interaction terms
created were as follows:
1. DRSMCentred = By multiplying DRCentred with SMCentred
2. DRPDCentred = By multiplying DRCentred with PDCentred
3. DUPMCentred = By multiplying DUCentred with PMCentred
After doing this, correlations were again checked between these variables and it was
found that problem of multicollinearity was reduced to a great extent. Further, as
stated before, in all the regression models, VIF didn’t exceed 1.526 (whereas the limit
is 10) and minimum tolerance value has been 0.655 (whereas it should be at least
165
more than 0.1). Appendix N shows correlation tables between these variables. Hence,
centring removed the problem of multicollinearity to proceed for the further analysis.
As mentioned before, moderator tests were conducted using hierarchical regression
analysis. Three models were constructed. In the first model, only the main variable
(either DRCentred or DUCentred) was entered. This enabled examining effects of
diversification strategies over different performance dimensions, which was also one
of the objectives of the study. In the second model, the moderator (centred moderator
appearing as another predictor variable) was also entered along with all control
variables (Age, Size, Leverage Experience). Finally, in the third model, all the
predictors were entered along with the centred interaction term. Moderator effect was
studied through increase in the third model’s significance compared to first two
models, significant change in F-statistics (for R2 change), and/or through the
significance level of interaction term. If the significance levels were achieved, the
moderator effect was proved (Hair et al., 2009).
Apart from that, a moderator could be a pure moderator or a quasi moderator. A ‘pure
moderator’ changes the form of relationship between the dependent and independent
variables. A pure moderator interacts with predictors and has negligible correlation
with the dependent variable. (Sharma et al., 1981; Zahra, 1996). A ‘quasi
moderator’ although also modifies the form of the relationship between the
dependent and Independent variables as it significantly interacts with independent
variables, but it also possesses a significant relation with dependent variable (Sharma
et al., 1981; Zahra, 1996).
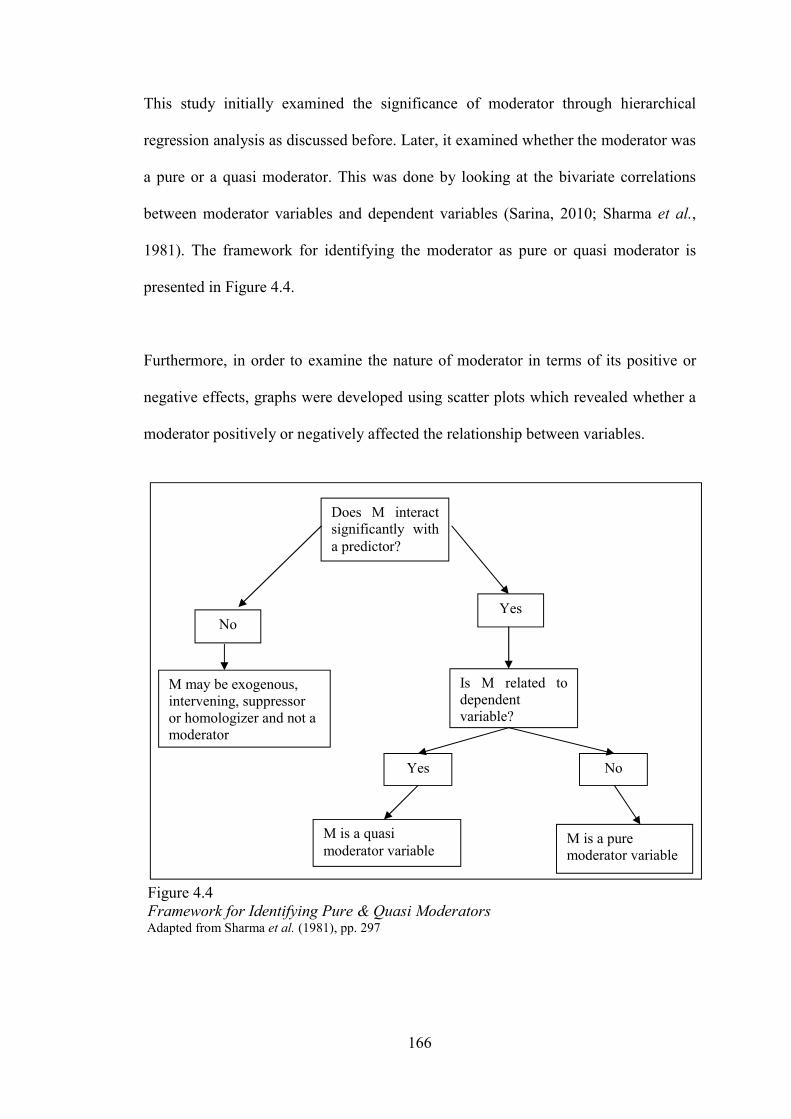
166
This study initially examined the significance of moderator through hierarchical
regression analysis as discussed before. Later, it examined whether the moderator was
a pure or a quasi moderator. This was done by looking at the bivariate correlations
between moderator variables and dependent variables (Sarina, 2010; Sharma et al.,
1981). The framework for identifying the moderator as pure or quasi moderator is
presented in Figure 4.4.
Furthermore, in order to examine the nature of moderator in terms of its positive or
negative effects, graphs were developed using scatter plots which revealed whether a
moderator positively or negatively affected the relationship between variables.
Figure 4.4 Framework for Identifying Pure & Quasi Moderators Adapted from Sharma et al. (1981), pp. 297
Does M interact significantly with a predictor?
Yes
Is M related to dependent variable?
Yes
M may be exogenous, intervening, suppressor or homologizer and not a moderator
No
M is a pure moderator variable
M is a quasi moderator variable
No
167
4.8.3 Testing Moderator Effects of Corporate Parenting Roles on the Relationship between Diversification Strategies and Financial Corporate Performance
This section presents test results of hierarchical regression analysis for the moderating
effects of three moderator variables; Synergy Manager, Parental Developer and
Portfolio Manager. For each Moderator and type of Diversification Strategy, results
are presented one by one for the four dimensions of Financial Corporate Performance.
4.8.3.1 Testing Moderator Effect of Synergy Manager on the Relationship between Related Diversification Strategy and Financial Corporate Performance (H2ai1 to H2ai4)
This subsection presents results about whether Synergy Manager acts as moderator
between Related Diversification Strategy and Financial Corporate Performance. As
the four financial ratios could not be aggregated into one index, therefore analysis is
presented one by one for all four financial ratios.
4.8.3.1.1 Testing Moderator Effect of Synergy Manager on the Relationship between Related Diversification Strategy and ROA (H2ai1)
Table 4.9 shows the results of multiple regressions conducted to test hypothesis
H2ai1. It can be seen from the table that although model 3 (including all predictors
along with interaction term for moderation) overall was significant, but the interaction
term (DRSMCentred) was not significant (Sig. = 0.852). Hence, for the third model,
the F-Change was also not significant (Sig. = 0.852). The coefficient for DRCentred
variable was also not significant for any model. Hence, it is concluded here that
related diversification has no significant effect on ROA. Moreover, Synergy Manager
does not act as moderator between related diversification and ROA.
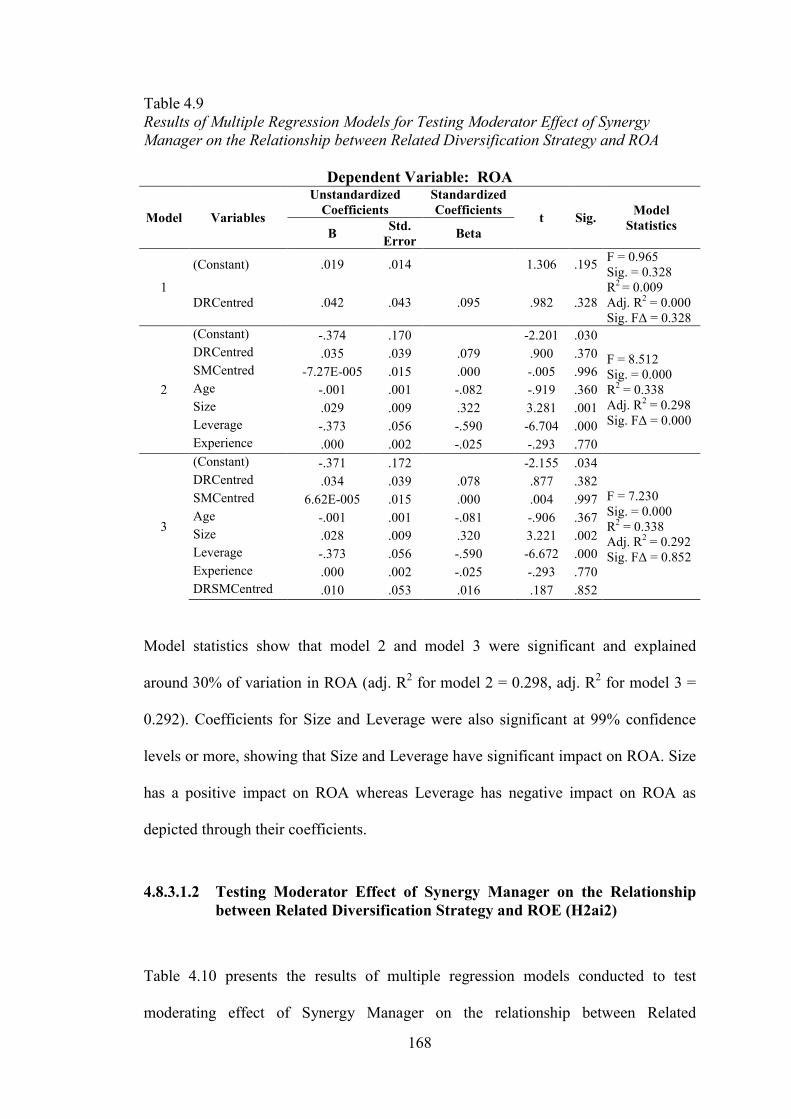
168
Table 4.9 Results of Multiple Regression Models for Testing Moderator Effect of Synergy Manager on the Relationship between Related Diversification Strategy and ROA
Dependent Variable: ROA
Model Variables
Unstandardized Coefficients
Standardized Coefficients
t Sig. Model
Statistics B
Std. Error
Beta
1
(Constant) .019 .014 1.306 .195 F = 0.965 Sig. = 0.328
DRCentred .042 .043 .095 .982 .328
R2 = 0.009 Adj. R2 = 0.000 Sig. FΔ = 0.328
2
(Constant) -.374 .170 -2.201 .030
F = 8.512 Sig. = 0.000 R2 = 0.338 Adj. R2 = 0.298 Sig. FΔ = 0.000
DRCentred .035 .039 .079 .900 .370
SMCentred -7.27E-005 .015 .000 -.005 .996
Age -.001 .001 -.082 -.919 .360
Size .029 .009 .322 3.281 .001
Leverage -.373 .056 -.590 -6.704 .000
Experience .000 .002 -.025 -.293 .770
3
(Constant) -.371 .172 -2.155 .034
F = 7.230 Sig. = 0.000 R2 = 0.338 Adj. R2 = 0.292 Sig. FΔ = 0.852
DRCentred .034 .039 .078 .877 .382
SMCentred 6.62E-005 .015 .000 .004 .997
Age -.001 .001 -.081 -.906 .367
Size .028 .009 .320 3.221 .002
Leverage -.373 .056 -.590 -6.672 .000
Experience .000 .002 -.025 -.293 .770
DRSMCentred .010 .053 .016 .187 .852
Model statistics show that model 2 and model 3 were significant and explained
around 30% of variation in ROA (adj. R2 for model 2 = 0.298, adj. R2 for model 3 =
0.292). Coefficients for Size and Leverage were also significant at 99% confidence
levels or more, showing that Size and Leverage have significant impact on ROA. Size
has a positive impact on ROA whereas Leverage has negative impact on ROA as
depicted through their coefficients.
4.8.3.1.2 Testing Moderator Effect of Synergy Manager on the Relationship between Related Diversification Strategy and ROE (H2ai2)
Table 4.10 presents the results of multiple regression models conducted to test
moderating effect of Synergy Manager on the relationship between Related
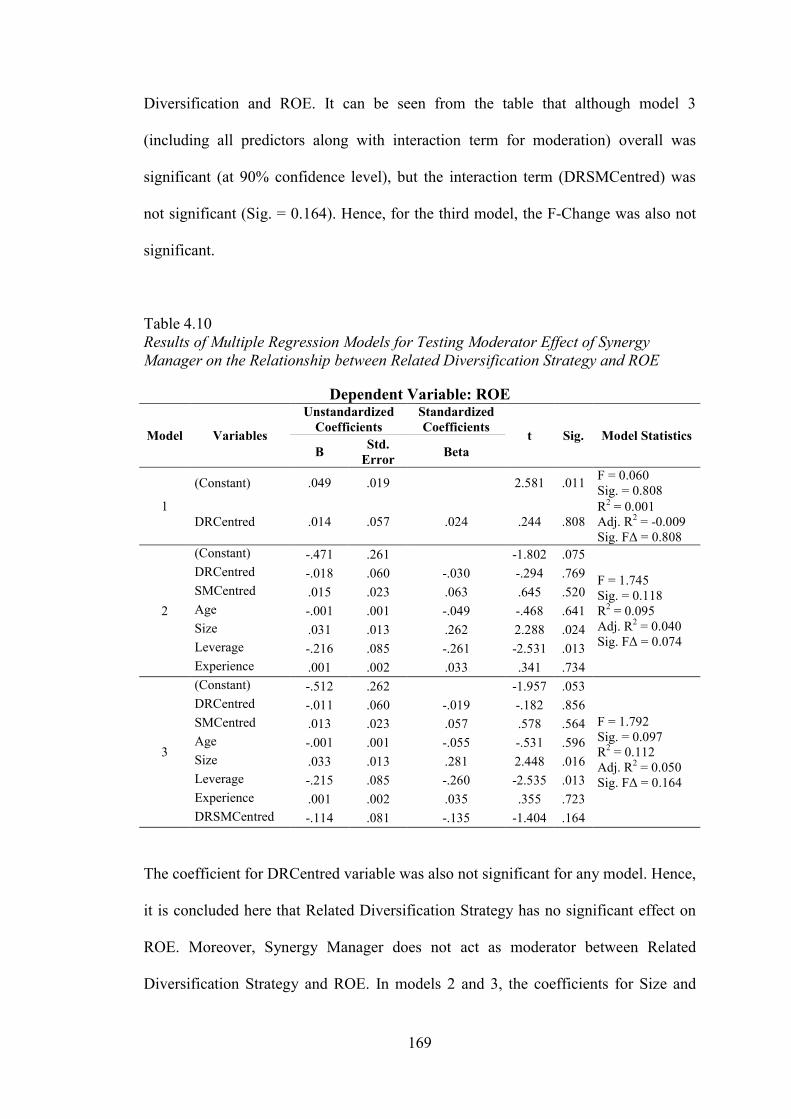
169
Diversification and ROE. It can be seen from the table that although model 3
(including all predictors along with interaction term for moderation) overall was
significant (at 90% confidence level), but the interaction term (DRSMCentred) was
not significant (Sig. = 0.164). Hence, for the third model, the F-Change was also not
significant.
Table 4.10 Results of Multiple Regression Models for Testing Moderator Effect of Synergy Manager on the Relationship between Related Diversification Strategy and ROE
Dependent Variable: ROE
Model Variables
Unstandardized Coefficients
Standardized Coefficients
t Sig. Model Statistics B
Std. Error
Beta
1
(Constant) .049 .019 2.581 .011 F = 0.060 Sig. = 0.808
DRCentred .014 .057 .024 .244 .808
R2 = 0.001 Adj. R2 = -0.009 Sig. FΔ = 0.808
2
(Constant) -.471 .261 -1.802 .075
F = 1.745 Sig. = 0.118 R2 = 0.095 Adj. R2 = 0.040 Sig. FΔ = 0.074
DRCentred -.018 .060 -.030 -.294 .769
SMCentred .015 .023 .063 .645 .520
Age -.001 .001 -.049 -.468 .641
Size .031 .013 .262 2.288 .024
Leverage -.216 .085 -.261 -2.531 .013
Experience .001 .002 .033 .341 .734
3
(Constant) -.512 .262 -1.957 .053
F = 1.792 Sig. = 0.097 R2 = 0.112 Adj. R2 = 0.050 Sig. FΔ = 0.164
DRCentred -.011 .060 -.019 -.182 .856
SMCentred .013 .023 .057 .578 .564
Age -.001 .001 -.055 -.531 .596
Size .033 .013 .281 2.448 .016
Leverage -.215 .085 -.260 -2.535 .013
Experience .001 .002 .035 .355 .723
DRSMCentred -.114 .081 -.135 -1.404 .164
The coefficient for DRCentred variable was also not significant for any model. Hence,
it is concluded here that Related Diversification Strategy has no significant effect on
ROE. Moreover, Synergy Manager does not act as moderator between Related
Diversification Strategy and ROE. In models 2 and 3, the coefficients for Size and
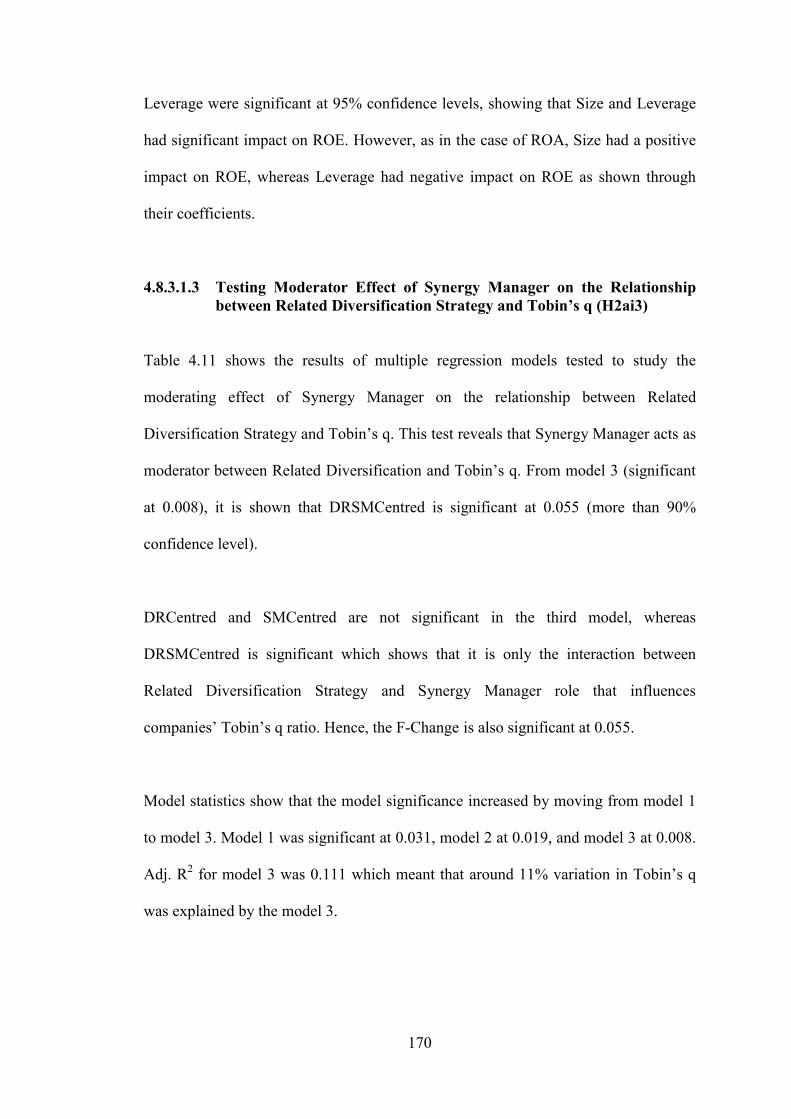
170
Leverage were significant at 95% confidence levels, showing that Size and Leverage
had significant impact on ROE. However, as in the case of ROA, Size had a positive
impact on ROE, whereas Leverage had negative impact on ROE as shown through
their coefficients.
4.8.3.1.3 Testing Moderator Effect of Synergy Manager on the Relationship between Related Diversification Strategy and Tobin’s q (H2ai3)
Table 4.11 shows the results of multiple regression models tested to study the
moderating effect of Synergy Manager on the relationship between Related
Diversification Strategy and Tobin’s q. This test reveals that Synergy Manager acts as
moderator between Related Diversification and Tobin’s q. From model 3 (significant
at 0.008), it is shown that DRSMCentred is significant at 0.055 (more than 90%
confidence level).
DRCentred and SMCentred are not significant in the third model, whereas
DRSMCentred is significant which shows that it is only the interaction between
Related Diversification Strategy and Synergy Manager role that influences
companies’ Tobin’s q ratio. Hence, the F-Change is also significant at 0.055.
Model statistics show that the model significance increased by moving from model 1
to model 3. Model 1 was significant at 0.031, model 2 at 0.019, and model 3 at 0.008.
Adj. R2 for model 3 was 0.111 which meant that around 11% variation in Tobin’s q
was explained by the model 3.
171
Table 4.11 Results of Multiple Regression Models for Testing Moderator Effect of Synergy Manager on the Relationship between Related Diversification Strategy and Tobin’s q
Dependent Variable: Tobin’s q
Model Variables
Unstandardized Coefficients
Standardized Coefficients
t Sig. Model Statistics B
Std. Error
Beta
1
(Constant) DRCentred
.948 .040 23.820 .000 F = 4.786 Sig. = 0.031 R2 = 0.044 Adj. R2 = 0.034 Sig. FΔ = 0.031
.259 .118 .209 2.188 .031
2
(Constant) -.178 .545 -.326 .745
F = 2.676 Sig. = 0.019 R2 = 0.138 Adj. R2 = 0.087 Sig. FΔ = 0.060
DRCentred .154 .125 .124 1.235 .220
SMCentred -.064 .048 -.128 -1.336 .185
Age .002 .002 .065 .647 .519
Size .046 .028 .184 1.644 .103
Leverage .348 .178 .197 1.958 .053
Experience .000 .005 .005 .057 .955
3
(Constant) -.295 .541 -.546 .586
F = 2.898 Sig. = 0.008 R2 = 0.170 Adj. R2 = 0.111 Sig. FΔ = 0.055
DRCentred .173 .123 .140 1.405 .163
SMCentred -.069 .047 -.137 -1.448 .151
Age .001 .002 .057 .570 .570
Size .052 .028 .209 1.883 .063
Leverage .350 .176 .198 1.996 .049
Experience .000 .005 .007 .075 .941
DRSMCentred -.326 .168 -.181 -1.944 .055
Furthermore, correlation was also examined between SM and Tobin’s q which was
not significant (Pearson correlation = -0.017, sig (2-tailed) = 0.849). This concluded
that SM was a pure moderator between DR and Tobin’s q.
In order to interpret the nature of moderation, graphs using scatter plots were made
following past scholars (Sarina, 2010; Warner, 2013). To do this, firstly, all the data
was sorted by Synergy Manager means in ascending order. A new variable was
created with the title SMlevel and values of 1, 2 or 3 were assigned to it based on the
mean of Synergy Manager (now sorted ascending wise). As Corporate Parenting
Roles were measured using 7-point Likert-type scale, therefore the means of all these
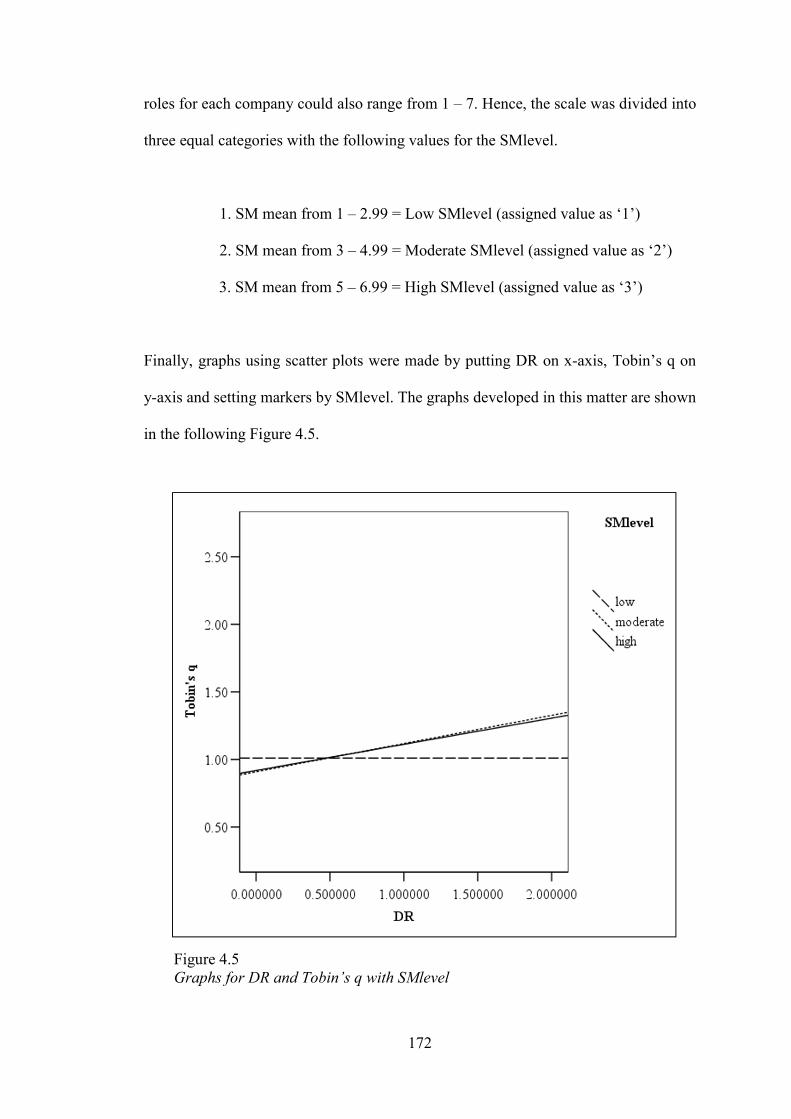
172
roles for each company could also range from 1 – 7. Hence, the scale was divided into
three equal categories with the following values for the SMlevel.
1. SM mean from 1 – 2.99 = Low SMlevel (assigned value as ‘1’)
2. SM mean from 3 – 4.99 = Moderate SMlevel (assigned value as ‘2’)
3. SM mean from 5 – 6.99 = High SMlevel (assigned value as ‘3’)
Finally, graphs using scatter plots were made by putting DR on x-axis, Tobin’s q on
y-axis and setting markers by SMlevel. The graphs developed in this matter are shown
in the following Figure 4.5.
Figure 4.5 Graphs for DR and Tobin’s q with SMlevel
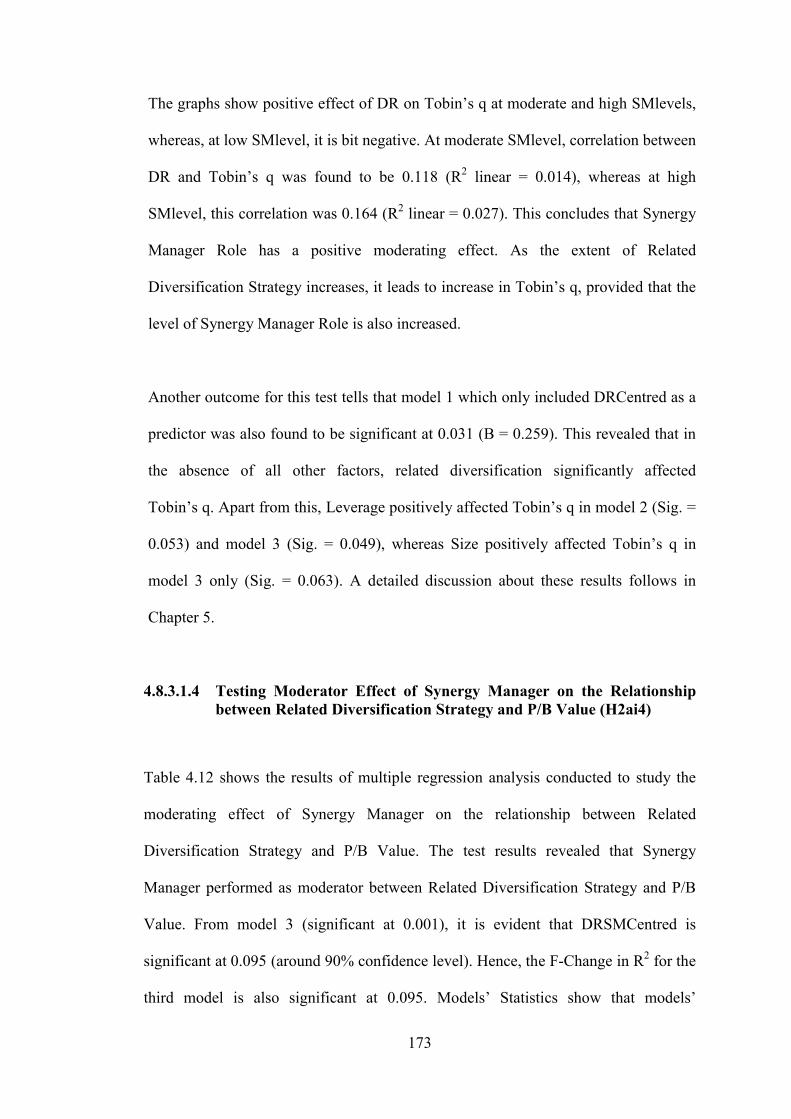
173
The graphs show positive effect of DR on Tobin’s q at moderate and high SMlevels,
whereas, at low SMlevel, it is bit negative. At moderate SMlevel, correlation between
DR and Tobin’s q was found to be 0.118 (R2 linear = 0.014), whereas at high
SMlevel, this correlation was 0.164 (R2 linear = 0.027). This concludes that Synergy
Manager Role has a positive moderating effect. As the extent of Related
Diversification Strategy increases, it leads to increase in Tobin’s q, provided that the
level of Synergy Manager Role is also increased.
Another outcome for this test tells that model 1 which only included DRCentred as a
predictor was also found to be significant at 0.031 (B = 0.259). This revealed that in
the absence of all other factors, related diversification significantly affected
Tobin’s q. Apart from this, Leverage positively affected Tobin’s q in model 2 (Sig. =
0.053) and model 3 (Sig. = 0.049), whereas Size positively affected Tobin’s q in
model 3 only (Sig. = 0.063). A detailed discussion about these results follows in
Chapter 5.
4.8.3.1.4 Testing Moderator Effect of Synergy Manager on the Relationship between Related Diversification Strategy and P/B Value (H2ai4)
Table 4.12 shows the results of multiple regression analysis conducted to study the
moderating effect of Synergy Manager on the relationship between Related
Diversification Strategy and P/B Value. The test results revealed that Synergy
Manager performed as moderator between Related Diversification Strategy and P/B
Value. From model 3 (significant at 0.001), it is evident that DRSMCentred is
significant at 0.095 (around 90% confidence level). Hence, the F-Change in R2 for the
third model is also significant at 0.095. Models’ Statistics show that models’
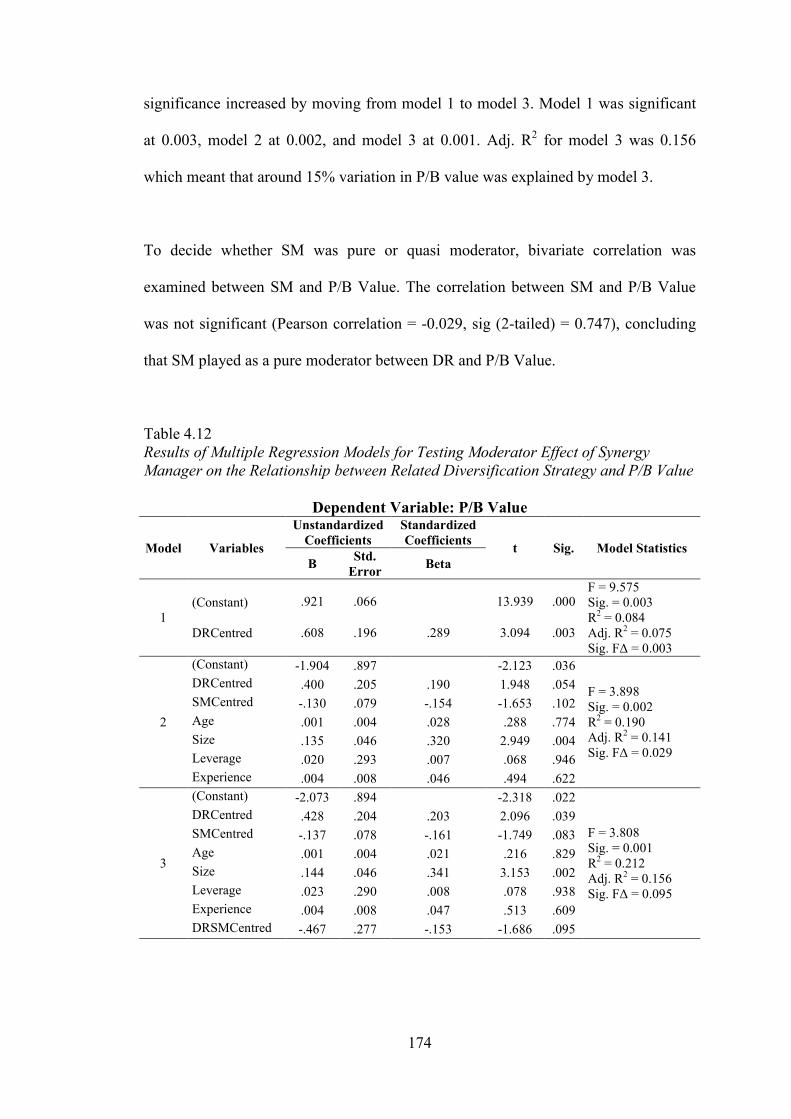
174
significance increased by moving from model 1 to model 3. Model 1 was significant
at 0.003, model 2 at 0.002, and model 3 at 0.001. Adj. R2 for model 3 was 0.156
which meant that around 15% variation in P/B value was explained by model 3.
To decide whether SM was pure or quasi moderator, bivariate correlation was
examined between SM and P/B Value. The correlation between SM and P/B Value
was not significant (Pearson correlation = -0.029, sig (2-tailed) = 0.747), concluding
that SM played as a pure moderator between DR and P/B Value.
Table 4.12 Results of Multiple Regression Models for Testing Moderator Effect of Synergy Manager on the Relationship between Related Diversification Strategy and P/B Value
Dependent Variable: P/B Value
Model Variables
Unstandardized Coefficients
Standardized Coefficients
t Sig. Model Statistics B
Std. Error
Beta
1 (Constant) DRCentred
.921 .066 13.939 .000 F = 9.575 Sig. = 0.003 R2 = 0.084 Adj. R2 = 0.075 Sig. FΔ = 0.003
.608 .196 .289 3.094 .003
2
(Constant) -1.904 .897 -2.123 .036
F = 3.898 Sig. = 0.002 R2 = 0.190 Adj. R2 = 0.141 Sig. FΔ = 0.029
DRCentred .400 .205 .190 1.948 .054
SMCentred -.130 .079 -.154 -1.653 .102
Age .001 .004 .028 .288 .774
Size .135 .046 .320 2.949 .004
Leverage .020 .293 .007 .068 .946
Experience .004 .008 .046 .494 .622
3
(Constant) -2.073 .894 -2.318 .022
F = 3.808 Sig. = 0.001 R2 = 0.212 Adj. R2 = 0.156 Sig. FΔ = 0.095
DRCentred .428 .204 .203 2.096 .039
SMCentred -.137 .078 -.161 -1.749 .083
Age .001 .004 .021 .216 .829
Size .144 .046 .341 3.153 .002
Leverage .023 .290 .008 .078 .938
Experience .004 .008 .047 .513 .609
DRSMCentred -.467 .277 -.153 -1.686 .095
175
Moreover, in order to interpret the nature of moderation, graphs were made using
scatter plots on the similar grounds as discussed for the previous hypothesis. DR was
placed on x-axis, P/B Value was placed on y-axis and markers were set by SMlevel.
The graphs developed in this manner are shown in Figure 4.6.
Figure 4.6 Graphs for DR and P/B Value with SMlevel
The graphs show that at moderate and high SMlevels, P/B Value is increasing with
increasing level of DR, whereas, at low SMlevel, P/B Value is slowly decreasing
when DR increases. At moderate SMlevel, correlation between DR and P/B Value
was found to be 0.207 (R2 linear = 0.043), whereas at high SMlevel, this correlation
increased to 0.24 (R2 linear = 0.057). This analysis confirms positive moderating
effect of Synergy Manager Role on the relationship between DR and P/B Value and
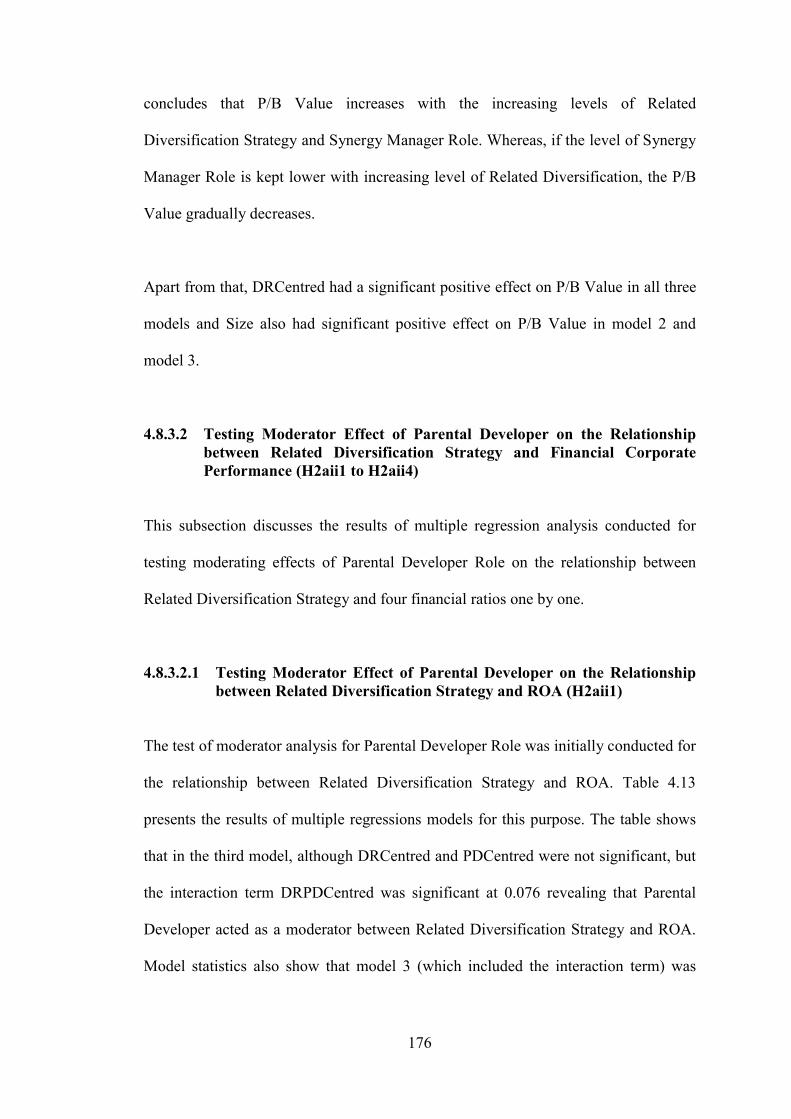
176
concludes that P/B Value increases with the increasing levels of Related
Diversification Strategy and Synergy Manager Role. Whereas, if the level of Synergy
Manager Role is kept lower with increasing level of Related Diversification, the P/B
Value gradually decreases.
Apart from that, DRCentred had a significant positive effect on P/B Value in all three
models and Size also had significant positive effect on P/B Value in model 2 and
model 3.
4.8.3.2 Testing Moderator Effect of Parental Developer on the Relationship between Related Diversification Strategy and Financial Corporate Performance (H2aii1 to H2aii4)
This subsection discusses the results of multiple regression analysis conducted for
testing moderating effects of Parental Developer Role on the relationship between
Related Diversification Strategy and four financial ratios one by one.
4.8.3.2.1 Testing Moderator Effect of Parental Developer on the Relationship between Related Diversification Strategy and ROA (H2aii1)
The test of moderator analysis for Parental Developer Role was initially conducted for
the relationship between Related Diversification Strategy and ROA. Table 4.13
presents the results of multiple regressions models for this purpose. The table shows
that in the third model, although DRCentred and PDCentred were not significant, but
the interaction term DRPDCentred was significant at 0.076 revealing that Parental
Developer acted as a moderator between Related Diversification Strategy and ROA.
Model statistics also show that model 3 (which included the interaction term) was
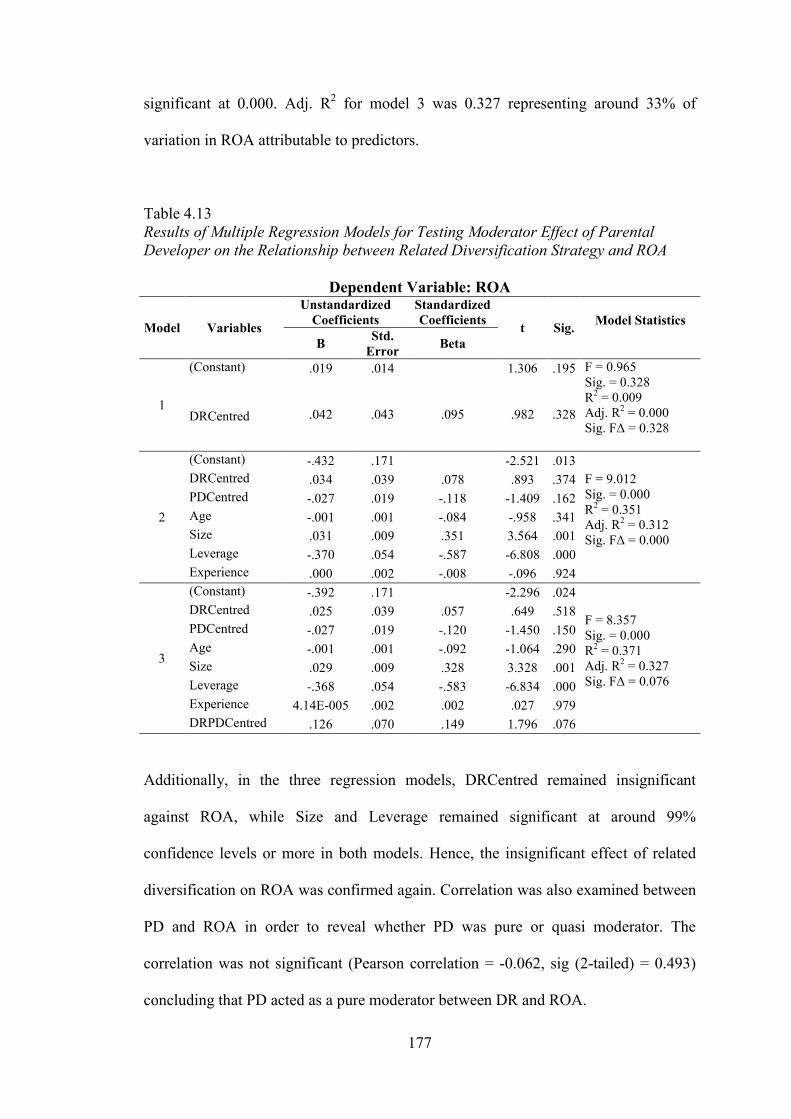
177
significant at 0.000. Adj. R2 for model 3 was 0.327 representing around 33% of
variation in ROA attributable to predictors.
Table 4.13 Results of Multiple Regression Models for Testing Moderator Effect of Parental Developer on the Relationship between Related Diversification Strategy and ROA
Dependent Variable: ROA
Model Variables
Unstandardized Coefficients
Standardized Coefficients
t Sig. Model Statistics
B
Std. Error
Beta
1
(Constant) .019 .014 1.306 .195 F = 0.965 Sig. = 0.328 R2 = 0.009 Adj. R2 = 0.000 Sig. FΔ = 0.328
DRCentred .042 .043 .095 .982 .328
2
(Constant) -.432 .171 -2.521 .013
F = 9.012 Sig. = 0.000 R2 = 0.351 Adj. R2 = 0.312 Sig. FΔ = 0.000
DRCentred .034 .039 .078 .893 .374
PDCentred -.027 .019 -.118 -1.409 .162
Age -.001 .001 -.084 -.958 .341
Size .031 .009 .351 3.564 .001
Leverage -.370 .054 -.587 -6.808 .000
Experience .000 .002 -.008 -.096 .924
3
(Constant) -.392 .171 -2.296 .024
F = 8.357 Sig. = 0.000 R2 = 0.371 Adj. R2 = 0.327 Sig. FΔ = 0.076
DRCentred .025 .039 .057 .649 .518
PDCentred -.027 .019 -.120 -1.450 .150
Age -.001 .001 -.092 -1.064 .290
Size .029 .009 .328 3.328 .001
Leverage -.368 .054 -.583 -6.834 .000
Experience 4.14E-005 .002 .002 .027 .979
DRPDCentred .126 .070 .149 1.796 .076
Additionally, in the three regression models, DRCentred remained insignificant
against ROA, while Size and Leverage remained significant at around 99%
confidence levels or more in both models. Hence, the insignificant effect of related
diversification on ROA was confirmed again. Correlation was also examined between
PD and ROA in order to reveal whether PD was pure or quasi moderator. The
correlation was not significant (Pearson correlation = -0.062, sig (2-tailed) = 0.493)
concluding that PD acted as a pure moderator between DR and ROA.
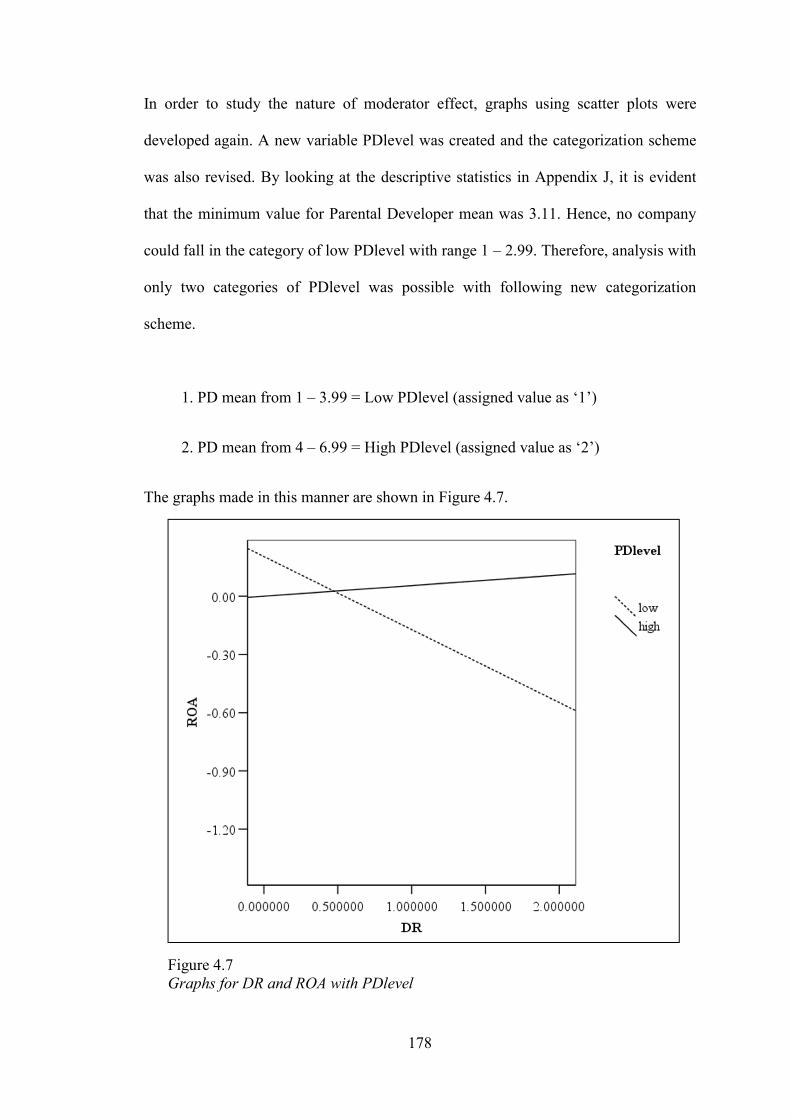
178
In order to study the nature of moderator effect, graphs using scatter plots were
developed again. A new variable PDlevel was created and the categorization scheme
was also revised. By looking at the descriptive statistics in Appendix J, it is evident
that the minimum value for Parental Developer mean was 3.11. Hence, no company
could fall in the category of low PDlevel with range 1 – 2.99. Therefore, analysis with
only two categories of PDlevel was possible with following new categorization
scheme.
1. PD mean from 1 – 3.99 = Low PDlevel (assigned value as ‘1’)
2. PD mean from 4 – 6.99 = High PDlevel (assigned value as ‘2’)
The graphs made in this manner are shown in Figure 4.7.
Figure 4.7 Graphs for DR and ROA with PDlevel
179
The graphs reveal that with low PDlevel, the relationship between DR and ROA is
actually negative (R = -0.981, R2 = 0.962) and at high PDlevel, the relationship
between DR and ROA is still positive (R = 0.11, R2 = 0.012). This confirms the
positive effect of Parental Developer Role on the relationship between Related
Diversification Strategy and ROA. Hence, it can be concluded here that ROA
increases with increasing level of Related Diversification Strategy coupled with
increasing level of Parental Developer Role played by the corporate managers.
4.8.3.2.2 Testing Moderator Effect of Parental Developer on the Relationship between Related Diversification Strategy and ROE (H2aii2)
Table 4.14 presents results of multiple regressions models conducted to test moderator
effect of Parental Developer on the relationship between Related Diversification
Strategy and ROE. Statistics for the third model show that the interaction term
DRPDCentred was significant at 0.003 (99% confidence level) revealing that Parental
Developer acts as a moderator between Related Diversification and ROE. Model
statistics also reveal that model 3 showed increased significance at 0.000 compared to
model 2 (Sig. at 0.002), whereas model 1 was not significant (0.808). Adj. R2 for
model 3 was 0.204 representing around 20% of variation in ROE attributable to
predictors.
Regarding other relationships, DRCentred remained insignificant in all three models
against ROE, hence, once again confirming absence of any significant effect of
related diversification on ROE. However, Size and Leverage remained significant in
models 2 and 3 with their respective positive and negative effects. Moreover,
correlation between PD and ROE was also significant (Pearson correlation = 0.242,
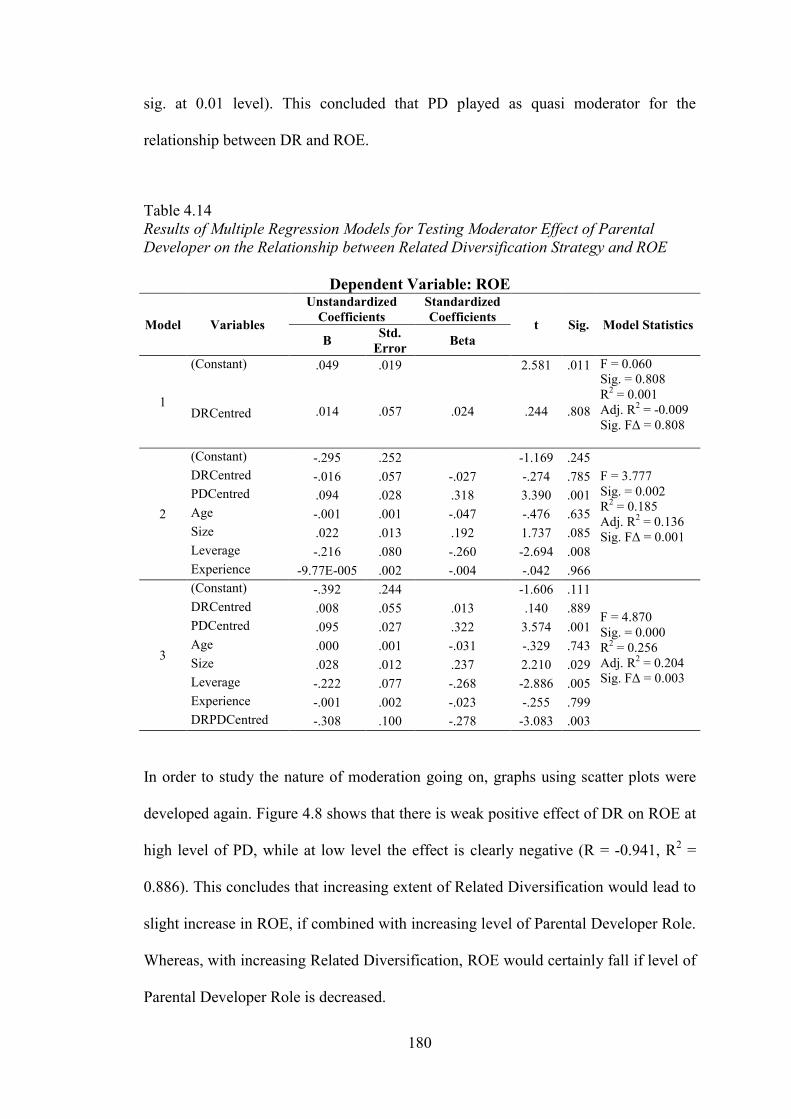
180
sig. at 0.01 level). This concluded that PD played as quasi moderator for the
relationship between DR and ROE.
Table 4.14 Results of Multiple Regression Models for Testing Moderator Effect of Parental Developer on the Relationship between Related Diversification Strategy and ROE
Dependent Variable: ROE
Model Variables
Unstandardized Coefficients
Standardized Coefficients
t Sig. Model Statistics B
Std. Error
Beta
1
(Constant) .049 .019 2.581 .011 F = 0.060 Sig. = 0.808 R2 = 0.001 Adj. R2 = -0.009 Sig. FΔ = 0.808
DRCentred .014 .057 .024 .244 .808
2
(Constant) -.295 .252 -1.169 .245
F = 3.777 Sig. = 0.002 R2 = 0.185 Adj. R2 = 0.136 Sig. FΔ = 0.001
DRCentred -.016 .057 -.027 -.274 .785
PDCentred .094 .028 .318 3.390 .001
Age -.001 .001 -.047 -.476 .635
Size .022 .013 .192 1.737 .085
Leverage -.216 .080 -.260 -2.694 .008
Experience -9.77E-005 .002 -.004 -.042 .966
3
(Constant) -.392 .244 -1.606 .111
F = 4.870 Sig. = 0.000 R2 = 0.256 Adj. R2 = 0.204 Sig. FΔ = 0.003
DRCentred .008 .055 .013 .140 .889
PDCentred .095 .027 .322 3.574 .001
Age .000 .001 -.031 -.329 .743
Size .028 .012 .237 2.210 .029
Leverage -.222 .077 -.268 -2.886 .005
Experience -.001 .002 -.023 -.255 .799
DRPDCentred -.308 .100 -.278 -3.083 .003
In order to study the nature of moderation going on, graphs using scatter plots were
developed again. Figure 4.8 shows that there is weak positive effect of DR on ROE at
high level of PD, while at low level the effect is clearly negative (R = -0.941, R2 =
0.886). This concludes that increasing extent of Related Diversification would lead to
slight increase in ROE, if combined with increasing level of Parental Developer Role.
Whereas, with increasing Related Diversification, ROE would certainly fall if level of
Parental Developer Role is decreased.
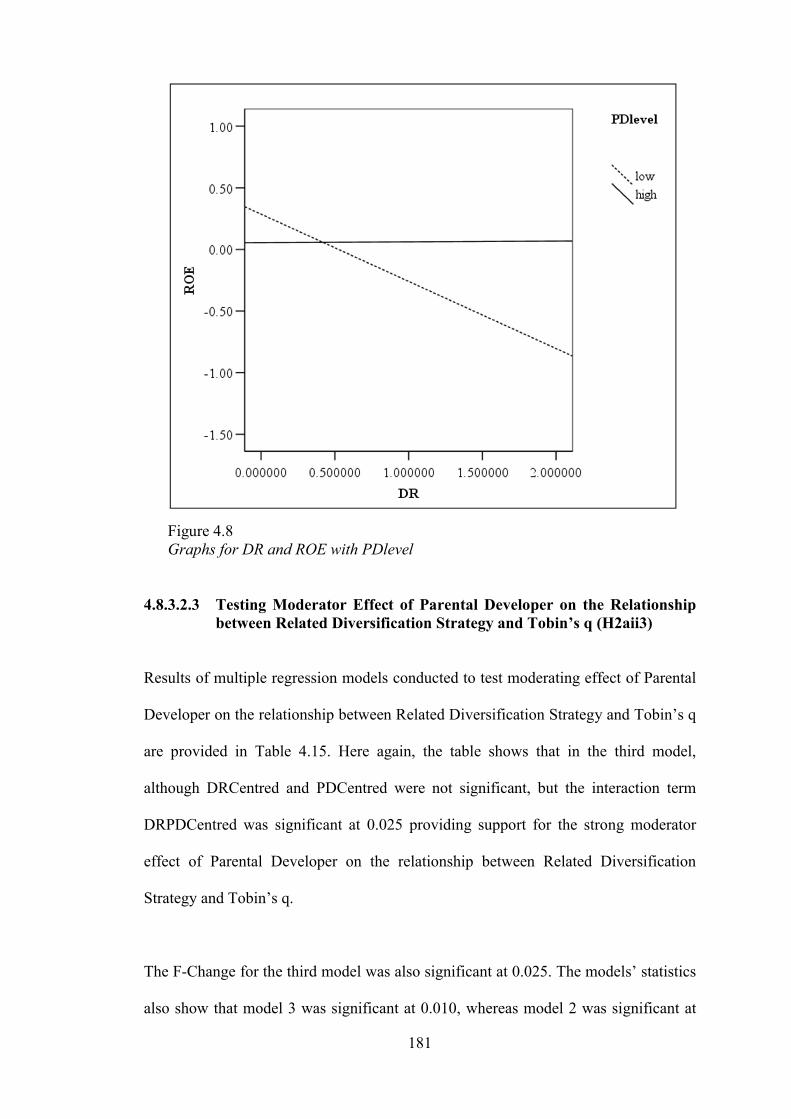
181
Figure 4.8 Graphs for DR and ROE with PDlevel
4.8.3.2.3 Testing Moderator Effect of Parental Developer on the Relationship
between Related Diversification Strategy and Tobin’s q (H2aii3)
Results of multiple regression models conducted to test moderating effect of Parental
Developer on the relationship between Related Diversification Strategy and Tobin’s q
are provided in Table 4.15. Here again, the table shows that in the third model,
although DRCentred and PDCentred were not significant, but the interaction term
DRPDCentred was significant at 0.025 providing support for the strong moderator
effect of Parental Developer on the relationship between Related Diversification
Strategy and Tobin’s q.
The F-Change for the third model was also significant at 0.025. The models’ statistics
also show that model 3 was significant at 0.010, whereas model 2 was significant at
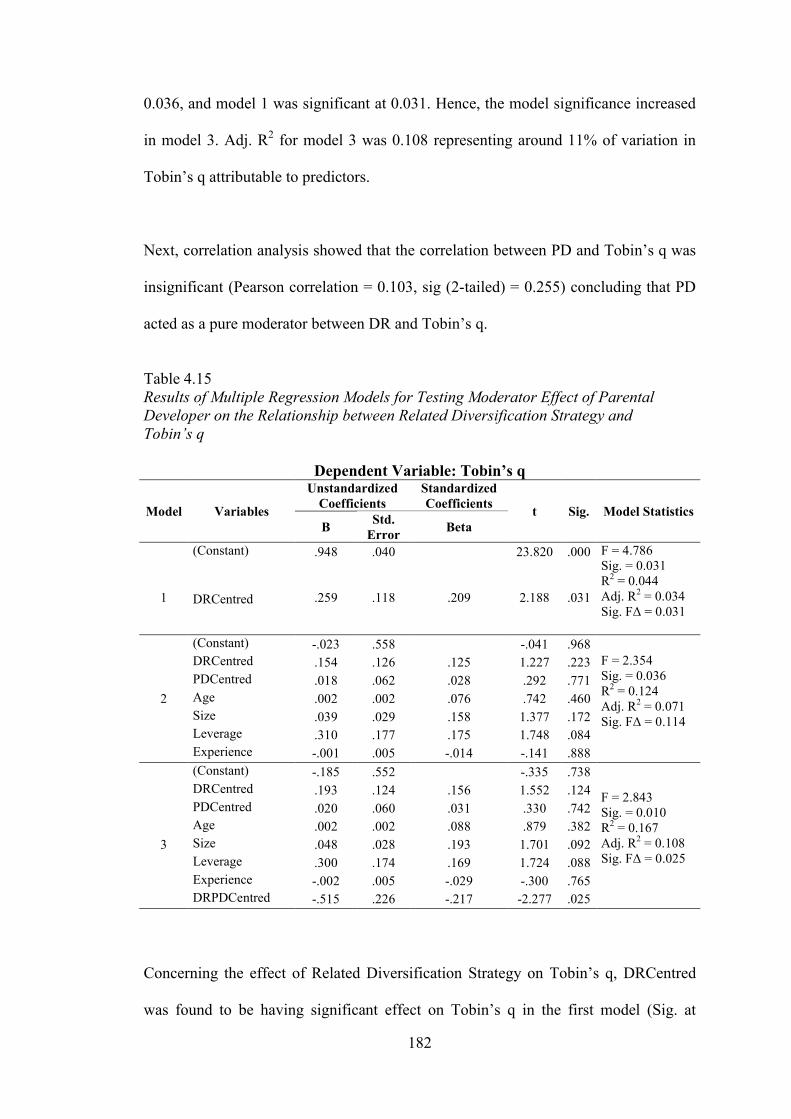
182
0.036, and model 1 was significant at 0.031. Hence, the model significance increased
in model 3. Adj. R2 for model 3 was 0.108 representing around 11% of variation in
Tobin’s q attributable to predictors.
Next, correlation analysis showed that the correlation between PD and Tobin’s q was
insignificant (Pearson correlation = 0.103, sig (2-tailed) = 0.255) concluding that PD
acted as a pure moderator between DR and Tobin’s q.
Table 4.15 Results of Multiple Regression Models for Testing Moderator Effect of Parental Developer on the Relationship between Related Diversification Strategy and Tobin’s q
Dependent Variable: Tobin’s q
Model Variables
Unstandardized Coefficients
Standardized Coefficients
t Sig. Model Statistics B
Std. Error
Beta
(Constant) .948 .040 23.820 .000 F = 4.786 Sig. = 0.031 R2 = 0.044 Adj. R2 = 0.034 Sig. FΔ = 0.031
1
DRCentred .259 .118 .209 2.188 .031
(Constant) -.023 .558 -.041 .968 F = 2.354 Sig. = 0.036 R2 = 0.124 Adj. R2 = 0.071 Sig. FΔ = 0.114
DRCentred .154 .126 .125 1.227 .223
PDCentred .018 .062 .028 .292 .771
2 Age .002 .002 .076 .742 .460
Size .039 .029 .158 1.377 .172
Leverage .310 .177 .175 1.748 .084
Experience -.001 .005 -.014 -.141 .888
(Constant) -.185 .552 -.335 .738
F = 2.843 Sig. = 0.010 R2 = 0.167 Adj. R2 = 0.108 Sig. FΔ = 0.025
DRCentred .193 .124 .156 1.552 .124
PDCentred .020 .060 .031 .330 .742
Age .002 .002 .088 .879 .382
3 Size .048 .028 .193 1.701 .092
Leverage .300 .174 .169 1.724 .088
Experience -.002 .005 -.029 -.300 .765
DRPDCentred -.515 .226 -.217 -2.277 .025
Concerning the effect of Related Diversification Strategy on Tobin’s q, DRCentred
was found to be having significant effect on Tobin’s q in the first model (Sig. at
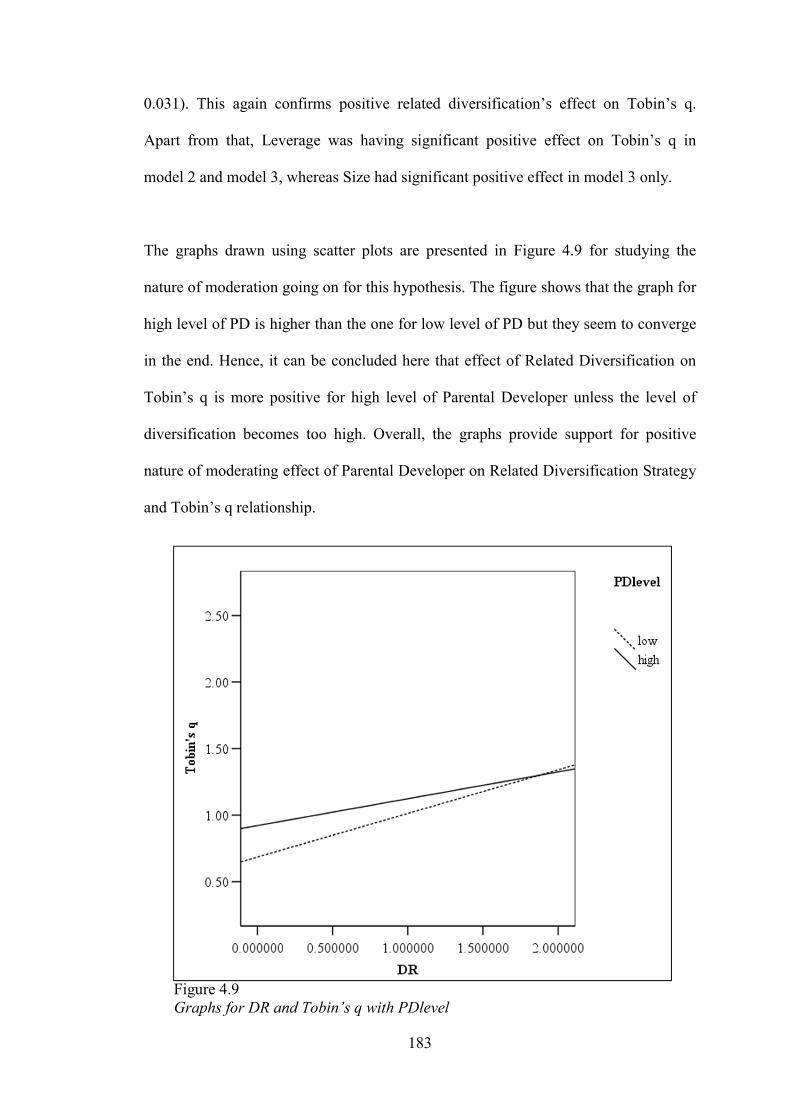
183
0.031). This again confirms positive related diversification’s effect on Tobin’s q.
Apart from that, Leverage was having significant positive effect on Tobin’s q in
model 2 and model 3, whereas Size had significant positive effect in model 3 only.
The graphs drawn using scatter plots are presented in Figure 4.9 for studying the
nature of moderation going on for this hypothesis. The figure shows that the graph for
high level of PD is higher than the one for low level of PD but they seem to converge
in the end. Hence, it can be concluded here that effect of Related Diversification on
Tobin’s q is more positive for high level of Parental Developer unless the level of
diversification becomes too high. Overall, the graphs provide support for positive
nature of moderating effect of Parental Developer on Related Diversification Strategy
and Tobin’s q relationship.
Figure 4.9 Graphs for DR and Tobin’s q with PDlevel
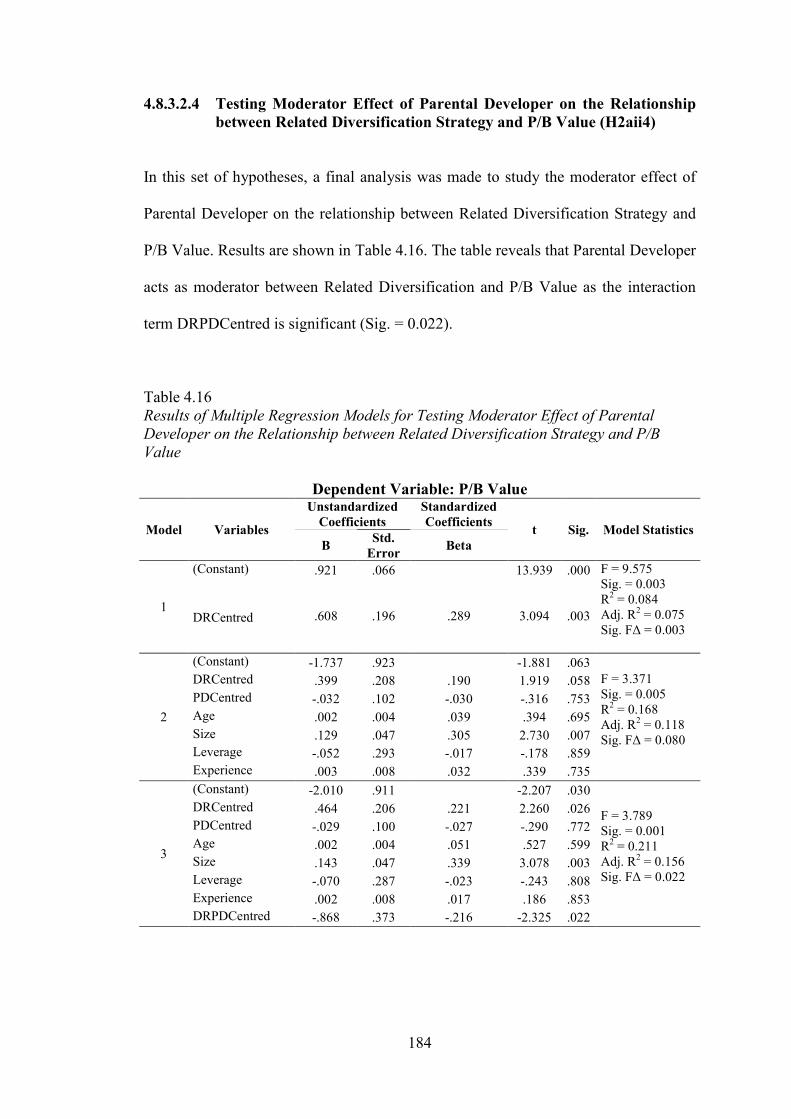
184
4.8.3.2.4 Testing Moderator Effect of Parental Developer on the Relationship between Related Diversification Strategy and P/B Value (H2aii4)
In this set of hypotheses, a final analysis was made to study the moderator effect of
Parental Developer on the relationship between Related Diversification Strategy and
P/B Value. Results are shown in Table 4.16. The table reveals that Parental Developer
acts as moderator between Related Diversification and P/B Value as the interaction
term DRPDCentred is significant (Sig. = 0.022).
Table 4.16 Results of Multiple Regression Models for Testing Moderator Effect of Parental Developer on the Relationship between Related Diversification Strategy and P/B Value
Dependent Variable: P/B Value
Model Variables
Unstandardized Coefficients
Standardized Coefficients
t Sig. Model Statistics B
Std. Error
Beta
1
(Constant) .921 .066 13.939 .000 F = 9.575 Sig. = 0.003 R2 = 0.084 Adj. R2 = 0.075 Sig. FΔ = 0.003
DRCentred .608 .196 .289 3.094 .003
2
(Constant) -1.737 .923 -1.881 .063 F = 3.371 Sig. = 0.005 R2 = 0.168 Adj. R2 = 0.118 Sig. FΔ = 0.080
DRCentred .399 .208 .190 1.919 .058
PDCentred -.032 .102 -.030 -.316 .753
Age .002 .004 .039 .394 .695
Size .129 .047 .305 2.730 .007
Leverage -.052 .293 -.017 -.178 .859
Experience .003 .008 .032 .339 .735
3
(Constant) -2.010 .911 -2.207 .030
F = 3.789 Sig. = 0.001 R2 = 0.211 Adj. R2 = 0.156 Sig. FΔ = 0.022
DRCentred .464 .206 .221 2.260 .026
PDCentred -.029 .100 -.027 -.290 .772
Age .002 .004 .051 .527 .599
Size .143 .047 .339 3.078 .003
Leverage -.070 .287 -.023 -.243 .808
Experience .002 .008 .017 .186 .853
DRPDCentred -.868 .373 -.216 -2.325 .022
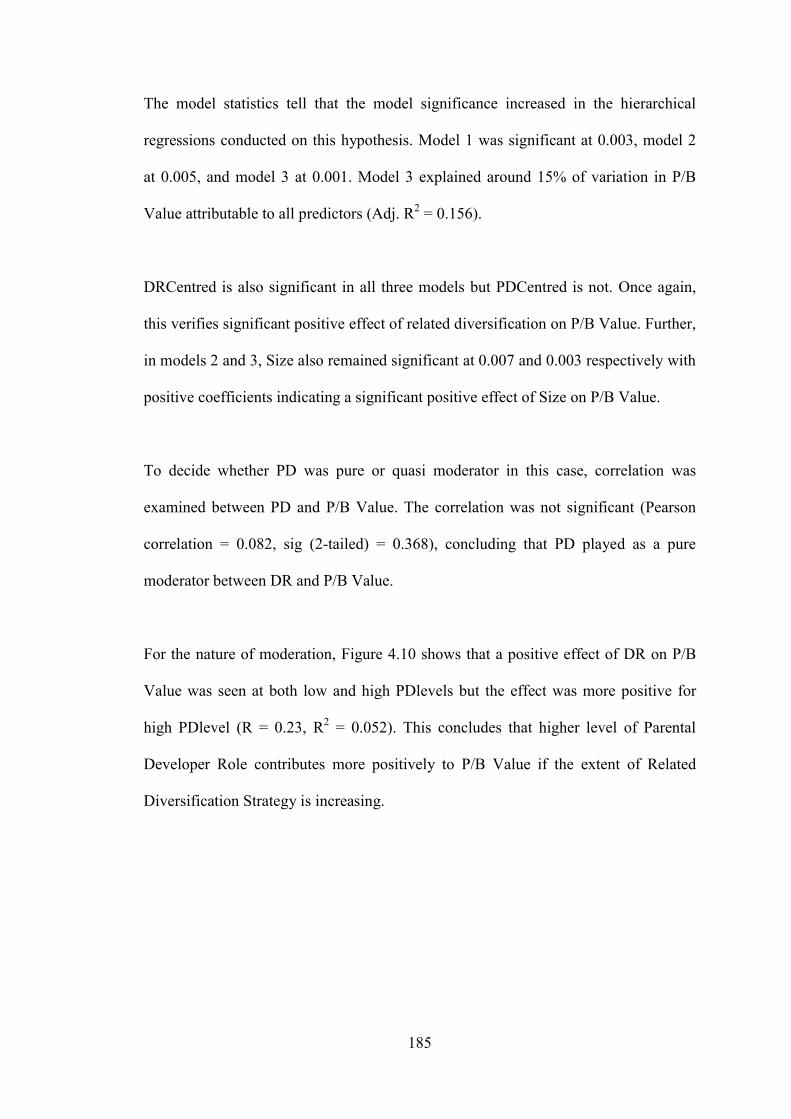
185
The model statistics tell that the model significance increased in the hierarchical
regressions conducted on this hypothesis. Model 1 was significant at 0.003, model 2
at 0.005, and model 3 at 0.001. Model 3 explained around 15% of variation in P/B
Value attributable to all predictors (Adj. R2 = 0.156).
DRCentred is also significant in all three models but PDCentred is not. Once again,
this verifies significant positive effect of related diversification on P/B Value. Further,
in models 2 and 3, Size also remained significant at 0.007 and 0.003 respectively with
positive coefficients indicating a significant positive effect of Size on P/B Value.
To decide whether PD was pure or quasi moderator in this case, correlation was
examined between PD and P/B Value. The correlation was not significant (Pearson
correlation = 0.082, sig (2-tailed) = 0.368), concluding that PD played as a pure
moderator between DR and P/B Value.
For the nature of moderation, Figure 4.10 shows that a positive effect of DR on P/B
Value was seen at both low and high PDlevels but the effect was more positive for
high PDlevel (R = 0.23, R2 = 0.052). This concludes that higher level of Parental
Developer Role contributes more positively to P/B Value if the extent of Related
Diversification Strategy is increasing.
186
Figure 4.10 Graphs for DR and P/B Value with PDlevel
4.8.3.3 Testing Moderator Effect of Portfolio Manager on the Relationship between Unrelated Diversification Strategy and Financial Corporate Performance (H2aiii1 to H2aiii4)
Portfolio Manager was proposed to be a moderator between Unrelated Diversification
Strategy and Financial Corporate Performance. As four financial ratios could not be
aggregated to develop an index, therefore, this set of hypotheses tests the moderating
effect of Portfolio Manager on the relationship between Unrelated Diversification
Strategy and four financial ratios one by one.
187
4.8.3.3.1 Testing Moderator Effect of Portfolio Manager on the Relationship between Unrelated Diversification Strategy and ROA (H2aiii1)
The test for Portfolio Manager as a moderator was first conducted against ROA.
Results of hierarchical regressions conducted to test the hypothesis are provided in
Table 4.17. Model statistics in the table reveal that Model 1 was significant at 0.032,
model 2 at 0.000, and model 3 at 0.000 supporting the significance of third model for
moderation.
The table also shows that the interaction term DUPMCentred was significant at 0.001
revealing that Portfolio Manager acts as moderating variable between Unrelated
Diversification Strategy and ROA. Adjusted R2 for model 3 was 0.395 indicating that
around 40% of variation in ROA was explained by predictors in model 3.
Further, correlation was examined between PM and ROA. The correlation between
PM and ROA was not significant (Pearson correlation = 0.088, sig (2-tailed) = 0.334)
concluding that PM acts as a pure moderator between DU and ROA. The term
DUCentred also remained significant in all three models (with negative B coefficient)
indicating a significant negative effect of Unrelated Diversification Strategy on ROA.
In addition to it, Size and Leverage also remained significant in models 2 and 3 at
0.000 significance levels with Size having positive effects on ROA and Leverage
having negative effects on ROA.
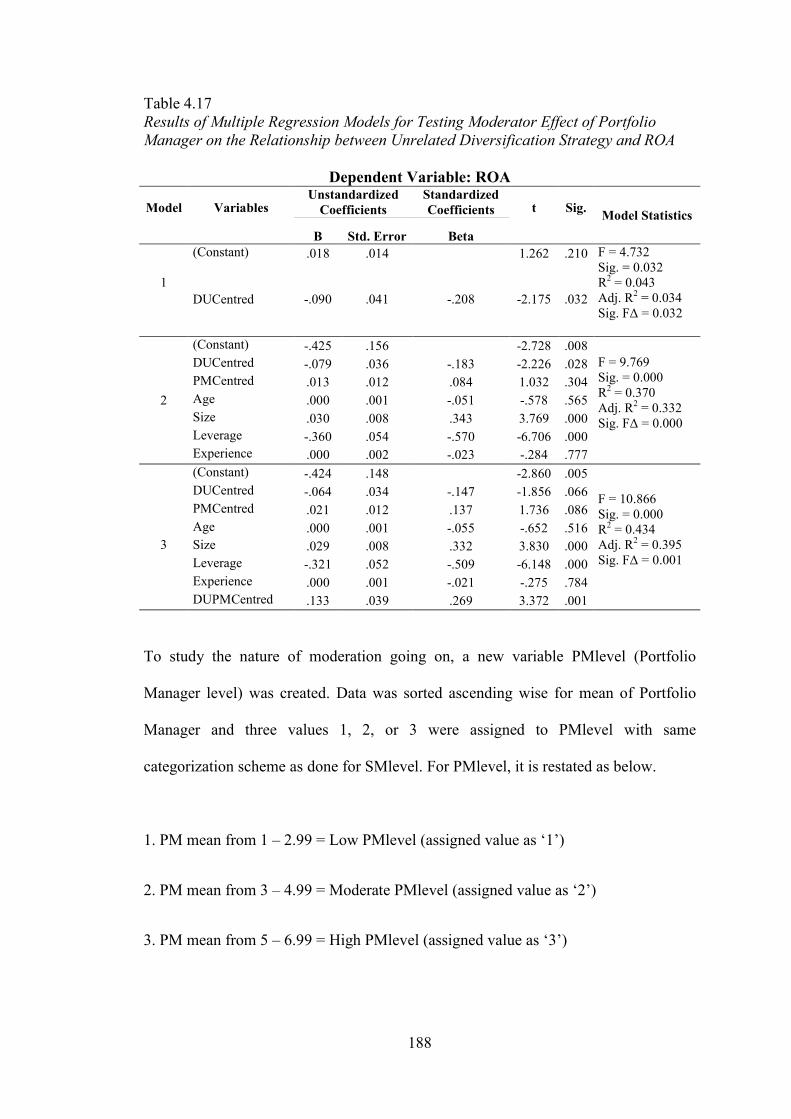
188
Table 4.17 Results of Multiple Regression Models for Testing Moderator Effect of Portfolio Manager on the Relationship between Unrelated Diversification Strategy and ROA
Dependent Variable: ROA
Model
Variables
Unstandardized Coefficients
Standardized Coefficients t
Sig.
Model Statistics
B Std. Error Beta
1
(Constant) .018 .014 1.262 .210 F = 4.732 Sig. = 0.032 R2 = 0.043 Adj. R2 = 0.034 Sig. FΔ = 0.032
DUCentred -.090 .041 -.208 -2.175 .032
2
(Constant) -.425 .156 -2.728 .008 F = 9.769 Sig. = 0.000 R2 = 0.370 Adj. R2 = 0.332 Sig. FΔ = 0.000
DUCentred -.079 .036 -.183 -2.226 .028
PMCentred .013 .012 .084 1.032 .304
Age .000 .001 -.051 -.578 .565
Size .030 .008 .343 3.769 .000
Leverage -.360 .054 -.570 -6.706 .000
Experience .000 .002 -.023 -.284 .777
3
(Constant) -.424 .148 -2.860 .005
F = 10.866 Sig. = 0.000 R2 = 0.434 Adj. R2 = 0.395 Sig. FΔ = 0.001
DUCentred -.064 .034 -.147 -1.856 .066
PMCentred .021 .012 .137 1.736 .086
Age .000 .001 -.055 -.652 .516
Size .029 .008 .332 3.830 .000
Leverage -.321 .052 -.509 -6.148 .000
Experience .000 .001 -.021 -.275 .784
DUPMCentred .133 .039 .269 3.372 .001
To study the nature of moderation going on, a new variable PMlevel (Portfolio
Manager level) was created. Data was sorted ascending wise for mean of Portfolio
Manager and three values 1, 2, or 3 were assigned to PMlevel with same
categorization scheme as done for SMlevel. For PMlevel, it is restated as below.
1. PM mean from 1 – 2.99 = Low PMlevel (assigned value as ‘1’)
2. PM mean from 3 – 4.99 = Moderate PMlevel (assigned value as ‘2’)
3. PM mean from 5 – 6.99 = High PMlevel (assigned value as ‘3’)

189
The graphs developed as a result of scatter plots are shown in Figure 4.11. It can be
seen from Table 4.17 that the effect of Unrelated Diversification Strategy on ROA
was significantly negative as depicted by the three models. However, Figure 4.11
shows that at moderate and high levels of Portfolio Manager, the negative effect of
unrelated diversification on ROA converts into somewhat positive effect. However,
for low PMlevels, the effect stays as negative.
This concludes that although Unrelated Diversification Strategy contributes
negatively to companies’ ROA, but if it is coupled with moderate or high levels of
Portfolio Manager, then the overall effect on ROA becomes positive or at least it
counters all the negative effect.
Figure 4.11 Graphs for DU and ROA with PMlevel
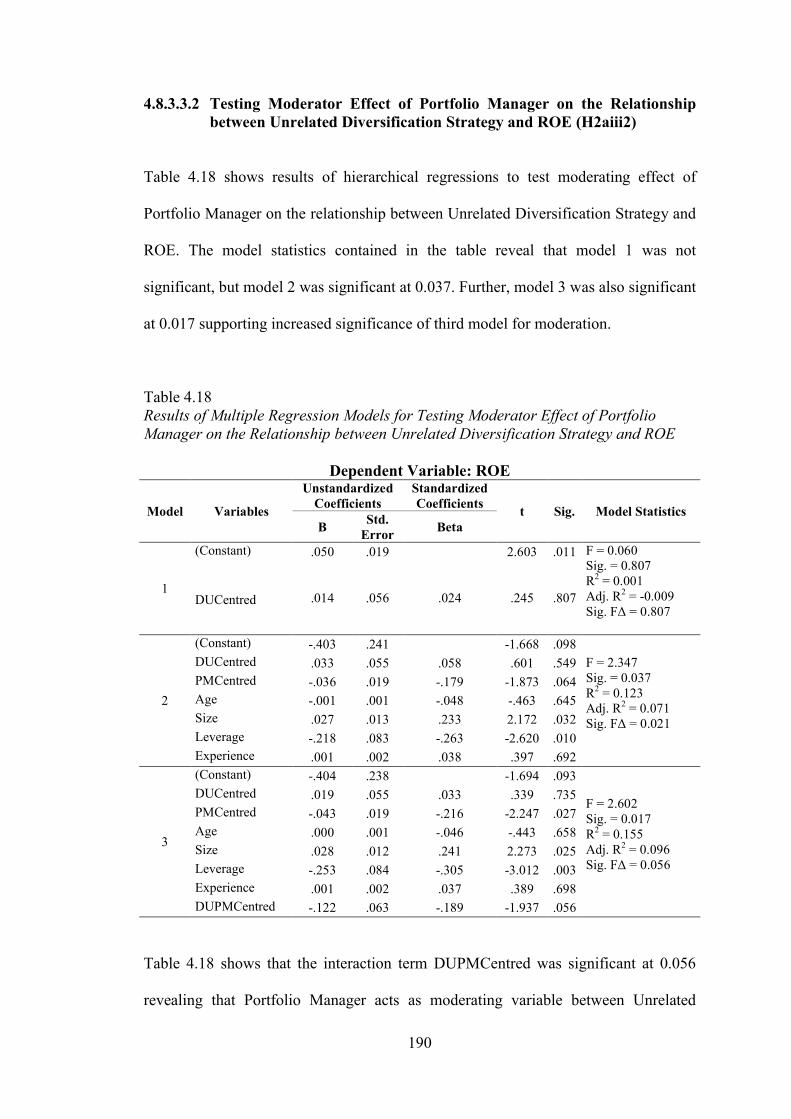
190
4.8.3.3.2 Testing Moderator Effect of Portfolio Manager on the Relationship between Unrelated Diversification Strategy and ROE (H2aiii2)
Table 4.18 shows results of hierarchical regressions to test moderating effect of
Portfolio Manager on the relationship between Unrelated Diversification Strategy and
ROE. The model statistics contained in the table reveal that model 1 was not
significant, but model 2 was significant at 0.037. Further, model 3 was also significant
at 0.017 supporting increased significance of third model for moderation.
Table 4.18 Results of Multiple Regression Models for Testing Moderator Effect of Portfolio Manager on the Relationship between Unrelated Diversification Strategy and ROE
Dependent Variable: ROE
Model Variables
Unstandardized Coefficients
Standardized Coefficients
t Sig. Model Statistics B
Std. Error
Beta
1
(Constant) .050 .019 2.603 .011 F = 0.060 Sig. = 0.807 R2 = 0.001 Adj. R2 = -0.009 Sig. FΔ = 0.807
DUCentred .014 .056 .024 .245 .807
2
(Constant) -.403 .241 -1.668 .098
F = 2.347 Sig. = 0.037 R2 = 0.123 Adj. R2 = 0.071 Sig. FΔ = 0.021
DUCentred .033 .055 .058 .601 .549
PMCentred -.036 .019 -.179 -1.873 .064
Age -.001 .001 -.048 -.463 .645
Size .027 .013 .233 2.172 .032
Leverage -.218 .083 -.263 -2.620 .010
Experience .001 .002 .038 .397 .692
3
(Constant) -.404 .238 -1.694 .093
F = 2.602 Sig. = 0.017 R2 = 0.155 Adj. R2 = 0.096 Sig. FΔ = 0.056
DUCentred .019 .055 .033 .339 .735
PMCentred -.043 .019 -.216 -2.247 .027
Age .000 .001 -.046 -.443 .658
Size .028 .012 .241 2.273 .025
Leverage -.253 .084 -.305 -3.012 .003
Experience .001 .002 .037 .389 .698
DUPMCentred -.122 .063 -.189 -1.937 .056
Table 4.18 shows that the interaction term DUPMCentred was significant at 0.056
revealing that Portfolio Manager acts as moderating variable between Unrelated
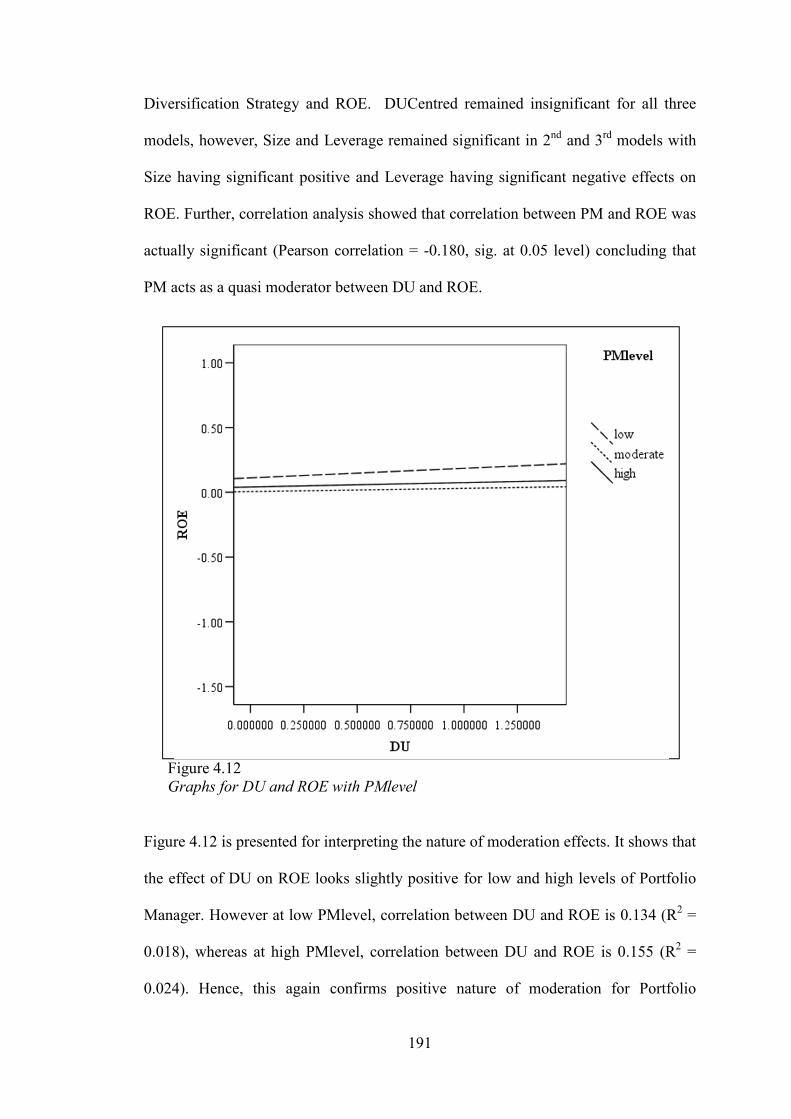
191
Diversification Strategy and ROE. DUCentred remained insignificant for all three
models, however, Size and Leverage remained significant in 2nd and 3rd models with
Size having significant positive and Leverage having significant negative effects on
ROE. Further, correlation analysis showed that correlation between PM and ROE was
actually significant (Pearson correlation = -0.180, sig. at 0.05 level) concluding that
PM acts as a quasi moderator between DU and ROE.
Figure 4.12 Graphs for DU and ROE with PMlevel
Figure 4.12 is presented for interpreting the nature of moderation effects. It shows that
the effect of DU on ROE looks slightly positive for low and high levels of Portfolio
Manager. However at low PMlevel, correlation between DU and ROE is 0.134 (R2 =
0.018), whereas at high PMlevel, correlation between DU and ROE is 0.155 (R2 =
0.024). Hence, this again confirms positive nature of moderation for Portfolio
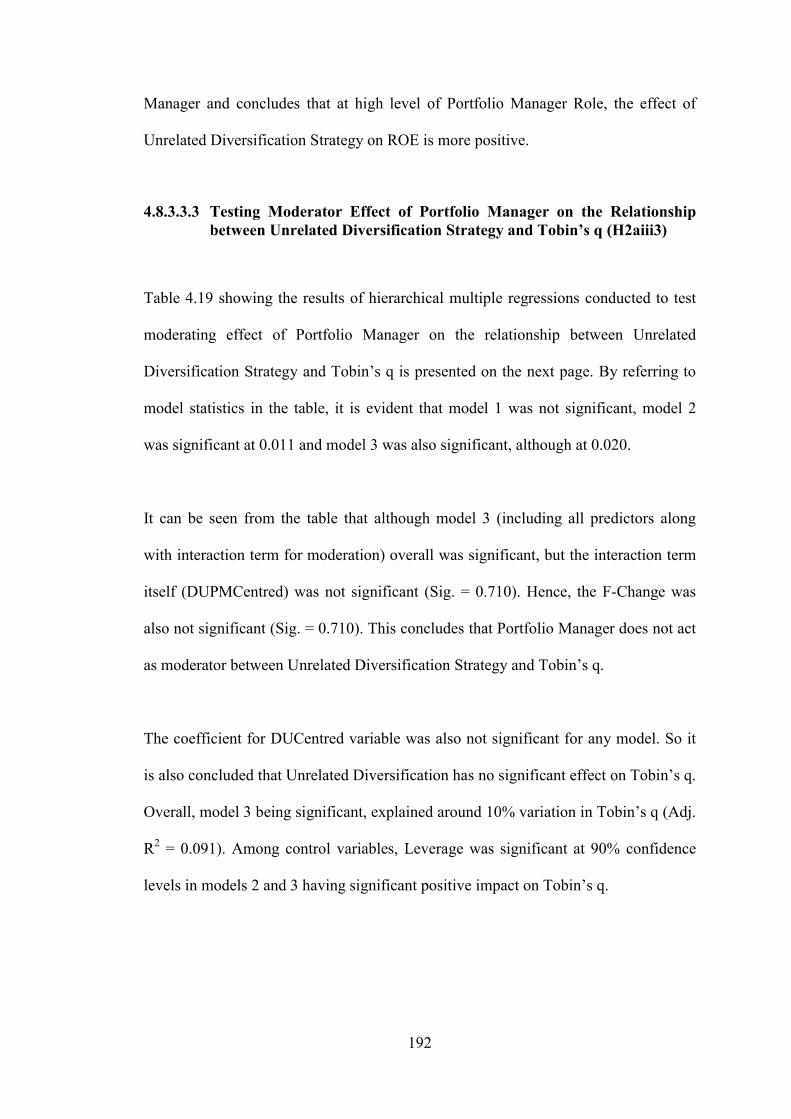
192
Manager and concludes that at high level of Portfolio Manager Role, the effect of
Unrelated Diversification Strategy on ROE is more positive.
4.8.3.3.3 Testing Moderator Effect of Portfolio Manager on the Relationship between Unrelated Diversification Strategy and Tobin’s q (H2aiii3)
Table 4.19 showing the results of hierarchical multiple regressions conducted to test
moderating effect of Portfolio Manager on the relationship between Unrelated
Diversification Strategy and Tobin’s q is presented on the next page. By referring to
model statistics in the table, it is evident that model 1 was not significant, model 2
was significant at 0.011 and model 3 was also significant, although at 0.020.
It can be seen from the table that although model 3 (including all predictors along
with interaction term for moderation) overall was significant, but the interaction term
itself (DUPMCentred) was not significant (Sig. = 0.710). Hence, the F-Change was
also not significant (Sig. = 0.710). This concludes that Portfolio Manager does not act
as moderator between Unrelated Diversification Strategy and Tobin’s q.
The coefficient for DUCentred variable was also not significant for any model. So it
is also concluded that Unrelated Diversification has no significant effect on Tobin’s q.
Overall, model 3 being significant, explained around 10% variation in Tobin’s q (Adj.
R2 = 0.091). Among control variables, Leverage was significant at 90% confidence
levels in models 2 and 3 having significant positive impact on Tobin’s q.
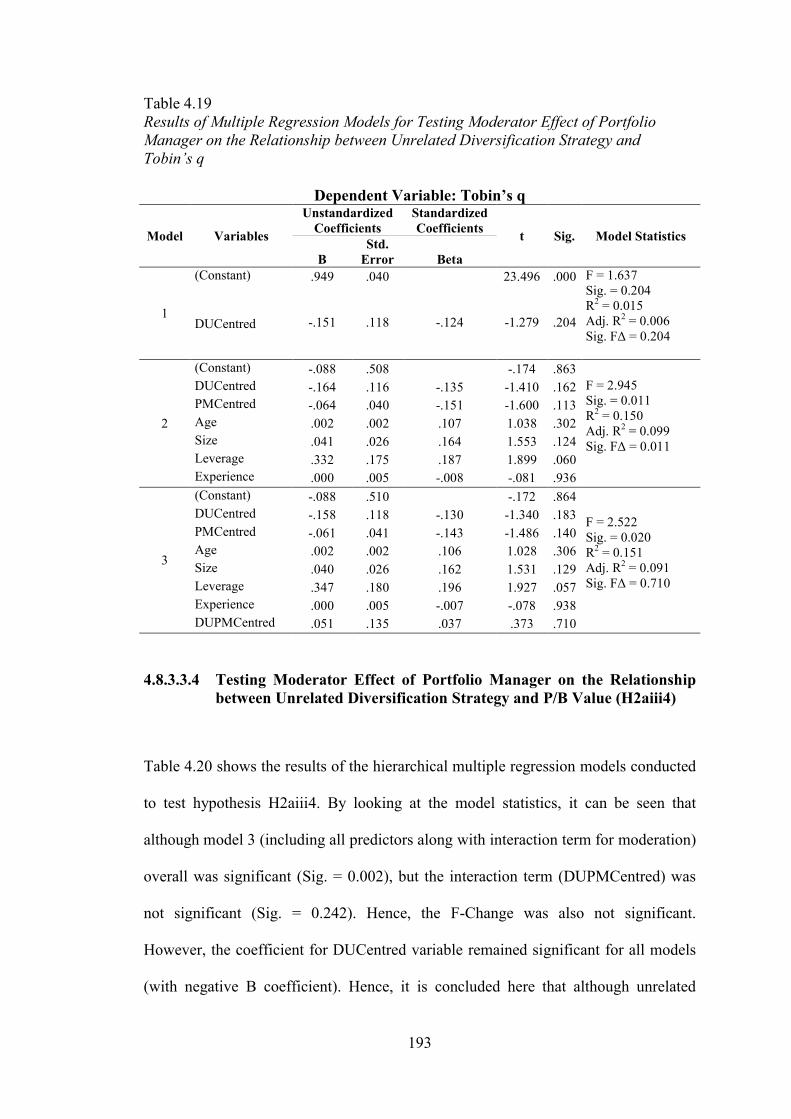
193
Table 4.19 Results of Multiple Regression Models for Testing Moderator Effect of Portfolio Manager on the Relationship between Unrelated Diversification Strategy and Tobin’s q
Dependent Variable: Tobin’s q
Model Variables
Unstandardized Coefficients
Standardized Coefficients
t Sig. Model Statistics
B Std.
Error Beta
1
(Constant) .949 .040 23.496 .000 F = 1.637 Sig. = 0.204 R2 = 0.015 Adj. R2 = 0.006 Sig. FΔ = 0.204
DUCentred -.151 .118 -.124 -1.279 .204
2
(Constant) -.088 .508 -.174 .863 F = 2.945 Sig. = 0.011 R2 = 0.150 Adj. R2 = 0.099 Sig. FΔ = 0.011
DUCentred -.164 .116 -.135 -1.410 .162
PMCentred -.064 .040 -.151 -1.600 .113
Age .002 .002 .107 1.038 .302
Size .041 .026 .164 1.553 .124
Leverage .332 .175 .187 1.899 .060
Experience .000 .005 -.008 -.081 .936
3
(Constant) -.088 .510 -.172 .864
F = 2.522 Sig. = 0.020 R2 = 0.151 Adj. R2 = 0.091 Sig. FΔ = 0.710
DUCentred -.158 .118 -.130 -1.340 .183
PMCentred -.061 .041 -.143 -1.486 .140
Age .002 .002 .106 1.028 .306
Size .040 .026 .162 1.531 .129
Leverage .347 .180 .196 1.927 .057
Experience .000 .005 -.007 -.078 .938
DUPMCentred .051 .135 .037 .373 .710
4.8.3.3.4 Testing Moderator Effect of Portfolio Manager on the Relationship between Unrelated Diversification Strategy and P/B Value (H2aiii4)
Table 4.20 shows the results of the hierarchical multiple regression models conducted
to test hypothesis H2aiii4. By looking at the model statistics, it can be seen that
although model 3 (including all predictors along with interaction term for moderation)
overall was significant (Sig. = 0.002), but the interaction term (DUPMCentred) was
not significant (Sig. = 0.242). Hence, the F-Change was also not significant.
However, the coefficient for DUCentred variable remained significant for all models
(with negative B coefficient). Hence, it is concluded here that although unrelated
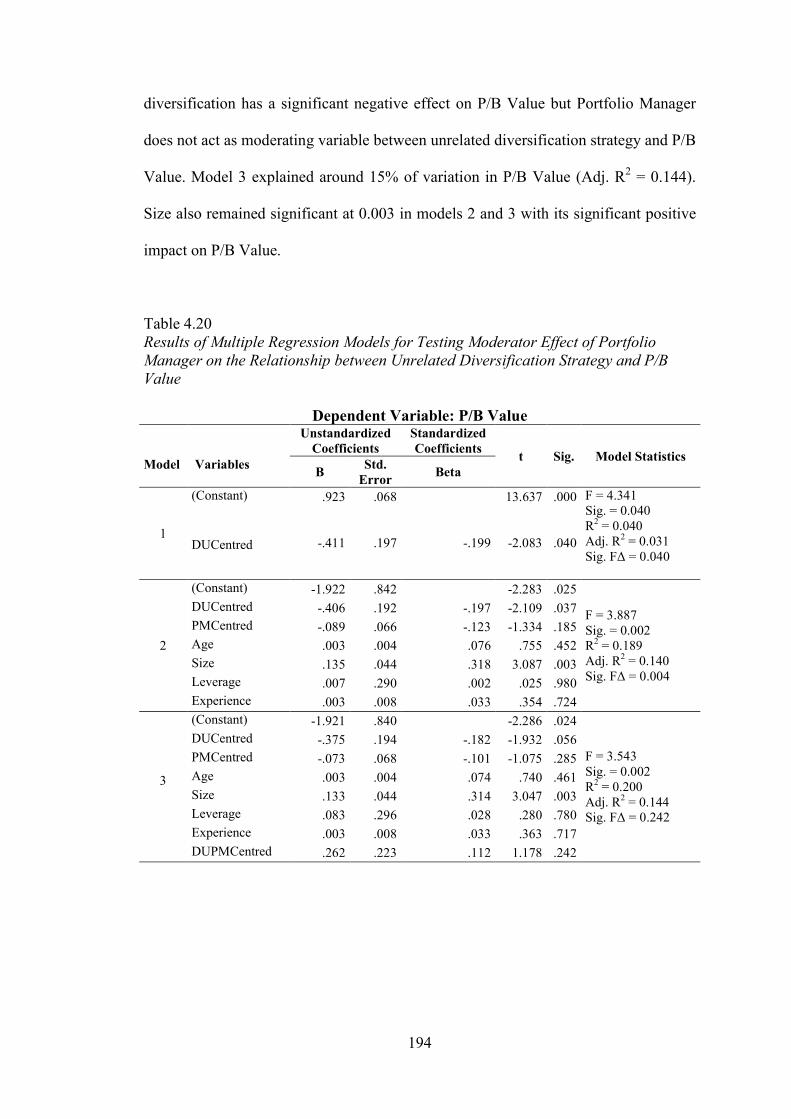
194
diversification has a significant negative effect on P/B Value but Portfolio Manager
does not act as moderating variable between unrelated diversification strategy and P/B
Value. Model 3 explained around 15% of variation in P/B Value (Adj. R2 = 0.144).
Size also remained significant at 0.003 in models 2 and 3 with its significant positive
impact on P/B Value.
Table 4.20 Results of Multiple Regression Models for Testing Moderator Effect of Portfolio Manager on the Relationship between Unrelated Diversification Strategy and P/B Value
Dependent Variable: P/B Value
Model
Variables
Unstandardized Coefficients
Standardized Coefficients
t Sig. Model Statistics B
Std. Error
Beta
1
(Constant) .923 .068 13.637 .000 F = 4.341 Sig. = 0.040 R2 = 0.040 Adj. R2 = 0.031 Sig. FΔ = 0.040
DUCentred -.411 .197 -.199 -2.083 .040
2
(Constant) -1.922 .842 -2.283 .025
F = 3.887 Sig. = 0.002 R2 = 0.189 Adj. R2 = 0.140 Sig. FΔ = 0.004
DUCentred -.406 .192 -.197 -2.109 .037
PMCentred -.089 .066 -.123 -1.334 .185
Age .003 .004 .076 .755 .452
Size .135 .044 .318 3.087 .003
Leverage .007 .290 .002 .025 .980
Experience .003 .008 .033 .354 .724
3
(Constant) -1.921 .840 -2.286 .024
F = 3.543 Sig. = 0.002 R2 = 0.200 Adj. R2 = 0.144 Sig. FΔ = 0.242
DUCentred -.375 .194 -.182 -1.932 .056
PMCentred -.073 .068 -.101 -1.075 .285
Age .003 .004 .074 .740 .461
Size .133 .044 .314 3.047 .003
Leverage .083 .296 .028 .280 .780
Experience .003 .008 .033 .363 .717
DUPMCentred .262 .223 .112 1.178 .242
195
4.8.4 Testing Moderator Effects of Corporate Parenting Roles on the Relationship between Diversification Strategies and Subjective Corporate Performance (H2bi, H2bii, H2biii)
It is discussed before in the previous chapters that this study divided Corporate
Performance variable into two dimensions – Objective (Financial) Corporate
Performance and Subjective Corporate Performance. Findings of the tests regarding
moderating role of Corporate Parenting Roles have been presented before for
financial ratios (ROA, ROE, Tobin’s q and P/B Value) which reflect objective
component of Corporate Performance. This section will present test results for the
moderating effect of Corporate Parenting Roles against Subjective Assessment of
Corporate Performance (named in this study as Subjective Corporate Performance).
4.8.4.1 Testing Moderator Effect of Synergy Manager on the Relationship between Related Diversification Strategy and Subjective Corporate Performance (SCP) (H2bi)
The Table 4.21 showing the results of hierarchical regression models conducted to
test moderating effect of SM on the relationship between DR and SCP is shown on
the next page. The models’ statistics show that model 1 was not significant (Sig. =
0.661) whereas model 2 and model 3 were significant at 0.000. Also, by looking at the
3rd model statistics, it is evident that the interaction term DRSMCentred was not
significant in the third model (Sig. 0.285). DRCentred was also not significant in any
of the models. This concludes that Synergy Manager does not act as moderating
variable between Related Diversification Strategy and SCP. Also, Related
Diversification Strategy has no significant effect on SCP. Model 3 explained around
37% variation in SCP attributed to all predictors.
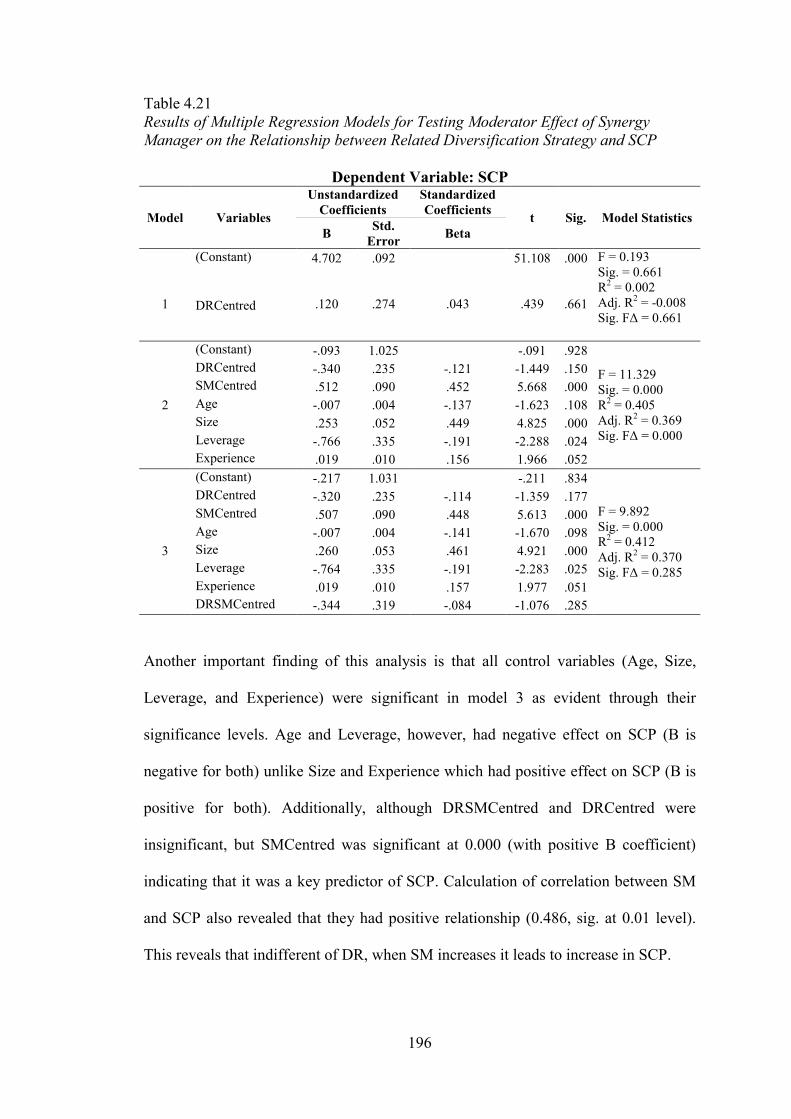
196
Table 4.21 Results of Multiple Regression Models for Testing Moderator Effect of Synergy Manager on the Relationship between Related Diversification Strategy and SCP
Dependent Variable: SCP
Model Variables
Unstandardized Coefficients
Standardized Coefficients
t Sig. Model Statistics B
Std. Error
Beta
(Constant) 4.702 .092 51.108 .000 F = 0.193 Sig. = 0.661 R2 = 0.002 Adj. R2 = -0.008 Sig. FΔ = 0.661
1
DRCentred .120 .274 .043 .439 .661
(Constant) -.093 1.025 -.091 .928
F = 11.329 Sig. = 0.000 R2 = 0.405 Adj. R2 = 0.369 Sig. FΔ = 0.000
DRCentred -.340 .235 -.121 -1.449 .150
SMCentred .512 .090 .452 5.668 .000
2 Age -.007 .004 -.137 -1.623 .108
Size .253 .052 .449 4.825 .000
Leverage -.766 .335 -.191 -2.288 .024
Experience .019 .010 .156 1.966 .052
(Constant) -.217 1.031 -.211 .834
F = 9.892 Sig. = 0.000 R2 = 0.412 Adj. R2 = 0.370 Sig. FΔ = 0.285
DRCentred -.320 .235 -.114 -1.359 .177
SMCentred .507 .090 .448 5.613 .000
Age -.007 .004 -.141 -1.670 .098
3 Size .260 .053 .461 4.921 .000
Leverage -.764 .335 -.191 -2.283 .025
Experience .019 .010 .157 1.977 .051
DRSMCentred -.344 .319 -.084 -1.076 .285
Another important finding of this analysis is that all control variables (Age, Size,
Leverage, and Experience) were significant in model 3 as evident through their
significance levels. Age and Leverage, however, had negative effect on SCP (B is
negative for both) unlike Size and Experience which had positive effect on SCP (B is
positive for both). Additionally, although DRSMCentred and DRCentred were
insignificant, but SMCentred was significant at 0.000 (with positive B coefficient)
indicating that it was a key predictor of SCP. Calculation of correlation between SM
and SCP also revealed that they had positive relationship (0.486, sig. at 0.01 level).
This reveals that indifferent of DR, when SM increases it leads to increase in SCP.
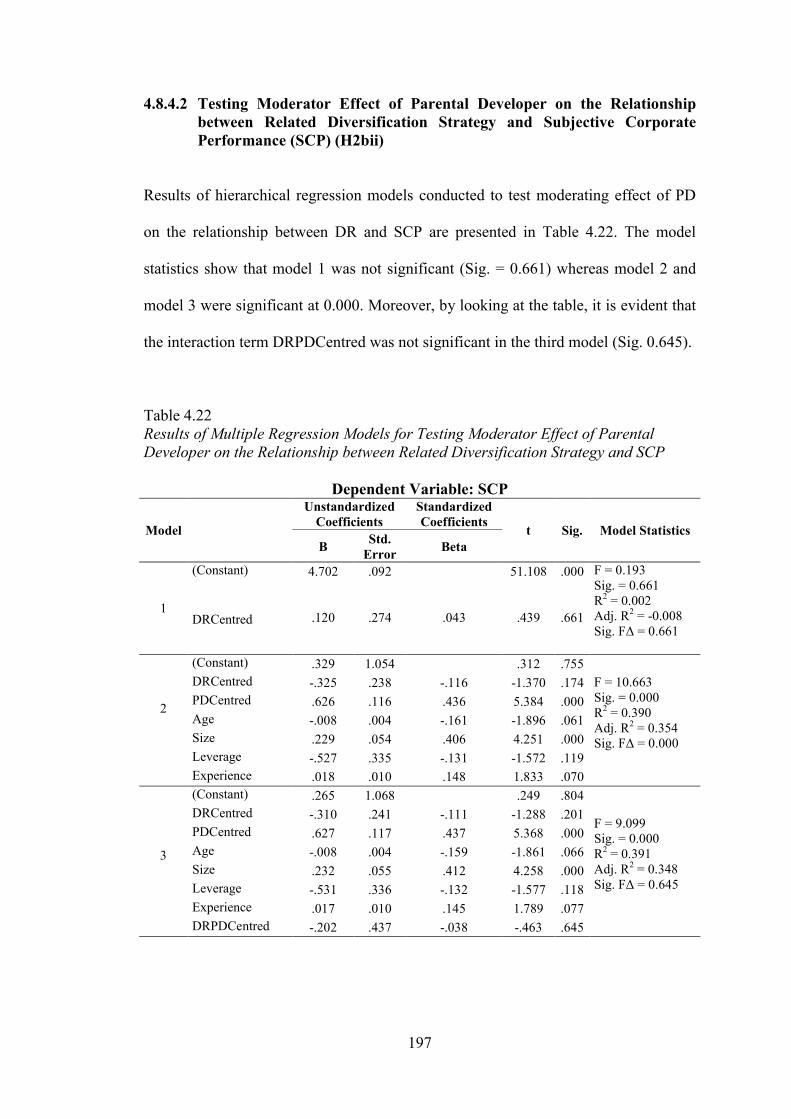
197
4.8.4.2 Testing Moderator Effect of Parental Developer on the Relationship between Related Diversification Strategy and Subjective Corporate Performance (SCP) (H2bii)
Results of hierarchical regression models conducted to test moderating effect of PD
on the relationship between DR and SCP are presented in Table 4.22. The model
statistics show that model 1 was not significant (Sig. = 0.661) whereas model 2 and
model 3 were significant at 0.000. Moreover, by looking at the table, it is evident that
the interaction term DRPDCentred was not significant in the third model (Sig. 0.645).
Table 4.22 Results of Multiple Regression Models for Testing Moderator Effect of Parental Developer on the Relationship between Related Diversification Strategy and SCP
Dependent Variable: SCP
Model
Unstandardized Coefficients
Standardized Coefficients
t Sig. Model Statistics B
Std. Error
Beta
1
(Constant) 4.702 .092 51.108 .000 F = 0.193 Sig. = 0.661 R2 = 0.002 Adj. R2 = -0.008 Sig. FΔ = 0.661
DRCentred .120 .274 .043 .439 .661
2
(Constant) .329 1.054 .312 .755
F = 10.663 Sig. = 0.000 R2 = 0.390 Adj. R2 = 0.354 Sig. FΔ = 0.000
DRCentred -.325 .238 -.116 -1.370 .174
PDCentred .626 .116 .436 5.384 .000
Age -.008 .004 -.161 -1.896 .061
Size .229 .054 .406 4.251 .000
Leverage -.527 .335 -.131 -1.572 .119
Experience .018 .010 .148 1.833 .070
3
(Constant) .265 1.068 .249 .804
F = 9.099 Sig. = 0.000 R2 = 0.391 Adj. R2 = 0.348 Sig. FΔ = 0.645
DRCentred -.310 .241 -.111 -1.288 .201
PDCentred .627 .117 .437 5.368 .000
Age -.008 .004 -.159 -1.861 .066
Size .232 .055 .412 4.258 .000
Leverage -.531 .336 -.132 -1.577 .118
Experience .017 .010 .145 1.789 .077
DRPDCentred -.202 .437 -.038 -.463 .645
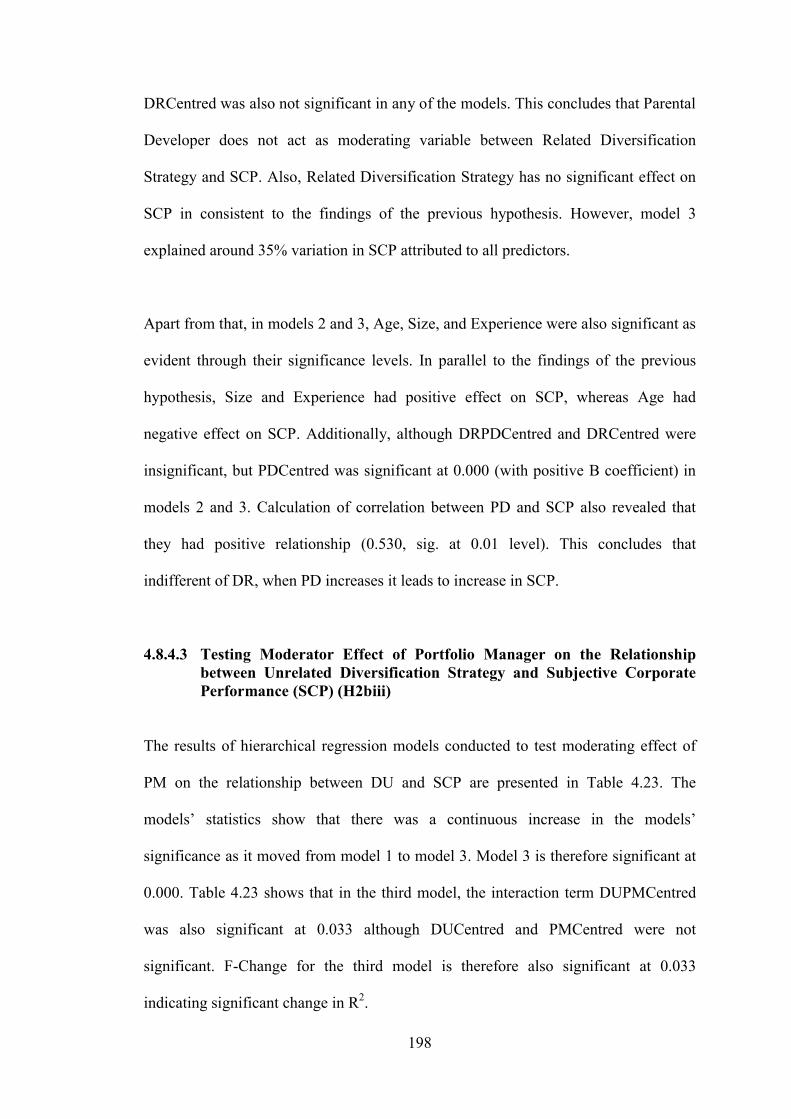
198
DRCentred was also not significant in any of the models. This concludes that Parental
Developer does not act as moderating variable between Related Diversification
Strategy and SCP. Also, Related Diversification Strategy has no significant effect on
SCP in consistent to the findings of the previous hypothesis. However, model 3
explained around 35% variation in SCP attributed to all predictors.
Apart from that, in models 2 and 3, Age, Size, and Experience were also significant as
evident through their significance levels. In parallel to the findings of the previous
hypothesis, Size and Experience had positive effect on SCP, whereas Age had
negative effect on SCP. Additionally, although DRPDCentred and DRCentred were
insignificant, but PDCentred was significant at 0.000 (with positive B coefficient) in
models 2 and 3. Calculation of correlation between PD and SCP also revealed that
they had positive relationship (0.530, sig. at 0.01 level). This concludes that
indifferent of DR, when PD increases it leads to increase in SCP.
4.8.4.3 Testing Moderator Effect of Portfolio Manager on the Relationship between Unrelated Diversification Strategy and Subjective Corporate Performance (SCP) (H2biii)
The results of hierarchical regression models conducted to test moderating effect of
PM on the relationship between DU and SCP are presented in Table 4.23. The
models’ statistics show that there was a continuous increase in the models’
significance as it moved from model 1 to model 3. Model 3 is therefore significant at
0.000. Table 4.23 shows that in the third model, the interaction term DUPMCentred
was also significant at 0.033 although DUCentred and PMCentred were not
significant. F-Change for the third model is therefore also significant at 0.033
indicating significant change in R2.
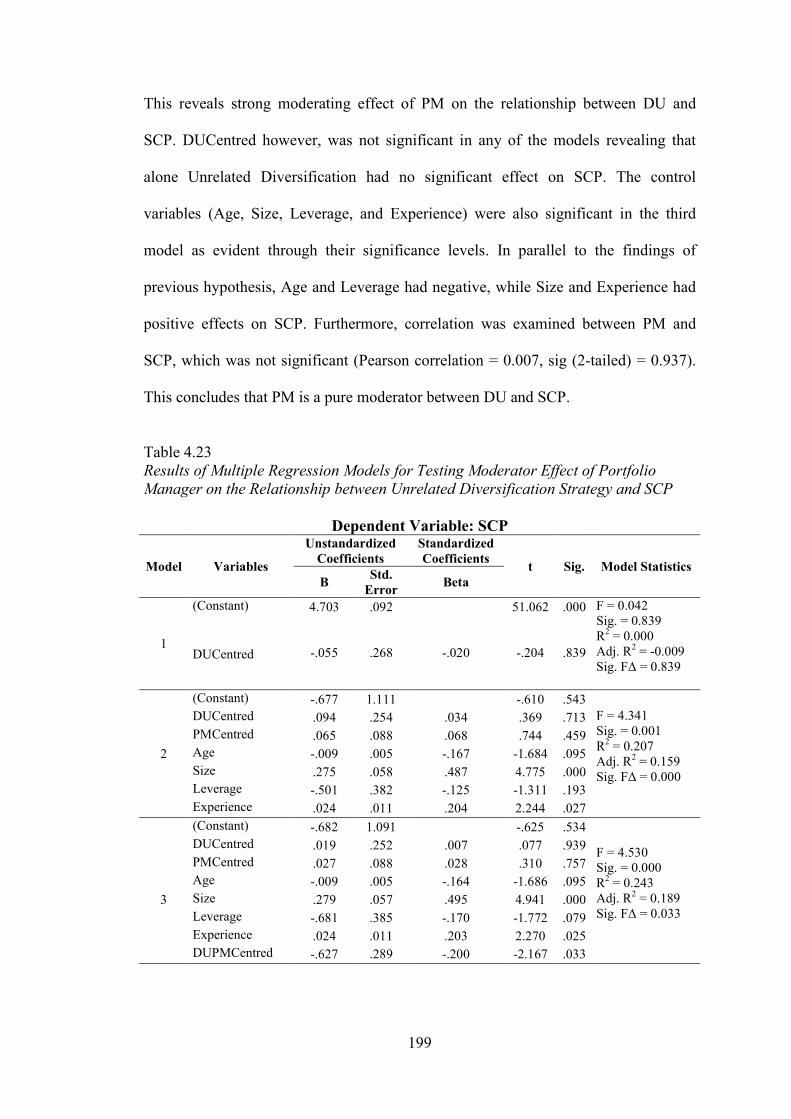
199
This reveals strong moderating effect of PM on the relationship between DU and
SCP. DUCentred however, was not significant in any of the models revealing that
alone Unrelated Diversification had no significant effect on SCP. The control
variables (Age, Size, Leverage, and Experience) were also significant in the third
model as evident through their significance levels. In parallel to the findings of
previous hypothesis, Age and Leverage had negative, while Size and Experience had
positive effects on SCP. Furthermore, correlation was examined between PM and
SCP, which was not significant (Pearson correlation = 0.007, sig (2-tailed) = 0.937).
This concludes that PM is a pure moderator between DU and SCP.
Table 4.23 Results of Multiple Regression Models for Testing Moderator Effect of Portfolio Manager on the Relationship between Unrelated Diversification Strategy and SCP
Dependent Variable: SCP
Model Variables
Unstandardized Coefficients
Standardized Coefficients
t Sig. Model Statistics B
Std. Error
Beta
1
(Constant) 4.703 .092 51.062 .000 F = 0.042 Sig. = 0.839 R2 = 0.000 Adj. R2 = -0.009 Sig. FΔ = 0.839
DUCentred -.055 .268 -.020 -.204 .839
(Constant) -.677 1.111 -.610 .543 F = 4.341 Sig. = 0.001 R2 = 0.207 Adj. R2 = 0.159 Sig. FΔ = 0.000
DUCentred .094 .254 .034 .369 .713
PMCentred .065 .088 .068 .744 .459
2 Age -.009 .005 -.167 -1.684 .095
Size .275 .058 .487 4.775 .000
Leverage -.501 .382 -.125 -1.311 .193
Experience .024 .011 .204 2.244 .027
(Constant) -.682 1.091 -.625 .534
F = 4.530 Sig. = 0.000 R2 = 0.243 Adj. R2 = 0.189 Sig. FΔ = 0.033
DUCentred .019 .252 .007 .077 .939
PMCentred .027 .088 .028 .310 .757
Age -.009 .005 -.164 -1.686 .095
3 Size .279 .057 .495 4.941 .000
Leverage -.681 .385 -.170 -1.772 .079
Experience .024 .011 .203 2.270 .025
DUPMCentred -.627 .289 -.200 -2.167 .033
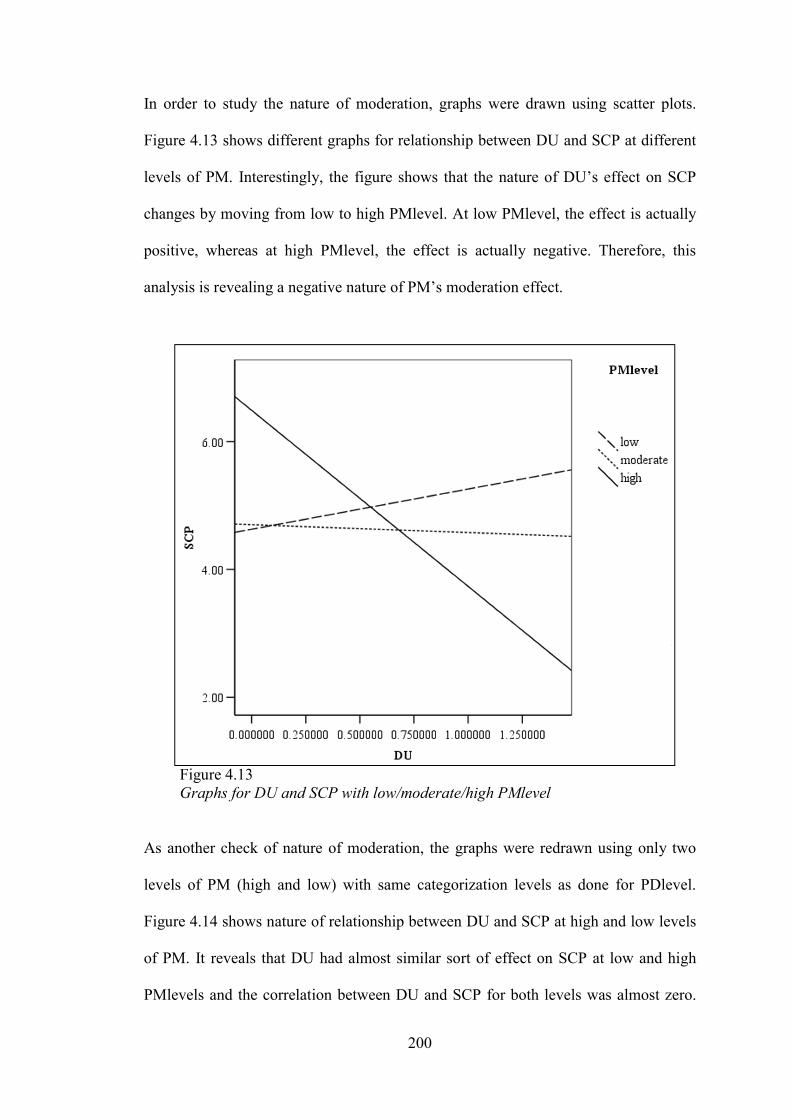
200
In order to study the nature of moderation, graphs were drawn using scatter plots.
Figure 4.13 shows different graphs for relationship between DU and SCP at different
levels of PM. Interestingly, the figure shows that the nature of DU’s effect on SCP
changes by moving from low to high PMlevel. At low PMlevel, the effect is actually
positive, whereas at high PMlevel, the effect is actually negative. Therefore, this
analysis is revealing a negative nature of PM’s moderation effect.
Figure 4.13 Graphs for DU and SCP with low/moderate/high PMlevel
As another check of nature of moderation, the graphs were redrawn using only two
levels of PM (high and low) with same categorization levels as done for PDlevel.
Figure 4.14 shows nature of relationship between DU and SCP at high and low levels
of PM. It reveals that DU had almost similar sort of effect on SCP at low and high
PMlevels and the correlation between DU and SCP for both levels was almost zero.
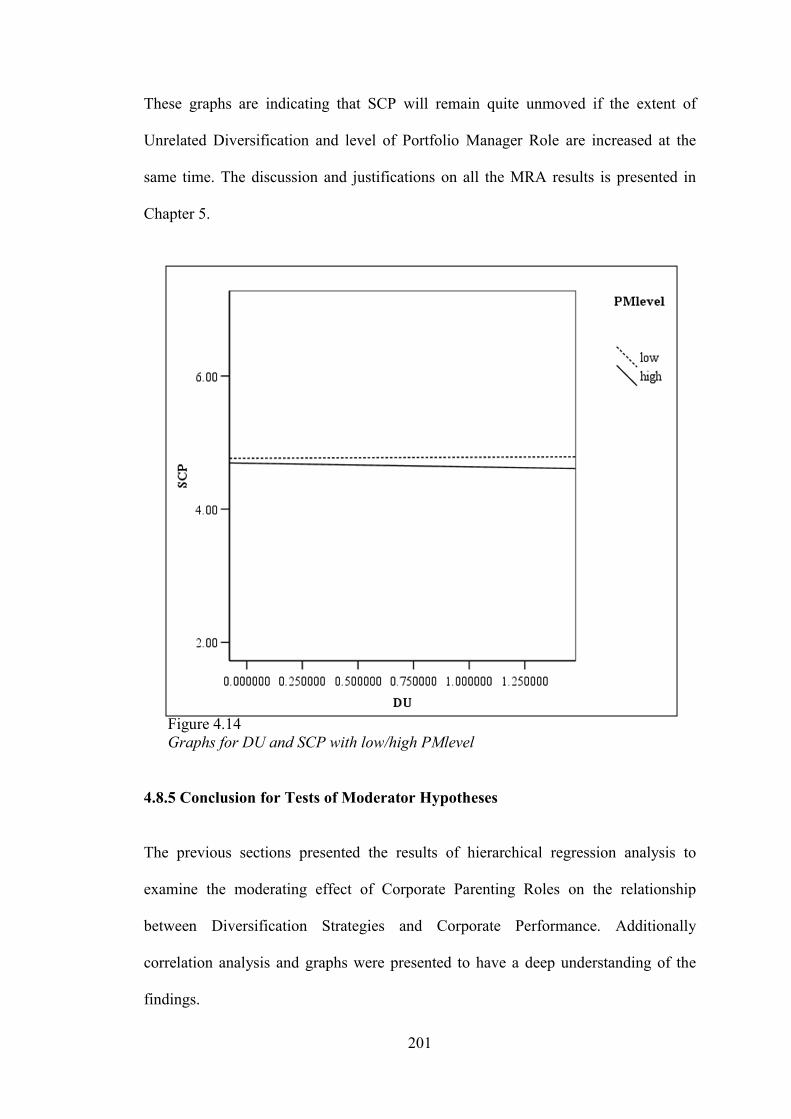
201
These graphs are indicating that SCP will remain quite unmoved if the extent of
Unrelated Diversification and level of Portfolio Manager Role are increased at the
same time. The discussion and justifications on all the MRA results is presented in
Chapter 5.
Figure 4.14 Graphs for DU and SCP with low/high PMlevel
4.8.5 Conclusion for Tests of Moderator Hypotheses
The previous sections presented the results of hierarchical regression analysis to
examine the moderating effect of Corporate Parenting Roles on the relationship
between Diversification Strategies and Corporate Performance. Additionally
correlation analysis and graphs were presented to have a deep understanding of the
findings.
202
About effect of Related Diversification Strategy on Performance, it is concluded that
Related Diversification Strategy has a significant positive effect on market measures
of performance (Tobin’s q, P/B Value). Whereas, Unrelated Diversification Strategy
has a significant negative effect on ROA (accounting measure of performance) and
P/B Value (market measure of performance). These conclusions are widely accepted
by the literature on the topic as it is discussed in detail in Chapter 5.
Regarding Synergy Manager Role, it is concluded that it acts as a positive moderating
variable (pure moderator) between Related Diversification Strategy and market
measures of performance (Tobin’s q, P/B Value). Parental Developer Role acts as a
positive moderating variable between Related Diversification Strategy and all
financial ratios of performance (ROA, ROE, Tobin’s q, and P/B Value). However,
only for ROE it acts as a quasi moderator. Portfolio Manager Role acts as positive
moderating variable between Unrelated Diversification Strategy and accounting
measures of performance (ROA, ROE).
Additionally, Portfolio Manager Role acts as moderating variable between Unrelated
Diversification Strategy and Subjective Corporate Performance. For ROE, Portfolio
Manager also acts as a quasi moderator. Moreover, all three moderators have a
positive influence on diversification strategies – performance relationships (except
PM’s moderating effect on DU – SCP relationship). This concludes that the effect of
diversification strategies on performance becomes more positive or converts from
negative to positive if the level of corporate parenting roles is increased.
203
The results obtained for moderator analysis are also supported by the previous
research and literature on the topic. It is discussed in detail with adequate references
from the past studies in Chapter 5. In order to have a collective look on the results of
hypotheses tests, Table 4.28 presented after the next section, provides a summary of
results.
4.8.6 Test of Significant Performance Differences among various Company Groups using t-tests
This section presents the results of t-tests conducted to compare different groups of
companies on different indicators of performance. Initially, it presents t-test results of
comparing Related Diversifiers against Unrelated Diversifiers on various performance
dimensions. Later on, t-test results are presented for comparing Parental Developers
against Synergy Managers within the category of Related Diversifiers.
4.8.6.1 Comparison of Related Diversifiers against Unrelated Diversifiers on Corporate Performance (H3ai to H3aiv, and H3b)
For this analysis, initially the companies were divided into two groups i.e. Dominant
Related Diversifiers and Dominant Unrelated Diversifiers on the basis of three year
average entropy scores. However, for ease of interpretations, Dominant Related
Diversifiers are only termed as Related Diversifiers and Dominant Unrelated
Diversifiers are termed as Unrelated Diversifiers. Independent samples t-tests was
conducted for comparing the performance of these groups on each of the five
dimensions of Corporate Performance.
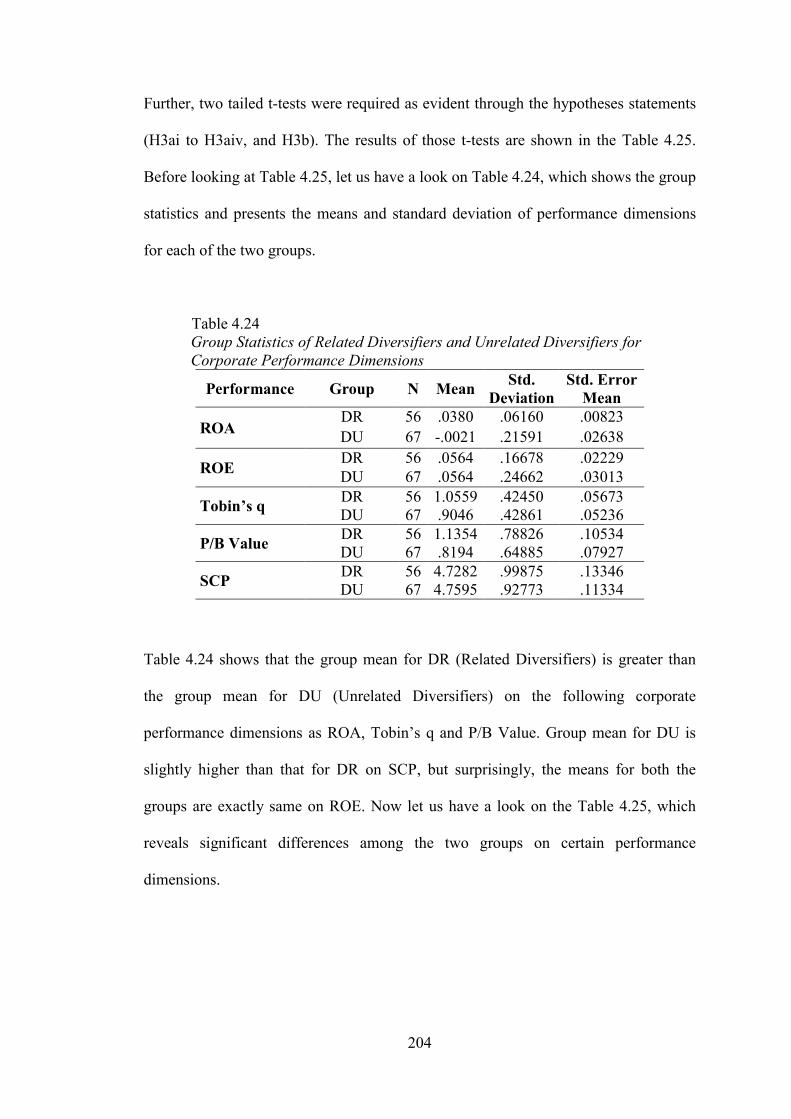
204
Further, two tailed t-tests were required as evident through the hypotheses statements
(H3ai to H3aiv, and H3b). The results of those t-tests are shown in the Table 4.25.
Before looking at Table 4.25, let us have a look on Table 4.24, which shows the group
statistics and presents the means and standard deviation of performance dimensions
for each of the two groups.
Table 4.24 Group Statistics of Related Diversifiers and Unrelated Diversifiers for Corporate Performance Dimensions
Performance Group N Mean Std.
Deviation Std. Error
Mean
ROA DR 56 .0380 .06160 .00823
DU 67 -.0021 .21591 .02638
ROE DR 56 .0564 .16678 .02229 DU 67 .0564 .24662 .03013
Tobin’s q DR 56 1.0559 .42450 .05673 DU 67 .9046 .42861 .05236
P/B Value DR 56 1.1354 .78826 .10534 DU 67 .8194 .64885 .07927
SCP DR 56 4.7282 .99875 .13346 DU 67 4.7595 .92773 .11334
Table 4.24 shows that the group mean for DR (Related Diversifiers) is greater than
the group mean for DU (Unrelated Diversifiers) on the following corporate
performance dimensions as ROA, Tobin’s q and P/B Value. Group mean for DU is
slightly higher than that for DR on SCP, but surprisingly, the means for both the
groups are exactly same on ROE. Now let us have a look on the Table 4.25, which
reveals significant differences among the two groups on certain performance
dimensions.
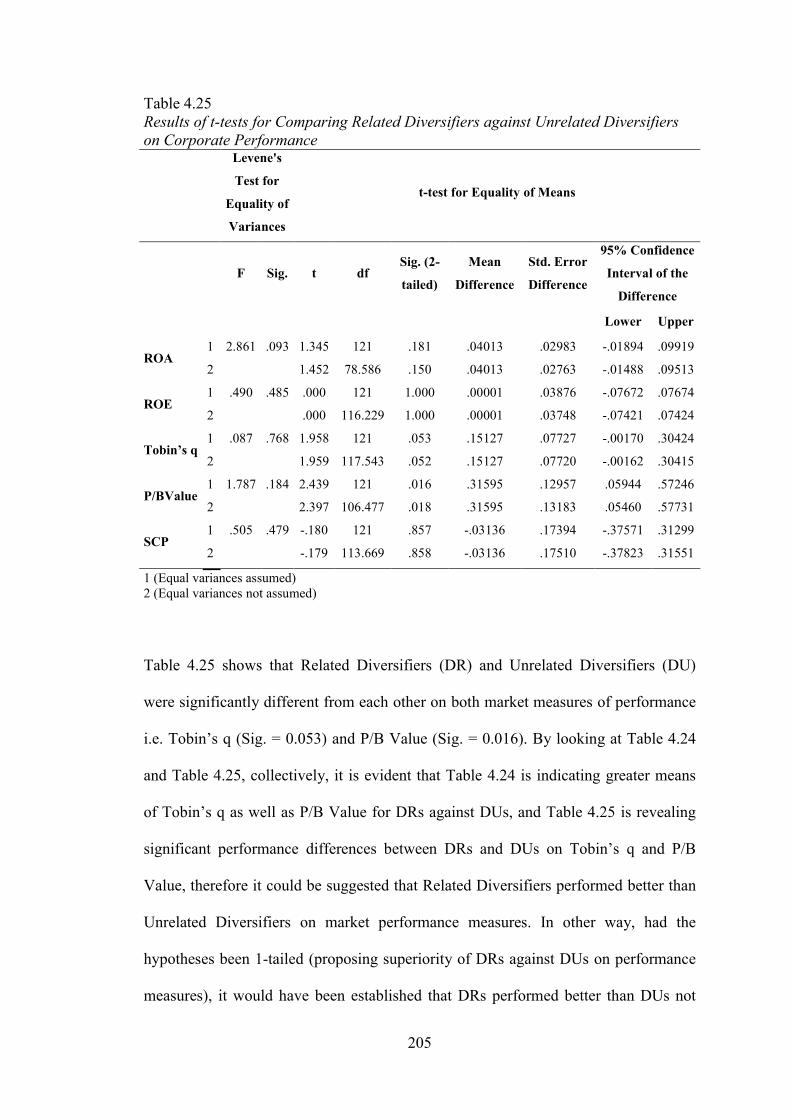
205
Table 4.25 Results of t-tests for Comparing Related Diversifiers against Unrelated Diversifiers on Corporate Performance
Levene's
Test for
Equality of
Variances
t-test for Equality of Means
F Sig. t df Sig. (2-
tailed)
Mean
Difference
Std. Error
Difference
95% Confidence
Interval of the
Difference
Lower Upper
ROA 1 2.861 .093 1.345 121 .181 .04013 .02983 -.01894 .09919
2 1.452 78.586 .150 .04013 .02763 -.01488 .09513
ROE 1 .490 .485 .000 121 1.000 .00001 .03876 -.07672 .07674
2 .000 116.229 1.000 .00001 .03748 -.07421 .07424
Tobin’s q 1 .087 .768 1.958 121 .053 .15127 .07727 -.00170 .30424
2 1.959 117.543 .052 .15127 .07720 -.00162 .30415
P/BValue 1 1.787 .184 2.439 121 .016 .31595 .12957 .05944 .57246
2 2.397 106.477 .018 .31595 .13183 .05460 .57731
SCP 1 .505 .479 -.180 121 .857 -.03136 .17394 -.37571 .31299
2 -.179 113.669 .858 -.03136 .17510 -.37823 .31551
1 (Equal variances assumed) 2 (Equal variances not assumed)
Table 4.25 shows that Related Diversifiers (DR) and Unrelated Diversifiers (DU)
were significantly different from each other on both market measures of performance
i.e. Tobin’s q (Sig. = 0.053) and P/B Value (Sig. = 0.016). By looking at Table 4.24
and Table 4.25, collectively, it is evident that Table 4.24 is indicating greater means
of Tobin’s q as well as P/B Value for DRs against DUs, and Table 4.25 is revealing
significant performance differences between DRs and DUs on Tobin’s q and P/B
Value, therefore it could be suggested that Related Diversifiers performed better than
Unrelated Diversifiers on market performance measures. In other way, had the
hypotheses been 1-tailed (proposing superiority of DRs against DUs on performance
measures), it would have been established that DRs performed better than DUs not
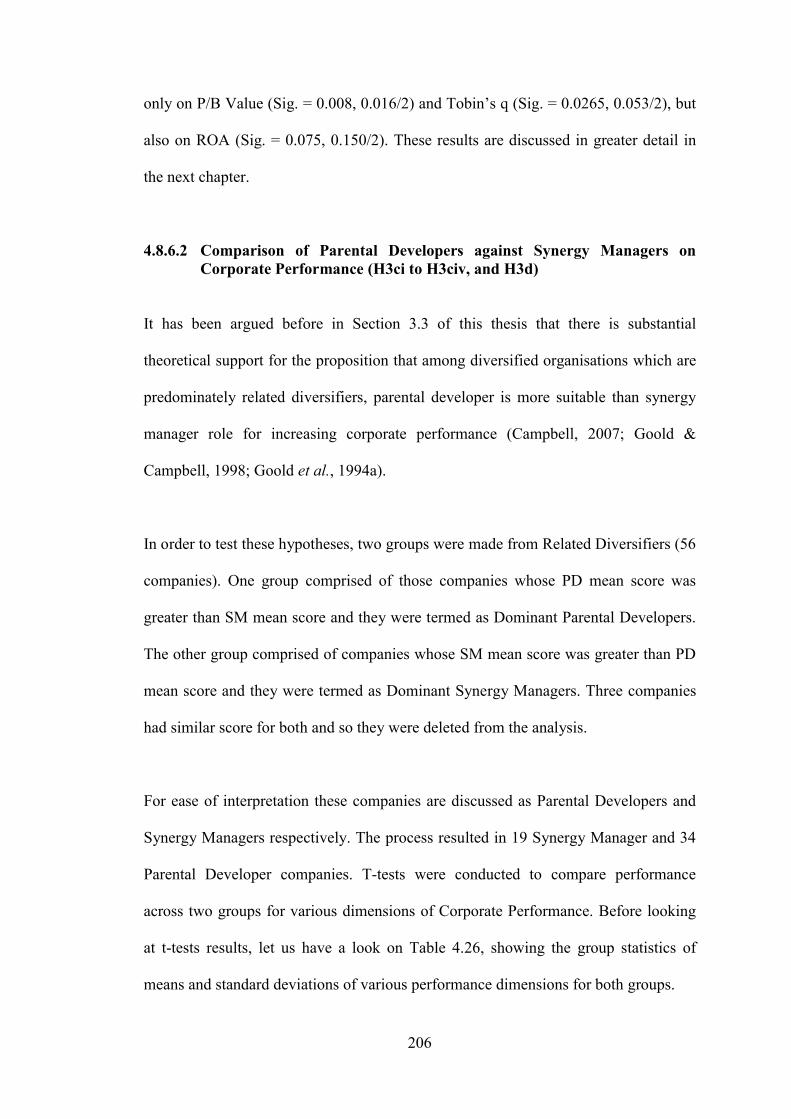
206
only on P/B Value (Sig. = 0.008, 0.016/2) and Tobin’s q (Sig. = 0.0265, 0.053/2), but
also on ROA (Sig. = 0.075, 0.150/2). These results are discussed in greater detail in
the next chapter.
4.8.6.2 Comparison of Parental Developers against Synergy Managers on Corporate Performance (H3ci to H3civ, and H3d)
It has been argued before in Section 3.3 of this thesis that there is substantial
theoretical support for the proposition that among diversified organisations which are
predominately related diversifiers, parental developer is more suitable than synergy
manager role for increasing corporate performance (Campbell, 2007; Goold &
Campbell, 1998; Goold et al., 1994a).
In order to test these hypotheses, two groups were made from Related Diversifiers (56
companies). One group comprised of those companies whose PD mean score was
greater than SM mean score and they were termed as Dominant Parental Developers.
The other group comprised of companies whose SM mean score was greater than PD
mean score and they were termed as Dominant Synergy Managers. Three companies
had similar score for both and so they were deleted from the analysis.
For ease of interpretation these companies are discussed as Parental Developers and
Synergy Managers respectively. The process resulted in 19 Synergy Manager and 34
Parental Developer companies. T-tests were conducted to compare performance
across two groups for various dimensions of Corporate Performance. Before looking
at t-tests results, let us have a look on Table 4.26, showing the group statistics of
means and standard deviations of various performance dimensions for both groups.
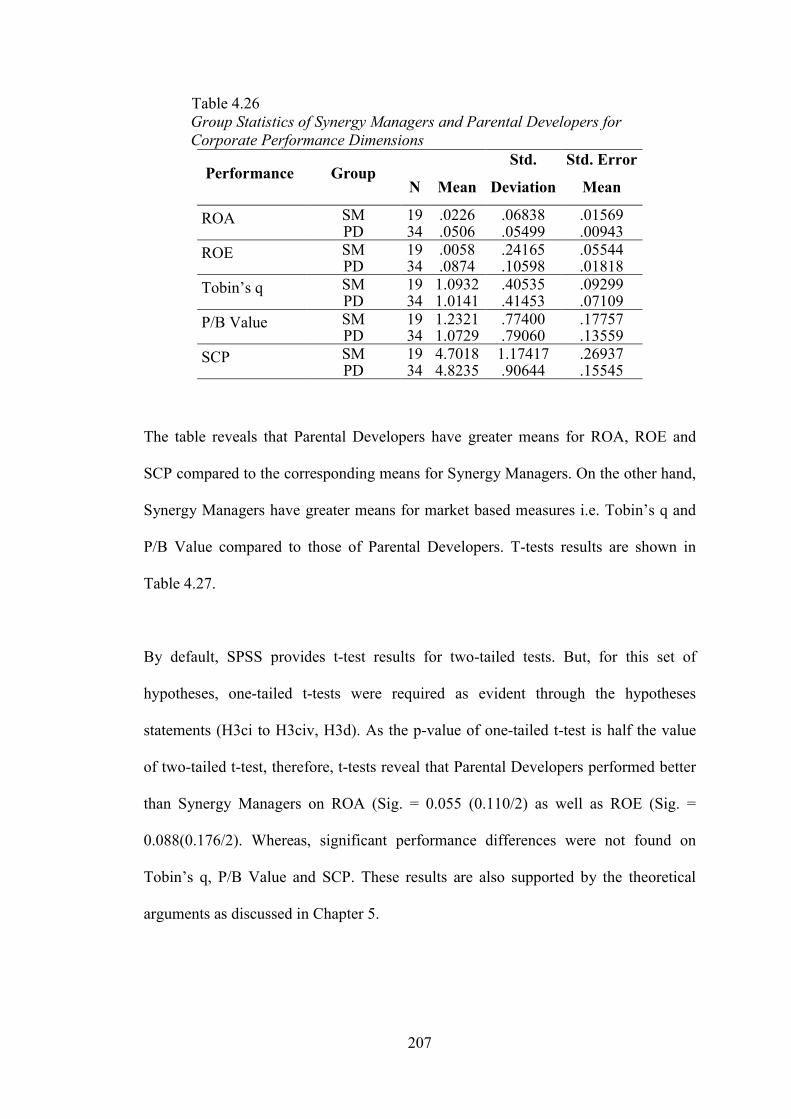
207
Table 4.26 Group Statistics of Synergy Managers and Parental Developers for Corporate Performance Dimensions
Performance Group N Mean
Std.
Deviation
Std. Error
Mean
ROA SM 19 .0226 .06838 .01569 PD 34 .0506 .05499 .00943
ROE SM 19 .0058 .24165 .05544 PD 34 .0874 .10598 .01818
Tobin’s q SM 19 1.0932 .40535 .09299 PD 34 1.0141 .41453 .07109
P/B Value SM 19 1.2321 .77400 .17757 PD 34 1.0729 .79060 .13559
SCP SM 19 4.7018 1.17417 .26937 PD 34 4.8235 .90644 .15545
The table reveals that Parental Developers have greater means for ROA, ROE and
SCP compared to the corresponding means for Synergy Managers. On the other hand,
Synergy Managers have greater means for market based measures i.e. Tobin’s q and
P/B Value compared to those of Parental Developers. T-tests results are shown in
Table 4.27.
By default, SPSS provides t-test results for two-tailed tests. But, for this set of
hypotheses, one-tailed t-tests were required as evident through the hypotheses
statements (H3ci to H3civ, H3d). As the p-value of one-tailed t-test is half the value
of two-tailed t-test, therefore, t-tests reveal that Parental Developers performed better
than Synergy Managers on ROA (Sig. = 0.055 (0.110/2) as well as ROE (Sig. =
0.088(0.176/2). Whereas, significant performance differences were not found on
Tobin’s q, P/B Value and SCP. These results are also supported by the theoretical
arguments as discussed in Chapter 5.
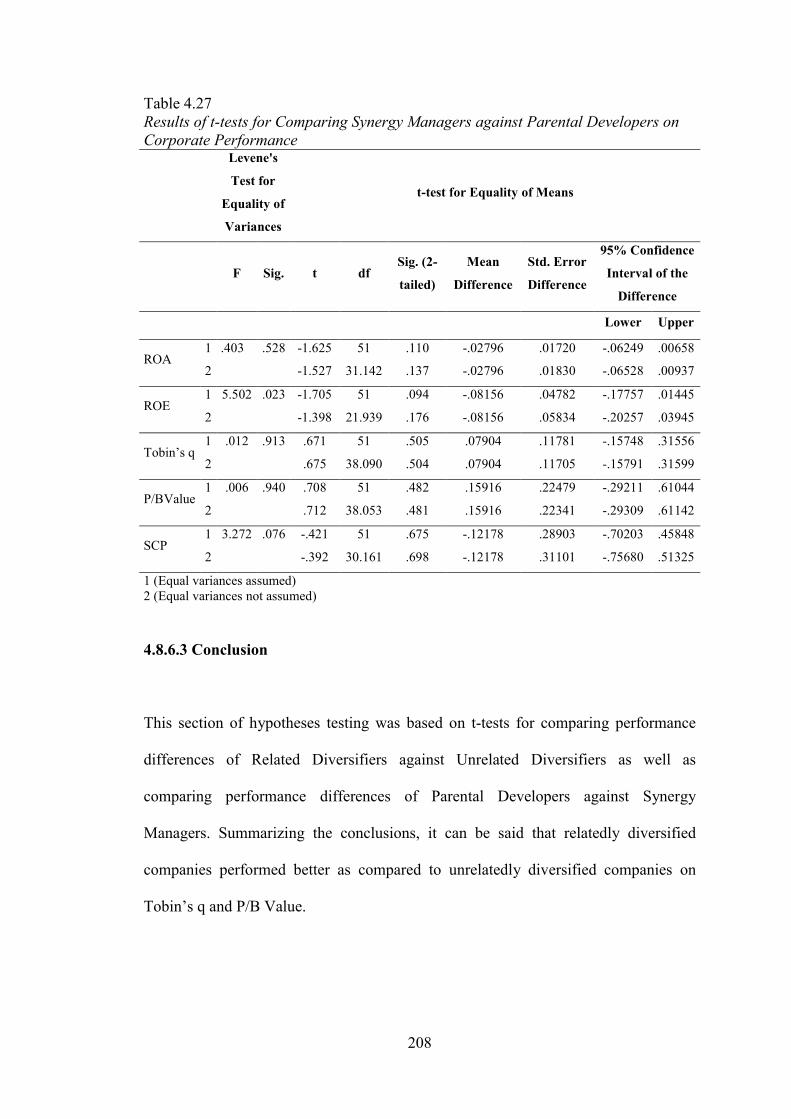
208
Table 4.27 Results of t-tests for Comparing Synergy Managers against Parental Developers on Corporate Performance
Levene's
Test for
Equality of
Variances
t-test for Equality of Means
F Sig. t df Sig. (2-
tailed)
Mean
Difference
Std. Error
Difference
95% Confidence
Interval of the
Difference
Lower Upper
ROA 1 .403 .528 -1.625 51 .110 -.02796 .01720 -.06249 .00658
2 -1.527 31.142 .137 -.02796 .01830 -.06528 .00937
ROE 1 5.502 .023 -1.705 51 .094 -.08156 .04782 -.17757 .01445
2 -1.398 21.939 .176 -.08156 .05834 -.20257 .03945
Tobin’s q 1 .012 .913 .671 51 .505 .07904 .11781 -.15748 .31556
2 .675 38.090 .504 .07904 .11705 -.15791 .31599
P/BValue 1 .006 .940 .708 51 .482 .15916 .22479 -.29211 .61044
2 .712 38.053 .481 .15916 .22341 -.29309 .61142
SCP 1 3.272 .076 -.421 51 .675 -.12178 .28903 -.70203 .45848
2 -.392 30.161 .698 -.12178 .31101 -.75680 .51325
1 (Equal variances assumed) 2 (Equal variances not assumed)
4.8.6.3 Conclusion
This section of hypotheses testing was based on t-tests for comparing performance
differences of Related Diversifiers against Unrelated Diversifiers as well as
comparing performance differences of Parental Developers against Synergy
Managers. Summarizing the conclusions, it can be said that relatedly diversified
companies performed better as compared to unrelatedly diversified companies on
Tobin’s q and P/B Value.
209
An additional analysis of number of Portfolio Managers, Synergy Managers, and
Parental Developers in each of Related Diversifiers and Unrelated Diversifiers
revealed that, in Related Diversifiers, corporate parents in 34 PLCs were working as
Parental Developers, whereas in 19 PLCs they were working as Synergy Managers.
On the other hand, in Unrelated Diversifiers, corporate parents in 34 PLCs were
working as Parental Developers, in 32 PLCs as Synergy Managers, and in one (1)
PLC only, they were working as Portfolio Manager.
This analysis indicates a practical misfit regarding type of diversification strategy and
corporate parenting role in unrelatedly diversified Malaysian PLCs. Had the number
of Portfolio Managers in Unrelated Diversifiers greater than Synergy Managers and
Parental Developers, Unrelated Diversifiers might have performed well or competed
well against Related Diversifiers. The analysis in sections 4.8.3.3.1 and 4.8.3.3.4
showed that Unrelated Diversifiers had negative effect on ROA and P/B Value
respectively. Also, t-tests’ results in section 4.8.6.1 indicated that Related Diversifiers
well doing better than Unrelated Diversifiers on certain performance measures. All
these analyses indicate that corporate parenting roles do have a moderating effect on
diversification – performance relationship.
About comparing Parental Developers against Synergy Managers, it is concluded that
former ones performed better as compared to later ones on ROA as well as on ROE
(accounting measure of performance). The results of both categories of tests go along
with the theoretical literature on the topics. Discussion of these results in relation to
past literature is done in Chapter 5.
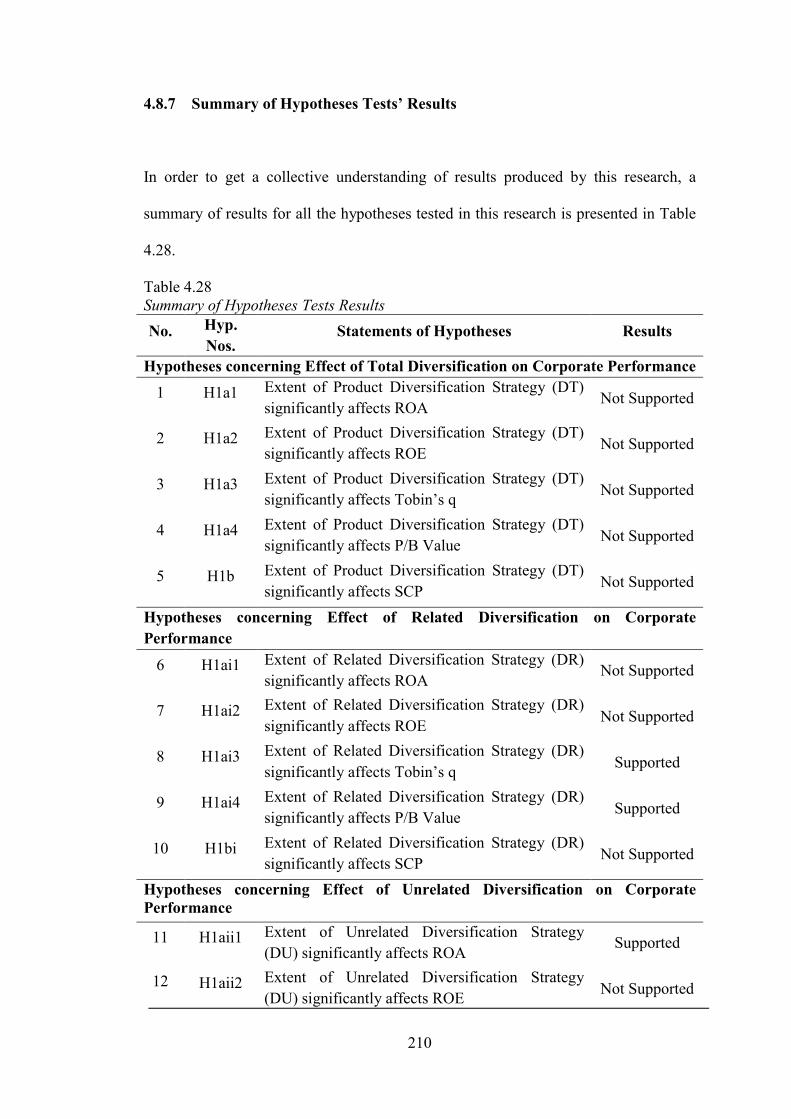
210
4.8.7 Summary of Hypotheses Tests’ Results
In order to get a collective understanding of results produced by this research, a
summary of results for all the hypotheses tested in this research is presented in Table
4.28.
Table 4.28 Summary of Hypotheses Tests Results
No. Hyp.
Nos. Statements of Hypotheses Results
Hypotheses concerning Effect of Total Diversification on Corporate Performance
1 H1a1 Extent of Product Diversification Strategy (DT)
significantly affects ROA Not Supported
2 H1a2 Extent of Product Diversification Strategy (DT)
significantly affects ROE Not Supported
3 H1a3 Extent of Product Diversification Strategy (DT)
significantly affects Tobin’s q Not Supported
4 H1a4 Extent of Product Diversification Strategy (DT)
significantly affects P/B Value Not Supported
5 H1b Extent of Product Diversification Strategy (DT)
significantly affects SCP Not Supported
Hypotheses concerning Effect of Related Diversification on Corporate
Performance
6 H1ai1 Extent of Related Diversification Strategy (DR)
significantly affects ROA Not Supported
7 H1ai2 Extent of Related Diversification Strategy (DR)
significantly affects ROE Not Supported
8 H1ai3 Extent of Related Diversification Strategy (DR)
significantly affects Tobin’s q Supported
9 H1ai4 Extent of Related Diversification Strategy (DR)
significantly affects P/B Value Supported
10 H1bi Extent of Related Diversification Strategy (DR)
significantly affects SCP Not Supported
Hypotheses concerning Effect of Unrelated Diversification on Corporate Performance
11 H1aii1 Extent of Unrelated Diversification Strategy
(DU) significantly affects ROA Supported
12 H1aii2 Extent of Unrelated Diversification Strategy
(DU) significantly affects ROE Not Supported
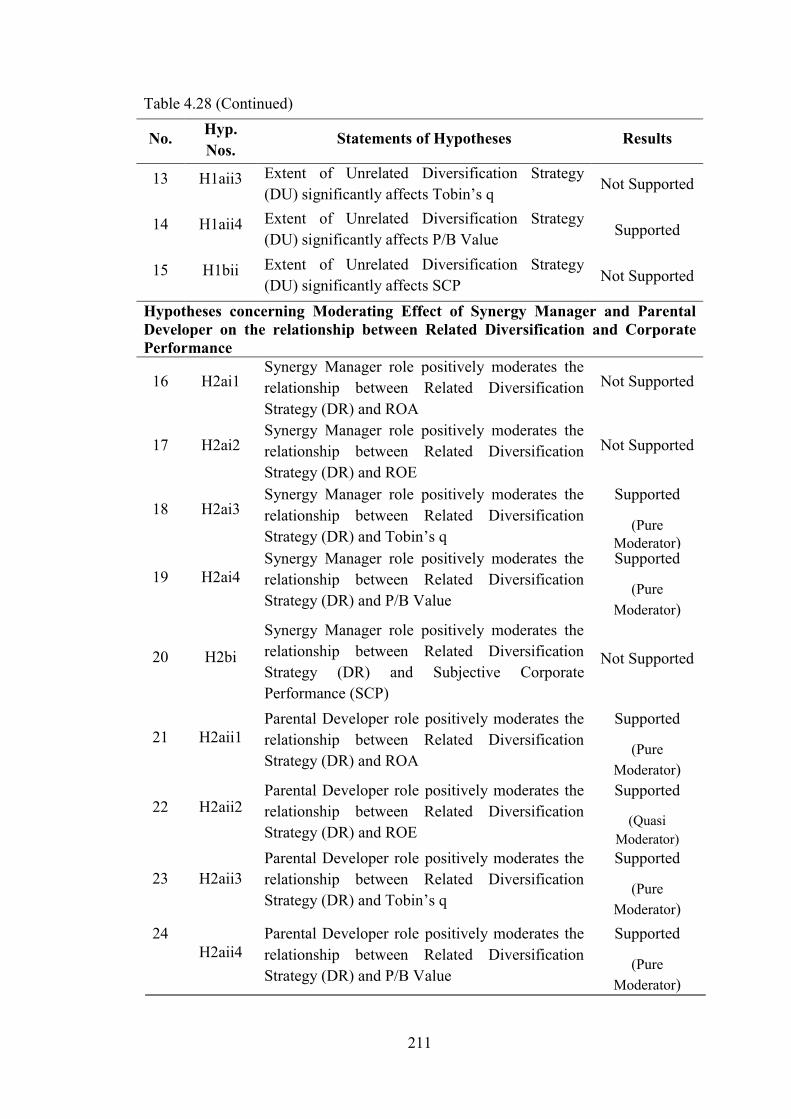
211
Table 4.28 (Continued)
No. Hyp.
Nos. Statements of Hypotheses Results
13 H1aii3 Extent of Unrelated Diversification Strategy
(DU) significantly affects Tobin’s q Not Supported
14 H1aii4 Extent of Unrelated Diversification Strategy
(DU) significantly affects P/B Value Supported
15 H1bii Extent of Unrelated Diversification Strategy
(DU) significantly affects SCP Not Supported
Hypotheses concerning Moderating Effect of Synergy Manager and Parental Developer on the relationship between Related Diversification and Corporate Performance
16 H2ai1 Synergy Manager role positively moderates the
relationship between Related Diversification
Strategy (DR) and ROA
Not Supported
17 H2ai2 Synergy Manager role positively moderates the
relationship between Related Diversification
Strategy (DR) and ROE
Not Supported
18 H2ai3 Synergy Manager role positively moderates the
relationship between Related Diversification
Strategy (DR) and Tobin’s q
Supported
(Pure Moderator)
19 H2ai4 Synergy Manager role positively moderates the
relationship between Related Diversification
Strategy (DR) and P/B Value
Supported
(Pure
Moderator)
20 H2bi
Synergy Manager role positively moderates the
relationship between Related Diversification
Strategy (DR) and Subjective Corporate
Performance (SCP)
Not Supported
21 H2aii1 Parental Developer role positively moderates the
relationship between Related Diversification
Strategy (DR) and ROA
Supported
(Pure
Moderator)
22 H2aii2 Parental Developer role positively moderates the
relationship between Related Diversification
Strategy (DR) and ROE
Supported
(Quasi
Moderator)
23 H2aii3
Parental Developer role positively moderates the
relationship between Related Diversification
Strategy (DR) and Tobin’s q
Supported
(Pure
Moderator)
24 H2aii4
Parental Developer role positively moderates the
relationship between Related Diversification
Strategy (DR) and P/B Value
Supported
(Pure
Moderator)
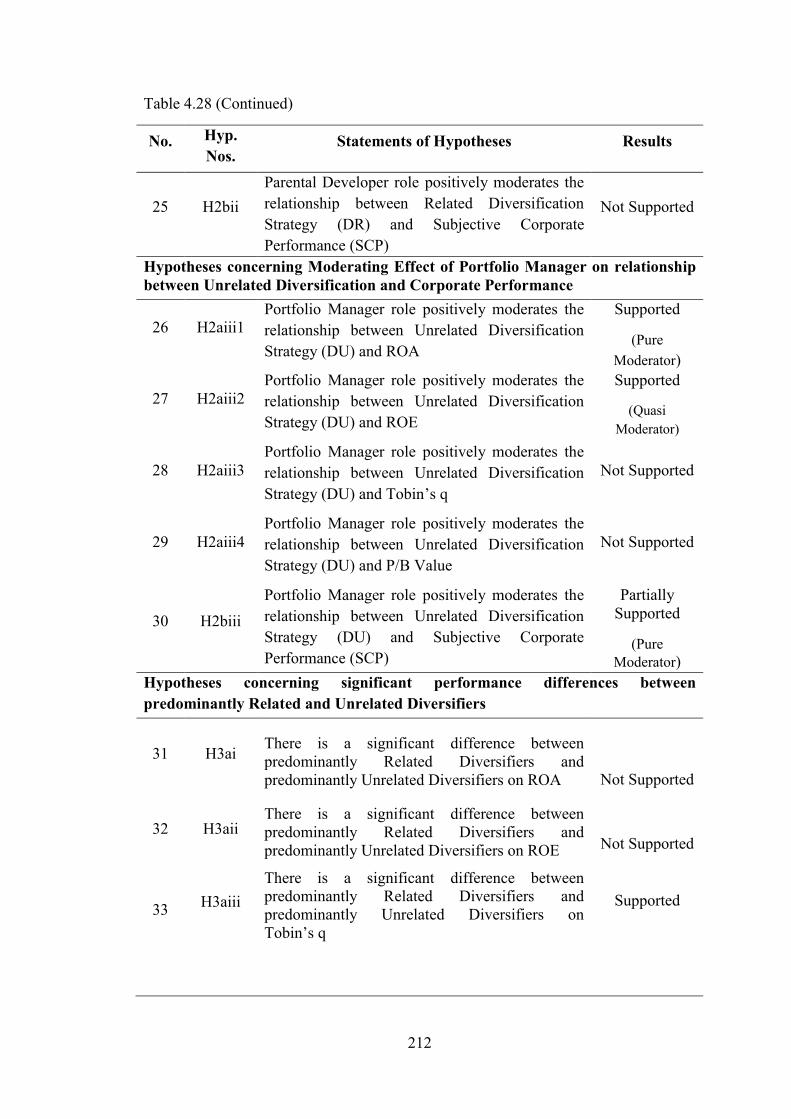
212
Table 4.28 (Continued)
No. Hyp.
Nos. Statements of Hypotheses Results
25 H2bii
Parental Developer role positively moderates the
relationship between Related Diversification
Strategy (DR) and Subjective Corporate
Performance (SCP)
Not Supported
Hypotheses concerning Moderating Effect of Portfolio Manager on relationship between Unrelated Diversification and Corporate Performance
26 H2aiii1 Portfolio Manager role positively moderates the
relationship between Unrelated Diversification
Strategy (DU) and ROA
Supported
(Pure
Moderator)
27 H2aiii2 Portfolio Manager role positively moderates the
relationship between Unrelated Diversification
Strategy (DU) and ROE
Supported
(Quasi
Moderator)
28 H2aiii3
Portfolio Manager role positively moderates the
relationship between Unrelated Diversification
Strategy (DU) and Tobin’s q
Not Supported
29 H2aiii4 Portfolio Manager role positively moderates the
relationship between Unrelated Diversification
Strategy (DU) and P/B Value
Not Supported
30 H2biii
Portfolio Manager role positively moderates the
relationship between Unrelated Diversification
Strategy (DU) and Subjective Corporate
Performance (SCP)
Partially Supported
(Pure Moderator)
Hypotheses concerning significant performance differences between
predominantly Related and Unrelated Diversifiers
31 H3ai There is a significant difference between predominantly Related Diversifiers and predominantly Unrelated Diversifiers on ROA Not Supported
32 H3aii There is a significant difference between predominantly Related Diversifiers and predominantly Unrelated Diversifiers on ROE
Not Supported
33 H3aiii
There is a significant difference between predominantly Related Diversifiers and predominantly Unrelated Diversifiers on Tobin’s q
Supported
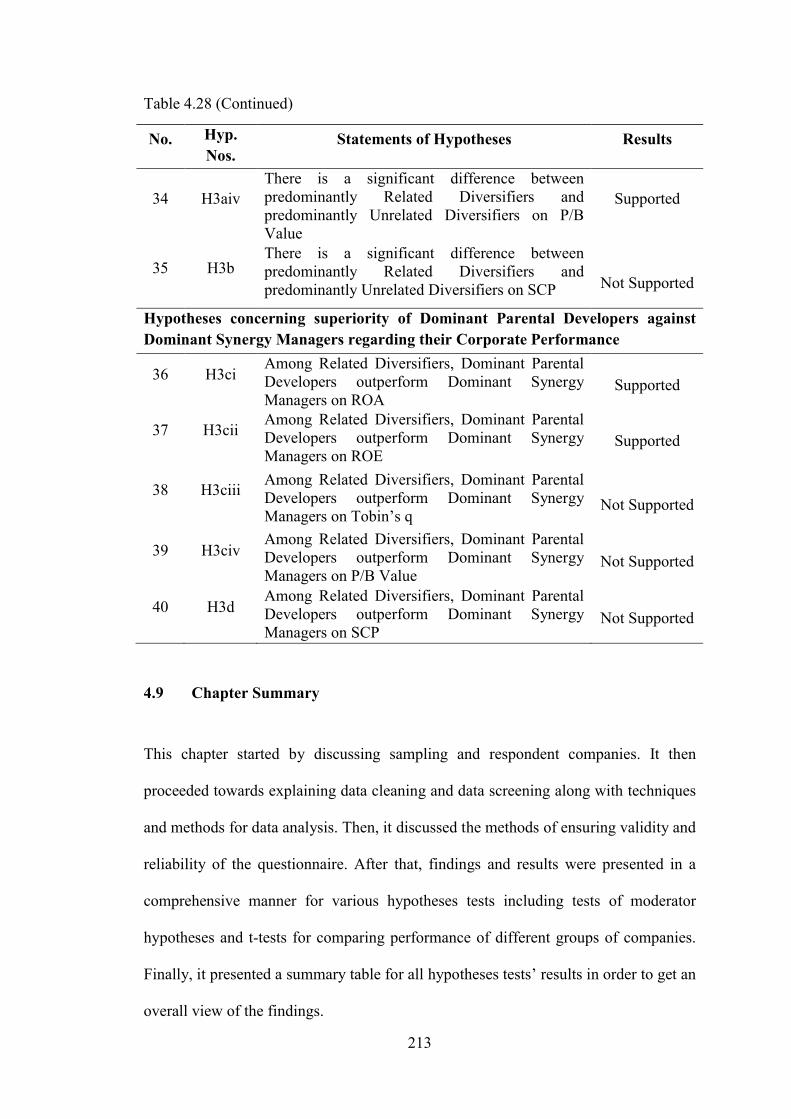
213
Table 4.28 (Continued)
No. Hyp.
Nos. Statements of Hypotheses Results
34 H3aiv
There is a significant difference between predominantly Related Diversifiers and predominantly Unrelated Diversifiers on P/B Value
Supported
35 H3b There is a significant difference between predominantly Related Diversifiers and predominantly Unrelated Diversifiers on SCP
Not Supported
Hypotheses concerning superiority of Dominant Parental Developers against
Dominant Synergy Managers regarding their Corporate Performance
36 H3ci Among Related Diversifiers, Dominant Parental Developers outperform Dominant Synergy Managers on ROA
Supported
37 H3cii Among Related Diversifiers, Dominant Parental Developers outperform Dominant Synergy Managers on ROE
Supported
38 H3ciii Among Related Diversifiers, Dominant Parental Developers outperform Dominant Synergy Managers on Tobin’s q
Not Supported
39 H3civ Among Related Diversifiers, Dominant Parental Developers outperform Dominant Synergy Managers on P/B Value
Not Supported
40 H3d Among Related Diversifiers, Dominant Parental Developers outperform Dominant Synergy Managers on SCP
Not Supported
4.9 Chapter Summary
This chapter started by discussing sampling and respondent companies. It then
proceeded towards explaining data cleaning and data screening along with techniques
and methods for data analysis. Then, it discussed the methods of ensuring validity and
reliability of the questionnaire. After that, findings and results were presented in a
comprehensive manner for various hypotheses tests including tests of moderator
hypotheses and t-tests for comparing performance of different groups of companies.
Finally, it presented a summary table for all hypotheses tests’ results in order to get an
overall view of the findings.
214
CHAPTER FIVE
DISCUSSIONS, IMPLICATIONS AND RECOMMENDATIONS
5.1 Introduction
This chapter makes discussions on the findings and results obtained in the previous
Chapter. Section 5.3 makes comprehensive discussions on the findings of various
hypotheses including justifications from past studies and relevant theories. This is
followed by Section 5.6 which presents theoretical and practical implications of the
study. Then, the chapter proceeds towards discussing limitations of the study in
another section and finally in Section 5.8, recommendations are presented for the
future research.
5.2 Overview of Study
This study aimed to examine the effect of diversification strategy and its types; related
and unrelated diversification strategies on corporate performance. Specifically, the
objective of the study was to make a genuine contribution to the relevant theories and
concerned literature by studying the moderating effect of corporate parenting roles
(Synergy Manager, Parental Developer and Portfolio Manager) on the relationship
between diversification strategies and various dimensions of corporate performance.
Corporate performance was divided into five dimensions, with four dimensions –
ROA, ROE, Tobin’s q and P/B Value – making up objective aspect of performance
and the fifth one was SCP (Subjective Corporate Performance). Synergy Manager and
Parental Developer were tested and proved to be moderators between Related
215
Diversification Strategy and certain performance dimensions. Whereas, Portfolio
Manager was tested and proved as a moderator between Unrelated Diversification
Strategy and certain performance dimensions.
This study was conducted on PLCs listed on the Main Market of Bursa Malaysia and
top/corporate level managers concerned with strategic and corporate planning were
the respondents. Mail questionnaires were sent to 563 respondents initially as well as
the questionnaires were sent through emails several times as a follow up. 136
respondents replied the questionnaires making a response rate of 24.15%. Before
sending, the questionnaire was tested for reliability and validity in a pilot study. But it
was tested again from all aspects after final data collection.
Final analyses revealed that the questionnaire was reliable and valid. Secondary data
was obtained from company annual reports and Datastream. After collection of data,
SPSS was used for analysing the data for different hypotheses. This chapter makes
discussions on the results obtained in Chapter 4, besides pointing towards theoretical
and practical implications of the study, limitations and future research
recommendations.
5.3 Discussions on the Findings of Hypotheses Tests
As stated before, this chapter is mainly devoted to discussions on the results of
hypotheses tests and on certain other important statistics. It has been mentioned
earlier that the analyses was conducted using certain descriptive statistics, correlation
analysis, scatter plots and graphs, simple linear regression and mainly relying on
216
moderated regression analysis (MRA) which is based on hierarchical regression
analysis so as to test the moderating effect of three Corporate Parenting Roles on the
relationship between Diversification Strategies and dimensions of Performance.
The discussion is made on each hypothesis by relating it to the findings of the
previous studies in the field, to underpinning theories of the concerned variables, and
through adding justifications and reasons for each of the findings. Theoretical and
managerial implications are also identified along the way wherever possible.
However, a separate discussion about theoretical and managerial implications is
available in Section 5.6 of this chapter.
5.3.1 Discussions on Hypothesis Findings: Test of Effect of Product Diversification Strategy on Corporate Performance (H1a1 to H1a4, and H1b)
A simple linear regression model was run to test any significant effect of extent of
Product Diversification Strategy (that is, Total Diversification DT) on five dimensions
of Corporate Performance (ROA, ROE, Tobin’s q, P/B Value, and SCP) one by one.
Results of all the hypotheses tests revealed that there was no significant effect of DT
on any of those five dimensions. These results are consistent with Marinelli (2011),
Montgomery (1985), Chang and Thomas (1989), Lloyd and Jahera Jr. (1994), and
Çolak (2010) who also revealed insignificant diversification effects on corporate
performance.
Research by Marinelli (2011) that was spread across 8 years of study was more recent
in this regard and it also relied on market as well as accounting measure of
performance, and revealed that diversification was not a cause of performance, rather
217
diversification – performance relationship was attributable to certain other factors.
Particularly, as financial ratios are most commonly used criterion variables in
product-diversification performance research, therefore, there is substantial support
for insignificant impact of diversification on accounting measures (Chang & Thomas,
1989; Montgomery, 1985) as well as market measures of performance (Çolak, 2010;
Lloyd & Jahera Jr., 1994).
Çolak (2010) suggested that effect of varying levels of diversification on performance
was not a significant systematic phenomenon and that there could be certain other
crucial reasons along with diversification, such as poor performance, deficiency of
innovation, and external economic conditions, which could explain company
performance. Similarly certain other authors also supported the idea that
diversification alone could not significantly depict performance unless it was coupled
with certain other factors of supreme importance like corporate parenting (Nippa et
al., 2011), managerial styles, management systems, organisational structures
(Christensen & Montgomery, 1981), and internal organisational arrangements (Hill et
al., 1992).
One of the other reasons for insignificant effect of diversification on performance
could also be attributed to the fact that in examining product diversification overall,
the total entropy score of product diversification (DT) was used. Whereas, this DT
score is a combination of DR score and DU score which are the scores for Related
Diversification Strategy and Unrelated Diversification Strategy respectively. So, a
significant effect of DT on Corporate Performance dimensions could not be found as
DT was sum of DR and DU scores. Afterwards, when the total DT score was further
218
divided into DR and DU scores for each company, then the subsequent hypotheses
involving DR and DU scores gained significant support for certain performance
dimensions.
This is in agreement with Park (2010) because the effect of product diversification
strategy on corporate performance could not be correctly observed unless
performance is examined against related diversification and unrelated diversification
strategies separately. Hence, on the basis of these arguments and findings from
previous studies, the insignificant effect of product diversification strategy on various
dimensions of corporate performance could be justified.
There are significant implications of this finding, that the managers in general and
Malaysian managers in particular must be cautious about the effects of diversification
strategy. Effect of diversification strategy must not be confounded with the relative
effect of related and unrelated diversification strategies as the two types might have
different effects on performance. This is also proved through the findings of
subsequent hypotheses in this study and discussion is made in the later sections.
Further, the managers must also bear in mind that related or unrelated diversification
strategies might also not affect performance in the desired way, unless they are
coupled with suitable corporate parenting roles.
5.3.2 Discussions on Hypothesis Findings: Test of Effect of Related Diversification Strategy on Corporate Performance (H1ai1 to H1ai4, and H1bi)
Various regression models were run to examine the effect of Related Diversification
Strategy on the five dimensions of Corporate Performance. To do that, in hierarchical
219
regression analysis comprising of 3 models, DRCentred variable was included as
predictor in all three models. This revealed a significant positive effect of DRCentred
variable on market measures of corporate performance (Tobin’s q, P/B Value). Hence,
this resulted in a conclusion that as the extent of Related Diversification Strategy
increases, it leads to increase in Tobin’s q as well as P/B Value.
These findings have a substantial support from the previous research literature. A
number of past scholars came up with similar conclusions that related diversification
strategy led to increase in market based company performance (Elsas et al., 2010,
Galván et al., 2007; Miller, 2006; Mishra & Akbar, 2007a; Palich et al., 2000). Study
of Elsas et al. (2010) was more recent in this regard which relied on Market/Book
Value as dependent variable and came with similar conclusion. Study of Mishra and
Akbar (2007a) also provides support for this finding as it relied on Tobin’s q as well
for dependent variable. Moreover, the findings also get support from study by Miller
(2006) which also used market based measure – log of Market Value, and from study
of Galván et al. (2007) that also relied on market based measure of performance (firm
value, excess value).
Most importantly, the findings gain support from a rich study conducted by Palich et
al. (2000) which was spread across three decades of research on the subject and
utilised meta-analytic data from fifty five past studies. Their study concluded that
related diversification added positively to firm performance as compared to either
limited or unrelated diversification.
220
The findings of these hypotheses also gain support from underpinning theories of
diversification discussed in Chapter 2. The findings confirm RBV arguments that
related diversification could lead to increased company performance perhaps due to
the benefits available in form of synergy creation through sharing of related resources
between businesses (Gupta et al., 2007; Morden, 2007). Such types of benefits are
usually not available to single business organisations or to conglomerates (Galván et
al., 2007; Rumelt, 1974, 1982).
So, related diversification adds positively to company performance as there could be
opportunities to create operational synergies and economies of scale benefits (Gupta
et al., 2007; Haberberg & Rieple, 2001; Hitt et al., 2011; Hoskisson et al., 2009),
while at the same time gaining increased market power and internal governance
benefits (Martin & Eisenhardt, 2001; Montgomery, 1994; Yaghoubi et al., 2011).
The findings also gain support from market power view as the view argues that
related diversification strategy can provide multiple performance advantages as
related diversifiers gain increased market power through backward and forward
integration (David, 2011; Hitt et al., 2011). Whereas, such benefits may not be
available to single business companies and unrelated diversifiers. The findings also
support internal market advantages as it argues that related diversification strategy
results in better corporate performance as it is easier to shift common inputs and
resources such as material, information and personnel across a portfolio of related
businesses as against unrelated ones (Hall, 1995; Martin & Eisenhardt, 2001; Teece,
1982).
221
Additionally, the findings support the phenomenal interaction between TCE
(Transaction Cost Economics) and RBV as TCE argues that benefits of diversification
are exploitable in emerging economies like Malaysia (Claessens et al., 1998; Fan et
al., 2008), in particular to group affiliated organisations in such economies (Carney et
al., 2011; Zhao, 2010) coupled with the RBV arguments supporting related
diversification strategy for providing economies of scale, governance and other
synergy benefits (Hitt et al., 2011; Yaghoubi et al., 2011).
However, significant effect of related diversification strategy on accounting measures
of performance could not be established. This is consistent with findings of Marinelli
(2011) and also gains partial support from study of Chang and Thomas (1989) and
Montgomery (1985) as the latter two studies found insignificant diversification effects
on performance.
On the basis of the arguments and justifications provided above, it can be concluded
that related diversification strategy positively affects market measures of corporate
performance. The findings provide guideline to the managers in selection of their
diversification strategy and recommend company expansion into related industries
and sectors due to increased advantages provided by related diversification strategy.
5.3.3 Discussions on Hypothesis Findings: Test of Effect of Unrelated Diversification Strategy on Corporate Performance (H1aii1 to H1aii4, and H1bii)
In order to examine the effect of Unrelated Diversification Strategy on the five
dimensions of Corporate Performance, various regression models were run. In
hierarchical regression analysis (with 3 models), DUCentred variable was included as
222
predictor. This revealed a significant negative effect of DUCentred variable on ROA
and P/B Value, where ROA is accounting and P/B Value is market measure of
corporate performance. This resulted in conclusion that unrelated diversification
strategy negatively affected accounting as well as market performance and as the
extent of unrelated diversification strategy increases, it leads to decrease in ROA as
well as P/B Value.
There exists considerable support from the previous research literature for these
findings. A number of past scholars came up with similar conclusions that unrelated
diversification strategy led to decreased company performance (Hoechle et al., 2012;
Palich et al., 2000; Ravichandran et al., 2009). Hoechle et al. (2012) conducted a
recent study on this topic with nearly 4000 companies and reported that
diversification discount (in terms of reduced market value) was significant among
unrelated companies and remained significant even after controlling for certain
governance factors. The findings of this thesis are also consistent with the findings of
Schmid and Walter (2008) and Villalonga (2004) who reported negative effects of
conglomerate diversification on firm’s market performance.
Also, in parallel to the findings of this research, study of Hill and Hansen (1991) also
reported negative effect of unrelated diversification on a similar ratio, market/book
value. The results hereby also confirm the findings of Ravichandran et al. (2009) who
found a significant negative correlation between unrelated diversification and
accounting as well as market measures of performance. The findings are also in line
with study of Berger and Ofek (1995) who found negative effect of unrelated
223
diversification on return on assets and excess value, concluding that it negatively
affected accounting as well as market performance of companies.
Additionally, the findings also correlate with those of Mishra and Akbar (2007a) who
revealed that unrelated diversification was not a powerful strategy among Indian
companies to significantly affect corporate performance. Lastly, the findings of this
study gain powerful support from the study of Palich et al. (2000) which among all
was a dominant study concerning the effects of various diversification strategies on
performance. It concluded that unlike related diversification strategy, focused strategy
(single business) and unrelated diversification strategy had unfavourable effects on
corporate performance.
Unrelated diversification strategy has been majorly considered as less useful and
inferior to related diversification strategy (Palich et al., 2000; Rumelt, 1974). There is
an extensive literature on the negative impacts of unrelated diversification for
financial as well as non-financial companies (Berger & Ofek, 1995; Schmid &
Walter, 2008; Villalonga, 2004). It is discussed before in context of RBV that related
diversifiers gain benefits from synergy advantages not commonly available to
unrelated ones (Abdullah, 2009; Grant et al., 2011) and that could be primary reason
behind this phenomenon.
Unrelated diversification might not be able to positively affect performance because
of the absence of any economies of scope and at the same time, existence of greater
administrative burden due to dissimilar businesses (Asrarhaghighi et al., 2013;
Tallman & Li, 1996; Yaghoubi et al., 2011). Hence, the findings support the
224
proposition that due to absence of operating synergies or economies of scope benefits
in unrelated diversification strategy, it may cause a reduction in corporate
performance (De, 1992; Tallman & Li, 1996).
These findings, while revealing the negative effect of unrelated diversification on
corporate performance also point towards the validity of agency theory (Hitt et al.,
2011; Hoechle et al., 2012), whose arguments elaborate that at times, managers might
not be making diversification decisions in company’s interest, rather it could be a
motivation to pursue their personal interests only (Amihud & Lev, 1981; Lane et al.,
1998). Although unrelated diversifiers could also gain from internal capital market
advantages by transferring cash and certain common usable resources across diverse
range of businesses, but at times, governance and transaction costs could be greater in
them due to problems in knowledge sharing, gaining cooperation among businesses
and implementing control mechanisms (Abdullah, 2009; Busija, et al., 1997). Hence,
if agency problems are dominant, they might overshadow those internal market
advantages resulting in a net loss for unrelated diversification.
The negative effects of unrelated diversification might be because the managers could
not be able to effectively control diverse businesses due to their limited expertise and
knowledge about them or because unrelated businesses might have different business
cultures and conflicting operational styles (Galván et al., 2007). As managers’
knowledge and corporate management style could really matter in managing unrelated
business portfolio (Johnson et al., 2008), therefore, this study examined the effect of
Portfolio Manager between Unrelated Diversification Strategy and Performance and
concludes that the negative effect of this strategy on at least objective financial
225
performance (ROA, P/B Value) is countered when corporate parents act as Portfolio
Managers. This is discussed in greater detail in a later section.
On the basis of above discussion, it can be concluded that unrelated diversification
strategy is not a useful strategy for companies and particularly, it has a significant
negative effect on ROA and P/B Value. Additionally, the strategy carries no
significant effects on ROE, Tobin’s q and overall subjective corporate performance
partly confirming the findings of Lloyd and Jahera Jr. (1994). Just like the findings of
previous hypotheses, these findings also advise managers to be careful in selection of
their type of diversification strategy and recommend company expansion into related
industries and sectors instead of unrelated ones.
Moreover, it is discussed through Section 5.3.6 that if a company chooses to be on
unrelated diversification route, it must have corporate leadership playing the role of
Portfolio Manager, as this role coupled with unrelated diversification would help
companies better manage corporate performance in terms of ROA and P/B Value.
The next sections will discuss the results obtained through testing moderator
hypotheses and will provide justifications and arguments in support of those findings.
Discussions and justifications are initially provided for the role of Synergy Manager
followed by Parental Developer and Portfolio Manager. Practical implications of the
findings are also presented along with this information.
226
5.3.4 Discussions on Hypothesis Findings: Test of Synergy Manager as Moderator between Related Diversification Strategy and Corporate Performance (H2ai1 to H2ai4, and H2bi)
A series of hierarchical regression models were run to test the moderating influence of
Synergy Manager on the relationship between Related Diversification Strategy and
various aspects of Corporate Performance. Hierarchical regression analysis including
3 models (as discussed in Chapter 4) was run for every aspect of Corporate
Performance individually. As there were five dimensions of Corporate Performance,
therefore, five hierarchical regression models (each including 3 models) were run.
This included testing hypotheses H2ai1 to H2ai4, and H2bi. Of these five hypotheses,
two gained significant support (H2ai3 and H2ai4) which conclude that Synergy
Manager positively moderates the relationship between Related Diversification
Strategy and Tobin’s q as well as P/B Value (market measures of performance). As
the framework of this study is unique, therefore exact justification of these findings
could not be found anywhere. However, there is a substantial support of these
findings from various perspectives and suggestions made by various scholars
pertinent to the field.
It has been discussed in the previous sections that companies pursue related
diversification strategy with the objective of improving performance through
realization of synergies such as economies of scope and mutual sharing of related
resources across related businesses (Hitt et al., 2011; Hoskisson et al., 2009). The
findings of this research strongly affirm the proposition that related diversification
strategy boosts up corporate performance when it is coupled with sincere efforts from
the top management for realization of synergies through mutual cooperation among
227
related businesses (Gottschalg & Meier, 2005; Oijen & Douma, 2000). Synergy
creation in related businesses can also be achieved through increased market power
and internal governance benefits (Abdullah, 2009; Dess et al., 2011; Haberberg &
Rieple, 2001).
The findings are in line with arguments of internal market advantages as they suggest
that related diversification strategy results in enhanced corporate performance if it is
combined with the top management efforts to create an efficient and effective internal
market which could facilitate shifting and sharing of common resources such as
inputs, material, logistics, information and personnel across a group of related
businesses (Hall, 1995; Martin & Eisenhardt, 2001; Teece, 1982).
Moreover, the findings support the connection between corporate parent value
addition and dynamic capabilities perspective (Bowman & Ambrosini, 2003; Sohl,
2011) as Hitt and Ireland (1986), and Sohl (2011) suggest that success of a diversified
organisation depends on existence of corporate level competences and capabilities.
The success of a related or unrelated organisation is contingent upon a parenting
strategy to add value to businesses (Bowman & Ambrosini, 2003; Kruehler et al.,
2012). The findings also support the argument that there must be a match between
degree of product diversification strategy and corporate parents’ capabilities to add
value (Johnson et al., 2005, 2008; Oijen & Douma, 2000; Porter, 1987).
The characteristics of Synergy Manager Role as described by Johnson et al. (2005)
are already presented in Chapter 2 in Table 2.3. A brief conceptualization of those
characteristics could be derived as; corporate management style where main objective
228
of corporate managers is the achievement of synergistic benefits by identifying basis
and implementing programmes for sharing and transfer of skills, resources and
competences across businesses. Therefore, Synergy Managers aim to keep
collaborative SBUs, the corporate staff works as ‘Integrators’ and corporate managers
overcome SBUs resistances in mutual collaboration (Johnson et al., 2005, 2008).
It looks from this conceptualization that purpose of Synergy Managers is achievement
of operational synergies through mutual sharing and cooperation. Now, unlike
unrelated diversification, where purpose of corporate managers could be achievement
of financial synergies (Gottschalg & Meier, 2005; Hoskisson et al., 2009), in related
diversification the purpose is to create operational synergies through economies of
scope which require certain degree of relatedness and cooperation among the
businesses (Gottschalg & Meier, 2005; Oijen & Douma, 2000). This infers that
performance of related diversifiers would depend very much upon the level of
synergy creation effort put by the corporate managers.
Due to this primary reason, Synergy Manager was proposed to positively moderate
relationship between Related Diversification Strategy and Corporate Performance,
which is supported by the findings of this study. Hence, the findings gain support
from the propositions of Porter (1987) and Johnson et al. (2005, 2008) that related
diversification strategy could add to corporate performance if it is supported by
synergy creation efforts or synergy manager role by the corporate managers.
As discussed earlier, the correlation analyses were also conducted to test for
pure/quasi moderator effects (Sarina, 2010; Sharma et al., 1981; Zahra, 1996). These
229
tests revealed that Synergy Manager played as pure moderator between Related
Diversification Strategy and Tobin’s q as well as for P/B Value. Additionally, graphs
revealed positive nature of this role as a moderator. This evidence is strong support
for pure moderating effect of Synergy Manager as it concludes that Synergy Manager
has no direct effect on Tobin’s’ q and P/B Value, but the interaction between Synergy
Manager and Related Diversification Strategy has strong effect on both dimensions of
performance. The evidences conclude that increasing level of related diversification
leads to increased market performance if combined with increasing levels of synergy
manager role. This supports the arguments from various scholars discussed above.
Furthermore, the justifications of this set of hypotheses gain more weight as the
supported hypotheses contain market measures of performance as dependent
variables, and the significant moderator effect of Synergy Manager is proved to be on
market measures of performance. Now, at times, market measures of performance
could provide a better reflection of corporate performance as compared to accounting
ratios (Chakravarthi, 1986; Santos & Brito, 2012).
The validity of the findings increase due to the fact that in particular, Tobin’s q has
been considered as most widely accepted and frequently used measure of corporate
performance (Kahloul & Hallara, 2010; Ravichandran et al., 2009). Certain studies, in
fact, relied exclusively on Tobin’s q as measure of corporate performance (Chari et
al., 2008; Gomes & Livdan, 2004; Guo & Cao, 2011; Lang & Stulz, 1994). Similarly,
P/B Value is another powerful market measure of performance which is based on
continuous market data released on daily basis (Berk et al., 2009; Hoechle et al.,
2012).
230
In conclusion, the findings support theories like RBV, internal capital market, and
particularly dynamic capabilities perspective in that the match of corporate level
capabilities (including capabilities to create cross business synergies) and the degree
of product diversification is essential to add positively to corporate performance
(Johnson et al., 2005, 2008; Oijen & Douma, 2000; Porter, 1987).
Additionally, the findings also support contingency theory (Dobák & Antal, 2010;
Matyusz, 2012) and suggest that different management styles are appropriate for
different types of diversification strategies. Particularly, the results conclude that
Corporate Parenting Role is a contingency factor and for Related Diversification
Strategy, Synergy Manager Role is suitable.
Hence, the findings add to the literature on product diversification, corporate
parenting, and corporate performance, as well as to underlying theories. They provide
guidelines to the managers in selection of appropriate corporate parenting role given
the type of diversification strategy. Specifically, the findings suggest that while
pursuing related diversification strategy, corporate managers must adopt the role of
synergy managers in their companies. More is discussed about this role in comparison
to parental developer role in the subsequent sections.
5.3.5 Discussions on Hypothesis Findings: Test of Parental Developer as Moderator between Related Diversification Strategy and Corporate Performance (H2aii1 to H2aii4, and H2bii)
For this set of hypotheses, a similar procedure as before, was adopted to test the
moderating effect of Parental Developer on the relationship between Related
Diversification Strategy and Corporate Performance dimensions. Five hypotheses:
231
H2aii1 to H2aii4, and H2bii were tested for five performance dimensions. Of these
five hypotheses, four gained significant support (H2aii1, H2aii2, H2aii3, and H2aii4).
This concluded that Parental Developer positively moderated the relationship between
Related Diversification Strategy and all dimensions of Financial Corporate
Performance (i.e. ROA, ROE, Tobin’s q, and P/B Value respectively). Again, due to
uniqueness of study’s framework, similar finding is not available from any past
studies. However, there is a whole lot of support from various perspectives and
suggestions made by different scholars pertinent to the field.
The findings of these hypotheses have substantial support from different perspectives.
Particularly, the findings are in line with and acquire full support from well-known
authors of the field; Goold et al. (1994b) and Johnson et al. (2005, 2008) who
suggested that corporate managers playing parental developer role or a similar role are
suitable for related diversification strategy. Logically, in related diversification,
competences across business units could be highly linked because businesses could
have similar value chains, and they also usually face similar resource requirements in
terms of inputs, machinery, information and human resources (Harrison & John,
2010; Lahovnik, 2011; Thompson et al., 2012).
On the other hand, as an effective parental developer, corporate managers understand
the critical success factors of businesses well, and the businesses also provide them
opportunities for value addition (Campbell, 2007; Goold et al., 1994a; Johnson et al.,
2005, 2008). They need to continuously possess that knowledge, skills, resources and
competences with which they could add value to related businesses (Alexander et al.,
1994; Campbell, 2007). Naturally, this seems to be more possible when the portfolio
232
of businesses is operating in related markets or sectors and the businesses also share
common internal characteristics. Therefore, a role like parental developer was
suggested to be a moderator for related diversification strategy by past scholars
(Goold et al., 1994b; Johnson et al., 2005, 2008) and the findings of this study have
proved the proposition.
The findings also support the general proposition that the match between corporate
managers’ skills, resources, competences and nature or direction of product
diversification strategy is extremely important for the purpose of improving corporate
performance (Alexander et al., 1994; Campbell, 2007; Kruehler et al., 2012). If their
skills and knowledge do not match the type of diversification, then the diversification
programme might fail (Goold et al., 1998; Kruehler et al., 2012).
In fact, certain scholars have explicitly argued that success of a diversified
organisation depends upon availability and match of corporate level competences and
capabilities with the needs of businesses (Hitt & Ireland, 1986; Sohl, 2011). Others
argue that there should be a match between extent of product diversification strategy
and corporate parents’ capabilities to add value (Johnson et al., 2005, 2008; Oijen &
Douma, 2000; Porter, 1987).
In this sense, the findings also support the connection between dynamic capabilities
perspective and corporate parent value addition. It is because DCP suggests that
managers need to develop business related expertise and continuously improve and
update them as the requirements of businesses change (Bowman & Ambrosini, 2003;
Sohl, 2011). Hence, the findings herewith attempt to extend and improve dynamic
233
capabilities perspective with reference to corporate strategy and corporate parent
value addition.
As it was discussed in Chapter 4, the analysis was also conducted to test whether each
moderator acted as a pure or a quasi moderator using correlation analysis and simple
linear regression models (Sarina, 2010; Sharma et al., 1981; Zahra, 1996). These tests
revealed that Parental Developer acted as pure moderator between Related
Diversification Strategy and three dimensions of Financial Corporate Performance i.e.
ROA, Tobin’s q, and P/B Value. Whereas, it acted as quasi moderator between
Related Diversification Strategy and ROE. Hence, overall, there is more support for
pure moderator effect of Parental Developer on the relationship.
Additionally, the positive nature of this role was also found using scatter plot graphs,
which was a powerful evidence for the positive nature of this moderator. Hence, the
findings would conclude that the interaction between Related Diversification Strategy
and Parental Developer would lead to increased performance with the condition that
the level of Parental Developer also goes on increasing with increasing level of
Related Diversification Strategy. This conclusion is in line with the arguments from
various researchers discussed above.
Summarising the discussion, it is said that the findings support dynamic capabilities
perspective concerning the match of corporate managers’ capabilities and roles to the
nature of product diversification strategy (Bowman & Ambrosini, 2003; Sohl, 2011;
Teece et al., 1997). They also support the proposition of Goold et al. (1994b) and
Johnson et al. (2005, 2008) regarding the suitability of parental developer role for
234
related diversifiers. At the same time, the findings support contingency theory (Dobák
& Antal, 2010; Matyusz, 2012) in suggesting that for different strategies, different
management styles are appropriate. Specifically, Corporate Parenting Role is a
contingency factor and for Related Diversification Strategy, Parental Developer Role
is suitable.
Hence, the findings make a contribution to the literature on product diversification
corporate parenting, and corporate performance, as well as to dynamic capabilities
theory and contingency theory and deliver guidelines to the managers for selection of
suitable corporate parenting role given the type of diversification strategy.
Particularly, the findings suggest that while following Related Diversification
Strategy, corporate managers must adopt the role of Parental Developers in their
companies. More is discussed about this role in comparison to Synergy Manager Role
in the subsequent sections.
5.3.6 Discussions on Hypothesis Findings: Test of Portfolio Manager as Moderator between Unrelated Diversification Strategy and Corporate Performance (H2aiii1 to H2aiii4, and H2biii)
This section will discuss the results of testing Portfolio Manager Role as moderator
between Unrelated Diversification Strategy and Corporate Performance for which five
hierarchical regression models were run for each of five dimensions of Corporate
Performance. Out of five, three hypotheses gained statistical support which were
H2aiii1, H2aiii2, and H2biii. This concluded that Portfolio Manager acted as
moderator between Unrelated Diversification Strategy and ROA, ROE, and
Subjective Corporate Performance (SCP). For relationship between Unrelated
Diversification and ROA, and ROE, it acted as positive moderator. The additional
235
analysis was also conducted in line with certain researchers (Sarina, 2010; Sharma et
al., 1981; Zahra, 1996) about pure or quasi moderating effect of this moderator. It
revealed that Portfolio Manager played as pure moderator between Unrelated
Diversification and ROA, and SCP, whereas, it played as a quasi moderator between
Unrelated Diversification and ROE.
The findings have substantial support from the suggestions and propositions made by
various past scholars in the field. Firstly, the findings seem absolutely logical if we
initially look at the characteristics of Unrelated Diversification Strategy and Portfolio
Manager Role separately and then relate them into one hypothesis. An unrelated or
conglomerate diversification takes an organisation away from its existing strategic
capability and results into new businesses and entirely different market segments
(Pearce II & Robinson Jr., 2011; Thompson et al., 2012). In unrelated diversification,
the portfolio of businesses might keep on changing as the purpose of this strategy is
not attainment of functional or operative synergies but financial synergies and
financial economies through restructuring (Bamford & West, 2010; Berger & Ofek,
1995).
On the other hand, let us look at the characteristics of Portfolio Manager as described
by Johnson et al. (2005, 2008) in Section 2.4.4 of this thesis. From there, it looks like
Portfolio Managers are quite different from other two roles in terms of their motive,
extent of involvement in business strategies of SBUs, and other organisational
requirements. Specifically, they prefer remote management and do not indulge into
the business strategies of SBUs for value creation, and provide adequate autonomy to
SBU managers (Johnson et al., 2005, 2008). They keep on searching actively for
236
undervalued assets or businesses and continuously involve in buying and selling for
gaining financial economies or benefits. Due to this theoretical relationship between
the two, Johnson et al. (2005, 2008) and Porter (1987) proposed that Portfolio
Manager Role was suitable for Unrelated Diversification Strategy. The findings
herewith support the proposition of these scholars.
In other words, the findings support the argument that Unrelated Diversification
Strategy could be successful with Portfolio Manager Role, as in this strategy there is
no serious intention from the top management to create operational synergies rather
the management is interested to seek undervalued businesses and assets for getting
financial rewards through their trade (Bamford & West, 2010). Hence, this role is
suitable for unrelated diversification strategy as it aims to attain financial synergies by
combining cash flows of different businesses in the corporation (Gottschalg & Meier,
2005; Hoskisson et al., 2009).
In parallel to the previous results, these findings also support the linkage between
corporate parent capabilities and the types of product diversification strategy
(Bowman & Ambrosini, 2003; Sohl, 2011). The evidence here supports the arguments
of Porter (1987) and Johnson et al. (2005, 2008) concerning the suitability of
Portfolio Manager Role for Unrelated or Conglomerate Diversification Strategy. The
findings also gain support from RBV and TCE collectively, which argue that it is
better to create internal efficiencies among unrelated businesses by manoeuvring cash
across them, instead of striving to get economies of scope among those unrelated
businesses (Ng, 2007; Tallman & Li, 1996).
237
Finally, the findings are supported by the contingency theory as well. Particularly, the
study suggests that for success of Unrelated Diversification Strategy, Portfolio
Manager Role is a contingency factor. Although this strategy effects performance
negatively, but the effect is countered by actively playing Portfolio Manager Role.
Typically, at higher levels of this role, the effect of Unrelated Diversification Strategy
on accounting ratios (ROA and ROE) becomes positive. Whereas, there is still certain
ambiguity about effect of Portfolio Manager Role on the relationship between
Unrelated Diversification Strategy and Subjective Corporate Performance. This
warrants caution in interpreting the relationship as well as relying only on subjective
measures of corporate performance.
Overall, the findings pay contribution to the literature on product diversification
strategy, corporate parenting, and corporate performance, as well as to underpinning
theories; DCP, RBV, TCE and Contingency Theory. Specifically, they suggest
strategic planners that in order to increase ROA and ROE, they should actively play
the role of Portfolio Manager while the extent of Unrelated Diversification Strategy is
increasing. The following section summarises the results of hypotheses tests
conducted for testing the moderating effect of three Corporate Parenting Roles on the
relationship between Diversification Strategies and Corporate Performance.
5.3.7 Conclusion on the Hypotheses Tests Results for Moderators
The overall results obtained through the hypotheses tests for moderators found a
significant effect of those moderators for certain corporate performance measures.
Synergy Manager was found positive moderator between Related Diversification
238
Strategy and market measures of performance. Whereas, Parental Developer was
found positive moderator between Related Diversification Strategy and Financial
Corporate Performance (i.e. accounting as well as market measures of performance).
Portfolio Manager was found moderator between Unrelated Diversification Strategy
and SCP, and positive moderator between Unrelated Diversification Strategy and
accounting measures.
Hence, out of 15 moderation hypotheses for different variables, 9 hypotheses gained
significant support for the moderator effects. Out of 9 hypotheses, 7 revealed pure
moderator effects, whereas 2 revealed quasi moderator effects. The type of moderator
effect revealed through making graphs using scatter plots was largely according to the
theoretical assumptions and expectations. The results of moderator hypotheses gain
significant support from the perspectives, suggestions and propositions made by past
scholars.
As discussed before in Chapter 2, these roles were categorized by Johnson et al.
(2005, 2008) which are well known authors in the field of strategic management.
Roles of Portfolio Manager and Synergy Manager were based on the work of Porter
(1987) and Parental Developer was based on the work of Goold et al. (1994b). Most
importantly, the combination of Corporate Parenting Roles and type of Diversification
Strategy as revealed by the analyses of this study is exactly according to the
arguments made by Porter (1987), Johnson et al. (2005, 2008) and Goold et al.
(1994b).
239
Overall, the findings agree with the contingency theory argument that the type of
corporate parenting role played by corporate managers must be based upon
company’s type of diversification strategy (Kruehler et al., 2012; Oijen & Douma,
2000). The findings have got the support from RBV, TCE and DCP as well.
The findings are consistent with RBV in suggesting that Related Diversification
Strategy leads to better performance if it is combined with sincere management efforts
for creating of synergies, economies of scope and other benefits (Hitt et al., 2011;
Hoskisson et al., 2009). Findings also gain support from TCE in concluding that
Related Diversifiers gain benefits through common resource sharing and Unrelated
Diversifiers get benefits by manoeuvring cash across unrelated businesses (Ng, 2007;
Tallman & Li, 1996).
In agreement with DCP, the findings support the view that performance of a
diversified company is primarily contingent upon certain corporate level distinctive
competences and capabilities (Hitt & Ireland, 1986; Sohl, 2011). In addition to that, it
is supported that related as well as unrelated diversification requires a good parenting
strategy and its corporate managers must actively acquire rare, valuable, robust and
non-substitutable resources and conduct those activities that could match the nature of
diversification and provide the businesses a strong and sustainable competitive
advantage (Bowman & Ambrosini, 2003; Kruehler et al., 2012).
This research built up and improved on the idea by Nippa et al. (2011) to use
parenting advantage as a moderating variable in product diversification – performance
research. The findings agree to the general arguments made by various scholars that a
240
complex relationship, such as product diversification – performance relationship,
needs to be examined though perspective of moderating effect of contingency
variables on it (Datta et al., 1991; Martínez-Campillo & Fernández-Gago, 2008;
Ravichandran et al., 2009). The type and nature of moderators for different types of
diversification strategies suggested by relevant theorists in the field are confirmed by
the findings of this research. This primarily satisfies the purpose of this study.
5.3.8 Discussions on Hypothesis Findings: t-test results for comparing Related Diversifiers against Unrelated Diversifiers on Corporate Performance Dimensions (H3ai to H3aiv, and H3b)
Independent samples t-tests were run to compare Related Diversifiers against
Unrelated Diversifiers on various performance dimensions. In this way, five two-
tailed hypotheses were tested. The tests resulted in the acceptance of two hypotheses
i.e. H3aiii and H3aiv. Statistically significant support for H3aiii and H3aiv resulted in
the conclusion that Related Diversifiers were significantly different than Unrelated
Diversifiers on Tobin’s q (sig. at 0.10 level) and P/B Value (sig. at 0.05 level)
respectively. It has been explained in section 4.8.6.1 that with one-tailed hypotheses
proposing superiority of Related Diversifiers against Unrelated Diversifiers, it would
establish that former ones performed better against later ones not only on market
measures but on ROA as well, because Related Diversifiers had higher means for
these ratios and their performance on these ratios was better than their counterparts.
There is a huge support from the literature that says that related diversification
overall, is more useful and adds more to corporate performance in contrast to
unrelated one (Christensen & Montgomery, 1981; Park, 2010; Rumelt, 1974, 1982).
Particularly, the findings of this set of hypotheses are consistent with the findings of
241
studies conducted by Galván et al. (2007), Mishra and Akbar (2007a), Varadarajan
and Ramanujam (1987), and Berger and Ofek (1995) which revealed that related
diversification performed better than unrelated diversification on market measures of
performance.
The justifications of these results are manifold. Firstly, as discussed earlier,
sometimes market based performance ratios might provide a better idea of corporate
performance as compared to accounting measures (Chakravarthi, 1986; Santos &
Brito, 2012). As mentioned before about Tobin’s q that it has been considered to be
most widely accepted and frequently used measure of corporate performance (Kahloul
& Hallara, 2010; Ravichandran et al., 2009) and therefore certain past studies have
exclusively relied on this ratio for measuring corporate performance (Chari et al.,
2008; Gomes & Livdan, 2004; Guo & Cao, 2011; Lang & Stulz, 1994). Therefore, the
performance differences among the two groups on Tobin’s q highlight the
significance of the findings.
Also, the significant performance differences among the two groups on P/B Value
also gain increased validity from that proposition that this ratio being a powerful
market measure of corporate performance not only represents value added by
management, but also provides feedback to company managers on the market
appraisal of their decisions (Berk et al., 2009). Hence, being market oriented, as
Tobin’s q and P/B Value ratios might truly capture company performance, therefore
the analysis indicates soundness of the findings.
242
In relation to the previous research, the findings are in line particularly with those of
Mishra and Akbar (2007a) who conducted their study in India, while relying on
Tobin’s q as dependent variable and concluded that related diversifiers performed
better than unrelated diversifiers. They added that in emerging economies the benefits
of related versus unrelated diversification were not uniformly available to all
diversified companies. The findings also get support from the basic underpinning
theories like resource based view (RBV), transaction cost economics (TCE) and
market power view. As argued before, related diversification strategy has been
considered superior to unrelated diversification strategy by certain scholars (Markides
& Williamson, 1994; Palich et al., 2000; Rumelt, 1974) as also suggested by these
underpinning theories.
In relation to TCE, as argued by certain scholars, knowledge sharing, control system
implementation and gaining cooperation among strategic business units could be more
difficult in conglomerates as compared to relatedly diversified businesses and
therefore conglomerates may not perform well as compared to related diversifiers
(Abdullah, 2009; Busija et al., 1997). Additionally, related diversifiers get more
advantages under TCE arguments as the substantial benefits might be available to
them through savings in production and transaction costs generated by forward and
backward integration (David, 2011; Fukui & Ushijima, 2006; Gupta et al., 2007).
The findings here also support RBV arguments that related diversification might
provide tremendous advantages to companies through synergies available in form of
economies of scope for producing related products, sharing common brand image,
and internal governance benefits in terms of sharing common resources like inputs
243
and personnel across businesses (Martin & Eisenhardt, 2001; Palich et al., 2000;
Yaghoubi et al., 2011) whereas, such type of benefits may not be available to
unrelated companies (Ravichandran et al., 2009).
The findings also highlight the proposition that related diversifiers could outperform
unrelated diversifiers as the former ones gain increased market power due to
multipoint competition and within organisation integration, hence putting increased
pressure over their competitors (Hitt et al., 2011; Johnson et al., 2008).
The results however, do not reveal significant differences among the two groups on
other measures of performance. These insignificant differences on other performance
measures could be attributed to measurement of diversification strategy. If more
categories of diversification as followed by Rumelt (1974) are employed, then
performance difference among those categories might prove significant (Christensen
& Montgomery, 1981; Tan et al., 2007).
The overall findings are supported by above arguments, theories, and literature, and
highlight important theoretical and practical implications. The findings serve as a
guideline for practicing managers that they must be cautious in their selection of
diversification type, as unrelated diversification might not perform better against
related diversification, particularly on the market measures of performance. The
conclusions made in section 4.8.6.3 have elaborated that among unrelatedly
diversified Malaysian PLCs, there has been clear misfit regarding the match of
appropriate corporate parenting role with this strategy. Specifically, these companies
have been dominantly playing either as Synergy Manager or Parental Developers.
244
Whereas, it is recommended that if companies choose to diversify in unrelated
industries, it must be coupled with Portfolio Manager Role.
5.3.9 Discussions on Hypothesis Findings: t-test results for comparing Dominant Parental Developers against Dominant Synergy Managers on Corporate Performance Dimensions (H3ci to H3civ, and H3d)
In order to compare corporate performance of Dominant Parental Developers against
Dominant Synergy Managers on five dimensions, independent samples t-tests were
conducted again. In this way, five hypotheses (H3ci to H3civ, and H3d) were tested.
The t-tests resulted in the acceptance of two hypotheses i.e. H3ci and H3cii which
concluded that Parental Developers outperformed Synergy Managers on ROA as well
as on ROE.
These results are supported by the theoretical literature in the field. The features of
Parental Developer Role make it unique from the other roles and characterise it as a
better corporate parenting role for the relatedly diversified companies as compared to
Synergy Manager Role (Johnson et al., 2008, 2011). Much like standalone influence
suggested by Goold et al. (1994a), this role is more demanding for corporate
managers, and requires them to develop sufficient understanding of critical success
factors of businesses, and build those corporate level skills and capabilities through
which direct value addition into businesses is possible (Goold et al., 1994a; Johnson
et al., 2008, 2011).
While on the other hand, Synergy Managers are particularly concerned with creation
of synergies through resource and competency sharing which could actually be just
one aspect of Parental Developers. Furthermore, synergy creation efforts or synergy
245
management programmes might fail due to several reasons (Goold & Campbell,
1998) or synergies might get imitated by competitors (Iversen, 2000). On the other
hand, Parental Developers might be successful with relatedly diversified businesses if
they qualify the criteria for being good Parental Developers (Campbell & Goold,
1988; Kruehler et al., 2012). Hence, it can be argued that in relatedly diversified
companies, those characterised by Parental Developers outperform others which are
characterised by Synergy Managers (Campbell, 2007; Goold et al., 1994a), hence
providing substantial support for the findings of this study’s hypotheses.
The findings provide support and extension to Dynamic Capabilities Perspective
(DCP). The definition of ‘capabilities’ (management’s ability in successfully aligning,
integrating and reconfiguring organisational resources, skills, internal and external
competences to cope up with swiftly changing external environments) and ‘dynamic’
(management’s capacity to renovate organisation’s competences to address changing
business environment which characterises high elements of uncertainty and
challenges) (Teece et al., 1997; Wang & Ahmed, 2007; Zaidi & Othman, 2011) in
fact point toward or seem to make greater association with Parental Developers as
compared to other roles.
Therefore, the findings go along with the propositions and findings of Bowman and
Ambrosini (2003), Kruehler et al. (2012), and Menz and Mattig (2008) and hereby
confirm that those organisations are more successful which are characterised by top
managers having dynamic capabilities in form of knowledge, skills and resources.
Having that, managers could understand and directly create value in strategic business
246
units and continuously improve them for successfully aligning them with the
environment.
The managerial and practical implications of these findings point towards the need for
managers to develop characteristics of Parental Developers through building
corporate level dynamic capabilities for adding value to their companies for strong
and sustainable competitive advantage.
5.4 Discussions on Effect of Control Variables
As demonstrated earlier, this study controlled for four variables which were
considered by past research as significant factors impacting corporate performance
other than the main variables. They were Age, Size, Leverage and Experience. In
hierarchical regression models, they appeared in 2nd and 3rd models. Among the four
variables, Size and Leverage were found to be significant predictors of Corporate
Performance dimensions in numerous models. However, Age and Experience were
found to be significant predictors of SCP only.
Firstly, Size remained significant predictor of all five dimensions of Corporate
Performance with positive effects on all dimensions. This is in agreement with Ishak
and Napier (2006), Daud et al. (2009), Chari et al. (2008), and Hall (1995) who also
revealed positive impact of size on accounting as well as market measures of
performance. This concludes that as Company Size (measured by log of total assets)
increases, it leads to significant increase in Corporate Performance probably due to
247
provision of increased market power and economies of scale benefits (Chari et al.,
2008; Galván et al., 2007).
Leverage also remained significant predictor of all dimensions of Corporate
Performance (except P/B Value) with its significant negative effects on ROA, ROE,
and SCP. However the impact of Leverage on Tobin’s q was positive. This points
towards the validity of Daud et al. (2009) argument that past research is divided on
the effect of leverage on corporate performance. Besides, they also found positive
impact of leverage on market performance measure (market adjusted return).
Negative impact of Leverage on ROA and ROE is consistent with Fukui and Ushijima
(2006), and Delios and Beamish (1999).
Company Age was not a significant predictor of Financial Corporate Performance, but
it was found as significant predictor of SCP with negative effects. Chakrabarti et al.
(2007) and Çolak (2010) also found negative effect of age on firm performance or
valuation. However, they measured performance through financial ratios. Results are
also consistent with Ishak and Napier (2006) who found that age did not affect market
measure of corporate performance. As anticipated before, Experience remained
significant predictor of SCP with positive coefficient. This concludes that as
Experience increases it leads to higher overall Corporate Performance measured
subjectively. These results are in line with those of Sohl (2011) and Chan (2010)
which indicated positive effect of managerial experience on organisational
performance.
248
5.5 Conclusions
In the previous sections of this chapter, discussions were made on the findings of
various hypotheses. Findings were discussed with respect to previous research
findings, perspectives and arguments made by past scholars. Overall, the findings
were in line with the previous research findings and gained support from the
arguments, propositions and perspectives built by past scholars. Findings about the
effects of product diversification (DT), related diversification (DR), and unrelated
diversification (DU) on performance were supported by the conclusions of the past
research.
The findings of the simple linear regression models for DT and Performance revealed
no significant effect of DT on Performance. These findings were consistent with
numerous research findings revealed in the past (Chang & Thomas, 1989; Çolak,
2010; Lloyd & Jahera Jr., 1994; Marinelli, 2011; Montgomery, 1985). This indicated
that the overall effect of Product Diversification on Corporate Performance was not
significant and pointed towards the need for disintegrating total diversification score
into related diversification and unrelated diversification scores as well as towards the
importance of adding contingency or moderating variables into the relationship.
The analyses also revealed significant positive effect of Related Diversification on
market measures of performance. These findings gained support from past researches
conducted by numerous scholars such as Elsas et al. (2010), Galván et al. (2007),
Miller (2006), Mishra and Akbar (2007a) and Palich et al. (2000).
249
In the same way, the analyses also revealed that there was significant negative effect
of Unrelated Diversification on ROA and P/B Value. These findings were also
supported by similar findings in the past (Berger & Ofek, 1995; Hill & Hansen, 1991;
Hoechle et al., 2012; Ravichandran et al., 2009; Schmid & Walter, 2008; Villalonga,
2004).
Following that, discussions were made on the moderating effect of Corporate
Parenting Roles on the relationship between Diversification Strategies and
Performance dimensions. Synergy Manager was found to be pure moderator
(positive) between Related Diversification Strategy and market measures of
performance (Tobin’s q, P/B Value). These findings got support from the arguments
and perspectives presented by past scholars (Gottschalg & Meier, 2005; Johnson et
al., 2005, 2008; Oijen & Douma, 2000; Porter, 1987). Tests of regression models for
Parental Developer revealed significant positive moderating effect of Parental
Developer on the relationship between Related Diversification and all dimensions of
Financial (Objective) Corporate Performance. These findings were supported by the
propositions of prominent scholars in the field such as Goold et al. (1994b) and
Johnson et al. (2005, 2008).
Similarly, tests of regression models for Portfolio Manager revealed significant
positive moderating effect of Portfolio Manager on the relationship between
Unrelated Diversification and ROA, ROE. These findings also gained support from
the suggestions and propositions made by past scholars (Johnson et al., 2005, 2008;
Porter, 1987). Importantly, the positive nature of effects for moderating variables was
250
also discussed in length and was also supported by suggestions and propositions of
past scholars.
However, nature of PM effect on the relationship between DU and SCP demands
caution due to subjective nature of assessment for Corporate Performance. Overall,
the findings justified contingency theory and also supported the connection between
corporate parenting, dynamic capabilities and product diversification strategies as
already discussed in the previous sections. The findings seemed to make significant
contribution towards resource based view, transaction cost economics, market power
view, dynamic capabilities perspective, agency theory, and contingency theory.
In other sets of hypotheses, performance of Related Diversifiers was compared
against Unrelated Diversifiers; and then within related diversifiers, performance of
Parental Developers was compared against Synergy Managers using t-tests. The tests
found that Related Diversifiers had significant performance differences against
Unrelated Diversifiers on market performance measures and their performance means
were greater than Unrelated Diversifiers on those market measures as well as on
ROA.
These results got support from substantial group of findings from past research which
also stated that related diversifiers performed well against unrelated ones (Berger &
Ofek, 1995; Galván et al., 2007; Mishra & Akbar, 2007a; Varadarajan & Ramanujam,
1987). These findings are also supported by the theoretical arguments concerning the
fit between type of diversification strategy and corporate parenting role (Johnson et
al., 2005, 2008; Porter, 1987) together with the explanations made in section 4.8.6.3.
251
These tests also revealed that Parental Developers performed better than Synergy
Managers on ROA and ROE. These results were also supported by the arguments
made by past scholars (Campbell, 2007; Goold et al., 1994a). Control variables
(particularly Size and Leverage) were also found to possess significant impacts on
Corporate Performance. Nature of their impact as revealed by this study was found to
be in line with existing literature in the field.
Therefore, in summarization, the findings for all the hypotheses were supported by the
available literature. As noted before, the findings improved the literature on product
diversification strategy, corporate parenting, corporate performance, as well as made a
contribution to all the concerned underpinning theories.
5.6 Implications of the Study
This study was designed to make significant contributions to the relevant theories in
the field as well as to guide practicing managers regarding the choice of product
diversification strategy and suitable corporate parenting role. The findings and
discussions indicate that this research has fulfilled its objectives. This research carries
important theoretical and practical implications which are discussed separately in the
following sections.
5.6.1 Theoretical Implications
The findings of this study add to the literature on product diversification strategy,
corporate parenting, and corporate performance and strengthen the body of research
252
on product diversification – performance relationship. They also add to resource
based view, transaction cost economics, dynamic capabilities perspective, and market
power view in particular. The findings provide better insight into product
diversification – performance relationship by having added the moderating effect of
corporate parenting roles into the relationship. The findings also aimed to discover the
similarities and differences with relevant research in the field.
This research examines and shows the relative effects of diversification strategies;
related and unrelated, over corporate performance and reveals that related
diversification strategy positively influences corporate performance (as measured by
Tobin’s q and P/B Value), whereas unrelated diversification strategy negatively
influences corporate performance (as measured by ROA and P/B Value). Further, it
shows that relatedly diversified companies were significantly different and seem to
outperform unrelatedly diversified companies on market performance measures.
This study further suggests that corporate parenting roles moderate the relationship
between diversification strategies and performance. Specifically, Roles of Synergy
Manager and Parental Developer positively moderate relationship between Related
Diversification Strategy and Performance, whereas Portfolio Manager positively
moderates relationship between Unrelated Diversification Strategy and Performance.
Hence, the results suggest that besides product diversification, corporate parenting is
an important contributor to corporate performance.
The results of this research also support the notion that product diversification –
performance relationship is influenced by contingency factors or moderators (Datta et
253
al., 1991; Martínez-Campillo & Fernández-Gago, 2008; Ravichandran et al., 2009),
hence providing support for the contingency theory. Specifically, this research agrees
with and confirms the proposition that product diversification – performance
relationship is moderated by corporate parenting (Campbell et al., 1995a; Nippa et al.,
2011). Moreover, the findings of this study suggest that Resource Based View (Teece,
1982; Wernerfelt, 1984), Transaction Cost Economics (Williamson, 1971), Market
Power View (Bernheim & Whinston, 1990; Martin & Eisenhardt, 2001; Saloner,
1985) and Dynamic Capabilities Perspective (Barney, 1991; Bowman & Ambrosini,
2003; Teece et al., 1997) can be used in explaining the relationship between
diversification strategies, corporate parenting roles and corporate performance.
Hence, the findings provided new insights into product diversification – performance
relationship by confirming the moderating role of corporate parenting roles into the
relationship. This extended the body of research on the topic as well as paid a
significant contribution to the relevant theories. There was substantial body of
research on the relationship, but the studies were limited regarding interrelationships
between product diversification strategies, corporate level competences or managerial
styles and corporate performance (Hitt & Ireland, 1986; Liu & Hsu, 2011; Menz &
Mattig, 2008).
Importantly, it possessed a gap in form of lack of research on the moderating role of
corporate parenting roles into product diversification - performance relationship
(Nippa et al., 2011). This research has filled that research gap by bringing together
factors of extreme strategic importance, which are product diversification strategies,
corporate parenting roles, and corporate performance together into one unique
254
framework. At the same time, it has significantly contributed to the relevant theories
in the field.
5.6.2 Practical Implications
This study examined interrelationships among extremely important managerial and
strategic issues, which are product diversification strategies, corporate parenting roles
and corporate performance. Therefore, this study carries significant practical or
managerial implications for managers in general and Malaysian managers in
particular.
Initially, the study points towards effects of product diversification strategy on
corporate performance and warns managers that they might not be able to see the
effect of total diversification strategy on corporate performance unless they
differentiate between and decompose total diversification strategy into related
diversification strategy and unrelated diversification strategy. Managers must adopt
caution in selecting their diversification routes as related diversification adds
positively to corporate performance, particularly market based performance. On the
other hand, as also revealed by most of the past studies, unrelated diversification
affects corporate performance negatively. Hence, corporate diversification,
particularly in the Malaysian context, is recommended in related sectors and
industries instead of unrelated ones.
For managers, this study highlights the importance of corporate parenting roles they
play in their companies. It is because the most important revelation of this study is the
255
active part of corporate parenting roles as moderators on the relationship between
diversification strategies and corporate performance. In other words, corporate
parenting roles act as important contingency variables when it comes to product
diversification – performance relationship. The roles work along with diversification
strategies to cast a combined effect on corporate performance.
This study suggests managers that they should be adopting either the role of Synergy
Manager or Parental Developer in case when they are primarily following related
diversification strategy. However, Parental Developer is preferable to Synergy
Manager as this research revealed that among relatedly diversified companies, those
having corporate parents playing the role of Parental Developers outperformed other
companies having corporate parents playing the role of Synergy Managers. The
intensity of these roles must go on increasing with the increasing level of related
diversification.
Managers are recommended to study the nature of these roles and differentiate
between them. The logic of these roles and their characteristics are already presented
in Chapter 2. The basic purpose of Synergy Managers is creation of synergy among
various related businesses in the group. Synergy Managers actively seek opportunities
for creating synergy, design and manage synergy management programmes, and
overcome any resistances from businesses in synergy creation. They assure that
businesses create synergy through sharing of various resources, competences and
skills among them.

256
On the other hand, Parental Developer role is more demanding. It requires corporate
managers to understand well the strategic conditions faced by the businesses and to
develop resources, knowledge, skills and competences in order to directly add value
to the businesses. As further corporate expansion could result into new markets,
technologies and resources, therefore, corporate managers are required to
continuously upgrade resource base, personal knowledge, skills and competences to
adjust to changing business conditions. In other words, Parental Developer is about
playing an active role in businesses’ value addition and not just having a corporate
centre representing certain cost figures.
On the basis of this research results, managers in general and Malaysian managers in
particular are recommended to develop corporate level resources, skills and
knowledge to directly add value to their businesses (Parental Developer) in case they
are following related diversification strategy. This arrangement has a greater
probability of assuring increased corporate performance whether measured through
accounting ratios or market based ratios.
As discussed before, managers are recommended to prefer related diversification
strategy over unrelated diversification strategy. But, in case they are going to follow
unrelated diversification strategy, they must prepare to play the role of Portfolio
Managers as this role is suitable for unrelated diversification strategy. Portfolio
Manager Role is characterized by decentralization along with having corporate
managers who actively seek acquisition of undervalued assets and businesses for
generating financial economies. The portfolio of businesses keeps on changing as
corporate managers buy and sell the businesses based on their financial performance.
257
Portfolio Managers normally do not intervene in the business strategies of their
businesses and possess limited interest in direct value addition to businesses.
Hence, this study presents certain cautions and recommendations for managers in
general and Malaysian managers in particular about the choice of diversification
strategies and corporate parenting roles. The study recommends that managers should
prefer following Related Diversification Strategy coupled with the Parental Developer
role for increasing their companies’ performance. Therefore, the study’s
recommendations are serving as a guideline for the overall Malaysian corporate sector
and are also extended to PLCs in similar developing countries. This is discussed
further in next section.
5.6.3 Contribution to Malaysian Economic well-being and other Developing Countries
This study has provided recommendations for PLCs operating in wide variety of
sectors including various manufacturing as well as service related industries. Hence,
the study has made significant contribution at the macro level by outlining
recommendations for the Malaysian corporate sector. Through providing guidelines to
Malaysian corporate sector regarding the choice of product diversification strategies
and most suitable corporate parenting roles for these strategies, this research has
attempted to refine the approach to corporate strategy formulation by the Malaysian
corporate sector along with redefining the criteria to take capital investment decisions
involving corporate level diversification.
258
In taking all the guidelines of this research, Malaysian corporate sector could improve
its contribution to country’s GDP and ultimately help in attaining Malaysia’s GDP
growth targets along with providing help in realizing other national level programmes
such as Economic Transformation Programme and Tenth Malaysia Plan.
Likewise, the findings of this research might also be equally applicable to PLCs and
corporate sectors in other developing countries facing similar business and macro
environments like those in Malaysia. It is because the business group structure, like
the one prevalent in Malaysia, is also a popular corporate structure in number of other
Asian countries (George, 2007; Mishra & Akbar, 2007a, 2007b). The suggestions
regarding selection of related diversification strategy instead of unrelated
diversification and about adopting role of synergy manager or preferentially parental
developer for related diversification strategy might also prove useful for other
developing countries firms. This would directly help enhancing the performance of
their respective corporate sectors and would ultimately add to their economic well-
being.
5.7 Limitations of the Study
Every research usually possesses certain theoretical, practical and methodological
limitations. The limitations of this study are reported as under.
This research examined relationships between those variables which are of general
nature and are common or relevant to every PLC (namely product diversification
strategy, corporate parenting and corporate performance). But, unlike U.S companies
259
where diversification is measured at company level, in emerging economies like
Malaysia, the diversification is measured at group level (George, 2007; Mishra &
Akbar, 2007a). Therefore, the findings of this study are more applicable to those
companies which are working in countries characterized by presence of business
groups. Also, in general, the findings are more applicable to companies working in
Malaysia and other countries with similar business environments and corporate
cultures as in Malaysia.
This study has covered most of the sectors such as Industrial Product, Finance,
Trading/Services, Consumer, Properties, Plantation, Technology and Construction
because most of the companies in the analyses belonged to these sectors. Hence, the
findings can easily be generalized over companies working in these sectors.
Generalizations over companies falling in other sectors such as REITs, Closed-End
Funds, Hotels, and Mining should be made with caution.
Although the methodology and all efforts ended up in an effective response rate of
around 24% which is usually considered to be satisfactory response rate from the top
level managers, but the results need caution in interpretation and generalization.
Further, the response rate of 24% was obtained mainly through mail questionnaires.
Better insights into the variables could be gained if similar data is obtained through
interviews where researcher has greater margin to probe into the questions and reveal
more information from the respondents. However, such an approach confronts
practical issues like time, money and respondent cooperation.
260
Apart from that, only one respondent’s reply was considered as a reply for overall
organisation. Sometimes, it is better to get the data from more than one person to
increase the accuracy of information. However, this method also faces problem of
respondent cooperation when the respondents are top level managers.
This study has relied on powerful and most frequently used financial ratios for
measuring performance as suggested by huge body of academic research on the topic.
Additionally, it secured subjective assessment of corporate performance to enrich the
investigation. However, corporate performance could be measured through hundreds
of different kind of ratios and indicators, and their use could also vary from company
to company. Now, absence of many other performance indicators in the analyses
could be considered as study’s limitation.
5.8 Recommendations for Future Research
This research has opened the avenues for future research into the variables related to
corporate parenting such as corporate parenting roles, capabilities, competences, and
the like. Future research can examine interrelationships between corporate parenting
capabilities, corporate culture, organisation structure, corporate parenting roles and
diversification strategies. Future research in the context of emerging economies like
Malaysia can also consider the variable of business group affiliation into their
frameworks incorporating such variables. Although data on industry characteristics is
usually limited in context of Asian countries but future research could look into
studying the variables by adding certain industry and sectorial information in it if
made possible by some data source.
261
Qualitative research into role of corporate parent competences and corporate
parenting styles could reveal significant information especially in context of business
restructuring, corporate culture and competitive advantage. It could produce case
studies of successful and unsuccessful companies faced with turnaround situations
like crises and corporate expansion with relevance to corporate parenting capabilities.
A combination of quantitative and qualitative methodologies could also provide
useful insights into relevant topics.
Also, this research was conducted by relying mainly on the mail questionnaires.
However, future research could rely on obtaining similar data using interviews if
permitted by time, cost and respondents. Hence, future studies can contribute to the
concerned literature by placing new variables along product diversification strategies,
corporate parenting roles and corporate performance into their frameworks as
suggested before. This would provide more insight into the topic.
5.9 Chapter Summary
This chapter presented discussions and conclusions on the findings and results
obtained in Chapter 4 along with discussing theoretical and practical implications of
the study, limitations and recommendations for future research. The chapter presented
discussions on the hypotheses findings in Section 5.3 along with discussion regarding
impact of control variables in Section 5.4. This was followed by theoretical and
practical implications of the study in Section 5.6. Finally, the chapter discussed
limitations of this research as well as presented recommendations for future studies in
Sections 5.7 and 5.8 respectively.
262
REFERENCES
Abdullah, H. H. (2009). The relationship of competitive strategy, strategic flexibility
and sourcing strategy on organizational performance. (Unpublished Doctoral
dissertation). Universiti Putra Malaysia.
Abdullah, H. H., & Mehmood, K. K. (2013). Corporate parent value addition and
challenges. Middle-East Journal of Scientific Research, 15(11), 1606-1617. doi:
10.5829/idosi.mejsr.2013.15.11.11640
Adner, R., & Zemsky, P. (2006, August). Diversification and performance: Linking
relatedness, market structure and the decision to diversify. Academy of
Management Proceedings, 1, GG1-GG5.
Afza, T., Slahudin, C., & Nazir, M. S. (2008). Diversification and corporate
performance: An evaluation of Pakistani firms. South Asian Journal of
Management, 15(3), 7-18.
Aggarwal, R. K., & Samwick, A. A. (2003). Why do managers diversify their firms?
Agency reconsidered. The Journal of Finance, 58(1), 71-118.
Ahmad, A. C., Ishak, Z., & Manaf, N. A. (2003). Corporate governance, ownership
structure and corporate diversification: Evidence from the Malaysian listed
companies. Asian Academy of Management Journal, 8(2), 67-89.
Ahmad, N., Omar, A., & Ramayah, T. (2012, July). Examining the validity and
reliability of e-lifestyles scale in the Malaysian context: A preliminary results.
Paper presented in The 3rd International Conference on Technology and
Operations Management “Sustaining Competitiveness through Green
Technology Management”, Bandung, Indonesia.
263
Aiken, L. S., & West, S. G. (1991). Multiple regression: Testing and interpreting
interactions. CA: Sage.
Akkermans, A. C. A. (2010). The diversification-performance relationship.
Modification during financial crises? (Unpublished Master’s thesis). Tilburg
University, Netherlands.
Alexander, M., Campbell, A., & Goold, M. (1994). Parenting advantage: The key to
corporate-level strategy. Retrieved from
http://www.adlittle.com/downloads/tx_adlprism/1995_q2_08-12.pdf
Alhaji, I. A., & Yusoff, W. F. W. (2013, June). The relationship between director’s
competencies, corporate governance and financial performance: A proposed
model. Paper presented at 3rd International Conference on Management, Penang,
Malaysia.
Amihud, Y., & Lev, B. (1981). Risk reduction as a managerial motive for
conglomerate mergers. Bell Journal of Economics, 12(2), 605-617.
Amran, N. A., & Ahmad, A. C. (2013). Effects of ownership structure on Malaysian
companies performance. Asian Journal of Accounting and Governance, 4, 51-60.
Ansari, M. A., Ahmad, Z. A., & Aafaqi, R. (2004). Organizational leadership in the
Malaysian context. In D. Tjosvold & K. Leung (Eds.), Leading in high growth
Asia: Managing relationship for teamwork and change (pp. 109-138). Singapore:
World Scientific Publishing Co.
Ansoff, H. I. (1957). Strategies for diversification. Harvard Business Review, 113-
124.
Asid, R. (2010). The technical efficiency analyses of manufacturing sector in
Malaysia: Evidence from the First Industrial Master Plan (1986-1995). Asian
Social Science, 6(2), 99-107.
264
Asrarhaghighi, E., Rahman, A. A., Sambasivan, M., & Mohamed, Z. A. (2013).
Diversification strategy and performance studies: Results, measures, and
sampling design. Journal of Advanced Management Science, 1(1), 12-18. doi:
10.12720/joams.1.1.12-18
Azlina, A. M. K. (2013). Board governance characteristics, capital structure
decisions and company performance in Malaysia. (Unpublished Doctoral
dissertation). Universiti Utara Malaysia.
Bamford, C. E., & West III, G. P. (2010). Strategic management: Value creation,
sustainability and performance. USA: South-Western, Cengage Learning.
Baranyi, Á. (2001): Environmental strategy types among manufacturing enterprises
in Hungary (Unpublished Doctoral dissertation). Budapest University of
Economic Sciences and Public Administration, Budapest, Hungary.
Barney, J. (1991). Firm resources and sustained competitive advantage. Journal of
Management, 17(1), 99-120.
Bassioni, H. A., Hassan, T. M., & Price, A. D. F. (2008). Evaluation and analysis of
criteria and sub-criteria of a construction excellence model. Engineering,
Construction and Architectural Management, 15(1), 21-41. doi:
org/10.1108/09699980810842043
Beckford, J. (2002). Contingency theory. Routledge, 6, 145-150.
Benito-Osorio, D., Guerras-Martin, L. A., & Zuniga-Vicente, J. A. (2012). Four
decades of research on product diversification: A literature review. Management
Decision, 50(2), 325-344. doi: 10.1108/00251741211203597
Benjamin, S. J., Muthaiyah, S., Marathamuthu, M. S., & Murugaiah, U. (2010). A
study of segment reporting practices: A Malaysian perspective. The Journal of
Applied Business Research, 26(3), 31-41.
265
Berger, P., & Ofek, E. (1995). Diversification’s effect on firm value. Journal of
Financial Economics, 37(1), 39-65.
Berk, J., DeMarzo, P., & Harford, J. (2009). Fundamentals of corporate finance.
USA: Pearson Education, Inc.
Bernheim, B. D., & Whinston, M. D. (1990). Multimarket contact and collusive
behavior. RAND Journal of Economics, 21(1), 1-26.
Bhide, A. (1993). Reversing corporate diversification. In D. H. Chew, Jr. (Ed.), The
new corporate finance: Where theory meets practice (pp. 526-537). NY:
McGraw-Hill.
Bian, H. (2011). SPSS series 6: Exploratory factor analysis [PowerPoint slides].
Retrieved from
http://core.ecu.edu/ofe/StatisticsResearch/SPSS%20Series%206%20Factor%20a
nalysis.pdf
Bitar, J., & Somers, W. J. (2004). A Contingency View of Dynamic Capabilities.
Cahier de recherche N, 1, 05.
Bowman, C., & Ambrosini, V. (2003). How the resource-based and the dynamic
capability views of the firm inform corporate-level strategy. British Journal of
Management, 14, 289-303.
Braakman, N., & Wagner, J. (2009). Product differentiation and profitability in
German manufacturing firms. University of Lüneburg Working Paper Series in
Economics (No. 115). Retrieved from http://www.uni
-lueneburg.de/fb2/vwl/papers/wp_115_Upload.pdf
Brown, J. B., & McDonnell, B. (1995). The balanced score-card: Short-term guest or
long-term resident? International Journal of Contemporary Hospitality
Management, 7(2/3), 7-11.
266
Bruche, G. (2000). Corporate strategy, relatedness and diversification. Working
Paper, Business Institute Berlin at the Berlin School of Economics (No. 13).
Retrieved from
http://www.mba-berlin.de/fileadmin/user_upload/MAIN-
dateien/1_IMB/Working_Papers/vor_2007/WP_13_working_paper_13.pdf.
Bryant, P., & Davis, C. (2012). Regulated change effects on boards of directors: A
look at agency theory and resource dependency theory. Academy of Strategic
Management Journal, 11(2), 1-15.
Bryman, A., & Bell, E. (2003). Business research methods. UK: Oxford University
Press.
Burgers, W., Padgett, D., Bourdeau, B., & Sun, A. (2009). Revisiting the link between
product and industry: Diversification and corporate performance. International
Review of Business Research Papers, 5 (January), 367- 379.
Bursa Malaysia (2011). Going public: A practical guide to listing on Bursa Malaysia.
Retrieved from
http://www.mia.org.my/new/downloads/professional/regulatory/sc_bursa/knowle
dge/2012/Practical_Guide_to_Listing_SMEs.pdf
Bursa Malaysia (n.d.a). Investor relations put into practice. Retrieved from
http://www.bursamalaysia.com/misc/listed_companies_listing_IR_manual.pdf
Bursa Malaysia (n.d.b). Investor relations: The workbook. Retrieved from
http://www.bursamalaysia.com/misc/listed_companies_listing_IR_manual_work
book.pdf
Busija, E. C., O’Neill, H. M., & Zeithaml, C. P. (1997). Diversification strategy, entry
mode, and performance: Evidence of choice and constraints. Strategic
Management Journal, 18(4), 321-327.
267
Caldart, A. A., & Ricart, J. E. (2006). A formal evaluation of the performance of
different corporate styles in stable and turbulent environments. University of
Navarra Working Paper (No. 621). Retrieved from
http://www.iese.edu/research/pdfs/DI-0621-E.pdf
Campa, J. M., & Kedia, S. (2002). Explaining the diversification discount. The
Journal of Finance, 57(4), 1731-1762.
Campbell, A. (2007). What do we know about group level strategy? Ashridge
Business School. Retrieved from
https://www.ashridge.org.uk/Media-
Library/Ashridge/PDFs/Publications/WhatDoWeKnowAboutGroupLevelStrateg
y.pdf.
Campbell, A., & Goold, M. (1988). Adding value from corporate headquarter. London
Business School Journal, Summer, 48-58.
Campbell, A., Goold, M., & Alexander, M. (1995a). The value of the parent
company. California Management Review, 38(1), 79-97.
Campbell, A., Goold, M., & Alexander, M. (1995b). Corporate strategy: The quest for
parenting advantage. Harvard Business Review, March-April, 120-132.
Capar, N. (2003). An analysis of the relationships between international
diversification, product diversification, firm resources and firm performance.
(Doctoral dissertation). Retrieved from Proquest Dissertations and Theses. (UMI
3098369).
Carney, M., Gedajlovic, E. R., Heugens, P. P. M. A. R., Essen, M. V., & Oosterhout,
J. V. (2011). Business group affiliation, performance, context, and strategy: A
meta-analysis. Academy of Management Journal, 54(3), 437-460.
268
Chakrabarti, A., Singh, K., & Mahmood, I. (2007). Diversification and performance:
Evidence from East Asian firms. Strategic Management Journal, 28, 101-120.
doi: 10.1002/smj.572
Chakravarthy, B. S. (1986). Measuring strategic performance. Strategic Management
Journal, 7(5), 437-458.
Chan, S. H. (2010). The influence of leadership expertise and experience on
organizational performance: A study of Amanah Ikhtiar Malaysia. Asia Pacific
Business Review, 16(1–2), 59–77. doi: 10.1080/13602380802503566
Chang, Y., & Thomas, H. (1989). The impact of diversification strategy on risk-return
performance. Strategic Management Journal, 10(3), 271-284.
Chari, M. D. R., Devaraj, S., & David, P. (2008). The impact of information
technology investments and diversification strategies on firm performance.
Management Science, 54(1), 224-234. doi 10.1287/mnsc.1070.0743
Chavan, M. (2009). The balance scorecard: A new challenge. Journal of Management
Development, 28(5), 393-406. doi: 10.1108/02621710910955930
Chin, L. C. (2009). An analysis of why Public Listed Companies go private in
Malaysia. (Unpublished Master’s dissertation). University of Malaya, Malaysia.
Christensen, H. K., & Montgomery, C. A. (1981). Corporate economic performance:
Diversification strategy versus market structure. Strategic Management Journal,
2(4), 327-343.
Claessens, S., Djankov, S., Fan, J. P. H., & Lang, L. H. P. (1998). Diversification and
efficiency of investment by East Asian corporations. World Bank Working Paper
(No. 2033). Retrieved from http://go.worldbank.org/CK0LIGKD90
Coakes, S., Steed, L., & Price, J. (2008). SPSS: Analysis without anguish: Version
15.0 for windows. Australia: Wiley.
269
Coase, R. H. (1937). The nature of the firm. Economica, 4(16), 386-405.
Çolak, G. (2010). Diversification, refocusing and firm value. Retrieved from
http://gonulcolak.org/uploads/DiverRefoc_R2.pdf
Collis, D. J. (1996). Corporate strategy in multi-business firms. Long Range Planning,
29(3), 416-418.
Collis, D., Young, D., & Goold, M. (2007). The size, structure, and performance of
corporate headquarters. Strategic Management Journal, 28, 383-405. doi:
10.1002/smj.595
Comrey, A. L., & Lee, H. B. (1992). A first course in factor analysis (2nd edition).
NJ: Erlbaum.
Cooper, D. R., & Schindler, P. S. (2006). Business research methods (9th edition).
NY: McGraw-Hill/Irwin.
Cooper, D. R., & Schindler, P. S. (2008). Business research methods (10th edition).
NY: McGraw-Hill/Irwin.
Coulter, M. (2005). Strategic management in action (3rd edition). NJ: Pearson
Education, Inc.
Cronbach, L. J. (1951). Coefficient alpha and the internal structure of tests.
Psychometrika, 16, 297-334.
Curran, P. J., West, S. G., & Finch, J. F. (1996). The robustness of test statistics to
nonnormality and specification error in confirmatory factor analysis.
Psychological methods, 1(1), 16-29. doi: org/10.1037/1082-989X.1.1.16
Dastidar, P. (2009). International corporate diversification and performance: Does
firm self-selection matter? Journal of International Business Studies, 40, 71-85.
doi:10.1057/palgrave.jibs.2008.57
270
Datta, D. K., Rajagopalan, N., & Rasheed, A. M. A. (1991). Diversification and
performance: Critical review and future directions. Journal of Management
Studies, 28(5), 529-558.
Daud, W. M. N. W., Salamudin, N. B., & Ahmad, I. B. (2009). Corporate
diversification and performance. International Business Education Journal, 2(1),
1-18.
David, F. R. (2011). Strategic management: Concepts. (13th edition). NJ: Pearson
Education, Inc.
David, P., O’Brien, J. P., Yoshikawa, T., & Delios, A. (2010). Do shareholders or
stakeholders appropriate the rents from corporate diversification? The influence
of ownership structure. Academy of Management Journal, 53(3), 636-654. doi:
10.5465/AMJ.2010.51469005
De, S. (1992). Diversification patterns and long-term corporate performance.
Managerial and Decision Economics, 13(1), 1-13.
DeCoster, J. (1998). Overview of factor analysis. Retrieved from http://www.stat-
help.com/notes.html
Delios, A., & Beamish, P. W. (1999). Geographic scope, product diversification, and
the corporate performance of Japanese firms. Strategic Management Journal,
20(8), 711-727.
Denton, D. K. (2005). Measuring relevant things. International Journal of
Productivity and Performance Management, 54(4), 278-287. doi:
10.1108/17410400510593820
Dess, G. G., Lumpkin, G. T., & Eisner, A. B. (2010). Strategic management: Text and
cases (5th edition). NY: McGraw-Hill/Irwin.
271
Dess, G., Lumpkin, G. T., Eisner, A., & McNamara, G. (2011). Strategic
management: Text and cases (6th edition). NY: McGraw-Hill/Irwin.
Dobák, M., & Antal, Zs. (2010). Vezetés és szervezés: Szervezetek kialakítása és
m_ködtetése. [Management and organization: creating and operating
organizations] Aula Kiadó, Budapest, Hungary.
Doukas, J. A., & Lang, L. H. P. (2003). Foreign direct investment, diversification and
firm performance. Journal of International Business Studies, 34, 153-172.
doi:10.1057/palgrave.jibs.8400014
Downe, A. G., Loke, S-P., Ho, J. S-Y., & Taiwo, A. A. (2012). Corporate talent needs
and availability in Malaysian service industry. International Journal of Business
and Management, 7(2), 224-235. doi:10.5539/ijbm.v7n2p224
Dubofsky, P., & Varadarajan, P. R. (1987). Diversification and measures of
performance: Additional empirical evidence. The Academy of Management
Journal, 30(3), 597-608.
Dundas, K. N. M., & Richardson, P. R. (1982). Implementing the unrelated product
strategy. Strategic Management Journal, 3, 287-301.
Eisenhardt, K. M. (1989). Agency theory: An assessment and review. Academy of
Management Review, 14(1), 57-74.
Elsas, R., Hackethal, A., & Holzhäuser, M. (2010). The anatomy of bank
diversification. Journal of Banking and Finance, 34, 1274-1287.
doi:10.1016/j.jbankfin.2009.11.024
Etter, J. F., & Perneger, T. V. (1997). Analysis on non-response bias in a mailed
health survey. J Clin Epidemiol, 50(10), 1123-1128.
272
Fan, J. P. H., Huang, J., Oberholzer-Gee, F., Smith, T. D., & Zhao, M. (2008).
Diversification of Chinese companies: An international comparison. Chinese
Management Studies, 2(1), 6-13. doi: 10.1108/17506140810866223
Fatima, S., Rehman, F. U., & Ali, M. (2011). Formation and internationalization of IT
firms of Pakistan: A resource based view. Business and Management Review,
1(10), 65-81.
Field, A. (2013). Discovering statistics using IBM SPSS statistics (4th edition). US:
SAGE Publications.
FTSE (2014). FTSE monthly report – July 2014. Retrieved from
http://www.ftse.com/Analytics/FactSheets/temp/bcae23d5-5f9a-4fe3-b64a-
3e1ed56a2d53.pdf.
Fukui, Y., & Ushijima, T. (2006). Corporate diversification, performance, and
restructuring in the largest Japanese manufacturers. Journal of the Japanese &
International Economies, 21(3), 303-323. doi: 10.1016/j.jjie.2006.06.002
Galván, A., Pindado, J., & De la Torre, C. (2007). Diversification: value-creating or
value-destroying strategy? Evidence from using panel data. Retrieved from
http://gredos.usal.es/jspui/bitstream/10366/17425/1/DAEE_04_07_Diversificatio
n.pdf
Gary, M. S. (2005). Implementation strategy and performance outcomes in related
diversification. Strategic Management Journal, 26, 643-664. doi:
10.1002/smj.468
Gefen, D., & Straub, D. (2005). A practical guide to factorial validity using PLS-
graph: Tutorial and annotated example. Communications of the Association for
Information Systems, 16, 91-109.
273
George R. P. (2007). Diversification and firm performance: The moderating influence
of ownership structure and business group-affiliation. South Asian Journal of
Management, 14(3), 66-94.
Ghaffour, A., & Ripin, M. (2014). Statement by Abdul Ghaffour, Alternate Executive
Director for Malaysia and Mohd Ripin, Advisor to Executive Director, March 7,
2014. In IMF Staff Country Report. (2014). Washington: International Monetary
Fund.
Ghosh, S., & Mukherjee, S. (2006). Measurement of corporate performance through
balance scorecard: An overview. Vidyasagar University Journal of Commerce,
11, 60-70.
Giblin, G. R. (2013). The effects of shareholder proposals on stock price: A study of
S&P 500 Companies. (Unpublished DBA dissertation). Golden Gate University,
California, United states.
Giovanis, A. N. (2013, May). The effects of perceived value, brand satisfaction, and
brand trust on brand loyalty of high-tech products: Evidence from the young
adults’ behavior. Paper presented in Third International Conference on
Quantitative and Qualitative Methodologies in the Economic and Administrative
Sciences (QMEAS), Athens, Greece.
Gitman, L. J., & Zutter, C. J. (2011). Principals of managerial finance (13th edition).
NJ: Prentice Hall.
Goddard, J., McKillop, D., & Wilson, J. O. S. (2008). The diversification and
financial performance of US credit unions. Journal of Banking and Finance, 32,
1836-1849. doi:10.1016/j.jbankfin.2007.12.015
Goll, I., & Sambharya, R. B. (1995). Corporate ideology, diversification and firm
performance. Organization Studies, 16(5), 823-846.
274
Gomes, J., & Livdan, D. (2004). Optimal diversification: Reconciling theory and
evidence. The Journal of Finance, 59(2), 507-535.
Goold, M. (1996). Parenting strategies for the mature business. Long Range Planning,
29(3), 358-369.
Goold, M., & Campbell, A. (1987). Strategies and styles: The role of the centre in
managing diversified corporations. London: Basil Blackwell Ltd.
Goold, M., & Campbell, A. (1991). Brief case: From corporate strategy to parenting
advantage. Long Range Planning, 24(1), 115-117.
Goold, M., & Campbell, A. (1994). Corporate strategy and parenting maps. In H.
Thomas, D. O’Neal, R. White & D. Hurst (Eds.), Building the strategically-
responsive organization (pp. 129-146). NJ: John Wiley & Sons. Ltd.
Goold, M., & Campbell, A. (1998). Desperately seeking synergy. Harvard Business
Review, September-October, 131-143.
Goold, M., & Campbell, A. (2002). Parenting in complex structures. Long Range
Planning, 35, 219-243.
Goold, M., Campbell, A., & Alexander, M. (1994a). How corporate parents add value
to the stand-alone performance of their businesses. Business Strategy Review,
5(4), 33-55.
Goold, M., Campbell, A., & Alexander, M. (1994b). Corporate level strategy:
Creating value in the multibusiness company. USA: John Wiley & Sons, Inc.
Goold, M., Campbell, A., & Alexander, M. (1998). Corporate strategy and parenting
theory. Long Range Planning, 31(2), 308 -314.
Goold, M., Campbell, A., & Luchs, K. (1993a). Strategies and styles revisited:
Strategic planning and financial control. Long Range Planning, 26(5), 49-60.
275
Goold, M., Campbell, A., & Luchs, K. (1993b). Strategies and styles revisited:
‘Strategic control’-Is it tenable? Long Range Planning, 26(6), 54-61.
Goold, M., & Luchs, K. (1993). Why diversify? Four decades of management
thinking. Academy of Management Executive, 7(3), 7-25.
Gottschalg, O., & Meier, D. (2005). What does it take to be good parent? Opening the
black-box of value creation in the unrelated multibusiness firm.
Retrieved from
http://www.hec.fr/var/fre/storage/original/application/4c1b667c0dab434a70346a
39f61bd949.pdf
Grant, R., Butler, B., Hung, H., & Orr, S. (2011). Contemporary strategic
management: An Australasian perspective. Australia: John Wiley & Sons.
Gruber, M., Heinemann, F., Brettel, M., & Hungeling, S. (2010). Configurations of
resources and capabilities and their performance implications: An exploratory
study on technology ventures. Strategic Management Journal, 31, 1337-1356.
doi: 10.1002/smj.865
Guillen, M. F. (2000). Business groups in emerging economies. Academy of
Management Journal, 43(3), 362-380.
Gujarati, D. (2006). Essentials of econometrics (3rd edition). US: McGraw-Hill.
Guo, Z. F., & Cao, L. (2011, May). Revisiting the effect of diversification on firm
performance. Global Conference on Business and Finance Proceedings, 6(2), San
Jose, Costa Rica.
Gupta, V., Gollakota, K., & Srinivasan, R. (2007). Business policy and strategy
management: Concepts and applications (2nd edition). India: Prentice-Hall.
Haberberg, A., & Rieple A. (2001). The strategic management of organisations.
England: Pearson Education Limited.
276
Hair Jr., J. F., Anderson, R. E., Tatham, R. L., & Black, W. C. (1998) Multivariate
data analysis with readings (5th edition). NJ: Prentice Hall.
Hair Jr., J. F., Black, W. C., Babin, B. J., & Anderson, R. E. (2009). Multivariate data
analysis (7th edition). NJ: Prentice Hall.
Hair, J. F., Black, W. C., Babin, B. J., & Anderson, R. E. (2010). Multivariate data
analysis: A global perspective (8th edition). NJ: Pearson.
Hall Jr., E. H. (1995). Corporate diversification and performance: An investigation of
causality. Australian Journal of Management, 20(1), 25-42.
Harper, A. H. (2011). Comovements and stock market integration between India and
its top trading partners: A multivariate analysis of international portfolio
diversification. (Unpublished Doctoral dissertation). Capella University,
Minneapolis, United States.
Harrison, J. S., & John, C. H. S. (2010). Foundations in strategic management (5th
edition). USA: South-Western, Cengage Learning.
Hassan, N. H. N., Muhammad, N. M. N., & Ismail, Z. (2011). Strategic management
accounting practice in Malaysia: Case of manufacturing sector. Journal of
Finance, Accounting and Management, 2(2), 23-38.
Helfat, C. E., & Eisenhardt, K. M. (2004). Inter-temporal economies of scope,
organizational modularity, and the dynamics of diversification. Strategic
Management Journal, 25, 1217-1232. doi: 10. IOO2/smj.427
Hepworth, P. (1998). Weighing it up: A literature review for the balanced scorecard.
Journal of Management Development, 17(8), 559-563.
Hill, C. W. L., & Hansen, G. S. (1991). A longitudinal study of the cause and
consequences of changes in diversification in the U.S. pharmaceutical industry
1977-1986, Strategic Management Journal, 12, 187-199.
277
Hill, C. W. L., Hitt, M. A., & Hoskisson, R. E. (1992). Cooperative versus
competitive structures in related and unrelated diversified firms. Organization
Science, 3(4), 501-521.
Hitt, M. A., & Ireland, R. D. (1986). Relationships among corporate level distinctive
competencies, diversification strategy, corporate structure and performance.
Journal of Management Studies, 23(4), 401-416.
Hitt, M. A., Ireland, R. D., & Hoskisson, R. E. (2011). Strategic management:
Competitiveness and globalization (9th edition). USA: South-Western, Cengage
Learning.
Hoechle, D., Schmid, M., Walter, I., & Yermack, D. (2012). How much of the
diversification discount can be explained by poor corporate governance? Journal
of Financial Economics, 103, 41-60. doi:10.1016/j.jfineco.2011.03.025
Hoskisson, R. E., Hitt, M. A., & Ireland, R. D. (2009). Business strategy: Theory and
cases (2nd edition). USA: South-Western, Cengage Learning.
Hwa, O. K. (2014). Getting the right stock market strategies at the right time.
[PowerPoint slides]. Retrieved from
http://www.investsmartsc.my/sites/default/files/ebrochures/files/SM1_Getting%2
0The%20Right%20Stock%20Market%20Strategies%20at%20the%20Right%20
Time.pdf.
Ibrahim, Y. M., & Kaka, A. P. (2007). The impact of diversification on the
performance of UK construction firms. Journal of Financial Management of
Property and Construction, 12(2), 73-86. doi:
http://dx.doi.org/10.1108/13664380780001095
IMF Staff Country Report. (2012). Malaysia staff report for the 2011 Article IV
consultation (Report No. 12/43). Washington: International Monetary Fund.
278
IMF Staff Country Report. (2014). Malaysia staff report for the 2013 Article IV
consultation (Report No. 14/80). Washington: International Monetary Fund.
Ishak, Z., & Napier, C. (2006). Expropriation of minority interests and corporate
diversification in Malaysia. Asian Academy of Management Journal of
Accounting and Finance, 2, 85-113.
Iversen, M. (2000). Synergies and sustainable competitive advantage. Institut for
Industriøkonomi og Virksomhedsstrategi, Handelshøjskolen i København.
Jacquemin, A. P., & Berry, C. H. (1979). Entropy measure of diversification and
corporate growth. The Journal of Industrial Economics, 27(4), 359-369.
Jensen, M. C. (1986). Agency costs of free cash flow, corporate finance, and
takeovers. American Economic Review, 76(2), 323-329.
Johnson, G., Scholes, K., & Whittington, R. (2005). Exploring corporate strategy:
Text and cases (7th edition). India: Dorling Kindersley.
Johnson, G., Scholes, K., & Whittington, R. (2008). Exploring corporate strategy:
Text and cases (8th edition). NJ: Prentice Hall.
Johnson, G., Whittington, R., & Scholes, K. (2011). Exploring strategy (9th edition).
England: Pearson Education Limited.
Jones, G. R., & Hill, C. W. L. (2010). Theory of strategic management: With cases
(9th edition). USA: South-Western, Cengage Learning.
Jusoh, R., & Parnell, J. A. (2008). Competitive strategy and performance
measurement in the Malaysian context. An exploratory study. Management
Decision, 46(1), 5-31. doi: 10.1108/00251740810846716
Kahloul, I., & Hallara, S. (2010). The impact of diversification on firm performance
and risk: An empirical evidence. International Research Journal of Finance and
Economics, 35, 150-162.
279
Kanapathy, K. V. (2005). Independent non-executive directors, managerial ownership
and firm performance in Malaysian Public Listed Companies. (Unpublished
Master’s Project Paper). Universiti Sains Malaysia.
Kaplan, R. S., & Norton, D. P. (1992). The balanced scorecard: Measures that drive
performance. Harvard Business Review, January-February, 70-80.
Kenny, G. (2012). Diversification: Best practices of the leading companies. Journal of
Business Strategy, 33(1), 12-20. doi: 10.1108/02756661211193776
Khalid, K., Hilman, H., & Kumar, D. (2012). Get along with quantitative research
process. International Journal of Research in Management, 2(2), 15-29.
Kim, H. Y. (2013). Statistical notes for clinical researchers: Assessing normal
distribution using skewness and kurtosis. Restorative dentistry & endodontics,
38(1), 52-54. doi: 10.5395/rde.2013.38.1.52
Klein, P. G., & Saidenberg, M. R. (2010). Organizational structure and the
diversification discount: Evidence from commercial banking. The Journal of
Industrial Economics, 58(1), 127-155.
Klier, D. O. (2009). Managing diversified portfolios: What multi-business firms can
learn from private equity. Germany: Physica-Verlag Heidelberg.
Knoll, S. (2007). Cross-Business synergies: A typology of cross-business synergies
and a mid-range theory of continuous growth synergy realization. (Unpublished
Doctoral dissertation). University of St. Gallen, Switzerland.
Kruehler, M., Pidun, U., & Rubner, H. (2012). How to assess the corporate parenting
strategy? A conceptual answer. Journal of Business Strategy, 33(4), 4-17. doi:
10.1108/02756661211242663
280
Kuppuswamy, V., & Villalonga, B. (2010). Does diversification create value in the
presence of external financing constraints? Evidence from the 2008–2009
financial crisis. Harvard Business School Finance Working Paper (No. 1569546).
Retrieved from http://ssrn.com/abstract=1569546
Lahovnik, M. (2011). Corporate strategies in the post-transition economy: The case of
Slovenian companies. The Journal of Applied Business Research, 27(1), 61-68.
Lane, P. J., Cannella Jr., A. A., & Lubatkin, M. H. (1998). Agency problems as
antecedents to unrelated mergers and diversification: Amihud and Lev
reconsidered. Strategic Management Journal, 19, 555–578.
Lang, L. H. P., & Stulz, R. M. (1994). Tobin's q, corporate diversification, and firm
performance. The Journal of Political Economy, 102(6), 1248-1280.
Lange, D., Boivie, S., & Henderson, A. D. (2009). The parenting paradox: How
multibusiness diversifiers endorse disruptive technologies while their corporate
children struggle. Academy of Management Journal, 52(1), 179-198.
Lawrence, P. R., & Lorsch, J. W. (1967): Differentiation and integration in complex
organizations. Administrative Science Quarterly, 12(1), 1-47.
Lee, S. C. (2002). Corporate diversification and performance: Evidence from Korea.
(Doctoral Dissertation). Retrieved from Proquest Dissertations and Theses. (UMI
3070635).
Lehmann, D., McDonald, R., Cote, J., Heath, T., Irwin, J., & Ambler, T. (2001).
Mediators and moderators. Journal of Consumer Psychology, 10(1/2), 89-100.
Lim, E. N-K., Das, S. S., & Das, A. (2009). Diversification strategy, capital structure,
and the Asian financial crisis (1997–1998): Evidence from Singapore firms.
Strategic Management Journal, 30, 577-594. doi: 10.1002/smj.752
281
Lins, K., & Servaes, H. (1999). International evidence on the value of corporate
diversification. The Journal of Finance, 54(6), 2215-2239.
Lins, K. V., & Servaes, H. (2002). Is corporate diversification beneficial in emerging
markets? Financial Management, Summer, 5-31.
Liu, H-Y., & Hsu, C-W. (2011). Antecedents and consequences of corporate
diversification: A dynamic capabilities perspective. Management Decision,
49(9), 1510-1534. doi: 10.1108/00251741111173961
Lloyd, W. P., & Jahera Jr., J. S. (1994). Firm-Diversification effects on performance
as measured by Tobin's q. Managerial and Decision Economics, 15(3), 259-266.
Lupia, A. (2001). Delegation of power: Agency theory. In N. J. Smelser & P. B.
Baltes, (Eds.), International encyclopedia of the social and behavioral sciences
(pp. 3375-3377). Oxford: Elsevier Sciences Limited.
Mah-Kamariyah, & Koh, P. (2011). A lawyer’s guide to doing business in Malaysia.
Retrieved from
http://www.mkp.com.my/storage/downloads/publications/MKP-Booklet-
DoingBusinessInMalaysia.pdf
Malaysian Accounting Standards Board (2014a). Information Retrieved through
http://www.masb.org.my/index.php?option=com_content&view=article&id=451:
links-local&catid=30
Malaysian Accounting Standards Board (2014b). Financial Reporting Standard 8:
Operating Segments. Retrieved from
http://www.masb.org.my/index.php?option=com_content&view=article&id=127
2
282
Malaysian Institute of Accountants. (2010). FRS 8 operating segments. Accountants
Today, January, 40-51. Retrieved from
www.mia.org.my/at/at/2010/01/06.pdf
Malaysian Institute of Economic Research (2012a). Malaysian economic outlook (1st
quarter 2012 update). MY: MIER.
Malaysian Institute of Economic Research (2012b). Business conditions: Survey
report (First quarter 2012, Issue No. 99). MY: MIER
Malaysian Institute of Economic Research (2014). Malaysian economic outlook (4th
quarter 2013 update). Retrieved from
http://www.mier.org.my/outlook/archives/2014_01.html
Malaysian Investment Development Authority (2014). Why Malaysia. Retrieved from
http://www.mida.gov.my/env3/index.php?page=why-malaysia
Marinelli, F. (2011, February). The relationship between diversification and firm’s
performance: Is there really a causal relationship? IESE Business School,
University of Navarra Working Paper (No. 907). Retrieved from
http://www.iese.edu/research/pdfs/DI-0907-E.pdf
Markides, C. C., & Williamson, P. J. (1994). Related diversification, core
competences and corporate performance. Strategic Management Journal, 15,
149-165.
Markides, C. C., & Williamson, P. J. (1996). Corporate diversification and
organizational structure: A resource-based view. The Academy of Management
Journal, 39(2), 340-367.
Martin, J. A., & Eisenhardt, K. M. (2001). Exploring cross-business synergies.
Academy of Management Proceedings, BPS, H1-H6, Washington.
283
Martin, J. D., & Sayrak, A. (2003). Corporate diversification and shareholder value: A
survey of recent literature. Journal of Corporate Finance, 9, 37-57.
Martínez-Campillo, A., & Fernández-Gago, R. (2008). The diversification-
performance relationship in Spanish firms: Does the CEO´s behaviour style
matter? European Research Studies, 11(1-2), 57-70.
Matyusz, Z. (2012). The effect of contingency factors on the use of manufacturing
practices and operations performance. (Unpublished Doctoral dissertation).
Corvinus University of Budapest, Hungary.
Mehmood, K. K., & Hilman, H. (2013, June). Four decades of academic research on
product diversification – performance relationship: Analysis and foresight.
Paper presented at the 10th Annual World Congress of the Academy for Global
Business Advancement, Bangkok, Thailand.
Menz, M., & Mattig, A. W. (2008). Diversification strategies and firm performance:
The impact of corporate management capabilities. Academy of Management
(AOM) Annual Meeting, Anaheim, California.
Michel, A., & Shaked, I. (1984). Does business diversification affect performance?
Financial Management, 13(4), 18-25.
Micheli, P., Mura, M., & Agliati, M. (2011). Exploring the roles of performance
measurement systems in strategy implementation: The case of a highly
diversified group of firms. International Journal of Operations & Production
Management, 31(10), 1115-1139. doi: 10.1108/01443571111172453
Miller, D. J. (2006). Technological diversity, related diversification, and firm
performance. Strategic Management Journal, 27, 601-619. doi: 10.1002/smj.533
Miller, D., & Sardais, C. (2011). Angel agents: Agency theory reconsidered. Academy
of Management Perspectives, May, 6-13.
284
Ministry of International Trade and Industry (2013). MITI weekly bulletin, 228. MY:
MITI
Mishra, A., & Akbar, M. (2007a). Empirical examination of diversification strategies
in business groups. Evidence from emerging markets. International Journal of
Emerging Markets, 2(1), 22-38. doi: 10.1108/17468800710718877
Mishra, A., & Akbar, M. (2007b). Parenting advantage in business groups of
emerging markets. VISION-The Journal of Business Perspective, 11(3), 1-10.
Mohamad, O., & Wheeler, C. N. (1996) Comparing high, moderate and low
performance exporters: Evidence from Malaysia. Asian Academy of Management
Journal, 1 (2). 16-31.
Mohammed, A. A. E. (2012). Financial situation of PN17 Companies listed in the
Malaysian Stock Exchange (Unpublished Master’s thesis). University Tun
Hussein Onn, Malaysia.
Montgomery, C. A. (1982). The measurement of firm diversification: Some new
empirical evidence. The Academy of Management Journal, 25(2), 299-307.
Montgomery, C. A. (1985). Product-Market diversification and market power. The
Academy of Management Journal, 28(4), 789-798.
Montgomery, C. A. (1994). Corporate diversification. Journal of Economic
Perspectives, 8(3), 163-178.
Morden, T. (2007). Principles of strategic management (3rd edition). USA: Ashgate
Publishing Company.
Mun, H. W. (Ed.). (2007). Malaysian economic development: Issues and debates.
Retrieved from http://harwaimun.com/Malaysian_Economics_Development.pdf
Nambiar, S. (2009). Revisiting privatisation in Malaysia: The importance of
institutional process. Asian Academy of Management Journal, 14(2), 21–40.
285
Nandakumar, M. K., Ghobadian, A., & O’Regan, N. (2010). Business-level strategy
and performance: The moderating effects of environment and structure.
Management Decision, 48(6), 907-939. doi: 10.1108/00251741011053460
Naqshbandi, M. M., & Idris, F. (2012). Competitive priorities in Malaysian service
industry. Business Strategy Series, 13(6), 1-16.
Nayyar, P. R. (1992). On the measurement of corporate diversification strategy:
Evidence from large U.S. service firms. Strategic Management Journal, 13(3),
219-235.
Nayyar, P. R. (1993). Stock market reactions to related diversification moves by
service firms seeking benefits from information asymmetry and economies of
scope. Strategic Management Journal, 14, 569-591.
Neill, J. (2011). Survey research & design in psychology: Exploratory factor
analysis (Lecture 5). Retrieved from
http://en.wikiversity.org/wiki/Survey_research_and_design_in_psychology/Lectu
res/Exploratory_factor_analysis
Ng, D. W. (2007). A modern resource based approach to unrelated diversification.
Journal of Management Studies, 44 (8), 1481-1502. doi: 10.1111/j.1467-
6486.2007.00719.x
Nippa, M., Pidun, U., & Rubner, H. (2011). Corporate portfolio management:
Appraising four decades of academic research. Academy of Management
Perspectives, 25(4), 50-66. doi: 10.5465/amp.2010.0164
Noordin, S. M., & Supramaniam, S. (2013). An overview of Malaysian legal system
and research. Retrieved from
http://www.nyulawglobal.org/Globalex/Malaysia1.htm
286
Nor Aziah, A. M. (2004). Land tax administration and compliance attitudes in
Malaysia. (Unpublished Doctoral dissertation). University of Nottingham.
Norusis, M. J. (1999). Guide to data analysis. NJ: Prentice Hall.
Nunnaly, J. (1978). Psychometric theory. USA: McGraw-Hill.
Nyberg, A. J., Fulmer, I. S., Gerhart, B., & Carpenter, M. A. (2010). Agency theory
revisited: CEO return and shareholder interest alignment. Academy of
Management Journal, 53(5), 1029-1049.
Official Website of the Office of the Prime Minister of Malaysia (2014). Information
Retrieved from https://www.pmo.gov.my/
Oijen, A. V., & Douma, S. (2000). Diversification strategy and the roles of the centre.
Long Range Planning, 33, 560-578.
Palepu, K. (1985). Diversification strategy, profit performance and the entropy
measure. Strategic Management Journal, 6(3), 239-255.
Palich, L. E., Cardinal, L. B., & Miller, C. C. (2000). Curvilinearity in the
diversification performance linkage: An examination of over three decades of
research. Strategic Management Journal, 21(2), 155-174.
Pan, W-H., Tsai, W-C., & Kuo, T-Y. (2010). Internationalization and firm
performance: Exploring the moderating effects of regional diversification.
African Journal of Business Management, 4(18), 4049-4056.
Pandya, A. M., & Rao, N. V. (1998). Diversification and firm performance: An
empirical evaluation. Journal of Financial and Strategic Decisions, 11(2), 67-81.
Park, K. M. (2010). Diversification strategy and firm performance: A study of the
restaurant industry. (Doctoral Dissertation). Retrieved from Proquest
Dissertations and Theses. (UMI 3444833).
287
Pearce II, J. A., & Robinson Jr., R. B. (2007). Strategic management: Formulation,
implementation and control (10th edition). NY: McGraw-Hill/Irwin.
Pearce II, J. A., & Robinson Jr., R. B. (2011). Strategic management: Formulation,
implementation and control (12th edition). NY: McGraw-Hill/Irwin.
Pehrsson, A. (2006). Business relatedness and performance: A study of managerial
perceptions. Strategic Management Journal, 27, 265-282. doi: 10.1002/smj.516
Pitts, R. A., & Hopkins, H. D. (1982). Firm diversity: Conceptualization and
measurement. The Academy of Management Review, 7(4), 620-629.
Porter, M. E. (1987). From competitive advantage to corporate strategy. Harvard
Business Review, May-June, 43-59.
Porter, M. E. (1991). Towards a dynamic theory of strategy. Strategic Management
Journal, 12(Special issue: Fundamental research issues in strategy and
economics), 95-117.
Punniyamoorthy, M., & Murali, R. (2008). Balanced score for the balanced scorecard:
A benchmarking tool. Benchmarking: An International Journal, 15(4), 420-443.
doi: 10.1108/14635770810887230
Ravichandran, T., Liu, Y., Han, S., & Hasan, I. (2009). Diversification and firm
performance: Exploring the moderating effects of information technology
spending. Journal of Management Information Systems, 25(4), 205-240. doi:
10.2753/MIS0742-1222250407
Razak, N. H. A., Ahmad, R., & Joher, H. A. (2011). Does government linked
companies (GLCs) perform better than non-GLCs? Evidence from Malaysian
listed companies. Journal of Applied Finance & Banking, 1(1), 213-240.
288
Read, D., & Loewenstein, G. (1995). Diversification bias: Explaining the discrepancy
in variety seeking between combined and separated choices. Journal of
Experimental Psychology: Applied, 1(1), 34-49. doi: org/10.1037/1076-
898X.1.1.34
Reinton, S. E., & Foote, N. (1988). Why parents must be more particular. The
McKinsey Quarterly, Autumn, 46-53.
Robbins, S. P., Coulter, M., & Langton, N. (2007). Fundamentals of management (5th
Canadian edition). Canada: Pearson Education.
Rokiah, I. (2010). Determinants and consequences of CEO succession in Malaysian
Public Listed Companies. (Unpublished Doctoral dissertation). Universiti Utara
Malaysia.
Ross, S. A., Westerfield, R. W., & Jordan, B. D. (2009). Fundamentals of corporate
finance (9th edition). NY: McGraw-Hill/Irwin.
Ross, S. A., Westerfield, R. W., Jaffe, J. F., & Jordan, B. D. (2011). Corporate
finance: Core principles & applications (3rd edition). NY: McGraw-Hill/Irwin.
Rumelt, R. P. (1974). Strategy, structure, and economic performance. Boston:
Harvard University Press.
Rumelt, R. P. (1982). Diversification strategy and profitability. Strategic Management
Journal, 3(4), 359-369.
Saloner, G. (1985, April). Predation, mergers and incomplete information.
Department of Economics, Massachusetts Institute of Technology Working
Paper (No. 383). Retrieved from
http://dspace.mit.edu/bitstream/handle/1721.1/64140/predationmergers00salo.pdf
?sequence=1
289
Santalo, J., & Becerra, M. (2004). The effect of diversification on performance
revisited: Diversification discount, premium, or both? Instituto de Empresa
Business School Working Paper (No. 04-36). Retrieved from
http://latienda.ie.edu/working_papers_economia/WP04-36.pdf
Santos, J. B., & Brito, L. A. L. (2012). Toward a subjective measurement model for
firm performance. Brazilian Administration Review, 9(Special Issue), 95-117.
Sarina, M. N. (2010). The moderating effect of organizational structure and quality
practices on absortive capacity, technology compatibility and technology
transfer relationship. (Unpublished Doctoral dissertation). Universiti Utara
Malaysia.
Schmid, M. M., & Walter, I. (2008). Do financial conglomerates create or destroy
economic value? Retrieved from
http://www.cfr.org/content/thinktank/Depression/Walter_2.pdf
Schoech. (2006). Contingency theory. Retrieved from
http://wweb.uta.edu/projects/sswtech/6371/coursepack/theory-contingency.pdf
Sekaran, U. (2003). Research methods for business: A skill building approach (4th
edition). NJ: John Wiley and Sons.
Sekulić, V. (2009). Corporate strategy development and competitive advantage of
enterprise. Economics and Organization, 6(3), 269-279.
Shahida, S., & Sapiyi, S. (2013). Why do firms issue Sukuk over Bonds? Malaysian
evidence. Prosiding Perkem, 3(2), 551-573.
Sharma, S., Durand, R. M., & Gur-Arie, O. (1981). Identification and analysis of
moderator variables. Journal of Marketing Research, 13, 291-300.
290
Shieh, G. (2011). Clarifying the role of mean centring in multicollinearity of
interaction effects. British Journal of Mathematical and Statistical Psychology,
64, 462–477. doi:10.1111/j.2044-8317.2010.02002.x
Shuaib, F. S. (2012). The Islamic legal system in Malaysia. Pacific Rim Law and
Policy Journal. Retrieved from https://digital.law.washington.edu/dspace-
law/handle/1773.1/1094?show=full
Silverman, B. S. (1999). Technological resources and the direction of corporate
diversification: Toward an integration of the resource-based view and transaction
cost economics. Management Science, 45(8), 1109-1124.
Singh, M., Davidson, W. N., & Suchard, J-A. (2003). Corporate diversification
strategies and capital structure. The Quarterly Review of Economics and Finance,
43, 147–167.
Singh, M., Mathur, I., Gleason, K. C., & Etebari, A. (2001). An empirical
examination of the trend and performance implications of business
diversification. Journal of Business & Economic Studies, 7(2), 25-51.
Smandek, B., Barthel, A., Winkler, J., & Ulbig, P. (2010). Balance score card
implementation for IP rights management in a public research institution.
Measuring Business Excellence, 14(4), 65-75. doi: 10.1108/13683041011093767
Sohl, T. (2011). Within-Industry diversification and firm performance: Synergy
creation and capability development. Academy of Management Best Paper
Proceedings. doi: 10.5465/AMBPP.2011.65869643
Straub, D. W., Boudreau, M. C., & Gefen, D. (2004). Validation guidelines for IS
positivist research. Communications of the Association for Information Systems,
13, 380-427.
291
Sulaiman, M., Jili, A., & Sanda, A. U. (2001). Predicting corporate failure in
Malaysia: An application of the Logit Model to financial ratio analysis. Asian
Academy of Management Journal, 6(1), 99-118.
Symeou, P., & Kretschmer, T. (2012, June). Diversification and firm performance in
dynamic environments: The role of the firm’s dynamic capabilities and
absorptive capacity. Retrieved from
http://druid8.sit.aau.dk/acc_papers/q35k9nvmh1aeqv0xspxrpd0ymu5d.pdf.
Tabachnick, B. G., & Fidell, L. S. (2007). Using multivariate statistics (5th edition).
Boston: Pearson Education Inc.
Tallman, S., & Li, J. (1996). Effects of international diversity and product diversity on
the performance of multinational firms. Academy of Management Journal, 39(1),
179-196.
Tan, B. R. (2007). The influence of institutional environments on the relationship
between diversification and firm performance. (Doctoral dissertation). Retrieved
from Proquest Dissertations and Theses. (UMI 3290596).
Tan, B., Chang, H-C., & Lee, C-K. (2007). Relationships among industry
environment, diversification motivations and corporate performance: An
empirical study of the automobile industry in Taiwan. International Journal of
Commerce and Management, 17(4), 326-346. doi: 10.1108/10569210710844390
Tan, J. (2008). Privatization in Malaysia: Regulation, rent-seeking and policy failure
(volume 6). London: Routledge.
Teece, D. J. (1982). Towards an economic theory of the multiproduct firm. Journal of
Economic Behaviour and Organization, 3, 39-63.
Teece, D. J., Pisano, G., & Shuen, A. (1997). Dynamic capabilities and strategic
management. Strategic Management Journal, 18(7), 509-533.
292
Thillainathan, R. (1999). Corporate governance & restructuring in Malaysia: A
Review of markets, mechanisms, agents & the legal infrastructure. Retrieved
from
http://www.google.com/url?sa=t&rct=j&q=&esrc=s&source=web&cd=1&ved=0
CCUQFjAA&url=http%3A%2F%2Fwww.oecd.org%2Fdaf%2Fca%2Fcorporate
governanceprinciples%2F1931380.pdf&ei=U0AdU-
iTDJGWiQeezoHYBQ&usg=AFQjCNE7IVTfV8xVIczqYSxUdakTi94zeQ&bv
m=bv.62578216,d.aGc
Thompson, A. A., Peteraf, M. A., Gamble, J. E., & Strickland III, A. J. (2012).
Crafting and executing strategy (18th edition). NY: McGraw-Hill/Irwin.
Thomson Reuters (2012). Worldscope database - Data definitions guide (issue 14).
NY: Thomson Reuters.
Tufiş, P. (2012). Exploratory factor analysis – principal components analysis.
Retrieved from
http://www.tufis.ro/paula/QR/2012_files/QR2012_exploratory_factor_analysis.p
df
Varadarajan, P. R., & Ramanujam, V. (1987). Diversification and performance: A re-
examination using a new two-dimensional conceptualization of diversity in firms.
The Academy of Management Journal, 30(2), 380-393.
Varanasi, M. P. (2005). Diversification strategy and firm performance. IIMB
Management Review, September, 97-104.
Venkatraman, N., & Ramanujam, V. (1986). Measurement of business performance in
strategy research: A comparison of approaches. The Academy of Management
Review, 11(4), 801-814.
293
Villalonga, B. (2004). Diversification discount or premium? New evidence from the
business information tracking series. The Journal of Finance, 59(2), 479-506.
Wall, T. D., Michie, J., Patterson, M., Wood, S. J., Sheehan, M., Clegg, C. W. et al.
(2004). On the validity of subjective measures of company performance.
Personnel Psychology, 57, 95-118.
Walters, M. (1999). Performance measurement systems: A case study of customer
satisfaction. Facilities, 17(3/4), 97-104. doi: org/10.1108/02632779910256371
Wan, D., & Ong, C. H. (2005). Board structure, process and performance: Evidence
from public-listed companies in Singapore. Corporate Governance, 13(2), 277-
290.
Wang, C. L., & Ahmed, P. K. (2007). Dynamic capabilities: A review and research
agenda. The International Journal of Management Reviews, 9(1), 31-51.
doi: 10.1111/j.1468-2370.2007.00201.x
Warner, R. M. (2013). Applied statistics: From bivariate through multivariate
techniques (2nd edition). CA: Sage Publications Inc.
Wernerfelt, B. (1984). A resource-based view of the firm. Strategic Management
Journal, 5, 171-180.
Whitelaw, P. A. (2001). Reliability and validity: The terrible twins of good research.
Retrieved from
http://www.mlq.com.au/Research/Articles/Reliability_Validity_Article_Paul_Wh
itelaw.pdf
Wiersema, M. F., & Bowen, H. P. (2011). The relationship between international
diversification and firm performance: Why it remains a puzzle. Global Strategy
Journal, 1, 152–170. doi: 10.1111/j.2042-5805.2011.00005.x
294
Williamson, O. E. (1971). The vertical integration of production: Market failure
considerations. American Economic Review, 16, 112-123.
Williamson, O. E. (1998). Transaction cost economics: How it works; Where it is
headed. De Economist, 146(1), 23-58.
Wu, R-S. (2012). Agency theory and open-market share repurchases: Evidence from
Taiwan. Emerging Markets Finance & Trade, 48(2), 6-23. doi:
10.2753/REE1540-496X48S201
Yaghoubi, M., Abidin, S., & Yaeghoobi, E. (2011). Impact of diversification
strategies on performance of Malaysian public listed companies. Retrieved from
http://ssrn.com/abstract=1930145
Yusoff, W. F. W., & Amrstrong, A. (2012). What competencies should directors
possess? Malaysia perspective. International Journal of Business and
Management, 7(2), 142-149. doi:10.5539/ijbm.v7n2p142
Zahra, S. A. (1996). Technology strategy and financial performance: Examining the
moderating role of the firm's competitive environment. Journal of Business
Venturing, 11, 189-219. doi:10.1016/0883-9026(96)00001-8
Zaidi, M. F. A., & Othman, S. N. (2011). Understanding dynamic capability as an
ongoing concept for studying technological capability. International Journal of
Business and Social Science, 2(6), 224-234.
Zhao, J. (2010). Ownership structure and corporate diversification strategies of
Chinese business groups. Management Research Review, 33(12), 1101-1112. doi:
10.1108/01409171011092167
Zikmund, W. G. (2000). Business Research Methods (6th edition). USA: Harcourt.
Zikmund, W. G. (2003). Business Research Methods (7th edition). USA: Thomson.

295
Zollo, M., & Winter, S. G. (2002). Deliberate learning and the evolution of dynamic
capabilities. Organization Science, 13(3), 339-351.


