Embed Size (px)
Citation preview

Nissen, E. et al. (2009) The late Quaternary slip-rate of the Har-Us-Nuur fault (Mongolian Altai) from cosmogenic 10Be and luminescence dating. Earth and Planetary Science Letters, 286 (3-4). pp. 467-478. ISSN 0012-821X
http://eprints.gla.ac.uk/8470/ Deposited on: 3 December 2009
Enlighten – Research publications by members of the University of Glasgow http://eprints.gla.ac.uk

The late Quaternary slip-rate of the Har-Us-Nuur fault
(Mongolian Altai) from Cosmogenic 10Be and
Luminescence dating
Edwin Nissena,∗,1, Richard T. Walkera, Amgalan Bayasgalanb,Andrew Carterc, Morteza Fattahid,e, Erdenebat Molorb,
Christoph Schnabelf, A. Joshua Westa, Sheng Xug
aCentre for the Observation and Modelling of Earthquakes and Tectonics (COMET),Department of Earth Sciences, University of Oxford, Parks Road, Oxford OX1 3PR, UK
bMongolian University of Science and Technology, Ulaan Bataar, MongoliacSchool of Earth Sciences, Birkbeck College, London WC1E 7HX, UK
dOxford University Centre for the Environment, South Parks Road, Oxford OX1 3QY,UK
eInstitute of Geophysics, Tehran University, Kargar Shomali, Tehran, IranfNERC Cosmogenic Isotope Analysis Facility, East Kilbride G75 0QF, UK
gScottish Universities Environmental Research Centre, East Kilbride G75 0QF, UK
Abstract
The Altai range (western Mongolia) accommodates NNE-SSW short-ening across the northern India-Eurasia collision zone by dextralslip on faults trending NNW–SSE, and anticlockwise, vertical-axisrotations of fault-bounded blocks. However, fault slip-rates andthe way in which faulting evolves over time are poorly understood,and form the motivation for this study. We focussed on the Har-Us-Nuur fault, a major transpressional fault bounding the east-ern margin of the Altai. Three abandoned alluvial fan surfaces,each displaced right-laterally by the fault, were targeted for dat-ing with cosmogenic 10Be and quartz optically stimulated lumines-cence (OSL). The first surface (A2) shows an exponential decreasein 10Be with increasing depth, with a significant inherited compo-
∗Corresponding authorEmail addresses: [email protected] (Edwin Nissen)
1Now at COMET, Bullard Laboratories, Department of Earth Sciences, University ofCambridge, Madingley Road, Cambridge CB3 0EZ, UK
Preprint submitted to Earth and Planetary Science Letters November 18, 2009

E. Nissen et al .
nent. Modelling this profile yielded a minimum age of 74.1 ka.Material from the same sampling pit was dated at ∼19 ka withOSL, but we consider this younger age to be incorrect, possiblydue to feldspar contamination or abnormal quartz OSL character-istics. The A2 surface is displaced by 175 m, implying a (maximum)dextral slip-rate of 2.4 ± 0.4 mm yr−1. A second fan surface (F1)was dated at ∼6 ka with OSL and shows little variation in 10Be withdepth, consistent with this young age. The inherited componentis higher than for A2, indicating contrasting levels of inheritancefor different periods of fan aggradation. A final surface (F2) showsscattered 10Be concentrations and lacks material suitable for OSL,so cannot be dated precisely. Using the total vertical displacementacross the fault, we place the initiation of movement on the faultat ∼2 Ma, significantly later than the late Oligocene to Miocene(28–5 Ma) onset of shortening in the Altai region. This suggeststhat deformation in the Altai has widened over time to incorporatenew faults at the range margins (such as Har-Us-Nuur), possiblybecause older faults in the range interior have rotated about ver-tical axes into orientations that require work to be done againstgravity.
Key words: Active tectonics, Altai, fault slip-rates, Exposure dating, OSLdating
1. Introduction
Late Quaternary fault slip-rates are important indicators of seismic haz-ard and provide valuable constraints for models of continental deformation.The collision between India and Eurasia is a key testing ground for thesemodels (Avouac & Tapponnier, 1993; Peltzer & Saucier, 1996; Eng-land & Molnar, 1997, 2005; Holt et al., 2000; Liu & Bird, 2008),but quantitative slip-rate data are primarily concentrated in the southernand central parts of this zone, in and around the Tibetan plateau (earlypapers include Van der Woerd et al., 1998; Lasserre et al., 1999;and Brown et al., 2002) and the Tien Shan range (e.g. Burtmanet al., 1996; Brown et al., 1998; Thompson et al., 2002). North ofthe Tien Shan such data become very sparse, with the notable exceptionof the Gobi-Altai region in southern Mongolia (Ritz et al., 1995,

E. Nissen et al .
2003, 2006; Owen et al., 1999; Vassallo et al., 2005, 2007).This paper concerns the tectonics of the Mongolian-Altai range (hence-
forth termed the Altai), which forms the northernmost region of active short-ening within the collision zone, around 2500 km north of the Himalaya (inset,Fig. 1a). The style of faulting and occurrence of large magnitude earthquakesin the Altai are well documented (e.g. Baljinnyam et al., 1993), but until nowvery little is known about how fast these faults move on late Quaternarytime-scales, the frequency at which these large events happen, or how thedistribution of faulting has evolved through time. These questions are themotivation for this study.
We focus on the Har-Us-Nuur fault, a major, right-lateral strike-slip faultbounding the eastern margin of the Altai. The aim of the main part of thepaper is to determine its late Quaternary slip-rate. To measure slip-ratesaccurately, robust ages and displacements of offset geomorphic markers mustbe determined. A number of techniques are available to date these landforms;the choice of which to use depends on the type, lithology and approximateage of the feature under consideration, and often only one is applicable ata particular site. As such, it is relatively uncommon for separate datingmethods to be tested against one another. In this study, we determine the ageof alluvial fans offset by the Har-Us-Nuur fault using both in situ-producedcosmogenic 10Be and optically stimulated luminescence (OSL) dating. Thisis amongst the first, direct comparisons of these methods for datingalluvial fan deposits (Hetzel et al., 2004; Owen et al., 2006; DeLong& Arnold, 2007), and the first such study in Mongolia. By directlycomparing the two methods, we can explore the uncertainties andlimitations of each method in a way that would be impossible ifone alone were used.
In the final part of the paper, we combine the Har-Us-Nuur slip-rate withthe cumulative vertical displacement across the fault to estimate its age, andtherefore the onset of deformation in the eastern Altai. Our results havesignificant implications for the evolution of faulting in an important part ofthe Alpine-Himalayan belt.
2. Tectonic Setting
The Altai mountains are situated in western Mongolia and adjacent partsof China, Russia and Kazakhstan (Fig. 1a). According to GPS, the rangeaccommodates ∼7 mm yr−1 of NNE-directed shortening (Calais et al., 2003),

E. Nissen et al .
a significant proportion of the total ∼35–40 mm yr−1 India-Eurasia conver-gence, also constrained by GPS (e.g. Chen et al., 2000; Wang et al., 2001;Sella et al., 2002). The onset of India-related deformation in the Altai ispoorly constrained; coarsening sedimentation in basins in and around theAltai points to initial range uplift during the late Oligocene or early Miocene(Devyatkin, 1974, 1981; Howard et al., 2003), whilst apatite fission-track(AFT) modelling suggests Pliocene in the Russian Altai (De Grave & vanden Haute, 2002) and at the Baatar Hyarhan massif in the eastern Altai(Vassallo, 2006), but Miocene in the interior part of the Chinese Altai (Yuanet al., 2006).
In contrast with the Himalaya and Tien Shan to the south, where con-vergence is primarily accommodated by thrust faulting, shorteningacross the Altai is thought to be achieved by the anticlockwise vertical-axisrotations of N- to NW-trending dextral strike-slip faults (Baljinnyam et al.,1993; see also the schematic illustration in Fig. 9, Bayasgalan et al.,2005). This unusual style of convergence is probably influenced by the∼NW-trending structural grain of the Altai (Cunningham, 1998), which isinherited from the Palaeozoic accretion of continental fragments and arc ter-ranes (Sengor et al., 1993). Many of the right-lateral faults include a signifi-cant reverse component, thus contributing to long-term range uplift. Peaksare up to 4.5 km in elevation and often distinctively flat-topped. These sum-mit plateaus are remnants of a peneplain surface (Cunningham, 2001) whichformed over much of central Asia during the Jurassic, according to AFTthermochronology (Jolivet et al., 2007).
The active strike-slip faults are distributed throughout the Altai and are aknown source of large magnitude earthquakes. Modern examples, labelled onFig. 1a, are the 1931 Ms 8.0 Fu-Yun earthquake in the SW Altai (Baljinnyamet al., 1993) and the 2003 Mw 7.3 Chuya earthquake in the NW part of therange (Nissen et al., 2007). Clear prehistoric ruptures are observed on manyother faults (Khil’ko et al., 1985; Baljinnyam et al., 1993; Walker et al.,2006), their long-term preservation enhanced by the cold, semi-arid climateand sparse population.
To date, the only quantitative slip-rates in the Altai are fromVassallo (2006) and Nissen et al. (2009). Vassallo (2006) estab-lished minimum horizontal rates of ∼0.5 mm yr−1 and ∼1.2 mm yr−1
along the northern and southern Olgiy-Hovd fault, based on cos-mogenic 10Be dating (Fig. 1a). Nissen et al. (2009) used OSL todetermine vertical displacement rates of ∼0.15–0.35 mm yr−1 across

E. Nissen et al .
thrusts bounding Baatar Hyarhan in the eastern Altai.
2.1. Overview of the Har-Us-Nuur fault
Around 500 km long (∼45◦–50◦ N), the Har-Us-Nuur fault trends NNW–SSE through relatively low terrain along the eastern margin of the Altai,adjacent to the Depression of Great Lakes (Fig. 1a). At its northern end(∼49◦–50◦ N), the fault splits into a number of parallel strands. The west-ernmost of these, the Jid fault, was studied in detail by Walker et al. (2006).They described an en echelon, left-stepping arrangement of partially-infilledtension fissures, caused by the most recent earthquake here. The age of theearthquake was bracketed at 870–980 years from OSL dating of trench mate-rial; slip of ∼5 m was determined from the size and orientation of the fissures;and the rupture length was estimated at ∼90 km. Using earthquake scalingrelationships, the authors estimated a moment magnitude of ∼7.4.
Khil’ko et al. (1985) described similar ruptures along part of the southern-most Har-Us-Nuur fault, also known as the Tonhil fault (∼45◦–46◦ N). Theestimated coseismic slip (∼2.5 m) and rupture length (∼25 km) are consis-tent with a moment magnitude of ∼6.9. Although not actually dated, theseruptures were tentatively assigned an age of 500–1000 years by the authors.
In contrast with the northern and southern sections, the central part ofthe Har-Us-Nuur fault (∼46◦–49◦ N) has until now been overlooked, despiteit representing an important source of seismic hazard for Hovd (the largesttown in western Mongolia, ∼50 km to the west). We focussed on the areasouth of Har-Us-Nuur lake (∼47.5◦–48◦ N), where a major restraining-bend– introduced by a change in fault strike – has uplifted the ∼3800 m-highJargalant-Nuruu massif (Fig. 1b). The Har-Us-Nuur fault bounds the easternmargin of these mountains.
3. Late Quaternary slip-rate
3.1. Site descriptions and offsets
South of Har-Us-Nuur lake, the Har-Us-Nuur fault beheads a series of al-luvial fans deposited along the eastern margin of the Jargalant-Nuruu massif(Fig. 2). Streams exiting the range bend sharply northwards toward Har-Us-Nuur lake, which constitutes the local base-level. In the northern part ofthis section, 15 m-pixel Advanced Spaceborne Thermal Emission and Reflec-tion Radiometer (ASTER) and 2.5 m-pixel Satellite Pour l’Observation dela Terre (SPOT-5) images show six light-coloured fan systems sourced from

E. Nissen et al .
granitic bedrock in the interior part of Jargalant-Nuruu (Fig. 2). Withinthese systems, incised, abandoned fan surfaces have been displaced right-laterally from the catchment outlets that fed them. The elevation of therange-front increases southwards so these displacements are in an uphill di-rection and can only have been caused by dextral slip on the Har-Us-Nuurfault. Sourced from granitic bedrock, the displaced surfaces are quartz-richand thus an obvious target for exposure dating with cosmogenic 10Be.
We visited each of these alluvial fan systems during fieldworkin Summer 2006. From north to south, we refer to them as A–F (Fig. 2b).Detailed SPOT images of individual systems are shown in Figs. 3–5. Mostsystems contain an active fan (labeled A1, B1 etc.), although the youngestsurface in the southernmost system (F1) shows minor incision by the activechannel (Fig. 5). In contrast, the older, abandoned set of surfaces – A2, B2etc. – are crossed by networks of incised runnels. These channels, up to afew metres wide and one or two deep, contain dark material sourced frommafic bedrock along the adjacent range-front. In fan system F, the erodedremnants of two even older surfaces (F3 and F4), with deeper and widerrunnels, are also preserved (Fig. 5).
Away from the runnels the A2–F2 fan surfaces are typically composedof gravel-sized clasts, although there are rare boulders up to ∼50 cm indiameter. The surface-tops are planar in form and the occasionalboulders are coated with desert varnish, except for the lowest fewcentimeters of exposure which are varnish free. These observationsare consistent with only minor erosion of the surface tops. In the SPOTimages, the older surfaces all appear lighter in colour than the younger set(Figs. 3–5). This colour difference may reflect weathering or soil developmentover time, or, alternatively, a systematic change in sediment supply betweenone period of aggradation and the next (with older fans containing higherproportions of granitic material than younger ones).
The older set of surfaces (A2–F2) all show right-lateral offsets from thecatchment outlets that supplied them. However, measuring these displace-ments is not trivial, because the extents of each fan may have been altered byerosion since they were originally deposited. This is of particular concern forB2, which appears as several, separate patches (Fig. 4a), and C2, D2 and E2,whose margins are not always clearly delineated from surrounding material(Fig. 4b–d). Instead, we focus on quantifying the offsets of A2 and F2, whichare relatively extensive and easily distinguishable from surrounding sediment(Figs 3 & 5); these fans were also targeted for dating (Sections 3.2 & 3.3).

E. Nissen et al .
The extents of A2 and F2 are still likely to have been altered by erosion sincedeposition, particularly along their northern margins, which are exposed tothe active feeder streams. We therefore focus on reconstructing their southernmargins (which are probably more intact), estimating displacements relativeto the southern edges of the feeder valleys at their outlets.
The southern margin of A2 is visible only to within ∼50 m of the fault;closer than this, the A2 fan is masked (or has been eroded) by darker, maficmaterial shed from the range-front (Fig. 3a, c). To estimate the A2 dis-placement, we first extrapolate its southern margin back to thefault (white dotted line, Fig. 3b). To restore this margin againstthe southern edge of the feeder valley requires a displacement of175 m. We assign error margins of ±30 m to this figure, to reflectthe uncertainty in extrapolating the southern margin of A2 backto the fault (Fig. 3b). The displacement of A2 is thus estimated tobe 175 ± 30 m.
The precise extents of F2 are also unclear close to the fault.West of the fault, on the southern side of the feeder valley, weinterpret a small patch of older material as belonging to F2, butwe cannot precisely constrain its southern edge (Fig. 5a,c). Thisleads to an uncertainty in where to assign the southern edge ofthe feeder catchment. Equally, a small pressure ridge disguises theprecise location of the southern margin of F2 on the eastern sideof the fault. We estimate the displacement of the southern marginof F2 to be 140 ± 40 m, with the error bounds reflecting theseuncertainties.
Our estimated displacements for A2 and F2 agree to withinerror. Furthermore, restoring the other abandoned fans (B2–E2)using a ∼160 m displacement – consistent with the bounds for A2and F2 – gives rise to plausible reconstructions (Fig. 4b, d). Theoffsets are therefore consistent with the contemporaneous deposition of all sixsurfaces. This implies that periods of fan-building are controlled by climate,which is unlikely to vary significantly over the small geographical area andnarrow elevation range (∼1275–1400 m) represented by the fan systems. Aclose relationship between climate and periods of alluvial fan deposition andabandonment is also observed in the Gobi-Altai range, where pulses of fanaggradation – correlated over areas many tens of kilometers wide – werepromoted at the transitions from cold, dry, glacial periods to warmer, wetterinterglacials (Vassallo et al., 2005; Ritz et al., 2006).

E. Nissen et al .
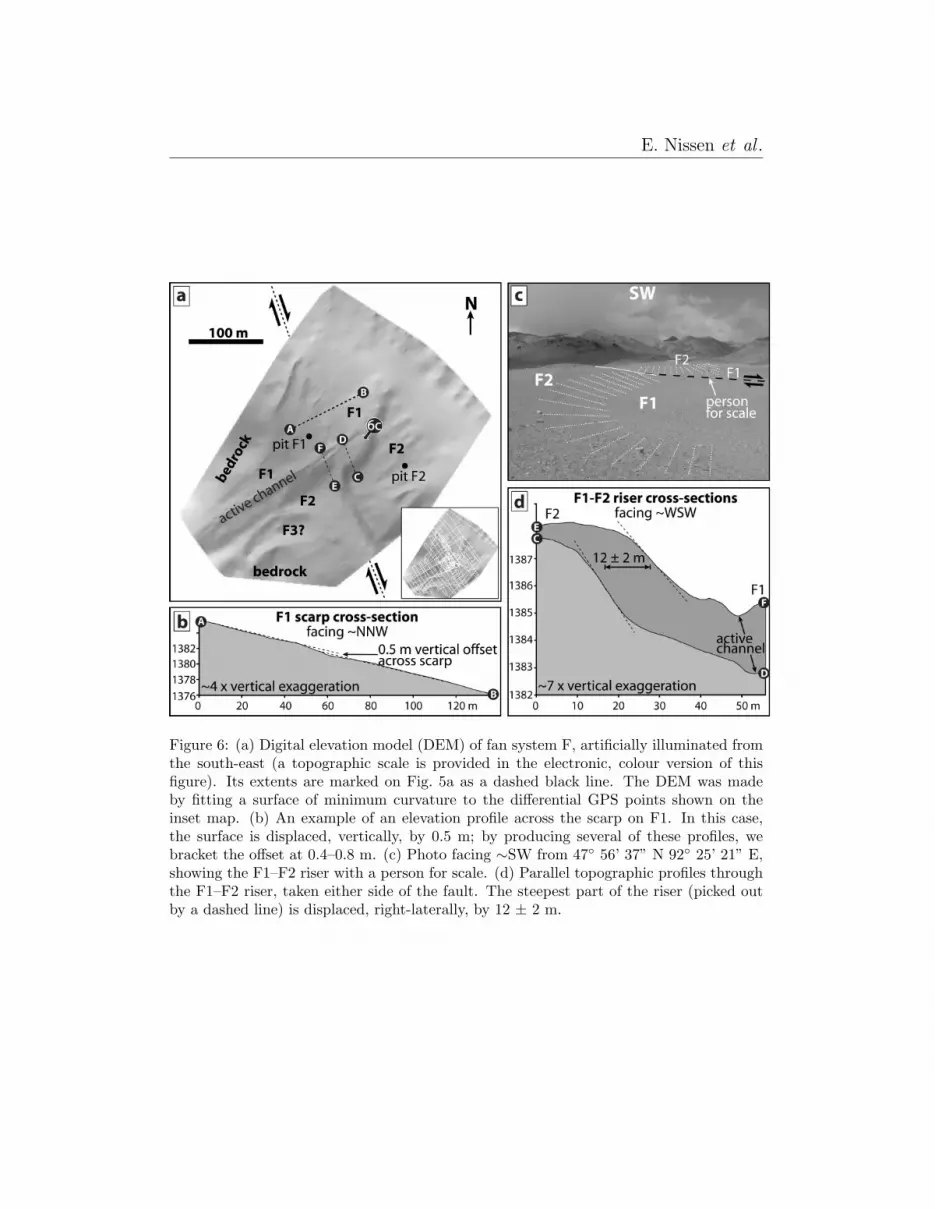
On the southernmost fan system we also observe some younger displace-ments. Firstly, a clear scarp is preserved across F1, along the line of thefault (Fig. 5a). Secondly, the riser between F1 and F2 preserves a right-lateral displacement along the fault (Fig. 6c). This offset is much smallerthan the overall ∼140 m displacement of the southern edge of F2 (Fig. 5b);the riser must have been refreshed F2 abandonment, and we assume that theoffset dates from F1 abandonment, instead.
To measure these displacements, we constructed a digital elevation model(DEM) of fan system F using differential GPS (Fig. 6a). From a series ofelevation profiles through this DEM (e.g. Fig. 6c), the vertical offset acrossthe scarp is 0.4–0.8 m. Parallel profiles taken either side of the fault acrossthe F1–F2 riser show an apparent dextral offset of 12 ± 2 m (Fig. 6d).However, these profiles also show that the riser is steeper on the eastern sideof the fault (profile C–D) than on the western side (E–F). This suggests thatthe riser was refreshed more recently on the eastern side, giving rise to anadditional uncertainty in the slip-rate derived from this offset (Section 3.5).
3.2. In situ-produced cosmogenic 10Be exposure dating
To calculate the Har-Us-Nuur fault slip-rate, we constrained the timingof alluvial fan abandonment using exposure dating with in situ-producedcosmogenic 10Be (e.g. Nishiizumi et al., 1986). This rare, long-lived isotopeis generated within surficial quartz grains by interactions with cosmic rays.Its production rate is a function of latitude and altitude, and also decreasesexponentially with overlying mass so that at depths of a few metres negligi-ble amounts are generated. After a quartz-bearing rock is exposed its 10Becontent will increase over time until eventually a steady-state equilibriumbetween production and decay (plus loss through erosion) is reached (Lal,1991). Providing this equilibrium is not yet achieved, measurements of 10Beconcentrations can therefore be used to establish the age at which the rockwas exposed. This method has become an important way of determining thetiming of alluvial fan abandonment in arid, mountain environments whereorganic material (for 14C dating) or fine-grained sediment (for luminescencedating) is often unavailable (e.g. Ritz et al., 1995).
The 10Be contained in any one quartz grain may include a significant por-tion obtained prior to deposition – during hillslope exhumation and transportwithin the catchment area – and the age of fan abandonment can be over-estimated if this inherited component is not recognized (Anderson et al.,

E. Nissen et al .
1996). There are two methods by which this can be done. In the first, sam-ples are taken from the bed of the active feeder stream, which is not yetabandoned and whose 10Be concentration is effectively derived entirely frompre-depositional exposure. These measurements are then used to correct forthe concentrations of individual boulders sampled from the surface of thealluvial fan (Brown et al., 1998). This approach relies on an assumption thatthe pre-depositional history of clasts in the active channel is similar to that ofthe material making up the older, abandoned surfaces. As such, this methodmay be unsuitable for the Jargalant-Nuruu fans, where erosional conditionsduring fan deposition were probably more intense than at present.
A second strategy involves samples being taken not just from the surface,but from several depths within the deposit to be dated (Repka et al., 1997).In this method, each sample should consist of many separate, small clastsso that individual clast exposure histories are averaged. Providing there isno significant variation in inherited 10Be over time, concentrations shoulddecrease exponentially with depth. The average inherited component is thendetermined from the asymptotic value that the profile tends to at depth.
In addition to the inherited 10Be, one must also account for any surfaceerosion the deposit has undergone between deposition and the time of sam-pling. A high surface erosion rate equates to an increased level of shieldingin the past, and will act to reduce the 10Be content of the material now ex-posed. If the surface erosion rate is unknown, a minimum exposure age canbe established by assuming no erosion. Otherwise the erosion rate can beestimated by comparing the shape of vertical profiles of 10Be with theoreticalcurves calculated with known erosion rates (Siame et al., 2004; Ritz et al.,2006).
In this study we targeted A2, F1 and F2 for exposure dating, using thevertical distribution of 10Be, averaged (at each depth) over many clasts. A2 m-deep sampling pit was excavated on each surface, at a location carefullychosen to avoid signs of recent erosion or deposition – in particular the runnelson A2 and F2, and the active stream incising into F1 (as well as some smalldebris flows that overtopped this channel). We measured 10Be concentrationsfor eight samples (each comprising >100 clasts) from each pit, at 25 cmintervals from the surface down to 1.75 m. The sample locations, samplingprocedure, sample preparation, and AMS measurements, are described indetail in the supplementary material. Final, vertical profiles of 10Be areshown in Fig. 7.

E. Nissen et al .
3.2.1. A2 fan
Sediment exposed in the A2 pit comprises angular to sub-angular coarsegravels and pebbles of quartz-rich granite or mafic composition. The materialis uncemented and shows only subtle stratification, although there is a clearlayer of soft sand with occasional pebbles exposed in one pit wall at 50–70 cmdepth (we use this fine-grained material for OSL dating in Section 3.3).
Averaged 10Be concentrations decrease from ∼12 × 105 at g−1 at thesurface down to ∼4 × 10⁵ atoms g−1 at a depth of 125 cm, but then rise to∼7 × 10⁵ atoms g−1 for the 150 cm and 175 cm samples (Fig. 7a). The pitwas situated close to the southern edge of the fan, and we probably excavatedthrough A2 into an older deposit below, from which this final pair of sampleswas taken. There is no well-developed paleosol at the boundary of these twolayers (at 125–150 cm); if our interpretation is correct, this suggests thatthe surface of the older deposit was removed when the younger material wasdeposited.
To determine the A2 exposure age we used a chi-squared inversion thatminimises the difference between observed 10Be concentrations and verticalprofiles predicted by theory (Siame et al., 2004). Details of this technique, to-gether with the values we used for the production rates, attenuation lengths,decay constant, and sediment density, are provided in the supplementarymaterial. We assumed that the deepest pair of samples belong to anolder deposit, and used only the upper six samples in the inversion.In addition, material collected from the surface may have a more complexhistory than buried clasts (for instance, they are more likely to have beendisturbed through bioturbation), so we also halved the weighting given tothe 0 cm sample.
We began by assuming a zero surface erosion-rate and, testing a rangeof values for the inherited 10Be component, solving for the best-fit exposureage. Assuming zero inheritance yielded an age of 93.6 ka but witha poor fit to the data (dotted line, Fig. 7a). The best match betweenobserved and modelled concentrations, satisfying the 1σ analytical errorsof all six samples, is for an inheritance of 1.40 × 10⁵ atoms g−1 and anage of 74.1 ka (solid line, Fig. 7a). Finally, we tested an inheritance of4.0 × 105 atoms g−1, which is the value we estimate for the younger,F1 fan (see below). This provided an age of 38.1 ka but with a poorfit to the data (Fig. 7a).
Next, using our best-fit value for the inherited 10Be component (1.40× 10⁵

E. Nissen et al .
atoms g−1), we modelled the data again but with the erosion rate now free tovary. The best match between observed and modelled concentrations (witha marginally lower χ2 value than for no erosion) is for an erosion rate of2.5 m Ma−1 and an age of 80.7 ka; this model distribution lies very close tothe 74.1 ka profile and so is not plotted separately on Fig. 7a. A good fit tothe data can also be achieved at even greater ages, using higher erosion rates.This is demonstrated by a contour plot of χ2 values for a range of ages anderosion rates (Fig. 7b); the pronounced trough of low χ2 values demonstratesa strong trade-off between the two parameters. However, because onlysmall amounts of erosion are likely to have occurred (Section 3.1),we consider the original model age of 74.1 ka to be close to thetrue age, even though it formally represents a minimum value.
3.2.2. F1 fan
In general, sediment exposed in the F1 pit closely resembles that of A2.Also like A2, a layer of soft sand is exposed in one of the F1 pit walls, ata depth of 80-90 cm. The F1 pit also contains a distinctive layer of largercobbles, up to ∼10 cm in diameter, at 30 cm depth.
F1 shows no clear decrease in 10Be concentrations with depth, and allbut one measurement falls close to 4 × 10⁵ atoms g−1 (Fig. 7b). This im-plies that levels of 10Be are dominated by the inherited component, with onlysmall amounts of additional 10Be produced since deposition. This inheritedcomponent is likely to be around 4 × 10⁵ atoms g−1, significantlyhigher than the value of 1.40 × 10⁵ atoms g−1 estimated for A2.The catchment areas of the A and F fan systems are similar insize and elevation; this discrepancy therefore suggests that hills-lope erosion rates were lower and/or transport times longer duringF1 deposition than for during A2 deposition. The anomalously lowconcentration in the 30 cm sample may reflect the unusually large size (andpresumably shorter transport times) of clasts within this particular horizon.
F1 is clearly younger than A2 or F2, but analytical errors are too largeand the data too scattered (even discounting the 30 cm sample) for us toprecisely constrain its age. Fig. 7c shows forward modelled 10Be profiles, forages of 0 ka, 5 ka and 10 ka, each with an inheritance of 4.0 × 10⁵ atoms g−1.The relatively poor fit of the 10 ka curve implies a younger age, but thescatter in the data is too high to provide firm constraints.

E. Nissen et al .
3.2.3. F2 fan
Material in the F2 pit is somewhat finer grained than in A2 or F1, com-prising angular to sub-angular gravels with rare cobbles. Like the other pitsthe sediment shows only subtle stratification, with no clear paleosols. Clastsare again either mafic or granitic, but the latter material contains abundantK-feldspar and is less quartz-rich than granite clasts in the other pits (pre-sumably reflecting the variability of the granitic source in Jargalant-Nuruu).
Only five of the F2 samples yielded measurable 10Be concentrations.These vary from ∼4× 10⁵ atoms g−1 up to ∼9 × 10⁵ atoms g−1, but there isno simple, exponential decay with depth (as there is for A2). To start with,we modelled the shallowest four samples under an assumption of no erosion.Because F2 is probably contemporaneous with A2, and becausethe two fans are close geographically and in elevation, we also as-sume an inheritance of 1.40 × 10⁵ atoms g−1, which is the best-fitvalue for A2. This yielded a best-fit age of 50.8 ka (dotted line,Fig. 7d). By discounting the surface sample, which is most likely to havebeen contaminated or disturbed (e.g. by bioturbation), a much-improved fitwas found for the middle three samples, corresponding to an age of 66.9 ka(dashed line, Fig. 7c). This figure is close to the 74.1 ka age for A2; however,because of the overall scatter in the F2 profile we use the modelled profilesas approximate guides only, and prefer not to assign F2 a formal exposureage.
The 10Be profiles from A2 and F1 suggest only small variations in inher-itance (averaged over many clasts) within any one episode of fan aggrada-tion. The large scatter in F2 10Be concentrations is therefore best explainedby pulses of fan-building, with at least three separate stages of aggradation.There are no well-developed paleosols in the F2 pit; however, as we suggestfor A2, any soil that developed following an earlier stage of fan-building mayhave been eroded when the next pulse of sediment was deposited.
3.3. Optically Stimulated Luminescence (OSL) dating
Optically Stimulated Luminescence (OSL) provides an alternative and in-dependent method of determining the age at which quartz-bearing sedimentswere deposited (e.g. Huntley et al., 1985). Subjected to natural radioactivity,electrons within quartz grains are displaced from their position within themineral lattice and become stored in nearby lattice defects. These trappedelectrons are released during prolonged exposure to sunlight, but can begin toaccumulate once the grains are buried. Stimulating samples of buried quartz

E. Nissen et al .
with light in the laboratory releases the trapped electrons together with pho-tons (‘luminescence’). By comparing this natural OSL with the luminescencesignals produced after the material is given known laboratory radiation doses,the total radiation received during burial (or ‘equivalent dose’, De) can beestablished. Meanwhile the dose rate received during burial is determinedusing measurements of radioactive U, Th and K in the surrounding sedimentand from estimates of cosmic radiation. The age at which the sediment sam-ple was last exposed to sunlight is then calculated by dividing the equivalentdose by the dose rate.
Fine-grained aeolian or fluvial sediments are preferred for OSL dating, be-cause they are more likely to have undergone prolonged exposure to sunlightduring transport, thus resetting the luminescence clock prior to deposition;if the grains were not fully bleached before burial then the true age of de-position can be over-estimated. The coarse gravels and pebbles within ourthree 10Be sampling pits are therefore a poor choice of material for OSLdating. However, the A2 and F1 pits each contain a lens-shaped layer ofhomogeneous, soft sand, exposed on one pit wall (at depths of 50–70 cmand 80–90 cm, respectively). We interpret these as having been depositedby small, low-energy streams within the fan systems. If this interpretationis correct then grains probably underwent significant exposure to sunlightduring transport, opening up the possibility of dating their burial with OSL.
We collected three samples from these sand layers – two from A2 and onefrom F1 – for quartz OSL dating. The dose rate received during burial wascalculated using estimates of the cosmic-ray dose rate and from measurementsof radioactive U, Th and K. All sampling and laboratory procedures areoutlined in the supplementary material. For each sample, OSL was measuredfor between 11 and 14 aliquots; individual De values (in Grays) are plotted inFig. 8 together with an overall probability density function. Weighted meanDe values and dose rates are shown in Table 1.
3.3.1. A2 fan
Two separate samples were collected from the sand layer in the A2 pit.For sample A2a, De values agree to within error for seven out of the elevenaliquots, producing a well-defined peak in dose distributions (Fig. 8a). Theremaining four aliquots show significantly higher De values, suggesting thatnot all grains were completely reset before deposition. Using the weightedmean De, 70.4 ± 12.4 Gy (Table 1), we calculated an age of 18.8 ± 3.5 ka(with 1σ error bounds). If the first peak in dose distributions (∼65 Gy)

E. Nissen et al .
is used (rather than the weighted mean De), a lower age of ∼17 kais attained.
De values for sample A2b are distributed in three clusters (Fig. 8b). Usingthe weighted mean De, 73.4 ± 31.0 Gy, we calculated an age of 19.8 ± 8.5 ka,consistent with that of A2a. If the higher dose distribution peaks areassumed to represent incompletely bleached sediment, and onlythe lowest cluster (∼60 Gy) used, an age of ∼16 ka is attained.
These age estimates are much younger than the minimum exposure age(74.1 ka) calculated from modelling 10Be concentrations from the same pit(Section 3.2.1). We discuss possible origins for this discrepancy in Section 3.4.
3.3.2. F1 fan
Equivalent doses for F1 aliquots show an even spread from 20–32 Gy, ex-cept for two aliquots that register higher values (Fig. 8c). Using the weightedmean De, 28.8 ± 7.5 Gy, we calculated an age of 6.3 ± 1.7 ka, consistentwith the young ages expected from the distribution of 10Be in the same pit(Section 3.2.2).
3.4. Discrepancy in A2 age estimates
Before determining the fault slip-rate, we first consider the ori-gin of the discrepancy between the A2 minimum exposure age(74.1 ka) and the A2 OSL ages (18.8 ± 3.5 ka and 19.8 ± 8.5 ka). Be-sides being crucial for our slip-rate calculations, this discrepancyhas implications for other studies in which alluvial deposits aredated with these methods, especially considering that direct com-parisons between exposure and luminescence ages are rare (Hetzelet al., 2004; Owen et al., 2006; DeLong & Arnold, 2007). Inter-estingly, Hetzel et al. (2004) also determine a much younger ageusing OSL (∼50 ka) than with 10Be (∼90 ka), for a faulted alluvialfan in the Qilian Shan (China). On the other hand, Owen et al.(2006) and DeLong & Arnold (2007) find OSL ages consistent withthose from cosmogenic radionuclides for fans in the Kunlun Shan(China) and California, respectively.
The calculated exposure age for A2 relies on the assumptionthat the inherited 10Be component, averaged over many individualclasts, is constant within the six samples used in the inversion. Ifthere was a fluctuation in this component as the fan was deposited,

E. Nissen et al .
then the true exposure age could be different from the value pro-vided by our modelled distribution. However, 10Be concentrationsin the younger, F1 fan suggest that the average inheritance re-mained relatively constant during the course of F1 deposition. Asignificant fluctuation in inheritance during A2 deposition is there-fore unlikely, and we consider the minimum exposure age of 74.1 kato be robust.
The alternative interpretation for the discrepancy, which weconsider more likely, is that we have under-estimated the A2 burialage using OSL. We can think of four possible explanations, outlinedbelow.
The first possibility is that sediment was partially bleached af-ter burial. Severe burrowing by animals could potentially achievethis; however, in each of the sampling pits the stratigraphy appearsintact, making this scenario unlikely. During sampling itself, onlythe ends of the sampling tube could have undergone any exposure.We cannot rule out the possibility that sediment shifted withinthe sampling tubes during transport – such that bleached grainsat the tube ends were mixed in with the pristine material in thecentral part of the tubes, which was used for the OSL measure-ments. However, measures were taken to minimise such mixing(supplementary material) so this explanation is also improbable.
A second option is that measurements of radioactive K, U andTh within our samples – from which the dose-rate received duringburial was estimated – are unrepresentative of the sediment as awhole. However, dose rates from A2a and A2b are consistent withone another, making this explanation unlikely.
A third possibility is that an OSL signal from a thermally-unstable feldspar component was measured (along with the quartzOSL) during sample stimulation, leading to OSL age under-estimation.Our samples were initially rich in feldspar and although we fol-lowed rigorous procedures to isolate quartz (supplementary ma-terial), a small fraction of feldspar may have remained. A highbackground OSL observed in the last seconds of typical stimula-tion cycles (Fig. 1a, supplementary material) is consistent withthis scenario, although too few grains were left following quartzisolation for us to to conclusively establish (or rule out) feldsparcontamination with further tests on the same samples. We note

E. Nissen et al .
that a similar explanation was considered by Hetzel et al. (2004)to account for their young OSL age, although the authors did notfurther investigate their age discrepancy.
Even if the quartz signal was succefully isolated, there is one fur-ther possible origin for the young OSL ages. Quartz samples frommountain environments in which grains have experienced ratherlimited environmental histories have sometimes shown abnormalOSL characteristics, including low thermal stability, which can re-sult in age underestimation when standard OSL methodology isused (e.g. Klasen, 2008). We also note that Owen et al. (1999)found low quartz sensitivities in sediment samples from the Gobi-Altai (southern Mongolia), suggesting that there may be a regional-scale problem using standard protocol OSL.
Unfortunately, because only a small amount of quartz was leftfollowing laboratory quartz isolation procedures, we were unableto follow up the last two possibilities with further tests. However,we will collect more samples from A2 in the future, and use theseto investigate the origin of the young OSL ages in more detail.
3.5. Slip-rate
To calculate the slip-rate, we divided the displacement of the A2fan (175 ± 30 m) by our preferred A2 age (74.1 ka). This yielded ahorizontal (right-lateral) slip-rate of 2.4 ± 0.4 mm yr−1. Formallythis is a maximum slip-rate as it is based on a minimum exposureage, calculated under an assumption of no erosion. However, thetrue age is probably close to the minimum age (Section 3.2.1),so the true slip-rate probably lies close to this formal maximumrate. In the supplementary material, we combine this slip-rate withinformation from prehistoric earthquake ruptures – observed on anearby section of the fault and described here for the first time– to estimate the earthquake recurrence interval on the centralHar-Us-Nuur fault.
Note that if the A2 OSL ages of (∼19 ka) were instead used,a horizontal slip-rate of ∼9 mm yr−1 would be attained. This isgreater than the ∼7 mm yr−1 shortening rate across the wholeAltai range (Calais et al., 2003). Considering that there are manyother active faults within the Altai, such a high slip-rate is very

E. Nissen et al .
unlikely. This supports our view that the A2 OSL ages are tooyoung.
We can also estimate horizontal and vertical slip-rates using the displace-ments measured on fan system F. Assuming the 12 ± 2 m displacement ofthe F1–F2 riser dates from F1 abandonment, and using the luminescenceage for sample F1 (6.3 ± 1.7 ka), we calculate a horizontal slip-rate of 1.3–3.0 mm yr−1, with a preferred value of 1.9 mm yr−1. Although we cannotbe certain that the riser was completely reset before F1 abandonment (Sec-tion 3.1), this figure is consistent with the ∼2.4 mm yr−1 slip-rate calculatedwith the A2 exposure age. Finally, dividing the 0.4–0.8 m vertical displace-ment across the F1 scarp by the 6.3 ± 1.7 ka OSL age provides a verticalslip-rate of 0.05–0.17 mm yr−1, with a preferred value of 0.10 mm yr−1.
4. Discussion
We now discuss the onset of movement on the Har-Us-Nuur fault, andinvestigate implications for the evolution of faulting and topography acrossthe Altai range.
The initiation of strike slip on the Har-Us-Nuur fault is linked to theonset of mountain-building within its restraining bends – including Jargalant-Nuruu within our study area (Fig. 1b). Bedrock samples collected from atransect of this massif contained too little apatite for us to constrain lateCenozoic uplift and exhumation with apatite (U-Th)/He thermochronology(supplementary material). However, we can provide a crude measure of theage of the Har-Us-Nuur fault by dividing the cumulative slip by the lateQuaternary slip-rate. The fault strikes parallel to the structural trend of theAltai, and there are no clear lithological offsets with which to measure thetotal strike-slip motion. However, low-lying bedrock exposed around 20 kmeast of Jargalant-Nuruu is at an elevation of 1500–1600 m, while within therange the peneplain surface is at about 3500 m. This suggests a cumulativethrow of ∼2000 m across the fault.
At the alluvial fans studied in Section 3, the Har-Us-Nuur fault strikes∼162◦ and has a horizontal slip-rate of 2.4 ± 0.4 mm yr−1. Adjacent to thehighest part of Jargalant-Nuruu the fault strikes 148◦, giving a shorteningcomponent of ∼0.5–0.7 mm yr−1. Although we found no clear exposure ofthe fault in the sides of river valleys exiting the range, the trace of the faultacross the range-front topography suggests a dip of ∼60◦ W, giving a verticaldisplacement rate of ∼0.8–1.2 mm yr−1 adjacent to the highest part of the

E. Nissen et al .
range. At this rate, the 2000 m throw on the fault would be achieved in1.7–2.4 Ma.
Although this is a crude estimate, it is much younger than initial India-related uplift in the Altai region as a whole, which is thought to date fromthe late Oligocene to Miocene, or ∼28–5 Ma (Section 2). This implies eitherthat active deformation migrated to the Har-Us-Nuur fault from elsewherewithin the range, or that the deforming zone has widened over time. Thisresult agrees with AFT analyses which show Pliocene cooling ages at BaatarHyarhan in the eastern Altai (Vassallo, 2006), but Miocene cooling ages inthe interior part of the Chinese Altai (Yuan et al., 2006).
The interior part of the Altai contains more continuous mountainous ter-rain than along the Har-Us-Nuur fault (Fig. 1a), and is an obvious choice forthe focus of earlier deformation. If faults in the range interior are, indeed,older, then they have probably rotated further about vertical axes in orderto accommodate overall convergence; this is illustrated by the difference instrike between the 2003 Chuya earthquake in the interior, north-western Al-tai (∼WNW) and the 1931 Fu-Yun earthquake along the western margin ofthe range (∼NNW; Fig. 1a). These rotations place older faults in the rangeinterior at a higher angle to the regional convergence direction and givesthem a relatively large component of shortening. Topography produced bythis dip-slip component in turn increases the normal stresses acting on thefaults, promoting the switching of deformation onto younger strike-slip faultswith favourable orientations. New faults forming in high areas, where thetopography is already elevated, would need to do more work against gravityin order to accommodate convergence than faults in low-lying regions. Thishighlights a possible mechanism for the migration or widening of deformationonto faults in low areas at the range margins, such as the Har-Us-Nuur fault.
5. Conclusions
The maximum late Quaternary right-lateral slip rate of theHar-Us-Nuur fault, along the eastern margin of the Altai range,is ∼2.4 mm yr−1. Assuming this figure can be extrapolated overlonger periods, the onset of movement on the fault was at ∼2 Ma,significantly later than the initial uplift of the Altai in the lateOligocene to Miocene (28–5 Ma). These results suggest that de-formation in the Altai has widened over time to incorporate faultsat the margins of the range. This might be because older faults

E. Nissen et al .
in the high, range interior have rotated about vertical axes intoorientations that require work to be done against gravity.
6. Acknowledgments
This work was supported by a NERC studentship to Edwin Nissen andNERC funding of COMET. SPOT imagery was acquired through the OA-SIS programme. We are very grateful to Dr Tien and Dr Zhang (Chi-nese Earthquake Administration) for their contributions in the field; to ourdriver, Baatar; student helpers, Baatar, Buyanaa, Deegii, Esukhei and Jakii;Ganbold (in Hovd); and Chimgee and Altan (in Ulaan Baatar). OwenGreen, Derek Preston, Steve Wyatt, Jason Day and Allan Davidson helped inpreparing 10Be samples, and we thank Lanny McHargue for calculating nor-malised measured 10Be/9Be ratios from the raw data. Weighted mean equiv-alent doses were calculated with the Analyst program, courtesy of ProfessorGeoff Duller. Finally, we thank Jean-Francois Ritz, Conall Mac Niocaill, andtwo anonymous reviewers for their detailed and constructive comments.

E. Nissen et al .
References
Anderson, R. S., Repka, J. L., & Dick, G. S., 1996. Explicit treatment ofinheritance in dating depositional surfaces using in situ 10Be and 26Al,Geology , 24, 47–51.
Avouac, J. -P. & Tapponnier, P., 1996. Kinematic model of active deforma-tion in Central Asia, Geophys. Res. Lett., 20, 895–898.
Baljinnyam, I., Bayasgalan, A., Borisov, B. A., Cisternas, A., Dem’yanovich,M. G., Ganbaatar, L., Kochetkov, V. M., Kurushin, R. A., Mol-nar, P., Philip, H., & Vashchilov, Y. Y., 1993. Ruptures of MajorEarthquakes and Active Deformation in Mongolia and Its Surroundings,Geol. Soc. Am. Memoir , 181, 62 pp.
Bayasgalan, A., Jackson, J., & McKenzie, D., 2005. Lithosphere rheologyand active tectonics in Mongolia: relations between earthquake sourceparameters, gravity and GPS measurements, Geophys. J. Int., 163, 1151–1179.
Brown, E. T., Bourles, D. L., Raisbeck, G. M., Yiou, F., Burchfiel, B. C.,Molnar, P., Deng, Q., & Li, J., 1998. Estimation of slip rates in the south-ern Tien Shan using cosmic ray exposure dates of abandoned alluvial fans,Geol. Soc. Am. Bull., 110(3), 377–386.
Brown, E. T., Bendick, R., Bourles, D. L., Gaur, V., Molnar, P., Raisbeck,G. M., & Yiou, F., 2002. Slip rates of the Karakorum fault, Ladakh, India,determined using cosmic ray exposure dating of debris flows and moraines,J. Geophys. Res., 107 (B9), 2192.
Burtman, V. S., Skobelev, S. F., & Molnar, P., 1996. Late Cenozoic slip on theTalas-Ferghana fault, the Tien Shan, central Asia, Geol. Soc. Am. Bull.,108, 1004-1021.
Calais, E., Vergnolle, M., San’kov, V., Lukhnev, A., Miroshnitchenko, A.,Amarjargal, S., & Deverchere, J., 2003. GPS measurements of crustal de-formation in the Baikal-Mongolia area (1994-2002): Implications for cur-rent kinematics of Asia, J. Geophys. Res., 108 (B10), 2501.
Chen, Z., Burchfiel, B. C., Liu, Y., King, R. W., Royden, L. H., Tang,W., Wang, E., Zhao, J., & Zhang, X., 2000. Global Positioning System

E. Nissen et al .
measurements from eastern Tibet and their implications for India/Eurasiaintercontinental deformation, J. Geophys. Res., 105 (B7), 16215–16228.
Cunningham, W. D., 1998. Lithospheric controls on late Cenozoic construc-tion of the Mongolian Altai, Tectonics , 17, 891–902.
Cunningham, D., 2001. Cenozoic normal faulting and regional doming in thesouthern Hangay region, Central Mongolia: implications for the origin ofthe Baikal rift province, Tectonophys., 331, 389–411.
Cunningham, D., 2005. Active intracontinental transpressional mountainbuilding in the Mongolian Altai: Defining a new class of orogen,Earth Planet. Sci. Lett., 240, 436–444.
De Grave, J. & Van den haute, P., 2002. Denudation and cooling of the LateTeleskoye Region in the Altai Mountains (South Siberia) as revealed byapatite fission-track thermochronology, Tectonophys., 349, 145–159.
DeLong, S. B. & Arnold, L. J., 2007. Dating alluvial deposits with opticallystimulated luminescence, AMS 14C and cosmogenic techniques, westernTransverse Ranges, California, USA, Quat. Geochron., 2, 129–136.
Devyatkin, E. V., 1974. Structures and formational complexes of the Ceno-zoic activated stage (in Russian), in Tectonics of the Mongolian People’sRepublic, pp. 182–195, Nauka, Moscow.
Devyatkin, E. V., 1981. The Cenozoic of Inner Asia (in Russian), Nauka,Moscow, Moscow.
Engdahl, E. R., van der Hilst, R. D., & Buland, R., 1998. Global teleseismicearthquake relocation from improved travel times and procedures for depthdetermination, Bull. Seismol. Soc. Am., 88, 722–743.
England, P. & Molnar, P., 1997. The field of crustal velocity in Asia calculatedfrom Quaternary rates of slip on faults, Geophys. J. Int., 130, 551–582.
England, P. & Molnar, P., 2005. Late Quaternary to decadal velocity fieldsin Asia, J. Geophys. Res., 110, B12401.
Hetzel, R., Tao, M., Stokes, S., Niedermann, S., Ivy-Ochs, S., Gao, B.,Strecker, M. R. & Kubik, P. W., 2004. Late Pleistocene/Holocene slip

E. Nissen et al .
rate of the Zhangye thrust (Qilian Shan, China) and implications for theactive growth of the northeastern Tibetan Plateau, Tectonics , 23, TC6006.
Holt, W. E., Chamot-Rooke, N., Pichon, X. L., Haines, A. J., Shen-Tu, B.,& Ren, J., 2000. Velocity field in Asia inferred from Quaternary fault sliprates and Global Positioning System observations J. Geophys. Res., 105(B8), 19185–19210.
Howard, J. P., Cunningham, W. D., Davies, S. J., Dijkstra, A. H., & Badarch,G., 2003. The stratigraphic and structural evolution of the Dzereg basin,western mongolia: clastic sedimentation, transpressional faulting and basindestruction in an intraplate, intracontinental setting, Basin. Res., 15, 45–72.
Huntley, D. J., Godfrey-Smith, D. I., & Thewalt, M. L. W., 1985. Opticaldating of sediments, Nature, 313, 105–107.
Jolivet, M., Ritz, J.-F., Vassallo, R., Larroque, C., Braucher, R., Todbileg,M., Chauvet, A., Sue, C., Arnaud, N., De Vicente, R., Arzhanikova, A., &Arzhanikov, S., 2007. Mongolian summits: An uplifted, flat, old but stillpreserved erosion surface, Geology , 35, 871–874.
Klasen, N., 2008. Underestimation of quartz OSL ages for glacifluvial sed-iments from the northern Alpine foreland, LED2008 Conference, paperO-28.
Khil’ko, S. D., Kurushin, R. A., Kochetkov, V. M., Baljinnyam, I., &Monkoo, D., 1985. Strong earthquakes, paleoseismological and macroseis-mic data (in Russian), in Earthquakes and the Basis for Seismic Zoningof Mongolia, Transactions 41, The Joint Soviet-Mongolian Scientific Geo-logical Research Expedition, pp. 19–83, Moscow, Nauka, 19–83.
Lal, D., 1991. Cosmic ray labeling of erosion surfaces - In situ nuclide pro-duction rates and erosion models, Earth Planet. Sci. Lett., 104, 424–439.
Lasserre, C., Morel, P.-H., Gaudemer, Y., Tapponnier, P., Ryerson, F. J.,King, G. C. P., Metivier, F., Kasser, M., Kashgarian, M., Baichi, L., Taiya,L. & Daoyang, Y., 1999. Postglacial left slip rate and past occurrence ofM≥8 earthquakes on the western Haiyuan fault, Gansu, China, J. Geo-phys. Res., 104 (B8), 17633–17652.

E. Nissen et al .
Liu, Z. & Bird, P., 2008. Kinematic modelling of neotectonics in the Persia-Tibet-Burma orogen, Geophys. J. Int., 172, 779–797.
Nishiizumi, K., Arnold, J. R., Lal, D., Klein, J., & Middleton, R., 1986.Production of Be-10 and Al-26 by cosmic rays in terrestrial quartz in situand implications for erosion rates, Nature, 319, 134–136.
Nissen, E., Emmerson, B., Funning, G. J., Mistrukov, A., Parsons, B., Robin-son, D. P., Rogozhin, E., & Wright, T. J., 2007. Combining InSAR andseismology to study the 2003 Siberian Altai earthquakes-dextral strike-slipand anticlockwise rotations in the northern India-Eurasia collision zone,Geophys. J. Int., 169, 216–232.
Nissen, E., Walker, R., Molor, E., Fattahi, M., & Bayasgalan, A., 2009. LateQuaternary rates of uplift and shortening at Baatar Hyarhan (MongolianAltai) with optically stimulated luminescence, Geophys. J. Int., 177, 259–278.
Owen, L. A., Cunningham, D., Richards, B. W. M., Rhodes, E., Wind-ley, B. F., Dorjnamjaa, D. & Badamgarav, J., 1999. Timing of forma-tion of forebergs in the northeastern Gobi Altai, Mongolia: implicationsfor estimating mountain uplift rates and earthquake recurrence intervals,J. Geol. Soc. London, 156, 457–464.
Owen, L. A., Finkel, R. C., Haizhou, M. & Barnard, P. M., 2006. Late Qua-ternary landscape evolution in the Kunlun Mountains and Qaidam Basin,Northern Tibet: A framework for examining the links between glaciation,lake level changes and alluvial fan formation, Quat. Int., 154-155, 73–86.
Peltzer, G. & Saucier, F., 1996. Present-day kinematics of Asia derived fromgeologic fault rates, J. Geophys. Res., 101 (B12), 27943–27956.
Repka, J. L., Anderson, R. S., & Finkel, R. C., 1997. Cosmogenic dating offluvial terraces, Fremont River, Utah, Earth Planet. Sci. Lett., 152, 59–73.
Ritz, J. -F., Brown, E. T., Bourles, D. L., Philip, H., Schlupp, A., Raisbeck,G. M., Yiou, F., & Enkhtuvshin, B., 1995. Slip rates along active faultsestimated with cosmic-ray exposure dates: Application to the Bogd fault,Gobi-Altaı, Mongolia, Geology , 23, 1019–1022.

E. Nissen et al .
Ritz, J. -F., Bourles, D., Brown, E. T., Carretier, S., Chery, J., Enhtuvshin,B., Galsan, P., Finkel, R. C., Hanks, T. C., Kendrick, K. J., Philip, H.,Raisbeck, G., Schlupp, A., Schwartz, D. P., & Yiou, F., 2003. Late Pleis-tocene to Holocene slip rates for the Gurvan Bulag thrust fault (Gobi-Altay, Mongolia) estimated with 10Be dates, J. Geophys. Res., 108 (B3),2162.
Ritz, J.-F., Vassallo, R., Braucher, R., Brown, E. T., Carretier, S., & Bourles,D. L., 2006. Using in situ-produced 10Be to quantify active tectonics inthe Gurvan Bogd mountain range (Gobi-Altay, Mongolia), in In Situ-Produced Cosmogenic Nuclides and Quantification of Geological Processes ,Geol. Soc. Am. Spec. Papers, 415, 87–110.
Sella, G. F., Dixon, T. H., & Mao, A., 2002. REVEL: A model for Recentplate velocities from space geodesy, J. Geophys. Res., 107 (B4), 2081.
Sengor, A. M. C., Natal’in, B. A., & Burtman, V. S., 1993. Evolution of theAltaid tectonic collage and Palaeozoic crustal growth in Eurasia, Nature,364, 299–307.
Siame, L., Bellier, O., Braucher, R., Sebrier, M., Cushing, M., Bourles, D.,Hamelin, B., Baroux, E., de Voogd, B., Raisbeck, G., & Yiou, F., 2004.Local erosion rates versus active tectonics: cosmic ray exposure modellingin Provence (south-east France), Earth Planet. Sci. Lett., 220, 345–364.
Tapponnier, P. & Molnar, P., 1979. Active faulting and Cenozoic tectonics ofthe Tien Shan, Mongolia, and Baykal regions, J. Geophys. Res., 84 (B7),3425–3459.
Thomas, J. C., Lanza, R., Kazansky, A., Zykin, V., Semakov, N., Mitrokhin,D., & Delvaux, D., 2002. Paleomagnetic study of Cenozoic sediments fromthe Zaisan basin (SE Kazakhstan) and the Chuya depression (SiberianAltai): tectonic implications for central Asia, Tectonophys., 351, 119–137.
Thompson, S. C., Weldon, R. J., Rubin, C. M., Abdrakhmatov, K., Molnar,P., & Berger, G. W., 2002. Late Quaternary slip rates across the centralTien Shan, Kyrgyzstan, central Asia, J. Geophys. Res., 107 (B9), 2203.
Van der Woerd, J., Ryerson, F. J., Tapponnier, P., Gaudemer, Y., Finkel, R.,Meriaux, A. S., Caffee, M., Guoguang, Z. & Qunlu, H., 1998. Holocene left-

E. Nissen et al .
slip rate determined by cosmogenic surface dating on the Xidatan segmentof the Kunlun fault (Qinghai, China), Geology , 26, 695–698.
Vassallo, R., 2006. Chronologie et evolution des reliefs dans la regionde Mongolie-Siberie: Approche morphotectonique et geochronologique (inFrench), Ph.D. thesis, Universite Montpellier 2.
Vassallo, R., Ritz, J. -F., Braucher, R., & Carretier, S., 2005. Dating faultedalluvial fans with cosmogenic 10Be in the Gurvan Bogd mountain range(Gobi-Altay, Mongolia): climatic and tectonic implications, Terra Nova,17, 278–285.
Vassallo, R., Ritz, J. -F., Braucher, R., Jolivet, M., Carretier, S., Larroque,C., Chauvet, A., Sue, C., Todbileg, M., Bourles, D., Arzhannikova, A.&Arzhannikov, S., 2007. Transpressional tectonics and stream terraces ofthe Gobi-Altay, Mongolia, Tectonics , 26, TC5013.
Walker, R. T., Bayasgalan, A., Carson, R., Hazlett, R., McCarthy, L., Mis-chler, J., Molor, E., Sarantsetseg, P., Smith, L., Tsogtbadrakh, B., &Tsolmon, G., 2006. Geomorphology and structure of the Jid right-lateralstrike-slip fault in the Mongolian Altay mountains, J. Struct. Geol., 28,1607–1622.
Wang, Q., Zhang, P.-Z., Freymueller, J. T., Bilham, R., Larson, K. M.,Lai, X., You, X., Niu, Z., Wu, J., Li, Y., Liu, J., Yang, Z., & Chen, Q.,2001. Present-Day Crustal Deformation in China Constrained by GlobalPositioning System Measurements, Science, 294, 574–578.
Yuan, W., Carter, A., Dong, J., & Bao, Z., 2006. Mesozoic-Tertiary ex-humation history of the Altai Mountains, northern Xinjiang, China: Newconstraints from apatite fission track data, Tectonophys., 412, 183–193.
E. Nissen et al .
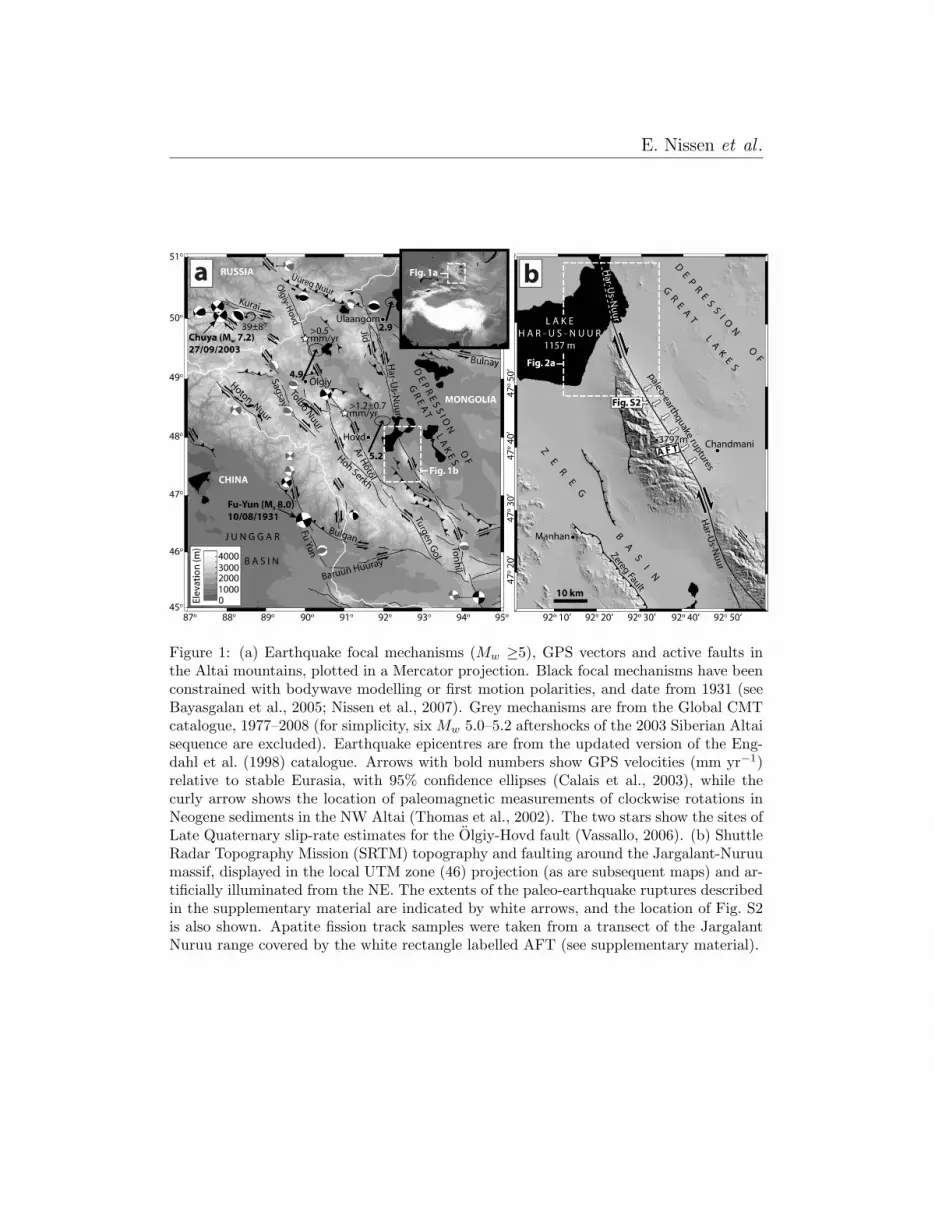
Figure 1: (a) Earthquake focal mechanisms (Mw ≥5), GPS vectors and active faults inthe Altai mountains, plotted in a Mercator projection. Black focal mechanisms have beenconstrained with bodywave modelling or first motion polarities, and date from 1931 (seeBayasgalan et al., 2005; Nissen et al., 2007). Grey mechanisms are from the Global CMTcatalogue, 1977–2008 (for simplicity, six Mw 5.0–5.2 aftershocks of the 2003 Siberian Altaisequence are excluded). Earthquake epicentres are from the updated version of the Eng-dahl et al. (1998) catalogue. Arrows with bold numbers show GPS velocities (mm yr−1)relative to stable Eurasia, with 95% confidence ellipses (Calais et al., 2003), while thecurly arrow shows the location of paleomagnetic measurements of clockwise rotations inNeogene sediments in the NW Altai (Thomas et al., 2002). The two stars show the sites ofLate Quaternary slip-rate estimates for the Olgiy-Hovd fault (Vassallo, 2006). (b) ShuttleRadar Topography Mission (SRTM) topography and faulting around the Jargalant-Nuruumassif, displayed in the local UTM zone (46) projection (as are subsequent maps) and ar-tificially illuminated from the NE. The extents of the paleo-earthquake ruptures describedin the supplementary material are indicated by white arrows, and the location of Fig. S2is also shown. Apatite fission track samples were taken from a transect of the JargalantNuruu range covered by the white rectangle labelled AFT (see supplementary material).

E. Nissen et al .
Figure 2: (a) ASTER image (15 m resolution) of the Har-Us-Nuur fault (picked out bywhite arrows) just south of the Har-Us-Nuur lake. In the northern part of the image thelake is completely frozen through, and the fault can be made out as it crosses the lake bed.Because there is no topography associated with the fault here, its 166◦ strike representsthe fault slip vector. (b) SPOT-5 image (2.5 m resolution) of a series of six light-colouredalluvial fan systems – labeled A to F – that have been deposited along the eastern margin ofthe Jargalant-Nuruu mountains. The range-front outlets of the catchments feeding thesefans are denoted by black arrows, and the trace of the Har-Us-Nuur fault by a dashedwhite line.

E. Nissen et al .
Figure 3: (a) SPOT-5 image of fan system A. A1 is a younger and slightly darker surface,and is still being deposited by the active stream channel. A2 is older and lighter, andis crossed by several runnels filled with dark material shed from mafic bedrock along therange-front. (b) Reconstruction made by aligning the southern edge of A2 (in orange)with the southern edge of the feeder valley. The white dotted line shows the extrapolationof the southern margin of A2 back to the fault. The white arrow represents the ±30 merror margin we assign to the preferred, 175 m displacement, reflecting the uncertaintyinvolved in this extrapolation. (c) Panoramic photographs facing ∼NE from 47◦ 58’ 28” N92◦ 24’ 16” E. Mafic bedrock can be seen in the foreground; material eroded from this hasbeen washed into the runnels crossing A2.

E. Nissen et al .
Figure 4: (a) SPOT-5 image of fan systems B & C. (b) Reconstruction of the B2 and C2surfaces (in orange) using a 160 m offset, consistent with both A2 and F2 fans. (c) SPOTimage of fan systems D & E. (d) Reconstruction of the D2 and E2 surfaces (in orange)using a 160 m offset.

E. Nissen et al .
Figure 5: (a) SPOT-5 image of fan system F. The dashed black line marks the extentsof the DEM in Fig. 6a. The faint, dark line crossing the F1 surface is the fault scarpdescribed in Section 3.1. (b) Reconstruction based on restoring the southern margin ofF2 (in orange) next to the southern edge of the feeder valley using a displacement of140 m. The question marks represent the uncertainties in the outline of the southern edgeof F2, on either side of the fault. Because of these uncertainties, we assign ±40 m errorbounds to the preferred F2 displacement. (c) Panorama facing ∼NE from 47◦ 56’ 25” N92◦ 25’ 10” E. Tents in left of picture provide scale.
E. Nissen et al .
Figure 6: (a) Digital elevation model (DEM) of fan system F, artificially illuminated fromthe south-east (a topographic scale is provided in the electronic, colour version of thisfigure). Its extents are marked on Fig. 5a as a dashed black line. The DEM was madeby fitting a surface of minimum curvature to the differential GPS points shown on theinset map. (b) An example of an elevation profile across the scarp on F1. In this case,the surface is displaced, vertically, by 0.5 m; by producing several of these profiles, webracket the offset at 0.4–0.8 m. (c) Photo facing ∼SW from 47◦ 56’ 37” N 92◦ 25’ 21” E,showing the F1–F2 riser with a person for scale. (d) Parallel topographic profiles throughthe F1–F2 riser, taken either side of the fault. The steepest part of the riser (picked outby a dashed line) is displaced, right-laterally, by 12 ± 2 m.

E. Nissen et al .
Figure 7: (a) Vertical profile of 10Be concentrations (averaged over many clasts) throughthe A2 fan, with horizontal bars showing analytical errors at the 1σ level. The curved linesrepresent modelled distributions, under the assumption of no erosion and discounting thelowest two samples (see text for details). (b) Plot of χ2 values for a range of erosion ratesand ages, using the best-fit inherited 10Be concentration of 1.40 × 10⁵ atoms g−1. Thecurved trough in χ2 values demonstrates a trade-off in χ2 between age and erosion rate.The circle represents the minimum age (using no erosion); the asterisk represents the over-all best-fit age and erosion rate; and the star represents the best-fit age for a fixed erosionrate of 7 m Ma−1 (Vassallo et al., 2005). (c) Vertical profile of 10Be through the F1 fan.Although we do not model this data, we do show forward-modelled distributions for agesof 0 ka, 5 ka and 10 ka. (d) Vertical profile of 10Be through the F2 fan. Curved lines rep-resent best-fit modelled distributions for an inherited component of 1.40 × 10⁵ atoms g−1
and assuming no erosion; for the dotted line, the shallowest four samples were used, whilefor the dashed line, only the middle three samples were used.

E. Nissen et al .
Figure 8: Equivalent dose distribution plots for OSL samples (a) A2a, (b) A2b and (c) F1.The x -axis represents the equivalent dose (De, in Grays) required to reproduce the naturalOSL signal. De values for individual aliquots are displayed in rank order, with an overallprobability density function superimposed on top. Error bars in individual aliquot De
values are based on photon-counting statistics, an error in fitting a straight line throughthe dose-response plots, and a 1% systematic error.

E. Nissen et al .
A2a A2b F1De (Gy) 70.7 ± 12.4 73.4 ± 31.0 28.8 ± 7.5K (%) 2.81 ± 0.03 2.85 ± 0.03 2.51 ± 0.03U (ppm) 1.70 ± 0.05 1.40 ± 0.05 4.30 ± 0.05Th (ppm) 5.60 ± 0.17 5.30 ± 0.17 11.80 ± 0.17Cosmic dose rate (Gy/ka) 0.252 ± 0.135 0.252 ± 0.135 0.243 ± 0.135Total dose rate (Gy/ka) 3.76 ± 0.18 3.70 ± 0.18 4.55 ± 0.18Age (ka) 18.8 ± 3.5 19.8 ± 8.5 6.3 ± 1.7
Table 1: Weighted mean equivalent doses (De), radioactive K, U and Th concentrations,cosmic dose rates, total dose rates and the resulting OSL ages for two samples from theA2 sampling pit and one from the F1 sampling pit. All errors are shown at the 1σ level.