Embed Size (px)
Citation preview

The impact of habitat fragmentation on tsetse abundance on theplateau of eastern Zambia☆
E. Ducheynea,1,⁎, C. Mweempwab,1, C. De Pusc, H. Vernieuwea, R. De Dekenc, G.Hendrickxa, and P. Van den Bosschec,dE. Ducheyne: [email protected]; C. Mweempwa: ; C. De Pus: ; H. Vernieuwe: ; R. De Deken: ; G. Hendrickx: ; P. Vanden Bossche:aAvia-GIS, Risschotlei 33, 2980 Zoersel, Belgium.bDepartment of Veterinary and Livestock Development, Zambia.cAnimal Health Department, Institute of Tropical Medicine, Antwerpen, Belgium.dDepartment of Veterinary Tropical Diseases, Faculty of Veterinary Science, South Africa.
AbstractTsetse-transmitted human or livestock trypanosomiasis is one of the major constraints to ruraldevelopment in sub-Saharan Africa. The epidemiology of the disease is determined largely by tsetsefly density. A major factor, contributing to tsetse population density is the availability of suitablehabitat. In large parts of Africa, encroachment of people and their livestock resulted in a destructionand fragmentation of such suitable habitat. To determine the effect of habitat change on tsetse densitya study was initiated in a tsetse-infested zone of eastern Zambia. The study area represents a gradientof habitat change, starting from a zone with high levels of habitat destruction and ending in an areawhere livestock and people are almost absent. To determine the distribution and density of the fly,tsetse surveys were conducted throughout the study area in the dry and in the rainy season. LandsatETM+ imagery covering the study area were classified into four land cover classes (munga, miombo,agriculture and settlements) and two auxiliary spectral classes (clouds and shadow) using a GaussianMaximum Likelihood Classifier. The classes were regrouped into natural vegetation and agriculturalzone. The binary images were overlaid with hexagons to obtain the spatial spectrum of spatial pattern.Hexagonal coverage was selected because of its compact and regular form. To identify scale-specificspatial patterns and associated entomological phenomena, the size of the hexagonal coverage wasvaried (250 and 500 m). Per coverage, total class area, mean patch size, number of patches and patchsize standard deviation were used as fragmentation indices. Based on the fragmentation index values,the study zone was classified using a Partitioning Around Mediods (PAM) method. The number ofclasses was determined using the Wilks’ lambda coefficient. To determine the impact of habitatfragmentation on tsetse abundance, the correlation between the fragmentation indices and the indexof apparent density of the flies was determined and habitat changes most affecting tsetse abundancewas identified. From this it followed that there is a clear relationship between habitat fragmentation
☆This paper is part of a special issue entitled “GisVet 2007”, Guest Edited by Annette Kjær Ersbøll.© 2009 Elsevier B.V.This document may be redistributed and reused, subject to certain conditions.
⁎Corresponding author. Tel.: +32 3 458 29 79. [email protected] the authors have contributed equally to the work presented in this paper.This document was posted here by permission of the publisher. At the time of deposit, it included all changes made during peer review,copyediting, and publishing. The U.S. National Library of Medicine is responsible for all links within the document and for incorporatingany publisher-supplied amendments or retractions issued subsequently. The published journal article, guaranteed to be such by Elsevier,is available for free, on ScienceDirect.
Sponsored document fromPreventive Veterinary Medicine
Published as: Prev Vet Med. 2009 September 01; 91(1): 11–18.
Sponsored Docum
ent Sponsored D
ocument
Sponsored Docum
ent
and the abundance of tsetse flies. Heavily fragmented areas have lower numbers of tsetse flies, butwhen the fragmentation of natural vegetation decreases, the number of tsetse flies increases followinga sigmoidal-like curve.
KeywordsTsetse; GIS; Fragmentation analysis
1 IntroductionTsetse-transmitted trypanosomiasis is a major constraint to rural development in large parts ofAfrica (Swallow, 1998).
The tsetse flies occur in about 10 million km2 of sub-Saharan Africa and the trypanosomesthey transmit can cause severe illness in livestock and people. The prevalence of bovinetrypanosomiasis, transmitted by Glossina morsitans morsitans (Diptera: Glossinidae) the onlyspecies present, is about 30% (Simukoko et al., 2007). For their survival, tsetse flies are highlydependent on the presence of suitable habitat and hosts. The seasonal distribution of the fliesis correlated with the distribution of its main host, cattle (Van den Bossche and Staak, 1997).However, in large parts of tsetse-infested sub-Saharan Africa the progressive clearing of thenatural vegetation for cultivation, the introduction of domestic animals and the almost completedisappearance of large game animals have had important repercussions for the distribution anddensity of tsetse flies. In Malawi, for example, the distribution of tsetse flies is almost restrictedto protected areas, where the vegetation is undisturbed whereas the extensive clearing of naturalvegetation outside the protected areas has led to the disappearance of the tsetse flies and thedisease they transmit (Van den Bossche et al., 2000). It can be anticipated that in the years tocome and with continued population growth and the environmental change a similar declinein the distribution and density of the tsetse population and the disease prevalence will beobserved elsewhere. This process of gradual reduction in challenge may in certain areasultimately lead to autonomous, anthropogenic clearing of tsetse and thus the disappearance ofthe disease (Bourn et al., 2000; Reid et al., 2000). Understanding this process may contributeto the development of focused trypanosomiasis control strategies that exploit this autonomoustsetse clearing.
While the landscape structure has a strong potential to influence disease dynamics, theimportance of landscape composition (number and type of patches) and configuration (spatialrelationship among patches) is only beginning to be explored (Ostfeld et al., 2005). Thequantification of the spatial heterogeneity of a landscape, also referred to as landscapefragmentation, is necessary to elucidate the relationship between the landscape and theecological processes (Turner, 2005). A wide range of landscape fragmentation indices (ormetrics) is now readily available to quantify the landscape composition and configuration forcategorical data through dedicated software packages such as Fragstats (stand alone,http://www.umass.edu/landeco/research/fragstats/fragstats.html) or Patch Analyst (GIS-integrated, http://flash.lakeheadu.ca/∼rrempel/patch/).
Examples of landscape indices include the total area of a given land cover class, the numberof patches of that land cover class, the shape of remaining land cover patches for composition,and the distance to the nearest patch of the same land cover class for landscape configuration.Often several indices are combined to completely quantify the entire landscape.
Even though the relationship between species diversity or species abundance and fragmentationcharacteristics is acknowledged, this relationship is not necessarily linear, and thresholds orminimum sizes for these factors may exist (Drinnan, 2005) below which species diversity or
Ducheyne et al. Page 2
Published as: Prev Vet Med. 2009 September 01; 91(1): 11–18.
Sponsored Docum
ent Sponsored D
ocument
Sponsored Docum
ent
abundance declines more than linear. Determining these thresholds is important from amanagement/control perspective. To investigate the relationship between tsetse abundance andhabitat fragmentation a study was initiated in the tsetse-infested livestock production area ofthe plateau of eastern Zambia where human population growth and agricultural expansion havebrought about profound changes to the environment (Van den Bossche, 2001). Those changeshave resulted in a substantial reduction in and fragmentation of the natural tsetse habitat andin the abundance of wildlife host.
2 Materials and methods2.1 Study area
The study was carried out in an area situated between 31°47′ and 31°55′E (31.788–31.916E)and between 13°55′ and 14°12′S (13.916–14.12S) in Katete District, Eastern Province, Zambia.It is a highly cultivated area with a cattle population of approximately 8–10 animals/km2.
The vegetation in the study area can be classified into two main types.
(i) Miombo, a one-storied open woodland with dominant genera Brachystegia andJulbernardia, and which is found mainly on poorer soils on ridges or slopes and (ii) munga, aone- or two-storied woodland where the principal tree genera are Acacia, Terminalia andCombretum, which is associated with flat topography and which follows the streams and theirsmaller tributaries. Most villages are found in the miombo vegetation type. Tsetse flies arefound in both vegetation types but their abundance in each of them varies seasonally (Van denBossche and De Deken, 2002). The annual climatic cycle in the study area comprises threeseasons: the warm rainy season (from early November to late April), the cold dry season (fromearly May to late August) and the hot dry season (from early September to late October). Thestudy area is a subsistence farming area with maize and cotton being the most important crops.It represents a gradient of habitat change, starting from a zone with high levels of vegetationdestruction and fragmentation as a result of human settlements and clearing for agriculture inthe south and ending in an area where livestock and people are almost absent and where naturalvegetation is largely untouched in the north (Fig. 1).
2.2 Tsetse distributionTo obtain up to date information on the distribution and density of G. m. morsitans, two surveyswere carried out. The first survey was conducted during the rainy season (February/March2006) and the second at the end of the hot dry season (October/November 2006). Use was madeof the fly-round method along transects as described by Potts (1930) and Ford et al. (1959).According to this method a sample team of two men traversed a transect using a black screen(1.5 m × 1 m) baited with acetone released at approximately 200 mg/h (Shereni, 1984). Thescreen hung from a bamboo pole and was kept hanging vertically by weighting with a secondbamboo pole at the bottom.
Each transect was about 6 km long and had about 30 sectors of roughly 200 m each. At the endof each sector was a stop. The fly-round team remained at each stop for 2 min and, using handnets, captured tsetse alighting on the screen. All flies were killed immediately after capture.The fly-rounds started between 07:00 and 08:00 h or 15:00 and 16:00 h in the rainy and hotdry seasons, respectively. Records were kept of the number and sex of the tsetse captured ateach stop along each transect.
All fly-round stops were georeferenced with a GPS using latitude–longitude coordinates(datum = WGS84). The dry season survey aimed at covering the same area as the one carriedout during the rainy season. The starting points of each transect were identical but the positionof the remainder of each transect could deviate slightly from its position during the rainy season
Ducheyne et al. Page 3
Published as: Prev Vet Med. 2009 September 01; 91(1): 11–18.
Sponsored Docum
ent Sponsored D
ocument
Sponsored Docum
ent

survey. Moreover, during the dry season the area surveyed was extended to a zone that wasnot covered during the rainy season.
2.3 Land cover classificationBecause of cloud contamination, only the dry season was available for selecting high qualitysatellite data. Due to the Scan Line Failure of the ETM+ sensor in May 2003, the most recentLandsat data was from 6 October 2002. Two consecutive Landsat scenes (Path/Rows = 170/069and 170/070, respectively) were ordered through the GLOVIS portal from the United StatesGeological Survey (http://glovis.usgs.gov).
The two images were preprocessed separately prior to mosaicking to reduce any effects ofdifferences in illumination and atmospheric absorption. The digital numbers were convertedinto near-surface reflectance taking into account atmospheric correction using a dark pixelsubtraction method (Chavez, 1988). Subsequently, they were co-registered to remove anygeometric distortions using a second order polynomial followed by a nearest neighbourresampling method. Finally, the imagery was mosaicked using a grey level matching method(Richards and Jia, 1999).
During the tsetse surveys, four different land cover types were identified, i.e. munga, miombo,agriculture and villages. In total, 560 reference points were georeferenced, this number wasdetermined using the rule of thumb by Jensen (1996) who states the number of training sitesshould be >10n, distributed equally across the entire image. In the case, we need at least10 × 7 = 70 training sites. For each point the landscape was described and pictures were taken.Using those ground truth data, training sites were delineated on the satellite imagery as inputfor a supervised classification. From these training sites, spectral signatures are derived forfour land cover types and two additional classes (clouds, shadow). The satellite image wasclassified using a Gaussian Maximum Likelihood Classifier with equal prior probabilities foreach spectral class. The accuracy assessment was performed using an independent validationset and was evaluated using a confusion matrix, the overall accuracy and the Kappa Index ofAgreement, which represents the agreement between ground truth and prediction afterremoving the proportion of agreement that could be expected to occur by chance (Congalton,2001). A Kappa Index of Agreement close to 1 indicates a high accuracy. All image processingwas carried out in Idrisi Andes (www.clarklabs.org).
2.4 Fragmentation analysisThe classified image was reduced to two classes: “natural vegetation” comprising the miomboand munga land cover types and “disturbed vegetation” comprising the agriculture and villagesland cover types. The classified image was overlaid with a grid of regular hexagons (De Clercqet al., 2007). Hexagons are selected because of their compact and regular form. Since habitatfragmentation occurs at different scales and to allow for the tsetse fly's mobility, two hexagonside sizes taking into account daily displacement capacity of G. m. morsitans (Hargrove,2003) were used, i.e. 250 and 500 m. The landscape fragmentation was assessed using PatchAnalyst in ArcView3.2 (www.esri.com) by calculating the following indices for each hexagonfor the disturbed vegetation class: total class area, number of patches, mean patch size andpatch size standard deviation. Based on these indices, the hexagons with similar fragmentationcharacteristics were grouped in classes using an unsupervised clustering method PartioningAround Mediods (PAM). In this method each point is initially randomly assigned to one of theclusters. During the subsequent iterative phase, the cost of the configuration is determined andthe mediod is adjusted to the configuration that reduces the cost maximally. In essence, this isa hill-climbing search method. The iterative process finishes when no configuration with lowerenergy can be found. The cost is calculated as the distance from each point to the nearestmediod. The number of clusters in the dataset was determined by means of the Wilk's Lambda
Ducheyne et al. Page 4
Published as: Prev Vet Med. 2009 September 01; 91(1): 11–18.
Sponsored Docum
ent Sponsored D
ocument
Sponsored Docum
ent

and the silhouette width in R Stats. Using the fragmentation indices for the mediod hexagonof each cluster, the clusters could be arranged according to fragmentation degree.
To link the entomological data to the fragmentation classes the index of apparent density (IAD)of tsetse was calculated for each polygon as follows:
where IADp = index of apparent density for polygon p, NbCatchesp = number of flies capturedin polygon p, NbStopsp = number of stops in polygon p.
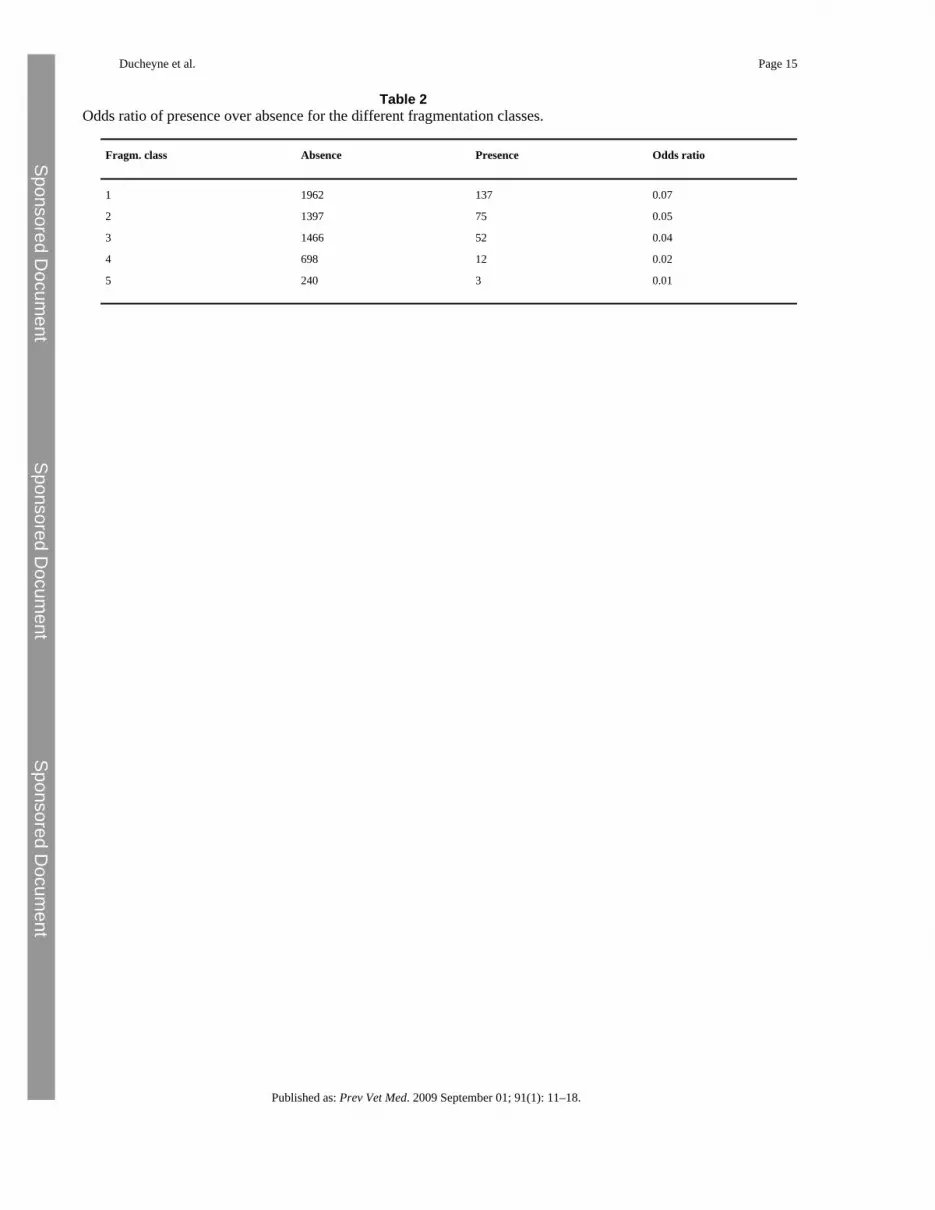
Subsequently the IAD for all fragmentation classes was derived as the mean of the IAD of eachpolygon belonging to the fragmentation class. In order to test whether there is a significantdifference between the different classes, the odds ratio of presence (i.e. IAD > 0) over absence(i.e. IAD = 0) was determined. In a next step, a general linear model with binomial distributionin R Stats was used to determine the difference between the categories.
3 Results3.1 Tsetse distribution
The entire study area was covered using 238 transects (119 in the dry and 119 in the rainyseason, respectively) consisting of 6645 stops. A total of 210 G. m. morsitans (140 male and70 female flies) were captured during the dry season survey. During the rainy season survey,182 flies (122 male and 60 female flies) were captured. The flies were captured at 304 stopslocated throughout the study area (Fig. 1).
3.2 Vegetation classificationUsing the four vegetation types, the overall accuracy as tested with an independent validationset using the Gaussian Maximum Likelihood Classifier was 96%, while the Kappa Index ofAgreement was 0.93. For all different vegetation types, except for miombo, a conditionalKappa Index of Agreement of more than 0.90 was obtained (agriculture = 0.9483,miombo = 0.7693, munga = 0.9580, villages = 0.9794, clouds = 1.0000, shadow = 0.9625).The lower conditional Kappa Index of Agreement for miombo was due to the misclassificationof 17% of the miombo pixels as munga (Table 1). Since prior to the fragmentation analysisthese two vegetation types were combined into a single ‘natural vegetation class’, the confusionbetween these two classes therefore did not affect the fragmentation analysis.
3.3 Fragmentation trends at different scalesIn both cases the best clustering (lowest Wilk's lambda) was obtained for five clusters. Allfragmentation indices contributed to the identification of the different fragmentation classes.However, it was noted that a subset of two indices (number of patches and class area) wassufficient to discriminate the clusters both at the 250 and 500 m scale. Fig. 3 illustrates themediods per fragmentation class for both the 250 and 500 m scale.
At the 250 m scale (Fig. 3, top), there is a strong north–south axis of highly fragmented habitatalong the road between Chipopera and Budula Siliya. Fragmentation decreases further awayfrom this road in both directions. To the west, fragmentation becomes minimal whenapproaching the Nyamadzi river, and to the east close to protected forest west of Fungulani.Fragmentation is also more pronounced in the southern than in the northern part of the study
Ducheyne et al. Page 5
Published as: Prev Vet Med. 2009 September 01; 91(1): 11–18.
Sponsored Docum
ent Sponsored D
ocument
Sponsored Docum
ent

area, especially in the area around Chipopera. Northwest of the Nyamadzi river, close to thegame management area (GMA), the habitat is still intact.
The same phenomenon can be observed at the 500 m (Fig. 3) scale but the fragmentationpatterns observed at this scale seem more clustered. From Fig. 2 both the north/south (gamemanagement area vs. Chipopera/Katete) as well as the east–west gradient away from the roadbetween Chipopera and Budula Siliya are observed. The protected forest north of Msoroappears as a non-fragmented zone as is the miombo/munga complex south of the GMA. Thoughthe number of fragmentation classes is the same for both scales, the interpretation of the classesbased on the mediods is slightly different (Fig. 4). While at the 250 m scale the hexagons withthe highest degree of fragmentation (class 5) contain a single large patch of agriculture,hexagons with several (but a small number) of large patches are also included in this categoryat the 500 m scale. On the other hand, the hexagons with a fragmentation class 4 degree offragmentation at the 250 m scale are similar to those which were assigned to fragmentationclass 3 at the 500 m scale. Both categories show a considerable area of disturbed landscapeconsisting of large number of small patches. Finally at the 500 m scale, the clustersdifferentiated within the ‘lightly fragmented’ fragmentation class whilst these two categoriesare collapsed into one category at the 250 m.
3.4 Influence of fragmentation on tsetse abundanceIndependent of the scale (250 and 500 m) the impact of fragmentation on tsetse abundance wassimilar (Fig. 5). During the dry as well as the rainy season the majority of the tsetse flies werecaptured in a non-fragmented landscape. Increasing levels of fragmentation resulted in agradual decline in the IAD of male and female G. m. morsitans until a level of fragmentation(fragmentation class 4) is reached where the IAD is constant but low.
From Table 2 follows that based on the odds ratio fragmentation classes 1 (α = 0.99), 2(α = 0.95) and 3 (α = 0.9) are significantly higher from the reference category (fragmentationclass 5) (Table 3).
4 Discussion4.1 Fragmentation quantification at different scales
The landscape fragmentation in the study zone can be characterized using two landscapeindices that are easy to measure, i.e. class area and number of patches or by any other subsetof landscape indices. This is due to the correlation between the estimated parameters.
At both scales the fragmentation trends are similar but they appear more clustered at 500 mdue to the generalization of the landscape pattern within the hexagons. At the 250 m scale thetrends are less obvious but the hexagons have a more homogeneous landscape within. This issimply caused by the smaller surface of the smaller hexagons.
4.2 Entomological repercussionsThe outcome of this study shows that in the study area the destruction and fragmentation ofthe natural habitat of tsetse flies has significant repercussions for the density of those flies.Extensive clearing, mainly for cotton production in the southern part of the study area hasresulted in the disappearance of large parts of the tsetse habitat and in a significant reductionin the apparent density of tsetse compared to the areas closer to the Luangwa escarpment wherehuman density is much lower and the natural vegetation largely undisturbed. This reduction inthe IAD of tsetse in the southern part can also be observed over time. Between 1990 and 1993,a longitudinal study monitoring the apparent density of the tsetse population in the southernpart around Chipopera (Fig. 1), which is currently characterized by fragmentation classes 1
Ducheyne et al. Page 6
Published as: Prev Vet Med. 2009 September 01; 91(1): 11–18.
Sponsored Docum
ent Sponsored D
ocument
Sponsored Docum
ent

and 2, using identical sampling methods revealed an average monthly IAD of 0.64 flies duringthe rainy season (Van den Bossche and De Deken, 2002). This is substantially higher than theaverage IAD of 0.01 and 0.02 flies observed during the rainy season survey in the fragmentationclasses 1 and 2 and at a scale of 250 m, respectively. Hence, over a period of about 15 yearsanthropogenic changes have resulted in the almost disappearance of tsetse from this area.
The results from this study suggest that the effect of habitat fragmentation on the apparentdensity of male and female tsetse flies is a gradual process with the IAD of tsetse increasingwith decreasing levels of fragmentation. The results also show that this effect seems to be morepronounced in male flies. This difference between male and female flies is rather a result of asampling bias inherent to the fly-round method that is less attractive to female compared tomale G. m. morsitans (Vale and Phelps, 1978). The observed variations in the IAD occurbetween habitats with high levels of fragmentation or areas where tsetse are most likely todisappear autonomously and habitats with low levels of fragmentation or areas where the tsetsepopulation is thriving and where control interventions are required to reduce its density.
Although suitable tsetse habitat is still present in all fragmentation classes it is expected thatits degree of fragmentation affects the movements of tsetse flies in their quest for food. Sincemost of the wild hosts have disappeared from most of the study area, tsetse flies have becomehighly dependent on cattle for their survival (Van den Bossche and Staak, 1997). The cattleavailability is highest in the highly fragmented landscape but distribution of cattle variesseasonally. Therefore tsetse are highly dependent on seasonal changes in their distribution tofind their host (Van den Bossche and De Deken, 2002). All factors (especially habitatfragmentation) hindering those seasonal movements of the flies will thus have directrepercussions on the flies’ feeding success and their survival. The effect of those changes inapparent fly density on disease transmission requires further investigation.
4.3 ConclusionsThe approach presented in this paper may form the basis for rationalizing area-wide tsetse flycontrol activities by identifying areas where tsetse flies are likely to disappear as a result ofautonomous clearing and where control may not be required and identifying areas where tsetseflies are likely to persist and where control is thus more appropriate.
Conflict of interest statementNone of the authors (Els Ducheyne, Cornelius Mweempwa, Claudia De Pus, Hilde Vernieuwe,Redginald De Deken, Guy Hendrickx, Peter Van den Bossche) has a financial or personalrelationship with other people or organisations that could inappropriately influence or bias thepaper entitled “The impact of habitat fragmentation on tsetse abundance on the plateau ofeastern Zambia”.
AcknowledgementsThis work was funded by the Wellcome Trust (Grant 075824/B/04/Z). Ir. Eva De Clercq is gratefully acknowledgedfor her valuable input to the fragmentation analysis.
ReferencesBourn, D.; Reid, R.S.; Rogers, D.; Snow, W.F.; Wint, W. AHP/ERGO; 2000. Environmental Change
and the Autonomous Control of Tsetse and Trypanosomosis in Sub-Saharan Africa. 248 pp.Chavez P.S. An improved dark-object subtraction technique for atmoshperic scattering correction of
multispectral data. Remote Sensing of Environment 1988;24:459–479.De Clercq E.M. De Wulf R.R. Van Herzele A. Relating spatial pattern of forest cover to accessibility.
Landscape and Urban Planning 2007;80:14–22.
Ducheyne et al. Page 7
Published as: Prev Vet Med. 2009 September 01; 91(1): 11–18.
Sponsored Docum
ent Sponsored D
ocument
Sponsored Docum
ent
Drinnan I. The search for fragmentation thresholds in southern Sydney suburb. Biological Conservation2005;124:339–349.
Ford J. Glasgow J.P. Johns D.L. Welch J.R. Transect flyrounds in the field studies of Glossina. Bulletinof Entomological Research 1959;50:275–285.
Hargrove J.W. Optimized simulation of the control of tsetse flies Glossina pallidipes and G. m. morsitans(Diptera: Glossinidae) using odour-baited targets in Zimbabwe. Bulletin of Entomological Research2003;93:19–29. [PubMed: 12593679]
Jensen, J.R. Vol. 2nd ed.. Prentice-Hall Inc.; Engelwood Cliffs, New Jersey: 1996. Introductory DigitalImage Processing: A Remote Sensing Perspective. 318 p.
Ostfeld R.S. Glass G.E. Kessing F. Spatial epidemiology: an emerging (or re-emerging) discipline. Trendsin Ecology and Evolution 2005;20:328–336. [PubMed: 16701389]
Potts W.H. A contribution to the study of numbers of tsetse-fly (Glossina morsitans Westw.) byquantitative methods. South African Journal of Science 1930;27:491–497.
Reid R.S. Kruska R.L. Deichmann U. Thornton P.K. Leak S.G.A. Human population growth andextinction of the tsetse fly. Agriculture, Ecosystems and Environment 2000;77:227–236.
Richards, J.A.; Jia, Y. Vol. 3rd ed.. Springer; Berlin: 1999. Remote Sensing Digital Image Analysis: AnIntroduction. 363 p.
Shereni W. The use of cloth screens and acetone vapour as alternatives to a bait-ox for samplingpopulations of tsetse flies (Diptera: Glossinidae). Transactions of the Zimbabwe ScientificAssociation 1984;62:22–27.
Simukoko H. Marcotty T. Phiri I. Geysen D. Vercruysse J. Van den Bossche P. The comparative role ofcattle, goats and pigs in the epidemiology of livestock trypanosomiasis on the plateau of easternZambia. Veterinary Parasitology 2007;147:231–238. [PubMed: 17493757]
Swallow, B.M., 1998. Impacts of African Animal Trypanosomosis on Migration, Livestock and CropProduction. Nairobi, ILRI, pp. 1–19.
Turner M.G. Landscape ecology: what is the state of the science? Annual Review of Ecology, Evolution,and Systematics 2005;36:319–344.
Vale G.A. Phelps R.J. Sampling problems with tsetse flies. Journal of Applied Ecology 1978;15:715–726.
Van den Bossche P. Some general aspects of the distribution and epidemiology of bovine trypanosomosisin southern Africa. International Journal for Parasitology 2001;31:592–598. [PubMed: 11334947]
Van den Bossche P. De Deken R. Seasonal variations in the distribution and abundance of the tsetse fly,Glossina morsitans morsitans in eastern Zambia. Medical and Veterinary Entomology 2002;16:170–176. [PubMed: 12109711]
Van den Bossche P. Staak C. The importance of cattle as a food source for Glossina morsitans morsitansWestwood (Diptera: Glossinidae) in Katete District, Eastern Province, Zambia. Acta Tropica1997;65:105–109. [PubMed: 9164604]
Van den Bossche P. Shumba W. Makhambera P. The distribution and epidemiology of bovinetrypanosomosis in Malawi. Veterinary Parasitology 2000;88:163–176. [PubMed: 10714455]
Ducheyne et al. Page 8
Published as: Prev Vet Med. 2009 September 01; 91(1): 11–18.
Sponsored Docum
ent Sponsored D
ocument
Sponsored Docum
ent

Fig. 1.(A) Map of study area, location of fly-round transects and tsetse fly captures during the dryand wet season survey. (B) Map of index of apparent density, interpolated using kriging.
Ducheyne et al. Page 9
Published as: Prev Vet Med. 2009 September 01; 91(1): 11–18.
Sponsored Docum
ent Sponsored D
ocument
Sponsored Docum
ent

Fig. 2.Representation of the degree of fragmentation of natural habitat in each of the fragmentationclasses for hexagon side sizes of 250 m (left) or 500 m (right).
Ducheyne et al. Page 10
Published as: Prev Vet Med. 2009 September 01; 91(1): 11–18.
Sponsored Docum
ent Sponsored D
ocument
Sponsored Docum
ent
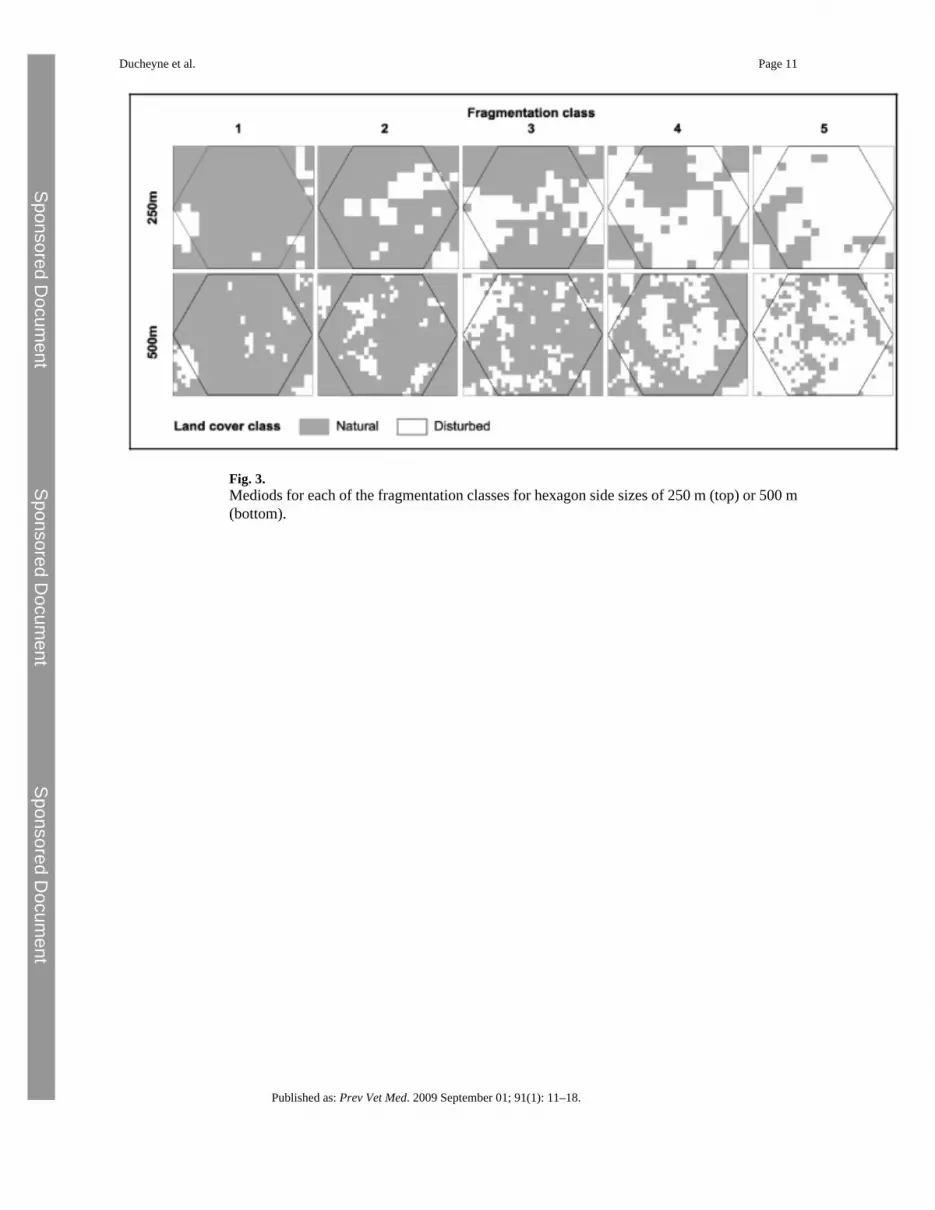
Fig. 3.Mediods for each of the fragmentation classes for hexagon side sizes of 250 m (top) or 500 m(bottom).
Ducheyne et al. Page 11
Published as: Prev Vet Med. 2009 September 01; 91(1): 11–18.
Sponsored Docum
ent Sponsored D
ocument
Sponsored Docum
ent

Fig. 4.Number of patches (—) and class area (– – –) of disturbed vegetation in each of the habitatfragmentation classes for hexagon side sizes of 250 m (■) or 500 m (○). To allow forcomparison between the two scales the number of patches at 500 m was divided by 4.
Ducheyne et al. Page 12
Published as: Prev Vet Med. 2009 September 01; 91(1): 11–18.
Sponsored Docum
ent Sponsored D
ocument
Sponsored Docum
ent
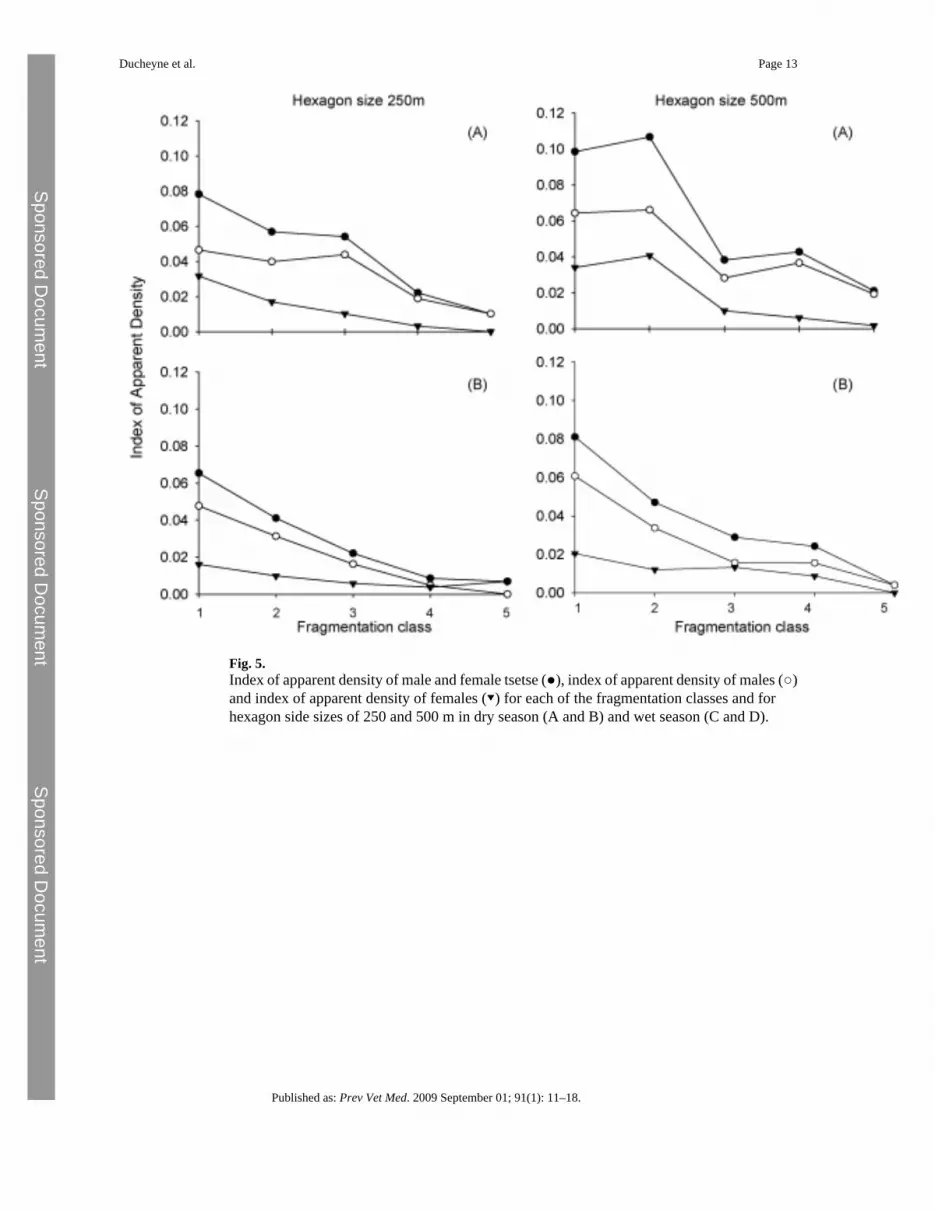
Fig. 5.Index of apparent density of male and female tsetse (●), index of apparent density of males (○)and index of apparent density of females (▾) for each of the fragmentation classes and forhexagon side sizes of 250 and 500 m in dry season (A and B) and wet season (C and D).
Ducheyne et al. Page 13
Published as: Prev Vet Med. 2009 September 01; 91(1): 11–18.
Sponsored Docum
ent Sponsored D
ocument
Sponsored Docum
ent

Sponsored Docum
ent Sponsored D
ocument
Sponsored Docum
ent
Ducheyne et al. Page 14
Table 1Error matrix of classification: true land cover (columns) versus predicted landcovers (rows). ErrorO: error of omission, the number of pixels that should havebeen added to the class but where omitted; ErrorC: error of commission, thenumber of pixels that were committed in the class but should have been added toanother class.
Truth
Agriculture Miombo Munga Villages Clouds Shadow Total ErrorC
Predicted
Agriculture 637 22 0 4 0 1 664 0.041
Miombo 26 646 65 0 0 3 740 0.127
Munga 0 140 3346 1 0 20 3507 0.046
Villages 5 1 0 248 0 0 254 0.024
Clouds 0 3 1 0 606 1 611 0.008
Shadow 0 0 0 0 0 725 725 0.000
Total 668 812 3412 253 606 750 6501
ErrorO 0.046 0.204 0.019 0.020 0.000 0.033 0.045
Published as: Prev Vet Med. 2009 September 01; 91(1): 11–18.
Sponsored Docum
ent Sponsored D
ocument
Sponsored Docum
ent
Ducheyne et al. Page 15
Table 2Odds ratio of presence over absence for the different fragmentation classes.
Fragm. class Absence Presence Odds ratio
1 1962 137 0.07
2 1397 75 0.05
3 1466 52 0.04
4 698 12 0.02
5 240 3 0.01
Published as: Prev Vet Med. 2009 September 01; 91(1): 11–18.

Sponsored Docum
ent Sponsored D
ocument
Sponsored Docum
ent
Ducheyne et al. Page 16
Table 3Statistical analysis of odds ratio using a general linear model with a binomial distribution.
Estimate S.D. Error z-Value Pr(>|z|)
Frag 4 0.3187 0.6492 0.491 0.62349
Frag 3 1.043 0.5972 1.746 0.08075 •
Frag 2 1.4574 0.5923 2.461 0.01387 *
Frag 1 1.7203 0.587 2.931 0.00338 **
Fragmentation class 5 (the class which is most fragmented) is the baseline category to which the other classes are compared.
•p < 0.1.
*p < 0.05.
**p < 0.01.
Published as: Prev Vet Med. 2009 September 01; 91(1): 11–18.


