Embed Size (px)
Citation preview
Cei
SBa
b
c
d
a
ARRA
KTZBN
3
0
Veterinary Parasitology 205 (2014) 451–459
Contents lists available at ScienceDirect
Veterinary Parasitology
jo u r nal homep age: www.elsev ier .com/ locate /vetpar
omparative biochemical changes in young Zebu cattlexperimentally infected with Trypanosoma vivax from tsetsenfested and non-tsetse infested areas of northwest Ethiopia
himelis Dagnachewa,∗, Getachew Terefea, Getachew Abebeb, Dave J. Barryc,runo M. Goddeerisd
Addis Ababa University, CVMA, P.O. Box: 34, Debre Zeit, EthiopiaFood and Agriculture Organization of the United Nations, FAO, Addis Ababa, EthiopiaUniversity of Glasgow, CMVLS, 120 University Place, G12 8TA Glasgow, United KingdomKatholieke Universiteit Leuven, Faculty of Bioscience Engineering, 30 bus 2456, B-3001 Heverlee, Belgium
r t i c l e i n f o
rticle history:eceived 17 February 2014eceived in revised form 16 August 2014ccepted 28 August 2014
eywords:rypanosoma vivaxebu cattleiochemical valuesorthwest Ethiopia
a b s t r a c t
Trypanosomosis is a vector-borne protozoan disease of animals and humans in sub-SaharanAfrica. In Ethiopia, particularly the northwest region is affected by both tsetse and non-tsetse transmitted trypanosomosis. The aim of the present study was to determine theeffects and compare differences in virulence of Trypanosoma vivax infection between tsetseand non-tsetse infested areas of northwest Ethiopia on the basis of serum biochemi-cal values in Zebu cattle. Eighteen cattles purchased from trypanosome free area andaged between 9 and 12 months were assigned into three groups of six animals (GroupTT = infected with T. vivax from tsetse infested area, Group NT = infected with T. vivaxfrom non-tsetse infested area and Group C = non-infected control). For each experimen-tal animal 3 ml of blood from naturally infected cattle was inoculated intravenously at 106
trypanosomes/ml except the control. Blood sample was collected once a week for 8 con-secutive weeks for analyzing serum biochemical values (glucose, total cholesterol, totalprotein, albumin, and enzymes including GOT, GPT and ALP) using a Humastar 80 clin-ical chemistry analyzer. Both T. vivax parasites caused an acute infection with parasitesappearing in circulation on 6 and 12 days post-infection for NT and TT cattle, respec-
tively. A significant reduction (P < 0.001) in glucose levels was observed in infected groupscompared with the control with mean values of 33.8 ± 3.6 mg/dl for TT, 34.3 ± 3.6 mg/dlfor NT and 70.9 ± 3.0 mg/dl for control groups. A similar reduction was also seen in totalcholesterol values (P = 0.001) with 70.4 ± 10.6 mg/dl for TT and 78.0 ± 10.6 mg/dl for NTgroups compared to 139.5 ± 8.7 mg/dl for the control group. No difference was observed for total serum protein between the three groups (P = 0.260) whereas the mean albumin∗ Corresponding author at: Addis Ababa University, College of Veterinary Medicine and Agriculture, Department of Pathology and Parasitology P.O. Box:4, Debre Zeit, Ethiopia. Tel.: +251 921681563; fax: +251 114339933.
E-mail addresses: [email protected], [email protected] (S. Dagnachew).
http://dx.doi.org/10.1016/j.vetpar.2014.08.031304-4017/© 2014 Elsevier B.V. All rights reserved.

452 S. Dagnachew et al. / Veterinary Parasitology 205 (2014) 451–459
level was significantly (P < 0.001) decreased (3.5 ± 0.1 g/dl and 2.9 ± 0.1 g/dl in TT and NTgroups respectively) compared to that for control cattle (4.5 ± 0.1 g/dl). On the other hand,infected groups had higher ALP values compared to the control (P = 0.007), with a meanvalue of 538.4 ± 64.4 IU/L, 564.9 ± 64.4 IU/L and 273.2 ± 52.6 IU/L for TT, NT and controlcattle, respectively. In conclusion, the two T. vivax parasites caused significant biochemicalchanges indicative of pathological responses. However, there was no significant variationbetween the two parasites in initiating these changes despite the difference in the onset ofparasitaemia.
1. Introduction
Trypanosomosis is a disease of domestic and wildanimals as well as humans caused by protozoan para-sites belonging to the genus Trypanosoma, and it remainsa serious setback to improved and profitable livestockand mixed-crop livestock farming in tropical Africa(Kristjanson et al., 1999; Swallow, 2002). In Ethiopia,trypanosomosis is distributed in wide areas particu-larly of the northwest region and is caused by bothtsetse and non-tsetse transmitted trypanosomes withhuge impact on livestock productivity (Abebe, 2005). Themost pathogenic trypanosome species responsible for thedisease in domestic livestock are Trypanosoma vivax, Try-panosoma congolense and Trypanosoma brucei in cattle,sheep, goats, horses and donkeys, and Trypanosoma simiaein pigs (Nantulya, 1990). Trypanosoma vivax is transmittedboth cyclically by tsetse flies and mechanically by otherbiting flies, covering large areas of sub-Saharan Africa andSouth America. The severity of the infection is influenced bya number of factors: virulence of the different species of try-panosomes, nutritional status and breed of cattle (Murrayet al., 1988; Awobode, 2006). Various disorders have beenreported consequent to trypanosome infection in animals(Logan-Henfrey et al., 1992; Esievo and Saror, 1991; Adamuet al., 2007). The disease leads to alterations in serumbiochemical parameters like liver enzymes, total protein,glucose and cholesterol (Wellde et al., 1989; Katunguka-Rwakishaya et al., 1992; Katunguka-Rwakishaya, 1996;Herrera et al., 2002). Tissue damage/reaction is also oneof the pathological indicators of animal trypanosomosisas evidenced by alterations in the serum enzyme levels.Mainly marked elevations in aspartate aminotransferase(AST), alanine aminotransferase (ALT) and alkaline phos-phatase (ALP) have been observed in pigs, rabbits and ratsexperimentally infected with T. brucei (Orhue et al., 2005)and T. congolense (Egbe-Nwiyi et al., 2003). The effects of thetrypanosome infection on serum biochemical parameterscan have a paramount importance on the pathophysiologyand outcome of the disease. Virulence may vary not onlybecause of the species and strain of the parasite but alsodue to the mode of transmission. For example, mechanicaltransmission of Plasmodium chabaudi (Spence et al., 2013)and T. brucei (Turner et al., 1995) in mice by needle pas-saging increases its virulence compared to transmissionthrough the insect vector. In the present study areas with
no relevant information on the virulence of trypanosomes,trypanocidal drug treatments are given frequently for thecontrol of the disease (Dagnachew et al., 2005; Cherenet© 2014 Elsevier B.V. All rights reserved.
et al., 2006; Sinshaw et al., 2006). Data on the virulenceof the parasite adapted for cyclical transmission and theone purely transmitted mechanically are important in eval-uating treatment responses and host resistance/toleranceto the infections as well as the distribution of the prob-lem. Therefore, in order to determine the disease effects ofT. vivax from tsetse (cyclical transmission) and non-tsetse(non-cyclical transmission) areas, a study was undertakenby measuring serum biochemical values to evaluate theeffects of the two parasites (from northwest Ethiopia) inexperimentally infected young Zebu cattle.
2. Materials and methods
2.1. Experimental animals
Eighteen indigenous Zebu (Bos indicus) cattle (6 maleand 12 female) aged 9–12 months were purchased froma trypanosome free area (Debre Brehan: northcentralEthiopia) located at 9◦4′ N and 39◦32′ E with an altitudeof 2840 m.a.s.l. about 130 km north of Addis Ababa. Theanimals were transferred into the fly-proof house of theCollege of Veterinary Medicine and Agriculture of AddisAbaba University at Debre Zeit located at 9◦6′ N and 37◦15′
E with an altitude of 1920 m.a.s.l. about 47 km east ofAddis Ababa. Animals were ear-tagged, examined for thepresence of trypanosomes and other blood parasites usingblood smear technique (Paris et al., 1982) and faecal eggcount method (Soulsby, 1982) for helminths. In order toavoid occurrence of pneumonia associated with transportstress and change of environment, each animal was treatedon arrival with oxytetracycline 20% w/v, (Chongqing Fang-tong Animal Pharmaceutical Co., Ltd., China). All animalswere treated with albendazole 2500 mg bolus and Iver-mectin (Chengdu Qiankum Veterinary PharmaceuticalsCo., Ltd., China) to control internal and external parasites.After treatment prior to the beginning of the experimentanimals were acclimatized for 1 month for the new envi-ronment, handling and feeding conditions.
2.2. Feeding and animal management
Animals were fed grass hay and supplemented withconcentrates of wheat bran and green Elephant grass.Water and mineral lick were available ad libitum. Thehandling of animals during the experiment was based on
international guiding principles for biomedical researchinvolving animals proposed by the Council for InternationalOrganizations of Medical Sciences (1985). The research was
ry Paras
atosvfn
2
tgTTi
2
odaZETmncessidmeta
2
2cwtfipopTl3iu
2
w(
S. Dagnachew et al. / Veterina
uthorized by the Animal Research Ethics Review Commit-ee of the College of Veterinary Medicine and Agriculturef the Addis Ababa University. All animals suffering fromevere infection with PCV below 15% and detectable ner-ous signs were treated with diminazene aceturate andailed to respond were euthanized by using overdose phe-obarbitol sodium intravenous administration.
.3. Experimental groups
After 1 month of acclimatization in the experimen-al house the animals were assigned randomly into threeroups of six animals per group: group TT = infected with. vivax from tsetse infested areas, group NT = infected with. vivax from non-tsetse infested areas and group C = non-nfected control.
.4. Trypanosome infections
Trypanosoma vivax used for the experiment werebtained from naturally infected cattle in Jabitehenanistrict of Birsheleko area (ETBS1) located at 10◦42′ Nnd 37◦16′ E for tsetse infested areas and in Bahir Daruria district (ETBD1) located at 11◦36′ N and 37◦23′
for non-tsetse infested areas of northwest Ethiopia.he trypanosome parasites were isolated from T. vivaxono-infected cattle in the field using parasitological tech-
ique (Murray and Mcintyre, 1977). The isolates wereonfirmed as pure T. vivax with screening PCR (Masigat al., 1992) and compared by microsatellite PCRs usingix different primers sets (Duffy et al., 2009). Howevertrain characterization was not done to show if eachs a clone of specific strain. The parasitaemia in theonor animals was estimated according to the “rapid-atching method” described by Herbert (1976). Each
xperimental animal received 3 ml of infected blood at 106
rypanosomes/ml by intravenous route except for the neg-tive control.
.5. Clinical examination and blood sample collection
During the experimental study period (November012–February 2013) all animals were examined daily forlinical parameters. For parasitological examination bloodas collected from the jugular vein using heparinized vacu-
ainer tubes (Murray and Mcintyre, 1977) daily for therst 2 weeks and once a week until the end of the studyeriod. Blood for serum biochemical analysis was collectednce a week for eight consecutive weeks during the studyeriod from the jugular vein using plain vacutainer tubes.he samples collected for serum biochemical analysis wereeft on the bench until clotting and then centrifuged at400 rpm for 10 min. The serum was carefully decanted
nto aliquots of 1.5 ml eppendorf tubes and kept at −20 ◦Cntil biochemical analysis.
.6. Determination of serum biochemical values
A Humastar 80 clinical chemistry autoanalyzer machineas used for the analysis of serum biochemical values
glucose, total cholesterol, total protein, albumin, and
itology 205 (2014) 451–459 453
enzymes including GOT/AST, GPT/ALT and ALP) and HumanGmbH (Wiesbaden, Germany) standard commercial testkits were used according to manufacturer’s instruction.The programme was set on the instrument for all thetests selected from test menu. Thereafter the machine wascalibrated using calibrator (Autocal). Quality control testswere done with normal (Humatrol N) and pathological(Humatrol P) samples each day before running samplesfor tests. Then adequate controls and serum samples wereplaced in sample cup and working reagents was addedin reagent bottles and put in order in the instrument.The instrument by itself pipettes programmed samplevolume and working reagent and incubates for 5 min at37 ◦C. Finally, absorbance was read from colour formationat the appropriate wavelength and the results were dis-played on the screen. The serum values of total proteinand albumin were determined by photometric colorimet-ric test while serum values of glucose, total cholesteroland enzymes were measured by enzymatic colorimetrictest.
2.7. Statistical analysis
Analysis of the means between treatment groups wasdone with the Statistical Program for Social Sciences(SPSS version-20) computer program. The General LinearModel repeated measure ANOVA was used for statis-tical analysis and the level of significance was set atP < 0.05.
3. Results
3.1. Clinical manifestations
The experimental infection with T. vivax from tsetse andnon-tsetse infested areas of northwest Ethiopia revealedan acute form of trypanosomosis with major clinicalfindings of reduced feed intake, fever, enlarged lymphnodes, oedema, anaemia, emaciation and nervous signs.These major clinical findings were observed within 21days post-infection. Following parasite detection in theblood, there was a rise in rectal temperature in thefirst week post-infection (p.i.) for the NT group (peakup to 40.5 ◦C) and in the second week p.i. (peak up to40 ◦C) in the TT group (Fig. 1A). The non-infected con-trol animals had fluctuations in rectal temperature butit remained below 39 ◦C. The overall Mean ± SD of rectaltemperature measured 2–4 days interval during the studyperiod were 39.001 ± 0.544 for TT group, 38.729 ± 0.666for NT group and 38.117 ± 0.360 for C-non-infected con-trol groups of cattle. Appearance of peak parasitaemiaand clinical signs in all experimental cattle were ear-lier in the NT group (day 8 p.i.) than in the TT group(day14 p.i.) as shown in Fig. 1B. There were four animals(two from NT and 2 from TT groups) that showed PCVbelow acceptable level (15%) and nervous signs. These
animals were euthanized after failing to respond for dimi-nazine aceturate treatment at day 30 post-infection usingan overdose phenobarbitol sodium intravenous adminis-tration.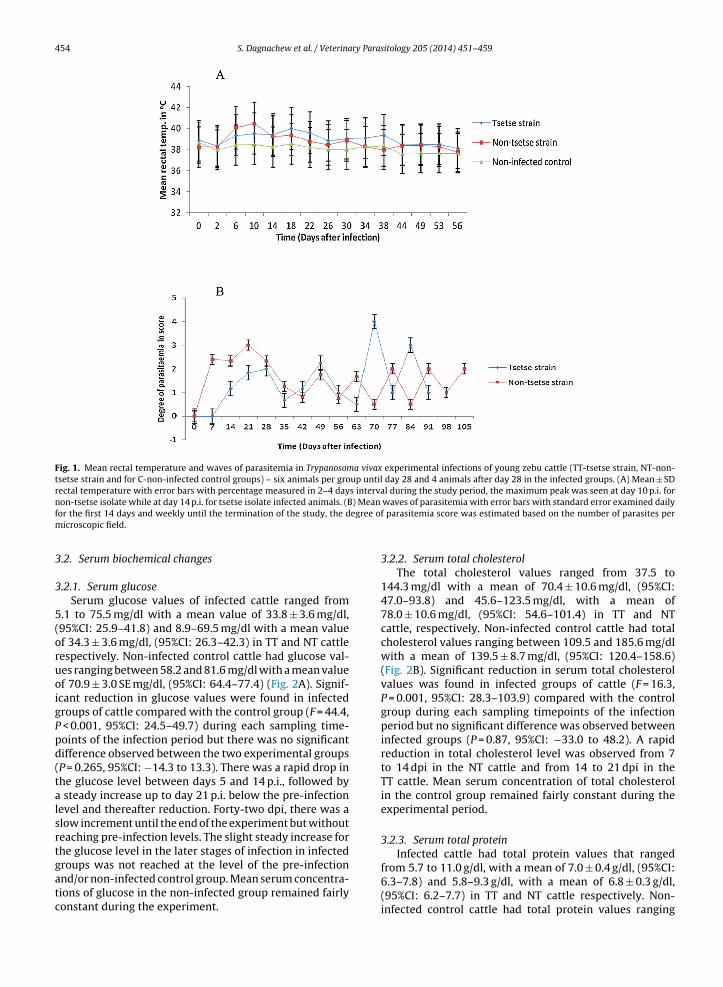
454 S. Dagnachew et al. / Veterinary Parasitology 205 (2014) 451–459
Fig. 1. Mean rectal temperature and waves of parasitemia in Trypanosoma vivax experimental infections of young zebu cattle (TT-tsetse strain, NT-non-tsetse strain and for C-non-infected control groups) – six animals per group until day 28 and 4 animals after day 28 in the infected groups. (A) Mean ± SDrectal temperature with error bars with percentage measured in 2–4 days interval during the study period, the maximum peak was seen at day 10 p.i. for
) Meanegree o
non-tsetse isolate while at day 14 p.i. for tsetse isolate infected animals. (Bfor the first 14 days and weekly until the termination of the study, the dmicroscopic field.
3.2. Serum biochemical changes
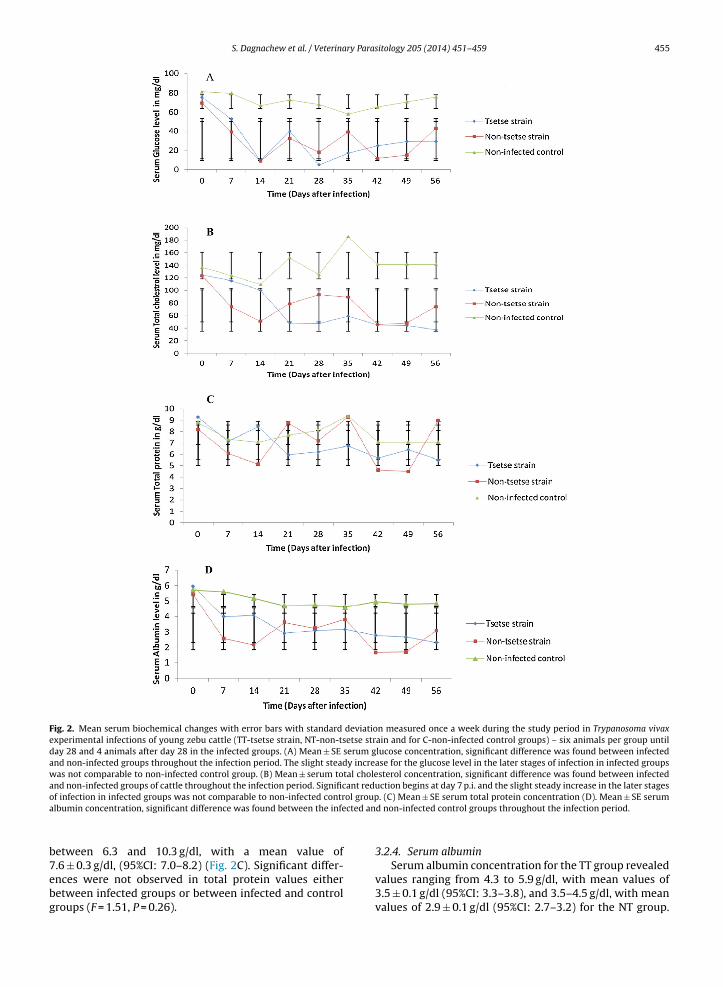
3.2.1. Serum glucoseSerum glucose values of infected cattle ranged from
5.1 to 75.5 mg/dl with a mean value of 33.8 ± 3.6 mg/dl,(95%CI: 25.9–41.8) and 8.9–69.5 mg/dl with a mean valueof 34.3 ± 3.6 mg/dl, (95%CI: 26.3–42.3) in TT and NT cattlerespectively. Non-infected control cattle had glucose val-ues ranging between 58.2 and 81.6 mg/dl with a mean valueof 70.9 ± 3.0 SE mg/dl, (95%CI: 64.4–77.4) (Fig. 2A). Signif-icant reduction in glucose values were found in infectedgroups of cattle compared with the control group (F = 44.4,P < 0.001, 95%CI: 24.5–49.7) during each sampling time-points of the infection period but there was no significantdifference observed between the two experimental groups(P = 0.265, 95%CI: −14.3 to 13.3). There was a rapid drop inthe glucose level between days 5 and 14 p.i., followed bya steady increase up to day 21 p.i. below the pre-infectionlevel and thereafter reduction. Forty-two dpi, there was aslow increment until the end of the experiment but withoutreaching pre-infection levels. The slight steady increase forthe glucose level in the later stages of infection in infected
groups was not reached at the level of the pre-infectionand/or non-infected control group. Mean serum concentra-tions of glucose in the non-infected group remained fairlyconstant during the experiment.waves of parasitemia with error bars with standard error examined dailyf parasitemia score was estimated based on the number of parasites per
3.2.2. Serum total cholesterolThe total cholesterol values ranged from 37.5 to
144.3 mg/dl with a mean of 70.4 ± 10.6 mg/dl, (95%CI:47.0–93.8) and 45.6–123.5 mg/dl, with a mean of78.0 ± 10.6 mg/dl, (95%CI: 54.6–101.4) in TT and NTcattle, respectively. Non-infected control cattle had totalcholesterol values ranging between 109.5 and 185.6 mg/dlwith a mean of 139.5 ± 8.7 mg/dl, (95%CI: 120.4–158.6)(Fig. 2B). Significant reduction in serum total cholesterolvalues was found in infected groups of cattle (F = 16.3,P = 0.001, 95%CI: 28.3–103.9) compared with the controlgroup during each sampling timepoints of the infectionperiod but no significant difference was observed betweeninfected groups (P = 0.87, 95%CI: −33.0 to 48.2). A rapidreduction in total cholesterol level was observed from 7to 14 dpi in the NT cattle and from 14 to 21 dpi in theTT cattle. Mean serum concentration of total cholesterolin the control group remained fairly constant during theexperimental period.
3.2.3. Serum total proteinInfected cattle had total protein values that ranged
from 5.7 to 11.0 g/dl, with a mean of 7.0 ± 0.4 g/dl, (95%CI:6.3–7.8) and 5.8–9.3 g/dl, with a mean of 6.8 ± 0.3 g/dl,(95%CI: 6.2–7.7) in TT and NT cattle respectively. Non-infected control cattle had total protein values ranging
S. Dagnachew et al. / Veterinary Parasitology 205 (2014) 451–459 455
Fig. 2. Mean serum biochemical changes with error bars with standard deviation measured once a week during the study period in Trypanosoma vivaxexperimental infections of young zebu cattle (TT-tsetse strain, NT-non-tsetse strain and for C-non-infected control groups) – six animals per group untilday 28 and 4 animals after day 28 in the infected groups. (A) Mean ± SE serum glucose concentration, significant difference was found between infectedand non-infected groups throughout the infection period. The slight steady increase for the glucose level in the later stages of infection in infected groupswas not comparable to non-infected control group. (B) Mean ± serum total cholesterol concentration, significant difference was found between infectedand non-infected groups of cattle throughout the infection period. Significant reduction begins at day 7 p.i. and the slight steady increase in the later stageso ol groupa cted an
b7ebg
f infection in infected groups was not comparable to non-infected contrlbumin concentration, significant difference was found between the infe
etween 6.3 and 10.3 g/dl, with a mean value of
.6 ± 0.3 g/dl, (95%CI: 7.0–8.2) (Fig. 2C). Significant differ-nces were not observed in total protein values eitheretween infected groups or between infected and controlroups (F = 1.51, P = 0.26).. (C) Mean ± SE serum total protein concentration (D). Mean ± SE serumd non-infected control groups throughout the infection period.
3.2.4. Serum albumin
Serum albumin concentration for the TT group revealedvalues ranging from 4.3 to 5.9 g/dl, with mean values of3.5 ± 0.1 g/dl (95%CI: 3.3–3.8), and 3.5–4.5 g/dl, with meanvalues of 2.9 ± 0.1 g/dl (95%CI: 2.7–3.2) for the NT group.
ry Paras
456 S. Dagnachew et al. / VeterinaNon-infected control cattle had serum albumin valuesranging between 4.1 and 7.2 g/dl, with a mean value of4.5 ± 0.1 g/dl (95%CI: 4.3–4.7) (Fig. 2D). There was a sig-nificant difference in albumin levels between infected andcontrol groups (F = 59.614, P < 0.001). A significant differ-ence was also observed between the TT and NT groups(P = 0.001, 95%CI: 0.28–0.98). A rapid decline in albuminlevel until 14 dpi in NT cattle, a gradual fall in TT cattle andno change in non-infected control cattle were observed.
3.2.5. Serum GOT (AST)Serum GOT values range from 74.5 to 358.2 IU/L, with a
mean value of 208.4 ± 24.9 IU/L, (95%CI: 129.4–238.9), forthe TT group, and from 83.2 to 349.9 IU/L, with a meanvalue of 162.5 ± 21.9 IU/L, (95%CI: 96.8–206.3) for NT cat-tle. In control cattle, GOT values ranged between 73.2 and234.3 IU/L, with a mean value of 134.5 ± 20.3 IU/L, (95%CI:89.8–179.2) (Fig. 3A). There was no significant difference inGOT values between infected groups of cattle and the con-trol group (F = 1.199, P = 0.350), but relatively higher meanvalues were recorded in the infected groups especially inthe later stage of the infection for both infected groups andeven earlier in the group receiving the tsetse trypanosomes.
3.2.6. Serum GPT (ALT)Infected cattle had serum GPT values from 22.8 to
59.3 IU/L, with a mean value of 32.5 ± 3.4 IU/L, for TT groupand 25.6 to 50.9 IU/L, with a mean value of 33.3 ± 3.4 IU/L,in NT infected cattle. Control group GPT values rangedfrom 27.2 to 38.5 IU/L, with a mean value of 31.5 ± 2.8 IU/L(Fig. 3B). No significant differences in GPT values werefound between infected and control groups of cattle(F = 0.790, P = 0.482).
3.2.7. Serum ALPSerum ALP values ranged from 321.0 to 671.8 IU/L, with
a mean value of 538.4 ± 64.4 IU/L (95%CI: 396.7–680.1), forthe TT group, and 230.5–880.8 IU/L, with a mean valueof 564.9 ± 64.4 IU/L (95%CI: 423.2–706.5), for NT infectedcattle. On the other hand, control cattle had ALP valuesranging between 214.1 and 352.7 IU/L, with a mean value of273.2 ± 52.6 IU/L (95%CI: 157.5–388.9) (Fig. 3C). Significantincrease in ALP values was found in infected groups of cat-tle compared with the control group (F = 8.064, P = 0.007),in each sampling timepoints of the study period but no sig-nificant differences were observed between the infectedgroups (P = 0.963, 95%CI: −272.3 to 219.3).
4. Discussion
4.1. Development of clinical manifestations
Acute clinical manifestations including reduced feedintake, fever, enlarged lymph nodes, oedema, anaemia,emaciation and nervous signs were observed in bothgroups of T. vivax experimentally infected cattle within
21 days post-infection. Four animals that showed nervoussigns and PCV below 15% were treated with diminazeneaceturate but failed to respond and hence humanely eutha-nized using an overdose phenobarbitol sodium intravenousitology 205 (2014) 451–459
administration at day 30 post-infection. This finding dif-fers from the views about T. vivax strains in East Africabeing less pathogenic than the West African T. vivax strains(Stephen, 1986). Fever and parasitaemia appeared earlierin the NT than in the TT infected cattle. The most likelyexplanation for the early onset of parasitaemia in the NTinfected cattle could be the increased growth rate of the NTparasite. Research works on T. brucei (Turner et al., 1995)and P. chabaudi (Spence et al., 2013) have shown that whenthese parasites are syringe passaged in rodents there isan increase in parasitaemia and virulence. This has beenattributed to a lack of a reset when going through the vec-tor. In the current work although parasites appeared in theblood faster virulence did not seem to be increased.
The present study agrees with previous reports thatthe prepatent period of infection by T. vivax is variable,depending on the host and the parasite isolate. In sheepand goats, the incubation period lasts for 4–12 days, whilein cattle it ranges from 9 to 14 days for virulent isolatesand from 9 to 59 days for less pathogenic isolates (Hoare,1972; Stephen, 1986). Similar experiments carried out onyoung zebu cattle (Bos indicus) following infection withthe Samaru strain of T. vivax caused an acute infection,with parasites appearing in circulation on day 2 of infectionand peaking on day 5 post-infection (Kadima et al., 2000).Other studies undertaken on infections of T. vivax in sheepand goats indicated mortality and abortions in the Brazil-ian semiarid region where outbreaks had been previouslyreported in cattle (Batista et al., 2009).
4.2. Serum biochemical abnormality
Parallel to the clinical manifestations, we observedseveral biochemical changes indicative of pathologicaland functional disturbances in infected groups. Significantreductions were noticed in serum glucose, total choles-terol and albumin as well as an increase in ALP levelsin infected cattle compared with the control group. Thereduction in the serum glucose levels until 14 dpi could beexplained by the parasite’s need for glucose as an energysource (Opperdoes et al., 1986). Subsequent significantincreases of glucose levels when parasites had becomesubpatent seemed to corroborate the above suggestion ofa parasite/glucose relationship and indeed subsequentlythere occurred alternating fluctuations of glucose level ininverse correlation with the wave of parasitaemia. This isa common finding in trypanosomosis (Anosa, 1988). Simi-lar reduction in serum glucose levels has been reported insheep experimentally infected with T. congolense (Taiwoet al., 2003), in West African Dwarf goats (Faye et al.,2005) infected with T. congolense and T. brucei, in cattleinfected with T. vivax (Kadima et al., 2000) and in camelsinfected with trypanosomes (Padmaja, 2012). Four infectedanimals in the current study displayed nervous signs andPCV below15% were euthanized because of severe clin-ical manifestation even after treatment, which suggeststhe development of encephalopathy associated with hypo-
glycemia and or damage to brain tissue by the parasite.Moreover, the findings of nervous signs in the present studycould be the possible crossing of brain by T. vivax as it wasreported previously in some species of trypanosomes such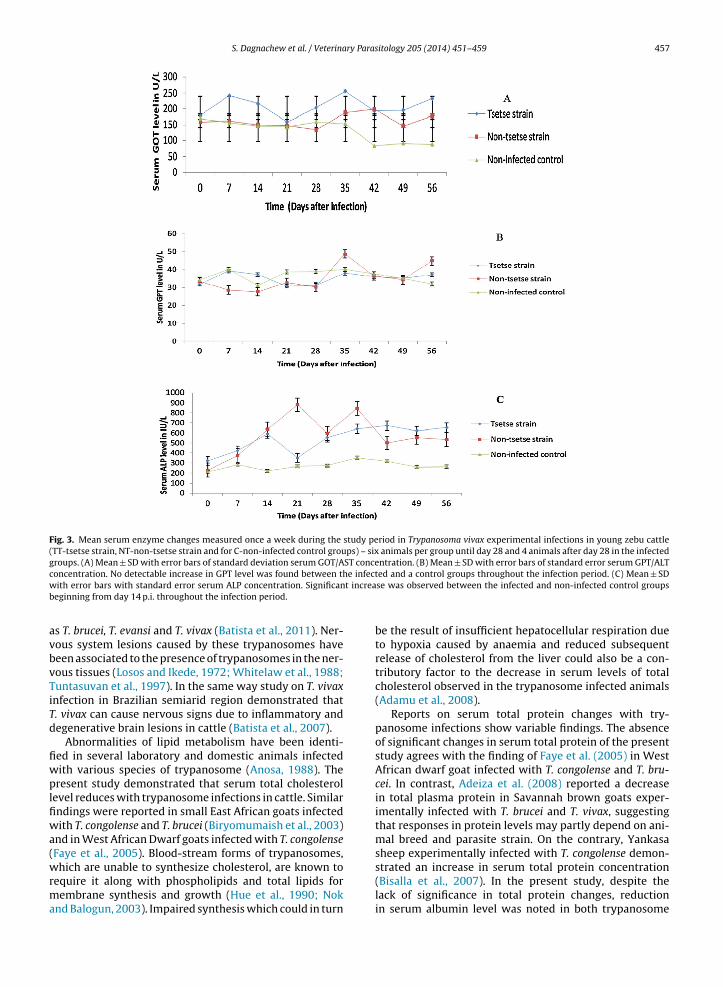
S. Dagnachew et al. / Veterinary Parasitology 205 (2014) 451–459 457
Fig. 3. Mean serum enzyme changes measured once a week during the study period in Trypanosoma vivax experimental infections in young zebu cattle(TT-tsetse strain, NT-non-tsetse strain and for C-non-infected control groups) – six animals per group until day 28 and 4 animals after day 28 in the infectedgroups. (A) Mean ± SD with error bars of standard deviation serum GOT/AST concentration. (B) Mean ± SD with error bars of standard error serum GPT/ALTc e infectw t increab
avbvTiTd
fiwplfiwa(wrma
oncentration. No detectable increase in GPT level was found between thith error bars with standard error serum ALP concentration. Significan
eginning from day 14 p.i. throughout the infection period.
s T. brucei, T. evansi and T. vivax (Batista et al., 2011). Ner-ous system lesions caused by these trypanosomes haveeen associated to the presence of trypanosomes in the ner-ous tissues (Losos and Ikede, 1972; Whitelaw et al., 1988;untasuvan et al., 1997). In the same way study on T. vivaxnfection in Brazilian semiarid region demonstrated that. vivax can cause nervous signs due to inflammatory andegenerative brain lesions in cattle (Batista et al., 2007).
Abnormalities of lipid metabolism have been identi-ed in several laboratory and domestic animals infectedith various species of trypanosome (Anosa, 1988). Theresent study demonstrated that serum total cholesterol
evel reduces with trypanosome infections in cattle. Similarndings were reported in small East African goats infectedith T. congolense and T. brucei (Biryomumaish et al., 2003)
nd in West African Dwarf goats infected with T. congolenseFaye et al., 2005). Blood-stream forms of trypanosomes,
hich are unable to synthesize cholesterol, are known toequire it along with phospholipids and total lipids forembrane synthesis and growth (Hue et al., 1990; Nok
nd Balogun, 2003). Impaired synthesis which could in turn
ed and a control groups throughout the infection period. (C) Mean ± SDse was observed between the infected and non-infected control groups
be the result of insufficient hepatocellular respiration dueto hypoxia caused by anaemia and reduced subsequentrelease of cholesterol from the liver could also be a con-tributory factor to the decrease in serum levels of totalcholesterol observed in the trypanosome infected animals(Adamu et al., 2008).
Reports on serum total protein changes with try-panosome infections show variable findings. The absenceof significant changes in serum total protein of the presentstudy agrees with the finding of Faye et al. (2005) in WestAfrican dwarf goat infected with T. congolense and T. bru-cei. In contrast, Adeiza et al. (2008) reported a decreasein total plasma protein in Savannah brown goats exper-imentally infected with T. brucei and T. vivax, suggestingthat responses in protein levels may partly depend on ani-mal breed and parasite strain. On the contrary, Yankasasheep experimentally infected with T. congolense demon-
strated an increase in serum total protein concentration(Bisalla et al., 2007). In the present study, despite thelack of significance in total protein changes, reductionin serum albumin level was noted in both trypanosome
ry Paras
458 S. Dagnachew et al. / Veterinainfected groups. Herrera et al. (2002) showed that total pro-tein and gamma globulins increased while serum albumindecreased in several trypanosome infections. Nadia et al.(2011) reported similar findings in T. vivax infected goats,Faye et al. (2005) in T. congolense infected West AfricanDwarf goats and Osman et al. (2011) in T. vivax infectedNubian goats. These changes might be due to liver damagecausing depressed albumin values (Cheesebrough, 1999).Conversely, Igbokwe and Mohammed (1992) reported nor-mal albumin levels in T. brucei infected Sokoto Red goats.The majority of infected cattle in our study developedoedema in the early and late stage of infection which mightbe associated to hypoalbuminemia. A similar manifestationon oedema has been reported during the chronic stage oftrypanosome infections (Orhue et al., 2005).
Changes in enzyme levels are a good marker of softtissue damage and that damage to body cells results inthe alteration of membrane permeability and consequentrelease of enzymes into the extracellular fluid (Obaleyeet al., 2007). Serum GOT/AST and GPT/ALT remained withinnormal range whereas the level of ALP was elevated ininfected groups. Our findings support previous studieswhich show that ALT levels in infected animals remainedconsistent within the pre-infection ranges throughout thecourse of the experimental study (Taiwo et al., 2003). Thepresent finding confirms the significant increase of ALPvalues in infected cattle compared to the control group.The rise in ALP level which was seen in the later stage ofthe disease may be associated with damage to the liveror bone hemopoietic system, the two major sites of ALPproduction. This finding disagrees with Taiwo et al. (2003)who did not find significant changes in ALP from the pre-infection levels in West African dwarf goats experimentallyinfected with T. brucei. On the other hand, the same authorsreported an increase in the level of ALP when the goats wereinfected with T. congolense, suggesting that host responsesmay differ according to parasite species. Raised levels ofALP can be seen in inflammatory conditions of the gut andliver (Oyewole and Malomo, 2009). Losos and Ikede (1972)reported that the liver has on occasion been regarded as thesite of lesions considered characteristic for diseases causedby T. vivax and T. congolense.
Changes in serum biochemical parameters have beenassociated with several factors (including the strain ofthe parasite and variability in susceptibility to infection)that influence the nature and severity of the responses(Anosa, 1988). However, this study demonstrated no sig-nificant difference between TT and NT infected cattle forall biochemical parameters tested except for serum albu-min where the values were lower in NT group. This lack indifference is perhaps not surprising as the levels of para-sitaemia were high in both infected groups despite theirdifference in onset.
5. Conclusion
The results of the present study showed an acute T. vivax
infection in cattle with a variety of changes in the hostbiochemical parameters. Comparison between infectedand non-infected groups of cattle indicated infectioncaused significant changes in biochemical values whereasitology 205 (2014) 451–459
comparison between the two infected groups did not dis-play a difference in serum biochemical values, except forserum albumin which was lower for the NT group. Earlyonset of parasitaemia was observed in the NT group com-pared to the TT group. Therefore, further investigationswith more characterized strains of T. vivax isolated fromboth areas are vital to elucidate the biochemical differencesthat exist in the serum biochemical metabolism betweenhost and parasite so that metabolic targets can be identifiedin the parasite to develop chemotherapeutic agents.
Acknowledgements
The author would like to thank the all staff of BahirDar Regional Veterinary Laboratory for the logistic supportand enthusiastic encouragement during the field work. Thiswork was supported by Ethio-Belgium VLIR project (grantno. ZEIN2006PR324), GALVmed, RSMFP of the World Bankand the thematic research project ‘Animal Health Improve-ment’ of Addis Ababa University.
References
Abebe, G., 2005. Review article: Trypanosomosis in Ethiopia. Ethio. J. Biol.Soc. 4, 75–121.
Adamu, S., Fatihu, M.Y., Useh, N.M., Mamman, M., Sekoni, V.O., Esievo,K.A.N., 2007. Sequential testicular and epididymal damage in Zebubulls experimentally infected with Trypanosoma vivax. Vet. Parasitol.143, 29–34.
Adamu, S., Ige, A.A., Jatau, I.D., Neils, J.S., Useh, N.M., Bisalla, M., Nok, I.A.J.,Esievo, K.A.N., 2008. Changes in the serum profiles of lipids and choles-terol in sheep experimental model of acute African trypanosomosis.Afr. J. Biotech. 7 (12), 2090–2098.
Adeiza, A.A., Maikai, V.A., Lawal, A.I., 2008. Comparative haematologi-cal changes in experimentally infected Savannah brown goats withT. brucei and T. vivax. Afri. J. Biotech. 7 (13), 2295–2298.
Anosa, V.O., 1988. Haematological and biochemical changes in human andanimal trypanosome. Rev. Elev. Med. Vet. Pays Trop. 41, 151–164.
Awobode, H.O., 2006. The biochemical changes induced by natural humanAfrican trypanosome infections. Afr. J. Biotech. 5 (9), 738–742.
Batista, J.S., Riet-Correa, F., Teixeira, M.M.G., Madruga, C.R., Simões, S.D.V.,Maia, T.F., 2007. Trypanosomiasis by T. vivax in cattle in the Brazil-ian semiarid: description of an outbreak and lesions in the nervoussystem. Vet. Parasitol. 143, 174–181.
Batista, J.S., Oliveira, A.F., Rodrigues, C.M.F., Damasceno, C.A.R., Oliveira,I.R.S., Alves, H.M., Paiva, E.S., Brito, P.D., Medeiros, J.M.F., Rodrigues,A.C., Teixeira, M.M.G., 2009. Infection by T. vivax in goats and sheep inthe Brazilian semiarid region: from acute disease outbreak to chroniccryptic infection. Vet. Parasitol. 165, 131–135.
Batista, J.S., Rodrigues, C.M.F., García, H.A., Bezerra, F.S.B., Olinda, R.G.,Teixeira, M.M.G., Blanco, B.S., 2011. Association of Trypanosoma vivaxin extracellular sites with central nervous system lesions and changesin cerebrospinal fluid in experimentally infected goats. Vet. Res. 42,63.
Biryomumaish, S., Katumguka-Rwakishaya, E., Rubaire-Akiiki, C.M., 2003.Serum biochemical changes in experimental T. congolense and T. bruceiinfection in small East Africa Goats. Vet. Arch. 73 (3), 167–180.
Bisalla, M., Ibrahim, N.D.G., Lawal, I.A., Esievo, K.A.N., 2007. Serum totalproteins, albumin and albumin globulin ratio in Yankasa sheep exper-imentally infected with T. congolense and immunomodulated withlevamisole. J. Protozool. Res. 17, 39–43.
Cheesebrough, M., 1999. Medical Laboratory Manual for TropicalCountries, ELBS ed. Pitman Press Ltd., Britain.
Cherenet, T., Sani, R.A., Panandam, J.M., Nadzr, S., Speybroeck, N., Van denBossche, P., 2006. A comparative longitudinal study of bovine try-panosomiasis in tsetse-free and tsetse-infested zones of the AmharaRegion, northwest Ethiopia. Vet. Parasitol. 140, 251–258.
Dagnachew, S., Sangwan, A.K., Abebe, G., 2005. Epidemiology of bovinetrypanosomosis in the Abay (Blue Nile) basin areas of northwestEthiopia. Rev. Med. Vet. 58, 151–157.
Duffy, C.W., Morrison, L.J., Black, A., Pinchbeck, G.L., Christley, R.M.,Schoenefeld, A., Tait, A.C., Turner, M.R., MacLeod, A., 2009.
ry Paras
E
E
F
H
H
H
H
I
I
K
K
K
K
L
L
M
M
M
N
Med. Parasitol. 83, 133–134.Whitelaw, D.D., Gardiner, P.R., Murray, M., 1988. Extravascular foci of
S. Dagnachew et al. / Veterina
Trypanosoma vivax displays a clonal population structure. Int. J. Para-sitol. 39, 1475–1483.
gbe-Nwiyi, T.N., Olushile, O.M., Mshelbwala, F., 2003. The effects of oralMagnesium chlroride supplementation on the pathogenicity of T. bru-cei and T. congolense infections in rats. Biosci. Res. Commun. 15, 1–7.
sievo, K.A.N., Saror, D.I., 1991. Immunochemistry and immunopathologyof animal trypanosomiasis. Vet. Bull. 61, 765–777.
aye, D., Fall, A., Leak, S., Losson, B., Geerts, S., 2005. Influence of an exper-imental Trypanosoma congolense infection and plane of nutrition onmilk production and some biochemical parameters in West AfricanDwarf goats. Acta Trop. 93, 247–257.
erbert, W.J., 1976. Trypanosoma brucei: a rapid matchingmethod forestimating the host’s parasitaemia. Exp. Parasitol. 40, 427–431.
errera, H.M., Aquino, L.P.C.T., Menezes, R.F., 2002. Trypanosoma evansiexperimental infection in the South American coati (Nasuna nasua):hematological, biochemical and histopathological changes. Acta Trop.81, 203–210.
oare, C., 1972. The Trypanosomes of Mammals: A Zoological Monograph.Blackwell Scientific Publications, Oxford/Edinburgh.
ue, G., Lemsre, J.L., Grard, G., Boutignon, F., Dieu, M.C., Janinin, J., Degand,P., 1990. Serum lipid and lipoprotein abnormalities in human Africantrypanosomosis. Trans. R. Soc. Trop. Med. Hyg. 84, 792–794.
gbokwe, I.O., Mohammed, A., 1992. Some plasma biochemical changesin experimental T. brucei infection of Sokoto red goats. Rev. Eelv.Med.Vet. Pays. Trop. 45, 287–290.
nternational Guiding Principles for Biomedical Research Involving Ani-mals (1985)-developed by the Council for International Organizationsof Medical Sciences (CIOMS).
adima, K.B., Erastus, Gyang, O., Daniel, Saror, I., Esievo, K.A.N., 2000.Serum biochemical values of T. vivax-infected cattle and the effectsof lactose in saline infusion. Vet. Arh. 70 (2), 67–74.
atunguka-Rwakishaya, E., 1996. Influence of T. congolense infection onsome blood inorganic and protein constituents in sheep. Rev. Elev.Med. Vet. Pays. Trop. 49, 311–314.
atunguka-Rwakishaya, E., Murray, M., Holmes, P.H., 1992. The patho-physiology of ovine trypanosomiasis: haematological and bloodbiochemical changes. Vet. Parasitol. 45, 17.
ristjanson, P.M., Swallow, B.M., Rowlands, G.J., Kruska, R.L., de Leeuw,P.N., 1999. Measuring the cost of African animal trypanosomosis, thepotential benefits of control and returns to research. Elsevier Agric.Syst. 59, 79–98.
ogan-Henfrey, L.L., Gardiner, P.R., Mahmoud, M.M., 1992. In: Kreier, J.P.,Baker, J.R. (Eds.), Parasitic Protozoa. Academic Press, San Diego, pp.157–275.
osos, G.J., Ikede, B.O., 1972. A review of pathology of diseases in domesticand laboratory animals caused by T. congolense, T., vivax, T. rhoden-siense and T. gambiense. Vet. Pathol. 9, 1–7.
asiga, D.K., Smyth, A.J., Hayes, P., Bromidge, T.J., Gibson, W.C., 1992. Sen-sitive detection of trypanosomes in tsetse flies by DNA amplification.Int. J. Parasitol. 22, 909–918.
urray, M.P.K., Mcintyre, W.I.M., 1977. An improved parasitological tech-nique for the diagnosis of African trypanosomosis. Trans. R. Soc. Trop.Med. Hyg. 71, 325–326.
urray, M., Morrison, W.I., Whitelaw, D.D., 1988. Host susceptibility to
African trypanosomiasis: trypanotolerance. Adv. Parasitol. 1, 1–68.adia, M.O., Kaila, G.J., Eltahir, H.A., Rahman, A.H.A., 2011. Serum bio-chemical changes in Nubian Goats, Nilotic Dwarf Goats and GaragEwes experimentally infected with a mechanically transmitted T.vivax stock. Int. J. Biol. Chem. 5, 136–142.
itology 205 (2014) 451–459 459
Nantulya, V.M., 1990. Trypanosomiasis in domestic animals: the problemsof diagnosis. Rev. Sci. Tech. 9, 357–367.
Nok, A.J., Balogun, E.O., 2003. A bloodstream T. congolense sialidasecould be involved in anaemia during experimental trypanosomiasis.J. Biochem. 133, 725–730.
Obaleye, J.A., Akinremi, C.A., Balogun, E.A., Adebayo, J.O., 2007. Toxicolog-ical studies and antimicrobial properties of some Iron (III) complexesof Ciprofloxacin. Afr. J. Biotech. 6 (24), 2826–2832.
Opperdoes, F.R., Hart, D.T., Baudhuin, P., 1986. Biogenesis of glycosomes(microbodies) in the Trypanosomatdae, T. brucei. Eur. J. Cell Biol. 41(14), 30.
Orhue, N.E.J., Nwanze, E.A.C., Okafor, A., 2005. Serum total protein,albumin and globulin levels in Trypanosoma brucei-infected rabbits:effect of orally administered Scoparia dulcis. Afr. J. Biotech. 4,1152–1155.
Osman, N., Ghada, M., Kaila, J., Eltahir, H.A., Rahman, A.H.A., 2011. Serumbiochemical changes in Nubian goats, Nilotic Dwarf goats and Garagewes experimentally infected with a mechanically transmitted T.vivax stock. Int. Jour. Biol. Chem. 5, 136–142.
Oyewole, O.I., Malomo, S.O., 2009. Toxicological assessment of oral admin-istration of some antisickling agents in rats. Afr. J. Biochem. Res. 3 (2),024–028.
Padmaja, K., 2012. Haemato-biochemical studies of camels infected withtrypanosomiasis. Vet. World 5 (6), 356–358.
Paris, J., Murray, M., McOimba, F., 1982. A comparative evaluation ofthe parasitological techniques currently available for the diagnosisof African Animal trypanosomosis in cattle. Acta Trop 39, 307–316.
Sinshaw, A., Abebe, G., Desquesnes, M., Yoin, W., 2006. Biting flies andT. vivax infection in three highland district bordering Lake Tana,Ethiopia. Vet. Parasitol. 142, 35–46.
Soulsby, E.J.L., 1982. Helminths, Arthropods and Protozoa of DomesticatedAnimals, 7th ed. Tindall, London, pp. 630–645.
Spence, P.J., Jarra, W., Lévy, P., Reid, A.J., Chappell, L., Brugat, T., Sanders, M.,Berriman, M., Langhorne, J., 2013. Malaria’s severity reset by mosquito.Vector transmission regulates immune control of Plasmodium viru-lence. Nature 498, 228–231.
Stephen, L.E., 1986. Trypanosomiasis: A Veterinary Perspective. PergamonPress, Oxford, UK.
Swallow, B.M., 2002. Impact of trypanosomiasis on agriculture. PAATTechnical and Scientific Series, 2. Food and Agriculture Organization(FAO), pp. 35–38.
Taiwo, V.O., Olaniyi, M.O., Ogunsanmi, A.O., 2003. Comparative plasmabiochemical changes and susceptibility of erythrocytes to in vitro per-oxidation during experimental T. congolense and T. brucei infectionsin sheep. J. Isreal Vet. Med. 58 (4), 435–443.
Tuntasuvan, D., Sarataphan, N., Nishikawa, H., 1997. Cerebral trypanoso-miasis in native cattle. Vet. Parasitol. 73, 357–363.
Turner, C.M.R., Aslam, N., Dye, C., 1995. Replication, differentiation, growthand the virulence of Trypanosoma brucei infections. Parasitology 11(3), 289–300.
Wellde, B.T., Rearson, M.J., Kovatch, R.M., Chumo, W.T., Wykoff, D.E., 1989.Experimental infection of cattle with T. brucei rhodesiense. Ann. Trop.
Trypanosoma vivax in goats: the central nervous system and aque-ous humor of the eye as potential sources of relapse infections afterchemotherapy. Parasitology 97, 51–61.


