Embed Size (px)
Citation preview
Molecular Ecology (2009) 18, 2787–2797 doi: 10.1111/j.1365-294X.2009.04233.x
Population sizes and dispersal pattern of tsetse flies: rollingon the river?
J . BOUYER,*† T . BALENGHIEN,* S . RAVEL,‡ L. VIAL,* I . S IDIBE ,† S . THEVENON,‡ P. SOLANO†‡
and T. DE MEEUS†‡§
*Cirad, UMR CIRAD-INRA Controle des maladies animales, Campus International de Baillarguet, F34398, Montpellier, France,
†Centre International de Recherche-developpement sur l’Elevage en Zone Subhumide (CIRDES), BP 454, Bobo-Dioulasso, Burkina
Faso, ‡Institut de Recherche pour le Developpement, Unite mixte de Recherche IRD-CIRAD 177, Campus International de Baillarguet,
34398 Montpellier Cedex 5, France, §Genetique et Evolution des Maladies Infectieuses, UMR CNRS/IRD 2724, Centre IRD de
Montpellier, 911 Avenue d’Agropolis, BP 64501, 34394 Montpellier Cedex 5, France
Corresponde
E-mail: bouy
� 2009 Black
Abstract
The West African trypanosomoses are mostly transmitted by riverine species of tsetse fly.
In this study, we estimate the dispersal and population size of tsetse populations located
along the Mouhoun river in Burkina Faso where tsetse habitats are experiencing
increasing fragmentation caused by human encroachment. Dispersal estimated through
direct (mark and recapture) and indirect (genetic isolation by distance) methods appeared
consistent with one another. In these fragmented landscapes, tsetse flies displayed
localized, small subpopulations with relatively short effective dispersal. We discuss how
such information is crucial for designing optimal strategies for eliminating this threat. To
estimate ecological parameters of wild animal populations, the genetic measures are both
a cost- and time-effective alternative to mark–release–recapture. They can be applied to
other vector-borne diseases of medical and/or economic importance.
Keywords: dispersal, mark–release–recapture experiment, population genetics, population size,
tsetse
Received 19 November 2008; revision received 23 March 2009/8 April 2009; accepted 9 April 2009
Introduction
Comparisons between direct and indirect estimates of
dispersal and population size are scarce (Watts et al.
2007) and cross-validations are needed to provide confi-
dence in these estimates before indirect methods can be
generalized, especially when analysing vector-borne
diseases affecting human health and/or economy. The
African trypanosomoses are among the most seriously
neglected tropical diseases (Schofield & Kabayo 2008).
The World Health Organization has recently launched
the Human African Trypanosomiasis (HAT, or sleeping
sickness) elimination programme following recent signs
of declining incidence due to increased efforts in case
detection and treatment, notably in Central Africa
(WHO 2006). However the situation in West Africa is
much less clear because only a small proportion of the
population at risk are under surveillance (Courtin et al.
2006). The Food and Agriculture Organization estimates
nce: Dr Bouyer Jeremy, Fax: 00 226 20 97 23 20;
well Publishing Ltd
the economic cost of animal trypanosomoses in Africa
at US$4.75 billion per year (FAO 1999). In 2001, the
African Union launched the Pan African Tsetse and
Trypanosomiasis Eradication Campaign (PATTEC) to
increase efforts to manage this plague, which is consid-
ered one of the root causes of hunger and poverty in
most sub-Saharan African countries (http://www.africa-
union.org/Structure_of_the_Commission/depPattec.htm)
and constitutes a serious impediment to sustainable
agricultural rural development in the area. Glossina
palpalis s.l. is currently one of the most important vec-
tors of human and animal trypanosomoses in West
Africa. In Guinea, the subspecies Glossina palpalis gambi-
ensis transmits sleeping sickness, with prevalence reach-
ing 2 to 5% in villages of the coastal mangrove area
(Dubreka focus; Camara et al. 2005). In Burkina Faso, it
is a major vector of animal trypanosomes, particularly
in the Mouhoun river basin, where the described study
was conducted (Bouyer et al. 2006). The riverine forests
of this river basin, the natural habitat of this species
(Bouyer et al. 2005), are experiencing increasing frag-
mentation caused by human encroachment, which have

2788 J . BOUYER E T A L.
a major impact on the fly’s distribution and densities
(Guerrini et al. 2008), and, presumably, on the structur-
ing of its population (Bouyer et al. 2007a).
Knowledge of gene flow patterns and dispersal rates
are necessary to develop effective control strategies for
vector species (Tabachnick & Black 1995). Tsetse dispersal
is generally modelled as a diffusion process with a diffu-
sion coefficient between 0.002 and 0.500 km2/day (Rog-
ers & Randolph 1984; Hargrove & Lange 1989; Hargrove
2000; Bouyer et al. 2007b). For tsetse flies, as for other vec-
tor species, direct methods for estimating dispersal using
mark–release of individuals is expensive and time-con-
suming, and the use of laboratory-reared flies can lead to
nonrepresentative estimates of certain parameters, since
they might behave differently than wild flies (Terblanche
& Chown 2007). Polymorphic markers provide an impor-
tant indirect alternative (De Meeus et al. 2007).
In this study, we used genetic variation at microsatel-
lite DNA loci, together with a mark–release–recapture
experiment, to assess population densities and dispersal
capacities of Glossina palpalis gambiensis along the Mou-
houn river in Burkina Faso (Fig. 1). The results of the
two studies appear consistent with each other. In these
fragmented landscapes, tsetse flies are shown to consist
of small localized subpopulations with relatively short
effective dispersal (~1 km/generation), in contrast to the
high dispersal capacities observed 20 years ago in simi-
lar river section in the absence of any fragmentation (Cui-
sance et al. 1985). An increase in genetic distance may
imply a smaller dispersal coefficient than previously esti-
mated, which in turn would lower the efficiency of some
control techniques. For example, the effective use of fixed
insecticide targets might be compromised, and the risk of
re-invasion after successful elimination of the vector
might be reduced. Such information thus appears crucial
for designing optimal strategies of elimination of these
tsetse populations along these riverine habitats.
Materials and methods
Description of study sites
The Mouhoun river basin in Burkina Faso is undergoing
landscape fragmentation through human-driven changes
of peririverine landscapes (principally cropping and cattle
grazing) (Guerrini et al. 2008). The part of the Mouhoun
river under study is called the Western Branch, and
extends from the Dinderesso Forest (4�26’W, 11�13¢N), to
the Sourou dam (3�26’W, 12�44¢N). Four sites, roughly ori-
ented from south to north, were sampled at intervals of 74,
61, and 81 km upstream to downstream, totalling 216 km
between the first and the fourth location. The within-site
distance sampled was 3 km for the first two samples and
10 km for the remaining sites (Fig. 1).
Genetic study
Entomological surveys were conducted using georefer-
enced, standardized biconical traps operated one day
during the 2002 hot dry season (14, 18, 21 and 16 traps in
sites A, H, C and D, respectively) (Bouyer et al. 2005)
(Fig. 1). One hundred twenty G. p. gambiensis were geno-
typed using a DNA analysis system from LI-COR at seven
microsatellite loci [B104, C102, B11, kindly supplied by
A. Robinson; pgp13, pgp11, pgp24 (Luna et al. 2001) and
CAG133 (Baker & Krafsur 2001)], following a protocol
described before (Bouyer et al. 2007a): 30 in sample A (the
most upstream) with 13 females and 17 males, and 30
females from each of the three other samples.
Population structure was assessed using the F statistics
of Wright (1965): FIS measures the homozygosity due to
nonrandom union of gametes within subpopulations and
FST measures differentiation among subpopulations. It is
often more informative to convert FST into its value
corrected for polymorphism (Hedrick
1999) where Hs is the genetic diversity as measured by Nei’s
unbiased estimator (Nei & Chesser 1983). The quantity
1 – Hs indeed corresponds to the maximum possible
differentiation between populations that do not exchange
any migrants in which case the relative probability to sam-
ple at random two identical genes from one population
approximately equals 1 minus the probability to sample dif-
ferent genes (Hs). F statistics were estimated using the
method of Weir & Cockerham (1984) and tested by random-
izations. Similarly, genotypic linkage disequilibrium (LD)
between pairs of loci was tested by randomizations. FSTAT
2.9.3 software (Goudet 1995) was used for all estimation
and testing. For three loci located on the heterosome X
(Pgp11, Pgp13 and B104), males were coded either homozy-
gous (FST and LD analyses) or as missing data (FIS analyses).
We tested for isolation by distance between pairs of
individuals as described by Rousset (2000) and Watts
et al. (2007). This method uses a regression of the
genetic distance between individuals as a function of
geographic distance. The slope of this regression is then
used for demographic inferences. Genetic distances
between individuals were estimated with a, estimator of
a, a between individuals analogue of FST/(1 – FST) that
shares the same properties (Rousset 1997). These are
related to the slope b from the regression between
geographic distances DG (in meters, computed out of
the georeferenced coordinates of each trap) by the
equation a ¼ b · DG + Constant, where b ¼ 1/4Dr2 (for
a one-dimensional model of population structure as along
the Mouhoun river), and where Dr2 is the product of the
effective population density (i.e. ~density of reproducing
adults per meter) by the dispersal surface that separates
them from their parents (Rousset 1997). The significance of
the regression was tested by a Mantel test with 1 million
� 2009 Blackwell Publishing Ltd
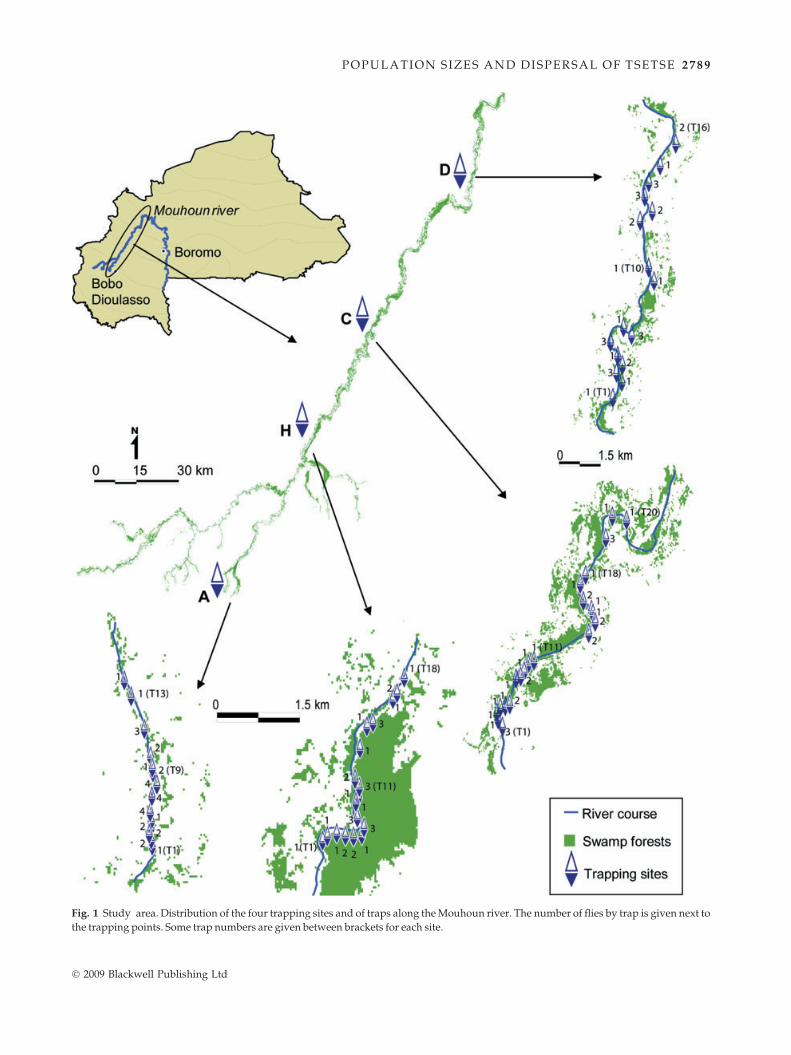
Fig. 1 Study area. Distribution of the four trapping sites and of traps along the Mouhoun river. The number of flies by trap is given next to
the trapping points. Some trap numbers are given between brackets for each site.
POPULA TION SIZE S AND DISPERSAL OF T SETSE 2 78 9
� 2009 Blackwell Publishing Ltd

2790 J . BOUYER E T A L.
randomizations (Mantel 1967). Isolation-by-distance
procedures and testing were all implemented using Gene-
Pop version 4 (Rousset 2008). Considering that each site
(A, H, C, D) represents an independent replicate, we com-
bined the results obtained in each of the four sites by aver-
aging the slopes over sites and using a Fisher procedure
(Fisher 1970) to obtain a global P value. Because here 4Dr2
was below 10 000 in at least one site (A), we used a instead
of e, as recommended by Watts et al. (2007). To obtain a
global representation, we regressed a against DG and site
(A, H, C, D) with multiple regression using S-Plus 2000
Professional Release 3 (MathSoft Inc., 2000). This allowed
representing the partials for a (corrected for site effect) as a
function of geographical distance.
Effective population sizes where computed with three
methods. Estim (Vitalis & Couvet 2001a) uses the
connection between migration and effective population
size with heterozygosity and linkage disequilibrium
between loci and was implemented in Estim 1.2 (Vitalis &
Couvet, 2001b). Linkage disequilibrium is connected to
effective population size, a property exploited by the
method from Bartley et al. (1992), Hill (1981), and Waples
(1991). The method relies on the fact that in a system
where gametes are distributed at random among a small
number of zygotes, there will be departures from expected
genotype frequencies, and departures from expected
gametic frequencies, both of which can be used to estimate
Ne (England et al. 2006). Hill (1981) showed that the
disequilibrium method has low precision unless tightly
linked loci are used, in which case the estimate is strongly
affected by historical, rather than recent, Ne. Hill’s
method was modified by Waples (1991) for use
exclusively with unlinked loci (England et al. 2006). He
pointed out that the method has greater power when the
effective size of a population is small (because the signal
from Ne becomes large relative to various sources of
noise), and therefore, may be useful for evolutionary
biologists or conservation biologists, who often are con-
cerned with low (or potentially low) Ne (Waples 2006).
Site Traps nTraps Estim
Linkage
disequilibrium
A (1,2,3) 1, 2, 2 1.6 (0.0101)
A (4,5,6) 2, 1, 4 5 (0.0316)
A 8 4 2.06 (0.039)
A (9,10,11) 2, 1, 2 1.3 (0.0082)
A 12 3 0.3 (0.0057)
H (3,4) 1, 2
H (16,17) 1, 2 2.08 (0.0197)
C (7,8) 1, 2
D (2,3,4) 1, 3, 2 2.2 (0.0139)
D 6 3 2.4 (0.0455)
D 8 3 1.5 (0.0284)
D 11 2
Waples also suggested that if data for a number of
unlinked loci are available, collectively they might provide
enough information for the method to be useful. From
Bartley et al.’s (1992) equation 2, modified as in NeEstima-
tor Help file, allelic correlations (r) can be estimated as
, where p and q are frequencies of
allele A at a first locus and allele B at a second locus,
respectively, and where D is Burrow’s [e.g. Bartley et al.
(1992) and Waples (2006)] composite measure of disequi-
librium (Weir 1979). For each pair of loci, the correlation r
is calculated for each pair of alleles at the two loci. The r2
values across all pairs of alleles are averaged to yield a sin-
gle r2 for each pair of loci. Finally, an arithmetic mean of
the r2 values for all pairs of loci is used to obtain a single
correlation coefficient and to obtain an Ne estimate using
the equation , where S is the harmonic
mean of the sample sizes of each pairwise comparison
between loci (Bartley et al. 1992; England et al. 2006). The
14 males contained in site A were coded homozygous for
X-linked loci, which should not be a problem for a compos-
ite-based linkage disequilibrium measure and data. Auto-
somal loci did not provide different results for this site.
The method was implemented with NeEstimator (Peel
et al. 2004). Heterozygote excess method from Pudovkin
et al. (1996; see also Luikart & Cornuet 1999) corrected by
Balloux (2004) uses the fact that, in dioecious (or self-
incompatible) populations, alleles from females can only
combine with alleles contained in males and a heterozy-
gote excess is expected as compared to Hardy–Weinberg
expectations, and this excess is proportional to the effec-
tive population size. This method was implemented
using Weir and Cockerham estimator of FIS in the equa-
tion Ne ¼ 1/(–2FIS) – FIS/(1 + FIS) (Balloux 2004) and
was only applicable in subsamples with heterozygote
excess, thus with very few null alleles. This probably pro-
vides overestimates in our case.
To optimize the number of biologically relevant results,
we combined the data from the closest traps that had too
few tsetse individuals (see Table 1). For heterozygote excess
Table 1 Estimation of effective population
sizes. Results of the three methods described
in the text are presented here, for given
subsets of traps for which the computations
were possible (e.g. output different from 0,
infinity or NA) (empty squares correspond
to such results). Numbers of genotyped
individuals per traps (nTraps) are indicated.
Densities (in individuals per metre) are
represented between brackets and corre-
spond to Ne/(DU*nTraps), where Ne is the
corresponding effective population size,
DU the distance unit defined in the text and
nTraps the number of traps contained in the
subsets used to compute Ne
Heterozygote
excess
3.4 (0.0653)
4.7 (0.0295)
25.0 (0.237)
3.8 (0.0361)
7.5 (0.1428)
� 2009 Blackwell Publishing Ltd
POPULA TION SIZE S AND DISPERSAL OF T SETSE 2 79 1
method, X-linked loci were coded as missing data in
males. Ne values were then used to compute tsetse den-
sities. The minimum distance between two traps
observed in our pooled subsets was between traps 5
and 6 of site C (105.55 m). The distance unit around a
trap was then defined as DU ¼ 105.55/2 ¼ 52.775 m,
which is the distance from upstream and downstream
to the focal trap that is assumed to define the neigh-
bourhood around this trap. Density was then computed
as Ne/(DU*nTraps), where nTraps is the number of traps
in the subset used to compute Ne. This probably repre-
sents an underestimate of flies’ density and certainly a
very rough approximation.
Dispersal study
Mark–release–recapture (MRR) was conducted in one of
the sites (A) using 4-day-old male Glossina palpalis gambi-
ensis from insectariums of the Centre International de
Recherche-Developpement sur l’Elevage en zone Subhu-
mide (CIRDES) in Bobo-Dioulasso (Burkina Faso). Before
release, they were fed twice with bovine blood containing
isometamidium (Trypamidium, Merial SAS) at the dose
of 0.5 mg/L, irradiated (11 krad) and marked with
acrylic paint on the thorax (one colour by cohort). Five
cohorts (containing 1918 flies each) and four cohorts (con-
taining 1951 flies each) were released at different sites on
20 April 2005 and 11 May 2005, respectively, along a
10-km river section. The flies were trapped every 500 m
from 0800 to 1200 h. Recapture events occurred at days
3, 8, 13, 18 and 6, 10, 15, 21 after release, respectively. Col-
lected flies were counted and released at the capture site.
For both release series, the daily survival probability, s,
and the diffusion coefficient D were estimated using a
simple one-dimensional diffusion model with a constant
mortality rate (Okubo & Levin 2001), allowing the computa-
tion of the total population size, N, and the mean dispersal
� 2009 Blackwell Publishing Ltd
distance (Codling et al. 2008) for wild flies using field daily
mortality probabilities from 1 to 3% (Hargrove 2003).
Results
Within-trap, within-site genetics
Statistical independence between loci allows using each
locus as a reasonably independent replicate. None of
the linkage disequilibrium tests gave a significant result
(over all traps, no P value is below 0.1). The global
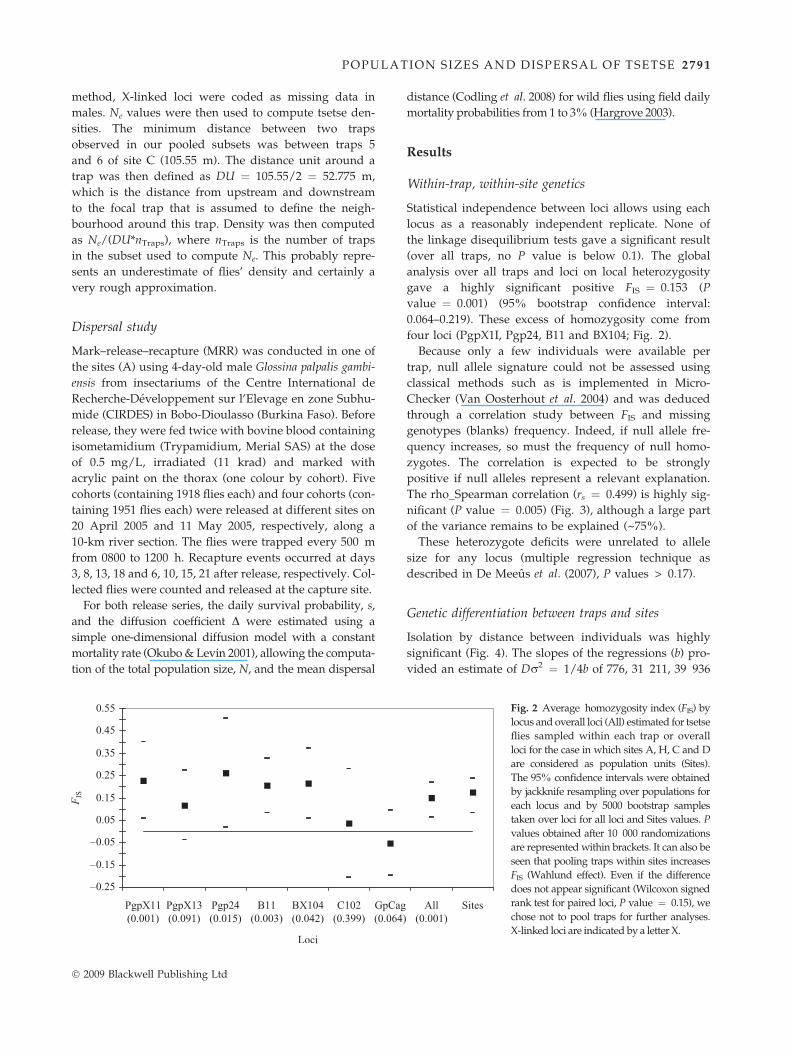
analysis over all traps and loci on local heterozygosity
gave a highly significant positive FIS ¼ 0.153 (P
value ¼ 0.001) (95% bootstrap confidence interval:
0.064–0.219). These excess of homozygosity come from
four loci (PgpX1I, Pgp24, B11 and BX104; Fig. 2).
Because only a few individuals were available per
trap, null allele signature could not be assessed using
classical methods such as is implemented in Micro-
Checker (Van Oosterhout et al. 2004) and was deduced
through a correlation study between FIS and missing
genotypes (blanks) frequency. Indeed, if null allele fre-
quency increases, so must the frequency of null homo-
zygotes. The correlation is expected to be strongly
positive if null alleles represent a relevant explanation.
The rho_Spearman correlation (rs ¼ 0.499) is highly sig-
nificant (P value ¼ 0.005) (Fig. 3), although a large part
of the variance remains to be explained (~75%).
These heterozygote deficits were unrelated to allele
size for any locus (multiple regression technique as
described in De Meeus et al. (2007), P values > 0.17).
Genetic differentiation between traps and sites
Isolation by distance between individuals was highly
significant (Fig. 4). The slopes of the regressions (b) pro-
vided an estimate of Dr2 ¼ 1/4b of 776, 31 211, 39 936
Fig. 2 Average homozygosity index (FIS) by
locus and overall loci (All) estimated for tsetse
flies sampled within each trap or overall
loci for the case in which sites A, H, C and D
are considered as population units (Sites).
The 95% confidence intervals were obtained
by jackknife resampling over populations for
each locus and by 5000 bootstrap samples
taken over loci for all loci and Sites values. P
values obtained after 10 000 randomizations
are represented within brackets. It can also be
seen that pooling traps within sites increases
FIS (Wahlund effect). Even if the difference
does not appear significant (Wilcoxon signed
rank test for paired loci, P value ¼ 0.15), we
chose not to pool traps for further analyses.
X-linked loci are indicated by a letter X.

Fig. 3 Graphic representation of the correlation between number
of missing genotypes in each site (A,H,C,D) and the mean FIS
found in the corresponding traps. The correlation coefficient
(Spearman) and the P value are indicated. Loci and samples where
missing genotypes are the most numerous have the highest FIS.
2792 J . BOUYER E T A L.
and 30 413 individuals · m for sites A, H, C and D,
respectively, with a mean of 2902 individuals · m. Dr2
is the product of the effective density of adults per
metres by the dispersal surface that separates them
from their parents (Rousset 1997). Removing all loci
with significant heterozygote deficits did not particu-
larly alter these results (mean slope of 0.00005) despite
an apparent drop in power (P value ¼ 0.048).
Slope in Fig. 4 is very small and there is great variance
in the pairwise genetic distances among flies at any chosen
physical distance. This has biological significance: local
populations encompass genetically diverse flies, and geo-
graphically disparate flies can be genetically quite similar.
Inference of densities of reproducing tsetse and effectivedistance between adults and their parents
There was no difference in the number of captured tsetse
per trap across sites (log-linear regression, P value ¼0.443). Flies appeared randomly distributed (Kolmogo-
rov–Smirnov, P values > 0.3). The different effective
population sizes (Ne) and corresponding densities (Ne/
DU*nTraps) are presented in Table 1. Densities extend
from 0.04 fly/m for A to 0.02 fly/m for H with Estim, 0.01
fly/m for A and 0.03 fly/m for D with linkage disequilib-
rium, 0.05 fly/m for A, 0.24 flies/m for H and 0.14 fly/m
for D with heterozygote excess methods (unweighted
means). These densities may appear small but if we use
mean estimates computed over methods (Dc), this results
in number of reproducing tsetse that range around 85,
368, 284 and 579 flies in sites A, H, C and D, respectively.
The linkage disequilibrium method gives biased results
when real Ne is bigger than sample size (England et al. 2006;
Fig. 4 Relationship between geographi-
cal distance (GD) and genetic distance a
(partials corrected for sampling sites
effects) along the Mouhoun river, with
95% confidence intervals obtained
through the linear regression a~GD +
Sampling Site + Constant under SPlus
2000 Professional release 3 (Mathsoft
Inc.). For parameter estimates, the mean
slope b, averaged over sites, was 0.00009,
with a global P value ¼ 0.003 (Fisher’s
procedure on Mantel test P values across
sites).
� 2009 Blackwell Publishing Ltd

Table 2 Estimates of dispersal distances r (in metres) between
reproducing adults and their parents using the isolation by
distance estimates Dr2 and mean densities Dc (tsetses per metre).
Estimates were obtained by the effective population size
approaches (averaged over the three methods) in each site of the
Mouhoun river and averaged over all sites (All). Corresponding
values obtained with the MRR study (MRR) are given for
comparison
Site Dr2 Dc r
A 776.277 0.033 153
H 31210.986 0.128 493
C 39936.102 0.036 1053
D 30413.625 0.086 596
All 2902.421 0.071 574
MRR 0.2 (1245; 2392)
POPULA TION SIZE S AND DISPERSAL OF T SETSE 2 79 3
Waples 2006). This bias is probably not very important
here as the heterozygote excess method, which is based on
Weir and Cockerham unbiased estimator of FIS, provides
very similar and very small values. We unfortunately
could not use unbiased LD-based estimates of Ne with
Waples and Do’s method implemented in LDNe version
1.31 (Waples & Do 2008) as this only outputted negative
Ne. We nevertheless undertook a simulation exploration
with EasyPop 2.0.1 (Balloux 2001) to check this issue. We
simulated an island model of 100 populations of 100 indi-
viduals each (50/50 sex ratio and random mating) for
10 000 generations starting with maximum diversity.
Mutation rate u was set to 10)5 with an IAM model of
mutation and 99 possible allelic states for eight indepen-
dent loci. We then sampled 20 populations with either
100, 10, 5 or 3 individuals sampled in each population.
Simulations were replicated 20 times. We then estimated
Ne with Bartley’s (LD-based), Balloux (FIS based) and Wa-
ples and Do’s (LD-based) methods. For convenience, LD-
based methods were only applied to the first population
of each replicate while FIS was averaged over the 20 sam-
pled populations with FSTAT. Results are presented in Fig.
S1 Supporting information, where it can be seen that all
methods are sample-size-sensitive, especially Bartley’s,
while Balloux’s method seems poorly affected. If we simu-
late smaller subpopulations (N ¼ 30) with a similar isola-
tion-by-distance pattern as the one found for tsetse flies
(10 000 populations in a one-dimensional stepping stone,
m ¼ 0.5), the bias is much reduced and even very small for
the FIS-based method (Fig. S2, Supporting information). We
can also notice that variances are big, especially so for LD-
based methods. We can conclude that because the two kinds
of methods provide consistent results, the Ne estimated from
tsetse flies along the Mouhoun river are probably not far
from real Ne, at least in terms of magnitude, despite the small
size of our samples. Nevertheless, further studies should
ideally use more flies (more than 5 and desirably 10) per trap.
When we use density estimates as Dc in the Dr2 values
we computed from the isolation-by-distance approach,
we get estimates of dispersal distance between reproduc-
ing individuals and their parents by . Note
that because Dc probably represents an underestimate, rwill consequently be overestimated. Table 2 gives differ-
ent r inferences for the different sites and overall. Values
extend from 153 to 1053 m. According to Krafsur (2009),
there are at most about eight generations per year in tsetse
flies. Under these conditions, a gene would require ~200
tsetse generations (~25 years) to travel all the width of the
sampled area. Nevertheless, genetic differentiation
between nearest sites appears relatively weak with an
ranging from 0.02 (between C and D) to 0.07 (between H
and C), probably as a result of a too-recent fragmentation,
combined with a very slow genetic drift in each site (due
to isolation by distance at a smaller scale).
� 2009 Blackwell Publishing Ltd
An alternative way to compute densities can be
obtained by multiplying the mean effective population
size averaged over methods by the total number of
traps and dividing it by the total length of the corre-
sponding sampling site. As can be seen from Table S1,
this simplification does not dramatically change the
results. Now a third method would use the direct esti-
mation of density (0.2 fly/m) from the MRR study in
site A (see below) as a maximum possible value. In that
case, minimum possible values for r would be 62, 396,
447 and 390 for sites A, H, C and D, respectively.
Significant heterozygote deficits seem to be a generality
in tsetse populations (see Krafsur (2009) for review) and
in Glossina palpalis in particular either because of null
alleles, Wahlund effect or both (Solano et al. 2000, 2009;
Ravel et al. 2007). Here, null alleles explain some propor-
tions of the heterozygote deficits (~25% at best, Fig. 3)
and the very small effective population sizes found with
linkage disequilibrium based methods also suggest a
Wahlund effect because in a one-dimensional dispersal
framework, such small subpopulations would have led
to much greater isolation-by-distance slopes. This Wahl-
und effect probably reflects that dispersal for mating and
larviposition (tsetse flies are ovoviviparous) is much
smaller than feeding dispersal capabilities (e.g. De Meeus
et al. (2007)). As the heterozygote excess method only
gives results when there is indeed an heterozygote excess
(when FIS > 0 the method outputs Ne < 0), it is likely
that strong heterozygote excess were obtained by chance
with small sample sizes (leading to small Ne), giving a
few opportunity to weight LD-based estimates.
Several exploratory simulations undertaken with Easy-
Pop 2.0.1 (Balloux 2001) suggest that Ne~30 with appropri-
ate Wahlund and subsample sizes (similar to our data) easily
reach the required slopes (in order of magnitude) of isolation
by distance. In that case, this would give a tsetse density
of about 0.3–0.5 fly/m (i.e. 800–3400 individuals in the
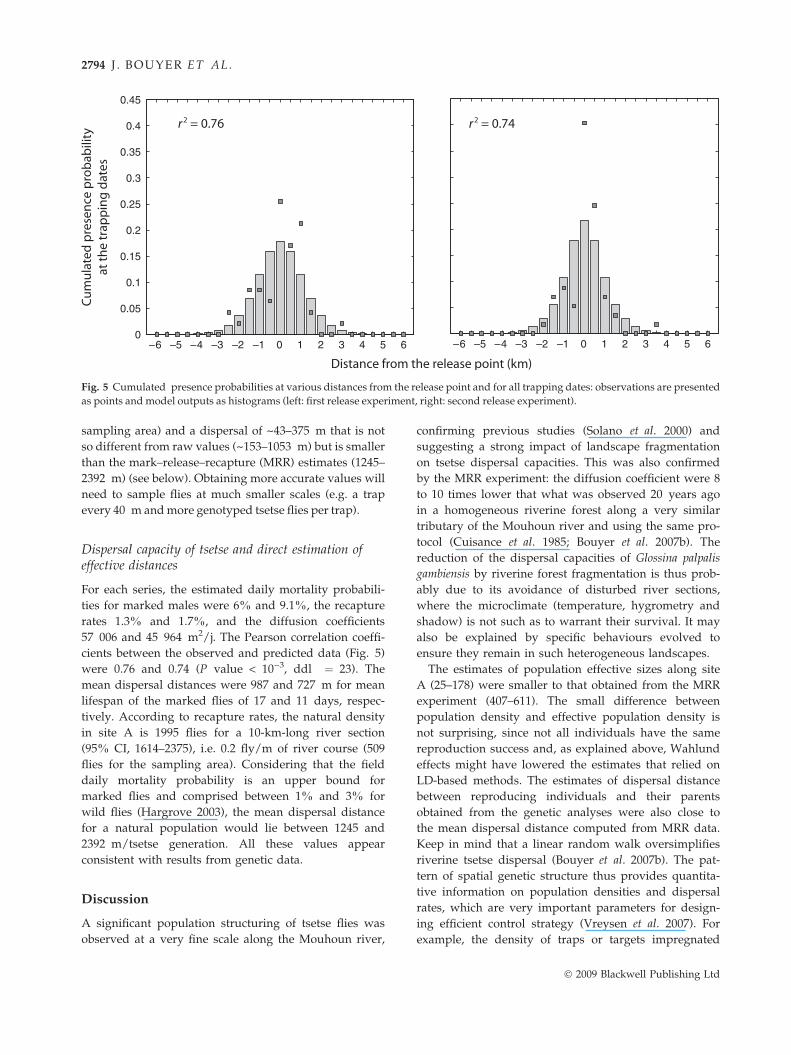
Fig. 5 Cumulated presence probabilities at various distances from the release point and for all trapping dates: observations are presented
as points and model outputs as histograms (left: first release experiment, right: second release experiment).
2794 J . BOUYER E T A L.
sampling area) and a dispersal of ~43–375 m that is not
so different from raw values (~153–1053 m) but is smaller
than the mark–release–recapture (MRR) estimates (1245–
2392 m) (see below). Obtaining more accurate values will
need to sample flies at much smaller scales (e.g. a trap
every 40 m and more genotyped tsetse flies per trap).
Dispersal capacity of tsetse and direct estimation ofeffective distances
For each series, the estimated daily mortality probabili-
ties for marked males were 6% and 9.1%, the recapture
rates 1.3% and 1.7%, and the diffusion coefficients
57 006 and 45 964 m2/j. The Pearson correlation coeffi-
cients between the observed and predicted data (Fig. 5)
were 0.76 and 0.74 (P value < 10)3, ddl ¼ 23). The
mean dispersal distances were 987 and 727 m for mean
lifespan of the marked flies of 17 and 11 days, respec-
tively. According to recapture rates, the natural density
in site A is 1995 flies for a 10-km-long river section
(95% CI, 1614–2375), i.e. 0.2 fly/m of river course (509
flies for the sampling area). Considering that the field
daily mortality probability is an upper bound for
marked flies and comprised between 1% and 3% for
wild flies (Hargrove 2003), the mean dispersal distance
for a natural population would lie between 1245 and
2392 m/tsetse generation. All these values appear
consistent with results from genetic data.
Discussion
A significant population structuring of tsetse flies was
observed at a very fine scale along the Mouhoun river,
confirming previous studies (Solano et al. 2000) and
suggesting a strong impact of landscape fragmentation
on tsetse dispersal capacities. This was also confirmed
by the MRR experiment: the diffusion coefficient were 8
to 10 times lower that what was observed 20 years ago
in a homogeneous riverine forest along a very similar
tributary of the Mouhoun river and using the same pro-
tocol (Cuisance et al. 1985; Bouyer et al. 2007b). The
reduction of the dispersal capacities of Glossina palpalis
gambiensis by riverine forest fragmentation is thus prob-
ably due to its avoidance of disturbed river sections,
where the microclimate (temperature, hygrometry and
shadow) is not such as to warrant their survival. It may
also be explained by specific behaviours evolved to
ensure they remain in such heterogeneous landscapes.
The estimates of population effective sizes along site
A (25–178) were smaller to that obtained from the MRR
experiment (407–611). The small difference between
population density and effective population density is
not surprising, since not all individuals have the same
reproduction success and, as explained above, Wahlund
effects might have lowered the estimates that relied on
LD-based methods. The estimates of dispersal distance
between reproducing individuals and their parents
obtained from the genetic analyses were also close to
the mean dispersal distance computed from MRR data.
Keep in mind that a linear random walk oversimplifies
riverine tsetse dispersal (Bouyer et al. 2007b). The pat-
tern of spatial genetic structure thus provides quantita-
tive information on population densities and dispersal
rates, which are very important parameters for design-
ing efficient control strategy (Vreysen et al. 2007). For
example, the density of traps or targets impregnated
� 2009 Blackwell Publishing Ltd
POPULA TION SIZE S AND DISPERSAL OF T SETSE 2 79 5
with insecticides needed to reduce tsetse densities will
depend on the dispersal capacities of the flies (Hargrove
2003). The number of sterile males and the distance
between release sites to achieve a sterile insect technique
campaign will also depend on the abundance and dis-
persal capacities (Cuisance et al. 1984; Dyck et al. 2005).
The genetic measures are all the more interesting in that
they take into account even rare events (e.g. one migration
episode) that occurred in the past and that left a genetic
signature, events that would be extremely difficult to
observe with MRR methods. Moreover, MRR protocols
are more expensive and time-consuming than the effort
required for the genetic analyses. Our genetic results show
that, unless dispersal is limited by density-dependent fac-
tors, an elimination of all tsetse from one site (say D) might
last for at least 10 years (with the highest dispersal from
Table 2) before being recolonized by flies from site C
(81 km), corresponding to an average recolonization rate
of 7.5 km/year, which is compatible with invasion fronts
observed in other tsetse species (Rogers 1977).
This methodology also could be applied to other impor-
tant vectors and vector-borne diseases affecting human
and/or animal health, especially when the insects are small,
difficult to handle and to breed, like culicoides for example.
Acknowledgements
This work benefited from international collaboration through
the Leverhulme Trust Tsetse Research Network. It was carried
out with the support of a Fonds de Solidarite Prioritaire project
(France), Wellcome Trust project 075824 and EU INCO-DEV pro-
ject 031849. We are indebted to the director general of CIRDES,
Professor Abdoulaye Gouro, for provision of excellent working
conditions; to Felix Sanou, Wilfried Yoni, Bila Cene, Adama Sana,
Moıse Zoungrana, and Boureima Sanou for assistance during the
field studies. Finally, we are very grateful to Steven Peck, Brigham
Young University, and two anonymous referees who allowed a
significant improvement of the manuscript.
References
Baker MD, Krafsur ES (2001) Identification and properties of
microsatellite markers in tsetse flies Glossina morsitans sensu
lato (Diptera: Glossinidae). Molecular Ecology Notes, 1, 234–
236.
Balloux F (2001) EasyPop (version 1.7): a computer program for
populationgeneticssimulations.JournalofHeredity,92,301–302.
Balloux F (2004) Heterozygote excess in small populations and
the heterozygote-excess effective population size. Evolution,
58, 1891–1900.
Bartley D, Bagley M, Gall G, Bentley B (1992) Use of linkage
disequilibrium data to estimate effective size of hatchery and
natural fish populations. Conservation Biology, 6, 365–375.
Bouyer J, Guerrini L, Cesar J, de la Rocque S, Cuisance D
(2005) A phyto-sociological analysis of the distribution of
riverine tsetse flies in Burkina Faso. Medical and Veterinary
Entomology, 19, 372–378.
� 2009 Blackwell Publishing Ltd
Bouyer J, Guerrini L, Desquesnes M, de la Rocque S, Cuisance
D (2006) Mapping African animal trypanosomosis risk from
the sky. Veterinary Research, 37, 633–645.
Bouyer J, Ravel S, Vial L et al. (2007a) Population structuring
of Glossina palpalis gambiensis (Diptera: Glossinidae)
according to landscape fragmentation in the Mouhoun river,
Burkina Faso. Journal of Medical Entomology, 44, 788–795.
Bouyer J, Sibert A, Desquesnes M, Cuisance D, de La Rocque S
(2007b) A model of diffusion of Glossina palpalis gambiensis
(Diptera: Glossinidae) in Burkina Faso. In: Area-wide Control
of Insect Pests. From Research to Field Implementation (eds
Vreysen MJB, Robinson AS, Hendrichs J), pp. 221–228.
Springer, Dordrecht, The Netherlands.
Camara M, Kaba D, Kagbadouno M et al. (2005) La
Trypanosomose Humaine Africaine en zone de mangrove en
Guinee: caracteristiques epidemiologiques et cliniques de
deux foyers voisins. Medecine Tropicale, 65, 155–161.
Codling EA, Plank MJ, Benhamou S (2008) Random walk models
in biology. Journal of the Royal Society Interface, 5, 813–834.
Courtin F, Jamonneau V, Oke E et al. (2006) Towards
understanding the presence/absence of Human African
trypanosomosis in a focus of Cote d’Ivoire: a spatial analysis
of the pathogenic system. International Journal of Health
Geographics, 13, 334–344.
Cuisance D, Politzar H, Merot P, Tamboura I (1984) Les
lachers de males irradies dans la campagne de lutte integree
contre les glossines dans la zone pastorale de Sideradougou,
Burkina Faso. Revue d’Elevage et de Medecine Veterinaire des
Pays Tropicaux, 37, 449–468.
Cuisance D, Fevrier J, Dejardin J, Filledier J (1985) Dispersion
lineaire de Glossina palpalis gambiensis et G. tachinoides dans une
galerie forestiere en zone soudano-guineenne (Burkina Faso).
Revue d’Elevage et de Medecine Veterinaire des Pays Tropicaux, 38, 153–172.
De Meeus T, McCoy KD, Prugnolle F et al. (2007) Population
genetics and molecular epidemiology or how to ‘debusquer
la bete’. Infection, Genetics and Evolution, 7, 308–332.
Dyck VA, Hendrickx G, Robinson AS (2005) Sterile Insect
Technique. Springer, IAEA, Vienna, Austria.
England PR, Cornuet JM, Berthier P, Tallmon DA, Luikart G
(2006) Estimating effective population size from linkage
disequilibrium: severe bias in small samples. Conservation
Genetics, 7, 303–308.
FAO (1999) Impacts of trypanosomiasis on African agriculture.
PAAT Technical and Scientific Series, 2, 46.
Fisher RA (1970) Statistical Methods for Research Workers, 14th
edn Oliver, Boyd, Edinburgh, UK.
Goudet J (1995) FSTAT (version 1.2): a computer program to
calculate F-statistics. Journal of Heredity, 86, 485–486.
Guerrini L, Bord JP, Ducheyne E, Bouyer J (2008)
Fragmentation analysis for prediction of suitable habitat for
vectors: the example of riverine tsetse flies in Burkina Faso.
Journal of Medical Entomology, 45, 1180–1186.
Hargrove JW (2000) A theoretical study of the invasion of
cleared areas by tsetse flies (Diptera: Glossinidae). Bulletin of
Entomological Research, 90, 201–209.
Hargrove JW (2003) Tsetse Eradication: Sufficiency, Necessity and
Desirability. Centre for Tropical Veterinary Medicine,
University of Edinburgh, Edinburgh, UK.
Hargrove JW, Lange K (1989) Tsetse dispersal viewed as a
diffusion process. Transactions of the Zimbabwe Scientific
Association, 64, 1–8.

2796 J . BOUYER E T A L.
Hedrick PW (1999) Perspective: highly variable loci and their
interpretation in evolution and conservation. Evolution, 53,
313–318.
Hill WG (1981) Estimation of effective population size from
data on linkage disequilibrium. Genetical Research, 38, 209–
216.
Krafsur ES (2009) Tsetse flies: genetics, evolution, and role as
vectors. Infection, Genetics and Evolution, 9, 124–141.
Luikart G, Cornuet JM (1999) Estimating the effective number
of breeders from heterozygote excess in progeny. Genetics,
151, 1211–1216.
Luna C, Bonizzoni M, Cheng Q et al. (2001) Microsatellite
polymorphism in tsetse flies (Diptera: Glossinidae). Journal of
Medical Entomology, 38, 376–381.
Mantel N (1967) The detection of disease clustering and a
generalized regression approach. Cancer Research, 27, 209–220.
Nei M, Chesser RK (1983) Estimation of fixation indices and
gene diversities. Annals of Human Genetics, 47, 253–259.
Okubo A, Levin SA (2001) Diffusion and Ecological Problems:
Modern Perspectives, 2nd edn. Springer-Verlag, New York.
Peel D, Ovenden JR, Peel SL (2004) NeEstimator version 1.3:
software for estimating effective population size, version 1.3.
Queensland Government, Department of Primary Industries
and Fisheries, Queensland.
Pudovkin AI, Zaykin DV, Hedgecock D (1996) On the potential
for estimating the effective number of breeders from
heterozygote excess in progeny. Genetics, 144, 383–387.
Ravel S, de Meeus T, Dujardin JP et al. (2007) The tsetse fly
Glossina palpalis palpalis is composed of several genetically
differentiated small populations in the sleeping sickness
focus of Bonon, Cote d’Ivoire. Infection, Genetics and
Evolution, 7, 116–125.
Rogers D (1977) Study of a natural population of Glossina
fuscipes fuscipes Newstead and a model of fly movement.
Journal of Animal Ecology, 46, 309–330.
Rogers JD, Randolph SE (1984) Local variation in the
population dynamics of Glossina palpalis palpalis (Robineau-
Desvoidy) (Diptera: Glossinidae). I. Natural population
regulation. Bulletin of Entomological Research, 74, 403–423.
Rousset F (1997) Genetic differentiation and estimation of gene
flow from F-statistics under isolation by distance. Genetics,
145, 1219–1228.
Rousset F (2000) Genetic differentiation between individuals.
Journal of Evolutionary Biology, 13, 58–62.
Rousset F (2008) GenePop ‘007: a complete re-implementation
of the GenePop software for Windows and Linux. Molecular
Ecology Resources, 8, 103–106.
Schofield CJ, Kabayo JP (2008) Trypanosomiasis vector control
in Africa and Latin America. Parasites and Vectors, 1, 24.
Solano P, de La Rocque S, de Meeus T et al. (2000)
Microsatellite DNA markers reveal genetic differentiation
among populations of Glossina palpalis gambiensis in the
agropastoral zone of Sideradougou, Burkina Faso. Insect
Molecular Biology, 9, 433–439.
Solano P, Ravel S, Bouyer J et al. (2009) The population
structure of Glossina palpalis gambiensis from island and
continental locations in coastal Guinea. Plos Neglected Tropical
Diseases, 3, e392.
Tabachnick WJ, Black WC (1995) Making a case for molecular
population genetic-studies of arthropod vectors. Parasitology
Today, 11, 27–30.
Terblanche JS, Chown SL (2007) Factory flies are not equal to
wild flies. Science, 317, 1678.
Van Oosterhout C, Hutchinson WF, Wills DPM, Shipley P
(2004) Micro-Checker: software for identifying and correcting
genotyping errors in microsatellite data. Molecular Ecology
Notes, 4, 535–538.
Vitalis R, Couvet D (2001a) Estimation of effective population
size and migration rate from one- and two-locus identity
measures. Genetics, 157, 911–925.
Vitalis R, Couvet D (2001b) Estim 1.0: a computer program to
infer population parameters from one- and two-locus gene
identity probabilities. Molecular Ecology Notes, 1, 354–356.
Vreysen M, Robinson AS, Hendrichs J (2007) Area-Wide Control
of Insect Pests, from Research to Field Implementation. Springer,
Vienna, Austria.
Waples RS (1991) Genetic methods for estimating the effective
size of cetacean populations. In: Genetic Ecology of Whales and
Dolphins (ed. Hoelzel AR), pp. 279–300. International
Whaling Commission (Special Issue no. 13).
Waples RS (2006) A bias correction for estimates of effective
population size based on linkage disequilibrium at unlinked
gene loci. Conservation Genetics, 7, 167–184.
Waples RS, Do C (2008) LDNE: a program for estimating
effective population size from data on linkage
disequilibrium. Molecular Ecology Resources, 8, 753–756.
Watts PC, Rousset F, Saccheri IJ et al. (2007) Compatible
genetic and ecological estimates of dispersal rates in insect
(Coenagrion mercuriale: Odonata: Zygoptera) populations:
analysis of ‘neighbourhood size’ using a more precise
estimator. Molecular Ecology, 16, 737–751.
Weir BS (1979) Inferences about linkage disequilibrium.
Biometrics, 35, 235–254.
Weir BS, Cockerham CC (1984) Estimating F-statistics for
the analysis of populations structure. Evolution, 38, 1358–
1370.
WHO (2006) Human African Trypanosomiasis (sleeping
sickness): epidemiological update. Weekly Epidemiological
Record, 82, 71–80.
Wright S (1965) The interpretation of population structure by
F-statistics with special regard to system of mating. Evlution,
19, 395–420.
J. Bouyer is interested in insect ecology, behaviour and
conservation and in area-wide integrated pest management.
T. Balenghien is interested in ecology and control of vectors.
S. Ravel is interested in tsetse population genetics and
vectorial competence. L. Vial is interested in vector popula-
tion genetics and prediction models for the presence of soft
ticks. I. Sidibe is interested in epidemiology and integrated
control of African trypanosomoses, and molecular diagnosis
of trypanosomes and their chemoresistance. S. Thevenon
is specialised in the genetics of cattle trypanotolerance.
P. Solano is a specialist of tsetse population genetics and try-
panosomes molecular diagnosis. T De Meeus is a senior
researcher specialised in population genetics in host parasite
systems with special interests for the evolution of habitat
specialisation and population genetics tools for empirical data.
� 2009 Blackwell Publishing Ltd

POPULA TION SIZE S AND DISPERSAL OF T SETSE 2 79 7
Supporting information
Additional supporting information may be found in the online
version of this article:
Fig. S1 Simulation results for Ne estimation with three different
methods (Balloux 2004; Bartley et al. 1992; Waples & Do 2008).
Fig. S2 Results obtained with different methods for Ne estima-
tion for different sample sizes (Balloux 2004; Bartley et al.1992;
� 2009 Blackwell Publishing Ltd
Waples & Do 2008) for a one dimensional stepping stone of
10 000 populations of size 30.
Table S1 Results obtained with alternative method to compute
tsetse densities from population genetics data
Please note: Wiley-Blackwell are not responsible for the content
or functionality of any supporting information supplied by the
authors. Any queries (other than missing material) should be
directed to the corresponding author for the article.


