Embed Size (px)
Citation preview
Edited by
The Impact of Alcoholic Beverages on Human Health
Peter Anderson
Printed Edition of the Special Issue Published in Nutrients
www.mdpi.com/journal/nutrients
The Impact of Alcoholic Beverages onHuman Health

The Impact of Alcoholic Beverages onHuman Health
Editor
Peter Anderson
MDPI • Basel • Beijing • Wuhan • Barcelona • Belgrade • Manchester • Tokyo • Cluj • Tianjin

Editor
Peter Anderson
Newcastle University
UK
Maastricht University
The Netherlands
Editorial Office
MDPI
St. Alban-Anlage 66
4052 Basel, Switzerland
This is a reprint of articles from the Special Issue published online in the open access journal
Nutrients (ISSN 2072-6643) (available at: https://www.mdpi.com/journal/nutrients/special issues/
Alcoholic Beverage).
For citation purposes, cite each article independently as indicated on the article page online and as
indicated below:
LastName, A.A.; LastName, B.B.; LastName, C.C. Article Title. Journal Name Year, Volume Number,
Page Range.
ISBN 978-3-0365-4101-3 (Hbk)
ISBN 978-3-0365-4102-0 (PDF)
© 2022 by the authors. Articles in this book are Open Access and distributed under the Creative
Commons Attribution (CC BY) license, which allows users to download, copy and build upon
published articles, as long as the author and publisher are properly credited, which ensures maximum
dissemination and a wider impact of our publications.
The book as a whole is distributed by MDPI under the terms and conditions of the Creative Commons
license CC BY-NC-ND.
Contents
About the Editor . . . . . . . . . . . . . . . . . . . . . . . . . . . . . . . . . . . . . . . . . . . . . . vii
Peter Anderson
The Impact of Alcoholic Beverages on Human HealthReprinted from: Nutrients 2021, 13, 4417, doi:10.3390/nu13124417 . . . . . . . . . . . . . . . . . . 1
Robert Dudley and Aleksey Maro
Human Evolution and Dietary EthanolReprinted from: Nutrients 2021, 13, 2419, doi:10.3390/nu13072419 . . . . . . . . . . . . . . . . . . 5
Ivneet Sohi, Ari Franklin, Bethany Chrystoja, Ashley Wettlaufer, Jurgen Rehm and Kevin
Shield
The Global Impact of Alcohol Consumption on Premature Mortality and Health in 2016Reprinted from: Nutrients 2021, 13, 3145, doi:10.3390/nu13093145 . . . . . . . . . . . . . . . . . . 15
Jurgen Rehm, Pol Rovira, Laura Llamosas-Falcon and Kevin D. Shield
Dose–Response Relationships between Levels of Alcohol Use and Risks of Mortality or Disease,for All People, by Age, Sex, and Specific Risk FactorsReprinted from: Nutrients 2021, 13, 2652, doi:10.3390/nu13082652 . . . . . . . . . . . . . . . . . . 29
Harriet Rumgay, Neil Murphy, Pietro Ferrari and Isabelle Soerjomataram
Alcohol and Cancer: Epidemiology and Biological MechanismsReprinted from: Nutrients 2021, 13, 3173, doi:10.3390/nu13093173 . . . . . . . . . . . . . . . . . . 41
Alex O. Okaru and Dirk W. Lachenmeier
Margin of Exposure Analyses and Overall Toxic Effects of Alcohol with Special Considerationof CarcinogenicityReprinted from: Nutrients 2021, 13, 3785, doi:10.3390/nu13113785 . . . . . . . . . . . . . . . . . . 55
David Nutt, Alexandra Hayes, Leon Fonville, Rayyan Zafar, Emily O.C. Palmer, Louise
Paterson and Anne Lingford-Hughes
Alcohol and the BrainReprinted from: Nutrients 2021, 13, 3938, doi:10.3390/nu13113938 . . . . . . . . . . . . . . . . . . 67
Svetlana Popova, Danijela Dozet, Kevin Shield, Jurgen Rehm and Larry Burd
Alcohol’s Impact on the FetusReprinted from: Nutrients 2021, 13, 3452, doi:10.3390/nu13103452 . . . . . . . . . . . . . . . . . . 87
Michael Roerecke
Alcohol’s Impact on the Cardiovascular SystemReprinted from: Nutrients 2021, 13, 3419, doi:10.3390/nu13103419 . . . . . . . . . . . . . . . . . . 103
Neo K. Morojele, Sheela V. Shenoi, Paul A. Shuper, Ronald Scott Braithwaite and Jurgen
Rehm
Alcohol Use and the Risk of Communicable DiseasesReprinted from: Nutrients 2021, 13, 3317, doi:10.3390/nu13103317 . . . . . . . . . . . . . . . . . . 113
Keith Pohl, Prebashan Moodley and Ashwin D. Dhanda
Alcohol’s Impact on the Gut and LiverReprinted from: Nutrients 2021, 13, 3170, doi:10.3390/nu13093170 . . . . . . . . . . . . . . . . . . 133
Tanya Chikritzhs and Michael Livingston
Alcohol and the Risk of InjuryReprinted from: Nutrients 2021, 13, 2777, doi:10.3390/nu13082777 . . . . . . . . . . . . . . . . . . 147
v
Mackenzie Fong, Stephanie Scott, Viviana Albani, Ashley Adamson and Eileen Kaner
‘Joining the Dots’: Individual, Sociocultural and Environmental Links between AlcoholConsumption, Dietary Intake and Body Weight—A Narrative ReviewReprinted from: Nutrients 2021, 13, 2927, doi:10.3390/nu13092927 . . . . . . . . . . . . . . . . . . 163
Peter Anderson, Dasa Kokole and Eva Jane Llopis
Production, Consumption, and Potential Public Health Impact of Low- and No-AlcoholProducts: Results of a Scoping ReviewReprinted from: Nutrients 2021, 13, 3153, doi:10.3390/nu13093153 . . . . . . . . . . . . . . . . . . 183
Dasa Kokole, Peter Anderson and Eva Jane-Llopis
Nature and Potential Impact of Alcohol Health Warning Labels: A Scoping ReviewReprinted from: Nutrients 2021, 13, 3065, doi:10.3390/nu13093065 . . . . . . . . . . . . . . . . . . 197
Tim Stockwell, Norman Giesbrecht, Kate Vallance and Ashley Wettlaufer
Government Options to Reduce the Impact of Alcohol on Human Health: Obstacles to EffectivePolicy ImplementationReprinted from: Nutrients 2021, 13, 2846, doi:10.3390/nu13082846 . . . . . . . . . . . . . . . . . . 221
vi

About the Editor
Peter Anderson
Dual trained as specialist in public health medicine and general practice (Oxford University
and London School of Hygiene and Tropical Medicine), Dr. Anderson has a background in general
practice, public health and academia, and has pioneered research and published on a range of
alcohol policy issues. In the European Office of the World Health Organization, he was responsible
for the alcohol and tobacco programmes, set up the Organization’s first European Alcohol Action
Plan, and became Director of the Department of Prevention and Health Promotion. He has brought
science to policy across a range of public health issues for the World Economic Forum, several
governments, intergovernmental organizations, including European Commission and OECD, and
public and private sector think tanks around the world.
vii

nutrients
Editorial
The Impact of Alcoholic Beverages on Human Health
Peter Anderson 1,2
Citation: Anderson, P. The Impact of
Alcoholic Beverages on Human
Health. Nutrients 2021, 13, 4417.
https://doi.org/10.3390/nu13124417
Received: 25 November 2021
Accepted: 7 December 2021
Published: 10 December 2021
Publisher’s Note: MDPI stays neutral
with regard to jurisdictional claims in
published maps and institutional affil-
iations.
Copyright: © 2021 by the author.
Licensee MDPI, Basel, Switzerland.
This article is an open access article
distributed under the terms and
conditions of the Creative Commons
Attribution (CC BY) license (https://
creativecommons.org/licenses/by/
4.0/).
1 Population Health Sciences Institute, Newcastle University, Baddiley-Clark Building,Newcastle upon Tyne NE2 4AX, UK; [email protected]
2 Department of Health Promotion, CAPHRI Care and Public Health Research Institute, Maastricht University,6211 LK Maastricht, The Netherlands
As summarized in the World Health Organization’s latest Global Status Report onAlcohol, the pleasure of alcohol is indicated by the fact that, worldwide, just over two-fifths of the population aged 15+ years drink alcohol; 2.3 billion people, consuming nearly35 billion litres of pure ethanol a year, equivalent to just over three drinks (33 g of pureethanol) a day (see [1]).
The pain of alcohol is indicated in the collection of papers in this special issue: ethanolin alcoholic beverages is toxic to human health, causing 7.1% of all deaths amongst thoseaged less than 70 years (two million deaths a year), with the three top causes of death beingcirrhosis of the liver, road injuries, and tuberculosis [1]. In addition, through a combinationof brain damage due to consuming alcohol and genetic predisposition, some 4% of adultsexperience what is termed alcohol dependence, a complex behavioural syndrome that hasat its core the inability to control alcohol consumption despite adverse social, occupationalor health consequences [2].
Ethanol:
• Is a teratogen [3];• Is genotoxic and a carcinogen [4,5];• Is hepatotoxic [6];• Is neurotoxic to the brain [2];• Causes injuries [7];• Causes a range of cardiovascular diseases [8];• Increases the risk of a range of communicable diseases, including HIV, TB, pneumonia,
and COVID-19 infection [9]; and• May or may not increase the risk of overweight and obesity [10].
For most conditions, the dose–response curves increase from zero consumption up-wards, with many curves being exponential [11]. The exception to this is that some alcoholconsumption protects some people against ischaemic diseases to some degree, with poten-tial benefits occurring at about 1 drink every other day [8]; this is an hormetic effect to anenvironmental agent characterized by a low dose beneficial effect and a high dose toxiceffect, that, for ethanol, may be a consequence of human ancestral exposure to naturallyoccurring low levels of ethanol from ripe fruit [12]. On the other side, though, margins ofexposure analysis indicate that the present average daily consumption amongst drinkersacross the world (33 g of ethanol a day) exceeds typically accepted thresholds indicatinghealth risks for carcinogens by some 10,000 [5].
The question this supplement raises, is the pleasure worth the pain?Governments and governmental organizations seem to consider that the pleasure
is worth the pain. As Stockwell and colleagues point out, it is possible to provide veryspecific and detailed advice to governments regarding the public health consequencesof policy decisions in such concrete terms as how many people will become ill, injuredor die prematurely from alcohol-related reasons if policy X or Y is not introduced [13].Yet, almost all countries fall far short of implementing effective public health policies to
Nutrients 2021, 13, 4417. https://doi.org/10.3390/nu13124417 https://www.mdpi.com/journal/nutrients1
Nutrients 2021, 13, 4417
reduce the harm done by alcohol [13]. Further, despite alcohol being a carcinogen, [4,5],at least in Europe, health warning labels are notable by their absence [14]. Additionally,even for people who run into problems, including alcohol dependence, there seems alack of care and treatment. As Nutt and colleagues point out, it remains the case that,to date, only three pharmacotherapies are licensed for alcohol dependence and only 9%of such individuals receive such treatment [2]; there is simply no moral outrage fromnon-governmental organizations.
The alcohol industry also seems to consider that the pleasure is worth the pain. Productreformulation of existing products to contain less alcohol, and more extensive marketpenetration of no and low alcohol products could lead to consumers drinking less ethanol(see [15]). Yet, overall, there seem to be only very limited moves in this direction [15],and the alcohol industry continues to counter the implementation of effective policies thatcould reduce the harm done by alcohol [13].
Why is there a dissonance between what the science says about alcohol’s toxicity, andthe failure to prevent two million deaths a year amongst the under seventies and provideadequate treatment to the 4% of adults who experience alcohol dependence? Stockwellet al. [13] mention four reasons:
1. lack of public awareness of both need and the effectiveness of policies;2. lack of government regulatory mechanisms to implement effective policies;3. alcohol industry lobbying; and,4. a failure from the public health community to promote specific and feasible actions as
opposed to general principles, e.g., ‘increased prices’ or ‘reduced affordability’.
What would be a litmus test of change that we take the pain of alcohol seriously?The simple specific take of this editorial:The alcohol industry places a warning label on its products: ALCOHOL CAUSES CANCER.Such an (unlikely) action would:
1. Shame governments for failing to protect their citizens against a known carcinogen; and,2. Demonstrate that the alcohol industry is serious in taking responsibility for its products.
Funding: No funding was received for writing this editorial.
Conflicts of Interest: The author declares no conflict of interest.
References
1. Sohi, I.; Franklin, A.; Chrystoja, B.; Wettlaufer, A.; Rehm, J.; Shield, K. The Global Impact of Alcohol Consumption on PrematureMortality and Health in 2016. Nutrients 2021, 13, 3145. [CrossRef] [PubMed]
2. Nutt, D.; Hayes, A.; Fonville, L.; Zafar, R.; Palmer, E.; Paterson, L.; Lingford-Hughes, A. Alcohol and the Brain. Nutrients 2021,13, 3938. [CrossRef] [PubMed]
3. Popova, S.; Dozet, D.; Shield, K.; Rehm, J.; Burd, L. Alcohol’s Impact on the Fetus. Nutrients 2021, 13, 3452. [CrossRef] [PubMed]4. Rumgay, H.; Murphy, N.; Ferrari, P.; Soerjomataram, I. Alcohol and Cancer: Epidemiology and Biological Mechanisms. Nutrients
2021, 13, 3173. [CrossRef] [PubMed]5. Okaru, A.; Lachenmeier, D. Margin of Exposure Analyses and Overall Toxic Effects of Alcohol with Special Consideration of
Carcinogenicity. Nutrients 2021, 13, 3785. [CrossRef] [PubMed]6. Pohl, K.; Moodley, P.; Dhanda, A. Alcohol’s Impact on the Gut and Liver. Nutrients 2021, 13, 3170. [CrossRef] [PubMed]7. Chikritzhs, T.; Livingston, M. Alcohol and the Risk of Injury. Nutrients 2021, 13, 2777. [CrossRef] [PubMed]8. Roerecke, M. Alcohol’s Impact on the Cardiovascular System. Nutrients 2021, 13, 3419. [CrossRef]9. Morojele, N.; Shenoi, S.; Shuper, P.; Braithwaite, R.; Rehm, J. Alcohol Use and the Risk of Communicable Diseases. Nutrients 2021,
13, 3317. [CrossRef]10. Fong, M.; Scott, S.; Albani, V.; Adamson, A.; Kaner, E. ‘Joining the Dots’: Individual, Sociocultural and Environmental Links
between Alcohol Consumption, Dietary Intake and Body Weight—A Narrative Review. Nutrients 2021, 13, 2927. [CrossRef]11. Rehm, J.; Rovira, P.; Llamosas-Falcón, L.; Shield, K. Dose—Response Relationships between Levels of Alcohol Use and Risks of
Mortality or Disease, for All People, by Age, Sex, and Specific Risk Factors. Nutrients 2021, 13, 2652. [CrossRef] [PubMed]12. Dudley, R.; Maro, A. Human Evolution and Dietary Ethanol. Nutrients 2021, 13, 2419. [CrossRef] [PubMed]13. Stockwell, T.; Giesbrecht, N.; Vallance, K.; Wettlaufer, A. Government Options to Reduce the Impact of Alcohol on Human Health:
Obstacles to Effective Policy Implementation. Nutrients 2021, 13, 2846. [CrossRef] [PubMed]
2

Nutrients 2021, 13, 4417
14. Kokole, D.; Anderson, P.; Jané-Llopis, E. Nature and Potential Impact of Alcohol Health Warning Labels: A Scoping Review.Nutrients 2021, 13, 3065. [CrossRef] [PubMed]
15. Anderson, P.; Kokole, D.; Llopis, E. Production, Consumption, and Potential Public Health Impact of Low- and No-AlcoholProducts: Results of a Scoping Review. Nutrients 2021, 13, 3153. [CrossRef] [PubMed]
3

nutrients
Review
Human Evolution and Dietary Ethanol
Robert Dudley 1,2,* and Aleksey Maro 1
Citation: Dudley, R.; Maro, A.
Human Evolution and Dietary
Ethanol. Nutrients 2021, 13, 2419.
https://doi.org/10.3390/nu13072419
Academic Editor: Emilio Sacanella
Received: 28 May 2021
Accepted: 13 July 2021
Published: 15 July 2021
Publisher’s Note: MDPI stays neutral
with regard to jurisdictional claims in
published maps and institutional affil-
iations.
Copyright: © 2021 by the authors.
Licensee MDPI, Basel, Switzerland.
This article is an open access article
distributed under the terms and
conditions of the Creative Commons
Attribution (CC BY) license (https://
creativecommons.org/licenses/by/
4.0/).
1 Department of Integrative Biology, University of California, Berkeley, CA 94720, USA;[email protected]
2 Smithsonian Tropical Research Institute, P.O. Box 2072, Balboa, Panama* Correspondence: [email protected]; Tel.: +1-510-642-1555
Abstract: The “drunken monkey” hypothesis posits that attraction to ethanol derives from anevolutionary linkage among the sugars of ripe fruit, associated alcoholic fermentation by yeast,and ensuing consumption by human ancestors. First proposed in 2000, this concept has receivedincreasing attention from the fields of animal sensory biology, primate foraging behavior, andmolecular evolution. We undertook a review of English language citations subsequent to publicationof the original paper and assessed research trends and future directions relative to natural dietaryethanol exposure in primates and other animals. Two major empirical themes emerge: attraction toand consumption of fermenting fruits (and nectar) by numerous vertebrates and invertebrates (e.g.,Drosophila flies), and genomic evidence for natural selection consistent with sustained exposure todietary ethanol in diverse taxa (including hominids and the genus Homo) over tens of millions of years.We also describe our current field studies in Uganda of ethanol content within fruits consumed byfree-ranging chimpanzees, which suggest chronic low-level exposure to this psychoactive moleculein our closest living relatives.
Keywords: alcoholism; evolution; fermentation; frugivory; Homo; primate; yeast
1. Introduction
The argument of the “drunken monkey” hypothesis is that alcohol (and primarilythe ethanol molecule) is a low-level but routine component of the diet for all animals thatconsume fruits and nectar [1,2]. In addition to providing a useful long-distance olfactorycue to localize nutritional resources and to identify ripe and calorically rich fruits up close,ethanol may also act as a feeding stimulant (as in modern humans, via the well-studiedaperitif effect; [3]). Humans first began intentional fermentation during the Meso-Neolithictransitional period broadly coincident with the domestication of crops, and ethanol con-sumption has correspondingly been viewed as a fairly recent phenomenon relative to theorigin of our species. However, dietary consumption of ethanol likely characterizes all fru-givorous and nectarivorous animals, including primates and the hominoid lineage leadingto modern humans. Millions of years of interaction among flowering plants, fermentativeyeast, and numerous vertebrate lineages thus suggest a linkage between ethanol ingestionand acquisition of nutritional reward. We also see in diverse animal taxa, as well as inmodern humans, substantial genetic variation in the ability to metabolize ethanol that isconsistent with natural selection to this end.
The natural role of ethanol in animal nutrition has been largely underestimated inthe zoological literature. For example, ethanol in ripe and fermenting fruits has beenproposed to be largely aversive to vertebrate consumers [4]. More recently, informationfrom behavioral, ecological, and genomic studies indicates an impressive commonalityof behavioral and physiological responses to ethanol, and in taxa ranging from fruit fliesto primates. The overarching concept that unites these studies is evolution, which cansometimes provide novel insights into questions of human health and behavior [5,6]. Here,we review advances in the field of comparative ethanol biology since the first publication
Nutrients 2021, 13, 2419. https://doi.org/10.3390/nu13072419 https://www.mdpi.com/journal/nutrients5
Nutrients 2021, 13, 2419
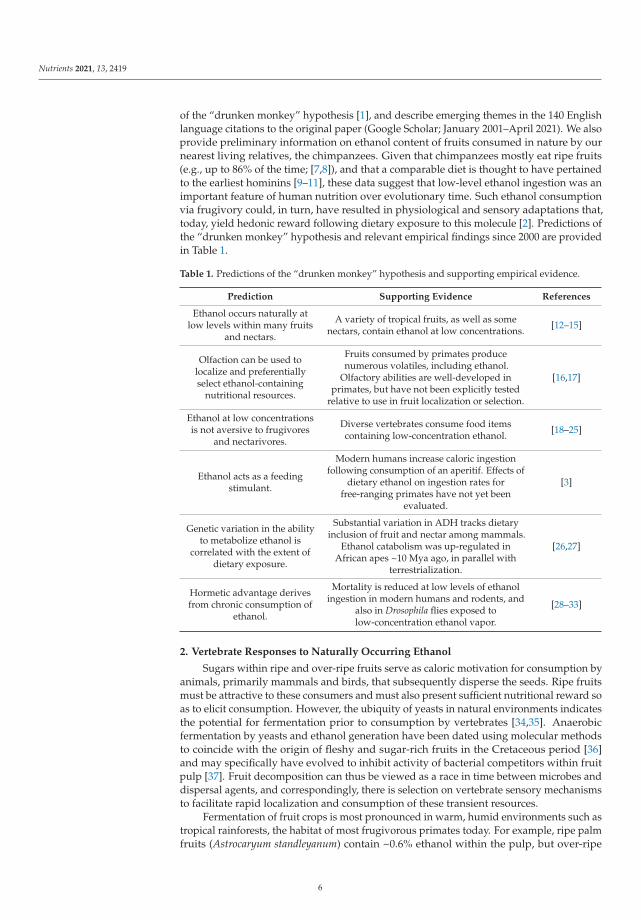
of the “drunken monkey” hypothesis [1], and describe emerging themes in the 140 Englishlanguage citations to the original paper (Google Scholar; January 2001–April 2021). We alsoprovide preliminary information on ethanol content of fruits consumed in nature by ournearest living relatives, the chimpanzees. Given that chimpanzees mostly eat ripe fruits(e.g., up to 86% of the time; [7,8]), and that a comparable diet is thought to have pertainedto the earliest hominins [9–11], these data suggest that low-level ethanol ingestion was animportant feature of human nutrition over evolutionary time. Such ethanol consumptionvia frugivory could, in turn, have resulted in physiological and sensory adaptations that,today, yield hedonic reward following dietary exposure to this molecule [2]. Predictions ofthe “drunken monkey” hypothesis and relevant empirical findings since 2000 are providedin Table 1.
Table 1. Predictions of the “drunken monkey” hypothesis and supporting empirical evidence.
Prediction Supporting Evidence References
Ethanol occurs naturally atlow levels within many fruits
and nectars.
A variety of tropical fruits, as well as somenectars, contain ethanol at low concentrations. [12–15]
Olfaction can be used tolocalize and preferentiallyselect ethanol-containing
nutritional resources.
Fruits consumed by primates producenumerous volatiles, including ethanol.
Olfactory abilities are well-developed inprimates, but have not been explicitly tested
relative to use in fruit localization or selection.
[16,17]
Ethanol at low concentrationsis not aversive to frugivores
and nectarivores.
Diverse vertebrates consume food itemscontaining low-concentration ethanol. [18–25]
Ethanol acts as a feedingstimulant.
Modern humans increase caloric ingestionfollowing consumption of an aperitif. Effects of
dietary ethanol on ingestion rates forfree-ranging primates have not yet been
evaluated.
[3]
Genetic variation in the abilityto metabolize ethanol is
correlated with the extent ofdietary exposure.
Substantial variation in ADH tracks dietaryinclusion of fruit and nectar among mammals.
Ethanol catabolism was up-regulated inAfrican apes ~10 Mya ago, in parallel with
terrestrialization.
[26,27]
Hormetic advantage derivesfrom chronic consumption of
ethanol.
Mortality is reduced at low levels of ethanolingestion in modern humans and rodents, and
also in Drosophila flies exposed tolow-concentration ethanol vapor.
[28–33]
2. Vertebrate Responses to Naturally Occurring Ethanol
Sugars within ripe and over-ripe fruits serve as caloric motivation for consumption byanimals, primarily mammals and birds, that subsequently disperse the seeds. Ripe fruitsmust be attractive to these consumers and must also present sufficient nutritional reward soas to elicit consumption. However, the ubiquity of yeasts in natural environments indicatesthe potential for fermentation prior to consumption by vertebrates [34,35]. Anaerobicfermentation by yeasts and ethanol generation have been dated using molecular methodsto coincide with the origin of fleshy and sugar-rich fruits in the Cretaceous period [36]and may specifically have evolved to inhibit activity of bacterial competitors within fruitpulp [37]. Fruit decomposition can thus be viewed as a race in time between microbes anddispersal agents, and correspondingly, there is selection on vertebrate sensory mechanismsto facilitate rapid localization and consumption of these transient resources.
Fermentation of fruit crops is most pronounced in warm, humid environments such astropical rainforests, the habitat of most frugivorous primates today. For example, ripe palmfruits (Astrocaryum standleyanum) contain ~0.6% ethanol within the pulp, but over-ripe
6
Nutrients 2021, 13, 2419
fruits have much higher levels, averaging 4.5% [12]. Substantial levels of ethanol withinpulp also characterize fruits in Southeast Asia over a range of ripening stages [13]. Animalsconsuming these fruits will necessarily ingest ethanol at low concentrations. Given thatanimal frugivores can consume 5%–10% of their body weight daily in ripe fruit, even theaforementioned low concentrations will yield substantial chronic dosage. Floral nectars inthe tropics can also ferment and yield substantial ethanol concentrations. Wild tree shrewsand slow lorises feed from palm flowers (Eugeissona tristis) in Malaysia that contain signifi-cant levels of ethanol within the nectar [14]. Although the animals never become overtlyinebriated, hair samples contain high levels of a secondary metabolite of ethanol (ethylglucuronide), consistent with high chronic exposure. Laboratory choice trials with twospecies of nectar-feeding primates indicate increasing preference for higher-concentrationethanol solutions [18] (see also [19] for analogous experiments with a primate frugivore).Additionally, wild chimpanzees consume anthropogenically sourced fermentations of palmsap within the tree canopy, at least at one site in West Africa [20]. Critically, the assertionthat ethanol is toxic and renders fruit unpalatable to vertebrates [4] has been empiricallyfalsified for mammalian dispersal agents [21].
In tropical rainforests, ripe fruit is a transient and spatially heterogeneous resource.Olfactory plumes of ethanol provide, however, an honest signal of caloric availability topotential consumers downwind. The olfactory sensitivity of primates to various alcohols,including ethanol, is well-developed [16,17], but this sensory capacity has not been demon-strated under field conditions. Adult fruit flies, however, use ethanol plumes to locatesuitable oviposition sites on ripe fruit. The study of ethanol responses in Drosophila nowrepresents a useful model system for understanding molecular pathways of inebriationin humans [38]. Additionally, behavioral preferences by fruit flies for ethanol-containingsubstrates are correlated with the ability to metabolize ethanol, suggesting a direct linkbetween metabolic capacity and sensory attraction [39]. Similarly, ethanol is not aversiveto fruit-feeding birds and bats [22,23] and is sometimes consumed at lethal levels [24,25].In rodents, ethanol evokes neural hyperactivity in brain-feeding circuits, further support-ing evolutionary associations between consumption of fermented substrates and caloricgain [40]. Most importantly, a recent survey of wild primate diets [15] demonstrated thewidespread consumption of fruits in the late stages of fermentation (as assessed by humanobservers). Because ethanol may be present within ripe fruits with no obvious externalsigns of microbial activity, this study provides a conservative estimate of actual dietaryexposure; a quantitative assessment of ethanol concentrations within consumed fruitsacross the entire spectrum of palatability is clearly now called for.
3. Evolutionary Consequences of Dietary Ethanol
If chronic dietary exposure to ethanol inevitably derives from frugivory (and fromnectarivory), then selection will favor the evolution of metabolic adaptations that maximizephysiological benefits but minimize costs of exposure. Higher concentrations of ethanolmay, by contrast, be stressful and cause harm. Such a nonlinear dose-response curveis termed hormesis and is an evolutionary outcome that increases overall organismalfitness given natural exposure to various compounds at low concentrations [41–43]. A keyprediction of the “drunken monkey” hypothesis, therefore, is that hormetic benefits willpertain to animals at low, naturally occurring levels of ethanol exposure.
In support of this claim, longevity (as well as female fecundity) of fruit flies is in-creased at low atmospheric concentrations of ethanol but decreases at zero exposure and athigher concentrations [28–30]. Laboratory rodents similarly show decreased mortality atintermediate levels of ethanol ingestion [31]. In humans, epidemiological studies suggest areduction in cardiovascular risk and overall mortality at low levels of ethanol consumptionrelative either to abstinence or to higher levels of intake [32,33]. Consequences of chronicethanol ingestion for human reproductive fitness have not been evaluated, but we mightexpect a similar outcome as with longevity. No current data address the hormetic effects ofethanol on wild animals with variable levels of dietary availability, but logistically, such
7
Nutrients 2021, 13, 2419
long-term measurements can be carried out in appropriate contexts (e.g., field-bandedtracking of individual hummingbirds through their lifespan at different sites with variableextent of nectar fermentation).
Evolutionary arguments also predict that intra- and interspecific variation in theability to metabolize ethanol will correspond to its relative dietary inclusion. Alcoholdehydrogenase (ADH) initially converts ethanol to acetaldehyde, which then is acted uponby aldehyde dehydrogenase (ALDH) to yield acetate used for energy yield in oxidativepathways. Both ADH and ALDH exist in a number of different allelic forms characterizedby varying catalytic efficiencies, which in Drosophila flies are well-known to correlate withnatural levels of environmental ethanol exposure [2,39]. Furthermore, in the lineage of greatapes that led to modern humans, there is a pronounced genetic signature demonstratingcomparable evolutionary responses to chronic dietary exposure to ethanol. Paleogeneticreconstruction of alcohol dehydrogenase genes across the hominid phylogeny indicates adramatically enhanced catabolic capacity in one particular ADH (ADH4, as encoded by theADH7 allele), starting at about 10 Mya [26]. ADH4, although only one of multiple ADHforms present in mammals, is found primarily in the mouth and digestive tract and thuseffects the “first pass” at the digestion of ethanol. This enzyme became dramatically betterat metabolizing ethanol following the phyletic split between the lineage leading to modernorangutans and to the other great apes, including ourselves. It thus correlates well withincreasing terrestrialization among the African apes, possibly yielding greater access tofermenting fruit crops on the ground, and thus resulting in increased ethanol within thediet [26]. The same mutation also characterizes ADH4 of the Madagascan aye-aye, whichroutinely feeds on nectar from flowers of an endemic palm. Although ethanol content isnot characterized for such flowers, studies with captive aye-ayes demonstrate a preferencefor consumption of low-level ethanol within sugar solutions [18].
Moreover, a recent study [27] evaluated variation in ADH 4 across 79 mammal species;multiple losses of function in ADH7 (i.e., pseudogenization) and relaxed selection on thisallele were found for those taxa with little or no presumed dietary exposure to ethanol (e.g.,whales). Contrariwise, natural selection was apparently intensified on ADH7 for thosespecies specializing on either fruit or nectar [27]. Although the actual extent of dietaryethanol consumption is not known for the study species, clearly the likelihood of its chronicingestion must be higher for frugivores and nectarivores. Quantitative specification ofethanol exposure, in conjunction with assessment of genetic changes in the other ethanol-metabolizing enzymes (e.g., ADH1, ADH2, and numerous ALDH polymorphisms) is nowcalled for to assess the overall evolutionary response to fermented nutritional substrates.
Hominoids (i.e., the lesser and greater apes) also exhibit an evolutionary loss of uricaseas a consequence of accumulating deleterious mutations in the corresponding gene (starting~20 Mya; [44,45]). Modern humans correspondingly exhibit very high blood levels of uricacid and show amplification of fat accumulation (and of the metabolic syndrome moregenerally) given chronic fructose ingestion [46–48]. Ethanol consumption also stimulatesfructose production by the liver, as well as more widespread production of uric acid, withboth effects acting synergistically to increase overall fat storage [49,50]. The psychoactiveand hedonic properties of ethanol and fructose are also similar, facilitating addictiveresponses to these naturally occurring compounds within fruit [51]. Such changes in boththe uricase gene and in genes directly involved in ethanol catabolism are consistent withpositive selection on dietary preference for fruit sugars and their fermentation productsand are possibly linked with sensory mechanisms facilitating their efficient consumptionand digestion.
In addition to aforementioned interspecific studies of ethanol metabolism, there isalso substantial intraspecific genetic variation in physiological responses to ethanol, atleast among modern human populations. In particular, slow-acting ALDH occurs at highfrequencies in East Asian humans, and yields toxic acetaldehyde buildup following the con-sumption of ethanol [52,53]. Such variation, in turn, has been correlated with the propensitytowards alcoholism for certain populations. Rates of alcoholism, however constructed
8
Nutrients 2021, 13, 2419
definitionally, tend to be much lower within East Asian populations, consistent with thedeterrent effects of elevated acetaldehyde [54,55]. Although genotype-by-environmentinteractions are also likely to be involved, the interacting dynamics of ethanol catabolismand accumulation of the acetaldehyde intermediate product are apparently protectiveagainst excessive alcohol consumption [56].
Finally, multigenerational exposure to high levels of dietary ethanol can result in sig-nificant changes to the gut microbiome, at least in laboratory rodents [57]. This intriguingoutcome, mediated either directly by ethanol or by its downstream metabolic products,may also indicate systemic neural regulation of ingestion as influenced by endogenous gutfauna. The role of the microbiome in mediating physiological and behavioral responsesto ethanol, either across the lifespan or in evolutionary time, has never been evaluatedfor free-ranging vertebrates, but clearly is of adaptive relevance. As with aforementionedmolecular evolutionary studies of ADH and ALDH, comparative studies of the gut mi-crobiome among frugivorous and nectarivorous species (and including birds as well asmammals) would elucidate correlates of microbical community composition relative tochronic ethanol ingestion and may indicate a role for selection in promoting higher rates ofethanol consumption so as to increase energetic gain while feeding.
4. Natural Ethanol Exposure in Chimpanzees
Recent field studies of chimpanzee-consumed fruits in Uganda suggest a chronic low-level ingestion of ethanol, albeit at sub-inebriating levels that are nonetheless consistentwith physiological consequences. The Ngogo population of Eastern chimpanzees (P.troglodytes schweinfurthii) in Kibale National Park reside in a forest with a low densityof a high-output, asynchronously fruiting fig species (Ficus mucuso), which is consumedpreferentially more than any other fruit (i.e., 18%–34% of total feeding time; [58,59]). In2019 and 2020, we determined ethanol concentrations for F. mucuso fruits as well as for adiversity of other consumed fruit species. By visiting F. mucuso trees with chimpanzeesactively foraging in the canopy, we could collect ripe figs either immediately after they fell,following disturbance or by rejection, or within an hour of having fallen (as evidencedby wet latex at the stem). We also collected unripe F. mucuso during part of the fieldseason, which the chimpanzees eat during periods of food shortage. Collected figs werefrozen at the field station to arrest fermentation. We determined ethanol concentrationswithin individual fruits using an infrared gas analyzer on homogenized pulp samples,and also via ethanol vapor measurements in the headspace over pulp samples. Prior tothese measurements, for each fruit we also assessed its mass, puncture resistance, sugarconcentration, surface reflectance, and presence or absence of fig wasps, so as to correlatequantitatively ethanol content with stages of ripeness, and to assess which factors mostinfluence microbial ethanol production. Data obtained to date indicate ethanol levelswithin ripe figs ranging from negligible amounts to as high as several percent (weight ofethanol/weight of fruit), consistent with values determined for other primate-consumedfruits [12,13].
Levels of ethanol consumption are determined both by ingested food volume and byintrinsic concentration. A typical daily consumption of ~6 kg of fruit at an ethanol contentof only 0.23% would correspond to ingestion of one standard drink (i.e., 14 g of ethanol inthe USA). Moreover, adult Eastern chimpanzees in the wild weigh substantially less thanhumans (i.e., only 30–40 kg; [60]), suggesting a much higher body-mass specific exposure.If consumed fruit were to contain 1% ethanol on average, then consuming 6 kg of fruitdaily would yield >4 standard drinks daily, and a much higher body-mass specific rate ofexposure. These preliminary calculations suggest that ethanol ingestion via frugivory isnon-trivial in wild chimpanzees, and can easily approach chronic exposure of physiologicalrelevance, if not of occasional inebriation.
Further assessment of dosage via dietary ingestion would require knowledge of ratesof ethanol absorption and catabolism in chimpanzees, which are not necessarily the sameas those in humans. Enzymatic activity relative to ethanol degradation is variable among
9
Nutrients 2021, 13, 2419
mammalian taxa, and even among modern human populations [56,61,62]. Direct measure-ment of blood-ethanol levels in free-ranging chimpanzees and other frugivores would beinformative in this regard. Nonetheless, chimpanzees may have evolved specific behav-ioral and physiological responses to ethanol commensurate with its natural occurrencewithin ripe and over-ripe fruit. Ripening in figs poses particular challenges to frugivoresin that overt and substantial color changes otherwise indicating suitability of fruits forconsumption are not present in this genus (Ficus: Moraceae). Both short-range olfactoryand tactile cues are thus more important in identifying ripe fruits, with reduced use ofvisual cues [63]. Equally relevant to foraging outcomes are features of spatial and temporalheterogeneity in fruit ripening and fermentation. For example, fruits growing within thesame tree may be vertically stratified, with fruits higher in the canopy being larger andcontaining more sugars [64] and possibly higher ethanol content as well.
Moreover, fig wasps are the mutualistic tenants and obligate pollinators of figs andmay influence fermentation outcomes via different microbiota that they vector into fruits.Fig wasp behavior and ecology are highly variable among species, as are the chemical andstructural features of different figs, which may, in turn, influence outcomes of microbialcolonization and growth. Finally, endogenous fermentation of sugars is likely to vary withlocal climate, and in particular with average ambient temperatures. Lower elevations likelyyield fruits with higher ethanol concentrations, given faster yeast growth in hotter climates.Our data for Ngogo (situated at 1400 m above sea level) likely represent conservativevalues for fruit-ethanol concentrations relative to those within lowland tropical rainforestswhere most frugivorous animals are found. Nonetheless, these preliminary measurementssuggest sustained exposure of our closest living relatives to dietary ethanol and establisha methodological framework for further investigation into the natural consumption offermented fruits.
5. Conclusions
Behavioral responses to naturally occurring ethanol can be advantageous for many an-imals, may be ancestral in primates, and have substantial implications for modern humansrelative to both benign consumption of alcohol and excessive levels of drinking. A numberof empirical questions can be posed to further assess the generality of these evolutionary ar-guments. In natural ecosystems, how do animals localize fermenting nutritional resources,and what are typical blood-ethanol levels within frugivores and nectarivores? Do thehormetic effects of low-level ethanol consumption extend more generally to all species ex-posed to this molecule over evolutionary time? Are there particular sensory mechanisms insome species that predispose them to excessive ethanol ingestion under artificial conditionsof high supply? For example, ethanol evokes hyperactivity in the brain-feeding circuitsof rodents, consistent with a general role as an appetitive stimulant [40]. Fermentation byyeasts of simple carbohydrate substrates is widespread in terrestrial environments, yetthe natural background of ethanol availability has been largely ignored by biologists andclinicians alike, nutritional and health implications for modern humans notwithstanding.We therefore encourage further studies of ethanol-seeking activities in the natural world,as such behaviors (and their underlying genetic underpinnings) may yield novel insightsinto contemporary human consumption and misuse of alcoholic beverages.
Author Contributions: Conceptualization, R.D. and A.M.; methodology, R.D. and A.M.; formalanalysis, R.D. and A.M.; investigation, A.M.; resources, A.M.; data curation, R.D. and A.M.; writing—original draft preparation, R.D. and A.M.; writing—review and editing, R.D. and A.M.; supervision,R.D.; project administration, R.D. and A.M.; funding acquisition, R.D. Both authors have read andagreed to the published version of the manuscript.
Funding: This research was funded by the Class of 1933 Chair in the Biological Sciences (Universityof California, Berkeley) to R.D.
Acknowledgments: We thank John Mitani and Aaron Sandel for ongoing logistical support.
10
Nutrients 2021, 13, 2419
Conflicts of Interest: The authors declare no conflict of interest. The funders had no role in the designof the study; in the collection, analyses, or interpretation of data; in the writing of the manuscript, orin the decision to publish the results.
References
1. Dudley, R. Evolutionary Origins of Human Alcoholism in Primate Frugivory. Q. Rev. Biol. 2000, 75, 3–15. [CrossRef] [PubMed]2. Dudley, R. The Drunken Monkey: Why We Drink and Abuse Alcohol; University of California Press: Berkeley, CA, USA, 2014.3. Yeomans, M.R. Effects of alcohol on food and energy intake in human subjects: Evidence for passive and active over-consumption
of energy. Br. J. Nutr. 2004, 92, S31–S34. [CrossRef] [PubMed]4. Janzen, D.H. Why Fruits Rot, Seeds Mold, and Meat Spoils. Am. Nat. 1977, 111, 691–713. [CrossRef]5. Williams, G.C.; Nesse, R.M. Why We Get Sick: The New Science of Darwinian Medicine; Times Books: New York, NY, USA, 1994.6. Nesse, R.M.; Berridge, K.C. Psychoactive Drug Use in Evolutionary Perspective. Science 1997, 278, 63–66. [CrossRef]7. McGrew, W.C.; Baldwin, P.J.; Tutin, C.E.G. Diet of wild chimpanzees (Pan troglodytes verus) at Mt. Assirik, Senegal: I. Composition.
Am. J. Primatol. 1998, 16, 213–226. [CrossRef]8. Wrangham, R.W.; Chapman, C.A.; Clark-Arcadi, A.P.; Isabirye-Basuta, G. Social ecology of Kanyawara chimpanzees: Impli-
cations for understanding the costs of great ape groups. In The Great Ape Societies; McGrew, W.C., Marchant, L.F., Nishida, T., Eds.;Cambridge University Press: Cambridge, UK, 1996; pp. 45–57.
9. Andrews, P.; Martin, L. Hominoid dietary evolution. Philos. Trans. R. Soc. Lond. B 1991, 334, 199–209.10. Andrews, P. Palaeoecology and hominoid palaeoenvironments. Biol. Rev. Cam. Philos. Soc. 1996, 71, 257–300. [CrossRef]11. Roberts, P.; Boivin, N.; Lee-Thorp, J.; Petraglia, M.; Stock, J. Tropical forests and the genus Homo. Evol. Anthropol. 2016, 25,
306–317. [CrossRef]12. Dudley, R. Fermenting fruit and the historical ecology of ethanol ingestion: Is alcoholism in modern humans an evolutionary
hangover? Addiction 2002, 97, 381–388. [CrossRef]13. Dominy, N.J. Fruits, Fingers, and Fermentation: The Sensory Cues Available to Foraging Primates. Integr. Comp. Biol. 2004, 44,
295–303. [CrossRef]14. Wiens, F.; Zitzmann, A.; Lachance, M.-A.; Yegles, M.; Pragst, F.; Wurst, F.M.; von Holst, D.; Guan, S.L.; Spanagel, R. Chronic
intake of fermented floral nectar by wild treeshrews. Proc. Natl. Acad. Sci. USA 2008, 105, 10426–10431. [CrossRef]15. Schiel, N.; Sanz, C.M.; Schülke, O.; Shanee, S.; Souto, A.; Souza-Alves, J.P.; Stewart, F.; Stewart, K.M.; Stone, A.; Sun, B.; et al.
Fermented food consumption in wild nonhuman primates and its ecological drivers. Am. J. Phys. Anthr. 2021, 175, 513–530.[CrossRef]
16. Simmen, B. Taste discrimination and diet differentiation among New World primates. In The Digestive System in Mammals: Food,Form, and Function; Chivers, D.J., Langer, P., Eds.; Cambridge University Press: Cambridge, UK, 1994; pp. 150–165.
17. Laska, M.; Seibt, A. Olfactory sensitivity for aliphatic alcohols in squirrel monkeys and pigtail macaques. J. Exp. Biol. 2002, 205,1633–1643. [CrossRef] [PubMed]
18. Gochman, S.R.; Brown, M.B.; Dominy, N.J. Alcohol discrimination and preferences in two species of nectar-feeding primate. R.Soc. Open Sci. 2016, 3, 160217. [CrossRef] [PubMed]
19. Ibañez, D.D.; Salazar, L.T.H.; Laska, M. Taste Responsiveness of Spider Monkeys to Dietary Ethanol. Chem. Senses 2019, 44,631–638. [CrossRef] [PubMed]
20. Hockings, K.J.; Bryson-Morrison, N.; Carvalho, S.; Fujisawa, M.; Humle, T.; McGrew, W.C.; Nakamura, M.; Ohashi, G.; Yamanashi,Y.; Yamakoshi, G.; et al. Tools to tipple: Ethanol ingestion by wild chimpanzees using leaf-sponges. R. Soc. Open Sci. 2015, 2,150150. [CrossRef]
21. Peris, J.E.; Rodríguez, A.; Peña, L.; Fedriani, J.M. Fungal infestation boosts fruit aroma and fruit removal by mammals and birds.Sci. Rep. 2017, 7, 5646. [CrossRef]
22. Sánchez, F.; Korine, C.; Steeghs, M.; Laarhoven, L.-J.; Harren, F.J.M.; Cristescu, S.M.; Dudley, R.; Pinshow, B. Ethanol and Methanolas Possible Odor Cues for Egyptian Fruit Bats (Rousettus aegyptiacus). J. Chem. Ecol. 2006, 32, 1289–1300. [CrossRef]
23. Mazeh, S.; Korine, C.; Pinshow, B.; Dudley, R. Does ethanol in fruit influence feeding in the frugivorous yellow-vented bulbul(Pycnonotus xanthopygos)? Behav. Process. 2008, 77, 369–375. [CrossRef]
24. Fitzgerald, S.D.; Sullivan, J.M.; Everson, R.J. Suspected Ethanol Toxicosis in Two Wild Cedar Waxwings. Avian Dis. 1990, 34,488–490. [CrossRef]
25. Kinde, H.; Foate, E.; Beeler, E.; Uzal, F.; Moore, J.; Poppenga, R. Strong circumstantial evidence for ethanol toxicosis in CedarWaxwings (Bombycilla cedrorum). J. Ornithol. 2012, 153, 995–998. [CrossRef]
26. Carrigan, M.A.; Uryasev, O.; Frye, C.B.; Eckman, B.L.; Myers, C.R.; Hurley, T.D.; Benner, S.A. Hominids adapted to metabolizeethanol long before human-directed fermentation. Proc. Natl. Acad. Sci. USA 2015, 112, 458–463. [CrossRef]
27. Janiak, M.C.; Pinto, S.L.; Duytschaever, G.; Carrigan, M.A.; Melin, A.D. Genetic evidence of widespread variation in ethanolmetabolism among mammals: Revisiting the ‘myth’ of natural intoxication. Biol. Lett. 2020, 16, 20200070. [CrossRef]
28. Starmer, W.T.; Heed, W.B.; Rockwood-Sluss, E.S. Extension of longevity in Drosophila mojavensis by environmental ethanol:Differences between subraces. Proc. Natl. Acad. Sci. USA 1977, 74, 387–391. [CrossRef]
29. Etges, W.J.; Klassen, C.S. Influences of atmospheric ethanol on adult Drosophila mojavensis: Altered metabolic rates and increasesin fitnesses among populations. Physiol. Zool. 1989, 62, 170–193. [CrossRef]
11
Nutrients 2021, 13, 2419
30. Parsons, P.A. Acetaldehyde utilization in Drosophila: An example of hormesis. Biol. J. Linn. Soc. 1989, 37, 183–189. [CrossRef]31. Diao, Y.; Nie, J.; Tan, P.; Zhao, Y.; Tu, J.; Ji, H.; Cao, Y.; Wu, Z.; Liang, H.; Huang, H.; et al. Long-term low-dose ethanol intake
improves healthspan and resists high-fat diet-induced obesity in mice. Aging 2020, 12, 13128–13146. [CrossRef] [PubMed]32. Poli, A.; Marangoni, F.; Avogaro, A.; Barba, G.; Bellentani, S.; Bucci, M.; Cambieri, R.; Catapano, A.; Costanzo, S.; Cricelli, C.; et al.
Moderate alcohol use and health: A consensus document. Nutr. Metab. Cardiovasc. Dis. 2013, 23, 487–504. [CrossRef] [PubMed]33. Chiva-Blanch, G.; Badimon, L. Benefits and risks of moderate alcohol consumption on cardiovascular disease: Current findings
and controversies. Nutrients 2020, 12, 108. [CrossRef]34. Last, F.T.; Price, D. Yeasts associated with living plants and their environs. In The Yeasts; Rose, A.H., Harrison, J.S., Eds.; Academic
Press: London, UK, 1969; Volume 1, pp. 183–218.35. Spencer, J.F.T.; Spencer, D.M. Ecology: Where yeasts live. In Yeasts in Natural and Artificial Habitats; Spencer, J.F.T., Spencer, D.M.,
Eds.; Springer: Berlin/Heidelberg, Germany, 1997; pp. 33–58.36. Benner, S.A.; Caraco, M.D.; Thomson, J.M.; Gaucher, E.A. Planetary biology–paleontological, geological, and molecular his-tories
of life. Science 2002, 296, 864–868. [CrossRef] [PubMed]37. Ingram, L.O.; Buttke, T.M. Effects of Alcohols on Micro-Organisms. Adv. Microb. Physiol. 1984, 25, 253–300. [CrossRef]38. Devineni, A.V.; Heberlein, U. The evolution of Drosophila melanogaster as a model for alcohol research. Annu. Rev. Neurosci.
2013, 36, 121–138. [CrossRef] [PubMed]39. Cadieu, N.; Cadieu, J.-C.; El Ghadraoui, L.; Grimal, A.; Lamboeuf, Y. Conditioning to ethanol in the fruit fly—A study using an
inhibitor of ADH. J. Insect Physiol. 1999, 45, 579–586. [CrossRef]40. Cains, S.; Blomeley, C.; Kollo, M.; Racz, R.; Burdakov, D. Agrp neuron activity is required for alcohol-induced overeating. Nat.
Commun. 2017, 8, 14014. [CrossRef] [PubMed]41. Gerber, L.M.; Williams, G.C. The nutrient-toxin dosage continuum in human evolution and modern health. Q. Rev. Biol. 1999, 74,
273–289. [CrossRef] [PubMed]42. Forbes, V.E. Is hormesis an evolutionary expectation? Funct. Ecol. 2000, 14, 12–24. [CrossRef]43. Calabrese, E.J.; Baldwin, L.A. Toxicology rethinks its central belief. Nature 2003, 421, 691–692. [CrossRef]44. Oda, M.; Satta, Y.; Takenaka, O.; Takahata, N. Loss of Urate Oxidase Activity in Hominoids and its Evolutionary Implications.
Mol. Biol. Evol. 2002, 19, 640–653. [CrossRef]45. Kratzer, J.T.; Lanaspa, M.A.; Murphy, M.N.; Cicerchi, C.; Graves, C.L.; Tipton, P.A.; Ortlund, E.A.; Johnson, R.J.; Gaucher, E.A.
Evolutionary history and metabolic insights of ancient mammalian uricases. Proc. Natl. Acad. Sci. USA 2014, 111, 3763–3768.[CrossRef] [PubMed]
46. Johnson, R.J.; Titte, S.; Cade, J.R.; Rideout, B.A.; Oliver, W.J. Uric acid, evolution and primitive cultures. Semin. Nephrol. 2005, 25,3–8. [CrossRef]
47. Tapia, E.; Cristóbal, M.; Garcia, F.; Soto, V.; Monroy-Sánchez, F.; Pacheco, U.; Lanaspa, M.A.; Roncal-Jiménez, C.A.; Cruz-Robles,D.; Ishimoto, T.; et al. Synergistic effect of uricase blockade plus physiological amounts of fructose-glucose on glomerularhypertension and oxidative stress in rats. Am. J. Physiol. Renal. Physiol. 2013, 304, F727–F736. [CrossRef] [PubMed]
48. Softic, S.; Meyer, J.G.; Wang, G.X.; Gupta, M.K.; Batista, T.M.; Lauritzen, H.; Fujisaka, S.; Serra, D.; Herrero, L.; Willoughby, J.;et al. Dietary sugars alter hepatic fatty acid oxidation via transcriptional and post-translational modifications of mitochondrialproteins. Cell Metab. 2019, 30, 735–753.e734. [CrossRef] [PubMed]
49. Sánchez-Lozada, L.G.; Andres-Hernando, A.; Garcia-Arroyo, F.E.; Cicerchi, C.; Li, N.; Kuwabara, M.; Roncal-Jimenez, C.; Johnson,R.J.; Lanaspa, M. Uric acid activates aldose reductase and the polyol pathway for endogenous fructose production and fataccumulation in the development of fatty liver. J. Biol. Chem. 2019, 294, 4272–4281. [CrossRef]
50. Wang, M.; Chen, W.Y.; Zhang, J.; Gobejishvili, L.; Barve, S.S.; McClain, C.J.; Joshi-Barve, S. Elevated fructose and uric acid throughaldose reductase contribute to experimental and human alcoholic liver disease. Hepatology 2020, 72, 1617–1637. [CrossRef]
51. Lustig, R.H. Fructose: It’s “alcohol without the buzz”. Adv. Nutr. 2013, 4, 226–235. [CrossRef]52. Shen, Y.-C.; Fan, J.-H.; Edenberg, H.J.; Li, T.-K.; Cui, Y.-H.; Wang, Y.-F.; Tian, C.-H.; Zhou, C.-F.; Zhou, R.-L.; Wang, J.; et al.
Polymorphism of ADH and ALDH genes among four ethnic groups in China and effects upon the risk for alcoholism. Alcohol.Clin. Exp. Res. 1997, 21, 1272–1277. [CrossRef]
53. Osier, M.V.; Pakstis, A.J.; Soodyall, H.; Comas, D.; Goldman, D.; Odunsi, A.; Okonofua, F.; Parnas, J.; Schulz, L.O.; Bertranpetit, J.;et al. A Global Perspective on Genetic Variation at the ADH Genes Reveals Unusual Patterns of Linkage Disequilibrium andDiversity. Am. J. Hum. Genet. 2002, 71, 84–99. [CrossRef] [PubMed]
54. Agarwal, D.P.; Goedde, H.W. Alcohol Metabolism, Alcohol Intolerance, and Alcoholism: Biochemical and Pharmacogenetic Approaches;Springer: Berlin/Heidelberg, Germany, 1990.
55. Helzer, J.E.; Canino, G.J. (Eds.) Alcoholism in North America, Europe, and Asia; Oxford University Press: New York, NY, USA, 1992.56. Li, T.-K. Pharmacogenetics of responses to alcohol and genes that influence alcohol drinking. J. Stud. Alcohol. Drugs 2000, 61, 5–12.
[CrossRef]57. Ezquer, F.; Quintanilla, M.E.; Moya-Flores, F.; Morales, P.; Munita, J.M.; Olivares, B.; Landskron, G.; Hermoso, M.A.; Ezquer,
M.; Herrera-Marschitz, M.; et al. Innate gut microbiota predisposes to high alcohol consumption. Addict. Biol. 2021, 26, e13018.[CrossRef]
58. Potts, K.B.; Baken, E.; Levang, A.; Watts, D.P. Ecological factors influencing habitat use by chimpanzees at Ngogo, Kibale NationalPark, Uganda. Am. J. Primatol. 2016, 78, 432–440. [CrossRef] [PubMed]
12

Nutrients 2021, 13, 2419
59. Watts, D.P.; Potts, K.B.; Lwanga, J.S.; Mitani, J.C. Diet of chimpanzees (Pan troglodytes schweinfurthii) at Ngogo, Kibale NationalPark, Uganda, 2. temporal variation and fallback foods. Am. J. Primatol. 2012, 74, 130–144. [CrossRef] [PubMed]
60. Pusey, A.E.; Oehlert, G.W.; Williams, J.M.; Goodall, J. Influence of ecological and social factors on body mass of wild chimpanzees.Int. J. Primatol. 2005, 26, 3–31. [CrossRef]
61. Martínez, C.; Galván, S.; Garcia-Martin, E.; Ramos, M.I.; Gutiérrez-Martín, Y.; Agúndez, J.A. Variability in ethanol biodispositionin whites is modulated by polymorphisms in the ADH1B and ADH1C genes. Hepatology 2010, 51, 491–500. [CrossRef] [PubMed]
62. Bjerregaard, P.; Mikkelsen, S.S.; Becker, U.; Hansen, T.; Tolstrup, J.S. Genetic variation in alcohol metabolizing enzymes amongInuit and its relation to drinking patterns. Drug Alcohol Depend. 2014, 144, 239–244. [CrossRef]
63. Dominy, N.J.; Yeakel, J.D.; Bhat, U.; Ramsden, L.; Wrangham, R.W.; Lucas, P.W. How chimpanzees integrate sensory informationto select figs. Interface Focus 2016, 6, 20160001. [CrossRef]
64. Houle, A.; Conklin-Brittain, N.L.; Wrangham, R.W. Vertical stratification of the nutritional value of fruit: Macronutrients andcondensed tannins. Am. J. Primatol. 2014, 76, 1207–1232. [CrossRef]
13

nutrients
Article
The Global Impact of Alcohol Consumption on PrematureMortality and Health in 2016
Ivneet Sohi 1,*, Ari Franklin 1, Bethany Chrystoja 1,2,3, Ashley Wettlaufer 1, Jürgen Rehm 1,2,3,4,5,6,7,8
and Kevin Shield 1,2,4
Citation: Sohi, I.; Franklin, A.;
Chrystoja, B.; Wettlaufer, A.; Rehm, J.;
Shield, K. The Global Impact of
Alcohol Consumption on Premature
Mortality and Health in 2016.
Nutrients 2021, 13, 3145. https://
doi.org/10.3390/nu13093145
Academic Editor: Rosa Casas
Received: 2 August 2021
Accepted: 1 September 2021
Published: 9 September 2021
Publisher’s Note: MDPI stays neutral
with regard to jurisdictional claims in
published maps and institutional affil-
iations.
Copyright: © 2021 by the authors.
Licensee MDPI, Basel, Switzerland.
This article is an open access article
distributed under the terms and
conditions of the Creative Commons
Attribution (CC BY) license (https://
creativecommons.org/licenses/by/
4.0/).
1 Centre for Addiction and Mental Health, Institute for Mental Health Policy Research, 33 Ursula FranklinStreet, Toronto, ON M5S 2S1, Canada; [email protected] (A.F.); [email protected] (B.C.);[email protected] (A.W.); [email protected] (J.R.); [email protected] (K.S.)
2 Dalla Lana School of Public Health, University of Toronto, 155 College Street, Toronto, ON M5T 3M7, Canada3 Cumming School of Medicine, University of Calgary, 3330 Hospital Drive NW, Calgary, AB T2N 4N1, Canada4 Centre for Addiction and Mental Health, Campbell Family Mental Health Research Institute, 33 Russell Street,
Toronto, ON M5S 2S1, Canada5 Department of Psychiatry, University of Toronto, 250 College Street, Toronto, ON M5T 1R8, Canada6 Institute of Medical Science, University of Toronto, 1 King’s College Circle, Toronto, ON M5S 1A8, Canada7 Institute of Clinical Psychology and Psychotherapy & Center for Clinical Epidemiology and Longitudinal
Studies, Technische Universität Dresden, Chemnitzer Street 46, D-01187 Dresden, Germany8 Department of International Health Projects, Institute for Leadership and Health Management, I.M. Sechenov
First Moscow State Medical University, Trubetskaya Street, 8, b. 2, 119992 Moscow, Russia* Correspondence: [email protected]
Abstract: This study aimed to estimate the impact of alcohol use on mortality and health amongpeople 69 years of age and younger in 2016. A comparative risk assessment approach was utilized,with population-attributable fractions being estimated by combining alcohol use data from theGlobal Information System on Alcohol and Health with corresponding relative risk estimates frommeta-analyses. The mortality and health data were obtained from the Global Health Observatory.Among people 69 years of age and younger in 2016, 2.0 million deaths and 117.2 million DisabilityAdjusted Life Years (DALYs) lost were attributable to alcohol consumption, representing 7.1% and5.5% of all deaths and DALYs lost in that year, respectively. The leading causes of the burden ofalcohol-attributable deaths were cirrhosis of the liver (457,000 deaths), road injuries (338,000 deaths),and tuberculosis (190,000 deaths). The numbers of premature deaths per 100,000 people were highestin Eastern Europe (155.8 deaths per 100,000), Central Europe (52.3 deaths per 100,000 people), andWestern sub-Saharan Africa (48.7 deaths per 100,000). A large portion of the burden of disease causedby alcohol among people 69 years of age and younger is preventable through the implementation ofcost-effective alcohol policies such as increases in taxation.
Keywords: alcohol; burden of disease; death; disability; infectious diseases; non-communicablediseases; injuries; global; policy
1. Introduction
Alcohol consumption is a leading risk factor for premature mortality and the burdenof disease worldwide. Research in developed and developing countries has found thatindividuals of younger ages are disproportionately affected by alcohol [1–3]. For instance,alcohol is estimated to be the leading risk factor for the burden of disease among people15 to 49 years of age, followed by high body mass index, high blood pressure, and dietaryrisks [3]. This population also has a large proportion of their expected lifespans remaining,contributes relatively more to the economy, and plays important roles in caring for theirfamilies [4].
In response to the burden of disease caused by alcohol, the World Health Organization(WHO), through its Global strategy to reduce the harmful use of alcohol and its Global
Nutrients 2021, 13, 3145. https://doi.org/10.3390/nu13093145 https://www.mdpi.com/journal/nutrients15
Nutrients 2021, 13, 3145
Action Plan for the prevention and control of NCDs (2013–2020), agreed at the 2010 WorldHealth Assembly to aim for a 10% relative reduction in harmful alcohol use by 2025 [5,6].Furthermore, the WHO’s Sustainable Development Goals (SDG) 3.4 outlines a targeted one-third reduction by 2030 of premature mortality (i.e., deaths among people 69 years of ageand younger) due to noncommunicable diseases, with reductions in alcohol-attributablediseases being key to achieving this goal [7,8]. There is a distinct spectrum of alcohol-attributable diseases and injuries which affect people 69 years of age and younger comparedto people 70 years of age and older. Therefore, it is necessary to characterize the disease-specific health impacts of alcohol for the purposes of structuring disease-specific healthefforts, for example to inform cancer prevention programs [9].
Given the impact of alcohol consumption on premature mortality, the objective of thisstudy was to estimate the alcohol-attributable mortality and burden of disease globallyin 2016, and to examine variations in the alcohol-attributable burden over time, by globalburden of disease (GBD) region, age, and sex.
2. Materials and Methods
A comparative risk assessment methodology was utilized to estimate the burden ofdisease attributable to alcohol use in 2016. These estimations were based on the theoreticalminimum risk exposure level (TMREL) of lifetime abstention. Lifetime abstention was uti-lized as a TMREL based on historical precedent, and the observation that lifetime abstainersmay have the lowest risk of overall health loss [10]. The population-attributable fraction(PAF) for alcohol use was estimated based on a Levin-based method which combines dataon alcohol exposure with corresponding relative risk (RR) estimates [11,12]. Informationregarding the methods utilized and the data sources can be found in the SupplementalMaterial and in the paper by Shield et al. [1].
2.1. Relative Risk Estimates
Alcohol RR estimates for chronic disease outcomes (except from ischemic diseases)were obtained from meta-analyses and based on average drinking (in grams per day) [13].The lag time between alcohol use and disease occurrence was only modelled for cancer(based on the estimate that there is a 10 year period between exposure and disease out-comes [14]). Heavy episodic drinking (HED) was utilized in the modelling for the RRs forischemic diseases and injuries [1]. All RR estimates were reviewed and approved by theWHO Technical Advisory Group on Alcohol and Drug Epidemiology. The sources of RRestimates are outlined in Supplemental Material Table S1.
2.2. Mortality, Morbidity, and Population Data
Data on mortality, Years of Life Lost (YLL), morbidity measured using Years Livedwith Disability (YLD), age, sex, country, year, and by cause of mortality and/or morbiditywere obtained from the WHO’s Global Health Estimates [15]. The total burden of diseasewas measured using Disability Adjusted Life Years (DALYs) lost. Estimates of prematuremortality were based on a cut off of deaths which occurred among people 69 years of ageand younger [4,16].
Alcoholic cardiomyopathy deaths, YLL, and YLD were estimated using the methodsof Manthey and colleagues [17] as they were not directly estimated in the WHO’s GlobalHealth Estimates. The WHO’s road traffic death database [18] was used to determine thefractions of alcohol-attributable motor vehicle deaths which involved a driver and thosetraffic deaths which involved people other than the driver.
Population data by age, sex, country, and year were obtained from the UN PopulationDivision [19]. Deaths, YLLs, YLDs, and DALYs lost were aggregated into five-year agegroups, beginning at 0 years until 84 years, followed by the category of 85 years and older;alcohol PAFs were applied to these age groupings.
Data were aggregated by GBD region (see: http://ghdx.healthdata.org (accessed on1 January 2021) for regional groupings) and by Human Development Index (HDI) region
16
Nutrients 2021, 13, 3145
(see Figure S1 in the Supplementary Materials for HDI groupings). HDI categories wereobtained from the United Nations Development Programme [20]. The HDI is based onhaving a long and healthy life (i.e., life expectancy at birth), being knowledgeable (i.e.,expected years of schooling and mean years of schooling for adults 25 years of age andolder), and having a decent standard of living (i.e., Gross National Income per capita) [20].
The 95% uncertainty intervals (see Tables S2–S14 in Supplementary Materials) werebased on a set of 1000 simulations of all lowest level parameters (i.e., parameters sampledfrom their respective error distributions). These parameters were then used to estimate1000 simulated estimates of the alcohol-attributable burden of disease. From these simula-tions, the 2.5th and 97.5th percentiles were utilized for the 95% uncertainty intervals.
Analyses were performed using the statistical software package R [21].
3. Results
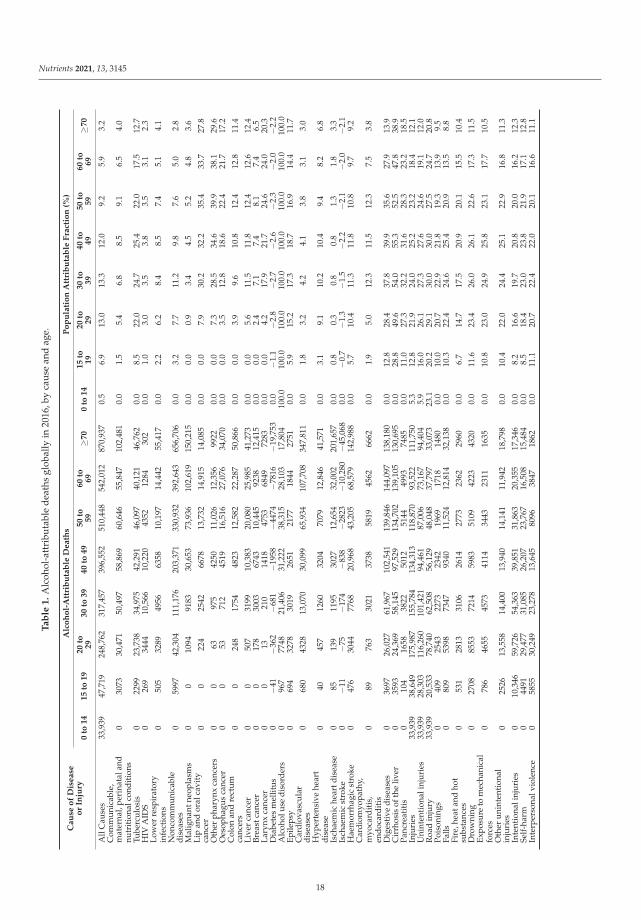
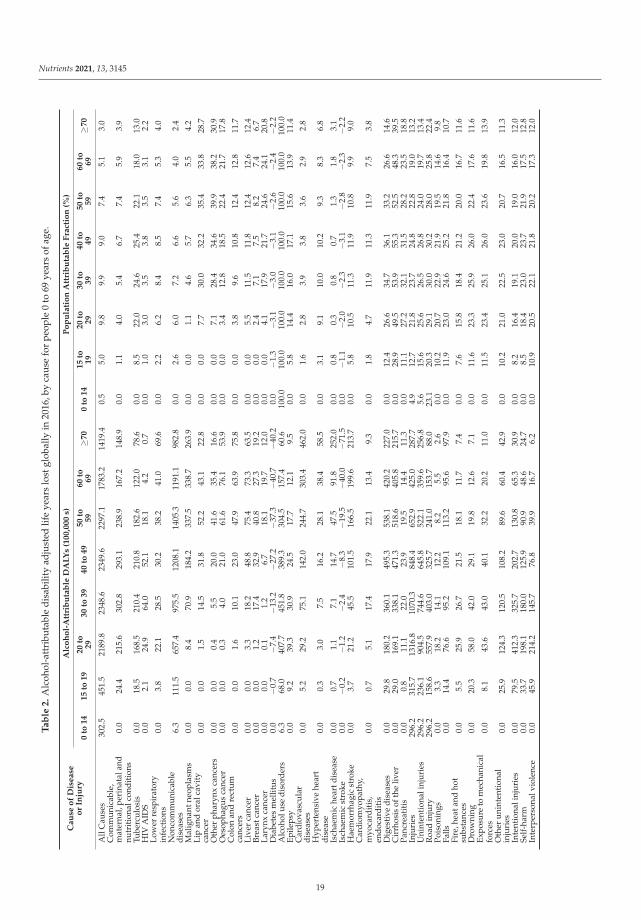
In 2016, there were 2.0 million premature deaths and 117.2 million DALYs lost globallydue to alcohol use, representing 7.1% of all premature deaths and 5.5% of all DALYs lostin that year (see Tables 1 and 2). In contrast, 3.2% of all deaths and 3.0% of all DALYslost among people 70 years of age and older were attributable to alcohol consumption.An estimated 70.7% of all alcohol-attributable deaths and 89.2% of all alcohol-attributableDALYs lost globally in 2016 were premature, i.e., among those 69 years of age and younger.In comparison, 52.0% of all deaths and 81.8% of all DALYs lost globally in 2016 werepremature. The alcohol-attributable deaths and DALYs lost among those 69 years ofage and younger were greater among men (1.6 million deaths and 90.9 million DALYslost) compared to women (0.5 million deaths and 26.3 million DALYs lost). The largestproportion of premature deaths that were attributable to alcohol occurred among people30–39 years of age (13.3%) and 20–29 years of age (13.0%). See Tables S2 to S17 for data onsex-specific alcohol-attributable deaths, YLL, YLD, and DALYs lost.
The leading causes of the burden of premature alcohol-attributable deaths werecirrhosis of the liver (457,000 deaths), road injuries (338,000 deaths), and tuberculosis(190,000 deaths) (see Figure 1). Road injuries and cirrhosis of the liver were the leadingcauses of alcohol-attributable deaths among those aged 0 to 39 and 40 to 69 years of age,respectively. The proportion of alcohol-attributable deaths due to road injuries decreasedwith age from 100% of all alcohol-attributable deaths among those aged 0–14 years to7.0% among those aged 60–69 years. The proportion of alcohol-attributable deaths due tocirrhosis of the liver increased with age, peaking at 26.4% of all alcohol-attributable deathsamong those 50–59 years of age. The proportion of alcohol-attributable deaths due totuberculosis increased with age, peaking at 10.7% of all alcohol-attributable deaths amongthose 40–49 years of age.
17
Nutrients 2021, 13, 3145
Ta
ble
1.
Alc
ohol
-att
ribu
tabl
ede
aths
glob
ally
in20
16,b
yca
use
and
age.
Cau
seo
fD
isease
or
Inju
ry
Alc
oh
ol-
Att
rib
uta
ble
Death
sP
op
ula
tio
nA
ttri
bu
tab
leF
ract
ion
(%)
0to
14
15
to19
20
to29
30
to39
40
to49
50
to59
60
to69
≥70
0to
14
15
to19
20
to29
30
to39
40
to49
50
to59
60
to69
≥70
All
Cau
ses
33,9
3947
,719
248,
762
317,
457
396,
552
510,
448
542,
012
870,
937
0.5
6.9
13.0
13.3
12.0
9.2
5.9
3.2
Com
mun
icab
le,
mat
erna
l,pe
rina
tala
ndnu
trit
iona
lcon
diti
ons
030
7330
,471
50,4
9758
,869
60,6
4655
,847
102,
481
0.0
1.5
5.4
6.8
8.5
9.1
6.5
4.0
Tube
rcul
osis
022
9923
,738
34,9
7542
,291
46,0
9740
,121
46,7
620.
08.
522
.024
.725
.422
.017
.512
.7H
IVA
IDS
026
934
4410
,566
10,2
2043
5212
8430
20.
01.
03.
03.
53.
83.
53.
12.
3Lo
wer
resp
irat
ory
infe
ctio
ns0
505
3289
4956
6358
10,1
9714
,442
55,4
170.
02.
26.
28.
48.
57.
45.
14.
1
Non
com
mun
icab
ledi
seas
es0
5997
42,3
0411
1,17
620
3,37
133
0,93
239
2,64
365
6,70
60.
03.
27.
711
.29.
87.
65.
02.
8
Mal
igna
ntne
opla
sms
00
1094
9183
30,6
5373
,936
102,
619
150,
215
0.0
0.0
0.9
3.4
4.5
5.2
4.8
3.6
Lip
and
oral
cavi
tyca
ncer
00
224
2542
6678
13,7
3214
,915
14,0
850.
00.
07.
930
.232
.235
.433
.727
.8
Oth
erph
aryn
xca
ncer
s0
063
975
4250
11,0
2612
,356
9922
0.0
0.0
7.3
28.5
34.6
39.9
38.1
29.6
Oes
opha
gus
canc
er0
053
712
4519
16,5
1627
,076
34,0
700.
00.
03.
512
.818
.622
.421
.717
.2C
olon
and
rect
umca
ncer
s0
024
817
5448
2312
,582
22,2
8750
,866
0.0
0.0
3.9
9.6
10.8
12.4
12.8
11.4
Live
rca
ncer
00
507
3199
10,3
8320
,080
25,9
8541
,273
0.0
0.0
5.6
11.5
11.8
12.4
12.6
12.4
Brea
stca
ncer
00
178
3003
6743
10,4
4592
3812
,415
0.0
0.0
2.4
7.1
7.4
8.1
7.4
6.5
Lary
nxca
ncer
00
1321
014
1847
5368
4972
830.
00.
04.
217
.921
.724
.624
.020
.3D
iabe
tes
mel
litus
0−4
1−3
62−6
81−1
958
−447
4−7
816
−19,
753
0.0
−1.1
−2.8
−2.7
−2.6
−2.3
−2.0
−2.2
Alc
ohol
use
diso
rder
s0
967
7748
21,4
0631
,222
38,3
1528
,103
17,8
0410
0.0
100.
010
0.0
100.
010
0.0
100.
010
0.0
100.
0Ep
ileps
y0
694
3278
3019
2651
2177
1844
2751
0.0
5.9
15.2
17.3
18.7
16.9
14.4
11.7
Car
diov
ascu
lar
dise
ases
068
043
2813
,070
30,0
9965
,934
107,
708
347,
811
0.0
1.8
3.2
4.2
4.1
3.8
3.1
3.0
Hyp
erte
nsiv
ehe
art
dise
ase
040
457
1260
3204
7079
12,8
4641
,571
0.0
3.1
9.1
10.2
10.4
9.4
8.2
6.8
Isch
aem
iche
artd
isea
se0
8513
911
9530
2712
,654
32,0
0220
1,65
70.
00.
80.
30.
80.
81.
31.
83.
3Is
chae
mic
stro
ke0
−11
−75
−174
−838
−282
3−1
0,28
0−4
5,06
80.
0−0
.7−1
.3−1
.5−2
.2−2
.1−2
.0−2
.1H
aem
orrh
agic
stro
ke0
476
3044
7768
20,9
6843
,205
68,5
7914
2,98
80.
05.
710
.411
.311
.810
.89.
79.
2C
ardi
omyo
path
y,m
yoca
rdit
is,
endo
card
itis
089
763
3021
3738
5819
4562
6662
0.0
1.9
5.0
12.3
11.5
12.3
7.5
3.8
Dig
esti
vedi
seas
es0
3697
26,0
2761
,967
102,
541
139,
846
144,
097
138,
180
0.0
12.8
28.4
37.8
39.9
35.6
27.9
13.9
Cir
rhos
isof
the
liver
035
9324
,369
58,1
4597
,529
134,
702
139,
105
130,
695
0.0
28.8
49.6
54.0
55.3
52.5
47.8
38.9
Panc
reat
itis
010
416
5838
2250
1251
4449
9374
850.
011
.027
.332
.231
.628
.323
.218
.5In
juri
es33
,939
38,6
4917
5,98
715
5,78
413
4,31
311
8,87
093
,522
111,
750
5.3
12.8
21.9
24.0
25.2
23.2
18.4
12.1
Uni
nten
tion
alin
juri
es33
,939
28,3
0311
6,26
010
1,42
194
,461
87,0
0673
,167
94,4
045.
916
.026
.127
.327
.624
.619
.112
.0R
oad
inju
ry33
,939
20,5
3378
,740
62,5
0856
,129
48,0
4837
,797
33,0
7323
.120
.229
.130
.030
.027
.524
.720
.8Po
ison
ings
040
925
4322
7323
4219
6917
1814
800.
010
.020
.722
.921
.819
.313
.99.
5Fa
lls0
809
5398
7347
9340
11,5
2412
,814
32,1
380.
010
.322
.424
.625
.420
.913
.58.
8Fi
re,h
eata
ndho
tsu
bsta
nces
053
128
1331
0626
1427
7323
6229
600.
06.
714
.717
.520
.920
.115
.510
.4D
row
ning
027
0885
5372
1459
8351
0942
2343
200.
011
.623
.426
.026
.122
.617
.311
.5Ex
posu
reto
mec
hani
cal
forc
es0
786
4655
4573
4114
3443
2311
1635
0.0
10.8
23.0
24.9
25.8
23.1
17.7
10.5
Oth
erun
inte
ntio
nal
inju
ries
025
2613
,558
14,4
0013
,940
14,1
4111
,942
18,7
980.
010
.422
.024
.425
.122
.916
.811
.3
Inte
ntio
nali
njur
ies
010
,346
59,7
2654
,363
39,8
5131
,863
20,3
5517
,346
0.0
8.2
16.6
19.7
20.8
20.0
16.2
12.3
Self
-har
m0
4491
29,4
7731
,085
26,2
0723
,767
16,5
0815
,484
0.0
8.5
18.4
23.0
23.8
21.9
17.1
12.8
Inte
rper
sona
lvio
lenc
e0
5855
30,2
4923
,278
13,6
4580
9638
4718
620.
011
.120
.722
.422
.020
.116
.611
.1
18
Nutrients 2021, 13, 3145
Ta
ble
2.
Alc
ohol
-att
ribu
tabl
edi
sabi
lity
adju
sted
life
year
slo
stgl
obal
lyin
2016
,by
caus
efo
rpe
ople
0to
69ye
ars
ofag
e.
Cau
seo
fD
isease
or
Inju
ry
Alc
oh
ol-
Att
rib
uta
ble
DA
LY
s(1
00,0
00
s)P
op
ula
tio
nA
ttri
bu
tab
leF
ract
ion
(%)
0to
14
15
to19
20
to29
30
to39
40
to49
50
to59
60
to69
≥70
0to
14
15
to19
20
to29
30
to39
40
to49
50
to59
60
to69
≥70
All
Cau
ses
302.
545
1.5
2189
.823
48.6
2349
.622
97.1
1783
.214
19.4
0.5
5.0
9.8
9.9
9.0
7.4
5.1
3.0
Com
mun
icab
le,
mat
erna
l,pe
rina
tala
ndnu
trit
iona
lcon
diti
ons
0.0
24.4
215.
630
2.8
293.
123
8.9
167.
214
8.9
0.0
1.1
4.0
5.4
6.7
7.4
5.9
3.9
Tube
rcul
osis
0.0
18.5
168.
521
0.4
210.
818
2.6
122.
078
.60.
08.
522
.024
.625
.422
.118
.013
.0H
IVA
IDS
0.0
2.1
24.9
64.0
52.1
18.1
4.2
0.7
0.0
1.0
3.0
3.5
3.8
3.5
3.1
2.2
Low
erre
spir
ator
yin
fect
ions
0.0
3.8
22.1
28.5
30.2
38.2
41.0
69.6
0.0
2.2
6.2
8.4
8.5
7.4
5.3
4.0
Non
com
mun
icab
ledi
seas
es6.
311
1.5
657.
497
5.5
1208
.114
05.3
1191
.198
2.8
0.0
2.6
6.0
7.2
6.6
5.6
4.0
2.4
Mal
igna
ntne
opla
sms
0.0
0.0
8.4
70.9
184.
233
7.5
338.
726
3.9
0.0
0.0
1.1
4.6
5.7
6.3
5.5
4.2
Lip
and
oral
cavi
tyca
ncer
0.0
0.0
1.5
14.5
31.8
52.2
43.1
22.8
0.0
0.0
7.7
30.0
32.2
35.4
33.8
28.7
Oth
erph
aryn
xca
ncer
s0.
00.
00.
45.
520
.041
.635
.416
.60.
00.
07.
128
.434
.639
.938
.230
.9O
esop
hagu
sca
ncer
0.0
0.0
0.3
4.0
21.0
61.6
76.1
53.9
0.0
0.0
3.4
12.8
18.5
22.4
21.7
17.8
Col
onan
dre
ctum
canc
ers
0.0
0.0
1.6
10.1
23.0
47.9
63.9
75.8
0.0
0.0
3.8
9.6
10.8
12.4
12.8
11.7
Live
rca
ncer
0.0
0.0
3.3
18.2
48.8
75.4
73.3
63.5
0.0
0.0
5.5
11.5
11.8
12.4
12.6
12.4
Brea
stca
ncer
0.0
0.0
1.2
17.4
32.9
40.8
27.3
19.2
0.0
0.0
2.4
7.1
7.5
8.2
7.4
6.7
Lary
nxca
ncer
0.0
0.0
0.1
1.2
6.7
18.1
19.7
12.0
0.0
0.0
4.1
17.9
21.7
24.6
24.1
20.8
Dia
bete
sm
ellit
us0.
0−0
.7−7
.4−1
3.2
−27.
2−3
7.3
−40.
7−4
0.2
0.0
−1.3
−3.1
−3.0
−3.1
−2.6
−2.4
−2.2
Alc
ohol
use
diso
rder
s6.
368
.040
7.7
451.
838
9.3
304.
515
7.4
60.6
100.
010
0.0
100.
010
0.0
100.
010
0.0
100.
010
0.0
Epile
psy
0.0
9.2
39.3
30.9
24.5
17.7
12.1
9.5
0.0
5.8
14.4
16.0
17.1
15.6
13.9
11.4
Car
diov
ascu
lar
dise
ases
0.0
5.2
29.2
75.1
142.
024
4.7
303.
446
2.0
0.0
1.6
2.8
3.9
3.8
3.6
2.9
2.8
Hyp
erte
nsiv
ehe
art
dise
ase
0.0
0.3
3.0
7.5
16.2
28.1
38.4
58.5
0.0
3.1
9.1
10.0
10.2
9.3
8.3
6.8
Isch
aem
iche
artd
isea
se0.
00.
71.
17.
114
.747
.591
.825
2.0
0.0
0.8
0.3
0.8
0.7
1.3
1.8
3.1
Isch
aem
icst
roke
0.0
−0.2
−1.2
−2.4
−8.3
−19.
5−4
0.0
−71.
50.
0−1
.1−2
.0−2
.3−3
.1−2
.8−2
.3−2
.2H
aem
orrh
agic
stro
ke0.
03.
721
.245
.510
1.5
166.
519
9.6
213.
70.
05.
810
.511
.311
.910
.89.
99.
0C
ardi
omyo
path
y,m
yoca
rdit
is,
endo
card
itis
0.0
0.7
5.1
17.4
17.9
22.1
13.4
9.3
0.0
1.8
4.7
11.9
11.3
11.9
7.5
3.8
Dig
esti
vedi
seas
es0.
029
.818
0.2
360.
149
5.3
538.
142
0.2
227.
00.
012
.426
.634
.736
.133
.226
.614
.6C
irrh
osis
ofth
eliv
er0.
029
.016
9.1
338.
147
1.3
518.
640
5.8
215.
70.
028
.949
.553
.955
.352
.548
.339
.5Pa
ncre
atit
is0.
00.
811
.122
.023
.919
.514
.411
.30.
011
.127
.232
.131
.528
.223
.518
.8In
juri
es29
6.2
315.
713
16.8
1070
.384
8.4
652.
942
5.0
287.
74.
912
.721
.823
.724
.822
.819
.013
.2U
nint
enti
onal
inju
ries
296.
223
6.1
904.
574
4.6
645.
852
2.1
359.
625
6.8
5.6
15.6
25.6
26.5
26.8
24.0
19.7
13.4
Roa
din
jury
296.
215
8.6
557.
940
3.0
325.
724
1.0
153.
788
.023
.120
.329
.130
.030
.228
.025
.822
.4Po
ison
ings
0.0
3.3
18.2
14.1
12.2
8.2
5.5
2.6
0.0
10.2
20.7
22.9
21.9
19.5
14.6
9.8
Falls
0.0
14.4
76.6
95.2
109.
111
3.2
95.6
97.9
0.0
11.9
23.0
24.6
25.2
21.8
16.4
10.7
Fire
,hea
tand
hot
subs
tanc
es0.
05.
525
.926
.721
.518
.111
.77.
40.
07.
615
.818
.421
.220
.016
.711
.6D
row
ning
0.0
20.3
58.0
42.0
29.1
19.8
12.6
7.1
0.0
11.6
23.3
25.9
26.0
22.4
17.6
11.6
Expo
sure
tom
echa
nica
lfo
rces
0.0
8.1
43.6
43.0
40.1
32.2
20.2
11.0
0.0
11.5
23.4
25.1
26.0
23.6
19.8
13.9
Oth
erun
inte
ntio
nal
inju
ries
0.0
25.9
124.
312
0.5
108.
289
.660
.442
.90.
010
.221
.022
.523
.020
.716
.511
.3
Inte
ntio
nali
njur
ies
0.0
79.5
412.
332
5.7
202.
713
0.8
65.3
30.9
0.0
8.2
16.4
19.1
20.0
19.0
16.0
12.0
Self
-har
m0.
033
.719
8.1
180.
012
5.9
90.9
48.6
24.7
0.0
8.5
18.4
23.0
23.7
21.9
17.5
12.8
Inte
rper
sona
lvio
lenc
e0.
045
.921
4.2
145.
776
.839
.916
.76.
20.
010
.920
.522
.121
.820
.217
.312
.0
19
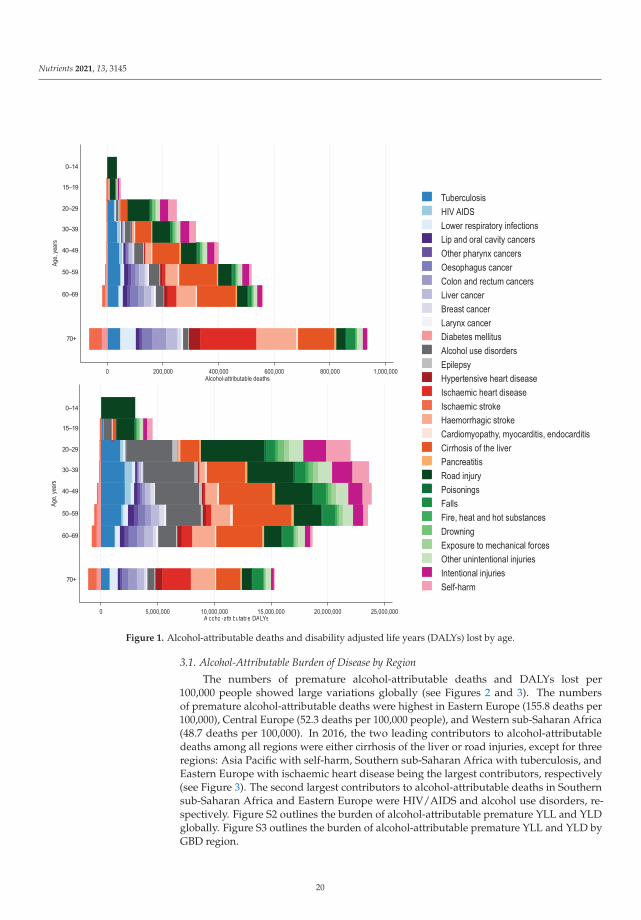
Nutrients 2021, 13, 3145
0 200,000 400,000 600,000 800,000 1,000,000
70+
60-69
50-59
40-49
30-39
20-29
15-19
0-14
Age,
year
s
Alcohol-attributable deaths
0 5,000,000 10,000,000 15,000,000 20,000,000 25,000,000
70+
60-69
50-59
40-49
30-39
20-29
15-19
0-14
Age,
year
s
Alcohol-attributable DALYs
TuberculosisHIV AIDSLower respiratory infectionsLip and oral cavity cancersOther pharynx cancersOesophagus cancerColon and rectum cancersLiver cancerBreast cancerLarynx cancerDiabetes mellitusAlcohol use disordersEpilepsyHypertensive heart diseaseIschaemic heart diseaseIschaemic strokeHaemorrhagic strokeCardiomyopathy, myocarditis, endocarditisCirrhosis of the liverPancreatitisRoad injuryPoisoningsFallsFire, heat and hot substancesDrowningExposure to mechanical forcesOther unintentional injuriesIntentional injuriesSelf-harm
0–14
15–19
20–29
30–39
40–49
50–59
60–69
70+
0–14
15–19
20–29
30–39
40–49
50–59
60–69
70+
Figure 1. Alcohol-attributable deaths and disability adjusted life years (DALYs) lost by age.
3.1. Alcohol-Attributable Burden of Disease by Region
The numbers of premature alcohol-attributable deaths and DALYs lost per100,000 people showed large variations globally (see Figures 2 and 3). The numbersof premature alcohol-attributable deaths were highest in Eastern Europe (155.8 deaths per100,000), Central Europe (52.3 deaths per 100,000 people), and Western sub-Saharan Africa(48.7 deaths per 100,000). In 2016, the two leading contributors to alcohol-attributabledeaths among all regions were either cirrhosis of the liver or road injuries, except for threeregions: Asia Pacific with self-harm, Southern sub-Saharan Africa with tuberculosis, andEastern Europe with ischaemic heart disease being the largest contributors, respectively(see Figure 3). The second largest contributors to alcohol-attributable deaths in Southernsub-Saharan Africa and Eastern Europe were HIV/AIDS and alcohol use disorders, re-spectively. Figure S2 outlines the burden of alcohol-attributable premature YLL and YLDglobally. Figure S3 outlines the burden of alcohol-attributable premature YLL and YLD byGBD region.
20
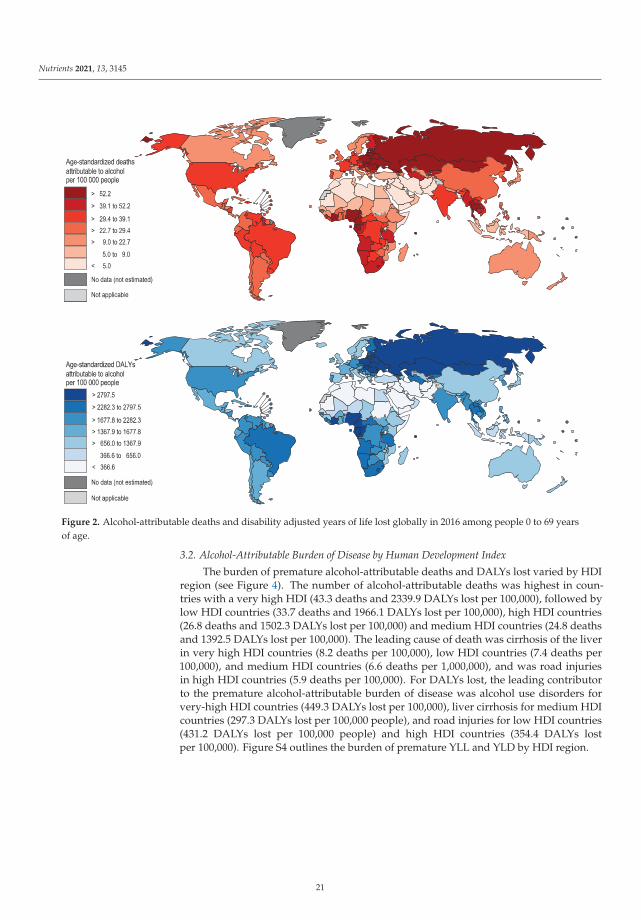
Nutrients 2021, 13, 3145
Figure 2. Alcohol-attributable deaths and disability adjusted years of life lost globally in 2016 among people 0 to 69 yearsof age.
3.2. Alcohol-Attributable Burden of Disease by Human Development Index
The burden of premature alcohol-attributable deaths and DALYs lost varied by HDIregion (see Figure 4). The number of alcohol-attributable deaths was highest in coun-tries with a very high HDI (43.3 deaths and 2339.9 DALYs lost per 100,000), followed bylow HDI countries (33.7 deaths and 1966.1 DALYs lost per 100,000), high HDI countries(26.8 deaths and 1502.3 DALYs lost per 100,000) and medium HDI countries (24.8 deathsand 1392.5 DALYs lost per 100,000). The leading cause of death was cirrhosis of the liverin very high HDI countries (8.2 deaths per 100,000), low HDI countries (7.4 deaths per100,000), and medium HDI countries (6.6 deaths per 1,000,000), and was road injuriesin high HDI countries (5.9 deaths per 100,000). For DALYs lost, the leading contributorto the premature alcohol-attributable burden of disease was alcohol use disorders forvery-high HDI countries (449.3 DALYs lost per 100,000), liver cirrhosis for medium HDIcountries (297.3 DALYs lost per 100,000 people), and road injuries for low HDI countries(431.2 DALYs lost per 100,000 people) and high HDI countries (354.4 DALYs lostper 100,000). Figure S4 outlines the burden of premature YLL and YLD by HDI region.
21
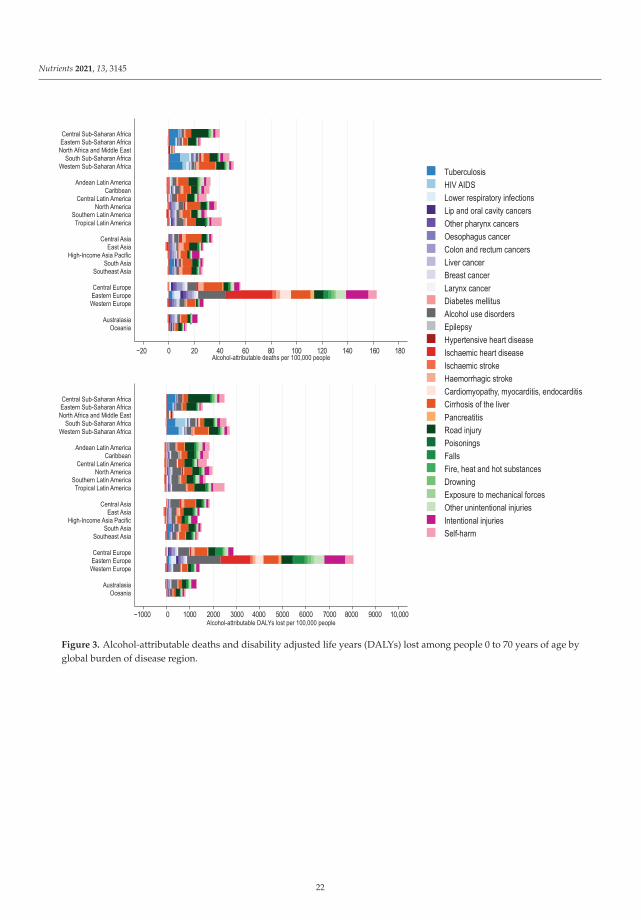
Nutrients 2021, 13, 3145
-20 0 20 40 60 80 100 120 140 160 180Alcohol-attributable deaths per 100,000 people
OceaniaAustralasia
Western EuropeEastern EuropeCentral Europe
Southeast Asia
South AsiaHigh-Income Asia Pacific
East AsiaCentral Asia
Tropical Latin America
Southern Latin AmericaNorth America
Central Latin AmericaCaribbean
Andean Latin America
Western Sub-Saharan AfricaSouth Sub-Saharan Africa
North Africa and Middle EastEastern Sub-Saharan AfricaCentral Sub-Saharan Africa
-1,000 0 1,000 2,000 3,000 4,000 5,000 6,000 7,000 8,000 9,000 10,000Alcohol-attributable DALYs lost per 100,000 people
OceaniaAustralasia
Western EuropeEastern EuropeCentral Europe
Southeast Asia
South AsiaHigh-Income Asia Pacific
East AsiaCentral Asia
Tropical Latin America
Southern Latin AmericaNorth America
Central Latin AmericaCaribbean
Andean Latin America
Western Sub-Saharan AfricaSouth Sub-Saharan Africa
North Africa and Middle EastEastern Sub-Saharan AfricaCentral Sub-Saharan Africa
TuberculosisHIV AIDSLower respiratory infectionsLip and oral cavity cancersOther pharynx cancersOesophagus cancerColon and rectum cancersLiver cancerBreast cancerLarynx cancerDiabetes mellitusAlcohol use disordersEpilepsyHypertensive heart diseaseIschaemic heart diseaseIschaemic strokeHaemorrhagic strokeCardiomyopathy, myocarditis, endocarditisCirrhosis of the liverPancreatitisRoad injuryPoisoningsFallsFire, heat and hot substancesDrowningExposure to mechanical forcesOther unintentional injuriesIntentional injuriesSelf-harm
−20 0 20 40 60 80 100 120 140 160 180
−1000 0 1000 2000 3000 4000 5000 6000 7000 8000 9000 10,000
Figure 3. Alcohol-attributable deaths and disability adjusted life years (DALYs) lost among people 0 to 70 years of age byglobal burden of disease region.
22

Nutrients 2021, 13, 3145
-500 0 500 1,000 1,500 2,000 2,500 3,000Alcohol-attributable DALYs lost per 100,000 people
Very-high
High
Medium
Low
-10 0 10 20 30 40 50Alcohol-attributable deaths per 100,000 people
Very-high
High
Medium
LowTuberculosisHIV AIDSLower respiratory infectionsLip and oral cavity cancersOther pharynx cancersOesophagus cancerColon and rectum cancersLiver cancerBreast cancerLarynx cancerDiabetes mellitusAlcohol use disordersEpilepsyHypertensive heart diseaseIschaemic heart diseaseIschaemic strokeHaemorrhagic strokeCardiomyopathy, myocarditis, endocarditisCirrhosis of the liverPancreatitisRoad injuryPoisoningsFallsFire, heat and hot substancesDrowningExposure to mechanical forcesOther unintentional injuriesIntentional injuriesSelf-harm
Hum
an D
evel
opm
ent I
ndex
regi
onHu
man
Dev
elop
men
t Ind
ex re
gion
−10 0 10 20 30 40 50
−500 0 500 1000 1500 2000 2500 3000
Figure 4. Alcohol-attributable deaths and disability adjusted life years (DALYs) lost among people 0 to 70 years of age byhuman development index region.
4. Discussion
The results of this study indicate that alcohol-attributable deaths and health lossoccurred among people relatively young in age. The proportions of alcohol-attributabledeaths and DALYs lost that were premature were greater than the proportions of all-cause deaths and DALYs lost that were considered premature. This indicates that al-cohol use disproportionately affects the health of people who are younger in age. Thecause composition of the premature alcohol-attributable burden is unique when com-pared to the burden among people 70 years of age and older, with cirrhosis of the liver,road injuries, and tuberculosis being the primary contributors to this burden. Further-more, regional and societal development-based variations in the magnitude of the pre-mature alcohol-attributable burden of disease and the cause composition of this burdenwere observed.
This study modelled both the detrimental and protective effects of alcohol consump-tion on health. Specifically, alcohol consumed at low amounts, and not on HED occasions
23
Nutrients 2021, 13, 3145
has a protective effect on diabetes, ischemic heart disease, and ischemic stroke [13]. Thisstudy found that for the premature disease burden, the detrimental effects of alcohol at thepopulation level outweighed the protective effects. At the individual level, the net effectof alcohol consumption on overall health is unknown; however, a recent modelling studyfound no level of alcohol consumption that provided a net health benefit [10].
The premature burden of disease attributable to alcohol consumption was charac-terized by tuberculosis, liver cirrhosis, and injuries. Liver cirrhosis is mainly linked tothe overall volume of drinking, while injuries attributable to alcohol are mostly relatedto intoxication (i.e., binge alcohol consumption) [13]. Tuberculosis risk (i.e., the impact ofalcohol on the immune system) is related both to the overall volume of alcohol consumedand binge drinking; however, due to the lack of studies, the impact of alcohol use ontuberculosis was modelled based only on the overall volume of alcohol consumed [13].Therefore, both overall volume of alcohol consumed and drinking to intoxication are factorsleading to the premature burden of disease attributable to alcohol consumption.
Tuberculosis remains an enormous public health concern globally, especially in lowand medium HDI countries [22]. The treatment of tuberculosis and the interaction betweenHIV/AIDS and tuberculosis are key public health priorities [23]. Alcohol use is a key riskfactor for both diseases (Morojele et al., this issue), which if addressed can substantiallyreduce the health burden of tuberculosis and HIV/AIDS. The burden of disease due to livercirrhosis was high in all HDI categories and in most GBD regions. The burden of alcoholicliver cirrhosis is affected by multiple risk factors which interact with alcohol, includinghepatitis B and C infections, obesity, and socio-economic status [24]. The burden of alcohol-related injuries is problematic as investment in preventing mortality from injury has fallenbehind other causes of death, such as HIV/AIDS and reproductive health [21]. Furthermore,mental health concerns have been overlooked in terms of public health programming,especially in young people [10] where injuries and neuropsychiatric conditions are greatlyimpacted by alcohol consumption [22].
The burden of premature disease attributable to alcohol consumption was highest inEastern Europe, Central Europe, and Western sub-Saharan Africa. The Central and EasternEurope region have a high overall volume of alcohol consumption and a high prevalenceof HED [5,6]. Alcohol control policy measures, including increases in alcohol prices anddecreases in availability, have been implemented in the Eastern Europe region and haveresulted in marked downward shifts in mortality and the burden of disease [25]. The West-ern sub-Saharan Africa region has a relatively low overall volume of alcohol consumption.The burden of alcohol-attributable premature disease in this region was driven mainly byinfectious diseases, liver cirrhosis, and injuries. Cirrhosis-related deaths doubled in thesub-Saharan Africa region between 1980 and 2010, with hepatitis B virus, hepatitis C virus,and alcohol use being contributing factors to this increase [26]. Furthermore, treatmentof liver cirrhosis is unavailable in most parts of sub-Saharan Africa, due to a shortage ofhepatologists and gastroenterologists, interventional radiologists, hepatobiliary surgeons,and pathologists [27].
4.1. Limitations
The methods used in this paper are limited by several factors. Firstly, estimatesof alcohol consumption came from surveys which are susceptible to numerous biaseswhich lead to an underestimation of alcohol use. Per capita consumption of alcohol isutilized to estimate the volume of alcohol use among drinkers to avoid bias; however,no correction exists for the prevalence of HED. This study did not fully account for theinteraction between alcohol use and other risk factors, such as smoking (increased risk ofcancer [28]), hepatitis B and C (increased risk of liver cirrhosis [29]), and obesity (increasedrisk of liver cirrhosis [24,30]). Furthermore, the study did not account for the differentialalcohol RRs by socio-economic status. Furthermore, although depression has been shownto be causally related to alcohol consumption, it was not included in the estimates of the
24
Nutrients 2021, 13, 3145
alcohol-attributable burden of disease due to depression also causally increasing alcoholconsumption [13].
This study is also limited as deaths and health loss due to interpersonal harm arebased on the alcohol consumption of the person who experiences the harm and not thealcohol consumption of the person who inflicts the harm. This is due to the relative risksof injuries from assault being based on the person who experiences the harm and notthe person who is inflicting the harm [13]. Therefore, estimates of intentional harm arelikely underestimated for children and women who are often victims of alcohol-relatedviolence [31]. It is important to note that violence against women and children is a majorpublic health, social policy, and human rights concern that spans disciplines and geographicalboundaries [32–35]. Globally, domestic violence is one of the largest sources of non-fatalinjuries to women and children [36], resulting in avoidable inequities in health status, andincreases in the risk of mental health and physical conditions [37].
4.2. Health Policies
The health harms and inequities outlined in the paper should be considered in thecontext of population-level interventions which can reduce the alcohol-attributable burdenof disease and are sustainable, scalable, and politically, economically, and technicallyfeasible [38]. Several alcohol interventions have been designated as “best buys” by theWHO as they are more cost-effective than most other interventions designed for otherrisk factors [39]. These include increases in taxation and restrictions on availability andmarketing. Other policies include WHO cost-effective “very good buys,” such as enactmentand enforcement of impaired-driving laws and blood-alcohol-concentration limits [39,40].
The need to intervene to reduce the burden of premature health loss attributableto alcohol consumption can be viewed under the framework of utilitarian ageism. Theframework of utilitarian ageism, which is often observed in medical practice, states thatthere should be prioritization of treatments and interventions for health loss among theyoung (as the old have lived longer) [41,42].
Despite the majority of the burden of disease attributable to alcohol consumptionoccurring among people 0 to 69 years of age, alcohol leads to a substantial burden ofdisease among people 70 years of age and older. Interventions such as the WHO best buysand very best buys should also be prioritized to reduce the burden among people 70 yearsof age and older. Furthermore, these policies should apply equally to beer, wine, spirits,and other alcoholic beverages as the harm caused by alcohol is based on ethanol contentregardless of whether the ethanol is consumed in the form of beer, wine, or spirits (withthe exception of alcohol poisonings which are caused predominately by the consumptionof spirits) [13].
5. Conclusions
Alcohol consumption remains a leading risk factor for the burden of disease, especiallyamong people younger in age. Given the high global alcohol-attributable burden of disease,the development and implementation of cost-effective alcohol control policies can furtherreduce in the near future the social, economic, and health burdens resulting from the useof alcohol.
Supplementary Materials: The following are available online at https://www.mdpi.com/article/10.3390/nu13093145/s1: the supplemental methodology and supplemental results (Figures S1–S4,and Tables S1–S17).
Author Contributions: Conceptualization, I.S., A.F., J.R. and K.S.; methodology, A.F., J.R. and K.S.;software, K.S.; validation A.F. and J.R.; formal analysis, I.S. and K.S.; investigation, I.S. and K.S.;data curation, A.W., A.F. and K.S.; writing—original draft preparation, I.S.; writing—reviewingand editing, I.S., A.F., J.R., B.C, A.W. and K.S.; visualization, B.C., K.S.; supervision, K.S.; projectadministration, K.S.; funding acquisition, J.R. and K.S. All authors have read and agreed to thepublished version of the manuscript.
25
Nutrients 2021, 13, 3145
Funding: This research was funded by the World Health Organization.
Institutional Review Board Statement: Not applicable.
Informed Consent Statement: Not applicable.
Data Availability Statement: All statistical code (i.e., R code) and input files used to produce theresults presented in this paper are available to the general public. To obtain the code and input files,please contact the author, Kevin Shield ([email protected]).
Acknowledgments: The authors would like to thank the World Health Organization as well as theregional and country level offices of the World Health Organization for providing data on alcohol con-sumption and the burden of disease. In particular, the authors thank Alexandra Fleischmann, VladimirPoznyak, Maristela Monteiro, and Carina Ferreira-Borges for coordinating this data collection.
Conflicts of Interest: The authors declare no conflict of interest. The funders had no role in the designof the study, in the collection, analyses, or interpretation of data, in the writing of the manuscript, orin the decision to publish the results.
References
1. Shield, K.; Manthey, J.; Rylett, M.; Probst, C.; Wettlaufer, A.; Parry, C.D.; Rehm, J. National, regional, and global burdens ofdisease from 2000 to 2016 attributable to alcohol use: A comparative risk assessment study. Lancet Public Health 2020, 5, e51–e61.[CrossRef]
2. Shield, K.D.; Rehm, J. Global risk factor rankings: The importance of age-based health loss inequities caused by alcohol and otherrisk factors. BMC Res. Notes 2015, 8, 1–4. [CrossRef]
3. Murray, C.J.; Aravkin, A.Y.; Zheng, P.; Abbafati, C.; Abbas, K.M.; Abbasi-Kangevari, M.; Abd-Allah, F.; Abdelalim, A.;Abdollahi, M.; Abdollahpour, I. Global burden of 87 risk factors in 204 countries and territories, 1990–2019: A systematicanalysis for the Global Burden of Disease Study 2019. Lancet 2020, 396, 1223–1249. [CrossRef]
4. Shield, K.; Rehm, J. Substance use and the objectives of current global health frameworks: Measurement matters. Addiction 2018,114, 771–773. [CrossRef]
5. Manthey, J.; Shield, K.D.; Rylett, M.; Hasan, O.S.; Probst, C.; Rehm, J. Global alcohol exposure between 1990 and 2017 andforecasts until 2030: A modelling study. Lancet 2019, 393, 2493–2502. [CrossRef]
6. World Health Organization. Global Status Report on Alcohol and Health 2018; World Health Organization: Geneva,Switzerland, 2018.
7. Jiang, H.; Xiang, X.; Room, R.; Hao, W. Alcohol and the Sustainable Development Goals. Lancet 2016, 388, 1279–1280. [CrossRef]8. Flor, L.S.; Gakidou, E. The burden of alcohol use: Better data and strong policies towards a sustainable development. Lancet
Public Health 2020, 5, e10–e11. [CrossRef]9. LoConte, N.K.; Brewster, A.M.; Kaur, J.S.; Merrill, J.K.; Alberg, A.J. Alcohol and cancer: A statement of the American Society of
Clinical Oncology. J. Clin. Oncol. 2018, 36, 83–93. [CrossRef]10. GBD 2016 Alcohol Collaborators. Alcohol use and burden for 195 countries and territories, 1990–2016: A systematic analysis for
the Global Burden of Disease Study 2016. Lancet 2018, 392, 1015–1035. [CrossRef]11. Levin, M.L. The occurence of lung cancer in man. Acta Unio Int. Contra Cancrum 1953, 9, 531–541.12. Rehm, J.; Irving, H.; Ye, Y.; Kerr, W.C.; Bond, J.; Greenfield, T.K. Are lifetime abstainers the best control group in alcohol
epidemiology? On the stability and validity of reported lifetime abstention. Am. J. Epidemiol. 2008, 168, 866–871. [CrossRef]13. Rehm, J.; Gmel Sr, G.E.; Gmel, G.; Hasan, O.S.M.; Imtiaz, S.; Popova, S.; Probst, C.; Roerecke, M.; Room, R.; Samokhvalov, A.V.;
et al. The relationship between different dimensions of alcohol use and the burden of disease—An update. Addiction 2017, 112,968–1001. [CrossRef]
14. Grundy, A.; Poirier, A.E.; Khandwala, F.; McFadden, A.; Friedernreich, C.M.; Brenner, D.R. Cancer inicidence attributable toalcohol consumption in Alberta in 2012. CMAJ Open 2016, 4, E507. [CrossRef]
15. World Health Organization. WHO Methods and Data Sources for Country-Level Casues of Death 2000–2016; WHO: Geneva,Switzerland, 2018.
16. Byass, P. Correlation between noncommunicable disease mortality in people aged 30–69 years and those aged 70–89 years. Bull.World Health Organ. 2019, 97, 589. [CrossRef]
17. Manthey, J.; Probst, C.; Rylett, M.; Rehm, J. National, regional, and global mortality due to alcoholic cardiomyopathy in 2015.Heart 2018, 104, 1663–1669. [CrossRef] [PubMed]
18. World Health Organization. WHO Road Traffic Death Database; World Health Organization: Geneva, Switzerland, 2018.19. United Nations. World Population Prospects: The 2017 Revision; United Nations: New York, NY, USA, 2017.20. United Nations Development Programme. Human Development Report 2018. Available online: http://www.webcitation.org/
6eYKeeF6z (accessed on 1 January 2021).21. R Core Team. R: A Language and Environment for Statistical Computing; R Core Team: Vienna, Austria, 2013.
26
Nutrients 2021, 13, 3145
22. Kyu, H.H.; Maddison, E.R.; Henry, N.J.; Mumford, J.E.; Barber, R.; Shields, C.; Brown, J.C.; Nguyen, G.; Carter, A.; Wolock, T.M.The global burden of tuberculosis: Results from the Global Burden of Disease Study 2015. Lancet Infect. Dis. 2018, 18, 261–284.[CrossRef]
23. Corbett, E.L.; Watt, C.J.; Walker, N.; Maher, D.; Williams, B.G.; Raviglione, M.C.; Dye, C. The growing burden of tuberculosis:Global trends and interactions with the HIV epidemic. Arch. Intern. Med. 2003, 163, 1009–1021. [CrossRef]
24. Rehm, J.; Patra, J.; Brennan, A.; Buckley, C.; Greenfield, T.K.; Kerr, W.C.; Manthey, J.; Purshouse, R.C.; Rovira, P.; Shuper, P.A. Therole of alcohol use in the aetiology and progression of liver disease: A narrative review and a quantification. Drug Alcohol Rev.2021. [CrossRef]
25. NCD Countdown 2030 collaborators. NCD Countdown 2030: Worldwide trends in non-communicable disease mortality andprogress towards Sustainable Development Goal target 3.4. Lancet 2018, 392, 1072–1088. [CrossRef]
26. Mokdad, A.A.; Lopez, A.D.; Shahraz, S.; Lozano, R.; Mokdad, A.H.; Stanaway, J.; Murray, C.J.; Naghavi, M. Liver cirrhosismortality in 187 countries between 1980 and 2010: A systematic analysis. BMC Med. 2014, 12, 1–24. [CrossRef]
27. Vento, S.; Dzudzor, B.; Cainelli, F.; Tachi, K. Liver cirrhosis in sub-Saharan Africa: Neglected, yet important. Lancet Global Health2018, 6, e1060–e1061. [CrossRef]
28. Voltzke, K.J.; Lee, Y.-C.A.; Zhang, Z.-F.; Zevallos, J.P.; Yu, G.-P.; Winn, D.M.; Vaughan, T.L.; Sturgis, E.M.; Smith, E.;Schwartz, S.M. Racial differences in the relationship between tobacco, alcohol, and the risk of head and neck cancer: Pooledanalysis of US studies in the INHANCE Consortium. Cancer Causes Control 2018, 29, 619–630. [CrossRef]
29. Llamosas-Falcón, L.; Shield, K.D.; Gelovany, M.; Hasan, O.S.; Manthey, J.; Monteiro, M.; Walsh, N.; Rehm, J. Impact of alcohol onthe progression of HCV-related liver disease: A systematic review and meta-analysis. J. Hepatol. 2021, 75, 536–546. [CrossRef]
30. Patra, J.; Buckley, C.; Kerr, W.C.; Brennan, A.; Purshouse, R.C.; Rehm, J. Impact of body mass and alcohol consumption onall-cause and liver mortality in 240 000 adults in the United States. Drug Alcohol Rev. 2021. [CrossRef]
31. Leonard, K. Domestic violence and alcohol: What is known and what do we need to know to encourage environmentalinterventions? J. Subst. Use 2001, 6, 235–247. [CrossRef]
32. Watts, C.; Zimmerman, C. Violence against women: Global scope and magnitude. Lancet 2002, 359, 1232–1237. [CrossRef]33. Devries, K.M.; Mak, J.Y.; Garcia-Moreno, C.; Petzold, M.; Child, J.C.; Falder, G.; Lim, S.; Bacchus, L.J.; Engell, R.E.; Rosenfeld, L.
The global prevalence of intimate partner violence against women. Science 2013, 340, 1527–1528. [CrossRef]34. Sinha, M. Measuring Violence against Women: Statistical Trends. Juristat: Canadian Centre for Justice Statistics; Minister of Industry:
Ottawa, ON, Canada, 2013.35. World Health Organization. Violence against Women: Intimate Partner and Sexual Violence against Women; World Health Organization:
Geneva Switzerland, 2016.36. Kyriacou, D.N.; Anglin, D.; Taliaferro, E.; Stone, S.; Tubb, T.; Linden, J.A.; Muelleman, R.; Barton, E.; Kraus, J.F. Risk factors for
injury to women from domestic violence. N. Engl. J. Med. 1999, 341, 1892–1898. [CrossRef]37. Coker, A.; Davis, K.; Arias, I.; Desai, S.; Sanderson, M.; Brandt, H.; Smith, P. Physical and mental health effects of intimate partner
violence for men and women. Am. J. Prev. Med. 2002, 23, 260–268. [CrossRef]38. World Health Organization. Equity, Social Determinants and Public Health Programmes; Blas, E., Kurup, A.S., Eds.; World Health
Organization,: Geneva, Switzerland, 2010.39. Chisholm, D.; Moro, D.; Bertram, M.; Pretorius, C.; Gmel, G.; Shield, K.; Rehm, J. Are the “best buys” for alcohol control still
valid? An update on the comparative cost-effectiveness of alcohol control strategies at the global level. JSAD 2018, 79, 514–522.[CrossRef]
40. Pan American Health Organization. Regional Status Report on Alcohol and Health in the Americas; PAHO: Washingon, DC,USA, 2015.
41. Harris, J. The Value of Life: An Introduction to Medical Ethics; Routledge: London, UK, 1985.42. Tsuchiya, A. QALYs and ageism: Philosophical theories and age weighting. Health Econ. 2000, 9, 57–68. [CrossRef]
27

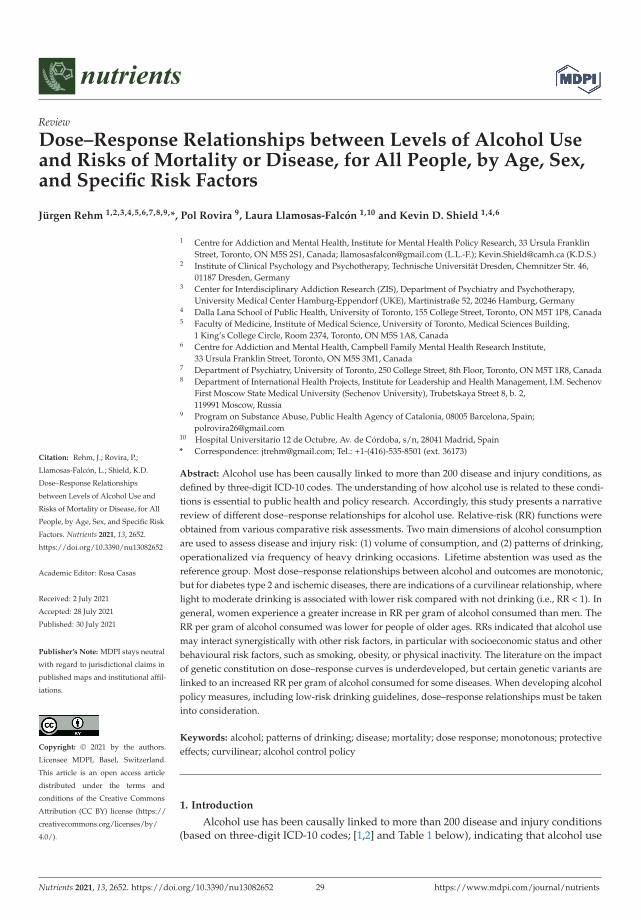
nutrients
Review
Dose–Response Relationships between Levels of Alcohol Useand Risks of Mortality or Disease, for All People, by Age, Sex,and Specific Risk Factors
Jürgen Rehm 1,2,3,4,5,6,7,8,9,*, Pol Rovira 9, Laura Llamosas-Falcón 1,10 and Kevin D. Shield 1,4,6
Citation: Rehm, J.; Rovira, P.;
Llamosas-Falcón, L.; Shield, K.D.
Dose–Response Relationships
between Levels of Alcohol Use and
Risks of Mortality or Disease, for All
People, by Age, Sex, and Specific Risk
Factors. Nutrients 2021, 13, 2652.
https://doi.org/10.3390/nu13082652
Academic Editor: Rosa Casas
Received: 2 July 2021
Accepted: 28 July 2021
Published: 30 July 2021
Publisher’s Note: MDPI stays neutral
with regard to jurisdictional claims in
published maps and institutional affil-
iations.
Copyright: © 2021 by the authors.
Licensee MDPI, Basel, Switzerland.
This article is an open access article
distributed under the terms and
conditions of the Creative Commons
Attribution (CC BY) license (https://
creativecommons.org/licenses/by/
4.0/).
1 Centre for Addiction and Mental Health, Institute for Mental Health Policy Research, 33 Ursula FranklinStreet, Toronto, ON M5S 2S1, Canada; [email protected] (L.L.-F.); [email protected] (K.D.S.)
2 Institute of Clinical Psychology and Psychotherapy, Technische Universität Dresden, Chemnitzer Str. 46,01187 Dresden, Germany
3 Center for Interdisciplinary Addiction Research (ZIS), Department of Psychiatry and Psychotherapy,University Medical Center Hamburg-Eppendorf (UKE), Martinistraße 52, 20246 Hamburg, Germany
4 Dalla Lana School of Public Health, University of Toronto, 155 College Street, Toronto, ON M5T 1P8, Canada5 Faculty of Medicine, Institute of Medical Science, University of Toronto, Medical Sciences Building,
1 King’s College Circle, Room 2374, Toronto, ON M5S 1A8, Canada6 Centre for Addiction and Mental Health, Campbell Family Mental Health Research Institute,
33 Ursula Franklin Street, Toronto, ON M5S 3M1, Canada7 Department of Psychiatry, University of Toronto, 250 College Street, 8th Floor, Toronto, ON M5T 1R8, Canada8 Department of International Health Projects, Institute for Leadership and Health Management, I.M. Sechenov
First Moscow State Medical University (Sechenov University), Trubetskaya Street 8, b. 2,119991 Moscow, Russia
9 Program on Substance Abuse, Public Health Agency of Catalonia, 08005 Barcelona, Spain;[email protected]
10 Hospital Universitario 12 de Octubre, Av. de Córdoba, s/n, 28041 Madrid, Spain* Correspondence: [email protected]; Tel.: +1-(416)-535-8501 (ext. 36173)
Abstract: Alcohol use has been causally linked to more than 200 disease and injury conditions, asdefined by three-digit ICD-10 codes. The understanding of how alcohol use is related to these condi-tions is essential to public health and policy research. Accordingly, this study presents a narrativereview of different dose–response relationships for alcohol use. Relative-risk (RR) functions wereobtained from various comparative risk assessments. Two main dimensions of alcohol consumptionare used to assess disease and injury risk: (1) volume of consumption, and (2) patterns of drinking,operationalized via frequency of heavy drinking occasions. Lifetime abstention was used as thereference group. Most dose–response relationships between alcohol and outcomes are monotonic,but for diabetes type 2 and ischemic diseases, there are indications of a curvilinear relationship, wherelight to moderate drinking is associated with lower risk compared with not drinking (i.e., RR < 1). Ingeneral, women experience a greater increase in RR per gram of alcohol consumed than men. TheRR per gram of alcohol consumed was lower for people of older ages. RRs indicated that alcohol usemay interact synergistically with other risk factors, in particular with socioeconomic status and otherbehavioural risk factors, such as smoking, obesity, or physical inactivity. The literature on the impactof genetic constitution on dose–response curves is underdeveloped, but certain genetic variants arelinked to an increased RR per gram of alcohol consumed for some diseases. When developing alcoholpolicy measures, including low-risk drinking guidelines, dose–response relationships must be takeninto consideration.
Keywords: alcohol; patterns of drinking; disease; mortality; dose response; monotonous; protectiveeffects; curvilinear; alcohol control policy
1. Introduction
Alcohol use has been causally linked to more than 200 disease and injury conditions(based on three-digit ICD-10 codes; [1,2] and Table 1 below), indicating that alcohol use
Nutrients 2021, 13, 2652. https://doi.org/10.3390/nu13082652 https://www.mdpi.com/journal/nutrients29
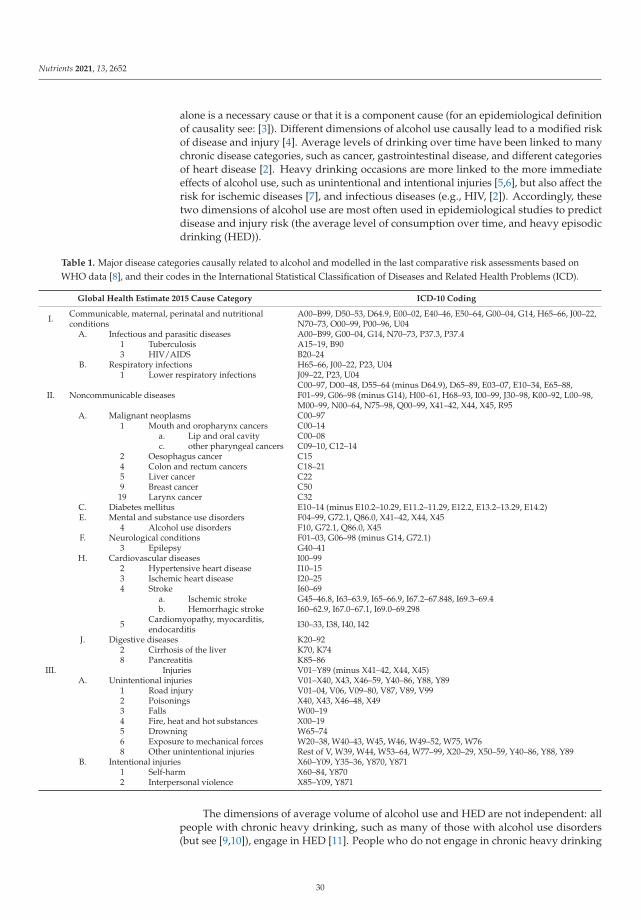
Nutrients 2021, 13, 2652
alone is a necessary cause or that it is a component cause (for an epidemiological definitionof causality see: [3]). Different dimensions of alcohol use causally lead to a modified riskof disease and injury [4]. Average levels of drinking over time have been linked to manychronic disease categories, such as cancer, gastrointestinal disease, and different categoriesof heart disease [2]. Heavy drinking occasions are more linked to the more immediateeffects of alcohol use, such as unintentional and intentional injuries [5,6], but also affect therisk for ischemic diseases [7], and infectious diseases (e.g., HIV, [2]). Accordingly, thesetwo dimensions of alcohol use are most often used in epidemiological studies to predictdisease and injury risk (the average level of consumption over time, and heavy episodicdrinking (HED)).
Table 1. Major disease categories causally related to alcohol and modelled in the last comparative risk assessments based onWHO data [8], and their codes in the International Statistical Classification of Diseases and Related Health Problems (ICD).
Global Health Estimate 2015 Cause Category ICD-10 Coding
I. Communicable, maternal, perinatal and nutritionalconditions
A00–B99, D50–53, D64.9, E00–02, E40–46, E50–64, G00–04, G14, H65–66, J00–22,N70–73, O00–99, P00–96, U04
A. Infectious and parasitic diseases A00–B99, G00–04, G14, N70–73, P37.3, P37.41 Tuberculosis A15–19, B903 HIV/AIDS B20–24
B. Respiratory infections H65–66, J00–22, P23, U041 Lower respiratory infections J09–22, P23, U04
II. Noncommunicable diseasesC00–97, D00–48, D55–64 (minus D64.9), D65–89, E03–07, E10–34, E65–88,F01–99, G06–98 (minus G14), H00–61, H68–93, I00–99, J30–98, K00–92, L00–98,M00–99, N00–64, N75–98, Q00–99, X41–42, X44, X45, R95
A. Malignant neoplasms C00–971 Mouth and oropharynx cancers C00–14
a. Lip and oral cavity C00–08c. other pharyngeal cancers C09–10, C12–14
2 Oesophagus cancer C154 Colon and rectum cancers C18–215 Liver cancer C229 Breast cancer C50
19 Larynx cancer C32C. Diabetes mellitus E10–14 (minus E10.2–10.29, E11.2–11.29, E12.2, E13.2–13.29, E14.2)E. Mental and substance use disorders F04–99, G72.1, Q86.0, X41–42, X44, X45
4 Alcohol use disorders F10, G72.1, Q86.0, X45F. Neurological conditions F01–03, G06–98 (minus G14, G72.1)
3 Epilepsy G40–41H. Cardiovascular diseases I00–99
2 Hypertensive heart disease I10–153 Ischemic heart disease I20–254 Stroke I60–69
a. Ischemic stroke G45–46.8, I63–63.9, I65–66.9, I67.2–67.848, I69.3–69.4b. Hemorrhagic stroke I60–62.9, I67.0–67.1, I69.0–69.298
5 Cardiomyopathy, myocarditis,endocarditis I30–33, I38, I40, I42
J. Digestive diseases K20–922 Cirrhosis of the liver K70, K748 Pancreatitis K85–86
III. Injuries V01–Y89 (minus X41–42, X44, X45)A. Unintentional injuries V01–X40, X43, X46–59, Y40–86, Y88, Y89
1 Road injury V01–04, V06, V09–80, V87, V89, V992 Poisonings X40, X43, X46–48, X493 Falls W00–194 Fire, heat and hot substances X00–195 Drowning W65–746 Exposure to mechanical forces W20–38, W40–43, W45, W46, W49–52, W75, W768 Other unintentional injuries Rest of V, W39, W44, W53–64, W77–99, X20–29, X50–59, Y40–86, Y88, Y89
B. Intentional injuries X60–Y09, Y35–36, Y870, Y8711 Self-harm X60–84, Y8702 Interpersonal violence X85–Y09, Y871
The dimensions of average volume of alcohol use and HED are not independent: allpeople with chronic heavy drinking, such as many of those with alcohol use disorders(but see [9,10]), engage in HED [11]. People who do not engage in chronic heavy drinking
30
Nutrients 2021, 13, 2652
can be separated in two categories: those who engage in HED and those who do not,with different impacts on some disease and mortality outcomes [12]. For example, onaverage, light drinking has been associated with cardio-protectivity compared to lifetimeabstention [13]; these effects disappear for light drinkers who also engage in HED [7].Furthermore, the risk of unintentional injury depends on the blood alcohol concentrationand thus is highest in people who have engaged in a heavy drinking occasion prior tosustaining their injury [5,6]. However, this dose–response relationship has been shownto vary based on prior drinking experience. Thus, Gmel and colleagues [14] showed thatwhile people at all average drinking levels are at increased risk for alcohol-related injury,those who normally drink lightly are at higher risk of injury compared to chronic heavydrinkers after consuming the same quantity of alcohol. Similar results have been reportedin other studies [15].
It is important to know the exact dose–response relationships between alcohol useand disease outcomes because alcohol control policy measures will in part depend on theserelationships [16]. For example, if most dose–response relationships are linear, populationmeasures to lower the population mean of alcohol use (=per capita consumption), such astaxation increases or availability restrictions, are the most effective and appropriate mea-sures (e.g., [17]). If the dose–response relationships are steep and exponential, measures forheavy drinkers could potentially be the more effective and/or cost-effective strategy [16,18].We will come back to these choices in the Discussion.
Given the numerous diseases which are causally related to alcohol consumption (seeTable 1 above), this contribution will systematically examine dose–response curves betweendifferent average levels of alcohol use and disease outcomes with a focus on modification ofsuch curves by personal characteristics and/or the drinking context. Thus, this contributionwill explore the impact of heavy episodic drinking on dose–response curves, as well as ifthese risks differ by factors such as sex, age, socio-economic status, genetic constitution,and behavioural risk factors.
2. Materials and Methods
This paper is a narrative review of the relative risk (RR) functions between averagelevel of alcohol use and the occurrence of diseases and injuries [19], mainly based onmeta-analytically derived dose–response curves used for comparative risk assessments(e.g., [8,20,21]). We used the meta-analyses reported by the latest WHO comparative riskassessments and from the Global Burden of Disease Study as they are comprehensive,evaluated by special committees, and continuously updated.
These dose–response curves usually compare the relative change in risk from a certainlevel of average drinking against the risk of a lifetime abstainer (for the rationale, see [22]).Lifetime abstention is selected as a comparison group, rather than abstention, as the peopleconstituting the latter group are comprised of lifetime abstainers and former drinkers,and therefore have different risk levels (for further discussion, see [23,24]). In burdencalculations, the theoretical minimum risk exposure level for comparison, rather thanabstention, has traditionally been used (e.g., [21]) but, for the topic of this paper, this is notrelevant. Whenever possible, the relative-risk curves are sex-specific ([8,20]; for furtherdiscussion, see below).
In risk factor epidemiology, in particular in comparative risk assessments, these dose–response curves based on RR for different exposures are then applied to almost all countries,taking into account the respective population distributions for drinking [25]. The onlyexception is the Russian Federation and surrounding countries, where region-specificdose–response curves are usually applied [26], because the same average level of drinkinghas been found to be associated with higher risks of mortality and other harms [27]. Thisprocedure assumes that the dose–response curve is fairly stable, an assumption which willbe examined below.
31
Nutrients 2021, 13, 2652
3. Results
3.1. Basic Typologies of Dose–Response Relationships
Threshold effects: Most risk curves can be described as continuous, but there is someevidence for threshold effects related to alcohol use. Tuberculosis (TB) provides us withan excellent example of this. In the original meta-analysis, Lönnroth and colleagues [28]examined the relationship between different levels of alcohol consumption, and concludedthat all studies with alcohol use below a threshold of 40 g pure alcohol per day found nosignificant relationship with incidence of active TB, whereas drinking above this thresholdresulted in about a three-fold higher risk. In this study, people with alcohol problems,including use disorders, were classified as being above the threshold. A newer study on thealcohol-TB dose–response relationship corroborated these results for people with alcoholproblems, but did not identify a threshold when they included only studies involvingindividuals with an average volume of alcohol consumption [29]. In these studies, a dose–response relationship was found, which can be explained by a monotonic increasing risk.In the linear continuous meta-analysis which was identified as the best-fitting model, theTB risk rose by about 2% per gram pure alcohol intake (95% CI: 0–3%), leading to thefollowing RR: at 25 g/day: 1.57 (95% CI: 1.10–2.23), at 50 g/day: 2.46 (95% CI: 1.21–4.98), at75 g/day: 3.85 (95% CI: 1.33–11.11), and at 100 g/day: 6.03 (95% CI: 1.47–24.81).
In the current comparative risk analyses [8], there is only one threshold relationshipfor the risk of HIV/AIDS. This model is not based on meta-analyses but on experimentaldata, and the threshold of 48 g/day and 60 g/day is modelled based on reaching a minimalblood alcohol level every day [2]. In sum, there is no good evidence for a real thresholdeffect, but for one dose–response relationship, a conservative threshold was chosen. It wasrecently decided that the risk for sexual transmitted diseases other than HIV/AIDS wouldbe modelled in the same manner in the next Global Status Report on Alcohol and Health(based on [30]).
Monotonic dose–response relationships: Most dose–response relationships are mono-tonic [11] if the comparisons are made with lifetime abstainers rather than with the com-bined group of lifetime abstainers and former drinkers. This means that with increasingaverage alcohol consumption, the risk for disease or mortality increases. In some instances,a monotonic relationship means that the risk between levels of alcohol use and RR is bestmodelled linearly, while in others there are exponential or flattening functions [11]. Itshould be noted that as the RR functions are exponential, an exponential linear functionmeans that the underlying disease or mortality risk is exponential.
Exceptions seem to be ischemic disease and diabetes, which show curvilinear rela-tionships, with light to moderate drinkers showing less risk than lifetime abstainers (fordetails, see below).
Curvilinear dose–response relationships: A number of important disease and mortalityoutcomes seem to show curvilinear relationships with the lowest risk at low to moderatedrinking levels: ischemic heart disease [7,13], ischemic stroke [31]; diabetes [32,33]. As forischemic disease, the protective effect seems to be mainly for acute outcomes, especiallyacute myocardial infarction, and less so for chronic ischemic events [34]. The use of thesecurvilinear dose–response relationships has received criticism, mainly because of theirunderlying unclear comparison groups, resulting in either overestimating the protectiveimpact of alcohol or in artificially creating such an impact where there is in reality amonotonous relationship (e.g., [35]). However, at least for ischemic disease categories,there are plausible biological pathways for a protective effect from light to moderatedrinking [36,37], so the overall shape of the curve is likely curvilinear with some kind ofprotective effect before the curve rises up again. However, the protective effect is likelyoverestimated, especially if meta-analyses based on overall abstention is used; the moreformer drinkers included, the higher the overestimation (for ischemic heart disease, ameta-analysis estimated the RR of former drinkers for ischemic heart disease mortality;1.25, 95% CI: 1.15–1.36; and 1.54, 95% CI: 1.17–2.03 for men and women, respectively [38]).
32

Nutrients 2021, 13, 2652
Another controversial dose–response curve involves alcohol use and dementia. Mostreviews found a curvilinear relationship with a protective effect for light to moderatedrinking [39], even though heavy drinking is clearly detrimentally related to the incidenceof dementia, in particular early onset dementia [40].
A final consideration here concerns sex differences in curvilinear relationships: theprotective effect and the increase in risk after the nadir are more pronounced in women,both for ischemic disease and diabetes (see risk curves in Appendix 1 of [8]). For more onsex as a modifier, see Section 3.2.
3.2. Modifiers of Dose–Response Relationships
Sex: In all countries, men, on average, consume higher quantities of alcohol, and havemore heavy drinking occasions [41]. Accordingly, alcohol-attributable mortality or burdenof disease rates are higher in men [8,21]. However, the differences in health harms areattenuated somewhat, as many RRs, especially for chronic diseases, are lower for men forthe same level of drinking. In the classical comparative risk assessment of English andcolleagues [42], a categorical approach was used with categories of <20 g/day, 20–40 g/day,and >40 g/day for women, and <40 g/day, 40–60 g/day and >60g/day for men, and theRRs were often estimated to be similar for the respective categories. Thus, in the analysis,the RR for the first category of women with a midpoint of 10 g/day was the same as forthe first category of men with a midpoint of 30 g/day.
These early quantifications were corroborated by later meta-analyses, and for thefollowing conditions, higher RRs are currently seen for women: HIV, hypertensive heartdisease, ischemic heart disease, both stroke types, liver cirrhosis, and pancreatitis. Forinstance, Figure 1 is based on the most recent comprehensive meta-analysis of Roereckeand colleagues [43] and shows a much higher RR in women for liver cirrhosis at the samelevel of drinking.
Figure 1. Relative risk for liver cirrhosis mortality as a function of mean alcohol consumption (based on [43]). RR: RelativeRisk; LC: liver cirrhosis; solid lines denote point estimates, dashed lines the 95% confidence intervals.
33

Nutrients 2021, 13, 2652
It should be noted that the categorical analyses based on a larger number of studiesresulted in fewer exponential dose–response curves, but the women had higher risks forthe same amount of drinking. For instance, a consumption of 7 and more drinks perday in women results in a RR of 24.6 (95% CI: 14.8–40.9), whereas the same amount ofaverage daily drinking in men was associated with a RR of 6.9 (95% CI: 1.1–45.0). Thesedifferences are based on the fact that for dose–response relationships in the cohorts used inmedical epidemiology, there is often not a sufficient number of people included to estimatedose–response curves for higher levels of average drinking, such as those seen in sometreatment samples (see Discussion below and [44]).
Before discussing other modifiers, it should be noted that, even now, more than25 years after the first comparative risk assessment, there is still often not a sufficientnumber of studies available to adequately separate risk curves between the sexes (see [8,20]for an overview). Data scarcity is even more of a problem for other modifiers (see belowand the Discussion).
Age: There are biological and other reasons that dose–response curves for alcohol useshould change with age. However, the underlying literature is scarce. Ischemic diseasecategories are an exception. Klatsky found an attenuation of risk based on age [45]. Basedon this, the dose–response curves for ischemic disease were modelled separately for threeage groups [46]. Figure 2 gives an example. As these curves also depend on the frequencyof HEDs (see above and [21]), different curves are provided. For people without any historyof HED, there are potential beneficial effects at up to 30 g/day average consumption, andthese effects are most pronounced in younger ages (see the curve in red versus the curvesin green or blue). For people with HED, the curve is flat until it reaches 30 g/day averageconsumption (black line), with no beneficial or detrimental effects, irrespective of age. Afterthat threshold is reached, the curves are the same irrespective of any history of HED [46].
Figure 2. Relative risk for ischemic heart disease mortality as a function of mean alcohol consumption, heavy drinkingoccasion status, and age for women assuming no heavy drinking occasions for light to moderate drinkers [46]. RR:Relative Risk.
34
Nutrients 2021, 13, 2652
Socioeconomic status and wealth (SES): Epidemiologic studies using a variety of indi-cators for SES (education, income, professional status) have consistently shown that, forthe general population, morbidity and mortality risk increases as SES decreases [47–49].Behavioural risk factors such as alcohol use and their social patterning have frequentlybeen proposed as factors mediating socioeconomic differences in health [50]. However,there may also be an interaction between such risk factors and SES. Thus, there have beensome indications that the dose–response relationships are steeper at lower levels of SES.For instance, the RR of alcohol consumption for those with HIV infections was consider-ably higher for low SES compared to high SES [51]. In general, systematic reviews andmeta-analyses found some indication for an interaction between alcohol use and SES [52].However, it is not clear if this interaction leading to more harm per litre of ethanol is due tosteeper risk curves or due to different drinking patterns or due to differences in reporting(e.g., [53]). The steeper dose–response curves could be due to interactions with other riskfactors, such as smoking or BMI (see the discussion on the harm paradox [54]). Overall,exploring this interaction and its possible underlying mechanisms should be a priority infuture research endeavours.
The same phenomena can be seen between countries: the harm per litre of alcoholdepends strongly on the economic wealth, or on the Human Development Index [55,56].Analyses stratified by the Human Development Index reveal that a substantial part ofthe variance for alcohol-attributable all-cause mortality stems from different causes ofdeath between countries. TB once again provides a good example, and has been calledthe archetypical disease of poverty [57], as it is very much linked to crowding, and othercharacteristics linked to economically poor environments [58]. Obviously, in rich countries,alcohol consumption and it is effects on the immune system will not lead to TB that often,as there are almost no people with active TB around to contract it from. Thus, the higherrisk for the same amount of alcohol can be explained by environmental variables, orinteractions with other risk factors, such as crowding. Shield and Rehm [55] provide thelist of diseases where various environmental factors play a large role: infectious diseases ingeneral (i.e., all sexually transmitted diseases, including HIV/AIDS, pneumonia) but alsoliver cirrhosis (via the interaction with hepatitis B and C [59]), and road injuries show thebiggest differences in standardized mortality after consuming one litre of pure ethanol.
Genetic constitution: Variants of three genes encoding alcohol-metabolizing enzymes,the aldehyde dehydrogenase gene ALDH2, and the two alcohol dehydrogenase genes,ADH1B and ADH1C, have been associated with different risks for some alcohol-attributablediseases. These variants are more prevalent in Japanese, Chinese, and other Asian popula-tions [60]. Differences in the dose–response curves can be found in disease outcomes forwhich acetaldehyde plays a role (flushing, most alcohol-attributable cancers [61]) and areespecially pronounced for oesophageal cancer [62], where acetaldehyde is one of the mostimportant underlying causal pathways [61,63,64].
4. Discussion
Before we discuss the findings in detail, we want to point out the limitations. Anyreview is limited by the quality of its underlying literature. In this case, there are four mainlimitations: First and foremost, the dose–response relationship for levels of alcohol usedepends to a considerable degree on the comparison group. Using the non-drinking groupfor comparison, i.e., not separating between lifetime abstainers and former drinkers willoften lead to more pronounced curvilinear relationships which falsely indicate a beneficialimpact at light to moderate levels of drinking for conditions where such benefits do not exist.The reason here is due to the inclusion of the so-called ‘sick quitters’, defined as peoplewho stopped drinking because of health problems [65]. This does not imply that there areno curvilinear relationships between the level of alcohol use and disease and mortalityoutcomes: as indicated above, there are known biological pathways for the beneficialeffects of light to moderate drinking on ischemic disease [36,66,67]. However, the ubiquityof reports on the beneficial health effects from light to moderate drinking [68,69] is mainly
35
Nutrients 2021, 13, 2652
due to this effect. Second, most of the risk curves are based on verbal reports of drinkersregarding their consumption levels, thus potentially introducing some biases [44,70,71].Even seemingly simple questions such as those regarding lifetime abstention may introducesome biases [23]: in a nationally representative US survey with follow-up, more than half(52.9%) of those who reported never having consumed any kind of alcoholic beverage in the1992 survey had, in fact, reported drinking in previous surveys. Third, most meta-analysesare based on a one-time measurement of alcohol only, with some follow-ups decadeslater [44]. This assumes that this one-time measurement captures the level of drinkingbefore and after the measurement, and certainly creates regression dilution bias [72] (i.e.,underestimation of the true relationship). Finally, in many cases risk curves are basedon a few studies from similar cultures. This certainly introduces bias, and also limits thegeneralizability of our knowledge with respect to groups, defined by sex, age, or othermodifiers. Moreover, many of the medical cohorts were selected for their likelihood ofreturning for follow-up, thus restricting groups with chronic heavy drinking patterns, suchas people with alcohol use disorders [73]. For risk curves, this means that the slopes foundwithin the variability of drinking of stable middle-class respondents are simply projectedonto slopes for more extreme drinking, where risk acceleration may plateau. This may alsocreate bias, especially for exponentially increasing slopes, and capping the relative risk atvalues where we have sufficient underlying observations for alcohol exposure may be theanswer [74]. Alternatively, RR may be capped at the average risk level for people withalcohol use disorders.
While the above limitations point to the need for more studies to fill in the researchgaps, the existing research clearly indicates several implications for alcohol policies, in-cluding guidelines: First, as most dose–response curves are monotonous, the lower thelevel of alcohol consumption overall, the better. While ischemic diseases and diabetesmay constitute exceptions, even based on current meta-analyses, it seems clear that lessconsumption is better (i.e., between 10 and 20 g/day [34,75]), and the risk is sex-specific.This means that most current low-risk drinking guidelines have thresholds which are toohigh [75]. Second, as many of the dose–response curves are exponential, risk reduction isgreater for heavier drinkers compared to moderate drinkers, if both reduce their drinkingby the same number of drinks per day [18]. Empirical evidence suggests that this is bestachieved by moving the overall population mean downwards [56,76].
5. Conclusions
Dose–response relationships are crucial for determining the best medical recommen-dations (such as low-risk drinking guidelines; [77]) and for creating effective alcoholcontrol policy measures. More research is necessary to better understand their variabilityand determinants.
Author Contributions: Conceptualization, J.R.; methodology, J.R.; validation, J.R., P.R., L.L.-F.,K.D.S.; formal analysis, P.R. and K.D.S.; investigation, J.R. and K.D.S.; resources, J.R.; data curation,J.R.; writing—original draft preparation, J.R.; writing—review and editing, J.R., P.R., L.L.-F., K.D.S.;visualization, P.R.; supervision, J.R.; project administration, J.R.; funding acquisition, J.R. All authorshave read and agreed to the published version of the manuscript.
Funding: This research was supported by funding from the US National Institute on Alcohol Abuseand Alcoholism (1R01AA028009-01A1) and the Canadian Institutes of Health Research, Institute ofNeurosciences, and Mental Health and Addiction (CRISM Ontario Node grant no. SMN-13950) tothe first author.
Institutional Review Board Statement: Not applicable, as the study did not involve humansor animals.
Informed Consent Statement: Not applicable.
Data Availability Statement: Not applicable.
36
Nutrients 2021, 13, 2652
Acknowledgments: We would like to acknowledge Astrid Otto for referencing and copy-editingthe manuscript.
Conflicts of Interest: The authors declare no conflict of interest. The funders had no role in the designof the study, in the collection, analyses, or interpretation of data, in the writing of the manuscript, orin the decision to publish the results.
References
1. Rehm, J.; Mathers, C.; Popova, S.; Thavorncharoensap, M.; Teerawattananon, Y.; Patra, J. Global burden of disease and injury andeconomic cost attributable to alcohol use and alcohol-use disorders. Lancet 2009, 373, 2223–2233. [CrossRef]
2. Rehm, J.; Probst, C.; Shield, K.D.; Shuper, P.A. Does alcohol use have a causal effect on HIV incidence and disease progression? Areview of the literature and a modeling strategy for quantifying the effect. Popul. Health Metr. 2017, 15, 4. [CrossRef] [PubMed]
3. Rothman, K.J.; Greenland, S.; Lash, T.L. Modern Epidemiology, 3rd ed.; Lippincott Williams & Wilkins: Philadelphia, PA, USA, 2008.4. Rehm, J.; Ashley, M.J.; Room, R.; Single, E.; Bondy, S.; Ferrence, R.; Giesbrecht, N. On the emerging paradigm of drinking patterns
and their social and health consequences. Addiction 1996, 91, 1615–1621. [CrossRef]5. Cherpitel, C.J.; Ye, Y.; Bond, J.; Borges, G.; Monteiro, M. Relative risk of injury from acute alcohol consumption: Modeling the
dose-response relationship in emergency department data from 18 countries. Addiction 2015, 110, 279–288. [CrossRef] [PubMed]6. Taylor, B.; Irving, H.; Kanteres, F.; Room, R.; Borges, G.; Cherpitel, C.; Greenfield, T.; Rehm, J. The more you drink, the harder you
fall: A systematic review and meta-analysis of how acute alcohol consumption and injury or collision risk increase together. DrugAlcohol Depend. 2010, 110, 108–116. [CrossRef]
7. Roerecke, M.; Rehm, J. Alcohol consumption, drinking patterns, and ischemic heart disease: A narrative review of meta-analysesand a systematic review and meta-analysis of the impact of heavy drinking occasions on risk for moderate drinkers. BMC Med.2014, 12, 182. [CrossRef] [PubMed]
8. Shield, K.; Manthey, J.; Rylett, M.; Probst, C.; Wettlaufer, A.; Parry, C.D.H.; Rehm, J. National, regional, and global burdens ofdisease from 2000 to 2016 attributable to alcohol use: A comparative risk assessment study. Lancet Public Health 2020, 5, e51–e61.[CrossRef]
9. Heilig, M.; MacKillop, J.; Martinez, D.; Rehm, J.; Leggio, L.; Vanderschuren, L.J. Addiction as a brain disease revised: Why it stillmatters, and the need for consilience. Neuropsychopharmacology 2021, 1–9. [CrossRef]
10. Jiang, H.; Lange, S.; Tran, A.; Imtiaz, S.; Rehm, J. Determining the sex-specific distributions of average daily alcohol consumptionusing cluster analysis: Is there a separate distribution for people with alcohol dependence? Popul. Health Metr. 2021, 19, 1–11.[CrossRef]
11. Rehm, J.; Gmel, G.E., Sr.; Gmel, G.; Hasan, O.S.M.; Imtiaz, S.; Popova, S.; Probst, C.; Roerecke, M.; Room, R.; Samokhvalov, A.V.;et al. The relationship between different dimensions of alcohol use and the burden of disease-an update. Addiction 2017, 112,968–1001. [CrossRef] [PubMed]
12. Gmel, G.; Kuntsche, E.; Rehm, J. Risky single—Occasion drinking: Bingeing is not bingeing. Addiction 2011, 106, 1037–1045.[CrossRef]
13. Roerecke, M.; Rehm, J. The cardioprotective association of average alcohol consumption and ischaemic heart disease: A systematicreview and meta—Analysis. Addiction 2012, 107, 1246–1260. [CrossRef]
14. Gmel, G.; Bissery, A.; Gammeter, R.; Givel, J.C.; Calmes, J.M.; Yersin, B.; Daeppen, J.B. Alcohol—Attributable injuries in admissionsto a Swiss emergency room—An analysis of the link between volume of drinking, drinking patterns, and preattendance drinking.Alcohol. Clin. Exp. Res. 2006, 30, 501–509. [CrossRef]
15. Krüger, H.P.; Kazenwadel, J.; Vollrath, M. Grand Rapids effects revisited: Accidents, alcohol and risk. In Alcohol, Drugs, and TrafficSafety, Proceedings of the 13th International Conference on Alcohol, Drugs and Traffic Safety, Adelaide, Australia, 13–18 August 1995;Kloeden, C.N., McLean, A.J., Eds.; NHMRC Road Accident Research Unit, University of Adelaide: Adelaide, Australia, 1995;pp. 222–230.
16. Keyes, K.M.; Galea, S. Population Health Science; Oxford University Press: Oxford, UK, 2016.17. Rose, G. Sick individuals and sick populations. Int. J. Epidemiol. 1985, 14, 32–38. [CrossRef]18. Nutt, D.J.; Rehm, J. Doing it by numbers: A simple approach to reducing the harms of alcohol. J. Psychopharmacol. 2014, 28, 3–7.
[CrossRef] [PubMed]19. Cook, D.J.; Mulrow, C.D.; Haynes, R.B. Systematic reviews: Synthesis of best evidence for clinical decisions. Ann. Intern. Med.
1997, 126, 376–380. [CrossRef]20. Rehm, J.; Sherk, A.; Shield, K.D.; Gmel, G. Risk Relations between Alcohol Use and Non-Injury Causes of Death Toronto, ON:
Centre for Addiction and Mental Health. 2017. Available online: https//www.camh.ca/-/media/files/pdfs---reports-and-books---research/camh-risk-relations-between-alcohol-use-and-non-injury-causes-of-death-sept2017-pdf.pdf?la=en&hash=393C0B60D26A218F2512C39C1B61EFCE0FCC5128 (accessed on 29 July 2021).
21. GBD. 2019 Risk Factors Collaborators. Global burden of 87 risk factors in 204 countries and territories, 1990–2019: A systematicanalysis for the Global Burden of Disease Study 2019. Lancet 2020, 396, 1223–1249. [CrossRef]
22. Rehm, J.; Monteiro, M.; Room, R.; Gmel, G.; Jernigan, D.; Frick, U.; Graham, K. Steps towards constructing a global comparativerisk analysis for alcohol consumption: Determining indicators and empirical weights for patterns of drinking, deciding abouttheoretical minimum, and dealing with different consequences. Eur. Addict. Res. 2001, 7, 138–147. [CrossRef]
37
Nutrients 2021, 13, 2652
23. Rehm, J.; Irving, H.; Ye, Y.; Kerr, W.C.; Bond, J.; Greenfield, T.K. Are lifetime abstainers the best control group in alcoholepidemiology? On the stability and validity of reported lifetime abstention. Am. J. Epidemiol. 2008, 168, 866–871. [CrossRef][PubMed]
24. Klatsky, A.L. Invited commentary: Never, or hardly ever? It could make a difference. Am. J. Epidemiol. 2008, 168, 872–875.[CrossRef] [PubMed]
25. Rehm, J.; Kehoe, T.; Gmel, G.; Stinson, F.; Grant, B.; Gmel, G. Statistical modeling of volume of alcohol exposure for epidemiologicalstudies of population health: The US example. Popul. Health Metr. 2010, 8, 3. [CrossRef]
26. Shield, K.; Rehm, J. Russia-specific relative risks and their effects on the estimated alcohol-attributable burden of disease. BMCPublic Health 2015, 15, 482. [CrossRef] [PubMed]
27. Zaridze, D.; Lewington, S.; Boroda, A.; Scélo, G.; Karpov, R.; Lazarev, A.; Konobeevskaya, I.; Igitov, V.; Terechova, T.; Boffetta, P.Alcohol and mortality in Russia: Prospective observational study of 151,000 adults. Lancet 2014, 383, 1465–1473. [CrossRef]
28. Lönnroth, K.; Williams, B.; Stadlin, S.; Jaramillo, E.; Dye, C. Alcohol use as a risk factor for tuberculosis—A systematic review.BMC Public Health 2008, 8, 289. [CrossRef] [PubMed]
29. Imtiaz, S.; Shield, K.D.; Roerecke, M.; Samokhvalov, A.V.; Lönnroth, K.; Rehm, J. Alcohol consumption as a risk factor fortuberculosis: Meta-analyses and burden of disease. Eur. Respir. J. 2017, 50, 1700216. [CrossRef] [PubMed]
30. Llamosas-Falcón, L. Proposal: To Include Mortality and Morbidity for Sexually Transmitted Diseases (STDs) as Alcohol-AttributableDisease Conditions in Comparative Risk Assessments—Rationale and Procedures; Centre for Addiction and Mental Health: Toronto,ON, Canada, 2021.
31. Larsson, S.C.; Wallin, A.; Wolk, A.; Markus, H.S. Differing association of alcohol consumption with different stroke types: Asystematic review and meta-analysis. BMC Med. 2016, 14, 178. [CrossRef]
32. Baliunas, D.; Taylor, B.; Irving, H.; Roerecke, M.; Patra, J.; Mohapatra, S.; Rehm, J. Alcohol as a risk factor for type 2 diabetes—Asystematic review and meta-analysis. Diabetes Care 2009, 32, 2123–2132. [CrossRef]
33. Knott, C.; Bell, S.; Britton, A. Alcohol consumption and the risk of type 2 diabetes: A systematic review and Dose-ResponseMeta-analysis of more than 1.9 million individuals from 38 observational studies. Diabetes Care 2015, 38, 1804–1812. [CrossRef]
34. Wood, A.M.; Kaptoge, S.; Butterworth, A.S.; Willeit, P.; Warnakula, S.; Bolton, T.; Paige, E.; Paul, D.S.; Sweeting, M.; Burgess, S.;et al. Risk thresholds for alcohol consumption: Combined analysis of individual-participant data for 599,912 current drinkers in83 prospective studies. Lancet 2018, 391, 1513–1523. [CrossRef]
35. Zhao, J.; Stockwell, T.; Roemer, A.; Naimi, T.; Chikritzhs, T. Alcohol consumption and mortality from coronary heart disease: Anupdated meta-analysis of cohort studies. J. Stud. Alcohol Drugs 2017, 78, 375–386. [CrossRef]
36. Brien, S.E.; Ronksley, P.E.; Turner, B.J.; Mukamal, K.J.; Ghali, W.A. Effect of alcohol consumption on biological markers associatedwith risk of coronary heart disease: Systematic review and meta-analysis of interventional studies. Br. Med. J. 2011, 342, d636.[CrossRef]
37. Rehm, J. On the limitations of observational studies. Addict. Res. Theory 2007, 15, 20–22.38. Roerecke, M.; Rehm, J. Ischemic heart disease mortality and morbidity in former drinkers: A meta-analysis. Am. J. Epidemiol.
2011, 73, 245–258. [CrossRef]39. Rehm, J.; Hasan, O.S.M.; Black, S.E.; Shield, K.D.; Schwarzinger, M. Alcohol use and dementia: A systematic scoping review.
Alzheimers Res. Ther. 2019, 11, 1. [CrossRef] [PubMed]40. Schwarzinger, M.; Pollock, B.G.; Hasan, O.S.M.; Dufouil, C.; Rehm, J.; QalyDays Study Group. Contribution of alcohol use
disorders to the burden of dementia in France 2008-13: A nationwide retrospective cohort study. Lancet Public Health 2018, 3,e124–e132. [CrossRef]
41. Manthey, J.; Shield, K.D.; Rylett, M.; Hasan, O.S.M.; Probst, C.; Rehm, J. Global alcohol exposure between 1990 and 2017 andforecasts until 2030: A modelling study. Lancet 2019, 393, 2493–2502. [CrossRef]
42. English, D.; Holman, C.; Milne, E.; Winter, M.; Hulse, G.; Codde, J.; Bower, C.; Corti, B.; De Klerk, N.; Knuiman, M.; et al. TheQuantification of Drug caused Morbidity and Mortality in Australia 1995; Australian Government Publishing Service: Canberra,Australia, 1995.
43. Roerecke, M.; Vafaei, A.; Hasan, O.S.M.; Chrystoja, B.R.; Cruz, M.; Lee, R.; Neuman, M.R.; Rehm, J. Alcohol Consumption andRisk of Liver Cirrhosis: A Systematic Review and Meta-Analysis. Am. J. Gastroenterol. 2019, 114, 1574–1586. [CrossRef] [PubMed]
44. Rehm, J.; Gmel, G.; Sempos, C.T.; Trevisan, M. Alcohol-related morbidity and mortality. Alcohol Res. Health 2003, 27, 39.45. Klatsky, A.L.; Udaltsova, N. Alcohol drinking and total mortality risk. Ann. Epidemiol. 2007, 17, S63–S67. [CrossRef]46. Rehm, J.; Shield, K.D.; Roerecke, M.; Gmel, G. Modelling the impact of alcohol consumption on cardiovascular disease mortality
for comparative risk assessments: An overview. BMC Public Health 2016, 16, 363. [CrossRef]47. Bond Huie, S.A.; Krueger, P.M.; Rogers, R.G.; Hummer, R.A. Wealth, race, and mortality. Soc. Sci. Q. 2003, 84, 667–684. [CrossRef]48. Feinstein, J.S. The relationship between socioeconomic status and health: A review of the literature. Milbank Q. 1993, 71, 279–322.
[CrossRef]49. Mackenbach, J.P.; Stirbu, I.; Roskam, A.-J.R.; Schaap, M.M.; Menvielle, G.; Leinsalu, M.; Kunst, A.E. Socioeconomic inequalities in
health in 22 European countries. N. Engl. J. Med. 2008, 358, 2468–2481. [CrossRef]50. Petrovic, D.; de Mestral, C.; Bochud, M.; Bartley, M.; Kivimäki, M.; Vineis, P.; Mackenbach, J.; Stringhini, S. The contribution of
health behaviors to socioeconomic inequalities in health: A systematic review. Prev. Med. 2018, 113, 15–31. [CrossRef] [PubMed]
38

Nutrients 2021, 13, 2652
51. Probst, C.; Simbayi, L.C.; Parry, C.D.; Shuper, P.A.; Rehm, J. Alcohol use, socioeconomic status and risk of HIV infections. AIDSBehav. 2017, 21, 1926–1937. [CrossRef]
52. Probst, C.; Roerecke, M.; Behrendt, S.; Rehm, J. Socioeconomic differences in alcohol-attributable mortality compared withall-cause mortality: A systematic review and meta-analysis. Int. J. Epidemiol. 2014, 43, 1314–1327. [CrossRef] [PubMed]
53. Probst, C.; Kilian, C.; Sanchez, S.; Lange, S.; Rehm, J. The role of alcohol use and drinking patterns in socioeconomic inequalitiesin mortality: A systematic review. Lancet Public Health 2020, 5, e324–e332. [CrossRef]
54. Boyd, J.; Sexton, O.; Angus, C.; Meier, P.; Purshouse, R.C.; Holmes, J. Causal mechanisms proposed for the alcohol harmparadox—A systematic review. Addiction 2021. [CrossRef]
55. Shield, K.D.; Rehm, J. Societal development and the alcohol-attributable burden of disease. Addiction 2021. [CrossRef]56. Babor, T.F.; Casswell, S.; Graham, K.; Huckle, T.; Livingston, M.; Österberg, E.; Rehm, J.; Room, R.; Rossow, I.; Sornpaisarn, B.
Alcohol: No Ordinary Commodity. Research and Public Policy, 3rd ed.; Oxford University Press: Oxford, UK, 2021, (forthcoming).57. Anonymous. Tackling poverty in tuberculosis control. Lancet 2005, 366, 2063. [CrossRef]58. Rehm, J.; Samokhvalov, A.V.; Neuman, M.G.; Room, R.; Parry, C.; Lönnroth, K.; Patra, J.; Poznyak, V.; Popova, S. The association
between alcohol use, alcohol use disorders and tuberculosis (TB). A systematic review. BMC Public Health 2009, 9, 1–12. [CrossRef]59. Llamosas-Falcón, L.; Shield, K.D.; Gelovany, M.; Hasan, O.S.; Manthey, J.; Monteiro, M.; Walsh, N.; Rehm, J. Impact of alcohol on
the progression of HCV-related liver disease: A systematic review and meta-analysis. J. Hepatol. 2021. [CrossRef]60. Eng, M.Y.; Luczak, S.E.; Wall, T.L. ALDH2, ADH1B, and ADH1C genotypes in Asians: A literature review. Alcohol Res. Health
2007, 30, 22.61. International Agency for Research on Cancer. International Agency for Research on Cancer. IARC Monographs on the Evaluation of
Carcinogenic Risks to Humans: Volume 96—Alcohol Consumption and Ethyl Carbamate; International Agency for Research on Cancer:Lyon, France, 2010.
62. Roerecke, M.; Shield, K.D.; Higuchi, S.; Yoshimura, A.; Larsen, E.; Rehm, M.X.; Rehm, J. Estimates of alcohol-related oesophagealcancer burden in Japan: Systematic review and meta-analyses. Bull. World Health Organ. 2015, 93, 329–338. [CrossRef]
63. Baan, R.; Straif, K.; Grosse, Y.; Secretan, B.; El Ghissassi, F.; Bouvard, V.; Altieri, A.; Cogliano, V.; WHO International Agencyfor Research on Cancer Monograph Working Group. Carcinogenicity of alcoholic beverages. Lancet Oncol. 2007, 8, 292–293.[CrossRef]
64. Brooks, P.J.; Enoch, M.-A.; Goldman, D.; Li, T.-K.; Yokoyama, A. The alcohol flushing response: An unrecognized risk factor foresophageal cancer from alcohol consumption. PLoS Med. 2009, 6, e1000050. [CrossRef] [PubMed]
65. Sarich, P.; Canfell, K.; Banks, E.; Paige, E.; Egger, S.; Joshy, G.; Korda, R.; Weber, M. A prospective study of health conditionsrelated to alcohol consumption cessation among 97,852 drinkers aged 45 and over in Australia. Alcohol. Clin. Exp. Res. 2019, 43,710–721. [CrossRef]
66. Puddey, I.B.; Rakic, V.; Dimmitt, S.B.; Beilin, L.J. Influence of pattern of drinking on cardiovascular disease and cardiovascularrisk factors–a review. Addiction 1999, 94, 649–663. [CrossRef]
67. Rehm, J.; Roerecke, M. Cardiovascular effects of alcohol consumption. Trends Cardiovasc. Med. 2017, 27, 534–538. [CrossRef][PubMed]
68. Fekjær, H.O. Alcohol—A universal preventive agent? A critical analysis. Addiction 2013, 108, 2051–2057. [CrossRef] [PubMed]69. Rehm, J. The role of the comparison group in epidemiology and general limitations. Addiction 2013, 108, 2058–2059. [CrossRef]
[PubMed]70. Del Boca, F.K.; Darkes, J. The validity of self—Reports of alcohol consumption: State of the science and challenges for research.
Addiction 2003, 98, 1–12. [CrossRef]71. Rehm, J.; Kilian, C.; Rovira, P.; Shield, K.D.; Manthey, J. The elusiveness of representativeness in general population surveys for
alcohol. Drug Alcohol Rev. 2021, 40, 161–165. [CrossRef] [PubMed]72. Clarke, R.; Shipley, M.; Lewington, S.; Youngman, L.; Collins, R.; Marmot, M.; Peto, R. Underestimation of risk associations due to
regression dilution in long-term follow-up of prospective studies. Am. J. Epidemiol. 1999, 150, 341–353. [CrossRef] [PubMed]73. Rehm, J.; Marmet, S.; Anderson, P.; Gual, A.; Kraus, L.; Nutt, D.; Room, R.; Samokhvalov, A.V.; Scafato, E.; Trapencieris, M.; et al.
Defining substance use disorders: Do we really need more than heavy use? Alcohol Alcohol. 2013, 48, 633–640. [CrossRef]74. Gmel, G.; Shield, K.D.; Kehoe-Chan, T.A.; Rehm, J. The effects of capping the alcohol consumption distribution and relative risk
functions on the estimated number of deaths attributable to alcohol consumption in the European Union in 2004. BMC Med. Res.Methodol. 2013, 13, 1–9. [CrossRef]
75. Shield, K.D.; Gmel, G.; Mäkelä, P.; Probst, C.; Room, R.; Gmel, G.; Rehm, J. Risk, individual perception of risk and populationhealth. Addiction 2017, 112, 2272–2273. [CrossRef]
76. Rossow, I.; Mäkelä, P. Public health thinking around alcohol-related harm: Why does per capita consumption matter? J. Stud.Alcohol Drugs 2021, 82, 9–17. [CrossRef]
77. Bondy, S.J.; Rehm, J.; Ashley, M.J.; Walsh, G.; Single, E.; Room, R. Low-risk drinking guidelines: The scientific evidence. Can. J.Public Health 1999, 90, 264–270. [CrossRef]
39

nutrients
Review
Alcohol and Cancer: Epidemiology and Biological Mechanisms
Harriet Rumgay 1,*, Neil Murphy 2, Pietro Ferrari 2 and Isabelle Soerjomataram 1
Citation: Rumgay, H.; Murphy, N.;
Ferrari, P.; Soerjomataram, I. Alcohol
and Cancer: Epidemiology and
Biological Mechanisms. Nutrients
2021, 13, 3173. https://doi.org/
10.3390/nu13093173
Academic Editor: Peter Anderson
Received: 23 July 2021
Accepted: 9 September 2021
Published: 11 September 2021
Publisher’s Note: MDPI stays neutral
with regard to jurisdictional claims in
published maps and institutional affil-
iations.
Copyright: © 2021 by the authors.
Licensee MDPI, Basel, Switzerland.
This article is an open access article
distributed under the terms and
conditions of the Creative Commons
Attribution (CC BY) license (https://
creativecommons.org/licenses/by/
4.0/).
1 Cancer Surveillance Branch, International Agency for Research on Cancer, CEDEX 08, 69372 Lyon, France;[email protected]
2 Nutrition and Metabolism Branch, International Agency for Research on Cancer, CEDEX 08,69372 Lyon, France; [email protected] (N.M.); [email protected] (P.F.)
* Correspondence: [email protected]
Abstract: Approximately 4% of cancers worldwide are caused by alcohol consumption. Drinkingalcohol increases the risk of several cancer types, including cancers of the upper aerodigestive tract,liver, colorectum, and breast. In this review, we summarise the epidemiological evidence on alcoholand cancer risk and the mechanistic evidence of alcohol-mediated carcinogenesis. There are severalmechanistic pathways by which the consumption of alcohol, as ethanol, is known to cause cancer,though some are still not fully understood. Ethanol’s metabolite acetaldehyde can cause DNAdamage and block DNA synthesis and repair, whilst both ethanol and acetaldehyde can disrupt DNAmethylation. Ethanol can also induce inflammation and oxidative stress leading to lipid peroxidationand further DNA damage. One-carbon metabolism and folate levels are also impaired by ethanol.Other known mechanisms are discussed. Further understanding of the carcinogenic properties ofalcohol and its metabolites will inform future research, but there is already a need for comprehensivealcohol control and cancer prevention strategies to reduce the burden of cancer attributable to alcohol.
Keywords: alcohol; acetaldehyde; oxidative stress; inflammation; one carbon metabolism; lipidmetabolism; DNA damage; cancer; carcinogenesis
1. Introduction
Approximately 4% of cancers worldwide are caused by alcohol consumption, equatingto more than 740,000 cases of cancer globally in 2020 [1]. The impact of alcohol consumptionon cancer burden differs by cancer type, and cancers of the oesophagus, liver, and breastrepresent the most alcohol-attributable cases of cancer globally (Figure 1). Drinking alcoholeven at lower levels of intake can increase the risk of cancer and we previously estimatedthat over 100,000 cases of cancer in 2020 were caused by light and moderate drinking ofthe equivalent of around one or two alcoholic drinks per day [1]. Despite this, there is lowpublic awareness of the causal link between alcohol and cancer and alcohol use is growingin several regions of the world [2,3].
More than 30 years ago, in 1988, the International Agency for Research on Cancer(IARC) classified alcoholic beverages as a group 1 carcinogen, the most severe classifica-tion [4]. The IARC Monographs program aims to classify cancerous agents according to thestrength of the available epidemiological and experimental evidence. Cancers of the oralcavity, pharynx, larynx, oesophagus, and liver were first classified as being causally relatedto the consumption of alcoholic beverages, and this was expanded to include cancers ofthe colorectum and female breast in the later monographs on alcoholic beverages in 2010and 2012, with a positive association observed for cancer of the pancreas [5,6].
The World Cancer Research Fund (WCRF) also conducts classification of physical anddietary components and their potential cancerous effects as part of their Continuous UpdateProject. The WCRF base their conclusions on the quality of epidemiological evidence andcarry out meta-analyses of the association with cancer risk. In the most recent report on Diet,Nutrition, Physical Activity and Cancer, WCRF concluded that there was strong evidence
Nutrients 2021, 13, 3173. https://doi.org/10.3390/nu13093173 https://www.mdpi.com/journal/nutrients41
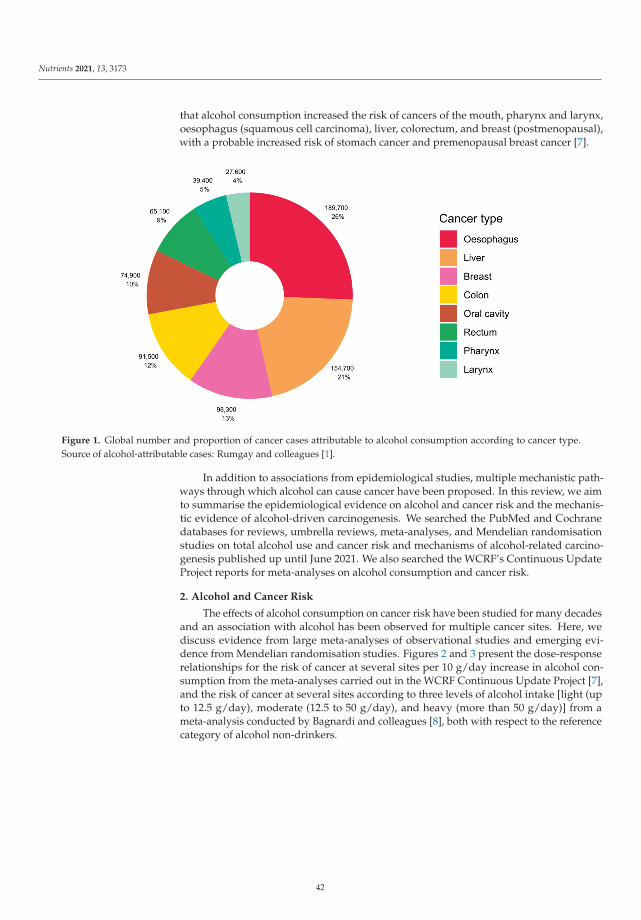
Nutrients 2021, 13, 3173
that alcohol consumption increased the risk of cancers of the mouth, pharynx and larynx,oesophagus (squamous cell carcinoma), liver, colorectum, and breast (postmenopausal),with a probable increased risk of stomach cancer and premenopausal breast cancer [7].
Figure 1. Global number and proportion of cancer cases attributable to alcohol consumption according to cancer type.Source of alcohol-attributable cases: Rumgay and colleagues [1].
In addition to associations from epidemiological studies, multiple mechanistic path-ways through which alcohol can cause cancer have been proposed. In this review, we aimto summarise the epidemiological evidence on alcohol and cancer risk and the mechanis-tic evidence of alcohol-driven carcinogenesis. We searched the PubMed and Cochranedatabases for reviews, umbrella reviews, meta-analyses, and Mendelian randomisationstudies on total alcohol use and cancer risk and mechanisms of alcohol-related carcino-genesis published up until June 2021. We also searched the WCRF’s Continuous UpdateProject reports for meta-analyses on alcohol consumption and cancer risk.
2. Alcohol and Cancer Risk
The effects of alcohol consumption on cancer risk have been studied for many decadesand an association with alcohol has been observed for multiple cancer sites. Here, wediscuss evidence from large meta-analyses of observational studies and emerging evi-dence from Mendelian randomisation studies. Figures 2 and 3 present the dose-responserelationships for the risk of cancer at several sites per 10 g/day increase in alcohol con-sumption from the meta-analyses carried out in the WCRF Continuous Update Project [7],and the risk of cancer at several sites according to three levels of alcohol intake [light (upto 12.5 g/day), moderate (12.5 to 50 g/day), and heavy (more than 50 g/day)] from ameta-analysis conducted by Bagnardi and colleagues [8], both with respect to the referencecategory of alcohol non-drinkers.
42
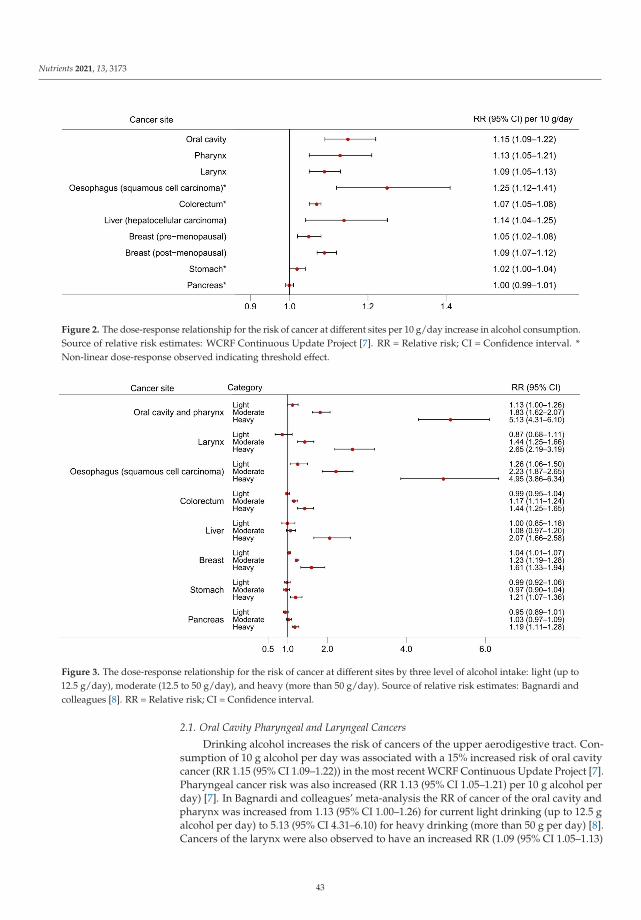
Nutrients 2021, 13, 3173
Figure 2. The dose-response relationship for the risk of cancer at different sites per 10 g/day increase in alcohol consumption.Source of relative risk estimates: WCRF Continuous Update Project [7]. RR = Relative risk; CI = Confidence interval. *Non-linear dose-response observed indicating threshold effect.
Figure 3. The dose-response relationship for the risk of cancer at different sites by three level of alcohol intake: light (up to12.5 g/day), moderate (12.5 to 50 g/day), and heavy (more than 50 g/day). Source of relative risk estimates: Bagnardi andcolleagues [8]. RR = Relative risk; CI = Confidence interval.
2.1. Oral Cavity Pharyngeal and Laryngeal Cancers
Drinking alcohol increases the risk of cancers of the upper aerodigestive tract. Con-sumption of 10 g alcohol per day was associated with a 15% increased risk of oral cavitycancer (RR 1.15 (95% CI 1.09–1.22)) in the most recent WCRF Continuous Update Project [7].Pharyngeal cancer risk was also increased (RR 1.13 (95% CI 1.05–1.21) per 10 g alcohol perday) [7]. In Bagnardi and colleagues’ meta-analysis the RR of cancer of the oral cavity andpharynx was increased from 1.13 (95% CI 1.00–1.26) for current light drinking (up to 12.5 galcohol per day) to 5.13 (95% CI 4.31–6.10) for heavy drinking (more than 50 g per day) [8].Cancers of the larynx were also observed to have an increased RR (1.09 (95% CI 1.05–1.13)
43
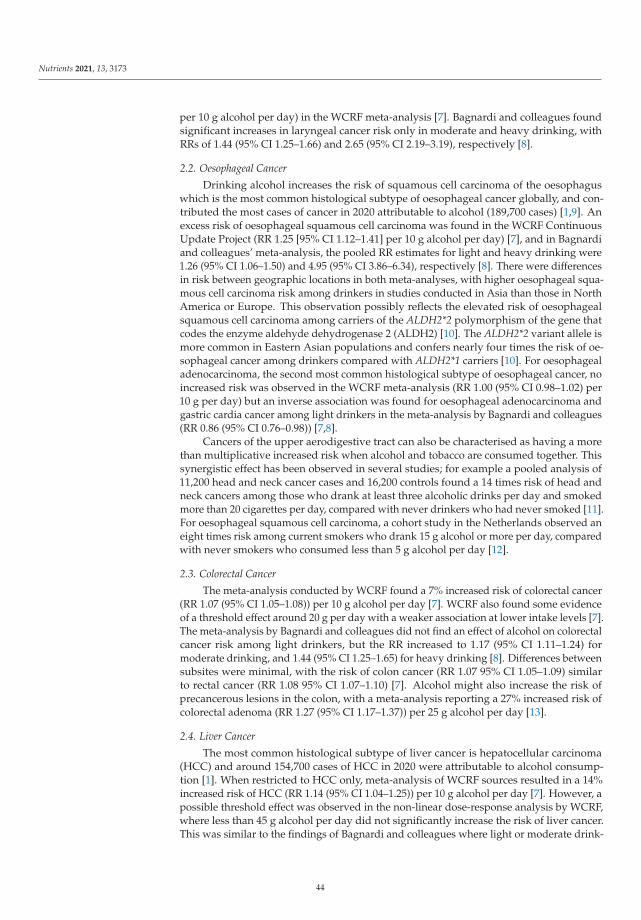
Nutrients 2021, 13, 3173
per 10 g alcohol per day) in the WCRF meta-analysis [7]. Bagnardi and colleagues foundsignificant increases in laryngeal cancer risk only in moderate and heavy drinking, withRRs of 1.44 (95% CI 1.25–1.66) and 2.65 (95% CI 2.19–3.19), respectively [8].
2.2. Oesophageal Cancer
Drinking alcohol increases the risk of squamous cell carcinoma of the oesophaguswhich is the most common histological subtype of oesophageal cancer globally, and con-tributed the most cases of cancer in 2020 attributable to alcohol (189,700 cases) [1,9]. Anexcess risk of oesophageal squamous cell carcinoma was found in the WCRF ContinuousUpdate Project (RR 1.25 [95% CI 1.12–1.41] per 10 g alcohol per day) [7], and in Bagnardiand colleagues’ meta-analysis, the pooled RR estimates for light and heavy drinking were1.26 (95% CI 1.06–1.50) and 4.95 (95% CI 3.86–6.34), respectively [8]. There were differencesin risk between geographic locations in both meta-analyses, with higher oesophageal squa-mous cell carcinoma risk among drinkers in studies conducted in Asia than those in NorthAmerica or Europe. This observation possibly reflects the elevated risk of oesophagealsquamous cell carcinoma among carriers of the ALDH2*2 polymorphism of the gene thatcodes the enzyme aldehyde dehydrogenase 2 (ALDH2) [10]. The ALDH2*2 variant allele ismore common in Eastern Asian populations and confers nearly four times the risk of oe-sophageal cancer among drinkers compared with ALDH2*1 carriers [10]. For oesophagealadenocarcinoma, the second most common histological subtype of oesophageal cancer, noincreased risk was observed in the WCRF meta-analysis (RR 1.00 (95% CI 0.98–1.02) per10 g per day) but an inverse association was found for oesophageal adenocarcinoma andgastric cardia cancer among light drinkers in the meta-analysis by Bagnardi and colleagues(RR 0.86 (95% CI 0.76–0.98)) [7,8].
Cancers of the upper aerodigestive tract can also be characterised as having a morethan multiplicative increased risk when alcohol and tobacco are consumed together. Thissynergistic effect has been observed in several studies; for example a pooled analysis of11,200 head and neck cancer cases and 16,200 controls found a 14 times risk of head andneck cancers among those who drank at least three alcoholic drinks per day and smokedmore than 20 cigarettes per day, compared with never drinkers who had never smoked [11].For oesophageal squamous cell carcinoma, a cohort study in the Netherlands observed aneight times risk among current smokers who drank 15 g alcohol or more per day, comparedwith never smokers who consumed less than 5 g alcohol per day [12].
2.3. Colorectal Cancer
The meta-analysis conducted by WCRF found a 7% increased risk of colorectal cancer(RR 1.07 (95% CI 1.05–1.08)) per 10 g alcohol per day [7]. WCRF also found some evidenceof a threshold effect around 20 g per day with a weaker association at lower intake levels [7].The meta-analysis by Bagnardi and colleagues did not find an effect of alcohol on colorectalcancer risk among light drinkers, but the RR increased to 1.17 (95% CI 1.11–1.24) formoderate drinking, and 1.44 (95% CI 1.25–1.65) for heavy drinking [8]. Differences betweensubsites were minimal, with the risk of colon cancer (RR 1.07 95% CI 1.05–1.09) similarto rectal cancer (RR 1.08 95% CI 1.07–1.10) [7]. Alcohol might also increase the risk ofprecancerous lesions in the colon, with a meta-analysis reporting a 27% increased risk ofcolorectal adenoma (RR 1.27 (95% CI 1.17–1.37)) per 25 g alcohol per day [13].
2.4. Liver Cancer
The most common histological subtype of liver cancer is hepatocellular carcinoma(HCC) and around 154,700 cases of HCC in 2020 were attributable to alcohol consump-tion [1]. When restricted to HCC only, meta-analysis of WCRF sources resulted in a 14%increased risk of HCC (RR 1.14 (95% CI 1.04–1.25)) per 10 g alcohol per day [7]. However, apossible threshold effect was observed in the non-linear dose-response analysis by WCRF,where less than 45 g alcohol per day did not significantly increase the risk of liver cancer.This was similar to the findings of Bagnardi and colleagues where light or moderate drink-
44
Nutrients 2021, 13, 3173
ing did not significantly increase liver cancer risk but risk among heavy drinkers doubled(RR 2.07 (95% CI 1.66–2.58)) [8].
2.5. Breast Cancer
Female breast cancer is the most commonly diagnosed cancer globally and contributedthe third largest number of alcohol-attributable cases in 2020 (98,300 cases) [1,14]. TheWCRF found a 7% increased risk of breast cancer per 10 g alcohol per day (95% CI 1.05–1.09) [7]. Whether there is a difference in breast cancer risk by menopausal status is unclear,as risk of postmenopausal breast cancer overlapped with that of premenopausal breastcancer in the WCRF meta-analysis (RR 1.09 (95% CI 1.07–1.12) versus RR 1.05 (95% CI 1.02–1.08), respectively, per 10 g alcohol per day). It does, however, seem that risk of breast canceramong drinkers might be specific to hormone receptor status; the WCRF meta-analysisof postmenopausal women observed an excess risk of oestrogen-receptor-positive andprogesterone receptor-positive (ER+PR+) tumours (RR 1.06 (95% CI 1.03–1.09)) and ER+PR–
tumours (RR 1.12 (95% CI 1.01–1.24)) per 10 g alcohol per day, and no significant associationwas observed for ER–PR– tumours (RR 1.02 95% CI 0.98–1.06) [7]. In a meta-analysis bySun and colleagues, current drinkers had an increased risk of all hormone receptor statusbreast tumours compared with never drinkers, but RRs were higher for ER+PR+ tumours(RR 1.40 95% CI 1.30–1.51) and ER+PR– tumours (RR 1.39 95% CI 1.12–1.71) than ER–PR–
tumours (RR 1.21 95% CI 1.02–1.43) [15].
2.6. Stomach Cancer
Alcohol consumption might increase the risk of stomach cancer. The linear dose-response meta-analysis by WCRF resulted in a non-significant RR of 1.02 (95% CI 1.00–1.04)per 10 g alcohol per day, but the non-linear dose-response analysis found an increasein stomach cancer risk for intakes over 45 g alcohol per day [7]. The meta-analysis byBagnardi and colleagues observed a 21% increased risk in heavy drinking (RR 1.21 95% CI1.07–1.36), and no significant increase in light or moderate drinking categories [8].
2.7. Pancreatic Cancer
The meta-analysis by WCRF did not find an increased risk of pancreatic cancer per10 g alcohol per day (RR 1.00 (95% CI 0.99–1.01)) but there was a possible threshold effectof increased risk for intakes of around 60 g per day (RR 1.17 (95% CI 1.05–1.29)) [7]. Thiswas a similar finding to the meta-analysis by Bagnardi and colleagues which found noincreased risk at light or moderate drinking but a significant RR of 1.19 (95% 1.11–1.28) forheavy drinking [8].
2.8. Other Cancer Types
The association between alcohol drinking and risk of other cancer types has been stud-ied but without sufficient evidence to be classified in the IARC monographs or WCRF Con-tinuous Update Project. Positive associations have been reported in some meta-analyses;for example, a 3% increase in lung cancer risk was observed per 10 g alcohol per day inthe WCRF meta-analysis based on 28 studies (RR 1.03 (95% CI 1.01–1.04)) after excludingstudies which did not control for smoking [7]. A positive association with lung cancerwas only found for heavy drinkers in Bagnardi and colleagues’ meta-analysis, but thiswas probably due to residual confounding from smoking because alcohol use did notincrease the risk of lung cancer among non-smokers [8]. Little evidence of an associationbetween alcohol consumption and gallbladder cancer was found in the WCRF ContinuousUpdate Project, but Bagnardi and colleagues found an excess risk of gallbladder canceramong heavy drinkers (RR 2.64 (95% CI 1.62–4.30)). WCRF found an elevated risk ofmalignant melanoma per 10 g alcohol per day (RR 1.08 (95% CI 1.03–1.13)), but no effecton basal cell carcinoma (RR 1.04 (95% CI 0.99–1.10)) or squamous cell carcinoma (RR 1.03(95% CI 0.97–1.09)) risk [7]. An increased risk of prostate cancer was observed for light and
45
Nutrients 2021, 13, 3173
moderate drinking in Bagnardi and colleagues’ meta-analysis but not in the dose-responseanalysis of one drink per day by WCRF [7,8].
WCRF found an inverse association between alcohol consumption and kidney cancerrisk (RR 0.92 (95% CI 0.86–0.97) per 10 g per day) [7]. However, this association wasrestricted to light and moderate drinking in Bagnardi and colleagues’ meta-analysis (RR0.92 (95% CI 0.86–0.99) and 0.79 (95% CI 0.72–0.86), respectively) [8]. The same meta-analysis also found significant inverse associations for the risk of thyroid cancer, Hodgkinlymphoma and non-Hodgkin lymphoma [8].
2.9. Confirming the Causal Relation Reported in Observational Studies
Many observational studies have been conducted to identify and define the risks fromdrinking alcohol and cancer development. Some limitations in these studies have beenidentified, such as lack of sufficient adjustment of confounding factors, for example tobaccosmoking and alcohol consumption are both common risk factors for oral cavity cancer.There are also concerns around reverse causality, with the reference categories of alcoholnon-drinkers possibly including former drinkers who still have an elevated risk of cancer.There are other concerns over the accuracy of recording of alcohol exposure data wherebias may be incorporated through non-participation of heavy drinkers in health studies,and under-reporting of alcohol consumption by the study subjects.
One method which might overcome some of the limitations in observational studiesis Mendelian randomisation (MR), which uses genetic variants to explore the causal rela-tionship between exposure and disease outcome. Assuming that analyses are conductedappropriately, due to the random distribution of these genetic variants at birth, MR studiesshould be less prone to conventional confounding and reverse causality.
For oral and oropharyngeal cancer, an MR study using genetic data on 6000 oral ororopharyngeal cancer cases and 6600 controls found a positive causal effect of alcoholconsumption independent of smoking [16]. The authors concluded that previous estimatesof the association between alcohol and oral and oropharyngeal cancer from observationalstudies may have been underestimated [16]. Another MR study on UK Biobank data foundthat drinking alcohol, especially above the UK’s low-risk guideline of up to 14 units perweek, was causally related with head and neck cancers, but not breast cancer [17]. A furtherupdated MR study using UK Biobank data did not find an association between alcoholexposure and cancer of any site, though they noted limitations of a lack of precision in theiranalyses due to low variance explained by the single nucleotide polymorphisms [18]. AnMR analysis by Ong and colleagues found no significant increase in breast cancer risk pergenetically predicted drink per day (odds ratio 1.00 (95% CI 0.93–1.08)) [19].
The future potential of MR studies is yet to be discovered but disclosing potentialsources of biases and confounding in observational studies is necessary to obtain robustestimates of the causal relationship between alcohol consumption and cancer risk.
3. Mechanisms of Alcohol-Driven Carcinogenesis
Following epidemiological evidence of the link between alcohol use and risk of cancerat multiple sites, several pathways have been investigated to explain the carcinogeniceffects of alcohol. Here, we discuss the key mechanisms linking alcohol consumption tocarcinogenesis, which are depicted in Figure 4.
3.1. Production of Acetaldehyde
Once consumed, alcohol is metabolised by enzymes including alcohol dehydroge-nase (ADH), cytochrome P-450 2E1 (CYP2E1) and bacterial catalase, producing acetalde-hyde [20]. Acetaldehyde is highly reactive towards DNA and has several carcinogenic andgenotoxic properties.
As it is highly reactive towards DNA, acetaldehyde may bind to DNA to form DNAadducts which alter its physical shape and potentially block DNA synthesis and repair [21].These DNA adducts are particularly genotoxic as they can induce DNA point mutations,
46
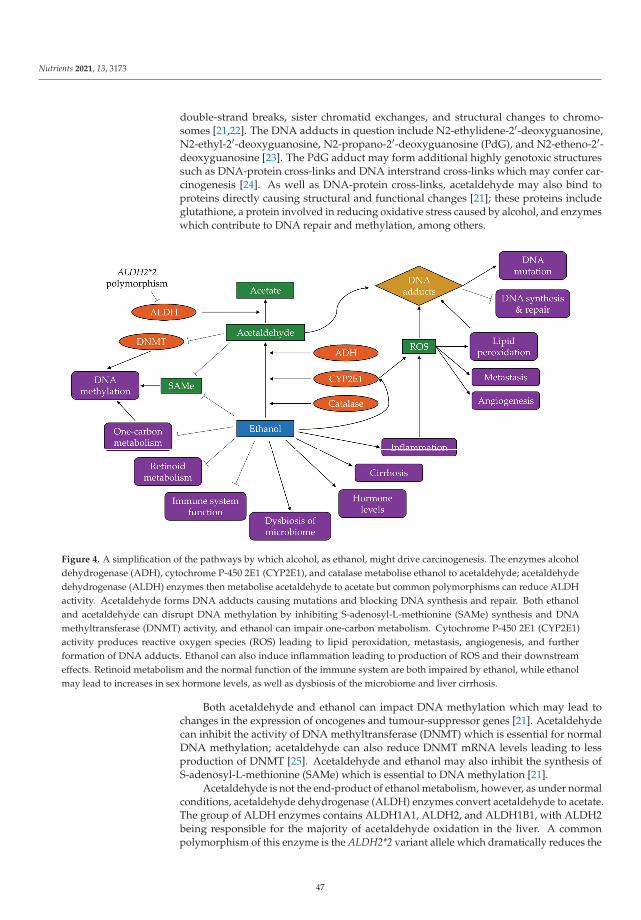
Nutrients 2021, 13, 3173
double-strand breaks, sister chromatid exchanges, and structural changes to chromo-somes [21,22]. The DNA adducts in question include N2-ethylidene-2′-deoxyguanosine,N2-ethyl-2′-deoxyguanosine, N2-propano-2′-deoxyguanosine (PdG), and N2-etheno-2′-deoxyguanosine [23]. The PdG adduct may form additional highly genotoxic structuressuch as DNA-protein cross-links and DNA interstrand cross-links which may confer car-cinogenesis [24]. As well as DNA-protein cross-links, acetaldehyde may also bind toproteins directly causing structural and functional changes [21]; these proteins includeglutathione, a protein involved in reducing oxidative stress caused by alcohol, and enzymeswhich contribute to DNA repair and methylation, among others.
Figure 4. A simplification of the pathways by which alcohol, as ethanol, might drive carcinogenesis. The enzymes alcoholdehydrogenase (ADH), cytochrome P-450 2E1 (CYP2E1), and catalase metabolise ethanol to acetaldehyde; acetaldehydedehydrogenase (ALDH) enzymes then metabolise acetaldehyde to acetate but common polymorphisms can reduce ALDHactivity. Acetaldehyde forms DNA adducts causing mutations and blocking DNA synthesis and repair. Both ethanoland acetaldehyde can disrupt DNA methylation by inhibiting S-adenosyl-L-methionine (SAMe) synthesis and DNAmethyltransferase (DNMT) activity, and ethanol can impair one-carbon metabolism. Cytochrome P-450 2E1 (CYP2E1)activity produces reactive oxygen species (ROS) leading to lipid peroxidation, metastasis, angiogenesis, and furtherformation of DNA adducts. Ethanol can also induce inflammation leading to production of ROS and their downstreameffects. Retinoid metabolism and the normal function of the immune system are both impaired by ethanol, while ethanolmay lead to increases in sex hormone levels, as well as dysbiosis of the microbiome and liver cirrhosis.
Both acetaldehyde and ethanol can impact DNA methylation which may lead tochanges in the expression of oncogenes and tumour-suppressor genes [21]. Acetaldehydecan inhibit the activity of DNA methyltransferase (DNMT) which is essential for normalDNA methylation; acetaldehyde can also reduce DNMT mRNA levels leading to lessproduction of DNMT [25]. Acetaldehyde and ethanol may also inhibit the synthesis ofS-adenosyl-L-methionine (SAMe) which is essential to DNA methylation [21].
Acetaldehyde is not the end-product of ethanol metabolism, however, as under normalconditions, acetaldehyde dehydrogenase (ALDH) enzymes convert acetaldehyde to acetate.The group of ALDH enzymes contains ALDH1A1, ALDH2, and ALDH1B1, with ALDH2being responsible for the majority of acetaldehyde oxidation in the liver. A commonpolymorphism of this enzyme is the ALDH2*2 variant allele which dramatically reduces the
47
Nutrients 2021, 13, 3173
activity of ALDH2 [10]. It is estimated that between 28% and 45% of East-Asian populationsare carriers of the ALDH2*2 allele [10], while the proportion is considerably lower amongCaucasians. In carriers of this polymorphism, acetaldehyde is not metabolised quicklyenough, leading to an accumulation of acetaldehyde and thus the prolonged possibility toexert its described genotoxic effects. Evidence shows that alcohol drinkers who carry theALDH2*2 variant allele have a substantially increased risk of cancers of the oesophagusand the upper aerodigestive tract [10], thus implicating the effects of acetaldehyde not onlyin the liver.
3.2. Induction of Oxidative Stress
Ethanol can also contribute to carcinogenesis through the induction of oxidative stresswhich is recognised as a key determinant of disease initiation [26]. Oxidative stress canbe induced by activation of certain pathways which produce reactive oxygen species(ROS) such as superoxide anion and hydrogen peroxide. One pathway by which ethanolachieves this is through increased CYP2E1 activity which produces high quantities ofROS whilst oxidising ethanol to acetaldehyde [27]. Heavy alcohol use has been shown toincrease CYP2E1 expression in the oesophagus [27]. Other sources of ROS during ethanolmetabolism include the mitochondrial respiratory chain and some cytosolic enzymes [28].
As ROS are highly reactive, their presence can lead to lipid peroxidation producingaldehydes which can bind to DNA forming etheno-DNA adducts [29,30]. These ethe-DNAadducts, namely 1,N6-ethenodeoxyadenosine and 3,N4-ethenodeoxycytidine, are highlymutagenic as they lead to mutations in several genes involved in key cell cycle regulationand tumour suppression [21]. Linhart and colleagues were able to demonstrate correlationbetween the amount of CYP2E1 and etheno-DNA adducts in cell, animal, and humantissue models, and highlighted their major importance in ethanol-mediated carcinogenesisin the liver, colorectum, and oesophagus, as well as other tissues [30].
Presence of ROS can also lead to changes in cell cycle behaviour. ROS can act asmessengers in intracellular signalling pathways to activate the transcription factor nuclearfactor κB (NF-κB). ROS can further promote cell proliferation and metastasis by interferingwith mitogen-activated protein kinase signalling pathways and upregulating vascularendothelial growth factor (VEGF) and monocyte chemotactic protein-1 (MCP-1) whichcan stimulate angiogenesis [31]. In HCC tissue samples from alcohol drinkers, ROS accu-mulation and increased synthesis of VEGF, MCP-1 and NF-κB were observed, indicatingalcohol-driven promotion and progression of HCC [32].
3.3. Increased Inflammation
Inflammation is a key pathway to cancer progression at several sites and is enhancedby alcohol use. Chronic alcohol consumption can recruit specific white blood cells (mono-cytes and macrophages) to the tumour microenvironment. These white blood cells producepro-inflammatory cytokines, such as tumour necrosis factor α (TNF-α) and the interleukinsIL-1, IL-6, and IL-8 [31,33], which activate oxidant-generating enzymes leading to down-stream formation of ROS [30]. NF-κB is also activated by these cytokines, stimulatingfurther ROS-producing enzymes.
In addition to its involvement in downstream ROS-producing pathways, it is hy-pothesised that IL-8 contributes to further accumulation of white blood cells (neutrophils,specifically) in the liver leading to acute inflammation. Elevated IL-8 levels have beenfound in patients with acute liver injury such as alcoholic hepatitis [34]. Additionally, thecytokine IL-6 stimulates production of the anti-apoptotic protein Mcl-1, thus avoiding celldeath and exposing the cell to further DNA damage [35].
3.4. Disruption to One-Carbon Metabolism and Folate Absorption
There is mounting evidence that alcohol can negatively affect one-carbon metabolismwhich is essential for DNA methylation and DNA synthesis [25]. Ethanol and acetaldehydecan reduce the activity of enzymes involved in one-carbon metabolism that regulate DNA
48
Nutrients 2021, 13, 3173
methylation, namely methionine synthase, methionine adenosyl transferase and DNMT,thus dysregulating epigenetic patterns and resulting in DNA hypomethylation [20].
Lipotropic nutrients such as folate are key sources of the methyl groups necessary forDNA methylation and influence the availability of SAMe, which is also essential to DNAmethylation [25]. Alcohol intake may deplete folate levels, or indeed be a cause of folate andB vitamin deficiency if alcohol constitutes the majority of calories consumed, as observedin malnourished alcoholics [21,26]. Folate deficiency affects the availability of nucleotidesneeded for DNA synthesis leading to accumulation of deoxyuridine monophosphate whichis incorporated into new DNA molecules causing double-strand breaks and chromosomaldamage [25]. Interestingly, there is evidence that higher folate intake among alcoholdrinkers may attenuate the increased risk of liver cancer mortality compared with thosewith low folate intake [36]. This attenuation was also observed for risk of postmenopausalbreast cancer among women who drink alcohol and have higher folate levels [37]. Theeffect of alcohol on one-carbon metabolism and folate might also be important in colorectalcancer development [20].
3.5. Altered Retinoid Metabolism
Retinoids are important regulators against carcinogenesis as they can induce cellgrowth, cell differentiation, and apoptosis [31]. Alcohol can alter retinoid metabolism byinhibiting the oxidation of vitamin A to retinoic acid [21]. Alcohol increases CYP2E1 activity(Section 3.2) which also functions to metabolise retinoic acid resulting in the production oftoxic metabolites [21]. This increased toxicity of retinoids may explain the observation ofexcess lung cancer risk in smokers who took β-carotene supplements and consumed 11 gor more of ethanol per day in the α-tocopherol, β-carotene cancer prevention study (ATBCtrial) study [21].
Chronic alcohol consumption has been linked with decreased levels of retinoids inthe liver [21], and low levels of retinol in the blood have been linked with higher risk ofhead and neck cancers [31]. Retinoids may also play a role in other signalling pathwaysimplicated in cancer development, such as oestrogen and breast cancer [31].
3.6. Changes to Oestrogen Regulation
Alcohol might interfere with oestrogen pathways by increasing hormone levels andenhancing the activity of ERs, important in breast carcinogenesis [38]. Sex hormone levelsmay be increased by alcohol through oxidative stress and through inhibition of the steroiddegradation enzymes sulfotransferase and 2-hydroxylase [39]. Heavy use of alcohol hasalso been linked with increased circulating levels of oestrone and oestradiol as well asdehydroepiandrosterone sulphate (DHEAS) [39]. DHEAS is metabolised to oestrogen byaromatase, the activity of which is also increased in chronic alcohol consumers [40]. Alarge cohort study found DHEAS levels 25% higher among women consuming at least20 g alcohol per day compared with non-drinkers [41]. However, some of the associationsamong alcohol drinking premenopausal women were limited to those taking oral contra-ceptives [40]. Despite limited evidence of mediation of the association between alcoholand breast cancer by individual sex hormones, a case-control study nested within EPICfound that a hormonal signature reflecting lower levels of sex-hormone binding globulinand higher levels of sex hormones mediated 24% of the association, suggesting that aninterplay of hormones may contribute to alcohol-mediated breast cancer development [42].
ERs are important transcription factors within cells and may provide the main path-way by which alcohol promotes breast tumour growth [40]. Elevated concentrations ofoestrogen due to alcohol use may lead to increased transcriptional activity of ER (up to15 times higher than normal activity), resulting in proliferation of ER+ cells [39].
3.7. Reduced Function of the Immune System
Alcohol has multiple negative effects on the host immune system. Firstly, alcohol candisrupt the production of proteins such as perforin and granzymes A and B, which are
49
Nutrients 2021, 13, 3173
necessary for natural killer (NK) cells to function in targeting and destroying potentiallycancerous cells [33]. Alcohol can block NK cells from being released from the bone mar-row [31]. Alcohol can also activate NKT cells which are associated with liver injury andhepatocyte apoptosis [33]. Additionally, alcohol may suppress T cell immune responsestherefore decreasing the anti-tumour regulation of the immune system.
With the immune system being compromised, alcohol consumption can exacerbatedamage from viral infections such as hepatitis C virus, which is common among chronicalcoholic liver disease patients [43]. In addition, heavy episodic alcohol use might re-duce the immune system’s defence against infection by disrupting the production of pro-inflammatory cytokines and increasing the expression of anti-inflammatory cytokines [33].This is contrary to the increased expression of pro-inflammatory cytokines due to chronicalcohol exposure as discussed with other evidence on alcohol-induced inflammation(Section 3.3).
3.8. Dysbiosis of the Microbiome
Microbiota in the oral cavity metabolise ethanol to acetaldehyde by the enzymecatalase. However, these bacteria have limited capacity to break acetaldehyde downfurther into its non-harmful compound acetate, thus the oral epithelia are further exposedto acetaldehyde [21,44]. Acetaldehyde concentrations in the saliva of drinkers are between10 and 100 times higher than in the blood; this is further doubled in smokers who drinkalcohol as tobacco smoke contains high levels of acetaldehyde [21].
Increased ethanol consumption can induce microbial dysbiosis and bacterial over-growth in the intestine [20]. This heightened bacterial presence may compromise theintestinal barrier resulting in ”gut leakiness” where the permeability of the intestinallumen is high enough such that bacterial products including lipopolysaccharides andpeptidoglycan move from the intestine into the blood [20,45]. Once in the blood thesebacterial products easily reach the liver where a variety of cells are activated (endothelialcells, liver macrophages, stellate cells and hepatocytes) producing a chronic inflammatoryenvironment [33], which may confer an increased risk of liver cancer [46].
3.9. Liver Cirrhosis
Liver cirrhosis is a well-recognised pathway to hepatocellular carcinoma developmentin heavy alcohol users and manifests as pre-neoplastic lesions in the liver [47]. Chronicalcohol exposure is associated with reduced expression of the cytokine interferon-γ which isan inhibitor of liver fibrosis [33]. Furthermore, ROS (Section 3.2) may trigger the productionof pro-fibrotic cytokines and collagen in liver cells [28].
3.10. Activation of Other Carcinogens
There is further hypothesis that alcohol consumption might activate the pathways ofother carcinogenic agents; this could occur through the alcohol-induced activity of CYP2E1which may metabolise pro-carcinogens in tobacco smoke and industrial chemicals [21]. Itis also possible that ethanol might aid these carcinogens to penetrate cells, especially thoseof the mucosa of the upper aerodigestive tract [21,48], where tobacco and alcohol have asynergistic effect on the risk of cancer [11,12].
4. Conclusions
Alcohol and its metabolite acetaldehyde can drive cancer development through severalpathways. Many of these pathways are interlinked and show the complexity and breadthof alcohol’s harmful potential. For example, inflammation can result in oxidative stress, butinflammation is a reaction by the immune system which is itself compromised by alcoholuse. Furthermore, DNA damage can occur through exposure to acetaldehyde and ROSwhich are both produced through CYP2E1 activity, with acetaldehyde also a product ofADH activity. Other potential pathways have been proposed including the dysregulationof carnitine metabolism [49]. We have only covered carcinogenesis in this review, but
50
Nutrients 2021, 13, 3173
alcohol likely alters, through these pathways and others, other functions in the body whichrender it more susceptible to other diseases and injuries, as discussed in other articles inthis Special Issue.
Alcohol consumption is a well-established risk factor for cancer and has been linkedto cancers of the oral cavity and pharynx, oesophagus, liver, colorectum and breast. Whilestudies have provided evidence on alcohol’s carcinogenic potential, further understandingof alcohol’s pathways to cancer development will inform the direction of future research.This information is useful to corroborate existing evidence, develop chemopreventionstrategies, and could improve cancer therapy, but there is already a wealth of evidenceto support the need for further alcohol control and cancer prevention efforts. We havediscussed evidence on mechanistic and epidemiological research in the field, and thisinformation must be used to decrease the burden of cancers, as well as other diseases andinjuries, attributable to alcohol.
Author Contributions: Conceptualization, H.R. and I.S.; writing—original draft preparation, H.R.;review and editing, H.R., I.S., N.M. and P.F. All authors have read and agreed to the publishedversion of the manuscript. Where authors are identified as personnel of the International Agencyfor Research on Cancer/World Health Organization, the authors alone are responsible for the viewsexpressed in this article and they do not necessarily represent the decisions, policy, or views of theInternational Agency for Research on Cancer/World Health Organization.
Funding: The work by H.R. reported in this paper was undertaken during a PhD studentship at theInternational Agency for Research on Cancer.
Institutional Review Board Statement: Not applicable.
Informed Consent Statement: Not applicable.
Conflicts of Interest: The authors declare no conflict of interest.
References
1. Rumgay, H.; Shield, K.; Charvat, H.; Ferrari, P.; Sornpaisarn, B.; Obot, I.; Islami, F.; Lemmens, V.E.P.P.; Rehm, J.; Soerjomataram, I.Global burden of cancer in 2020 attributable to alcohol consumption: A population-based study. Lancet Oncol. 2021, 22, 1071–1080.[CrossRef]
2. Buykx, P.; Li, J.; Gavens, L.; Hooper, L.; Lovatt, M.; Gomes de Matos, E.; Meier, P.; Holmes, J. Public awareness of the link betweenalcohol and cancer in England in 2015: A population-based survey. BMC Public Health 2016, 16, 1194. [CrossRef]
3. Manthey, J.; Shield, K.D.; Rylett, M.; Hasan, O.S.M.; Probst, C.; Rehm, J. Global alcohol exposure between 1990 and 2017 andforecasts until 2030: A modelling study. Lancet 2019, 393, 2493–2502. [CrossRef]
4. International Agency for Research on Cancer. IARC Monographs on the Evaluation of Carcinogenic Risks to Humans. Volume 44.Alcohol Drinking; 1988; Volume 44. Available online: https://publications.iarc.fr/Book-And-Report-Series/Iarc-Monographs-On-The-Identification-Of-Carcinogenic-Hazards-To-Humans/Alcohol-Drinking-1988 (accessed on 20 June 2021).
5. International Agency for Research on Cancer. IARC Monographs on the Evaluation of Carcinogenic Risks to Humans. Volume 96.Alcohol Consumption and Ethyl Carbamate; 2010; Volume 96. Available online: https://publications.iarc.fr/Book-And-Report-Series/Iarc-Monographs-On-The-Identification-Of-Carcinogenic-Hazards-To-Humans/Alcohol-Consumption-And-Ethyl-Carbamate-2010 (accessed on 20 June 2021).
6. International Agency for Research on Cancer. IARC Monographs on the Evaluation of Carcinogenic Risks to Humans. Volume 100E.Personal Habits and Indoor Combustions; 2012. Available online: https://publications.iarc.fr/Book-And-Report-Series/Iarc-Monographs-On-The-Identification-Of-Carcinogenic-Hazards-To-Humans/Personal-Habits-And-Indoor-Combustions-2012(accessed on 20 June 2021).
7. World Cancer Research Fund/American Institute for Cancer Research. Diet, Nutrition, Physical Activity and Cancer: A GlobalPerspective; Continuous Update Project Expert Report; 2018. Available online: https://www.wcrf.org/wp-content/uploads/2021/02/Summary-of-Third-Expert-Report-2018.pdf (accessed on 20 June 2021).
8. Bagnardi, V.; Rota, M.; Botteri, E.; Tramacere, I.; Islami, F.; Fedirko, V.; Scotti, L.; Jenab, M.; Turati, F.; Pasquali, E.; et al. Alcoholconsumption and site-specific cancer risk: A comprehensive dose–response meta-analysis. Br. J. Cancer 2014, 112, 580. [CrossRef]
9. Arnold, M.; Ferlay, J.; van Berge Henegouwen, M.I.; Soerjomataram, I. Global burden of oesophageal and gastric cancer byhistology and subsite in 2018. Gut 2020, 69, 1564–1571. [CrossRef] [PubMed]
10. Chang, J.S.; Hsiao, J.-R.; Chen, C.-H. ALDH2 polymorphism and alcohol-related cancers in Asians: A public health perspective. J.Biomed. Sci. 2017, 24, 19. [CrossRef] [PubMed]
51
Nutrients 2021, 13, 3173
11. Hashibe, M.; Brennan, P.; Chuang, S.-C.; Boccia, S.; Castellsague, X.; Chen, C.; Curado, M.P.; Dal Maso, L.; Daudt, A.W.; Fabianova,E.; et al. Interaction between tobacco and alcohol use and the risk of head and neck cancer: Pooled analysis in the InternationalHead and Neck Cancer Epidemiology Consortium. Cancer Epidemiol. Biomark. Prev. 2009, 18, 541–550. [CrossRef]
12. Steevens, J.; Schouten, L.J.; Goldbohm, R.A.; van den Brandt, P.A. Alcohol consumption, cigarette smoking and risk of subtypesof oesophageal and gastric cancer: A prospective cohort study. Gut 2010, 59, 39–48. [CrossRef] [PubMed]
13. Ben, Q.; Wang, L.; Liu, J.; Qian, A.; Wang, Q.; Yuan, Y. Alcohol drinking and the risk of colorectal adenoma: A dose–responsemeta-analysis. Eur. J. Cancer Prev. 2015, 24, 286–295. [CrossRef]
14. Ferlay, J.; Ervik, M.; Lam, F.; Colombet, M.; Mery, L.; Piñeros, M.; Znaor, A.; Soerjomataram, I. Global Cancer Observatory: CancerToday. Available online: https://gco.iarc.fr/today (accessed on 15 December 2020).
15. Sun, Q.; Xie, W.; Wang, Y.; Chong, F.; Song, M.; Li, T.; Xu, L.; Song, C. Alcohol Consumption by Beverage Type and Risk of BreastCancer: A Dose-Response Meta-Analysis of Prospective Cohort Studies. Alcohol Alcohol. 2020, 55, 246–253. [CrossRef] [PubMed]
16. Gormley, M.; Dudding, T.; Sanderson, E.; Martin, R.M.; Thomas, S.; Tyrrell, J.; Ness, A.R.; Brennan, P.; Munafò, M.; Pring, M.; et al.A multivariable Mendelian randomization analysis investigating smoking and alcohol consumption in oral and oropharyngealcancer. Nat. Commun. 2020, 11, 6071. [CrossRef]
17. Ingold, N.; Amin, H.A.; Drenos, F. Alcohol causes an increased risk of head and neck but not breast cancer in individuals fromthe UK Biobank study: A Mendelian randomisation analysis. medRxiv 2019, 19002832. [CrossRef]
18. Larsson, S.C.; Carter, P.; Kar, S.; Vithayathil, M.; Mason, A.M.; Michaëlsson, K.; Burgess, S. Smoking, alcohol consumption, andcancer: A mendelian randomisation study in UK Biobank and international genetic consortia participants. PLoS Med. 2020, 17,e1003178. [CrossRef] [PubMed]
19. Ong, J.-S.; Derks, E.M.; Eriksson, M.; An, J.; Hwang, L.-D.; Easton, D.F.; Pharoah, P.P.; Berchuck, A.; Kelemen, L.E.; Matsuo,K.; et al. Evaluating the role of alcohol consumption in breast and ovarian cancer susceptibility using population-based cohortstudies and two-sample Mendelian randomization analyses. Int. J. Cancer 2021, 148, 1338–1350. [CrossRef] [PubMed]
20. Rossi, M.; Jahanzaib Anwar, M.; Usman, A.; Keshavarzian, A.; Bishehsari, F. Colorectal Cancer and Alcohol Consumption-Populations to Molecules. Cancers 2018, 10, 38. [CrossRef] [PubMed]
21. Seitz, H.K.; Stickel, F. Molecular mechanisms of alcohol-mediated carcinogenesis. Nat. Rev. Cancer 2007, 7, 599–612. [CrossRef]22. Garaycoechea, J.I.; Crossan, G.P.; Langevin, F.; Mulderrig, L.; Louzada, S.; Yang, F.; Guilbaud, G.; Park, N.; Roerink, S.; Nik-Zainal,
S.; et al. Alcohol and endogenous aldehydes damage chromosomes and mutate stem cells. Nature 2018, 553, 171–177. [CrossRef][PubMed]
23. Wang, M.; McIntee, E.J.; Cheng, G.; Shi, Y.; Villalta, P.W.; Hecht, S.S. Identification of DNA Adducts of Acetaldehyde. Chem. Res.Toxicol. 2000, 13, 1149–1157. [CrossRef]
24. Brooks, P.J.; Theruvathu, J.A. DNA adducts from acetaldehyde: Implications for alcohol-related carcinogenesis. Alcohol 2005, 35,187–193. [CrossRef]
25. Varela-Rey, M.; Woodhoo, A.; Martinez-Chantar, M.-L.; Mato, J.M.; Lu, S.C. Alcohol, DNA methylation, and cancer. Alcohol Res.2013, 35, 25–35.
26. Barve, S.; Chen, S.-Y.; Kirpich, I.; Watson, W.H.; McClain, C. Development, Prevention, and Treatment of Alcohol-Induced OrganInjury: The Role of Nutrition. Alcohol Res. 2017, 38, 289–302.
27. Millonig, G.; Wang, Y.; Homann, N.; Bernhardt, F.; Qin, H.; Mueller, S.; Bartsch, H.; Seitz, H.K. Ethanol-mediated carcinogenesisin the human esophagus implicates CYP2E1 induction and the generation of carcinogenic DNA-lesions. Int. J. Cancer 2011, 128,533–540. [CrossRef]
28. Albano, E. Alcohol, oxidative stress and free radical damage. Proc. Nutr. Soc. 2006, 65, 278–290. [CrossRef]29. Haorah, J.; Ramirez, S.H.; Floreani, N.; Gorantla, S.; Morsey, B.; Persidsky, Y. Mechanism of alcohol-induced oxidative stress and
neuronal injury. Free. Radic. Biol. Med. 2008, 45, 1542–1550. [CrossRef] [PubMed]30. Linhart, K.; Bartsch, H.; Seitz, H.K. The role of reactive oxygen species (ROS) and cytochrome P-450 2E1 in the generation of
carcinogenic etheno-DNA adducts. Redox Biol. 2014, 3, 56–62. [CrossRef] [PubMed]31. Ratna, A.; Mandrekar, P. Alcohol and Cancer: Mechanisms and Therapies. Biomolecules 2017, 7, 61. [CrossRef]32. Wang, F.; Yang, J.-L.; Yu, K.-K.; Xu, M.; Xu, Y.-Z.; Chen, L.; Lu, Y.-M.; Fang, H.-S.; Wang, X.-Y.; Hu, Z.-Q.; et al. Activation of the
NF-κB pathway as a mechanism of alcohol enhanced progression and metastasis of human hepatocellular carcinoma. Mol. Cancer2015, 14, 10. [CrossRef]
33. Molina, P.E.; Happel, K.I.; Zhang, P.; Kolls, J.K.; Nelson, S. Focus on: Alcohol and the immune system. Alcohol Res. Health 2010, 33,97–108.
34. Zimmermann, H.W.; Seidler, S.; Gassler, N.; Nattermann, J.; Luedde, T.; Trautwein, C.; Tacke, F. Interleukin-8 is activated inpatients with chronic liver diseases and associated with hepatic macrophage accumulation in human liver fibrosis. PLoS ONE2011, 6, e21381. [CrossRef] [PubMed]
35. Lin, M.-T.; Juan, C.-Y.; Chang, K.-J.; Chen, W.-J.; Kuo, M.-L. IL-6 inhibits apoptosis and retains oxidative DNA lesions in humangastric cancer AGS cells through up-regulation of anti-apoptotic gene mcl-1. Carcinogenesis 2001, 22, 1947–1953. [CrossRef][PubMed]
36. Persson, E.C.; Schwartz, L.M.; Park, Y.; Trabert, B.; Hollenbeck, A.R.; Graubard, B.I.; Freedman, N.D.; McGlynn, K.A. Alcoholconsumption, folate intake, hepatocellular carcinoma, and liver disease mortality. Cancer Epidemio. Biomark. Prev. 2013, 22,415–421. [CrossRef]
52
Nutrients 2021, 13, 3173
37. Sellers, T.A.; Kushi, L.H.; Cerhan, J.R.; Vierkant, R.A.; Gapstur, S.M.; Vachon, C.M.; Olson, J.E.; Therneau, T.M.; Folsom, A.R.Dietary Folate Intake, Alcohol, and Risk of Breast Cancer in a Prospective Study of Postmenopausal Women. Epidemiology 2001,12, 420–428. [CrossRef] [PubMed]
38. Dumitrescu, R.G.; Shields, P.G. The etiology of alcohol-induced breast cancer. Alcohol 2005, 35, 213–225. [CrossRef] [PubMed]39. Liu, Y.; Nguyen, N.; Colditz, G.A. Links between alcohol consumption and breast cancer: A look at the evidence. Womens Health
2015, 11, 65–77. [CrossRef]40. Singletary, K.W.; Gapstur, S.M. Alcohol and Breast CancerReview of Epidemiologic and Experimental Evidence and Potential
Mechanisms. JAMA 2001, 286, 2143–2151. [CrossRef]41. Endogenous Hormones Breast Cancer Collaborative Group; Key, T.J.; Appleby, P.N.; Reeves, G.K.; Roddam, A.W.; Helzlsouer,
K.J.; Alberg, A.J.; Rollison, D.E.; Dorgan, J.F.; Brinton, L.A.; et al. Circulating sex hormones and breast cancer risk factors inpostmenopausal women: Reanalysis of 13 studies. Br. J. Cancer 2011, 105, 709–722. [CrossRef] [PubMed]
42. Assi, N.; Rinaldi, S.; Viallon, V.; Dashti, S.G.; Dossus, L.; Fournier, A.; Cervenka, I.; Kvaskoff, M.; Turzanski-Fortner, R.; Bergmann,M.; et al. Mediation analysis of the alcohol-postmenopausal breast cancer relationship by sex hormones in the EPIC cohort. Int. J.Cancer 2020, 146, 759–768. [CrossRef]
43. Pessione, F.; Degos, F.; Marcellin, P.; Duchatelle, V.; Njapoum, C.; Martinot-Peignoux, M.; Degott, C.; Valla, D.; Erlinger, S.; Rueff,B. Effect of alcohol consumption on serum hepatitis C virus RNA and histological lesions in chronic hepatitis C. Hepatology 1998,27, 1717–1722. [CrossRef]
44. Cao, Y.; Willett, W.C.; Rimm, E.B.; Stampfer, M.J.; Giovannucci, E.L. Light to moderate intake of alcohol, drinking patterns, andrisk of cancer: Results from two prospective US cohort studies. BMJ 2015, 351, h4238. [CrossRef]
45. Shin, N.-R.; Whon, T.W.; Bae, J.-W. Proteobacteria: Microbial signature of dysbiosis in gut microbiota. Trends Biotechnol. 2015, 33,496–503. [CrossRef] [PubMed]
46. Fedirko, V.; Tran, H.Q.; Gewirtz, A.T.; Stepien, M.; Trichopoulou, A.; Aleksandrova, K.; Olsen, A.; Tjønneland, A.; Overvad, K.;Carbonnel, F.; et al. Exposure to bacterial products lipopolysaccharide and flagellin and hepatocellular carcinoma: A nestedcase-control study. BMC Med. 2017, 15, 72. [CrossRef] [PubMed]
47. Yang, Y.M.; Kim, S.Y.; Seki, E. Inflammation and Liver Cancer: Molecular Mechanisms and Therapeutic Targets. Semin. Liver Dis.2019, 39, 26–42. [CrossRef] [PubMed]
48. Howie, N.; Trigkas, T.; Cruchley, A.; Wertz, P.; Squier, C.; Williams, D. Short-term exposure to alcohol increases the permeabilityof human oral mucosa. Oral Dis. 2001, 7, 349–354. [CrossRef] [PubMed]
49. van Roekel, E.H.; Trijsburg, L.; Assi, N.; Carayol, M.; Achaintre, D.; Murphy, N.; Rinaldi, S.; Schmidt, J.A.; Stepien, M.; Kaaks,R.; et al. Circulating Metabolites Associated with Alcohol Intake in the European Prospective Investigation into Cancer andNutrition Cohort. Nutrients 2018, 10, 654. [CrossRef]
53


nutrients
Review
Margin of Exposure Analyses and Overall Toxic Effects ofAlcohol with Special Consideration of Carcinogenicity
Alex O. Okaru 1 and Dirk W. Lachenmeier 2,*
Citation: Okaru, A.O.; Lachenmeier,
D.W. Margin of Exposure Analyses
and Overall Toxic Effects of Alcohol
with Special Consideration of
Carcinogenicity. Nutrients 2021, 13,
3785. https://doi.org/10.3390/
nu13113785
Academic Editor: Peter Anderson
Received: 29 July 2021
Accepted: 19 October 2021
Published: 25 October 2021
Publisher’s Note: MDPI stays neutral
with regard to jurisdictional claims in
published maps and institutional affil-
iations.
Copyright: © 2021 by the authors.
Licensee MDPI, Basel, Switzerland.
This article is an open access article
distributed under the terms and
conditions of the Creative Commons
Attribution (CC BY) license (https://
creativecommons.org/licenses/by/
4.0/).
1 Department of Pharmacy, University of Nairobi, Nairobi P.O. Box 19676-00202, Kenya; [email protected] Chemisches und Veterinäruntersuchungsamt (CVUA) Karlsruhe, Weissenburger Straße 3,
76187 Karlsruhe, Germany* Correspondence: [email protected]; Tel.: +49-721-926-5434
Abstract: Quantitative assessments of the health risk of the constituents of alcoholic beveragesincluding ethanol are reported in the literature, generally with hepatotoxic effects considered asthe endpoint. Risk assessment studies on minor compounds such as mycotoxins, metals, and othercontaminants are also available on carcinogenicity as the endpoint. This review seeks to highlightpopulation cancer risks due to alcohol consumption using the margin of exposure methodology.The individual and cumulative health risk contribution of each component in alcoholic beverages ishighlighted. Overall, the results obtained consistently show that the ethanol contributes the bulkof harmful effects of alcoholic beverages, while all other compounds only contribute in a minorfashion (less than 1% compared to ethanol). Our data provide compelling evidence that policy shouldbe focused on reducing total alcohol intake (recorded and unrecorded), while measures on othercompounds should be only secondary to this goal.
Keywords: alcohol; risk assessment; hepatotoxicity; dose–response relationship; margin of exposure;epidemiological methods
1. Introduction
The epidemiological association of alcoholic beverages with cancer remains a topicthat has continued to attract global attention for over a century with the first documentedcases, cancer of the esophagus, being reported in 1910 [1,2]. Later in 1988, the World HealthOrganization (WHO)/International Agency for Research on Cancer (IARC) classified“alcohol drinking” as carcinogenic to humans (group 1) after establishing a causal linkbetween alcohol use and malignancies of the oral pharynx, esophagus, and liver [1].The promoters or causative factors in alcoholic beverages for developing carcinogeniclesions are a matter of continuing debate among scientists. However, alcohol being amulticomponent mixture, the potential contribution of each or all the compounds tocarcinogenesis should not be overlooked. These substances occur as residues, contaminants,or even adulterants, in addition to being naturally occurring in either raw materials orfermentation by-products.
Ethanol, the principal component of alcoholic beverages, is classified as a humancarcinogen (group 1) by IARC. Other than ethanol, other IARC-classified carcinogenic com-pounds such as acetaldehyde, formaldehyde, acrylamide, aflatoxins, ochratoxin A, arsenic,lead, cadmium, ethyl carbamate, furan, safrole, 4-methylimidazole, N-nitrosodimethylamine(NDMA), 3-Monochloropropane-1,2-diol (3-MCPD), and benzene have occurred in alco-holic beverages. The contribution of these compounds to cancer is either synergistic orindependent of each other. Understanding the contribution of each component is importantin disentangling the mechanisms of carcinogenicity due to alcohol and ultimately aids inalcohol control policies. Nevertheless, epidemiological research has reported that onlyethanol achieves the requisite threshold to explain the carcinogenic risk of alcoholic bever-ages. This review seeks to highlight population cancer risks due to alcohol consumption
Nutrients 2021, 13, 3785. https://doi.org/10.3390/nu13113785 https://www.mdpi.com/journal/nutrients55

Nutrients 2021, 13, 3785
using the margin of exposure (MOE) approach with emphasis on the cancer-risk contri-bution of individual components of alcoholic beverages. This review identifies ethanolas the main oncogenic component in alcoholic beverages and lays emphasis on the needfor policy geared towards the reduction in drinking per se and not target on other minorcarcinogens that may require strict implementation of industry best practices, i.e., as lowas reasonably achievable (ALARA) guidelines and good manufacturing practices.
2. The Margin of Exposure Method and Its Application to Alcoholic Beverages
Despite there being other methods for evaluating the health risks associated withalcohol intake, the margin of exposure (MOE) method is recommended for comparing therisks of different alcoholic beverage components [1]. MOE compares exposure levels to atoxicological threshold. The toxicological thresholds are derived from the dose–responseevaluations for both carcinogens and non-carcinogens.
The ratio between the benchmark dose’s lower one-sided confidence limit (BMDL) andpredicted human consumption/exposure of the same substance is known as the margin ofexposure. MOE is typically used to compare the health risks of various chemicals and, as aresult, to prioritize risk management efforts. The lower the MOE, the greater the risk topeople; typically, a value of less than 10,000 is used to indicate health risk.
The benchmark dose (BMD) is the dose of a chemical that, based on the dose–responsemodeling, causes a specified change in the response rate (benchmark response) of anundesirable impact compared to the background. The benchmark response is typically sug-gested to be set near the lower limit of what can be measured (e.g., for animal experimentin the 1–10% range). BMD–response modeling results can then be used with exposure datato create a MOE for quantitative risk assessment. No observed effect level (NOEL) or noobserved adverse effect level (NOAEL) values can be used as surrogate thresholds whereBMDL values are unavailable in the literature. Consequently, the MOEs can be determinedby dividing the NO(A)EL by estimated human intake [1].
The human intakes for each beverage group (i.e., beer, wine, spirits, and unrecordedalcohol) for various drinking scenarios (e.g., low risk drinking and heavy drinking) can bebased on drinking guidelines such as the Canadian ones, which consider 13.6 g of purealcohol a standard drink [1]. MOEs for average and maximum contamination with thevarious substances can also be determined for both drinking scenarios to give a range foraverage and worst-case contamination scenarios [1].
The most recent detailed IARC reviews were suggested to be used to select compoundsand their levels in alcoholic beverages. For the established and probable human carcinogens,toxicological endpoints and BMD are primarily based on literature data [1]. Suitablerisk assessment studies, including endpoints and dose–response modeling results, weretypically identified in monographs published by national and international risk assessmentbodies such as the United States Environmental Protection Agency (US EPA), the WorldHealth Organization International Programme on Chemical Safety (WHO-IPCS), the JointFAO/WHO Expert Committee on Food Additives (JECFA), and the European Food SafetyAuthority (EFSA). Data from peer-reviewed scientific research can be used for compoundswithout accessible monographs or those with missing data on dose–response modelingfindings [1].
3. Occurrence of Carcinogenic Compounds in Alcoholic Beverages
Ethanol and acetaldehyde (ethanal), both categorized by IARC as group 1 carcinogens,are the primary carcinogens occurring in alcoholic beverages accounting for approximately5.5% of all cancer cases worldwide [3]. Although the inherent cancer risk of alcoholic bever-ages parallels consumption volumes, even light alcohol drinking has been associated withcancer with ethanol and acetaldehyde being central to the pathogenicity. At the molecularlevel, ethanol and acetaldehyde are postulated to cause cancer in similar mechanistic fash-ion, since acetaldehyde, a genotoxic compound, is a metabolite of ethanol resulting fromthe alcohol dehydrogenase or CYP 450 E1 pathways. Since ethanol and acetaldehyde have
56
Nutrients 2021, 13, 3785
similar carcinogenesis mechanisms, the computation of cancer risk can be be undertakencumulatively. Additionally, ethanol plays a promoting role in oncogenesis by solvatingother carcinogens [1].
Besides metabolism, acetaldehyde occurs naturally, albeit in small amounts in alco-holic beverages with the highest contents reported to be in fortified wines (118 mg/L)and some spirit drinks (66 mg/L) [4]. Additionally, acetaldehyde occurs at high levels incertain unrecorded alcohols [5]. The average daily acetaldehyde exposure from alcoholicbeverages has been calculated to be 0.112 mg/kg body weight, with a MOE of 498 [5].
IARC has classified formaldehyde (methanal), a naturally occurring substance foundin various plants, mainly fruits and vegetables, and animal products such as meat, dairyproducts, and fish [1], as a group 1 carcinogen [6]. Formaldehyde is a carcinogen linked tothe development of leukemia and naso-pharyngeal cancer in humans. Alcoholic beveragescontain a substantial quantity of formaldehyde [7]. In a sampling of 500 beverages includingwine, beer, spirits, and unrecorded alcohol, lower formaldehyde contamination (1.8 percent)was found, which was however more than the WHO IPCS permissible concentrations [7].To surpass the daily US EPA reference dose (RfD) of 0.2 mg/kg bodyweight [8], a personweighing 60 kg would need to partake daily 800 mL of alcohol containing 14.37 mg/Lformaldehyde. Even in the worst-case scenario, this level of exposure is exceedinglyunlikely.
Acrylamide, considered by IARC as probably carcinogenic, may produce cancerthrough its metabolite, glycidamide, that forms DNA adducts [9]. Nevertheless, thereare only a few reports on the occurrence of acrylamide in alcoholic beverages withone study reporting acrylamide levels of 22 μg/kg [10]. The group 2B carcinogen, 3-monochloropropane-1,2-diol, is a heat-induced contaminant resulting from the thermalprocessing of malt [11]. In experimental animals, 3-MCPD causes renal tubule adeno-carcinomas. Although 3-MCPD is detected in some dark specialty malts used for beerproduction [11–13], it only occurs in low levels in most beers. It typically ranges from<10 μg/L to 14 μg/L [14,15].
IARC has classified the mycotoxins, aflatoxin B1 and ochratoxin A, found in somealcoholic beverages as carcinogenic to humans (group 1) and possibly carcinogenic tohumans (group 2B), respectively [16]. Aflatoxin B1, as well as other aflatoxins (B2, G1, andG2), is a naturally occurring toxin in barley, corn, and sorghum malts that enters beer due tothe use of contaminated cereals [17–19]. The occurrence of aflatoxins is climate-related withaflatoxins thriving in warm climates, especially in the tropics. Indeed, higher contaminationof beer is reported to be in warm climatic countries such as South Africa, India, Mexico, andKenya, among others [19,20]. Aflatoxin B1 has been found in the greatest concentrations(up to 6.8 μg/L) in artisanal beers from Kenya [20,21]. Similarly, ochratoxin A (OTA) occursas a contaminant in grapes and in raw materials for beer, such as barley, malt, or cerealderivatives. Unlike aflatoxin B1, OTA is partially detoxified during fermentation [22], andits concentration remains unchanged in wine for one year [23].
Among heavy metals, arsenic, cadmium, and lead are possibly the ones of carcinogenicconcern. The IARC classifies metalloid arsenic and inorganic arsenic compounds as group1 carcinogens [24]. Lung, skin, liver, kidney, prostate, and urinary bladder malignancieshave all been linked to inorganic arsenic compounds [24]. The reported levels of arsenicin beer are 0–102.4 μg/L [24], while those in spirits and wines are 0–27 and 0–14.6 μg/L,respectively [25]. The IARC designated cadmium as a group 1 carcinogenic agent becauseit causes cancers of the lungs, kidneys, and prostate [26]. According to an EFSA report [25],the amount of arsenic in various beverages varies. Fortified and liqueur wines had aCd concentration of 0.5 μg/L, whereas liqueur had a level of 6.0 μg/L. The averageconcentration of Cd in wines and beers is 1.2 and 1.8 μg/L, respectively [25]. Organiclead compounds are “not classifiable as to their carcinogenicity to humans” (group 3) [27],whereas inorganic lead and lead compounds are “probably carcinogenic” (group 2A) [28].The concentrations of lead vary across alcohol types. The average content of Pb in wines
57
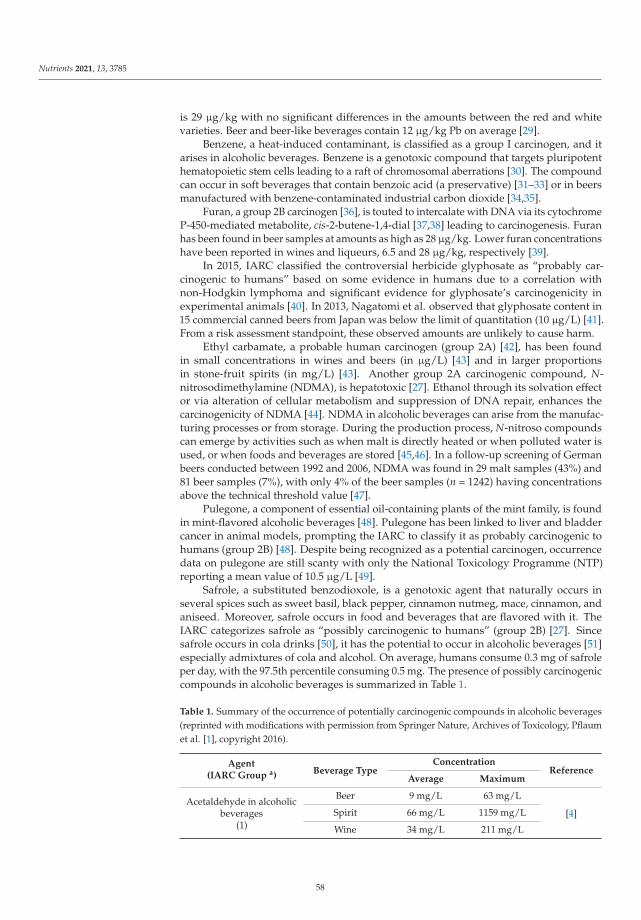
Nutrients 2021, 13, 3785
is 29 μg/kg with no significant differences in the amounts between the red and whitevarieties. Beer and beer-like beverages contain 12 μg/kg Pb on average [29].
Benzene, a heat-induced contaminant, is classified as a group I carcinogen, and itarises in alcoholic beverages. Benzene is a genotoxic compound that targets pluripotenthematopoietic stem cells leading to a raft of chromosomal aberrations [30]. The compoundcan occur in soft beverages that contain benzoic acid (a preservative) [31–33] or in beersmanufactured with benzene-contaminated industrial carbon dioxide [34,35].
Furan, a group 2B carcinogen [36], is touted to intercalate with DNA via its cytochromeP-450-mediated metabolite, cis-2-butene-1,4-dial [37,38] leading to carcinogenesis. Furanhas been found in beer samples at amounts as high as 28 μg/kg. Lower furan concentrationshave been reported in wines and liqueurs, 6.5 and 28 μg/kg, respectively [39].
In 2015, IARC classified the controversial herbicide glyphosate as “probably car-cinogenic to humans” based on some evidence in humans due to a correlation withnon-Hodgkin lymphoma and significant evidence for glyphosate’s carcinogenicity inexperimental animals [40]. In 2013, Nagatomi et al. observed that glyphosate content in15 commercial canned beers from Japan was below the limit of quantitation (10 μg/L) [41].From a risk assessment standpoint, these observed amounts are unlikely to cause harm.
Ethyl carbamate, a probable human carcinogen (group 2A) [42], has been foundin small concentrations in wines and beers (in μg/L) [43] and in larger proportionsin stone-fruit spirits (in mg/L) [43]. Another group 2A carcinogenic compound, N-nitrosodimethylamine (NDMA), is hepatotoxic [27]. Ethanol through its solvation effector via alteration of cellular metabolism and suppression of DNA repair, enhances thecarcinogenicity of NDMA [44]. NDMA in alcoholic beverages can arise from the manufac-turing processes or from storage. During the production process, N-nitroso compoundscan emerge by activities such as when malt is directly heated or when polluted water isused, or when foods and beverages are stored [45,46]. In a follow-up screening of Germanbeers conducted between 1992 and 2006, NDMA was found in 29 malt samples (43%) and81 beer samples (7%), with only 4% of the beer samples (n = 1242) having concentrationsabove the technical threshold value [47].
Pulegone, a component of essential oil-containing plants of the mint family, is foundin mint-flavored alcoholic beverages [48]. Pulegone has been linked to liver and bladdercancer in animal models, prompting the IARC to classify it as probably carcinogenic tohumans (group 2B) [48]. Despite being recognized as a potential carcinogen, occurrencedata on pulegone are still scanty with only the National Toxicology Programme (NTP)reporting a mean value of 10.5 μg/L [49].
Safrole, a substituted benzodioxole, is a genotoxic agent that naturally occurs inseveral spices such as sweet basil, black pepper, cinnamon nutmeg, mace, cinnamon, andaniseed. Moreover, safrole occurs in food and beverages that are flavored with it. TheIARC categorizes safrole as “possibly carcinogenic to humans” (group 2B) [27]. Sincesafrole occurs in cola drinks [50], it has the potential to occur in alcoholic beverages [51]especially admixtures of cola and alcohol. On average, humans consume 0.3 mg of safroleper day, with the 97.5th percentile consuming 0.5 mg. The presence of possibly carcinogeniccompounds in alcoholic beverages is summarized in Table 1.
Table 1. Summary of the occurrence of potentially carcinogenic compounds in alcoholic beverages(reprinted with modifications with permission from Springer Nature, Archives of Toxicology, Pflaumet al. [1], copyright 2016).
Agent(IARC Group a) Beverage Type
ConcentrationReference
Average Maximum
Acetaldehyde in alcoholicbeverages
(1)
Beer 9 mg/L 63 mg/L
[4]Spirit 66 mg/L 1159 mg/L
Wine 34 mg/L 211 mg/L
58
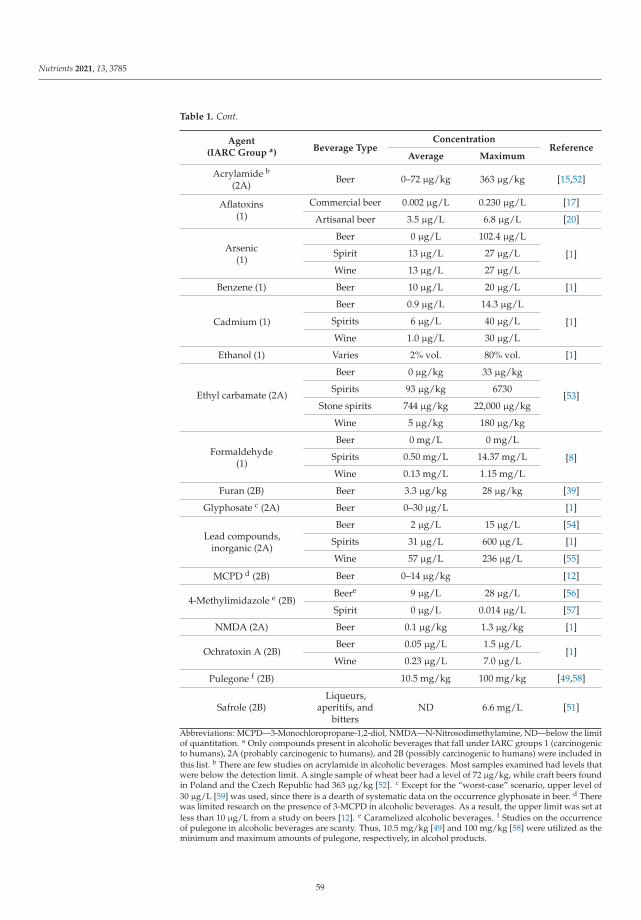
Nutrients 2021, 13, 3785
Table 1. Cont.
Agent(IARC Group a) Beverage Type
ConcentrationReference
Average Maximum
Acrylamide b
(2A)Beer 0–72 μg/kg 363 μg/kg [15,52]
Aflatoxins(1)
Commercial beer 0.002 μg/L 0.230 μg/L [17]
Artisanal beer 3.5 μg/L 6.8 μg/L [20]
Arsenic(1)
Beer 0 μg/L 102.4 μg/L
[1]Spirit 13 μg/L 27 μg/L
Wine 13 μg/L 27 μg/L
Benzene (1) Beer 10 μg/L 20 μg/L [1]
Cadmium (1)
Beer 0.9 μg/L 14.3 μg/L
[1]Spirits 6 μg/L 40 μg/L
Wine 1.0 μg/L 30 μg/L
Ethanol (1) Varies 2% vol. 80% vol. [1]
Ethyl carbamate (2A)
Beer 0 μg/kg 33 μg/kg
[53]Spirits 93 μg/kg 6730
Stone spirits 744 μg/kg 22,000 μg/kg
Wine 5 μg/kg 180 μg/kg
Formaldehyde(1)
Beer 0 mg/L 0 mg/L
[8]Spirits 0.50 mg/L 14.37 mg/L
Wine 0.13 mg/L 1.15 mg/L
Furan (2B) Beer 3.3 μg/kg 28 μg/kg [39]
Glyphosate c (2A) Beer 0–30 μg/L [1]
Lead compounds,inorganic (2A)
Beer 2 μg/L 15 μg/L [54]
Spirits 31 μg/L 600 μg/L [1]
Wine 57 μg/L 236 μg/L [55]
MCPD d (2B) Beer 0–14 μg/kg [12]
4-Methylimidazole e (2B)Beere 9 μg/L 28 μg/L [56]
Spirit 0 μg/L 0.014 μg/L [57]
NMDA (2A) Beer 0.1 μg/kg 1.3 μg/kg [1]
Ochratoxin A (2B)Beer 0.05 μg/L 1.5 μg/L
[1]Wine 0.23 μg/L 7.0 μg/L
Pulegone f (2B) 10.5 mg/kg 100 mg/kg [49,58]
Safrole (2B)Liqueurs,
aperitifs, andbitters
ND 6.6 mg/L [51]
Abbreviations: MCPD—3-Monochloropropane-1,2-diol, NMDA—N-Nitrosodimethylamine, ND—below the limitof quantitation. a Only compounds present in alcoholic beverages that fall under IARC groups 1 (carcinogenicto humans), 2A (probably carcinogenic to humans), and 2B (possibly carcinogenic to humans) were included inthis list. b There are few studies on acrylamide in alcoholic beverages. Most samples examined had levels thatwere below the detection limit. A single sample of wheat beer had a level of 72 μg/kg, while craft beers foundin Poland and the Czech Republic had 363 μg/kg [52]. c Except for the “worst-case” scenario, upper level of30 μg/L [59] was used, since there is a dearth of systematic data on the occurrence glyphosate in beer. d Therewas limited research on the presence of 3-MCPD in alcoholic beverages. As a result, the upper limit was set atless than 10 μg/L from a study on beers [12]. e Caramelized alcoholic beverages. f Studies on the occurrenceof pulegone in alcoholic beverages are scanty. Thus, 10.5 mg/kg [49] and 100 mg/kg [58] were utilized as theminimum and maximum amounts of pulegone, respectively, in alcohol products.
59
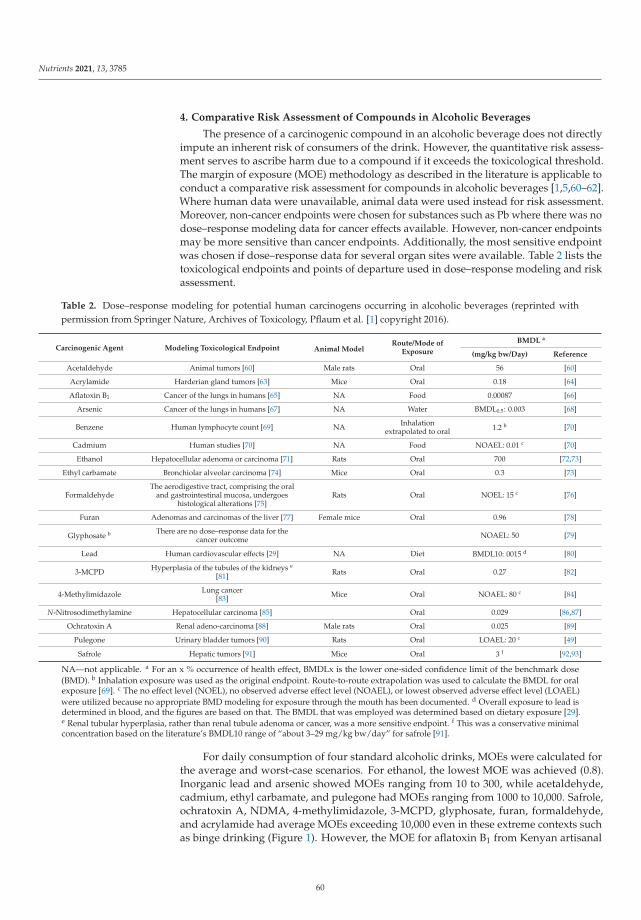
Nutrients 2021, 13, 3785
4. Comparative Risk Assessment of Compounds in Alcoholic Beverages
The presence of a carcinogenic compound in an alcoholic beverage does not directlyimpute an inherent risk of consumers of the drink. However, the quantitative risk assess-ment serves to ascribe harm due to a compound if it exceeds the toxicological threshold.The margin of exposure (MOE) methodology as described in the literature is applicable toconduct a comparative risk assessment for compounds in alcoholic beverages [1,5,60–62].Where human data were unavailable, animal data were used instead for risk assessment.Moreover, non-cancer endpoints were chosen for substances such as Pb where there was nodose–response modeling data for cancer effects available. However, non-cancer endpointsmay be more sensitive than cancer endpoints. Additionally, the most sensitive endpointwas chosen if dose–response data for several organ sites were available. Table 2 lists thetoxicological endpoints and points of departure used in dose–response modeling and riskassessment.
Table 2. Dose–response modeling for potential human carcinogens occurring in alcoholic beverages (reprinted withpermission from Springer Nature, Archives of Toxicology, Pflaum et al. [1] copyright 2016).
Carcinogenic Agent Modeling Toxicological Endpoint Animal ModelRoute/Mode of
Exposure
BMDL a
(mg/kg bw/Day) Reference
Acetaldehyde Animal tumors [60] Male rats Oral 56 [60]
Acrylamide Harderian gland tumors [63] Mice Oral 0.18 [64]
Aflatoxin B1 Cancer of the lungs in humans [65] NA Food 0.00087 [66]
Arsenic Cancer of the lungs in humans [67] NA Water BMDL0.5: 0.003 [68]
Benzene Human lymphocyte count [69] NA Inhalationextrapolated to oral 1.2 b [70]
Cadmium Human studies [70] NA Food NOAEL: 0.01 c [70]
Ethanol Hepatocellular adenoma or carcinoma [71] Rats Oral 700 [72,73]
Ethyl carbamate Bronchiolar alveolar carcinoma [74] Mice Oral 0.3 [73]
FormaldehydeThe aerodigestive tract, comprising the oral
and gastrointestinal mucosa, undergoeshistological alterations [75]
Rats Oral NOEL: 15 c [76]
Furan Adenomas and carcinomas of the liver [77] Female mice Oral 0.96 [78]
Glyphosate b There are no dose–response data for thecancer outcome NOAEL: 50 [79]
Lead Human cardiovascular effects [29] NA Diet BMDL10: 0015 d [80]
3-MCPD Hyperplasia of the tubules of the kidneys e
[81] Rats Oral 0.27 [82]
4-Methylimidazole Lung cancer[83] Mice Oral NOAEL: 80 c [84]
N-Nitrosodimethylamine Hepatocellular carcinoma [85] Oral 0.029 [86,87]
Ochratoxin A Renal adeno-carcinoma [88] Male rats Oral 0.025 [89]
Pulegone Urinary bladder tumors [90] Rats Oral LOAEL: 20 c [49]
Safrole Hepatic tumors [91] Mice Oral 3 f [92,93]
NA—not applicable. a For an x % occurrence of health effect, BMDLx is the lower one-sided confidence limit of the benchmark dose(BMD). b Inhalation exposure was used as the original endpoint. Route-to-route extrapolation was used to calculate the BMDL for oralexposure [69]. c The no effect level (NOEL), no observed adverse effect level (NOAEL), or lowest observed adverse effect level (LOAEL)were utilized because no appropriate BMD modeling for exposure through the mouth has been documented. d Overall exposure to lead isdetermined in blood, and the figures are based on that. The BMDL that was employed was determined based on dietary exposure [29].e Renal tubular hyperplasia, rather than renal tubule adenoma or cancer, was a more sensitive endpoint. f This was a conservative minimalconcentration based on the literature’s BMDL10 range of “about 3–29 mg/kg bw/day” for safrole [91].
For daily consumption of four standard alcoholic drinks, MOEs were calculated forthe average and worst-case scenarios. For ethanol, the lowest MOE was achieved (0.8).Inorganic lead and arsenic showed MOEs ranging from 10 to 300, while acetaldehyde,cadmium, ethyl carbamate, and pulegone had MOEs ranging from 1000 to 10,000. Safrole,ochratoxin A, NDMA, 4-methylimidazole, 3-MCPD, glyphosate, furan, formaldehyde,and acrylamide had average MOEs exceeding 10,000 even in these extreme contexts suchas binge drinking (Figure 1). However, the MOE for aflatoxin B1 from Kenyan artisanal
60
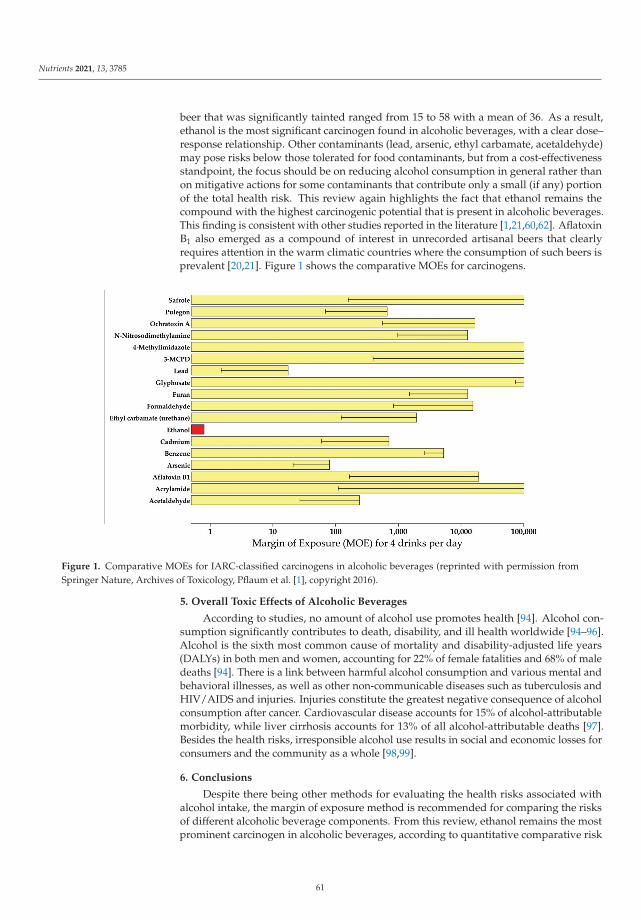
Nutrients 2021, 13, 3785
beer that was significantly tainted ranged from 15 to 58 with a mean of 36. As a result,ethanol is the most significant carcinogen found in alcoholic beverages, with a clear dose–response relationship. Other contaminants (lead, arsenic, ethyl carbamate, acetaldehyde)may pose risks below those tolerated for food contaminants, but from a cost-effectivenessstandpoint, the focus should be on reducing alcohol consumption in general rather thanon mitigative actions for some contaminants that contribute only a small (if any) portionof the total health risk. This review again highlights the fact that ethanol remains thecompound with the highest carcinogenic potential that is present in alcoholic beverages.This finding is consistent with other studies reported in the literature [1,21,60,62]. AflatoxinB1 also emerged as a compound of interest in unrecorded artisanal beers that clearlyrequires attention in the warm climatic countries where the consumption of such beers isprevalent [20,21]. Figure 1 shows the comparative MOEs for carcinogens.
Figure 1. Comparative MOEs for IARC-classified carcinogens in alcoholic beverages (reprinted with permission fromSpringer Nature, Archives of Toxicology, Pflaum et al. [1], copyright 2016).
5. Overall Toxic Effects of Alcoholic Beverages
According to studies, no amount of alcohol use promotes health [94]. Alcohol con-sumption significantly contributes to death, disability, and ill health worldwide [94–96].Alcohol is the sixth most common cause of mortality and disability-adjusted life years(DALYs) in both men and women, accounting for 22% of female fatalities and 68% of maledeaths [94]. There is a link between harmful alcohol consumption and various mental andbehavioral illnesses, as well as other non-communicable diseases such as tuberculosis andHIV/AIDS and injuries. Injuries constitute the greatest negative consequence of alcoholconsumption after cancer. Cardiovascular disease accounts for 15% of alcohol-attributablemorbidity, while liver cirrhosis accounts for 13% of all alcohol-attributable deaths [97].Besides the health risks, irresponsible alcohol use results in social and economic losses forconsumers and the community as a whole [98,99].
6. Conclusions
Despite there being other methods for evaluating the health risks associated withalcohol intake, the margin of exposure method is recommended for comparing the risksof different alcoholic beverage components. From this review, ethanol remains the mostprominent carcinogen in alcoholic beverages, according to quantitative comparative risk
61
Nutrients 2021, 13, 3785
assessment. Therefore, the reduction in alcohol intake ought to be prioritized in combatingharm due to alcoholic beverages [100]. Since the dose–response relationship holds foralcohol harm, reduction in alcoholic strength would be beneficial in minimizing the harmfuleffects of alcohol [101]. For illustration, drinking four bottles of 5.5 percent vol. ethanolbeer generates a MOE of 0.5, whereas drinking the same volume of light beer (1.5 percentvol. ethanol) yields a substantially greater MOE of 1.9 [1]. Moreover, consumers may not betypically able to discriminate different alcohol strengths in beer and, thus, may not ingestmore volumes to compensate for the lower alcoholic strength beer [102,103].
Other carcinogens besides ethanol require mitigative steps as well, which may requirestrict adoption of industry best practices such as keeping contaminants/components aslow as can reasonably be achieved (ALARA). We urge the relevant regulatory authoritiesto implement the available mitigative measures to protect consumers from potentiallycarcinogenic substances.
Author Contributions: D.W.L. was in charge of conceptualization; D.W.L. and A.O.O. were in chargeof methodology; A.O.O. was in charge of writing—original draft preparation; D.W.L. was in chargeof writing—review and editing. All authors have read and agreed to the published version of themanuscript.
Funding: This research received no external funding.
Institutional Review Board Statement: Not applicable.
Informed Consent Statement: Not applicable.
Data Availability Statement: Extracted data are presented in the main tables.
Conflicts of Interest: The authors declare no conflict of interest.
References
1. Pflaum, T.; Hausler, T.; Baumung, C.; Ackermann, S.; Kuballa, T.; Rehm, J.; Lachenmeier, D.W. Carcinogenic compounds inalcoholic beverages: An update. Arch. Toxicol. 2016, 90, 2349–2367. [CrossRef] [PubMed]
2. Lamy, L. Etude de statistique clinique de 134 cas de cancer de l’ oesophage en du cardia. Arch. Mal. Appar. Dig. 1910, 4, 451–475.3. Praud, D.; Rota, M.; Rehm, J.; Shield, K.; Zatonski, W.; Hashibe, M.; La Vecchia, C.; Boffetta, P. Cancer incidence and mortality
attributable to alcohol consumption. Int. J. Cancer 2016, 138, 1380–1387. [CrossRef] [PubMed]4. Lachenmeier, D.W.; Sohnius, E.-M. The role of acetaldehyde outside ethanol metabolism in the carcinogenicity of alcoholic
beverages: Evidence from a large chemical survey. Food Chem. Toxicol. 2008, 46, 2903–2911. [CrossRef]5. Lachenmeier, D.W.; Kanteres, F.; Rehm, J. Carcinogenicity of acetaldehyde in alcoholic beverages: Risk assessment outside ethanol
metabolism. Addiction 2009, 104, 533–550. [CrossRef]6. IARC Working Group on the Evaluation of Carcinogenic Risks to Humans. Formaldehyde. IARC Monogr. Eval. Carcinog. Risks
Hum. 2006, 88, 39–325.7. Monakhova, Y.B.; Jendral, J.A.; Lachenmeier, D.W. The margin of exposure to formaldehyde in alcoholic beverages. Arch. Ind.
Hyg. Toxicol. 2012, 63, 227–237. [CrossRef]8. Jendral, J.A.; Monakhova, Y.B.; Lachenmeier, D.W. Formaldehyde in Alcoholic Beverages: Large Chemical Survey Using Purpald
Screening Followed by Chromotropic Acid Spectrophotometry with Multivariate Curve Resolution. Int. J. Anal. Chem. 2011, 2011,797604. [CrossRef]
9. Boettcher, M.I.; Schettgen, T.; Kütting, B.; Pischetsrieder, M.; Angerer, J. Mercapturic acids of acrylamide and glycidamide asbiomarkers of the internal exposure to acrylamide in the general population. Mutat. Res.-Genet. Toxicol. Environ. Mutagen. 2005,580, 167–176. [CrossRef]
10. Mo, W.; He, H.; Xu, X.; Huang, B.; Ren, Y. Simultaneous determination of ethyl carbamate, chloropropanols and acrylamide infermented products, flavoring and related foods by gas chromatography–triple quadrupole mass spectrometry. Food Control 2014,43, 251–257. [CrossRef]
11. Wenzl, T.; Lachenmeier, D.W.; Gökmen, V. Analysis of heat-induced contaminants (acrylamide, chloropropanols and furan) incarbohydrate-rich food. Anal. Bioanal. Chem. 2007, 389, 119–137. [CrossRef]
12. Breitling-Utzmann, C.M.; Köbler, H.; Harbolzheimer, D.; Maier, A. 3-MCPD - Occurrence in bread crust and various food groupsas well as formation in toast. Dtsch. Leb. 2003, 99, 280–285.
13. Svejkovská, B.; Novotný, O.; Divinová, V.; Réblová, Z.; Doležal, M.; Velíšek, J. Esters of 3-chloropropane-1,2-diol in foodstuffs.Czech J. Food Sci. 2018, 22, 190–196. [CrossRef]
14. Baxter, E.D.; Booer, C.D.; Muller, R.E.; O’Shaugnessy, C.; Slaiding, I.R. Minimizing acrylamide and 3-MCPD in crystal malts;effects on flavour. Proc. Congr. Eur. Brew Conv. 2005, 30, 163-1–163-6.
62
Nutrients 2021, 13, 3785
15. Sadowska-Rociek, A.; Surma, M. A survey on thermal processing contaminants occurrence in dark craft beers. J. Food Compos.Anal. 2021, 99, 103888. [CrossRef]
16. IARC Working Group on the Evaluation of Carcinogenic Risks to Humans. Aflatoxins. IARC Monogr. Eval. Carcinog. Risks Hum.2012, 100F, 225–248.
17. Mably, M.; Mankotia, M.; Cavlovic, P.; Tam, J.; Wong, L.; Pantazopoulos, P.; Calway, P.; Scott, P.M. Survey of aflatoxins in beersold in Canada. Food Addit. Contam. 2005, 22, 1252–1257. [CrossRef]
18. Gilbert, J.; Michelangelo, P. Analytical methods for mycotoxins in the wheat chain. In Mycotoxin Reduction in Grain Chain; Leslie,J.F., Logrieco, A.F., Eds.; Wiley Blackwell: Oxford, UK, 2014; pp. 169–188.
19. Odhav, B.; Naicker, V. Mycotoxins in South African traditionally brewed beers. Food Addit. Contam. 2002, 19, 55–61. [CrossRef]20. Okaru, A.O.; Abuga, K.O.; Kibwage, I.O.; Hausler, T.; Luy, B.; Kuballa, T.; Rehm, J.; Lachenmeier, D.W. Aflatoxin contamination
in unrecorded beers from Kenya – A health risk beyond ethanol. Food Control 2017, 79, 344–348. [CrossRef]21. Okaru, A.O.; Rehm, J.; Sommerfeld, K.; Kuballa, T.; Walch, S.G.; Lachenmeier, D.W. The Threat to Quality of Alcoholic Beverages
by Unrecorded Consumption. In Alcoholic Beverages; Woodhead Publishing: Cambridge, UK, 2019; pp. 1–34.22. Esti, M.; Benucci, I.; Liburdi, K.; Acciaro, G. Monitoring of ochratoxin A fate during alcoholic fermentation of wine-must. Food
Control 2012, 27, 53–56. [CrossRef]23. Lopez de Cerain, A.; González-Peñas, E.; Jiménez, A.M.; Bello, J. Contribution to the study of ochratoxin A in Spanish wines.
Food Addit. Contam. 2002, 19, 1058–1064. [CrossRef]24. IARC Working Group on the Evaluation of Carcinogenic Risks to Humans. Arsenic and arsenic compounds. IARC Monogr. Eval.
Carcinog. Risks Hum. 2012, 100C, 41–93.25. Barbaste, M.; Medina, B.; Perez-Trujillo, J.P. Analysis of arsenic, lead and cadmium in wines from the Canary Islands, Spain, by
ICP/MS. Food Addit. Contam. 2021, 4, 141–148. [CrossRef]26. IARC Working Group on the Evaluation of Carcinogenic Risks to Humans. Cadmium and cadmium compounds. IARC Monogr.
Eval. Carcinog. Risks Hum. 2012, 100C, 121–145.27. IARC Monographs on the Evaluation of Carcinogenic Risks to Humans; Suppl. S7; International Agency for Research on Cancer: Lyon,
France, 1987.28. IARC Working Group on the Evaluation of Carcinogenic Risks to Humans. Inorganic and organic lead compounds. IARC Monogr.
Eval. Carcinog. Risks Hum. 2006, 87, 39–468.29. EFSA. Scientifc opinion on lead in food. EFSA J. 2010, 8, 1570.30. IARC Working Group on the Evaluation of Carcinogenic Risks to Humans. Benzene. IARC Monogr. Eval. Carcinog. Risks Hum.
2012, 100F, 249–294.31. Lachenmeier, D.W.; Kuballa, T.; Reusch, H.; Sproll, C.; Kersting, M.; Alexy, U. Benzene in infant carrot juice: Further insight into
formation mechanism and risk assessment including consumption data from the DONALD study. Food Chem. Toxicol. 2010, 48,291–297. [CrossRef]
32. Loch, C.; Reusch, H.; Ruge, I.; Godelmann, R.; Pflaum, T.; Kuballa, T.; Schumacher, S.; Lachenmeier, D.W. Benzaldehyde in cherryflavour as a precursor of benzene formation in beverages. Food Chem. 2016, 206, 74–77. [CrossRef]
33. Steinbrenner, N.; Löbell-Behrends, S.; Reusch, H.; Kuballa, T.; Lachenmeier, D.W. Benzol in Lebensmitteln – ein Überblick. J.Verbrauchersch. Lebensm. 2010, 5, 443–452. [CrossRef]
34. Long, D.G. From cobalt to chloropropanol: De tribulationibus aptis cerevisiis imbibendis. J. Inst. Brew. 1999, 105, 79–84. [CrossRef]35. Wu, Q.-J.; Lin, H.; Fan, W.; Dong, J.-J.; Chen, H.-L. Investigation into Benzene, Trihalomethanes and Formaldehyde in Chinese
Lager Beers. J. Inst. Brew. 2006, 112, 291–294. [CrossRef]36. IARC Working Group on the Evaluation of Carcinogenic Risks to Humans. Furan. IARC Monogr. Eval. Carcinog. Risks Hum. 1995,
63, 393–407.37. Chen, L.J.; Hecht, S.S.; Peterson, L.A. Identification of cis-2-butene-1,4-dial as a microsomal metabolite of furan. Chem. Res. Toxicol.
1995, 8, 903–906. [CrossRef]38. Peterson, L.A.; Cummings, M.E.; Vu, C.C.; Matter, B.A. Glutathione trapping to measure microsomal oxidation of furan toto
cis-2-butene-1,4-dial. Drug Metab. Dispos. 2005, 33, 1453–1458. [CrossRef]39. EFSA. Update on furan levels in food from monitoring years 2004–2010 and exposure assessment. EFSA J. 2011, 9, 2347.40. IARC Working Group on the Evaluation of Carcinogenic Risks to Humans. Glyphosate. IARC Monogr. Eval. Carcinog. Risks Hum.
2015, 112, 321–399.41. Nagatomi, Y.; Yoshioka, T.; Yanagisawa, M.; Uyama, A.; Mochizuki, N. Simultaneous LC-MS/MS Analysis of Glyphosate,
Glufosinate, and Their Metabolic Products in Beer, Barley Tea, and Their Ingredients. Biosci. Biotechnol. Biochem. 2013, 77,2218–2221. [CrossRef]
42. IARC Working Group on the Evaluation of Carcinogenic Risks to Humans. Alcohol consumption and ethyl carbamate. IARCMonogr. Eval. Carcinog. Risks Hum. 2010, 96, 1–1428.
43. Uthurry, C.A.; Varela, F.; Colomo, B.; Suárez Lepe, J.A.; Lombardero, J.; García del Hierro, J.R. Ethyl carbamate concentrations oftypical Spanish red wines. Food Chem. 2004, 88, 329–336. [CrossRef]
44. Anderson, L.M.; Souliotis, V.L.; Chhabra, S.K.; Moskal, T.J.; Harbaugh, S.D.; Kyrtopoulos, S.A. N-nitrosodimethylamine-derivedO(6)-methylguanine in DNA of monkey gastrointestinal and urogenital organs and enhancement by ethanol. Int. J. Cancer 1996,66, 130–134. [CrossRef]
63
Nutrients 2021, 13, 3785
45. Lijinsky, W. N-Nitroso compounds in the diet. Mutat. Res. Toxicol. Environ. Mutagen. 1999, 443, 129–138. [CrossRef]46. Tricker, A.R.; Kubacki, S.J. Review of the occurrence and formation of non-volatile N -nitroso compounds in foods. Food Addit.
Contam. 1992, 9, 39–69. [CrossRef]47. Lachenmeier, D.W.; Fügel, D. Reduction of nitrosamines in beer—Review of a success story. Brew Sci. 2007, 60, 84–89.48. IARC Working Group on the Evaluation of Carcinogenic Risks to Humans. Pulegone. IARC Monogr. Eval. Carcinog. Risks Hum.
2015, 108, 141–154.49. National Toxicology Program. Toxicology and carcinogenesis studies of pulegone (CAS No. 89-82-7) in F344/N rats and B6C3F1
mice (gavage studies). Natl. Toxicol. Program Tech. Rep. Ser. 2011, 563, 1–201.50. SCF. Opinion of the Scientifc Committee on Food on the Safety of the Presence of Safrole (1-allyl-3,4-methylene Dioxy Benzene) in Flavouring
and Other Food Ingredients with Flavouring Properties; European Commission: Brussels, Belgium, 2002.51. Curro, P.; Micali, G.; Lanuzza, F. Determination of beta-asarone, safrole, isosafrole and anethole in alcoholic drinks by high-
performance liquid chromatography. J Chromatogr. 1987, 404, 273–278. [CrossRef]52. Gutsche, B.; Weißhaar, R.; Buhlert, J. Acrylamide in food - Screening results from food control in Baden-Württemberg. Deut.
Lebensm. Rundsch. 2002, 98, 437–443.53. EFSA. Opinion of the Scientific Panel on Contaminants in the Food Chain on a request from the European Commission on Ethyl
Carbamate and Hydrocyanic Acid in Food and Beverages (Question No EFSA-Q-2006-076). EFSA J. 2007, 1–44.54. Donhauser, S.; Wagner, D.J.F. Critical trace-elements in brewing technology. 2. Occurrence of arsenic, lead, cadmium, chromium,
mercury and selenium in beer. Monatsschr. Brauwiss. 1987, 40, 328–333.55. Andrey, D. A simple gas chromatography method for the determination of ethylcarbamate in spirits. Z. Lebensm. Unters. Forsch.
1987, 185, 21–23. [CrossRef]56. Klejdus, B.; Moravcová, J.; Lojková, L.; Vacek, J.; Kubán, V. Solid-phase extraction of 4(5)-methylimidazole (4MeI) and 2-acetyl-
4(5)-(1,2,3,4-tetrahydroxybutyl)-imidazole (THI) from foods and beverages with subsequent liquid chromatographic-electrospraymass spectrometric quantification. J. Sep. Sci. 2006, 29, 378–384. [CrossRef]
57. Yoshikawa, S.; Fujiwara, M. Determination of 4 (5)-Methylimidazole in Food by Thin Layer Chromatography. Food Hyg. Saf. Sci.(Shokuhin Eiseigaku Zasshi) 1981, 22, 189–196. [CrossRef]
58. European Commission. European Commission Regulation (EC) No 1334/2008 of the European Parliament and of the Council of16 December 2008 on flavourings and certain food ingredients with flavouring properties for use in and on foods and amendingCouncil Regulation (EEC) No 1601/91, Regulations (EC). Off. J. Eur. Union 2008, L 354/34, 34–50.
59. BfR Provisional Assessment of Glyphosate in Beer; BfR Communication No. 005/2016; Bundesinstitut für Risikobewertung (BfR):Berlin, Germany, 25 February 2016.
60. Lachenmeier, D.W.; Przybylski, M.C.; Rehm, J. Comparative risk assessment of carcinogens in alcoholic beverages using themargin of exposure approach. Int. J. Cancer 2012, 131, 995–1003. [CrossRef]
61. Lachenmeier, D.W.; Gill, J.S.; Chick, J.; Rehm, J. The total margin of exposure of ethanol and acetaldehyde for heavy drinkersconsuming cider or vodka. Food Chem. Toxicol. 2015, 83, 210–214. [CrossRef]
62. Lachenmeier, D.W.; Rehm, J. Comparative risk assessment of alcohol, tobacco, cannabis and other illicit drugs using the marginof exposure approach. Sci. Rep. 2015, 5, 8126. [CrossRef]
63. Mueller, U.; Agudo, A.; Carrington, C.; Doerge, D.; Hellenäs, K.E.; Leb-lanc, J.C.; Rao, M.; Renwick, A.; Slob, W.; Wu, Y.Acrylamide (Addendum). In Safety Evaluation of Certain Contaminants in Food. Prepared by the Seventysecond Meeting of the JointFAO/WHO Expert Committee on Food Additives (JECFA); WHO Food Additives Series 63; WHO and FAO: Geneva, Switzerland,2011; pp. 1–51.
64. National Toxology Program NTP. Technical Report on the Toxicology and Carcinogenesis Studies of Acrylamide in F344/N Ratsand B6C3F1 Mice (Feed and Drinking Water Studies). Natl. Toxicol. Progr. Tech. Rep. Ser. 2012, 575, 1–236.
65. EFSA. Opinion of the scientific panel on contaminants in the food chain [CONTAM] related to the potential increase of consumerhealth risk by a possible increase of the existing maximum levels for aflatoxins in almonds, hazelnuts and pistachios and derivedprod. EFSA J. 2007, 446, 1–127.
66. Yeh, F.S.; Yu, M.C.; Mo, C.C.; Luo, S.; Tong, M.J.; Henderson, B.E. Hepatitis B virus, aflatoxins, and hepatocellular carcinoma insouthern Guangxi, China. Cancer Res. 1989, 49, 2506–2509. [CrossRef]
67. Benford, D.J.; Alexander, J.; Baines, J.; Bellinger, D.C.; Carrington, C.; Peréz, V.A.; Uxbury, J.; Fawell, J.; Hailemariam, K.; Montoro,R.; et al. Arsenic (Addendum). In Safety Evaluation of Certain Contaminants in Food. Prepared by the Seventy-Second Meeting of theJoint FAO/WHO Expert Committee on Food Additives (JECFA); WHO Food Additives Series 63; WHO and FAO: Geneva, Switzerland,2011; pp. 153–316.
68. Chen, C.-L.; Chiou, H.-Y.; Hsu, L.-I.; Hsueh, Y.-M.; Wu, M.-M.; Chen, C.-J. Ingested arsenic, characteristics of well waterconsumption and risk of different histological types of lung cancer in northeastern Taiwan. Environ. Res. 2010, 110, 455–462.[CrossRef] [PubMed]
69. US EPA. Benzene (CASRN 71-43-2). Integrated Risk Information System. Document 0276; US Environmental Protection Agency:Washington, DC, USA, 2003.
70. Rothman, N.; Li, G.L.; Dosemeci, M.; Bechtold, W.E.; Marti, G.E.; Wang, Y.Z.; Linet, M.; Xi, L.Q.; Lu, W.; Smith, M.T.; et al.Hematotoxicity among Chinese workers heavily exposed to benzene. Am. J. Ind. Med. 1996, 29, 236–246. [CrossRef]
64
Nutrients 2021, 13, 3785
71. Lachenmeier, D.W.; Kanteres, F.; Rehm, J. Epidemiology-based risk assessment using the benchmark dose/margin of exposureapproach: The example of ethanol and liver cirrhosis. Int. J. Epidemiol. 2011, 40, 210–218. [CrossRef] [PubMed]
72. Beland, F.A.; Benson, R.W.; Mellick, P.W.; Kovatch, R.M.; Roberts, D.W.; Fang, J.-L.; Doerge, D.R. Effect of ethanol on thetumorigenicity of urethane (ethyl carbamate) in B6C3F1 mice. Food Chem. Toxicol. 2005, 43, 1–19. [CrossRef]
73. National Toxicology Program. NTP technical report on the toxicology and carcino- gensis. Studies of urethane, ethanol, andurethane/ethanol (urethane, CAS No. 51-79-6; ethanol, CAS No. 64-17-5) in B6C3F1 mice (drinking water studies). Natl. Toxicol.Progr. Tech. Rep. Ser. 2004, 510, 1–346.
74. Vavasour, E.; Renwick, A.G.; Engeli, B.; Barlow, S.; Castle, L.; DiNovi, M.; Slob, W.; Schlatter, J.; Bolger, M. Ethyl carbamate. InSafety Evaluation of Certain Contaminants in Food. Prepared by the Sixty-Fourth Meeting of the Joint FAO/WHO Expert Committee onFood Additives (JECFA); WHO Food Additives Series 55; WHO and FAO: Geneva, Switzerland, 2006.
75. IPCS. Environmental Health Criteria 239: Principles for Modelling Dose-Response for the Risk Assessment of Chemicals; World HealthOrganization: Geneva, Switzerland, 2009.
76. Til, H.P.; Woutersen, R.A.; Feron, V.J.; Hollanders, V.H.; Falke, H.E.; Clary, J.J. Two-year drinking-water study of formaldehyde inrats. Food Chem. Toxicol. 1989, 27, 77–87. [CrossRef]
77. Williams, G.M.; Arisseto, A.P.; Baines, J.; DiNovi, M.; Feeley, M.; Schlatter, J.; Slob, W.; Toledo, M.C.F.; Vavasour, E. Furan. InSafety Evaluation of Certain Contaminants in food. Prepared by the Seventy-Second Meeting of the Joint FAO/WHO Expert Committee onFood Additives (JECFA); WHO Food Additives Series 63; WHO and FAO: Geneva, Switzerland, 2011.
78. Moser, G.J.; Foley, J.; Burnett, M.; Goldsworthy, T.L.; Maronpot, R. Furan-induced dose–response relationships for liver cytotoxicity,cell proliferation, and tumorigenicity (furan-induced liver tumorigenicity). Exp. Toxicol. Pathol. 2009, 61, 101–111. [CrossRef]
79. EFSA. Conclusion on the peer review of the pesticide risk assessment of the active substance glyphosate. EFSA J. 2015, 13, 4302.80. Navas-Acien, A.; Tellez-Plaza, M.; Guallar, E.; Muntner, P.; Silbergeld, E.; Jaar, B.; Weaver, V. Blood Cadmium and Lead and
Chronic Kidney Disease in US Adults: A Joint Analysis. Am. J. Epidemiol. 2009, 170, 1156–1164. [CrossRef]81. Abraham, K.; Mielke, H.; Lampen, A. Hazard characterization of 3-MCPD using benchmark dose modeling: Factors influencing
the outcome. Eur. J. Lipid Sci. Technol. 2012, 114, 1225–1226. [CrossRef]82. Cho, W.S.; Han, B.S.; Nam, K.T.; Park, K.; Choi, M.; Kim, S.H.; Jeong, J.; Jang, D.D. Carcinogenicity study of 3-monochloropropane-
1,2-diol in Sprague-Dawley rats. Food Chem. Toxicol. 2008, 46, 3172–3177. [CrossRef]83. EFSA. Scientific Opinion on the re-evaluation of caramel colours (E 150 a,b,c,d) as food additives. EFSA J. 2011, 9, 2004.84. National Toxicology Program. Toxicology and carcinogenesis studies of 4-methylimidazole (Cas No. 822-36-6) in F344/N rats
and B6C3F1 mice (feed studies). Natl. Toxicol. Program Tech. Rep. Ser. 2007, 535, 1–274.85. Zeilmaker, M.J.; Bakker, M.I.; Schothorst, R.; Slob, W. Risk Assessment of N-nitrosodimethylamine Formed Endogenously after
Fish-with-Vegetable Meals. Toxicol. Sci. 2010, 116, 323–335. [CrossRef]86. Peto, R.; Gray, R.; Brantom, P.; Grasso, P. Dose and time relationships for tumor induction in the liver and esophagus of 4080
inbred rats by chronic ingestion of N-nitrosodiethylamine or N-nitrosodimethylamine. Cancer Res. 1991, 51, 6452–6469.87. Peto, R.; Gray, R.; Brantom, P.; Grasso, P. Effects on 4080 rats of chronic ingestion of N-nitrosodiethylamine or N-
nitrosodimethylamine: A detailed dose-response study. Cancer Res. 1991, 51, 6415–6451.88. Barlow, S.; Bolger, M.; Pitt, J.I.; Verger, P. Ochratoxin A (addendum). In Safety Evaluation of Certain Contaminants in Food. Prepared
by the Sixty-Eighth Meeting of the Joint FAO/WHO Expert Committee on Food Additives (JECFA); WHO Food Additives Series 59;WHO and FAO: Geneva, Switzerland, 1989.
89. National Toxicology Program. Toxicology and Carcinogenesis Studies of Ochratoxin A (CAS No. 303-47-9) in F344/N Rats(Gavage Studies). Natl. Toxicol. Program Tech. Rep. Ser. 1989, 358, 1–142.
90. E.M.A. Public Statement on the Use of Herbal Medicinal Products Containing Pulegone and Menthofuran. EMEA/HMPC/138386/2005;European Medicines Agency: London, UK, 2016.
91. Martati, E.; Boersma, M.G.; Spenkelink, A.; Khadka, D.B.; Punt, A.; Vervoort, J.; Bladeren, P.J.; Rietjens, I.M. Physiologically basedbiokinetic (PBBK) model for safrole bioactivation and detoxification in rats. Chem. Res. Toxicol. 2011, 24, 818–834. [CrossRef]
92. Boberg, E.W.; Miller, E.C.; Miller, J.A.; Poland, A.; Liem, A. Strong evidence from studies with brachymorphic mice andpentachlorophenol that 1’-sulfoöxysafrole is the major ultimate electrophilic and carcinogenic metabolite of 1’-hydroxysafrole inmouse liver. Cancer Res. 1983, 43, 5163–5173.
93. Miller, E.C.; Swanson, A.B.; Phillips, D.H.; Fletcher, T.L.; Liem, A.; Miller, J.A. Structure-activity studies of the carcinogenicities inthe mouse and rat of some naturally occurring and synthetic alkenylbenzene derivatives related to safrole and estragole. CancerRes. 1983, 43, 1124–1134.
94. Burton, R.; Sheron, N. No level of alcohol consumption improves health. Lancet 2018, 392, 987–988. [CrossRef]95. Astrup, A.; Estruch, R. Alcohol and the global burden of disease. Lancet 2019, 393, 2390. [CrossRef]96. Room, R.; Babor, T.; Rehm, J. Alcohol and public health. Lancet 2005, 365, 519–530. [CrossRef]97. Rehm, J.; Room, R.; Monteiro, M.; Gmel, G.; Graham, K.; Rehn, N.; Sempos, C.T.; Jernigan, D. Alcohol as a risk factor for global
burden of disease. Eur. Addict. Res. 2003, 9, 157–164. [CrossRef]98. Rehm, J.; Mathers, C.; Popova, S.; Thavorncharoensap, M.; Teerawattananon, Y.; Patra, J. Global burden of disease and injury and
economic cost attributable to alcohol use and alcohol-use disorders. Lancet 2009, 373, 2223–2233. [CrossRef]
65

Nutrients 2021, 13, 3785
99. Bardach, A.E.; Alcaraz, A.O.; Ciapponi, A.; Garay, O.U.; Riviere, A.P.; Palacios, A.; Cremonte, M.; Augustovski, F. Alcoholconsumption’s attributable disease burden and cost-effectiveness of targeted public health interventions: A systematic review ofmathematical models. BMC Public Health 2019, 19, 1378. [CrossRef]
100. Babor, T.; Holder, H.; Caetano, R.; Homel, R.; Casswell, S.; Livingston, M.; Edwards, G.; Österberg, E.; Giesbrecht, N.; Rehm, J.;et al. Strategies and interventions to reduce alcohol-related harm. In Alcohol: No Ordinary Commodity; Oxford University PressInc.: New York, NY, USA, 2010; Volume 58, pp. 103–108.
101. Rehm, J.; Lachenmeier, D.W.; Llopis, E.J.; Imtiaz, S.; Anderson, P. Evidence of reducing ethanol content in beverages to reduceharmful use of alcohol. Lancet Gastroenterol. Hepatol. 2016, 1, 78–83. [CrossRef]
102. Segal, D.S.; Stockwell, T. Low alcohol alternatives: A promising strategy for reducing alcohol related harm. Int. J. Drug Policy2009, 20, 183–187. [CrossRef] [PubMed]
103. Geller, E.S.; Kalsher, M.J.; Clarke, S.W. Beer versus mixed-drink consumption at fraternity parties: A time and place for low-alcoholalternatives. J. Stud. Alcohol 1991, 52, 197–204. [CrossRef] [PubMed]
66
nutrients
Review
Alcohol and the Brain
David Nutt *, Alexandra Hayes, Leon Fonville , Rayyan Zafar, Emily O.C. Palmer , Louise Paterson
and Anne Lingford-Hughes
Citation: Nutt, D.; Hayes, A.;
Fonville, L.; Zafar, R.; Palmer, E.O.C.;
Paterson, L.; Lingford-Hughes, A.
Alcohol and the Brain. Nutrients 2021,
13, 3938. https://doi.org/10.3390/
nu13113938
Academic Editor: Peter Anderson
Received: 22 September 2021
Accepted: 2 November 2021
Published: 4 November 2021
Publisher’s Note: MDPI stays neutral
with regard to jurisdictional claims in
published maps and institutional affil-
iations.
Copyright: © 2021 by the authors.
Licensee MDPI, Basel, Switzerland.
This article is an open access article
distributed under the terms and
conditions of the Creative Commons
Attribution (CC BY) license (https://
creativecommons.org/licenses/by/
4.0/).
Neuropsychopharmacology Unit, Division of Psychiatry, Department of Brain Sciences, Hammersmith Hospital,Imperial College London, London W12 ONN, UK; [email protected] (A.H.);[email protected] (L.F.); [email protected] (R.Z.); [email protected] (E.O.C.P.);[email protected] (L.P.); [email protected] (A.L.-H.)* Correspondence: [email protected]; Tel.: +44-2075946628
Abstract: Alcohol works on the brain to produce its desired effects, e.g., sociability and intoxication,and hence the brain is an important organ for exploring subsequent harms. These come in manydifferent forms such as the consequences of damage during intoxication, e.g., from falls and fights,damage from withdrawal, damage from the toxicity of alcohol and its metabolites and altered brainstructure and function with implications for behavioral processes such as craving and addiction. Ontop of that are peripheral factors that compound brain damage such as poor diet, vitamin deficienciesleading to Wernicke-Korsakoff syndrome. Prenatal alcohol exposure can also have a profound impacton brain development and lead to irremediable changes of fetal alcohol syndrome. This chapter brieflyreviews aspects of these with a particular focus on recent brain imaging results. Cardiovascular effectsof alcohol that lead to brain pathology are not covered as they are dealt with elsewhere in the volume.
Keywords: alcohol; brain; addiction; alcoholism
Terminology describing alcohol consumption has varied over the years but generallydrinking at a level causing mental and/or physical ill health is referred to as harmful(ICD-10/11) or abuse (DSM-IV). Alcohol dependence or addiction or alcoholism is acomplex behavioral syndrome that has at its core the inability to control consumptiondespite adverse social, occupational or health consequences (ICD-10/11; DSM-IV). Morerecently DSM-5 criteria use the term alcohol use disorder (AUD) as a continuum withmild equivalent to abuse and moderate-severe equivalent to dependence [1]. Whilst mostsocial drinkers remain in control of their engagement with alcohol, a small but significantminority transition to dependence. Alcoholism is a global public health emergency withthe World Health Organization estimating prevalence of 4% and is associated with c.3 million deaths annually [2]. There is a high rate of relapse; around 80% of dependentindividuals relapse within a year with current available therapies [3]. Current adjunctivepharmacotherapies have only mild-moderate effects on alcohol consumption and relapseprevention [4,5] and no there are no rescue medications available to counteract the adverseeffects of intoxication [6]. Neuroimaging studies have revolutionized our understandingof brain neurochemistry and function in response to chronic alcohol consumption anddependence, but so far, this has not led to huge improvements in treatment availabilityor efficacy. In order to improve treatment outcomes, a detailed understanding of theneurobiological mechanisms responsible for vulnerability, relapse and successful recoveryand the identification of novel biomarkers to develop more efficacious therapeutic targetsare warranted.
1. Structural and Volumetric Changes
1.1. Structural Alterations in Adults
The link between alcohol use and cerebral atrophy goes back decades, with earlyfindings coming from post-mortem investigations [7] and subsequent in vivo examinationsof gross morphology using computerized tomography (CT) [8–10]. The emergence of
Nutrients 2021, 13, 3938. https://doi.org/10.3390/nu13113938 https://www.mdpi.com/journal/nutrients67
Nutrients 2021, 13, 3938
magnetic resonance imaging (MRI) brought vast improvements to image resolution andallowed for differentiation of brain tissue. Whilst the early CT scans pointed towardsventricular enlargement and widening of cortical sulci, MRI studies have provided a wealthof evidence towards distinct differences in grey and white matter associated with chronicalcohol use [11]. Grey matter volume loss is commonly observed in alcohol dependenceand effects are widespread across cortical and subcortical regions [12,13], though meta-analytic efforts have pointed specifically towards volume loss in the prefrontal cortex,cingulate cortex, insula, and striatum in particular [14–16]. A meta-regression analysisfurther showed that the impact on grey matter was linked to lifetime alcohol consumptionand duration of alcohol dependence [16]. Macrostructural differences can also be observedin white matter volume [17] but more importantly there are noticeable differences inmicrostructure [18], most notably in the corpus callosum, highlighting potential disruptionto myelination and axonal integrity. It should be noted that the impact of alcohol on thecerebellar structure has been relatively understudied and most MRI research has focusedon cortical and subcortical structures. The cerebellum is known to be affected in alcoholdependence, even more so in those with additional neurological complications such asWernicke-Korsakoff syndrome, and studies have found a loss of cerebellar volume thatfurther increases with age [19].
Reductions in brain volume are not necessarily irreversible and early CT studieshad already shown that brain volume appears to partially recover with abstinence fromalcohol [20,21]. Longitudinal MRI studies further showed that changes to volume follow anon-linear pattern with greater increases occurring in the early stages of abstinence [22–24].Furthermore, reducing alcohol consumption to an average of 20 drinks per month ratherthan abstaining completely was sufficient to produce increases in brain volume comparedwith those who returned to patterns of heavy drinking that matched pre-treatment levels(consuming an average of 155 drinks per month) [25]. Though evidence in white matteris limited, it does suggest a similar pattern of recovery with abstinence exists [26,27]. Aninteresting finding from longitudinal MRI studies has been that people prone to futurerelapses are distinguishable from those able to abstain [28–31], suggesting there might bebiological differences that play a role in treatment progression.
There is a longstanding notion that alcohol has an interactive effect on the biologicalaging processes, whereby the brains of alcohol dependent individuals resemble those ofchronologically older individuals who do not have alcohol dependence [32]. Imagingstudies have long found that the loss of grey matter volume as well as the disturbancesto white matter microstructure typically seen in alcohol dependence are exacerbatedwith age [10,27,33–38]. This phenomenon has also been investigated using the brain ageparadigm, an approach that investigates healthy brain aging by estimating chronologicalage from neuroimaging data and examines the difference between an individual’s predictedand actual age [39]. One study found that individuals with alcohol dependence showeda difference of up to 11.7 years between their chronological and predicted biological agebased on their grey matter volume [33]. Crucially, the difference showed a linear increasewith age and was at its greatest in old age which further offers support to the notion of agreater vulnerability to the effects of alcohol in later life.
Low levels of alcohol consumption have historically been viewed as harmless oreven beneficial due to its potentially favorable effects on cardiovascular health [40], asdescribed in more detail elsewhere in this special issue. It has been suggested a similarJ- or U-shaped relationship exists with brain structure, but only a few MRI studies havefound support for this assumption [41–43]. More recent large-scale studies of the generalpopulation have in fact shown negative linear associations between alcohol consumptionand brain structure, showing widespread reductions in grey and white matter volume aswell as white matter microstructure and cortical thickness [44–47]. Taken together, thesestudies highlight that there is no protective effect of light drinking (e.g., 1–<7 drinks perweek) over abstinence and in fact show, similar to alcohol dependence though to a lesserdegree, that any level of alcohol consumption can affect brain volume and white matter
68
Nutrients 2021, 13, 3938
microstructure. It should be noted that these are cross-sectional association studies, and itis not possible to infer causality or estimate the impact of alcohol on the brain over time.Furthermore, only a small proportion of the variance in brain structure is explained byalcohol consumption [44,46]. A study on brain age further found that only those whodrank daily or almost daily showed a difference between chronological and predicted brainage, and there were no differences in those who drank less frequently or abstained fromalcohol [48]. This suggests that whilst low levels of alcohol consumption may affect brainstructure, this may not negatively impact healthy brain aging. An important caveat tothe generalizability is the relatively small amount of large-scale imaging datasets and thefindings discussed here primarily relate to the UK BioBank dataset [44,46–48].
1.2. Structural Alterations in Adolescents
Alcohol use is typically initiated during adolescence, and studies have found thatalcohol can impact neurodevelopmental trajectories during this period. Typical brainmaturation can be characterized as a loss in grey matter density due to synaptic pruningalongside ongoing growth of white matter volume that reflects increased myelination tostrengthen surviving connections [49]. In adolescents who engage in heavy and bingedrinking, as defined by the National Institute on Alcohol Abuse and Alcoholism [50], thereis a greater decrease in grey matter volume along with an attenuated increase of whitematter volume as well as disturbances in white matter microstructure in comparison to non-drinkers [51]. These effects are found in prefrontal, cingulate, and temporal regions as wellas the corpus callosum and may reflect an acceleration of typical age-related developmentalprocesses similar to what we have described in adults with alcohol dependence. Less isknown about the dose-response mechanism, though it has been suggested moderatedrinking lies somewhere intermediate [52,53]. This would again imply that the impactof alcohol consumption on brain structure is not limited to heavy alcohol consumption.However, it has been noted there are differences in brain structure that predate alcoholinitiation and may predispose individuals to heavy alcohol use. Structural precursorshave mostly been found in the prefrontal cortex and fronto-limbic white matter and showconsiderable overlap with structural differences found in individuals with a family historyof alcohol dependence [54]. Nevertheless, there are studies that have suggested differencesare not solely attributable to familial risk [55,56], and more research is needed to betterunderstand these risk factors.
1.3. Pre-Natal Alcohol Exposure
A far more severe disruption to neurodevelopment comes from prenatal exposureto alcohol—collectively known as fetal alcohol spectrum disorders (FASD)—which canencompass cognitive deficiencies, neurobehavioral disorders, growth retardation, craniofa-cial dysmorphism, and deficits to the central nervous system including brain malforma-tions [57]. Early case studies highlighted striking morphological anomalies, most notablythinning of the corpus callosum and enlargement of ventricles, but subsequent radiologicalinvestigations have highlighted there is considerable variability in the impact of FASDon brain development [58]. Quantitative analyses of brain macrostructure in FASD haverepeatedly found lower grey and white matter volume along with increased thicknessand density of cortical grey matter [59]. Crucially, findings have found no morphologicaldifferences in the occipital lobe, suggesting that not all brain structures are affected equally.Brain phenotypes of FASD have consistently been recapitulated in animal models andhighlight the modulating role of timing and alcohol exposure [60]. Taken together, it is clearthat the teratogenic effects of alcohol on brain structure are widespread and can be seenacross the spectrum of FASD. However, understanding the link between these structuralalterations and other parameters of FASD remains an ongoing challenge.
69
Nutrients 2021, 13, 3938
1.4. Conclusion
In summary, MRI studies have offered invaluable insight into the effects of alcoholand have typically found a loss of volume and reduced myelination throughout the brain.The findings described here fit the notion that alcohol affects healthy brain aging andthis effect becomes more pronounced with higher levels of consumption. It also suggeststhat there may be a greater vulnerability to the effects of alcohol on brain health with oldage. The impact of alcohol can be observed early on, moderate to heavy drinking duringadolescence leads to observable differences to non-drinkers, but this is further confoundedby risk factors to unhealthy drinking patterns and alcohol dependence. However, thoughMRI research will be important in advancing our understanding of the impact of alcoholon the brain we cannot infer harm solely from alterations to brain structure.
2. Neurotoxic Properties of Alcohol
2.1. Thiamine Deficiency
Thiamine, also known as Vitamin B1, is an essential cofactor that is critical for nervefunction. It is required for the functioning of several enzymes responsible for carbohydrateand lipid metabolism and the generation of several essential molecules including nucleicacids and neurotransmitters [61,62]. The human body is incapable of producing thiamineitself and therefore it must be derived solely from diet. Thiamine deficiency predominantlyoccurs as a result of malnutrition, and in most western countries is most commonly (90%)associated with alcoholism [63]. Over time, thiamine deficiency can result in nerve damage,leading to alcoholic neuropathy.
Much of the calorific intake of individuals with alcoholism comes from their con-sumption of alcoholic beverages, which are generally low in nutrient content. Vitaminsupplementation in alcoholic beverages can play a role in mitigation of these deficiencies,e.g., some Danish beer brands contain vitamins (B6 in addition to thiamine) to ‘normalize’blood thiamine levels in those with alcoholic neuropathy [64]. However, individuals withalcoholism require levels of thiamine supplementation much higher than that required fromthe average diet, so control of dietary intake alone is not the whole story [61]. In additionto thiamine deficiency AUD is associated with other malnutrition and other micronutrientdeficiencies which are comprehensively reviewed by McLean et al. [65].
Alcohol use can also cause thiamine deficiency by disrupting absorption in the gas-trointestinal tract. Alcohol damages the mucosa of the gut and reduces intestinal thiaminetransport. Studies in both humans and rodents have demonstrated that thiamine is trans-ported via an active sodium independent transporter and therefore requires both energy anda normal pH level [66–68], both of which are reduced in alcoholism. Additionally, thiamineabsorption can further be depleted by diarrhoea or vomiting which are common occurrencesin alcoholism. It is also important to note that thiamine absorption in the gut can be alteredby several genetic variants that affect thiamine transport and metabolism [69].
Alcohol also hinders the ability of cells to utilize the thiamine. Thiamine requiresphosphorylation by thiamine pyrophosphokinase to be converted to its active co-enzymeform. Thiamine pyrophosphokinase is inhibited by alcohol, which also increases the rateof thiamine metabolism [63]. This phosphorylation step requires magnesium as a cofactor,which is also depleted in alcoholism [70]. Cumulatively, alcoholism leads to thiaminedeficiency via the reduction of intake, uptake, and utilization.
Chronic thiamine deficiency ultimately leads to neurotoxicity. As previously men-tioned, thiamine is an essential cofactor required for the synthesis and function of severalessential enzymes. One of these enzymes is transketolase which is required for glucosebreakdown via the pentose phosphate pathway. This pathway produces several essentialproducts. The first is Ribose-5-Phosphate which is required for the synthesis of nucleic acidsand other complex sugars. The second is nicotinamide adenine dinucleotide phosphate(NADPH) which is required in the assembly of coenzymes, steroids, fatty acids, aminoacids, neurotransmitters, and glutathione [61]. The reduction in production of these factorsin addition to thiamine deficiency interrupts the cells’ defense mechanisms, notably the
70
Nutrients 2021, 13, 3938
ability to reduce reactive oxygen species (ROS), leading to cellular damage. This damagethen triggers apoptosis (cell death). Another mechanism by which thiamine deficiencyleads to cytotoxicity is by affecting carbohydrate metabolism leading to the reduction ofthe enzyme α-Ketoglutarate Dehydrogenase, leading to mitochondrial damage, which inturn induces necrosis [61].
The brain is the most energy-utilizing organ in the body, necessitating a constantsupply of energy to function. Without the breakdown of glucose and the subsequentproduction of essential molecules, thiamine deficiency leads to brain dysfunction anddegeneration. The most extreme outcome of alcohol-induced thiamine deficiency-relatedneurotoxicity is the development of Wernicke–Korsakoff Syndrome (WKS). WKS refersto the closely associated conditions of Wernicke’s encephalopathy (WE) and Korsakoff’sPsychosis (KP). WE is an acute, but reversable condition characterized by confusion,oculomotor disturbances and ataxia [61]. However, these are all rarely seen together so ahigh index of clinical suspicion should be maintained. WE is caused by thiamine deficiencyinduced energy deficits and glutamate increases leading to cytotoxicity [63]. WE candevelop into non-reversable brain damage (KP) relating to behavior abnormalities andmemory impairments.
Both WE and KP are well characterized disorders associated with a distinct clinicaland neuropathological presentation. More broadly neurological structural and functionalconsequences of alcoholism are called alcohol-related brain damage (ARBD). Reducedcognitive functioning is prevalent in between 50% and 80% of individuals with AD [71].These deficits are often transient [72] and are not normally as severe as those observed inpatients with WE or KP [73], but instead it has been hypothesized that ARBD may evolveto KP via progressive brain damage and associated cognitive impairment [74]. Despiteindividual variations in severity, it is well established that thiamine deficiency leads toneurotoxicity with negative consequences for cognitive functioning.
2.2. Neurotoxicity of Acetaldehyde
Alcohol is metabolized to acetaldehyde, via the action of alcohol dehydrogenase(ADH), CYP2E1 and catalase. Acetaldehyde is known to be toxic active metabolite, it is im-plicated in; the induction of alcoholic cardiomyopathy [75], the development of cancers [76]and to have some neurobehavioral effects [77]. During intoxication the production of ac-etaldehyde can cause flushing, increased heart rate, dry mouth, nausea and headache [78].Notably, Acetaldehyde contributes to toxic effects of chronic alcohol on the brain leadingto neuronal degeneration [79]. Acetaldehyde induces cell damage and cytotoxicity byinducing DNA malfunction and protein adducts [78]. Additionally, this protein adductformation can also induce an immune response which can further damage tissues.
2.3. Alcohol and Neuroinflammation
In addition to thiamine-deficiency and acetaldehyde related toxicity, alcohol can alsocause damage via peripheral and neuro-inflammatory mechanisms. Studies in rodentshave demonstrated that alcohol stimulates intestinal inflammation by irritating the stomachand gut, causing the release of the nuclear protein high-mobility group box 1 (HMGB1),which subsequently activate Toll-like receptor 4 (TLR4) and makes the gut “leaky” [80].This makes alcohol and endotoxins more likely to cross the lining of the gut and travelvia the circulation to the liver. Further alcohol metabolism and increases in bacteria causethe liver to produce inflammatory factors such as pro-inflammatory cytokines [81]. Thiscumulatively increases levels of circulating pro-inflammatory cytokines which can crossthe blood brain barrier (BBB) and cause inflammation in the brain [82].
Alcohol also induces neuroinflammation via alterations in neurotransmitter levels.Alcohol is known to increase glutamate levels via the inhibition of the N-methyl-D-aspartate(NMDA) receptor [83] and its cellular action on glutamatergic neurons [84]. Elevated levelsof glutamate in a rodent binge drinking model are associated with increased microglialactivation in the hippocampus [85]. In addition, alcohol also activates the body’s main stress
71
Nutrients 2021, 13, 3938
response system, the hypothalamic–pituitary–adrenal (HPA) axis. When activated, the HPAaxis results in the release of corticotropin-releasing hormone (CRH), which acts to suppressperipheral inflammation but increases neuroinflammation via a complex regulation ofNK-cells, [81] and by potentiating NF-κB activation in the rodent prefrontal cortex [86].This combination of increased glutamate and CRH levels enhance the ability of alcohol toinduce neuroinflammation and cause subsequent tissue damage.
Alcohol can also directly induce neuroinflammation via the activation of residentneuro-immune cells (microglia and astrocytes). Microglia respond to pathogens, tissuedamage, cell death and degeneration. They can respond in a pro- or anti- inflammatoryway and depending on the type of activation will produce neurotoxic or neuroprotectivemediators [81]. Once activated, alterations in microglial gene expression can potentiallylead to increases in inflammatory mediators such as cytokines, glutamate and reactiveoxygen species (ROS). These mediators are associated with microglial-dependent neuronalloss [87]. Microglial activation is characterized not only by changes in gene expression, butalso by characteristic changes in morphology. Microglia normally survey the brain tissue ina ramified shape with several projecting processes, however once activated the processesshrink and thicken, and the cells gradually become ameboid in shape [88]. Chronic alcoholconsumption can therefore cause the de-regulation of microglial activation. This in turncan lead to degeneration of brain tissue and is likely associated with brain volume loss [46],as covered in Section 1.
Alcohol is thought to activate microglia partially via TLR4 receptors, indeed TLR4deficiency protected against alcohol induced glial activation and neurotoxicity in a rodentmodel of chronic alcohol consumption [89]. Several studies have investigated the effectof alcohol administration on microglia. Analysis of post-mortem brains of patients withAlcohol Use Disorder showed in increase in microglial markers (Iba1 and GluT5) comparedwith controls [82]. Binge alcohol administration in adolescent rats established microglialproliferation and morphological changes [90]. However, the activation was describedas only partial due to the lack of alteration alcohol had on levels of MHC-II or TNF-αexpression. Conversely, microglial activation and neurodegeneration were clearly shownin rats exposed to intermittent alcohol treatment [91]. Indeed two-photon microscopy hasbeen used to demonstrate the rapid response of microglia to even single acute alcoholexposure [92]. Microglial activation has also been investigated in response to heavy sessionintermittent drinking in rodents [93]. It has been suggested that peripheral inflammationcould be caused by stimulation of systemic monocytes and macrophages or by causinggastrointestinal mucosal injury [93]. This innate response was linked to the perpetuationof the immune cascade via microglial activation which produces neuroinflammation [94]this, in turn has been shown to affect cognitive function [93]. Initial transcriptome studiesindicated that alcohol increased levels of TSPO (18 kDa translocator protein, that is upregu-lated in activated microglia). These findings were supported by PET studies performedin baboons [95]. However, when TSPO binding was analyzed using PET in alcohol de-pendent individuals and individuals undergoing detoxification these findings were notreplicated [96,97]. Cumulatively, this evidence suggests that alcohol is clearly an activatorof microglia, and as previously described upregulation of microglial activation can resultin neurotoxicity. However, the extent of alcohol induced microglial activation may well bedependent on the extent and pattern of alcohol exposure.
2.4. Conclusion
In summary, alcohol can contribute to neurotoxicity via thiamine deficiency, metabolitetoxicity and neuroinflammation. Alcohol reduces the uptake and metabolism of thiamine,the essential co-factor without which glucose breakdown and the production of essentialmolecules cannot occur. This leads to neurotoxicity and can lead to the developmentof conditions of WE and KP. The metabolism of alcohol itself can also lead directly toneurotoxicity as the metabolite acetaldehyde is toxic and can lead to neurodegeneration.
72
Nutrients 2021, 13, 3938
Finally, alcohol can lead to neurotoxicity via the induction of both the central and peripheralimmune system, causing damaging levels of inflammation.
3. Functional Brain Changes
In addition to structural alterations, evidence suggests that chronic exposure to alcoholcan lead to functional dysregulation of key brain systems that control behaviour such asreward processing, impulse control and emotional regulation. This likely contributes tothe pathophysiology of alcohol misuse and addiction. In recent years, functional magneticresonance imaging (fMRI) has been used to probe these pathways via blood oxygenlevel dependent (BOLD) signal in the brain both at rest and during the performance ofneurocognitive tasks in an MRI scanner.
3.1. Reward Processing
The reward system is in part controlled by the dopaminergic mesolimbic pathway.Originating in the ventral tegmental area. (VTA), dopaminergic projections extend throughthe striatum and prefrontal regions of the brain. The reward system is responsible forgoal-directed behavior by means of reinforcement and responds to conventional rewardssuch as food and money, as well as all known drugs of abuse. Drugs of abuse, includingalcohol, interact with and influence this system and several fMRI paradigms have beendeveloped to probe such effects. One of the most commonly used to probe non-drug relatedreward sensitivity is the monetary incentive delay (MID) task [98], whereas to measuredrug-related reward, cue-reactivity tasks are usually employed [99]. Most commonly thesetasks consist of presenting the individual with static or video imagery of a ‘cue’, typicallydrug or related paraphernalia, however, smell and taste can also be used.
In response to alcohol-related cues, abstinent alcohol-dependent individuals demon-strate an increased BOLD signal in reward-related fronto-striatal brain regions comparedwith healthy controls, notably prefrontal cortex, ventral striatum (VS), orbitofrontal cortex(OFC) and anterior cingulate cortex (ACC), which is often associated with increased crav-ing [99]. In contrast, a blunted BOLD response to anticipation of non-drug rewards hasbeen observed in the VS and dorsal striatum (DS) [100]. Together, these findings suggestthat in alcohol dependence the reward system attributes excess salience to alcohol-relatedstimuli while simultaneously responding less to conventional rewards.
Interestingly, evidence suggests that dysregulation of the reward system in abstinentalcohol-dependent individuals can be ameliorated by pharmacological intervention. Forexample, naltrexone, a μ-opioid receptor antagonist, can attenuate the increased BOLDresponse to alcohol-related cues in the putamen and reduce risk of relapse [101].
Alcohol-related functional differences in the brain are not exclusively observedin dependent individuals. When comparing the neural response of light (consuming~0.4 drinks per day) and heavy (consuming ~5 drinks per day) drinkers to alcohol cues,light drinkers have been found to have a higher BOLD signal in VS, while heavy drinkersshow an increased BOLD signal in DS [102]. The DS response in the heavy drinkers sug-gests the initiation of a shift from experimental to compulsive alcohol use during which ashift in neural processing is thought to occur from VS to DS control [103]. However, suchcross-sectional studies are unable to establish whether such differences are prodromal orconsequential of alcohol exposure. A recent longitudinal study in adolescents showed thatblunted BOLD response to non-drug reward was predictive of subsequent problematicalcohol use [104]. Similarly, college students who transitioned from moderate (consumingless than 30 drinks per month) to heavy (consuming more than 30 drinks per month)alcohol consumption exhibited hyperactivity in the striatum, OFC, ACC and insula inresponse to alcohol-related cues compared with those whose alcohol consumption did notalter over time [105]. These results suggests that certain functional differences in rewardprocessing may predate problematic alcohol consumption.
73
Nutrients 2021, 13, 3938
3.2. Impulsivity
Impulsivity, a term used to describe a lack of inhibitory control characterized byreckless behavior in the absence of premeditation, has multiple domains including choice,trait, and response inhibition [106]. Increased impulsivity is thought to be a determinantand a consequence of alcohol use [107]. At the behavioral level, alcohol intoxication hasbeen shown to increase risky behaviors such as risky driving, criminal behavior, and sexualpromiscuity [108], whilst trait impulsivity has often been found to be increased in alcoholdependent individuals [109].
To probe impulsiveness through fMRI, response inhibition tasks are commonly used,such as the Go/no-go (GNG) task and Stop Signal Task (SST). Several longitudinal studieshave probed response inhibition in adolescent drinkers. Such studies have found thatadolescents who later transitioned into heavy drinking had lower BOLD activation atbaseline and increased activation in frontal regions when subsequently drinking heavilycompared with continuous non-drinkers [110,111]. This supports the role of impairedresponse inhibition as a risk factor rather than a consequence of alcohol consumption.
Choice impulsivity, the tendency to make choices that lead to suboptimal, immediateor risky outcomes is often measured using a delay discounting task to assess an individual’spreference for a smaller, immediate reward compared with a larger, delayed reward [112].The literature regarding the effects of alcohol on choice impulsivity is varied with findingsthat alcohol (0.7 g of alcohol/kg body weight) consumption decreased choice impulsivityin non-dependent drinkers [113], whereas another found alcohol (0.2–0.8 g of alcohol/kgbody weight) intoxication increased choice impulsivity [114]. Individuals who scoredhigher in trait impulsivity measures exhibited greater choice impulsivity than their lowertrait impulsive counterparts [115].
3.3. Emotional Regulation
Altered emotional processing has been found both during alcohol intoxication anddependence and appears to worsen as consumption increases. At the behavioral level,binge drinkers, as defined by scoring in the top third of the Alcohol Use Questionnaire(AUQ), report reduced positive mood and alcohol dependent individuals are more likelyto interpret disgusted faces as angry faces and demonstrate a bias for fear recognition infacial expressions when fearful faces are morphed with happy, surprised, sad, disgusted orangry faces [116].
The brain mechanisms of emotional regulation can be measured using imagery taskswhere participants are shown either faces expressing emotions or evocative/aversiveimages designed to evoke emotional responses. In heavy drinkers, who consume morethan 15 drinks a week, a blunted BOLD response to fearful faces in the amygdala, a regionof the brain involved in fear conditioning and stress responses, has been found to beassociated with drinking level in the previous 3 months and higher scores on an obsessive-compulsive drinking scale [117]. These findings suggest that acute intoxication diminishesone’s ability to process emotional information accurately and that this may be perpetuatedwith heavy alcohol consumption.
3.4. Resting State Functional Connectivity
Resting state functional connectivity (RSFC) is a technique that quantifies connectionsbetween brain regions based on temporal correlation of BOLD signal change. In a recent UKBioBank study of 25,378 individuals, increased within-network connectivity was identifiedwithin the default mode network (DMN) in those with higher alcohol consumption [46].The DMN is believed to be involved in the processing of self-awareness, negative emotions,and rumination, so increased connectivity within this network may infer a decreased respon-siveness to external incentives and increased rumination towards alcohol-related cues [118].
Interestingly, in abstinent alcohol-dependent individuals, RSFC was increased be-tween the amygdala and the substantia nigra/VTA and associated with increased lifetimeexposure to alcohol [119]. Such differences in abstinent individuals can suggest a pathologi-
74

Nutrients 2021, 13, 3938
cal change in brain function after chronic exposure to alcohol or a mechanism for successfulabstinence. The latter proposal is corroborated by Beck at al., 2012 [120] who found thathyperconnectivity between these regions during a cue reactivity task was associated withsuccessful maintenance of abstinence.
3.5. Conclusion
fMRI studies have allowed us to identify the effects of alcohol use and dependenceon brain function as well as vulnerability to heavy use. Typically, exposure to alcoholsensitizes the reward system to alcohol related cues, interferes with the processing ofnon-drug reward, increases impulsivity, and disrupts emotional regulation. However,the findings discussed here also highlight the variability of individual differences in thepresence and magnitude of such neurocognitive deficits which may be driven by exposure,trait factors or abstinence. Finally, an important caveat to much of the present evidenceis the generalizability of small cohort cross-sectional studies. To better characterize brainfunction and behavior following exposure to alcohol both acute and chronic, as wellas improve treatment outcome and reduce risk of relapse, it is imperative that large-scale studies with longitudinal designs are conducted. This information is critical fordevelopment of alcohol regulation and abuse prevention.
4. Neurochemical Dysfunction in Alcoholism
Neuroimaging studies have also dramatically advanced our understanding of the brain’sresponse to alcohol and the neurochemical basis of alcohol dependence. Positron emissiontomography (PET) and single photon emission computed tomography (SPECT) use radio-tracers that bind specifically to key receptors of interest, to quantify receptor location andavailability. Neurotransmitter release can also be indirectly quantified using PET, throughmeasurement of the amount of tracer that is ‘displaced’ from the receptor when endogenousneurotransmitter is released in response to a pharmacological (or other) challenge. Suchtechniques have been instrumental in the investigation of key neurotransmitter systems andidentification of molecular dysfunction in the human brain. The use of PET to study the effectsof chronic alcohol consumption has advanced our understanding of reward mechanisms,neuroadaptations resulting from chronic use that led to tolerance and withdrawal and hasidentified key regions and circuits implicated in loss of control and motivation to drink. Thissection summarizes PET studies that investigate the key neurotransmitter systems and reviewthe evidence in case-control studies (summarized in Table 1).
Table 1. Strength of evidence to show direction of effects on receptor radioligand binding in human PET imaging studies inalcohol dependence.
Receptor system Striatal D2/3 Midbrain D3 Extrastriatal D2/3 GABA-A μ-opioid CB1 SERT mGluR5
Strength ofevidence
Thickness of arrow indicates the relative strength of evidence of research in the receptor system as assessed by the author based on studiesreported in the chapter.
4.1. Dopamine
The dopamine system has been the most extensively studied neurotransmitter sys-tem in addiction and several targets in both pre- and post-synaptic locations have beenevaluated for their respective roles in alcoholism. Dopamine receptor number (availability)and dopamine release can both be measured, in receptor availability and neurotransmitterchallenge PET studies, respectively. In studies investigating receptor availability, the keytarget to date has been the dopamine D2 receptor in the striatum, primarily using the an-tagonist radiotracer [11C]Raclopride which binds selectively to both D2 and D3 dopaminereceptors (hereafter referred to as DRD2/3). Data from 7 studies with 105 alcohol depen-dent individuals and 113 healthy controls were compared in a meta-analysis, revealing an
75
Nutrients 2021, 13, 3938
overall reduction in DRD2/3 availability in the alcohol dependent group with an effect sizeof −0.78 (95% CI, −1.21, −0.35, p < 0.001) [121]. Lower DRD2/3 receptors in alcoholismin turn has been associated with decreased metabolic activity in prefrontal brain regionsnecessary for cognitive control and executive functioning, as assessed with the radiotracer[18F]Fluorodeoxyglucose (FDG) [122]. This could explain the vulnerability of such indi-viduals to both compulsive and impulsive drinking, due to disrupted self-regulation [123].Combined PET/fMRI studies have indicated that reduced striatal DRD2/3 availability wasassociated with greater frontal BOLD reactivity to alcohol-induced cues [124] indicatinga relationship with reward processing. Moreover, the severity of clinical impairment hasbeen shown to correlate with cortical hypometabolism as measured with FDG PET inalcoholism [125], providing several potential functional implications for D2 and/or D3receptor loss.
Using other dopaminergic tracers, reduced levels of DRD2/3 availability and dopaminesynthesis capacity, as measured by [18F]DMFP and [18F]DOPA, respectively, have beenshowed to be associated with increased craving and relapse [126], suggesting these re-ceptors have prognostic value and may represent a target for drug development throughupregulation of dopamine receptor function or dopaminergic transmission. To supportsuch hypotheses, Rominger et al. identified that DRD2/3 receptor numbers, as assessedwith [18F]Fallypride, recovered by 30% in individuals who successfully abstained fromalcohol at one year, to a level comparable with healthy controls [127], whereas in those thatrelapsed the DRD2/3 receptor levels did not change. [18F]Fallypride has additional utilityas it can quantify extra-striatal DRD2/3 receptors due to its very high affinity. Accordingly,studies have found lower DRD2/3 availability amongst alcohol dependent individualsin brain regions outside the striatum, such as the thalamus, insular cortex, hippocampus,and temporal cortex in comparison to matched healthy controls [123], although two otherstudies found no such difference in temporal [128] or frontal binding [129] using this tracer.
The development of novel radiotracers with greater specificity for the dopamine D3receptor allowed characterization of this subtype which has been shown in preclinicalmodels to regulate alcohol consumption. Notably, no difference in binding in the ventralstriatum or caudate or putamen was found, however, there was a significantly higherD3 receptor availability in the hypothalamus that was linked to higher lifetime use ofalcohol [130]. Preclinical imaging has identified D3 receptor antagonism as a plausibletherapeutic target to ameliorate alcoholism and its potential efficacy as an intervention iscurrently under investigation using fMRI [131] and combined PET/MR techniques [132].
PET studies using dopamine-sensitive tracers such as [11C]Raclopride have success-fully been employed to detect changes in dopamine release, demonstrating that dopamin-ergic deficits exist in alcoholism. For example, amphetamine-induced striatal dopaminerelease was found to be blunted in alcohol dependence relative to controls [133], high-lighting a lower release potential which may explain the reward-deficiency phenomenaassociated with addiction described earlier.
Dopaminergic function following chronic alcohol consumption has been extensivelyinvestigated with several targets for potential therapeutics being discovered. Whilstpromising early clinical work has identified some novel pharmacological targets that couldbe used to treat alcohol dependent individuals, further large-scale studies are required tovalidate their use and further exploration of dopaminergic dysregulation is warranted tobetter characterize the extent of pathology induced by alcoholism.
4.2. GABA
GABA is the brain’s main inhibitory neurotransmitter and alcohol acutely enhancesGABAergic neurotransmission [134]. A host of in-vivo PET imaging studies have observedan association between alcoholism and lower GABA-A receptors in the cortex (medialprefrontal, OFC, parietal, temporal, and ACC) and the cerebellum [135–138]. These studieshave found lower radiotracer binding of between 6–20% using non-subtype selectiveGABA-A receptor tracers [11C]Flumazenil PET and [123I]Iomazenil SPECT imaging in
76
Nutrients 2021, 13, 3938
alcohol dependence relative to controls. More recently, the alpha-5 subunit selectivePET tracer [11C]Ro15-4513 identified lower availability of this subunit in the nucleusaccumbens (NAc) and hippocampus in abstinent alcohol dependent individuals whencompared with matched controls [138]. A functional [18F]FDG PET study investigating thedifferential effects of a benzodiazepine challenge on cerebellar metabolism indicating thatdysregulation of GABA-A receptor may serve as a predisposing trait to alcoholism ratherthan as a result of chronic alcohol consumption: cerebellar hypo-metabolism was evident inthose with a positive family history of alcohol dependence compared with family negativehistory individuals [139].
4.3. Opioids
The opioid system is acutely involved in the reinforcing effects of alcohol. The μ-opioid receptor (MOR) binds β-endorphins and enkephalins which, in turn, increasedopamine release in the NAc [140]. [11C]Carfentanil is a PET tracer that can be used todefine MOR receptor availability and is also sensitive to endogenous endorphin release.Endorphin release in the NAc and OFC was measured in light versus heavy drinkersthrough displacement of [11C]Carfentanil following acute alcohol consumption of analcoholic drink. Changes in OFC binding correlated significantly with problematic drinkingand subjective high in heavy drinkers but not in controls [141]. In abstinent alcoholdependent individuals a greater MOR availability in the ventral striatum, as measured by[11C]Carfentanil, compared with healthy controls was correlated with a greater craving foralcohol [142]. Increased MOR binding could be due to higher receptor levels or reducedrelease of endogenous endorphins. It was later postulated that greater [11C]Carfentanilbinding could be related to reduced β-endorphins in alcoholism. Post-mortem studies havenoted a 23–51% reduction in MOR binding [143] in alcohol dependent individuals whencompared with controls. Reduced MOR binding in post-mortem tissue could be interpretedas a neuroadaptive response to alcohol-induced release of endogenous β-endorphinsin patients with severe alcohol dependence and could explain why naltrexone remainsrelatively ineffective in this subpopulation [140]. Preclinical data suggests that nalmefenecounters alcohol-induced dysregulations of the MOR/endorphin and the KOR/dynorphinsystem [141]. Drugs that antagonize these receptors, including the licensed drug naltrexonehave been found to attenuate alcohol seeking in rats and have been shown to clinicallyreduce alcohol consumption [144].
4.4. Other Neurochemical Systems
The endocannabinoid system is implicated in modulating alcohol rewards [145].Although limited in scope, one small PET study using [18F]FMPEP-d2 reported increasedcannabinoid CB1 receptor in alcohol dependence in early withdrawal [146]. A more long-term PET study found that alcohol dependence is associated with widespread reduction ofcannabinoid CB1 receptor binding in the human brain and this reduction persists at least2–4 weeks into abstinence. The correlation of reduced binding with years of alcohol abusesuggests an involvement of CB1 receptors in alcohol dependence in humans [147].
PET studies investigating the serotonin system in alcohol dependence are very limitedin number, and so a consensus opinion on their importance has not been reached. Studieshave focused on the serotonin transporter (SERT) using [11C] DASB, revealing mixedresults with some [148,149] reporting increased levels of SERT whereas others have foundno difference or reduced levels of SERT [150].
Only recently have radiotracers specific for characterizing excitatory glutamate recep-tors been developed. Early findings indicate impaired mGluR5 signaling to be involved incompulsive alcohol consumption [151]. These effects are found to be reversible following28 days of abstinence and so can be viewed as a target to aid withdrawal [152].
77
Nutrients 2021, 13, 3938
4.5. Conclusion
The dopamine, GABA and opioid systems are by far the most researched using PETand SPECT imaging techniques to measure neurochemical dysfunction in alcohol depen-dence, due to the availability of selective radiolabeled tracers for the targets of DRD2/3,GABA-A and MOR receptors, respectively. Well validated tracers for other targets such asthose in the serotonergic system do exist, but their use in alcohol dependent individuals isnot well characterized. Studies using novel radioligands to assess other receptor targets andneurochemical systems including the endocannabinoid and glutamatergic systems is lessadvanced, but a few selective tracers do exist. It must be acknowledged that PET/SPECTis somewhat limited as a technique because of its radioactivity meaning that young peopleand repeat scanning cannot be carried out. Nevertheless, PET/SPECT imaging is still theonly way to directly image neurotransmitter receptors and neurotransmitter release (whensensitive tracers are available) in the living human brain. Further studies are required toelucidate receptor changes in response to alcohol consumption and dependence across allknown neurotransmitter systems.
5. Summary
Chronic alcohol consumption is thought to contribute directly to neurotoxicity via thi-amine deficiency, metabolite toxicity and neuroinflammation, leading to the developmentof serious conditions of WE and KP, and the acceleration of neurodegeneration more gener-ally. In addition, neuroimaging of the brain in response to alcohol dependence has foundimportant structural, functional, and neurochemical differences compared with healthybrains which have shone light on possible chronic effects of alcohol consumption, revealedpotential vulnerability markers which may be of clinical relevance, identified prognosticbiomarkers associated with relapse and recovery and identified possible biomarkers fordrug development. The picture is complex with modulation of brain systems by alcoholdiffering according to the time course of the disorder, the severity and quantity of alcoholused and with an important role for family history in which genetics also plays a role. Thesometimes-contradictory findings could also be related to differences in duration of alcoholabstinence and different characteristics of patients being assessed. Another considerationfor PET and fMRI imaging studies in alcohol dependence in general is its association withsignificant cortical grey matter loss, such that in theory, certain reductions observed inreceptor availability or changes in BOLD response may in part be explained by changesin brain volume. Further effort is required to determine the interaction between corticalatrophy and the observed functional and/or neurochemical changes.
There is evidence of gender- and sex-related differences in consumption of alcohol aswell as its effects on the brain [153]. However, neuroimaging studies on the effects of alcoholuse and dependence have either excluded women or shown low female enrolment [154].Consideration of gender- and sex-related effects has also been limited, in part due to alack of power [154]. Rates of alcohol dependence have increased drastically in women andmany of the harmful health effects are more severe and occur more rapidly in women [155].This underscores the need to examine sex- and gender-related alterations on brain functionand structure in alcohol use; improving our understanding of these effects may enabletailoring of pharmacotherapeutic treatments to improve outcomes.
Another important area for further research is to determine whether alterations inbrain structure, brain function and receptor availability in alcohol dependent individualsoccur as a direct result of alcohol toxicity or whether they represent vulnerability factors forthe onset, development or persistence of problematic or dependent drinking, or whetherboth contribute to the observed changes. Larger prospective studies and those with alongitudinal design are needed to better understand trait markers that may exist prior tothe development of addiction and how they may change across the whole trajectory ofthe disorder to assess causality, and to stratify and target patients most at risk. Continuedefforts to identify suitable biological targets to reduce craving, withdrawal, increase cogni-tion and maintain abstinence for those affected are warranted because despite 30 years of
78
Nutrients 2021, 13, 3938
neuroimaging and the huge advances in technologies to understand the brain basis of alco-hol use disorder, it remains the case that, to date, only three pharmacotherapies are licensedfor alcohol dependence and only 9% of such individuals receive such treatment [156].
Funding: Some of the research reviewed here from our group was funded by the UK MRC.
Conflicts of Interest: The authors declare no conflict of interest.
References
1. Diagnostic and Statistical Manual of Mental Disorders: DSM-5TM, 5th ed.; American Psychiatric Publishing: Arlington, VA, USA,2013; p. xliv.
2. World Health Organization. Global Status Report on Alcohol and Health 2018; World Health Organization: Geneva, Switzerland, 2018.3. Weisner, C.; Matzger, H.; Kaskutas, L.A. How important is treatment? One-year outcomes of treated and untreated alcohol-
dependent individuals. Addiction 2003, 98, 901–911.4. Kranzler, H.R.; Van Kirk, J. Efficacy of naltrexone and acamprosate for alcoholism treatment: A meta-analysis. Alcohol. Clin. Exp.
Res. 2001, 25, 1335–1341. [CrossRef]5. Pettinati, H.M.; Rabinowitz, A.R. New pharmacotherapies for treating the neurobiology of alcohol and drug addiction. Psychiatry
2006, 3, 14.6. Akbar, M.; Egli, M.; Cho, Y.-E.; Song, B.-J.; Noronha, A. Medications for alcohol use disorders: An overview. Pharmacol. Ther.
2018, 185, 64–85. [CrossRef]7. Courville, C.B. Effects of Alcohol on the Nervous System of Man; San Lucas Press: Oxford, UK, 1955.8. Brewer, C.; Perrett, L. Brain damage due to alcohol consumption: An air-encephalographic, psychometric and electroencephalo-
graphic study. Br. J. Addict. 1971, 66, 170–182. [CrossRef]9. Jernigan, T.L.; Zatz, L.M.; Ahumada, A.J., Jr.; Pfefferbaum, A.; Tinklenberg, J.R.; Moses, J.A., Jr. CT measures of cerebrospinal
fluid volume in alcoholics and normal volunteers. Psychiatry Res. 1982, 7, 9–17. [CrossRef]10. Pfefferbaum, A.; Rosenbloom, M.; Crusan, K.; Jernigan, T.L. Brain CT changes in alcoholics: Effects of age and alcohol consumption.
Alcohol. Clin. Exp. Res. 1988, 12, 81–87. [CrossRef]11. Bühler, M.; Mann, K. Alcohol and the human brain: A systematic review of different neuroimaging methods. Alcohol. Clin. Exp.
Res. 2011, 35, 1771–1793. [CrossRef]12. Chye, Y.; Mackey, S.; Gutman, B.A.; Ching, C.R.; Batalla, A.; Blaine, S.; Brooks, S.; Caparelli, E.C.; Cousijn, J.; Dagher, A. Subcortical
surface morphometry in substance dependence: An ENIGMA addiction working group study. Addict. Biol. 2020, 25, e12830. [CrossRef]13. Mackey, S.; Allgaier, N.; Chaarani, B.; Spechler, P.; Orr, C.; Bunn, J.; Allen, N.B.; Alia-Klein, N.; Batalla, A.; Blaine, S. Mega-analysis
of gray matter volume in substance dependence: General and substance-specific regional effects. Am. J. Psychiatry 2019, 176,119–128. [CrossRef]
14. Li, L.; Yu, H.; Liu, Y.; Meng, Y.-j.; Li, X.-j.; Zhang, C.; Liang, S.; Li, M.-l.; Guo, W.; Deng, W. Lower regional grey matter in alcoholuse disorders: Evidence from a voxel-based meta-analysis. BMC Psychiatry 2021, 21, 1–11. [CrossRef] [PubMed]
15. Xiao, P.; Dai, Z.; Zhong, J.; Zhu, Y.; Shi, H.; Pan, P. Regional gray matter deficits in alcohol dependence: A meta-analysis ofvoxel-based morphometry studies. Drug Alcohol Depend. 2015, 153, 22–28. [CrossRef]
16. Yang, X.; Tian, F.; Zhang, H.; Zeng, J.; Chen, T.; Wang, S.; Jia, Z.; Gong, Q. Cortical and subcortical gray matter shrinkage inalcohol-use disorders: A voxel-based meta-analysis. Neurosci. Biobehav. Rev. 2016, 66, 92–103. [CrossRef] [PubMed]
17. Monnig, M.A.; Tonigan, J.S.; Yeo, R.A.; Thoma, R.J.; McCrady, B.S. White matter volume in alcohol use disorders: A meta-analysis.Addict. Biol. 2013, 18, 581–592. [CrossRef]
18. Hampton, W.H.; Hanik, I.M.; Olson, I.R. Substance abuse and white matter: Findings, limitations, and future of diffusion tensorimaging research. Drug Alcohol Depend. 2019, 197, 288–298. [CrossRef]
19. Zahr, N.M.; Pitel, A.-L.; Chanraud, S.; Sullivan, E.V. Contributions of studies on alcohol use disorders to understanding cerebellarfunction. Neuropsychol. Rev. 2010, 20, 280–289. [CrossRef] [PubMed]
20. Carlen, P.L.; Wortzman, G.; Holgate, R.; Wilkinson, D.; Rankin, J. Reversible cerebral atrophy in recently abstinent chronicalcoholics measured by computed tomography scans. Science 1978, 200, 1076–1078. [CrossRef]
21. Ishikawa, Y.; Meyer, J.S.; Tanahashi, N.; Hata, T.; Velez, M.; Fann, W.E.; Kandula, P.; Motel, K.F.; Rogers, R.L. Abstinence improvescerebral perfusion and brain volume in alcoholic neurotoxicity without Wernicke-Korsakoff syndrome. J. Cereb. Blood Flow Metab.1986, 6, 86–94. [CrossRef]
22. Durazzo, T.C.; Mon, A.; Gazdzinski, S.; Yeh, P.-H.; Meyerhoff, D.J. Serial longitudinal MRI data indicates non-linear regional graymatter volume recovery in abstinent alcohol dependent individuals. Addict. Biol. 2015, 20, 956. [CrossRef]
23. Gazdzinski, S.; Durazzo, T.C.; Meyerhoff, D.J. Temporal dynamics and determinants of whole brain tissue volume changesduring recovery from alcohol dependence. Drug Alcohol Depend. 2005, 78, 263–273. [CrossRef]
24. Zou, X.; Durazzo, T.C.; Meyerhoff, D.J. Regional brain volume changes in alcohol-dependent individuals during short-term andlong-term abstinence. Alcohol. Clin. Exp. Res. 2018, 42, 1062–1072. [CrossRef]
25. Meyerhoff, D.J.; Durazzo, T.C. Not all is lost for relapsers: Relapsers with low WHO risk drinking levels and complete abstainershave comparable regional gray matter volumes. Alcohol. Clin. Exp. Res. 2020, 44, 1479–1487. [CrossRef]
79
Nutrients 2021, 13, 3938
26. Gazdzinski, S.; Durazzo, T.C.; Mon, A.; Yeh, P.-H.; Meyerhoff, D.J. Cerebral white matter recovery in abstinent alcoholics—A multimodality magnetic resonance study. Brain 2010, 133, 1043–1053. [CrossRef]
27. Pfefferbaum, A.; Rosenbloom, M.J.; Chu, W.; Sassoon, S.A.; Rohlfing, T.; Pohl, K.M.; Zahr, N.M.; Sullivan, E.V. White matter mi-crostructural recovery with abstinence and decline with relapse in alcohol dependence interacts with normal ageing: A controlledlongitudinal DTI study. Lancet Psychiatry 2014, 1, 202–212. [CrossRef]
28. Cardenas, V.A.; Durazzo, T.C.; Gazdzinski, S.; Mon, A.; Studholme, C.; Meyerhoff, D.J. Brain morphology at entry into treatmentfor alcohol dependence is related to relapse propensity. Biol. Psychiatry 2011, 70, 561–567. [CrossRef]
29. Cardenas, V.A.; Studholme, C.; Gazdzinski, S.; Durazzo, T.C.; Meyerhoff, D.J. Deformation-based morphometry of brain changesin alcohol dependence and abstinence. Neuroimage 2007, 34, 879–887. [CrossRef]
30. Durazzo, T.C.; Mon, A.; Gazdzinski, S.; Meyerhoff, D.J. Regional brain volume changes in alcohol-dependent individuals duringearly abstinence: Associations with relapse following treatment. Addict. Biol. 2017, 22, 1416–1425. [CrossRef]
31. Zou, Y.; Murray, D.E.; Durazzo, T.C.; Schmidt, T.P.; Murray, T.A.; Meyerhoff, D.J. White matter microstructural correlates ofrelapse in alcohol dependence. Psychiatry Res. Neuroimaging 2018, 281, 92–100. [CrossRef]
32. Oscar-Bemian, M.; Schendan, H.E. Asymmetries of brain function in alcoholism: Relationship to aging. In Neurobehavior ofLanguage and Cognition; Springer: Berlin/Heidelberg, Germany, 2002; pp. 213–240.
33. Guggenmos, M.; Schmack, K.; Sekutowicz, M.; Garbusow, M.; Sebold, M.; Sommer, C.; Smolka, M.N.; Wittchen, H.-U.; Zimmer-mann, U.S.; Heinz, A. Quantitative neurobiological evidence for accelerated brain aging in alcohol dependence. Transl. Psychiatry2017, 7, 1–7. [CrossRef]
34. Pfefferbaum, A.; Adalsteinsson, E.; Sullivan, E.V. Dysmorphology and microstructural degradation of the corpus callosum:Interaction of age and alcoholism. Neurobiol. Aging 2006, 27, 994–1009. [CrossRef]
35. Pfefferbaum, A.; Lim, K.O.; Zipursky, R.B.; Mathalon, D.H.; Rosenbloom, M.J.; Lane, B.; Ha, C.N.; Sullivan, E.V. Brain gray andwhite matter volume loss accelerates with aging in chronic alcoholics: A quantitative MRI study. Alcohol. Clin. Exp. Res. 1992, 16,1078–1089. [CrossRef]
36. Sorg, S.F.; Squeglia, L.M.; Taylor, M.J.; Alhassoon, O.M.; Delano-Wood, L.M.; Grant, I. Effects of aging on frontal white mattermicrostructure in alcohol use disorder and associations with processing speed. J. Stud. Alcohol Drugs 2015, 76, 296–306. [CrossRef]
37. Sullivan, E.V.; Zahr, N.M.; Sassoon, S.A.; Thompson, W.K.; Kwon, D.; Pohl, K.M.; Pfefferbaum, A. The role of aging, drugdependence, and hepatitis C comorbidity in alcoholism cortical compromise. JAMA Psychiatry 2018, 75, 474–483. [CrossRef]
38. Thayer, R.E.; Hagerty, S.L.; Sabbineni, A.; Claus, E.D.; Hutchison, K.E.; Weiland, B.J. Negative and interactive effects of sex, aging,and alcohol abuse on gray matter morphometry. Hum. Brain Mapp. 2016, 37, 2276–2292. [CrossRef]
39. Cole, J.H.; Franke, K. Predicting age using neuroimaging: Innovative brain ageing biomarkers. Trends Neurosci. 2017, 40, 681–690.[CrossRef]
40. Kawano, Y. Physio-pathological effects of alcohol on the cardiovascular system: Its role in hypertension and cardiovasculardisease. Hypertens. Res. 2010, 33, 181–191. [CrossRef]
41. Kubota, M.; Nakazaki, S.; Hirai, S.; Saeki, N.; Yamaura, A.; Kusaka, T. Alcohol consumption and frontal lobe shrinkage: Study of1432 non-alcoholic subjects. J. Neurol. Neurosurg. Psychiatry 2001, 71, 104–106. [CrossRef]
42. McEvoy, L.K.; Fennema-Notestine, C.; Elman, J.A.; Eyler, L.T.; Franz, C.E.; Hagler, D.J., Jr.; Hatton, S.N.; Lyons, M.J.; Paniz-zon, M.S.; Dale, A.M. Alcohol intake and brain white matter in middle aged men: Microscopic and macroscopic differences.NeuroImage Clin. 2018, 18, 390–398. [CrossRef]
43. Sachdev, P.S.; Chen, X.; Wen, W.; Anstry, K.J. Light to moderate alcohol use is associated with increased cortical gray matter inmiddle-aged men: A voxel-based morphometric study. Psychiatry Res. Neuroimaging 2008, 163, 61–69. [CrossRef]
44. Daviet, R.; Aydogan, G.; Jagannathan, K.; Spilka, N.; Koellinger, P.D.; Kranzler, H.R.; Nave, G.; Wetherill, R.R. Multimodal brainimaging study of 36,678 participants reveals adverse effects of moderate drinking. bioRxiv 2021. [CrossRef]
45. Morris, V.L.; Owens, M.M.; Syan, S.K.; Petker, T.D.; Sweet, L.H.; Oshri, A.; MacKillop, J.; Amlung, M. Associations betweendrinking and cortical thickness in younger adult drinkers: Findings from the Human Connectome Project. Alcohol. Clin. Exp. Res.2019, 43, 1918–1927. [CrossRef] [PubMed]
46. Topiwala, A.; Ebmeier, K.P.; Maullin-Sapey, T.; Nichols, T.E. No safe level of alcohol consumption for brain health: Observationalcohort study of 25,378 UK Biobank participants. medRxiv 2021. [CrossRef]
47. Topiwala, A.; Allan, C.L.; Valkanova, V.; Zsoldos, E.; Filippini, N.; Sexton, C.; Mahmood, A.; Fooks, P.; Singh-Manoux, A.; Mackay,C.E. Moderate alcohol consumption as risk factor for adverse brain outcomes and cognitive decline: Longitudinal cohort study.BMJ 2017, 357, j2353. [CrossRef]
48. Ning, K.; Zhao, L.; Matloff, W.; Sun, F.; Toga, A.W. Association of relative brain age with tobacco smoking, alcohol consumption,and genetic variants. Sci. Rep. 2020, 10, 1–10. [CrossRef] [PubMed]
49. Sowell, E.R.; Thompson, P.M.; Toga, A.W. Mapping changes in the human cortex throughout the span of life. Neurosci. 2004, 10,372–392. [CrossRef]
50. National Institute on Alcohol Abuse and Alcoholism. Drinking Levels Defined. Available online: https://www.niaaa.nih.gov/alcohol-health/overview-alcohol-consumption/moderate-binge-drinking (accessed on 1 November 2021).
51. Lees, B.; Meredith, L.R.; Kirkland, A.E.; Bryant, B.E.; Squeglia, L.M. Effect of alcohol use on the adolescent brain and behavior.Pharmacol. Biochem. Behav. 2020, 192, 172906. [CrossRef]
80
Nutrients 2021, 13, 3938
52. Pfefferbaum, A.; Kwon, D.; Brumback, T.; Thompson, W.K.; Cummins, K.; Tapert, S.F.; Brown, S.A.; Colrain, I.M.; Baker, F.C.;Prouty, D. Altered brain developmental trajectories in adolescents after initiating drinking. Am. J. Psychiatry 2018, 175, 370–380.[CrossRef] [PubMed]
53. Sullivan, E.V.; Brumback, T.; Tapert, S.F.; Brown, S.A.; Baker, F.C.; Colrain, I.M.; Prouty, D.; De Bellis, M.D.; Clark, D.B.; Nagel, B.J.Disturbed cerebellar growth trajectories in adolescents who initiate alcohol drinking. Biol. Psychiatry 2020, 87, 632–644. [CrossRef]
54. Squeglia, L.M.; Cservenka, A. Adolescence and drug use vulnerability: Findings from neuroimaging. Curr. Opin. Behav. Sci. 2017,13, 164–170. [CrossRef]
55. Jones, S.A.; Nagel, B.J. Altered frontostriatal white matter microstructure is associated with familial alcoholism and future bingedrinking in adolescence. Neuropsychopharmacology 2019, 44, 1076–1083. [CrossRef]
56. Weiland, B.J.; Korycinski, S.T.; Soules, M.; Zubieta, J.-K.; Zucker, R.A.; Heitzeg, M.M. Substance abuse risk in emerging adultsassociated with smaller frontal gray matter volumes and higher externalizing behaviors. Drug Alcohol Depend. 2014, 137, 68–75.[CrossRef] [PubMed]
57. Nguyen, V.T.; Chong, S.; Tieng, Q.M.; Mardon, K.; Galloway, G.J.; Kurniawan, N.D. Radiological studies of fetal alcohol spectrumdisorders in humans and animal models: An updated comprehensive review. Magn. Reson. Imaging 2017, 43, 10–26. [CrossRef][PubMed]
58. Treit, S.; Jeffery, D.; Beaulieu, C.; Emery, D. Radiological findings on structural magnetic resonance imaging in fetal alcoholspectrum disorders and healthy controls. Alcohol. Clin. Exp. Res. 2020, 44, 455–462. [CrossRef]
59. Lebel, C.; Roussotte, F.; Sowell, E.R. Imaging the impact of prenatal alcohol exposure on the structure of the developing humanbrain. Neuropsychol. Rev. 2011, 21, 102–118. [CrossRef] [PubMed]
60. O’Leary-Moore, S.K.; Parnell, S.E.; Lipinski, R.J.; Sulik, K.K. Magnetic resonance-based imaging in animal models of fetal alcoholspectrum disorder. Neuropsychol. Rev. 2011, 21, 167–185. [CrossRef]
61. Martin, P.R.; Singleton, C.K.; Hiller-Sturmhöfel, S. The role of thiamine deficiency in alcoholic brain disease. Alcohol Res. Health2003, 27, 134.
62. Thomson, A.D. Mechanisms of vitamin deficiency in chronic alcohol misusers and the development of the Wernicke-Korsakoffsyndrome. Alcohol Alcohol. 2000, 35, 2. [CrossRef]
63. Thomson, A.D.; Marshall, E.J. The natural history and pathophysiology of Wernicke’s encephalopathy and Korsakoff’s psychosis.Alcohol Alcohol. 2006, 41, 151–158. [CrossRef]
64. Behse, F.; Buchthal, F. Alcoholic neuropathy: Clinical, electrophysiological, and biopsy findings. Ann. Neurol. Off. J. Am. Neurol.Assoc. Child Neurol. Soc. 1977, 2, 95–110. [CrossRef]
65. McLean, C.; Tapsell, L.; Grafenauer, S.; McMahon, A.T. Systematic review of nutritional interventions for people admitted tohospital for alcohol withdrawal. Nutr. Diet. 2020, 77, 76–89. [CrossRef] [PubMed]
66. Thomson, A.D.; Baker, H.; Leevy, C.M. Patterns of 35S-thiamine hydrochloride absorption in the malnourished alcoholic patient.J. Lab. Clin. Med. 1970, 76, 34–45.
67. Gastaldi, G.; Casirola, D.; Ferrari, G.; Rindi, G. Effect of chronic ethanol administration on thiamine transport in microvillousvesicles of rat small intestine. Alcohol Alcohol. 1989, 24, 83–89. [CrossRef] [PubMed]
68. Reidling, J.C.; Said, H.M. Adaptive regulation of intestinal thiamin uptake: Molecular mechanism using wild-type and transgenicmice carrying hTHTR-1 and-2 promoters. Am. J. Physiol.-Gastrointest. Liver Physiol. 2005, 288, G1127–G1134. [CrossRef] [PubMed]
69. Marcé-Grau, A.; Martí-Sánchez, L.; Baide-Mairena, H.; Ortigoza-Escobar, J.D.; Pérez-Dueñas, B. Genetic defects of thiaminetransport and metabolism: A review of clinical phenotypes, genetics, and functional studies. J. Inherit. Metab. Dis. 2019, 42,581–597. [CrossRef]
70. Traviesa, D. Magnesium deficiency: A possible cause of thiamine refractoriness in Wernicke-Korsakoff encephalopathy. J. Neurol.Neurosurg. Psychiatry 1974, 37, 959–962. [CrossRef]
71. Bates, M.E.; Bowden, S.C.; Barry, D. Neurocognitive impairment associated with alcohol use disorders: Implications for treatment.Exp. Clin. Psychopharmacol. 2002, 10, 193. [CrossRef] [PubMed]
72. Pitel, A.L.; Rivier, J.; Beaunieux, H.; Vabret, F.; Desgranges, B.; Eustache, F. Changes in the episodic memory and executivefunctions of abstinent and relapsed alcoholics over a 6-month period. Alcohol. Clin. Exp. Res. 2009, 33, 490–498. [CrossRef]
73. Oscar-Berman, M.; Marinkovic, K. Alcohol: Effects on neurobehavioral functions and the brain. Neuropsychol. Rev. 2007, 17,239–257. [CrossRef]
74. Brion, M.; Pitel, A.-L.; Beaunieux, H.; Maurage, P. Revisiting the continuum hypothesis: Toward an in-depth exploration ofexecutive functions in korsakoff syndrome. Front. Hum. Neurosci. 2014, 8, 498. [CrossRef] [PubMed]
75. Guo, R.; Ren, J. Alcohol and Acetaldehyde in Public Health: From Marvel to Menace. Int. J. Environ. Res. Public Health 2010, 7,1285–1301. [CrossRef]
76. Niemelä, O. Distribution of ethanol-induced protein adducts in vivo: Relationship to tissue injury. Free Radic. Biol. Med. 2001, 31,1533–1538. [CrossRef]
77. Quertemont, E.; Eriksson, C.J.P.; Zimatkin, S.M.; Pronko, P.S.; Diana, M.; Pisano, M.; Rodd, Z.A.; Bell, R.R.; Ward, R.J. Is Ethanol aPro-Drug? Acetaldehyde Contribution to Brain Ethanol Effects. Alcohol. Clin. Exp. Res. 2005, 29, 1514–1521. [CrossRef]
78. Eriksson, C.J.P. The Role of Acetaldehyde in the Actions of Alcohol (Update 2000). Alcohol. Clin. Exp. Res. 2001, 25, 15S–32S.[CrossRef]
81

Nutrients 2021, 13, 3938
79. Takeuchi, M.; Saito, T. Cytotoxicity of Acetaldehyde-Derived Advanced Glycation End-Products (AA-AGE) in Alcoholic-InducedNeuronal Degeneration. Alcohol. Clin. Exp. Res. 2005, 29, 220S–224S. [CrossRef] [PubMed]
80. Ferrier, L.; Bérard, F.; Debrauwer, L.; Chabo, C.; Langella, P.; Buéno, L.; Fioramonti, J. Impairment of the intestinal barrier byethanol involves enteric microflora and mast cell activation in rodents. Am. J. Pathol. 2006, 168, 1148–1154. [CrossRef] [PubMed]
81. Crews, F.T.; Sarkar, D.K.; Qin, L.; Zou, J.; Boyadjieva, N.; Vetreno, R.P. Neuroimmune function and the consequences of alcoholexposure. Alcohol Res. Curr. Rev. 2015, 37, 331.
82. He, J.; Crews, F.T. Increased MCP-1 and microglia in various regions of the human alcoholic brain. Exp. Neurol. 2008, 210, 349–358.[CrossRef] [PubMed]
83. Lovinger, D.M.; White, G.; Weight, F.F. Ethanol inhibits NMDA-activated ion current in hippocampal neurons. Science 1989, 243,1721–1724. [CrossRef]
84. Fliegel, S.; Brand, I.; Spanagel, R.; Noori, H.R. Ethanol-induced alterations of amino acids measured by in vivo microdialysis inrats: A meta-analysis. Silico Pharmacol. 2013, 1, 7. [CrossRef] [PubMed]
85. Ward, R.J.; Lallemand, F.; de Witte, P. Biochemical and neurotransmitter changes implicated in alcohol-induced brain damage inchronic or ‘binge drinking’ alcohol abuse. Alcohol Alcohol 2009, 44, 128–135. [CrossRef]
86. Munhoz, C.D.; Sorrells, S.F.; Caso, J.R.; Scavone, C.; Sapolsky, R.M. Glucocorticoids Exacerbate Lipopolysaccharide-InducedSignaling in the Frontal Cortex and Hippocampus in a Dose-Dependent Manner. J. Neurosci. 2010, 30, 13690. [CrossRef]
87. Socodato, R.; Portugal, C.C.; Canedo, T.; Domith, I.; Oliveira, N.A.; Paes-de-Carvalho, R.; Relvas, J.B.; Cossenza, M. c-Srcdeactivation by the polyphenol 3-O-caffeoylquinic acid abrogates reactive oxygen species-mediated glutamate release frommicroglia and neuronal excitotoxicity. Free Radic. Biol. Med. 2015, 79, 45–55. [CrossRef] [PubMed]
88. Henriques, J.F.; Portugal, C.C.; Canedo, T.; Relvas, J.B.; Summavielle, T.; Socodato, R. Microglia and alcohol meet at the crossroads:Microglia as critical modulators of alcohol neurotoxicity. Toxicol. Lett. 2018, 283, 21–31. [CrossRef]
89. Alfonso-Loeches, S.; Pascual-Lucas, M.; Blanco, A.M.; Sanchez-Vera, I.; Guerri, C. Pivotal Role of TLR4 Receptors in Alcohol-Induced Neuroinflammation and Brain Damage. J. Neurosci. 2010, 30, 8285–8295. [CrossRef] [PubMed]
90. McClain, J.A.; Morris, S.A.; Deeny, M.A.; Marshall, S.A.; Hayes, D.M.; Kiser, Z.M.; Nixon, K. Adolescent binge alcohol exposureinduces long-lasting partial activation of microglia. Brain Behav. Immun. 2011, 25 (Suppl. 1), S120–S128. [CrossRef] [PubMed]
91. Zhao, Y.N.; Wang, F.; Fan, Y.X.; Ping, G.F.; Yang, J.Y.; Wu, C.F. Activated microglia are implicated in cognitive deficits, neuronaldeath, and successful recovery following intermittent ethanol exposure. Behav. Brain Res. 2013, 236, 270–282. [CrossRef] [PubMed]
92. Stowell, R.D.; Majewska, A.K. Acute ethanol exposure rapidly alters cerebellar and cortical microglial physiology. Eur. J. Neurosci.2020, 54, 5834–5843. [CrossRef]
93. Ward, R.J.; Lallemand, F.; de Witte, P. Influence of adolescent heavy session drinking on the systemic and brain innate immunesystem. Alcohol Alcohol 2014, 49, 193–197. [CrossRef]
94. Qin, L.; He, J.; Hanes, R.N.; Pluzarev, O.; Hong, J.S.; Crews, F.T. Increased systemic and brain cytokine production andneuroinflammation by endotoxin following ethanol treatment. J. Neuroinflamm. 2008, 5, 10. [CrossRef]
95. Saba, W.; Goutal, S.; Auvity, S.; Kuhnast, B.; Coulon, C.; Kouyoumdjian, V.; Buvat, I.; Leroy, C.; Tournier, N. Imaging theneuroimmune response to alcohol exposure in adolescent baboons: A TSPO PET study using 18F-DPA-714. Addict. Biol. 2018, 23,1000–1009. [CrossRef]
96. Hillmer, A.T.; Sandiego, C.M.; Hannestad, J.; Angarita, G.A.; Kumar, A.; McGovern, E.M.; Huang, Y.; O’Connor, K.C.; Carson,R.E.; O’Malley, S.S.; et al. In vivo imaging of translocator protein, a marker of activated microglia, in alcohol dependence.Mol. Psychiatry 2017, 22, 1759–1766. [CrossRef]
97. Kalk, N.; Guo, Q.; Owen, D.; Cherian, R.; Erritzoe, D.; Gilmour, A.; Ribeiro, A.; McGonigle, J.; Waldman, A.; Matthews, P. De-creased hippocampal translocator protein (18 kDa) expression in alcohol dependence: A [11C] PBR28 PET study. Transl. Psychiatry2017, 7, e996. [CrossRef]
98. Knutson, B.; Adams, C.M.; Fong, G.W.; Hommer, D. Anticipation of increasing monetary reward selectively recruits nucleusaccumbens. J. Neurosci. 2001, 21, RC159. [CrossRef]
99. Courtney, K.E.; Schacht, J.P.; Hutchison, K.; Roche, D.J.; Ray, L.A. Neural substrates of cue reactivity: Association with treatmentoutcomes and relapse. Addict. Biol. 2016, 21, 3–22. [CrossRef] [PubMed]
100. Luijten, M.; Schellekens, A.F.; Kühn, S.; Machielse, M.W.; Sescousse, G. Disruption of reward processing in addiction: Animage-based meta-analysis of functional magnetic resonance imaging studies. JAMA Psychiatry 2017, 74, 387–398. [CrossRef]
101. Bach, P.; Weil, G.; Pompili, E.; Hoffmann, S.; Hermann, D.; Vollstädt-Klein, S.; Mann, K.; Perez-Ramirez, U.; Moratal, D.; Canals,S. Incubation of neural alcohol cue reactivity after withdrawal and its blockade by naltrexone. Addict. Biol. 2020, 25, e12717.[CrossRef] [PubMed]
102. Vollstädt-Klein, S.; Wichert, S.; Rabinstein, J.; Bühler, M.; Klein, O.; Ende, G.; Hermann, D.; Mann, K. Initial, habitual andcompulsive alcohol use is characterized by a shift of cue processing from ventral to dorsal striatum. Addiction 2010, 105, 1741–1749.[CrossRef] [PubMed]
103. Everitt, B.J.; Robbins, T.W. Neural systems of reinforcement for drug addiction: From actions to habits to compulsion. Nat. Neurosci.2005, 8, 1481–1489. [CrossRef]
104. Büchel, C.; Peters, J.; Banaschewski, T.; Bokde, A.L.; Bromberg, U.; Conrod, P.J.; Flor, H.; Papadopoulos, D.; Garavan, H.; Gowland,P. Blunted ventral striatal responses to anticipated rewards foreshadow problematic drug use in novelty-seeking adolescents.Nat. Commun. 2017, 8, 1–11. [CrossRef]
82
Nutrients 2021, 13, 3938
105. Dager, A.D.; Anderson, B.M.; Rosen, R.; Khadka, S.; Sawyer, B.; Jiantonio-Kelly, R.E.; Austad, C.S.; Raskin, S.A.; Tennen, H.;Wood, R.M. Functional magnetic resonance imaging (fMRI) response to alcohol pictures predicts subsequent transition to heavydrinking in college students. Addiction 2014, 109, 585–595. [CrossRef] [PubMed]
106. Mitchell, M.R.; Potenza, M.N. Recent insights into the neurobiology of impulsivity. Curr. Addict. Rep. 2014, 1, 309–319. [CrossRef]107. De Wit, H. Impulsivity as a determinant and consequence of drug use: A review of underlying processes. Addict. Biol. 2009, 14,
22–31. [CrossRef]108. Leigh, B.C. Peril, chance, adventure: Concepts of risk, alcohol use and risky behavior in young adults. Addiction 1999, 94, 371–383.
[CrossRef]109. Taylor, E.M.; Murphy, A.; Boyapati, V.; Ersche, K.D.; Flechais, R.; Kuchibatla, S.; McGonigle, J.; Metastasio, A.; Nestor, L.; Orban,
C. Impulsivity in abstinent alcohol and polydrug dependence: A multidimensional approach. Psychopharmacology 2016, 233,1487–1499. [CrossRef]
110. Norman, A.L.; Pulido, C.; Squeglia, L.M.; Spadoni, A.D.; Paulus, M.P.; Tapert, S.F. Neural activation during inhibition predictsinitiation of substance use in adolescence. Drug Alcohol Depend. 2011, 119, 216–223. [CrossRef]
111. Wetherill, R.R.; Squeglia, L.M.; Yang, T.T.; Tapert, S.F. A longitudinal examination of adolescent response inhibition: Neuraldifferences before and after the initiation of heavy drinking. Psychopharmacology 2013, 230, 663–671. [CrossRef] [PubMed]
112. Kirby, K.N.; Marakovic, N.N. Delay-discounting probabilistic rewards: Rates decrease as amounts increase. Psychon. Bull. Rev.1996, 3, 100–104. [CrossRef] [PubMed]
113. Ortner, C.N.; MacDonald, T.K.; Olmstead, M.C. Alcohol intoxication reduces impulsivity in the delay-discounting paradigm.Alcohol Alcohol. 2003, 38, 151–156. [CrossRef]
114. Dougherty, D.M.; Marsh-Richard, D.M.; Hatzis, E.S.; Nouvion, S.O.; Mathias, C.W. A test of alcohol dose effects on multiplebehavioral measures of impulsivity. Drug Alcohol Depend. 2008, 96, 111–120. [CrossRef]
115. McCarthy, D.M.; Niculete, M.E.; Treloar, H.R.; Morris, D.H.; Bartholow, B.D. Acute alcohol effects on impulsivity: Associationswith drinking and driving behavior. Addiction 2012, 107, 2109–2114. [CrossRef] [PubMed]
116. Herman, A.M.; Duka, T. Facets of impulsivity and alcohol use: What role do emotions play? Neurosci. Biobehav. Rev. 2019, 106,202–216. [CrossRef] [PubMed]
117. Gowin, J.L.; Vatsalya, V.; Westman, J.G.; Schwandt, M.L.; Bartlett, S.; Heilig, M.; Momenan, R.; Ramchandani, V.A. The effect ofvarenicline on the neural processing of fearful faces and the subjective effects of alcohol in heavy drinkers. Alcohol. Clin. Exp. Res.2016, 40, 979–987. [CrossRef] [PubMed]
118. Zhang, R.; Volkow, N.D. Brain default-mode network dysfunction in addiction. Neuroimage 2019, 200, 313–331. [CrossRef][PubMed]
119. Orban, C.; McGonigle, J.; Flechais, R.S.; Paterson, L.M.; Elliott, R.; Erritzoe, D.; Ersche, K.D.; Murphy, A.; Nestor, L.J.; Passetti, F.Chronic alcohol exposure differentially modulates structural and functional properties of amygdala: A cross-sectional study.Addict. Biol. 2021, 26, e12980. [CrossRef]
120. Beck, A.; Wüstenberg, T.; Genauck, A.; Wrase, J.; Schlagenhauf, F.; Smolka, M.N.; Mann, K.; Heinz, A. Effect of brain structure,brain function, and brain connectivity on relapse in alcohol-dependent patients. Arch. Gen. Psychiatry 2012, 69, 842–852. [CrossRef]
121. Erritzoe, D.; Zafar, R.; Nutt, D. Meta-analysis and systematic review of the dopamine DRD2/3 receptors in Addiction. Manuscriptin prep.
122. Volkow, N.D.; Wang, G.-J.; Telang, F.; Fowler, J.S.; Logan, J.; Jayne, M.; Ma, Y.; Pradhan, K.; Wong, C. Profound decreases indopamine release in striatum in detoxified alcoholics: Possible orbitofrontal involvement. J. Neurosci. 2007, 27, 12700–12706.[CrossRef] [PubMed]
123. Volkow, N.D.; Wiers, C.E.; Shokri-Kojori, E.; Tomasi, D.; Wang, G.-J.; Baler, R. Neurochemical and metabolic effects of acuteand chronic alcohol in the human brain: Studies with positron emission tomography. Neuropharmacology 2017, 122, 175–188.[CrossRef]
124. Heinz, A.; Siessmeier, T.; Wrase, J.; Hermann, D.; Klein, S.; Grüsser-Sinopoli, S.M.; Flor, H.; Braus, D.F.; Buchholz, H.G.; Gründer,G. Correlation between dopamine D2 receptors in the ventral striatum and central processing of alcohol cues and craving. Am. J.Psychiatry 2004, 161, 1783–1789. [CrossRef]
125. Gilman, S.; Adams, K.M.; Johnson-Greene, D.; Koeppe, R.A.; Junck, L.; Kluin, K.J.; Martorello, S.; Heumann, M.; Hill, E. Effects ofdisulfiram on positron emission tomography and neuropsychological studies in severe chronic alcoholism. Alcohol. Clin. Exp. Res.1996, 20, 1456–1461. [CrossRef] [PubMed]
126. Heinz, A.; Siessmeier, T.; Wrase, J.; Buchholz, H.G.; Gründer, G.; Kumakura, Y.; Cumming, P.; Schreckenberger, M.; Smolka, M.N.;Rösch, F. Correlation of alcohol craving with striatal dopamine synthesis capacity and D2/3 receptor availability: A combined[18F] DOPA and [18F] DMFP PET study in detoxified alcoholic patients. Am. J. Psychiatry 2005, 162, 1515–1520. [CrossRef]
127. Rominger, A.; Cumming, P.; Xiong, G.; Koller, G.; Böning, G.; Wulff, M.; Zwergal, A.; Förster, S.; Reilhac, A.; Munk, O. [18F]fallypride PET measurement of striatal and extrastriatal dopamine D2/3 receptor availability in recently abstinent alcoholics.Addict. Biol. 2012, 17, 490–503. [CrossRef] [PubMed]
128. Repo, E.; Kuikka, J.T.; Bergström, K.A.; Karhu, J.; Hiltunen, J.; Tiihonen, J.; Kuikka, J. Dopamine transporter and D2-receptordensity in late-onset alcoholism. Psychopharmacology 1999, 147, 314–318. [CrossRef]
129. Narendran, R.; Mason, N.S.; Paris, J.; Himes, M.L.; Douaihy, A.B.; Frankle, W.G. Decreased prefrontal cortical dopaminetransmission in alcoholism. Am. J. Psychiatry 2014, 171, 881–888. [CrossRef] [PubMed]
83
Nutrients 2021, 13, 3938
130. Erritzoe, D.; Tziortzi, A.; Bargiela, D.; Colasanti, A.; Searle, G.E.; Gunn, R.N.; Beaver, J.D.; Waldman, A.; Nutt, D.J.; Bani, M.In vivo imaging of cerebral dopamine D3 receptors in alcoholism. Neuropsychopharmacology 2014, 39, 1703–1712. [CrossRef]
131. Murphy, A.; Nestor, L.J.; McGonigle, J.; Paterson, L.; Boyapati, V.; Ersche, K.D.; Flechais, R.; Kuchibatla, S.; Metastasio, A.; Orban,C. Acute D3 antagonist GSK598809 selectively enhances neural response during monetary reward anticipation in drug andalcohol dependence. Neuropsychopharmacology 2017, 42, 1049–1057. [CrossRef] [PubMed]
132. Zafar, R.; Wall, M.; Erritzoe, D.; Nutt, D. Role of D3 Receptor antagonism in alcohol dependence: A combined PET/MRIinvestigation. Manuscript in prep.
133. Martinez, D.; Gil, R.; Slifstein, M.; Hwang, D.-R.; Huang, Y.; Perez, A.; Kegeles, L.; Talbot, P.; Evans, S.; Krystal, J. Alcohol dependenceis associated with blunted dopamine transmission in the ventral striatum. Biol. Psychiatry 2005, 58, 779–786. [CrossRef]
134. Begleiter, H.; Porjesz, B. What is inherited in the predisposition toward alcoholism? A proposed model. Alcohol. Clin. Exp. Res.1999, 23, 1125–1135. [CrossRef] [PubMed]
135. Abi-Dargham, A.; Krystal, J.H.; Anjilvel, S.; Scanley, B.E.; Zoghbi, S.; Baldwin, R.M.; Rajeevan, N.; Ellis, S.; Petrakis, I.L.; Seibyl, J.P.Alterations of benzodiazepine receptors in type II alcoholic subjects measured with SPECT and [123I] iomazenil. Am. J. Psychiatry1998, 155, 1550–1555. [CrossRef]
136. Lingford-Hughes, A.R.; Acton, P.; Gacinovic, S.; Suckling, J.; Busatto, G.; Boddington, S.; Bullmore, E.; Woodruff, P.; Costa, D.;Pilowsky, L. Reduced levels of GABA-benzodiazepine receptor in alcohol dependency in the absence of grey matter atrophy. Br. J.Psychiatry 1998, 173, 116–122. [CrossRef] [PubMed]
137. Lingford-Hughes, A.; Wilson, S.; Cunningham, V.J.; Feeney, A.; Stevenson, B.; Brooks, D.; Nutt, D.J. GABA-benzodiazepinereceptor function in alcohol dependence: A combined 11 C-flumazenil PET and pharmacodynamic study. Psychopharmacology2005, 180, 595–606. [CrossRef]
138. Lingford-Hughes, A.; Reid, A.G.; Myers, J.; Feeney, A.; Hammers, A.; Taylor, L.G.; Rosso, L.; Turkheimer, F.; Brooks, D.J.; Grasby,P. A [11C] Ro15 4513 PET study suggests that alcohol dependence in man is associated with reduced α5 benzodiazepine receptorsin limbic regions. J. Psychopharmacol. 2012, 26, 273–281. [CrossRef] [PubMed]
139. Volkow, N.D.; Wang, G.J.; Begleiter, H.; Hitzemann, R.; Pappas, N.; Burr, G.; Pascani, K.; Wong, C.; Fowler, J.S.; Wolf, A.P. Regionalbrain metabolic response to lorazepam in subjects at risk for alcoholism. Alcohol. Clin. Exp. Res. 1995, 19, 510–516. [CrossRef] [PubMed]
140. Weerts, E.M.; Wand, G.S.; Kuwabara, H.; Munro, C.A.; Dannals, R.F.; Hilton, J.; Frost, J.J.; McCaul, M.E. Positron emissiontomography imaging of mu-and delta-opioid receptor binding in alcohol-dependent and healthy control subjects. Alcohol. Clin.Exp. Res. 2011, 35, 2162–2173. [CrossRef]
141. Mitchell, J.M.; O’Neil, J.P.; Janabi, M.; Marks, S.M.; Jagust, W.J.; Fields, H.L. Alcohol consumption induces endogenous opioidrelease in the human orbitofrontal cortex and nucleus accumbens. Sci. Transl. Med. 2012, 4, 116ra116. [CrossRef] [PubMed]
142. Heinz, A.; Reimold, M.; Wrase, J.; Hermann, D.; Croissant, B.; Mundle, G.; Dohmen, B.M.; Braus, D.H.; Schumann, G.; Machulla,H.-J. Correlation of stable elevations in striatal μ-opioid receptor availability in detoxified alcoholic patients with alcohol craving:A positron emission tomography study using carbon 11–labeled carfentanil. Arch. Gen. Psychiatry 2005, 62, 57–64. [CrossRef]
143. Hermann, D.; Hirth, N.; Reimold, M.; Batra, A.; Smolka, M.N.; Hoffmann, S.; Kiefer, F.; Noori, H.R.; Sommer, W.H.; Reischl, G.Low μ-opioid receptor status in alcohol dependence identified by combined positron emission tomography and post-mortembrain analysis. Neuropsychopharmacology 2017, 42, 606–614. [CrossRef]
144. Mann, K.; Torup, L.; Sørensen, P.; Gual, A.; Swift, R.; Walker, B.; van den Brink, W. Nalmefene for the management of alcohol de-pendence: Review on its pharmacology, mechanism of action and meta-analysis on its clinical efficacy. Eur. Neuropsychopharmacol.2016, 26, 1941–1949. [CrossRef]
145. Parsons, L.H.; Hurd, Y.L. Endocannabinoid signalling in reward and addiction. Nat. Rev. Neurosci. 2015, 16, 579–594. [CrossRef][PubMed]
146. Neumeister, A.; Normandin, M.D.; Murrough, J.W.; Henry, S.; Bailey, C.R.; Luckenbaugh, D.A.; Tuit, K.; Zheng, M.Q.; Galatzer-Levy, I.R.; Sinha, R. Positron emission tomography shows elevated cannabinoid CB 1 receptor binding in men with alcoholdependence. Alcohol. Clin. Exp. Res. 2012, 36, 2104–2109. [CrossRef]
147. Hirvonen, J.; Zanotti-Fregonara, P.; Umhau, J.C.; George, D.T.; Rallis-Frutos, D.; Lyoo, C.H.; Li, C.-T.; Hines, C.S.; Sun, H.;Terry, G.E. Reduced cannabinoid CB 1 receptor binding in alcohol dependence measured with positron emission tomography.Mol. Psychiatry 2013, 18, 916–921. [CrossRef]
148. Brown, A.K.; George, D.T.; Fujita, M.; Liow, J.S.; Ichise, M.; Hibbeln, J.; Ghose, S.; Sangare, J.; Hommer, D.; Innis, R.B. PET [11C]DASB imaging of serotonin transporters in patients with alcoholism. Alcohol. Clin. Exp. Res. 2007, 31, 28–32. [CrossRef] [PubMed]
149. Szabo, Z.; Owonikoko, T.; Peyrot, M.; Varga, J.; Mathews, W.B.; Ravert, H.T.; Dannals, R.F.; Wand, G. Positron emissiontomography imaging of the serotonin transporter in subjects with a history of alcoholism. Biol. Psychiatry 2004, 55, 766–771.[CrossRef] [PubMed]
150. Martinez, D.; Slifstein, M.; Gil, R.; Hwang, D.-R.; Huang, Y.; Perez, A.; Frankle, W.G.; Laruelle, M.; Krystal, J.; Abi-Dargham, A.Positron emission tomography imaging of the serotonin transporter and 5-HT1A receptor in alcohol dependence. Biol. Psychiatry2009, 65, 175–180. [CrossRef] [PubMed]
151. Kumar, J.; Ismail, Z.; Hatta, N.H.; Baharuddin, N.; Hapidin, H.; Get Bee, Y.-T.; Yap, E.; Pakri Mohamed, R.M. Alcohol addiction-metabotropic glutamate receptor subtype 5 and its Ligands: How They All Come Together? Curr. Drug Targets 2018, 19, 907–915.[CrossRef] [PubMed]
84

Nutrients 2021, 13, 3938
152. Akkus, F.; Mihov, Y.; Treyer, V.; Ametamey, S.M.; Johayem, A.; Senn, S.; Rösner, S.; Buck, A.; Hasler, G. Metabotropic glutamatereceptor 5 binding in male patients with alcohol use disorder. Transl. Psychiatry 2018, 8, 1–8. [CrossRef]
153. Erol, A.; Karpyak, V.M. Sex and gender-related differences in alcohol use and its consequences: Contemporary knowledge andfuture research considerations. Drug Alcohol Depend. 2015, 156, 1–13. [CrossRef]
154. Verplaetse, T.L.; Cosgrove, K.P.; Tanabe, J.; McKee, S.A. Sex/gender differences in brain function and structure in alcohol use:A narrative review of neuroimaging findings over the last 10 years. J. Neurosci. Res. 2021, 99, 309–323. [CrossRef]
155. McCaul, M.E.; Roach, D.; Hasin, D.S.; Weisner, C.; Chang, G.; Sinha, R. Alcohol and women: A brief overview. Alcohol. Clin. Exp.Res. 2019, 43, 774. [CrossRef]
156. Fairbanks, J.; Umbreit, A.; Kolla, B.P.; Karpyak, V.M.; Schneekloth, T.D.; Loukianova, L.L.; Sinha, S. Evidence-based pharma-cotherapies for alcohol use disorder: Clinical pearls. In Mayo Clinic Proceedings; Elsevier: Amsterdam, The Netherlands, 2020;pp. 1964–1977.
85

nutrients
Review
Alcohol’s Impact on the Fetus
Svetlana Popova 1,2,3,4,*, Danijela Dozet 1,4, Kevin Shield 1,2, Jürgen Rehm 1,2,4,5,6,7 and Larry Burd 8
Citation: Popova, S.; Dozet, D.;
Shield, K.; Rehm, J.; Burd, L.
Alcohol’s Impact on the Fetus.
Nutrients 2021, 13, 3452. https://
doi.org/10.3390/nu13103452
Academic Editor: Peter Anderson
Received: 9 August 2021
Accepted: 27 September 2021
Published: 29 September 2021
Publisher’s Note: MDPI stays neutral
with regard to jurisdictional claims in
published maps and institutional affil-
iations.
Copyright: © 2021 by the authors.
Licensee MDPI, Basel, Switzerland.
This article is an open access article
distributed under the terms and
conditions of the Creative Commons
Attribution (CC BY) license (https://
creativecommons.org/licenses/by/
4.0/).
1 Institute for Mental Health Policy Research, Centre for Addiction and Mental Health,33 Ursula Franklin Street, Toronto, ON M5S 2S1, Canada; [email protected] (D.D.);[email protected] (K.S.); [email protected] (J.R.)
2 Dalla Lana School of Public Health, University of Toronto, 155 College Street, Toronto, ON M5T 3M7, Canada3 Factor-Inwentash Faculty of Social Work, University of Toronto, 246 Bloor Street W,
Toronto, ON M5S 1V4, Canada4 Institute of Medical Science, Faculty of Medicine, Medical Sciences Building, University of Toronto,
1 King’s College Circle, Toronto, ON M5S 1A8, Canada5 Institute of Clinical Psychology and Psychotherapy & Center of Clinical Epidemiology and Longitudinal
Studies, Technische Universität Dresden, Chemnitzer Street 46, 01187 Dresden, Germany6 Department of Psychiatry, University of Toronto, 250 College Street, Toronto, ON M5T 1R8, Canada7 Department of International Health Projects, Institute for Leadership and Health Management,
I.M. Sechenov First Moscow State Medical University, Trubetskaya Street, 8, b. 2, 119992 Moscow, Russia8 Department of Pediatrics, University of North Dakota School of Medicine and Health Sciences,
1301 N Columbia Rd., Grand Forks, ND 58202, USA; [email protected]* Correspondence: [email protected]; Tel.: +1-(416)-535-8501 (ext. 34558)
Abstract: Background: Alcohol is a teratogen and prenatal exposure may adversely impact thedeveloping fetus, increasing risk for negative outcomes, including Fetal Alcohol Spectrum Disorder(FASD). Global trends of increasing alcohol use among women of childbearing age due to economicdevelopment, changing gender roles, increased availability of alcohol, peer pressure and social ac-ceptability of women’s alcohol use may put an increasing number of pregnancies at risk for prenatalalcohol exposure (PAE). This risk has been exacerbated by the ongoing COVID-19 pandemic in somecountries. Method: This literature review presents an overview on the epidemiology of alcohol useamong childbearing age and pregnant women and FASD by World Health Organization regions;impact of PAE on fetal health, including FASD; associated comorbidities; and social outcomes. Re-sults/Conclusion: The impact of alcohol on fetal health and social outcomes later in life is enormous,placing a huge economic burden on countries. Prevention of prenatal alcohol exposure and earlyidentification of affected individuals should be a global public health priority.
Keywords: alcohol; fetal; fetal alcohol spectrum disorder; morbidity; mortality; pregnancy
1. Introduction
Alcohol consumption can harm not only the person consuming alcohol, but also totheir family, friends and community. Alcohol use during pregnancy is one of the examplesof “harm to others”—to the developing fetus. Alcohol has been a well-established teratogenfor many years and may adversely impact the developing fetus, increasing risk for manyadverse outcomes, including Fetal Alcohol Spectrum Disorder (FASD).
Alcohol use is increasing at an alarming rate among women globally, particularlyamong women of childbearing age (15–49 years) and pregnant women [1–5]. Alcoholconsumption has increased in terms of the prevalence of current drinkers [4], and in thevolume and frequency of drinking among drinkers [5], as well as the lowering of theage of initiation for alcohol use [3]. Though a global assessment of alcohol use amongpregnant women during the pandemic has yet to be conducted, there is some evidenceto suggest that the COVID-19 pandemic has been associated with increased alcohol useamong women of childbearing age in some countries [6–8]. Higher than usual rates ofalcohol use, combined with unplanned pregnancies, places many pregnancies at increased
Nutrients 2021, 13, 3452. https://doi.org/10.3390/nu13103452 https://www.mdpi.com/journal/nutrients87

Nutrients 2021, 13, 3452
risk of alcohol exposure and therefore, many infants at risk of harm [9]. Changes tosubstance use during the pandemic may be mediated by mental health status; for example,pregnant women’s psychological distress in the United States was predictive of the numberof substances they used [10], whereas a Canadian study found no such association [11].This article will overview epidemiology of alcohol use among childbearing and pregnantwomen, FASD in general and special sub-populations as well as the impact of alcohol onthe fetus.
1.1. Alcohol Use among Childbearing-Aged Women
Based on data from the World Health Organization’s (WHO) 2018 Global InformationSystem on Alcohol and Health [4], global adult per capita consumption of alcohol (APC)among women of childbearing age was estimated to be 2.3 L in 2016. Worldwide, APCamong women of childbearing age varies, ranging from as low as 0.1 L in the EasternMediterranean Region to as high as 4.6 L in the European Region. Countries with high-income economies reported the greatest APC (4.5 L), followed by upper-middle-incomeeconomies (2.7 L), lower-middle-income economies (1.5 L), and low-income economies(1.2 L) (see Table 1).
Table 1. Adult per capita consumption and the prevalence of current drinking, former drinking, lifetime abstention, and heavy episodicdrinking among women of childbearing age (15 to 49 years of age) in 2016.
RegionsPer Capita
Consumption (Litres)
Prevalence (%)
CurrentDrinking
FormerDrinking
LifetimeAbstention
Heavy EpisodicDrinking
Global 2.3 32.1 56.7 11.3 8.7
WHO regions
African 2.1 21.7 69.4 9.0 7.6
America 3.1 42.9 25.0 32.0 10.5
Eastern Mediterranean 0.1 1.3 97.8 0.9 0.1
European 4.6 53.9 30.3 15.9 18.7
South-East Asia 1.4 22.5 70.5 7.0 5.2
Western Pacific 2.8 42.7 49.6 7.6 10.7
World Bank regions
Low-income economies 1.2 17.4 73.8 8.8 5.5
Lower-middle-income economies 1.5 20.6 71.3 8.1 5.0
Upper-middle-income economies 2.7 37.6 50.7 11.8 10.4
High-income economies 4.5 60.7 18.4 20.9 17.3
Source: The Global Information System on Alcohol and Health [12].
Globally, in 2016, 32.1% of women of childbearing age consumed alcohol. The preva-lence of current drinking among childbearing-aged women was lowest in the EasternMediterranean Region (1.3%) and highest in the European Region (53.9%) [4].
Worldwide, approximately 8.7% of women of childbearing age engaged in heavyepisodic drinking (HED), defined as consuming at least 60 g of pure alcohol on at leastone occasion in the past 30 days [4]. The definition of what constitutes a standard drinkvaries: in the United States, a standard drink contains 14 g of pure alcohol, but in Europe, astandard drink contains approximately 10 g of alcohol.
Among women of childbearing age who drink, the prevalence of HED was lowest in theEastern Mediterranean Region (0.1%) and highest in the European Region (18.7%). Amongchildbearing-aged women who drink, the prevalence of HED was highest in countries withhigh-income economies (60.7% and 17.3%, respectively), followed by upper-middle-income
88
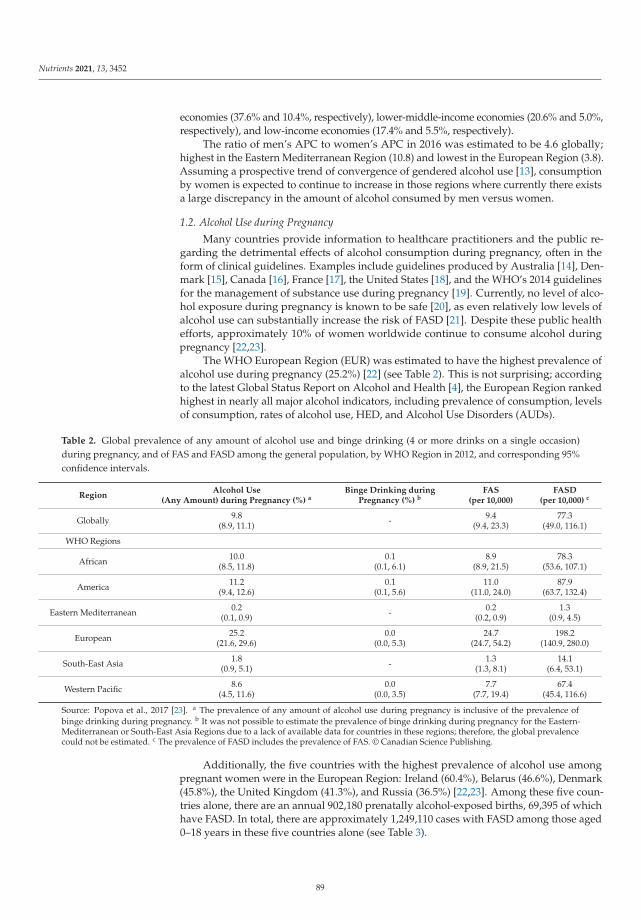
Nutrients 2021, 13, 3452
economies (37.6% and 10.4%, respectively), lower-middle-income economies (20.6% and 5.0%,respectively), and low-income economies (17.4% and 5.5%, respectively).
The ratio of men’s APC to women’s APC in 2016 was estimated to be 4.6 globally;highest in the Eastern Mediterranean Region (10.8) and lowest in the European Region (3.8).Assuming a prospective trend of convergence of gendered alcohol use [13], consumptionby women is expected to continue to increase in those regions where currently there existsa large discrepancy in the amount of alcohol consumed by men versus women.
1.2. Alcohol Use during Pregnancy
Many countries provide information to healthcare practitioners and the public re-garding the detrimental effects of alcohol consumption during pregnancy, often in theform of clinical guidelines. Examples include guidelines produced by Australia [14], Den-mark [15], Canada [16], France [17], the United States [18], and the WHO’s 2014 guidelinesfor the management of substance use during pregnancy [19]. Currently, no level of alco-hol exposure during pregnancy is known to be safe [20], as even relatively low levels ofalcohol use can substantially increase the risk of FASD [21]. Despite these public healthefforts, approximately 10% of women worldwide continue to consume alcohol duringpregnancy [22,23].
The WHO European Region (EUR) was estimated to have the highest prevalence ofalcohol use during pregnancy (25.2%) [22] (see Table 2). This is not surprising; accordingto the latest Global Status Report on Alcohol and Health [4], the European Region rankedhighest in nearly all major alcohol indicators, including prevalence of consumption, levelsof consumption, rates of alcohol use, HED, and Alcohol Use Disorders (AUDs).
Table 2. Global prevalence of any amount of alcohol use and binge drinking (4 or more drinks on a single occasion)during pregnancy, and of FAS and FASD among the general population, by WHO Region in 2012, and corresponding 95%confidence intervals.
RegionAlcohol Use
(Any Amount) during Pregnancy (%) aBinge Drinking during
Pregnancy (%) bFAS
(per 10,000)FASD
(per 10,000) c
Globally 9.8(8.9, 11.1) - 9.4
(9.4, 23.3)77.3
(49.0, 116.1)
WHO Regions
African 10.0(8.5, 11.8)
0.1(0.1, 6.1)
8.9(8.9, 21.5)
78.3(53.6, 107.1)
America 11.2(9.4, 12.6)
0.1(0.1, 5.6)
11.0(11.0, 24.0)
87.9(63.7, 132.4)
Eastern Mediterranean 0.2(0.1, 0.9) - 0.2
(0.2, 0.9)1.3
(0.9, 4.5)
European 25.2(21.6, 29.6)
0.0(0.0, 5.3)
24.7(24.7, 54.2)
198.2(140.9, 280.0)
South-East Asia 1.8(0.9, 5.1) - 1.3
(1.3, 8.1)14.1
(6.4, 53.1)
Western Pacific 8.6(4.5, 11.6)
0.0(0.0, 3.5)
7.7(7.7, 19.4)
67.4(45.4, 116.6)
Source: Popova et al., 2017 [23]. a The prevalence of any amount of alcohol use during pregnancy is inclusive of the prevalence ofbinge drinking during pregnancy. b It was not possible to estimate the prevalence of binge drinking during pregnancy for the Eastern-Mediterranean or South-East Asia Regions due to a lack of available data for countries in these regions; therefore, the global prevalencecould not be estimated. c The prevalence of FASD includes the prevalence of FAS. © Canadian Science Publishing.
Additionally, the five countries with the highest prevalence of alcohol use amongpregnant women were in the European Region: Ireland (60.4%), Belarus (46.6%), Denmark(45.8%), the United Kingdom (41.3%), and Russia (36.5%) [22,23]. Among these five coun-tries alone, there are an annual 902,180 prenatally alcohol-exposed births, 69,395 of whichhave FASD. In total, there are approximately 1,249,110 cases with FASD among those aged0–18 years in these five countries alone (see Table 3).
89
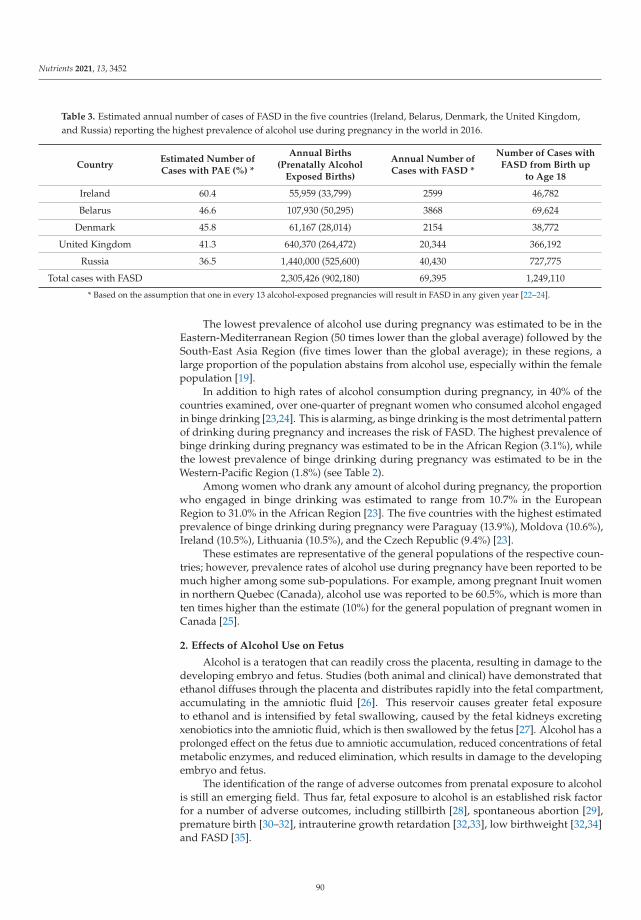
Nutrients 2021, 13, 3452
Table 3. Estimated annual number of cases of FASD in the five countries (Ireland, Belarus, Denmark, the United Kingdom,and Russia) reporting the highest prevalence of alcohol use during pregnancy in the world in 2016.
CountryEstimated Number ofCases with PAE (%) *
Annual Births(Prenatally Alcohol
Exposed Births)
Annual Number ofCases with FASD *
Number of Cases withFASD from Birth up
to Age 18
Ireland 60.4 55,959 (33,799) 2599 46,782
Belarus 46.6 107,930 (50,295) 3868 69,624
Denmark 45.8 61,167 (28,014) 2154 38,772
United Kingdom 41.3 640,370 (264,472) 20,344 366,192
Russia 36.5 1,440,000 (525,600) 40,430 727,775
Total cases with FASD 2,305,426 (902,180) 69,395 1,249,110
* Based on the assumption that one in every 13 alcohol-exposed pregnancies will result in FASD in any given year [22–24].
The lowest prevalence of alcohol use during pregnancy was estimated to be in theEastern-Mediterranean Region (50 times lower than the global average) followed by theSouth-East Asia Region (five times lower than the global average); in these regions, alarge proportion of the population abstains from alcohol use, especially within the femalepopulation [19].
In addition to high rates of alcohol consumption during pregnancy, in 40% of thecountries examined, over one-quarter of pregnant women who consumed alcohol engagedin binge drinking [23,24]. This is alarming, as binge drinking is the most detrimental patternof drinking during pregnancy and increases the risk of FASD. The highest prevalence ofbinge drinking during pregnancy was estimated to be in the African Region (3.1%), whilethe lowest prevalence of binge drinking during pregnancy was estimated to be in theWestern-Pacific Region (1.8%) (see Table 2).
Among women who drank any amount of alcohol during pregnancy, the proportionwho engaged in binge drinking was estimated to range from 10.7% in the EuropeanRegion to 31.0% in the African Region [23]. The five countries with the highest estimatedprevalence of binge drinking during pregnancy were Paraguay (13.9%), Moldova (10.6%),Ireland (10.5%), Lithuania (10.5%), and the Czech Republic (9.4%) [23].
These estimates are representative of the general populations of the respective coun-tries; however, prevalence rates of alcohol use during pregnancy have been reported to bemuch higher among some sub-populations. For example, among pregnant Inuit womenin northern Quebec (Canada), alcohol use was reported to be 60.5%, which is more thanten times higher than the estimate (10%) for the general population of pregnant women inCanada [25].
2. Effects of Alcohol Use on Fetus
Alcohol is a teratogen that can readily cross the placenta, resulting in damage to thedeveloping embryo and fetus. Studies (both animal and clinical) have demonstrated thatethanol diffuses through the placenta and distributes rapidly into the fetal compartment,accumulating in the amniotic fluid [26]. This reservoir causes greater fetal exposureto ethanol and is intensified by fetal swallowing, caused by the fetal kidneys excretingxenobiotics into the amniotic fluid, which is then swallowed by the fetus [27]. Alcohol has aprolonged effect on the fetus due to amniotic accumulation, reduced concentrations of fetalmetabolic enzymes, and reduced elimination, which results in damage to the developingembryo and fetus.
The identification of the range of adverse outcomes from prenatal exposure to alcoholis still an emerging field. Thus far, fetal exposure to alcohol is an established risk factorfor a number of adverse outcomes, including stillbirth [28], spontaneous abortion [29],premature birth [30–32], intrauterine growth retardation [32,33], low birthweight [32,34]and FASD [35].
90
Nutrients 2021, 13, 3452
Cellular responses resulting from prenatal exposure to the teratogen alcohol is an areaof considerable interest to a wide range of researchers and clinicians. Currently, alcohol isknown to be teratogenic for all organ systems of the developing fetus [36]. Alcohol seemsto be especially harmful to the developing nervous system. Some of these mechanisms,include increased oxidative stress to the central nervous system (CNS) [37], impaired angio-genesis and neurogenesis that occurs during brain development in utero [38], increased celldeath in various brain structures [39], as well as disruptions to the endocrine system [40],to gene expressions [41] and to prostaglandin synthesis [42]. Prenatal alcohol exposuredysregulates amino acid homeostasis and induces excitatory neurotoxicity, increasingtaurine levels as a neuroprotective response [43].
PAE is generally associated with reduced overall brain volume in exposed individuals,which can be observed at birth and later in life. Specifically, individuals with PAE may havereduced gray and white matter in the cerebrum and cerebellum, and reduced gray matterin brain structures including the amygdala, hippocampus, putamen, caudate, thalamus andpallidum [44]. Poorer cognitive and behavioural outcomes are associated with larger brainvolume decreases from PAE; however, rates of brain volume growth are similar in earlychildhood and there are abnormal brain-behaviour connections displayed in children withPAE, suggesting there is a well-defined, long window of opportunity for intervention [45].The asymmetry of the cerebral cortex thickness throughout development is preserved inindividuals with PAE despite their thinner cortex and reduced globally reduced volume,suggesting that typical brain developmental patterns do occur in individuals with PAEand that deficits in cognitive performance are more related to the teratogenic exposure inutero [44].
In addition to the substantial cognitive, neurological, and behavioural deficits resultingfrom damage to the central nervous system, PAE can also lead to organ defects found inthe liver, kidney, and heart, as well as disruptions in the gastrointestinal and endocrinesystems [46,47]. Consistent and high levels of alcohol intake on a daily basis duringpregnancy are associated with significant fetal impairments in gross and fine motor functionobserved in childhood [48]. It is theorized that PAE programs the fetal HPA axis to haveincreased tone, affecting stress response and regulation during baseline and stressfulconditions throughout life [40]. This increased tone may be linked to increased reactivityin adverse life events and may represent an increased vulnerability to depression, asHPA dysregulation is commonly found in individuals with depression [49]. There isalso preliminary evidence to suggest that PAE can adversely impact immune functionlater in life as a result of changes in cytokines and lymphocytes that are related to atopicallergy and infection outcomes [50]. While more research is needed in this area, this earlyfinding is important given the relationship between stress reactivity and immune function,suggesting that individuals with PAE are even more susceptible to various comorbidities.
Outcomes from alcohol exposure are modified by a large number of effect modi-fiers, which include timing and amount of alcohol consumption (dose-dependent), mater-nal/fetal polysubstance exposure (smoking, other drugs, prescription medications (bothprescribed and diverted), nutritional deficiencies, exposure to environmental stressors (e.g.,domestic violence, poverty, homelessness), comorbid mental disorders (e.g., depression,anxiety), and peer pressure from friends, families and especially partners’ substance usepatterns during pregnancy [51–53]. Some patterns of co-exposure are observed to be moredetrimental, especially drinking alcohol and nicotine or cannabis exposure [54–56]. It hasbeen shown that prenatal exposures to alcohol and nicotine are more potent influences ondeveloping fetal brain structures than cocaine [57].
A growing body of evidence supports epigenetic etiology in the development of FASDdue to ethanol-related changes in gene expression (without changes in the DNA sequence),particularly from 3 to 8 weeks of gestation [58]. The timing and pattern of prenatal alcoholexposure affects the alcohol-induced alterations; for example, binge drinking in the firsttrimester can affect cell proliferation, whereas cell migration/differentiation is affectedin the second, and cellular networking is affected by binges in the third trimester [59].
91
Nutrients 2021, 13, 3452
Exposure to alcohol can affect biochemical reactions in the methionine–homocysteinecycle which is linked to epigenetic changes including abnormal DNA methylation [58]and induces oxidative stress which leads to DNA damage [60] affecting a fetus’s cellproliferation and differentiation. Interestingly, chronic paternal alcohol use is associatedwith epigenetic dysregulation in neonates as well [61]. Furthermore, rodent studies havefound that prenatal alcohol exposure affects gene transcription in adolescence [62].
2.1. Fetal Alcohol Spectrum Disorder
The most dramatic manifestation of PAE is Fetal Alcohol Spectrum Disorder (FASD).FASD describes a wide range of effects, these are broadly clustered into three categories:(1) cognitive impairments including central nervous system damage, congenital anomalies,prenatal or postnatal growth restrictions; (2) characteristic dysmorphic facial features; and(3) deficits in cognitive, behavioral, emotional, and adaptive functioning. Since the firstdescription of FAS by Jones and Smith in 1973 [63,64], the terminology and the diagnosticguidelines have changed numerous times. Depending on the classification system, FASDincludes several alcohol-related diagnoses, such as Fetal Alcohol Syndrome (FAS), partialFAS (pFAS), alcohol-related neurodevelopmental disorder (ARND), and Alcohol-RelatedBirth Defects (ARBD) [65,66]. The Canadian framework utilizes a single designationof FASD as a diagnostic term, with the specification of the presence or absence of thecharacteristic sentinel facial features [67]. In addition, the category of neurodevelopmentaldisorder associated with prenatal alcohol exposure (ND-PAE) is included in the Diagnosticand Statistical Manual of Mental Disorders, Fifth Edition (DSM-5; [68]). Although thecriteria for FASD diagnoses have been described thoroughly, the diagnosis of FASD remainschallenging, and the specific assessment techniques used to make the definitive diagnosisare still debated, especially for ARND. It is important to note that FASD captures only amodest proportion of damage to the developing fetus from alcohol exposure, so not everychild with PAE will be diagnosed with FASD [22].
The risk of developing FASD is related to the patterns (the quantity, frequency, du-ration) of alcohol consumption, as well as other factors. It has been well documentedin both animal and human studies that larger quantities of PAE and sustained drinkingthroughout all trimesters of pregnancy result in greater physical and cognitive deficits, andthe appearance of facial features in FAS [69]. Binge drinking is associated with the highestrisk of fetal damage [52]. However, many studies show that low and moderate drinkingduring pregnancy is also associated with fetal damage [20,21].
Research studies show that many other risk factors can also influence developmentof FASD, which include a smaller body profile of mother (height, weight, and body massindex [BMI]), maternal age, low socioeconomic status and smoking [52], a poor nutritionalstatus (deficit of riboflavin, calcium, and zinc; [70], genetic polymorphisms [71,72], andpaternal alcohol consumption [73].
Several categories of biomarkers of PAE and FASD have been proposed. Theseinclude biomarkers demonstrating adverse outcomes for Fetal Alcohol Syndrome includ-ing anatomical markers (e.g., facial abnormalities; micrognathia); biomarkers of neuro-logical impairments (e.g., reduced memory retention), developmental biomarkers (e.g.,delayed motor learning) and neurobehavioral biomarkers (e.g., deficits in executive func-tioning) [74]. For example, lower serum concentrations of insulin growth factors IGF-Iand IGF-II have been found to be a reliable biomarker of prenatal alcohol exposure inchildren [75]. Certain imaging studies are proposed to be biomarkers for brain differencesassociated with FASD, including the use of computerized tomography, magnetic resonanceimaging and positron emission tomography [74]. In addition, a number of biomarkers forPAE present at birth are available based on meconium and cord blood [74,76,77].
FASD has a very broad phenotype and is further complicated by high rates of co-morbidity. More than 400 disease conditions, spanning across 18 of 22 chapters of theICD-10 have been reported to co-occur in people diagnosed with FASD [36]. The mostprevalent conditions that occur in individuals with FASD are found within the International
92

Nutrients 2021, 13, 3452
Statistical Classification of Diseases (ICD-10) chapters of “Congenital malformations, de-formities, and chromosomal abnormalities” (43%) and “Mental and behavioral disorders”(18%) [78]. Some comorbid conditions that are highly prevalent among people with FASDinclude abnormal results of function studies of the peripheral nervous system and specialsenses, conduct disorder, chronic serous otitis media, receptive and expressive languagedisorders, and visual, developmental, cognitive, mental, and behavioral impairments, withprevalence estimates of these conditions ranging from 50% to 91% [36]. FASD, as indicatedby the sheer number of conditions found to co-occur in this population, is a multifacetedspectrum of disorders, affecting multiple organs and systems.
The complexity and chronicity of FASD affects both the affected individual andtheir family. In many cases, people with FASD require lifelong support from a widerange of support services, including health care, social assistance, and remedial education.Accordingly, it has been shown that FASD has a substantial economic impact on anysociety [79–81]. In Canada, the annual cost attributable to FASD was estimated to bebetween CAD1.3 billion and CAD2.3 billion [81]. In North America, the lifetime cost for acomplex case of FASD has been estimated to be more than CAD1 million [82]. Individualsfrom all socio-economic and ethnic backgrounds are affected by FASD [83]. The deficitsexpressed by individuals with FASD vary broadly in severity and type. Moreover, FASDis intergenerational and familial. Children with an affected sibling are at a higher risk ofhaving FASD [84].
2.2. Changes over the Lifespan of People with Fetal Alcohol Spectrum Disorder
The neurodevelopmental impairments associated with PAE resulting in FASD lead toother disabilities later in life. These disabilities include, but are not limited to, academicfailure, substance abuse, mental health problems, frequent contact with law enforcement,and inability to live independently and obtain and/or maintain employment—all of whichhave lifelong implications [69]. These generally are referred to as secondary disabilities,which increase the demands and costs on existing service systems. This includes the healthcare system with increased demand for services [85], educational systems with need forspecial services for these children and adolescents, corrections systems beginning in earlyadolescence and extending across adult life, mental health systems across the lifespan,social services and child protection services and developmental disabilities.
2.3. Prevalence of Fetal Alcohol Spectrum Disorder
Globally, the prevalence rates of FASD among the general population were estimatedto be 77.3 per 10,000 people [22,86].The prevalence of FASD in the general population wasestimated to be highest in the European Region, at 198.2 per 10,000 people, and lowest inthe Eastern Mediterranean Region, at 1.3 per 10,000 people (Table 2; [22,86]), respectively.These estimates are in line with the above-reported prevalence of alcohol use duringpregnancy. The five countries with highest prevalence of FASD per 1,000 were South Africa(111.1), Croatia (53.3), Ireland (47.5), Italy (45.0), and Belarus (36.6) [86]. The five countrieswith the lowest prevalence of FASD (<0.1 per 1,000) were Oman, United Arab Emirates,Saudi Arabia, Qatar, and Kuwait [86].
Recent multi-site active case ascertainment studies in the United States have estimatedthe prevalence of FASD to be 5% among students in grade one [21,87–89]. In Canada, thepopulation-based prevalence of FASD among elementary school children was estimatedto be between 2% and 3% [90]. These studies found that nearly all of these students inthe United States and all of these students in Canada had not been previously diagnosedwith FASD.
The prevalence of FASD in the Western Cape Province of South Africa, a regionknown for wine production and a high prevalence of binge drinking among women ofchildbearing age, has been reported to be 135.1 to 207.5 per 1000 (13.5–20.8%) among firstgrade students—one of the highest FASD prevalence rates in the world [91].
93
Nutrients 2021, 13, 3452
A systematic review and meta-analysis revealed that FASD prevalence is much higherin certain sub-populations such as children in care, correctional, or special educationprograms, specialized clinical populations, and Aboriginal populations, compared to thegeneral population [83]. For example, compared to the general population, the prevalenceof FASD among children in care was 32 times higher in the United States and 40 timeshigher in Chile, the prevalence of FASD among adults in the Canadian correctional systemwas 19 times higher, and the prevalence of FASD among special education populations inChile was over 10 times higher [83].
FASD prevalence rates reported in individual studies are extremely alarming. Forinstance, the prevalence of FASD was 62% among children with intellectual disabilities incare in Chile [92], over 52% among adoptees from Eastern Europe [93], and approximately40% among children residing in orphanages in Lithuania [94]. The highest prevalenceestimates of Fetal Alcohol Syndrome (FAS), which ranged between 46% and 68%, werereported in Russian orphanages for children with developmental abnormalities [95]. Ad-ditionally, the prevalence of FASD among youth in correctional services was over 23% inCanada [96], and over 14% among psychiatric care populations in the United States [97].
These findings demonstrate the large service and cost burdens of FASD across varioussystems of care and reflect a substantial global health problem [81]. It is important toprovide caregiver education, diagnosis-informed interventions, lifelong services and long-term risk reduction to individuals with FASD to reduce the prevalence of secondarydisabilities. Appropriate interventions, as well as diagnostic and support services, must beavailable to individuals with FASD from an early age in order to decrease their chances ofbecoming involved with the legal system, whether as a victim or as an offender. FASD is ahuge risk factor for incarceration. It was estimated based on available findings that, on anygiven day in a specific year, children and adolescents with FASD are 19 times more likelyto be incarcerated compared to children and adolescents without FASD [98]. Lastly, highprevalence rates of FASD among special education and specialized clinical populations arenot surprising given that individuals with FASD are at an increased risk of having learningdifficulties and mental health problems, and of experiencing developmental delays [36].
2.4. Fetal Alcohol Spectrum Disorder: Global Implications
Globally, there are 130 million live births each year. In 2016, 32.1% of women of child-bearing age globally consumed alcohol in the past year [4] and 10% of women consumed al-cohol during pregnancy [22]. These data demonstrate that every year, 13,000,000 pregnanciesare alcohol-exposed in the world. Based on a crude estimate of exposure outcomes froma meta-analysis, an estimated one in every 13 alcohol-exposed pregnancies will result inFASD in one specific year [24]. This broad estimate suggests that out of the 13 millionalcohol-exposed pregnancies, 1 million of these pregnancies will result in a baby bornwith FASD. To put this in perspective, this results in 2739 new cases of FASD each day, or114 every hour, or 2 per minute. The cumulative impact is astonishing. Globally, the num-ber of children with FASD aged from birth through 18 years of age is 18,000,000. We havepreviously noted that only a small number of individuals with FASD have been diagnosed:perhaps only one of every 800 to 1000 cases [99]. FASD is especially underdiagnosed incertain age groups, as tens of millions of adults and elderly people remain undiagnosed.
These are conservative estimates. Since a large portion of pregnancies globally areunplanned (44%) [100], many of the 32% of women of childbearing age who alreadyconsume alcohol are at risk of having an alcohol-exposed pregnancy in the early stages,before pregnancy recognition typically occurs. Alcohol use during pregnancy is also widelyunderreported [101,102] so the number of pregnancies with prenatal alcohol exposure (PAE)could be much higher. This would also increase the estimated number of births of childrenwith FASD.
In addition, the number of comorbid disorders found to co-occur in individuals withFASD may also account for the lower prevalence estimates of FASD (i.e., underdiagnoses),likely due to the shadowing that might occur by the other disease conditions. Often,
94
Nutrients 2021, 13, 3452
clinicians diagnose the immediate condition that has brought the individual in to seekmedical treatment (e.g., problems with concentration), rather than taking into considerationthe potential associations and underlying causes of the condition or illness (e.g., PAE).
2.5. Fetal Alcohol Spectrum Disorder and Mortality
One of the main neglected manifestations of FASD is premature mortality. The majorityof people who may have met the diagnostic criteria for FASD die before they get a chanceto be diagnosed. Deaths from stillbirth, sudden infant death syndrome and infectiousillness are examples [103–105].
People diagnosed with FASD have a five-fold increase in risk for a premature deathcompared to people without FASD [105]. Since this risk is familial, their siblings similarlyhave a higher risk of mortality, irrespective of FASD diagnosis [106]. Having children withFASD is an important risk factor in maternal mortality [107,108]. In one case–control studyin North Dakota (United States), mothers of children with FASD had a 44.82-fold increasein mortality risk compared to control mothers of the same age [108]. Among the deaths ofbirth mothers of children with FASD, 87% were among women under the age of 50 years,and among the causes of death for these cases, 67% was attributed to cancer, accidents, orclassified as alcohol-related [108].
2.6. Fetal Alcohol Spectrum Disorder and Parenting
The complexity of parenting is increased for parents of children with FASD due tomultiple issues, including sleep and eating disorders, fine and gross motor delays, toileting,speech and language disorders, need for medication(s), ongoing travel (often years) fortherapies, learning and behavior impairments at school, and unavailability of childcare forchildren with complex behavioral impairments as well as of respite care services [109–112].The complexity of parenting increases during adolescence, as young adult life with FASDmay be especially complex. Early recognition of FASD and early emphasis on prevention ofthese problems and secondary disabilities are seen to be most useful in decreasing demandson parents [109].
3. Treatment Options
To date, there is no known treatment to reverse alcohol-induced damage to the fe-tus; however, many animal and human research studies have explored treatment optionsto reverse or prevent the mechanisms of alcohol teratogenicity on fetus [113]. For in-stance, animal studies have demonstrated ethanol-induced oxidative stress reduction byadministering vitamins C and E [114–117], astaxanthin [117,118], curcumin [119,120] andresveratrol [121,122]. Doses of Vitamin E were found to reduce and even prevent Pukinjecell loss in rats [123,124], and when paired with beta carotene, doses of Vitamin C canalso reduce or ameliorate hippocampal cell loss [124,125]. In zebrafish embryos, doses ofVitamin A were found to reverse small eye and body length defects, but were unable toreverse heart edema and other physical anomalies following PAE [124,126,127]. It was alsoshown that zinc can decrease physical abnormalities when administered at the time ofethanol exposure in mice [124,128,129]. Administering food supplements with folic acid,selenium, DHA, L-glutamine, boricacid, and choline [124,130] to pregnant women withrisk of developing a child with FASD, also demonstrated that it can reduce the severity ofethanol-induced toxicity [124,131]. Recent studies show that low maternal iron reservesduring pregnancy are associated with more prevalent FASD features where there is PAE;this is especially important as women of reproductive age who are heavy users of alcoholtend to have low iron stores [132]. Furthermore, while there is a breadth of evidenceusing animal models, clinical trials are needed to study interventions and supplementationoptions for humans [117].
95
Nutrients 2021, 13, 3452
4. Limitations
The current review has several strengths, including an overview of the most up-to-dateepidemiological data on alcohol use in pregnancy and FASD in conjunction with what isknown about the effects of alcohol on the fetus, including individual and population-levelimpacts. These data must be understood in light of several existing limitations, however.First and foremost, alcohol use during pregnancy is underreported and in addition, FASDis largely undiagnosed. Some countries may not have available data on alcohol use duringpregnancy (e.g., countries not included in WHO Member States) and though the globalestimate is 10%, this varies widely across countries. Furthermore, studies on maternalalcohol consumption are often not based on representative sampling strategies, and oftendo not include data on alcohol use patterns, pregnancy planning, or timing of pregnancyrecognition. The current review presents meta-analytic estimates of FASD prevalence ingeneral and sub-populations based on active case ascertainment (ACA) studies, which arethe gold standard; however, case definitions and diagnostic criteria for FASD vary widelyacross studies and in different countries.
5. Conclusions
The detrimental effects of alcohol on a fetus leading to preventable chronic disabilitiesshould be recognized and addressed as a global public health issue. The increasingincidence and prevalence of PAE and FASD at alarming rates is a public health exigencywhich demands strategic and timely interventions for both pregnant and childbearing-aged women who consume alcohol, and for their offspring who may be at risk of PAE.Prevention initiatives aimed at reducing alcohol use prior to and during pregnancy shouldbe implemented worldwide.
There must be recognition that FASD is not restricted solely to disadvantaged groups,but rather that it may occur throughout society, regardless of socio-economic status, ed-ucation, or ethnicity [90]. Therefore, efforts must be made to better educate the generalpopulation (adult women and men, children, and teenagers) about the risks of alcohol use(especially binge drinking and frequent drinking) during pregnancy.
Appropriate screening for alcohol use in all women of childbearing age, in combi-nation with health promotion before conception, contraceptive counselling, brief inter-ventions, and referrals to substance abuse programs where appropriate, should become aroutine standard of care. Research has shown that easy access to substance use programsutilizing effective treatment of identified cases of alcohol dependence or AUDs amongpregnant women could reduce the risk of PAE and having children with FASD [133,134].Collaborative research projects and maternal health promotion programs (e.g., the Women-Infant-Child (WIC) program or the Parent Child Assistance Program (PCAP)) can befunded to help identify mothers who are drinking during pregnancy and therefore infantsand young children with PAE who are at risk for FASD. Such programs have been shownto be cost-effective, and similarly, it has been estimated that preventing one case of FASDincurs only 3% of the costs it would require to provide support services to individuals withFASD [135].
Screening for PAE could lead to close monitoring of a child’s development, facilitateearly diagnosis, and the implementation of timely interventions, if necessary. It wouldalso prevent the occurrence of secondary disabilities later in life and the occurrence and/orrecurrence of prenatal and postnatal alcohol exposure within families at risk for FASD.Improved access to FASD diagnosis also is an opportunity to identify mothers who not onlyhave maternal risk factors for FASD but also have children with FASD. This is a prioritypopulation for the prevention of alcohol exposure in future pregnancies. Among peoplediagnosed with FASD, specific efforts must be made to prevent school failure, victimization,incarceration, and the development of substance use disorders. Effective and consistentexecution of universal screening can assist all countries in the development of surveillancesystems to monitor the prevalence of alcohol use during pregnancy and of FASD, over
96

Nutrients 2021, 13, 3452
time, in order to identify vulnerable populations, develop resources, and evaluate theeffectiveness of prevention strategies.
To conclude, the negative health outcomes of alcohol exposure on the fetus, includingFASD, are preventable and the most effective measure is to completely avoid consumingany type of alcohol during the entire pregnancy and while trying to become pregnant. Allcountries should implement effective and cost-effective population-based policy optionsthat aim to reduce alcohol use among populations, including women of childbearing ageand pregnant women [136,137], which ultimately will decrease the incidence of FASD andother negative health outcomes of children and their mothers.
Author Contributions: Conceptualization, S.P. and L.B.; methodology, S.P., L.B. and K.S.; writing—original draft preparation, S.P. and L.B.; writing—review and editing, S.P., D.D., L.B., K.S. and J.R.;visualization, S.P.; supervision, S.P. All authors have read and agreed to the published version ofthe manuscript.
Funding: This research received no external funding.
Institutional Review Board Statement: Not applicable.
Informed Consent Statement: Not applicable.
Conflicts of Interest: The authors declare no conflict of interest.
References
1. Slade, T.; Chapman, C.; Swift, W.; Keyes, K.; Tonks, Z.; Teesson, M. Birth cohort trends in the global epidemiology of alcohol useand alcohol-related harms in men and women: Systematic review and metaregression. BMJ Open 2016, 6, e011827. [CrossRef][PubMed]
2. Denny, C.H.; Acero, C.S.; Terplan, M.; Kim, S.Y. Trends in alcohol use among pregnant women in the U.S., 2011–2018. Am. J. Prev.Med. 2020, 59, 768–769. [CrossRef] [PubMed]
3. Geels, L.M.; Vink, J.M.; van Beek, J.H.D.A.; Bartels, M.; Willemsen, G.; Boomsma, D.I. Increases in alcohol consumption in womenand elderly groups: Evidence from an epidemiological study. BMC Public Health 2013, 13, 207. [CrossRef] [PubMed]
4. World Health Organization. Global Status Report on Alcohol and Health; World Health Organization: Geneva, Switzerland, 2018.5. Manthey, J.; Shield, K.D.; Rylett, M.; Hasan, O.S.M.; Probst, C.; Rehm, J. Global alcohol exposure between 1990 and 2017 and
forecasts until 2030: A modelling study. Lancet 2019, 393, 2493–2502. [CrossRef]6. NANOS Research. COVID-19 and Increased Alcohol Consumption: NANOS Poll Summary Report; Canadian Centre on Substance
Use and Addiction: Ottawa, ON, Canada, 2020.7. Naughton, F.; Ward, E.; Khondoker, M.; Belderson, P.; Marie Minihane, A.; Dainty, J.; Hanson, S.; Holland, R.; Brown, T.; Notley,
C. Health behaviour change during the UK COVID-19 lockdown: Findings from the first wave of the C-19 health behaviour andwell-being daily tracker study. Br. J. Health Psychol. 2021, 26, 624–643. [CrossRef]
8. Pollard, M.S.; Tucker, J.S.; Green, J.H.D. Changes in adult alcohol use and consequences during the COVID-19 pandemic in theUS. JAMA Netw. Open 2020, 3, e2022942. [CrossRef]
9. Sher, J. Fetal alcohol spectrum disorders: Preventing collateral damage from COVID-19. Lancet Public Health 2020, 5, e424.[CrossRef]
10. Smith, C.L.; Waters, S.F.; Spellacy, D.; Burduli, E.; Brooks, O.; Carty, C.L.; Ranjo, S.; McPherson, S.; Barbosa-Leiker, C. Substanceuse and mental health in pregnant women during the COVID-19 pandemic. J. Reprod. Infant Psychol. 2021, 1–14. [CrossRef]
11. Kar, P.; Tomfohr-Madsen, L.; Giesbrecht, G.; Bagshawe, M.; Lebel, C. Alcohol and substance use in pregnancy during theCOVID-19 pandemic. Drug Alcohol Depend. 2021, 225, 108760. [CrossRef]
12. World Health Organization. Global Information System on Alcohol and Health; World Health Organization: Geneva, Switzerland, 2018.13. Bloomfield, K.; Gmel, G.; Neve, R.; Mustonen, H. Investigating gender convergence in alcohol consumption in Finland, Germany,
The Netherlands, and Switzerland: A repeated survey analysis. Subst. Abuse 2001, 22, 39–53. [CrossRef]14. National Health and Medical Research Council. Australian Guidelines to Reduce Health Risks from Drinking Alcohol; National Health
and Medical Research Council: Canberra, Australia, 2009.15. Danish National Board of Health. Healthy Habits before, during and after Pregnancy, 1st English ed.; Danish National Board of
Health: Copenhagen, Denmark, 2010. (translated from 2nd Danish edition).16. Carson, N.; Leach, L.; Murphy, K.J. A re-examination of Montreal Cognitive Assessment (MoCA) cutoff scores. Int. J. Geriatr.
Psychiatry 2018, 33, 379–388. [CrossRef]17. French Ministry of Youth Affairs and Sports. Health Comes with Eating and Moving: The Food Guide for Pregnancy; French Ministry
of Youth Affairs and Sports: Saint-Yrieix-la-Perche, France, 2015.18. Centers for Disease Control and Prevention. Advisory on Alcohol Use during Pregnancy. A 2005 Message to Women from the US
Surgeon General; Centers for Disease Control and Prevention: Atlanta, GA, USA, 2005.
97
Nutrients 2021, 13, 3452
19. World Health Organization. Guidelines for the Identification and Management of Substance Use and Substance Use Disorders inPregnancy; World Health Organization: Geneva, Switzerland, 2014.
20. May, P.A.; Blankenship, J.; Marais, A.; Gossage, J.P.; Kalberg, W.O.; Joubert, B.; Cloete, M.; Barnard, R.; de Vries, M.; Hasken,J.; et al. Maternal alcohol consumption producing fetal alcohol spectrum disorders (FASD): Quantity, frequency, and timing ofdrinking. Drug Alcohol Depend. 2013, 133, 502–512. [CrossRef]
21. Chambers, C.D.; Coles, C.; Kable, J.; Akshoomoff, N.; Xu, R.; Zellner, J.A.; Honerkamp-Smith, G.; Manning, M.A.; Adam, M.P.;Jones, K.L. Fetal alcohol spectrum disorders in a pacific Southwest city: Maternal and child characteristics. Alcohol. Clin. Exp. Res.2019, 43, 2578–2590. [CrossRef]
22. Popova, S.; Lange, S.; Probst, C.; Gmel, G.; Rehm, J. Estimation of national, regional, and global prevalence of alcohol use duringpregnancy and fetal alcohol syndrome: A systematic review and meta-analysis. Lancet Glob. Health 2017, 5, e290–e299. [CrossRef]
23. Popova, S.; Lange, S.; Probst, C.; Gmel, G.; Rehm, J. Global prevalence of alcohol use and binge drinking during pregnancy, andfetal alcohol spectrum disorder. Biochem. Cell Biol. 2018, 96, 237–240. [CrossRef]
24. Lange, S.; Probst, C.; Rehm, J.; Popova, S. Prevalence of binge drinking during pregnancy by country and World HealthOrganization region: Systematic review and meta-analysis. Reprod. Toxicol. 2017, 73, 214–221. [CrossRef] [PubMed]
25. Fraser, S.L.; Muckle, G.; Abdous, B.B.; Jacobson, J.L.; Jacobson, S.W. Effects of binge drinking on infant growth and developmentin an Inuit sample. Alcohol 2012, 46, 277–283. [CrossRef] [PubMed]
26. Brien, J.F.; Loomis, C.W.; Tranmer, J.; McGrath, M. Disposition of ethanol in human maternal venous blood and amniotic fluid.Am. J. Obstet. Gynecol. 1983, 146, 181–186. [CrossRef]
27. Underwood, M.A.; Gilbert, W.M.; Sherman, M.P. Amniotic fluid: Not just fetal urine anymore. J. Perinatol. 2005, 25, 341–348.[CrossRef] [PubMed]
28. Kesmodel, U.; Wisborg, K.; Olsen, S.F.; Henriksen, T.B.; Secher, N.J. Moderate alcohol intake during pregnancy and the risk ofstillbirth and death in the first year of life. Am. J. Epidemiol. 2002, 155, 305–312. [CrossRef]
29. Henriksen, T.B.; Hjollund, N.H.; Jensen, T.K.; Bonde, J.P.; Andersson, A.-M.; Kolstad, H.; Ernst, E.; Giwercman, A.; Skakkebæk,N.E.; Olsen, J. Alcohol consumption at the time of conception and spontaneous abortion. Am. J. Epidemiol. 2004, 160, 661–667.[CrossRef]
30. Albertsen, K.; Andersen, A.-M.N.; Olsen, J.; Grønbæk, M. Alcohol consumption during pregnancy and the risk of pretermdelivery. Am. J. Epidemiol. 2004, 159, 155–161. [CrossRef]
31. Kesmodel, U.; Olsen, S.F.; Secher, N.J. Does alcohol increase the risk of preterm delivery? Epidemiology 2000, 512–518. [CrossRef][PubMed]
32. Patra, J.; Bakker, R.; Irving, H.; Jaddoe, V.W.; Malini, S.; Rehm, J. Dose–response relationship between alcohol consumption beforeand during pregnancy and the risks of low birthweight, preterm birth and small for gestational age (SGA)—A systematic reviewand meta-analyses. BJOG Int.J. Obstet. Gynaecol. 2011, 118, 1411–1421. [CrossRef] [PubMed]
33. Yang, Q.; Witkiewicz, B.B.; Olney, R.S.; Liu, Y.; Davis, M.; Khoury, M.J.; Correa, A.; Erickson, J.D. A case-control study of maternalalcohol consumption and intrauterine growth retardation. Ann. Epidemiol. 2001, 11, 497–503. [CrossRef]
34. O’Callaghan, F.V.; O’Callaghan, M.; Najman, J.M.; Williams, G.M.; Bor, W. Maternal alcohol consumption during pregnancy andphysical outcomes up to 5 years of age: A longitudinal study. Early Hum. Dev. 2003, 71, 137–148. [CrossRef]
35. Stratton, K.R.; Howe, C.J.; Battaglia, F.C. Fetal Alcohol Syndrome: Diagnosis, Epidemiology, Prevention, and Treatment; NationalAcademy Press: Washington, DC, USA, 1996.
36. Popova, S.; Lange, S.; Shield, K.; Mihic, A.; Chudley, A.E.; Mukherjee, R.A.S.; Bekmuradov, D.; Rehm, J. Comorbidity of fetalalcohol spectrum disorder: A systematic review and meta-analysis. Lancet 2016, 387, 978–987. [CrossRef]
37. Ornoy, A. Embryonic oxidative stress as a mechanism of teratogenesis with special emphasis on diabetic embryopathy. Reprod.Toxicol. 2007, 24, 31–41. [CrossRef] [PubMed]
38. Jégou, S.; El Ghazi, F.; de Lendeu, P.K.; Marret, S.; Laudenbach, V.; Uguen, A.; Marcorelles, P.; Roy, V.; Laquerrière, A.; Gonzalez,B.J. Prenatal alcohol exposure affects vasculature development in the neonatal brain. Ann. Neurol. 2012, 72, 952–960. [CrossRef]
39. Cartwright, M.M.; Smith, S.M. Increased cell death and reduced neural crest cell numbers in ethanol-exposed Embryos: Partialbasis for the fetal alcohol syndrome phenotype. Alcohol. Clin. Exp. Res. 1995, 19, 378–386. [CrossRef]
40. Haley, D.W.; Handmaker, N.S.; Lowe, J. Infant stress reactivity and prenatal alcohol exposure. Alcohol. Clin. Exp. Res. 2006, 30,2055–2064. [CrossRef]
41. Vangipuram, S.D.; Grever, W.E.; Parker, G.C.; Lyman, W.D. Ethanol increases fetal human neurosphere size and alters adhesionmolecule gene expression. Alcohol. Clin. Exp. Res. 2008, 32, 339–347. [CrossRef]
42. Randall, C.L.; Anton, R.F. Aspirin reduces alcohol-induced prenatal mortality and malformations in mice. Alcohol. Clin. Exp. Res.1984, 8, 513–515. [CrossRef]
43. Lunde-Young, R.; Davis-Anderson, K.; Naik, V.; Nemec, M.; Wu, G.; Ramadoss, J. Regional dysregulation of taurine and relatedamino acids in the fetal rat brain following gestational alcohol exposure. Alcohol 2018, 66, 27–33. [CrossRef] [PubMed]
44. Zhou, D.; Rasmussen, C.; Pei, J.; Andrew, G.; Reynolds, J.N.; Beaulieu, C. Preserved cortical asymmetry despite thinner cortexin children and adolescents with prenatal alcohol exposure and associated conditions: Cortical asymmetry in prenatal alcoholexposure. Hum. Brain Mapp. 2018, 39, 72–88. [CrossRef] [PubMed]
98

Nutrients 2021, 13, 3452
45. Gautam, P.; Lebel, C.; Narr, K.L.; Mattson, S.N.; May, P.A.; Adnams, C.M.; Riley, E.P.; Jones, K.L.; Kan, E.C.; Sowell, E.R. Volumechanges and brain-behavior relationships in white matter and subcortical gray matter in children with prenatal alcohol exposure.Hum. Brain Mapp. 2015, 36, 2318–2329. [CrossRef] [PubMed]
46. Lee, X.A.; Mostafaie, Y. Acute alcohol exposure in early gestation programmes sex-specific insulin resistance in offspring: Ashifting tide in prenatal alcohol exposure models. J. Physiol. 2020, 598, 1807–1808. [CrossRef] [PubMed]
47. Caputo, C.; Wood, E.; Jabbour, L. Impact of fetal alcohol exposure on body systems: A systematic review: Impact of fetal alcoholexposure on body systems. Birth Defects Res. 2016, 108, 174–180. [CrossRef]
48. Bay, B.; Kesmodel, U.S. Prenatal alcohol exposure—A systematic review of the effects on child motor function. Acta Obstet.Gynecol. Scand. 2011, 90, 210–226. [CrossRef] [PubMed]
49. Weinberg, J.; Sliwowska, J.H.; Lan, N.; Hellemans, K.G.C. Prenatal alcohol exposure: Foetal programming, the hypothalamic-pituitary-adrenal axis and sex differences in outcome. J. Neuroendocrinol. 2008, 20, 470–488. [CrossRef] [PubMed]
50. Reid, N.; Moritz, K.M.; Akison, L.K. Adverse health outcomes associated with fetal alcohol exposure: A systematic reviewfocused on immune-related outcomes. Pediatr. Allergy Immunol. 2019, 30, 698–707. [CrossRef]
51. Eberhart, J.K.; Parnell, S.E. The genetics of fetal alcohol spectrum disorders. Alcohol. Clin. Exp. Res. 2016, 40, 1154–1165. [CrossRef]52. May, P.A.; Gossage, J.P. Maternal risk factors for fetal alcohol spectrum disorders: Not as simple as it might seem. Alcohol Res.
Health 2011, 34, 15–26.53. Day, J.; Savani, S.; Krempley, B.D.; Nguyen, M.; Kitlinska, J.B. Influence of paternal preconception exposures on their offspring:
Through epigenetics to phenotype. Am. J. Stem Cells 2016, 5, 11–18. [PubMed]54. Odendaal, H.J.; Steyn, D.W.; Elliott, A.; Burd, L. Combined effects of cigarette smoking and alcohol consumption on perinatal
outcome. Gynecol. Obstet. Investig. 2009, 67, 1–8. [CrossRef]55. Shuffrey, L.C.; Myers, M.M.; Isler, J.R.; Lucchini, M.; Sania, A.; Pini, N.; Nugent, J.D.; Condon, C.; Ochoa, T.; Brink, L.; et al.
Association between prenatal exposure to alcohol and tobacco and neonatal brain activity: Results from the safe passage study.JAMA Netw. Open 2020, 3, e204714. [CrossRef]
56. Boa-Amponsem, O.; Zhang, C.; Mukhopadhyay, S.; Ardrey, I.; Cole, G.J. Ethanol and cannabinoids interact to alter behavior in azebrafish fetal alcohol spectrum disorder model. Birth Defects Res. 2019, 111, 775–788. [CrossRef] [PubMed]
57. Levitt, P.; Stanwood, G.D.; Thompson, B.L. Prenatal exposure to drugs: Effects on brain development and implications for policyand education. Nat. Rev. Neurosci. 2009, 10, 303–312. [CrossRef]
58. Kobor, M.S.; Weinberg, J. Focus on: Epigenetics and fetal alcohol spectrum disorders. Alcohol Res. Health 2011, 34, 29–37.59. Kleiber, M.L.; Mantha, K.; Stringer, R.L.; Singh, S.M. Neurodevelopmental alcohol exposure elicits long-term changes to gene
expression that alter distinct molecular pathways dependent on timing of exposure. J. Neurodev. Disord. 2013, 5, 6. [CrossRef]60. Bhatia, S.; Drake, D.M.; Miller, L.; Wells, P.G. Oxidative stress and DNA damage in the mechanism of fetal alcohol spectrum
disorders. Birth Defects Res. 2019, 111, 714–748. [CrossRef] [PubMed]61. Sánchez-Alvarez, R.; Gayen, S.; Vadigepalli, R.; Anni, H. Ethanol diverts early neuronal differentiation trajectory of embryonic
stem cells by disrupting the balance of lineage specifiers. PLoS ONE 2013, 8, e63794. [CrossRef]62. Perkins, A.; Lehmann, C.; Lawrence, R.C.; Kelly, S.J. Alcohol exposure during development: Impact on the epigenome. Int. J. Dev.
Neurosci. 2013, 31, 391–397. [CrossRef]63. Jones, K.; Smith, D. Recognition of the fetal alcohol syndrome in early infancy. Lancet 1973, 302, 999–1001. [CrossRef]64. Jones, K.; Smith, D.; Ulleland, C.; Streissguth, A. Pattern of malformation in offspring of chronic alcoholic mothers. Lancet 1973,
301, 1267–1271. [CrossRef]65. Chudley, A.E.; Conry, J.; Cook, J.L.; Loock, C.; Rosales, T.; LeBlanc, N. Fetal alcohol spectrum disorder: Canadian guidelines for
diagnosis. Can. Med. Assoc. J. CMAJ 2005, 172, S1–S21. [CrossRef] [PubMed]66. Hoyme, H.E.; Kalberg, W.O.; Elliott, A.J.; Blankenship, J.; Buckley, D.; Marais, A.-S.; Manning, M.A.; Robinson, L.K.; Adam,
M.P.; Abdul-Rahman, O.; et al. Updated clinical guidelines for diagnosing fetal alcohol spectrum disorders. Pediatrics2016, 138, e20154256. [CrossRef]
67. Cook, J.L.; Green, C.R.; Lilley, C.M.; Anderson, S.M.; Baldwin, M.E.; Chudley, A.E.; Conry, J.L.; LeBlanc, N.; Loock, C.A.; Lutke,J.; et al. Fetal alcohol spectrum disorder: A guideline for diagnosis across the lifespan. Can. Med. Assoc. J. CMAJ 2016, 188,191–197. [CrossRef] [PubMed]
68. American Psychiatric Association. Diagnostic and Statistical Manual of Mental Disorders: DSM-5, 5th ed.; American PsychiatricAssociation: Arlington, VA, USA, 2013.
69. Streissguth, A.P.; Barr, H.M.; Kogan, J.; Bookstein, F.L. Understanding the Occurrence of Secondary Disabilities in Clients with FetalAlcohol Syndrome (FAS) and Fetal Alcohol Effects (FAE). Final Report to the Centers for Disease Control and Prevention (CDC); 96-06;University of Washington, Fetal Alcohol & Drug Unit: Seattle, WA, USA, 1996.
70. Keen, C.L.; Uriu-Adams, J.Y.; Skalny, A.; Grabeklis, A.; Grabeklis, S.; Green, K.; Yevtushok, L.; Wertelecki, W.W.; Chambers, C.D.The plausibility of maternal nutritional status being a contributing factor to the risk for fetal alcohol spectrum disorders: Thepotential influence of zinc status as an example. BioFactors 2010, 36, 125–135. [CrossRef]
71. Johnson, C.; Drgon, T.; Liu, Q.-R.; Walther, D.; Edenberg, H.; Rice, J.; Foroud, T.; Uhl, G.R. Pooled association genome scanningfor alcohol dependence using 104,268 SNPs: Validation and use to identify alcoholism vulnerability loci in unrelated individualsfrom the collaborative study on the genetics of alcoholism. Am. J. Med. Gen. Part B Neuropsychiat. Gen. 2006, 141B, 844–853.[CrossRef]
99
Nutrients 2021, 13, 3452
72. Stoler, J.M.; Ryan, L.M.; Holmes, L.B. Alcohol dehydrogenase 2 genotypes, maternal alcohol use, and infant outcome. J. Pediatr.2002, 141, 780–785. [CrossRef]
73. Ouko, L.A.; Shantikumar, K.; Knezovich, J.; Haycock, P.; Schnugh, D.J.; Ramsay, M. Effect of alcohol consumption on CpGmethylation in the differentially methylated regions of H19 and IG-DMR in male gametes—Implications for fetal alcohol spectrumdisorders. Alcohol. Clin. Exp. Res. 2009, 33, 1615–1627. [CrossRef]
74. Chabenne, A.; Moon, C.; Ojo, C.; Khogali, A.; Nepal, B.; Sharma, S. Biomarkers in fetal alcohol syndrome. Biomark. Genom. Med.2014, 6, 12–22. [CrossRef]
75. Andreu-Fernández, V.; Bastons-Compta, A.; Navarro-Tapia, E.; Sailer, S.; Garcia-Algar, O. Serum concentrations of IGF-I/IGF-IIas biomarkers of alcohol damage during foetal development and diagnostic markers of foetal alcohol syndrome. Sci. Rep.2019, 9, 1562. [CrossRef] [PubMed]
76. Himes, S.K.; Dukes, K.A.; Tripp, T.; Petersen, J.M.; Raffo, C.; Burd, L.; Odendaal, H.; Elliott, A.J.; Hereld, D.; Signore, C.; et al.Clinical sensitivity and specificity of meconium fatty acid ethyl ester, ethyl glucuronide, and ethyl sulfate for detecting maternaldrinking during pregnancy. Clin. Chem. 2015, 61, 523–532. [CrossRef] [PubMed]
77. Howlett, H.; Abernethy, S.; Brown, N.W.; Rankin, J.; Gray, W.K. How strong is the evidence for using blood biomarkers alone toscreen for alcohol consumption during pregnancy? A systematic review. Eur. J. Obstet.Gynecol. Reprod. Biol. 2017, 213, 45–52.[CrossRef] [PubMed]
78. World Health Organization. International Statistical Classification of Diseases and Related Health Problems, 5th ed.; 10th Revision;World Health Organization: Geneva, Switzerland, 2016.
79. Popova, S.; Lange, S.; Burd, L.; Chudley, A.E.; Clarren, S.K.; Rehm, J. Cost of fetal alcohol spectrum disorder diagnosis in Canada.PLoS ONE 2013, 8, e60434. [CrossRef] [PubMed]
80. Popova, S.; Lange, S.; Burd, L.; Urbanoski, K.; Rehm, J. Cost of specialized addiction treatment of clients with fetal alcoholspectrum disorder in Canada. BMC Public Health 2013, 13, 570. [CrossRef]
81. Popova, S.; Lange, S.; Burd, L.; Rehm, J. The economic burden of fetal alcohol spectrum disorder in Canada in 2013. AlcoholAlcohol. 2016, 51, 367–375. [CrossRef]
82. Popova, S.; Stade, B.; Bekmuradov, D.; Lange, S.; Rehm, J. What do we know about the economic impact of fetal alcohol spectrumdisorder? A systematic literature review. Alcohol Alcohol. 2011, 46, 490–497. [CrossRef]
83. Popova, S.; Lange, S.; Shield, K.; Burd, L.; Rehm, J. Prevalence of fetal alcohol spectrum disorder among special subpopulations:A systematic review and meta-analysis. Addiction 2019, 114, 1150–1172. [CrossRef]
84. Abel, E.L. Fetal alcohol syndrome in families. Neurotoxicol. Teratol. 1988, 10, 1–2. [CrossRef]85. Oh, S.S.; Kim, Y.J.; Jang, S.-I.; Park, S.; Nam, C.M.; Park, E.-C. Hospitalizations and mortality among patients with fetal alcohol
spectrum disorders: A prospective study. Sci. Rep. 2020, 10, 19512. [CrossRef] [PubMed]86. Lange, S.; Probst, C.; Gmel, G.; Rehm, J.; Burd, L.; Popova, S. Global prevalence of fetal alcohol spectrum disorder among children
and youth: A systematic review and meta-analysis. JAMA Pediatr. 2017, 171, 948–956. [CrossRef] [PubMed]87. May, P.A.; Hasken, J.M.; Baete, A.; Russo, J.; Elliott, A.J.; Kalberg, W.O.; Buckley, D.; Brooks, M.; Ortega, M.A.; Hedrick, D.M.; et al.
Fetal alcohol spectrum disorders in a Midwestern city: Child characteristics, maternal risk traits, and prevalence. Alcohol. Clin.Exp. Res. 2020, 44, 919–938. [CrossRef] [PubMed]
88. May, P.A.; Hasken, J.M.; Bozeman, R.; Jones, J.V.; Burns, M.K.; Goodover, J.; Kalberg, W.O.; Buckley, D.; Brooks, M.; Ortega,M.A.; et al. Fetal alcohol spectrum disorders in a rocky mountain region city: Child characteristics, maternal risk traits, andprevalence. Alcohol. Clin. Exp. Res. 2020, 44, 900–918. [CrossRef] [PubMed]
89. May, P.A.; Hasken, J.M.; Stegall, J.M.; Mastro, H.A.; Kalberg, W.O.; Buckley, D.; Brooks, M.; Hedrick, D.M.; Ortega, M.A.; Elliott,A.J.; et al. Fetal alcohol spectrum disorders in a southeastern county of the United States: Child characteristics and maternal risktraits. Alcohol. Clin. Exp. Res. 2020, 44, 939–959. [CrossRef]
90. Popova, S.; Lange, S.; Poznyak, V.; Chudley, A.E.; Shield, K.D.; Reynolds, J.N.; Murray, M.; Rehm, J. Population-based prevalenceof fetal alcohol spectrum disorder in Canada. BMC Public Health 2019, 19, 845. [CrossRef]
91. May, P.A.; Blankenship, J.; Marais, A.S.; Gossage, J.P.; Kalberg, W.O.; Barnard, R.; de Vries, M.; Robinson, L.K.; Adnams,C.M.; Buckley, D. Approaching the prevalence of the full spectrum of fetal alcohol spectrum disorders in a south Africanpopulation-based study. Alcohol. Clin. Exp. Res. 2013, 37, 818–830. [CrossRef]
92. Mena, M.; Navarrete, P.; Avila, P.; Bedregal, P.; Berríos, X. Alcohol drinking in parents and its relation with intellectual score oftheir children. Rev. Med. Chile 1993, 121, 98–105.
93. Landgren, M.; Svensson, L.; Strömland, K.; Grönlund, M.A. Prenatal alcohol exposure and neurodevelopmental disorders inchildren adopted from eastern Europe. Pediatrics 2010, 125, e1178–e1185. [CrossRef]
94. Kuzmenkoviene, E.; Prasauskiene, A.; Endziniene, M. The prevalence of fetal alcohol spectrum disorders and concomitantdisorders among orphanage children in Lithuania. J. Popul. Ther. Clin. Pharmacol. 2012, 19, e423.
95. Legonkova, S.V. Kliniko-Funktcionalnaia Kharakteristika Fetalnogo Alkogolnogo Sindroma u Detei Rannego Vozrasta [Clinical andFunctional Characteristics of Fetal Alcohol Syndrome in Early Childhood]; St. Petersburg’s State Paediatric Medical Academy:St. Petersburg, Russia, 2011.
96. Fast, D.K.; Conry, J.; Loock, C.A. Identifying fetal alcohol syndrome among youth in the criminal justice system. J. Dev. Behav.Pediatr. 1999, 20, 370–372. [CrossRef]
100
Nutrients 2021, 13, 3452
97. Bell, C.C.; Chimata, R. Prevalence of neurodevelopmental disorders among low-income African Americans at a clinic on Chicago’sSouth Side. Psychiatr. Serv. 2015, 66, 539–542. [CrossRef]
98. Popova, S.; Lange, S.; Bekmuradov, D.; Mihic, A.; Rehm, J. Fetal alcohol spectrum disorder prevalence estimates in correctionalsystems: A systematic literature review. Can. J. Public Health 2011, 102, 336–340. [CrossRef] [PubMed]
99. Popova, S.; Dozet, D.; Burd, L. Fetal alcohol spectrum disorder: Can we change the future? Alcohol. Clin.Exp.Res. 2020, 44,815–819. [CrossRef] [PubMed]
100. Bearak, J.; Popinchalk, A.; Alkema, L.; Sedgh, G. Global, regional, and subregional trends in unintended pregnancy and itsoutcomes from 1990 to 2014: Estimates from a Bayesian hierarchical model. Lancet Global Health 2018, 6, e380–e389. [CrossRef]
101. Lange, S.; Shield, K.; Koren, G.; Rehm, J.; Popova, S. A comparison of the prevalence of prenatal alcohol exposure obtained viamaternal self-reports versus meconium testing: A systematic literature review and meta-analysis. BMC Pregnancy Childbirth2014, 14, 127. [CrossRef] [PubMed]
102. Chiandetti, A.; Hernandez, G.; Mercadal-Hally, M.; Alvarez, A.; Andreu-Fernandez, V.; Navarro-Tapia, E.; Bastons-Compta,A.; Garcia-Algar, O. Prevalence of prenatal exposure to substances of abuse: Questionnaire versus biomarkers. Reprod. Health2017, 14, 137. [CrossRef] [PubMed]
103. Schaff, E.; Moreno, M.; Foster, K.; Klug, M.G.; Burd, L. What do we know about prevalence and management of intoxicatedwomen during labor and delivery? Glob. Pediatr. Health 2019, 6, 2333794X19894799. [CrossRef] [PubMed]
104. Elliott, A.J.; Kinney, H.C.; Haynes, R.L.; Dempers, J.D.; Wright, C.; Fifer, W.P.; Angal, J.; Boyd, T.K.; Burd, L.; Burger, E.; et al.Concurrent prenatal drinking and smoking increases risk for SIDS: Safe passage study report. EClinicalMedicine 2020, 19, 100247.[CrossRef]
105. Burd, L.; Martsolf, J.; Klug, M. Children with fetal alcohol syndrome in North Dakota: A case control study utilizing birthcertificate data. Addict. Biol. 1996, 1, 181–189. [CrossRef]
106. Burd, L.; Klug, M.; Martsolf, J. Increased sibling mortality in children with fetal alcohol syndrome. Addict. Biol. 2004, 9, 179–186.[CrossRef]
107. Schwartz, M.; Hart, B.; Weyrauch, D.; Benson, P.; Klug, M.G.; Burd, L. The hidden face of fetal alcohol spectrum disorder. Curr.Women’s Health Rev. 2017, 13, 96–102. [CrossRef]
108. Li, Q.; Fisher, W.W.; Peng, C.-Z.; Williams, A.D.; Burd, L. Fetal alcohol spectrum disorders: A population based study of prematuremortality rates in the mothers. Matern. Child Health J. 2012, 16, 1332–1337. [CrossRef]
109. Petrenko, C.L.M.; Alto, M.E.; Hart, A.R.; Freeze, S.M.; Cole, L.L. “I’m doing my part, I just need help from the community”:Intervention implications of foster and adoptive parents’ experiences raising children and young adults with FASD. J. Fam. Nurs.2019, 25, 314–347. [CrossRef]
110. Rutman, D.; van Bibber, M. Parenting with fetal alcohol spectrum disorder. Int. J. Mental Health Addict. 2010, 8, 351–361. [CrossRef]111. Jirikowic, T.; Olson, H.C.; Astley, S. Parenting stress and sensory processing: Children with fetal alcohol spectrum disorders.
Occup. Particip. Health 2012, 32, 160–168. [CrossRef]112. Hanlon-Dearman, A.; Chen, M.L.; Olson, H.C. Understanding and managing sleep disruption in children with fetal alcohol
spectrum disorder. Biochem. Cell Biol. 2018, 96, 267–274. [CrossRef] [PubMed]113. Joya, X.; Garcia-Algar, O.; Salat-Batlle, J.; Pujades, C.; Vall, O. Advances in the development of novel antioxidant therapies as
an approach for fetal alcohol syndrome prevention. Birth Defects Res. Part A Clin. Mol. Teratol. 2015, 103, 163–177. [CrossRef][PubMed]
114. Peng, Y.; Kwok, K.; Yang, P.; Ng, S.; Liu, J.; Wong, O.; He, M.; Kung, H.; Lin, M. Ascorbic acid inhibits ROS production, NF-κBactivation and prevents ethanol-induced growth retardation and microencephaly. Neuropharmacology 2005, 48, 426–434. [CrossRef][PubMed]
115. Wentzel, P.; Rydberg, U.; Eriksson, U.J. Antioxidative treatment diminishes ethanol-induced congenital malformations in the rat.Alcohol. Clin. Exp. Res. 2006, 30, 1752–1760. [CrossRef]
116. Shirpoor, A.; Nemati, S.; Ansari, M.H.K.; Ilkhanizadeh, B. The protective effect of vitamin E against prenatal and early postnatalethanol treatment-induced heart abnormality in rats: A 3-month follow-up study. Int. Immunopharmacol. 2015, 26, 72–79.[CrossRef]
117. Zhang, Y.; Wang, H.; Li, Y.; Peng, Y. A review of interventions against fetal alcohol spectrum disorder targeting oxidative stress.Int. J. Dev. Neurosci. 2018, 71, 140–145. [CrossRef]
118. Zheng, D.; Li, Y.; He, L.; Tang, Y.; Li, X.; Shen, Q.; Yin, D.; Peng, Y. The protective effect of astaxanthin on fetal alcohol spectrumdisorder in mice. Neuropharmacology 2014, 84, 13–18. [CrossRef]
119. Tiwari, V.; Chopra, K. Protective effect of curcumin against chronic alcohol-induced cognitive deficits and neuroinflammation inthe adult rat brain. Neuroscience 2013, 244, 147–158. [CrossRef] [PubMed]
120. Cantacorps, L.; Montagud-Romero, S.; Valverde, O. Curcumin treatment attenuates alcohol-induced alterations in a mouse modelof foetal alcohol spectrum disorders. Prog. Neuro-Psychopharmacol. Biol. Psychiatry 2020, 100, 109899. [CrossRef]
121. Yuan, H.; Zhang, W.; Li, H.; Chen, C.; Liu, H.; Li, Z. Neuroprotective effects of resveratrol on embryonic dorsal root ganglionneurons with neurotoxicity induced by ethanol. Food Chem. Toxicol. 2013, 55, 192–201. [CrossRef] [PubMed]
122. Luo, G.; Huang, B.; Qiu, X.; Xiao, L.; Wang, N.; Gao, Q.; Yang, W.; Hao, L. Resveratrol attenuates excessive ethanol exposureinduced insulin resistance in rats via improving NAD+/NADH ratio. Mol. Nutr. Food Res. 2017, 61, 1700087. [CrossRef] [PubMed]
101
Nutrients 2021, 13, 3452
123. Heaton, M.B.; Mitchell, J.J.; Paiva, M. Amelioration of ethanol-induced neurotoxicity in the neonatal rat central nervous systemby antioxidant therapy. Alcohol. Clin. Exp. Res. 2000, 24, 512–518. [CrossRef]
124. Young, J.K.; Giesbrecht, H.E.; Eskin, M.N.; Aliani, M.; Suh, M. Nutrition implications for fetal alcohol spectrum disorder. Adv.Nutr. 2014, 5, 675–692. [CrossRef] [PubMed]
125. Mitchell, J.J.; Paiva, M.; Heaton, M.B. The antioxidants vitamin E and beta-carotene protect against ethanol-induced neurotoxicityin embryonic rat hippocampal cultures. Alcohol 1999, 17, 163–168. [CrossRef]
126. Marrs, J.A.; Clendenon, S.G.; Ratcliffe, D.R.; Fielding, S.M.; Liu, Q.; Bosron, W.F. Zebrafish fetal alcohol syndrome model: Effectsof ethanol are rescued by retinoic acid supplement. Alcohol 2010, 44, 707–715. [CrossRef]
127. Sarmah, S.; Marrs, J.A. Complex cardiac defects after ethanol exposure during discrete cardiogenic events in zebrafish: Preventionwith folic acid. Dev. Dyn. 2013, 242, 1184–1201. [CrossRef] [PubMed]
128. Carey, L.C.; Coyle, P.; Philcox, J.C.; Rofe, A.M. Zinc Supplementation at the time of ethanol exposure ameliorates teratogenicity inmice. Alcohol. Clin. Exp. Res. 2003, 27, 107–110. [CrossRef]
129. Summers, B.L.; Rofe, A.M.; Coyle, P. Dietary zinc supplementation throughout pregnancy protects against fetal dysmorphologyand improves postnatal survival after prenatal ethanol exposure in mice. Alcohol. Clin. Exp. Res. 2009, 33, 591–600. [CrossRef]
130. Jacobson, S.W.; Carter, R.C.; Molteno, C.D.; Stanton, M.E.; Herbert, J.S.; Lindinger, N.M.; Lewis, C.E.; Dodge, N.C.; Hoyme,H.E.; Zeisel, S.H.; et al. Efficacy of maternal choline supplementation during pregnancy in mitigating adverse effects of prenatalalcohol exposure on growth and cognitive function: A randomized, double-blind, placebo-controlled clinical trial. Alcohol. Clin.Exp. Res. 2018, 42, 1327–1341. [CrossRef]
131. Yanaguita, M.Y.; Gutierrez, C.M.; Ribeiro, C.N.M.; Lima, G.A.; Machado, H.R.; Peres, L.C. Pregnancy outcome in ethanol-treatedmice with folic acid supplementation in saccharose. Child’s Nerv. System 2008, 24, 99–104. [CrossRef]
132. Helfrich, K.K.; Saini, N.; Kling, P.J.; Smith, S.M. Maternal iron nutriture as a critical modulator of fetal alcohol spectrum disorderrisk in alcohol-exposed pregnancies. Biochem. Cell Biol. 2018, 96, 204–212. [CrossRef]
133. Grant, T.M.; Ernst, C.C.; Streissguth, A.; Stark, K. Preventing alcohol and drug exposed births in Washington State: Interventionfindings from three parent-child assistance program sites. Am. J. Drug Alcohol Abuse 2005, 31, 471–490. [CrossRef]
134. Thanh, N.X.; Jonsson, E.; Moffatt, J.; Dennett, L.; Chuck, A.W.; Birchard, S. An economic evaluation of the parent–child assistanceprogram for preventing fetal alcohol spectrum disorder in Alberta, Canada. Adm. Policy Mental Health Mental Health Serv. Res.2015, 42, 10–18. [CrossRef] [PubMed]
135. Greenmyer, J.R.; Popova, S.; Klug, M.G.; Burd, L. Fetal alcohol spectrum disorder: A systematic review of the cost of and savingsfrom prevention in the United States and Canada. Addiction 2020, 115, 409–417. [CrossRef] [PubMed]
136. World Health Organization. Global Strategy to Reduce the Harmful Use of Alcohol; World Health Organization: Geneva, Switzerland, 2010.137. World Health Organization. Global Action Plan. for the Prevention and Control. of NCDs 2013–2020; World Health Organization:
Geneva, Switzerland, 2013.
102
nutrients
Review
Alcohol’s Impact on the Cardiovascular System
Michael Roerecke 1,2,3
Citation: Roerecke, M. Alcohol’s
Impact on the Cardiovascular System.
Nutrients 2021, 13, 3419. https://
doi.org/10.3390/nu13103419
Academic Editor: Peter Anderson
Received: 10 August 2021
Accepted: 24 September 2021
Published: 28 September 2021
Publisher’s Note: MDPI stays neutral
with regard to jurisdictional claims in
published maps and institutional affil-
iations.
Copyright: © 2021 by the author.
Licensee MDPI, Basel, Switzerland.
This article is an open access article
distributed under the terms and
conditions of the Creative Commons
Attribution (CC BY) license (https://
creativecommons.org/licenses/by/
4.0/).
1 Centre for Addiction and Mental Health (CAMH), Institute for Mental Health Policy Research, 33 UrsulaFranklin Street, Toronto, ON M5T 2S1, Canada; [email protected]
2 Campbell Family Mental Health Research Institute, CAMH, 33 Ursula Franklin Street,Toronto, ON M5T 2S1, Canada
3 Dalla Lana School of Public Health, University of Toronto, 155 College Street, Toronto, ON M5T 1P8, Canada
Abstract: Alcohol consumption has been shown to have complex, and sometimes paradoxical, asso-ciations with cardiovascular diseases (CVDs). Several hundred epidemiological studies on this topichave been published in recent decades. In this narrative review, the epidemiological evidence will beexamined for the associations between alcohol consumption, including average alcohol consumption,drinking patterns, and alcohol use disorders, and CVDs, including ischaemic heart disease, stroke,hypertension, atrial fibrillation, cardiomyopathy, and heart failure. Methodological shortcomings,such as exposure classification and measurement, reference groups, and confounding variables (mea-sured or unmeasured) are discussed. Based on systematic reviews and meta-analyses, the evidenceseems to indicate non-linear relationships with many CVDs. Large-scale longitudinal epidemiologicalstudies with multiple detailed exposure and outcome measurements, and the extensive assessment ofgenetic and confounding variables, are necessary to elucidate these associations further. Conflictingassociations depending on the exposure measurement and CVD outcome are hard to reconcile, andmake clinical and public health recommendations difficult. Furthermore, the impact of alcohol onother health outcomes needs to be taken into account. For people who drink alcohol, the less alcoholconsumed the better.
Keywords: alcohol drinking; binge drinking; cardiovascular diseases; ischaemic heart disease;hypertension; stroke; review
1. Introduction
Alcohol is one of the most important risk factors for disease and mortality globally [1].The relationship between alcohol consumption and cardiovascular diseases (CVDs) iscomplex, and hundreds if not thousands of individual research reports have been published.Due to the potential beneficial effects of alcohol consumption on some CVD outcomes, therelationship between alcohol consumption and CVDs, in particular ischaemic heart disease(IHD), is controversial and highly debated [2–7].
Diseases under the umbrella of CVDs are differential in their aetiology. Therefore,based on major reviews and meta-analyses, this review is divided into the major CVDsub-categories: IHD, ischaemic stroke (IS), haemorrhagic stroke (HS), hypertension, atrialfibrillation (AF), cardiomyopathy, and heart failure.
Alcohol consumption is multi-dimensional, and there is no agreement in the literatureon how to label different levels of alcohol consumption. What is considered low, moderate,and heavy alcohol consumption varies widely. Even the amount of alcohol in a ‘standard’drink varies considerably [8]. For example, in the UK, one standard unit is 8 g pure alcohol(half a pint); in the US, it is 14 g per standard drink; and in Canada, it is 13.6 g. Episodicheavy drinking, sometimes called ‘binge’ drinking, is not consistently defined [9–12]. Inthe US, episodic heavy drinking occasions are defined as alcohol consumption that bringsthe blood alcohol concentration to at least 0.08% (or 0.08 g of alcohol per deciliter), corre-sponding to ≥5 US standard drinks per occasion in men and ≥4 standard drinks in women,
Nutrients 2021, 13, 3419. https://doi.org/10.3390/nu13103419 https://www.mdpi.com/journal/nutrients103

Nutrients 2021, 13, 3419
in about 2 h [13]. Accordingly, in this narrative review, in order to standardize the exposure,alcohol intake is referred to in grams of pure alcohol based on reported conversion factors.The following search terms were used in Medline and Embase: (cardiovascular diseasesor cardiac diseases or stroke or heart diseases or heart failure or cardiac myopathy orcardiac arrhythmia or hypertensive heart disease or hypertension or high blood pressureor elevated blood pressure or resistant hypertension).mp AND (alcohol consumption.mp.or exp alcohol consumption) AND (systematic reviews and meta-analysis).mp.
2. Ischaemic Heart Disease
Alcohol consumption and IHD are both highly prevalent in high-income countries.Many systematic reviews and meta-analyses [5,14–20] and numerous individual studieshave been published in recent decades on the relationship between alcohol consumptionand IHD, or myocardial infarction, the main subcategory of IHD. This relationship andits implications remain controversial due to a lack of long-term randomized controlledtrials with CVD endpoints. Most meta-analyses of epidemiological data on the topic havefound a J-shaped or sometimes inverse relationship between average alcohol consumptionand IHD, with lifetime abstainers showing a higher risk compared to current ‘moderate’drinkers (various amounts of alcohol are used to define these drinking groups), and thenan uptake of the risk curve to similar or higher risks compared to those seen for heavierdrinkers. Oftentimes, whether or not a J-curve or an inverse or U-shaped relationship isobserved depends on the range of alcohol consumption reported in an individual studyand the specific IHD endpoint considered (fatal or non-fatal).
The J-shaped risk relationship has been found in both sexes and for IHD morbidityand mortality [16,21]. In a meta-analysis comprising 957,684 participants and 38,627 events,a J-shaped curve in relation to lifetime abstainers was observed in women for both fatal andnon-fatal IHD outcomes, and an inverse relationship was observed in men with non-fatalIHD events [16]. Using only studies fully stratified by sex and endpoint, the nadir wasfound at 32 g per day for IHD mortality in men, 69 g per day for IHD morbidity in men,11 g per day for IHD mortality in women, and 14 g per day for IHD morbidity in women.The evidence suggests that the type of alcoholic beverage does not play a role in the shapeof the relationship. A meta-analysis [22] of fatal or non-fatal CVD events showed that aJ-shaped association was observed for the consumption of wine, an inverse relationship forbeer consumption, and a negative association for spirits.
IHD mortality among men who drink 60 or more g of pure alcohol on average perday has been found to be similar to that of lifetime abstainers [18]. Among women, suchdrinking levels are rarely observed in typical epidemiological studies. The risk from alcoholconsumption is typically higher in women for the same amount of alcohol consumptioncompared to men, due to body fat distribution, body size, and alcohol solubility [23–25].Nevertheless, both men and women with alcohol use disorders, who oftentimes, but notalways, drink very heavily, have been associated with some of the highest mortality risksfor IHD (RR = 1.62; 95% CI: 1.34 to 1.95 in men; RR = 2.09; 95% CI: 1.28 to 3.41 in womencompared to the general population) [17].
Due to the large heterogeneity observed in meta-analyses of alcohol consumption andCVD outcomes, it is clear that not all drinking is associated with a lower risk for IHD. Forexample, data from Russia consistently show a detrimental association with IHD outcomes;however, it should be noted that the most prevalent drinking pattern in Russia at the timeof these studies was infrequent heavy drinking rather than low amounts more frequently.Both drinking patterns would result in the same magnitude of average alcohol intake overthe week [26,27].
Perhaps the most compelling observational evidence for a beneficial associationbetween average alcohol consumption and IHD comes from an individual-participantanalysis of nearly 600,000 current drinkers of the Emerging Risk Factors Collaboration,EPIC-CVD, and the UK Biobank cohorts [28]. In an inverse relationship, the hazard ratiofor an increase in 100 g pure alcohol per week in comparison to >0 to <50 g per week was
104

Nutrients 2021, 13, 3419
0.94 (95% CI: 0.91–0.97) for myocardial infarction (14,539 events). However, except formyocardial infarction, the risk (per 100 g per week increase in consumption) for stroke(HR = 1.14, 1.10–1.17), coronary disease other than myocardial infarction (1.06, 1.00–1.11),heart failure (1.09, 1.03–1.15), and fatal hypertensive disease (1.24, 1.15–1.33) increasedin a linear fashion. The shape of the relationship between average alcohol consumptionand myocardial infarction was J-shaped for fatal myocardial infarction (2748 events) andnon-fatal coronary disease excluding myocardial infarction (6000 events), and inverse fornon-fatal myocardial infarction (11,706 events). The data point for the highest consumptionwas 300 g per week, which translates to about 25 standard drinks of 12 g each per week, or3.57 standard drinks per day on average. The analyses were adjusted for age, sex, smoking,and history of diabetes. Due to the strong association with MI, the nadir (i.e., the lowestrisk) for overall CVD events (39,018 events) was at an alcohol consumption level of 100 gper week.
The threat of unmeasured confounding variables and other sources of bias [7] is notunique to the alcohol–IHD relationship. Early on, the sick-quitter hypothesis [29] waswidely thought to be the cause of the J-shaped curve reported in many studies. Meta-analyses have shown that former drinkers are associated with a higher risk for IHDmortality than lifetime or long-term abstainers (RR = 1.25; 95% CI: 1.15–1.36) [30]. Noassociation was found for both sexes for IHD morbidity. The sick-quitter hypothesis hasbeen systematically evaluated, and meta-analyses have shown that even when lifetimeabstainers are the reference group, thereby eliminating the sick-quitter effect, or, in otherwords, former drinking bias, a lower risk for people reporting alcohol consumption up to30 g per day without irregular heavy drinking episodes remained [5].
Aside from the issue of reference groups, heavy episodic drinking, i.e., drinking aboutfive standard drinks for men and four for women on one occasion or within two hoursbased on some definitions [13], seems to be an effect modifier for the relationship betweenaverage alcohol consumption and IHD. A meta-analysis [5] found an RR = 1.75 (95% CI:1.36–2.25) for people who drink up to 30 g on average per day, but who actually havea drinking pattern characterized by less frequent drinking and mostly heavy drinkingepisodes compared to drinkers without such a drinking pattern. This increased risk seemsto negate any lower risk for IHD found in people who drink up to 30 g on average per daywithout heavy drinking episodes. Thus, the risk was similar for lifetime abstainers andpeople who consume alcohol mostly in heavy drinking episodes. However, the concept ofheavy episodic drinking, at least regarding the CVD effects of alcohol consumption, is notclearly defined, and different studies use different thresholds for heavy episodic drinking.These vary from three drinks per drinking day to six or even eight drinks per drinkingday [31,32]. For an overview of mechanisms, please see [33,34].
Adjustment for possible confounders, some of which may lie in the pathway of CVDdevelopment and could be considered mediators, remains an issue in alcohol epidemi-ology [35]. An analysis of individual-level data from eight cohort studies showed thatadjustment for age; year of baseline; smoking; body mass index; education; physical activ-ity; energy intake; intake of polyunsaturated fat, monounsaturated fat, saturated fat, fiber,and cholesterol; and study design did not explain the J-shaped association [36].
A J-shaped or inverse association has also been reported in patients with CVD. In ameta-analysis of 11 cohorts published in 2014, an inverse risk relationship between averagealcohol consumption and IHD in patients with hypertension was reported [37]. Similarassociations have been reported among people with diabetes and non-fatal myocardialinfarction [38–42]. A recent large-scale study from the UK reported a J-curve for most CVDoutcomes in patients with CVD [43].
The pathways by which alcohol consumption may exert a beneficial effect on ischaemicdiseases are not well understood. In the absence of long-term randomized controlledtrials on CVD endpoints, 44 intervention studies on surrogate biomarkers for CVD weresummarized in a meta-analysis in 2011 [44]. The results showed a substantial dose–responserelationship for high-density lipoprotein-C with (in comparison to no alcohol consumption):
105
Nutrients 2021, 13, 3419
mean difference: 0.072 mmol per L (95% CI: 0.024–0.119) for 12.5–29.9 g per day; meandifference: 0.103 mmol per L (95% CI: 0.065–0.141) for 30–60 g per day; mean difference:0.141 mmol per L (95% CI: 0.042–0.240) for >60 g per day. The effect on fibrinogen levelswas −0.20 g per L (95% CI: −0.29 to −0.11), and for Adiponectin, 0.56 mg per L (95% CI:0.39–0.72). Alcohol consumption did not substantially change the levels of total cholesterol,low density lipoprotein cholesterol, triglycerides, Lp(a) lipoprotein, C-reactive protein,interleukin 6, or tumour necrosis factor α. Analyses stratified by type of alcoholic beveragewere similar to analyses of all alcoholic beverages combined.
Due to the limitations of typical epidemiological studies, other types of study design,such as Mendelian randomization studies using an instrumental variable approach, soughtto answer questions about the causality of the lower risk of low-level alcohol drinkers.However, the use of such an approach [45,46], which depends on several assumptions thatare not easily met in a complex relationship, such as between alcohol consumption patternsand CVD risk, is highly debated [47–50].
3. Hypertension
Several meta-analyses have been published over the last two decades that summarizethe relationship between average alcohol consumption and incidence of hypertension [51,52,54–58].While older reviews (e.g., [54,58]) found a small but significantly lower risk in women whoreported very small amounts of alcohol intake, more recent meta-analyses with more datadid not find such an association. In particular, in a meta-analysis of 361,254 participantsfrom 20 cohort studies (125,907 men and 235,347 women) with 90,160 incident cases ofhypertension, the risk compared to abstainers was elevated for any amount of alcoholconsumption in men, and in women, there was no increased risk for up to 24 g per day(RR = 0.94; 95% CI: 0.88–1.01), with an increased risk beyond this level of consumption [57].The risk to former drinkers was similar to lifetime abstainers (RR = 1.03; 95% CI: 0.89–1.20).Among men, the risk increased to 1.68 (95% CI: 1.31–2.14) for drinking 60 g per day onaverage. No such data were available for women. The difference in risk for up to 24 gper day for women compared to men was significant (RR = 0.79; 95% CI: 0.67–0.93). Onepossible explanation for this difference could be more detrimental drinking patterns amongmen, which typically includes more binge drinking episodes. Heavy episodic drinkingelevates blood pressure and, subsequentially, the risk for hypertension [73,74].
The relationship between alcohol consumption and blood pressure and hyperten-sion has to be seen as causal and reversible, with experimental evidence showing thata reduction in alcohol consumption leads to a reduction in both systolic and diastolicblood pressure in a dose–response relationship with effects of clinical importance [75]. Thereduction in systolic blood pressure is sizable with a mean difference of −5.50 mmHg(95% CI: −6.70 to −4.30) for people who drink 72 g per day on average and reduce theirconsumption by about 50%. There was no discernible difference for drinkers of up to24 g per day in comparison to abstainers; however, data were sparse. For a discussion ofmechanisms, please see [74,76].
4. Stroke
There are two major stroke subtypes with differing aetiologies: IS (based on ischaemicdisease processes) and HS (based on haemorrhagic processes, i.e., bleeding processes). Dueto higher prevalence, IS typically drives investigations of total stroke. With similarities inaetiology, one would expect IS to show a similar relationship with alcohol consumption incomparison to IHD. Indeed, several earlier [52,60] and more recent [59,62] meta-analyseshave shown that the association between average alcohol consumption and IS follows aJ-curve. In a meta-analysis of 27 prospective cohort studies with 3824 IS cases (2216 menand 1608 women) compared to abstainers, the risk for IS was below one for up to 24 g perday on average (RR = 0.90 (95% CI: 0.85–0.95) for <12 g; RR = 0.92 (95% CI: 0.87–0.97) for12–24 g per day), and increased for alcohol consumption >24 g per day [59]. In contrast,the analysis of the Emerging Risk Factors Collaboration, EPIC-CVD, and the UK Biobank
106
Nutrients 2021, 13, 3419
cohorts [28] showed an increased risk for both fatal and non-fatal total stroke based onaverage alcohol consumption.
The risk for intracerebral and subarachnoid HS increased with every drink, and theconsumption of >48 g per day resulted in an RR = 1.67 (95% CI: 1.25–2.23) for intracerebralstroke and 1.82 (95% CI: 1.18–2.82) for subarachnoid HS [59,61].
Several studies have reported an elevated risk for both IS and HS from heavy episodicdrinking [77–79]. One study showed that the risk increased with a higher frequency ofheavy episodic drinking [78]. Alcohol consumption is also a trigger for stroke events. Thehigher the alcohol consumption within 24 h or one week, the higher the risk for IS orHS [53,80].
5. AF and Cardiomyopathy
Several meta-analyses have investigated the risk of AF in relation to alcohol con-sumption [63–66]. In a meta-analysis of seven cohort studies with 12,554 cases of AF, incomparison to non-drinkers, the risk for AF was elevated in all drinking groups, evenwhen heavy episodic drinkers were excluded from the analysis. The pooled linear riskincrease was 1.08 (95% CI: 1.06–1.10) for each 12 g per day increase in average alcoholconsumption. More recently, using data from 249,496 participants, a meta-analysis con-cluded that there was no increase in risk for AF for consumption of 6–7 drinks (10–12 gper drink) per week [63]. Another large cohort study of 403,281 participants from the UKBiobank with 21,312 incident cases of AF reported a J-shaped relationship for averagealcohol consumption, with people drinking 56 g per week or less having the lowest riskin comparison to lifetime abstainers [67]. A beverage-specific analysis showed that theJ-shaped curve was found in wine drinkers, but not in beer or spirit drinkers [67]. A recentrandomized controlled trial indicates that a reduction in drinking is associated with a lowerrecurrence of AF [81].
While the exact amounts remain unknown, alcohol consumption (either regular orirregular), can cause, aside from hypertension, structural damage to the heart muscleand arrythmias [68]. Cardiomyopathy, which is characterized by ventricle dilatation,hypertrophy, and dysfunction, can be caused by alcohol consumption and its metabolites,both of which have a direct toxic effect on the heart muscles [68]. A quantification ofa potential dose–response relationship has not been possible to date; however, it seemsthat the consumption of >80 g per day leads to a substantially increased risk [69]. Fewstudies have been conducted among women, for which less alcohol consumption perday and a short duration of such consumption over several years have a similar effectcompared to men. It has been estimated that 1–40% of alcohol use disorder patients havecardiomyopathy, or, conversely, that 23–47% of patients with dilated cardiomyopathy have,in fact, alcoholic cardiomyopathy [69].
6. Heart Failure
CVD categories, such as IHD, hypertension, and cardiomyopathy, increase the riskof heart failure. Three meta-analyses largely came to similar conclusions [70–72]. Inthe most recent meta-analysis published in 2018, which consisted of 355,804 participantswith 13,738 cases of HF based on 13 cohort studies, it was shown that the dose–responserelationship between alcohol consumption and HF was curvilinear [71]. Compared tonon-drinkers, the risk for 1–84 g per week, 85–168 g per week, 168–336 g per week, and>336 g per week were RR = 0.86 (95% CI: 0.81–0.90), 0.88 (0.77–1.01), 0.91 (0.80–1.04), and1.16 (0.92–1.47), respectively. Based on eight studies, the meta-analysis concluded thatformer drinkers are at a higher risk for AF compared to lifetime abstainers (RR = 1.22;95% CI: 1.11–1.33) [71]. Due to data limitations, the role of sex and other potential effectmodifiers remains unclear.
107

Nutrients 2021, 13, 3419
7. Conclusions
Epidemiological studies indicate a complex relationship between various dimensionsof alcohol consumption (i.e., life course drinking patterns) and CVD outcomes. Indeed,substantial heterogeneity is evident. Most epidemiological studies to date have relied ona single measurement of alcohol intake at baseline. It is assumed that the self-reporteddrinking levels, preferably including drinking patterns, remains the same before and afterthe baseline measurement. For many people this is clearly not the case, and even lifetimeabstainers are hard to identify [82].
Does some alcohol consumption protect some people against ischaemic diseases tosome degree? Epidemiological data, as outlined in this review, suggest that this is the case(Table 1). For example, a J-shaped relationship emerges for average alcohol consumptionand IHD and IS. On the other hand, the relationship with incident hypertension, which is apotent risk factor for most if not all CVDs, is quite different between men and women, withan increased risk for any amount of alcohol consumption in men. While potential sourcesof bias, such as the reference group, i.e., separating lifetime abstainers, former drinkers,and heavy episodic drinkers, have been systematically investigated for the relationshipbetween alcohol and IHD, their impact on other CVD outcomes remains less clear. Whilethere is a lack of large-scale randomized studies on the long-term effect of alcohol con-sumption on various CVD endpoints, short-term clinical trial data indicate a sizable effectof alcohol consumption on HDL-C and fibrinogen. However, the heterogeneity found inepidemiological studies points to more than just biological differences. Socioeconomicstatus, for example, might influence the impact of alcohol on CVD [83]. More research isnecessary to advance knowledge on this topic.
Table 1. Shape of the relation between alcohol consumption and CVD categories based on current evidence syntheses.
CVD Category Shape of the Relationship Meta-Analyses and Systematic Reviews
Ischaemic heart disease J-shaped, modified by episodic heavy drinking [5,14–22,28,30,37,43,44,51–53]
HypertensionAny consumption detrimental in men,detrimental beyond 24 g in women; reduction indrinkers >24 g/day lowers blood pressure
[51,52,54–58]
Stroke
Ischaemic stroke: J-shaped, possibly modified byepisodic heavy drinkingHaemorrhagic stroke:detrimental, possibly modified by episodicheavy drinking
[21,28,51,52,59–62]
Atrial fibrillation Detrimental beyond 60 g/week [63–67]
Cardiomyopathy Consumption of >80 g/day leads to asubstantially increased risk [68,69]
Heart failure J-shaped [63,70–72]
It should also be noted that due to the limitations of alcohol-epidemiological studies,the beneficial associations tend to be overestimated. Furthermore, potential beneficialeffects of non-heavy alcohol consumption on CVD endpoints, as described in this review,have already been observed at very low levels, such as 100 g pure alcohol per week, which,at the lower end, translates to about 1 drink every other day. As such, most drinkersshould drink less. Recommending drinking as a primary or secondary prevention measurefor CVDs, which comes up occasionally in the literature, should be discouraged due tothe substantial risks of any alcohol consumption for many health outcomes. Alcohol is acarcinogen, neuro-toxin, hepato-toxin, and psychoactive drug.
Funding: This research received no external funding.
Institutional Review Board Statement: Not applicable, as the study did not involve humans oranimals.
108

Nutrients 2021, 13, 3419
Informed Consent Statement: Not applicable.
Data Availability Statement: Not applicable.
Conflicts of Interest: The author declares no conflict of interest.
References
1. World Health Organization. Global Status Report on Alcohol and Health; World Health Organization: Geneva, Switzerland, 2018.2. O’Keefe, J.H.; Bhatti, S.K.; Bajwa, A.; DiNicolantonio, J.J.; Lavie, C.J. Alcohol and cardiovascular health: The dose makes the
poison . . . or the remedy. Mayo Clin. Proc. 2014, 89, 382–393. [CrossRef]3. Chikritzhs, T.N.; Naimi, T.S.; Stockwell, T.R.; Liang, W. Mendelian randomisation meta-analysis sheds doubt on protective
associations between ‘moderate’ Alcohol. consumption and coronary heart disease. Evid. Based Med. 2015, 20, 38. [CrossRef]4. Rehm, J.; Gmel Sr, G.E.; Gmel, G.; Hasan, O.S.M.; Imtiaz, S.; Popova, S.; Probst, C.; Roerecke, M.; Room, R.; Samokhvalov, A.V.;
et al. The relationship between different dimensions of Alcohol. use and the burden of disease—An update. Addiction 2017, 112,968–1001. [CrossRef] [PubMed]
5. Roerecke, M.; Rehm, J. Alcohol consumption, drinking patterns, and ischemic heart disease: A narrative review of meta-analysesand a systematic review and meta-analysis of the impact of heavy drinking occasions on risk for moderate drinkers. BMC Med.2014, 12, 182. [CrossRef] [PubMed]
6. O’Keefe, E.L.; DiNicolantonio, J.J.; O’Keefe, J.H.; Lavie, C.J. Alcohol and CV Health: Jekyll and Hyde J-Curves. Prog. Cardiovasc.Dis. 2018, 61, 68–75. [CrossRef]
7. Naimi, T.S.; Stockwell, T.; Zhao, J.; Xuan, Z.; Dangardt, F.; Saitz, R.; Liang, W.; Chikritzhs, T. Selection biases in observationalstudies affect associations between ‘moderate’ Alcohol. consumption and mortality. Addiction 2017, 112, 207–214. [CrossRef]
8. Kalinowski, A.; Humphreys, K. Governmental standard drink definitions and low-risk Alcohol. consumption guidelines in 37countries. Addiction 2016, 111, 1293–1298. [CrossRef]
9. Dawson, D.A. Defining risk drinking. Alcohol. Res. Health J. Natl. Inst. Alcohol. Abuse Alcohol. 2011, 34, 144–156.10. Gmel, G.; Kuntsche, E.; Rehm, J. Risky single-occasion drinking: Bingeing is not bingeing. Addiction 2011, 106, 1037–1045.
[CrossRef] [PubMed]11. Dawson, D.A.; Grant, B.F. The “gray area” of consumption between moderate and risk drinking. J. Stud. Alcohol Drugs 2011, 72,
453–458. [CrossRef] [PubMed]12. Biagioni, N.; Pettigrew, S.; Jones, S.C.; Stafford, J.; Daube, M.; Chikritzhs, T. Defining binge drinking: Young drinkers’ perceptions
of risky Alcohol. consumption. Public Health 2017, 152, 55–57. [CrossRef] [PubMed]13. National Institute on Alcohol. Abuse and Alcoholism (NIAAA). NIAAA Council approves definition of binge drinking. NIAAA
Newsl. 2004, 3, 3.14. Corrao, G.; Rubbiati, L.; Bagnardi, V.; Zambon, A.; Poikolainen, K. Alcohol and coronary heart disease: A meta-analysis. Addiction
2000, 95, 1505–1523. [CrossRef] [PubMed]15. Roerecke, M.; Rehm, J. Irregular heavy drinking occasions and risk of ischemic heart disease: A systematic review and meta-
analysis. Am. J. Epidemiol. 2010, 171, 633–644. [CrossRef] [PubMed]16. Roerecke, M.; Rehm, J. The cardioprotective association of average Alcohol. consumption and ischaemic heart disease: A
systematic review and meta-analysis. Addiction 2012, 107, 1246–1260. [CrossRef]17. Roerecke, M.; Rehm, J. Cause-specific mortality risk in Alcohol. use disorder treatment patients: A systematic review and
meta-analysis. Int. J. Epidemiol. 2014, 43, 906–919. [CrossRef] [PubMed]18. Roerecke, M.; Rehm, J. Chronic heavy drinking and ischaemic heart disease: A systematic review and meta-analysis. Open Heart
2014, 1, e000135. [CrossRef]19. Maclure, M. Demonstration of deductive meta-analysis: Ethanol intake and risk of myocardial infarction. Epidemiol. Rev. 1993, 15,
328–351. [CrossRef]20. Zhao, J.; Stockwell, T.; Roemer, A.; Naimi, T.; Chikritzhs, T. Alcohol Consumption and Mortality From Coronary Heart Disease:
An Updated Meta-Analysis of Cohort Studies. J. Stud. Alcohol. Drugs 2017, 78, 375–386. [CrossRef]21. Ronksley, P.E.; Brien, S.E.; Turner, B.J.; Mukamal, K.J.; Ghali, W.A. Association of Alcohol. consumption with selected cardiovas-
cular disease outcomes: A systematic review and meta-analysis. BMJ 2011, 342, d671. [CrossRef]22. Costanzo, S.; Di Castelnuovo, A.; Donati, M.B.; Iacoviello, L.; de Gaetano, G. Wine, beer or spirit drinking in relation to fatal and
non-fatal cardiovascular events: A meta-analysis. Eur. J. Epidemiol. 2011, 26, 833–850. [CrossRef]23. Piano, M.R.; Thur, L.A.; Hwang, C.L.; Phillips, S.A. Effects of Alcohol. on the Cardiovascular System in Women. Alcohol. Res.
2020, 40, 12. [CrossRef] [PubMed]24. Kwo, P.Y.; Ramchandani, V.A.; O’Connor, S.; Amann, D.; Carr, L.G.; Sandrasegaran, K.; Kopecky, K.K.; Li, T.K. Gender differences
in Alcohol. metabolism: Relationship to liver volume and effect of adjusting for body mass. Gastroenterology 1998, 115, 1552–1557.[CrossRef]
25. Frezza, M.; di Padova, C.; Pozzato, G.; Terpin, M.; Baraona, E.; Lieber, C.S. High blood Alcohol. levels in women. The roleof decreased gastric Alcohol. dehydrogenase activity and first-pass metabolism. N. Engl. J. Med. 1990, 322, 95–99. [CrossRef][PubMed]
109

Nutrients 2021, 13, 3419
26. Zaridze, D.; Brennan, P.; Boreham, J.; Boroda, A.; Karpov, R.; Lazarev, A.; Konobeevskaya, I.; Igitov, V.; Terechova, T.; Boffetta, P.;et al. Alcohol and cause-specific mortality in Russia: A retrospective case-control study of 48,557 adult deaths. Lancet 2009, 373,2201–2214. [CrossRef]
27. Malyutina, S.; Bobak, M.; Kurilovitch, S.; Gafarov, V.; Simonova, G.; Nikitin, Y.; Marmot, M. Relation between heavy andbinge drinking and all-cause and cardiovascular mortality in Novosibirsk, Russia: A prospective cohort study. Lancet 2002, 360,1448–1454. [CrossRef]
28. Wood, A.M.; Kaptoge, S.; Butterworth, A.S.; Willeit, P.; Warnakula, S.; Bolton, T.; Paige, E.; Paul, D.S.; Sweeting, M.; Burgess, S.;et al. Risk thresholds for Alcohol. consumption: Combined analysis of individual-participant data for 599,912 current drinkers in83 prospective studies. Lancet 2018, 391, 1513–1523. [CrossRef]
29. Shaper, A.G.; Wannamethee, G.; Walker, M. Alcohol and mortality in british men: Explaining the u-shaped curve. Lancet 1988,332, 1267–1273. [CrossRef]
30. Roerecke, M.; Rehm, J. Ischemic heart disease mortality and morbidity rates in former drinkers: A meta-analysis. Am. J. Epidemiol.2011, 173, 245–258. [CrossRef] [PubMed]
31. Kuntsche, E.; Kuntsche, S.; Thrul, J.; Gmel, G. Binge drinking: Health impact, prevalence, correlates and interventions. Psychol.Health 2017, 32, 976–1017. [CrossRef] [PubMed]
32. Maurage, P.; Lannoy, S.; Mange, J.; Grynberg, D.; Beaunieux, H.; Banovic, I.; Gierski, F.; Naassila, M. What We Talk About WhenWe Talk About Binge Drinking: Towards an Integrated Conceptualization and Evaluation. Alcohol Alcohol. 2020, 55, 468–479.[CrossRef]
33. Piano, M.R.; Mazzuco, A.; Kang, M.; Phillips, S.A. Cardiovascular Consequences of Binge Drinking: An Integrative Review withImplications for Advocacy, Policy, and Research. Alcohol. Clin. Exp. Res. 2017, 41, 487–496. [CrossRef]
34. Molina, P.E.; Nelson, S. Binge Drinking’s Effects on the Body. Alcohol. Res. 2018, 39, 99–109.35. Wallach, J.D.; Serghiou, S.; Chu, L.; Egilman, A.C.; Vasiliou, V.; Ross, J.S.; Ioannidis, J.P.A. Evaluation of confounding in
epidemiologic studies assessing Alcohol. consumption on the risk of ischemic heart disease. BMC Med. Res. Methodol. 2020, 20,64. [CrossRef] [PubMed]
36. Hvidtfeldt, U.A.; Tolstrup, J.S.; Jakobsen, M.U.; Heitmann, B.L.; Grønbaek, M.; O’Reilly, E.; Bälter, K.; Goldbourt, U.; Hallmans,G.; Knekt, P.; et al. Alcohol intake and risk of coronary heart disease in younger, middle-aged, and older adults. Circulation 2010,121, 1589–1597. [CrossRef] [PubMed]
37. Huang, C.; Zhan, J.; Liu, Y.J.; Li, D.J.; Wang, S.Q.; He, Q.Q. Association between Alcohol. consumption and risk of cardiovasculardisease and all-cause mortality in patients with hypertension: A meta-analysis of prospective cohort studies. Mayo Clin. Proc.2014, 89, 1201–1210. [CrossRef] [PubMed]
38. Pai, J.K.; Mukamal, K.J.; Rimm, E.B. Long-term Alcohol. consumption in relation to all-cause and cardiovascular mortality amongsurvivors of myocardial infarction: The Health Professionals Follow-up Study. Eur. Heart J. 2012, 33, 1598–1605. [CrossRef]
39. Jackson, V.A.; Sesso, H.D.; Buring, J.E.; Gaziano, J.M. Alcohol consumption and mortality in men with preexisting cerebrovasculardisease. Arch. Intern. Med. 2003, 163, 1189–1193. [CrossRef]
40. Tanasescu, M.; Hu, F.B.; Willett, W.C.; Stampfer, M.J.; Rimm, E.B. Alcohol consumption and risk of coronary heart disease amongmen with type 2 diabetes mellitus. J. Am. Coll. Cardiol. 2001, 38, 1836–1842. [CrossRef]
41. Solomon, C.G.; Hu, F.B.; Stampfer, M.J.; Colditz, G.A.; Speizer, F.E.; Rimm, E.B.; Willett, W.C.; Manson, J.E. Moderate Alcohol.consumption and risk of coronary heart disease among women with type 2 diabetes mellitus. Circulation 2000, 102, 494–499.[CrossRef]
42. Beulens, J.W.; Algra, A.; Soedamah-Muthu, S.S.; Visseren, F.L.; Grobbee, D.E.; van der Graaf, Y. Alcohol consumption and risk ofrecurrent cardiovascular events and mortality in patients with clinically manifest vascular disease and diabetes mellitus: TheSecond Manifestations of ARTerial (SMART) disease study. Atherosclerosis 2010, 212, 281–286. [CrossRef]
43. Ding, C.; O’Neill, D.; Bell, S.; Stamatakis, E.; Britton, A. Association of Alcohol. consumption with morbidity and mortalityin patients with cardiovascular disease: Original data and meta-analysis of 48,423 men and women. BMC Med. 2021, 19, 167.[CrossRef] [PubMed]
44. Brien, S.E.; Ronksley, P.E.; Turner, B.J.; Mukamal, K.J.; Ghali, W.A. Effect of Alcohol. consumption on biological markersassociated with risk of coronary heart disease: Systematic review and meta-analysis of interventional studies. BMJ 2011, 342,d636. [CrossRef]
45. Holmes, M.V.; Dale, C.E.; Zuccolo, L.; Silverwood, R.J.; Guo, Y.; Ye, Z.; Prieto-Merino, D.; Dehghan, A.; Trompet, S.; Wong, A.; et al.Association between Alcohol and cardiovascular disease: Mendelian randomisation analysis based on individual participantdata. BMJ 2014, 349, g4164. [CrossRef] [PubMed]
46. Millwood, I.Y.; Walters, R.G.; Mei, X.W.; Guo, Y.; Yang, L.; Bian, Z.; Bennett, D.A.; Chen, Y.; Dong, C.; Hu, R.; et al. Conventionaland genetic evidence on Alcohol and vascular disease aetiology: A prospective study of 500,000 men and women in China. Lancet2019, 393, 1831–1842. [CrossRef]
47. Mukamal, K.J.; Rimm, E.B.; Stampfer, M.J. Reply to: Mendel’s laws, Mendelian randomization and causal inference in observa-tional data: Substantive and nomenclatural issues. Eur. J. Epidemiol. 2020, 35, 725–726. [CrossRef] [PubMed]
48. Mukamal, K.J.; Stampfer, M.J.; Rimm, E.B. Genetic instrumental variable analysis: Time to call mendelian randomization what itis. The example of Alcohol and cardiovascular disease. Eur. J. Epidemiol. 2020, 35, 93–97. [CrossRef]
110
Nutrients 2021, 13, 3419
49. Davey Smith, G.; Holmes, M.V.; Davies, N.M.; Ebrahim, S. Mendel’s laws, Mendelian randomization and causal inference inobservational data: Substantive and nomenclatural issues. Eur. J. Epidemiol. 2020, 35, 99–111. [CrossRef]
50. Gmel, G. Beneficial effects of moderate Alcohol use—A case for Occam’s razor? Addiction 2017, 112, 215–217. [CrossRef]51. Corrao, G.; Bagnardi, V.; Zambon, A.; Arico, S. Exploring the dose-response relationship between Alcohol. consumption and the
risk of several alcohol-related conditions: A meta-analysis. Addiction 1999, 94, 1551–1573. [CrossRef]52. Corrao, G.; Bagnardi, V.; Zambon, A.; La Vecchia, C. A meta-analysis of Alcohol. consumption and the risk of 15 diseases. Prev.
Med. 2004, 38, 613–619. [CrossRef]53. Mostofsky, E.; Chahal, H.S.; Mukamal, K.J.; Rimm, E.B.; Mittleman, M.A. Alcohol and Immediate Risk of Cardiovascular Events:
A Systematic Review and Dose-Response Meta-Analysis. Circulation 2016, 133, 979–987. [CrossRef] [PubMed]54. Briasoulis, A.; Agarwal, V.; Messerli, F.H. Alcohol consumption and the risk of hypertension in men and women: A systematic
review and meta-analysis. J. Clin. Hypertens. 2012, 14, 792–798. [CrossRef] [PubMed]55. Jung, M.H.; Shin, E.S.; Ihm, S.H.; Jung, J.G.; Lee, H.Y.; Kim, C.H. The effect of Alcohol. dose on the development of hypertension
in Asian and Western men: Systematic review and meta-analysis. Korean J. Intern. Med. 2020, 35, 906–916. [CrossRef] [PubMed]56. Liu, F.; Liu, Y.; Sun, X.; Yin, Z.; Li, H.; Deng, K.; Zhao, Y.; Wang, B.; Ren, Y.; Liu, X.; et al. Race- and sex-specific association
between Alcohol. consumption and hypertension in 22 cohort studies: A systematic review and meta-analysis. Nutr. Metab.Cardiovasc. Dis. 2020, 30, 1249–1259. [CrossRef] [PubMed]
57. Roerecke, M.; Tobe, S.W.; Kaczorowski, J.; Bacon, S.L.; Vafaei, A.; Hasan, O.S.M.; Krishnan, R.J.; Raifu, A.O.; Rehm, J. Sex-SpecificAssociations Between Alcohol. Consumption and Incidence of Hypertension: A Systematic Review and Meta-Analysis of CohortStudies. J. Am. Heart Assoc. 2018, 7. [CrossRef] [PubMed]
58. Taylor, B.; Irving, H.M.; Baliunas, D.; Roerecke, M.; Patra, J.; Mohapatra, S.; Rehm, J. Alcohol and hypertension: Genderdifferences in dose–response relationships determined through systematic review and meta-analysis. Addiction 2009, 104,1981–1990. [CrossRef]
59. Larsson, S.C.; Wallin, A.; Wolk, A.; Markus, H.S. Differing association of Alcohol. consumption with different stroke types: Asystematic review and meta-analysis. BMC Med. 2016, 14, 178. [CrossRef]
60. Patra, J.; Taylor, B.; Irving, H.; Roerecke, M.; Baliunas, D.; Mohapatra, S.; Rehm, J. Alcohol consumption and the risk of morbidityand mortality for different stroke types—A systematic review and meta-analysis. BMC Public Health 2010, 10, 258. [CrossRef]
61. Yao, X.; Zhang, K.; Bian, J.; Chen, G. Alcohol consumption and risk of subarachnoid hemorrhage: A meta-analysis of 14observational studies. Biomed. Rep. 2016, 5, 428–436. [CrossRef]
62. Zhang, C.; Qin, Y.-Y.; Chen, Q.; Jiang, H.; Chen, X.-Z.; Xu, C.-L.; Mao, P.-J.; He, J.; Zhou, Y.-H. Alcohol intake and risk of stroke: Adose–response meta-analysis of prospective studies. Int. J. Cardiol. 2014, 174, 669–677. [CrossRef]
63. Gallagher, C.; Hendriks, J.M.L.; Elliott, A.D.; Wong, C.X.; Rangnekar, G.; Middeldorp, M.E.; Mahajan, R.; Lau, D.H.; Sanders, P.Alcohol and incident atrial fibrillation—A systematic review and meta-analysis. Int. J. Cardiol. 2017, 246, 46–52. [CrossRef]
64. Kodama, S.; Saito, K.; Tanaka, S.; Horikawa, C.; Saito, A.; Heianza, Y.; Anasako, Y.; Nishigaki, Y.; Yachi, Y.; Iida, K.T.; et al. Alcoholconsumption and risk of atrial fibrillation: A meta-analysis. J. Am. Coll. Cardiol. 2011, 57, 427–436. [CrossRef]
65. Larsson, S.C.; Drca, N.; Wolk, A. Alcohol consumption and risk of atrial fibrillation: A prospective study and dose-responsemeta-analysis. J. Am. Coll. Cardiol. 2014, 64, 281–289. [CrossRef] [PubMed]
66. Samokhvalov, A.V.; Irving, H.M.; Rehm, J. Alcohol consumption as a risk factor for atrial fibrillation: A systematic review andmeta-analysis. Eur. J. Cardiovasc. Prev. Rehabil. 2010, 17, 706–712. [CrossRef] [PubMed]
67. Tu, S.J.; Gallagher, C.; Elliott, A.D.; Linz, D.; Pitman, B.M.; Hendriks, J.M.L.; Lau, D.H.; Sanders, P.; Wong, C.X. Risk Thresholdsfor Total and Beverage-Specific Alcohol. Consumption and Incident Atrial Fibrillation. JACC Clin. Electrophysiol. 2021. [CrossRef][PubMed]
68. Fernández-Solà, J. The Effects of Ethanol on the Heart: Alcoholic Cardiomyopathy. Nutrients 2020, 12, 572. [CrossRef] [PubMed]69. Rehm, J.; Hasan, O.S.M.; Imtiaz, S.; Neufeld, M. Quantifying the contribution of Alcohol. to cardiomyopathy: A systematic
review. Alcohol 2017, 61, 9–15. [CrossRef] [PubMed]70. Larsson, S.C.; Orsini, N.; Wolk, A. Alcohol consumption and risk of heart failure: A dose-response meta-analysis of prospective
studies. Eur. J. Heart Fail. 2015, 17, 367–373. [CrossRef]71. Larsson, S.C.; Wallin, A.; Wolk, A. Alcohol consumption and risk of heart failure: Meta-analysis of 13 prospective studies. Clin.
Nutr. 2018, 37, 1247–1251. [CrossRef]72. Padilla, H.; Gaziano, J.M.; Djoussé, L. Alcohol Consumption and Risk of Heart Failure: A Meta-Analysis. Null 2010, 38, 84–89.
[CrossRef] [PubMed]73. Piano, M.R.; Burke, L.; Kang, M.; Phillips, S.A. Effects of Repeated Binge Drinking on Blood Pressure Levels and Other
Cardiovascular Health Metrics in Young Adults: National Health and Nutrition Examination Survey, 2011–2014. J. Am. HeartAssoc. 2018, 7, e008733. [CrossRef]
74. Puddey, I.B.; Rakic, V.; Dimmitt, S.B.; Beilin, L.J. Influence of pattern of drinking on cardiovascular disease and cardiovascularrisk factors—A review. Addiction 1999, 94, 649–663. [CrossRef] [PubMed]
75. Roerecke, M.; Kaczorowski, J.; Tobe, S.W.; Gmel, G.; Hasan, O.S.M.; Rehm, J. The effect of a reduction in Alcohol. consumption onblood pressure: A systematic review and meta-analysis. Lancet Public Health 2017, 2, e108–e120. [CrossRef]
76. Puddey, I.B.; Mori, T.A.; Barden, A.E.; Beilin, L.J. Alcohol and Hypertension-New Insights and Lingering Controversies. Curr.Hypertens. Rep. 2019, 21, 79. [CrossRef] [PubMed]
111
Nutrients 2021, 13, 3419
77. Aigner, A.; Grittner, U.; Rolfs, A.; Norrving, B.; Siegerink, B.; Busch, M.A. Contribution of Established Stroke Risk Factors to theBurden of Stroke in Young Adults. Stroke 2017, 48, 1744–1751. [CrossRef]
78. Sull, J.W.; Yi, S.W.; Nam, C.M.; Ohrr, H. Binge drinking and mortality from all causes and cerebrovascular diseases in korean menand women: A Kangwha cohort study. Stroke 2009, 40, 2953–2958. [CrossRef]
79. Sundell, L.; Salomaa, V.; Vartiainen, E.; Poikolainen, K.; Laatikainen, T. Increased stroke risk is related to a binge-drinking habit.Stroke 2008, 39, 3179–3184. [CrossRef]
80. Guiraud, V.; Amor, M.B.; Mas, J.L.; Touzé, E. Triggers of ischemic stroke: A systematic review. Stroke 2010, 41, 2669–2677.[CrossRef]
81. Voskoboinik, A.; Kalman, J.M.; De Silva, A.; Nicholls, T.; Costello, B.; Nanayakkara, S.; Prabhu, S.; Stub, D.; Azzopardi, S.; Vizi, D.;et al. Alcohol Abstinence in Drinkers with Atrial Fibrillation. N. Engl. J. Med. 2020, 382, 20–28. [CrossRef]
82. Rehm, J.; Irving, H.; Ye, Y.; Kerr, W.C.; Bond, J.; Greenfield, T.K. Are lifetime abstainers the best control group in Alcohol.epidemiology? On the stability and validity of reported lifetime abstention. Am. J. Epidemiol. 2008, 168, 866–871. [CrossRef][PubMed]
83. Degerud, E.; Ariansen, I.; Ystrom, E.; Graff-Iversen, S.; Høiseth, G.; Mørland, J.; Davey Smith, G.; Næss, Ø. Life coursesocioeconomic position, Alcohol. drinking patterns in midlife, and cardiovascular mortality: Analysis of Norwegian population-based health surveys. PLoS Med. 2018, 15, e1002476. [CrossRef] [PubMed]
112

nutrients
Review
Alcohol Use and the Risk of Communicable Diseases
Neo K. Morojele 1,*, Sheela V. Shenoi 2,3, Paul A. Shuper 4,5,6,7, Ronald Scott Braithwaite 8
and Jürgen Rehm 4,5,9,10,11,12,13,14
Citation: Morojele, N.K.; Shenoi, S.V.;
Shuper, P.A.; Braithwaite, R.S.; Rehm,
J. Alcohol Use and the Risk of
Communicable Diseases. Nutrients
2021, 13, 3317. https://doi.org/
10.3390/nu13103317
Academic Editor: Peter Henneman
Received: 30 July 2021
Accepted: 14 September 2021
Published: 23 September 2021
Publisher’s Note: MDPI stays neutral
with regard to jurisdictional claims in
published maps and institutional affil-
iations.
Copyright: © 2021 by the authors.
Licensee MDPI, Basel, Switzerland.
This article is an open access article
distributed under the terms and
conditions of the Creative Commons
Attribution (CC BY) license (https://
creativecommons.org/licenses/by/
4.0/).
1 Department of Psychology, University of Johannesburg, Johannesburg 2006, South Africa2 Section of Infectious Diseases, Department of Medicine, Yale University School of Medicine,
New Haven, CT 06510, USA; [email protected] Yale Institute for Global Health, Yale University, New Haven, CT 06520, USA4 Centre for Addiction and Mental Health, Institute for Mental Health Policy Research and Campbell Family
Mental Health Research Institute, Toronto, ON M5S 2S1, Canada; [email protected] (P.A.S.);[email protected] (J.R.)
5 Dalla Lana School of Public Health, University of Toronto, Toronto, ON M5T 3M7, Canada6 Institute for Collaboration on Health, Intervention, and Policy, University of Connecticut,
Storrs, CT 06269, USA7 Alcohol, Tobacco and Other Drug Research Unit, South African Medical Research Council,
Pretoria 0001, South Africa8 Division of Comparative Effectiveness and Decision Science, Department of Population Health,
NYU Grossman School of Medicine, New York University, New York, NY 10013, USA;[email protected]
9 Department of Psychiatry, University of Toronto, Toronto, ON M5T 1R8, Canada10 Center for Interdisciplinary Addiction Research (ZIS), Department of Psychiatry and Psychotherapy,
University Medical Center Hamburg-Eppendorf (UKE), 20246 Hamburg, Germany11 Institute of Clinical Psychology and Psychotherapy, Technische Universität Dresden,
01187 Dresden, Germany12 Faculty of Medicine, Institute of Medical Science, University of Toronto, Toronto, ON M5S 1A8, Canada13 Program on Substance Abuse, Public Health Agency of Catalonia, 08005 Barcelona, Spain14 Department of International Health Projects, Institute for Leadership and Health Management,
I.M. Sechenov First Moscow State Medical University (Sechenov University), 119991 Moscow, Russia* Correspondence: [email protected]; Tel.: +27-11-559-3125
Abstract: The body of knowledge on alcohol use and communicable diseases has been growing inrecent years. Using a narrative review approach, this paper discusses alcohol’s role in the acquisitionof and treatment outcomes from four different communicable diseases: these include three conditionsincluded in comparative risk assessments to date—Human Immunodeficiency Virus (HIV)/AIDS,tuberculosis (TB), and lower respiratory infections/pneumonia—as well as Severe Acute RespiratorySyndrome Coronavirus 2 (SARS-CoV-2) because of its recent and rapid ascension as a global healthconcern. Alcohol-attributable TB, HIV, and pneumonia combined were responsible for approximately360,000 deaths and 13 million disability-adjusted life years lost (DALYs) in 2016, with alcohol-attributable TB deaths and DALYs predominating. There is strong evidence that alcohol is associatedwith increased incidence of and poorer treatment outcomes from HIV, TB, and pneumonia, via bothbehavioral and biological mechanisms. Preliminary studies suggest that heavy drinkers and thosewith alcohol use disorders are at increased risk of COVID-19 infection and severe illness. Aside fromHIV research, limited research exists that can guide interventions for addressing alcohol-attributableTB and pneumonia or COVID-19. Implementation of effective individual-level interventions andalcohol control policies as a means of reducing the burden of communicable diseases is recommended.
Keywords: alcohol; communicable diseases; infectious diseases; HIV; tuberculosis; pneumonia;severe acute respiratory syndrome coronavirus 2
1. Introduction
Alcohol consumption was recognized as a risk factor for infectious lung diseases, suchas pneumonia, as early as 1785, in Benjamin Rush’s seminal work on the effects of spirits on
Nutrients 2021, 13, 3317. https://doi.org/10.3390/nu13103317 https://www.mdpi.com/journal/nutrients113
Nutrients 2021, 13, 3317
the human body and mind [1]. However, the first global comparative risk assessment onalcohol use as a risk factor for disease burden and mortality, conducted in the last decade ofthe last century [2], did not include any effects of alcohol consumption on infectious disease.The impact of alcohol use on infectious disease outcomes only entered comparative riskassessments in the Global Burden of Disease Study and the World Health Organization’s(WHO) Global Status Reports after 2010 (starting with [3]; for an overview of the reasoningto include it, see [4,5]).
We can only speculate as to why the strong association between alcohol use andinfectious disease was overlooked in global risk assessments for such a long time. Thisoversight is all the more astonishing as the association is readily apparent in researchand practice, for instance, by the high prevalence of people with alcohol use disorders(AUDs) in tuberculosis treatment [6]; or by the strong associations between alcohol use andHIV/AIDS in surveys or other empirical studies [7–12]. However, these associations werenot judged to be necessarily causal, even when alcohol use was related to the incidenceof HIV infection [13,14]. Another likely reason is that the impact of alcohol use wasindirect, via behavioral and biological pathways which were impacted by many socialand other factors, making it difficult to identify alcohol use as a necessary element in amulti-component process of causation [15].
For example, the impact of alcohol on HIV/AIDS is mainly mediated by the impact ofalcohol use on decision-making, resulting in riskier sexual behaviors [16] and lower adher-ence to virus suppression therapies [17–20], which results in higher transmission of HIVand other sexually transmitted diseases [21–23]. It took strong experimental methodologyto ascertain that the widely recognized associations between alcohol and HIV/AIDS hadsubstantial causal components (for more details, see [16,17]). For other infectious diseaseoutcomes, such as tuberculosis (TB), the toxic effects of heavy alcohol consumption on theimmune system render the host more susceptible to TB disease, which is again an indirecteffect ([24,25]; for systematic overviews on all mechanisms, see [6,26]).
Given the plethora of multi-component causal pathways involving alcohol and in-fectious diseases and the complexities required to elucidate them, additional evidenceis likely to continue to emerge regarding the causal impact of alcohol use on infectiousdiseases. For example, there is an association between alcohol and other sexually transmit-ted infections [27], and the causal mechanism for the impact of alcohol on HIV infectionseems to also apply to these other sexually transmitted infections [5]. However, the presentreview will be restricted to conditions that have been included in global comparative riskassessments to date (HIV/AIDS, tuberculosis, pneumonia) with one exception, COVID-19infection, which has been included because of its recent and rapid ascension as a globalhealth concern, even though it occurred after the last global comparative risk assessmentwas performed. All sections on disease outcomes discuss both behavioral and biologi-cal risk factors and are split into sections regarding incidence (Does alcohol use causenew infections with the disease?) and impact upon the course (How does alcohol useimpact the course of disease?), and all sections also discuss different dimensions of alcoholconsumption, in particular, irregular and heavy drinking occasions.
2. Alcohol and the Risk of Human Immunodeficiency Virus (HIV) and AcquiredImmune Deficiency Syndrome (AIDS)
HIV persists as a global health issue. In 2020, there were an estimated 37.6 millionpeople living with HIV, including 1.5 million newly infected individuals and 690,000 whodied from AIDS-related illnesses [28]. Alcohol has been identified as a driver of thisepidemic, facilitating HIV acquisition/transmission and disease progression through bothbehavioral and biological means.
114

Nutrients 2021, 13, 3317
2.1. Alcohol and HIV Acquisition/Transmission2.1.1. Behavioral Mechanisms
Most HIV seroconversions result from sexual activity [29], and alcohol has beenassociated with a diminished likelihood of engagement in the behaviors necessary toprevent sexually based HIV acquisition/transmission. Consuming alcohol in sexual con-texts can result in alcohol myopia [30], which entails an alcohol-induced constraint incognitive capacity that causes a focus on risk-impelling cues (e.g., sexual arousal) anda disregard of risk-inhibiting cues (e.g., the prospect of HIV acquisition/transmission),thereby increasing the likelihood of condomless sex. This mechanism and correspondingalcohol–condomless sex association have been supported through a number of reviews andmeta-analyses [7–12,14,31] as well as through controlled experiments that have providedevidence for the causal nature of this link [16,17,32–34].
More recently, HIV prevention efforts have emphasized biomedical approaches, whichinclude HIV Pre-Exposure Prophylaxis (PrEP)—a medication taken daily by those livingwithout HIV to prevent HIV acquisition [35,36]; and Treatment as Prevention (TasP)—which involves people living with HIV taking antiretroviral therapy (ART) to achieve viralsuppression, thereby eliminating the possibility of viral transmission [21–23]. Despite theirbiomedical basis, these approaches are directly reliant on a behavior, namely adherence,which has been shown to be negatively associated with alcohol use [18–20,37–41]. A varietyof underlying mechanisms for this association have been proposed, which, for the sakeof conciseness, are presented below under “Alcohol and HIV Disease Progression”. It ispossible that long-acting formulations of PrEP and ART may be particularly well suitedfor HIV prevention in alcohol users because those formulations diminish the adherenceburden. This hypothesis needs to be evaluated in future research.
2.1.2. Biological Mechanisms
Alcohol use can facilitate HIV acquisition/transmission by (1) decreasing host immuneefficiencies among those living without HIV and (2) increasing viral replication amongpeople living with HIV. Regarding the former, alcohol disrupts the physiology of the liver,causing a disturbance to non-specific innate and adaptive immune responses [42–45]. Bothacute and chronic alcohol consumption can suppress the production of lymphocytes andcytokines [46–50], inhibit T-lymphocyte proliferation [51], and decrease or inhibit the pro-duction of CD4+ and CD8+ T-cells and natural killer cells [52,53], which, taken together,can result in immunodeficiency and autoimmunity, and increase host susceptibility toHIV infection [25,54,55]. These effects can be further exacerbated by liver diseases such asliver fibrosis and cirrhosis observed among those who chronically abuse alcohol [25,54–59].Among people living with HIV, moderate to heavy alcohol consumption has been signifi-cantly associated with changes in vaginal flora, increased proinflammatory cytokines, andgenital tract inflammation, which increase HIV shedding and replication, and, in turn, thelikelihood of HIV transmission [60–63].
2.2. Alcohol Use and HIV Disease Progression2.2.1. Behavioral Mechanisms
The successful treatment of HIV, which entails achieving viral suppression to haltdisease progression, relies on enacting the behaviorally underpinned steps of the HIVcare continuum that include HIV testing, linkage, and retention in HIV care, and ARTinitiation and adherence. Alcohol use has been associated with poor outcomes at all stepsof the continuum [37,64–69], and some evidence suggestive of the causal role of alcoholuse, particularly with respect to adherence, has been yielded [17–20]. Alcohol-HIV carecontinuum associations can result from a range of mechanisms, including alcohol-relatedstigmatization that prevents alcohol users from accessing HIV testing and care [70,71],and alcohol-derived diminished cognitive functioning that poses a challenge for ongoingadherence and clinic attendance [72,73]. Among individuals who are alcohol-dependent,the syndrome of dependence may shift priorities towards obtaining and consuming alcohol
115
Nutrients 2021, 13, 3317
and away from health, self-care, and other concerns [70]. Finally, specific to ART adherence,some alcohol-consuming people living with HIV consciously and intentionally decide notto take their doses due to factors including the possession of beliefs surrounding toxicalcohol–ART interactions [74].
2.2.2. Biological Mechanisms
The role of alcohol in HIV disease progression is manifested through its effects onhost liver and immunomodulation, resulting in increased activation of CD4+ T-cells andits subsequent depletion at mucosal sites [63], as well as inhibition and abnormalitiesof T and B lymphocytes and natural killer cells [31,75,76], all of which are necessary forthe containment of HIV pathogens. Alcohol may also enhance HIV viral replication byincreasing or altering the HIV-binding CXCR4 coreceptor [77,78]. Accordingly, among ART-naïve individuals, heavy drinking (vs. lower consumption) has been linked to higher CD8cell counts and lower CD4 cell counts [79–81], and among those taking ART, it has beenassociated with reduced CD4 cell counts and higher log HIV RNA, even after controllingfor adherence and age [80,82–84]. Relevant to this latter group, some ART medicationsare metabolized by the Cytochrome P450 enzyme pathway in the liver, which may beinduced or inhibited by acute or chronic alcohol consumption [63,85,86]. This can affect thepharmacokinetics of some ART medications, resulting in either an increase or decrease ofthe available drug in plasma and causing drug toxicity or suboptimal control of the virus,respectively [63]. The effect of alcohol on ART can be further exacerbated by comorbidities,including drug dependence and Hepatitis C coinfection [17,63,87–89].
2.3. Addressing the Intersection of Alcohol Use and HIV
Alcohol use is closely intertwined with the persistent HIV epidemic. HIV prevention-and treatment-related outcomes can be improved by addressing alcohol use throughbehavioral [90], pharmacological [91], and policy/structural-level interventions [92,93].Tailoring and targeting these interventions to meet the unique needs of diverse populationsaffected by HIV may further enhance their effectiveness and help reduce the global HIVburden [94].
3. Alcohol Use and the Risk of Tuberculosis
Tuberculosis (TB) is the leading cause of infectious death globally, surpassing HIV/AIDSand among the top 10 causes of death worldwide [95]. In 2019, 10 million people became illwith tuberculosis, and 1.4 million people died [95]. TB is caused by Mycobacterium tuberculosis,transmitted when affected individuals cough droplet nuclei containing the bacteria intothe air, which is subsequently inhaled by others, causing latent infection and pulmonaryand extrapulmonary disease. The WHO estimates that one-third of the global population islatently infected. Alcohol use is among the top modifiable risk factors for tuberculosis, withAUDs prevalent in 30% of patients with TB and 11.4% (9.3–13%) of TB mortality attributableto alcohol [95,96].
3.1. Behavioral Mechanisms
Alcohol use is well established as a risk factor for incident TB [6,97], responsiblefor 17% of incident TB globally [98]. Data suggest that alcohol use is associated with a35% increased risk for developing active TB [98], while a systematic review of 21 studiesdemonstrated that only heavy alcohol use (defined as >40 g ethanol daily) or AUD provideda pooled risk of 3.50 (95% CI: 2.01–5.93) [6,99]. The mechanisms for the increased risk are notclearly delineated but are likely attributable to both biological and behavioral factors, thelatter facilitated by close contact in crowded congregate settings [6,26]. Alcohol consumedin the context of social interactions, such as bars [6,26,99], has facilitated transmission andoutbreaks of TB in institutionalized or service settings, including prisons [100] and amonghomeless populations [101] have been well documented.
116
Nutrients 2021, 13, 3317
Alcohol use is also an established risk factor for poor TB outcomes overall, includingtreatment failure, loss to follow up, and mortality for both drug-susceptible and drug-resistant TB [102]. This is predominantly attributed to behavioral mechanisms, notablypoor adherence to TB treatment and poor retention in TB care [102–104]. Outcomes areworse with common comorbid conditions, including HIV, hepatitis C, substance use, andsmoking [105–108]. Recognized limitations in studies assessing the relationship betweenalcohol and TB include poorly quantified alcohol consumption, a lack of alcohol standardsacross countries, and a lack of data on optimal screening for alcohol use among thosereceiving TB treatment.
Increased TB treatment failure and death independent of loss to follow-up suggestsalcohol-related biological factors [102], with a novel study underway to gauge the role ofalcohol use on outcomes controlling for adherence [109]. Interventions to reduce the impactof alcohol use on TB outcomes are scarce though emerging evidence suggests screeningand intervention are feasible and promising to improve treatment completion and clinicaloutcomes [56,110–116].
Less is known about the role of alcohol in TB preventive therapy. Until recently,the only regimen available for prevention was 6–12 months of isoniazid with rare butrecognized hepatic toxicity that can be exacerbated by alcohol use [117–121]. The balancebetween the benefits of preventing TB, with its individual and public health implications,against the risk of individual toxicity is currently being explored, considering the potentiallower risk associated with shorter course regimens [122,123]. Data are needed to guideoptimal screening and thresholds for alcohol use that halt TB preventive therapy; strategiesto improve TB preventive therapy completion in the setting of alcohol use are beingevaluated [124,125].
3.2. Biological Mechanisms
Pathophysiologically, data suggest multiple targets of alcohol use, including direct im-pairment of cell-mediated immunity [126], direct impact on the upper respiratory tract [127],indirect impact on adaptive immunity [128], and malnutrition [129,130], as pathways forincreased susceptibility to TB.
Alcohol use complicates TB treatment for drug-susceptible and drug-resistant TB [102]. Fre-quent coinfection with hepatitis C and/or HIV increases the risk of hepatotoxicity [121,131,132].Interactions between alcohol and anti-tuberculous medications are well established. Isoniazid,rifampin, and pyrazinamide, core agents of the first-line TB treatment regimen, uncommonly(~1–3%) cause hepatitis, which can be dose-related and reversible with cessation of the medi-cations or may be due to hypersensitivity reaction [133]. Data are emerging on newer agentsnow available for drug-resistant TB [134]. In patients taking TB treatment who are at increasedrisk of hepatotoxicity, such as those with alcohol use or liver disease, closer monitoring isrecommended, and non-hepatotoxic TB agents may be substituted.
3.3. Addressing the Intersection of Alcohol Use and TB
Alcohol use increases the risk of incident tuberculosis disease and risk of poor out-comes, primarily through behavioral mechanisms [98,99]. Data suggest alcohol use alsoimpairs cell-mediated and adaptive immunity, though work remains to elucidate thesemechanisms [126,127]. Additionally, there is a paucity of data on the thresholds for alcoholuse that portend risk, implementation of screening and addressing alcohol use within TBprograms, and the alcohol-related risk for latent TB and latent TB treatment. Emergingdata suggest promising interventions that can improve TB outcomes.
4. Alcohol Use and the Risk of Lower Respiratory Infections (Pneumonia)
Pneumonia is the most important category of lower respiratory infections. Its mostcommon type is bacterial pneumonia caused by the Streptococcus pneumoniae, but otherforms may be viral or, rarely, caused by fungi or parasites [135]. In 2019, lower respi-ratory infections, the main category usually estimated in international statistics, caused
117
Nutrients 2021, 13, 3317
about 2.5 million deaths globally (point estimate: 2,493,000; 95% confidence interval (CI):2,268,000–2,736,000) and about 97 million disability years of life lost (DALYs; point estimate:97,190,000; 95% CI: 84,871,000–113,083,000; all data are based on the 2019 Global Burdenof Disease Study [136]. More than 80% of the lower respiratory infection deaths [136] andmore than 90% of the DALYs lost were in low- and middle-income countries (LMIC) [136],with a clear gradient in age-adjusted rates by wealth: the higher the economic wealth,the lower the rate of lower respiratory infections. In total, 3.2% (95% CI: 1.6–6.0%) of thedeaths and 1.8% of the DALYs (95% CI: (1.0–3.3%)) due to lower respiratory infectionswere attributable to alcohol, meaning they would not have occurred in a world withoutalcohol [137].
Alcohol use both impacts the etiology and the course of lower respiratory infections,most importantly in community-acquired infections. As with most infections, lower respi-ratory infections are more highly prevalent in crowded environments often inhabited bypoor people. Additionally, within countries, pneumonia is associated with socioeconomicstatus, an indicator of wealth: the higher the socioeconomic status, the lower the prevalenceof lower respiratory infections [138]. Alcohol contributes to these inequalities ([139,140]),especially via heavy drinking occasions [141]. Of course, factors other than crowding andalcohol use, which are associated with wealth at the individual and societal levels, alsocontribute to lower respiratory infection rates, such as tobacco smoking, undernutrition,indoor air pollution, and insufficient access to health care [96]. Most of these risk factorsare known to interact with alcohol use [142].
The main impact of alcohol use on lower respiratory infections seems to be via theinnate and the adaptive immune system [24,53,143–145]. There are a number of pathwaysleading to the weakening of various aspects of the immune system, with the key immunecells involved in combating pulmonary conditions being neutrophils, lymphocytes, alveolarmacrophages, and the cells responsible for innate immune responses [44,55,145–149]. Inaddition, alcohol use is causally linked to more than 200 disease and injury outcomes(such as various types of cancer, stroke, liver cirrhosis, or traffic injury) which weaken theimmune system and increase the risk for lower respiratory infections [138].
Although a number of studies on pathways have been conducted among people withAUDs, two dose–response meta-analyses found an almost linearly increasing risk withincreasing average consumption of alcohol [150,151]. These two meta-analyses estimatedthat an average increase of one drink per day was associated with an increased risk of 8%(95% CI 6–9%) and 6% (95% CI 1–11%). As people with AUDs tend to have the highestaverage consumption [152], risk for lower respiratory infections is highest in this group. For,instance, in a cohort study of more than 12 million French hospital patients, the relative riskfor hospitalization for pneumococcal pneumonia in patients with an AUD was 3.71 (95%3.60–3.83; [153]). Other studies have found similar and higher risks [154–156].
The same mechanisms which lead to the incidence of lower respiratory infections alsoworsen its course. Clearly, the living conditions and behaviors, as well as alcohol-inducedcompromised immunity, hinder the healing process for people with lower respiratoryinfections [157]. Abstinence or at least an absence of heavy drinking occasions shouldthus be the norm during such infections, bearing in mind that for some people with AUD,abruptly abstaining may lead to alcohol withdrawal syndrome, which in itself may haveseverely negative effects [158].
5. Alcohol Use and the Risk of COVID-19
The ongoing global pandemic of coronavirus disease 2019 (COVID-19) is caused by thesevere acute respiratory syndrome coronavirus 2 (SARS-CoV-2). Following the first casesin China late in 2019, which soon spread to other countries, the WHO declared it a PublicHealth Emergency of International Concern on 30 January 2020, and later—based on morethan 118,000 cases in 114 countries and 4291 deaths—a pandemic on 11 March 2020 [159].To date, on 10 July 2021, the estimates are that there have been more than 187 millionCOVID-19 infections and more than 4 million deaths [160], which are widely considered to
118
Nutrients 2021, 13, 3317
be conservative estimates, as only direct cases with ascertainment are included (for a totalestimate, see [161]). Alcohol use may play a role in both the incidence and the course of thedisease [162], with both behavioral and biological pathways.
5.1. Behavioral Pathways
COVID-19–alcohol behavioral pathways hinge on the social drift hypotheses—thephenomenon that alcohol problems, especially in heavy drinkers and people with AUDs,are associated with long-term negative effects on the place of residence, involving anelevated likelihood of moving into or remaining in disadvantaged neighborhoods [163,164].These environments hinder physical distancing and have been established as risk factorsfor COVID-19 infections and poor outcomes [165]. Independent of characteristics ofdisadvantaged neighborhoods, alcohol consumption has been shown to narrow physicaldistancing [166].
5.2. Biological Pathways
COVID-19 has only recently emerged as a pathogen, so there is less comprehensiveand systematic knowledge about its relationship with alcohol use than there is for moreestablished pathogens. The pathophysiology of COVID-19 is complex [167] but can beconceptually simplified as:
(1) COVID-19 travels from the upper respiratory tract (highest transmission risk) to thelower respiratory tract (highest disease risk), causing pneumonia;
(2) COVID-19 initiates innate and adaptive immune responses that are often maladaptive,leading to ineffective pathogen eradication combined with inflammation that causeshost tissue damage;
(3) Damage is concentrated not at the alveolus (i.e., the interface of air–blood oxygenexchange), as is typical of pneumonia, but instead at epithelial cells (i.e., cells liningthe lower respiratory tract) and endothelial cells (i.e., cells lining blood vessels);
(4) Endothelial damage occurs not only in the lungs but also systematically, leadingto vasculitis (i.e., damaged small blood vessels) and thrombosis (i.e., blood clots),potentially causing multi-organ failure.
Accordingly, alcohol use may impact COVID-19 by facilitating some or all of thesesteps. Heavy alcohol consumption is a well-known risk factor for aspiration pneumonia,so it is likely that alcohol, if consumed heavily, leads to increased aspiration of the upperrespiratory tract COVID-19 to the lower respiratory tract.
Heavy alcohol use weakens the innate and adaptive immune systems [168,169]. Theprocesses have been described in other sections and are summarised in [126,128]. A recentnetwork meta-analysis [170] explored the potential effects of alcohol use on inflammation,based on the fact that many COVID-19 patients present with fever in the early phase, withsome progressing to a hyperinflammatory phase. This network meta-analysis demon-strated that alcohol exposure might augment COVID-19-induced inflammation by alteringthe activity of key inflammatory mediators (augmenting inflammatory effects and inhibit-ing the activity of anti-inflammatory mediators, including the glucocorticoid receptor).Finally, a large study showed genetically informative putative causal effects of alcohol useon worsening the course of COVID-19 [171]. However, the last study has not undergonepeer review as of yet.
Finally, chronic heavy use of alcohol leads to frailty, arterial hypertension, and liverand other organ damage, rendering people more susceptible to COVID-related complica-tions. Susceptibility to COVID is also enhanced if alcohol leads to obesity or co-occurringinfectious diseases or arterial hypertension [172–175]. Pathways involving obesity, a knownindependent risk factor for COVID-19 [176], have received research interest, both fromtheoretical [177] and empirical perspectives [173].
119
Nutrients 2021, 13, 3317
5.3. Association with Alcohol Use or Heavy Alcohol Use/AUDs
Studies on the association between alcohol use and the incidence and severity ofCOVID-19 have yielded mixed results. While some studies have found associations, inparticular for heavy drinkers [178–180] or people with AUDs [181], other studies havedemonstrated that alcohol use per se was not necessarily associated with the incidenceof COVID-19 or with a more severe course of the disease [182–184]. This is in line withthe postulated pathways described above, which mainly report effects for heavy drinkingand/or in people with AUDs (see also [185–187]).
6. Interventions for Preventing Transmission and Improving Treatment Outcomes ofAlcohol-Attributable Diseases
The evidence reviewed above suggests that alcohol is a clear risk factor for the inci-dence of and poor treatment outcomes from HIV, TB, and pneumonia, with the evidenceregarding its effects on COVID-19 still emerging. Alcohol-attributable TB, HIV, and pneu-monia combined were responsible for approximately 360,000 deaths and 14 million DALYsin 2016 (Table 1), and alcohol-attributable TB deaths and DALYs far exceeded alcohol-attributable lower respiratory infection and HIV deaths and DALYs [137]. Given theobserved role of alcohol use in these diseases, reductions in alcohol consumption shouldlead to reduced incidence of and improved disease outcomes, including fewer deaths,among those with these illnesses. Feasible and effective alcohol-reduction interventionsmust be prioritized, but how best to intervene has not been fully delineated. We discussindividual-level interventions followed by structural interventions (or alcohol controlmeasures) that may prevent transmission and improve treatment outcomes of alcohol-attributable communicable diseases.
Table 1. Alcohol-attributable communicable diseases: 2016 estimates [137].
Deaths (Thousands) DALYs (Millions)
Tuberculosis 236.3 (74.6–456.6) 9.9 (3.2–18.6)HIV/AIDS 30.4 (22.8–56.7) 1.7 (1.2–3.1)
Lower respiratory infections 95.2 (48.5–177.6) 2.3 (1.3–4.3)
6.1. Reducing the Incidence of Communicable Diseases
Individual-level approaches focusing on alcohol reduction in order to reduce theincidence of pneumonia and TB are relatively rare, whereas more studies focused onalcohol use reduction for preventing HIV transmission have been conducted. Within asystematic review of studies of interventions for reducing the incidence of TB, no studiesthat examined alcohol-reduction interventions for reducing the incidence of TB werefound [188].
Similarly, despite the role of alcohol use in increasing the risk of pneumonia acqui-sition, alcohol use reduction seems to be missing as part of a number of texts providingrecommendations for the prevention of pneumonia (e.g., [189,190]). On the other hand,one of the main preventative measures for pneumonia is vaccination, and commentatorshave recommended vaccinating individuals with an AUD in order to prevent (re-)infectionwith pneumonia [158]. Others (e.g., [191]) have suggested that clinicians should identifyindividuals who are at high risk of developing pneumonia as potential candidates forpneumonia vaccinations due to their possession of risk factors, including alcohol use,smoking, older age, and lower socioeconomic status, among a few others [191].
In terms of HIV, a number of systematic reviews of alcohol–HIV reduction inter-ventions [8,192,193], mostly conducted in clinic or treatment settings, have shown thatbehavioral interventions can reduce alcohol use in sexual contexts and alcohol consumptionamong individuals at risk of alcohol-related HIV acquisition. A systematic review [8] ofalcohol–HIV interventions targeting both alcohol and sexual risk behavior reduction amongSTI clinic and substance use treatment patients in Russia showed evidence of effectivenessin increasing condom use. Interventions in other settings, such as bars and communities,
120

Nutrients 2021, 13, 3317
may also be ideal and feasible (e.g., [194–196]) but have yielded mixed results [194,195].Secondary prevention, which entails TasP (discussed below), with high adherence to ARTto bring about viral suppression, is particularly important yet problematic in people livingwith HIV who drink alcohol [94].
6.2. Improving Treatment Outcomes
Since alcohol use complicates the treatment of many communicable diseases, integra-tion of alcohol use reduction counseling or screening and brief interventions into TB [197],HIV [94], or pneumonia [150] treatment services has been recommended. Similarly, screen-ing for TB [197] or HIV among people with AUDs has also been recommended, as has theco-location of services [94]. However, the evidence base regarding the effectiveness of suchapproaches for all communicable disease categories of interest in the current report is fairlylimited.
A few primary studies that have evaluated the efficacy of individual-level alcoholreduction interventions for improving TB treatment outcomes [56,114,116,198] have yieldeddisappointing results. In Russia, Shin et al. [198] found no differences between the TB andalcohol use outcomes of new TB patients with AUDs who received: (1) a brief counselingintervention (BCI) and treatment as usual; (2) naltrexone combined with brief behavioralcompliance enhancement counseling (BBCET) (naltrexone adherence counseling); (3) BCIand naltrexone with BBCET and treatment as usual; and (4) treatment as usual—referralto a narcologist (namely, an addiction psychiatrist in the Russian system). One sub-groupanalysis revealed that among those with previous quit attempts (n = 111), the TB treatmentoutcome was better for the naltrexone group (92.3%) compared with the non-naltrexonegroup (75.9%). In a cluster RCT in South Africa, Peltzer et al. [116] found no effect for atwo-session screening and brief intervention on TB and alcohol use outcomes among newTB patients who had Alcohol Use Disorder Identification Test (AUDIT) scores of ≥7 if theywere women and ≥8 if they were men. More research on individual-level alcohol-reductioninterventions among patients on TB treatment is needed.
Several recommendations regarding the treatment of patients with pneumonia whodrink alcohol or have AUDs have been put forward. These include preventing further boutsof pneumonia by providing alcohol counseling [151] and pneumococcal vaccination [158].Screening and brief interventions for AUDs among all patients undergoing treatment forpneumonia have also been recommended so that the clinician can be well informed abouttheir patients’ alcohol use and manage their pneumonia accordingly [150]. Assessmentfor potential alcohol withdrawal syndrome that may occur as a result of abstinence isalso recommended as it can have serious and even fatal consequences if not managedappropriately [158]. Providing guidelines on screening for the risk of AUDs and alcoholwithdrawal syndrome to TB treatment providers has also been recommended [199].
Efforts to improve treatment outcomes and improve secondary prevention for peopleliving with HIV who drink alcohol require emphasizing linkage and retention in care,ART initiation, ART adherence, viral suppression, and condom use [94]. A recently pub-lished high-quality systematic review and meta-analysis involving 21 studies and 8461people living with HIV, 69% of whom were on ART, has indicated (contrary to other find-ings, [200–202]) that individual-level behavioral interventions were effective in reducingthe quantity and heavy consumption (but not alcohol use or alcohol use frequency), increas-ing condom use (but not affecting the number of sexual partners or a composite index ofsexual risk), reducing viral load, and increasing ART adherence [90]. Interventions in whichparticipants were recruited from clinics were most likely to be effective. As supplementsto such interventions, additional approaches that have been recommended include theuse of technology to deliver interventions, use of ultra-brief interventions, prevention ofincreased alcohol consumption or the development of AUDs, a focus on aging populations,addressing psychosocial comorbidities, and improving accessibility and convenience ofHIV care [94]. Occasionally, health workers have stigmatizing attitudes or inadequateknowledge that can lead to inadvertent ART nonadherence among their patients [203].
121

Nutrients 2021, 13, 3317
Very clear guidelines are needed to enable health workers to provide appropriate andconsistent messaging [204].
Pharmacological interventions for reducing alcohol use and improving treatment out-comes may be especially appropriate for those with communicable diseases [91]. Farhadianet al.’s systematic review, including seven studies, provided some evidence of naltrexone’seffectiveness in reducing alcohol consumption and HIV viral load, but it did not affect ARTadherence, CD4 cell count, or disease severity. However, as discussed above, a study inwhich naltrexone was used in combination with naltrexone adherence counseling, and inanother group also behavioral counseling to reduce drinking and improve TB treatmentoutcomes among TB patients, did not yield positive results [198].
6.3. Alcohol Control Measures
Alcohol control policies that are aligned with the three alcohol “best buys”—increasingexcise tax, bans or restrictions on alcohol advertising, and restricting the availability ofalcohol [205]—are most effective for reducing population-level alcohol use. These measurescan be expected to be effective for reducing the incidence of and morbidity and mortalitydue to alcohol-attributable TB, pneumonia, and HIV. There is some evidence that mayprovide support for such effects. For example, a study in the United States showedthat longer sales hours at the state/district level were associated with high-risk sexualbehaviors [92], which are associated with HIV transmission. However, implementation ofeffective alcohol control policies such as the best buys is relatively low around the world,particularly in lower- and middle-income countries [206–209], many of which have thehighest disease burden with respect to many communicable diseases [136]. Implementationand enforcement of effective alcohol control policies as a means of reducing the burden ofcommunicable diseases is recommended.
7. Discussion/Conclusions
Alcohol use is a clear risk factor for the incidence of and poor treatment outcomesfrom HIV, TB, and pneumonia. Emerging evidence suggests that heavy and chronic alcoholuse is associated with an increased risk of acquisition of COVID-19 and more severe diseaseonce infected, while evidence regarding the role of alcohol use per se in COVID-19 is mixed.
Alcohol’s role in communicable diseases can be explained by both behavioral andbiological mechanisms (Figure 1). Alcohol use increases susceptibility to infectious diseasesthrough several immunologic mechanisms. Chronic or irregular heavy drinking leads toincreased susceptibility to viral and bacterial infections, including mycobacterial infectionsand decreased response to vaccination. Chronic heavy drinking stimulates inflammationyet impairs neutrophil function in the innate (immediate) immune response and leadsto loss of T cells and B cells in the adaptive (delayed or humoral) response. In contrast,moderate alcohol consumption seems to strengthen the response to infection, though theexact mechanisms of alcohol’s mixed effects on the immune system, particularly on theadaptive immune response, remain under investigation [126,128]. In terms of behavioralmechanisms, most of alcohol’s effects on disease acquisition result from impaired decisionmaking (or impaired control), which gives rise to increased risk behaviors such as condom-less sex. Furthermore, alcohol consumption is negatively associated with linkage to andretention in care and with medication adherence (particularly for HIV and TB treatment).
122
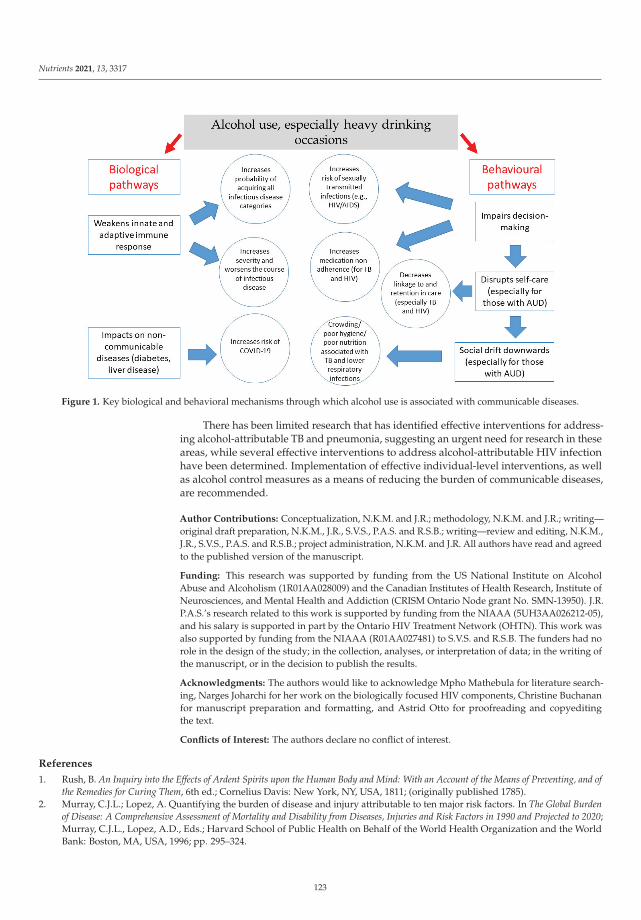
Nutrients 2021, 13, 3317
Figure 1. Key biological and behavioral mechanisms through which alcohol use is associated with communicable diseases.
There has been limited research that has identified effective interventions for address-ing alcohol-attributable TB and pneumonia, suggesting an urgent need for research in theseareas, while several effective interventions to address alcohol-attributable HIV infectionhave been determined. Implementation of effective individual-level interventions, as wellas alcohol control measures as a means of reducing the burden of communicable diseases,are recommended.
Author Contributions: Conceptualization, N.K.M. and J.R.; methodology, N.K.M. and J.R.; writing—original draft preparation, N.K.M., J.R., S.V.S., P.A.S. and R.S.B.; writing—review and editing, N.K.M.,J.R., S.V.S., P.A.S. and R.S.B.; project administration, N.K.M. and J.R. All authors have read and agreedto the published version of the manuscript.
Funding: This research was supported by funding from the US National Institute on AlcoholAbuse and Alcoholism (1R01AA028009) and the Canadian Institutes of Health Research, Institute ofNeurosciences, and Mental Health and Addiction (CRISM Ontario Node grant No. SMN-13950). J.R.P.A.S.’s research related to this work is supported by funding from the NIAAA (5UH3AA026212-05),and his salary is supported in part by the Ontario HIV Treatment Network (OHTN). This work wasalso supported by funding from the NIAAA (R01AA027481) to S.V.S. and R.S.B. The funders had norole in the design of the study; in the collection, analyses, or interpretation of data; in the writing ofthe manuscript, or in the decision to publish the results.
Acknowledgments: The authors would like to acknowledge Mpho Mathebula for literature search-ing, Narges Joharchi for her work on the biologically focused HIV components, Christine Buchananfor manuscript preparation and formatting, and Astrid Otto for proofreading and copyeditingthe text.
Conflicts of Interest: The authors declare no conflict of interest.
References
1. Rush, B. An Inquiry into the Effects of Ardent Spirits upon the Human Body and Mind: With an Account of the Means of Preventing, and ofthe Remedies for Curing Them, 6th ed.; Cornelius Davis: New York, NY, USA, 1811; (originally published 1785).
2. Murray, C.J.L.; Lopez, A. Quantifying the burden of disease and injury attributable to ten major risk factors. In The Global Burdenof Disease: A Comprehensive Assessment of Mortality and Disability from Diseases, Injuries and Risk Factors in 1990 and Projected to 2020;Murray, C.J.L., Lopez, A.D., Eds.; Harvard School of Public Health on Behalf of the World Health Organization and the WorldBank: Boston, MA, USA, 1996; pp. 295–324.
123
Nutrients 2021, 13, 3317
3. Lim, S.S.; Vos, T.; Flaxman, A.D.; Danaei, G.; Shibuya, K.; Adair-Rohani, H.; Amann, M.; Anderson, H.R.; Andrews, K.G.; Aryee,M.; et al. A comparative risk assessment of burden of disease and injury attributable to 67 risk factors and risk factor clusters in21 regions, 1990–2010: A systematic analysis for the Global Burden of Disease Study 2010. Lancet 2012, 380, 2224–2260. [CrossRef]
4. Rehm, J.; Baliunas, D.; Borges, G.L.; Graham, K.; Irving, H.; Kehoe, T.; Parry, C.D.; Patra, J.; Popova, S.; Poznyak, V. Therelation between different dimensions of alcohol consumption and burden of disease: An overview. Addiction 2010, 105, 817–843.[CrossRef] [PubMed]
5. Rehm, J.; Gmel, G.E., Sr.; Gmel, G.; Hasan, O.S.M.; Imtiaz, S.; Popova, S.; Probst, C.; Roerecke, M.; Room, R.; Samokhvalov, A.V.;et al. The relationship between different dimensions of alcohol use and the burden of disease-an update. Addiction 2017, 112,968–1001. [CrossRef] [PubMed]
6. Lönnroth, K.; Williams, B.G.; Stadlin, S.; Jaramillo, E.; Dye, C. Alcohol use as a risk factor for tuberculosis: A systematic review.BMC Public Health 2008, 8, 289. [CrossRef] [PubMed]
7. Kalichman, S.C.; Simbayi, L.C.; Kaufman, M.; Cain, D.; Jooste, S. Alcohol use and sexual risks for HIV/AIDS in sub-SaharanAfrica: Systematic review of empirical findings. Prev. Sci. 2007, 8, 141–151. [CrossRef] [PubMed]
8. Lan, C.W.; Scott-Sheldon, L.A.; Carey, K.B.; Johnson, B.T.; Carey, M.P. Alcohol and sexual risk reduction interventions amongpeople living in Russia: A systematic review and meta-analysis. AIDS Behav. 2014, 18, 1835–1846. [CrossRef] [PubMed]
9. Scott-Sheldon, L.A.; Walstrom, P.; Carey, K.B.; Johnson, B.T.; Carey, M.P. Alcohol use and sexual risk behaviors among individualsinfected with HIV: A systematic review and meta-analysis 2012 to early 2013. Curr. HIV/AIDS Rep. 2013, 10, 314–323. [CrossRef]
10. Okoro, U.J.; Carey, K.B.; Johnson, B.T.; Carey, M.P.; Scott-Sheldon, L.A.J. Alcohol consumption, risky sexual behaviors, and HIV inNigeria: A meta-analytic review. Curr. Drug. Res. Rev. 2019, 11, 92–110. [CrossRef]
11. Shuper, P.A.; Joharchi, N.; Irving, H.; Rehm, J. Alcohol as a correlate of unprotected sexual behavior among people living withHIV/AIDS: Review and meta-analysis. AIDS Behav. 2009, 13, 1021–1036. [CrossRef]
12. Przybyla, S.M.; Krawiec, G.; Godleski, S.A.; Crane, C.A. Meta-Analysis of alcohol and serodiscordant condomless sex amongpeople living with HIV. Arch. Sex. Behav. 2018, 47, 1351–1366. [CrossRef]
13. Fisher, J.C.; Bang, H.; Kapiga, S.H. The association between HIV infection and alcohol use: A systematic review and meta-analysisof African studies. Sex. Transm. Dis. 2007, 34, 856–863. [CrossRef] [PubMed]
14. Baliunas, D.; Rehm, J.; Irving, H.; Shuper, P. Alcohol consumption and risk of incident human immunodeficiency virus infection:A meta-analysis. Int. J. Public Health 2010, 55, 159–166. [CrossRef] [PubMed]
15. Rothman, K.J.; Greenland, S.; Lash, T.L. Modern Epidemiology, 3rd ed.; Lippincott Williams & Wilkins: Philadelphia, PA, USA, 2008.16. Scott-Sheldon, L.A.; Carey, K.B.; Cunningham, K.; Johnson, B.T.; Carey, M.P. Alcohol use predicts sexual decision-making: A
systematic review and meta-analysis of the experimental literature. AIDS Behav. 2016, 20 (Suppl. 1), S19–S39. [CrossRef]17. Rehm, J.; Probst, C.; Shield, K.D.; Shuper, P.A. Does alcohol use have a causal effect on HIV incidence and disease progression? A
review of the literature and a modeling strategy for quantifying the effect. Popul. Health Metr. 2017, 15, 4. [CrossRef]18. Braithwaite, R.S.; McGinnis, K.A.; Conigliaro, J.; Maisto, S.A.; Crystal, S.; Day, N.; Cook, R.L.; Gordon, A.; Bridges, M.W.; Seiler,
J.F.; et al. A temporal and dose-response association between alcohol consumption and medication adherence among veterans incare. Alcohol. Clin. Exp. Res. 2005, 29, 1190–1197. [CrossRef] [PubMed]
19. Parsons, J.T.; Rosof, E.; Mustanski, B. The temporal relationship between alcohol consumption and HIV-medication adherence: Amultilevel model of direct and moderating effects. Health Psychol. 2008, 27, 628–637. [CrossRef] [PubMed]
20. Schensul, J.J.; Ha, T.; Schensul, S.; Sarna, A.; Bryant, K. Identifying the intersection of alcohol, adherence and sex in HIV positivemen on ART treatment in India using an adapted timeline followback procedure. AIDS Behav. 2017, 21, 228–242. [CrossRef]
21. Cohen, M.S.; Chen, Y.Q.; McCauley, M.; Gamble, T.; Hosseinipour, M.C.; Kumarasamy, N.; Hakim, J.G.; Kumwenda, J.; Grinsztejn,B.; Pilotto, J.H.; et al. Antiretroviral therapy for the prevention of HIV-1 transmission. N. Engl. J. Med. 2016, 375, 830–839.[CrossRef]
22. Cohen, M.S.; Chen, Y.Q.; McCauley, M.; Gamble, T.; Hosseinipour, M.C.; Kumarasamy, N.; Hakim, J.G.; Kumwenda, J.; Grinsztejn,B.; Pilotto, J.H.; et al. Prevention of HIV-1 infection with early antiretroviral therapy. N. Engl. J. Med. 2011, 365, 493–505. [CrossRef]
23. Eisinger, R.W.; Dieffenbach, C.W.; Fauci, A.S. HIV Viral load and transmissibility of HIV infection: Undetectable equalsuntransmittable. JAMA 2019, 321, 451–452. [CrossRef]
24. Happel, K.I.; Nelson, S. Alcohol, immunosuppression, and the lung. Proc. Am. Thorac. Soc. 2005, 2, 428–432. [CrossRef] [PubMed]25. Szabo, G. Alcohol’s contribution to compromised immunity. Alcohol. Health Res. World 1997, 21, 30.26. Rehm, J.; Samokhvalov, A.V.; Neuman, M.G.; Room, R.; Parry, C.; Lönnroth, K.; Patra, J.; Poznyak, V.; Popova, S. The association
between alcohol use, alcohol use disorders and tuberculosis (TB). A systematic review. BMC Public Health 2009, 9, 1–12. [CrossRef][PubMed]
27. Cook, R.L.; Clark, D.B. Is there an association between alcohol consumption and sexually transmitted diseases? A systematicreview. Sex. Transm. Dis. 2005, 32, 156–164. [CrossRef] [PubMed]
28. UNAIDS. Global HIV & AIDS Statistics—Fact Sheet; UNAIDS: Geneva, Switzerland, 2021.29. UNAIDS. Seizing the Moment: Tackling Entrenched Inequalities to End Epidemics; Joint United Nations Programme on HIV/AIDS:
Geneva, Switzerland, 2020.30. Steele, C.M.; Josephs, R.A. Alcohol myopia: Its prized and dangerous effects. Am. Psychol. 1990, 45, 921–933. [CrossRef] [PubMed]31. Shuper, P.A.; Neuman, M.; Kanteres, F.; Baliunas, D.; Joharchi, N.; Rehm, J. Causal considerations on alcohol and HIV/AIDS: A
systematic review. Alcohol Alcohol. 2010, 45, 159–166. [CrossRef] [PubMed]
124
Nutrients 2021, 13, 3317
32. Rehm, J.; Shield, K.D.; Joharchi, N.; Shuper, P. Alcohol consumption and the intention to engage in unprotected sex: Systematicreview and meta-analysis of experimental studies. Addiction 2012, 107, 51–59. [CrossRef]
33. Shuper, P.A.; Joharchi, N.; Monti, P.M.; Loutfy, M.; Rehm, J. Acute alcohol consumption directly increases HIV transmission risk:A randomized controlled experiment. J. Acquir. Immune Defic. Syndr. 2017, 76, 493–500. [CrossRef]
34. Shuper, P.A.; Joharchi, N.; Rehm, J. Protocol for a controlled experiment to identify the causal role of acute alcohol consumptionin condomless sex among HIV-positive MSM: Study procedures, ethical considerations, and implications for HIV prevention.AIDS Behav. 2016, 20 (Suppl. 1), S173–S184. [CrossRef] [PubMed]
35. Baeten, J.M.; Donnell, D.; Ndase, P.; Mugo, N.R.; Campbell, J.D.; Wangisi, J.; Tappero, J.W.; Bukusi, E.A.; Cohen, C.R.; Katabira,E.; et al. Antiretroviral prophylaxis for HIV prevention in heterosexual men and women. N. Engl. J. Med. 2012, 367, 399–410.[CrossRef] [PubMed]
36. Grant, R.M.; Lama, J.R.; Anderson, P.L.; McMahan, V.; Liu, A.Y.; Vargas, L.; Goicochea, P.; Casapia, M.; Guanira-Carranza, J.V.;Ramirez-Cardich, M.E.; et al. Preexposure chemoprophylaxis for HIV prevention in men who have sex with men. N. Engl. J. Med.2010, 363, 2587–2599. [CrossRef] [PubMed]
37. Hendershot, C.S.; Stoner, S.A.; Pantalone, D.W.; Simoni, J.M. Alcohol use and antiretroviral adherence: Review and meta-analysis.J. Acquir. Immune Defic. Syndr. 2009, 52, 180–202. [CrossRef] [PubMed]
38. Shuper, P.A.; Joharchi, N.; Bogoch, I.I.; Loutfy, M.; Crouzat, F.; El-Helou, P.; Knox, D.C.; Woodward, K.; Rehm, J. Alcoholconsumption, substance use, and depression in relation to HIV Pre-Exposure Prophylaxis (PrEP) nonadherence among gay,bisexual, and other men-who-have-sex-with-men. BMC Public Health 2020, 20, 1782. [CrossRef] [PubMed]
39. Haberer, J.E.; Baeten, J.M.; Campbell, J.; Wangisi, J.; Katabira, E.; Ronald, A.; Tumwesigye, E.; Psaros, C.; Safren, S.A.; Ware, N.C.;et al. Adherence to antiretroviral prophylaxis for HIV prevention: A substudy cohort within a clinical trial of serodiscordantcouples in East Africa. PLoS Med. 2013, 10, e1001511. [CrossRef] [PubMed]
40. Mugo, P.M.; Sanders, E.J.; Mutua, G.; van der Elst, E.; Anzala, O.; Barin, B.; Bangsberg, D.R.; Priddy, F.H.; Haberer, J.E.Understanding adherence to daily and intermittent regimens of oral HIV pre-exposure prophylaxis among men who have sexwith men in Kenya. AIDS Behav. 2015, 19, 794–801. [CrossRef] [PubMed]
41. van der Elst, E.M.; Mbogua, J.; Operario, D.; Mutua, G.; Kuo, C.; Mugo, P.; Kanungi, J.; Singh, S.; Haberer, J.; Priddy, F.; et al. Highacceptability of HIV pre-exposure prophylaxis but challenges in adherence and use: Qualitative insights from a phase I trial ofintermittent and daily PrEP in at-risk populations in Kenya. AIDS Behav. 2013, 17, 2162–2172. [CrossRef] [PubMed]
42. Lau, A.H.; Szabo, G.; Thomson, A.W. Antigen-presenting cells under the influence of alcohol. Trends Immunol. 2009, 30, 13–22.[CrossRef]
43. McClain, C.J.; Shedlofsky, S.; Barve, S.; Hill, D.B. Cytokines and alcoholic liver disease. Alcohol. Health Res. World 1997, 21,317–320.
44. Szabo, G.; Mandrekar, P. A recent perspective on alcohol, immunity, and host defense. Alcohol. Clin. Exp. Res. 2009, 33, 220–232.[CrossRef]
45. Friedman, H.; Newton, C.; Klein, T.W. Microbial infections, immunomodulation, and drugs of abuse. Clin. Microbiol. Rev. 2003,16, 209–219. [CrossRef]
46. Friedman, H.; Pross, S.; Klein, T.W. Addictive drugs and their relationship with infectious diseases. FEMS Immunol. Med.Microbiol. 2006, 47, 330–342. [CrossRef]
47. Goral, J.; Choudhry, M.A.; Kovacs, E.J. Acute ethanol exposure inhibits macrophage IL-6 production: Role of p38 and ERK1/2MAPK. J. Leukoc. Biol. 2004, 75, 553–559. [CrossRef] [PubMed]
48. Goral, J.; Kovacs, E.J. In vivo ethanol exposure down-regulates TLR2-, TLR4-, and TLR9-mediated macrophage inflammatoryresponse by limiting p38 and ERK1/2 activation. J. Immunol. 2005, 174, 456–463. [CrossRef] [PubMed]
49. Pruett, S.B.; Schwab, C.; Zheng, Q.; Fan, R. Suppression of innate immunity by acute ethanol administration: A global perspectiveand a new mechanism beginning with inhibition of signaling through TLR3. J. Immunol. 2004, 173, 2715–2724. [CrossRef]
50. Brodie, C.; Domenico, J.; Gelfand, E.W. Ethanol inhibits early events in T-lymphocyte activation. Clin. Immunol. Immunopathol.1994, 70, 129–136. [CrossRef] [PubMed]
51. Zhang, T.; Guo, C.J.; Douglas, S.D.; Metzger, D.S.; O’Brien, C.P.; Li, Y.; Wang, Y.J.; Wang, X.; Ho, W.Z. Alcohol suppressesIL-2-induced CC chemokine production by natural killer cells. Alcohol. Clin. Exp. Res. 2005, 29, 1559–1567. [CrossRef]
52. Shellito, J.E.; Olariu, R. Alcohol decreases T-lymphocyte migration into lung tissue in response to Pneumocystis carinii anddepletes T-lymphocyte numbers in the spleens of mice. Alcohol. Clin. Exp. Res. 1998, 22, 658–663. [CrossRef]
53. Cook, R.T. Alcohol abuse, alcoholism, and damage to the immune system—A review. Alcohol. Clin. Exp. Res. 1998, 22, 1927–1942.54. Szabo, G. Consequences of alcohol consumption on host defence. Alcohol Alcohol. 1999, 34, 830–841. [CrossRef]55. Neuman, M.G. Cytokines—central factors in alcoholic liver disease. Alcohol Res. Health 2003, 27, 307–316.56. Mathew, T.A.; Yanov, S.A.; Mazitov, R.; Mishustin, S.P.; Strelis, A.K.; Yanova, G.V.; Golubchikova, V.T.; Taran, D.V.; Golubkov, A.;
Shields, A.L.; et al. Integration of alcohol use disorders identification and management in the tuberculosis programme in TomskOblast, Russia. Eur. J. Public Health 2009, 19, 16–18. [CrossRef] [PubMed]
57. Neuman, M.G.; Sha, K.; Esguerra, R.; Zakhari, S.; Winkler, R.E.; Hilzenrat, N.; Wyse, J.; Cooper, C.L.; Seth, D.; Gorrell, M.D.; et al.Inflammation and repair in viral hepatitis C. Dig. Dis. Sci. 2008, 53, 1468–1487. [CrossRef]
58. Voiculescu, M.; Winkler, R.E.; Moscovici, M.; Neuman, M.G. Chemotherapies and targeted therapies in advanced hepatocellularcarcinoma: From laboratory to clinic. J. Gastrointestin Liver Dis. 2008, 17, 315–322. [PubMed]
125
Nutrients 2021, 13, 3317
59. Alcohol-Induced hepatic fibrosis: Mechanisms. Proceedings of a satellite symposium. Hilton Head Island, South Carolina, USA.June 1998. Alcohol. Clin. Exp. Res. 1999, 23, 901–954.
60. Theall, K.P.; Amedee, A.; Clark, R.A.; Dumestre, J.; Kissinger, P. Alcohol consumption and HIV-1 vaginal RNA shedding amongwomen. J. Stud. Alcohol. Drugs 2008, 69, 454–458. [CrossRef] [PubMed]
61. Coleman, J.S.; Hitti, J.; Bukusi, E.A.; Mwachari, C.; Muliro, A.; Nguti, R.; Gausman, R.; Jensen, S.; Patton, D.; Lockhart, D.;et al. Infectious correlates of HIV-1 shedding in the female upper and lower genital tracts. AIDS 2007, 21, 755–759. [CrossRef][PubMed]
62. Rebbapragada, A.; Howe, K.; Wachihi, C.; Pettengell, C.; Sunderji, S.; Huibner, S.; Ball, T.B.; Plummer, F.A.; Jaoko, W.; Kaul, R.Bacterial vaginosis in HIV-infected women induces reversible alterations in the cervical immune environment. J. Acquir. ImmuneDefic. Syndr. 2008, 49, 520–522. [CrossRef]
63. Pandrea, I.; Happel, K.I.; Amedee, A.M.; Bagby, G.J.; Nelson, S. Alcohol’s role in HIV transmission and disease progression.Alcohol Res. Health 2010, 33, 203–218.
64. Azar, M.M.; Springer, S.A.; Meyer, J.P.; Altice, F.L. A systematic review of the impact of alcohol use disorders on HIV treatmentoutcomes, adherence to antiretroviral therapy and health care utilization. Drug Alcohol. Depend. 2010, 112, 178–193. [CrossRef][PubMed]
65. Vagenas, P.; Azar, M.M.; Copenhaver, M.M.; Springer, S.A.; Molina, P.E.; Altice, F.L. The impact of alcohol use and relateddisorders on the HIV continuum of care: A systematic review. Curr. HIV/AIDS Rep. 2015, 12, 421–436. [CrossRef] [PubMed]
66. Walter, A.W.; Lundgren, L.; Umez-Eronini, A.; Ritter, G.A. Alcohol use and HIV testing in a national sample of women. AIDSBehav. 2016, 20 (Suppl. 1), S84–S96. [CrossRef]
67. Maughan-Brown, B.; Harrison, A.; Galarraga, O.; Kuo, C.; Smith, P.; Bekker, L.G.; Lurie, M.N. Factors affecting linkage to HIVcare and ART initiation following referral for ART by a mobile health clinic in South Africa: Evidence from a multimethod study.J. Behav. Med. 2019, 42, 883–897. [CrossRef]
68. Monroe, A.K.; Lau, B.; Mugavero, M.J.; Mathews, W.C.; Mayer, K.H.; Napravnik, S.; Hutton, H.E.; Kim, H.S.; Jabour, S.; Moore,R.D.; et al. Heavy alcohol use is associated with worse retention in HIV care. J. Acquir. Immune Defic. Syndr. 2016, 73, 419–425.[CrossRef] [PubMed]
69. Cook, R.L.; Zhou, Z.; Kelso-Chichetto, N.E.; Janelle, J.; Morano, J.P.; Somboonwit, C. Alcohol consumption patterns and HIVviral suppression among persons receiving HIV care in Florida: An observational study. Addict. Sci. Clin. Pract. 2017, 12, 1–9.[CrossRef] [PubMed]
70. Fatch, R.; Bellows, B.; Bagenda, F.; Mulogo, E.; Weiser, S.; Hahn, J.A. Alcohol consumption as a barrier to prior HIV testing in apopulation-based study in rural Uganda. AIDS Behav. 2013, 17, 1713–1723. [CrossRef] [PubMed]
71. Kalichman, S.; Banas, E.; Kalichman, M.; Mathews, C. Stigmatisation of alcohol use among people receiving antiretroviral therapyfor HIV infection, Cape Town, South Africa. Glob. Public Health 2020, 15, 1040–1049. [CrossRef]
72. Britton, M.K.; Porges, E.C.; Bryant, V.; Cohen, R.A. Neuroimaging and Cognitive Evidence for Combined HIV-Alcohol Effects onthe Central Nervous System: A Review. Alcohol. Clin. Exp. Res. 2021, 45, 290–306. [CrossRef]
73. Heinz, A.J.; Fogler, K.A.; Newcomb, M.E.; Trafton, J.A.; Bonn-Miller, M.O. Problematic alcohol use among individuals with HIV:Relations with everyday memory functioning and HIV symptom severity. AIDS Behav. 2014, 18, 1302–1314. [CrossRef]
74. El-Krab, R.; Kalichman, S.C. Alcohol-antiretroviral therapy interactive toxicity beliefs and intentional medication nonadherence:Review of research with implications for interventions. AIDS Behav. 2021, 25, 1–14. [CrossRef]
75. Bagasra, O.; Kajdacsy-Balla, A.; Lischner, H.W.; Pomerantz, R.J. Alcohol intake increases human immunodeficiency virus type 1replication in human peripheral blood mononuclear cells. J. Infect. Dis. 1993, 167, 789–797. [CrossRef]
76. Bagasra, O.; Bachman, S.E.; Jew, L.; Tawadros, R.; Cater, J.; Boden, G.; Ryan, I.; Pomerantz, R.J. Increased human immunodeficiencyvirus type 1 replication in human peripheral blood mononuclear cells induced by ethanol: Potential immunopathogenicmechanisms. J. Infect. Dis. 1996, 173, 550–558. [CrossRef] [PubMed]
77. Chen, H.; Zha, J.; Gowans, R.E.; Camargo, P.; Nishitani, J.; McQuirter, J.L.; Cole, S.W.; Zack, J.A.; Liu, X. Alcohol enhances HIVtype 1 infection in normal human oral keratinocytes by up-regulating cell-surface CXCR4 coreceptor. AIDS Res. Hum. Retrovir.2004, 20, 513–519. [CrossRef]
78. Liu, X.; Zha, J.; Nishitani, J.; Chen, H.; Zack, J.A. HIV-1 infection in peripheral blood lymphocytes (PBLs) exposed to alcohol.Virology 2003, 307, 37–44. [CrossRef]
79. Crum, R.M.; Galai, N.; Cohn, S.; Celentano, D.D.; Vlahov, D. Alcohol use and T-lymphocyte subsets among injection drug userswith HIV-1 infection: A prospective analysis. Alcohol. Clin. Exp. Res. 1996, 20, 364–371. [CrossRef] [PubMed]
80. Baum, M.K.; Rafie, C.; Lai, S.; Sales, S.; Page, J.B.; Campa, A. Alcohol use accelerates HIV disease progression. AIDS Res. Hum.Retrovir. 2010, 26, 511–518. [CrossRef]
81. Samet, J.H.; Cheng, D.M.; Libman, H.; Nunes, D.P.; Alperen, J.K.; Saitz, R. Alcohol consumption and HIV disease progression. J.Acquir. Immune Defic. Syndr. 2007, 46, 194–199. [CrossRef] [PubMed]
82. Asiimwe, S.B.; Fatch, R.; Patts, G.; Winter, M.; Lloyd-Travaglini, C.; Emenyonu, N.; Muyindike, W.; Kekibiina, A.; Blokhina, E.;Gnatienko, N. Alcohol types and HIV disease progression among HIV-infected drinkers not yet on antiretroviral therapy inRussia and Uganda. AIDS Behav. 2017, 21, 204–215. [CrossRef]
83. Miguez, M.J.; Shor-Posner, G.; Morales, G.; Rodriguez, A.; Burbano, X. HIV treatment in drug abusers: Impact of alcohol use.Addict. Biol. 2003, 8, 33–37. [CrossRef] [PubMed]
126
Nutrients 2021, 13, 3317
84. Samet, J.H.; Horton, N.J.; Traphagen, E.T.; Lyon, S.M.; Freedberg, K.A. Alcohol consumption and HIV disease progression: Arethey related? Alcohol. Clin. Exp. Res. 2003, 27, 862–867. [CrossRef]
85. McDowell, J.A.; Chittick, G.E.; Stevens, C.P.; Edwards, K.D.; Stein, D.S. Pharmacokinetic interaction of abacavir (1592U89) andethanol in human immunodeficiency virus-infected adults. Antimicrob. Agents Chemother. 2000, 44, 1686–1690. [CrossRef]
86. Lieber, C.S.; DeCarli, L.M. Hepatic microsomal ethanol-oxidizing system. In vitro characteristics and adaptive properties in vivo.J. Biol. Chem. 1970, 245, 2505–2512. [CrossRef]
87. Neuman, M.G.; Monteiro, M.; Rehm, J. Drug interactions between psychoactive substances and antiretroviral therapy inindividuals infected with human immunodeficiency and hepatitis viruses. Subst. Use Misuse 2006, 41, 1395–1463. [CrossRef]
88. Neuman, M.G.; Schneider, M.; Nanau, R.M.; Parry, C. HIV-antiretroviral therapy induced liver, gastrointestinal, and pancreaticinjury. Int. J. Hepatol. 2012, 2012, 760706. [CrossRef]
89. Hahn, J.A.; Samet, J.H. Alcohol and HIV disease progression: Weighing the evidence. Curr. HIV/AIDS Rep. 2010, 7, 226–233.[CrossRef]
90. Scott-Sheldon, L.A.J.; Carey, K.B.; Johnson, B.T.; Carey, M.P. Behavioral interventions targeting alcohol use among people livingwith HIV/AIDS: A systematic review and meta-analysis. AIDS Behav. 2017, 21, 126–143. [CrossRef]
91. Farhadian, N.; Moradi, S.; Zamanian, M.H.; Farnia, V.; Rezaeian, S.; Farhadian, M.; Shahlaei, M. Effectiveness of naltrexonetreatment for alcohol use disorders in HIV: A systematic review. Subst. Abuse Treat. Prev. Policy 2020, 15, 24. [CrossRef] [PubMed]
92. Collins, R.L.; Taylor, S.L.; Elliott, M.N.; Ringel, J.S.; Kanouse, D.E.; Beckman, R. Off-premise alcohol sales policies, drinking, andsexual risk among people living with HIV. Am. J. Public Health 2010, 100, 1890–1892. [CrossRef] [PubMed]
93. Cohen, D.A.; Wu, S.Y.; Farley, T.A. Structural interventions to prevent HIV/sexually transmitted disease: Are they cost-effectivefor women in the southern United States? Sex. Transm. Dis. 2006, 33, S46–S49. [CrossRef] [PubMed]
94. Shuper, P.A. The role of alcohol-related behavioral research in the design of HIV secondary prevention interventions in the era ofantiretroviral therapy: Targeted research priorities moving forward. AIDS Behav. 2021, 25, 1–16. [CrossRef]
95. World Health Organization. Global Tuberculosis Report; World Health Organization: Geneva, Switzerland, 2020.96. GBD 2016 Lower Respiratory Infections Collaborators. Estimates of the global, regional, and national morbidity, mortality, and
aetiologies of lower respiratory infections in 195 countries, 1990–2016: A systematic analysis for the Global Burden of DiseaseStudy 2016. Lancet Infect. Dis. 2018, 18, 1191–1210. [CrossRef]
97. Peltzer, K.; Davids, A.; Njuho, P. Alcohol use and problem drinking in South Africa: Findings from a national population-basedsurvey. Afr. J. Psychiatry 2011, 14, 30–37. [CrossRef]
98. Imtiaz, S.; Shield, K.D.; Roerecke, M.; Samokhvalov, A.V.; Lönnroth, K.; Rehm, J. Alcohol consumption as a risk factor fortuberculosis: Meta-analyses and burden of disease. Eur. Respir. J. 2017, 50, 1700216. [CrossRef]
99. Francisco, J.; Oliveira, O.; Felgueiras, Ó.; Gaio, A.R.; Duarte, R. How much is too much alcohol in tuberculosis? Eur. Respir. J.2017, 49, 1601468. [CrossRef] [PubMed]
100. Cords, O.; Martinez, L.; Warren, J.L.; O’Marr, J.M.; Walter, K.S.; Cohen, T.; Zheng, J.; Ko, A.I.; Croda, J.; Andrews, J.R. Incidenceand prevalence of tuberculosis in incarcerated populations: A systematic review and meta-analysis. Lancet Public Health 2021, 6,e300–e308. [CrossRef]
101. Friedman, L.N.; Sullivan, G.M.; Bevilaqua, R.P.; Loscos, R. Tuberculosis screening in alcoholics and drug addicts. Am. Rev. Respir.Dis. 1987, 136, 1188–1192. [CrossRef] [PubMed]
102. Ragan, E.J.; Kleinman, M.B.; Sweigart, B.; Gnatienko, N.; Parry, C.D.; Horsburgh, C.R.; LaValley, M.P.; Myers, B.; Jacobson, K.R.The impact of alcohol use on tuberculosis treatment outcomes: A systematic review and meta-analysis. Int. J. Tuberc. Lung. Dis.2020, 24, 73–82. [CrossRef] [PubMed]
103. Dos Santos, D.T.; Arroyo, L.H.; Alves, Y.M.; Alves, L.S.; Berra, T.Z.; Crispim, J.A.; Alves, J.D.; Ramos, D.A.C.; Alonso, J.B.; deAssis, I.S.; et al. Survival time among patients who were diagnosed with tuberculosis, the precocious deaths and associatedfactors in southern Brazil. Trop. Med. Health 2021, 49, 31. [CrossRef] [PubMed]
104. Workie, M.G.; Aycheh, M.W.; Birhanu, M.Y.; Tsegaye, T.B. Treatment interruption among drug-susceptible pulmonary tuberculosispatients in Southern Ethiopia. Patient Prefer. Adherence 2021, 15, 1143–1151. [CrossRef]
105. Arora, U.; Garg, P.; Agarwal, S.; Nischal, N.; Wig, N. Complexities in the treatment of coinfection with HIV, hepatitis B, hepatitisC, and tuberculosis. Lancet Infect. Dis. 2021, 21, e182. [CrossRef]
106. Thomas, B.E.; Thiruvengadam, K.; Kadam, D.; Ovung, S.; Sivakumar, S.; Bala Yogendra Shivakumar, S.V.; Paradkar, M.; Gupte,N.; Suryavanshi, N. Smoking, alcohol use disorder and tuberculosis treatment outcomes: A dual co-morbidity burden that cannotbe ignored. PLoS ONE 2019, 14, e0220507. [CrossRef]
107. Kamarulzaman, A.; Reid, S.E.; Schwitters, A.; Wiessing, L.; El-Bassel, N.; Dolan, K.; Moazen, B.; Wirtz, A.L.; Verster, A.; Altice, F.L.Prevention of transmission of HIV, hepatitis B virus, hepatitis C virus, and tuberculosis in prisoners. Lancet 2016, 388, 1115–1126.[CrossRef]
108. Zelnick, J.R.; Daftary, A.; Hwang, C.; Labar, A.S.; Boodhram, R.; Maharaj, B.; Wolf, A.K.; Mondal, S.; Amico, K.R.; Orrell, C.; et al.Electronic dose monitoring identifies a high-risk subpopulation in the treatment of drug-resistant tuberculosis and HIV. Clin.Infect. Dis. 2020. [CrossRef] [PubMed]
109. Myers, B.; Bouton, T.C.; Ragan, E.J.; White, L.F.; McIlleron, H.; Theron, D.; Parry, C.D.H.; Horsburgh, C.R.; Warren, R.M.; Jacobson,K.R. Impact of alcohol consumption on tuberculosis treatment outcomes: A prospective longitudinal cohort study protocol. BMCInfect. Dis. 2018, 18, 488. [CrossRef] [PubMed]
127
Nutrients 2021, 13, 3317
110. Louwagie, G.M.; Morojele, N.; Siddiqi, K.; Mdege, N.D.; Tumbo, J.; Omole, O.; Pitso, L.; Bachmann, M.O.; Ayo-Yusuf, O.A.Addressing tobacco smoking and drinking to improve TB treatment outcomes, in South Africa: A feasibility study of the ProLifeprogram. Transl. Behav. Med. 2020, 10, 1491–1503. [CrossRef] [PubMed]
111. Moriarty, A.S.; Louwagie, G.M.; Mdege, N.D.; Morojele, N.; Tumbo, J.; Omole, O.B.; Bachmann, M.O.; Kanaan, M.; Turner, A.;Parrott, S.; et al. Improving TB outcomes by modifying life-style behaviours through a brief motivational intervention followedby short text messages (ProLife): Study protocol for a randomised controlled trial. Trials 2019, 20, 457. [CrossRef]
112. Myers, B.; Parry, C.D.H.; Morojele, N.K.; Nkosi, S.; Shuper, P.A.; Kekwaletswe, C.T.; Sorsdahl, K.R. “Moving forward with life”:Acceptability of a brief alcohol reduction intervention for people receiving antiretroviral therapy in South Africa. Int. J. Environ.Res. Public Health 2020, 17, 5706. [CrossRef]
113. Magidson, J.F.; Satinsky, E.N.; Luberto, C.M.; Myers, B.; Funes, C.J.; Vanderkruik, R.; Andersen, L.S. “Cooling of the mind”:Assessing the relevance of mindfulness training among people living with HIV using alcohol and other substances in SouthAfrica. Soc. Sci. Med. 2020, 266, 113424. [CrossRef]
114. Greenfield, S.F.; Shields, A.; Connery, H.S.; Livchits, V.; Yanov, S.A.; Lastimoso, C.S.; Strelis, A.K.; Mishustin, S.P.; Fitzmaurice,G.; Mathew, T.A.; et al. Integrated management of physician-delivered alcohol care for tuberculosis patients: Design andimplementation. Alcohol. Clin. Exp. Res. 2010, 34, 317–330. [CrossRef] [PubMed]
115. Calligaro, G.L.; de Wit, Z.; Cirota, J.; Orrell, C.; Myers, B.; Decker, S.; Stein, D.J.; Sorsdahl, K.; Dawson, R. Brief psychotherapyadministered by non-specialised health workers to address risky substance use in patients with multidrug-resistant tuberculosis:A feasibility and acceptability study. Pilot Feasibility Stud. 2021, 7, 28. [CrossRef]
116. Peltzer, K.; Naidoo, P.; Louw, J.; Matseke, G.; Zuma, K.; Mchunu, G.; Tutshana, B.; Mabaso, M. Screening and brief interventionsfor hazardous and harmful alcohol use among patients with active tuberculosis attending primary public care clinics in SouthAfrica: Results from a cluster randomized controlled trial. BMC Public Health 2013, 13, 699. [CrossRef]
117. Aiwale, A.S.; Patel, U.A.; Barvaliya, M.J.; Jha, P.R.; Tripathi, C. Isoniazid induced convulsions at therapeutic dose in an alcoholicand smoker patient. Curr. Drug Saf. 2015, 10, 94–95. [CrossRef]
118. Cross, F.S.; Long, M.W.; Banner, A.S.; Snider, D.E., Jr. Rifampin-isoniazid therapy of alcoholic and nonalcoholic tuberculouspatients in a U.S. Public Health Service Cooperative Therapy Trial. Am. Rev. Respir. Dis. 1980, 122, 349–353. [CrossRef]
119. Karamanakos, P.N.; Pappas, P.; Boumba, V.; Vougiouklakis, T.; Marselos, M. The alcohol intolerance produced by isoniazid isnot due to a disulfiram-like reaction despite aldehyde dehydrogenase inhibition. Pharmacology 2016, 98, 267–271. [CrossRef][PubMed]
120. Pettit, A.C.; Bethel, J.; Hirsch-Moverman, Y.; Colson, P.W.; Sterling, T.R. Female sex and discontinuation of isoniazid due toadverse effects during the treatment of latent tuberculosis. J. Infect. 2013, 67, 424–432. [CrossRef]
121. Freiman, J.M.; Fatch, R.; Cheng, D.; Emenyonu, N.; Ngabirano, C.; Geadas, C.; Adong, J.; Muyindike, W.R.; Linas, B.P.; Jacobson,K.R.; et al. Prevalence of elevated liver transaminases and their relationship with alcohol use in people living with HIV onanti-retroviral therapy in Uganda. PLoS ONE 2021, 16, e0250368. [CrossRef] [PubMed]
122. Freiman, J.M.; Jacobson, K.R.; Muyindike, W.R.; Horsburgh, C.R.; Ellner, J.J.; Hahn, J.A.; Linas, B.P. Isoniazid preventive therapyfor people with HIV who are heavy alcohol drinkers in high TB/HIV-burden countries: A risk-benefit analysis. J. Acquir. ImmuneDefic. Syndr. 2018, 77, 405–412. [CrossRef]
123. McClintock, A.H.; Eastment, M.; McKinney, C.M.; Pitney, C.L.; Narita, M.; Park, D.R.; Dhanireddy, S.; Molnar, A. Treatmentcompletion for latent tuberculosis infection: A retrospective cohort study comparing 9 months of isoniazid, 4 months of rifampinand 3 months of isoniazid and rifapentine. BMC Infect. Dis. 2017, 17, 146. [CrossRef]
124. Mukherjee, T.I.; Hirsch-Moverman, Y.; Saito, S.; Gadisa, T.; Melaku, Z.; Howard, A.A. Determinants of alcohol use among peopleliving with HIV initiating isoniazid preventive therapy in Ethiopia. Drug Alcohol. Depend. 2019, 204, 107465. [CrossRef] [PubMed]
125. Lodi, S.; Emenyonu, N.I.; Marson, K.; Kwarisiima, D.; Fatch, R.; McDonell, M.G.; Cheng, D.M.; Thirumurthy, H.; Gandhi, M.;Camlin, C.S.; et al. The Drinkers’ Intervention to Prevent Tuberculosis (DIPT) trial among heavy drinkers living with HIV inUganda: Study protocol of a 2 × 2 factorial trial. Trials 2021, 22, 355. [CrossRef] [PubMed]
126. Szabo, G.; Saha, B. Alcohol’s effect on host defense. Alcohol Res. 2015, 37, 159–170. [PubMed]127. Yeligar, S.M.; Chen, M.M.; Kovacs, E.J.; Sisson, J.H.; Burnham, E.L.; Brown, L.A. Alcohol and lung injury and immunity. Alcohol
2016, 55, 51–59. [CrossRef] [PubMed]128. Pasala, S.; Barr, T.; Messaoudi, I. Impact of alcohol abuse on the adaptive immune system. Alcohol Res. 2015, 37, 185–197.
[PubMed]129. Haiqing, C.; Chen, L.; Yin, C.; Liao, Y.; Meng, X.; Lu, C.; Tang, S.; Li, X.; Wang, X. The effect of micro-nutrients on malnutrition,
immunity and therapeutic effect in patients with pulmonary tuberculosis: A systematic review and meta-analysis of randomisedcontrolled trials. Tuberculosis 2020, 125, 101994. [CrossRef]
130. Sinha, P.; Lönnroth, K.; Bhargava, A.; Heysell, S.K.; Sarkar, S.; Salgame, P.; Rudgard, W.; Boccia, D.; Van Aartsen, D.; Hochberg,N.S. Food for thought: Addressing undernutrition to end tuberculosis. Lancet Infect. Dis. 2021. [CrossRef]
131. Enoh, J.E.; Cho, F.N.; Manfo, F.P.; Ako, S.E.; Akum, E.A. Abnormal levels of liver enzymes and hepatotoxicity in HIV-positive,TB, and HIV/TB-coinfected patients on treatment in Fako division, southwest region of Cameroon. Biomed. Res. Int. 2020, 2020,9631731. [CrossRef]
128
Nutrients 2021, 13, 3317
132. Melikyan, N.; Huerga, H.; Atshemyan, H.; Kirakosyan, O.; Sargsyants, N.; Aydinyan, T.; Saribekyan, N.; Khachatryan, N.;Oganezova, I.; Falcao, J.; et al. Concomitant treatment of chronic hepatitis C with direct-acting antivirals and multidrug-resistanttuberculosis is effective and safe. Open Forum. Infect. Dis. 2021, 8, ofaa653. [CrossRef]
133. Yew, W.W.; Leung, C.C. Antituberculosis drugs and hepatotoxicity. Respirology (Carlton Vic.) 2006, 11, 699–707. [CrossRef]134. Alghamdi, W.A.; Al-Shaer, M.H.; Kipiani, M.; Barbakadze, K.; Mikiashvili, L.; Kempker, R.R.; Peloquin, C.A. Pharmacokinetics of
bedaquiline, delamanid and clofazimine in patients with multidrug-resistant tuberculosis. J. Antimicrob. Chemother. 2021, 76,1019–1024. [CrossRef] [PubMed]
135. Torres, A.; Cilloniz, C.; Niederman, M.S.; Menéndez, R.; Chalmers, J.D.; Wunderink, R.G.; van der Poll, T. Pneumonia. Nat. Rev.Dis. Primers 2021, 7, 25. [CrossRef]
136. Global Health Data Exchange (GHDx). GBD Results Tool for the Global Burden of Disease 2019 Study. Available online:http://ghdx.healthdata.org/gbd-results-tool (accessed on 12 April 2020).
137. Shield, K.; Manthey, J.; Rylett, M.; Probst, C.; Wettlaufer, A.; Parry, C.D.H.; Rehm, J. National, regional, and global burdens ofdisease from 2000 to 2016 attributable to alcohol use: A comparative risk assessment study. Lancet Public Health 2020, 5, e51–e61.[CrossRef]
138. Torres, A.; Peetermans, W.E.; Viegi, G.; Blasi, F. Risk factors for community-acquired pneumonia in adults in Europe: A literaturereview. Thorax 2013, 68, 1057–1065. [CrossRef] [PubMed]
139. Shield, K.D.; Rehm, J. Societal development and the alcohol—Attributable burden of disease. Addiction 2021, 116, 2326–2338.[CrossRef] [PubMed]
140. Probst, C.; Roerecke, M.; Behrendt, S.; Rehm, J. Socioeconomic differences in alcohol-attributable mortality compared withall-cause mortality: A systematic review and meta-analysis. Int. J. Epidemiol. 2014, 43, 1314–1327. [CrossRef] [PubMed]
141. Probst, C.; Kilian, C.; Sanchez, S.; Lange, S.; Rehm, J. The role of alcohol use and drinking patterns in socioeconomic inequalitiesin mortality: A systematic review. Lancet Public Health 2020, 5, e324–e332. [CrossRef]
142. Babor, T.F.; Casswell, S.; Graham, K.; Huckle, T.; Livingston, M.; Österberg, E.; Rehm, J.; Room, R.; Rossow, I.; Sornpaisarn, B.Alcohol: No Ordinary Commodity. Research and Public Policy, 3rd ed.; Oxford University Press: Oxford, UK, 2021.
143. Bhatty, M.; Pruett, S.B.; Swiatlo, E.; Nanduri, B. Alcohol abuse and Streptococcus pneumoniae infections: Consideration ofvirulence factors and impaired immune responses. Alcohol 2011, 45, 523–539. [CrossRef]
144. Mehta, A.J.; Guidot, D.M. Alcohol and the lung. Alcohol Res. 2017, 38, 243–254.145. Simet, S.M.; Sisson, J.H. Alcohol’s effects on lung health and immunity. Alcohol Res. Curr. Rev. 2015, 37, 199.146. Gamble, L.; Mason, C.; Nelson, S. The effects of alcohol on immunity and bacterial infection in the lung. Med. Mal. Infect. 2006, 36,
72–77. [CrossRef]147. Heermans, E.H. Booze and blood: The effects of acute and chronic alcohol abuse on the hematopoietic system. Clin. Lab. Sci.
1998, 11, 229–232.148. Nelson, S.; Zhang, P.; Bagby, G.J.; Happel, K.I.; Raasch, C.E. Alcohol abuse, immunosuppression, and pulmonary infection. Curr.
Drug Abuse Rev. 2008, 1, 56–67. [CrossRef]149. Szabo, G.; Mandrekar, P.; Catalano, D. Inhibition of superantigen-induced T cell proliferation and monocyte IL-1β, TNF-α, and
IL-6 production by acute ethanol treatment. J. Leukoc. Biol. 1995, 58, 342–350. [CrossRef]150. Samokhvalov, A.; Irving, H.; Rehm, J. Alcohol consumption as a risk factor for pneumonia: A systematic review and meta-analysis.
Epidemiol. Infect. 2010, 138, 1789–1795. [CrossRef]151. Simou, E.; Britton, J.; Leonardi-Bee, J. Alcohol and the risk of pneumonia: A systematic review and meta-analysis. BMJ Open 2018,
8, e022344. [CrossRef]152. Rehm, J.; Anderson, P.; Gual, A.; Kraus, L.; Marmet, S.; Nutt, D.; Room, R.; Samokhvalov, A.; Scafato, E.; Shield, K. The tangible
common denominator of substance use disorders: A reply to commentaries to Rehm et al. (2013a). Alcohol Alcohol. 2014, 49,118–122. [CrossRef] [PubMed]
153. Schwarzinger, M.; Thiébaut, S.P.; Baillot, S.; Mallet, V.; Rehm, J. Alcohol use disorders and associated chronic disease: A nationalretrospective cohort study from France. BMC Public Health 2018, 18, 1–9. [CrossRef] [PubMed]
154. Fernández-Solá, J.; Junqué, A.; Estruch, R.; Monforte, R.; Torres, A.; Urbano-Márquez, A. High alcohol intake as a risk andprognostic factor for community-acquired pneumonia. Arch. Intern. Med. 1995, 155, 1649–1654. [CrossRef] [PubMed]
155. Koivula, I.; Sten, M.; Makela, P.H. Risk factors for pneumonia in the elderly. Am. J. Med. 1994, 96, 313–320. [CrossRef]156. Luján, M.; Gallego, M.; Belmonte, Y.; Fontanals, D.; Valles, J.; Lisboa, T.; Rello, J. Influence of pneumococcal serotype group on
outcome in adults with bacteraemic pneumonia. Eur. Respir. J. 2010, 36, 1073–1079. [CrossRef] [PubMed]157. Trevejo-Nunez, G.; Kolls, J.K.; De Wit, M. Alcohol use as a risk factor in infections and healing: A clinician’s perspective. Alcohol
Res. 2015, 37, 177.158. Gupta, N.M.; Deshpande, A.; Rothberg, M.B. Pneumonia and alcohol use disorder: Implications for treatment. Cleve Clin. J. Med.
2020, 87, 493–500. [CrossRef] [PubMed]159. WHO Director General. WHO Director-General’s Opening Remarks at the Media Briefing on COVID-19—11 March 2020.
Available online: https://www.who.int/director-general/speeches/detail/who-director-general-s-opening-remarks-at-the-media-briefing-on-covid-19---11-march-2020 (accessed on 21 July 2021).
160. Worldometer. COVID-19 Coronavirus Pandemic. Available online: https://www.worldometers.info/coronavirus/ (accessed on10 July 2021).
129

Nutrients 2021, 13, 3317
161. Islam, N.; Shkolnikov, V.M.; Acosta, R.J.; Klimkin, I.; Kawachi, I.; Irizarry, R.A.; Alicandro, G.; Khunti, K.; Yates, T.; Jdanov, D.A.;et al. Excess deaths associated with covid-19 pandemic in 2020: Age and sex disaggregated time series analysis in 29 high incomecountries. BMJ 2021, 373, n1137. [CrossRef]
162. Althobaiti, Y.S.; Alzahrani, M.A.; Alsharif, N.A.; Alrobaie, N.S.; Alsaab, H.O.; Uddin, M.N. The possible relationship between theabuse of tobacco, opioid, or alcohol with COVID-19. Healthcare 2020, 9, 2. [CrossRef]
163. Kendler, K.S.; Ohlsson, H.; Karriker-Jaffe, K.J.; Sundquist, J.; Sundquist, K. Social and economic consequences of alcohol usedisorder: A longitudinal cohort and co-relative analysis. Psychol. Med. 2017, 47, 925–935. [CrossRef] [PubMed]
164. Buu, A.; Mansour, M.; Wang, J.; Refior, S.K.; Fitzgerald, H.E.; Zucker, R.A. Alcoholism effects on social migration and neighbor-hood effects on alcoholism over the course of 12 years. Alcohol. Clin. Exp. Res. 2007, 31, 1545–1551. [CrossRef] [PubMed]
165. Samuels-Kalow, M.E.; Dorner, S.; Cash, R.E.; Dutta, S.; White, B.; Ciccolo, G.E.; Brown, D.F.M.; Camargo, C.A., Jr. Neighborhooddisadvantage measures and COVID-19 cases in Boston, 2020. Public Health Rep. 2021, 136, 368–374. [CrossRef] [PubMed]
166. Gurrieri, L.; Fairbairn, C.E.; Sayette, M.A.; Bosch, N. Alcohol narrows physical distance between strangers. Proc. Natl. Acad. Sci.USA 2021, 118, e2101937118. [CrossRef] [PubMed]
167. Osuchowski, M.F.; Winkler, M.S.; Skirecki, T.; Cajander, S.; Shankar-Hari, M.; Lachmann, G.; Monneret, G.; Venet, F.; Bauer, M.;Brunkhorst, F.M.; et al. The COVID-19 puzzle: Deciphering pathophysiology and phenotypes of a new disease entity. LancetRespir. Med. 2021, 9, 622–642. [CrossRef]
168. Bailey, K.L.; Samuelson, D.R.; Wyatt, T.A. Alcohol use disorder: A pre-existing condition for COVID-19? Alcohol 2021, 90, 11–17.[CrossRef]
169. Vasudeva, A.; Patel, T.K. Alcohol consumption: An important epidemiological factor in COVID-19? J. Glob. Health 2020, 10,020335. [CrossRef] [PubMed]
170. Huang, W.; Zhou, H.; Hodgkinson, C.; Montero, A.; Goldman, D.; Chang, S.L. Network meta-analysis on the mechanismsunderlying alcohol augmentation of COVID-19 pathologies. Alcohol. Clin. Exp. Res. 2021, 45, 675–688. [CrossRef]
171. Wendt, F.R.; De Lillo, A.; Pathak, G.A.; De Angelis, F.; Polimanti, R. Host genetic liability for severe COVID-19 overlaps withalcohol drinking behavior and diabetic outcomes and in over 1 million participants. medRxiv 2020, 12. [CrossRef]
172. Benzano, D.; Ornell, F.; Schuch, J.B.; Pechansky, F.; Sordi, A.O.; von Diemen, L.; Kessler, F.H.P. Clinical vulnerability for severityand mortality by COVID-19 among users of alcohol and other substances. Psychiatry Res. 2021, 300, 113915. [CrossRef] [PubMed]
173. Fan, X.; Liu, Z.; Poulsen, K.L.; Wu, X.; Miyata, T.; Dasarathy, S.; Rotroff, D.M.; Nagy, L.E. Alcohol consumption is associated withpoor prognosis in obese patients with COVID-19: A Mendelian randomization study using UK Biobank. Nutrients 2021, 13, 1592.[CrossRef] [PubMed]
174. Kushner, T.; Cafardi, J. Chronic liver disease and COVID-19: Alcohol use disorder/alcohol-associated liver disease, nonalcoholicfatty liver disease/nonalcoholic steatohepatitis, autoimmune liver disease, and compensated cirrhosis. Clin. Liver Dis. 2020, 15,195–199. [CrossRef] [PubMed]
175. Moon, A.M.; Curtis, B.; Mandrekar, P.; Singal, A.K.; Verna, E.C.; Fix, O.K. Alcohol-associated liver disease before and afterCOVID-19: An overview and call for ongoing investigation. Hepatol. Commun. 2021, 5, 1616–1621. [CrossRef]
176. Cava, E.; Neri, B.; Carbonelli, M.G.; Riso, S.; Carbone, S. Obesity pandemic during COVID-19 outbreak: Narrative review andfuture considerations. Clin. Nutr. 2021, 40, 1637–1643. [CrossRef]
177. Bilal, B.; Saleem, F.; Fatima, S.S. Alcohol consumption and obesity: The hidden scare with COVID-19 severity. Med. Hypotheses2020, 144, 110272. [CrossRef]
178. Alberca, R.W.; Rigato, P.O.; Ramos YÁ, L.; Teixeira, F.M.E.; Branco, A.C.C.; Fernandes, I.G.; Pietrobon, A.J.; Duarte, A.; Aoki, V.;Orfali, R.L.; et al. Clinical characteristics and survival analysis in frequent alcohol consumers with COVID-19. Front. Nutr. 2021,8, 689296. [CrossRef]
179. Saurabh, S.; Verma, M.K.; Gautam, V.; Kumar, N.; Jain, V.; Goel, A.D.; Gupta, M.K.; Sharma, P.P.; Bhardwaj, P.; Singh, K.; et al.Tobacco, alcohol use and other risk factors for developing symptomatic COVID-19 vs asymptomatic SARS-CoV-2 infection: Acase-control study from western Rajasthan, India. Trans. R. Soc. Trop. Med. Hyg. 2021, 115, 820–831. [CrossRef]
180. Varela Rodríguez, C.; Arias Horcajadas, F.; Martín-Arriscado Arroba, C.; Combarro Ripoll, C.; Juanes Gonzalez, A.; EsperesatePajares, M.; Rodrigo Holgado, I.; Cadenas Manceñido, Á.; Sánchez Rodríguez, L.; Baselga Penalva, B.; et al. COVID-19-relatedneuropsychiatric symptoms in patients with alcohol abuse conditions during the SARS-CoV-2 pandemic: A retrospective cohortstudy using real world data from electronic health records of a tertiary hospital. Front. Neurol. 2021, 12, 630566. [CrossRef][PubMed]
181. Wang, Q.Q.; Kaelber, D.C.; Xu, R.; Volkow, N.D. COVID-19 risk and outcomes in patients with substance use disorders: Analysesfrom electronic health records in the United States. Mol. Psychiatry 2021, 26, 30–39. [CrossRef] [PubMed]
182. Dai, M.; Tao, L.; Chen, Z.; Tian, Z.; Guo, X.; Allen-Gipson, D.S.; Tan, R.; Li, R.; Chai, L.; Ai, F.; et al. Influence of cigarettes andalcohol on the severity and death of COVID-19: A multicenter retrospective study in Wuhan, China. Front. Physiol. 2020, 11,588553. [CrossRef]
183. Lv, L.; Zhou, Y.W.; Yao, R. Alcohol consumption and COVID-19 severity: A propensity score matched study in China. Signa Vitae2021, 17, 112–120. [CrossRef]
184. Pro, G.; Gilbert, P.A.; Baldwin, J.A.; Brown, C.C.; Young, S.; Zaller, N. Multilevel modeling of county-level excessive alcohol use,rurality, and COVID-19 case fatality rates in the US. PLoS ONE 2021, 16, e0253466. [CrossRef] [PubMed]
130
Nutrients 2021, 13, 3317
185. Abbasi-Oshaghi, E.; Mirzaei, F.; Khodadadi, I. Alcohol misuse may increase the severity of COVID-19 infections. Disaster. Med.Public Health Prep. 2020, 18, 1–2. [CrossRef]
186. Saengow, U.; Assanangkornchai, S.; Casswell, S. Alcohol: A probable risk factor of COVID-19 severity. Addiction 2021, 116,204–220. [CrossRef]
187. Testino, G. Are patients with alcohol use disorders at increased risk for COVID-19 infection? Alcohol Alcohol. 2020, 55, 344–346.[CrossRef]
188. Collin, S.M.; Wurie, F.; Muzyamba, M.C.; de Vries, G.; Lonnroth, K.; Migliori, G.B.; Abubakar, I.; Anderson, S.R.; Zenner, D.Effectiveness of interventions for reducing TB incidence in countries with low TB incidence: A systematic review of reviews. Eur.Respir. Rev. 2019, 28, 180107. [CrossRef] [PubMed]
189. Almirall, J.; Bolibar, I.; Serra-Prat, M. Risk factors for community-acquired pneumonia in adults: Recommendations for itsprevention. Community Acquir. Infect. 2015, 2, 32. [CrossRef]
190. Pletz, M.W.; Rohde, G.G.; Welte, T.; Kolditz, M.; Ott, S. Advances in the prevention, management, and treatment of community-acquired pneumonia. F1000Res 2016, 5. [CrossRef]
191. Rivero-Calle, I.; Cebey-Lopez, M.; Pardo-Seco, J.; Yuste, J.; Redondo, E.; Vargas, D.A.; Mascaros, E.; Diaz-Maroto, J.L.; Linares-Rufo, M.; Jimeno, I.; et al. Lifestyle and comorbid conditions as risk factors for community-acquired pneumonia in outpatientadults (NEUMO-ES-RISK project). BMJ Open Respir. Res. 2019, 6, e000359. [CrossRef]
192. Carrasco, M.A.; Esser, M.B.; Sparks, A.; Kaufman, M.R. HIV-alcohol risk reduction interventions in sub-Saharan Africa: Asystematic review of the literature and recommendations for a way forward. AIDS Behav. 2016, 20, 484–503. [CrossRef] [PubMed]
193. Morojele, N.K.; Ranchod, C. Review of interventions to reduce alcohol use-related sexual risk behaviour in Africa. Afr. J. DrugAlcohol. Stud. 2011, 10, 95–106.
194. Fritz, K.; McFarland, W.; Wyrod, R.; Chasakara, C.; Makumbe, K.; Chirowodza, A.; Mashoko, C.; Kellogg, T.; Woelk, G. Evaluationof a peer network-based sexual risk reduction intervention for men in beer halls in Zimbabwe: Results from a randomizedcontrolled trial. AIDS Behav. 2011, 15, 1732–1744. [CrossRef]
195. Kalichman, S.C.; Simbayi, L.C.; Cain, D.; Carey, K.B.; Carey, M.P.; Eaton, L.; Harel, O.; Mehlomakhulu, V.; Mwaba, K. Randomizedcommunity-level HIV prevention intervention trial for men who drink in South African alcohol-serving venues. Eur. J. PublicHealth 2014, 24, 833–839. [CrossRef] [PubMed]
196. Morojele, N.K.; Kitleli, N.; Ngako, K.; Kekwaletswe, C.T.; Nkosi, S.; Fritz, K.; Parry, C.D. Feasibility and acceptability of abar-based sexual risk reduction intervention for bar patrons in Tshwane, South Africa. SAHARA J. 2014, 11, 1–9. [CrossRef][PubMed]
197. Raviglione, M.; Poznyak, V. Targeting harmful use of alcohol for prevention and treatment of tuberculosis: A call for action. Eur.Respir. J. 2017, 50. [CrossRef] [PubMed]
198. Shin, S.; Livchits, V.; Connery, H.S.; Shields, A.; Yanov, S.; Yanova, G.; Fitzmaurice, G.M.; Nelson, A.K.; Greenfield, S.F.; TomskTuberculosis Alcohol Working Group. Effectiveness of alcohol treatment interventions integrated into routine tuberculosis care inTomsk, Russia. Addiction 2013, 108, 1387–1396. [CrossRef] [PubMed]
199. Mehta, A.J. Alcoholism and critical illness: A review. World J. Crit. Care Med. 2016, 5, 27–35. [CrossRef]200. Brown, J.L.; DeMartini, K.S.; Sales, J.M.; Swartzendruber, A.L.; DiClemente, R.J. Interventions to reduce alcohol use among
HIV-infected individuals: A review and critique of the literature. Curr. HIV/AIDS Rep. 2013, 10, 356–370. [CrossRef]201. Madhombiro, M.; Musekiwa, A.; January, J.; Chingono, A.; Abas, M.; Seedat, S. Psychological interventions for alcohol use
disorders in people living with HIV/AIDS: A systematic review. Syst. Rev. 2019, 8, 244. [CrossRef]202. Samet, J.H.; Walley, A.Y. Interventions targeting HIV-infected risky drinkers: Drops in the bottle. Alcohol Res. Health 2010, 33,
267–279. [PubMed]203. Regenauer, K.S.; Myers, B.; Batchelder, A.W.; Magidson, J.F. “That person stopped being human”: Intersecting HIV and substance
use stigma among patients and providers in South Africa. Drug Alcohol. Depend. 2020, 216, 108322. [CrossRef] [PubMed]204. Kalichman, S.C.; Katner, H.; Hill, M.; Kalichman, M.O.; Hernandez, D. Alcohol-related intentional antiretroviral nonadherence
among people living with HIV: Test of an Interactive Toxicity Beliefs Process Model. J. Int. Assoc. Provid. AIDS Care 2019, 18,2325958219826612. [CrossRef]
205. World Health Organization. Tackling NCDs: ‘Best Buys’ and Other Recommended Interventions for the Prevention and Control ofNoncommunicable Diseases; World Health Organization: Geneva, Switzerland, 2017.
206. Ferreira-Borges, C.; Esser, M.B.; Dias, S.; Babor, T.; Parry, C.D. Alcohol control policies in 46 African countries: Opportunities forimprovement. Alcohol Alcohol. 2015, 50, 470–476. [CrossRef]
207. Gururaj, G.; Gautham, M.S.; Arvind, B.A. Alcohol consumption in India: A rising burden and a fractured response. Drug AlcoholRev. 2021, 40, 368–384. [CrossRef] [PubMed]
208. Medina-Mora, M.E.; Monteiro, M.; Rafful, C.; Samano, I. Comprehensive analysis of alcohol policies in the Latin America and theCaribbean. Drug Alcohol Rev. 2021, 40, 385–401. [CrossRef]
209. Morojele, N.K.; Dumbili, E.W.; Obot, I.S.; Parry, C.D.H. Alcohol consumption, harms and policy developments in sub-SaharanAfrica: The case for stronger national and regional responses. Drug Alcohol Rev. 2021, 40, 402–419. [CrossRef] [PubMed]
131

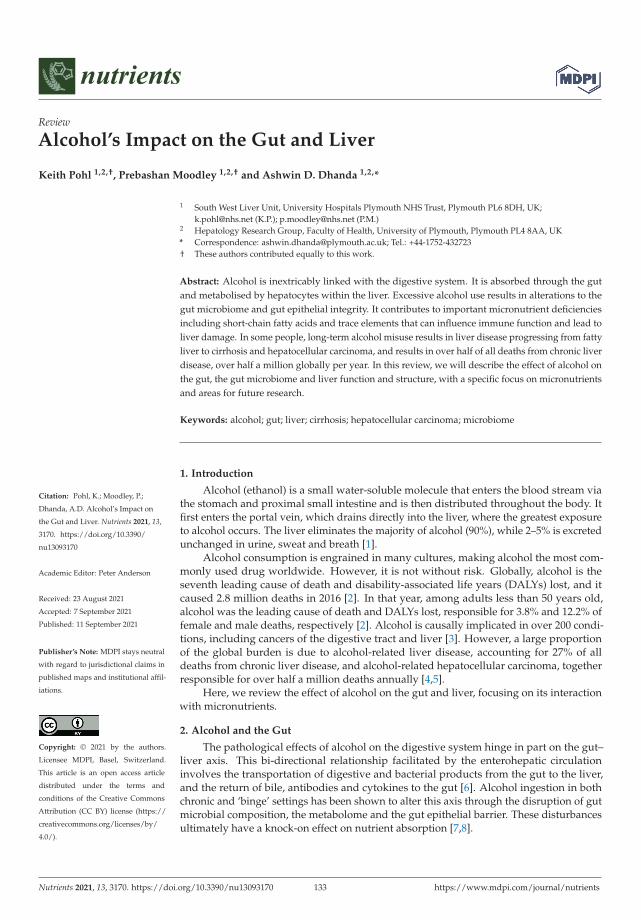
nutrients
Review
Alcohol’s Impact on the Gut and Liver
Keith Pohl 1,2,†, Prebashan Moodley 1,2,† and Ashwin D. Dhanda 1,2,*
Citation: Pohl, K.; Moodley, P.;
Dhanda, A.D. Alcohol’s Impact on
the Gut and Liver. Nutrients 2021, 13,
3170. https://doi.org/10.3390/
nu13093170
Academic Editor: Peter Anderson
Received: 23 August 2021
Accepted: 7 September 2021
Published: 11 September 2021
Publisher’s Note: MDPI stays neutral
with regard to jurisdictional claims in
published maps and institutional affil-
iations.
Copyright: © 2021 by the authors.
Licensee MDPI, Basel, Switzerland.
This article is an open access article
distributed under the terms and
conditions of the Creative Commons
Attribution (CC BY) license (https://
creativecommons.org/licenses/by/
4.0/).
1 South West Liver Unit, University Hospitals Plymouth NHS Trust, Plymouth PL6 8DH, UK;[email protected] (K.P.); [email protected] (P.M.)
2 Hepatology Research Group, Faculty of Health, University of Plymouth, Plymouth PL4 8AA, UK* Correspondence: [email protected]; Tel.: +44-1752-432723† These authors contributed equally to this work.
Abstract: Alcohol is inextricably linked with the digestive system. It is absorbed through the gutand metabolised by hepatocytes within the liver. Excessive alcohol use results in alterations to thegut microbiome and gut epithelial integrity. It contributes to important micronutrient deficienciesincluding short-chain fatty acids and trace elements that can influence immune function and lead toliver damage. In some people, long-term alcohol misuse results in liver disease progressing from fattyliver to cirrhosis and hepatocellular carcinoma, and results in over half of all deaths from chronic liverdisease, over half a million globally per year. In this review, we will describe the effect of alcohol onthe gut, the gut microbiome and liver function and structure, with a specific focus on micronutrientsand areas for future research.
Keywords: alcohol; gut; liver; cirrhosis; hepatocellular carcinoma; microbiome
1. Introduction
Alcohol (ethanol) is a small water-soluble molecule that enters the blood stream viathe stomach and proximal small intestine and is then distributed throughout the body. Itfirst enters the portal vein, which drains directly into the liver, where the greatest exposureto alcohol occurs. The liver eliminates the majority of alcohol (90%), while 2–5% is excretedunchanged in urine, sweat and breath [1].
Alcohol consumption is engrained in many cultures, making alcohol the most com-monly used drug worldwide. However, it is not without risk. Globally, alcohol is theseventh leading cause of death and disability-associated life years (DALYs) lost, and itcaused 2.8 million deaths in 2016 [2]. In that year, among adults less than 50 years old,alcohol was the leading cause of death and DALYs lost, responsible for 3.8% and 12.2% offemale and male deaths, respectively [2]. Alcohol is causally implicated in over 200 condi-tions, including cancers of the digestive tract and liver [3]. However, a large proportionof the global burden is due to alcohol-related liver disease, accounting for 27% of alldeaths from chronic liver disease, and alcohol-related hepatocellular carcinoma, togetherresponsible for over half a million deaths annually [4,5].
Here, we review the effect of alcohol on the gut and liver, focusing on its interactionwith micronutrients.
2. Alcohol and the Gut
The pathological effects of alcohol on the digestive system hinge in part on the gut–liver axis. This bi-directional relationship facilitated by the enterohepatic circulationinvolves the transportation of digestive and bacterial products from the gut to the liver,and the return of bile, antibodies and cytokines to the gut [6]. Alcohol ingestion in bothchronic and ‘binge’ settings has been shown to alter this axis through the disruption of gutmicrobial composition, the metabolome and the gut epithelial barrier. These disturbancesultimately have a knock-on effect on nutrient absorption [7,8].
Nutrients 2021, 13, 3170. https://doi.org/10.3390/nu13093170 https://www.mdpi.com/journal/nutrients133

Nutrients 2021, 13, 3170
2.1. The Effect of Alcohol on Microbial Composition and Gut Barrier Function
The human gut microbiome describes a complex community of bacteria, viruses, fungiand archaea, which varies both with environmental factors (such as diet and drugs) andage, but less so with host genetics [9–12]. Disruption of the microbiome (dysbiosis) has beenlinked with a wide range of conditions including diabetes, obesity, cardiovascular disease,inflammatory bowel disease and liver cirrhosis; however, it is unclear whether this is acause or effect relationship [13,14]. Several studies have investigated the effect of alcoholconsumption in both animal and human models, and have consistently shown that alcoholconsumption is linked with the development of dysbiosis [13,15]. In brief, alcohol has beenshown to increase the relative abundance of Proteobacteria, Enterobacteriacea and Streptococcusand decrease the abundance of Bacteroides, Akkermansia and Faecalibacterium [15]. Theaetiological mechanism of this dysbiosis is not fully understood; however, it is likely thatthis is multifaceted, including alcohol-induced oxidative stress (which is poorly toleratedby obligate anaerobes such as Bacteroides) and the downregulation of antibacterial peptidessuch as α-defensins by alcohol [16,17].
Alcohol-induced dysbiosis contributes to the development of both acute (e.g., alcoholichepatitis) and chronic (e.g., alcohol-related cirrhosis) liver diseases through its pathologicaleffect on gut integrity. The intestinal mucous barrier has an essential role in the immunefunction of the gut, and its disruption leads to these disease states. In this barrier, neigh-bouring enterocytes are bound together by the apical ‘tight junction’ proteins claudins,occludin and zona occludens, preventing the unwanted translocation of luminal contentssuch as pathogen-associated molecular particles (PAMPs) and bacterial endotoxins into theportal circulation [18]. Dysbiosis induced by alcohol consumption has been linked to thedisruption of these tight junctions. As a consequence, the subsequent immune dysfunctionand increase in circulating pro-inflammatory cytokines such as tumour necrosis factor(TNF)-α and interleukin (IL)-1β further disrupts the gut barrier [18,19].
2.2. The Effect of Alcohol on the Metabolome
Alcohol-related dysbiosis inevitably affects the gut metabolome, and dramatic alter-ations in short-chain fatty acids (SCFAs), amino acids and bile acids have been documented.
The role of SCFAs in the maintenance of tight junctions is becoming increasinglyapparent. SCFAs are fatty acids with fewer than six carbon atoms, and are the product ofthe anaerobic fermentation of indigestible dietary fibres by the gut microbiota [20]. Analysisof the faecal metabolome in humans with alcohol use disorders revealed a reduction inSCFAs, which is likely to be due in part to dysbiosis that negatively affects SCFA-producingbacteria such as Faecalibacterium [15,21]. Several murine models have reliably shown thatsupplementation with SCFAs in either the form of a high fibre diet, probiotic or dietarymodification enhances gut epithelial integrity and reduces liver injury in alcoholic models,and work in this area is ongoing [22–24].
The gut metabolome also plays an important part in the metabolism and absorptionof essential and non-essential amino acids, which appear to be altered by alcohol ingestion.Less work has been conducted to investigate this effect. However, several studies haveidentified that alcohol consumption lowers the concentration of almost all amino acids inthe gut lumen [12,14,25]. Both essential, dietary-obtained amino acids (e.g., lysine) andnon-essential amino acids (e.g., glutamic acid) are affected. It is postulated that this is aresult of a disturbed microbial–host co-metabolism as a result of dysbiosis [14]. Althoughluminal amino acid concentrations fall with alcohol consumption, serum levels of some,such as tyrosine and phenylalanine, rise, suggesting an altered metabolic and absorptionprofile of the dysbiotic microbiome [14,26]. This metabolic imbalance may play a role inthe generation of increased levels of reactive oxygen species (ROS) and toxic intermediates.
Bile acids have been shown to be altered in both the serum and luminal contents ofhumans and rats consuming alcohol [12,14,27]. Primary (synthesised by the liver) andsecondary (from bacterial metabolism) bile acids perform a variety of functions predomi-nantly in the small bowel and have crucial roles in lipid absorption, cholesterol homeostasis
134

Nutrients 2021, 13, 3170
as well as hormonal actions through their steroid structure. In a healthy entero-hepaticcirculation, primary bile acids are conjugated with either taurine or glycine to form bilesalts that are secreted into the intestinal lumen. The intestinal microbiota then metabolisesthese to secondary bile acids, removing the taurine/glycine groups before recycling themback to the liver. Alcohol consumption appears to disrupt this by increasing the proportionof secondary bile acids and the total concentration of bile acids, as well as increasing theproportion conjugated with glycine instead of taurine [12,14]. It is felt that this is caused bydysbiosis decreasing the bioavailability of taurine and an increased rate of entero-hepaticcycling [12,14]. The consequence of this disruption is not fully understood; however, it islikely that the glycine-conjugated acids that are more prevalent during alcohol consump-tion are relatively more toxic, and the increased synthesis of bile acids despite high luminalconcentrations contributes to hepatic steatosis [12].
2.3. The Effect of Alcohol Consumption on Nutritional Status
Chronic alcohol ingestion reduces nutrient absorption and contributes to malnutri-tion [28]. Alterations in intestinal permeability, bile acid profiles and the microbiome allcontribute to this, and in addition, the toxic metabolites and ROS released during alcoholmetabolism cause structural damage to the intestine. In particular, chronic alcohol use hasbeen shown to cause cell death, mucosal erosions and the loss of epithelium at the villitips [29]. The consequences of this are variable deficiencies in vitamins A, B1 (thiamine),B2 (riboflavin), B6 (pyridoxine), C, D, E and K as well as folate, calcium, magnesium,phosphate, iron and the trace elements zinc and selenium [28,30]. It is important thatall patients with chronic alcohol use disorders undergo a full nutritional assessment asthese deficiencies vary between individuals, with iron as an example that can be eitherdeficient or found in excess. Alongside the mechanisms described above, heavy alcoholusers obtain up to 50 percent of their daily caloric intake from nutritionally deplete alco-holic drinks [8]. Furthermore, it should be noted that alongside the symptomatic effects ofchronic alcohol misuse (e.g., vomiting, anorexia and abdominal pain), social factors in thisgroup such as poverty and access to a nutritionally ‘complete’ diet may also contribute tomalnutrition [31].
The effect of alcohol on the gut is summarised in Figure 1.
135
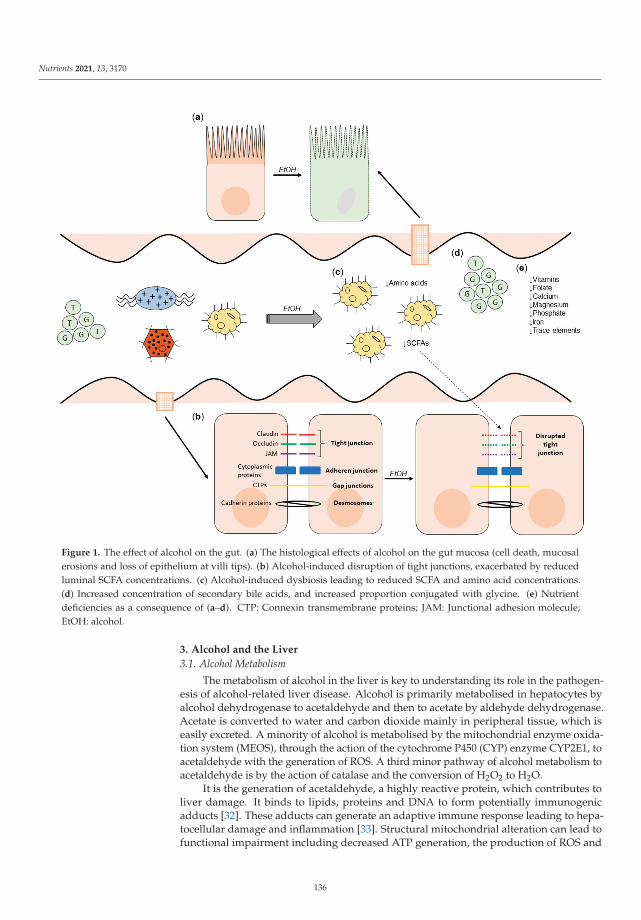
Nutrients 2021, 13, 3170
Figure 1. The effect of alcohol on the gut. (a) The histological effects of alcohol on the gut mucosa (cell death, mucosalerosions and loss of epithelium at villi tips). (b) Alcohol-induced disruption of tight junctions, exacerbated by reducedluminal SCFA concentrations. (c) Alcohol-induced dysbiosis leading to reduced SCFA and amino acid concentrations.(d) Increased concentration of secondary bile acids, and increased proportion conjugated with glycine. (e) Nutrientdeficiencies as a consequence of (a–d). CTP: Connexin transmembrane proteins; JAM: Junctional adhesion molecule;EtOH: alcohol.
3. Alcohol and the Liver
3.1. Alcohol Metabolism
The metabolism of alcohol in the liver is key to understanding its role in the pathogen-esis of alcohol-related liver disease. Alcohol is primarily metabolised in hepatocytes byalcohol dehydrogenase to acetaldehyde and then to acetate by aldehyde dehydrogenase.Acetate is converted to water and carbon dioxide mainly in peripheral tissue, which iseasily excreted. A minority of alcohol is metabolised by the mitochondrial enzyme oxida-tion system (MEOS), through the action of the cytochrome P450 (CYP) enzyme CYP2E1, toacetaldehyde with the generation of ROS. A third minor pathway of alcohol metabolism toacetaldehyde is by the action of catalase and the conversion of H2O2 to H2O.
It is the generation of acetaldehyde, a highly reactive protein, which contributes toliver damage. It binds to lipids, proteins and DNA to form potentially immunogenicadducts [32]. These adducts can generate an adaptive immune response leading to hepa-tocellular damage and inflammation [33]. Structural mitochondrial alteration can lead tofunctional impairment including decreased ATP generation, the production of ROS and
136
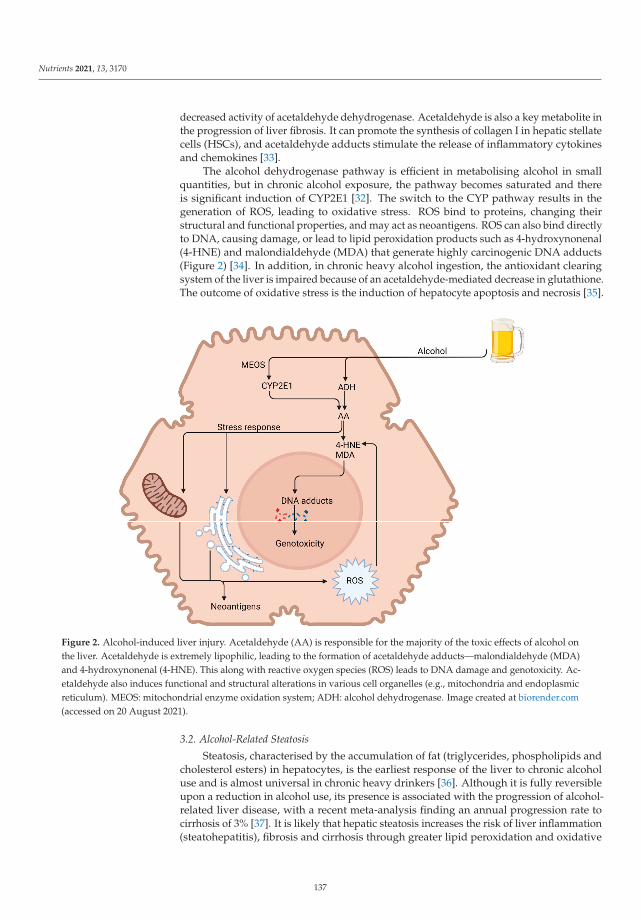
Nutrients 2021, 13, 3170
decreased activity of acetaldehyde dehydrogenase. Acetaldehyde is also a key metabolite inthe progression of liver fibrosis. It can promote the synthesis of collagen I in hepatic stellatecells (HSCs), and acetaldehyde adducts stimulate the release of inflammatory cytokinesand chemokines [33].
The alcohol dehydrogenase pathway is efficient in metabolising alcohol in smallquantities, but in chronic alcohol exposure, the pathway becomes saturated and thereis significant induction of CYP2E1 [32]. The switch to the CYP pathway results in thegeneration of ROS, leading to oxidative stress. ROS bind to proteins, changing theirstructural and functional properties, and may act as neoantigens. ROS can also bind directlyto DNA, causing damage, or lead to lipid peroxidation products such as 4-hydroxynonenal(4-HNE) and malondialdehyde (MDA) that generate highly carcinogenic DNA adducts(Figure 2) [34]. In addition, in chronic heavy alcohol ingestion, the antioxidant clearingsystem of the liver is impaired because of an acetaldehyde-mediated decrease in glutathione.The outcome of oxidative stress is the induction of hepatocyte apoptosis and necrosis [35].
Figure 2. Alcohol-induced liver injury. Acetaldehyde (AA) is responsible for the majority of the toxic effects of alcohol onthe liver. Acetaldehyde is extremely lipophilic, leading to the formation of acetaldehyde adducts—malondialdehyde (MDA)and 4-hydroxynonenal (4-HNE). This along with reactive oxygen species (ROS) leads to DNA damage and genotoxicity. Ac-etaldehyde also induces functional and structural alterations in various cell organelles (e.g., mitochondria and endoplasmicreticulum). MEOS: mitochondrial enzyme oxidation system; ADH: alcohol dehydrogenase. Image created at biorender.com(accessed on 20 August 2021).
3.2. Alcohol-Related Steatosis
Steatosis, characterised by the accumulation of fat (triglycerides, phospholipids andcholesterol esters) in hepatocytes, is the earliest response of the liver to chronic alcoholuse and is almost universal in chronic heavy drinkers [36]. Although it is fully reversibleupon a reduction in alcohol use, its presence is associated with the progression of alcohol-related liver disease, with a recent meta-analysis finding an annual progression rate tocirrhosis of 3% [37]. It is likely that hepatic steatosis increases the risk of liver inflammation(steatohepatitis), fibrosis and cirrhosis through greater lipid peroxidation and oxidative
137
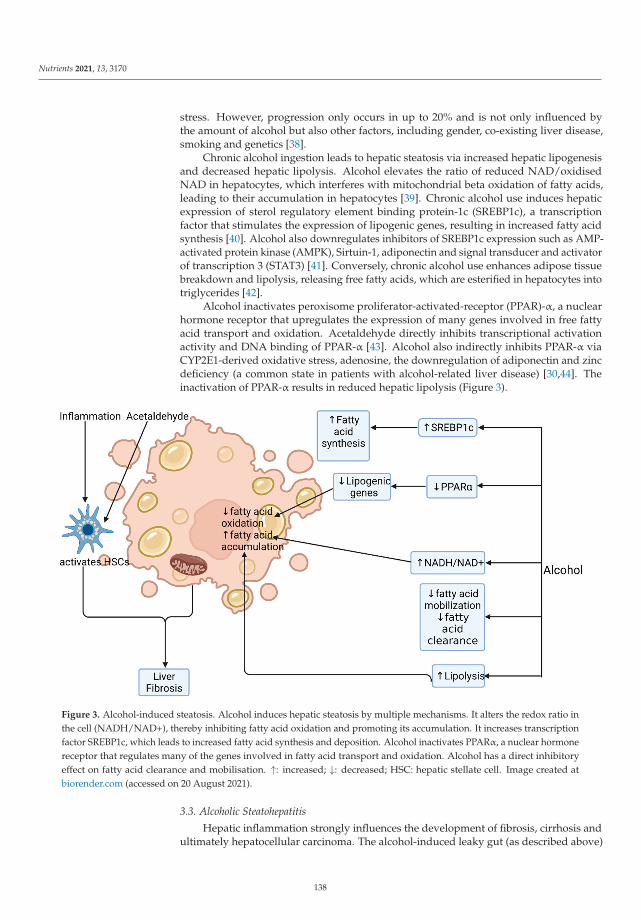
Nutrients 2021, 13, 3170
stress. However, progression only occurs in up to 20% and is not only influenced bythe amount of alcohol but also other factors, including gender, co-existing liver disease,smoking and genetics [38].
Chronic alcohol ingestion leads to hepatic steatosis via increased hepatic lipogenesisand decreased hepatic lipolysis. Alcohol elevates the ratio of reduced NAD/oxidisedNAD in hepatocytes, which interferes with mitochondrial beta oxidation of fatty acids,leading to their accumulation in hepatocytes [39]. Chronic alcohol use induces hepaticexpression of sterol regulatory element binding protein-1c (SREBP1c), a transcriptionfactor that stimulates the expression of lipogenic genes, resulting in increased fatty acidsynthesis [40]. Alcohol also downregulates inhibitors of SREBP1c expression such as AMP-activated protein kinase (AMPK), Sirtuin-1, adiponectin and signal transducer and activatorof transcription 3 (STAT3) [41]. Conversely, chronic alcohol use enhances adipose tissuebreakdown and lipolysis, releasing free fatty acids, which are esterified in hepatocytes intotriglycerides [42].
Alcohol inactivates peroxisome proliferator-activated-receptor (PPAR)-α, a nuclearhormone receptor that upregulates the expression of many genes involved in free fattyacid transport and oxidation. Acetaldehyde directly inhibits transcriptional activationactivity and DNA binding of PPAR-α [43]. Alcohol also indirectly inhibits PPAR-α viaCYP2E1-derived oxidative stress, adenosine, the downregulation of adiponectin and zincdeficiency (a common state in patients with alcohol-related liver disease) [30,44]. Theinactivation of PPAR-α results in reduced hepatic lipolysis (Figure 3).
Figure 3. Alcohol-induced steatosis. Alcohol induces hepatic steatosis by multiple mechanisms. It alters the redox ratio inthe cell (NADH/NAD+), thereby inhibiting fatty acid oxidation and promoting its accumulation. It increases transcriptionfactor SREBP1c, which leads to increased fatty acid synthesis and deposition. Alcohol inactivates PPARα, a nuclear hormonereceptor that regulates many of the genes involved in fatty acid transport and oxidation. Alcohol has a direct inhibitoryeffect on fatty acid clearance and mobilisation. ↑: increased; ↓: decreased; HSC: hepatic stellate cell. Image created atbiorender.com (accessed on 20 August 2021).
3.3. Alcoholic Steatohepatitis
Hepatic inflammation strongly influences the development of fibrosis, cirrhosis andultimately hepatocellular carcinoma. The alcohol-induced leaky gut (as described above)
138
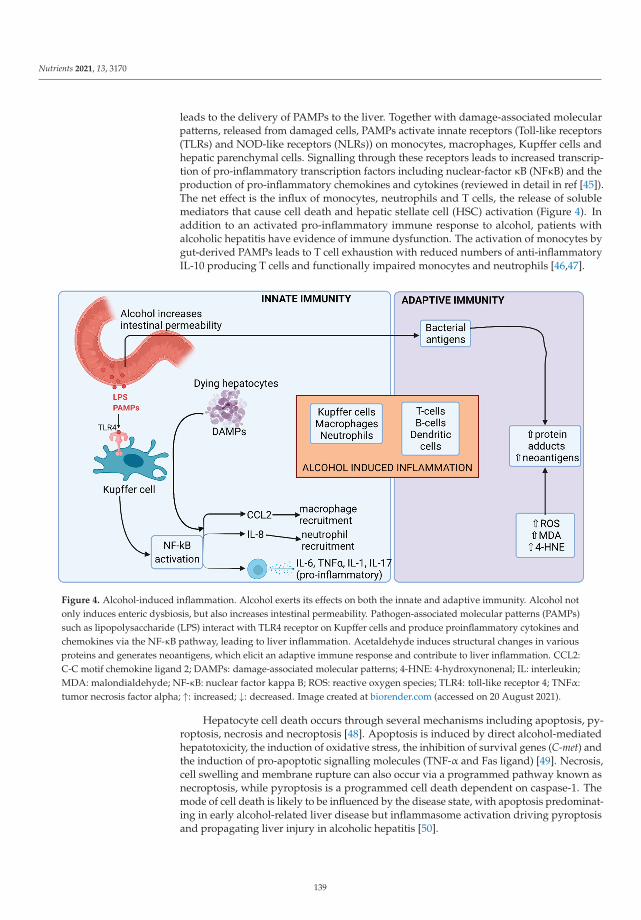
Nutrients 2021, 13, 3170
leads to the delivery of PAMPs to the liver. Together with damage-associated molecularpatterns, released from damaged cells, PAMPs activate innate receptors (Toll-like receptors(TLRs) and NOD-like receptors (NLRs)) on monocytes, macrophages, Kupffer cells andhepatic parenchymal cells. Signalling through these receptors leads to increased transcrip-tion of pro-inflammatory transcription factors including nuclear-factor κB (NFκB) and theproduction of pro-inflammatory chemokines and cytokines (reviewed in detail in ref [45]).The net effect is the influx of monocytes, neutrophils and T cells, the release of solublemediators that cause cell death and hepatic stellate cell (HSC) activation (Figure 4). Inaddition to an activated pro-inflammatory immune response to alcohol, patients withalcoholic hepatitis have evidence of immune dysfunction. The activation of monocytes bygut-derived PAMPs leads to T cell exhaustion with reduced numbers of anti-inflammatoryIL-10 producing T cells and functionally impaired monocytes and neutrophils [46,47].
Figure 4. Alcohol-induced inflammation. Alcohol exerts its effects on both the innate and adaptive immunity. Alcohol notonly induces enteric dysbiosis, but also increases intestinal permeability. Pathogen-associated molecular patterns (PAMPs)such as lipopolysaccharide (LPS) interact with TLR4 receptor on Kupffer cells and produce proinflammatory cytokines andchemokines via the NF-κB pathway, leading to liver inflammation. Acetaldehyde induces structural changes in variousproteins and generates neoantigens, which elicit an adaptive immune response and contribute to liver inflammation. CCL2:C-C motif chemokine ligand 2; DAMPs: damage-associated molecular patterns; 4-HNE: 4-hydroxynonenal; IL: interleukin;MDA: malondialdehyde; NF-κB: nuclear factor kappa B; ROS: reactive oxygen species; TLR4: toll-like receptor 4; TNFα:tumor necrosis factor alpha; ↑: increased; ↓: decreased. Image created at biorender.com (accessed on 20 August 2021).
Hepatocyte cell death occurs through several mechanisms including apoptosis, py-roptosis, necrosis and necroptosis [48]. Apoptosis is induced by direct alcohol-mediatedhepatotoxicity, the induction of oxidative stress, the inhibition of survival genes (C-met) andthe induction of pro-apoptotic signalling molecules (TNF-α and Fas ligand) [49]. Necrosis,cell swelling and membrane rupture can also occur via a programmed pathway known asnecroptosis, while pyroptosis is a programmed cell death dependent on caspase-1. Themode of cell death is likely to be influenced by the disease state, with apoptosis predominat-ing in early alcohol-related liver disease but inflammasome activation driving pyroptosisand propagating liver injury in alcoholic hepatitis [50].
139
Nutrients 2021, 13, 3170
MicroRNAs (miRNAs) are small non-coding RNAs that have a role in the post-transcriptional regulation of their target genes. Two key miRNAs are differentially ex-pressed in patients with alcohol-related liver disease. miRNA-155, a key regulator ofinflammation, is increased in the liver and circulation in mouse models of alcohol-relatedliver disease [51]. Chronic alcohol consumption increases the expression of miRNA-155 inKupffer cells, which contributes to increased LPS-triggered TNF production [52]. miR-181b-3p, a negative regulator of TLR4 signalling in Kupffer cells, is downregulated in patientswith alcohol-related liver disease [53].
3.4. Alcohol-Induced Fibrosis and Cirrhosis
Fibrosis is the liver’s wound healing response to a damaging stimulus, reversibleon removal of the stimulus. In the presence of heavy long-term alcohol consumption,there is chronic inflammation and fibrogenesis causing the deposition of broad bands offibrous tissue, distorting the liver architecture and altering hepatic blood flow, leading toportal hypertension and its associated complications. Extracellular matrix deposition byactivated HSCs is the key event in the development and progression of liver fibrosis. Othercells (portal fibroblasts and myofibroblasts) contribute to a smaller extent [54]. HSCs areactivated both by inflammatory cytokines and directly by alcohol and its metabolites andROS. Activated HSCs perpetuate the inflammatory response by the secretion of chemokinesand the expression of adhesion molecules that attract and stimulate circulating immunecells, which in turn activate quiescent HSCs [55].
3.5. Hepatocellular Carcinoma
Cirrhosis is a precancerous state increasing the risk of primary liver cancer, the com-monest being hepatocellular carcinoma (HCC). Globally, around 30% of HCCs are due toalcohol. Alcohol itself is a carcinogen and in the context of HCC plays specific roles in itsdevelopment through ROS-induced damage, inflammatory mechanisms and its reactivemetabolite, acetaldehyde.
In heavy alcohol drinkers, increased activity of the CYP pathway generates ROS,leading to DNA damage that causes cell cycle arrest and apoptosis and disrupts genefunction, increasing carcinogenesis and propagation [56]. The activation of inflammatorypathways in patients with alcohol-related liver disease is associated with increased cancerrisk, although mechanisms have not been fully elucidated but are likely to involve pro-inflammatory cytokine promotion of ROS accumulation [57,58]. Cytokine generation isalso associated with the upregulation of the angiogenesis and metastasis development [59].Additionally, alcohol suppresses the anti-tumour response of CD8+ T cells [60].
Acetaldehyde is highly reactive and forms adducts with DNA and proteins that causemitochondrial damage and disruption of DNA repair mechanisms. Increased levels ofacetaldehyde found in people with genetic variations that confer altered activity of alcoholdehydrogenase and aldehyde dehydrogenase are associated with a higher risk of HCC inheavy drinkers [61].
4. Research Priorities and Future Perspectives
The human body is able to metabolise and eliminate small volumes of alcohol withoutlong-term sequelae. However, excessive alcohol use leads to alterations in the gut micro-biome, metabolome, epithelial integrity and immune signalling culminating in progressiveliver disease. Our recent improved understanding of these changes has identified potentialnew therapies to delay or reverse liver disease. Here, we suggest areas in need of furtherresearch and potential strategies for therapy.
4.1. Microbiome
Alcohol’s effect on the microbiome is highly heterogeneous with multiple genera up-or downregulated, making a single probiotic treatment challenging to identify. Probioticsmarginally improve liver function tests in patients with liver disease [62], but few trials
140
Nutrients 2021, 13, 3170
in patients with alcohol-related liver disease have been conducted and they have failedto demonstrate any clinical benefit in patients with cirrhosis [63]. However, combinationtherapy to restore gut dysbiosis may be a more successful strategy.
Faecal microbiota transplant has recently been piloted as a treatment for patients withalcohol use disorder [64]. Healthy donor stool transplant by nasogastric injection wasassociated with a partial improvement in bacterial diversity and reversal in dysbiosis, animprovement in gut SCFA production and reduced severity of alcohol use disorder [64].Although not designed to treat or prevent cirrhosis, this therapy may prove beneficial inthis patient population.
4.2. Short-Chain Fatty Acids
SCFAs are a product of the bacterial digestion of dietary fibre and are essential tomaintain gut epithelial integrity. Strategies to increase intestinal SCFA may reduce gutpermeability and exposure of the liver to gut-derived toxins, thus preventing the pro-gression of liver disease. Studies of SCFA treatment have yet to be conducted in patientswith alcohol-related liver disease. Delivery of the SCFA butyrate by enema reduced gutoxidative stress and inflammation in patients with inflammatory bowel disease [65]. In-direct methods to increase SCFAs such as by faecal microbiota transplant or augmentingSCFA-producing bacteria with specific probiotics (e.g., Clostridium butyricum) may also bebeneficial. In a randomised trial, C. butyricum in combination with Bifidobacterium infantisreduced symptoms of minimal hepatic encephalopathy in patients with hepatitis B cirrho-sis as well as measures of gut permeability [66]. However, supplementation with otherprobiotics (Bifidobacterium, Lactobacillus and Lactococcus genera) did not improve gut barrierfunction [67], suggesting the importance of targeting SCFA-producing species.
Interestingly, aerobic fitness also influences the microbiome and response to dietaryfat or alcohol. An animal study demonstrated that high-aerobically fit rats fed a highfat diet were protected from steatosis [68]. Conversely, low-aerobically fit rats had re-duced SCFA-producing bacteria and altered microbiome metabolism of carbohydratesand energy, leading to hepatic steatosis [69]. A combined study enhancing both aerobicfitness and SCFA-producing bacteria in patients with alcohol-related liver disease mayyield beneficial results.
4.3. Dietary Manipulation
In a cohort study comparing the gut microbiome in patients with cirrhosis from theUSA and Turkey, several dietary factors were associated with a reduced risk of progressionmediated by increased microbial diversity [70]. Fermented milk, vegetables, cereals, coffeeand tea were associated with greater diversity, while carbonated drinks, pork and poultrywere associated with lower diversity. Increased intake of insoluble fibre may also increasethe bacterial production of SCFAs. Trials have been conducted in patients with hepaticencephalopathy demonstrating the safety of a high protein and high fibre diet [71,72],but none has yet been conducted evaluating the effects of long-term clinical outcomes.Further carefully designed trials of dietary manipulation are required in patients withalcohol-related liver disease.
4.4. Micronutrient Supplementation
Patients with alcohol-related liver disease are deficient in micronutrients includingzinc and selenium [30]. Both these trace elements are essential for cellular and immunefunction [73,74] and their deficiency is associated with more advanced disease [75] andmortality from alcoholic hepatitis [30]. Supplementation may improve clinical outcomesthrough the modulation of immune function, but existing studies are too small and hetero-geneous to demonstrate improved survival [76]. An ongoing trial of zinc supplementationin patients with alcohol-related cirrhosis (NCT02072746) demonstrated an improvement inliver inflammation in an interim analysis [77].
141
Nutrients 2021, 13, 3170
Vitamin deficiencies, especially of vitamin C and D, in patients with alcohol-relatedliver disease are common. Vitamin supplementation may modulate the gut microbiomeresulting in reduced dysbiosis, which may reduce gut permeability and liver inflammation;studies in healthy individuals have demonstrated beneficial shifts in microbial generawith vitamin C [78] and D [79]. Although studies of antioxidant and vitamin supple-mentation in patients with severe alcoholic hepatitis did not demonstrate a short-termsurvival benefit [80], trials of long-term vitamin supplementation in patients with less acutepresentations of alcohol-related liver disease are lacking.
4.5. Immune Dysregulation
Patients with alcohol-related liver disease have simultaneous immune activation andexhaustion [19]. Interventions targeting inflammation broadly with corticosteroids [81] orspecific pro-inflammatory cytokines such as TNF-α [82] have been investigated in severeforms of alcohol-related liver disease with alcoholic hepatitis. However, increased mortalityfrom infective complications was noted, demonstrating the delicate balance of the immuneresponse in these patients [83]. Strategies to target immune exhaustion may promote liverrepair mechanisms at the same time as maintaining defence against pathogens. Checkpointinhibitors such as anti-PD-1 monoclonal antibodies improve the host immune responseand have been licenced for the treatment of cancers. Such treatment may reduce PAMP-induced CD8+ T cell exhaustion [47] and improve the healing response in alcohol-relatedliver disease.
4.6. Repurposing of Existing Therapies
Clinical trials of commonly used drugs such as metformin, pioglitazone and statinshave shown benefit on liver biochemistry or histological changes in patients with non-alcoholic steatohepatitis [84–86]. Benefits are mainly mediated by a reduction in insulinresistance, a mechanism that is not a strong contributor to alcohol-related liver disease.However, these drugs also alter the gut microbiome [87]; metformin, for example, increasesthe abundance of SCFA-producing bacteria [88]. Further trials of these agents are requiredto evaluate their benefit in the setting of alcohol-related liver disease.
5. Conclusions
In conclusion, alcohol has wide-ranging effects on the gut and liver, altering the gutmicrobiome, barrier function and immune function resulting in liver inflammation, fibrosisand cirrhosis. Trials of new interventional strategies to target gut dysbiosis and immunedysfunction are now required.
Author Contributions: Conceptualization, A.D.D.; writing—original draft preparation, K.P. andP.M.; writing—review and editing, A.D.D. All authors have read and agreed to the published versionof the manuscript.
Funding: This research received no external funding.
Institutional Review Board Statement: Not applicable.
Informed Consent Statement: Not applicable.
Conflicts of Interest: The authors declare no conflict of interest.
References
1. Paton, A. Alcohol in the body. BMJ 2005, 330, 85–87. [CrossRef]2. GBD Alcohol Drug Use Collaborators. The global burden of disease attributable to alcohol and drug use in 195 countries and
territories, 1990–2016: A systematic analysis for the Global Burden of Disease Study 2016. Lancet Psychiatry 2018, 5, 987–1012.[CrossRef]
3. World Health Organization. Alcohol Factsheet. Available online: https://www.who.int/en/news-room/fact-sheets/detail/alcohol (accessed on 20 August 2021).
4. GBD Causes of Death Collaborators. Global, regional, and national age-sex specific mortality for 264 causes of death, 1980–2016:A systematic analysis for the global burden of disease study 2016. Lancet 2017, 390, 1151–1210. [CrossRef]
142
Nutrients 2021, 13, 3170
5. Global Burden of Disease Liver Cancer Collaboration; Akinyemiju, T.; Abera, S.; Ahmed, M.; Alam, N.; Alemayohu, M.A.; Allen,C.; Al-Raddadi, R.; Alvis-Guzman, N.; Amoako, Y.; et al. The burden of primary liver cancer and underlying etiologies from 1990to 2015 at the global, regional, and national level: Results from the global burden of disease study 2015. JAMA Oncol. 2017, 3,1683–1691. [CrossRef]
6. Albillos, A.; de Gottardi, A.; Rescigno, M. The gut-liver axis in liver disease: Pathophysiological basis for therapy. J. Hepatol. 2020,72, 558–577. [CrossRef] [PubMed]
7. Kamran, U.; Towey, J.; Khanna, A.; Chauhan, A.; Rajoriya, N.; Holt, A. Nutrition in alcohol-related liver disease: Physiopathologyand management. World J. Gastroenterol. WJG 2020, 26, 2916–2930. [CrossRef] [PubMed]
8. Lieber, C.S. Relationships between nutrition, alcohol use, and liver disease. Alcohol Res. Health 2003, 27, 220–231. [PubMed]9. Human Microbiome Project Consortium. Structure, function and diversity of the healthy human microbiome. Nature 2012, 486,
207–214. [CrossRef] [PubMed]10. Rothschild, D.; Weissbrod, O.; Barkan, E.; Kurilshikov, A.; Korem, T.; Zeevi, D.; Costea, P.I.; Godneva, A.; Kalka, I.N.; Bar, N.; et al.
Environment dominates over host genetics in shaping human gut microbiota. Nature 2018, 555, 210–215. [CrossRef]11. David, L.A.; Maurice, C.F.; Carmody, R.N.; Gootenberg, D.B.; Button, J.E.; Wolfe, B.E.; Ling, A.V.; Devlin, A.S.; Varma, Y.;
Fischbach, M.A.; et al. Diet rapidly and reproducibly alters the human gut microbiome. Nature 2014, 505, 559–563. [CrossRef][PubMed]
12. Bajaj, J.S. Alcohol, liver disease and the gut microbiota. Nat. Rev. Gastroenterol. Hepatol. 2019, 16, 235–246. [CrossRef] [PubMed]13. Engen, P.A.; Green, S.J.; Voigt, R.M.; Forsyth, C.B.; Keshavarzian, A. The gastrointestinal microbiome: Alcohol effects on the
composition of intestinal microbiota. Alcohol Res. 2015, 37, 223–236. [PubMed]14. Zhong, W.; Zhou, Z. Alterations of the gut microbiome and metabolome in alcoholic liver disease. World J. Gastrointest. Pathophysiol.
2014, 5, 514–522. [CrossRef] [PubMed]15. Litwinowicz, K.; Choroszy, M.; Waszczuk, E. Changes in the composition of the human intestinal microbiome in alcohol use
disorder: A systematic review. Am. J. Drug Alcohol Abus. 2020, 46, 4–12. [CrossRef]16. Keshavarzian, A.; Farhadi, A.; Forsyth, C.B.; Rangan, J.; Jakate, S.; Shaikh, M.; Banan, A.; Fields, J.Z. Evidence that chronic alcohol
exposure promotes intestinal oxidative stress, intestinal hyperpermeability and endotoxemia prior to development of alcoholicsteatohepatitis in rats. J. Hepatol. 2009, 50, 538–547. [CrossRef]
17. Shukla, P.K.; Meena, A.S.; Rao, V.; Rao, R.G.; Balazs, L.; Rao, R. Human defensin-5 blocks ethanol and colitis-induced dysbiosis,tight junction disruption and inflammation in mouse intestine. Sci. Rep. 2018, 8, 16241. [CrossRef]
18. Starkel, P.; Leclercq, S.; de Timary, P.; Schnabl, B. Intestinal dysbiosis and permeability: The yin and yang in alcohol dependenceand alcoholic liver disease. Clin. Sci. 2018, 132, 199–212. [CrossRef]
19. Dhanda, A.D.; Collins, P.L. Immune dysfunction in acute alcoholic hepatitis. World J. Gastroenterol. WJG 2015, 21, 11904–11913.[CrossRef]
20. Silva, Y.P.; Bernardi, A.; Frozza, R.L. The role of short-chain fatty acids from gut microbiota in gut-brain communication. Front.Endocrinol. 2020, 11, 25. [CrossRef]
21. Couch, R.D.; Dailey, A.; Zaidi, F.; Navarro, K.; Forsyth, C.B.; Mutlu, E.; Engen, P.A.; Keshavarzian, A. Alcohol induced alterationsto the human fecal VOC metabolome. PLoS ONE 2015, 10, e0119362. [CrossRef]
22. Cresci, G.A.; Bush, K.; Nagy, L.E. Tributyrin supplementation protects mice from acute ethanol-induced gut injury. Alcohol. Clin.Exp. Res. 2014, 38, 1489–1501. [CrossRef]
23. Cresci, G.A.; Glueck, B.; McMullen, M.R.; Xin, W.; Allende, D.; Nagy, L.E. Prophylactic tributyrin treatment mitigates chronic-binge ethanol-induced intestinal barrier and liver injury. J. Gastroenterol. Hepatol. 2017, 32, 1587–1597. [CrossRef]
24. Jiang, X.W.; Li, Y.T.; Ye, J.Z.; Lv, L.X.; Yang, L.Y.; Bian, X.Y.; Wu, W.R.; Wu, J.J.; Shi, D.; Wang, Q.; et al. New strain of Pediococcuspentosaceus alleviates ethanol-induced liver injury by modulating the gut microbiota and short-chain fatty acid metabolism.World J. Gastroenterol. WJG 2020, 26, 6224–6240. [CrossRef] [PubMed]
25. Wei, X.; Jiang, S.; Zhao, X.; Li, H.; Lin, W.; Li, B.; Lu, J.; Sun, Y.; Yuan, J. Community-metabolome correlations of gut microbiotafrom child-turcotte-pugh of A and B patients. Front. Microbiol. 2016, 7, 1856. [CrossRef]
26. Voutilainen, T.; Karkkainen, O. Changes in the human metabolome associated with alcohol use: A review. Alcohol Alcohol. 2019,54, 225–234. [CrossRef] [PubMed]
27. Kakiyama, G.; Hylemon, P.B.; Zhou, H.; Pandak, W.M.; Heuman, D.M.; Kang, D.J.; Takei, H.; Nittono, H.; Ridlon, J.M.; Fuchs, M.;et al. Colonic inflammation and secondary bile acids in alcoholic cirrhosis. Am. J. Physiol. Gastrointest. Liver Physiol. 2014, 306,G929–G937. [CrossRef]
28. Lieber, C.S. ALCOHOL: Its metabolism and interaction with nutrients. Annu. Rev. Nutr. 2000, 20, 395–430. [CrossRef]29. Bishehsari, F.; Magno, E.; Swanson, G.; Desai, V.; Voigt, R.M.; Forsyth, C.B.; Keshavarzian, A. Alcohol and gut-derived
inflammation. Alcohol Res. 2017, 38, 163–171. [PubMed]30. Dhanda, A.; Atkinson, S.; Vergis, N.; Enki, D.; Fisher, A.; Clough, R.; Cramp, M.; Thursz, M. Trace element deficiency is highly
prevalent and associated with infection and mortality in patients with alcoholic hepatitis. Aliment. Pharmacol. Ther. 2020, 52,537–544. [CrossRef] [PubMed]
31. Katikireddi, S.V.; Whitley, E.; Lewsey, J.; Gray, L.; Leyland, A.H. Socioeconomic status as an effect modifier of alcohol consumptionand harm: Analysis of linked cohort data. Lancet Public Health 2017, 2, e267. [CrossRef]
32. Cederbaum, A.I.; Lu, Y.; Wu, D. Role of oxidative stress in alcohol-induced liver injury. Arch. Toxicol. 2009, 83, 519–548. [CrossRef]
143

Nutrients 2021, 13, 3170
33. Mello, T.; Ceni, E.; Surrenti, C.; Galli, A. Alcohol induced hepatic fibrosis: Role of acetaldehyde. Mol. Asp. Med. 2008, 29, 17–21.[CrossRef] [PubMed]
34. Wang, Y.; Millonig, G.; Nair, J.; Patsenker, E.; Stickel, F.; Mueller, S.; Bartsch, H.; Seitz, H.K. Ethanol-induced cytochrome P4502E1causes carcinogenic etheno-DNA lesions in alcoholic liver disease. Hepatology 2009, 50, 453–461. [CrossRef] [PubMed]
35. Tan, H.K.; Yates, E.; Lilly, K.; Dhanda, A.D. Oxidative stress in alcohol-related liver disease. World J. Hepatol. 2020, 12, 332–349.[CrossRef] [PubMed]
36. Lieber, C.S. Alcoholic fatty liver: Its pathogenesis and mechanism of progression to inflammation and fibrosis. Alcohol 2004, 34,9–19. [CrossRef] [PubMed]
37. Parker, R.; Aithal, G.P.; Becker, U.; Gleeson, D.; Masson, S.; Wyatt, J.I.; Rowe, I.A.; WALDO Study Group. Natural history ofhistologically proven alcohol-related liver disease: A systematic review. J. Hepatol. 2019, 71, 586–593. [CrossRef] [PubMed]
38. Seitz, H.K.; Bataller, R.; Cortez-Pinto, H.; Gao, B.; Gual, A.; Lackner, C.; Mathurin, P.; Mueller, S.; Szabo, G.; Tsukamoto, H.Alcoholic liver disease. Nat. Rev. Dis. Primers 2018, 4, 16. [CrossRef]
39. Baraona, E.; Lieber, C.S. Effects of ethanol on lipid metabolism. J. Lipid Res. 1979, 20, 289–315. [CrossRef]40. You, M.; Fischer, M.; Deeg, M.A.; Crabb, D.W. Ethanol induces fatty acid synthesis pathways by activation of sterol regulatory
element-binding protein (SREBP). J. Biol. Chem. 2002, 277, 29342–29347. [CrossRef]41. Purohit, V.; Gao, B.; Song, B.J. Molecular mechanisms of alcoholic fatty liver. Alcohol. Clin. Exp. Res. 2009, 33, 191–205. [CrossRef]42. Wei, X.; Shi, X.; Zhong, W.; Zhao, Y.; Tang, Y.; Sun, W.; Yin, X.; Bogdanov, B.; Kim, S.; McClain, C.; et al. Chronic alcohol
exposure disturbs lipid homeostasis at the adipose tissue-liver axis in mice: Analysis of triacylglycerols using high-resolutionmass spectrometry in combination with in vivo metabolite deuterium labeling. PLoS ONE 2013, 8, e55382. [CrossRef] [PubMed]
43. Li, H.H.; Tyburski, J.B.; Wang, Y.W.; Strawn, S.; Moon, B.H.; Kallakury, B.V.; Gonzalez, F.J.; Fornace, A.J., Jr. Modulation of fattyacid and bile acid metabolism by peroxisome proliferator-activated receptor alpha protects against alcoholic liver disease. Alcohol.Clin. Exp. Res. 2014, 38, 1520–1531. [CrossRef] [PubMed]
44. Galli, A.; Pinaire, J.; Fischer, M.; Dorris, R.; Crabb, D.W. The transcriptional and DNA binding activity of peroxisome proliferator-activated receptor alpha is inhibited by ethanol metabolism. A novel mechanism for the development of ethanol-induced fattyliver. J. Biol. Chem. 2001, 276, 68–75. [CrossRef] [PubMed]
45. Gao, B.; Ahmad, M.F.; Nagy, L.E.; Tsukamoto, H. Inflammatory pathways in alcoholic steatohepatitis. J. Hepatol. 2019, 70, 249–259.[CrossRef] [PubMed]
46. Dhanda, A.D.; Williams, E.L.; Yates, E.; Lait, P.J.P.; Schewitz-Bowers, L.P.; Hegazy, D.; Cramp, M.E.; Collins, P.L.; Lee, R.W.J.Intermediate monocytes in acute alcoholic hepatitis are functionally activated and induce IL-17 expression in CD4(+) T cells. J.Immunol. 2019, 203, 3190–3198. [CrossRef] [PubMed]
47. Markwick, L.J.; Riva, A.; Ryan, J.M.; Cooksley, H.; Palma, E.; Tranah, T.H.; Manakkat Vijay, G.K.; Vergis, N.; Thursz, M.; Evans, A.;et al. Blockade of PD1 and TIM3 restores innate and adaptive immunity in patients with acute alcoholic hepatitis. Gastroenterology2015, 148, 590–602. [CrossRef]
48. Wang, S.; Pacher, P.; De Lisle, R.C.; Huang, H.; Ding, W.X. A mechanistic review of cell death in alcohol-induced liver injury.Alcohol. Clin. Exp. Res. 2016, 40, 1215–1223. [CrossRef]
49. Feldstein, A.E.; Gores, G.J. Apoptosis in alcoholic and nonalcoholic steatohepatitis. Front. Biosci. A J. Virtual Libr. 2005, 10,3093–3099. [CrossRef]
50. Gaul, S.; Leszczynska, A.; Alegre, F.; Kaufmann, B.; Johnson, C.D.; Adams, L.A.; Wree, A.; Damm, G.; Seehofer, D.; Calvente, C.J.;et al. Hepatocyte pyroptosis and release of inflammasome particles induce stellate cell activation and liver fibrosis. J. Hepatol.2021, 74, 156–167. [CrossRef]
51. Bala, S.; Csak, T.; Saha, B.; Zatsiorsky, J.; Kodys, K.; Catalano, D.; Satishchandran, A.; Szabo, G. The pro-inflammatory effects ofmiR-155 promote liver fibrosis and alcohol-induced steatohepatitis. J. Hepatol. 2016, 64, 1378–1387. [CrossRef]
52. Bala, S.; Csak, T.; Kodys, K.; Catalano, D.; Ambade, A.; Furi, I.; Lowe, P.; Cho, Y.; Iracheta-Vellve, A.; Szabo, G. Alcohol-inducedmiR-155 and HDAC11 inhibit negative regulators of the TLR4 pathway and lead to increased LPS responsiveness of Kupffer cellsin alcoholic liver disease. J. Leukoc. Biol. 2017, 102, 487–498. [CrossRef]
53. Saikia, P.; Bellos, D.; McMullen, M.R.; Pollard, K.A.; de la Motte, C.; Nagy, L.E. MicroRNA 181b-3p and its target importin alpha5regulate toll-like receptor 4 signaling in Kupffer cells and liver injury in mice in response to ethanol. Hepatology 2017, 66, 602–615.[CrossRef] [PubMed]
54. Tsuchida, T.; Friedman, S.L. Mechanisms of hepatic stellate cell activation. Nat. Rev. Gastroenterol. Hepatol. 2017, 14, 397–411.[CrossRef] [PubMed]
55. Friedman, S.L. Hepatic stellate cells: Protean, multifunctional, and enigmatic cells of the liver. Physiol. Rev. 2008, 88, 125–172.[CrossRef] [PubMed]
56. Goldar, S.; Khaniani, M.S.; Derakhshan, S.M.; Baradaran, B. Molecular mechanisms of apoptosis and roles in cancer developmentand treatment. Asian Pac. J. Cancer Prev. 2015, 16, 2129–2144. [CrossRef] [PubMed]
57. Park, E.J.; Lee, J.H.; Yu, G.Y.; He, G.; Ali, S.R.; Holzer, R.G.; Osterreicher, C.H.; Takahashi, H.; Karin, M. Dietary and geneticobesity promote liver inflammation and tumorigenesis by enhancing IL-6 and TNF expression. Cell 2010, 140, 197–208. [CrossRef]
58. Chiba, T.; Marusawa, H.; Ushijima, T. Inflammation-associated cancer development in digestive organs: Mechanisms and rolesfor genetic and epigenetic modulation. Gastroenterology 2012, 143, 550–563. [CrossRef] [PubMed]
144
Nutrients 2021, 13, 3170
59. Hagymasi, K.; Blazovics, A.; Lengyel, G.; Kocsis, I.; Feher, J. Oxidative damage in alcoholic liver disease. Eur. J. Gastroenterol.Hepatol. 2001, 13, 49–53. [CrossRef] [PubMed]
60. Yan, G.; Wang, X.; Sun, C.; Zheng, X.; Wei, H.; Tian, Z.; Sun, R. Chronic alcohol consumption promotes diethylnitrosamine-inducedhepatocarcinogenesis via immune disturbances. Sci. Rep. 2017, 7, 2567. [CrossRef]
61. Sakamoto, T.; Hara, M.; Higaki, Y.; Ichiba, M.; Horita, M.; Mizuta, T.; Eguchi, Y.; Yasutake, T.; Ozaki, I.; Yamamoto, K.; et al.Influence of alcohol consumption and gene polymorphisms of ADH2 and ALDH2 on hepatocellular carcinoma in a Japanesepopulation. Int. J. Cancer 2006, 118, 1501–1507. [CrossRef]
62. Khalesi, S.; Johnson, D.W.; Campbell, K.; Williams, S.; Fenning, A.; Saluja, S.; Irwin, C. Effect of probiotics and synbioticsconsumption on serum concentrations of liver function test enzymes: A systematic review and meta-analysis. Eur. J. Nutr. 2018,57, 2037–2053. [CrossRef]
63. Li, F.; Duan, K.; Wang, C.; McClain, C.; Feng, W. Probiotics and alcoholic liver disease: Treatment and potential mechanisms.Gastroenterol. Res. Pract. 2016, 2016, 5491465. [CrossRef] [PubMed]
64. Bajaj, J.S.; Gavis, E.A.; Fagan, A.; Wade, J.B.; Thacker, L.R.; Fuchs, M.; Patel, S.; Davis, B.; Meador, J.; Puri, P.; et al. A randomizedclinical trial of fecal microbiota transplant for alcohol use disorder. Hepatology 2021, 73, 1688–1700. [CrossRef] [PubMed]
65. Hamer, H.M.; Jonkers, D.M.; Vanhoutvin, S.A.; Troost, F.J.; Rijkers, G.; de Bruine, A.; Bast, A.; Venema, K.; Brummer, R.J. Effect ofbutyrate enemas on inflammation and antioxidant status in the colonic mucosa of patients with ulcerative colitis in remission.Clin. Nutr. 2010, 29, 738–744. [CrossRef] [PubMed]
66. Xia, X.; Chen, J.; Xia, J.; Wang, B.; Liu, H.; Yang, L.; Wang, Y.; Ling, Z. Role of probiotics in the treatment of minimal hepaticencephalopathy in patients with HBV-induced liver cirrhosis. J. Int. Med. Res. 2018, 46, 3596–3604. [CrossRef] [PubMed]
67. Horvath, A.; Leber, B.; Schmerboeck, B.; Tawdrous, M.; Zettel, G.; Hartl, A.; Madl, T.; Stryeck, S.; Fuchs, D.; Lemesch, S.; et al.Randomised clinical trial: The effects of a multispecies probiotic vs. placebo on innate immune function, bacterial translocationand gut permeability in patients with cirrhosis. Aliment. Pharmacol. Ther. 2016, 44, 926–935. [CrossRef]
68. Morris, E.M.; Jackman, M.R.; Johnson, G.C.; Liu, T.W.; Lopez, J.L.; Kearney, M.L.; Fletcher, J.A.; Meers, G.M.; Koch, L.G.; Britton,S.L.; et al. Intrinsic aerobic capacity impacts susceptibility to acute high-fat diet-induced hepatic steatosis. American journal ofphysiology. Endocrinol. Metab. 2014, 307, E355–E364. [CrossRef]
69. Panasevich, M.R.; Morris, E.M.; Chintapalli, S.V.; Wankhade, U.D.; Shankar, K.; Britton, S.L.; Koch, L.G.; Thyfault, J.P.; Rector, R.S.Gut microbiota are linked to increased susceptibility to hepatic steatosis in low-aerobic-capacity rats fed an acute high-fat diet.Am. J. Physiol. Gastrointest. Liver Physiol. 2016, 311, G166–G179. [CrossRef] [PubMed]
70. Bajaj, J.S.; Idilman, R.; Mabudian, L.; Hood, M.; Fagan, A.; Turan, D.; White, M.B.; Karakaya, F.; Wang, J.; Atalay, R.; et al. Dietaffects gut microbiota and modulates hospitalization risk differentially in an international cirrhosis cohort. Hepatology 2018, 68,234–247. [CrossRef] [PubMed]
71. Ruiz-Margain, A.; Macias-Rodriguez, R.U.; Rios-Torres, S.L.; Roman-Calleja, B.M.; Mendez-Guerrero, O.; Rodriguez-Cordova, P.;Torre, A. Effect of a high-protein, high-fiber diet plus supplementation with branched-chain amino acids on the nutritional statusof patients with cirrhosis. Rev. Gastroenterol. Mex. 2018, 83, 9–15. [CrossRef]
72. Liu, Q.; Duan, Z.P.; Ha, D.K.; Bengmark, S.; Kurtovic, J.; Riordan, S.M. Synbiotic modulation of gut flora: Effect on minimalhepatic encephalopathy in patients with cirrhosis. Hepatology 2004, 39, 1441–1449. [CrossRef]
73. Burk, R.F.; Hill, K.E.; Motley, A.K.; Byrne, D.W.; Norsworthy, B.K. Selenium deficiency occurs in some patients with moderate-to-severe cirrhosis and can be corrected by administration of selenate but not selenomethionine: A randomized controlled trial. Am.J. Clin. Nutr. 2015, 102, 1126–1133. [CrossRef] [PubMed]
74. Maret, W. Zinc and human disease. Met. Ions Life Sci. 2013, 13, 389–414. [CrossRef]75. Nangliya, V.; Sharma, A.; Yadav, D.; Sunder, S.; Nijhawan, S.; Mishra, S. Study of trace elements in liver cirrhosis patients and
their role in prognosis of disease. Biol. Trace Elem. Res. 2015, 165, 35–40. [CrossRef]76. Tan, H.K.; Streeter, A.; Cramp, M.E.; Dhanda, A.D. Effect of zinc treatment on clinical outcomes in patients with liver cirrhosis: A
systematic review and meta-analysis. World J. Hepatol. 2020, 12, 389–398. [CrossRef] [PubMed]77. Mohammad, M.; Song, M.; Falkner, K.; McClain, C.; Cave, M. Zinc sulfate for alcoholic cirrhosis (ZAC) clinical trial—Interim
analysis of liver injury/inflammation biomarkers. Hepatology 2014, 60, 794A.78. Otten, A.T.; Bourgonje, A.R.; Peters, V.; Alizadeh, B.Z.; Dijkstra, G.; Harmsen, H.J.M. Vitamin C supplementation in healthy
individuals leads to shift of bacterial populations in the gut—A pilot study. Antioxidants 2021, 10, 1278. [CrossRef] [PubMed]79. Singh, P.; Rawat, A.; Alwakeel, M.; Sharif, E.; Al Khodor, S. The potential role of vitamin D supplementation as a gut microbiota
modifier in healthy individuals. Sci. Rep. 2020, 10, 21641. [CrossRef]80. Phillips, M.; Curtis, H.; Portmann, B.; Donaldson, N.; Bomford, A.; O’Grady, J. Antioxidants versus corticosteroids in the
treatment of severe alcoholic hepatitis–a randomised clinical trial. J. Hepatol. 2006, 44, 784–790. [CrossRef]81. Thursz, M.R.; Richardson, P.; Allison, M.; Austin, A.; Bowers, M.; Day, C.P.; Downs, N.; Gleeson, D.; MacGilchrist, A.; Grant, A.;
et al. Prednisolone or pentoxifylline for alcoholic hepatitis. N. Engl. J. Med. 2015, 372, 1619–1628. [CrossRef]82. Naveau, S.; Chollet-Martin, S.; Dharancy, S.; Mathurin, P.; Jouet, P.; Piquet, M.A.; Davion, T.; Oberti, F.; Broet, P.; Emilie, D.; et al.
A double-blind randomized controlled trial of infliximab associated with prednisolone in acute alcoholic hepatitis. Hepatology2004, 39, 1390–1397. [CrossRef] [PubMed]
145
Nutrients 2021, 13, 3170
83. Vergis, N.; Atkinson, S.R.; Knapp, S.; Maurice, J.; Allison, M.; Austin, A.; Forrest, E.H.; Masson, S.; McCune, A.; Patch, D.; et al. Inpatients with severe alcoholic hepatitis, prednisolone increases susceptibility to infection and infection-related mortality, and isassociated with high circulating levels of bacterial DNA. Gastroenterology 2017, 152, 1068–1077.e1064. [CrossRef] [PubMed]
84. Kumar, J.; Memon, R.S.; Shahid, I.; Rizwan, T.; Zaman, M.; Menezes, R.G.; Kumar, S.; Siddiqi, T.J.; Usman, M.S. Antidiabeticdrugs and non-alcoholic fatty liver disease: A systematic review, meta-analysis and evidence map. Dig. Liver Dis. Off. J. Ital. Soc.Gastroenterol. Ital. Assoc. Study Liver 2021, 53, 44–51. [CrossRef]
85. Athyros, V.G.; Alexandrides, T.K.; Bilianou, H.; Cholongitas, E.; Doumas, M.; Ganotakis, E.S.; Goudevenos, J.; Elisaf, M.S.;Germanidis, G.; Giouleme, O.; et al. The use of statins alone, or in combination with pioglitazone and other drugs, for thetreatment of non-alcoholic fatty liver disease/non-alcoholic steatohepatitis and related cardiovascular risk. An Expert PanelStatement. Metab. Clin. Exp. 2017, 71, 17–32. [CrossRef] [PubMed]
86. Jalali, M.; Rahimlou, M.; Mahmoodi, M.; Moosavian, S.P.; Symonds, M.E.; Jalali, R.; Zare, M.; Imanieh, M.H.; Stasi, C. The effectsof metformin administration on liver enzymes and body composition in non-diabetic patients with non-alcoholic fatty liverdisease and/or non-alcoholic steatohepatitis: An up-to date systematic review and meta-analysis of randomized controlled trials.Pharmacol. Res. 2020, 159, 104799. [CrossRef]
87. Weersma, R.K.; Zhernakova, A.; Fu, J. Interaction between drugs and the gut microbiome. Gut 2020, 69, 1510–1519. [CrossRef]88. Forslund, K.; Hildebrand, F.; Nielsen, T.; Falony, G.; Le Chatelier, E.; Sunagawa, S.; Prifti, E.; Vieira-Silva, S.; Gudmundsdottir, V.;
Pedersen, H.K.; et al. Disentangling type 2 diabetes and metformin treatment signatures in the human gut microbiota. Nature2015, 528, 262–266. [CrossRef]
146
nutrients
Review
Alcohol and the Risk of Injury
Tanya Chikritzhs 1,* and Michael Livingston 1,2
Citation: Chikritzhs, T.; Livingston,
M. Alcohol and the Risk of Injury.
Nutrients 2021, 13, 2777. https://
doi.org/10.3390/nu13082777
Academic Editor: Peter Anderson
Received: 12 July 2021
Accepted: 10 August 2021
Published: 13 August 2021
Publisher’s Note: MDPI stays neutral
with regard to jurisdictional claims in
published maps and institutional affil-
iations.
Copyright: © 2021 by the authors.
Licensee MDPI, Basel, Switzerland.
This article is an open access article
distributed under the terms and
conditions of the Creative Commons
Attribution (CC BY) license (https://
creativecommons.org/licenses/by/
4.0/).
1 National Drug Research Institute, Faculty of Health Sciences, Curtin University, Perth, WA 6008, Australia;[email protected]
2 Centre for Alcohol Policy Research, La Trobe University, Bundoora, Melbourne, VIC 3086, Australia* Correspondence: [email protected]
Abstract: Globally, almost four and a half million people died from injury in 2019. Alcohol’scontribution to injury-related premature loss of life, disability and ill-health is pervasive, touchingindividuals, families and societies throughout the world. We conducted a review of research evidencefor alcohol’s causal role in injury by focusing on previously published systematic reviews, meta-analyses and where indicated, key studies. The review summarises evidence for pharmacological andphysiological effects that support postulated causal pathways, highlights findings and knowledgegaps relevant to specific forms of injury (i.e., violence, suicide and self-harm, road injury, falls, burns,workplace injuries) and lays out options for evidence-based prevention.
Keywords: alcohol; injury; review; risk; mortality; morbidity; policy; intervention
1. Introduction
Globally, almost four and a half million people died from injury in 2019 [1], with 7% ofthese deaths directly attributable to alcohol. Alcohol’s role in injury-related premature lossof life, disability and ill-health is pervasive, touching individuals, families and societies theworld over. Alcohol use, particularly intoxication, plays a major role in a wide range ofinjuries, some of which are readily recognisable as alcohol-related (e.g., road injuries, violentassault) and others which are less so (e.g., falls, drownings, injuries in the workplace).
Alcohol-attributable injury accounts for around one-tenth of the total impact of alcoholon health (9.9% and 12.6% in low- and high-income countries, respectively) [1]. Males (90%)and young people aged 15–39 years (40%) dominate alcohol-attributable injury deaths [1].Impacts on health systems are considerable, with alcohol contributing to between 5%and 40% of all emergency department (ED) injury presentations across 27 countries [2].This comes with significant costs. In 2014, injuries caused by alcohol in the USA werean estimated 8% of all injury-related ED presentations at a cost of nearly USD 9 billion,and when in-patient admissions were added, costs almost tripled (USD 26 billion) [3].Canadian estimates of hospitalisation and day surgery costs for alcohol-attributable injuriesin 2017 were just under CAD 1 billion [4]. Large economic impacts are not limited to high-income countries. In Sri Lanka, alcohol-attributable injury costs exceeded an estimatedUSD 380 million, nearly half of the total costs of alcohol in that country in 2015 [5]. InLatin America, where around 30% of road fatalities are attributable to alcohol [6], theburden of road crashes overall was between 1.5% and 3.9% of gross domestic product in2013 compared to about 2% in the USA [7].
Alcohol-related injuries thus represent a significant economic burden in many societiesglobally and require substantial resources from overstretched health systems to manage.Importantly though, alcohol-related injuries are preventable and there are clear examples ofeffective interventions to reduce them. For instance, deaths due to drink-driving declinedrapidly in many high-income countries during the 1980s [8,9], driven by tougher drink-driving laws and enforcement alongside broader alcohol policy shifts such as increasesin the legal minimum drinking age. However, from a global perspective, rates of overall
Nutrients 2021, 13, 2777. https://doi.org/10.3390/nu13082777 https://www.mdpi.com/journal/nutrients147
Nutrients 2021, 13, 2777
alcohol-related injury have remained largely stable over time [1] and are likely to increase incoming years as alcohol consumption in lower- and middle-income countries increases [10].
This review will summarise research evidence linking alcohol to physical injuries,including potential causal mechanisms involved. The review also highlights key researchfindings specific to various forms of injury and lays out options available for prevention.Given the breadth of information we aim to cover here, we take a narrative review approach,relying largely on previously published systematic reviews, meta-analyses and focusingon key studies where appropriate.
2. Alcohol as a Cause of Physical Injury
Research evidence for alcohol as a cause of injury has clearly emerged for many typesof injury, across multiple settings, and using a wide range of study designs. Key formsof research evidence include: laboratory experiments conducted under controlled condi-tions [11], real-world emergency department studies [12], driving simulation studies [13],studies linking population level drinking and injury rates [14] and retrospective time-seriesstudies showing that alcohol policy changes and interventions can influence populationrates of injury [15].
In one of the most comprehensive reviews of individual-level data, Taylor et al. [16]demonstrated strong dose–response relationships between amount of alcohol consumedin the past 3 h and odds of both motor vehicle and non-motor vehicle injury. Their meta-analysis estimated that even relatively moderate consumption levels (24 g of pure alcohol)roughly doubled the odds of injury, but that risks increased sharply at higher levels ofconsumption, such that someone who had consumed 120 g of alcohol had a more than50 times higher risk of a motor vehicle injury than a non-drinker. Other reviews haveshown that these effects are broadly consistent across different study designs and alcoholrecall periods, suggesting robust relationships [17,18].
At the population level, time-series analyses have shown that changes in per-capitaalcohol consumption are associated with changes in mortality rates related to road in-juries [19], suicide [20] and homicide [21,22]. These studies (see [14]) clearly showed thatthe amount of alcohol consumed in a given society is a key driver of injury rates, althoughthere is significant variation cross-nationally, reflecting variation in drinking patterns andprevention policies at the country level. These established relationships between alcoholuse and physical injury have underpinned regulation and public policy in many coun-tries. Some applications, such as legal blood alcohol limits for driving [23], reach backmany decades, while others, such as integration into national drinking guidelines [24], arerelatively recent.
Plausible Causal Pathways: Pharmacological and Physiological Actions of Alcohol on the HumanBrain and Central Nervous System
Alcohol is a known neurotoxin and central nervous system depressant. Even at low tomoderate levels, alcohol has been observed to impair balance, visual focus, reaction time,judgment and to change behaviour (e.g., [25]). At high enough doses, intoxication canresult in loss of consciousness, coma, respiratory failure (i.e., due to airway obstruction),aspiration pneumonia and ultimately, death [26].
Regarding plausible causal pathways that explain links between alcohol and injury,experimental studies offer the firmest evidence by virtue of their ability to randomly assignparticipants to placebo and exposure groups, subjectively measure functional biomarkersand control alcohol dosage. Though not immune, experimental studies are also bestequipped to separate out pharmacological/physiological effects from ‘expectancy’ effects,i.e., personal beliefs about how alcohol affects behaviour, such as physical aggression,which can vary widely among individuals and cultures [27,28].
Laboratory studies which test human performance on various tasks designed todetect alcohol effects on specific brain systems have identified substantial impairmentsacross multiple measures of cognitive (e.g., information processing) and psychomotorfunctions (e.g., eye-brain-hand-foot coordination) that directly bear on all forms of injury
148
Nutrients 2021, 13, 2777
risk. An extensive review of more than 200 controlled experimental studies on alcohol’sacute effects on the brain and central nervous system found impairments for visuo-motorcontrol, divided attention, focused attention, reaction time, response inhibition and workingmemory. Effects were highly consistent at blood/breath alcohol concentrations (BACs) of0.05% and higher, and some effects were found even at lower levels [29].
Extending what has been learnt from standard laboratory experiments, in vivo neu-roimaging studies can detect alcohol’s pharmacological effect on the human brain andbring potential mechanisms for alcohol-caused injury into clearer focus. Reviews of neu-roimaging studies consistently support findings of diminished cognitive and psychomotorfunctions identified by laboratory experiments [28]. Several reviews, incorporating studieswith a wide range of designs, show that beginning at low levels, acute alcohol intakereduces overall brain glucose metabolism (a proxy for neuronal activity) and increasesmetabolism of acetate (a product of acetaldehyde oxidation) in a dose–response manner.Reduced glucose metabolism is most concentrated in the cerebellum (implicated in motorimpairment), while limbic regions (implicated in reward-seeking behaviour and addiction)show increased metabolism [28,30,31]. These studies also show that brain centres mostaffected by alcohol (i.e., cerebellum, hippocampus, occipital cortex, striatum, amygdala) areregions where balance, movement coordination, attention focus, self-control, processing ofemotional stimuli (e.g., threat detection), motivation and reward-seeking, spatial learningand memory are believed to occur.
There is strong concurrence, therefore, between reviews of experimental laboratorystudies demonstrating cognitive and performance deficits and neuroimaging studiesdemonstrating pharmacological and physiological actions of alcohol on the brain thatstrongly implicate causal pathways to injury risk. It is crucial, however, to bear in mindthat the relationship between alcohol and injury is by no means inexorable. Outside ofthe laboratory, observational studies confirm every-day experience that not all alcoholuse, or even intoxication, necessarily results in injury. Risk of injury from alcohol can beinfluenced by individual differences and expectancies about appropriate or permissiblebehaviours [27,32,33] as can social and cultural norms (e.g., community acceptance orrejection of drinking and driving). External factors such as setting (e.g., home, pub, park),price and physical availability of alcohol also have major impacts on alcohol-caused injuriesat a population level [34,35].
3. Specific Injury Types
The injury literature often distinguishes between injuries arising from intentionalbehaviours and those that are most often unintentional or accidental. Interpersonal violence,self-harm and suicide are all considered intentional injuries as they arise from purposefulactions directed towards oneself or others. Unintentional injuries on the other hand includeroad injuries, other transport injuries, falls, drownings, burns, poisonings, workplaceinjuries and other ‘accidents’ (e.g., freezing), and are often further categorised into transportand non-transport. Categorizing injuries according to intention is commonplace in theliterature and assumed to have utility for injury management and prevention. For instance,prevention approaches to intentional injuries often focus on characteristics of individualsand their behaviours, while unintentional prevention initiatives are more often concernedwith how people, objects and environments interact [36]. It is nevertheless worth notingthat some have questioned whether categorisation limits collaboration and advancementof prevention efforts, as the underlying motivations of individuals are not always clear-cut(e.g., some burns are intentional, as are some road injuries), and groups share many similarcharacteristics, including effective prevention approaches (see Section 4 on policy andinterventions below) [37].
In terms of morbidity and mortality, alcohol-attributable intentional and unintentionalinjuries each account for roughly 50% of total numbers of Disability Adjusted Life Years(DALYs), Deaths and Years of Life Lost (YLL), with transport (i.e., mostly road injury)making up the majority of unintentional injuries [1]. Figure 1 presents the estimated
149
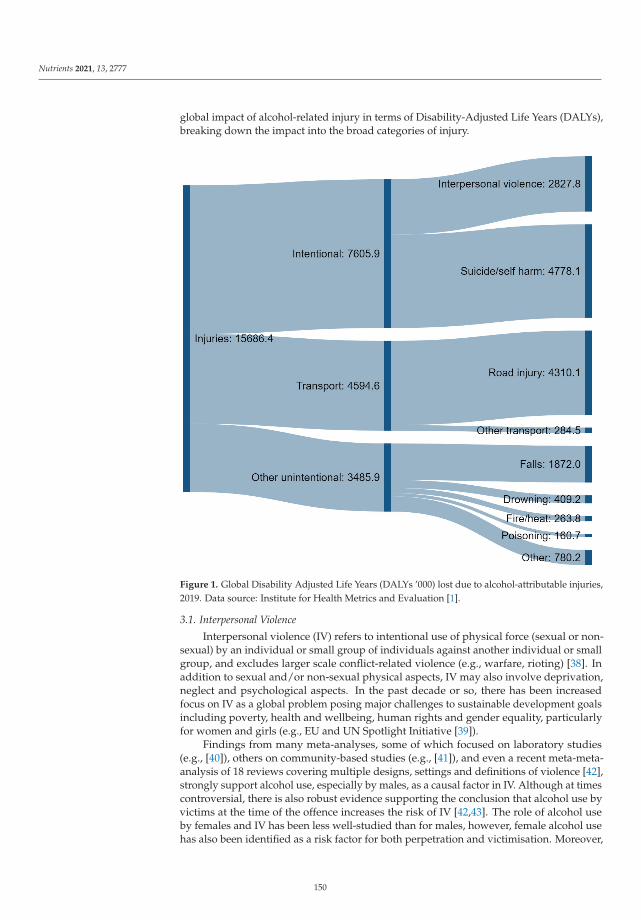
Nutrients 2021, 13, 2777
global impact of alcohol-related injury in terms of Disability-Adjusted Life Years (DALYs),breaking down the impact into the broad categories of injury.
Figure 1. Global Disability Adjusted Life Years (DALYs ’000) lost due to alcohol-attributable injuries,2019. Data source: Institute for Health Metrics and Evaluation [1].
3.1. Interpersonal Violence
Interpersonal violence (IV) refers to intentional use of physical force (sexual or non-sexual) by an individual or small group of individuals against another individual or smallgroup, and excludes larger scale conflict-related violence (e.g., warfare, rioting) [38]. Inaddition to sexual and/or non-sexual physical aspects, IV may also involve deprivation,neglect and psychological aspects. In the past decade or so, there has been increasedfocus on IV as a global problem posing major challenges to sustainable development goalsincluding poverty, health and wellbeing, human rights and gender equality, particularlyfor women and girls (e.g., EU and UN Spotlight Initiative [39]).
Findings from many meta-analyses, some of which focused on laboratory studies(e.g., [40]), others on community-based studies (e.g., [41]), and even a recent meta-meta-analysis of 18 reviews covering multiple designs, settings and definitions of violence [42],strongly support alcohol use, especially by males, as a causal factor in IV. Although at timescontroversial, there is also robust evidence supporting the conclusion that alcohol use byvictims at the time of the offence increases the risk of IV [42,43]. The role of alcohol useby females and IV has been less well-studied than for males, however, female alcohol usehas also been identified as a risk factor for both perpetration and victimisation. Moreover,
150
Nutrients 2021, 13, 2777
alcohol use is more strongly linked to victimisation among women than victimisationamong men in intimate partner violence (IPV) [44,45].
Alcohol use by parents and caregivers, particularly at harmful or hazardous levels,also increases the risk of child physical injury, such as burns, fractures and, occasionally,death, arising from maltreatment [46]. Heavy alcohol use by either victim or perpetratoris also a risk factor for the physical abuse of older people by offspring, partners or otherrelatives in a caregiver role, as well as professional caregivers to a lesser extent [47].
Global burden of disease estimates indicate that as a proportion of total alcohol-attributable injuries, IV accounts for about 16% of deaths and 18% of DALYs [1]. However,IV is highly prone to under-reporting in official statistics, often as a result of victimsavoiding authorities or official agencies for fear of further victimisation. In addition, effectsof IV can extend well beyond immediate physical consequences that might compel a victimto seek treatment (e.g., emergency department attendance) or formal assistance (e.g., police,social services). Experience of trauma for instance, especially at a young age, increasesrisks of developing mental health problems, reproductive and sexual health problems,substance misuse, chronic illness (e.g., cardiovascular disease, diabetes, cancer) and ofliving in poverty later in life, very little of which is readily quantifiable [48].
3.2. Suicide and Self-Harm
Suicide and self-harm are second only to road injuries in terms of injury-related burdenof disease contribution [49] and a major cause of death for young people [50]. The GBDestimates that around 15% of all suicide deaths are attributable to alcohol, meaning over100,000 people die each year from alcohol-related self-harm. A series of systematic reviewshave found strong and consistent evidence that alcohol and self-harm are strongly linked.This includes individual-level studies showing that people with alcohol use disorders(AUDs) are at increased risk of suicidal ideation, self-harm and completed suicide [51],studies showing that heavy drinking in-the-event increases suicide risk [52] and aggregatestudies showing population-level links between alcohol consumption and suicide rates [20].Evidence also points to violent methods of suicide, such as by firearm or hanging, involvingheavier drinking in-the-event compared to poisoning (e.g., [53,54]).
Alcohol’s role in self-harm appears to be mediated through cultural factors—forexample, there is some evidence that alcohol is more strongly associated with self-harm formen and for cultures where intoxication-oriented drinking is more common [20]. Further,while the evidence is reasonably clear that alcohol contributes to suicide and self-harm,there remains uncertainty about the magnitude of the causal relationship, with at least somepotential for alcohol use disorder, intoxication and self-harm to have common underlyingdrivers [20].
3.3. Road Injuries
Road injuries typically include fatal and non-fatal injuries that occur on public roads asa result of accidents involving one or more motor vehicles (e.g., cars, motorcycles, trucks),pedestrians or cyclists. Road injuries are currently ranked 7th for their contribution tototal global DALYs (2.9%) for all ages [55]. Beginning in about 1980, many high-incomecountries reported substantial reductions in road injury rates. Rapid declines in nationalroad tolls continued for about 15 years, largely as a result of concerted prevention effortsincluding legislation and enforcement of maximum legal blood alcohol concentrationlevels for driving [9]. After this time, improvements in high-income countries slowedconsiderably (e.g., [56]), although downward trends continued on a global scale with age-standardised DALYs for road injury declining for all ages (31%), 10–24 year olds (33.6%)and 25–49 year olds (22.5%) [55] between 1990 and 2019. Even so, worldwide, road injuryremains the leading cause of death and disability for 10–24 year olds (6.6%) and 25–49 yearolds (5.1%) [55].
Global statistics obscure large differences in road injury rates across nations andregions, particularly between high-income and low to low/middle-income nations. In the
151
Nutrients 2021, 13, 2777
African region for instance (where under-reporting is widespread) [57], road fatality rateslead the world, are at least double that for the European region [58] and have shownonly marginal improvement over recent decades [57]. This suggests that a great deal ofroad injury prevention work remains to be carried out, particularly in Africa and South-East Asia where road safety laws, including for drink-driving, rarely meet best-practicestandards [58].
The causal, dose-dependent role that alcohol plays in fatal and non-fatal road crasheshas been well-established over decades of extensive observational, laboratory and drivingsimulation research [13,16,59]. Alcohol has been shown to impair driving performanceat blood alcohol concentrations as low as 0.02% [60,61] and well before the driver orobservers are able to detect signs of intoxication [62]. With a few notable exceptions (e.g.,Sweden [63]), most countries maintain maximum legal blood alcohol concentration levelsfor non-probationary drivers (e.g., 0.05%, 0.08% [58]) that are higher than levels now knownto significantly increase crash risk.
Alcohol-impaired drivers increase road injury risk to themselves and others, includingpassengers, pedestrians and other drivers [58,64]. Besides motor vehicle operators, alcohol-positive pedestrians [65] and cyclists [66,67] are also at increased risk of road injury. Drink-for-drink, young and inexperienced drivers are at much greater risk of serious road injurythan their more experienced counterparts [56,61]. Among drivers with alcohol use disorder,road crash risk is at least twice that for non-dependent drivers (e.g., [68]).
Estimates of country-specific alcohol-attributable fractions for road fatalities varyconsiderably, however, averages for broad regions range from about 2% in the EasternMediterranean where alcohol consumption is largely prohibited, to almost 38% in Europewhere alcohol is widely available [6]. Among all alcohol-attributable injuries, road injuriesaccount for over one quarter (27.5%) of total DALYs and they also account for more thanhalf of all unintentional injuries (see Figure 1).
3.4. Falls
Falls represent a major contributor to morbidity and mortality, ranking 21st across allages (second only to road injuries in terms of injury) and 8th for people aged 75 years andolder as a cause of age-standardised DALYs [55]. Not surprisingly, for those aged over 70,falls are the most common cause of an injury-related death [49].
Systematic reviews of studies that examine usual drinking practices and fall riskgenerally produce mixed results [69,70], however the majority fail to account for patternsof drinking. In a pooled analysis of case-control studies from emergency departmentsin 28 countries, Cherpitel et al., showed that both frequent and episodic heavy drinkingwere strong predictors of alcohol-involved falls [71]. Studies that have examined drinkingin-the-event are even more compelling. In a meta-analysis of five studies that used acutemeasures of drinking, Taylor et al. [16] found a clear dose–response relationship, withodds of a fall-related injury increasing by 1.15 for each 10 g of alcohol consumed. This issupported by other reviews [70] and pooled analyses of ED studies [12,72].
Recent work has identified concerns about interactions between alcohol consumptionand use of medication among older populations, where falls represent a disproportionatelylarge cause of morbidity [73]. This points towards one possible specific intervention to re-duce the burden of falls—better assessment and management of alcohol consumption risksby primary healthcare workers when administering/prescribing medications, especiallythose related to the central nervous system [73].
Studies have repeatedly shown that accidental fall injuries result in substantialcosts [74]—for example, a US study estimated the annual cost of fall injuries at morethan USD 80 billion [75]. National populations throughout the world are ageing [76] and,although trends vary across countries, some studies have reported increasing levels ofrisky drinking among older age groups [77–80]. Alcohol-related falls are therefore likely topresent an increasing social burden for many countries in coming decades.
152
Nutrients 2021, 13, 2777
3.5. Drowning
A recent systematic review [81] found that around half of all drowning deaths andmore than one-third of all drowning-related injuries involved alcohol, but that the preva-lence of alcohol involvement varied markedly between studies. The literature relies heavilyon post-mortem assessments of BAC or relatively crude cross-sectional surveys, meaningthe strength of the causal evidence is relatively low, but the best estimates for proportionof all drownings causally attributable to alcohol range from 10% to 30% [82], with peoplewho have blood alcohol concentrations of 0.10% or higher increasing their risk of drowningten-fold [82].
3.6. Injuries from Excessive Heat and Cold
Alcohol intoxication raises the risk of sustaining serious injuries from excessive heat,such as burns from household fires, and from excessive cold, such as hypothermia or deathfrom freezing when drinking outdoors in cold weather. Systematic reviews consistentlyidentify alcohol intoxication as a key risk factor for residential fire mortality [83,84], witharound half of all house fire fatalities tested returning positive BACs [85]. In a robustUS case-control study, presence of an intoxicated person in the household was the singlestrongest predictor of fire leading to fatality [86]. Alcohol intoxication delays escape andincreases risk of fire ignition, particularly in conjunction with smoking (e.g., falling asleepwhile drinking and smoking) [87]. Acute and chronic heavy alcohol use, particularlyamong older age groups, are also major risk factors for serious hypothermia and deathby freezing, although increased risk of hypothermia can also occur among the young(e.g., [88]). Likely under-reported at a global level, alcohol’s role in injuries arising fromexcessive cold nonetheless present ongoing challenges for cold climate countries duringwinter months, with many reporting alcohol’s involvement in more than 40% of fatalcases (e.g., [89–91]).
3.7. Workplace Injuries
Despite growing use of alcohol and drug testing in the workplace, internationalresearch evidence for alcohol as a major contributor to workplace accidents and injuries(except impaired driving) is surprisingly under-developed. Although single studies havecontinued to support a causal relationship [92–94], almost three decades have passed sinceStallones and Kraus’ [95] review of epidemiological evidence regarding alcohol’s role inworkplace injuries.
3.8. Alcohol Poisoning and Other Injuries from Heavy Intoxication
Other key forms of injury arising from heavy intoxication include aspiration (i.e.,choking) [49] and alcohol poisoning [96]. These are especially common among marginalisedpopulations in intoxication-oriented and spirits drinking cultures, with—for example—rates substantially higher in Eastern Europe than the rest of Europe [97]. Additionalinjury risks arise when informal (e.g., home-made) or illegally produced counterfeit oradulterated products are consumed. These products often contain unknown quantitiesof pure alcohol (i.e., ethanol) and other toxic substances (e.g., methanol, ethylene glycol)not intended for human consumption (e.g., ‘antifreeze’, perfume, methylated spirits) thatcan cause blindness, brain injury, coma and death when ingested [98,99]. People withalcohol use disorders, low incomes and tourists appear to be at particular risk of injuryfrom illicit alcohol. Large poisoning outbreaks have been documented in many countries,with fatality rates as high as 30% in some places (e.g., Uganda, Tunisia, Turkey, Pakistan,Norway, Nicaragua, Libya, Kenya, Indonesia, India, Estonia, Ecuador, Czech Republic,Cambodia) [100,101].
4. Effective Interventions and Policies
Broadly speaking, research evidence for effective interventions and policies aimed atreducing alcohol-related injuries can be grouped into two camps: (i) alcohol consumption-
153
Nutrients 2021, 13, 2777
centred approaches oriented towards reducing use at a whole-of-population level, thatmay also have specific or more substantive effects on sub-populations (e.g., young people,heavy drinkers), and (ii) injury-centred approaches targeted at reducing the risk of specifictypes of injury (e.g., falls, assaults) or injuries that occur in specific situations (e.g., whiledriving, in the workplace). Though not intended to be exhaustive, the following sectionssummarise current research evidence for a wide range of policy and intervention optionsavailable to decision makers concerned with reducing alcohol-related injury.
4.1. Alcohol Consumption-Centred Approaches
Decades of research evidence clearly support policy approaches that reduce population-level alcohol consumption as having a central role to play in the reduction of alcohol-related injury overall. Whole-of-population consumption-centred approaches are highlycost-effective at reducing harmful alcohol use in general, alongside restrictions on mar-keting and brief interventions [102]. Furthermore, although most evidence in support ofconsumption-centred approaches has been derived from high-income countries, they are alsohighly effective in middle- and low-income countries when implemented appropriately [103].
Among consumption-centred approaches, research evidence in support of effectivereduction of population-level alcohol use is arguably the strongest and most consistentfor price-based interventions that influence alcohol’s economic availability, i.e., retail pricerelative to disposable income [104–107]. A meta-analysis of 50 studies suggested that adoubling of alcohol taxes would reduce road injury deaths by 11%, violence by 2% andsuicide by around 4% [108]. Price-based interventions have historically been delivered viagovernments raising alcohol taxes. However, there is growing evidence that raising theminimum price at which alcohol can be sold at retail (i.e., minimum unit pricing, MUP) isan effective strategy for reducing overall consumption, IV and drink-driving [109–112].
There is also very strong evidence that raising the legal minimum drinking age (e.g.,from 18 to 21 years) leads to substantial reductions in road injuries among young peoplein the USA and elsewhere [113,114], and is most effective when supported by concertedenforcement efforts [115,116]. Benefits of higher legal minimum drinking age laws havealso been shown to accrue to suicide [117], violence and morbidity from other accidentalinjuries [118] among young people.
Strategies which reduce alcohol’s physical availability can substantially reduce in-jury rates, including in low- and middle-income countries [119]. Research evidence isparticularly robust for reductions in permitted hours of sale of alcohol late at night andreduced violence and road injuries [15,120]. Links between physical density of outlets(i.e., both on- and off-trade access) and injury outcomes (including violence, road injuryand self-harm [121]) have been demonstrated by many studies. However, uncertaintiesremain about the overall robustness of this literature [122] and confirmation is needed fromnew studies that incorporate information on alcohol sales with appropriate methods forstudying geospatial data.
Of recent interest are potential impacts from alcohol’s designation as an ‘essential’product/service and liberalisation of off-trade alcohol sales by a large number of jurisdic-tions during the COVID-19 pandemic [123–126]. Expansion of off-trade sales often occurredsimultaneously to the closure of workplaces, schools, childcare, leisure and physical activitycentres [126]. Although evidence is still emerging, reports in the media and grey literaturesuggest increased drinking in the home in some countries [127–129] (largely off-setting re-ductions in on-premises drinking). These reports have appeared alongside several studiesshowing increased abusive head trauma among children [130] and family violence [131,132].There is some concern that, pressured by commercial vested interests [133,134], govern-ments will allow continuation of deregulatory changes originally intended as temporary,leading to increased risks of IV and trauma in the home [123,124,126].
Multi-component interventions that simultaneously implement a suite of strategiescan markedly reduce injury, especially when supported by their target populations [135].Although price increases and physical availability restrictions (e.g., reduced trading hours,
154
Nutrients 2021, 13, 2777
limits on cheap high-risk beverage purchases) are considered central to the success ofthese programmes, they are often accompanied by supporting harm (e.g., mandatoryserver training, sobriety testing) and demand reduction strategies (e.g., advertising restric-tions) [135,136]. Most recently, a series of price and availability restrictions in Lithuaniareduced total mortality there by 3% [137], with the bulk of benefits arising from reductionsin injury-related deaths [138]. Due to their relatively direct control of alcohol sales, advertis-ing and promotion, jurisdictions with whole or partial alcohol monopolies (more commonto Scandinavia and North America) are well-placed to implement multi-component in-terventions. All else being equal, alcohol monopolies have lower rates of alcohol-relatedinjuries than those with free market systems [139]. Studies which have modelled potentialimpacts of disbanding retail monopolies in Sweden, for example, have estimated increasesin alcohol-related injury deaths of between 18% and 28% annually [140].
4.2. Injury-Centred Approaches
From a global perspective, evidence-based strategies for reducing alcohol-related roadinjuries have undoubtedly received more government commitment to implementation thanany other source of injury—and with striking results [58]. Of critical importance to mini-mizing the road toll in countries where alcohol is widely consumed are government lawsprohibiting BACs exceeding 0.02% for probationary drivers and 0.05% for non-probationarydrivers (WHO 2018). Current best-practice drink-driving laws should also be coupled withwidely publicised, highly visible police enforcement and random breath testing [141]. Atlast count, 45 countries, covering less than a third of the world’s population, had enactedsuch laws, with just 2% from low-income countries [58]. There is great scope, therefore, forgovernments of countries at all income levels to substantially reduce premature death anddisability caused by alcohol-impaired road users among their citizenry.
Motor vehicle drivers who repeatedly drink and drive are often targeted for furtherpreventative measures. Commonly referred to as ignition- or alcohol-interlocks, devicesthat detect breath alcohol can be retrofitted to motor vehicles of drink-driving offend-ers. When positive breath alcohol is detected, alcohol-interlocks incapacitate a vehicleby blocking engine ignition and are highly effective at reducing repeat drink-drivingoffences [7,142].
Interventions aimed at reducing alcohol-related IV have largely been focused arounddrinking venues and night-time entertainment precincts. While broad physical availabilityrestrictions (e.g., reduced trading hours for licensed venues) have the clearest evidence, im-proving server training [143], venue security, environmental design and management havebeen shown in some settings to reduce violence and aggression [144]. Research into inter-ventions aimed at alcohol-related domestic or family violence specifically is relatively scant,with systematic reviews finding few robust evaluations of alcohol policy interventions [145].Individual-level interventions with offenders have shown generally poor results in termsof reducing reoffending [146], suggesting that upstream policy interventions should be thefocus of work to reduce alcohol-related violence.
Research on interventions to reduce alcohol-related drowning or burns is scarce. Astudy of minimum-legal drinking age laws in the USA found no impact on young-adultdrowning rates [147], while programs aiming to reduce alcohol consumption while boatingand fishing remain largely unevaluated [148]. Similarly, evaluation studies of workplacealcohol and drug testing are poor, with only one relatively high-quality study finding aneffect of testing in the transport industry [149].
5. Conclusions
Invitations to consider alcohol’s role in the death, disability and distress that arisesfrom human injury, and what actions could be taken to reduce the burden, can evoke awide range of responses. To varying degrees, responses may be part of a broader agenda,compromised by politicisation, motivated by vested interests or simply reflect personalbeliefs and experience. In contrast, scientific evidence in support of alcohol’s causal and
155

Nutrients 2021, 13, 2777
central role in injury has strengthened over time and is strikingly robust. Given the broadrange of scientific disciplines and research approaches which have contributed to theevidence base, the many decades over which that evidence has accumulated and thevariety of forms that alcohol-related injury can take, the high level of overall consistencyamong findings is remarkable.
Estimates of the human and economic costs of alcohol-related injury leave no doubtthat the global burden is very large. In truth, it is probably larger still, and it may bemany more decades (if at all) before the full extent of short- and long-term consequences,including chronic disease, mental health problems and reduced wellbeing, are fully under-stood and quantified across all counties. At the very least, the burden borne by low- andmiddle-income countries is likely far higher than current statistics imply.
Upward global trends in per capita alcohol consumption during the past thirty yearsor so are predicted to continue, increasing by more than a litre per person by 2030 (i.e.,from 6.5 L in 2017 to 7.6 L in 2030) [10]. Increasing consumption combined with ageingpopulations and more drinking in the home (facilitated by pandemic-related liberalisationof off-trade sales) can be expected to bring about changes in the distribution and magnitudeof alcohol-attributable injury in the next several decades. These changes may well add tochallenges faced by governments already struggling to manage over-loaded healthcaresystems, policing and social services [150].
Nonetheless, there is reason to be optimistic. The evidence is clear: population-levelalcohol consumption-centred policies that reduce alcohol’s economic and physical avail-ability, especially when implemented in conjunction with each other, substantially reducealcohol-related injury in its various forms. Strategies specifically targeted at reducingalcohol-impaired driving are also highly effective and indeed essential for addressing theworld’s leading cause of death and disability among people in their most productive years.There are major human capital and economic windfalls awaiting governments that adoptnation-wide, best-practice alcohol interventions. Manifestly underutilised, independentlyand collectively, the full potential of these strategies has been scarcely realised, though theyoffer evidence-based solutions for high- and low-income countries alike [151].
Funding: This work was supported by funding from the Australian Government under the Drugand Alcohol Program (NDRI core funder) and from Curtin University, Western Australia.
Conflicts of Interest: The authors declare no conflict of interest.
References
1. Institute for Health Metrics and Evaluation. GBD Results Tool: Global Health Data Exchange; University of Washington: Seattle, WA,USA, 2021.
2. Ye, Y.; Shield, K.; Cherpitel, C.J.; Manthey, J.; Korcha, R.; Rehm, J. Estimating alcohol-attributable fractions for injuries basedon data from emergency department and observational studies: A comparison of two methods. Addiction 2018, 114, 462–470.[CrossRef]
3. White, A.M.; Slater, M.E.; Ng, G.; Hingson, R.; Breslow, R. Trends in Alcohol-Related Emergency Department Visits in the UnitedStates: Results from the Nationwide Emergency Department Sample, 2006 to 2014. Alcohol. Clin. Exp. Res. 2018, 42, 352–359.[CrossRef] [PubMed]
4. Canadian Substance Use Costs and Harms Scientific WORKING Group. Canadian Substance Use Costs and Harms VisualizationTool, Version 2.0.0 [Online Tool]. 2020. Available online: https://csuch.ca/explore-the-data/ (accessed on 23 June 2021).
5. Ranaweera, S.; Amarasinghe, H.; Chandraratne, N.; Thavorncharoensap, M.; Ranasinghe, T.; Karunaratna, S.; Kumara, D.;Santatiwongchai, B.; Chaikledkaew, U.; Abeykoon, P.; et al. Economic costs of alcohol use in Sri Lanka. PLoS ONE 2018,13, e0198640. [CrossRef]
6. World Health Organisation. The Global Health Observatory—Regional Prevalence, Aafs (15+), Road Traffic Crash Deaths; World HealthOrganisation: Geneva, Switzerland, 2021.
7. Lefio, A.; Bachelet, V.C.; Jiménez-Paneque, R.; Gomolan, P.; Rivas, K. A systematic review of the effectiveness of interventionsto reduce motor vehicle crashes and their injuries among the general and working populations. Rev. Panam. Salud Públ. 2018,42, 1–8. [CrossRef] [PubMed]
8. Cummings, P.; Rivara, F.P.; Olson, C.M.; Smith, K.M. Changes in traffic crash mortality rates attributed to use of alcohol, or lackof a seat belt, air bag, motorcycle helmet, or bicycle helmet, United States, 1982–2001. Inj. Prev. 2006, 12, 148–154. [CrossRef][PubMed]
156
Nutrients 2021, 13, 2777
9. Sweedler, B.M.; Stewart, K. Worldwide Trends in Alcohol and Drug Impaired Driving. Drugs, Driving and Traffic Safety; BirkhäuserBasel Verlag AG: Basel, Switzerland, 2009; pp. 23–41.
10. Manthey, J.; Shield, K.D.; Rylett, M.; Hasan, O.M.; Probst, C.; Rehm, J. Global alcohol exposure between 1990 and 2017 andforecasts until 2030, A modelling study. Lancet 2019, 393, 2493–2502. [CrossRef]
11. Giancola, P.R.; Duke, A.A.; Ritz, K.Z. Alcohol, violence, and the alcohol myopia model: Preliminary findings and im-plicationsfor prevention. Addict. Behav. 2011, 36, 1019–1022. [CrossRef]
12. Borges, G.; Cherpitel, C.; Orozco, R.; Bond, J.; Ye, Y.; Macdonald, S.; Rehm, J.; Poznyak, V. Multicentre study of acute alcoholuse and non-fatal injuries: Data from the WHO collaborative study on alcohol and injuries. Bull. World Health Organ. 2006,84, 453–460. [CrossRef]
13. Irwin, C.; Iudakhina, E.; Desbrow, B.; McCartney, D. Effects of acute alcohol consumption on measures of simulated driving:A systematic review and meta-analysis. Accid. Anal. Prev. 2017, 102, 248–266. [CrossRef]
14. Norström, T.; Ramstedt, M. Mortality and population drinking: A review of the literature. Drug Alcohol Rev. 2005, 24, 537–547.[CrossRef]
15. Nepal, S.; Kypri, K.; Tekelab, T.; Hodder, R.K.; Attia, J.; Bagade, T.; Chikritzhs, T.; Miller, P. Effects of Extensions and Restrictionsin Alcohol Trading Hours on the Incidence of Assault and Unintentional Injury: Systematic Review. J. Stud. Alcohol Drugs 2020,81, 5–23. [CrossRef]
16. Taylor, B.; Irving, H.; Kanteres, F.; Room, R.; Borges, G.; Cherpitel, C.; Greenfield, T.; Rehm, J. The more you drink, the harderyou fall: A systematic review and meta-analysis of how acute alcohol consumption and injury or collision risk increase together.Drug Alcohol Depend. 2010, 110, 108–116. [CrossRef]
17. Zeisser, C.; Stockwell, T.; Chikritzhs, T.; Cherpitel, C.J.; Ye, Y.; Gardner, C. A Systematic Review and Meta-Analysis of AlcoholConsumption and Injury Risk as a Function of Study Design and Recall Period. Alcohol. Clin. Exp. Res. 2013, 37, E1–E8. [CrossRef][PubMed]
18. Cherpitel, C.J.; Ye, Y.; Bond, J.; Borges, G.; Monteiro, M. Relative risk of injury from acute alcohol consumption: Modeling thedose-response relationship in emergency department data from 18 countries. Addiction 2015, 110, 279–288. [CrossRef]
19. Jiang, H.; Livingston, M.; Room, R. Alcohol Consumption and Fatal Injuries in Australia Before and After Major Traffic SafetyInitiatives: A Time Series Analysis. Alcohol. Clin. Exp. Res. 2015, 39, 175–183. [CrossRef] [PubMed]
20. Norstrøm, T.-A.; Rossow, I. Alcohol Consumption as a Risk Factor for Suicidal Behavior: A Systematic Review of Associations atthe Individual and at the Population Level. Arch. Suicide Res. 2016, 20, 489–506. [CrossRef] [PubMed]
21. Ramstedt, M. Population drinking and homicide in Australia: A time series analysis of the period 1950–2003. Drug Alcohol Rev.2011, 30, 466–472. [CrossRef]
22. Bye, E.K. Alcohol and homicide in Eastern Europe: A time series analysis of six countries. Homicide Stud. 2008, 12, 7–27. [CrossRef]23. Homel, R. Random breath testing in Australia: A complex deterrent. Aust. Drug Alcohol Rev. 1988, 7, 231–241. [CrossRef]24. National Health and Medical Research Council. Australian Guidelines to Reduce Health Risks from Drinking Alcohol; NHMRC:
Canberra, NSW, Australia, 2020.25. Dry, M.J.; Burns, N.R.; Nettelbeck, T.; Farquharson, A.L.; White, J.M. Dose-related effects of alcohol on cognitive functioning.
PLoS ONE 2012, 7, e50977. [CrossRef]26. Davis, A.; Lipson, A. Central-Nervous-System Depression and High Blood Ethanol Levels. Lancet 1986, 327, 566. [CrossRef]27. Exum, M.L. Alcohol and aggression: An integration of findings from experimental studies. J. Crim. Justice 2006, 34, 131–145.
[CrossRef]28. Bjork, J.M.; Gilman, J.M. The effects of acute alcohol administration on the human brain: Insights from neuroimaging.
Neuropharmacology 2014, 84, 101–110. [CrossRef] [PubMed]29. Zoethout, R.W.M.; Delgado, W.L.; Ippel, A.E.; Dahan, A.; Van Gerven, J.M.A. Functional biomarkers for the acute effects of
alcohol on the central nervous system in healthy volunteers. Br. J. Clin. Pharmacol. 2011, 71, 331–350. [CrossRef]30. Jacob, A.; Wang, P. Alcohol Intoxication and Cognition: Implications on Mechanisms and Therapeutic Strategies. Front. Neurosci.
2020, 14, 102. [CrossRef]31. Van Skike, C.E.; Goodlett, C.; Matthews, D.B. Acute alcohol and cognition: Remembering what it causes us to forget. Alcohol 2019,
79, 105–125. [CrossRef] [PubMed]32. Wells, S.; Flynn, A.; Tremblay, P.F.; Dumas, T.; Miller, P.; Graham, K. Linking masculinity to negative drinking conse-quences:
The mediating roles of heavy episodic drinking and alcohol expectancies. J. Stud. Alcohol Drugs 2014, 75, 510–519. [CrossRef][PubMed]
33. Attwood, A.S.; Munafò, M.R. Effects of acute alcohol consumption and processing of emotion in faces: Implications forunderstanding alcohol-related aggression. J. Psychopharmacol. 2014, 28, 719–732. [CrossRef] [PubMed]
34. Babor, T.; Caetano, R.; Casswell, S.; Edwards, G.; Giesbrecht, N.; Graham, K. Alcohol: No Ordinary Commodity—Research and PublicPolicy, 2nd ed.; Oxford University Press: Oxford, UK, 2010.
35. Cherpitel, C.J.; Witbrodt, J.; Korcha, R.A.; Ye, Y.; Monteiro, M.G.; Chou, P. Dose–Response Relationship of Alcohol and InjuryCause: Effects of Country-Level Drinking Pattern and Alcohol Policy. Alcohol. Clin. Exp. Res. 2019, 43, 850–856. [CrossRef]
36. Yin, X.; Li, D.; Zhu, K.; Liang, X.; Peng, S.; Tan, A.; Du, Y. Comparison of intentional and unintentional injuries among Chinesechildren and adolescents. J. Epidemiol. 2019, 30, 529–536. [CrossRef]
157
Nutrients 2021, 13, 2777
37. Cohen, L.; Miller, T.; Sheppard, M.A.; Gordon, E.; Gantz, T.; Atnafou, R. Bridging the gap: Bringing together intentional andunintentional injury prevention efforts to improve health and well being. J. Saf. Res. 2003, 34, 473–483. [CrossRef] [PubMed]
38. Violence Prevention Alliance. Definition and Typology of Violence; World Health Organisation: Geneva, Switzerland, 2021.39. Shrivastava, S.R.; Shrivastava, P.S.; Ramasamy, J. Spotlight initiative: A step of united nations and European union to end violence
against women. Med. J. Dr. D.Y. Patil Vidyapeeth 2018, 11, 380. [CrossRef]40. Steele, C.M.; Southwick, L. Alcohol and social behavior: I. The psychology of drunken excess. J. Per. Soc. Psychol. 1985, 48, 18.
[CrossRef]41. Kuhns, J.B.; Exum, M.L.; Clodfelter, T.A.; Bottia, M.C. The prevalence of alcohol-involved homicide offending: A meta-analytic
review. Homicide Stud. 2014, 18, 251–270. [CrossRef]42. Duke, A.A.; Smith, K.M.Z.; Oberleitner, L.M.S.; Westphal, A.; McKee, S.A. Alcohol, drugs, and violence: A meta-meta-analysis.
Psychol. Violence 2018, 8, 238–249. [CrossRef]43. Kuhns, J.B.; Wilson, D.B.; Clodfelter, T.A.; Maguire, E.R.; Ainsworth, S.A. A meta-analysis of alcohol toxicology study findings
among homicide victims. Addiction 2010, 106, 62–72. [CrossRef]44. Cafferky, B.M.; Mendez, M.; Anderson, J.R.; Stith, S.M. Substance use and intimate partner violence: A meta-analytic review.
Psychol. Violence 2018, 8, 110. [CrossRef]45. Devries, K.M.; Child, J.; Bacchus, L.J.; Mak, J.; Falder, G.; Graham, K.; Watts, C.; Heise, L. Intimate partner violence victimization
and alcohol consumption in women: A systematic review and meta-analysis. Addiction 2014, 109, 379–391. [CrossRef] [PubMed]46. World Health Organization. Preventing Child. Maltreatment: A Guide to Taking Action and Generating Evidence; World Health
Organization: Geneva, Switzerland, 2006.47. Johannesen, M.; Lo Giudice, D. Elder abuse: A systematic review of risk factors in community-dwelling elders. Age Ageing 2013,
42, 292–298. [CrossRef]48. World Health Organization. Global Status Report on Violence Prevention 2014; World Health Organization: Geneva, Switzerland, 2014.49. Roth, G.A.; Abate, D.; Abate, K.H.; Abay, S.M.; Abbafati, C.; Abbasi, N.; Abbastabar, H.; Abd-Allah, F.; Abdela, J.; Abdelalim,
A.; et al. Global, regional, and national age-sex-specific mortality for 282 causes of death in 195 countries and territories, 1980–2017,a systematic analysis for the Global Burden of Disease Study 2017. Lancet 2018, 392, 1736–1788. [CrossRef]
50. World Health Organisation. Preventing Suicide: A Global Imperative; World Health Organization: Geneva, Switzerland, 2014.51. Darvishi, N.; Farhadi, M.; Haghtalab, T.; Poorolajal, J. Alcohol-Related Risk of Suicidal Ideation, Suicide Attempt, and Completed
Suicide: A Meta-Analysis. PLoS ONE 2015, 10, e0126870. [CrossRef] [PubMed]52. Borges, G.; Bagge, C.; Cherpitel, C.J.; Conner, K.; Orozco, R.; Rossow, I. A meta-analysis of acute use of alcohol and the risk of
suicide attempt. Psychol. Med. 2017, 47, 949–957. [CrossRef]53. Conner, K.R.; Huguet, N.; Caetano, R.; Giesbrecht, N.; McFarland, B.H.; Nolte, K.B.; Kaplan, M.S. Acute use of alcohol and
methods of suicide in a US national sample. Am. J. Public Health 2014, 104, 171–178. [CrossRef]54. Kaplan, M.S.; McFarland, B.; Huguet, N.; Conner, K.; Caetano, R.; Giesbrecht, N.; Nolte, K.B. Acute alcohol intoxication and
suicide: A gender-stratified analysis of the National Violent Death Reporting System. Inj. Prev. 2012, 19, 38–43. [CrossRef]55. Vos, T.; Lim, S.S.; Abbafati, C.; Abbas, K.M.; Abbasi, M.; Abbasifard, M.; Abbasi-Kangevari, M.; Abbastabar, H.; Abd-Allah, F.;
Abdelalim, A.; et al. Global burden of 369 diseases and injuries in 204 countries and territories, 1990–2019: A systematic analysisfor the Global Burden of Disease Study 2019. Lancet 2020, 396, 1204–1222. [CrossRef]
56. Voas, R.B.; Torres, P.; Romano, E.; Lacey, J.H. Alcohol-Related Risk of Driver Fatalities: An Update Using 2007 Data. J. Stud.Alcohol Drugs 2012, 73, 341–350. [CrossRef]
57. Adeloye, D.; Thompson, J.Y.; Akanbi, M.; Azuh, D.; Samuel, V.; Omoregbe, N.; Ayo, C.K. The burden of road traffic crashes,injuries and deaths in Africa: A systematic review and meta-analysis. Bull. World Health Organ. 2016, 94, 510–521A. [CrossRef][PubMed]
58. World Health Organization. Global Status Report on Road Safety 2018, Summary; World Health Organization: Geneva, Switzerland, 2018.59. Taylor, B.; Rehm, J. The relationship between alcohol consumption and fatal motor vehicle injury: High risk at low alco-hol levels.
Alcohol. Clin. Exp. Res. 2012, 36, 1827–1834. [CrossRef]60. Lira, M.C.; Sarda, V.; Heeren, T.C.; Miller, M.; Naimi, T.S. Alcohol Policies and Motor Vehicle Crash Deaths Involving Blood
Alcohol Concentrations Below 0.08%. Am. J. Prev. Med. 2020, 58, 622–629. [CrossRef]61. Zador, P.L.; Krawchuk, S.A.; Voas, R.B. Alcohol-related relative risk of driver fatalities and driver involvement in fatal crashes in
relation to driver age and gender: An update using 1996 data. J. Stud. Alcohol 2000, 61, 387–395. [CrossRef]62. Kerr, W.C.; Greenfield, T.K.; Midanik, L.T. How many drinks does it take you to feel drunk? Trends and predictors for subjective
drunkenness. Addiction 2006, 101, 1428–1437. [CrossRef]63. Norstrom, T. Assessment of the Impact of the 0.02 Percent BAC-Limit in Sweden. Stud. Crime Crime Prev. 1997, 6, 245–258.64. Quinlan, K.; Shults, R.A.; Rudd, R.A. Child Passenger Deaths Involving Alcohol-Impaired Drivers. Pediatrics 2014, 133, 966–972.
[CrossRef] [PubMed]65. Lasota, D.; Goniewicz, M.; Kosson, D.; Ochal, A.; Krajewski, P.; Tarka, S.; Goniewicz, K.; Mirowska-Guzel, D. The effect of ethyl
alcohol on the severity of injuries in fatal pedestrian victims of traffic crashes. PLoS ONE 2019, 14, e0221749. [CrossRef]66. Hartung, B.; Mindiashvili, N.; Maatz, R.; Schwender, H.; Roth, E.H.; Ritz-Timme, S.; Moody, J.; Malczyk, A.; Daldrup, T. Regarding
the fitness to ride a bicycle under the acute influence of alcohol. Int. J. Leg. Med. 2014, 129, 471–480. [CrossRef]
158
Nutrients 2021, 13, 2777
67. Harada, M.Y.; Gangi, A.; Ko, A.; Liou, D.Z.; Barmparas, G.; Li, T.; Hotz, H.; Stewart, D.; Ley, E.J. Bicycle trauma and alcoholintoxication. Int. J. Surg. 2015, 24, 14–19. [CrossRef]
68. Guitart, A.M.; Espelt, A.; Castellano, Y.; Suelves, J.M.; Villalbí, J.R.; Brugal, M.T. Injury-Related Mortality Over 12 Years in aCohort of Patients with Alcohol Use Disorders: Higher Mortality Among Young People and Women. Alcohol. Clin. Exp. Res. 2015,39, 1158–1165. [CrossRef]
69. Reid, M.C.; Boutros, N.N.; O’Connor, P.G.; Cadariu, A.; Concato, J. The health-related effects of alcohol use in older per-sons:A systematic review. Subst. Abuse 2002, 23, 149–164. [CrossRef]
70. Kool, B.; Ameratunga, S.; Jackson, R. The role of alcohol in unintentional falls among young and middle-aged adults: A systematicreview of epidemiological studies. Inj. Prev. 2009, 15, 341–347. [CrossRef] [PubMed]
71. Cherpitel, C.J.; Witbrodt, J.; Ye, Y.; Korcha, R. A multi-level analysis of emergency department data on drinking patterns, alcoholpolicy and cause of injury in 28 countries. Drug Alcohol Depend. 2018, 192, 172–178. [CrossRef]
72. Cherpitel, C.J. Drinking Patterns and Problems and Drinking in the Event: An Analysis of Injury by Cause Among CasualtyPatients. Alcohol. Clin. Exp. Res. 1996, 20, 1130–1137. [CrossRef]
73. Holton, A.; Boland, F.; Gallagher, P.; Fahey, T.; Moriarty, F.; Kenny, R.A.; Cousins, G. Potentially serious alcohol–medicationin-teractions and falls in community-dwelling older adults: A prospective cohort study. Age Ageing 2019, 48, 824–831. [CrossRef]
74. Chandran, A.; Hyder, A.A.; Peek-Asa, C. The Global Burden of Unintentional Injuries and an Agenda for Progress. Epidemiol. Rev.2010, 32, 110–120. [CrossRef]
75. Zaloshnja, E.; Miller, T.; Lawrence, B.A.; Romano, E. The costs of unintentional home injuries. Am. J. Prev. Med. 2005, 28, 88–94.[CrossRef]
76. Lutz, W.; Sanderson, W.; Scherbov, S. The coming acceleration of global population ageing. Nat. Cell Biol. 2008, 451, 716–719.[CrossRef] [PubMed]
77. Calvo, E.; Medina, J.T.; Ornstein, K.A.; Staudinger, U.M.; Fried, L.P.; Keyes, K.M. Cross-country and historical variation in alcoholconsumption among older men and women: Leveraging recently harmonized survey data in 21 countries. Drug Alcohol Depend.2020, 215, 108219. [CrossRef]
78. Han, B.H.; Moore, A.A.; Sherman, S.; Keyes, K.M.; Palamar, J. Demographic trends of binge alcohol use and alcohol use disordersamong older adults in the United States, 2005–2014. Drug Alcohol Depend. 2017, 170, 198–207. [CrossRef]
79. Breslow, R.A.; Castle, I.J.P.; Chen, C.M.; Graubard, B.I. Trends in alcohol consumption among older Americans: Nation-al HealthInterview Surveys, 1997 to 2014. Alcohol. Clin. Exp. Res. 2017, 41, 976–986. [CrossRef]
80. Livingston, M.; Callinan, S.; Dietze, P.; Stanesby, O.; Kuntsche, E. Is there gender convergence in risky drinking when tak-ingbirth cohorts into account? Evidence from an Australian national survey 2001–2013. Addiction 2018, 113, 2019–2028. [CrossRef]
81. Hamilton, K.; Keech, J.J.; Peden, A.E.; Hagger, M.S. Alcohol use, aquatic injury, and unintentional drowning: A system-aticliterature review. Drug Alcohol Rev. 2018, 37, 752–773. [CrossRef]
82. Driscoll, T.R.; Harrison, J.; Steenkamp, M. Review of the role of alcohol in drowning associated with recreational aquatic activity.Inj. Prev. 2004, 10, 107–113. [CrossRef]
83. Warda, L.; Tenenbein, M.; Moffatt, M.E.K. House fire injury prevention update. Part I. A review of risk factors for fatal andnon-fatal house fire injury. Inj. Prev. 1999, 5, 145–150. [CrossRef]
84. Turner, S.L.; Johnson, R.D.; Weightman, A.; Rodgers, S.; Arthur, G.; Bailey, R.; Lyons, R.A. Risk factors associated withunintentional house fire incidents, injuries and deaths in high-income countries: A systematic review. Inj. Prev. 2017, 23, 131–137.[CrossRef]
85. Bruck, D.; Ball, M.; Thomas, I.R. Fire fatality and alcohol intake: Analysis of key risk factors. J. Stud. Alcohol Drugs 2011,72, 731–736. [CrossRef]
86. Runyan, C.W.; Bangdiwala, S.I.; Linzer, M.A.; Sacks, J.J.; Butts, J. Risk Factors for Fatal Residential Fires. New Engl. J. Med. 1992,327, 859–863. [CrossRef]
87. Ball, M.; Bruck, D. The effect of alcohol upon response to fire alarm signals in sleeping young adults. In Proceedings of the 3rdInternational Symposium on Human Behaviour in Fire, Belfast, Northern Ireland, 1–3 September 2004; pp. 291–302.
88. Schreurs, C.J.; Van Hoof, J.J.; Van Der Lely, N. Hypothermia and acute alcohol intoxication in Dutch adolescents: The relationshipbetween core and outdoor temperatures. J. Subst. Use 2016, 22, 449–453. [CrossRef]
89. Brändström, H.; Eriksson, A.; Giesbrecht, G.; Ängquist, K.-A.; Haney, M. Fatal hypothermia: An analysis from a sub-arctic region.Int. J. Circumpolar Health 2012, 71, 1–7. [CrossRef]
90. Kosinski, S.; Darocha, T.; Gałazkowski, R.; Drwiła, R. Accidental hypothermia in Poland–estimation of prevalence, diagnosticmethods and treatment. Scand. J. Trauma Resusc. Emerg. Med. 2015, 23, 1–6. [CrossRef] [PubMed]
91. Makela, P. Alcohol-related mortality by age and sex and its impact on life expectancy: Estimates based on the Finnish deathregister. Eur. J. Public Health 1998, 8, 43–51. [CrossRef]
92. McNeilly, B.; Ibrahim, J.; Bugeja, L.; Ozanne-Smith, J. The prevalence of work-related deaths associated with alcohol and drugs inVictoria, Australia, 2001–2006. Inj. Prev. 2010, 16, 423–428. [CrossRef]
93. Ramirez, M.; Bedford, R.; Sullivan, R.; Anthony, T.R.; Kraemer, J.; Faine, B.; Peek-Asa, C. Toxicology Testing in Fatally InjuredWorkers: A Review of Five Years of Iowa FACE Cases. Int. J. Environ. Res. Public Health 2013, 10, 6154–6168. [CrossRef]
94. Webb, G.R.; Redman, S.; Hennrikus, D.J.; Kelman, G.R.; Gibberd, R.W.; Sanson-Fisher, R.W. The relationships between high-riskand problem drinking and the occurrence of work injuries and related absences. J. Stud. Alcohol 1994, 55, 434–446. [CrossRef]
159
Nutrients 2021, 13, 2777
95. Stallones, L.; Kraus, J.F. The occurrence and epidemiologic features of alcohol-related occupational injuries. Addiction 1993,88, 945–951. [CrossRef] [PubMed]
96. Yoon, Y.-H.; Stinson, F.S.; Yi, H.-Y.; Dufour, M.C. Accidental* Alcohol Poisoning Mortality in the United States, 1996–1998.Alcohol Res. Health J. Natl. Inst. Alcohol Abus. Alcohol. 2003, 27, 110–118.
97. Moskalewicz, J.; Razvodovsky, Y.; Wieczorek, Ł. East–west disparities in alcohol-related harm. Alcohol. Drug Addict. 2016,29, 209–222. [CrossRef]
98. Brent, J. Current Management of Ethylene Glycol Poisoning. Drugs 2001, 61, 979–988. [CrossRef]99. Kruse, J.A. Methanol and Ethylene Glycol Intoxication. Crit. Care Clin. 2012, 28, 661–711. [CrossRef] [PubMed]100. World Health Organisation. Methanol Poisoning Outbreaks; World Health Organisation: Geneva, Switzerland, 2014.101. Nekoukar, Z.; Zakariaei, Z.; Taghizadeh, F.; Musavi, F.; Banimostafavi, E.S.; Sharifpour, A.; Ghuchi, N.E.; Fakhar, M.; Tabaripour,
R.; Safanavaei, S. Methanol poisoning as a new world challenge: A review. Ann. Med. Surg. 2021, 66, 102445. [CrossRef]102. Chisholm, D.; Moro, D.; Bertram, M.; Pretorius, C.; Gmel, G.; Shield, K.; Rehm, J. Are the “Best Buys” for Alcohol Control Still
Valid? An Update on the Comparative Cost-Effectiveness of Alcohol Control Strategies at the Global Level. J. Stud. Alcohol Drugs2018, 79, 514–522. [CrossRef]
103. Rehm, J.; Babor, T.F.; Casswell, S.; Room, R. Heterogeneity in trends of alcohol use around the world: Do policies make adifference? Drug Alcohol Rev. 2021, 40, 345–349. [CrossRef] [PubMed]
104. Gallet, C.A. The demand for alcohol: A meta-analysis of elasticities. Aust. J. Agric. Resour. Econ. 2007, 51, 121–135. [CrossRef]105. Wagenaar, A.C.; Salois, M.J.; Komro, K.A. Effects of beverage alcohol price and tax levels on drinking: A meta-analysis of
1003 estimates from 112 studies. Addiction 2009, 104, 179–190. [CrossRef] [PubMed]106. Sornpaisarn, B.; Shield, K.D.; Cohen, J.E.; Schwartz, R.; Rehm, J. Elasticity of alcohol consumption, alcohol-related harms, and
drinking initiation in low- and middle-income countries: A systematic review and meta-analysis. Int. J. Alcohol Drug Res. 2013,2, 45–58. [CrossRef]
107. Nelson, J.P. Meta-analysis of alcohol price and income elasticities–with corrections for publication bias. Health Econ. Rev. 2013,3, 1–10. [CrossRef]
108. Wagenaar, A.C.; Tobler, A.L.; Komro, K.A. Effects of alcohol tax and price policies on morbidity and mortality: A systematicreview. Am. J. Public Health 2010, 100, 2270–2278. [CrossRef]
109. Taylor, N.; Miller, P.; Coomber, K.; Livingston, M.; Scott, D.; Buykx, P.; Chikritzhs, T. The impact of a minimum unit price onwholesale alcohol supply trends in the Northern Territory, Australia. Aust. N. Z. J. Public Health 2021, 45, 26–33. [CrossRef]
110. Stockwell, T.; Zhao, J.; Marzell, M.; Gruenewald, P.J.; Macdonald, S.; Ponicki, W.R.; Martin, G. Relationships Between MinimumAlcohol Pricing and Crime During the Partial Privatization of a Canadian Government Alcohol Monopoly. J. Stud. Alcohol Drugs2015, 76, 628–634. [CrossRef]
111. O’Donnell, A.; Anderson, P.; Jané-Llopis, E.; Manthey, J.; Kaner, E.; Rehm, J. Immediate impact of minimum unit pricing onalcohol purchases in Scotland: Controlled interrupted time series analysis for 2015–18. BMJ 2019, 366, l5274. [CrossRef]
112. Zhao, J.; Stockwell, T.; Martin, G.; Macdonald, S.; Vallance, K.; Treno, A.; Ponicki, W.R.; Tu, A.; Buxton, J. The relationshipbetween minimum alcohol prices, outlet densities and alcohol-attributable deaths in British Columbia, 2002–2009. Addiction 2013,108, 1059–1069. [CrossRef]
113. Jiang, H.; Livingston, M.; Manton, E. The effects of random breath testing and lowering the minimum legal drinking age ontraffic fatalities in Australian states. Inj. Prev. 2014, 21, 77–83. [CrossRef]
114. Wagenaar, A.C.; Toomey, T.L. Effects of minimum drinking age laws: Review and analyses of the literature from 1960 to 2000.J. Stud. Alcohol Suppl. 2002, S206, 206–225. [CrossRef] [PubMed]
115. Scribner, R.; Cohen, D. The Effect of Enforcement on Merchant Compliance with the Minimum Legal Drinking Age Law.J. Drug Issues 2001, 31, 857–866. [CrossRef]
116. Wagenaar, A.C.; Wolfson, M. Enforcement of the Legal Minimum Drinking Age in the United States. J. Public Health Policy 1994,15, 37–53. [CrossRef]
117. Xuan, Z.; Naimi, T.S.; Kaplan, M.S.; Bagge, C.L.; Few, L.R.; Maisto, S.; Saitz, R.; Freeman, R. Alcohol Policies and Suicide:A Review of the Literature. Alcohol. Clin. Exp. Res. 2016, 40, 2043–2055. [CrossRef] [PubMed]
118. Carpenter, C.; Dobkin, C. The minimum legal drinking age and morbidity in the United States. Rev. Econ. Stat. 2017, 99, 95–104.[CrossRef]
119. Cook, W.K.; Bond, J.; Greenfield, T.K. Are alcohol policies associated with alcohol consumption in low- and middle-incomecountries? Addiction 2014, 109, 1081–1090. [CrossRef]
120. Wilkinson, C.; Livingston, M.; Room, R. Impacts of changes to trading hours of liquor licences on alcohol-related harm:A systematic review 2005–2015. Public Health Res. Pr. 2016, 26, e2641644. [CrossRef]
121. Fitterer, J.L.; Nelson, T.A.; Stockwell, T. A Review of Existing Studies Reporting the Negative Effects of Alcohol Access andPositive Effects of Alcohol Control Policies on Interpersonal Violence. Front. Public Health 2015, 3, 253. [CrossRef] [PubMed]
122. Gmel, G.; Holmes, J.; Studer, J. Are alcohol outlet densities strongly associated with alcohol-related outcomes? A critical reviewof recent evidence. Drug Alcohol Rev. 2015, 35, 40–54. [CrossRef]
123. Reynolds, J.; Wilkinson, C. Accessibility of ‘essential’alcohol in the time of COVID-19, casting light on the blind spots of licensing?Drug Alcohol Rev. 2020, 39, 305–308. [CrossRef]
160

Nutrients 2021, 13, 2777
124. Hobin, E.; Smith, B. Is another public health crisis brewing beneath the COVID-19 pandemic? Can. J. Public Health 2020,111, 392–396. [CrossRef]
125. Braillon, A. Alcohol control and the COVID-19 crisis on the other side of the Atlantic. Can. J. Public Health 2020, 111, 1–2. [CrossRef]126. Andreasson, S.; Chikritzhs, T.; Dangardt, F.; Holder, H.; Naimi, T.; Sherk, A.; Stockwell, T. Alcohol and Society 2021, Alcohol and the
Coronavirus Pandemic: Individual, Societal and Policy Perspectives; Swedish Society of Nursing; SFAM; SAFF; CERA; The SwedishSociety of Addiction Medicine; SIGHT, Movendi International & IOGT-NTO: Stockholm, Sweden, 2021.
127. Callinan, S.; Mojica-Perez, Y.; Wright, C.J.C.; Livingston, M.; Kuntsche, S.; Laslett, A.-M.; Room, R.; Kuntsche, E. Purchasing,consumption, demographic and socioeconomic variables associated with shifts in alcohol consumption during the COVID-19pandemic. Drug Alcohol Rev. 2021, 40, 183–191. [CrossRef] [PubMed]
128. Ryerson, N.C.; Wilson, O.W.; Pena, A.; Duffy, M.; Bopp, M. What happens when the party moves home? The effect of theCOVID-19 pandemic on US college student alcohol consumption as a function of legal drinking status using longitudinal data.Transl. Behav. Med. 2021, 11, 772–774. [CrossRef]
129. Calina, D.; Hartung, T.; Mardare, I.; Mitroi, M.; Poulas, K.; Tsatsakis, A.; Rogoveanu, I.; Docea, A.O. COVID-19 pandemic andalcohol consumption: Impacts and interconnections. Toxicol. Rep. 2021, 8, 529–535. [CrossRef]
130. Sidpra, J.; Abomeli, D.; Hameed, B.; Baker, J.; Mankad, K. Rise in the incidence of abusive head trauma during the COVID-19pandemic. Arch. Dis. Child. 2021, 106, e14. [CrossRef] [PubMed]
131. Piquero, A.R.; Jennings, W.G.; Jemison, E.; Kaukinen, C.; Knaul, F.M. Domestic violence during the COVID-19 pandemic-Evidencefrom a systematic review and meta-analysis. J. Crim. Justice 2021, 74, 101806–101815. [CrossRef]
132. Mclay, M.M. When “Shelter-in-Place” Isn’t Shelter that’s safe: A rapid analysis of domestic violence case differences during theCOVID-19 pandemic and stay-at-home orders. J. Fam. Violence 2021, 7, 1–10.
133. Keric, D.; Stafford, J. Alcohol industry arguments for putting profit before health in the midst of a pandemic: The WesternAustralian experience. Drug Alcohol Rev. 2021, 40, 201–204. [CrossRef] [PubMed]
134. Opp, S.M.; Mosier, S.L. Liquor, marijuana, and guns: Essential services or political tools during the Covid-19 pandemic? PolicyDes. Pr. 2020, 3, 297–311. [CrossRef]
135. Chikritzhs, T.; Gray, D.; Lyons, Z.; Saggers, S. Restrictions on the Sale and Supply of Alcohol: Evidence and Outcomes; National DrugResearch Institute: Perth, WA, Australia, 2007.
136. Porthé, V.; García-Subirats, I.; Ariza, C.; Villalbí, J.R.; Bartroli, M.; Júarez, O.; Díez, E. Community-Based Interventions to ReduceAlcohol Consumption and Alcohol-Related Harm in Adults. J. Commun. Health 2021, 46, 565–576. [CrossRef]
137. Štelemekas, M.; Manthey, J.; Badaras, R.; Casswell, S.; Ferreira-Borges, C.; Kalediene, R.; Lange, S.; Neufeld, M.; Petkeviciene, J.;Radišauskas, R.; et al. Alcohol control policy measures and all-cause mortality in Lithuania: An interrupted time–series analysis.Addiction 2021. [CrossRef]
138. Stumbrys, D.; Telksnys, T.; Jasilionis, D.; Liutkute Gumarov, V.; Galkus, L.; Goštautaite Midttun, N.; Štelemekas, M. Alcohol-related male mortality in the context of changing alcohol control policy in Lithuania 2000–2017. Drug Alcohol Rev. 2020, 39, 818–826.[CrossRef]
139. Miller, T.; Snowden, C.; Birckmayer, J.; Hendrie, D. Retail alcohol monopolies, underage drinking, and youth impaired drivingdeaths. Accid. Anal. Prev. 2006, 38, 1162–1167. [CrossRef] [PubMed]
140. Stockwell, T.; Sherk, A.; Norström, T.; Angus, C.; Ramstedt, M.; Andréasson, S.; Chikritzhs, T.; Gripenberg, J.; Holder, H.; Holmes,J.; et al. Estimating the public health impact of disbanding a government alcohol monopoly: Application of new methods to thecase of Sweden. BMC Public Health 2018, 18, 1400. [CrossRef] [PubMed]
141. Shults, R.A.; Elder, R.W.; Sleet, D.A.; Nichols, J.L.; Alao, M.O.; Carande-Kulis, V.G.; Zaza, S.; Sosin, D.M.; Thompson, R.S. Reviewsof evidence regarding interventions to reduce alcohol-impaired driving. Am. J. Prev. Med. 2001, 21, 66–88. [CrossRef]
142. Kaufman, E.J.; Wiebe, D.J. Impact of state ignition interlock laws on alcohol-involved crash deaths in the United States. Am. J.Public Health 2016, 106, 865–871. [CrossRef]
143. Wallin, E.; Norström, T.; Andréasson, S. Alcohol prevention targeting licensed premises: A study of effects on violence.J. Stud. Alcohol 2003, 64, 270–277. [CrossRef]
144. Graham, K.; Homel, R. Raising the Bar; Taylor & Francis: Abingdon, UK, 2008.145. Wilson, I.M.; Graham, K.; Taft, A. Alcohol interventions, alcohol policy and intimate partner violence: A systematic review.
BMC Public Health 2014, 14, 881. [CrossRef]146. McMurran, M. Alcohol-Related Violence: Prevention and Treatment; John Wiley & Sons: Hoboken, NJ, USA, 2012.147. Howland, J.; Birckmayer, J.; Hemenway, D.; Cote, J. Did changes in minimum age drinking laws affect adolescent drowning
(1970–1990)? Inj. Prev. 1998, 4, 288–291. [CrossRef] [PubMed]148. Leavy, J.E.; Crawford, G.; Portsmouth, L.; Jancey, J.; Leaversuch, F.; Nimmo, L.; Hunt, K. Recreational Drowning Prevention
Interventions for Adults, 1990–2012: A Review. J. Community Health 2015, 40, 725–735. [CrossRef] [PubMed]149. Pidd, K.; Roche, A.M. How effective is drug testing as a workplace safety strategy? A systematic review of the evidence.
Accid. Anal. Prev. 2014, 71, 154–165. [CrossRef] [PubMed]150. Stockwell, T.; Andreasson, S.; Cherpitel, C.; Chikritzhs, T.; Dangardt, F.; Holder, H.; Naimi, T.; Sherk, A. The burden of alcohol on
health care during COVID-19. Drug Alcohol Rev. 2021, 40, 3–7. [CrossRef] [PubMed]151. Medina-Mora, M.E.; Monteiro, M.; Rafful, C.; Samano, I. Comprehensive analysis of alcohol policies in the Latin America and the
Caribbean. Drug Alcohol Rev. 2021, 40, 385–401. [CrossRef] [PubMed]
161


nutrients
Review
‘Joining the Dots’: Individual, Sociocultural and EnvironmentalLinks between Alcohol Consumption, Dietary Intake and BodyWeight—A Narrative Review
Mackenzie Fong *, Stephanie Scott, Viviana Albani, Ashley Adamson and Eileen Kaner
Citation: Fong, M.; Scott, S.; Albani,
V.; Adamson, A.; Kaner, E. ‘Joining
the Dots’: Individual, Sociocultural
and Environmental Links between
Alcohol Consumption, Dietary Intake
and Body Weight—A Narrative
Review. Nutrients 2021, 13, 2927.
https://doi.org/10.3390/nu13092927
Academic Editor: Peter Anderson
Received: 4 August 2021
Accepted: 23 August 2021
Published: 24 August 2021
Publisher’s Note: MDPI stays neutral
with regard to jurisdictional claims in
published maps and institutional affil-
iations.
Copyright: © 2021 by the authors.
Licensee MDPI, Basel, Switzerland.
This article is an open access article
distributed under the terms and
conditions of the Creative Commons
Attribution (CC BY) license (https://
creativecommons.org/licenses/by/
4.0/).
Population Health Sciences Institute, Newcastle University, Newcastle-upon-Tyne NE1 4LP1, UK;[email protected] (S.S.); [email protected] (V.A.);[email protected] (A.A.); [email protected] (E.K.)* Correspondence: [email protected]
Abstract: Alcohol is energy-dense, elicits weak satiety responses relative to solid food, inhibits dietaryfat oxidation, and may stimulate food intake. It has, therefore, been proposed as a contributor toweight gain and obesity. The aim of this narrative review was to consolidate and critically appraisethe evidence on the relationship of alcohol consumption with dietary intake and body weight, withinmainstream (non-treatment) populations. Publications were identified from a PubMed keywordsearch using the terms ‘alcohol’, ‘food’, ‘eating’, ‘weight’, ‘body mass index’, ‘obesity’, ‘food reward’,‘inhibition’, ‘attentional bias’, ‘appetite’, ‘culture’, ‘social’. A snowball method and citation searcheswere used to identify additional relevant publications. Reference lists of relevant publications werealso consulted. While limited by statistical heterogeneity, pooled results of experimental studiesshowed a relatively robust association between acute alcohol intake and greater food and totalenergy intake. This appears to occur via metabolic and psychological mechanisms that have not yetbeen fully elucidated. Evidence on the relationship between alcohol intake and weight is equivocal.Most evidence was derived from cross-sectional survey data which does not allow for a cause-effectrelationship to be established. Observational research evidence was limited by heterogeneity andmethodological issues, reducing the certainty of the evidence. We found very little qualitative workregarding the social, cultural, and environmental links between concurrent alcohol intake and eatingbehaviours. That the evidence of alcohol intake and body weight remains uncertain despite noshortage of research over the years, indicates that more innovative research methodologies andnuanced analyses are needed to capture what is clearly a complex and dynamic relationship. Also,given synergies between ‘Big Food’ and ‘Big Alcohol’ industries, effective policy solutions are likelyto overlap and a unified approach to policy change may be more effective than isolated efforts.However, joint action may not occur until stronger evidence on the relationship between alcoholintake, food intake and weight is established.
Keywords: alcohol; body weight; obesity; eating dietary intake; drinking pattern
1. Introduction
Excess body weight and heavy alcohol consumption remain two of the most intractablepublic health challenges globally. Worldwide, around 39% of adults have overweight and13% have obesity [1], while one in four adults in England and Scotland regularly consumeover 14 units of alcohol per week; the maximum number of units considered ‘low risk’based on the Chief Medical Officer’s guidelines in the UK [2]. One in five drinkers inGreat Britain binge drink on their heaviest drinking day (>8 units for men and >6 unitsfor women) [2]. Obesity and alcohol misuse are leading causes of disability and disease,and disease burden attributable to elevated body mass index (BMI) and alcohol-relatedmortality and morbidity are greater in socioeconomically disadvantaged populationscompared with more advantaged counterparts [3–5]. The phenomenon whereby people
Nutrients 2021, 13, 2927. https://doi.org/10.3390/nu13092927 https://www.mdpi.com/journal/nutrients163
Nutrients 2021, 13, 2927
of lower socioeconomic position (SEP) consume the same (or less) alcohol as those fromhigher SEP yet experience greater alcohol-related harm is described as the alcohol-harmparadox [6]. This relationship is consistent internationally and across varying measures ofSEP such as education, car ownership, income, employment, and housing tenure [7].
Like other nutritive beverages (mainly sugar-sweetened beverages (SSBs)), alcoholhas been proposed as a causal factor of weight gain and obesity. Beverages elicit weaksatiety signals relative to solid food [8–10] resulting in insufficient dietary compensationand greater daily energy intake [11,12]. However, compared to other nutritive beverages,alcohol has a very high energy density (29 kJ/g), providing more energy for volume thanmost (e.g., wine = 280 kJ/100 mL vs. cola drink = 177 kJ/100 mL). It is estimated that alcoholcontributes around 10% of an adult drinker’s weekly energy intake [13] which, in the UK,roughly equates to 690–770 kJ based on data from the National Diet and Nutrition Surveyshowing that daily energy intake of adults 19–64 years and 65 years and over was 7690and 6900 kJ/day, respectively [14]. This is significant given that a reduction of 400 kJ/daymay attenuate population-level weight gain [15]. Further, unlike other beverages, alcoholmetabolism inhibits dietary fat oxidation [16], thereby promoting body fat storage. Thepharmacological properties of alcohol are posited to stimulate food intake during thedrinking occasion ostensibly through integrated cognitive and hedonic mechanisms [17].Taken together, the nutritional properties, and metabolic and psychological effects ofalcohol make it a logical driver of weight gain and obesity.
As with most research attempting to disentangle the relationship of weight witha single food/beverage item, evidence on the relationship between alcohol and weightis drawn mostly from heterogeneous cross-sectional studies, and findings are inconsis-tent [18]. To unpack this relationship further, researchers have investigated the role ofseveral moderators, with sex, drinking pattern and type of alcoholic drink garnering mostinterest. Briefly, the hypotheses are that the relationship of alcohol and body weight isstronger: (a) in females; (b) in heavy drinkers; and (c) for beer/spirit intake. There arewell-documented social and cultural differences in how men and women engage withalcohol [19,20], as well as biological sex differences in body composition, genetic factors,absorption, and metabolism [21,22]. Hypotheses regarding heavy drinking may be relatedto socioeconomic factors; people of lower SEP tend to binge drink more frequently thantheir counterparts from more advantaged backgrounds [23,24]. Similarly, drink preferencemay be socially patterned; wine is preferred by the middle class and is considered to be asource of cultural capital and distinction [25,26]. Wine drinking has been associated withmore healthful dietary intake relative to beer drinking [27,28]. Further, standard servingsizes generally differ between drink types. In the UK, the standard serving size for beeris a 570 mL ‘pint’, providing ~880 kJ (full strength beer). For wine, the standard servingsize is a 175 mL (‘medium’) glass, providing ~630 kJ. Spirits are often served with nutritivebeverage mixers which contribute to greater energy content.
Given the clear public health importance of these two interrelated issues, and thebreadth of available literature, it is important to synthesise and appraise this literature tounderstand the knowledge base and current thinking, identify areas of further research, andinform future interventions. Thus, the aim of this narrative review was to consolidate andcritically appraise the evidence on the relationship between alcohol consumption, dietaryintake, and body weight within mainstream (non-treatment) populations. We acknowledgethat the relationship of alcohol and weight in people with alcohol dependency (AD) isdistinct. This group is more likely to experience undernutrition and have a low BMI forreasons including substitution of food for alcohol [29], changes in appetite [29,30], andinterferences with nutrient digestion, absorption, and metabolism [30]. While this reviewfocuses on general (non-treatment) populations, we discuss diverse population groups(including people with AD) in the Section 4 of this paper. As intake of both alcohol and foodoccurs within complex socioecological contexts, we also aimed to explore how individual,sociocultural, and environmental factors shape consumption behaviours.
164
Nutrients 2021, 13, 2927
2. Materials and Methods
We undertook a narrative review to consolidate and critically appraise the literatureexploring the impact of alcohol on food intake, the relationship of alcohol with body weight,and the individual-level mechanisms and sociocultural and environmental influencesof alcohol and food intake. Publications were identified from a PubMed search usingcombinations of the keywords: ‘alcohol’, ‘food’, ‘eating’, ‘weight’, ‘body mass index’,‘obesity’, ‘food reward’, ‘inhibition’, ‘attentional bias’, ‘appetite’, ‘culture’, ‘social’. Weused the snowball method and citation searches and consulted articles’ reference lists toidentify additional publications. Results are grouped thematically and examined belowas follows: (1) The relationship between alcohol and dietary intake, and alcohol and bodyweight; (2) Individual-level mechanisms; (3) Social, cultural, and environmental influenceson alcohol and food intake.
3. Results
3.1. Alcohol and Dietary Intake
A recent systematic review and meta-analysis identified 22 experimental trials inves-tigating the effect of acute alcohol intake on ad libitum food energy intake (participantsare invited to eat as much or as little food as they wish) and total energy intake (energyfrom beverages and food) [31]. While narrative synthesis conveyed that the effect of alco-hol on food energy intake was inconsistent and dependent on the comparator condition(no/negligible energy non-alcoholic drink vs. energy containing non-alcoholic drink) andthe alcohol dose, meta-analysis found that food energy intake was significantly greaterin the alcohol condition compared to pooled effect of energy and non-energy containingnon-alcoholic beverage comparators (n = 12; WMD 343 kJ; 95% CI 161, 525 kJ). With regardsto total energy intake, 7/8 studies found that compared to no beverage and no/negligible-energy beverage comparators, alcoholic beverages significantly increased total energyintake. Comparisons with energy-containing beverages were mixed. Meta-analysis foundthat total energy intake was greater in the alcohol condition compared to the energy andnon-energy containing non-alcoholic/no beverage conditions (n = 8; WMD 1072 kJ; 95%CI 820, 1323 kJ). In keeping with these findings, analyses of nationally representativesurvey data in Australian adults found that energy intake for those that reported alcoholconsumption on the day of the dietary recall was significantly greater than those who didnot. Between-participant, age-adjusted mean daily energy intake on alcohol vs. no alcoholdays was 11,409 kJ vs. 9944 kJ (p < 0.0001) for men, and 8303 kJ vs. 7070 kJ (p < 0.0001) forwomen, respectively. This was a mean increase of 1514 kJ (462) for men and 1227 kJ (424)for women [32].
There are suggestions that alcohol may impact macronutrient intake, and this may haveimplications on weight as macronutrients may differentially affect energy metabolism [33].Cummings and colleagues [34] systematically reviewed the evidence on the relationship ofalcohol and macronutrient intake (refined and unrefined carbohydrate/fat/protein) intake.The 18 experimental studies identified in the search yielded mixed results. While there wasa trend for a single occasion of light and moderate drinking to promote fat (8/18 studies)and protein intake (5/12 studies), most studies did not detect differences in macronutrientintake in response to these drinking behaviours. Similarly, findings from 12 observationalstudies, most of which used nationally representative cross-sectional datasets, were alsoinconsistent. The most consistent findings were of the inverse association between fre-quent heavy drinking and refined carbohydrate intake from foods such as candies, cereal(unspecified), and chocolate (reported in 90.9% of studies), but also intake of unrefinedcarbohydrate from foods such as fruits, grains, and vegetables (reported in 90% of studies).Meanwhile, Parekh et al. [35] recently conducted a nuanced analysis of the FraminghamHeart Offspring Cohort study (1971–2008) and explored the relationship of drinking pat-terns with dietary intake, and how these shifted over time as participants aged. Across alldata collection points, binge drinkers consumed less fruits and vegetables and wholegrains,
165
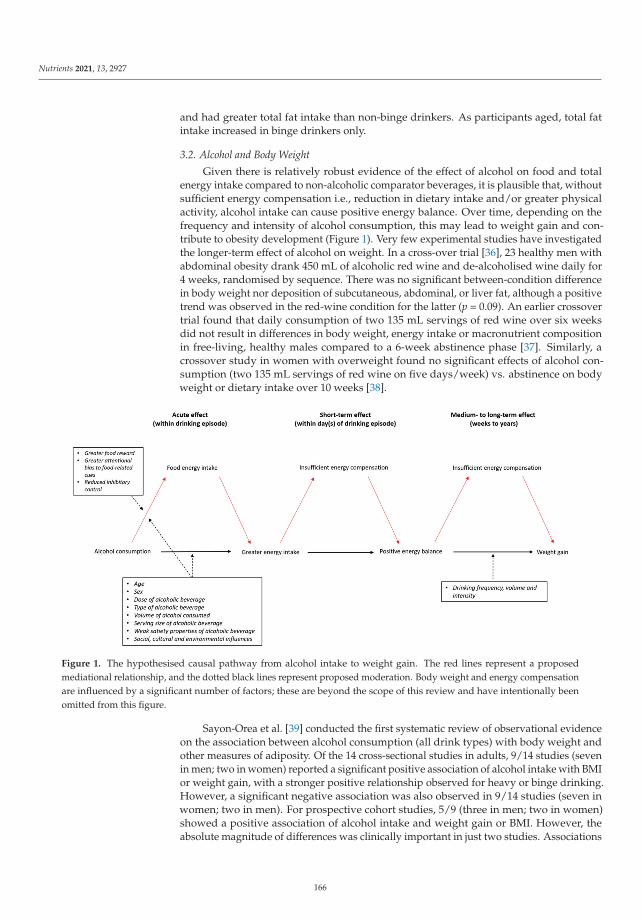
Nutrients 2021, 13, 2927
and had greater total fat intake than non-binge drinkers. As participants aged, total fatintake increased in binge drinkers only.
3.2. Alcohol and Body Weight
Given there is relatively robust evidence of the effect of alcohol on food and totalenergy intake compared to non-alcoholic comparator beverages, it is plausible that, withoutsufficient energy compensation i.e., reduction in dietary intake and/or greater physicalactivity, alcohol intake can cause positive energy balance. Over time, depending on thefrequency and intensity of alcohol consumption, this may lead to weight gain and con-tribute to obesity development (Figure 1). Very few experimental studies have investigatedthe longer-term effect of alcohol on weight. In a cross-over trial [36], 23 healthy men withabdominal obesity drank 450 mL of alcoholic red wine and de-alcoholised wine daily for4 weeks, randomised by sequence. There was no significant between-condition differencein body weight nor deposition of subcutaneous, abdominal, or liver fat, although a positivetrend was observed in the red-wine condition for the latter (p = 0.09). An earlier crossovertrial found that daily consumption of two 135 mL servings of red wine over six weeksdid not result in differences in body weight, energy intake or macronutrient compositionin free-living, healthy males compared to a 6-week abstinence phase [37]. Similarly, acrossover study in women with overweight found no significant effects of alcohol con-sumption (two 135 mL servings of red wine on five days/week) vs. abstinence on bodyweight or dietary intake over 10 weeks [38].
Figure 1. The hypothesised causal pathway from alcohol intake to weight gain. The red lines represent a proposedmediational relationship, and the dotted black lines represent proposed moderation. Body weight and energy compensationare influenced by a significant number of factors; these are beyond the scope of this review and have intentionally beenomitted from this figure.
Sayon-Orea et al. [39] conducted the first systematic review of observational evidenceon the association between alcohol consumption (all drink types) with body weight andother measures of adiposity. Of the 14 cross-sectional studies in adults, 9/14 studies (sevenin men; two in women) reported a significant positive association of alcohol intake with BMIor weight gain, with a stronger positive relationship observed for heavy or binge drinking.However, a significant negative association was also observed in 9/14 studies (seven inwomen; two in men). For prospective cohort studies, 5/9 (three in men; two in women)showed a positive association of alcohol intake and weight gain or BMI. However, theabsolute magnitude of differences was clinically important in just two studies. Associations
166
Nutrients 2021, 13, 2927
of mixed direction were observed for cohort studies that reported measures of abdominaladiposity, although subgroup analyses in larger cohorts revealed only negative associationswith wine drinking despite positive associations with total alcohol intake. One cohort studyexhibited a U-shaped association between wine consumption and waist circumference,and three exhibited a J-shaped association, such that heavy (male and female) alcoholdrinkers (≥28 drinks/week) showed greatest weight gain, BMI or waist circumference.Travesy and Chaput [18] conducted an updated narrative review which included additionalcross-sectional and longitudinal evidence. Attention was drawn to more recent evidencethat examined the relationship of alcohol intake pattern, especially heavy drinking, withadiposity outcomes. For instance, Shelton and Knott [40] analysed data from the HealthSurvey for England and calculated % recommended dietary intake (RDA) from alcoholon participants’ heaviest drinking day over the previous seven days. The risk of obesitywas approximately 70% greater in the heaviest (≥75%RDA) vs. lightest (0–25% RDA)groups. Concordant with Sayon-Orea et al., the authors concluded that while the literatureis heterogeneous and findings are inconsistent, there is a trend for the relationship betweenalcohol and body weight to be non-linear (J-shaped), and that drinking intensity (heavydrinking) may be a more salient behaviour than drinking frequency.
Bendsen et al. [41] focused on beer intake specifically; their systematic review included12 experimental studies testing the effect of beer intake vs. intake of low- or non-alcoholicbeer/water/no substitute beverage on anthropometric outcomes. Experimental interven-tions lasted between 21–126 days and, for most, participants were prescribed a certainvolume of beer to drink per day or per week. Random effects pooling found that beer con-sumption did not increase body weight compared to the no-substitute beverage comparator(mean difference 0.54 kg; 95% CI-1.00, 2.08; p = 0.49; I2 = 0%). In contrast, consumption ofalcoholic beer was found to increase body weight compared with no and low-alcohol beer(mean difference 0.73 kg; 95% CI 0.53, 0.92; p < 0.0001; I2 = 0%). Among the ten prospectivecohort studies and 25 cross-sectional studies included in the review, most showed a positiverelationship or no relationship between beer intake and markers of obesity; in women anegative relationship was observed in several studies. Twenty-one studies reported obesityoutcomes by level of beer intake, although heterogeneity in outcome measures and beerintake e.g., frequency vs. amount, prohibited quantitative data synthesis. The cumulativeraw data did not indicate a dose-response at lower or moderate beer intake (~500 mL/day),but higher beer intake (>4 L/week) may be associated positively with abdominal obesity,particularly among men. The authors noted that most studies controlled for at least somepotential confounders i.e., age, education, physical activity, and smoking, but that thedegree of statistical adjustment varied widely.
Most recently, Golzarand et al. [42] conducted meta-analyses in 127 observationalstudies investigating the association between alcohol intake and markers of adiposity. Meta-analyses of cohort studies revealed no significant association between alcohol drinkingand risk of overweight (HR 0.93; 95% CI 0.46, 1.89; I2 = 97.7; p = 0.84), obesity (HR 0.84,95% CI 0.52, 1.37; I2 = 90.7; p = 0.48), overweight/obesity (HR 1.15; 95% CI 0.84, 1.58;I2 = 87.0; p = 0.37), nor abdominal obesity (HR 1.13; 95% CI 0.90, 1.41; I2 = 61.0; p = 0.28).In cross sectional studies, alcohol intake was associated with greater odds of havingoverweight (OR 1.11; 95% CI 1.05; 1.18; I2 = 87.7; p = 0.001), but not obesity (OR 1.03;95%CI 0.95, 1.12; I2 = 95.1; p = 0.48). Subgroup analysis by alcohol dose revealed that heavydrinking (>28 g/day), but not light (<14 g/day), nor moderate drinking (14–28 g/day), wasassociated positively with overweight (OR 1.12; 95% CI 1.01, 1.24; p = 0.02). Regardingobesity, moderate drinkers had 16% lower odds of having obesity, but neither light norheavy drinking were associated with greater odds of obesity. Those in the highest categoryof alcohol intake had 19% increased odds of abdominal obesity compared to those in thelowest category (OR 1.19; 95% CI 1.09, 1.29; p < 0.001). Heterogeneity between studies wasvery high and the authors rated most studies as being of very low quality/certainty basedon the GRADE working group grades of evidence (i.e., the true effect is probably markedlydifferent from the estimated effect) [43].
167
Nutrients 2021, 13, 2927
3.3. Alcohol and Weight Loss
A smaller number of studies have investigated the effect of alcohol intake on weightloss outcomes. In one randomised controlled trial (RCT), adults with overweight or obesitywere prescribed hypo-energetic diets of 1500 cal/day (6300 kJ/day), of which 10% was tobe consumed as either grape juice or white wine (200 mL). At 3 months follow-up, therewere no significant differences in weight loss nor other anthropometric measures betweengroups [44]. Secondary analyses of a weight loss RCT found that while energy on no-alcohol days was significantly less than days alcohol was consumed, alcohol consumptionwas not associated with weekly weight loss [45]. Further, analyses of a large multicentreRCT (the Look AHEAD (Action for Health in Diabetes) study) identified that weight lossbetween participants who did and did not abstain from alcohol were similar during thefirst year regardless of study group. However, at Year 4, participants assigned to theIntensive Lifestyle Intervention (ILI) who abstained from alcohol lost 1.6% more weightrelative to individuals who drank alcohol at any time during the intervention [46]. Kaseand colleagues found that alcohol intake was not associated with weight before or after26-week behavioural weight loss intervention, nor was change in alcohol intake related tochange in weight [47]. However, reduction in alcohol was more relevant to weight loss forcertain personality traits; specifically, those with higher levels of impulsivity experiencedgreater weight loss from reducing alcohol consumption.
3.4. Indiviudal-Level Mechanisms Linking Alcohol and Food Intake3.4.1. Appetite, Hunger and Satiety
It is proposed that alcohol stimulates appetite; a phenomenon referred to as theaperitif effect [48]. However, several studies examining the effect of alcohol on levels ofghrelin (predominant hunger-stimulating hormone), have yielded mixed findings, withsome even observing a reduction in ghrelin [18,49]. It is speculated that alcohol mayenhance subjective appetite, however, most studies do not indicate a significant increase inself-reported appetite following an aperitif [48]. One of the more recent studies involvedparticipants consuming either an alcohol (0.6 g/kg) or lemonade primer, rested for twentyminutes (to allow time for alcohol absorption) and then consumed snacks ad libitum forten minutes [50]. Compared to the lemonade group, the alcohol groups experienced greatersnack urge between baseline and the rest period, and experienced a smaller decline inappetite following snack consumption.
As with other nutritive beverages, alcohol is proposed to elicit weak satiety signalsrelative to solid food [8–10,51]. Compared to food, beverages have faster gastric transittimes [52,53], demand less oral processing [54,55], reduce ghrelin suppression [56,57] andelicit lower cognitive perception of anticipated satiety [56,58]. The weaker satiety responseselicited by alcohol may not stimulate sufficient feelings of fullness needed to inhibit furtherenergy intake.
3.4.2. Inhibitory Control
Inhibitory control is an umbrella term that describes the suppression of goal-irrelevantstimuli and behavioural responses [59]. Several studies have shown that alcohol cancause deficits in inhibitory control in relation to suppression of autonomic appetitive re-sponses [60]. A study in female undergraduate students showed that consumption ofcookies following an alcohol primer (compared to an alcohol-free placebo) was mediatedby inhibitory control (assessed through performance on a Stroop task), such that poorerinhibitory control was associated with greater cookie consumption [61]. Impairment ofinhibitory control may be more pronounced in people who have higher trait disinhibi-tion [50] and dietary restraint [62], although evidence is conflicted [63]. Notably, evenalcohol-related cues (e.g., alcohol odour, memory elicitation of drinking) in the absence ofactual consumption has been shown to reduce inhibitory control [64].
168
Nutrients 2021, 13, 2927
3.4.3. Food-Related Reward and Attentional-Bias
Alcohol may stimulate greater food intake by enhancing its reward value. Studiesusing explicit self-report measures to assess the effect of alcohol on indices of food rewardshowed that intake of an alcohol primer increased: appetite, snack urge, ad libiutm intakeand explicit liking of high-fat savoury foods [50,65,66].
It is posited that alcohol may increase attentional bias (AB) (i.e., selective attention) tofood cues through classical conditioning [67] e.g., associations between an ‘aperitif’ beforemeals, ‘drinks and nibbles’, wine and cheese pairings etc. As AB is thought to indicateunderlying appetitive motivational processes, several studies have used AB to food cuesas an implicit measure of food reward. Between [68] and within-subjects [66] studiesfound that low dose alcohol primers (0.3–0.4 mg/kg) did not affect AB towards energy-dense foods relative to placebo. Gough et al. [66] observed that AB to food cues increasedfollowing a higher dose alcohol primer (0.6 mg/kg) compared to placebo, suggesting thatthese effects may only occur at higher doses. A smaller study in 23 young adults foundthat while low- (0.3 g/kg) and high-dose (0.65 g/kg) alcohol primers reduced alcohol-cuerelated AB relative to placebo, AB towards food-cues were sustained across all doses [69].Recent evidence has indicated that alcohol (beer) odour increased attentional bias forfood-cues, even in the absence of actual alcohol consumption [70].
3.5. Social, Cultural and Environmental Influences on Food and Alcohol Intake3.5.1. The Interconnected Role of Food and Alcohol in Social and Cultural Life
Food and alcohol ‘products’ are a source of pleasure and a valued component ofsocial spaces (especially within the night-time economy), as well as emotional and culturallife. A qualitative synthesis of 62 papers, identified that alcohol and food were both usedto overcome personal problems, facilitate fun experiences, exercise control and restraint,and demonstrate a sense of identity in 10–17-year-olds [71]. However, we have a poorerunderstanding of how drinking and eating behaviours interact; just a handful of studieshave explored this relationship in any depth, with most data focusing on young adultpopulations. The first (and, to our knowledge, only) qualitative study to examine theinterconnectedness of food and alcohol consumption for UK young adults, found thatsociocultural, physical and emotional links between food and alcohol were an unquestionednorm for 18–25-year-olds [72]. For interviewees, eating patterns whilst drinking alcoholwere tied not only to hunger, but also to sociability, traditions, and identity. Further, youngadults in this study conceptualised and calculated acute risks to weight, appearance, andsocial status, rather than risks to their long-term health. In a study focused upon multiplehealth behaviours (physical activity, nutrition, weight gain), Nelson et al. [73] found thatUS college students suggested their weight gain resulted, in part, from drinking alcoholand alcohol-related eating, including both eating late at night after alcohol was consumedas well as eating before going out to allow themselves to consume more alcohol.
3.5.2. Role of the Environment
Physical, economic, and political environments drive the availability and affordabilityof food and alcohol products which, in turn, influence their consumption. In developedcountries, people have virtually unfettered access to alcohol and food products high in fat,sugar and salt (HFSS). Research has demonstrated an association between alcohol outletdensity (a proxy marker of physical availability) and higher alcohol consumption [74,75],and between density of hot food takeaway outlets and obesity [3,76]. Importantly, both den-sity of fast food [77,78] and alcohol outlets [79] are associated with greater socioeconomicdeprivation. The recent proliferation of digital ‘on demand’ food and alcohol deliveryservices has enhanced their availability and may facilitate greater consumption [80–82],however, this requires more investigation. Regarding affordability, both HFSS food andalcohol products are relatively inexpensive. In the UK, affordability of alcohol has increasedover time and is 13% more affordable than in 2008 [83]. High strength white ciders andspirits are especially cheap and may cost as little as 19 p per unit, meaning that 14 units (the
169
Nutrients 2021, 13, 2927
maximum number of units considered ‘low risk’ based on the UK Chief Medical Officer’sguidelines) are available for just £2.68 [84].
3.5.3. The Role of Food and Alcohol Industries
As corporate industries, ‘Big Food’ and ‘Big Alcohol’ use similar marketing andlobbying tactics with high degrees of co-operation [85–88]. For example, both industrieshave engaged in the use of ‘framing’; whereby actors use discursive strategies to ‘frame’ adebate to benefit their corporate agenda [89]. Recent work by Rinaldi et al. [90] identifiedthat different stakeholders in alcohol control (including industry) use framing discreditpublic health policy solutions; whilst similar studies have explored the use of framingin relation to the sugar tax [91] and food industry [92]. Petticrew et al. [93] identifiedthe existence of a ‘cross-industry’ playbook represented by two incongruous ‘frames’:(i) aetiology of public health issues is complex, therefore, individual products cannot beblamed; and (ii) population health measures are ’too simple’ to address complex publichealth problems.
Both industries also use strategic advertising and marketing to promote acceptability,and even glamorisation, of convenience food and alcohol consumption. Recent researchdemonstrated that marketing messages by ‘Big Food’ and ‘Big Alcohol’ were both adaptedin the early stages of the pandemic. Martino et al. [94] analysed the extent and nature ofonline marketing by leading alcohol and food/beverage brands (and their parent compa-nies) in Australia over a 4-month period. They found that nearly 80% of posts from brandsstudies related to COVID-19, with quick service restaurants, food and alcohol deliverycompanies, alcohol brands and bottle shops most active.
4. Discussion
4.1. Appraising the Evidence
We found good evidence from pooled laboratory studies showing that acute intake ofalcoholic beverages consistently and significantly increased food and total energy intakewithin the drinking episode. This energy appears to be additive to energy from othersources, resulting in greater daily energy intake relative to alcohol-free days. However, thecumulative findings of the four previous reviews on alcohol intake and body weight areequivocal and do not support a fully consistent relationship. That the acute effect of alcoholon food intake did not translate to a robust relationship between alcohol and weight mayspeak to the poor external validity of laboratory studies; responses to alcohol manifestdifferently in a laboratory vs. real life setting [95]. Also, Kwok et al. noted that the findingsof their meta-analyses of the effect of alcohol on food intake were only generalisable toyounger adults aged 18–37 years, and that significant statistical heterogeneity and smalleffect sizes were observed for some outcomes.
Neither experimental nor observational evidence supported a clear association be-tween alcohol and weight. Experimental studies were conducted in small samples andstudies were likely to be underpowered to detect intervention effects. Similarly, the longesttrial was conducted over ten weeks, possibly not long enough for group differences toemerge. An unclear relationship between alcohol and weight in observational evidencecan be partially explained by significant heterogeneity among studies i.e., differences inassessment of drinking behaviour, cut-offs for levels of drinking, cut offs for abdominalobesity. Most epidemiological evidence was obtained from cross-sectional studies whichcarry the inherent limitation of not being able to determine a cause-effect relationship. As-sessment of alcohol intake relies largely on self-report surveys e.g., Alcohol Use DisordersIdentification Test (AUDIT-C) [96]. While these measures have adequate psychometricproperties [97], they are prone to recall [98,99] and social desirability biases [100], andpeople tend to overestimate the amount of alcohol that constitutes a standard unit [101].Taken together, there is a real risk for alcohol intake to be underreported which reducesconfidence in studies’ findings. Recall methods e.g., the ‘Yesterday Method’—collectionof detailed information about alcohol consumed the previous day—are also more likely
170
Nutrients 2021, 13, 2927
to overestimate abstention [102]. Relating average alcohol intake at a single time pointe.g., units per week, may lead to spurious findings, particularly if drinking patterns (i.e.,binge) are not considered. Further, surveys may only capture current drinking behaviour,and ‘non-drinkers’ may include former drinkers who have previously experienced alcohol-related weight change; potentially reducing the validity of studies that compared drinkersto ‘non-drinkers’.
There is also the significant potential for various factors to confound the relationshipbetween alcohol and weight. Aside from the review by Bendsen et al. [41], others did notreport the extent to which included studies statistically adjusted for confounders. Particu-larly pertinent is the adjustment for physical activity which could mitigate alcohol-inducedenergy intake. Systematic reviews have found that alcohol intake is positively (linearlyor curvilinearly) associated with physical activity in young people, college-students, andthe general adult population [103,104]. A cohort study in US college students found thatweight motives mediated the positive relationship between heavy episodic drinking andvigorous (but not moderate) physical activity, suggesting that drinkers may engage inphysical activity to compensate for additional energy intake or neutralise alcohol-relatedharms in line with the compensatory health behaviours model [105]. In the weight loss RCTby Carels et al. [45], duration of exercise was greater on days that alcohol was consumed,and participants who consumed alcohol more frequently had higher energy expenditurethan those who drank less frequently. This may also explain why experimental studies infree-living participants found no relationship between alcohol and weight change. Anotherimportant confounding factor is ‘delayed’ dietary compensation. Studies in free-livingparticipants have shown that corrective dietary compensation in response to deviationsin daily energy intake was observed over a 24-hour period [12] and even up to three tofour days later [106]. Therefore, while alcohol intake can increase daily energy intake, thisadditional energy may be offset in the following days. Distinctly, dietary compensation canbe problematic when it manifests as ‘drunkorexia’ or ‘alcorexia’, characterised by dietaryrestriction, purging and/or excessive exercise to enable consumption of large quantities ofalcohol and avoid weight gain and/or enhance intoxication [107–110].
Regarding the effect of moderating variables, the collective evidence gleaned fromthe four previous reviews of observational evidence does not support the hypotheses thatdrink type or sex moderates the relationship between alcohol and weight. That the effect ofthese moderators was inconsistent is expected given the heterogeneity and limitations men-tioned previously. Notwithstanding these limitations, evidence of a J-shaped relationshipbetween alcohol intake and weight-related outcomes (such that the positive associationwas strongest for heavy/binge drinking) were relatively consistent and is feasible giventhe substantial amount of energy consumed during a binge drinking episode. In analy-ses of a large national sample from England and Scotland in 18–25 year olds, Albani andcolleagues [111] observed a significant positive association between alcohol consumptionand BMI observed at Very High levels of intake (>75% RDA energy) in men and High toVery High intakes (>50% RDA energy) in women; equating to >1875 calories (7838 kJ) and>1000 calories (4180 kJ), respectively. This is a substantial amount of energy and wouldrequire significant dietary restriction and/or increased physical activity to mitigate the riskof weight gain. Further, drinking intensity is socially patterned and heavy/binge drink-ing is more prevalent in deprived groups [112–114]; SEP may moderate the relationshipbetween heavy drinking and weight. This may be related to observations that those withlower SEP are more likely to engage in multiple health-risk behaviours (e.g., alcohol use,smoking, poor diet, lower physical activity) [115]. It is also suggested that heavy and/orbinge drinking is linked to other behaviours implicated in weight gain. For instance, bingedrinking is associated with impulsivity [116,117], which is also associated positively withenergy intake and snacking, and negatively associated with diet quality [117].
171
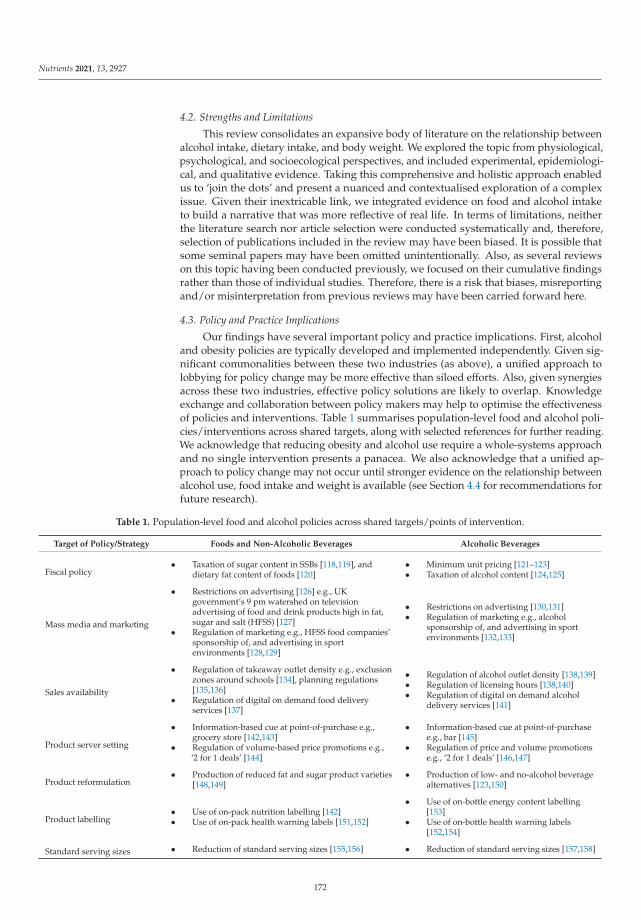
Nutrients 2021, 13, 2927
4.2. Strengths and Limitations
This review consolidates an expansive body of literature on the relationship betweenalcohol intake, dietary intake, and body weight. We explored the topic from physiological,psychological, and socioecological perspectives, and included experimental, epidemiologi-cal, and qualitative evidence. Taking this comprehensive and holistic approach enabledus to ‘join the dots’ and present a nuanced and contextualised exploration of a complexissue. Given their inextricable link, we integrated evidence on food and alcohol intaketo build a narrative that was more reflective of real life. In terms of limitations, neitherthe literature search nor article selection were conducted systematically and, therefore,selection of publications included in the review may have been biased. It is possible thatsome seminal papers may have been omitted unintentionally. Also, as several reviewson this topic having been conducted previously, we focused on their cumulative findingsrather than those of individual studies. Therefore, there is a risk that biases, misreportingand/or misinterpretation from previous reviews may have been carried forward here.
4.3. Policy and Practice Implications
Our findings have several important policy and practice implications. First, alcoholand obesity policies are typically developed and implemented independently. Given sig-nificant commonalities between these two industries (as above), a unified approach tolobbying for policy change may be more effective than siloed efforts. Also, given synergiesacross these two industries, effective policy solutions are likely to overlap. Knowledgeexchange and collaboration between policy makers may help to optimise the effectivenessof policies and interventions. Table 1 summarises population-level food and alcohol poli-cies/interventions across shared targets, along with selected references for further reading.We acknowledge that reducing obesity and alcohol use require a whole-systems approachand no single intervention presents a panacea. We also acknowledge that a unified ap-proach to policy change may not occur until stronger evidence on the relationship betweenalcohol use, food intake and weight is available (see Section 4.4 for recommendations forfuture research).
Table 1. Population-level food and alcohol policies across shared targets/points of intervention.
Target of Policy/Strategy Foods and Non-Alcoholic Beverages Alcoholic Beverages
Fiscal policy• Taxation of sugar content in SSBs [118,119], and
dietary fat content of foods [120]• Minimum unit pricing [121–123]• Taxation of alcohol content [124,125]
Mass media and marketing
• Restrictions on advertising [126] e.g., UKgovernment’s 9 pm watershed on televisionadvertising of food and drink products high in fat,sugar and salt (HFSS) [127]
• Regulation of marketing e.g., HFSS food companies’sponsorship of, and advertising in sportenvironments [128,129]
• Restrictions on advertising [130,131]• Regulation of marketing e.g., alcohol
sponsorship of, and advertising in sportenvironments [132,133]
Sales availability
• Regulation of takeaway outlet density e.g., exclusionzones around schools [134], planning regulations[135,136]
• Regulation of digital on demand food deliveryservices [137]
• Regulation of alcohol outlet density [138,139]• Regulation of licensing hours [138,140]• Regulation of digital on demand alcohol
delivery services [141]
Product server setting
• Information-based cue at point-of-purchase e.g.,grocery store [142,143]
• Regulation of volume-based price promotions e.g.,‘2 for 1 deals’ [144]
• Information-based cue at point-of-purchasee.g., bar [145]
• Regulation of price and volume promotionse.g., ‘2 for 1 deals’ [146,147]
Product reformulation• Production of reduced fat and sugar product varieties
[148,149]• Production of low- and no-alcohol beverage
alternatives [123,150]
Product labelling• Use of on-pack nutrition labelling [142]• Use of on-pack health warning labels [151,152]
• Use of on-bottle energy content labelling[153]
• Use of on-bottle health warning labels[152,154]
Standard serving sizes • Reduction of standard serving sizes [155,156] • Reduction of standard serving sizes [157,158]
172
Nutrients 2021, 13, 2927
Second, there are only a handful of studies examining strategies that specifically aimto reduce energy intake from alcohol. Evidence of the effect of product reformulationstrategies i.e., low- and no-alcohol drinks, is limited. A recent study found that low-alcohol products are perceived to target non-traditional consumers (pregnant women) andoccasions (weekday lunchtimes), suggesting potential challenges to their uptake [159]. In arecent systematic review and meta-analysis, Robinson et al. [153] found moderate evidencethat consumers are unaware of the energy content of alcoholic drinks, and that consumerssupport energy labelling. However, most studies found no effect of energy-labelling onactual or intended alcohol consumption; studies were generally of poor methodologicalquality and none were conducted in a real-life setting. Displaying the energy content ofalcohol may result in complex public health messaging and disordered ‘drunkorexia’ or‘alcorexia’ behaviours e.g., binge drinking, restriction of dietary intake/purging. Thesebehaviours increase the likelihood of intoxication, result in blood alcohol levels risingsharply affecting the brain and subsequent behaviour, which in turn steeply increases therisk of acute harm such as from accidents. Some [160–162] but not all [163] studies suggestthat such weight control behaviours are particularly prevalent amongst females and canlead to wider repercussions for health and wellbeing. For example, amongst UK women,consumption of alcohol without food is associated with higher risk of liver cirrhosis [164].Meanwhile, in a prospective cohort study of UK Biobank (UKB) participants, Jani et al. [165]found a 10% higher risk of mortality with alcohol drinking without food compared toalcohol drinking with food amongst 38–73 year-olds.
Third, policy and practice strategies are more challenging to implement in marginalisedor at-risk populations, such as those in alcohol recovery or experiencing homelessness orfood-insecurity. Here, the evidence-base becomes sparser, with a small pool of quantitativeresearch and a dearth of qualitative data. Again, most studies do not focus explicitly onthis relationship in marginalised/at risk groups; usually this is discussed in the contextof wider aims/objectives or with one product given a peripheral mention in the contextof the other. Thus, Puddephatt et al. [166] found that a small minority of UK food bankclients reported using alcohol and other illicit substances to suppress hunger and to copewith the stress of their access to food. Meanwhile, Reitzel et al. [167] identified that, amongUS homeless adults, 28.4% of the sample had probable alcohol dependence, 25% wereheavy drinkers, and 78.4% were food insecure. Further, heavy drinking and probablealcohol dependence/abuse were each associated with increased odds of food insecurity.Similar associations were identified by Bergmans et al. [168]. Tan and Johns [169] didspecifically focus on the links between alcohol use and eating disorders amongst thosealcohol dependent or in early recovery, and found the ‘alcohol wheel’ to be triggering forthose more susceptible to an eating disorder in alcohol services. Further, Thomson andPaudel (2018) highlight the possibility of addiction swap (substitution of sugar for alcoholaddiction) for those in alcohol recovery.
4.4. Future Research
Despite no shortage of observational research, the relationship between alcohol andweight remains uncertain. To genuinely improve our understanding of this relationship,rather than gratuitously generating further cross-sectional analyses, resources should beprioritised for research that uses innovative methodologies to make a novel and meaningfulcontribution to the literature, and that considers the complexities of the relationship andimportant variables linking food and alcohol consumption (regular drinking pattern andprevious drinking status, physical activity levels, personality traits, health motives, SEP).Rather than examining the relationship of alcohol intake and weight which may be anoversimplification even with statistical adjustment, a latent class analysis may be moreilluminating, given that weight-related behaviours and food/beverage consumption pat-terns tend to cluster. Methodologies that sample behaviour in the field such as ecologicalmomentary assessment (EMA) [170] or diary studies [106] that are conducted over severalweeks would provide valuable, richly detailed data on alcohol use and energy balance
173
Nutrients 2021, 13, 2927
behaviours in real life. Similarly, more qualitative work is needed to improve our under-standing around consumers’ knowledge, perceptions and attitudes regarding alcohol, food,weight, and weight-related behaviours across the life course. This would help to identifyand develop targeted interventions that are informed by real life experiences. Also, youthalcohol consumption has declined steadily and significantly over the last 15 years in manyhigh-income countries including the UK, with those young people who do drink startingto do so at a later age, less often and in smaller quantities [171,172]. What, then, are theimplications of this on eating behaviours and body weight? How consumers use no- andlow-alcohol products requires further research i.e., who uses them, how are they used andfor what reasons, are they substitutive or additive to the whole diet, what are facilitatorsand barriers to their uptake, do they lead to self-licensing (e.g., I had a low-alcohol beer,therefore, I can eat more chips). More generally, all future research must adequately repre-sent people from marginalised and disadvantaged communities who are disproportionallyaffected by alcohol misuse and obesity.
5. Conclusions
Alcohol appears to increase food and energy intake within a drinking episode, andthis energy increases daily energy intake. However, as with other research that attemptsto disentangle the relationship of weight with a single nutrient/food/beverage/meal,evidence is equivocal and does not support a fully consistent relationship. Most evidence isderived from cross-sectional survey data and is limited by methodological weaknesses andheterogeneity. That the evidence remains uncertain despite no shortage of observationalresearch indicates that more nuanced analyses and creative research methodologies areneeded to capture what is clearly a complex and dynamic relationship. To meaningfullyadvance our understanding of the relationship between alcohol, food and weight, futureresearch must account for relevant behaviours and variables and, importantly, how theycluster with patterns of alcohol intake e.g., binge drinking, and how they shift across thelife course. Qualitative work and sampling weight-related behaviour and alcohol use inthe field (e.g., using EMA protocols or diary studies) would add much needed richness andnuance to the literature. Given synergies between ‘Big Food’ and ‘Big Alcohol’ industries,effective policy solutions are likely to overlap and a unified approach to policy change maybe more effective than isolated efforts. However, joint action may not occur until strongerevidence on the relationship between alcohol intake, food intake and weight is established.
Author Contributions: M.F. and S.S.: determined the direction of the review, designed the searchstrategy, conducted the literature search, synthesised search results, appraised the evidence, anddrafted and refined the manuscript. A.A., E.K., V.A.: critically reviewed the manuscript. All authorshave read and agreed to the published version of the manuscript.
Funding: This research received no external funding.
Institutional Review Board Statement: Not applicable.
Informed Consent Statement: Not applicable.
Data Availability Statement: Not applicable.
Acknowledgments: This research is supported by the National Institute of Health Research (NIHR)Applied Research Collaboration (ARC) for the North East and North Cumbria (NENC). The NationalInstitute for Health Research (NIHR) is the nation’s largest funder of health and care research andprovides the people, facilities and technology that enables research to thrive. Find out more aboutthe NIHR.
Conflicts of Interest: The authors declare no conflict of interest.
174
Nutrients 2021, 13, 2927
References
1. World Health Organisation. Overweight and Obesity 2021. Available online: https://www.who.int/news-room/fact-sheets/detail/obesity-and-overweight (accessed on 2 April 2021).
2. Office for National Statistics. Adult Drinking Habits in Great Britain 2018. Available online: https://www.ons.gov.uk/peoplepopulationandcommunity/healthandsocialcare/drugusealcoholandsmoking/datasets/adultdrinkinghabits (accessed on7 June 2021).
3. Burgoine, T.; Forouhi, N.G.; Griffin, S.J.; Brage, S.; Wareham, N.J.; Monsivais, P. Does neighborhood fast-food outlet exposureamplify inequalities in diet and obesity? A cross-sectional study. Am. J. Clin. Nutr. 2016, 103, 1540–1547. [CrossRef] [PubMed]
4. Katikireddi, S.V.; Whitley, E.; Lewsey, J.; Gray, L.; Leyland, A.H. Socioeconomic status as an effect modifier of alcohol consumptionand harm: Analysis of linked cohort data. Lancet Public Health 2017, 2, e267–e276. [CrossRef]
5. Dai, H.; Alsalhe, T.A.; Chalghaf, N.; Riccò, M.; Bragazzi, N.L.; Wu, J. The global burden of disease attributable to high bodymass index in 195 countries and territories, 1990–2017: An analysis of the Global Burden of Disease Study. PLoS Med. 2020, 17,e1003198. [CrossRef]
6. Boyd, J.; Bambra, C.; Purshouse, R.C.; Holmes, J. Beyond Behaviour: How Health Inequality Theory Can Enhance Our Under-standing of the ‘Alcohol-Harm Paradox’. Int. J. Environ. Res. Public Health 2021, 18, 6025. [CrossRef]
7. Beard, E.; Brown, J.; West, R.; Angus, C.; Brennan, A.; Holmes, J.; Kaner, E.; Meier, P.; Michie, S. Deconstructing the Alcohol HarmParadox: A Population Based Survey of Adults in England. PLoS ONE 2016, 11, e0160666. [CrossRef]
8. Mourao, D.M.; Bressan, J.; Campbell, W.W.; Mattes, R.D. Effects of food form on appetite and energy intake in lean and obeseyoung adults. Int. J. Obes. 2007, 31, 1688–1695. [CrossRef]
9. Houchins, J.A.; Tan, S.Y.; Campbell, W.W.; Mattes, R.D. Effects of fruit and vegetable, consumed in solid vs beverage forms, onacute and chronic appetitive responses in lean and obese adults. Int. J. Obes. 2012, 37, 1109–1115. [CrossRef] [PubMed]
10. Wiessing, K.R.; Xin, L.; Budgett, S.C.; Poppitt, S.D. No evidence of enhanced satiety following whey protein- or sucrose-enrichedwater beverages: A dose response trial in overweight women. Eur. J. Clin. Nutr. 2015, 69, 1238–1243. [CrossRef] [PubMed]
11. Fong, M.; Li, A.; Hill, A.J.; Cunich, M.; Skilton, M.R.; Madigan, C.D.; Caterson, I.D. Modelling the Association between Core andDiscretionary Energy Intake in Adults with and without Obesity. Nutrients 2019, 11, 683. [CrossRef]
12. McKiernan, F.; Hollis, J.; Mattes, R. Short-term dietary compensation in free-living adults. Physiol. Behav. 2008, 93, 975–983.[CrossRef] [PubMed]
13. Arif, A.A.; Rohrer, J.E. Patterns of alcohol drinking and its association with obesity: Data from the third national health andnutrition examination survey, 1988–1994. BMC Public Health 2005, 5, 126. [CrossRef]
14. Public Health England. National Diet and Nutrition Survey (NDNS) from Years 1 to 9: Data Tables 201. Available online:https://www.gov.uk/government/statistics/ndns-time-trend-and-income-analyses-for-years-1-to-9 (accessed on 7 June 2021).
15. Hill, J.O.; Wyatt, H.R.; Reed, G.W.; Peters, J.C. Obesity and the environment: Where do we go from here? Science 2003, 299,853–855. [CrossRef] [PubMed]
16. Sozio, M.; Crabb, D.W. Alcohol and lipid metabolism. Am. J. Physiol. Endocrinol. Metab. 2008, 295, E10–E16. [CrossRef]17. Yeomans, M.R. Alcohol, appetite and energy balance: Is alcohol intake a risk factor for obesity? Physiol. Behav. 2010, 100, 82–89.
[CrossRef]18. Traversy, G.; Chaput, J.-P. Alcohol Consumption and Obesity: An Update. Curr. Obes. Rep. 2015, 4, 122–130. [CrossRef] [PubMed]19. Erol, A.; Karpyak, V.M. Sex and gender-related differences in alcohol use and its consequences: Contemporary knowledge and
future research considerations. Drug Alcohol Depend. 2015, 156, 1–13. [CrossRef] [PubMed]20. Wilsnack, R.W.; Wilsnack, S.C. Gender and Alcohol: Consumption and Consequences. Alcohol: Science, Policy, and Public Health; Oxford
University Press: New York, NY, USA, 2013; pp. 153–160.21. Baraona, E.; Abittan, C.S.; Dohmen, K.; Moretti, M.; Pozzato, G.; Chayes, Z.W.; Schaefer, C.; Lieber, C.S. Gender differences in
pharmacokinetics of alcohol. Alcohol Clin. Exp. Res. 2001, 25, 502–507. [CrossRef] [PubMed]22. Thomasson, H.R. Gender Differences in Alcohol Metabolism. In Recent Developments in Alcoholism; Springer: Boston, MA, USA,
2002; Volume 12.23. Fone, D.L.; Farewell, D.; White, J.; Lyons, R.A.; Dunstan, F.D. Socioeconomic patterning of excess alcohol consumption and
binge drinking: A cross-sectional study of multilevel associations with neighbourhood deprivation. BMJ Open 2013, 3, e002337.[CrossRef] [PubMed]
24. Beard, E.; Brown, J.; West, R.; Kaner, E.; Meier, P.; Michie, S. Associations between socio-economic factors and alcohol con-sumption: A population survey of adults in England. PLoS ONE 2019, 14, e0209442.
25. Scott, S.; Shucksmith, J.; Baker, R.; Kaner, E. ‘Hidden Habitus’: A Qualitative Study of Socio-Ecological Influences on DrinkingPractices and Social Identity in Mid-Adolescence. Int. J. Environ. Res. Public Health 2017, 14, 611. [CrossRef]
26. Brierley-Jones, L.; Ling, J.; McCabe, K.E.; Wilson, G.B.; Crosland, A.; Kaner, E.F.; Haighton, C.A. Habitus of home and traditionaldrinking: A qualitative analysis of reported middle-class alcohol use. Soc. Health Illn. 2014, 36, 1054–1076. [CrossRef] [PubMed]
27. Sánchez-Villegas, A.; Toledo, E.; Bes-Rastrollo, M.; Martín-Moreno, J.; Tortosa, A.; Martinez-Gonzalez, M.A. Association betweendietary and beverage consumption patterns in the SUN (Seguimiento Universidad de Navarra) cohort study. Public Health Nutr.2008, 12, 351–358. [CrossRef] [PubMed]
28. Ruidavets, J.-B.; Bataille, V.; Dallongeville, J.; Simon, C.; Bingham, A.; Amouyel, P.; Arveiler, M.; Ducimetière, P.; Ferrières, J.Alcohol intake and diet in France, the prominent role of lifestyle. Eur. Heart J. 2004, 25, 1153–1162. [CrossRef]
175
Nutrients 2021, 13, 2927
29. De Timary, P.; Cani, P.D.; Duchemin, J.; Neyrinck, A.M.; Gihousse, D.; Laterre, P.-F.; Badaoui, A.; Leclercq, S.; Delzenne, N.M.;Stärkel, P. The loss of metabolic control on alcohol drinking in heavy drinking alcohol-dependent subjects. PLoS ONE 2012, 7,e38682. [CrossRef]
30. Ross, L.J.; Wilson, M.; Banks, M.; Rezannah, F.; Daglish, M. Prevalence of malnutrition and nutritional risk factors in patientsundergoing alcohol and drug treatment. Nutrition 2012, 28, 738–743. [CrossRef] [PubMed]
31. Kwok, A.; Dordevic, A.L.; Paton, G.; Page, M.J.; Truby, H. Effect of alcohol consumption on food energy intake: A systematicreview and meta-analysis. Br. J. Nutr. 2019, 121, 481–495. [CrossRef]
32. Grech, A.; Rangan, A.; Allman-Farinelli, M. Increases in Alcohol Intakes Are Concurrent with Higher Energy Intakes: Trends inAlcohol Consumption in Australian National Surveys from 1983, 1995 and 2012. Nutrients 2017, 9, 944. [CrossRef] [PubMed]
33. Ebbeling, C.B.; Swain, J.F.; Feldman, H.A.; Wong, W.W.; Hachey, D.L.; Garcia-Lago, E.; Ludwig, D.S. Effects of Dietary Compositionon Energy Expenditure During Weight-Loss Maintenance. JAMA 2012, 307, 2627–2634. [CrossRef] [PubMed]
34. Cummings, J.R.; Gearhardt, A.N.; Ray, L.A.; Choi, A.K.; Tomiyama, A.J. Experimental and observational studies on alcohol useand dietary intake: A systematic review. Obes Rev. 2020, 21, e12950. [CrossRef] [PubMed]
35. Parekh, N.; Lin, Y.; Chan, M.; Juul, F.; Makarem, N. Longitudinal dimensions of alcohol consumption and dietary intake in theFramingham Heart Study Offspring Cohort (1971–2008). Br. J. Nutr. 2020, 125, 685–694. [CrossRef] [PubMed]
36. Beulens, J.W.; van Beers, R.M.; Stolk, R.P.; Schaafsma, G.; Hendriks, H.F. The effect of moderate alcohol consumption on fatdis-tribution and adipocytokines. Obesity 2006, 14, 60–66. [CrossRef]
37. Cordain, L.; Bryan, E.D.; Melby, C.L.; Smith, M.J. Influence of moderate daily wine consumption on body weight regulation andmetabolism in healthy free-living males. J. Am. Coll. Nutr. 1997, 16, 134–139. [CrossRef] [PubMed]
38. Cordain, L.; Melby, C.L.; Hamamoto, A.E.; O’Neill, D.; Cornier, M.-A.; Barakat, H.A.; Israel, R.G.; Hill, J.O. Influence of moderatechronic wine consumption on insulin sensitivity and other correlates of syndrome X in moderately obese women. Metabolism2000, 49, 1473–1478. [CrossRef] [PubMed]
39. Sayon-Orea, C.; Martinez-Gonzalez, M.A.; Bes-Rastrollo, M. Alcohol consumption and body weight: A systematic review. Nutr.Rev. 2011, 69, 419–431. [CrossRef] [PubMed]
40. Shelton, N.J.; Knott, C.S. Association Between Alcohol Calorie Intake and Overweight and Obesity in English Adults. Am. J.Public Health 2014, 104, 629–631. [CrossRef]
41. Bendsen, N.T.; Christensen, R.; Bartels, E.M.; Kok, F.J.; Sierksma, A.; Raben, A.; Astrup, A. Is beer consumption related tomeasures of abdominal and general obesity? A systematic review and meta-analysis. Nutr. Rev. 2012, 71, 67–87. [CrossRef]
42. Golzarand, M.; Salari-Moghaddam, A.; Mirmiran, P. Association between alcohol intake and overweight and obesity: Asys-tematic review and dose-response meta-analysis of 127 observational studies. Crit. Rev. Food Sci. Nutr. 2021, 1–21. [CrossRef]
43. Guyatt, G.H.; Oxman, A.D.; Vist, G.E.; Kunz, R.; Falck-Ytter, Y.; Alonso-Coello, P.; Schünemann, H.J. GRADE: An emergingconsensus on rating quality of evidence and strength of recommendations. BMJ 2008, 336, 924–926. [CrossRef]
44. Flechtner-Mors, M.; Biesalski, H.K.; Jenkinson, C.P.; Adler, G.; Ditschuneit, H.H. Effects of moderate consumption of white wineon weight loss in overweight and obese subjects. Int. J. Obes. 2004, 28, 1420–1426. [CrossRef]
45. Carels, R.A.; Young, K.M.; Coit, C.; Clayton, A.M.; Spencer, A.; Wagner, M. Skipping meals and alcohol consumption: Theregulation of energy intake and expenditure among weight loss participants. Appetite 2008, 51, 538–545. [CrossRef]
46. Chao, A.M.; Wadden, T.A.; Tronieri, J.S.; Berkowitz, R.I. Alcohol Intake and Weight Loss During Intensive Lifestyle Interventionfor Adults with Overweight or Obesity and Diabetes. Obesity 2018, 27, 30–40. [CrossRef]
47. Kase, C.A.; Piers, A.D.; Schaumberg, K.; Forman, E.M.; Butryn, M.L. The relationship of alcohol use to weight loss in the contextof behavioral weight loss treatment. Appetite 2016, 99, 105–111. [CrossRef]
48. Eiler, W.J., 2nd; Džemidžic, M.; Case, K.R.; Soeurt, C.M.; Armstrong, C.L.; Mattes, R.D.; O’Connor, S.J.; Harezlak, J.; Acton, A.J.;Considine, R.V.; et al. The apéritif effect: Alcohol’s effects on the brain’s response to food aromas in women. Obesity 2015, 23,1386–1393. [CrossRef]
49. Koopmann, A.; Schuster, R.; Kiefer, F. The impact of the appetite-regulating, orexigenic peptide ghrelin on alcohol use disorders:A systematic review of preclinical and clinical data. Biol. Psychol. 2016, 131, 14–30. [CrossRef]
50. Rose, A.; Hardman, C.; Christiansen, P. The effects of a priming dose of alcohol and drinking environment on snack food intake.Appetite 2015, 95, 341–348. [CrossRef] [PubMed]
51. Mattes, R.D.; Campbell, W.W. Effects of Food Form and Timing of Ingestion on Appetite and Energy Intake in Lean Young Adultsand in Young Adults with Obesity. J. Am. Diet Assoc. 2009, 109, 430–437. [CrossRef]
52. Glasbrenner, B.; Pieramico, O.; Brecht-Krau, D.; Baur, M.; Malfertheiner, P. Gastric emptying of solids and liquids in obesity. J.Mol. Med. 1993, 71. [CrossRef]
53. Hoad, C.; Rayment, P.; Spiller, R.C.; Marciani, L.; Alonso, B.D.C.; Traynor, C.; Mela, D.; Peters, H.P.F.; Gowland, P.A. In VivoImaging of Intragastric Gelation and Its Effect on Satiety in Humans. J. Nutr. 2004, 134, 2293–2300. [CrossRef] [PubMed]
54. Lavin, J.; French, S.; Ruxton, C.; Read, N. An investigation of the role of oro-sensory stimulation in sugar satiety? Int. J. Obes.2002, 26, 384–388. [CrossRef]
55. French, S.J.; Cecil, J.E. Oral, gastric and intestinal influences on human feeding. Physiol. Behav. 2001, 74, 729–734. [CrossRef]56. Cassady, B.A.; Considine, R.V.; Mattes, R.D. Beverage consumption, appetite, and energy intake: What did you expect? Am. J.
Clin. Nutr. 2012, 95, 587–593. [CrossRef] [PubMed]
176
Nutrients 2021, 13, 2927
57. Leidy, H.J.; Apolzan, J.; Mattes, R.D.; Campbell, W.W. Food Form and Portion Size Affect Postprandial Appetite Sensations andHormonal Responses in Healthy, Nonobese, Older Adults. Obesity 2010, 18, 293–299. [CrossRef] [PubMed]
58. DiMeglio, D.; Mattes, R. Liquid versus solid carbohydrate: Effects on food intake and body weight. Int. J. Obes. 2000, 24, 794–800.[CrossRef] [PubMed]
59. Diamond, A. Executive Functions. Ann. Rev. Psychol. 2013, 64, 135–168. [CrossRef]60. Field, M.; Wiers, R.; Christiansen, P.; Fillmore, M.T.; Verster, J.C. Acute Alcohol Effects on Inhibitory Control and Implicit
Cognition: Implications for Loss of Control Over Drinking. Alcohol. Clin. Exp. Res. 2010, 34, 1346–1352. [CrossRef]61. Christiansen, P.; Rose, A.; Randall-Smith, L.; Hardman, C.A. Alcohol’s acute effect on food intake is mediated by inhibitory
control impairments. Health Psychol. 2016, 35, 518–522. [CrossRef]62. Caton, S.J.; Nolan, L.J.; Hetherington, M.M. Alcohol, Appetite and Loss of Restraint. Curr. Obes. Rep. 2015, 4, 99–105. [CrossRef]63. Luce, K.H.; Crowther, J.H.; Leahey, T.; Buchholz, L.J. Do restrained eaters restrict their caloric intake prior to drinking alcohol?
Eat Behav. 2013, 14, 361–365. [CrossRef]64. Jones, A.; Robinson, E.; Duckworth, J.; Kersbergen, I.; Clarke, N.; Field, M. The effects of exposure to appetitive cues on inhibitory
control: A meta-analytic investigation. Appetite 2018, 128, 271–282. [CrossRef]65. Schrieks, I.C.; Stafleu, A.; Griffioen-Roose, S.; de Graaf, C.; Witkamp, R.; Boerrigter-Rijneveld, R.; Hendriks, H.F. Moderate alcohol
consumption stimulates food intake and food reward of savoury foods. Appetite 2015, 89, 77–83. [CrossRef]66. Gough, T.; Christiansen, P.; Rose, A.K.; Hardman, C.A. The effect of alcohol on food-related attentional bias, food reward and
intake: Two experimental studies. Appetite 2021, 162, 105173. [CrossRef]67. Castellanos, E.H.; Charboneau, E.; Dietrich, M.S.; Park, S.; Bradley, B.; Mogg, K.; Cowan, R.L. Obese adults have visual attention
bias for food cue images: Evidence for altered reward system function. Int. J. Obes. 2009, 33, 1063–1073. [CrossRef] [PubMed]68. Adams, S.; Wijk, E. Effects of Acute Alcohol Consumption on Food Intake and Pictorial Stroop Response to High-Calorie Food
Cues. Alcohol Alcohol. 2020, 56, 275–283. [CrossRef] [PubMed]69. Monem, R.; Fillmore, M.T. Alcohol administration reduces attentional bias to alcohol-related but not food-related cues: Evi-dence
for a satiety hypothesis. Psychol. Addict. Behav. 2019, 33, 677–684. [CrossRef]70. Karyadi, K.A.; Cyders, M.A. Preliminary support for the role of alcohol cues in food cravings and attentional biases. J. Health
Psychol. 2017, 24, 812–822. [CrossRef]71. Scott, S.; Elamin, W.; Giles, E.L.; Hillier-Brown, F.; Byrnes, K.; Connor, N.; Newbury-Birch, D.; Ells, L. Socio-Ecological Influences
on Adolescent (Aged 10–17) Alcohol Use and Unhealthy Eating Behaviours: A Systematic Review and Synthesis of QualitativeStudies. Nutrients 2019, 11, 1914. [CrossRef] [PubMed]
72. Scott, S.; Muir, C.; Stead, M.; Fitzgerald, N.; Kaner, E.; Bradley, J.; Wrieden, W.; Power, C.; Adamson, A. Exploring the linksbetween unhealthy eating behaviour and heavy alcohol use in the social, emotional and cultural lives of young adults (aged18–25): A qualitative research study. Appetite 2019, 144, 104449. [CrossRef] [PubMed]
73. Nelson, M.C.; Kocos, R.; Lytle, L.A.; Perry, C.L. Understanding the Perceived Determinants of Weight-related Behaviors in LateAdolescence: A Qualitative Analysis among College Youth. J. Nutr. Educ. Behav. 2009, 41, 287–292. [CrossRef]
74. Ayuka, F.; Barnett, R.; Pearce, J. Neighbourhood availability of alcohol outlets and hazardous alcohol consumption in NewZealand. Health Place 2014, 29, 186–199. [CrossRef]
75. Weitzman, E.R.; Folkman, A.; Folkman, M.K.L.; Wechsler, H. The relationship of alcohol outlet density to heavy and frequentdrinking and drinking-related problems among college students at eight universities. Health Place 2002, 9, 1–6. [CrossRef]
76. Burgoine, T.; Sarkar, C.; Webster, C.J.; Monsivais, P. Examining the interaction of fast-food outlet exposure and income on dietand obesity: Evidence from 51,361 UK Biobank participants. Int. J. Behav. Nutr. Phys. Activity 2018, 15, 71. [CrossRef] [PubMed]
77. Maguire, E.R.; Burgoine, T.; Monsivais, P. Area deprivation and the food environment over time: A repeated cross-sectional studyon takeaway outlet density and supermarket presence in Norfolk, UK, 1990–2008. Health Place 2015, 33, 142–147. [CrossRef][PubMed]
78. Public Health England. Obesity and the Environment. Density of Fast Food Outlets at 31 December 2017. Available on-line: https://assets.publishing.service.gov.uk/government/uploads/system/uploads/attachment_data/file/741555/Fast_Food_map.pdf (accessed on 23 July 2021).
79. Berke, E.M.; Tanski, S.E.; Demidenko, E.; Alford-Teaster, J.; Shi, X.; Sargent, J.D. Alcohol Retail Density and DemographicPredictors of Health Disparities: A Geographic Analysis. Am. J. Public Health 2010, 100, 1967–1971. [CrossRef]
80. Huckle, T.; Parker, K.; Romeo, J.S.; Casswell, S. Online alcohol delivery is associated with heavier drinking during the first NewZealand COVID -19 pandemic restrictions. Drug Alcohol Rev. 2020, 40, 826–834. [CrossRef] [PubMed]
81. Mojica-Perez, Y.; Callinan, S.; Livingston, M. Alcohol Home Delivery Services: An Investigation of Use and Risk 2019. Availableonline: https://fare.org.au/wp-content/uploads/Alcohol-home-delivery-services.pdf (accessed on 23 July 2021).
82. Keeble, M.; Adams, J.; Sacks, G.; Vanderlee, L.; White, C.M.; Hammond, D.; Burgoine, T. Use of Online Food Delivery Services toOrder Food Prepared Away-From-Home and Associated Sociodemographic Characteristics: A Cross-Sectional, Multi-CountryAnalysis. Int. J. Environ. Res. Public Health 2020, 17, 5190. [CrossRef]
83. NHS Digital. Expenditure and Affordability 2020. Available online: https://digital.nhs.uk/data-and-information/publications/statistical/statistics-on-alcohol/2020/part-7 (accessed on 23 July 2021).
84. Alcohol Health Alliance. Small Change: Alcohol at Pocket Money Prices. AHA Pricing Survey. 2020. Available online:https://ahauk.org/wp-content/uploads/2021/04/Small-change-Final-04_2021-compressed.pdf (accessed on 23 July 2021).
177
Nutrients 2021, 13, 2927
85. Petticrew, M.; Maani, N.; Pettigrew, L.; Rutter, H.; VAN Schalkwyk, M.C. Dark Nudges and Sludge in Big Alcohol: BehavioralEconomics, Cognitive Biases, and Alcohol Industry Corporate Social Responsibility. Milbank Q. 2020, 98, 1290–1328. [CrossRef]
86. Smith, R.; Kelly, B.; Yeatman, H.; Boyland, E. Food Marketing Influences Children’s Attitudes, Preferences and Consumption: ASystematic Critical Review. Nutrients 2019, 11, 875. [CrossRef]
87. Viacava, K.R.; Weydmann, G.J.; De Vasconcelos, M.F.; Jaboinski, J.; Batista, G.D.; De Almeida, R.M.M.; Bizarro, L. It is pleasantand heavy: Convergence of visual contents in tobacco, alcohol and food marketing in Brazil. Health Promot. Int. 2015, 31, 674–683.[CrossRef]
88. Miller, D.; Harkins, C. Corporate strategy, corporate capture: Food and alcohol industry lobbying and public health. Crit. Soc.Policy 2010, 30, 564–589. [CrossRef]
89. Livonen, K. Defensive responses to strategic sustainability paradoxes: Have your coke and drink it too! J. Bus. Ethics 2018, 148,309–327. [CrossRef]
90. Rinaldi, C.; van Schalkwyk, M.C.; Egan, M.; Petticrew, M. A Framing Analysis of Consultation Submissions on the WHO GlobalStrategy to Reduce the Harmful Use of Alcohol: Values and Interests. Int. J. Health Policy Manag. 2021, in press. [CrossRef]
91. Campbell, N.; Mialon, M.; Reilly, K.; Browne, S.; Finucane, F.M. How are frames generated? Insights from the industry lobbyagainst the sugar tax in Ireland. Soc. Sci. Med. 2020, 264, 113215. [CrossRef]
92. Lauber, K.; Ralston, R.; Mialon, M.; Carriedo, A.; Gilmore, A. Non-communicable disease governance in the era of the sustainabledevelopment goals: A qualitative analysis of food industry framing in WHO consultations. Glob. Health 2020, 16, 76. [CrossRef]
93. Petticrew, M.; Katikireddi, S.V.; Knai, C.; Cassidy, R.; Maani Hessari, N.; Thomas, J.; Weishaar, H. Nothing can be done until eve-rything is done: The use of complexity arguments by food, beverage, alcohol and gambling industries. J. Epidemiol. CommunityHealth 2017, 71, 1078–1083.
94. Martino, F.; Brooks, R.; Browne, J.; Carah, N.; Zorbas, C.; Corben, K.; Saleeba, E.; Martin, J.; Peeters, A.; Backholer, K. The Natureand Extent of Online Marketing by Big Food and Big Alcohol During the COVID-19 Pandemic in Australia: Content AnalysisStudy. JMIR Public Health Surveill. 2021, 7, e25202. [CrossRef]
95. Schoenmakers, T.; Wiers, R. Craving and Attentional Bias Respond Differently to Alcohol Priming: A Field Study in the Pub. Eur.Addict. Res. 2010, 16, 9–16. [CrossRef]
96. Bush, K.; Kivlahan, D.R.; McDonell, M.B.; Fihn, S.D.; Bradley, K.A. The AUDIT Alcohol Consumption Questions (AUDIT-C) AnEffective Brief Screening Test for Problem Drinking. Arch. Intern. Med. 1998, 158, 1789–1795. [CrossRef]
97. McKenna, H.; Treanor, C.; O’Reilly, D.; Donnelly, M. Evaluation of the psychometric properties of self-reported measures ofalcohol consumption: A COSMIN systematic review. Subst. Abus. Treat. Prev. Policy 2018, 13, 6. [CrossRef]
98. Gmel, G.; Daeppen, J.B. Recall bias for seven-day recall measurement of alcohol consumption among emergency departmentpatients: Implications for case-crossover designs. J. Stud. Alcohol Drugs. 2007, 68, 303–310. [CrossRef]
99. Cherpitel, C.J.; Ye, Y.; Stockwell, T.; Vallance, K.; Chow, C. Recall bias across 7 days in self-reported alcohol consumption prior toinjury among emergency department patients. Drug Alcohol Rev. 2017, 37, 382–388. [CrossRef]
100. Davis, C.G.; Thake, J.; Vilhena, N. Social desirability biases in self-reported alcohol consumption and harms. Addict. Behav. 2010,35, 302–311. [CrossRef]
101. Devos-Comby, L.; Lange, J.E. My Drink is Larger than Yours? A Literature Review of Self-Defined Drink Sizes and StandardDrinks. Curr. Drug Abus. Rev. 2008, 1, 162–176. [CrossRef]
102. Gilligan, C.; Anderson, K.G.; Ladd, B.O.; Yong, Y.M.; David, M. Inaccuracies in survey reporting of alcohol consumption. BMCPublic Health 2019, 19, 1639. [CrossRef]
103. Dodge, T.; Clarke, P.; Dwan, R. The Relationship Between Physical Activity and Alcohol Use Among Adults in the United States.Am. J. Health Promot. 2016, 31, 97–108. [CrossRef] [PubMed]
104. Piazza-Gardner, A.K.; Barry, A.E. Examining physical activity levels and alcohol consumption: Are people who drink moreactive? Am. J. Health Promot. 2012, 26, e95–e104. [CrossRef]
105. Matley, F.A.I.; Davies, E.L. Resisting temptation: Alcohol specific self-efficacy mediates the impacts of compensatory healthbeliefs and behaviours on alcohol consumption. Psychol. Health Med. 2017, 23, 259–269. [CrossRef]
106. Bray, G.A.; Flatt, J.-P.; Volaufova, J.; Delany, J.P.; Champagne, C.M. Corrective responses in human food intake identified from ananalysis of 7-d food-intake records. Am. J. Clin. Nutr. 2008, 88, 1504–1510. [CrossRef] [PubMed]
107. Eisenberg, M.; Fitz, C.C. “Drunkorexia”: Exploring the Who and Why of a Disturbing Trend in College Students’ Eating andDrinking Behaviors. J. Am. Coll. Health 2014, 62, 570–577. [CrossRef]
108. Knight, A.; Castelnuovo, G.; Pietrabissa, G.; Manzoni, G.M.; Simpson, S. Drunkorexia: An Empirical Investigation amongAustralian Female University Students. Aust. Psychol. 2017, 52, 414–423. [CrossRef]
109. Lupi, M.; Martinotti, G.; Di Giannantonio, M. Drunkorexia: An emerging trend in young adults. Eat. Weight. Disord. Stud. Anorex.Bulim. Obes. 2017, 22, 619–622. [CrossRef]
110. Wilkerson, A.H.; Hackman, C.L.; Rush, S.E.; Usdan, S.L.; Smith, C.S. “Drunkorexia”: Understanding eating and physical activitybe-haviors of weight conscious drinkers in a sample of college students. J. Am. Coll. Health 2017, 65, 492–501. [CrossRef]
111. Albani, V.; Bradley, J.; Wrieden, W.L.; Scott, S.; Muir, C.; Power, C.; Fitzgerald, N.; Stead, M.; Kaner, E.; Adamson, A.J. ExaminingAssociations between Body Mass Index in 18–25 Year-Olds and Energy Intake from Alcohol: Findings from the Health Survey forEngland and the Scottish Health Survey. Nutrients 2018, 10, 1477. [CrossRef]
178
Nutrients 2021, 13, 2927
112. Thern, E.; Landberg, J. Understanding the differential effect of alcohol consumption on the relation between socio-economicposition and alcohol-related health problems: Results from the Stockholm Public Health Cohort. Addiction 2020, 116, 799–808.[CrossRef]
113. Boniface, S.; Lewer, D.; Hatch, S.; Goodwin, L. Associations between interrelated dimensions of socio-economic status, higher riskdrinking and mental health in South East London: A cross-sectional study. PLoS ONE 2020, 15, e0229093. [CrossRef] [PubMed]
114. Sadler, S.; Angus, C.; Gavens, L.; Gillespie, D.; Holmes, J.; Hamilton, J.; Brennan, A.; Meier, P. Understanding the alcoholharm paradox: An analysis of sex- and condition-specific hospital admissions by socio-economic group for alcohol-associatedconditions in England. Addiction 2017, 112, 808–817. [CrossRef]
115. Bellis, M.A.; Hughes, K.; Nicholls, J.; Sheron, N.; Gilmore, I.; Jones, L. The alcohol harm paradox: Using a national survey toexplore how alcohol may disproportionately impact health in deprived individuals. BMC Public Health 2016, 16, 111. [CrossRef][PubMed]
116. Adan, A.; Forero, D.; Navarro, J.F. Personality Traits Related to Binge Drinking: A Systematic Review. Front. Psychiatry 2017, 8,134. [CrossRef] [PubMed]
117. Bénard, M.; Bellisle, F.; Kesse-Guyot, E.; Julia, C.; Andreeva, V.A.; Etilé, F.; Reach, G.; Dechelotte, P.; Tavolacci, M.-P.; Hercberg, S.;et al. Impulsivity is associated with food intake, snacking, and eating disorders in a general population. Am. J. Clin. Nutr. 2018,109, 117–126. [CrossRef]
118. World Obesity. Sugar-Sweetened Beverage Tax: Systematic Reviews 2019. Available online: https://www.worldobesity.org/resources/policy-dossiers/pd-1/systematic-reviews (accessed on 23 July 2021).
119. World Obesity. Sugar-Sweetened Beverage Tax: Case Studies 2019. Available online: https://www.worldobesity.org/resources/policy-dossiers/pd-1/case-studies (accessed on 23 July 2021).
120. Lhachimi, S.K.; Pega, F.; Heise, T.L.; Fenton, C.; Gartlehner, G.; Griebler, U.; Sommer, I.; Bombana, M.; Katikireddi, S. Taxationof the fat content of foods for reducing their consumption and preventing obesity or other adverse health outcomes. CochraneDatabase Syst Rev. 2020, 9, CD012415. [CrossRef]
121. Boniface, S.; Scannell, J.W.; Marlow, S. Evidence for the effectiveness of minimum pricing of alcohol: A systematic review andassessment using the Bradford Hill criteria for causality. BMJ Open 2017, 7, e013497. [CrossRef]
122. Anderson, P.; O’Donnell, A.; Kaner, E.; Llopis, E.J.; Manthey, J.; Rehm, J. Impact of minimum unit pricing on alcohol purchases inScotland and Wales: Controlled interrupted time series analyses. Lancet Public Health 2021, 6, e557–e565. [CrossRef]
123. Llopis, E.J.; O’Donnell, A.; Anderson, P. Impact of price promotion, price, and minimum unit price on household purchases oflow and no alcohol beers and ciders: Descriptive analyses and interrupted time series analysis of purchase data from 70, 303British households, 2015–2018 and first half of 2020. Soc. Sci. Med. 2021, 270, 113690. [CrossRef] [PubMed]
124. Nelson, J.P.; McNall, A.D. Alcohol prices, taxes, and alcohol-related harms: A critical review of natural experiments in alcoholpolicy for nine countries. Health Policy 2016, 120, 264–272. [CrossRef] [PubMed]
125. Elder, R.W.; Lawrence, B.; Ferguson, A.; Naimi, T.; Brewer, R.D.; Chattopadhyay, S.K.; Toomey, T.L.; Fielding, J.E. The Effectivenessof Tax Policy Interventions for Reducing Excessive Alcohol Consumption and Related Harms. Am. J. Prev. Med. 2010, 38, 217–229.[CrossRef] [PubMed]
126. Boyland, E.J.; Nolan, S.N.; Kelly, B.; Tudur-Smith, C.; Jones, A.; Halford, J.C.; Robinson, E. Advertising as a cue to consume: Asystematic review and meta-analysis of the effects of acute exposure to unhealthy food and nonalcoholic beverage advertising onintake in children and adults. Am. J. Clin. Nutr. 2016, 103, 519–533. [CrossRef]
127. Obesity Health Alliance. The Need for a Comprehensive 9pm Watershed on All Junk Food Adverts Shown on All Types of Media2021. Available online: http://obesityhealthalliance.org.uk/wp-content/uploads/2019/03/The-need-for-a-comprehensive-9pm-watershed-Briefing.pdf (accessed on 23 July 2021).
128. Ireland, R.; Chambers, S.; Bunn, C. Exploring the relationship between Big Food corporations and professional sports clubs: Ascoping review. Public Health Nutr. 2019, 22, 1888–1897. [CrossRef]
129. Smith, M.; Signal, L.; Edwards, R.; Hoek, J. Children’s and parents’ opinions on the sport-related food environment: A systematicreview. Obes. Rev. 2017, 18, 1018–1039. [CrossRef]
130. Stautz, K.; Brown, K.G.; King, S.E.; Shemilt, I.; Marteau, T.M. Immediate effects of alcohol marketing communications and mediaportrayals on consumption and cognition: A systematic review and meta-analysis of experimental studies. BMC Public Health2016, 16, 465. [CrossRef]
131. Courtney, A.L.; Rapuano, K.M.; Sargent, J.D.; Heatherton, T.F.; Kelley, W.M. Reward System Activation in Response to AlcoholAdvertisements Predicts College Drinking. J. Stud Alcohol Drugs 2018, 79, 29–38. [CrossRef]
132. Westberg, K.; Stavros, C.; Smith, A.C.; Munro, G.; Argus, K. An examination of how alcohol brands use sport to engage consumerson social media. Drug Alcohol Rev. 2016, 37, 28–35. [CrossRef]
133. Jones, S. When does alcohol sponsorship of sport become sports sponsorship of alcohol? A case study of developments in sportin Australia. Int. J. Sports Mark. Spons. 2010, 11, 67–78. [CrossRef]
134. Williams, J.; Scarborough, P.; Matthews, A.; Cowburn, G.; Foster, C.; Roberts, N.; Rayner, M. A systematic review of the influenceof the retail food environment around schools on obesity-related outcomes. Obes. Rev. 2014, 15, 359–374. [CrossRef] [PubMed]
135. Keeble, M.; Burgoine, T.; White, M.; Summerbell, C.; Cummins, S.; Adams, J. How does local government use the planningsystem to regulate hot food takeaway outlets? A census of current practice in England using document review. Health Place 2019,57, 171–178. [CrossRef] [PubMed]
179
Nutrients 2021, 13, 2927
136. Keeble, M.; Adams, J.; White, M.; Summerbell, C.; Cummins, S.; Burgoine, T. Correlates of English local government use of theplanning system to regulate hot food takeaway outlets: A cross-sectional analysis. Int. J. Behav. Nutr. Phys. Act. 2019, 16, 127.[CrossRef] [PubMed]
137. Goffe, L.; Uwamahoro, N.S.; Dixon, C.J.; Blain, A.P.; Danielsen, J.; Kirk, D.; Adamson, A.J. Supporting a Healthier Takeaway MealChoice: Creating a Universal Health Rating for Online Takeaway Fast-Food Outlets. Int. J. Environ. Res. Public Health 2020, 17,9260. [CrossRef]
138. Popova, S.; Giesbrecht, N.; Bekmuradov, D.; Patra, J. Hours and Days of Sale and Density of Alcohol Outlets: Impacts on AlcoholConsumption and Damage: A Systematic Review. Alcohol Alcohol. 2009, 44, 500–516. [CrossRef]
139. Campbell, C.A.; Hahn, R.A.; Elder, R.; Brewer, R.; Chattopadhyay, S.; Fielding, J.; Naimi, T.; Toomey, T.; Lawrence, B.; Middleton,J.C. The Effectiveness of Limiting Alcohol Outlet Density as a Means of Reducing Excessive Alcohol Consumption and Alcohol-Related Harms. Am. J. Prev. Med. 2009, 37, 556–569. [CrossRef]
140. Hahn, R.A.; Kuzara, J.L.; Elder, R.; Brewer, R.; Chattopadhyay, S.; Fielding, J.; Naimi, T.S.; Toomey, T.; Middleton, J.C.; Lawrence,B. Effectiveness of policies restricting hours of alcohol sales in preventing excessive alcohol consumption and related harms. Am.J. Prev Med. 2010, 39, 590–604. [CrossRef]
141. Colbert, S.; Wilkinson, C.; Thornton, L.; Feng, X.; Richmond, R. Online alcohol sales and home delivery: An international policyreview and systematic literature review. Health Policy 2021, in press. [CrossRef]
142. Gupta, A.; Billich, N.; George, N.A.; Blake, M.R.; Huse, O.; Backholer, K.; Boelsen-Robinson, T.; Peeters, A. The effect of front-of-package labels or point-of-sale signage on consumer knowledge, attitudes and behavior regarding sugar-sweetened beverages: Asystematic review. Nutr. Rev. 2020, in press. [CrossRef]
143. Chan, J.; McMahon, E.; Brimblecombe, J. Point-of-sale nutrition information interventions in food retail stores to promote healthierfood purchase and intake: A systematic review. Obes. Rev. 2021, in press. [CrossRef]
144. Watt, T.L.S.; Beckert, W.; Smith, R.D.; Cornelsen, L. Reducing consumption of unhealthy foods and beverages through banningprice promotions: What is the evidence and will it work? Public Health Nutr. 2020, 23, 2228–2233. [CrossRef]
145. Carter, P.; Bignardi, G.; Hollands, J.; Marteau, T.M. Information-based cues at point of choice to change selection and consumptionof food, alcohol and tobacco products: A systematic review. BMC Public Health 2018, 18, 418. [CrossRef]
146. Meier, P.; Booth, A.; Stockwell, T.; Sutton, A.; Wilkerson, A.; Wong, R. Independent Review of the Effects of Alcohol Pricing andPromotion; University of Sheffield: Sheffield, UK, 2008.
147. Jackson, R.; Johnson, M.; Campbell, F.; Messina, J.; Guillaume, L.; Meier, P.; Goyder, E.; Chilcott, J.; Payne, N. Interventions onControl of Alcohol Price, Promotion and Availability for Prevention of Alcohol Use Disorders in Adults and Young People; University ofSheffield: Sheffield, UK, 2010.
148. Gressier, M.; Swinburn, B.; Frost, G.; Segal, A.B.; Sassi, F. What is the impact of food reformulation on individuals’ behaviour,nutrient intakes and health status? A systematic review of empirical evidence. Obes. Rev. 2020, 22, e13139. [CrossRef]
149. Hashem, K.M.; He, F.J.; A MacGregor, G. Effects of product reformulation on sugar intake and health—A systematic review andmeta-analysis. Nutr. Rev. 2019, 77, 181–196. [CrossRef]
150. Rehm, J.; Lachenmeier, D.W.; Llopis, E.J.; Imtiaz, S.; Anderson, P. Evidence of reducing ethanol content in beverages to reduceharmful use of alcohol. Lancet Gastroenterol. Hepatol. 2016, 1, 78–83. [CrossRef]
151. Rosenblatt, D.H.; Bode, S.; Dixon, H.; Murawski, C.; Summerell, P.; Ng, A.; Wakefield, M. Health warnings promote healthierdietary decision making: Effects of positive versus negative message framing and graphic versus text-based warnings. Appetite2018, 127, 280–288. [CrossRef] [PubMed]
152. Clarke, N.; Pechey, E.; Kosıte, D.; König, L.M.; Mantzari, E.; Blackwell, A.K.; Marteau, T.M.; Hollands, G.J. Impact of healthwarning labels on selection and consumption of food and alcohol products: Systematic review with meta-analysis. Health Psychol.Rev. 2020, 1–24. [CrossRef] [PubMed]
153. Robinson, E.; Humphreys, G.; Jones, A. Alcohol, calories, and obesity: A rapid systematic review and meta-analysis of consumerknowledge, support, and behavioral effects of energy labeling on alcoholic drinks. Obes Rev. 2021, 22, e13198. [CrossRef][PubMed]
154. Stautz, K.; Marteau, T.M. Viewing alcohol warning advertising reduces urges to drink in young adults: An online experiment.BMC Public Health 2016, 16, 530. [CrossRef] [PubMed]
155. Steenhuis, I.H.M.; Vermeer, W.M. Portion size: Review and framework for interventions. Int. J. Behav. Nutr. Phys. Activity 2009, 6,58. [CrossRef]
156. Marteau, T.M.; Hollands, G.; Shemilt, I.; Jebb, S.A. Downsizing: Policy options to reduce portion sizes to help tackle obesity. BMJ2015, 351, h5863. [CrossRef] [PubMed]
157. Kersbergen, I.; Oldham, M.; Jones, A.; Field, M.; Angus, C.; Robinson, E. Reducing the standard serving size of alcoholic beveragesprompts reductions in alcohol consumption. Addiction 2018, 113, 1598–1608. [CrossRef] [PubMed]
158. Pilling, M.; Clarke, N.; Pechey, R.; Hollands, G.; Marteau, T. The effect of wine glass size on volume of wine sold: A mega-analysisof studies in bars and restaurants. Addiction 2020, 115, 1660–1667. [CrossRef] [PubMed]
159. Vasiljevic, M.; Couturier, D.-L.; Marteau, T.M. What are the perceived target groups and occasions for wines and beers labelledwith verbal and numerical descriptors of lower alcohol strength? An experimental study. BMJ Open 2019, 9, e024412. [CrossRef][PubMed]
180
Nutrients 2021, 13, 2927
160. Cummings, J.R.; Ray, L.A.; Tomiyama, A.J. Food-alcohol competition: As young females eat more food, do they drink less alcohol?J. Health Psychol. 2017, 22, 674–683. [CrossRef] [PubMed]
161. Farhat, T.; Iannotti, R.J.; Simons-Morton, B.G. Overweight, obesity, youth, and health-risk behaviors. Am. J. Prev. Med. 2010, 38,258–267. [CrossRef] [PubMed]
162. Pasch, K.E.; Nelson, M.C.; Lytle, L.A.; Moe, S.G.; Perry, C.L. Adoption of Risk-Related Factors Through Early Adolescence:Associations with Weight Status and Implications for Causal Mechanisms. J. Adolesc. Health 2008, 43, 387–393. [CrossRef][PubMed]
163. Peralta, R.L.; Barr, P.B. Gender orientation and alcohol-related weight control behavior among male and female college students.J. Am. Coll. Health 2016, 65, 229–242. [CrossRef]
164. Simpson, R.F.; Hermon, C.; Liu, B.; Green, J.; Reeves, G.K.; Beral, V.; Floud, S. Alcohol drinking patterns and liver cirrhosis risk:Analysis of the prospective UK Million Women Study. Lancet Public Health 2018, 4, e41–e48. [CrossRef]
165. Jani, B.D.; McQueenie, R.; Nicholl, B.I.; Field, R.; Hanlon, P.; Gallacher, K.I.; Mair, F.S.; Lewsey, J. Association between patterns ofalcohol consumption (beverage type, frequency and consumption with food) and risk of adverse health outcomes: A prospectivecohort study. BMC Med. 2021, 19, 8. [CrossRef] [PubMed]
166. Puddephatt, J.-A.; Keenan, G.; Fielden, A.; Reaves, D.; Halford, J.C.; Hardman, C.A. ‘Eating to survive’: A qualitative analysisof factors influencing food choice and eating behaviour in a food-insecure population. Appetite 2019, 147, 104547. [CrossRef][PubMed]
167. Reitzel, L.R.; Chinamuthevi, S.; Daundasekara, S.S.; Hernandez, D.C.; Chen, T.-A.; Harkara, Y.; Obasi, E.M.; Kendzor, D.E.;Businelle, M.S. Association of Problematic Alcohol Use and Food Insecurity among Homeless Men and Women. Int. J. Environ.Res. Public Health 2020, 17, 3631. [CrossRef] [PubMed]
168. Bergmans, R.S.; Coughlin, L.; Wilson, T.; Malecki, K. Cross-sectional associations of food insecurity with smoking cigarettes andheavy alcohol use in a population-based sample of adults. Drug Alcohol Depend. 2019, 205, 107646. [CrossRef] [PubMed]
169. Tan, J.; Johns, G. Drinking and Eating; Alcohol Change UK: London, UK, 2019.170. Wray, T.B.; Merrill, J.E.; Monti, P.M. Using Ecological Momentary Assessment (EMA) to Assess Situation-Level Predictors of
Alcohol Use and Alcohol-Related Consequences. Alcohol Res. Curr. Rev. 2014, 36, 19–27.171. Oldham, M.; Callinan, S.; Whitaker, V.; Fairbrother, H.; Curtis, P.; Meier, P.; Livingston, M.; Holmes, J. The decline in youth
drinking in England—is everyone drinking less? A quantile regression analysis. Addiction 2019, 115, 230–238. [CrossRef]172. Vashishtha, R.; Pennay, A.; Dietze, P.; Marzan, M.B.; Room, R.; Livingston, M. Trends in adolescent drinking across 39 high-income
countries: Exploring the timing and magnitude of decline. Eur. J. Public Health 2020, 31, 424–431. [CrossRef]
181

nutrients
Review
Production, Consumption, and Potential Public Health Impactof Low- and No-Alcohol Products: Results of a Scoping Review
Peter Anderson 1,2,*, Daša Kokole 1 and Eva Jané Llopis 1,3,4
Citation: Anderson, P.; Kokole, D.;
Llopis, E.J. Production, Consumption,
and Potential Public Health Impact of
Low- and No-Alcohol Products:
Results of a Scoping Review.
Nutrients 2021, 13, 3153. https://
doi.org/10.3390/nu13093153
Academic Editor: Joerg Koenigstorfer
Received: 28 July 2021
Accepted: 8 September 2021
Published: 10 September 2021
Publisher’s Note: MDPI stays neutral
with regard to jurisdictional claims in
published maps and institutional affil-
iations.
Copyright: © 2021 by the authors.
Licensee MDPI, Basel, Switzerland.
This article is an open access article
distributed under the terms and
conditions of the Creative Commons
Attribution (CC BY) license (https://
creativecommons.org/licenses/by/
4.0/).
1 Department of Health Promotion, CAPHRI Care and Public Health Research Institute, Maastricht University,6200 MD Maastricht, The Netherlands; [email protected] (D.K.); [email protected] (E.J.L.)
2 Population Health Sciences Institute, Newcastle University, Newcastle upon Tyne NE2 4AX, UK3 ESADE Business School, University Ramon Llull, 08034 Barcelona, Spain4 Institute for Mental Health Policy Research, Centre for Addiction and Mental Health (CAMH),
Toronto, ON M5S 2S1, Canada* Correspondence: [email protected]
Abstract: Switching from higher strength to low- and no-alcohol products could result in consumersbuying and drinking fewer grams of ethanol. We undertook a scoping review with systematicsearches of English language publications between 1 January 2010 and 17 January 2021 usingPubMed and Web of Science, covering production, consumption, and policy drivers related tolow- and no-alcohol products. Seventy publications were included in our review. We found nopublications comparing a life cycle assessment of health and environmental impacts between alcohol-free and regular-strength products. Three publications of low- and no-alcohol beers found onlylimited penetration of sales compared with higher strength beers. Two publications from only onejurisdiction (Great Britain) suggested that sales of no- and low-alcohol beers replaced rather thanadded to sales of higher strength beers. Eight publications indicated that taste, prior experiences,brand, health and wellbeing issues, price differentials, and overall decreases in the social stigmaassociated with drinking alcohol-free beverages were drivers of the purchase and consumption oflow- and no-alcohol beers and wines. Three papers indicated confusion amongst consumers withrespect to the labelling of low- and no-alcohol products. One paper indicated that the introductionof a minimum unit price in both Scotland and Wales favoured shifts in purchases from higher-to lower-strength beers. The evidence base for the potential beneficial health impact of low- andno-alcohol products is very limited and needs considerable expansion. At present, the evidence basecould be considered inadequate to inform policy.
Keywords: no-alcohol products; low-alcohol products; production; consumption; health impact
1. Introduction
Ethanol in alcoholic beverages is toxic to human health. Whilst consumption of upto 30 g of ethanol a day may be associated with a reduced risk of ischemic heart diseasecompared with no consumption [1], ethanol is genotoxic and a carcinogen, with no level ofrisk-free consumption [2].
Alcohol is a risk factor for early death. At an individual level, forty-year-olds whodrink more than 350 g of alcohol per week (about five drinks a day) lose four to five yearsof life compared with those who drink 100 g of alcohol or less per week (approximatelyone and a half drinks a day) [3]. At a global level, alcohol is the cause of approximately3 million deaths each year [4].
Reducing alcohol consumption reduces the risk of dying prematurely and the likeli-hood of a wide range of conditions, including cancer, elevated blood pressure, stroke, liverdisease, mental health disorders, and accidents and injuries [5].
There are many strategies that enable people to drink less alcohol. For example, theWHO SAFER initiative calls on governments at all levels to (i) strengthen restrictions
Nutrients 2021, 13, 3153. https://doi.org/10.3390/nu13093153 https://www.mdpi.com/journal/nutrients183
Nutrients 2021, 13, 3153
on alcohol availability; (ii) advance and enforce drinking and driving countermeasures;(iii) facilitate access to screening, brief interventions, and treatment; (iv) enforce bans orcomprehensive restrictions on alcohol advertising, sponsorship, and promotion; and (v)raise prices on alcohol through excise taxes and pricing policies [6].
As an additional strategy, there is a growing discourse around the potential publichealth benefit of low- and no-alcohol products (alcohol-free and low-alcohol versions ofalcoholic drinks such as beer, wine, and spirits) [7,8]. The WHO’s global alcohol strategycalled on the alcohol industry to contribute to reducing the harmful use of alcohol byaddressing its products [9], for example, by reducing the amount of alcohol they contain.In its consultation document, ‘Advancing our health: prevention in the 2020s,’ the UKGovernment made a commitment to work with the alcohol industry to deliver a significantincrease in the availability of alcohol-free and low-alcohol products by 2025; [10].
Low- and no-alcohol products can only be of public health benefit if they replacerather than add to existing consumption of higher strength products. In addition, any suchpotential health benefits resulting from the production and replacement consumption oflow- and no-alcohol products should be offset against any environmental external costs(for example, due to extra steps in production), which can be assessed through life cycleassessments.
To inform the discourse on low- and no-alcohol products, we have undertaken ascoping review on their production, consumption, and potential health impact. In thereview, we identify five research questions, for which we aim to synthesise knowledgeabout low- and no-alcohol products related to:
1. Production, including life cycle assessment compared with production of regularstrength products
2. Prevalence of purchase and consumption3. Potential health impact4. Consumer perceptions and preferences5. Policy drivers of purchase and consumption.
2. Methods
2.1. Design and Registration
We used scoping review methodology because of the breadth of the research questionsand the lack of clarity on the amount and nature of existing research on this topic. Scopingreviews are used to map the main concepts in research areas and present a broad overviewof the existing evidence, including the identification of research gaps, regardless of thestudy quality [11]. The design was guided by the methodological framework of Arksey andO’Malley [12]. The review protocol was pre-registered at https://osf.io/kv3rj/ (accessedon 1 September 2021).
2.2. Eligibility Criteria
To be included in the review, papers had to include topics related to the production,consumption, and health impact of low- and no-alcohol products. There was no restrictionon research design. To delineate the scope of our research, we only focused on peer-reviewed literature rather than grey literature. Original articles and reviews in Englishpublished in 2011 or later were included. For production, only reviews were included, as adetailed examination of production methods was not the focus of the paper. Papers notspecific to low- and no-alcohol products were excluded.
2.3. Information Sources and Search Strategy
Two databases (PubMed and Web of Science) were searched with the abovementionedrestrictions on language and dates (English language, published between 1 January 2011and 17 January 2021). The search strategy contained blocks with terms related to low- andno- alcoholic products (‘Low alcohol’ or ‘No alcohol’ or ‘Zero alcohol’ or ‘Alcohol-free’ or‘Alcohol free’ or Reformulation or Reduc* ethanol content or Reduc* ethanol strength or
184
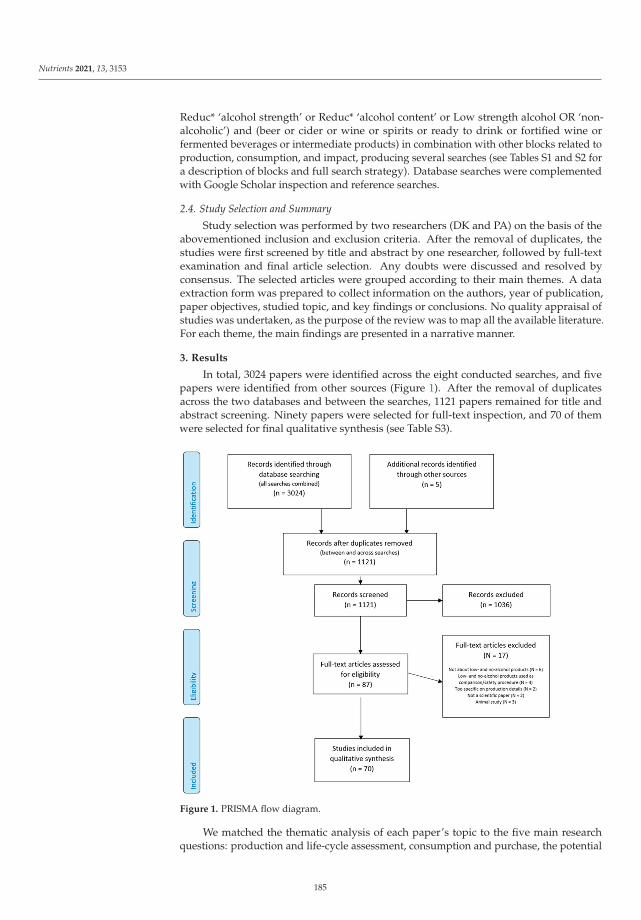
Nutrients 2021, 13, 3153
Reduc* ‘alcohol strength’ or Reduc* ‘alcohol content’ or Low strength alcohol OR ‘non-alcoholic’) and (beer or cider or wine or spirits or ready to drink or fortified wine orfermented beverages or intermediate products) in combination with other blocks related toproduction, consumption, and impact, producing several searches (see Tables S1 and S2 fora description of blocks and full search strategy). Database searches were complementedwith Google Scholar inspection and reference searches.
2.4. Study Selection and Summary
Study selection was performed by two researchers (DK and PA) on the basis of theabovementioned inclusion and exclusion criteria. After the removal of duplicates, thestudies were first screened by title and abstract by one researcher, followed by full-textexamination and final article selection. Any doubts were discussed and resolved byconsensus. The selected articles were grouped according to their main themes. A dataextraction form was prepared to collect information on the authors, year of publication,paper objectives, studied topic, and key findings or conclusions. No quality appraisal ofstudies was undertaken, as the purpose of the review was to map all the available literature.For each theme, the main findings are presented in a narrative manner.
3. Results
In total, 3024 papers were identified across the eight conducted searches, and fivepapers were identified from other sources (Figure 1). After the removal of duplicatesacross the two databases and between the searches, 1121 papers remained for title andabstract screening. Ninety papers were selected for full-text inspection, and 70 of themwere selected for final qualitative synthesis (see Table S3).
Figure 1. PRISMA flow diagram.
We matched the thematic analysis of each paper’s topic to the five main researchquestions: production and life-cycle assessment, consumption and purchase, the potential
185
Nutrients 2021, 13, 3153
impact on health, perception and preferences, and policy drivers of purchase and consump-tion. The results are presented within these categories. Additionally, several reviews werefound which encompassed broader overviews of the selected topics and sometimes coveredseveral themes at once [13–20]; thus, their findings are presented where appropriate. Alongwith the key findings of the papers, we also examined the definition of low- and no-alcoholproducts and the funding sources for the research (see Table S4).
3.1. Production and Life Cycle Assessment
In terms of the production of low- and non-alcoholic beverages, the majority of theresearch focused on beer and wine. For non-alcoholic or low-alcohol beer, the reasongiven for the importance of improving production used in many papers is flavour is oneof the main problems with non-alcoholic beer acceptance. Thus, much of the productionresearch has focused on how to make the flavour more acceptable and similar to alcoholicbeer and whether biological (limiting ethanol formation during beer fermentation) orphysical (removing ethanol from regular beer) approaches are more suitable to achievethis goal [21–27]. Most of the reviews refer to regulations when defining beer products; forexample, EU regulations require 0.5% alcohol by volume (ABV) or less for non-alcoholicbeer and 1.2% ABV or less for low-alcohol beer, but they acknowledge that these regulationsdiffer by country. Other directions of research are related to low alcoholic or alcohol-freebeers within the niche of craft beer [13] and dry hopping as a technique to produce non-alcoholic beer [14].
In the field of wine, the de-alcoholisation research has two directions: one objectiveis to decrease the alcohol strength in wine, and the second is to produce new low-alcoholbeverages [28]. With regard to the first objective, the main issue that the wine industryfaces is the increase in wine ABV due to climate change conditions (e.g., in Australian redwines, alcohol concentration has increased approximately 1% ABV per decade since the1980s [29]). Thus, research has focused on how to reduce the elevated alcohol content inwine without leading to a taste that is not as well-accepted by consumers (e.g., [29–31]).For the second objective, the issue is also to overcome the loss of desirable sensory prop-erties appreciated by consumers when alcohol content is reduced/removed from wine,with research focusing on identifying the most appropriate methods to achieve this goal(e.g., [32–35]). In terms of the definition of lower-alcohol wine products, the reviews haveacknowledged country differences in regulations: one review mentioned the definitionsadopted by the International Organisation of Vine and Wine: ’Beverages obtained by winedealcoholization’ for beverages with 0.5% ABV or lower, and ‘Beverages obtained by partialwine dealcoholization’ for those in the range of 0.5–8.5% ABV [28]; other reviews havedefined wine products as lower-alcohol with an ABV of up to 11.0% [33,34].
While the comparison of various production methods is difficult, and thus it is difficultto define the best processes [22], some attempts at life cycle assessment have been carriedout for alcohol-free bitter extracts as aperitifs [36,37] as well as for partial de-alcoholisationof wines [38]. We found no published life cycle assessments comparing the production ofzero-alcohol beers or wines with the production of regular beers or wines.
As mentioned previously, no research was found on alcohol-free or low-alcohol spirits,but another review examined the field of traditional low-alcoholic and non-alcoholicfermented beverages [39], such as kefir, boz, or kvass. Finally, we found one study ofethanol production in non-alcoholic beer across the storage period, which found thatstorage temperature and packaging can have significant effects on ethanol productionduring the storage period, although the excess production does not exceed the allowedamount of 0.5% ABV [40].
3.2. Consumption and Purchase
Relatively little research in peer-reviewed literature has focused on low- and no-alcohol drink consumption and purchase trends, and all studies have focused on non-alcoholic or low-alcohol beer (none on wine or spirits). One study [41,42] examined the
186
Nutrients 2021, 13, 3153
introduction of new low- and no-alcohol beers (defined as beers with 3.5% ABV or less) andreformulated beers in Great Britain and found that the volume of purchases of new low-and no-alcohol beer products (2.6% of the volume of all beers purchased in 2018) and newreformulated beer products (6.9% of the volume of all beers purchased in 2018) was verysmall. More widely, an analysis of official data from ethanol beer sales in Australia andNew Zealand [43] showed that in Australia, the consumption of ethanol in mid-strengthbeer (3.01–3.5% ABV) increased, whereas consumption of low-strength beer (<3% ABV)decreased between 2000 and 2016. In New Zealand, the consumption of mid-strength beer(2.501–4.35% ABV) decreased substantially.
3.3. Impact on Health
Overall, only one public health-oriented review has been conducted to examine theevidence base of the reduction of ethanol content of alcoholic beverages as a means toreduce the harmful use of alcohol [20]. The review concluded that the literature is stilltoo scarce to draw conclusions, although some mechanisms for how this might occurhave been proposed: first, current drinkers may replace standard alcoholic beverageswith similar beverages of lower alcoholic strength, and second, current drinkers mayswitch to no-alcohol alternatives some of the time. On the other hand, lowering alcoholicstrength could reduce the threshold and initiate alcohol use in current abstainers, especiallyin adolescents.
The study [41] that examined the impact of the introduction of new low- and no-alcohol beers (defined as beers with 3.5% ABV or less) and reformulated beers in GreatBritain on the average alcoholic strength of beer and the number of grams of alcoholpurchased by households obtained the following results: a combined associated impactof both events with relative reductions of alcohol by volume of beer between 1.2% and2.3%, purchases of grams of alcohol within beer between 7.1% and 10.2%, and purchasesof grams of alcohol as a whole between 2.6% and 3.9%. Another study investigated thereformulation of products by one company and found that the mean ABV of its beerproducts dropped from 4.69 in 2015 to 4.55 in 2018, and these changes were associated withreduced purchases of grams of alcohol within its beer products [42].
Several individual studies have focused on the impact of low- and no-alcohol productson health-related topics. All but one focused on beer. The topics covered have includedthe impact of non-alcoholic beer on anxiety [44] and sleep quality [45,46]; the impact ofalcohol-free beer enriched with isomaltulose on insulin resistance in diabetic patients withoverweight or obesity [47]; the effect of non-alcoholic beer compared with improved dietand exercise on nutritional status, endothelial function, and quality of life in patientswith cirrhosis [48]; the impact of non-alcoholic beer [49–51] or alcohol-free wine [52] oncardiovascular health; and the relationship between non-alcoholic beer and breastfeedingin terms of whether supplementing with non-alcoholic beer improves the oxidative stressand antioxidant content of breast milk [53] as well as how much ethanol in non-alcoholicbeer may reach the breastfed child [54]. All these studies concluded that the impact of thetested drink was in a favourable direction, but they focused on relatively short-term effects(days to months) and the studies were conducted on small samples (ranging between 7 and60 participants). The only study examining effects over a longer term (two years) foundthat in Australian older women, the frequency of drinking low-alcohol beer was positivelyassociated with bone mass density in the lumbar spine but not in the hip [55]. Additionally,among the studies mentioned in this section, only two of twelve [52,55] were not fundedby the alcohol industry or industry-related organisations. The majority of the studies alsodid not specifically define the possible alcohol content in the drinks, although they usedterms in line with those used in regulations (alcohol-free, non-alcoholic, and low-alcohol).Additionally, two reviews examined the health properties of low-alcohol and alcohol-freebeer [15,16] but focused more on the theorised nutritional benefits of beer and how to retainthem in low- and non-alcoholic alternatives.
187

Nutrients 2021, 13, 3153
Another prominent topic in terms of study focus is the evaluation of non-alcoholicor low-alcohol beer in the context of sports/exercise, studying these products’ effect ondecreasing post-race inflammation and upper respiratory tract infection incidence amongmarathon runners [56] or fluid retention after exercise, with mixed results [57–60]. Finally,one study investigate chemical and physical properties to determine whether beer canbe considered an isotonic drink [61] and concluded that only yeast-clouded alcohol-freebeer (but not regular beer or clear alcohol-free beer) could be declared and promoted asisotonic, as it matches the Codex Alimentarius threshold values. However, none of thetested beverages matched the EC recommendation for sodium content.
3.4. Perceptions and Preferences
A relatively large number of papers focused on examining individual perceptions andpreferences related to low- and non-alcoholic beverages, although the range of examinedtopics was rather heterogeneous. The majority of studies focused on beers, althoughregarding health impact, more studies focused on low-alcohol wine, and one consideredalcohol-free spirits.
Several studies examined responses to low- and non-alcoholic beverages (beer andwine). One study found that, while the alcohol content affected participants’ sensoryexpectations, it had no significant effect on expected liking; it also found that describing thesensory qualities of beer using a sensory descriptor had a larger effect than labelled alcoholcontent and label colour [62]. Another study [63] investigated whether non-alcoholic beerinduced a conditioned response even when participants know that the beer is non-alcoholic.The study found that non-alcoholic beer produced a conditioned response in older drinkersbecause these drinkers more strongly associated the alcohol conditioned stimulus with theunconditioned stimulus than did younger participants [63]. One study [64] investigatedhow people evaluate low-alcohol wine (8% ABV content) and if the reduction in alcoholand the information that a wine is low in alcohol influenced consumption. The studyfound no difference in liking and consumption between low-alcohol and standard-alcoholwines [64]; however, participants were willing to pay more for standard wine comparedwith lower-alcohol wine. Two studies used functional magnetic resonance approaches tocompare peoples’ reactions to lower-alcohol alternatives and higher-alcohol alternatives:one [65] found no differences between acute brain rewards in the consumption of beerwith and without alcohol when presented in a context in which regular alcoholic beer isexpected; the second study [66] found greater activation in brain regions that are sensitiveto taste intensity in low-alcohol compared with high-alcohol wines, although the definitionof low-alcohol wine in the study was 13–13.5% ABV. Two studies examined whetherconsumers were able to discriminate between alcoholic and non-alcoholic products; bothfound that consumers were able to distinguish between mock and real sparkling wine [67]and between alcohol-free spirits and alcoholic spirits [68].
A number of studies investigated preferences and found that taste is an important pref-erence driver in Australian wine consumers [69] and that that innovative wine attributes,including alcohol-free wine, were ranked among the least important attributes in a sampleof Italian wine consumers [70]. Alcoholic aroma and flavour contributed as positive prefer-ence drivers for the acceptance of non-alcoholic beer in a sample of beer consumers [71].Consumers perceived light beer (not clearly defined by % ABV) as healthier but less tastythan regular beer, and the preference for light beer was driven mostly by taste, prior expe-rience, and brand [72]. A study of regular beer or wine consumers from the UK found thatparticipants perceived pregnant women, athletes, and those aged 6–13 years old as targetgroups, and they perceived weekday lunches as the target occasions for drinking wine andbeer labelled as lower-strength [73]. Another survey of Australian wine consumers foundthat taste was an important driver of consumption and considered ‘low-alcohol wine’ tocontain around 3–8% alcohol [69]. The perceived reasons for preferring a low-alcohol wineincluded driving after drinking, lessening the adverse effects of alcohol, and being able toconsume more without the effects of higher-alcohol wine [69]. Finally, in a sample of Dutch
188
Nutrients 2021, 13, 3153
and Portuguese respondents, non-alcoholic beer was conceptualized as useful when alcoholwas not convenient and functional as a substitute for regular beer, with the consumption ofnon-alcoholic beer driven by health and wellbeing issues, price differentials, and overalldecreases in the social stigma associated with drinking alcohol-free beverages [74,75].
It is important to note that perceptions and preferences of low- and no-alcohol prod-ucts might differ by culture and country. Two reviews examined the cultural context ofnon-alcoholic or low-alcohol beer consumption in the US [19] and the Netherlands andPortugal [17]. Another review pointed out that much low alcohol wine research originatesfrom Australia [18].
3.5. Policy Drivers
We identified a number of policy driver-related studies, such as marketing [76] andlabelling of lower-strength beer and wine [77–79] as well as the price of low- and non-alcoholic beer [80–82], with funding either received by governmental bodies or not receivedat all. In terms of marketing, one study conducted a content analysis of how the low- orlower-strength equivalents of beer and wine were marketed in an online context in theUK [76] and found that they were more often marketed in association with occasionsdeemed to be suitable for their consumption, including lunchtime (for wine), outdoorevents/barbeques (for beer), and on sport/fitness occasions (for beer). Compared withregular-strength wines and beers, low- and lower-strength equivalents were more fre-quently marketed with images or text associated with health or information about lowalcohol content and appeared to be marketed not as substitutes for higher-strength productsbut as products that can be consumed on additional occasions with an added implicationof healthiness.
Two studies considered the labelling of low- and non-alcoholic products amongregular drinkers from the UK. One study found that products with verbal descriptorsdenoting lower strength (low and super-low) had a lower appeal than regular-strengthproducts, with appeal decreasing as % ABV decreased [79]. The second study found thatthe total amount of drink consumed increased as the label on the drink denoted successivelylower alcohol strengths [78]. A related study also found that 17 of 18 verbal descriptors forlower-strength products were perceived as denoting products far higher in strength thanthe currently legislated cap (in the UK) of 1.2% ABV for low-alcohol products [77].
Related to price, one study [80] found that the introduction of minimum unit price inScotland and Wales shifted purchases from higher- to lower-strength products, more so forciders than for beers. In Australia, one analysis [82] found that after the varying nominalrates of tax were introduced for beer products according to three alcohol content levels(low-, mid-, and high-strength) in 2000/01, the relatively higher nominal tax rates for twobeer categories (mid- and high-strength off-premises) had a significant negative effect ontheir consumption. Another Australian study examined price elasticity for several alcoholicbeverages, including low-alcohol beer, but did not report on this specific category [81].
4. Discussion
The main finding of this scoping review was that there is only a relatively small andincoherent scientific literature on the production, consumption, and potential health impactof low- and no-alcohol products. The evidence base could be considered insufficient toinform policy.
Producers have a responsibility to report on their health and environmental impacts.Despite European guidance on undertaking life cycle assessments for beer production [83],such assessments are voluntary, with no requirement for public reporting. Whilst alcohol-free products, for example, may have a potential impact in reducing the harm inflicted byalcohol, and such potential benefits should be weighed against any environmental externalcosts, which may be present because there are extra steps in the production processes. Suchscientific assessments have not been published.
189
Nutrients 2021, 13, 3153
There are hardly any published scientific data on the extent of purchase and con-sumption of low- and no-alcohol products. Published British data, which is restricted tohousehold purchases of beer, suggest only low penetration in terms of volumes purchased.
In terms of health impact, there are a number of disparate studies on potential lowquality, from which it is difficult to draw firm conclusions. British household purchasedata suggest that the introduction of new low- and no-alcohol beers as well as productreformulation of existing beers to contain less alcohol result in households purchasingfewer grams of ethanol. However, these analyses refer to only one product (beer) and onlyone jurisdiction (Great Britain).
There have been several studies on perceptions and preferences for the uptake of no-and low-alcohol products, primarily beer. These indicate the importance of taste, priorexperiences, brand (same brand as regular-strength beers), health and wellbeing issues,price differentials, and overall decreases in the social stigma associated with drinkingalcohol-free beverages as important drivers of the purchase and consumption of low- andno-alcohol beers.
With respect to policy drivers, some research suggests that low- and no-alcoholproducts are marketed as products that can be used on additional occasions or in additionalcircumstances rather than as substitutes for higher-strength products. Although concernhas been expressed concern on this issue [7], the scoping review found no published studiesto indicate whether or not the marketing of low- and no-alcohol brands is specifically usedto market higher-strength products. Several studies on labelling have suggested that thelabelling of low- and no-alcohol products is sometimes inconsistent and not always asclear as it should be. Finally, some evidence from several jurisdictions suggests that pricingpolicy, such as the introduction of a minimum unit price, can favour shifts in purchasesand consumption from higher- to lower-strength alcohol products.
4.1. Limitations
Our review is subject to the general limitations of scoping reviews: we did not appraisestudies for quality, and the conclusions are still somewhat broad and qualitative. The resultsof our review are constrained by the relatively small size of published studies, which werenot necessarily coherent within the five main groups that we used. In addition, as westarted with very broad research questions, we decided to limit certain methodologicalcriteria (such as using only two search databases and focusing on peer-reviewed articles inEnglish only) in order to rapidly find and appraise the most relevant literature, but thismeans that findings from grey literature in other languages (such as government reports)are not included in this review.
4.2. Implications
Despite its limitations, our review indicates large research gaps and identifies policyactions to address these gaps, as proposed in the Table 1.
190
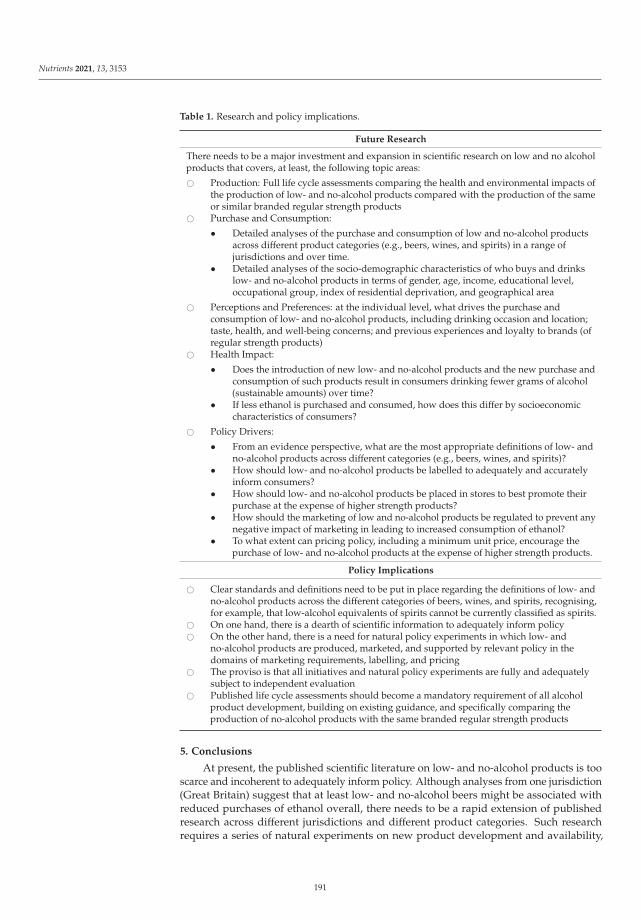
Nutrients 2021, 13, 3153
Table 1. Research and policy implications.
Future Research
There needs to be a major investment and expansion in scientific research on low and no alcoholproducts that covers, at least, the following topic areas:
� Production: Full life cycle assessments comparing the health and environmental impacts ofthe production of low- and no-alcohol products compared with the production of the sameor similar branded regular strength products
� Purchase and Consumption:
• Detailed analyses of the purchase and consumption of low and no-alcohol productsacross different product categories (e.g., beers, wines, and spirits) in a range ofjurisdictions and over time.
• Detailed analyses of the socio-demographic characteristics of who buys and drinkslow- and no-alcohol products in terms of gender, age, income, educational level,occupational group, index of residential deprivation, and geographical area
� Perceptions and Preferences: at the individual level, what drives the purchase andconsumption of low- and no-alcohol products, including drinking occasion and location;taste, health, and well-being concerns; and previous experiences and loyalty to brands (ofregular strength products)
� Health Impact:
• Does the introduction of new low- and no-alcohol products and the new purchase andconsumption of such products result in consumers drinking fewer grams of alcohol(sustainable amounts) over time?
• If less ethanol is purchased and consumed, how does this differ by socioeconomiccharacteristics of consumers?
� Policy Drivers:
• From an evidence perspective, what are the most appropriate definitions of low- andno-alcohol products across different categories (e.g., beers, wines, and spirits)?
• How should low- and no-alcohol products be labelled to adequately and accuratelyinform consumers?
• How should low- and no-alcohol products be placed in stores to best promote theirpurchase at the expense of higher strength products?
• How should the marketing of low and no-alcohol products be regulated to prevent anynegative impact of marketing in leading to increased consumption of ethanol?
• To what extent can pricing policy, including a minimum unit price, encourage thepurchase of low- and no-alcohol products at the expense of higher strength products.
Policy Implications
� Clear standards and definitions need to be put in place regarding the definitions of low- andno-alcohol products across the different categories of beers, wines, and spirits, recognising,for example, that low-alcohol equivalents of spirits cannot be currently classified as spirits.
� On one hand, there is a dearth of scientific information to adequately inform policy� On the other hand, there is a need for natural policy experiments in which low- and
no-alcohol products are produced, marketed, and supported by relevant policy in thedomains of marketing requirements, labelling, and pricing
� The proviso is that all initiatives and natural policy experiments are fully and adequatelysubject to independent evaluation
� Published life cycle assessments should become a mandatory requirement of all alcoholproduct development, building on existing guidance, and specifically comparing theproduction of no-alcohol products with the same branded regular strength products
5. Conclusions
At present, the published scientific literature on low- and no-alcohol products is tooscarce and incoherent to adequately inform policy. Although analyses from one jurisdiction(Great Britain) suggest that at least low- and no-alcohol beers might be associated withreduced purchases of ethanol overall, there needs to be a rapid extension of publishedresearch across different jurisdictions and different product categories. Such researchrequires a series of natural experiments on new product development and availability,
191
Nutrients 2021, 13, 3153
along with new policy drivers that promote shifts from higher- to lower-strength productsthat are fully and independently evaluated for their impact on drinking less ethanol, thusreducing ill-health and premature death. Such research should be a required price tag forall relevant natural experiments led by producers and governments.
Supplementary Materials: The following are available online at https://www.mdpi.com/article/10.3390/nu13093153/s1.
Author Contributions: Conceptualization: P.A. and D.K.; methodology: D.K. and P.A.; investigation:D.K. and P.A.; data analysis: D.K. and P.A.; supervision: E.J.L.; writing—original draft: D.K. and P.A.;writing—review and editing: D.K., P.A. and E.J.L. All authors have read and agreed to the publishedversion of the manuscript.
Funding: This work was supported by the European Health and Digital Executive Agency (HaDEA)(previously Consumers, Health, Agriculture and Food Executive Agency (CHAFEA)) acting underthe mandate from the European Commission (EC) specifically by the project ALHAMBRA (EUHealth Programme 2014–2020 under service contract 2019 71 05). The views expressed in this articleare those of the authors only and do not necessarily reflect the views of the EC or HaDEA.
Institutional Review Board Statement: Not applicable.
Data Availability Statement: Extracted data is presented in the Supplementary Materials.
Conflicts of Interest: P.A., D.K., and E.J.L. received funds from the European Health and DigitalExecutive Agency under a service contract. Within the previous five years, PA has received fundsfrom the AB InBev Foundation.
References
1. Rehm, J.; Rovira, P.; Shield, K.D. Dose-response relationships between levels of alcohol use and risks of mortality for all people,and for different ages, by sex, and for groups defined by risk factors. Nutrients 2021, 13, 2652. [CrossRef] [PubMed]
2. Rumgay, H.; Murphy, N.; Ferrari, P.; Soerjomataram, I. Alcohol and cancer: Epidemiology and biological mechanisms. Nutrients2021, in press.
3. Wood, A.; Kaptoge, S.; Butterworth, A.; Paul, D.; Burgess, S.; Sweeting, M.; Bell, S.; Astle, W.; Willeit, P.; Bolton, T.; et al.Risk thresholds for alcohol consumption: Combined analysis of individual-participant data for 599,912 current drinkers in 83prospective studies. Lancet 2018, 391, 1513–1523. [CrossRef]
4. Shield, K.; Manthey, J.; Rylett, M.; Probst, C.; Wettlaufer, A.; Parry, C.D.H.; Rehm, J. National, regional, and global burdens ofdisease from 2000 to 2016 attributable to alcohol use: A comparative risk assessment study. Lancet Public Health 2020, 5, e51–e61.[CrossRef]
5. World Health Organization (WHO). Global Status Report on Alcohol and Health. 2018. Available online: https://apps.who.int/iris/bitstream/handle/10665/274603/9789241565639-eng.pdf?ua=1&ua=1 (accessed on 1 September 2021).
6. World Health Organization. SAFER, Alcohol Control Initiative. 2020. Available online: https://www.who.int/substance_abuse/safer/en/ (accessed on 1 September 2021).
7. European Health and Digital Executive Agency. Service Contract for the Provision of 2019—Support to Member States in Studiesand Capacity Building Activities to Reduce Alcohol Related Harm. Available online: https://etendering.ted.europa.eu/cft/cft-document.html?docId=65290 (accessed on 1 September 2021).
8. Corfe, S.; Hyde, R.; Shepherd, J. Alcohol-Free and Low-Strength Drinks Understanding Their Role in Reducing Alcohol-RelatedHarms. Available online: https://www.smf.co.uk/publications/no-low-alcohol-harms/ (accessed on 1 September 2021).
9. World Health Organization. Global Strategy to Reduce the Harmful Use of Alcohol; World Health Organization: Geneva, Switzerland, 2010.10. UK Government. Advancing our Health: Prevention in the 2020s—Consultation Document. 2019. Available online:
https://www.gov.uk/government/consultations/advancing-our-health-prevention-in-the-2020s/advancing-our-health-prevention-in-the-2020s-consultation-document (accessed on 1 September 2021).
11. Arksey, H.; O’Malley, L. Scoping studies: Towards a methodological framework. Int. J. Soc. Res. Methodol. 2005, 8, 19–32.[CrossRef]
12. Tricco, A.C.; Lillie, E.; Zarin, W.; O’Brien, K.; Colquhoun, H.; Kastner, M.; Levac, D.; Ng, C.; Sharpe, J.P.; Wilson, K.; et al. Ascoping review on the conduct and reporting of scoping reviews. BMC Med. Res. Methodol. 2016, 16, 1–10. [CrossRef] [PubMed]
13. Baiano, A. Craft beer: An overview. Compr. Rev. Food Sci. Food Saf. 2020, 20, 1829–1856. [CrossRef] [PubMed]14. Hagemann, M.H.; Bogner, K.; Marchioni, E.; Braun, S. Chances for dry-hopped non-alcoholic beverages? Part 1: Concept and
market prospects. Brew. Sci. 2016, 69, 50–55.15. Hagemann, M.H.; Schmidt-Cotta, V.; Marchioni, E.; Braun, S. Chance for Dry-hopped Non-alcoholic Beverages? Part 2: Health
Properties and Target Consumers. Brew. Sci. 2017, 70, 118–123. [CrossRef]
192

Nutrients 2021, 13, 3153
16. Mellor, D.D.; Hanna-Khalil, B.; Carson, R. A Review of the Potential Health Benefits of Low Alcohol and Alcohol-Free Beer:Effects of Ingredients and Craft Brewing Processes on Potentially Bioactive Metabolites. Beverages 2020, 6, 25. [CrossRef]
17. Silva, A.P.; Jager, G.; Van Zyl, H.; Voss, H.-P.; Pintado, M.M.; Hogg, T.; De Graaf, C. Cheers, proost, saúde: Cultural, contextualand psychological factors of wine and beer consumption in Portugal and in the Netherlands. Crit. Rev. Food Sci. Nutr. 2017, 57,1340–1349. [CrossRef] [PubMed]
18. Bucher, T.; Deroover, K.; Stockley, C. Low-Alcohol Wine: A Narrative Review on Consumer Perception and Behaviour. Beverages2018, 4, 82. [CrossRef]
19. Hoalst-Pullen, N.; Patterson, M.W. The Geography of Beer: Culture and Economics; Springer International Publishing:Berlin/Heidelberg, Germany, 2020; ISBN 9783030416546.
20. Rehm, J.; Lachenmeier, D.W.; Llopis, E.J.; Imtiaz, S.; Anderson, P. Evidence of reducing ethanol content in beverages to reduceharmful use of alcohol. Lancet Gastroenterol. Hepatol. 2016, 1, 78–83. [CrossRef]
21. Blanco, C.A.; Andrés-Iglesias, C.; Montero, O. Low-alcohol Beers: Flavor Compounds, Defects, and Improvement Strategies. Crit.Rev. Food Sci. Nutr. 2016, 56, 1379–1388. [CrossRef] [PubMed]
22. Brányik, T.; da Silva, D.P.; Baszczynski, M.; Lehnert, R.; Silva, J.B.D.A.E. A review of methods of low alcohol and alcohol-free beerproduction. J. Food Eng. 2012, 108, 493–506. [CrossRef]
23. Catarino, M.; Mendes, A. Non-alcoholic beer—A new industrial process. Sep. Purif. Technol. 2011, 79, 342–351. [CrossRef]24. Jackowski, M.; Trusek, A. Non-alcoholic beer production—An overview. Pol. J. Chem. Technol. 2018, 20, 32–38. [CrossRef]25. Muller, C.; Neves, L.E.; Gomes, L.; Guimarães, M.; Ghesti, G. Processes for alcohol-free beer production: A review. Food Sci.
Technol. 2020, 40, 273–281. [CrossRef]26. Mangindaan, D.; Khoiruddin, K.; Wenten, I.G. Beverage dealcoholization processes: Past, present, and future. Trends Food Sci.
Technol. 2018, 71, 36–45. [CrossRef]27. Salanta, L.C.; Coldea, T.E.; Ignat, M.V.; Pop, C.R.; Tofana, M.; Mudura, E.; Zhao, H.F. Non-Alcoholic and Craft Beer Pro-duction
and Challenges. Processes 2020, 8, 1382. [CrossRef]28. Liguori, L.; Albanese, D.; Crescitelli, A.; Di Matteo, M.; Russo, P. Impact of dealcoholization on quality properties in white wine at
various alcohol content levels. J. Food Sci. Technol. 2019, 56, 3707–3720. [CrossRef] [PubMed]29. Varela, C.; Dry, P.R.; Kutyna, D.R.; Francis, I.L.; Henschke, P.A.; Curtin, C.D.; Chambers, P.J. Strategies for reducing alcohol
concentration in wine. Aust. J. Grape Wine Res. 2015, 21, 670–679. [CrossRef]30. Dequin, S.; Escudier, J.-L.; Bely, M.; Noble, J.; Albertin, W.; Masneuf-Pomarède, I.; Marullo, P.; Salmon, J.-M.; Sablayrolles, J.M.
How to adapt winemaking practices to modified grape composition under climate change conditions. OENO One 2017, 51, 205.[CrossRef]
31. Ozturk, B.; Anli, E. Different techniques for reducing alcohol levels in wine: A review. BIO Web Conf. 2014, 3, 02012. [CrossRef]32. Longo, R.; Blackman, J.W.; Torley, P.J.; Rogiers, S.Y.; Schmidtke, L.M. Changes in volatile composition and sensory attributes of
wines during alcohol content reduction. J. Sci. Food Agric. 2017, 97, 8–16. [CrossRef] [PubMed]33. Longo, R.; Blackman, J.W.; Antalick, G.; Torley, P.J.; Rogiers, S.Y.; Schmidtke, L. A comparative study of partial dealcoholisation
versus early harvest: Effects on wine volatile and sensory profiles. Food Chem. 2018, 261, 21–29. [CrossRef]34. Longo, R.; Blackman, J.W.; Antalick, G.; Torley, P.J.; Rogiers, S.Y.; Schmidtke, L.M. Harvesting and blending options for lower
alcohol wines: A sensory and chemical investigation. J. Sci. Food Agric. 2018, 98, 33–42. [CrossRef]35. Varela, J.; Varela, C. Microbiological strategies to produce beer and wine with reduced ethanol concentration. Curr. Opin.
Biotechnol. 2019, 56, 88–96. [CrossRef]36. Laoretani, D.S.; Sánchez, R.J.; Paredes, D.A.F.; Iribarren, O.A.; Espinosa, J. On the conceptual modeling, economic analysis and
life cycle assessment of partial dealcoholization alternatives of bitter extracts. Sep. Purif. Technol. 2020, 251, 117331. [CrossRef]37. Paredes, D.A.F.; Laoretani, D.S.; Morero, B.; Sánchez, R.; Iribarren, O.A.; Espinosa, J. Screening of membrane technologies in
concentration of bitter extracts with simultaneous alcohol recovery: An approach including both economic and environmentalissues. Sep. Purif. Technol. 2020, 237, 116339. [CrossRef]
38. Margallo, M.; Aldaco, R.; Barceló, A.; Diban, N.; Ortiz, I.; Irabien, A. Life cycle assessment of technologies for partial dealcoholisa-tion of wines. Sustain. Prod. Consum. 2015, 2, 29–39. [CrossRef]
39. Baschali, A.; Tsakalidou, E.; Kyriacou, A.; Karavasiloglou, N.; Matalas, A.-L. Traditional low-alcoholic and non-alcoholicfermented beverages consumed in European countries: A neglected food group. Nutr. Res. Rev. 2017, 30, 1–24. [CrossRef]
40. Zendeboodi, F.; Jannat, B.; Sohrabvandi, S.; Khanniri, E.; Mortazavian, A.M.; Khosravi, K.; Sarmadi, B.; Asadzadeh, S.; Amirabadi,P.E.; Esmaeili, S. Monitoring of ethanol content in non-alcoholic beer stored in different packages under different storagetemperatures. Biointerface Res. Appl. Chem. 2019, 9, 4624–4628. [CrossRef]
41. Anderson, P.; Llopis, E.J.; O’Donnell, A.; Manthey, J.; Rehm, J. Impact of low and no alcohol beers on purchases of alcohol:Interrupted time series analysis of British household shopping data, 2015–2018. BMJ Open 2020, 10, e036371. [CrossRef] [PubMed]
42. Anderson, P.; Llopis, E.J.; Rehm, J. Evaluation of Alcohol Industry Action to Reduce the Harmful Use of Alcohol: Case Studyfrom Great Britain. Alcohol Alcohol. 2020, 55, 424–432. [CrossRef] [PubMed]
43. Kypri, K.; Harrison, S.; McCambridge, J. Ethanol Content in Australian and New Zealand Beer Markets: Exploratory StudyExamining Public Health Implications of Official Data and Market Intelligence Reports. J. Stud. Alcohol Drugs 2020, 81, 320–330.[CrossRef]
193

Nutrients 2021, 13, 3153
44. Franco, L.; Galán, C.; Bravo, R.; Bejarano, I.; Peñas-Lledo, E.; Rodríguez, A.B.; Barriga, C.; Cubero, J. Effect of non-alcohol beer onanxiety: Relationship of 5-HIAA. Neurochem. J. 2015, 9, 149–152. [CrossRef]
45. Franco, L.; Bravo, R.; Galan, C.; Rodríguez, A.; Barriga, C.; Cubero, J. Effect of non-alcoholic beer on Subjective Sleep Quality in auniversity stressed population. Acta Physiol. Hung. 2014, 101, 353–361. [CrossRef]
46. Franco, L.; Sanchez, C.L.; Bravo, R.; Rodríguez, A.B.; Barriga, C.; Romero, E.; Cubero, J. The Sedative Effect of Non-Alcoholic Beerin Healthy Female Nurses. PLoS ONE 2012, 7, e37290. [CrossRef]
47. Mateo-Gallego, R.; Pérez-Calahorra, S.; Lamiquiz-Moneo, I.; Marco-Benedí, V.; Bea, A.M.; Fumanal, A.J.; Prieto-Martín, A.;Laclaustra, M.; Cenarro, A.; Civeira, F. Effect of an alcohol-free beer enriched with isomaltulose and a resistant dextrin on insulinresistance in diabetic patients with overweight or obesity. Clin. Nutr. 2020, 39, 475–483. [CrossRef] [PubMed]
48. Macías-Rodríguez, R.U.; Ruiz-Margáin, A.; Román-Calleja, B.M.; Espin-Nasser, E.M.; Flores-García, N.C.; Torre, A.; Galicia-Hernández, G.; Rios-Torres, S.L.; Fernández-Del-Rivero, G.; Orea-Tejeda, A.; et al. Clinical Trials Study: Effect of non-alcoholicbeer, diet and exercise on endothelial function, nutrition and quality of life in patients with cirrhosis. World J. Hepatol. 2020, 12,1299–1313. [CrossRef] [PubMed]
49. Daimiel, L.; Micó, V.; Díez-Ricote, L.; Ruiz-Valderrey, P.; Istas, G.; Rodríguez-Mateos, A.; Ordovás, J.M. Alcoholic and Non-Alcoholic Beer Modulate Plasma and Macrophage microRNAs Differently in a Pilot Intervention in Humans with CardiovascularRisk. Nutrients 2021, 13, 69. [CrossRef] [PubMed]
50. Chiva-Blanch, G.; Condines, X.; Magraner, E.; Roth, I.; Valderas-Martínez, P.; Arranz, S.; Casas, R.; Martínez-Huélamo, M.;Vallverdú-Queralt, A.; Rada, P.Q.; et al. The non-alcoholic fraction of beer increases stromal cell derived factor 1 and the numberof circulating endothelial progenitor cells in high cardiovascular risk subjects: A randomized clinical trial. Atherosclerosis 2014,233, 518–524. [CrossRef] [PubMed]
51. Chiva-Blanch, G.; Magraner, E.; Condines, X.; Valderas-Martínez, P.; Roth, I.; Arranz, S.; Casas, R.; Navarro, M.; Hervas, A.;Sisó, A.; et al. Effects of alcohol and polyphenols from beer on atherosclerotic biomarkers in high cardiovascular risk men: Arandomized feeding trial. Nutr. Metab. Cardiovasc. Dis. 2015, 25, 36–45. [CrossRef]
52. Noguer, M.; Cerezo, A.B.; Navarro, E.D.; Garcia-Parrilla, M. Intake of alcohol-free red wine modulates antioxidant enzymeactivities in a human intervention study. Pharmacol. Res. 2012, 65, 609–614. [CrossRef]
53. Codoñer-Franch, P.; Hernandez-Aguilar, M.-T.; Navarro-Ruiz, A.; López-Jaén, A.B.; Borja-Herrero, C.; Valls-Bellés, V. DietSupplementation During Early Lactation with Non-alcoholic Beer Increases the Antioxidant Properties of Breastmilk andDecreases the Oxidative Damage in Breastfeeding Mothers. Breastfeed. Med. 2013, 8, 164–169. [CrossRef]
54. Schneider, C.; Thierauf, A.; Kempf, J.; Auwärter, V. Ethanol Concentration in Breastmilk After the Consumption of Non-alcoholicBeer. Breastfeed. Med. 2013, 8, 291–293. [CrossRef]
55. Yin, J.; Winzenberg, T.; Quinn, S.; Giles, G.; Jones, G. Beverage-specific alcohol intake and bone loss in older men and women: Alongitudinal study. Eur. J. Clin. Nutr. 2011, 65, 526–532. [CrossRef]
56. Scherr, J.; Nieman, D.C.; Schuster, T.; Habermann, J.; Rank, M.; Braun, S.; Pressler, A.; Wolfarth, B.; Halle, M. Nonalcoholic BeerReduces Inflammation and Incidence of Respiratory Tract Illness. Med. Sci. Sports Exerc. 2012, 44, 18–26. [CrossRef]
57. Castro-Sepulveda, M.; Johannsen, N.; Astudillo, S.; Jorquera, C.; Álvarez, C.; Zbinden-Foncea, H.; Ramírez-Campillo, R. Effects ofBeer, Non-Alcoholic Beer and Water Consumption before Exercise on Fluid and Electrolyte Homeostasis in Athletes. Nutrients2016, 8, 345. [CrossRef] [PubMed]
58. Desbrow, B.; Murray, D.; Leveritt, M. Beer as a Sports Drink? Manipulating Beer’s Ingredients to Replace Lost Fluid. Int. J. SportNutr. Exerc. Metab. 2013, 23, 593–600. [CrossRef] [PubMed]
59. Desbrow, B.; Cecchin, D.; Jones, A.; Grant, G.; Irwin, C.; Leveritt, M. Manipulations to the Alcohol and Sodium Content of Beerfor Postexercise Rehydration. Int. J. Sport Nutr. Exerc. Metab. 2015, 25, 262–270. [CrossRef] [PubMed]
60. Wijnen, A.H.C.; Steennis, J.; Catoire, M.; Wardenaar, F.C.; Mensink, M. Post-Exercise Rehydration: Effect of Consumption of Beerwith Varying Alcohol Content on Fluid Balance after Mild Dehydration. Front. Nutr. 2016, 3, 45. [CrossRef] [PubMed]
61. Krennhuber, K.; Kahr, H.; Jäger, A. Suitability of Beer as An Alternative to Classical Fitness Drinks. Curr. Res. Nutr. Food Sci. J.2016, 4, 26–31. [CrossRef]
62. Blackmore, H.; Hidrio, C.; Godineau, P.; Yeomans, M.R. The effect of implicit and explicit extrinsic cues on hedonic and sensoryexpectations in the context of beer. Food Qual. Prefer. 2019, 81, 103855. [CrossRef]
63. Fukuda, M. The effects of non-alcoholic beer on response inhibition: An open-label study. Learn. Motiv. 2019, 66, 46–54. [CrossRef]64. Bucher, T.; Frey, E.; Wilczynska, M.; Deroover, K.; Dohle, S. Consumer perception and behaviour related to low-alcohol wine: Do
people overcompensate? Public Health Nutr. 2020, 23, 1939–1947. [CrossRef]65. Smeets, P.A.M.; De Graaf, C. Brain Responses to Anticipation and Consumption of Beer with and without Alcohol. Chem. Senses
2018, 44, 51–60. [CrossRef]66. Frost, R.; Quiñones, I.; Veldhuizen, M.; Alava, J.-I.; Small, D.; Carreiras, M. What Can the Brain Teach Us about Winemaking? An
fMRI Study of Alcohol Level Preferences. PLoS ONE 2015, 10, e0119220. [CrossRef]67. Naspetti, S.; Alberti, F.; Mozzon, M.; Zingaretti, S.; Zanoli, R. Effect of information on consumer preferences and willingness-to-pay
for sparkling mock wines. Br. Food J. 2020, 122, 2621–2638. [CrossRef]68. Lachenmeier, D.W.; Pflaum, T.; Nieborowsky, A.; Mayer, S.; Rehm, J. Alcohol-free spirits as novel alcohol placebo—A viable
approach to reduce alcohol-related harms? Int. J. Drug Policy 2016, 32, 1–2. [CrossRef] [PubMed]
194
Nutrients 2021, 13, 3153
69. Saliba, A.J.; Ovington, L.A.; Moran, C.C. Consumer demand for low-alcohol wine in an Australian sample. Int. J. Wine Res. 2013,5, 1–8. [CrossRef]
70. Stanco, M.; Lerro, M.; Marotta, G. Consumers’ Preferences for Wine Attributes: A Best-Worst Scaling Analysis. Sustainability 2020,12, 2819. [CrossRef]
71. Paixão, J.A.; Filho, E.T.; Bolini, H.M.A. Investigation of Alcohol Factor Influence in Quantitative Descriptive Analysis and in theTime-Intensity Profile of Alcoholic and Non-Alcoholic Commercial Pilsen Beers Samples. Beverages 2020, 6, 73. [CrossRef]
72. Chrysochou, P. Drink to get drunk or stay healthy? Exploring consumers’ perceptions, motives and preferences for light beer.Food Qual. Prefer. 2014, 31, 156–163. [CrossRef]
73. Vasiljevic, M.; Couturier, D.-L.; Marteau, T.M. What are the perceived target groups and occasions for wines and beers labelledwith verbal and numerical descriptors of lower alcohol strength? An experimental study. BMJ Open 2019, 9, e024412. [CrossRef]
74. Silva, A.P.; Jager, G.; van Bommel, R.; van Zyl, H.; Voss, H.-P.; Hogg, T.; Pintado, M.M.; de Graaf, C. Functional or emotional?How Dutch and Portuguese conceptualise beer, wine and non-alcoholic beer consumption. Food Qual. Prefer. 2016, 49, 54–65.[CrossRef]
75. Silva, A.P.; Jager, G.; Voss, H.-P.; van Zyl, H.; Hogg, T.; Pintado, M.; de Graaf, C. What’s in a name? The effect of congruent andincongruent product names on liking and emotions when consuming beer or non-alcoholic beer in a bar. Food Qual. Prefer. 2016,55, 58–66. [CrossRef]
76. Vasiljevic, M.; Coulter, L.; Petticrew, M.; Marteau, T.M. Marketing messages accompanying online selling of low/er and regularstrength wine and beer products in the UK: A content analysis. BMC Public Health 2018, 18, 147. [CrossRef]
77. Vasiljevic, M.; Couturier, D.L.; Marteau, T.M. Impact of low alcohol verbal descriptors on perceived strength: An experimentalstudy. Br. J. Health Psychol. 2018, 23, 38–67. [CrossRef]
78. Vasiljevic, M.; Couturier, D.-L.; Frings, D.; Moss, A.; Albery, I.; Marteau, T.M. Impact of lower strength alcohol labeling onconsumption: A randomized controlled trial. Health Psychol. 2018, 37, 658–667. [CrossRef] [PubMed]
79. Vasiljevic, M.; Couturier, D.; Marteau, T.M. Supplemental Material for Impact on Product Appeal of Labeling Wine and Beer With(a) Lower Strength Alcohol Verbal Descriptors and (b) Percent Alcohol by Volume (%ABV): An Experimental Study. Psychol.Addict. Behav. 2018, 32, 779. [CrossRef] [PubMed]
80. Llopis, E.J.; O’Donnell, A.; Anderson, P. Impact of price promotion, price, and minimum unit price on household purchases oflow and no alcohol beers and ciders: Descriptive analyses and interrupted time series analysis of purchase data from 70, 303British households, 2015–2018 and first half of 2020. Soc. Sci. Med. 2021, 270, 113690. [CrossRef] [PubMed]
81. Srivastava, P.; McLaren, K.R.; Wohlgenant, M.; Zhao, X. Disaggregated econometric estimation of consumer demand response byalcoholic beverage types. Aust. J. Agric. Resour. Econ. 2014, 59, 412–432. [CrossRef]
82. Vandenberg, B.; Jiang, H.; Livingston, M. Effects of changes to the taxation of beer on alcohol consumption and governmentrevenue in Australia. Int. J. Drug Policy 2019, 70, 1–7. [CrossRef]
83. European Commission. PEFCR for Beer. Available online: https://ec.europa.eu/environment/eussd/smgp/pdf/Beer%20PEFCR%20June%202018%20final.pdf (accessed on 1 September 2021).
195

nutrients
Article
Nature and Potential Impact of Alcohol Health Warning Labels:A Scoping Review
Daša Kokole 1,*, Peter Anderson 1,2 and Eva Jané-Llopis 1,3,4
Citation: Kokole, D.; Anderson, P.;
Jané-Llopis, E. Nature and Potential
Impact of Alcohol Health Warning
Labels: A Scoping Review. Nutrients
2021, 13, 3065. https://doi.org/
10.3390/nu13093065
Academic Editor: Joerg Koenigstorfer
Received: 21 July 2021
Accepted: 27 August 2021
Published: 31 August 2021
Publisher’s Note: MDPI stays neutral
with regard to jurisdictional claims in
published maps and institutional affil-
iations.
Copyright: © 2021 by the authors.
Licensee MDPI, Basel, Switzerland.
This article is an open access article
distributed under the terms and
conditions of the Creative Commons
Attribution (CC BY) license (https://
creativecommons.org/licenses/by/
4.0/).
1 Department of Health Promotion, CAPHRI Care and Public Health Research Institute, Maastricht University,POB 616, 6200 MD Maastricht, The Netherlands; [email protected] (P.A.);[email protected] (E.J.-L.)
2 Population Health Sciences Institute, Newcastle University, Baddiley-Clark Building, Richardson Road,Newcastle upon Tyne NE2 4AX, UK
3 ESADE Business School, University Ramon Llull, Avenida de Pedralbes, 60-62, 08034 Barcelona, Spain4 Institute for Mental Health Policy Research, CAMH, 33 Russell Street, Toronto, ON M5S 2S1, Canada* Correspondence: [email protected]
Abstract: Alcohol is toxic to human health. In addition to providing nutritional information, labelson alcohol products can be used to communicate warnings on alcohol-related harms to consumers.This scoping review examined novel or enhanced health warning labels to assess the current stateof the research and the key studied characteristics of labels, along with their impact on the studiedoutcomes. Four databases (Web of Science, MEDLINE, PsycInfo, CINAHL) were searched betweenJanuary 2010 and April 2021, and 27 papers were included in the review. The results found that moststudies were undertaken in English-speaking populations, with the majority conducted online or inthe laboratory setting as opposed to the real world. Seventy percent of the papers included at leastone cancer-related message, in most instances referring either to cancer in general or to bowel cancer.Evidence from the only real-world long-term labelling intervention demonstrated that alcohol healthwarning labels designed to be visible and contain novel and specific information have the potentialto be part of an effective labelling strategy. Alcohol health warning labels should be seen as tools toraise awareness on alcohol-related risks, being part of wider alcohol policy approaches.
Keywords: alcohol; labelling; health warning labels; effectiveness; implementation
1. Introduction
Globally, 5.3% of all deaths and 5.0% of all disability adjusted life years are causedby ethanol [1], a toxic substance [2]. Alcohol consumption is causally related to morethan 40 ICD-10 three-digit categories [3], including non-communicable diseases such asliver disease [4], cancers of the colon, liver and breast [5–7], alcohol use disorders [8], non-ischaemic cardiovascular diseases [9]; communicable diseases such as tuberculosis [10];and intentional and unintentional injuries [3]. Alcohol can also impair mental health (par-ticularly depression [11,12]) and cause harm to others, such as in foetal alcohol spectrumdisorders [13,14].
Despite alcohol’s detrimental effect on a variety of health outcomes, public awarenessabout some health risks associated with alcohol consumption remains relatively low. A2018 review of 32 studies found that while awareness of alcohol as a risk factor for cancervaries by country, in most studies, less than half of the respondents correctly identifiedthe alcohol–cancer link [15]. This finding is confirmed in more recent studies [16–18],which additionally found that awareness of the link between alcohol and cancer differedby type of cancer (e.g., the link between alcohol and breast cancer tended to be the leastwell known).
One of the approaches to raise awareness of the health risks associated with alcoholconsumption can be product labelling. A review from 2013 on enhanced labelling [19]
Nutrients 2021, 13, 3065. https://doi.org/10.3390/nu13093065 https://www.mdpi.com/journal/nutrients197
Nutrients 2021, 13, 3065
identified five elements that could be useful to consumers: a list of ingredients, nutritionalinformation, serving size and servings per container, a definition of moderate intake (lowrisk drinking guidelines) and a health warning label (HWL). While the majority of coun-tries have mandated alcohol volume content on the labels [20], this is not the case withnutritional or health labelling. In many of the high consumption regions, such as EU coun-tries, UK, US, Australia, New Zealand and Canada, alcoholic beverages are exempt fromregulations to include nutritional information (for example, nutritional values and caloriecontent) on the product label [21–24], as opposed to non-alcoholic drinks and food products.Nutritional labelling policy thus leaves much room for improvement, with clear guidelinesavailable on how information should be presented based on the requirements for food andnon-alcoholic beverages should nutritional labels be mandated for alcoholic beverages.Whilst there is scarce alcohol-specific research on nutrition information [25,26], much isknown from the nutrition field on enhanced presentation of nutritional information [27,28],which could be applied to alcoholic beverages.
There is little available evidence on the effectiveness of health warning labels thatwould inform consumers about the risks associated with alcohol consumption. Most olderstudies examining the effectiveness of implemented health warning messages report on theUS health warning label, which focuses on risks surrounding drinking during pregnancy,and has not changed since its introduction in 1989 [29,30]. More recent studies on existinghealth warning labelling schemes, either mandatory [31,32] or voluntary [33–35], showthat the existing labels (e.g., pregnancy logo or responsibility message) are suboptimal andare either not being noticed or not being understood. However, evidence from tobaccoshows that health warning labels can be a very important part of the broader packageof interventions [36,37], and there have been calls to apply tobacco-style health warninglabels to alcohol products [38]. Given the evidence for the less effective existing alcoholHWL, this review focuses on examining evidence with regard to novel (not previouslyimplemented in practice) or enhanced labels (improved versions of existing ones).
The importance of labelling is recognised by the World Health Organisation, whoseglobal strategy to reduce the harmful use of alcohol [39] calls for providing consumerinformation about the harm related to alcohol and labelling alcoholic beverages to indicatesuch risks. Awareness of such information is, in turn, linked to increased public supportfor more stringent policies, such as taxation [40,41], and can therefore be an importantpart of effective alcohol policy. There has been increased interest among policymakers toprovide health information to consumers through labels. Ireland passed the Public HealthAlcohol Act in 2018, mandating cancer warnings on labels [42] and becoming only thesecond country in the world after South Korea so to do [20], but nothing else has beenimplemented as of 2021. There has also been increased research activity, and a numberof labelling-related reviews have been published recently. Previous reviews focusing onalcohol HWL operated with a relative scarcity of studies [43], focused only on one aspect ofthe label (image vs. text) [44] or made a brief narrative overview of health labelling studiesas part of broader alcohol labelling [45]. Whilst our work partially overlaps with otherreviews in examining the impact of labels, our review adds a thorough and systematicexamination of the scope of (quasi-)experimental research on new or enhanced healthwarning labels, including an overview of the labels used in the studies and the explanatoryvariables studied. As there is not a single definition of “alcohol HWL”, labels can differin how they are developed, implemented and evaluated, and the current review aims tocontextualise impacts in light of this information. As health warning labels, we considerlabels that are containing information on the relationship between alcohol and healthoutcomes. We do not focus on drinking guidelines and standard drinks labelling, as thishas been carried out elsewhere [46].
Thus, the aim of this scoping review is to examine the peer-reviewed literature study-ing novel or enhanced health warning labels and to answer two research questions: (1) whatis the scope of the current alcohol HWL research (in terms of research aims, studied in-
198
Nutrients 2021, 13, 3065
dependent variables, the outcomes of interest, as well as label content and format), and(2) what is the impact of the labels and key label characteristics on the studied outcomes?
2. Methods
2.1. Design
To answer the research questions, we used scoping review methodology, guided bythe methodological framework of Arksey and O’Malley [47]. Scoping reviews are used tomap the main concepts in the research area and present a broad overview of the existingevidence, including identification of the gaps, regardless of the study quality [48]. Theprotocol was not published in advance, and the results are reported in accordance withPRISMA-ScR checklist [49].
2.2. Eligibility Criteria
To be included in the review, studies had to evaluate new or enhanced alcohol healthwarning labels in any population. By “new”, we considered labels developed for thepurpose of the research and not previously implemented in practice, and by “enhanced”,we considered improved versions of existing labels already implemented in practice.Studies had to include experimental or quasi-experimental methodology with clearlydelineated independent and dependent variables, in order to be able to synthesise resultsbased on the manipulated variables and to identify the key characteristics of effectivelabels. Only peer-reviewed articles in the English language published in 2010 or afterwere included, as in the previous reviews, there were no older experimental studies ofnew messages. Studies that did not include health warning messages, that focused onqualitative data or were only cross-sectional evaluations were excluded.
2.3. Information Sources and Search Strategy
Four databases (Web of Science, MEDLINE, PsycInfo, CINAHL) were searched withthe abovementioned restrictions on language and dates (English language, January 2010–April 2021). Additionally, we complemented the database searches with inspection ofreference lists of relevant articles and reviews, and we undertook a Google Scholar search.The search strategy contained a combination of terms related to alcohol labelling: [alcoholAND (label OR label*) AND (message OR information OR warning) AND (experiment*OR eval* OR effect)].
2.4. Study Selection and Summary
Study selection was performed by one researcher according to the abovementionedinclusion and exclusion criteria, with ambiguous cases being resolved through consultationwith the second researcher. After the removal of duplicates, the studies were first screenedby title and abstract, followed by full text examination and final article selection. Next, thedata were charted to answer the main research questions. Next to general information onthe papers’ aim and methodology, information on label development and implementationwas charted, as well as the independent studied variables and the results for each of theoutcomes. Papers rather than studies were taken as the units of interest, as the focus of thereview was to appraise the scope of the published literature and to identify results for allthe studied outcomes.
3. Results
In total, we identified 27 papers that fit our inclusion criteria (see Appendix A forPRISMA diagram) [50–76]. One paper reported on two studies using different method-ologies to study the same variables [50], and four papers reported on different aspects ofone intervention [51–54]. The remaining papers were individual studies (with a completeor partial focus on alcohol HWL labelling), although some of them were part of the sameresearch line of label development and testing (e.g., [55–60]) or studied the same labels(e.g., [61,62]).
199
Nutrients 2021, 13, 3065
Table 1 provides an overview of the papers with their aim and methodology. Two-thirds (18) of the included papers were published in 2018 or later, indicating an increasingresearch interest in the topic. All of the research was undertaken in Western countries:most papers reported on research conducted in the UK (nine), Canada (six) and Australia(five). The remaining papers reported on research conducted in the US (three), Germany(two) or were multi-country (twice Luxembourg/Germany, and once Italy/France). Onlyfour papers described real-world interventions. The remainder of the studies were eitherconducted online (sixteen) or in a laboratory (eight, of which one was in a naturalisticshopping laboratory). Six studies had under 100 participants, eleven studies had above1000 participants and one study relied on sales data. The majority (80%) of the studies with alower number of participants were conducted in the laboratory and before 2018, indicatingthat in recent years, larger sample sizes were accessible in an easier manner throughonline panels. Two-thirds of the papers focused on the general adult (of legal drinkingage in the country) drinking population, although the exact inclusion criteria differed andranged from people drinking at least once in the past 12 months, to people consumingalcohol weekly. Eight of the papers focused on the younger population/students (someby convenience rather than by inclusion criteria) and one paper focused on secondaryschool students.
3.1. Research Scope
To answer the first research question, we looked at the aim of the papers and thevariables studied (both independent variables and the outcomes), as well as at the contentand format of the studied labels.
In terms of study aims and studied independent variables, five papers (19%) comparedonly new or enhanced labels with no or regular labels [51–54,63]. Focusing on label content,eight papers (30%) compared text-only labels with text and image labels [55,56,61,62,64–67],twelve studies (44%) compared text message characteristics (e.g., content, specificity, fram-ing, source, use of causal language) [57–60,67–74] and three (11%) compared image char-acteristics [57,66,75]. Four (15%) papers compared label formats, such as size, position,colour or branding [50,64,70,76]. Additionally, nine papers (33%) studied other variables,such as alcohol content, alcohol/substance type, efficacy information, expectancy andself-affirmation [64–66,68,69,73–76].
The majority of papers investigated more than one outcome (Table 2). The mostcommonly studied outcomes were attitude (41% of the papers), intentions (30%), emotion-related outcomes (e.g., fear, worry) (26%) and acceptability/support for the labels (26%).Behaviour was studied in six papers (22%)—in three of them through self-report [51,54,67],but also through purchasing [53,56] or consuming alcohol [62].
The tested labels were predominantly developed by the researchers themselves, basedeither on other research (e.g., related to tobacco and alcohol labels, alcohol harm, effectivemessages) or on own development and piloting (e.g., through qualitative studies), or both.In the four papers related to a real-world intervention [51–54], the labels were additionally(next to own and other research) developed in consultation with local stakeholders. Intwo cases, the labels used in the research were developed by a non-governmental or-ganisation [67,75], and in one case [50], existing voluntary labels were enhanced basedon theory.
200
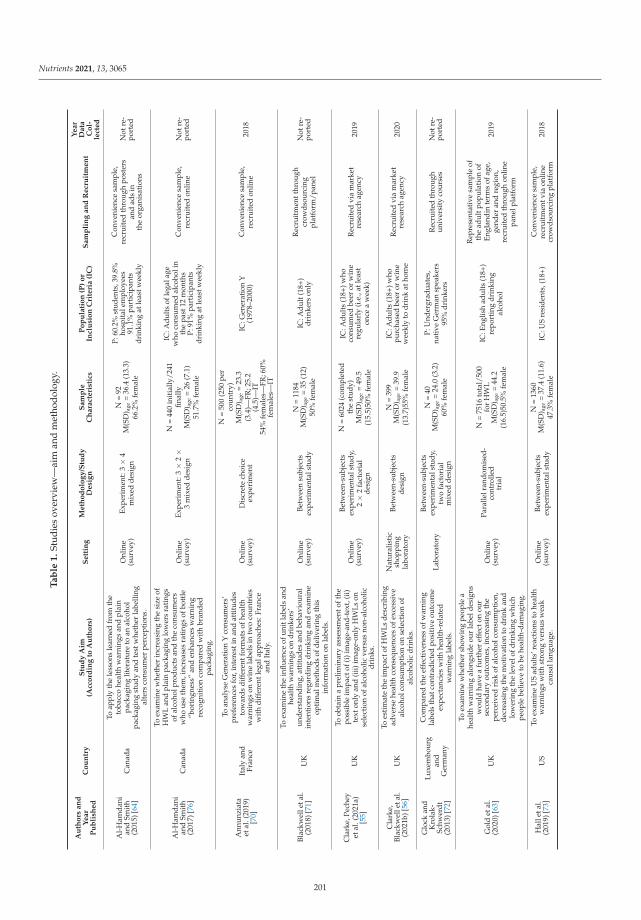
Nutrients 2021, 13, 3065
Ta
ble
1.
Stud
ies
over
view
—ai
man
dm
etho
dolo
gy.
Au
tho
rsa
nd
Ye
ar
Pu
bli
she
dC
ou
ntr
yS
tud
yA
im(A
cco
rdin
gto
Au
tho
rs)
Se
ttin
gM
eth
od
olo
gy
/Stu
dy
De
sig
nS
am
ple
Ch
ara
cte
rist
ics
Po
pu
lati
on
(P)
or
Incl
usi
on
Cri
teri
a(I
C)
Sa
mp
lin
ga
nd
Re
cru
itm
en
t
Ye
ar
Da
taC
ol-
lect
ed
Al-
Ham
dani
and
Smit
h(2
015)
[64]
Can
ada
Toap
ply
the
less
ons
lear
ned
from
the
toba
cco
heal
thw
arni
ngs
and
plai
npa
ckag
ing
liter
atur
eto
anal
coho
lpa
ckag
ing
stud
yan
dte
stw
heth
erla
belli
ngal
ters
cons
umer
perc
epti
ons.
Onl
ine
(sur
vey)
Expe
rim
ent:
3×
4m
ixed
desi
gn
N=
92M
(SD
) age
=36
.4(1
3.3)
66.2
%fe
mal
e
P:60
.2%
stud
ents
,39.
8%ho
spit
alem
ploy
ees
91.1
%pa
rtic
ipan
tsdr
inki
ngat
leas
twee
kly
Con
veni
ence
sam
ple,
recr
uite
dth
roug
hpo
ster
san
dad
sin
the
orga
nisa
tion
s
Not
re-
port
ed
Al-
Ham
dani
and
Smit
h(2
017)
[76]
Can
ada
Toex
amin
ew
heth
erin
crea
sing
the
size
ofH
WL
and
plai
npa
ckag
ing
low
ers
rati
ngs
ofal
coho
lpro
duct
san
dth
eco
nsum
ers
who
use
them
,inc
reas
esra
ting
sof
bott
le“b
orin
gnes
s”an
den
hanc
esw
arni
ngre
cogn
itio
nco
mpa
red
wit
hbr
ande
dpa
ckag
ing.
Onl
ine
(sur
vey)
Expe
rim
ent:
3×
2×
3m
ixed
desi
gn
N=
440
init
ially
/241
final
lyM
(SD
) age
=26
(7.1
)51
.7%
fem
ale
IC:A
dult
sof
lega
lage
who
cons
umed
alco
holi
nth
epa
st12
mon
ths
P:91
%pa
rtic
ipan
tsdr
inki
ngat
leas
twee
kly
Con
veni
ence
sam
ple,
recr
uite
don
line
Not
re-
port
ed
Ann
unzi
ata
etal
.(20
19)
[70]
Ital
yan
dFr
ance
Toan
alys
eG
ener
atio
nY
cons
umer
s’pr
efer
ence
sfo
r,in
tere
stin
and
atti
tude
sto
war
dsdi
ffer
entf
orm
ats
ofhe
alth
war
ning
son
win
ela
bels
intw
oco
untr
ies
wit
hdi
ffer
entl
egal
appr
oach
es:F
ranc
ean
dIt
aly.
Onl
ine
(sur
vey)
Dis
cret
ech
oice
expe
rim
ent
N=
500
(250
per
coun
try)
M(S
D) a
ge=
23.3
(3.4
)—FR
;25.
2(4
.5)—
IT54
%fe
mal
es—
FR;6
0%fe
mal
es—
IT
IC:G
ener
atio
nY
(197
8–20
00)
Con
veni
ence
sam
ple,
recr
uite
don
line
2018
Blac
kwel
leta
l.(2
018)
[71]
UK
Toex
amin
eth
ein
fluen
ceof
unit
labe
lsan
dhe
alth
war
ning
son
drin
kers
’un
ders
tand
ing,
atti
tude
san
dbe
havi
oura
lin
tent
ions
rega
rdin
gdr
inki
ngan
dex
amin
eop
tim
alm
etho
dsof
deliv
erin
gth
isin
form
atio
non
labe
ls.
Onl
ine
(sur
vey)
Betw
een
subj
ects
expe
rim
enta
lstu
dy
N=
1184
M(S
D) a
ge=
35(1
2)50
%fe
mal
e
IC:A
dult
(18+
)dr
inke
rson
ly
Rec
ruit
men
tthr
ough
crow
dsou
rcin
gpl
atfo
rm/p
anel
Not
re-
port
ed
Cla
rke,
Pech
eyet
al.(
2021
a)[5
5]U
K
Toob
tain
apr
elim
inar
yas
sess
men
toft
hepo
ssib
leim
pact
of(i
)im
age-
and-
text
,(ii)
text
only
and
(iii)
imag
e-on
lyH
WLs
onse
lect
ion
ofal
coho
licve
rsus
non-
alco
holic
drin
ks.
Onl
ine
(sur
vey)
Betw
een-
subj
ects
expe
rim
enta
lstu
dy,
2×
2fa
ctor
ial
desi
gn
N=
6024
(com
plet
edth
est
udy)
M(S
D) a
ge=
49.5
(15.
5)50
%fe
mal
e
IC:A
dult
s(1
8+)w
hoco
nsum
edbe
eror
win
ere
gula
rly
(i.e
.,at
leas
ton
cea
wee
k)
Rec
ruit
edvi
am
arke
tre
sear
chag
ency
2019
Cla
rke,
Blac
kwel
leta
l.(2
021b
)[56
]U
K
Toes
tim
ate
the
impa
ctof
HW
Lsde
scri
bing
adve
rse
heal
thco
nseq
uenc
esof
exce
ssiv
eal
coho
lcon
sum
ptio
non
sele
ctio
nof
alco
holic
drin
ks.
Nat
ural
isti
csh
oppi
ngla
bora
tory
Betw
een-
subj
ects
desi
gn
N=
399
M(S
D) a
ge=
39.9
(13.
7)55
%fe
mal
e
IC:A
dult
s(1
8+)w
hopu
rcha
sed
beer
orw
ine
wee
kly
todr
ink
atho
me
Rec
ruit
edvi
am
arke
tre
sear
chag
ency
2020
Glo
ckan
dK
rola
k-Sc
hwer
dt(2
013)
[72]
Luxe
mbo
urg
and
Ger
man
y
Com
pare
dth
eef
fect
iven
ess
ofw
arni
ngla
bels
that
cont
radi
cted
posi
tive
outc
ome
expe
ctan
cies
wit
hhe
alth
-rel
ated
war
ning
labe
ls.
Labo
rato
ry
Betw
een-
subj
ects
expe
rim
enta
lstu
dy,
two
fact
oria
lm
ixed
desi
gn
N=
40M
(SD
) age
=24
.0(3
.2)
60%
fem
ale
P:U
nder
grad
uate
s,na
tive
Ger
man
spea
kers
95%
drin
kers
Rec
ruit
edth
roug
hun
iver
sity
cour
ses
Not
re-
port
ed
Gol
det
al.
(202
0)[6
3]U
K
Toex
amin
ew
heth
ersh
owin
gpe
ople
ahe
alth
war
ning
alon
gsid
eou
rla
beld
esig
nsw
ould
have
afu
rthe
ref
fect
onou
rse
cond
ary
outc
omes
,inc
reas
ing
the
perc
eive
dri
skof
alco
holc
onsu
mpt
ion,
decr
easi
ngth
em
otiv
atio
nto
drin
kan
dlo
wer
ing
the
leve
lofd
rink
ing
whi
chpe
ople
belie
veto
behe
alth
-dam
agin
g.
Onl
ine
(sur
vey)
Para
llelr
ando
mis
ed-
cont
rolle
dtr
ial
N=
7516
tota
l/50
0fo
rH
WL
M(S
D) a
ge=
44.2
(16.
5)50
.5%
fem
ale
IC:E
nglis
had
ults
(18+
)re
port
ing
drin
king
alco
hol
Rep
rese
ntat
ive
sam
ple
ofth
ead
ultp
opul
atio
nof
Engl
andi
nte
rms
ofag
e,ge
nder
and
regi
on,
recr
uite
dth
roug
hon
line
pane
lpla
tfor
m
2019
Hal
leta
l.(2
019)
[73]
US
Toex
amin
eU
Sad
ults
’rea
ctio
nsto
heal
thw
arni
ngs
wit
hst
rong
vers
usw
eak
caus
alla
ngua
ge.
Onl
ine
(sur
vey)
Betw
een-
subj
ects
expe
rim
enta
lstu
dy
N=
1360
M(S
D) a
ge=
37.4
(11.
6)47
.3%
fem
ale
IC:U
Sre
side
nts,
(18+
)C
onve
nien
cesa
mpl
e,re
crui
tmen
tvia
onlin
ecr
owds
ourc
ing
plat
form
2018
201
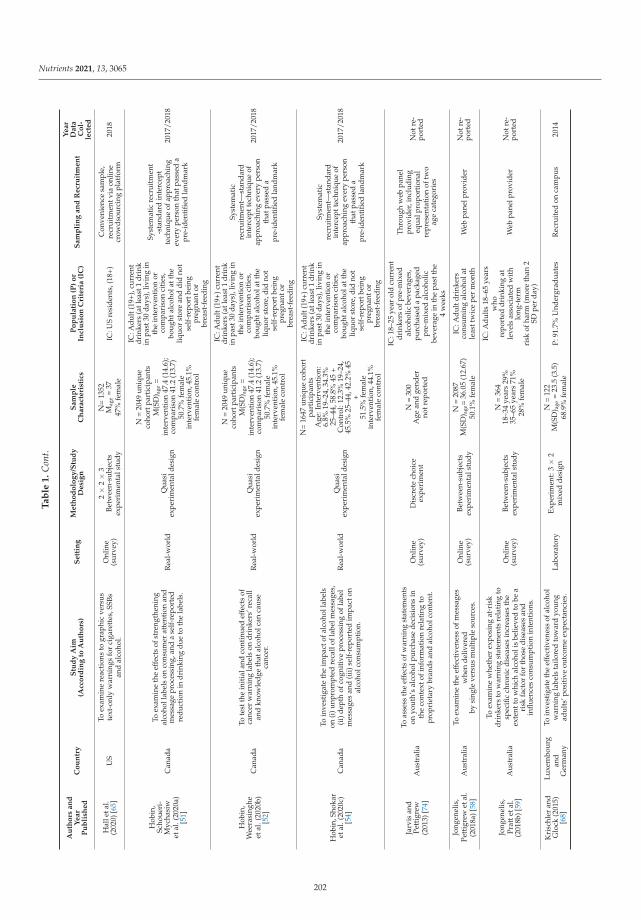
Nutrients 2021, 13, 3065
Ta
ble
1.
Con
t.
Au
tho
rsa
nd
Ye
ar
Pu
bli
she
dC
ou
ntr
yS
tud
yA
im(A
cco
rdin
gto
Au
tho
rs)
Se
ttin
gM
eth
od
olo
gy
/Stu
dy
De
sig
nS
am
ple
Ch
ara
cte
rist
ics
Po
pu
lati
on
(P)
or
Incl
usi
on
Cri
teri
a(I
C)
Sa
mp
lin
ga
nd
Re
cru
itm
en
t
Ye
ar
Da
taC
ol-
lect
ed
Hal
leta
l.(2
020)
[65]
US
Toex
amin
ere
acti
ons
togr
aphi
cve
rsus
text
-onl
yw
arni
ngs
for
ciga
rett
es,S
SBs
and
alco
hol.
Onl
ine
(sur
vey)
2×
2×
3Be
twee
n-su
bjec
tsex
peri
men
tals
tudy
N=
1352
Mag
e=
3747
%fe
mal
eIC
:US
resi
dent
s,(1
8+)
Con
veni
ence
sam
ple,
recr
uitm
entv
iaon
line
crow
dsou
rcin
gpl
atfo
rm20
18
Hob
in,
Scho
ueri
-M
ycha
siw
etal
.(20
20a)
[51]
Can
ada
Toex
amin
eth
eef
fect
sof
stre
ngth
enin
gal
coho
llab
els
onco
nsum
erat
tent
ion
and
mes
sage
proc
essi
ng,a
nda
self
-rep
orte
dre
duct
ion
indr
inki
ngdu
eto
the
labe
ls.
Rea
l-w
orld
Qua
siex
peri
men
tald
esig
n
N=
2049
uniq
ueco
hort
part
icip
ants
M(S
D) a
ge=
inte
rven
tion
47.4
(14.
6);
com
pari
son
41.2
(13.
7)50
.7%
fem
ale
inte
rven
tion
,45.
1%fe
mal
eco
ntro
l
IC:A
dult
(19+
),cu
rren
tdr
inke
rs(a
tlea
st1
drin
kin
past
30da
ys),
livin
gin
the
inte
rven
tion
orco
mpa
riso
nci
ties
,bo
ught
alco
hola
tthe
liquo
rst
ore
and
did
not
self
-rep
ortb
eing
preg
nant
orbr
east
-fee
ding
Syst
emat
icre
crui
tmen
t-s
tand
ard
inte
rcep
tte
chni
que
ofap
proa
chin
gev
ery
pers
onth
atpa
ssed
apr
e-id
enti
fied
land
mar
k
2017
/201
8
Hob
in,
Wee
rasi
nghe
etal
.(20
20b)
[52]
Can
ada
Tote
stth
ein
itia
land
cont
inue
def
fect
sof
canc
erw
arni
ngla
bels
ondr
inke
rs’r
ecal
lan
dkn
owle
dge
that
alco
holc
anca
use
canc
er.
Rea
l-w
orld
Qua
siex
peri
men
tald
esig
n
N=
2049
uniq
ueco
hort
part
icip
ants
M(S
D) a
ge=
inte
rven
tion
47.4
(14.
6);
com
pari
son
41.2
(13.
7)50
.7%
fem
ale
inte
rven
tion
,45.
1%fe
mal
eco
ntro
l
IC:A
dult
(19+
)cur
rent
drin
kers
(atl
east
1dr
ink
inpa
st30
days
),liv
ing
inth
ein
terv
enti
onor
com
pari
son
citi
es,
boug
htal
coho
latt
heliq
uor
stor
e,di
dno
tse
lf-r
epor
tbei
ngpr
egna
ntor
brea
st-f
eedi
ng
Syst
emat
icre
crui
tmen
t—st
anda
rdin
terc
eptt
echn
ique
ofap
proa
chin
gev
ery
pers
onth
atpa
ssed
apr
e-id
enti
fied
land
mar
k
2017
/201
8
Hob
in,S
hoka
ret
al.(
2020
c)[5
4]C
anad
a
Toin
vest
igat
eth
eim
pact
ofal
coho
llab
els
on(i
)unp
rom
pted
reca
llof
labe
lmes
sage
s,(i
i)de
pth
ofco
gnit
ive
proc
essi
ngof
labe
lm
essa
ges
and
(iii)
self
-rep
orte
dim
pact
onal
coho
lcon
sum
ptio
n.
Rea
l-w
orld
Qua
siex
peri
men
tald
esig
n
N=
1647
uniq
ueco
hort
part
icip
ants
Age
:Int
erve
ntio
n:6.
8%19
–24,
34.3
%25
–44,
58.8
%45
+C
ontr
ol:1
2.3%
19–2
4,45
.5%
25–4
4,42
.2%
45+
51.5
%fe
mal
ein
terv
enti
on,4
4.1%
fem
ale
cont
rol
IC:A
dult
(19+
)cur
rent
drin
kers
(atl
east
1dr
ink
inpa
st30
days
),liv
ing
inth
ein
terv
enti
onor
com
pari
son
citi
es,
boug
htal
coho
latt
heliq
uor
stor
e,di
dno
tse
lf-r
epor
tbei
ngpr
egna
ntor
brea
st-f
eedi
ng
Syst
emat
icre
crui
tmen
t—st
anda
rdin
terc
eptt
echn
ique
ofap
proa
chin
gev
ery
pers
onth
atpa
ssed
apr
e-id
enti
fied
land
mar
k
2017
/201
8
Jarv
isan
dPe
ttig
rew
(201
3)[7
4]A
ustr
alia
Toas
sess
the
effe
cts
ofw
arni
ngst
atem
ents
onyo
uth’
sal
coho
lpur
chas
ede
cisi
ons
inth
eco
ntex
tofi
nfor
mat
ion
rela
ting
topr
opri
etar
ybr
ands
and
alco
holc
onte
nt.
Onl
ine
(sur
vey)
Dis
cret
ech
oice
expe
rim
ent
N=
300
Age
and
gend
erno
trep
orte
d
IC:1
8–25
year
old
curr
ent
drin
kers
ofpr
e-m
ixed
alco
holic
beve
rage
s,pu
rcha
sed
apa
ckag
edpr
e-m
ixed
alco
holic
beve
rage
inth
epa
stth
e4
wee
ks
Thr
ough
web
pane
lpr
ovid
er,i
nclu
ding
equa
lpro
port
iona
lre
pres
enta
tion
oftw
oag
eca
tego
ries
Not
re-
port
ed
Jong
enel
is,
Pett
igre
wet
al.
(201
8a)[
58]
Aus
tral
iaTo
exam
ine
the
effe
ctiv
enes
sof
mes
sage
sw
hen
deliv
ered
bysi
ngle
vers
usm
ulti
ple
sour
ces.
Onl
ine
(sur
vey)
Betw
een-
subj
ects
expe
rim
enta
lstu
dy
N=
2087
M(S
D) a
ge=
36.0
5(1
2.67
)50
.1%
fem
ale
IC:A
dult
drin
kers
cons
umin
gal
coho
lat
leas
ttw
ice
per
mon
thW
ebpa
nelp
rovi
der
Not
re-
port
ed
Jong
enel
is,
Prat
teta
l.(2
018b
)[59
]A
ustr
alia
Toex
amin
ew
heth
erex
posi
ngat
-ris
kdr
inke
rsto
war
ning
stat
emen
tsre
lati
ngto
spec
ific
chro
nic
dise
ases
incr
ease
sth
eex
tent
tow
hich
alco
holi
sbe
lieve
dto
bea
risk
fact
orfo
rth
ose
dise
ases
and
influ
ence
sco
nsum
ptio
nin
tent
ions
.
Onl
ine
(sur
vey)
Betw
een-
subj
ects
expe
rim
enta
lstu
dy
N=
364
18–3
4ye
ars
29%
35–6
5ye
ars
71%
28%
fem
ale
IC:A
dult
s18
–65
year
sw
hore
port
eddr
inki
ngat
leve
lsas
soci
ated
wit
hlo
ng-t
erm
risk
ofha
rm(m
ore
than
2SD
per
day)
Web
pane
lpro
vide
rN
otre
-po
rted
Kri
schl
eran
dG
lock
(201
5)[6
8]
Luxe
mbo
urg
and
Ger
man
y
Toin
vest
igat
eth
eef
fect
iven
ess
ofal
coho
lw
arni
ngla
bels
tailo
red
tow
ard
youn
gad
ults
’pos
itiv
eou
tcom
eex
pect
anci
es.
Labo
rato
ryEx
peri
men
t:3×
2m
ixed
desi
gn
N=
122
M(S
D) a
ge=
23.5
(3.5
)68
.9%
fem
ale
P:91
.7%
Und
ergr
adua
tes
Rec
ruit
edon
cam
pus
2014
202

Nutrients 2021, 13, 3065
Ta
ble
1.
Con
t.
Au
tho
rsa
nd
Ye
ar
Pu
bli
she
dC
ou
ntr
yS
tud
yA
im(A
cco
rdin
gto
Au
tho
rs)
Se
ttin
gM
eth
od
olo
gy
/Stu
dy
De
sig
nS
am
ple
Ch
ara
cte
rist
ics
Po
pu
lati
on
(P)
or
Incl
usi
on
Cri
teri
a(I
C)
Sa
mp
lin
ga
nd
Re
cru
itm
en
t
Ye
ar
Da
taC
ol-
lect
ed
Ma
(202
1)[6
9]U
S
Tode
term
ine
the
impa
ctof
pict
oria
lw
arni
ngla
bels
feat
urin
gna
rrat
ive
cont
ent
onri
skpe
rcep
tion
san
dbe
havi
oura
lin
tent
ions
.
Onl
ine
(sur
vey)
Betw
een-
subj
ects
expe
rim
enta
lstu
dy
N=
169
M(S
D) a
ge=
43.2
(11.
5)37
.9%
fem
ale
IC:A
lcoh
olco
nsum
ers
Rec
ruit
edth
roug
hw
ebpa
nelp
rovi
der
Not
re-
port
ed
Mon
ket
al.
(201
7)[6
6]U
KTo
inve
stig
ate
the
amou
ntof
tim
esp
ent
look
ing
atth
edi
ffer
ente
lem
ents
ofal
coho
l-re
late
dhe
alth
war
ning
s.La
bora
tory
Expe
rim
ent:
2×
2×
2m
ixed
fact
oria
lde
sign
N=
22M
(SD
) age
=21
.3(1
.7)
68.2
%fe
mal
eU
nive
rsit
yst
uden
tsO
ppor
tuni
tysa
mpl
ing
Not
re-
port
ed
Mor
gens
tern
etal
.(20
21)
[67]
Ger
man
yTo
inve
stig
ate
impa
ctof
alco
holw
arni
ngla
bels
onkn
owle
dge
and
nega
tive
emot
ions
.
Onl
ine
(sur
vey)
Thre
efa
ctor
ial
expe
rim
ent
N=
9260
M(S
D) a
ge=
12.9
(1.8
)48
.6%
fem
ale
IC:S
econ
dary
scho
olst
uden
ts(1
0–17
)
Rec
ruit
edth
roug
hsc
hool
sfr
omra
ndom
lyse
lect
edsu
b-re
gion
s
2017
–20
18
Pech
eyet
al.
(202
0)[5
7]U
K
tode
scri
beth
epo
tent
iale
ffec
tive
ness
and
acce
ptab
ility
ofim
age-
and-
text
(als
okn
own
aspi
ctor
ialo
rgr
aphi
c)H
WLs
appl
ied
toal
coho
licdr
inks
.
Onl
ine
(sur
vey)
Betw
een-
subj
ects
expe
rim
enta
lstu
dy
N=
5528
M(S
D) a
ge=
47.5
(15.
8)50
.9%
fem
ale
IC:1
8+,s
elf-
repo
rted
cons
umin
gei
ther
beer
orw
ine
atle
asto
nce
aw
eek
Purp
osef
ulsa
mpl
ing
toin
clud
era
nge
ofag
e,ge
nder
and
soci
algr
ades
(rec
ruit
edvi
am
arke
tre
sear
chag
ency
)
2018
Pett
igre
wet
al.
(201
6)[6
0]A
ustr
alia
Toin
vest
igat
eth
epo
tent
iale
ffec
tive
ness
ofal
coho
lwar
ning
stat
emen
tsde
sign
edto
incr
ease
awar
enes
sof
the
alco
hol–
canc
erlin
k.
Onl
ine
(sur
vey)
Betw
een-
subj
ects
expe
rim
enta
lstu
dy
N=
1680
<31
year
s49
.531
–45
year
s25
.246
–65
year
s25
.349
.9%
fem
ale
IC:A
dult
(18–
65)
drin
kers
,con
sum
ing
alco
hola
tlea
sttw
oda
yspe
rm
onth
Web
pane
lpro
vide
rN
otre
-po
rted
Pham
etal
.(2
018)
*[5
0]A
ustr
alia
Toin
vest
igat
eat
tent
ion
ofcu
rren
tin
mar
keta
lcoh
olw
arni
ngla
bels
and
exam
ine
whe
ther
atte
ntio
nca
nbe
enha
nced
thro
ugh
theo
reti
cally
info
rmed
desi
gn.
Stud
y1:
Onl
ine
(sur
vey)
Stud
y2:
Labo
rato
ry
Betw
een-
subj
ects
expe
rim
enta
lstu
dy
Stud
y1:
N=
559
M(S
D) a
ge=
31.9
(7.8
)G
ende
rno
trep
orte
dSt
udy
2:N
=87
M(S
D) a
ge=
26.6
(10.
5)G
ende
rno
tre
port
ed
Stud
y1:
P:72
%em
ploy
ed,6
.6%
full
tim
est
uden
tsSt
udy
2:P
49.4
%fu
llti
me
stud
ents
,41.
4%em
ploy
ed
Stud
y1:
Snow
ball
recr
uitm
ento
nlin
eSt
udy
2:Fa
ceto
face
onca
mpu
s
2015
Sille
ro-R
ejon
etal
.(20
18)
[75]
UK
Toex
amin
ew
heth
eren
hanc
ing
self
-affi
rmat
ion
amon
ga
popu
lati
onof
drin
kers
,pri
orto
view
ing
thre
aten
ing
alco
holp
icto
rial
heal
thw
arni
ngla
bels
,w
ould
redu
cede
fens
ive
reac
tion
san
dpr
omot
ere
acti
ons
rela
ted
tobe
havi
our
chan
ge,a
ndw
heth
erth
ere
isan
inte
ract
ion
betw
een
self
-affi
rmat
ion
and
seve
rity
ofw
arni
ng.
Labo
rato
ryBe
twee
n-su
bjec
tsex
peri
men
tals
tudy
N=
128
M(S
D) a
ge=
22(4
)G
ende
rno
trep
orte
d
IC:A
dult
(18+
)reg
ular
alco
holc
onsu
mer
sw
hoha
veco
nsum
edov
er14
unit
spe
rw
eek
duri
ngth
epr
eced
ing
wee
k
Opp
ortu
nity
sam
plin
g,re
crui
ted
via
e-m
ail,
post
ers
and
web
site
s
Not
re-
port
ed
Staf
ford
and
Salm
on(2
017)
[62]
UK
Tote
stw
heth
erth
esp
eed
ofal
coho
lco
nsum
ptio
nis
influ
ence
dby
the
type
ofal
coho
lhea
lth
war
ning
cont
aine
don
the
beve
rage
.
Labo
rato
ryBe
twee
n-su
bjec
tsex
peri
men
tals
tudy
N=
45M
(SD
) age
=18
.9(1
.1)
100%
fem
ale
IC:F
emal
e(1
8–25
)re
gula
ral
coho
lco
nsum
ers
Rec
ruit
edus
ing
anon
line
syst
eman
dvi
aso
cial
med
ia
Not
re-
port
ed
Wig
gan
dSt
affo
rd(2
016)
[61]
UK
Tote
stth
eef
fect
iven
ess
ofa
rang
eof
alco
holh
ealt
hw
arni
ngs,
com
pari
ngno
heal
thw
arni
ng,t
exto
nly
and
pict
oria
lw
arni
ng.
Labo
rato
ryBe
twee
n-su
bjec
tsex
peri
men
tals
tudy
N=
60M
(SD
) age
=19
.4(3
.1)
71.7
%fe
mal
eIC
:Alc
ohol
cons
umer
sR
ecru
ited
usin
gan
onlin
esy
stem
,rec
eive
dcr
edit
poin
ts
Not
re-
port
ed
Zha
oet
al.
(202
0)[5
3]C
anad
aTo
test
ifth
ela
belli
ngin
terv
enti
onw
asas
soci
ated
wit
hre
duce
dal
coho
lcon
sum
ptio
n.R
eal-
wor
ldQ
uasi
expe
rim
enta
ldes
ign
Mon
thly
reta
ilsa
les
data
,no
indi
vidu
alpa
rtic
ipan
ts
Popu
lati
on15
+in
the
rese
arch
area
s/
2017
/201
8
*tw
ost
udie
sco
nsid
ered
ason
e,as
they
are
stud
ying
the
sam
eou
tcom
e.
203

Nutrients 2021, 13, 3065
Table 2. Studied outcomes.
N % Papers
Attitude 11 41%
Al-Hamdani & Smith (2015) [64]; Al-Hamdani & Smith (2017) [76];Annunziata et al. (2019) [70]; Blackwell et al. (2018) [71]; Glock &
Krolak-Schwerdt (2013) [72]; Hall et al. (2020) [65]; Jarvis &Pettigrew (2013) [74]; Jongenelis et al. (2018a) [58]; Krischler &
Glock (2015) [68]; Pettigrew et al. (2016) [60]; Stafford & Salmon(2017) [62]
Intentions 8 30%
Clarke et al. (2021a) [55]; Glock & Krolak-Schwerdt (2013) [72];Jongenelis et al. (2018a) [58]; Jongenelis et al. (2018b) [59];
Krischler & Glock (2015) [68]; Ma (2021) [69]; Pettigrew et al.(2016) [60]; Wigg & Stafford (2016) [61]
Emotion 7 26%Clarke et al. (2021a) [55]; Clarke et al. (2021b) [56]; Hall et al.
(2020) [65]; Ma (2021) [69]; Morgenstern et al. (2021) [67];Pechey et al. (2020) [57]; Wigg & Stafford (2016) [61]
Acceptability/support 7 26%Blackwell et al. (2018) [71]; Clarke et al. (2021a) [55]; Clarke et al.
(2021b) [56]; Hall et al. (2020) [65]; Hall et al. (2019) [73]Hobin et al. (2020b) [52]; Pechey et al. (2020) [57]
Behaviour 6 22%Clarke et al. (2021b) [56]; Hobin et al. (2020a) [51]; Hobin et al.(2020c) [54]; Morgenstern et al. (2021) [67]; Stafford & Salmon
(2017) [62]; Zhao et al. (2020) [53]
Awareness/recognition 5 19%Al-Hamdani & Smith (2015) [64]; Al-Hamdani & Smith (2017) [76];
Hobin et al. (2020a) [51]; Hobin et al. (2020b) [52];Hobin et al. (2020c) [54]
Risk perception 5 19% Clarke et al. (2021a) [55]; Gold et al. (2020) [63]; Ma (2021) [69];Sillero-Rejon et al. (2018) [75]; Wigg & Stafford (2016) [61]
Motivation 4 15% Blackwell et al. (2018) [71]; Gold et al. (2020) [63]; Pechey et al.(2020) [57]; Sillero-Rejon et al. (2018) [75]
Reactance 4 15% Blackwell et al. (2018) [71]; Clarke et al. (2021a) [55]; Hall et al.(2020) [65]; Sillero-Rejon et al. (2018) [75]
Knowledge 3 11% Hobin et al. (2020b) [52]; Jongenelis et al. (2018b) [59];Morgenstern et al. (2021) [67]
Perceived effectiveness 3 11% Hall et al. (2020) [65]; Hall et al. (2019) [73];Sillero-Rejon et al. (2018) [75]
Attention 3 11% Monk et al. (2017) [66]; Pham et al. (2018) [50];Sillero-Rejon et al. (2018) [75]
Cognitive processing 3 11% Hall et al. (2020) [65]; Hobin et al. (2020a) [51];Hobin et al. (2020c) [54]
Avoidance 3 11% Blackwell et al. (2018) [71]; Clarke et al. (2021a) [55];Sillero-Rejon et al. (2018) [75]
Efficacy 2 7% Blackwell et al. (2018) [71]; Hall et al. (2020) [65]
In terms of label content, eight studies studied a single message; the remaining wereeither comparing different labels (or groups of labels) or used several messages as a singleintervention. Most commonly, the messages were referring either to cancer in general (e.g.,“Warning: Alcohol causes cancer”) [51–54,57–60,63,67,71,75], or specifically to bowel cancer(e.g., “Alcohol causes bowel cancer”) [51–60,69,71], both in 41% of all papers. Overall, 70%of papers included at least one cancer-related message, with other mentioned cancers beingalso breast (33%) [51–58,60] and liver cancer (30%) [55–57,61,62,64,69,76]. Liver cirrhosis orliver disease message was used in nine (33%) papers (e.g., “Warning: Alcohol causes liverdisease”) ([56,57,59,65–67,72,73,75]. Heart disease [55,57,59,72], mental illness [59,67,71,75],brain damage [70,72,74,75] and drinking and driving-related messages [67,70,74,75] wereused in four papers each (15%), and pregnancy messages in three papers (11%) [50,67,75].Four papers (15%; [59,67,68,72]), included other topics of messages such as diabetes, posi-tive expectancies related to alcohol, warning against operating machinery or serving alcoholto minors. Fifteen papers (56%) included images in the labels—ten of them included onlygraphic images (e.g., images of diseased body parts) [55–57,61,62,64,65,68,69,76], two in-
204

Nutrients 2021, 13, 3065
cluded both graphic and neutral images [66,75], one included only neutral images [67] andtwo included pictograms [50,70].
In terms of label format, the majority of the papers formatted the labels to be clearlyvisible. This meant putting labels on the front of the pack, with a predetermined size andclear contrast between text and background and separation from the rest of the label (e.g.,black text on white background with black or red border, such as [55–57,61,63] or black texton a bright yellow background and red border, such as [51–54]). A complete description ofthe studied labels content and format is available in Supplementary Table S1.
3.2. Key Label Characteristics—Impact on the Outcomes
Results for all the studied outcomes from each of the papers are presented in Table 3.Below, the results are summarised based on the study aims identified through the tworesearch questions: (1) studying overall label effectiveness by comparing image and textlabels and (2) studying other label message characteristics and label formats.
3.2.1. Label Effectiveness
A large online UK study [63] did not find that adding a text warning to alcoholdrink label changed perceived personal risk, motivation to drink less or perception ofdamaging drinking among adult drinkers. On the other hand, the Canadian real-worldstudy, which included putting three types of labels (one of them a cancer warning) on themajority of alcohol drinks in the participating liquor stores in the studied region, foundthat these enhanced labels led to increased recall, cognitive processing and self-reportedimpact of drinking [51,54], as well as decreased alcohol sales [53] in the interventionmunicipality compared to the control municipality. While the whole intervention includedboth cancer warnings as well as low-risk guidelines/standard drink labels, it is not possibleto completely disentangle the impact of solely the cancer warning labels from the results,although some results pointed to effects being driven predominantly by the cancer label.The one paper that looked specifically at the cancer labels [52] found that cancer labelsincreased knowledge of alcohol as a carcinogen, and that knowledge increased withtime. Additionally, the authors found that knowledge about alcohol causing cancer wasassociated with a greater likelihood of supporting health warning labels.
3.2.2. Label Content—Image vs. Text
Among the eight papers that compared image and text labels, six had control groupcomparison [55,61,62,64,67] and in two [65,66], only text and image were compared. Six ofthe papers used graphic images (e.g., diseased body part); in one, the images were neutral,and one contained both graphic and neutral images.
In the studies where graphic images were used, comparison between text-only andimage-and-text labels showed higher negative emotional arousal [55,56], fear [55,56,61,65]and reactance [65] for the image-and-text labels among adults compared to text only labels,as well as lower product appeal [64,65], label acceptability [55,56] and believability [65].Moreover, in the study using neutral images [67], there were higher negative emotions forimage-and-text labels compared to text-only were found among the secondary school stu-dents, but only for some messages. The same study also found that both types of labels arebetter than no label for increasing knowledge about alcohol-related risks when knowledgeis low at baseline. While an online experiment showed a selection of alcoholic drinks inthe given scenario to be lower after seeing image-and-text labels compared to text-onlylabels [55], this finding did not replicate in a naturalistic lab shopping setting [56] amongadult regular drinkers, where none of the labels affected purchasing behaviour. In an-other study, both text-only and image-and-text labels decreased the speed of consumptioncompared to no label, with no significant difference between them [62].
205
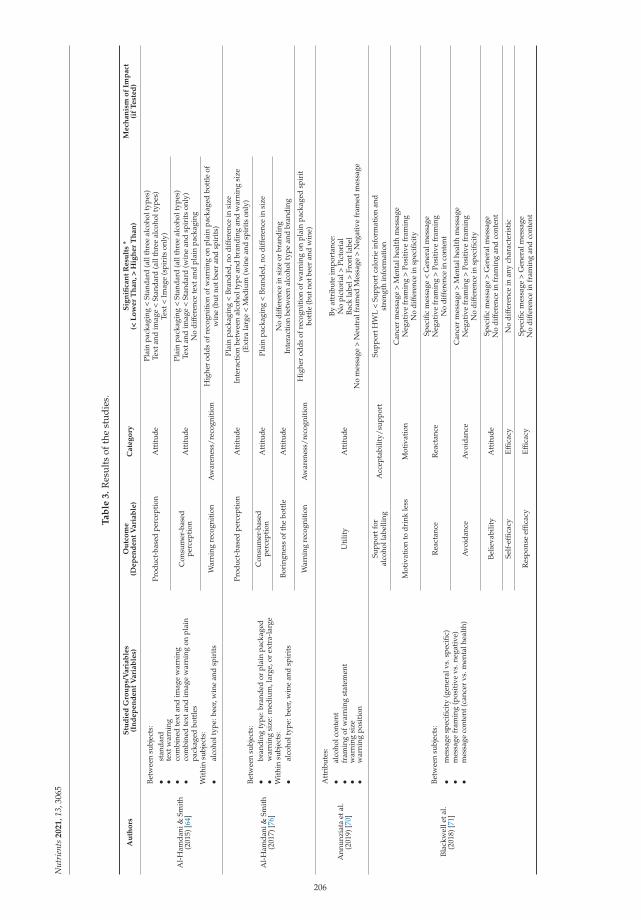
Nut
rien
ts2
02
1,1
3,30
65
Ta
ble
3.
Res
ults
ofth
est
udie
s.
Au
tho
rsS
tud
ied
Gro
up
s/V
ari
ab
les
(In
de
pe
nd
en
tV
ari
ab
les)
Ou
tco
me
(De
pe
nd
en
tV
ari
ab
le)
Ca
teg
ory
Sig
nifi
can
tR
esu
lts
*(<
Lo
we
rT
ha
n,
>H
igh
er
Th
an
)M
ech
an
ism
of
Imp
act
(if
Te
ste
d)
Al-
Ham
dani
&Sm
ith
(201
5)[6
4]
Betw
een
subj
ects
:•
stan
dard
•te
xtw
arni
ng•
com
bine
dte
xtan
dim
age
war
ning
•co
mbi
ned
text
and
imag
ew
arni
ngon
plai
npa
ckag
edbo
ttle
sW
ithi
nsu
bjec
ts:
•al
coho
ltyp
e:be
er,w
ine
and
spir
its
Prod
uct-
base
dpe
rcep
tion
Att
itud
ePl
ain
pack
agin
g<
Stan
dard
(all
thre
eal
coho
ltyp
es)
Text
and
imag
e<
Stan
dard
(all
thre
eal
coho
ltyp
es)
Text
<Im
age
(spi
rits
only
)
Con
sum
er-b
ased
perc
epti
onA
ttit
ude
Plai
npa
ckag
ing
<St
anda
rd(a
llth
ree
alco
holt
ypes
)Te
xtan
dim
age
<St
anda
rd(w
ine
and
spir
its
only
)N
odi
ffer
ence
text
and
plai
npa
ckag
ing
War
ning
reco
gnit
ion
Aw
aren
ess/
reco
gnit
ion
Hig
her
odds
ofre
cogn
itio
nof
war
ning
onpl
ain
pack
aged
bott
leof
win
e(b
utno
tbee
ran
dsp
irit
s)
Al-
Ham
dani
&Sm
ith
(201
7)[7
6]
Betw
een
subj
ects
:•
bran
ding
type
:bra
nded
orpl
ain
pack
aged
•w
arni
ngsi
ze:m
ediu
m,l
arge
,or
extr
a-la
rge
Wit
hin
subj
ects
:•
alco
holt
ype:
beer
,win
ean
dsp
irit
s
Prod
uct-
base
dpe
rcep
tion
Att
itud
ePl
ain
pack
agin
g<
Bran
ded,
nodi
ffer
ence
insi
zeIn
tera
ctio
nbe
twee
nal
coho
ltyp
ean
dbr
andi
ngan
dw
arni
ngsi
ze(E
xtra
larg
e<
Med
ium
(win
ean
dsp
irit
son
ly)
Con
sum
er-b
ased
perc
epti
onA
ttit
ude
Plai
npa
ckag
ing
<Br
ande
d,no
diff
eren
cein
size
Bori
ngne
ssof
the
bott
leA
ttit
ude
No
diff
eren
cein
size
orbr
andi
ngIn
tera
ctio
nbe
twee
nal
coho
ltyp
ean
dbr
andi
ng
War
ning
reco
gnit
ion
Aw
aren
ess/
reco
gnit
ion
Hig
her
odds
ofre
cogn
itio
nof
war
ning
onpl
ain
pack
aged
spir
itbo
ttle
(but
notb
eer
and
win
e)
Ann
unzi
ata
etal
.(2
019)
[70]
Att
ribu
tes:
•al
coho
lcon
tent
•fr
amin
gof
war
ning
stat
emen
t•
war
ning
size
•w
arni
ngpo
siti
on
Uti
lity
Att
itud
e
Byat
trib
ute
impo
rtan
ce:
No
pict
oria
l>Pi
ctor
ial
Back
labe
l>Fr
ontl
abel
No
mes
sage
>N
eutr
alfr
amed
Mes
sage
>N
egat
ive
fram
edm
essa
ge
Blac
kwel
leta
l.(2
018)
[71]
Betw
een
subj
ects
:
•m
essa
gesp
ecifi
city
(gen
eral
vs.s
peci
fic)
•m
essa
gefr
amin
g(p
osit
ive
vs.n
egat
ive)
•m
essa
geco
nten
t(ca
ncer
vs.m
enta
lhea
lth)
Supp
ortf
oral
coho
llab
ellin
gA
ccep
tabi
lity/
supp
ort
Supp
ortH
WL
<Su
ppor
tcal
orie
info
rmat
ion
and
stre
ngth
info
rmat
ion
Mot
ivat
ion
todr
ink
less
Mot
ivat
ion
Can
cer
mes
sage
>M
enta
lhea
lth
mes
sage
Neg
ativ
efr
amin
g>
Posi
tive
fram
ing
No
diff
eren
cein
spec
ifici
ty
Rea
ctan
ceR
eact
ance
Spec
ific
mes
sage
<G
ener
alm
essa
geN
egat
ive
fram
ing
>Po
siti
vefr
amin
gN
odi
ffer
ence
inco
nten
t
Avo
idan
ceA
void
ance
Can
cer
mes
sage
>M
enta
lhea
lth
mes
sage
Neg
ativ
efr
amin
g>
Posi
tive
fram
ing
No
diff
eren
cein
spec
ifici
ty
Belie
vabi
lity
Att
itud
eSp
ecifi
cm
essa
ge>
Gen
eral
mes
sage
No
diff
eren
cein
fram
ing
and
cont
ent
Self
-effi
cacy
Effic
acy
No
diff
eren
cein
any
char
acte
rist
ic
Res
pons
eef
ficac
yEf
ficac
ySp
ecifi
cm
essa
ge>
Gen
eral
mes
sage
No
diff
eren
cein
fram
ing
and
cont
ent
206
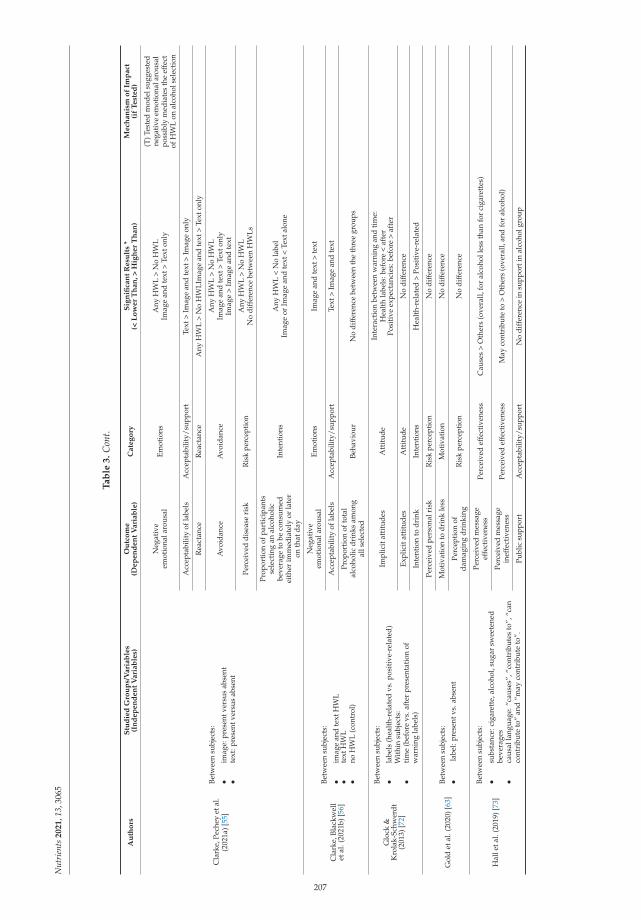
Nut
rien
ts2
02
1,1
3,30
65
Ta
ble
3.
Con
t.
Au
tho
rsS
tud
ied
Gro
up
s/V
ari
ab
les
(In
de
pe
nd
en
tV
ari
ab
les)
Ou
tco
me
(De
pe
nd
en
tV
ari
ab
le)
Ca
teg
ory
Sig
nifi
can
tR
esu
lts
*(<
Lo
we
rT
ha
n,
>H
igh
er
Th
an
)M
ech
an
ism
of
Imp
act
(if
Te
ste
d)
Cla
rke,
Pech
eyet
al.
(202
1a)[
55]
Betw
een
subj
ects
:
•im
age:
pres
entv
ersu
sab
sent
•te
xt:p
rese
ntve
rsus
abse
nt
Neg
ativ
eem
otio
nala
rous
alEm
otio
nsA
nyH
WL
>N
oH
WL
Imag
ean
dte
xt>
Text
only
(T)T
este
dm
odel
sugg
este
dne
gati
veem
otio
nala
rous
alpo
ssib
lym
edia
tes
the
effe
ctof
HW
Lon
alco
hols
elec
tion
Acc
epta
bilit
yof
labe
lsA
ccep
tabi
lity/
supp
ort
Text
>Im
age
and
text
>Im
age
only
Rea
ctan
ceR
eact
ance
Any
HW
L>
No
HW
LIm
age
and
text
>Te
xton
ly
Avo
idan
ceA
void
ance
Any
HW
L>
No
HW
LIm
age
and
text
>Te
xton
lyIm
age
>Im
age
and
text
Perc
eive
ddi
seas
eri
skR
isk
perc
epti
onA
nyH
WL
>N
oH
WL
No
diff
eren
cebe
twee
nH
WLs
Prop
orti
onof
part
icip
ants
sele
ctin
gan
alco
holic
beve
rage
tobe
cons
umed
eith
erim
med
iate
lyor
late
ron
that
day
Inte
ntio
nsA
nyH
WL
<N
ola
bel
Imag
eor
Imag
ean
dte
xt<
Text
alon
e
Cla
rke,
Blac
kwel
let
al.(
2021
b)[5
6]
Betw
een
subj
ects
:
•im
age
and
text
HW
L•
text
HW
L•
noH
WL
(con
trol
)
Neg
ativ
eem
otio
nala
rous
alEm
otio
nsIm
age
and
text
>te
xt
Acc
epta
bilit
yof
labe
lsA
ccep
tabi
lity/
supp
ort
Text
>Im
age
and
text
Prop
orti
onof
tota
lal
coho
licdr
inks
amon
gal
lsel
ecte
dBe
havi
our
No
diff
eren
cebe
twee
nth
eth
ree
grou
ps
Glo
ck&
Kro
lak-
Schw
erdt
(201
3)[7
2]
Betw
een
subj
ects
:
•la
bels
(hea
lth-
rela
ted
vs.p
osit
ive-
rela
ted)
Wit
hin
subj
ects
:•
tim
e(b
efor
evs
.aft
erpr
esen
tati
onof
war
ning
labe
ls)
Impl
icit
atti
tude
sA
ttit
ude
Inte
ract
ion
betw
een
war
ning
and
tim
e:H
ealt
hla
bels
:bef
ore
<af
ter
Posi
tive
expe
ctan
cies
:bef
ore
>af
ter
Expl
icit
atti
tude
sA
ttit
ude
No
diff
eren
ce
Inte
ntio
nto
drin
kIn
tent
ions
Hea
lth-
rela
ted
>Po
siti
ve-r
elat
ed
Gol
det
al.(
2020
)[63
]Be
twee
nsu
bjec
ts:
•la
bel:
pres
entv
s.ab
sent
Perc
eive
dpe
rson
alri
skR
isk
perc
epti
onN
odi
ffer
ence
Mot
ivat
ion
todr
ink
less
Mot
ivat
ion
No
diff
eren
ce
Perc
epti
onof
dam
agin
gdr
inki
ngR
isk
perc
epti
onN
odi
ffer
ence
Hal
leta
l.(2
019)
[73]
Betw
een
subj
ects
:
•su
bsta
nce:
ciga
rett
e,al
coho
l,su
gar
swee
tene
dbe
vera
ges
•ca
usal
lang
uage
:“ca
uses
”,“c
ontr
ibut
esto
”,“c
anco
ntri
bute
to”
and
“may
cont
ribu
teto
”.
Perc
eive
dm
essa
geef
fect
iven
ess
Perc
eive
def
fect
iven
ess
Cau
ses
>O
ther
s(o
vera
ll,fo
ral
coho
lles
sth
anfo
rci
gare
ttes
)
Perc
eive
dm
essa
gein
effe
ctiv
enes
sPe
rcei
ved
effe
ctiv
enes
sM
ayco
ntri
bute
to>
Oth
ers
(ove
rall,
and
for
alco
hol)
Publ
icsu
ppor
tA
ccep
tabi
lity/
supp
ort
No
diff
eren
cein
supp
orti
nal
coho
lgro
up
207

Nut
rien
ts2
02
1,1
3,30
65
Ta
ble
3.
Con
t.
Au
tho
rsS
tud
ied
Gro
up
s/V
ari
ab
les
(In
de
pe
nd
en
tV
ari
ab
les)
Ou
tco
me
(De
pe
nd
en
tV
ari
ab
le)
Ca
teg
ory
Sig
nifi
can
tR
esu
lts
*(<
Lo
we
rT
ha
n,
>H
igh
er
Th
an
)M
ech
an
ism
of
Imp
act
(if
Te
ste
d)
Hal
leta
l.(2
020)
[65]
Betw
een
subj
ects
:•
labe
l:te
xtvs
.im
age
and
text
•ef
ficac
yin
form
atio
n:pr
esen
tvs.
abse
ntW
ithi
nsu
bjec
ts:
•su
bsta
nce:
ciga
rett
e,al
coho
l,su
gar
swee
tene
dbe
vera
ges
Perc
eive
dm
essa
geef
fect
iven
ess
Perc
eive
def
fect
iven
ess
Imag
ean
dte
xt>
Text
(ove
rall,
and
for
alco
hol)
Belie
vabi
lity
Att
itud
eTe
xt>
Imag
ean
dte
xt(o
vera
ll,an
dfo
ral
coho
l)
Rea
ctan
ceR
eact
ance
Imag
ean
dte
xt>
Text
(ove
rall,
and
for
alco
hol)
Fear
Emot
ions
Imag
ean
dte
xt>
Text
(ove
rall,
and
for
alco
hol)
Thin
king
abou
thar
ms
Cog
niti
vepr
oces
sing
Imag
ean
dte
xt>
Text
(ove
rall,
and
for
alco
hol)
Prod
ucta
ppea
lA
ttit
ude
Text
>Im
age
and
text
(ove
rall,
and
for
alco
hol)
Polic
ysu
ppor
tA
ccep
tabi
lity/
supp
ort
Text
>Im
age
and
text
(ove
rall,
and
for
alco
hol)
Self
-effi
cacy
Effic
acy
No
diff
eren
cein
effic
acy
info
rmat
ion
pres
ence
Hob
in,
Scho
ueri
-Myc
hasi
wet
al.(
2020
a)[5
1]
Betw
een
subj
ects
:•
labe
ls:e
nhan
ced
vs.r
egul
ar
Rec
ogni
tion
ofla
bels
Aw
aren
ess/
reco
gnit
ion
Enha
nced
labe
l>re
gula
rla
bel
Cog
niti
vepr
oces
sing
Cog
niti
vepr
oces
sing
Enha
nced
labe
l>R
egul
arla
bel
(T)C
onsu
mer
atte
ntio
nto
and
proc
essi
ngof
labe
lm
essa
ges
part
ially
med
iate
dth
ere
lati
onsh
ipbe
twee
nth
een
hanc
edal
coho
lwar
ning
labe
lsan
dse
lf-r
epor
ted
drin
king
less
→su
gges
tsth
atst
reng
then
ing
HW
Lw
illin
crea
seth
eir
effe
ctiv
enes
sbe
caus
eth
eydr
awat
tent
ion
toan
din
crea
sepr
oces
sing
ofth
ela
bels
Self
-rep
orte
dim
pact
ondr
inki
ng(r
educ
tion
)Be
havi
our
Enha
nced
labe
ls>
Reg
ular
labe
l
Hob
in,W
eera
sing
heet
al.(
2020
b)[5
2]Be
twee
nsu
bjec
ts:
•la
bels
:enh
ance
dvs
.reg
ular
Prom
pted
and
unpr
ompt
edre
call
Aw
aren
ess/
reco
gnit
ion
Enha
nced
labe
l>R
egul
arla
bel(
larg
estd
iffer
ence
betw
een
grou
psat
T2)
Kno
wle
dge
ofal
coho
las
carc
inog
enK
now
ledg
eEn
hanc
edla
bel>
Reg
ular
labe
l(la
rges
tdiff
eren
cebe
twee
ngr
oups
atT
3)
Supp
ortf
orhe
alth
war
ning
labe
lson
alco
hol
cont
aine
rsA
ccep
tabi
lity/
supp
ort
Inte
rven
tion
:Agr
ee(W
ave
1=
57.4
%;W
ave
2=
57.3
%;
Wav
e3
=61
.3%
)C
ompa
riso
n:A
gree
(Wav
e1
=53
.7%
;Wav
e2
=51
.6%
;W
ave
3=
53.7
%)
(T)K
now
ledg
eab
outa
lcoh
olca
usin
gca
ncer
asso
ciat
edw
ith
grea
ter
likel
ihoo
dof
supp
orti
nghe
alth
war
ning
labe
lsin
the
stud
y
Hob
in,S
hoka
ret
al.
(202
0c)[
54]
Betw
een
subj
ects
:•
labe
ls:e
nhan
ced
vs.r
egul
ar
Unp
rom
pted
reca
llA
war
enes
s/re
cogn
itio
nEn
hanc
edla
bel>
Reg
ular
labe
l(ca
ncer
labe
l)
Cog
niti
vepr
oces
sing
Cog
niti
vepr
oces
sing
Enha
nced
labe
l>R
egul
arla
bel
Self
-rep
orte
dim
pact
ondr
inki
ng(r
educ
tion
)Be
havi
our
Enha
nced
labe
ls>
Reg
ular
labe
l
Jarv
is&
Pett
igre
w(2
013)
[74]
Att
ribu
tes:
•br
and
•al
coho
lcon
tent
•w
arni
ngm
essa
ge(f
ram
edpo
siti
veor
nega
tive
)
Uti
lity
Att
itud
eBr
and
>A
lcoh
olco
nten
t>W
arni
ngst
atem
ent
Two
war
ning
stat
emen
tssi
gnifi
cant
:one
posi
tive
and
one
nega
tive
208

Nut
rien
ts2
02
1,1
3,30
65
Ta
ble
3.
Con
t.
Au
tho
rsS
tud
ied
Gro
up
s/V
ari
ab
les
(In
de
pe
nd
en
tV
ari
ab
les)
Ou
tco
me
(De
pe
nd
en
tV
ari
ab
le)
Ca
teg
ory
Sig
nifi
can
tR
esu
lts
*(<
Lo
we
rT
ha
n,
>H
igh
er
Th
an
)M
ech
an
ism
of
Imp
act
(if
Te
ste
d)
Jong
enel
is,P
etti
grew
etal
.(20
18a)
[58]
Betw
een
subj
ects
:•
Sour
ce:s
ingl
e-so
urce
orm
ulti
ple-
sour
ceof
mes
sage
Inte
ntio
nsto
redu
ceal
coho
lcon
sum
ptio
nIn
tent
ions
Mul
tipl
eso
urce
>Si
ngle
sour
ce
Mes
sage
belie
vabi
lity
Att
itud
eM
ulti
ple
sour
ce>
Sing
leso
urce
Mes
sage
conv
inci
ngne
ssA
ttit
ude
Mul
tipl
eso
urce
>Si
ngle
sour
ce
Pers
onal
rele
vanc
eof
the
mes
sage
Att
itud
eM
ulti
ple
sour
ce>
Sing
leso
urce
Jong
enel
is,P
ratt
etal
.(2
018b
)[59
]Be
twee
nsu
bjec
ts:
•La
belc
onte
nt
Alc
ohol
asri
skfa
ctor
belie
fsK
now
ledg
ePr
esen
tmes
sage
>A
bsen
tmes
sage
(for
allm
essa
ges
exce
ptfo
rliv
erda
mag
e)
Inte
ntio
nsto
redu
ceal
coho
lcon
sum
ptio
nIn
tent
ions
Pres
entm
essa
ge>
Abs
entm
essa
ge(f
orca
ncer
,dia
bete
san
dm
enta
lill
ness
mes
sage
,but
notf
orliv
erda
mag
ean
dhe
artd
isea
se)
Kri
schl
er&
Glo
ck(2
015)
[68]
Betw
een
subj
ects
:•
labe
ls(q
uest
ions
vs.s
tate
men
tsvs
.con
trol
)W
ithi
nsu
bjec
ts:
•ex
pect
ancy
cate
gory
(pos
itiv
evs
.neg
ativ
e,te
nsio
nre
duct
ion
vs.n
egat
ive
seda
ting
vs.
soci
ally
rela
ted)
Dri
nkin
gin
tent
ions
Inte
ntio
nsN
odi
ffer
ence
Indi
vidu
alou
tcom
eex
pect
anci
esA
ttit
ude
No
diff
eren
ce
Gen
eral
outc
ome
expe
ctan
cies
Att
itud
eN
odi
ffer
ence
Ma
(202
1)[6
9]
Betw
een
subj
ects
:•
narr
ativ
ePW
Ls•
non-
narr
ativ
ePW
Ls•
cont
rol(
nost
imul
us)
Wor
ryab
outd
evel
opin
gal
coho
l-re
late
dca
ncer
Emot
ions
Nar
rati
vela
bels
>no
labe
ls
Feel
ings
ofri
skof
deve
lopi
ngal
coho
l-re
late
dca
ncer
Ris
kpe
rcep
tion
Nar
rati
vela
bels
>no
labe
ls
Com
para
tive
likel
ihoo
dof
deve
lopi
ngal
coho
l-re
late
dca
ncer
Ris
kpe
rcep
tion
No
diff
eren
ce
Perc
eive
dse
veri
tyof
harm
ofde
velo
ping
alco
hol-
rela
ted
canc
erR
isk
perc
epti
onN
arra
tive
labe
ls>
nola
bels
(T)M
edia
tion
anal
ysis
foun
dth
atna
rrat
ive
PWLs
(vs.
cont
rol)
indi
rect
lyin
fluen
ced
inte
ntio
nsth
roug
hw
orry
,but
nott
hrou
ghfe
elin
gsof
risk
,co
mpa
rati
velik
elih
ood,
orpe
rcei
ved
seve
rity
.
Inte
ntio
nsto
redu
ceal
coho
luse
Inte
ntio
nsN
odi
ffer
ence
Mon
ket
al.
(201
7)[6
6]
Betw
een
subj
ects
:•
imag
e:gr
aphi
cor
neut
ral
•ar
eaof
inte
rest
:tex
tor
imag
e•
posi
tive
expe
ctan
cych
ange
:inc
reas
eor
decr
ease
/no
chan
ge
Dw
ellt
ime
Att
enti
onIm
age
>Te
xt(o
vera
llan
din
the
posi
tive
expe
ctan
cies
incr
ease
grou
p)N
odi
ffer
ence
betw
een
grap
hic
orne
utra
l,an
dbe
twee
nin
crea
sean
dde
crea
sein
posi
tive
expe
ctan
cies
Mor
gens
tern
etal
.(2
021)
[67]
Betw
een
subj
ects
:•
posi
tion
ofth
eH
WL
onth
equ
esti
onna
ire
(bef
ore
vs.a
fter
alco
holi
tem
s)•
type
ofH
WL
(tex
tonl
yvs
.im
age
and
text
)•
cont
ento
fthe
HW
L(o
neou
tofa
pool
ofte
n)
Kno
wle
dge
abou
tal
coho
l-re
late
dri
sks
Kno
wle
dge
Any
labe
l>N
ola
bel(
for
canc
eran
dliv
erci
rrho
sis)
Self
-rep
orto
falc
ohol
use
Beha
viou
rN
odi
ffer
ence
Neg
ativ
eem
otio
nsEm
otio
nsTe
xtan
dim
age
>Te
xton
ly(o
nly
for
som
em
essa
ges—
driv
ing,
liver
cirr
hosi
s,ph
arm
aceu
tica
ls,m
inor
s)
209

Nut
rien
ts2
02
1,1
3,30
65
Ta
ble
3.
Con
t.
Au
tho
rsS
tud
ied
Gro
up
s/V
ari
ab
les
(In
de
pe
nd
en
tV
ari
ab
les)
Ou
tco
me
(De
pe
nd
en
tV
ari
ab
le)
Ca
teg
ory
Sig
nifi
can
tR
esu
lts
*(<
Lo
we
rT
ha
n,
>H
igh
er
Th
an
)M
ech
an
ism
of
Imp
act
(if
Te
ste
d)
Pech
eyet
al.
(202
0)[5
7]
Betw
een
subj
ects
:
•m
essa
gety
pe(7
mes
sage
sof
diff
eren
thea
lth
cons
eque
nces
)•
imag
ety
pe(3
diff
eren
tgra
phic
imag
espe
rhe
alth
cons
eque
nce)
Neg
ativ
eem
otio
nala
rous
alEm
otio
nsBo
wel
canc
er>
Oth
ers
(>liv
erca
ncer
>liv
erci
rrho
sis
>he
art
dise
ase
>liv
erdi
seas
e>
7ty
pes
ofca
ncer
>br
east
canc
er)
Des
ire
toco
nsum
eth
ela
belle
dpr
oduc
tM
otiv
atio
nBo
wel
canc
er<
Live
rci
rrho
sis
<Br
east
canc
er<
Live
rca
ncer
<H
eart
dise
ase
<Li
ver
dise
ase
<7
type
sof
canc
er
Acc
epta
bilit
yof
the
labe
lA
ccep
tabi
lity/
supp
ort
Low
over
alla
ccep
tabi
lity,
Bow
elca
ncer
<O
ther
s(B
reas
tcan
cer
<Li
ver
dise
ase
<7
type
sof
canc
er<
Live
rca
ncer
<Li
ver
dise
ase
<Li
ver
cirr
hosi
s)
Pett
igre
wet
al.
(201
6)[6
0]
Betw
een
subj
ects
:•
cont
ento
fthe
mes
sage
(6m
essa
ges)
Wit
hin
subj
ects
:•
befo
rean
daf
ter
(onl
yfo
rin
tent
ion)
Inte
ntio
nto
redu
ceal
coho
lcon
sum
ptio
nIn
tent
ions
Pre
<Po
stN
odi
ffer
ence
betw
een
mes
sage
s
Belie
vabi
lity
ofm
essa
geA
ttit
ude
Bow
elca
ncer
>O
ther
mes
sage
s
Con
vinc
ingn
ess
ofth
em
essa
geA
ttit
ude
Bow
elca
ncer
>O
ther
mes
sage
s
Pers
onal
rele
vanc
eof
the
mes
sage
Att
itud
eBo
wel
canc
er>
Oth
erm
essa
ges
Pham
etal
.(2
018)
[50]
Betw
een
subj
ects
:
•co
lour
chan
ge(u
seof
red
colo
urin
gin
stea
dof
blac
k)•
size
ofth
eH
WL
(inc
reas
eby
50%
)•
chan
ges
inbo
thco
lour
and
size
•co
ntro
l(ex
isti
ngla
bel)
Att
enti
onA
tten
tion
Enha
nced
colo
uran
dsi
ze>
Oth
ergr
oups
Num
ber
and
leng
thof
visu
alfix
atio
ns
Att
enti
onN
odi
ffer
ence
betw
een
grou
ps
Sille
ro-R
ejon
etal
.(2
018)
[75]
Betw
een
subj
ects
:•
self
-affi
rmat
ion
(sel
f-af
firm
edvs
.con
trol
)W
ithi
n-su
bjec
t:•
war
ning
seve
rity
(mod
erat
ely-
seve
revs
.hi
ghly
-sev
ere)
Vis
uala
tten
tion
Att
enti
onN
odi
ffer
ence
inse
veri
tyor
self
-affi
rmat
ion
Avo
idan
ceA
void
ance
Hig
hly
seve
re>
Mod
erat
ely
seve
reN
odi
ffer
ence
inse
lf-a
ffirm
atio
n
Rea
ctan
ceR
eact
ance
Hig
hly
seve
re>
Mod
erat
ely
seve
reN
odi
ffer
ence
inse
lf-a
ffirm
atio
n
Perc
eive
dsu
scep
tibi
lity
tohe
alth
risk
sR
isk
perc
epti
onN
odi
ffer
ence
inse
veri
tyor
self
-affi
rmat
ion
Perc
eive
dw
arni
ngef
fect
iven
ess
Perc
eive
def
fect
iven
ess
Hig
hly
seve
re>
Mod
erat
ely
seve
reN
odi
ffer
ence
inse
lf-a
ffirm
atio
n
Mot
ivat
ion
todr
ink
less
Mot
ivat
ion
Hig
hly
seve
re>
Mod
erat
ese
vere
No
diff
eren
cein
self
-affi
rmat
ion
Staf
ford
&Sa
lmon
(201
7)[6
2]
Betw
een
subj
ects
:•
noH
WL
•te
xton
lyH
WL
•im
age
and
text
HW
L
Prod
uctd
esig
nev
alua
tion
Att
itud
eIm
age
and
text
HW
L<
No
HW
LN
odi
ffer
ence
betw
een
text
only
and
noH
WL
(H)T
hem
echa
nism
resp
onsi
ble
for
slow
erco
nsum
ptio
nis
theo
rise
dto
bedu
eto
high
erle
vels
offe
arar
ousa
lin
the
two
heal
thw
arni
ngco
ndit
ions
The
dura
tion
toco
nsum
eth
ete
stbe
vera
geBe
havi
our
No
HW
L<
Text
HW
LN
oH
WL
<Im
age
and
text
HW
LN
odi
ffer
ence
betw
een
text
HW
Lan
dim
age
and
text
HW
L
210

Nut
rien
ts2
02
1,1
3,30
65
Ta
ble
3.
Con
t.
Au
tho
rsS
tud
ied
Gro
up
s/V
ari
ab
les
(In
de
pe
nd
en
tV
ari
ab
les)
Ou
tco
me
(De
pe
nd
en
tV
ari
ab
le)
Ca
teg
ory
Sig
nifi
can
tR
esu
lts
*(<
Lo
we
rT
ha
n,
>H
igh
er
Th
an
)M
ech
an
ism
of
Imp
act
(if
Te
ste
d)
Wig
g&
Staf
ford
(201
6)[6
1]
Betw
een
subj
ects
:•
noH
WL
•te
xton
lyH
WL
•im
age
and
text
HW
L
Fear
arou
sal
Emot
ions
Imag
ean
dte
xtH
WL
>Te
xtH
WL
Imag
ean
dte
xtH
WL
>N
oH
WL
No
diff
eren
cebe
twee
nte
xtH
WL
and
noH
WL
Ris
kpe
rcep
tion
Ris
kpe
rcep
tion
Imag
ean
dte
xtH
WL
>N
oH
WL
No
diff
eren
cebe
twee
nte
xtH
WL
and
noH
WL
No
diff
eren
cebe
twee
nim
age
and
text
HW
Lan
dte
xtH
WL
Inte
ntio
nto
quit
/red
uce
alco
holc
onsu
mpt
ion
Inte
ntio
nsIm
age
and
text
HW
L>
No
HW
LN
odi
ffer
ence
betw
een
text
HW
Lan
dno
HW
LN
odi
ffer
ence
betw
een
imag
ean
dte
xtH
WL
and
text
HW
L
Zha
oet
al.
(202
0)[5
3]Be
twee
nsu
bjec
ts:
•la
bel:
enha
nced
vs.r
egul
arA
lcoh
olsa
les
Beha
viou
rEn
hanc
edla
bels
<R
egul
arla
bels
*Si
gnifi
cant
resu
lts
colu
mn
des
crib
esth
eim
pac
tofi
ndep
end
entv
aria
bles
(tes
ted
grou
ps)
onth
ed
epen
den
tvar
iabl
e(o
utc
ome)
and
shou
ldbe
read
toge
ther
wit
hth
eou
tcom
eco
lum
n,fo
rex
amp
le,“
pla
inpa
ckag
ing
grou
pha
dsi
gnifi
cant
lylo
wer
prod
uctb
ased
perc
epti
onco
mpa
red
tost
anda
rdpa
ckag
ing
grou
p”.
211
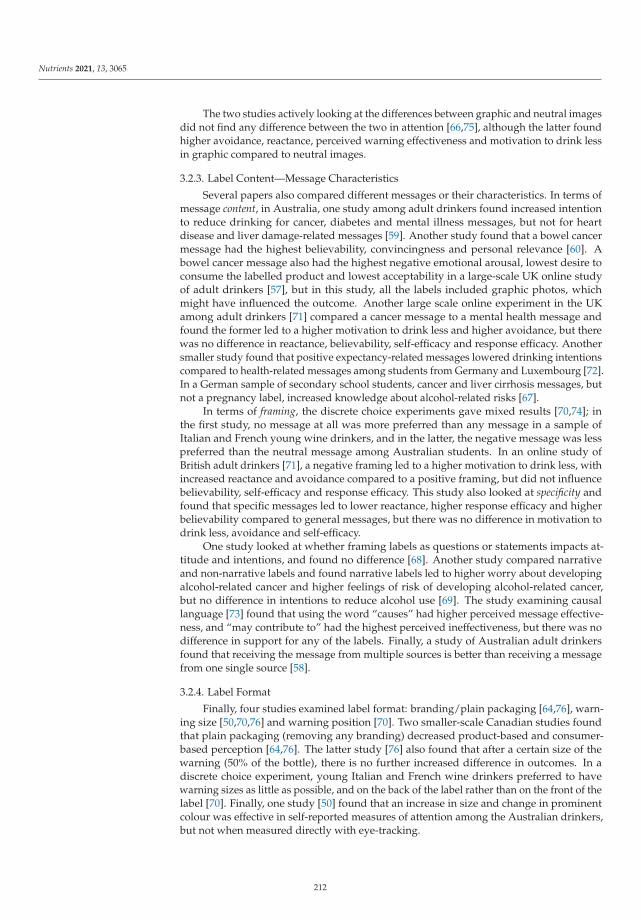
Nutrients 2021, 13, 3065
The two studies actively looking at the differences between graphic and neutral imagesdid not find any difference between the two in attention [66,75], although the latter foundhigher avoidance, reactance, perceived warning effectiveness and motivation to drink lessin graphic compared to neutral images.
3.2.3. Label Content—Message Characteristics
Several papers also compared different messages or their characteristics. In terms ofmessage content, in Australia, one study among adult drinkers found increased intentionto reduce drinking for cancer, diabetes and mental illness messages, but not for heartdisease and liver damage-related messages [59]. Another study found that a bowel cancermessage had the highest believability, convincingness and personal relevance [60]. Abowel cancer message also had the highest negative emotional arousal, lowest desire toconsume the labelled product and lowest acceptability in a large-scale UK online studyof adult drinkers [57], but in this study, all the labels included graphic photos, whichmight have influenced the outcome. Another large scale online experiment in the UKamong adult drinkers [71] compared a cancer message to a mental health message andfound the former led to a higher motivation to drink less and higher avoidance, but therewas no difference in reactance, believability, self-efficacy and response efficacy. Anothersmaller study found that positive expectancy-related messages lowered drinking intentionscompared to health-related messages among students from Germany and Luxembourg [72].In a German sample of secondary school students, cancer and liver cirrhosis messages, butnot a pregnancy label, increased knowledge about alcohol-related risks [67].
In terms of framing, the discrete choice experiments gave mixed results [70,74]; inthe first study, no message at all was more preferred than any message in a sample ofItalian and French young wine drinkers, and in the latter, the negative message was lesspreferred than the neutral message among Australian students. In an online study ofBritish adult drinkers [71], a negative framing led to a higher motivation to drink less, withincreased reactance and avoidance compared to a positive framing, but did not influencebelievability, self-efficacy and response efficacy. This study also looked at specificity andfound that specific messages led to lower reactance, higher response efficacy and higherbelievability compared to general messages, but there was no difference in motivation todrink less, avoidance and self-efficacy.
One study looked at whether framing labels as questions or statements impacts at-titude and intentions, and found no difference [68]. Another study compared narrativeand non-narrative labels and found narrative labels led to higher worry about developingalcohol-related cancer and higher feelings of risk of developing alcohol-related cancer,but no difference in intentions to reduce alcohol use [69]. The study examining causallanguage [73] found that using the word “causes” had higher perceived message effective-ness, and “may contribute to” had the highest perceived ineffectiveness, but there was nodifference in support for any of the labels. Finally, a study of Australian adult drinkersfound that receiving the message from multiple sources is better than receiving a messagefrom one single source [58].
3.2.4. Label Format
Finally, four studies examined label format: branding/plain packaging [64,76], warn-ing size [50,70,76] and warning position [70]. Two smaller-scale Canadian studies foundthat plain packaging (removing any branding) decreased product-based and consumer-based perception [64,76]. The latter study [76] also found that after a certain size of thewarning (50% of the bottle), there is no further increased difference in outcomes. In adiscrete choice experiment, young Italian and French wine drinkers preferred to havewarning sizes as little as possible, and on the back of the label rather than on the front of thelabel [70]. Finally, one study [50] found that an increase in size and change in prominentcolour was effective in self-reported measures of attention among the Australian drinkers,but not when measured directly with eye-tracking.
212
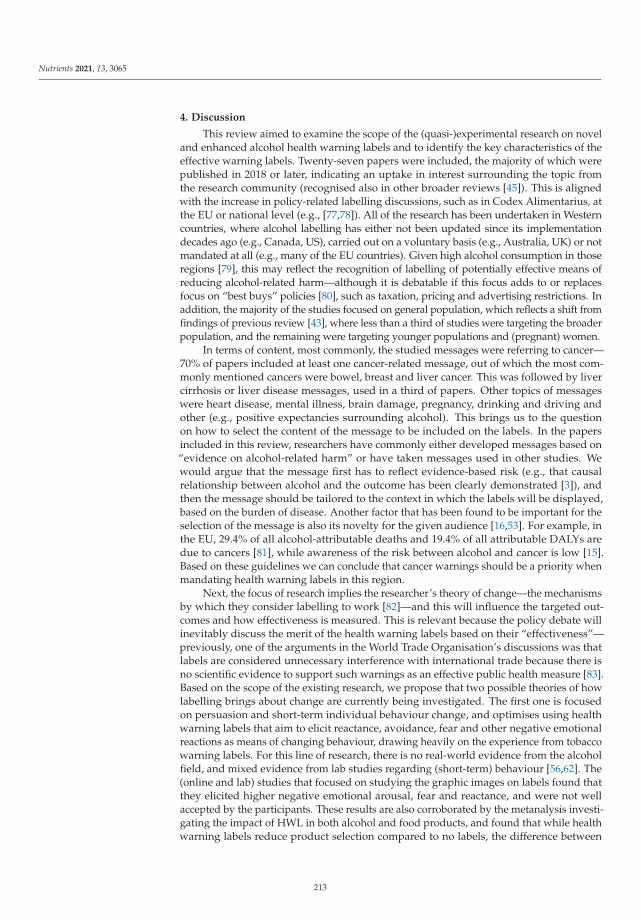
Nutrients 2021, 13, 3065
4. Discussion
This review aimed to examine the scope of the (quasi-)experimental research on noveland enhanced alcohol health warning labels and to identify the key characteristics of theeffective warning labels. Twenty-seven papers were included, the majority of which werepublished in 2018 or later, indicating an uptake in interest surrounding the topic fromthe research community (recognised also in other broader reviews [45]). This is alignedwith the increase in policy-related labelling discussions, such as in Codex Alimentarius, atthe EU or national level (e.g., [77,78]). All of the research has been undertaken in Westerncountries, where alcohol labelling has either not been updated since its implementationdecades ago (e.g., Canada, US), carried out on a voluntary basis (e.g., Australia, UK) or notmandated at all (e.g., many of the EU countries). Given high alcohol consumption in thoseregions [79], this may reflect the recognition of labelling of potentially effective means ofreducing alcohol-related harm—although it is debatable if this focus adds to or replacesfocus on “best buys” policies [80], such as taxation, pricing and advertising restrictions. Inaddition, the majority of the studies focused on general population, which reflects a shift fromfindings of previous review [43], where less than a third of studies were targeting the broaderpopulation, and the remaining were targeting younger populations and (pregnant) women.
In terms of content, most commonly, the studied messages were referring to cancer—70% of papers included at least one cancer-related message, out of which the most com-monly mentioned cancers were bowel, breast and liver cancer. This was followed by livercirrhosis or liver disease messages, used in a third of papers. Other topics of messageswere heart disease, mental illness, brain damage, pregnancy, drinking and driving andother (e.g., positive expectancies surrounding alcohol). This brings us to the questionon how to select the content of the message to be included on the labels. In the papersincluded in this review, researchers have commonly either developed messages based on“evidence on alcohol-related harm” or have taken messages used in other studies. Wewould argue that the message first has to reflect evidence-based risk (e.g., that causalrelationship between alcohol and the outcome has been clearly demonstrated [3]), andthen the message should be tailored to the context in which the labels will be displayed,based on the burden of disease. Another factor that has been found to be important for theselection of the message is also its novelty for the given audience [16,53]. For example, inthe EU, 29.4% of all alcohol-attributable deaths and 19.4% of all attributable DALYs aredue to cancers [81], while awareness of the risk between alcohol and cancer is low [15].Based on these guidelines we can conclude that cancer warnings should be a priority whenmandating health warning labels in this region.
Next, the focus of research implies the researcher’s theory of change—the mechanismsby which they consider labelling to work [82]—and this will influence the targeted out-comes and how effectiveness is measured. This is relevant because the policy debate willinevitably discuss the merit of the health warning labels based on their “effectiveness”—previously, one of the arguments in the World Trade Organisation’s discussions was thatlabels are considered unnecessary interference with international trade because there isno scientific evidence to support such warnings as an effective public health measure [83].Based on the scope of the existing research, we propose that two possible theories of howlabelling brings about change are currently being investigated. The first one is focusedon persuasion and short-term individual behaviour change, and optimises using healthwarning labels that aim to elicit reactance, avoidance, fear and other negative emotionalreactions as means of changing behaviour, drawing heavily on the experience from tobaccowarning labels. For this line of research, there is no real-world evidence from the alcoholfield, and mixed evidence from lab studies regarding (short-term) behaviour [56,62]. The(online and lab) studies that focused on studying the graphic images on labels found thatthey elicited higher negative emotional arousal, fear and reactance, and were not wellaccepted by the participants. These results are also corroborated by the metanalysis investi-gating the impact of HWL in both alcohol and food products, and found that while healthwarning labels reduce product selection compared to no labels, the difference between
213
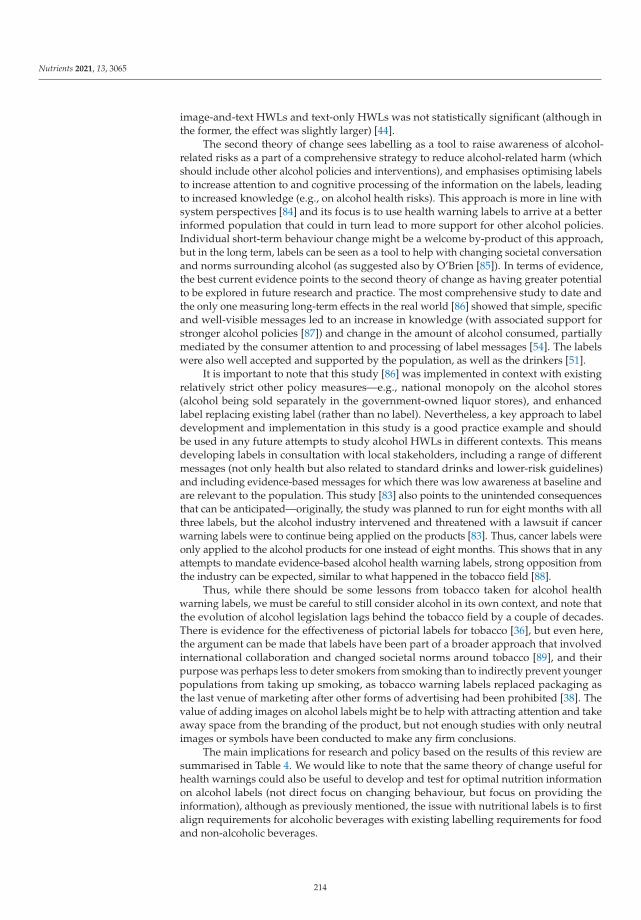
Nutrients 2021, 13, 3065
image-and-text HWLs and text-only HWLs was not statistically significant (although inthe former, the effect was slightly larger) [44].
The second theory of change sees labelling as a tool to raise awareness of alcohol-related risks as a part of a comprehensive strategy to reduce alcohol-related harm (whichshould include other alcohol policies and interventions), and emphasises optimising labelsto increase attention to and cognitive processing of the information on the labels, leadingto increased knowledge (e.g., on alcohol health risks). This approach is more in line withsystem perspectives [84] and its focus is to use health warning labels to arrive at a betterinformed population that could in turn lead to more support for other alcohol policies.Individual short-term behaviour change might be a welcome by-product of this approach,but in the long term, labels can be seen as a tool to help with changing societal conversationand norms surrounding alcohol (as suggested also by O’Brien [85]). In terms of evidence,the best current evidence points to the second theory of change as having greater potentialto be explored in future research and practice. The most comprehensive study to date andthe only one measuring long-term effects in the real world [86] showed that simple, specificand well-visible messages led to an increase in knowledge (with associated support forstronger alcohol policies [87]) and change in the amount of alcohol consumed, partiallymediated by the consumer attention to and processing of label messages [54]. The labelswere also well accepted and supported by the population, as well as the drinkers [51].
It is important to note that this study [86] was implemented in context with existingrelatively strict other policy measures—e.g., national monopoly on the alcohol stores(alcohol being sold separately in the government-owned liquor stores), and enhancedlabel replacing existing label (rather than no label). Nevertheless, a key approach to labeldevelopment and implementation in this study is a good practice example and shouldbe used in any future attempts to study alcohol HWLs in different contexts. This meansdeveloping labels in consultation with local stakeholders, including a range of differentmessages (not only health but also related to standard drinks and lower-risk guidelines)and including evidence-based messages for which there was low awareness at baseline andare relevant to the population. This study [83] also points to the unintended consequencesthat can be anticipated—originally, the study was planned to run for eight months with allthree labels, but the alcohol industry intervened and threatened with a lawsuit if cancerwarning labels were to continue being applied on the products [83]. Thus, cancer labels wereonly applied to the alcohol products for one instead of eight months. This shows that in anyattempts to mandate evidence-based alcohol health warning labels, strong opposition fromthe industry can be expected, similar to what happened in the tobacco field [88].
Thus, while there should be some lessons from tobacco taken for alcohol healthwarning labels, we must be careful to still consider alcohol in its own context, and note thatthe evolution of alcohol legislation lags behind the tobacco field by a couple of decades.There is evidence for the effectiveness of pictorial labels for tobacco [36], but even here,the argument can be made that labels have been part of a broader approach that involvedinternational collaboration and changed societal norms around tobacco [89], and theirpurpose was perhaps less to deter smokers from smoking than to indirectly prevent youngerpopulations from taking up smoking, as tobacco warning labels replaced packaging asthe last venue of marketing after other forms of advertising had been prohibited [38]. Thevalue of adding images on alcohol labels might be to help with attracting attention and takeaway space from the branding of the product, but not enough studies with only neutralimages or symbols have been conducted to make any firm conclusions.
The main implications for research and policy based on the results of this review aresummarised in Table 4. We would like to note that the same theory of change useful forhealth warnings could also be useful to develop and test for optimal nutrition informationon alcohol labels (not direct focus on changing behaviour, but focus on providing theinformation), although as previously mentioned, the issue with nutritional labels is to firstalign requirements for alcoholic beverages with existing labelling requirements for foodand non-alcoholic beverages.
214
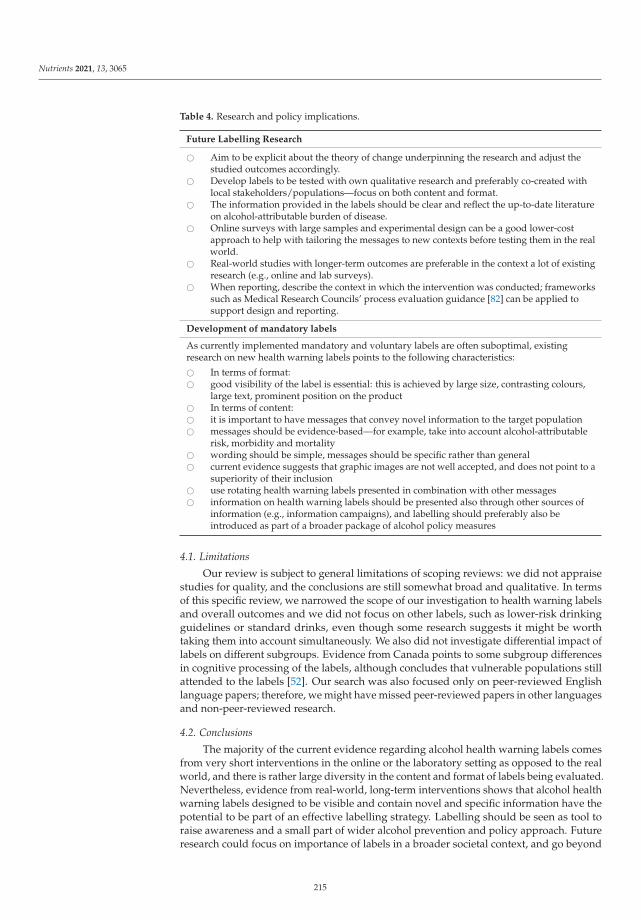
Nutrients 2021, 13, 3065
Table 4. Research and policy implications.
Future Labelling Research
� Aim to be explicit about the theory of change underpinning the research and adjust thestudied outcomes accordingly.
� Develop labels to be tested with own qualitative research and preferably co-created withlocal stakeholders/populations—focus on both content and format.
� The information provided in the labels should be clear and reflect the up-to-date literatureon alcohol-attributable burden of disease.
� Online surveys with large samples and experimental design can be a good lower-costapproach to help with tailoring the messages to new contexts before testing them in the realworld.
� Real-world studies with longer-term outcomes are preferable in the context a lot of existingresearch (e.g., online and lab surveys).
� When reporting, describe the context in which the intervention was conducted; frameworkssuch as Medical Research Councils’ process evaluation guidance [82] can be applied tosupport design and reporting.
Development of mandatory labels
As currently implemented mandatory and voluntary labels are often suboptimal, existingresearch on new health warning labels points to the following characteristics:
� In terms of format:� good visibility of the label is essential: this is achieved by large size, contrasting colours,
large text, prominent position on the product� In terms of content:� it is important to have messages that convey novel information to the target population� messages should be evidence-based—for example, take into account alcohol-attributable
risk, morbidity and mortality� wording should be simple, messages should be specific rather than general� current evidence suggests that graphic images are not well accepted, and does not point to a
superiority of their inclusion� use rotating health warning labels presented in combination with other messages� information on health warning labels should be presented also through other sources of
information (e.g., information campaigns), and labelling should preferably also beintroduced as part of a broader package of alcohol policy measures
4.1. Limitations
Our review is subject to general limitations of scoping reviews: we did not appraisestudies for quality, and the conclusions are still somewhat broad and qualitative. In termsof this specific review, we narrowed the scope of our investigation to health warning labelsand overall outcomes and we did not focus on other labels, such as lower-risk drinkingguidelines or standard drinks, even though some research suggests it might be worthtaking them into account simultaneously. We also did not investigate differential impact oflabels on different subgroups. Evidence from Canada points to some subgroup differencesin cognitive processing of the labels, although concludes that vulnerable populations stillattended to the labels [52]. Our search was also focused only on peer-reviewed Englishlanguage papers; therefore, we might have missed peer-reviewed papers in other languagesand non-peer-reviewed research.
4.2. Conclusions
The majority of the current evidence regarding alcohol health warning labels comesfrom very short interventions in the online or the laboratory setting as opposed to the realworld, and there is rather large diversity in the content and format of labels being evaluated.Nevertheless, evidence from real-world, long-term interventions shows that alcohol healthwarning labels designed to be visible and contain novel and specific information have thepotential to be part of an effective labelling strategy. Labelling should be seen as tool toraise awareness and a small part of wider alcohol prevention and policy approach. Futureresearch could focus on importance of labels in a broader societal context, and go beyond
215
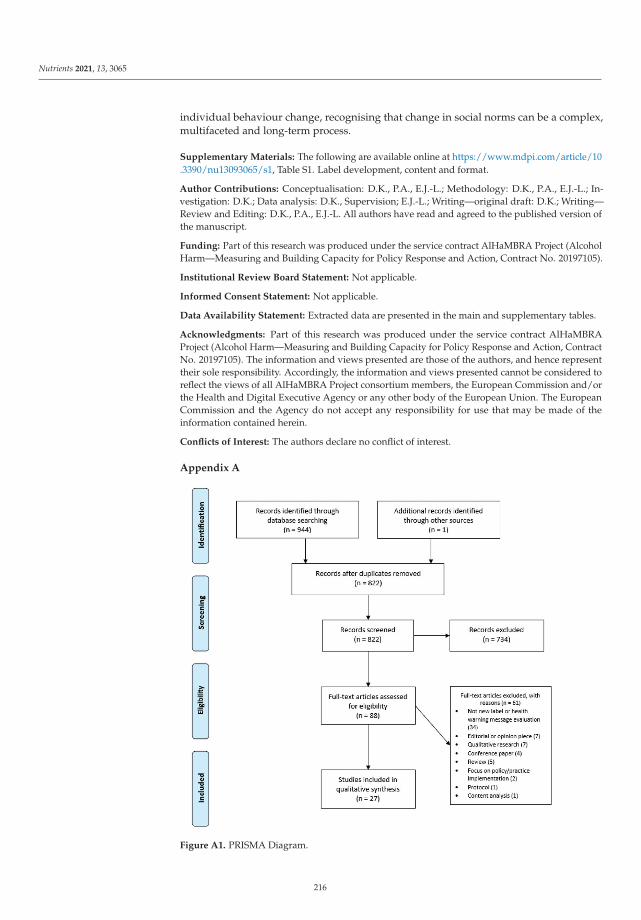
Nutrients 2021, 13, 3065
individual behaviour change, recognising that change in social norms can be a complex,multifaceted and long-term process.
Supplementary Materials: The following are available online at https://www.mdpi.com/article/10.3390/nu13093065/s1, Table S1. Label development, content and format.
Author Contributions: Conceptualisation: D.K., P.A., E.J.-L.; Methodology: D.K., P.A., E.J.-L.; In-vestigation: D.K.; Data analysis: D.K., Supervision; E.J.-L.; Writing—original draft: D.K.; Writing—Review and Editing: D.K., P.A., E.J.-L. All authors have read and agreed to the published version ofthe manuscript.
Funding: Part of this research was produced under the service contract AlHaMBRA Project (AlcoholHarm—Measuring and Building Capacity for Policy Response and Action, Contract No. 20197105).
Institutional Review Board Statement: Not applicable.
Informed Consent Statement: Not applicable.
Data Availability Statement: Extracted data are presented in the main and supplementary tables.
Acknowledgments: Part of this research was produced under the service contract AlHaMBRAProject (Alcohol Harm—Measuring and Building Capacity for Policy Response and Action, ContractNo. 20197105). The information and views presented are those of the authors, and hence representtheir sole responsibility. Accordingly, the information and views presented cannot be considered toreflect the views of all AlHaMBRA Project consortium members, the European Commission and/orthe Health and Digital Executive Agency or any other body of the European Union. The EuropeanCommission and the Agency do not accept any responsibility for use that may be made of theinformation contained herein.
Conflicts of Interest: The authors declare no conflict of interest.
Appendix A
Figure A1. PRISMA Diagram.
216
Nutrients 2021, 13, 3065
References
1. Shield, K.; Manthey, J.; Rylett, M.; Probst, C.; Wettlaufer, A.; Parry, C.D.H.; Rehm, J. National, regional, and global burdens ofdisease from 2000 to 2016 attributable to alcohol use: A comparative risk assessment study. Lancet Public Health 2020, 5, e51–e61.[CrossRef]
2. Okaru, A.O.; Lachenmeier, D.W. Margin of exposure analyses and overall toxic effects of alcohol with special consideration ofcarcinogenicity. Nutrients 2021, in press.
3. Rehm, J.; Gmel Sr, G.E.; Gmel, G.; Hasan, O.S.M.; Imtiaz, S.; Popova, S.; Probst, C.; Roerecke, M.; Room, R.; Samokhvalov, A.V.;et al. The relationship between different dimensions of alcohol use and the burden of disease—An update. Addiction 2017, 112,968–1001. [CrossRef]
4. Rehm, J.; Taylor, B.; Mohapatra, S.; Irving, H.; Baliunas, D.; Patra, J.; Roerecke, M. Alcohol as a risk factor for liver cirrhosis: Asystematic review and meta-analysis. Drug Alcohol Rev. 2010, 29, 437–445. [CrossRef]
5. Bagnardi, V.; Rota, M.; Botteri, E.; Tramacere, I.; Islami, F.; Fedirko, V.; Scotti, L.; Jenab, M.; Turati, F.; Pasquali, E.; et al. Alcoholconsumption and site-specific cancer risk: A comprehensive dose–response meta-analysis. Br. J. Cancer 2015, 112, 580–593.[CrossRef] [PubMed]
6. International Agency for Research on Cancer IARC. IARC Monographs on the Evaluation of Carcinogenic Risks to Humans: Volume 96:Alcohol Consumption and Ethyl Carbamate; International Agency for Research on Cancer IARC: Lion, France, 2010; Volume 96.
7. International Agency for Research on Cancer. Monographs on the Evaluation of Carcinogenic Risks to Humans: Alcohol Drinking;International Agency for Research on Cancer IARC: Lion, France, 1988; Volume 44.
8. Grant, B.F.; Goldstein, R.; Saha, T.D.; Chou, S.P.; Jung, J.; Zhang, H.; Pickering, R.P.; Ruan, W.J.; Smith, S.M.; Huang, B.; et al.Epidemiology of DSM-5 Alcohol Use Disorder results from the national epidemiologic survey on alcohol and related conditionsIII. JAMA Psychiatry 2015, 72, 757–766. [CrossRef] [PubMed]
9. Rehm, J.; Roerecke, M. Cardiovascular effects of alcohol consumption. Trends Cardiovasc. Med. 2017, 27, 534–538. [CrossRef]10. Imtiaz, S.; Shield, K.D.; Roerecke, M.; Samokhvalov, A.V.; Lonnroth, K.; Rehm, J. Alcohol consumption as a risk factor for
tuberculosis: Meta-analyses and burden of disease. Eur. Respir. J. 2017, 50, 1700216. [CrossRef]11. Bellos, S.; Skapinakis, P.; Rai, D.; Zitko, P.; Araya, R.; Lewis, G.; Lionis, C.; Mavreas, V. Longitudinal association between different
levels of alcohol consumption and a new onset of depression and generalized anxiety disorder: Results from an internationalstudy in primary care. Psychiatry Res. 2016, 243, 30–34. [CrossRef]
12. Boden, J.M.; Fergusson, D.M. Alcohol and depression. Addiction 2011, 106, 906–914. [CrossRef]13. Popova, S.; Lange, S.; Shield, K.; Mihic, A.; Chudley, A.E.; Mukherjee, R.A.S.; Bekmuradov, D.; Rehm, J. Comorbidity of fetal
alcohol spectrum disorder: A systematic review and meta-analysis. Lancet 2016, 387, 978–987. [CrossRef]14. Testa, M.; Quigley, B.M.; Eiden, R. The Effects of Prenatal Alcohol Exposure on Infant Mental Development: A Meta-Analytical
Review. Alcohol Alcohol. 2003, 38, 295–304. [CrossRef]15. Scheideler, J.K.; Klein, W.M.P. Awareness of the Link between Alcohol Consumption and Cancer across the World: A Review.
Cancer Epidemiol. Biomark. Prev. 2018, 27, 429–437. [CrossRef]16. Vallance, K.; Stockwell, T.; Zhao, J.; Shokar, S.; Schoueri-Mychasiw, N.; Hammond, D.; Greenfield, T.K.; McGavock, J.; Weerasinghe,
A.; Hobin, E. Baseline Assessment of Alcohol-Related Knowledge of and Support for Alcohol Warning Labels Among AlcoholConsumers in Northern Canada and Associations With Key Sociodemographic Characteristics. J. Stud. Alcohol Drugs 2020, 81,238–248. [CrossRef] [PubMed]
17. Calvert, C.M.; Toomey, T.; Jones-Webb, R. Are people aware of the link between alcohol and different types of Cancer? BMCPublic Health 2021, 21, 1–10. [CrossRef] [PubMed]
18. Thomsen, K.L.; Christensen, A.S.P.; Meyer, M.K.H. Awareness of alcohol as a risk factor for cancer: A population-basedcross-sectional study among 3000 Danish men and women. Prev. Med. Rep. 2020, 19, 101156. [CrossRef]
19. Martin-Moreno, J.M.; Harris, M.E.; Breda, J.; Møller, L.; Alfonso-Sanchez, J.L.; Gorgojo, L. Enhanced labelling on alcoholic drinks:Reviewing the evidence to guide alcohol policy. Eur. J. Public Health 2013, 23, 1082–1087. [CrossRef] [PubMed]
20. World Health Organisation Global Information System on Alcohol and Health (GISAH). Available online: http://apps.who.int/gho/data/node.gisah.A1191?lang=en&showonly=GISAH (accessed on 27 August 2021).
21. Government of Canada Labelling Requirements for Alcoholic Beverages. Available online: https://inspection.canada.ca/food-label-requirements/labelling/industry/alcohol/eng/1392909001375/1392909133296 (accessed on 11 June 2021).
22. European Commission Regulation (EU) No 1169/2011 of the European Parliament and of the Council of 25 October 2011 onthe Provision of Food Information to Consumers. Available online: https://eur-lex.europa.eu/legal-content/EN/ALL/?uri=CELEX%3A32011R1169 (accessed on 27 August 2021).
23. Food Standards Australia and New Zealand Labelling of Alcoholic Beverages. Available online: https://www.foodstandards.gov.au/consumer/labelling/Pages/Labelling-of-alcoholic-beverages.aspx (accessed on 11 June 2021).
24. Alcohol and Tobacco Tax and Trade Bureau Labeling Resources. Available online: https://www.ttb.gov/labeling/labeling-resources (accessed on 11 June 2021).
25. Maynard, O.M.; Langfield, T.; Attwood, A.S.; Allen, E.; Drew, I.; Votier, A.; Munafò, M.R. No Impact of Calorie or Unit Informationon Ad Libitum Alcohol Consumption (Special Issue: Communicating messages about drinking). Alcohol Alcohol. 2018, 53, 12–19.[CrossRef] [PubMed]
217
Nutrients 2021, 13, 3065
26. Maynard, O.; Blackwell, A.; Munafò, M.; Attwood, A. Know Your Limits: Labelling Interventions to Reduce Alcohol Consumption;Alcohol Research UK: London, UK, 2018.
27. Croker, H.; Packer, J.; Russell, S.J.; Stansfield, C.; Viner, R.M. Front of pack nutritional labelling schemes: A systematic review andmeta-analysis of recent evidence relating to objectively measured consumption and purchasing. J. Hum. Nutr. Diet. 2020, 33,518–537. [CrossRef]
28. Kelly, B.; Jewell, J. What Is the Evidence on the Policy Specifications, Development Processes and Effectiveness of Existing Front-of-PackFood Labelling Policies in the WHO European Region? WHO Regional Office for Europe: Copenhagen, Denmark, 2018.
29. Wilkinson, C.; Allsop, S.; Cail, D.; Chikritzhs, T.; Daube, M.; Kirby, G.; Mattick, R. Alcohol Warning Labels: Evidence of Effectivenesson Risky Alcohol Consumption and Short Term Outcomes; National Drug Research Institute: Bentley, WA, Australia, 2009.
30. Wilkinson, C.; Room, R. Warnings on alcohol containers and advertisements: International experience and evidence on effects.Drug Alcohol Rev. 2009, 28, 426–435. [CrossRef]
31. Dossou, G.; Gallopel-Morvan, K.; Diouf, J.-F. The effectiveness of current French health warnings displayed on alcohol advertise-ments and alcoholic beverages. Eur. J. Public Health 2017, 27, 699–704. [CrossRef]
32. Dumas, A.; Toutain, S.; Hill, C.; Simmat-Durand, L. Warning about drinking during pregnancy: Lessons from the Frenchexperience. Reprod. Health 2018, 15, 20. [CrossRef] [PubMed]
33. Coomber, K.; Martino, F.; Barbour, I.R.; Mayshak, R.; Miller, P.G. Do consumers “Get the facts”? A survey of alcohol warninglabel recognition in Australia. BMC Public Health 2015, 15, 816. [CrossRef] [PubMed]
34. Critchlow, N.; Jones, D.; Moodie, C.; Mackintosh, A.M.; Fitzgerald, N.; Hooper, L.; Thomas, C.; Vohra, J. Awareness of product-related information, health messages and warnings on alcohol packaging among adolescents: A cross-sectional survey in theUnited Kingdom. J. Public Health 2020, 42, e223–e230. [CrossRef] [PubMed]
35. Kersbergen, I.; Field, M. Alcohol consumers’ attention to warning labels and brand information on alcohol packaging: Findingsfrom cross-sectional and experimental studies. BMC Public Health 2017, 17, 1–11. [CrossRef] [PubMed]
36. Noar, S.M.; Francis, D.B.; Bridges, C.; Sontag, J.M.; Ribisl, K.M.; Brewer, N.T. The impact of strengthening cigarette pack warnings:Systematic review of longitudinal observational studies. Soc. Sci. Med. 2016, 164, 118–129. [CrossRef]
37. Noar, S.M.; Francis, D.B.; Bridges, C.; Sontag, J.M.; Brewer, N.T.; Ribisl, K.M. Effects of Strengthening Cigarette Pack Warnings onAttention and Message Processing: A Systematic Review. J. Mass Commun. Q. 2017, 94, 416–442. [CrossRef]
38. Al-Hamdani, M. The case for stringent alcohol warning labels: Lessons from the tobacco control experience. J. Public Health Policy2013, 35, 65–74. [CrossRef]
39. World Health Organization. Global Strategy to Reduce the Harmful Use of Alcohol; World Health Organization: Geneva, Switzerland, 2010.40. Bates, S.; Holmes, J.; Gavens, L.; De Matos, E.G.; Li, J.; Ward, B.; Hooper, L.; Dixon, S.; Buykx, P. Awareness of alcohol as a risk
factor for cancer is associated with public support for alcohol policies. BMC Public Health 2018, 18, 1–11. [CrossRef]41. Buykx, P.; Gilligan, C.; Ward, B.; Kippen, R.; Chapman, K. Public support for alcohol policies associated with knowledge of cancer
risk. Int. J. Drug Policy 2015, 26, 371–379. [CrossRef]42. Alcohol Action Ireland What is Public Health Alcohol Act? Available online: https://alcoholireland.ie/what-is-the-public-
health-alcohol-bill/ (accessed on 11 June 2021).43. Hassan, L.M.; Shiu, E. A systematic review of the efficacy of alcohol warning labels: Insights from qualitative and quantitative
research in the new millennium. J. Soc. Mark. 2018, 8, 333–352. [CrossRef]44. Clarke, N.; Pechey, E.; Kosıte, D.; König, L.M.; Mantzari, E.; Blackwell, A.K.M.; Marteau, T.M.; Hollands, G.J. Impact of health
warning labels on selection and consumption of food and alcohol products: Systematic review with meta-analysis. Health Psychol.Rev. 2020, 1–24. [CrossRef] [PubMed]
45. Dimova, E.D.; Mitchell, D. Rapid literature review on the impact of health messaging and product information on alcohollabelling. Drugs: Educ. Prev. Policy 2021, 1–13. [CrossRef]
46. Wettlaufer, A. Can a Label Help me Drink in Moderation? A Review of the Evidence on Standard Drink Labelling. Subst. UseMisuse 2018, 53, 585–595. [CrossRef] [PubMed]
47. Arksey, H.; O’Malley, L. Scoping studies: Towards a methodological framework. Int. J. Soc. Res. Methodol. 2005, 8, 19–32.[CrossRef]
48. Tricco, A.C.; Lillie, E.; Zarin, W.; O’Brien, K.; Colquhoun, H.; Kastner, M.; Levac, D.; Ng, C.; Sharpe, J.P.; Wilson, K.; et al. Ascoping review on the conduct and reporting of scoping reviews. BMC Med Res. Methodol. 2016, 16, 1–10. [CrossRef]
49. Tricco, A.C.; Lillie, E.; Zarin, W.; O’Brien, K.K.; Colquhoun, H.; Levac, D.; Moher, D.; Peters, M.D.J.; Horsley, T.; Weeks, L.;et al. PRISMA extension for scoping reviews (PRISMA-ScR): Checklist and explanation. Ann. Intern. Med. 2018, 169, 467–473.[CrossRef]
50. Pham, C.; Rundle-Thiele, S.; Parkinson, J.; Li, S. Alcohol Warning Label Awareness and Attention: A Multi-method Study. AlcoholAlcohol. 2017, 53, 39–45. [CrossRef]
51. Hobin, E.; Schoueri-Mychasiw, N.; Weerasinghe, A.; Vallance, K.; Hammond, D.; Greenfield, T.K.; McGavock, J.; Paradis, C.;Stockwell, T. Effects of strengthening alcohol labels on attention, message processing, and perceived effectiveness: A quasi-experimental study in Yukon, Canada. Int. J. Drug Policy 2020, 77, 102666. [CrossRef]
52. Hobin, E.; Weerasinghe, A.; Vallance, K.; Hammond, D.; McGavock, J.; Greenfield, T.K.; Schoueri-Mychasiw, N.; Paradis, C.;Stockwell, T. Testing Alcohol Labels as a Tool to Communicate Cancer Risk to Drinkers: A Real-World Quasi-Experimental Study.J. Stud. Alcohol Drugs 2020, 81, 249–261. [CrossRef]
218

Nutrients 2021, 13, 3065
53. Zhao, J.; Stockwell, T.; Vallance, K.; Hobin, E. The Effects of Alcohol Warning Labels on Population Alcohol Consumption:An Interrupted Time Series Analysis of Alcohol Sales in Yukon, Canada. J. Stud. Alcohol Drugs 2020, 81, 225–237. [CrossRef][PubMed]
54. Hobin, E.; Shokar, S.; Vallance, K.; Hammond, D.; McGavock, J.; Greenfield, T.K.; Schoueri-Mychasiw, N.; Paradis, C.; Stockwell,T. Communicating risks to drinkers: Testing alcohol labels with a cancer warning and national drinking guidelines in Canada.Can. J. Public Health 2020, 111, 716–725. [CrossRef] [PubMed]
55. Clarke, N.; Pechey, E.; Mantzari, E.; Blackwell, A.K.M.; De Loyde, K.; Morris, R.W.; Munafò, M.R.; Marteau, T.M.; Hollands, G.J.Impact of health warning labels communicating the risk of cancer on alcohol selection: An online experimental study. Addiction2021, 116, 41–52. [CrossRef]
56. Clarke, N.; Blackwell, A.K.M.; De Loyde, K.; Pechey, E.; Hobson, A.; Pilling, M.; Morris, R.W.; Marteau, T.M.; Hollands, G.J.Health warning labels and alcohol selection: A randomised controlled experiment in a naturalistic shopping laboratory. Addiction2021, 3. [CrossRef]
57. Pechey, E.; Clarke, N.; Mantzari, E.; Blackwell, A.K.M.; Deloyde, K.; Morris, R.W.; Marteau, T.M.; Hollands, G.J. Image-and-texthealth warning labels on alcohol and food: Potential effectiveness and acceptability. BMC Public Health 2020, 20, 1–14. [CrossRef]
58. Jongenelis, M.; Pettigrew, S.; Wakefield, M.; Slevin, T.; Pratt, I.S.; Chikritzhs, T.; Liang, W. Investigating Single-Versus Multiple-Source Approaches to Communicating Health Messages Via an Online Simulation. Am. J. Health Promot. 2018, 32, 979–988.[CrossRef] [PubMed]
59. Jongenelis, M.I.; Pratt, I.S.; Slevin, T.; Chikritzhs, T.; Liang, W.; Pettigrew, S. The effect of chronic disease warning statements onalcohol-related health beliefs and consumption intentions among at-risk drinkers. Health Educ. Res. 2018, 33, 351–360. [CrossRef][PubMed]
60. Pettigrew, S.; Jongenelis, M.I.; Glance, D.; Chikritzhs, T.; Pratt, I.S.; Slevin, T.; Liang, W.; Wakefield, M. The effect of cancerwarning statements on alcohol consumption intentions. Health Educ. Res. 2016, 31, 60–69. [CrossRef]
61. Wigg, S.; Stafford, L.D. Health Warnings on Alcoholic Beverages: Perceptions of the Health Risks and Intentions towards AlcoholConsumption. PLoS ONE 2016, 11, e0153027. [CrossRef]
62. Stafford, L.D.; Salmon, J. Alcohol health warnings can influence the speed of consumption. J. Public Health 2017, 25, 147–154.[CrossRef] [PubMed]
63. Gold, N.; Egan, M.; Londakova, K.; Mottershaw, A.; Harper, H.; Burton, R.; Henn, C.; Smolar, M.; Walmsley, M.; Arambepola, R.;et al. Effect of alcohol label designs with different pictorial representations of alcohol content and health warnings on knowledgeand understanding of low-risk drinking guidelines: A randomized controlled trial. Addiction 2021, 116, 1443–1459. [CrossRef]
64. Al-Hamdani, M.; Smith, S. Alcohol warning label perceptions: Emerging evidence for alcohol policy. Can. J. Public Health 2015,106, e395–e400. [CrossRef]
65. Hall, M.G.; Grummon, A.H.; Lazard, A.J.; Maynard, O.M.; Taillie, L.S. Reactions to graphic and text health warnings for cigarettes,sugar-sweetened beverages, and alcohol: An online randomized experiment of US adults. Prev. Med. 2020, 137, 106120. [CrossRef][PubMed]
66. Monk, R.L.; Westwood, J.; Heim, D.; Qureshi, A.W. The effect of pictorial content on attention levels and alcohol-related beliefs:An eye-tracking study. J. Appl. Soc. Psychol. 2017, 47, 158–164. [CrossRef]
67. Morgenstern, M.; Dumbili, E.W.; Hansen, J.; Hanewinkel, R. Effects of alcohol warning labels on alcohol-related cognitionsamong German adolescents: A factorial experiment. Addict. Behav. 2021, 117, 106868. [CrossRef] [PubMed]
68. Krischler, M.; Glock, S. Alcohol warning labels formulated as questions change alcohol-related outcome expectancies: A pilotstudy. Addict. Res. Theory 2015, 23, 343–349. [CrossRef]
69. Ma, Z. The Role of Narrative Pictorial Warning Labels in Communicating Alcohol-Related Cancer Risks. Health Commun.2021, 1–9. [CrossRef]
70. Annunziata, A.; Agnoli, L.; Vecchio, R.; Charters, S.; Mariani, A. Health warnings on wine labels: A discrete choice analysis ofItalian and French Generation Y consumers. Wine Econ. Policy 2019, 8, 81–90. [CrossRef]
71. Blackwell, A.K.M.; Drax, K.; Attwood, A.S.; Munafò, M.R.; Maynard, O.M. Informing drinkers: Can current UK alcohol labels beimproved? Drug Alcohol Depend. 2018, 192, 163–170. [CrossRef]
72. Glock, S.; Krolak-Schwerdt, S. Changing Outcome Expectancies, Drinking Intentions, and Implicit Attitudes toward Alcohol: AComparison of Positive Expectancy-Related and Health-Related Alcohol Warning Labels. Appl. Psychol. Health Well-Being 2013, 5,332–347. [CrossRef]
73. Hall, M.G.; Grummon, A.H.; Maynard, O.M.; Kameny, M.R.; Jenson, D.; Popkin, B.M. Causal Language in Health Warning Labelsand US Adults’ Perception: A Randomized Experiment. Am. J. Public Health 2019, 109, 1429–1433. [CrossRef]
74. Jarvis, W.; Pettigrew, S. The relative influence of alcohol warning statement type on young drinkers’ stated choices. Food Qual.Prefer. 2013, 28, 244–252. [CrossRef]
75. Sillero-Rejon, C.; Attwood, A.S.; Blackwell, A.K.M.; Ibáñez-Zapata, J.-A.; Munafò, M.R.; Maynard, O.M. Alcohol pictorial healthwarning labels: The impact of self-affirmation and health warning severity. BMC Public Health 2018, 18, 1403. [CrossRef] [PubMed]
76. Al-Hamdani, M.; Smith, S.M. Alcohol Warning Label Perceptions: Do Warning Sizes and Plain Packaging Matter? J. Stud. AlcoholDrugs 2017, 78, 79–87. [CrossRef]
219

Nutrients 2021, 13, 3065
77. Jané-Llopis, E.; Kokole, D.; Neufeld, M.; Hasan, O.S.M.; Rehm, J. What Is the Current Alcohol Labelling Practice in the WHOEuropean Region and What Are Barriers and Facilitators to Development and Implementation of Alcohol Labelling Policy?Health Evidence Network Synthesis Report, No. 68. Available online: https://www.ncbi.nlm.nih.gov/books/NBK558550/(accessed on 11 June 2021).
78. Neufeld, M.; Ferreira-Borges, C.; Rehm, J. Implementing Health Warnings on Alcoholic Beverages: On the Leading Role ofCountries of the Commonwealth of Independent States. Int. J. Environ. Res. Public Health 2020, 17, 8205. [CrossRef] [PubMed]
79. World Health Organisation. Global Status Report on Alcohol and Health 2018; World Health Organization: Geneva, Switzerland,2018; Volume 65. Available online: http://www.who.int/iris/handle/10665/112736 (accessed on 27 August 2021).
80. Chisholm, D.; Moro, D.; Bertram, M.; Pretorius, C.; Gmel, G.; Shield, K.; Rehm, J. Are the “Best Buys” for Alcohol Control StillValid? An Update on the Comparative Cost-Effectiveness of Alcohol Control Strategies at the Global Level. J. Stud. Alcohol Drugs2018, 79, 514–522. [CrossRef] [PubMed]
81. WHO. Status Report on Alcohol Consumption, Harm and Policy Responses in 30 European Countries 2019; WHO: Copenhagen,Denmark, 2019.
82. Moore, G.F.; Audrey, S.; Barker, M.; Bond, L.; Bonell, C.; Hardeman, W.; Moore, L.; O’Cathain, A.; Tinati, T.; Wight, D.; et al.Process evaluation of complex interventions: Medical Research Council guidance. BMJ 2015, 350. [CrossRef]
83. Stockwell, T.; Solomon, R.; O’Brien, P.; Vallance, K.; Hobin, E. Cancer Warning Labels on Alcohol Containers: A Consumer’sRight to Know, a Government’s Responsibility to Inform, and an Industry’s Power to Thwart. J. Stud. Alcohol Drugs 2020, 81,284–292. [CrossRef] [PubMed]
84. Petticrew, M.; Shemilt, I.; Lorenc, T.M.; Marteau, T.; Melendez-Torres, G.J.; O’Mara-Eves, A.; Stautz, K.; Thomas, J. Alcoholadvertising and public health: Systems perspectives versus narrow perspectives. J. Epidemiol. Community Health 2017, 71, 308–312.[CrossRef] [PubMed]
85. O’Brien, P.; Mitchell, A.D. On the Bottle: Health Information, Alcohol Labelling and the WTO Technical Barriers to TradeAgreement. QUT Law Rev. 2018, 18, 124. [CrossRef]
86. Vallance, K.; Stockwell, T.; Hammond, D.; Shokar, S.; Schoueri-Mychasiw, N.; Greenfield, T.; McGavock, J.; Zhao, J.; Weerasinghe,A.; Hobin, E. Testing the Effectiveness of Enhanced Alcohol Warning Labels and Modifications Resulting From Alcohol IndustryInterference in Yukon, Canada: Protocol for a Quasi-Experimental Study. JMIR Res. Protoc. 2020, 9, e16320. [CrossRef] [PubMed]
87. Weerasinghe, A.; Schoueri-Mychasiw, N.; Vallance, K.; Stockwell, T.; Hammond, D.; McGavock, J.; Greenfield, T.K.; Paradis, C.;Hobin, E. Improving Knowledge that Alcohol Can Cause Cancer is Associated with Consumer Support for Alcohol Policies:Findings from a Real-World Alcohol Labelling Study. Int. J. Environ. Res. Public Health 2020, 17, 398. [CrossRef] [PubMed]
88. Hiilamo, H.; Crosbie, E.; A Glantz, S. The evolution of health warning labels on cigarette packs: The role of precedents, andtobacco industry strategies to block diffusion. Tob. Control 2014, 23, e2. [CrossRef] [PubMed]
89. Myers, M.L. The FCTC’s evidence-based policies remain a key to ending the tobacco epidemic. Tob. Control 2013, 22, i45–i46.[CrossRef]
220
nutrients
Article
Government Options to Reduce the Impact of Alcohol onHuman Health: Obstacles to Effective Policy Implementation
Tim Stockwell 1,*, Norman Giesbrecht 2, Kate Vallance 1 and Ashley Wettlaufer 2
Citation: Stockwell, T.; Giesbrecht,
N.; Vallance, K.; Wettlaufer, A.
Government Options to Reduce the
Impact of Alcohol on Human Health:
Obstacles to Effective Policy
Implementation. Nutrients 2021, 13,
2846. https://doi.org/10.3390/
nu13082846
Academic Editor: Peter Anderson
Received: 2 July 2021
Accepted: 11 August 2021
Published: 19 August 2021
Publisher’s Note: MDPI stays neutral
with regard to jurisdictional claims in
published maps and institutional affil-
iations.
Copyright: © 2021 by the authors.
Licensee MDPI, Basel, Switzerland.
This article is an open access article
distributed under the terms and
conditions of the Creative Commons
Attribution (CC BY) license (https://
creativecommons.org/licenses/by/
4.0/).
1 Canadian Institute for Substance Use Research, University of Victoria, Victoria, BC V8P 5C2, Canada;[email protected]
2 Centre for Addiction and Mental Health, Toronto, ON M5V 2B4, Canada;[email protected] (N.G.); [email protected] (A.W.)
* Correspondence: [email protected]
Abstract: Evidence for effective government policies to reduce exposure to alcohol’s carcinogenicand hepatoxic effects has strengthened in recent decades. Policies with the strongest evidenceinvolve reducing the affordability, availability and cultural acceptability of alcohol. However, policiesthat reduce population consumption compete with powerful commercial vested interests. Thispaper draws on the Canadian Alcohol Policy Evaluation (CAPE), a formal assessment of effectivegovernment action on alcohol across Canadian jurisdictions. It also draws on alcohol policy casestudies elsewhere involving attempts to introduce minimum unit pricing and cancer warning labelson alcohol containers. Canadian governments collectively received a failing grade (F) for alcoholpolicy implementation during the most recent CAPE assessment in 2017. However, had the bestpractices observed in any one jurisdiction been implemented consistently, Canada would havereceived an A grade. Resistance to effective alcohol policies is due to (1) lack of public awareness ofboth need and effectiveness, (2) a lack of government regulatory mechanisms to implement effectivepolicies, (3) alcohol industry lobbying, and (4) a failure from the public health community to promotespecific and feasible actions as opposed to general principles, e.g., ‘increased prices’ or ‘reducedaffordability’. There is enormous untapped potential in most countries for the implementation ofproven strategies to reduce alcohol-related harm. While alcohol policies have weakened in manycountries during the COVID-19 pandemic, societies may now also be more accepting of publichealth-inspired policies with proven effectiveness and potential economic benefits.
Keywords: alcohol; policy; public health; alcohol industry; Canada
1. Introduction
Alcohol and public health policy as an organised field of academic inquiry is relativelynew. In 1975, the assertion by Kettil Bruun, Griffith Edwards, Robin Room and others thatalcohol was a public health issue was seen as new and controversial [1]. Using case studiesmostly from Scandinavia and other parts of Europe, they provided evidence that the totalconsumption of alcohol was a reliable predictor of the extent of serious alcohol-relatedharms in any particular population, e.g., liver disease, injury and alcohol use disorders.Perhaps their most revolutionary proposal was that governments could take action toreduce alcohol-related harm, principally by reducing its affordability (e.g., through highertaxes) and its availability (e.g., by reduced days and hours of sale).
In the decades since this landmark publication, often referred to as the “PurpleBook”, thousands of studies have been published on the intersections between populationconsumption of alcohol, the extent of population harm from alcohol and the relativeeffectiveness of alternative government policies. Learnings from these research mountainsare now distilled in systematic reviews and meta-analyses and are further informed byadvances in theory and methodology. For example, the International Model of AlcoholHarms and Policies (InterMAHP) [2] provides an online tool to accurately estimate the
Nutrients 2021, 13, 2846. https://doi.org/10.3390/nu13082846 https://www.mdpi.com/journal/nutrients221
Nutrients 2021, 13, 2846
extent of alcohol-related harm in any population (be it a city, region, or country) fromavailable data on per capita alcohol consumption and the recorded prevalence of variouscauses of death, injury, and illness. InterMAHP also helps to estimate how these harmschange when policies are introduced to increase or decrease alcohol consumption (e.g., [3]).The tool is built on some solid foundations including (a) a demonstrated mathematicalrelationship between the average consumption of a population and the distribution ofdrinkers according to their typical daily consumption [4] and (b) the latest systematicreviews and meta-analyses of published studies estimating risks of different types ofdisease and injury as a function of how much people drink.
As a result of such advances, it is now possible to provide very specific and detailedadvice to governments regarding the public health consequences of policy decisions insuch concrete terms as how many people will become ill, injured or die prematurely fromalcohol-related reasons if policy X or Y is introduced—and what might be the economiccosts and benefits. Furthermore, the Sheffield Alcohol Policy Model (SAPM, e.g., [5])has been effectively applied over the last decade to inform legal and policy processesculminating in the introduction of a Minimum Unit Price (MUP) for alcohol in Scotlandin May 2018 [6], a successful policy which is rapidly being emulated in other countries(e.g., [7–9]). Both InterMAHP and SAPM have been used to estimate policy impacts ofMUP on such sensitive outcomes as government revenues and consumer expenditure(e.g., [3,10]).
In this paper, we take the view that while there are considerable obstacles and chal-lenges to the implementation of effective alcohol policies, theories and methodologies toinform effective implementation are available to policy decision makers, the public healthfield and the broader community of concerned citizens. While authors of the most highlycited and comprehensive evidence review on effective alcohol policies [11] concluded,rather depressingly, that effective policy is inevitably unpopular, we take a more optimisticapproach. We highlight “circuit breaker” strategies which can create a more favourableclimate for governments being prepared to implement policies with demonstrated effec-tiveness in reducing alcohol-related harms.
2. What Is Effective Alcohol Policy?
The World Health Organization (WHO) recently launched the WHO-SAFER interna-tional initiative to reduce alcohol-related harm in member countries [12]. Built around agrowing evidence base and the pre-existing WHO Global Strategy on Alcohol [13], thisinitiative promotes the following objectives:
(1) Strengthening restrictions on alcohol availability(2) Advancing and enforcing drink-driving countermeasures(3) Facilitating access to screening, brief interventions and treatment(4) Enforcing bans or comprehensive restrictions on alcohol advertising, sponsorship
and promotion(5) Raising prices on alcohol through excise taxes and pricing policies.
A number of research-led initiatives have sought to conduct systematic assessments ofthe extent to which such evidence-based strategies are being implemented in jurisdictionsand, in some cases, relate the extent of policy implementation to outcomes (e.g., [14,15]).The co-authors of this manuscript developed the Canadian Alcohol Policy Evaluation(CAPE) project [16–19] in which 250 indicators of alcohol policy implementation were eval-uated across 11 domains of effective government action in each of Canada’s 10 provincesand three territories. Table 1 below identifies seven domains for which there is evidence ofdirect effectiveness for the reduction in alcohol consumption and harms and also indicatesthe strength of this evidence and the likely scope of impacts on population level harms.These domains include each of the five WHO SAFER domains listed above and, in addition,two others with long-standing evidence to support them: Liquor Law Enforcement (e.g.,targeting enforcement to high-risk premises and enforcing laws prohibiting service tointoxicated persons) and Minimum Legal Drinking Age Laws.
222

Nutrients 2021, 13, 2846
Table 1. CAPE provincial and territorial alcohol policy domains and weights.
Direct Policy DomainsEffectiveness
(out of 5)Scope
(out of 5)Weight 1
(out of 25)
1. Pricing and Taxation 5 5 252. Physical Availability of Alcohol 4 4 16
3. Impaired Driving Countermeasures 5 3 154. Marketing and Advertising Controls 3 5 15
5. Minimum Legal Drinking Age 4 3 126. Screening, Brief Intervention and Referral 3 3 9
7. Liquor Law Enforcement: 3 3 9
Indirect Policy DomainsFacilitation
(out of 5)Scope
(out of 5)Weight 2
(out of 25)
8. Alcohol Control System 5 5 259. Alcohol Strategy 4 5 20
10. Monitoring and Reporting 4 4 1611. Health and Safety Messaging 3 4 12
1 Weight (direct) = Effectiveness × Scope. 2 Weight (indirect) = Facilitation × Scope. Weights are boldfaced to emphasise these were thefinal estimates of potential policy impacts.
Uniquely, CAPE also identified and assessed four “indirect policy domains” withthe capacity to facilitate the implementation of the other seven directly effective policies.In short, the extent of government ownership of alcohol distribution and retail systems(i.e., Alcohol Control System) facilitates control of direct policy levers such as pricing andavailability; a comprehensive Alcohol Strategy outlining multiple policy objectives withfunding for implementation, clear leadership independent of commercial vested interestsand an evaluation plan will guide multiple arms of government towards effective action;comprehensive, transparent and regular public Monitoring and Reporting of alcohol harmsand policies will help to sustain and continue to direct effective policies; Health and SafetyMessaging, particularly at the point of purchase and consumption through containerlabelling, will motivate effective policy action by highlighting risks and harms from alcoholconsumption, both among citizens and their elected representatives [17].
3. What Are the Obstacles to Effective Policy Implementation?
There are some recurring themes that characterise resistance to the implementation ofthe types of effective alcohol policies discussed above. We will restrict our discussion tofour key themes: (1) a lack of awareness about the extent of alcohol-related harm and the ef-fectiveness of alcohol policies; (2) a lack of government regulatory and legislative structuresfocused on reducing harm from alcohol; (3) effective lobbying by alcohol industry groupsto foster such skepticism and to propose less-effective policies; (4) absent or ineffectivelobbying by public health advocacy groups. We will discuss each of these in turn andsuggest ways such impediments can be overcome or at least be rendered less obstructive.
3.1. Low Public Awareness of the Extent of Alcohol Related Harm
Alcohol use is causally implicated in several hundred diagnostic categories of illnessand injury [2] including cancer and cardiovascular diseases, the two most common causesof death in developed countries. However, alcohol’s contribution to the illnesses andinjuries leading to emergency department presentation, hospitalisation and/or prematuredeath are usually not recorded on death certificates or diagnostic records. Special studiesare required to estimate the extent to which these premature deaths and presentations mightbe attributable to alcohol. The methods of such studies are complex and technical, wellbeyond the grasp of many health professionals, let alone decision-makers or members ofthe public. There is also a widespread belief evidenced by national surveys and perpetuatedby industry groups that moderate alcohol consumption can protect people from a widearray of harms, cardiovascular diseases in particular. For example, one survey found that57% of the Canadian population believed alcohol in moderation was good for their health
223
Nutrients 2021, 13, 2846
(e.g., [20]). The prevalence of this belief may have waned in recent years, perhaps reflectingmore open debate and critique of this idea, with a 2020 survey of Quebecers finding thisproportion to now be lower, at 40% [21]. Opinion surveys in different countries have alsofrequently found that when people are asked to estimate whether alcohol or illicit drugscontribute the most problems to society, usually alcohol comes in a poor second [22].
Contrary to these popular and governmental biases, the hard evidence is that alcoholuse contributes more health harms than other psychoactive drugs that are prohibited inmany countries (i.e., cannabis, opioids, stimulants, etc.). This is borne out of WHO GlobalBurden of Disease estimates which most recently indicate that 2.4 million premature deathsglobally are attributable to alcohol, compared with 0.49 million for illicit drugs in 2019 [23].In Canada, the ongoing Canadian Substance Use Costs and Harms [24] project reportsannually on estimated hospitalisations, deaths and economic costs from alcohol, cannabis,nicotine, opioids and other psychoactive substances [24]. The overall economic cost ofsubstance use across healthcare, lost productivity, criminal justice and other direct-costdomains was estimated at $46 billion in 2017. Accounting for more than three-quarters ofthe total cost are Canada’s three legal drugs: alcohol ($16.6 billion), tobacco ($12.3 billion)and cannabis ($3.2 billion). Among illicit substances, only opioids ($5.9 billion) and cocaine($3.7 billion) make up more than 5% of the total cost [24]. This disparity persists even at atime when there is an opioid overdose crisis. Typically, public debate focuses on the “crises”even if the harm and death rates are not substantially higher than those from alcohol.
Part of the reason for the lack of awareness of alcohol-related harms may be the extentto which these are not wholly attributable to the use of alcohol. Alcohol’s contributionsto serious illnesses, injuries and premature deaths are usually contributory and often noteven recorded. Sherk et al. [25] estimated that over 90% of alcohol-attributable deaths in aCanadian jurisdiction were partially alcohol attributable, and less than 10% wholly or 100%attributable. A good example is alcohol-related breast cancer. It has been estimated thatapproximately 7% of these cancers can be attributed to alcohol [26]. Nonetheless, despitethis relatively small contribution, because of the high prevalence of cancer in general, about30% of alcohol-attributable deaths in Canada are from alcohol-related cancers [24] (Notethat these estimates sum up the fractions of lives lost or hospitalisations caused to make upeach partially attributable case).
Not surprisingly, there is evidence worldwide that few members of the public areaware that alcohol is a carcinogen, despite the WHO’s International Agency for Researchon Cancer having confirmed a causal association more than 30 years ago [27]. For example,a national UK survey found that only 13% of respondents could identify alcohol as a causeof cancer without prompting, 33% could do so if prompted and 54% were completelyunaware of any alcohol–cancer connection [28].
The lack of public awareness of the hidden, partially alcohol-attributable illnesses andinjuries is also reflected in the widespread perception that the only serious harms fromalcohol are alcohol dependence, liver cirrhosis and crashes from impaired driving. In fact,these are just tips of much larger icebergs. At the outset of the COVID-19 pandemic, therewere several North American examples of perverse rationales being given by governmentsfor classifying alcohol as an “essential commodity”, which reflect this restricted viewof alcohol-related harm. In California [29] and at least two Canadian jurisdictions [30],this essential-commodity status was justified as a way of preventing healthcare servicesfrom being overwhelmed by people going into alcohol withdrawal. In Canada, at mostonly 5% of alcohol-attributable hospitalisations are associated with alcohol dependenceor withdrawal [30]. When India imposed a strict lockdown with a complete alcoholprohibition, there was indeed observed a spike in presentations for alcohol withdrawal,but this was transient and soon demand dropped to zero [31]. It was also documentedduring a Nordic strike of government alcohol monopoly workers that demand for alcoholwithdrawal treatment dropped to less than 40% of normal levels [32]. It has been shownelsewhere [30] that when partial as well as wholly alcohol-attributable hospitalisations areconsidered, maintaining alcohol use imposes a greater burden on healthcare services in
224
Nutrients 2021, 13, 2846
many countries than has COVID-19, e.g., 105,000 alcohol-attributable hospital admissionswere estimated for 2017 [24] compared with 40,000 COVID-19-related admissions in thefirst full year of the pandemic [33].
3.2. Low Public Awareness of the Effectiveness of Alcohol Policies
Babor et al. [11] advanced the influential narrative that effective alcohol policies(principally restrictions on pricing and availability) are unpopular with the public and theirelected representatives, while less effective educational strategies receive the strongestsupport in opinion surveys. This position is well based on opinion research spanningmultiple countries which consistently suggests that across-the-board price increases inparticular are the most unpopular of all alcohol policy options. For example, a carefulanalysis of public opinion on alcohol policy in the UK found 84% support for publicinformation campaigns, whereas only 33% supported increasing the price of alcohol, 41%for reducing the number of liquor outlets and 39% for reducing their hours of trading [34].Critically, Li et al. [34] were able to identify skepticism about the effectiveness of differentpolicies as a determining factor in whether they would be supported.
There is also a widespread belief that “alcoholics” will always access alcohol regard-less of price or availability, a viewpoint that anyone who has discussed alcohol controlpolicies with decision-makers or members of the public will have encountered. This iscontrary to evidence from a thorough systematic review that heavy drinkers do reduce theirdrinking when prices increase [35] and from the accounts of alcohol-dependent drinkersthemselves [36].
3.3. Absent or Inadequate Government Regulatory and Legislative Structures
Governments in both the developed and developing worlds rarely give high levelconsideration to alcohol policy. Responsibility for the implementation of the kinds ofevidence-based policies listed above is usually scattered across multiple ministries anddepartments. Health ministries are mostly responsible for providing healthcare to the sickand injured rather than addressing underlying causes and reducing risk factors, thus theydo not have direct access to the most important policy levers, namely, price, availabilityand marketing restrictions. Finance departments are responsible for taxation and pricingbut are not mandated to reduce adverse health and safety impacts of alcohol and often areunaware of the economic costs of these. They see their major responsibilities as raisinggovernment revenues and maintaining free and fair markets for all commodities. Directregulation of the sale and distribution of liquor is mostly delegated to local licensing andcivic authorities who perhaps are more inclined to see their roles as limiting public nuisanceand overseeing a fair market rather than protecting public health. It is rare for public healthconsiderations to be represented in the local, regional and national regulation of alcohol.
The low priority given to alcohol by governments is often reflected in the extent ofnational and international government funding for research, prevention and treatment. Aprime example is the substantially larger budget for the US National Institute for DrugAbuse than for the US National Institute for Alcoholism and Alcohol Abuse, i.e., USD1.3billion versus USD0.45 billion in 2020 [37,38]. This balance of effort and resourcing isalso frequently reflected in national government departmental budgets and numbers ofdedicated staff. For example, Health Canada’s Alcohol Policy Unit (APU) had about 1/6thof the staff positions allocated to the Office of Controlled Substances [39]. The APU hassince been downsized and absorbed into another public health unit.
At various times and places, alcohol-related problems have been deemed so severethat they have become a top government priority. Total prohibitions on alcohol sales haveoccasionally been attempted, notably in the US and parts of Canada in the early part of thelast century and, most recently, in India and South Africa as part of government measuresto reduce the spread of COVID-19 (e.g., [40]). These tend to be short lived and associatedwith increased crime and corruption even if health and safety outcomes improve, e.g.,reduced deaths from liver cirrhosis during the US Prohibition [41] and reduced violence in
225
Nutrients 2021, 13, 2846
the South African COVID-19 lockdowns [40]. More sustainable policies to control alcoholconsumption and reduce harms were introduced in the 19th and 20th centuries, principallyin North America and Scandinavia, namely, direct alcohol distribution and retail systemsotherwise known as “government alcohol monopolies”. Remnants of these monopoliesstill operate in some 17 US states, mostly restricted to sales of spirits and wine, and tosome degree in all Canadian jurisdictions (even Alberta maintains government control overthe distribution of alcohol) and some Scandinavian countries. The Finnish and Swedishalcohol monopolies (Alko and Systembolaget, respectively) are notable for both reportingto Ministries for Health and Social Affairs rather than following the North Americanpractice of placing such operations within finance ministries focused on revenue collectionrather than health and social outcomes [42,43]. Government alcohol control systems canfacilitate ready access to the key policy levers of pricing and availability, but they also needa special mandate to do so in the interests of public health and safety rather than simplefree-market economics. For this reason, the CAPE project documents both the extent ofgovernment ownership of alcohol distribution and retail systems in a jurisdiction and alsoto what ministry they report as an indication of the public purpose they are intended tofulfil [18].
Perhaps the most telling indication of the low priority afforded to alcohol and pub-lic health policy globally is the lack of alcohol-specific national and international laws.Room et al. [44] have made the case for an international treaty on alcohol noting suchtreaties exist for tobacco and illicit drug trade. In Canada, we have a federal TobaccoAct and a federal Cannabis Act but no Alcohol Act [19]. The legalisation of cannabis inCanada casts the lack of legislation and regulation of alcohol in sharp relief, especially whenconsidering the substantially lower harms and costs of cannabis in contrast to alcohol [24].
3.4. Effectiveness of Alcohol Industry Influence
Globally, nationally and sub-nationally, alcohol industry groups and companies applytheir immense resources to influence public debates on alcohol-related harm and policiesto address this harm so as to protect their marketplace. Babor [45] described some of theways alcohol industry-funded groups have sought to influence research agendas and shapepublic discussions around alcohol-related harm and prevention policies. He highlightedhow these activities help to confuse public discussion of health issues and policy optionsand are a convenient way to demonstrate ‘corporate responsibility’ in their attempts toavoid taxation and regulation. McCambridge et al. [46] have further analysed how industry-funded social aspects bodies such as DrinkAware in the UK attempt to work closely withgovernment agencies to influence policy agendas away from evidence-based policies thatmight restrict alcohol markets. Needless to say, industry groups can use their financialclout to directly influence the agendas of political parties through donations and directlobbying in ways that are not available to the public health community.
Petticrew and colleagues published a thematic analysis of industry-sponsored publi-cations on the role of alcohol as a risk factor for cancer. They showed how the evidencefor alcohol’s causal role in cancer is downplayed, ignored or even denied with heavyemphasis on the strength of other rival risk factors [47]. There are also many examples ofindustry-sponsored organisations extolling various health benefits from using their productwith little discussion of the growing critical literature of this interpretation (e.g., [48]). Acomprehensive analysis of direct alcohol industry funding for alcohol research reportedthat this had increased by 56% in recent decades [49].
The CAPE project has worked to identify the extent of alcohol industry involvementin the development and implementation of alcohol policies in Canada, provincially andfederally [49,50]. A key indicator used is whether alcohol industry representatives aredirectly involved in the development of government alcohol strategies. In 2017, it wasnoted that Canada’s National Alcohol Strategy Advisory Council had several Canadianalcohol manufacturers represented, a situation that has been subsequently remedied. These
226
Nutrients 2021, 13, 2846
efforts, and many others besides, work towards creating a positive climate of opinionaround alcohol and discourage effective government action to restrict its consumption.
Industry players have also shown they are not afraid to directly counter efforts toeducate the public about alcohol’s role as a contributing cause of cancer. The phenomenonof “pink washing” has been widely documented whereby industry groups support cancerawareness activities [51]. A prime Canadian example some years ago was the creationof Mike’s Hard Pink Lemonade in association with the Canadian Cancer Associationsbreast cancer awareness week [52], i.e., an alcohol producer associating itself with a cancerprevention activity while marketing a product which contributes directly to cancer [26].More recently, an initiative taken by the Yukon government in Canada to place cancerwarning labels on all products sold in a major liquor store in its capital Whitehorse as partof a Health Canada-funded research project was shut down as a result of thinly veiled legalthreats from major drinks producers [53].
3.5. Ineffectiveness of Public Health Advocacy
Perhaps surprisingly, even agencies concerned with the promotion of public healthhave often worked in opposition to or ignored the potential of evidence-based alcoholpolicies to improve public health. The ”Pink-Washing” of breast cancer noted above is justone example of perverse strategies from the public health field. Amin et al. [54] conducteda formal review of the websites of the Organisation for Economic Co-operation and Devel-opment cancer control agencies in 2017 as to the extent to which they identified alcohol asa risk factor for cancer. Websites in all countries except the USA and Canada at that timeidentified alcohol as a Class 1 carcinogen. While the US cancer agency recommended usingtaxation as a means of reducing tobacco-related cancers, no such action was recommendedin relation to alcohol taxes. Canada is also an example of an OECD country with no nationaladvocacy agency dedicated to promoting effective alcohol policy.
3.6. Summary and Ways Forward
There could not be a starker contrast between government responses to the COVID-19pandemic versus those to the health and safety problems associated with alcohol use,despite the related harms often being similar in scale [30]. Naturally, precautions toavoid contracting a potentially deadly virus that might make you seriously ill or kill youwithin weeks are more likely to be supported than measures to reduce the availability andaffordability of an enjoyable intoxicant, despite its short- and long-term risks. However,while the harms from COVID-19 have been counted and reported daily through multimediathroughout the course of the pandemic crisis, the majority of people in most countries areunaware of the serious harms (e.g., cancer) of alcohol consumption and of the full scaleof its burden on health and well-being. Since greater than 90% of associated mortality ispartially alcohol attributable, this important contribution often flies under the radar, and isnot recorded on death certificates or routinely reported by health authorities. It should notbe surprising, therefore, that effective government action to reduce our ability to access andpurchase a favourite recreational drug, widely believed to be innocuous or even beneficialto health, is often not taken. If one adds to this the existence of powerful commercial vestedinterest groups who are prepared to threaten litigation against governments that exercisetheir legal right to warn consumers of alcohol’s health risks by placing cancer warninglabels [53], it is a wonder that any government action at all is ever taken to inform citizensof alcohol’s health risks, let alone implement effective policies to reduce its consumption.
The evidence that the minority of people who understand that alcohol is a carcinogen,for example, are more likely to support evidence-based alcohol strategies (e.g., [50,55])should be a wake-up call to the public health community to increase awareness of alcohol-related harms. While awareness rising and educational strategies in general have beendecried as lacking evidence for changing population behaviours (e.g., [11]), they couldlikely have a critical role as a means of creating a more favourable environment for theimplementation of more directly effective policies [18].
227
Nutrients 2021, 13, 2846
The CSUCH project in Canada has begun the difficult task of enumerating boththe partially and wholly alcohol-attributable deaths and adverse health outcomes forall its jurisdictions, for all years and in comparison with other popular psychoactivesubstances [24]. The estimates are presented to the public and to policymakers in a varietyof formats and through a variety of media, including a web-based data visualisationtool (see: https://csuch.ca (access date 11 August 2021)) for individuals to explore anddownload figures and data tables. Such a resource on its own is completely insufficient tosubstantially impact national policies on such weighty matters as taxation and pricing, but,if communicated effectively to stakeholders with an interest in, for example, preventingcancer, heart disease, violence and/or substance use disorders, it could help turn the tideof public opinion.
Perhaps the single most effective tool to raise awareness of alcohol’s potentially harm-ful effects would be mandated warning labels of the variety trialled by the Yukon LiquorCorporation (see Figure 1). The Health Canada-funded evaluations of this interventiondemonstrated increased awareness of key messages (i.e., cancer risk, national drinkingguidelines and standard drink contents) among those who recalled seeing the messages(e.g., [56]), greater intentions to reduce alcohol intake [57] and significantly reduced percapita consumption at the intervention site [58]. These labels were likely effective asthey were carefully developed on the basis of published research regarding what makesa warning label noticeable, relevant and memorable (unlike the static, small, black andwhite US labels). A unique feature of warning labels as a means of raising awareness ofalcohol-related issues is that they are more likely to be seen and recalled by those whowould perhaps most benefit from the information they contain, i.e., those who consumealcohol most frequently [59].
Figure 1. Warning labels trialled in the Yukon Territory, Canada.
What else might the public health community attempt by way of increasing thelikelihood that effective alcohol policies might be implemented by governments? Mostcritically, putting pressure on their governments to give public health rather than industrygroups a place at the policy-making table. At the very least, they can attempt to holdgovernments accountable by regularly monitoring and reporting the extent to whichpresent policies match up with gold-standard best practices for reducing alcohol-relatedharm. The CAPE project, and other similar projects in Europe and the USA, draw attentionto the disparities between actual implementation and best practice evidence-based policies.The CAPE project has extensively engaged with stakeholders and relevant governmentsectors (e.g., health, liquor regulators and government retailers, finance) to communicateclearly using publicly available and transparent indicators of effective practice [60]. Thishas involved going beyond lofty ideals and exhortations to “reduce alcohol’s availability”
228
Nutrients 2021, 13, 2846
or “increase the price of alcohol” and instead reported on tangible, verifiable performanceindicators such as the density of different types of liquor outlets, the extent of private versusgovernment ownership, whether alcohol prices are keeping up with the cost of living andthe level of minimum prices [18]. We have discovered that, contrary to what might beexpected, across Canada’s 13 jurisdictions, examples of best practice could be foundsomewhere in every one of the 11 policy domains identified earlier. In fact, if identifiedbest practices were implemented uniformly across Canada, the national score would havebeen 87%, i.e., an A grade. It may well be that government failures to implement effectivealcohol policies are at least partly due to a lack of awareness of what is effective policyrather than a lack of willingness to implement this. However, then again, Canada may bean exception in this regard given that it still has significant, if eroding, government controlsover alcohol’s distribution and retail sale(e.g., [61]).
A final thought. This essay was written in the middle of 2021 as the world is strugglingto emerge from the COVID-19 pandemic. It has been widely documented that alcoholcontrols have weakened in many countries and that the alcohol industry has lobbiedeffectively to persuade governments to remove restrictions on their trade that have been inplace for generations (e.g., [62]). However, there is also a significant opportunity at thismoment for governments to take effective actions on alcohol to achieve a variety of bothpublic health and fiscal outcomes. The population at large may now be more sensitisedto the importance of public health measures to protect the population’s health and safety.There is also a substantial shortfall in government revenues as a consequence of economicdownturns during the pandemic crisis. Alcohol pricing, taxation and availability policiescould be a key part of the process of recovery. A combination of MUP and increasedalcohol taxes has been shown to be a means of delivering such diverse benefits as improvedpublic health outcomes, increased government revenues and greater industry profits [3].Restrictions on outlet densities or at least moratoria on the issuing of new liquor licencescould also help the financial sustainability of existing businesses. Such restrictions on thealcohol market could enable producers and retailers to make greater profits from selling lessalcohol while also helping to shore up much-needed government revenues and reducingrelated harms.
Author Contributions: Writing—original draft, T.S.; Writing—review and editing, T.S., N.G., K.V.and A.W. All authors have read and agreed to the published version of the manuscript.
Funding: This research received no external funding.
Conflicts of Interest: I have received travel expenses, research funds and limited personal fees fromtwo Nordic government alcohol monopolies for research on alcohol and public health in the past5 years.
References
1. Bruun, K.; Edwards, G.; Lumui, M.; Mäkelä, K.; Pan, L.; Popham, R.; Room, R.; Schmidt, W.; Skog, O.-J.; Sulkunen, P.; et al.Alcohol Control Policies in Public Health Perspective; Finnish Foundation for Alcohol Studies: Helsinki, Finland, 1975.
2. Sherk, A.; Stockwell, T.; Rehm, J.; Dorocicz, J.; Shield, K.D. InterMAHP: The International Model of Alcohol Harms and Policies: AComprehensive Guide to the Estimation of Alcohol-Attributable Morbidity and Mortality; Version 1.0: December 2017; Canadian Institutefor Substance Use Research, University of Victoria: Victoria, BC, Canada, 2017. Available online: www.intermahp.cisur.ca(accessed on 13 August 2021).
3. Stockwell, T.; Churchill, S.; Sherk, A.; Sorge, J.; Gruenewald, P. How many alcohol attributable deaths and hospital admissionscould be prevented by alternative pricing and taxation policies? Modelling impacts on alcohol consumption, revenues andrelated harms in Canada. Health Promot. Chronic Dis. Prev. Can. 2020, 40, 153–164. [CrossRef]
4. Kehoe, T.; Gmel, G.; Shield, K.; Rehm, J. Determining the best population-level alcohol consumption model and its impact onestimates of alcohol-attributable harms. Popul. Health Metr. 2012, 10, 6. [CrossRef] [PubMed]
5. Holmes, J.; Meng, Y.; Meier, P.; Brennan, A.; Angus, C.; Campbell-Burton, A.; Guo, Y.; Hill-McManus, D.; Purshouse, R. Effects ofminimum unit pricing for alcohol on different income and socioeconomic groups: A modelling study. Lancet 2014, 383, 1655–1664.[CrossRef]
6. Scottish Government. Alcohol and Drugs: Minimum Unit Pricing. 2018. Available online: https://www.gov.scot/policies/alcohol-and-drugs/minimum-unit-pricing/ (accessed on 13 August 2021).
229
Nutrients 2021, 13, 2846
7. KTVZ News. Oregon High-Proof, Low-Cost Spirits to Rise in Price; Bend Distiller Sees Little Impact. 2021. Available online: https://ktvz.com/news/central-oregon/2021/04/12/olcc-raises-pricimg-on-high-proof-low-cost-spirits-to-increase-in-cost/ (ac-cessed on 13 August 2021).
8. Taylor, N.; Miller, P.; Coomber, K.; Livingston, M.; Scott, D.; Buykx, P.; Chikritzhs, T. The impact of a minimum unit price onwholesale alcohol supply trends in the Northern Territory, Australia. Aust. N. Z. J. Public Health 2021, 45, 26–33. [CrossRef]
9. Welsh Government. Guidance on the Implementation of Minimum Pricing for Alcohol in Wales; Welsh Government: Cardiff, UK, 2020.10. Sherk, A.; Stockwell, T.; April, N.; Churchill, S.; Sorge, J.; Gamache, P. The potential health impact of an alcohol minimum unit
price in Québec: An application of the International Model of Alcohol Harms and Policies. J. Stud. Alcohol Drugs 2020, 81, 631–640.[CrossRef] [PubMed]
11. Babor, T.; Caetano, R.; Casswell, S.; Edwards, G.; Giesbrecht, N.; Grube, J.W.; Graham, K. Alcohol: No Ordinary Commodity. Researchand Public Policy, 2nd ed.; Oxford University Press: Oxford, UK, 2010.
12. WHO. The SAFER Technical Package: Five Areas of Intervention at National and Subnational Levels; WHO Technical Document; WHO:Geneva, Switzerland, 2019.
13. WHO. Global Strategy to Reduce the Harmful Use of Alcohol; WHO Department of Mental Health and Substance Abuse: Geneva,Switzerland, 2016. Available online: https://www.who.int/publications/i/item/9789241599931 (accessed on 13 August 2021).
14. Canadian Institute for Health Information. Alcohol Harm in Canada: Examining Hospitalizations Entirely Caused by Alcoholand Strategies to Reduce Alcohol Harm. 2019. Available online: https://www.cihi.ca/sites/default/files/document/report-alcohol-hospitalizations-en-web.pdf (accessed on 13 August 2021).
15. Naimi, T.S.; Blanchette, J.; Nelson, T.F.; Nguyen, T.; Oussayef, N.; Heeren, T.C.; Gruenewald, P.; Mosher, J.; Xuan, Z. A new scaleof the U.S. alcohol policy environment and its relationship to binge drinking. Am. J. Prev. Med. 2014, 46, 10–16. [CrossRef]
16. Giesbrecht, N.; Wettlaufer, A.; Simpson, S.; April, N.; Asbridge, M.; Cukier, S.; Mann, R.E.; McAllister, J.; Murie, A.; Pauley, C.;et al. Strategies to reduce alcohol-related harms and costs in Canada: A comparison of provincial policies. Int. J. Alcohol Drug Res.2016, 5, 33–45. [CrossRef]
17. Stockwell, T.; Wettlaufer, A.; Vallance, K.; Chow, C.; Giesbrecht, N.; April, N.; Asbridge, M.; Callaghan, R.; Cukier, S.; Davis-MacNevin, P.; et al. Strategies to Reduce Alcohol-Related Harms and Costs in Canada: An Evaluation of Provincial and TerritorialPolicies; Canadian Institute for Substance Use Research, University of Victoria: Victoria, BC, Canada, 2019. Available online:https://www.uvic.ca/research/centres/cisur/assets/docs/report-cape-pt-en.pdf (accessed on 13 August 2021).
18. Vallance, K.; Stockwell, T.; Wettlaufer, A.; Giesbrecht, N.; Chow, C.; Card, K.; Farrell-Low, A.; The Canadian Alcohol PolicyEvaluation (CAPE) project: Findings from a review of provincial and territorial alcohol policies. Drug Alcohol Rev. 2021.Available online: https://onlinelibrary.wiley.com/doi/epdf/10.1111/dar.13313 (accessed on 13 August 2021).
19. Wettlaufer, A.; Vallance, K.; Chow, C.; Stockwell, T.; Giesbrecht, N.; April, N.; Asbridge, M.; Callaghan, R.; Cukier, S.; Hynes, G.;et al. Strategies to Reduce Alcohol-Related Harms and Costs in Canada: A Review of Federal Policies; Canadian Institute for SubstanceUse Research, University of Victoria: Victoria, BC, Canada, 2019. Available online: https://www.uvic.ca/research/centres/cisur/assets/docs/report-cape-fed-en.pdf (accessed on 13 August 2021).
20. Ogborne, A.C.; Smart, R.G. Public opinion on the health benefits of moderate drinking: Results from a Canadian NationalPopulation Health Survey. Addiction 2001, 96, 641–649. [CrossRef]
21. Institut National de Santé Publique du Québec. Alcohol Consumption: What do the People of Quebec Think? Research Report,Montreal, Canada. 6 May 2021. Available online: https://www.inspq.qc.ca/publications/2772-consommation-alcool-population-quebec (accessed on 13 August 2021).
22. Australian Institute of Health and Welfare. National Drug Strategy Household Survey 2019; Drug Statistics Series No. 32. PHE 270;AIHW: Canberra, Australia, 2020.
23. Institute for Health Metrics and Evaluation. Global Health Data Exchange (GHMx) Data Tool. 2021. Available online: http://ghdx.healthdata.org/gbd-results-tool (accessed on 9 June 2021).
24. Canadian Substance Use Costs and Harms Scientific Working Group Canadian Substance Use Costs and Harms (2007–2017); CanadianCentre on Substance Use and Addiction: Ottawa, ON, Canada, 2020.
25. Sherk, A.; Thomas, G.; Churchill, S.; Stockwell, T. Does drinking within low-risk guidelines prevent harm? Implications forhigh-income countries using the International Model of Alcohol Harms and Policies. J. Stud. Alcohol Drugs 2020, 81, 352–361.[CrossRef] [PubMed]
26. Shield, K.; Soerjomataram, I.; Rehm, R. Alcohol Use and Breast Cancer: A Critical Review. Alcohol. Clin. Exp. Res. 2016, 40,1166–1181. [CrossRef] [PubMed]
27. International Agency for Research on Cancer. Alcohol Consumption and Ethyl Carbamate; IARC Monographs on the Evaluation ofCarcinogenic Risks to Humans; IARC: Lyon, France, 2010.
28. Bates, S.; Holmes, J.; Gavens, L.; De Matos, E.G.; Li, J.; Ward, B.; Hooper, L.; Dixon, S.; Bukyx, P. Awareness of alcohol as a riskfactor for cancer is associated with public support for alcohol policies. BMC Public Health 2018, 18, 688. [CrossRef] [PubMed]
29. Opp, S.M.; Mosier, S.L. Liquor, marijuana, and guns: Essential services or political tools during the COVID-19 pandemic? PolicyDes. Pract. 2020, 3, 297–311. [CrossRef]
30. Stockwell, T.; Andreasson, S.; Cherpitel, C.; Chikritzhs, T.; Danghardt, F.; Holder, H.; Naimi, T.; Sherk, A. The burden of alcoholon health care during COVID-19. Drug Alcohol Rev. 2020, 40, 3–7. [CrossRef] [PubMed]
230
Nutrients 2021, 13, 2846
31. Narasimha, V.L.; Shukla, L.; Mukherjee, D.; Menon, J.; Huddar, S.; Panda, U.K.; Mahadevan, J.; Kandasamy, A.; Chand, P.K.;Benegal, V.; et al. Complicated Alcohol Withdrawal-An Unintended Consequence of COVID-19 Lockdown. Alcohol Alcohol. 2020,55, 350–353. [CrossRef] [PubMed]
32. Rossow, I. The strike hits: The 1982 wine and liquor monopoly strike in Norway and its impact on various harm indicators. InThe Effects of Nordic Alcohol Policies: What Happens to Drinking and Harm When Alcohol Controls Change? Room, R., Ed.; NordicCouncil for Alcohol and Drug Research: Helsinki, Finland, 2002; pp. 133–144, Publication No. 42.
33. Government of Canada. Epidemiological Summary of COVID-19 Cases in Canada. 2021. Available online: https://health-infobase.canada.ca/covid-19/epidemiological-summary-covid-19-cases.html (accessed on 13 August 2021).
34. Li, J.; Lovatt, M.; Eadie, D.; Dobbie, F.; Meier, P.; Holmes, J.; Hastings, G.; MacKintosh, A. Public attitudes towards alcohol controlpolicies in Scotland and England: Results from a mixed-methods study. Soc. Sci. Med. 2017, 177, 177–189. Available online:https://www.sciencedirect.com/science/article/pii/S0277953617300448 (accessed on 13 August 2021). [CrossRef] [PubMed]
35. Wagenaar, A.C.; Salois, M.J.; Komro, K.A. Effects of beverage alcohol price and tax levels on drinking: A meta-analysis of 1003estimates from 112 studies. Addiction 2009, 104, 179–190. [CrossRef]
36. Erickson, R.; Stockwell, T.; Pauly, B.; Chow, C.; Roemer, A.; Zhao, J.; Vallance, K.; Wettlaufer, A. How do people with homelessnessand alcohol dependence cope when alcohol is unaffordable? A comparison of residents of Canadian Managed Alcohol Programs(MAPs) and locally recruited controls. Drug Alcohol Rev. 2018, 37 (Suppl. S1), S174–S183. Available online: https://onlinelibrary.wiley.com/doi/abs/10.1111/dar.12649 (accessed on 13 August 2021). [CrossRef]
37. US National Institute on Drug Abuse. Fiscal Year 2020 Budget Information—Congressional Justification for National Institute on DrugAbuse; NIDA: Bethesda, MD, USA, 2020. Available online: https://www.drugabuse.gov/about-nida/legislative-activities/budget-information/fiscal-year-2020-budget-information-congressional-justification-national (accessed on 13 August 2021).
38. US National Institute on Alcohol Abuse and Alcoholism. Fiscal Year 2020 Budget Information—Congressional Justification for NationalInstitute on Alcohol Abuse and Alcoholism; NIDA: Bethesda, MD, USA, 2020. Available online: https://www.niaaa.nih.gov/about-niaaa/our-funding/congressional-budget-justification/fy-2020-congressional-budget-justification (accessed on 13 August 2021).
39. Government Electronic Directory Services. 2021. Available online: https://www.canada.ca/en/shared-services/corporate/transparency/access-information-privacy/publications/privacy-impact-assessments-summary-government-electronic-directory-services.html (accessed on 13 August 2021).
40. Parry, C. The Temporary Ban on Alcohol Sales During Levels 4 & 5 of COVID-19 Lockdown in South Africa: Lessons Learnt; South AfricanMedical Research Council: Cape Town, South Africa, 2020. Available online: https://www.wcla.gov.za/sites/default/files/2020-07/C%20Parry%20Alcohol%20%20Covid19%20-%203%20July%20Webinar%20Edinburgh.pdf (accessed on 13 August 2021).
41. Hall, W. What are the policy lessons of National Alcohol Prohibition in the United States, 1920–1933? Addiction 2010, 105,1164–1173. [CrossRef]
42. Stockwell, T.; Sherk, A.; Norstrom, T.; Angus, C.; Ramstedt, M.; Andreasson, S.; Chikritzhs, T.; Gripenberg, J.; Holder, H.; Holmes,J.; et al. Estimating the public health impact of disbanding a government alcohol monopoly: Application of new methods to thecase of Sweden. BMC Public Health 2018, 18, 1400. [CrossRef]
43. Stockwell, T.; Sherk, A.; Sorge, J.; Norström, T.; Angus, C.; Chikritzhs, T.; Churchill, S.; Holmes, J.; Meier, P.; Naimi, T.; et al.Finnish Alcohol Policy at the Crossroads: The Health, Safety and Economic Consequences of Alternative Systems to Manage the Retail Sale ofAlcohol; A Report Prepared for the Finnish Alcohol Monopoly, Alko; Canadian Institute for Substance Use Research, University ofVictoria: Victoria, BC, Canada, 2019. Available online: https://www.uvic.ca/research/centres/cisur/assets/docs/report-alko.pdf (accessed on 13 August 2021).
44. Room, R.; Schmidt, L.; Rehm, J.; Mäkelä, P. International regulation of alcohol. Br. Med. J. 2008, 337, a2364. [CrossRef]45. Babor, T.F. Alcohol research and the alcoholic beverage industry: Issues, concerns and conflicts of interest. Addiction 2009, 104,
34–47. [CrossRef]46. McCambridge, J.; Kypri, K.; Miller, P.; Hawkins, B.; Hastings, G. Be aware of Drinkaware. Addiction 2014, 109, 519–524. [CrossRef]
[PubMed]47. Petticrew, M.; Maani Hessari, N.; Knai, C.; Weiderpass, E. How alcohol industry organisations mislead the public about alcohol
and cancer. Drug Alcohol Rev. 2018, 37, 293–303. [CrossRef] [PubMed]48. Éduc’alcool. Alcohol and Heart Health. Montreal: Canada. PDF Copy. 2019. Available online: https://www.educalcool.qc.ca/
wp-content/uploads/2021/03/Alcohol-and-heart-health.pdf (accessed on 13 August 2021).49. Golder, S.; Garry, J.; McCambridge, J. Declared funding and authorship by alcohol industry actors in the scientific literature: A
bibliometric study. Eur. J. Public Health 2020, 30, 1193–1200. [CrossRef] [PubMed]50. Buykx, P.; Li, J.; Gavens, L.; Hooper, L.; Lovatt, M.; Gomes de Matos, E.; Holmes, J. Public awareness of the link between alcohol
and cancer in England in 2015: A population-based survey. BMC Public Health 2016, 16, 1194. [CrossRef]51. Weerasinghe, A.; Schoueri-Mychasiw, N.; Vallance, K.; Stockwell, T.; Hammond, D.; McGavock, J.; Greenfield, T.K.; Paradis, C.;
Hobin, E. Improving Knowledge that Alcohol Can Cause Cancer is Associated with Consumer Support for Alcohol Policies:Findings from a Real-World Alcohol Labelling Study. Int. J. Environ. Res. Public Health 2020, 17, 398. [CrossRef]
52. Mart, S.; Giesbrecht, N. Red flags on pink-washed drinks: Contradictions and dangers in marketing alcohol to prevent cancer.Addiction 2015, 110, 1541–1548. [CrossRef]
53. Buteau, E. Drink Pink for Breast Cancer Research with Mike’s Hard Pink Lemonade. 2014. Available online: http://ericabuteau.com/2014/09/06/hard-pink-lemonade/ (accessed on 13 August 2021).
231
Nutrients 2021, 13, 2846
54. Stockwell, T.; Solomon, R.; O’Brien, P.; Vallance, K.; Hobin, E. Cancer Warning Labels on Alcohol Containers: A Consumer’sRight to Know, a Government’s Responsibility to Inform, and an Industry’s Power to Thwart. J. Stud. Alcohol Drugs 2020, 81,284–292. [CrossRef]
55. Amin, G.; Siegel, M.; Naimi, T. National Cancer Societies and their public statements on alcohol consumption and cancer risk.Addiction 2018, 113, 1802–1808. [CrossRef]
56. Hobin, E.; Weerasinghe, A.; Vallance, K.; Hammond, D.; McGavock, J.; Greenfield, T.K.; Schoueri-Mychasiw, N.; Paradis, C.;Stockwell, T. Testing Alcohol Labels as a Tool to Communicate Cancer Risk to Drinkers: A Real-World Quasi-Experimental Study.J. Stud. Alcohol Drugs 2020, 81, 249–261. [CrossRef]
57. Hobin, E.; Shokar, S.; Vallance, K.; Hammond, D.; McGavock, J.; Greenfield, T.K.; Schoueri-Mychasiw, N.; Paradis, C.; Stockwell,T. Communicating risks to drinkers: Testing alcohol labels with a cancer warning and national drinking guidelines in Canada.Can. J. Public Health 2020, 111, 716–725. [CrossRef] [PubMed]
58. Zhao, J.H.; Stockwell, T.; Vallance, K.; Hobin, E. The effects of alcohol warning labels on population alcohol consumption: Aninterrupted time-series analysis of alcohol sales in Yukon, Canada. J. Stud. Alcohol Drugs 2020, 81, 225–237. [CrossRef] [PubMed]
59. Greenfield, T. Warning labels: Evidence on harm reduction fromlong-term American surveys. In Alcohol: Minimizing the Harm;Plant, M., Single, E., Stockwell, T., Eds.; Free Association Books: London, UK, 1997; pp. 105–125.
60. Vallance, K.; Stockwell, T.; Wettlaufer, A.; Giesbrecht, N.; Chow, C.; Card, K.; Farrell-Low, A.; Strategies for engaging policystakeholders to translate research knowledge into practice more effectively: Lessons learned from the Canadian Alcohol PolicyEvaluation project. Drug Alcohol Rev. 2021. Available online: https://onlinelibrary.wiley.com/doi/epdf/10.1111/dar.13313(accessed on 13 August 2021).
61. Giesbrecht, N.; Wettlaufer, A.; Stockwell, T.; Vallance, K.; Chow, C.; April, N.; Asbridge, M.; Callaghan, R.; Cukier, S.; Hynes, G.;et al. Alcohol retail privatization in Canadian provinces between 2012 and 2017. Is decision-making oriented to harm reduction?Drug Alcohol Rev. 2020, 40, 459–467. [CrossRef] [PubMed]
62. Andreasson, S.; Chikritzhs, T.; Dangardt, F.; Holder, H.; Naimi, T.; Stockwell, T. Alcohol and the Coronavirus Pandemic: Individual,Societal and Policy Perspectives; Alcohol and Society 2021; Swedish Society of Nursing: Stockholm, Sweden; SFAM: Stockholm,Sweden; SAFF: Stockholm, Sweden; CERA: Stockholm, Sweden; The Swedish Society of Addiction Medicine: Stockholm, Sweden;SIGHT: Stockholm, Sweden; Movendi International: Stockholm, Sweden; IOGT-NTO: Stockholm, Sweden, 2021.
232
MDPISt. Alban-Anlage 66
4052 BaselSwitzerland
Tel. +41 61 683 77 34Fax +41 61 302 89 18
www.mdpi.com
Nutrients Editorial OfficeE-mail: [email protected]
www.mdpi.com/journal/nutrients


MDPI
St. Alban-Anlage 66
4052 Basel
Switzerland
Tel: +41 61 683 77 34
Fax: +41 61 302 89 18
www.mdpi.com ISBN 978-3-0365-4102-0