Embed Size (px)
Citation preview
Ataiwi A. H. et al., Iraqi J. Laser A, 12, 43-52 (2013)
43
Iraqi J. Laser, Part A, Vol.12, pp. 43-52 (2013)
Effect of Laser Surface Modification on the Corrosion Resistance of
Dental Alloys in Artificial Saliva Containing Alcoholic Beverages
Ali H. Ataiwi Rana A. Majed and Ali A. Muhsin
Materials Engineering Department, University of Technology, Baghdad, Iraq
(Received 24 April 2012; accepted 14 January 2013)
Abstract: The objective of this study is to demonstrate the corrosion behavior of dental alloys Co-Cr-
Mo, Ni-Cr-Mo and Ti-Al-V in artificial saliva at pH=4 and 37oC enriched with ethyl alcohol at 8%
percentage. The linear and cyclic polarizations were investigated by electrochemical measurements.
Laser surface modification was achieved for the three dental alloys to improve corrosion resistance. The
results show that corrosion resistance of Co-Cr-Mo and Ni-Cr-Mo alloys only were increased after laser
treatment due to the fact that laser radiation has caused a smoother surface, in addition to the decrement
in corrosion current densities (icorr) for Co-Cr-Mo and Ni-Cr-Mo alloys and the reverse scan in cyclic
polarization became in the wider range of potentials compared with the reverse scan for untreated dental
alloys, in addition to the obtainment of smaller hysteresis loop for Ti-Al-V alloy.
Introduction
Alcohol is a drug that causes about as much
harm as tobacco. It is linked to more than 60
medical conditions and imposes a heavy burden
on public health and finances[1]. According to
research conducted for the World Health
Organization (WHO), alcohol-related harm is
nearly equal to that caused by tobacco, and far
greater than for illicit drugs [2]. Four percent of
the global burden of disease is attributed to
alcohol, compared with 4.1 percent to tobacco
and 4.4 percent to high blood pressure.
Ethanol or ethyl alcohol is the active
ingredient in alcoholic beverages such as beer,
wine and whisky. It is produced by the
fermentation of carbohydrates (sugars and
starches) in fruits and other plant sources (such
as corn, barley, grapes, and so on), using the
process that discovered thousands of years ago.
During fermentation, microorganism, such as
yeast, convert sugar to alcohol and carbon
dioxide [3,4].
The properties of pure 100% absolute
alcohol (dehydrated) are: colorless limpid
volatile liquid; boiling point 78oC; freezing
point 117.3oC; vinous odor; and pungent taste. It
is miscible with water, methyl alcohol, ether,
chloroform and acetone [5].
Ethanol is very soluble in water because it
contains a polar O-H bond like those in water
which makes it very compatible with water [3].
There are many authors studied the behavior of
dental alloys in artificial saliva to measure the
resistance of these alloys toward many
materials. Chang et al. [6] studied
electrochemical behavior on microbiology
related corrosion of metallic dental materials in
the presence of streptococcus mutants. While
Latifa Kinani et al. studied effect of eugenol
(occurs widely as a component of essential oils
and is a major constituent of clove oil) on the
titanium corrosion in artificial saliva enriched
with eugenol at different concentration by
Ataiwi A. H. et al., Iraqi J. Laser A, 12, 43-52 (2013)
44
utilizing electrochemical measurement and
scanning electron microscopy [7].
Rajendran et al. studied corrosion behavior of
mild steel (MS) , zinc coated mild steel (MS-Zn)
and stainless steel 316L (SS) in artificial saliva
at pH=6.5 and 37oC in presence of D-Glucose
by utilizing potentiodynamic polarization study
and AC impedance spectra. The results of this
study indicated that in the presence D-Glucose
all three alloys showed better corrosion
resistance than in the absence D-Glucose
because in presence D-Glucose will form metal
(Ni-Cr-Fe)-glucose complex on metal surface, it
is compact, close packed and stable [8]. In
another study, Rajendran et al. studied corrosion
behavior of same materials in the presence of
spirulina powder (a tiny aquatic plant has been
eaten by human since prehistoric times) using
the same technique and they showed that the
corrosion resistance was SS316L > MS > MS-
Zn [9].
The aim of this work is an attempting to
improve the corrosion resistance of dental alloys
in artificial saliva at pH=4 and 37oC in presence
of 8% ethyl alcohol which represents the level
of ethanol in some alcoholic beverages.
Materials and Procedure
Preparation of Samples and Electrolyte
The alloys used in this study were Co-Cr-Mo
alloy, Ni-Cr-Mo alloy and Ti-Al-V alloy, the
chemical composition of these alloys was
determined using X-ray florescence technique
(X-MET in Ministry of science and technology-
Iraq) and as shown in Tables (1) to (3) by.
Commercially available dental alloys were
cylinder shape for Ni-Cr-Mo (15mm diameter
and 5mm thickness) and square shape for Co-
Cr-Mo with dimension of (5x8x9.5 mm), while
Ti-Al-V was cut with dimension (13x9.5x5
mm). All three alloys were made into electrode
by hot mounting to insulate all but one side with
an epoxy resin.
Table (1): Chemical composition of Co based alloy.
ASTM Co Nb Fe Mn W Mo Cr Elements
F75 Balance 0.16 0.4 0.93 1.01 5.27 26.9 Wt%
Table (2): Chemical composition of Ni based alloy.
UNS number Ni Cu Fe Nb Mo Cr Elements
N08825 Balance 0.13 2.4 3.8 9.94 20.9 Wt%
Table (3): Chemical composition of Ti based alloy.
UNS number Ti Nb Fe Cu V Al Elements
R56400 Balance 0.01 0.17 0.18 3.6 5.54 Wt%
The open side of mounted specimens were wet
grinding by different degree of silicon carbide
papers (600, 800, 1000 and 1200) with sample
rotate 90º when change paper, then polishing
samples by napped cloth and alumina slurry has
particle size (0.3µm) by using (Ma-Pao 160E
Grinder and Polisher) machine Chine
manufactured, rinsed in distilled water and
stored in desiccators. The electrolyte reference
used was artificial saliva, which closely
resembles natural saliva, with composition of
(0.4 g/L KCl, 0.4g/L NaCl,0.906 g/L
CaCl2.2H2O, 0.69 g/L NaH2PO4.2H2O, 0.005g/L
Na2S.9H2O and 1g/L urea)[10]. Lactic acid was
added to adjust the pH of the solution at 4.
The presence of alcoholic beverage was
performed by adding 8% ethyl alcohol to
experimental solution.
Ataiwi A. H. et al., Iraqi J. Laser A, 12, 43-52 (2013)
45
Electrochemical Measurements
Polarization experiments were performed in
WINKING M Lab (Germany manufactured)
Potentiostat/Galvanostat from Bank-Elektronik
with electrochemical standard cell with
provision for working electrode (dental alloys),
auxiliary electrode (Pt electrode), and a Luggin
capillary as salt bridge for connection with
saturated calomel electrode SCE reference
electrode. Electrochemical measurements were
performed with a potentiostat by
electrochemical software at a scan rate
0.5mA.sec-1
.
The main results obtained were expressed in
terms of the corrosion potentials (Ecorr) and
corrosion current density (icorr) in addition to
measuring the Tafel slops by Tafel extrapolation
method.
Laser Surface Modification (LSM)
The laser that used in this work is a home
built Q-switched Nd:YAG laser with an output
of second harmonic generation of 1064nm, laser
energy of 190mJ, 30ns pulse duration, and
0.5mm spot size. One advantages of laser
surface modification LSM was the obtainment
of smooth surface for treated alloys.
The surface roughness measurements of
polished specimens were carried out by using a
stylus profilometer, civil instrument (TR 200)
with stylus tip radius 2µm. Vickers
microhardness for specimens without and with
LSM were by taking average of three readings.
Results and Discussion
Surface Characterization Table (4) indicates surface roughness
measurements of polished specimens.
Table (4): Surface roughness measurements for
specimens.
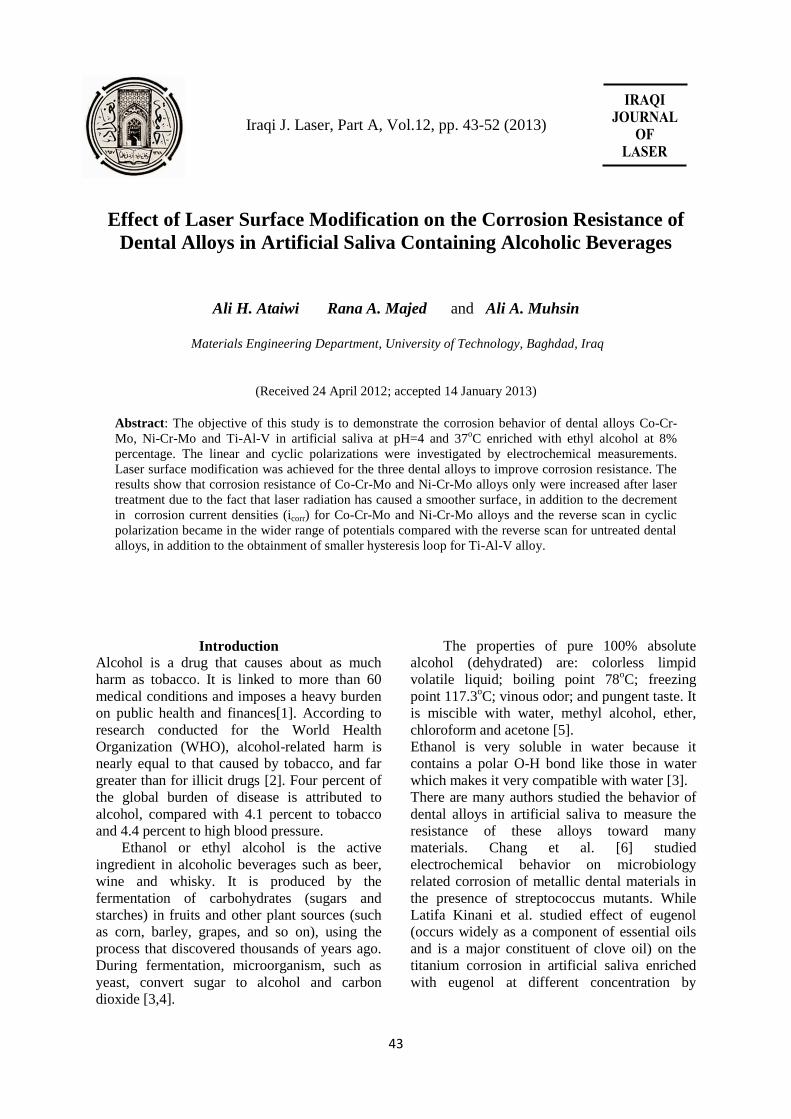
The microstructures of specimens of the three
dental alloys are shown in Figs. (1) to (3) for
untreated and LSM treated specimens. They
indicate laser spots in the specimens.
LSM treatment has effect on hardness of
specimens due to laser melting and rapid
cooling, while the bulk of material (which
known as saturated solid solution) remained
unaffected.
Fig. (1): Optical micrograph for untreated and
treated Co-Cr-Mo alloy without etching.
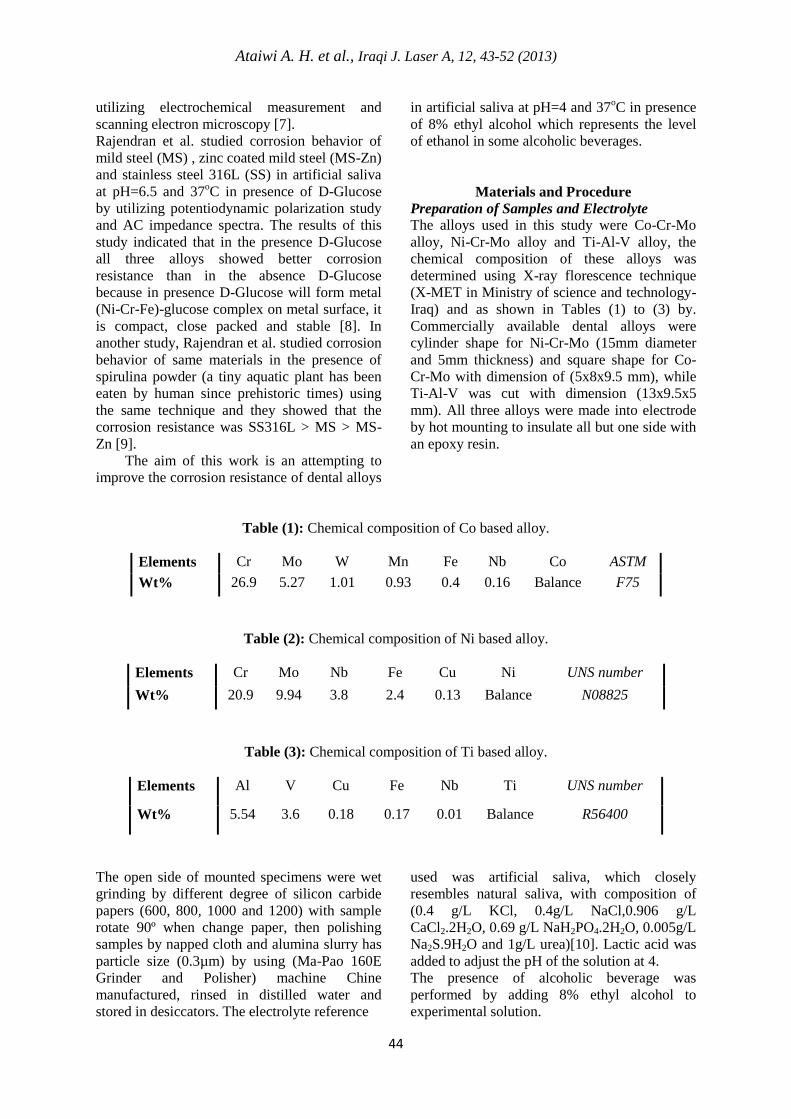
Fig. (2): Optical micrograph for untreated and
treated Ni-Cr-Mo alloy without etching
Ra (μm)
of treated
alloys
Ra (μm) of
untreated
alloys
Specimens
(alloys)
0.452 3.622 Co-Cr-Mo
0.563 4.112 Ni-Cr-Mo
0.738 4.665 Ti-Al-V
Ataiwi A. H. et al., Iraqi J. Laser A, 12, 43-52 (2013)
46
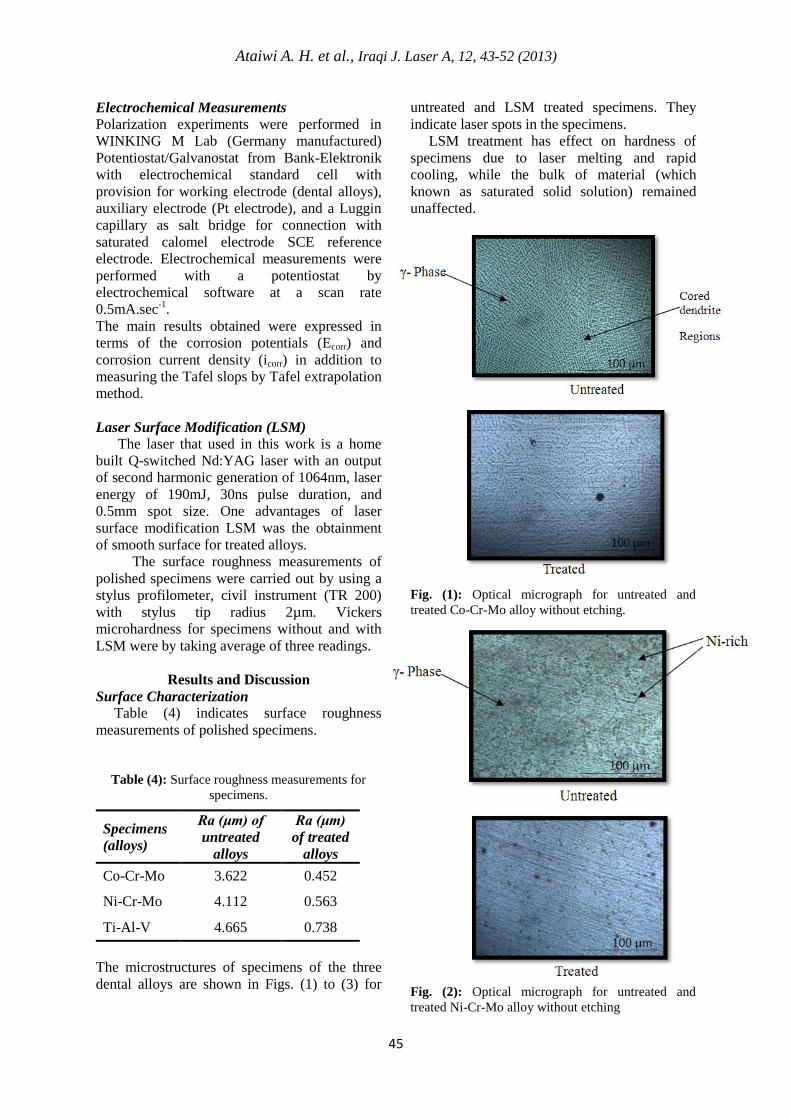
Fig. (3): Optical micrograph for untreated and
treated Ti-Al-V alloy without etching.
Table (5) indicates Vickers microhardness for
specimens without and with LSM
Table (5): Vickers microhardness for untreated and
treated specimens by LSM.
Open Circuit Potential Measurements (OCP)
The electrical potential at the metal electrolyte
interface is strongly dependent on the nature and
the concentration of the electrolyte, pH and
surface conditions. As a result, the
electrochemical reactions at this interface vary
with time. The OCP-Time was measured with
respect to SCE for 20 minute with scan rate
10mV in aerated electrolyte of artificial saliva at
pH=4 and 37+1oC for dental alloys.
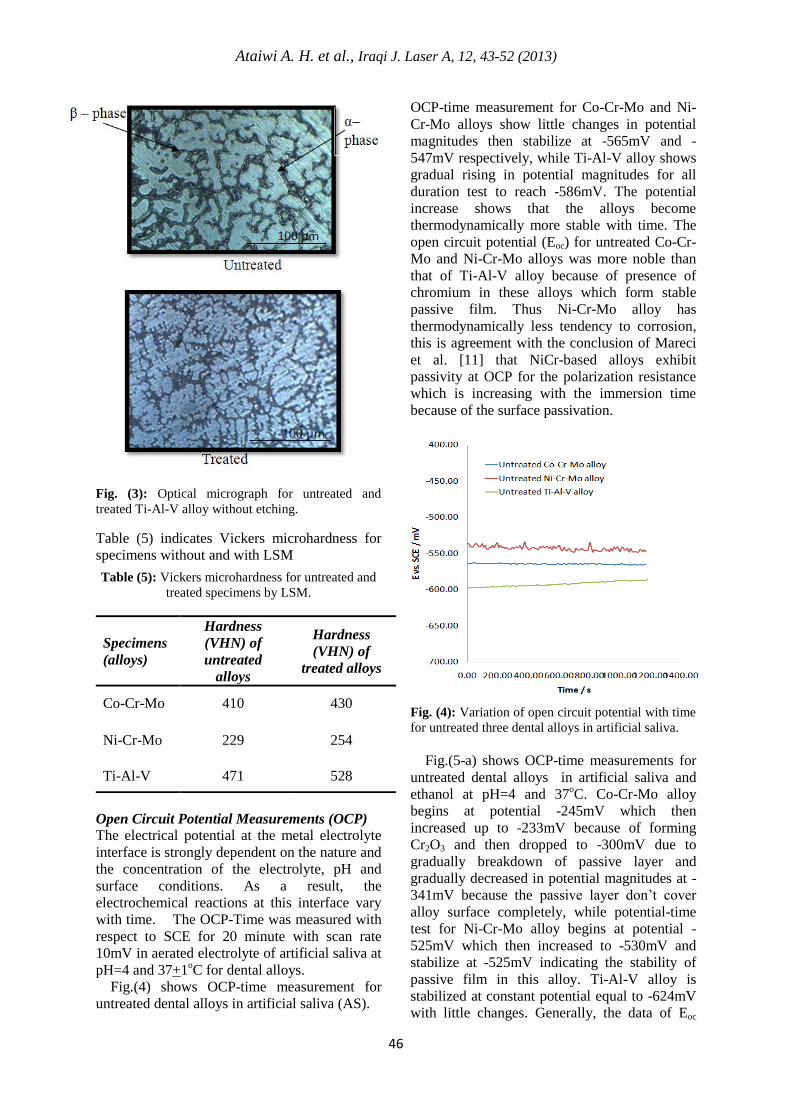
Fig.(4) shows OCP-time measurement for
untreated dental alloys in artificial saliva (AS).
OCP-time measurement for Co-Cr-Mo and Ni-
Cr-Mo alloys show little changes in potential
magnitudes then stabilize at -565mV and -
547mV respectively, while Ti-Al-V alloy shows
gradual rising in potential magnitudes for all
duration test to reach -586mV. The potential
increase shows that the alloys become
thermodynamically more stable with time. The
open circuit potential (Eoc) for untreated Co-Cr-
Mo and Ni-Cr-Mo alloys was more noble than
that of Ti-Al-V alloy because of presence of
chromium in these alloys which form stable
passive film. Thus Ni-Cr-Mo alloy has
thermodynamically less tendency to corrosion,
this is agreement with the conclusion of Mareci
et al. [11] that NiCr-based alloys exhibit
passivity at OCP for the polarization resistance
which is increasing with the immersion time
because of the surface passivation.
Fig. (4): Variation of open circuit potential with time
for untreated three dental alloys in artificial saliva.
Fig.(5-a) shows OCP-time measurements for
untreated dental alloys in artificial saliva and
ethanol at pH=4 and 37oC. Co-Cr-Mo alloy
begins at potential -245mV which then
increased up to -233mV because of forming
Cr2O3 and then dropped to -300mV due to
gradually breakdown of passive layer and
gradually decreased in potential magnitudes at -
341mV because the passive layer don’t cover
alloy surface completely, while potential-time
test for Ni-Cr-Mo alloy begins at potential -
525mV which then increased to -530mV and
stabilize at -525mV indicating the stability of
passive film in this alloy. Ti-Al-V alloy is
stabilized at constant potential equal to -624mV
with little changes. Generally, the data of Eoc
Hardness
(VHN) of
treated alloys
Hardness
(VHN) of
untreated
alloys
Specimens
(alloys)
430 410 Co-Cr-Mo
254 229 Ni-Cr-Mo
528 471 Ti-Al-V
Ataiwi A. H. et al., Iraqi J. Laser A, 12, 43-52 (2013)
47
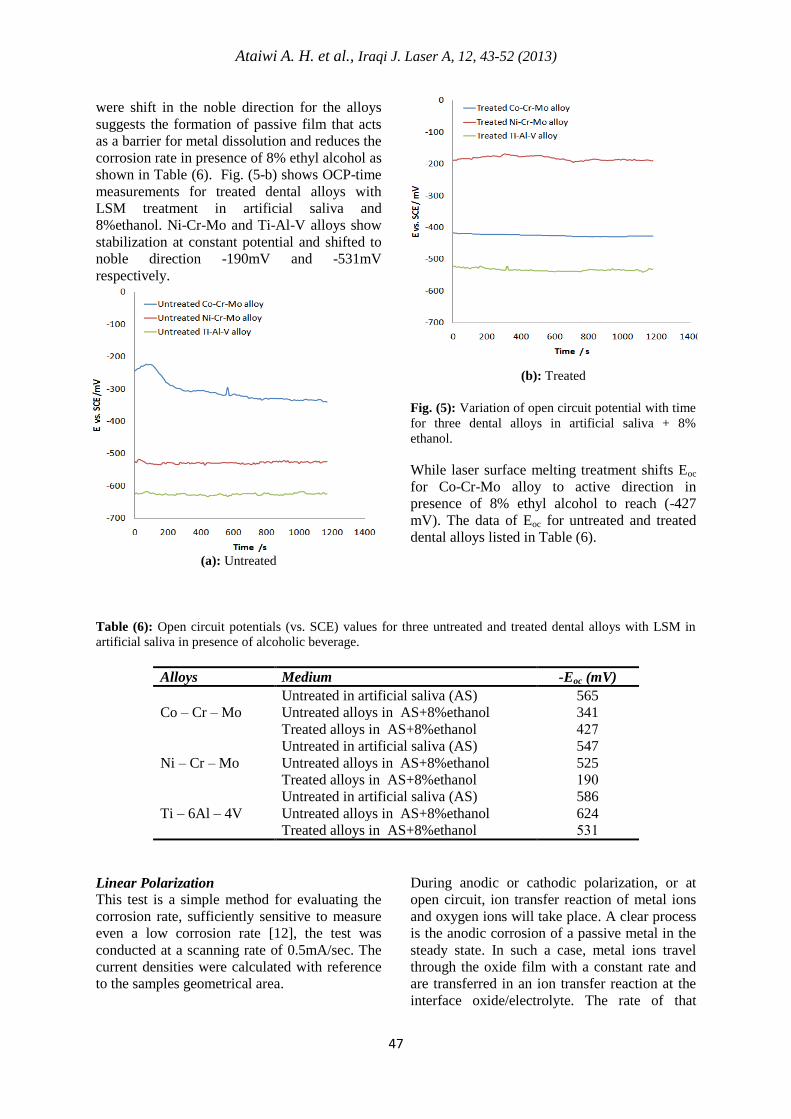
were shift in the noble direction for the alloys
suggests the formation of passive film that acts
as a barrier for metal dissolution and reduces the
corrosion rate in presence of 8% ethyl alcohol as
shown in Table (6). Fig. (5-b) shows OCP-time
measurements for treated dental alloys with
LSM treatment in artificial saliva and
8%ethanol. Ni-Cr-Mo and Ti-Al-V alloys show
stabilization at constant potential and shifted to
noble direction -190mV and -531mV
respectively.
(a): Untreated
(b): Treated
Fig. (5): Variation of open circuit potential with time
for three dental alloys in artificial saliva + 8%
ethanol.
While laser surface melting treatment shifts Eoc
for Co-Cr-Mo alloy to active direction in
presence of 8% ethyl alcohol to reach (-427
mV). The data of Eoc for untreated and treated
dental alloys listed in Table (6).
Table (6): Open circuit potentials (vs. SCE) values for three untreated and treated dental alloys with LSM in
artificial saliva in presence of alcoholic beverage.
Alloys Medium -Eoc (mV)
Co – Cr – Mo
Untreated in artificial saliva (AS) 565
Untreated alloys in AS+8%ethanol 341
Treated alloys in AS+8%ethanol 424
Ni – Cr – Mo
Untreated in artificial saliva (AS) 547
Untreated alloys in AS+8%ethanol 525
Treated alloys in AS+8%ethanol 091
Ti – 6Al – 4V
Untreated in artificial saliva (AS) 586
Untreated alloys in AS+8%ethanol 624
Treated alloys in AS+8%ethanol 530
Linear Polarization
This test is a simple method for evaluating the
corrosion rate, sufficiently sensitive to measure
even a low corrosion rate [12], the test was
conducted at a scanning rate of 0.5mA/sec. The
current densities were calculated with reference
to the samples geometrical area.
During anodic or cathodic polarization, or at
open circuit, ion transfer reaction of metal ions
and oxygen ions will take place. A clear process
is the anodic corrosion of a passive metal in the
steady state. In such a case, metal ions travel
through the oxide film with a constant rate and
are transferred in an ion transfer reaction at the
interface oxide/electrolyte. The rate of that
Ataiwi A. H. et al., Iraqi J. Laser A, 12, 43-52 (2013)
48
passive film dissolution depends on the local
potential drop at the interface, the pH and the
activity of the metal ions at the oxide surface
[13].
The polarizations test started at a cathodic
potential in relation to the corrosion potential,
therefore the surface passive film was at least
partially removed due to the highly reducing
initial potentials as shown in Fig. (6) which
illustrates the linear polarization for untreated
three dental alloys in oral environments
(artificial saliva) only.
Fig. (6): Linear polarization of untreated dental
alloys in artificial saliva at pH=4 and 37oC.
After immersion in the electrolyte for 20 min., a
linear polarization test was carried out for the
specimens in artificial saliva to determine the
values of polarization data. Each specimen was
polarized from –40 mA to 15 mA.
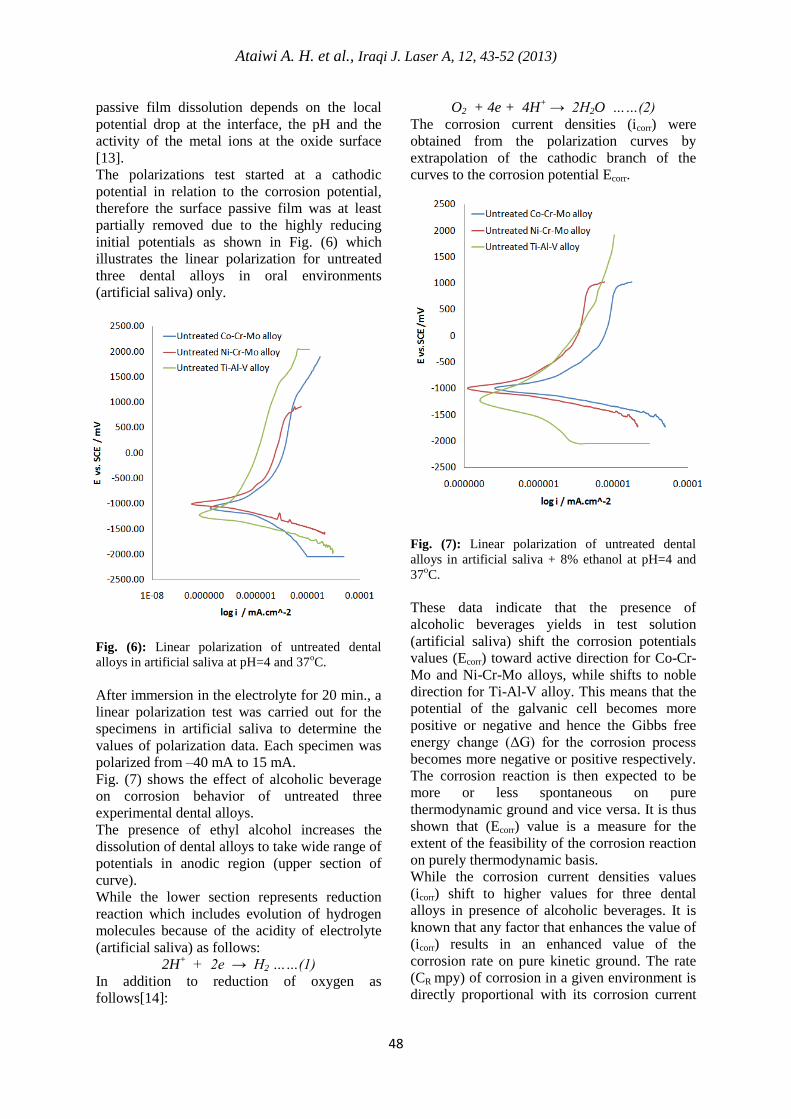
Fig. (7) shows the effect of alcoholic beverage
on corrosion behavior of untreated three
experimental dental alloys.
The presence of ethyl alcohol increases the
dissolution of dental alloys to take wide range of
potentials in anodic region (upper section of
curve).
While the lower section represents reduction
reaction which includes evolution of hydrogen
molecules because of the acidity of electrolyte
(artificial saliva) as follows:
2H+ + 2e → H2 ……(1)
In addition to reduction of oxygen as
follows[14]:
O2 + 4e + 4H+ → 2H2O ……(2)
The corrosion current densities (icorr) were
obtained from the polarization curves by
extrapolation of the cathodic branch of the
curves to the corrosion potential Ecorr.
Fig. (7): Linear polarization of untreated dental
alloys in artificial saliva + 8% ethanol at pH=4 and
37oC.
These data indicate that the presence of
alcoholic beverages yields in test solution
(artificial saliva) shift the corrosion potentials
values (Ecorr) toward active direction for Co-Cr-
Mo and Ni-Cr-Mo alloys, while shifts to noble
direction for Ti-Al-V alloy. This means that the
potential of the galvanic cell becomes more
positive or negative and hence the Gibbs free
energy change (ΔG) for the corrosion process
becomes more negative or positive respectively.
The corrosion reaction is then expected to be
more or less spontaneous on pure
thermodynamic ground and vice versa. It is thus
shown that (Ecorr) value is a measure for the
extent of the feasibility of the corrosion reaction
on purely thermodynamic basis.
While the corrosion current densities values
(icorr) shift to higher values for three dental
alloys in presence of alcoholic beverages. It is
known that any factor that enhances the value of
(icorr) results in an enhanced value of the
corrosion rate on pure kinetic ground. The rate
(CR mpy) of corrosion in a given environment is
directly proportional with its corrosion current
Ataiwi A. H. et al., Iraqi J. Laser A, 12, 43-52 (2013)
49
density (icorr) in accordance with the relation
[15]:
( )
……(3)
where CR(mpy): corrosion rate in mil per year, e:
equivalent weight of alloy (gm), ρ: density of
alloy (gm/cm3) and icorr: corrosion current
density (μA.cm-2
). The average values of
corrosion parameters are shown in Table (7).
Table (7): Corrosion parameters of untreated and treated dental alloys with LSM in artificial saliva at
pH=4 and temperature 37oC in the presence of alcoholic beverage.
Alloys Case -Ecorr
(mV)
icorrx10-6
(μA.cm-2
)
-bc
(mV.dec-1
)
ba
(mV.dec-1
)
Rpx103
(Ω.cm-2
)
CRx103
(mpy)
Co-Cr-Mo
AS only 1058.4 476.09 659.4 1278.0 0.978 0.2061
Untreated 1098.5 613.92 332.5 3046.1 0.212 0.2658
Treated 913.80 607.70 483.7 2192.9 0.283 0.2629
Ni-Cr-Mo
AS only 997.3 299.05 258.3 433.8 0.235 0.1136
Untreated 1019.5 593.25 288.5 772.5 0.154 0.2254
Treated 982.0 482.96 346.9 800.9 0.217 0.1836
Ti-Al-V
AS only 1232.2 288.44 278.9 206.9 0.370 0.1996
Untreated 1205.8 548.42 970.9 1517.2 0.469 0.3795
Treated 1197.2 578.84 290.4 5673.3 0.207 0.4004
The data of corrosion rate show, in general, that
the presence of alcoholic beverages increases
the rate of corrosion for untreated dental alloys.
The Tafel slopes were very much influenced in
the presence of alcoholic beverages yields, the
cathodic Tafel slope (bc) decreases for Co-Cr-
Mo, while was increased for Ni-Cr-Mo and Ti-
6Al-4V alloys. But the anodic Tafel slopes (ba)
were increased for three dental alloys and have
values higher than that of cathodic Tafel slopes.
It is inferred that the rate of change of current
with change of potential was smaller during
cathodic polarization than that during anodic
polarization.
The polarization resistance (Rp) can be
determined from the Tafel slopes and according
to Stern- Geary equation [16,17]:
…. (4)
The values of Rp which have been calculated
from above equation are presented in Table (7).
These data indicate that the polarization
resistance value was decreased for Co-Cr-Mo
and Ni-Cr-Mo alloys in the presence of
alcoholic beverages yields, while increases for
Ti-6Al-4V alloy.
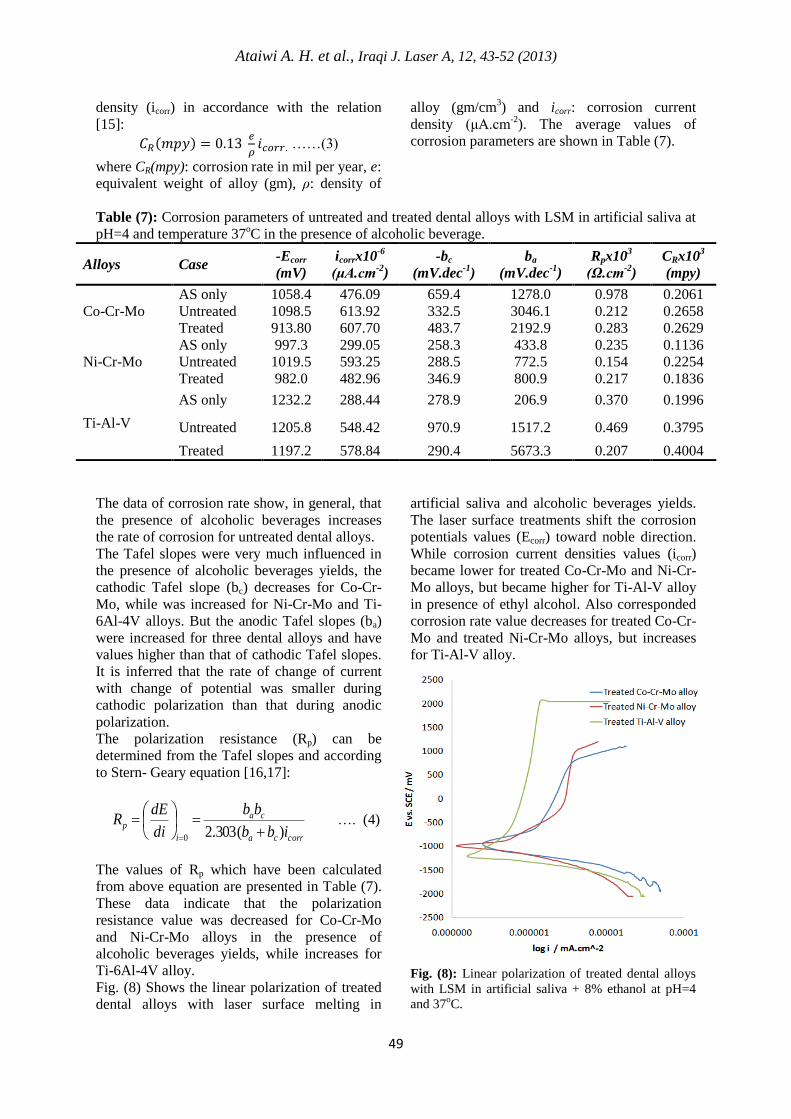
Fig. (8) Shows the linear polarization of treated
dental alloys with laser surface melting in
artificial saliva and alcoholic beverages yields.
The laser surface treatments shift the corrosion
potentials values (Ecorr) toward noble direction.
While corrosion current densities values (icorr)
became lower for treated Co-Cr-Mo and Ni-Cr-
Mo alloys, but became higher for Ti-Al-V alloy
in presence of ethyl alcohol. Also corresponded
corrosion rate value decreases for treated Co-Cr-
Mo and treated Ni-Cr-Mo alloys, but increases
for Ti-Al-V alloy.
Fig. (8): Linear polarization of treated dental alloys
with LSM in artificial saliva + 8% ethanol at pH=4
and 37oC.
corrca
ca
i
pibb
bb
di
dER
)(303.20
Ataiwi A. H. et al., Iraqi J. Laser A, 12, 43-52 (2013)
50
The increase in the surface hardness was very
little with laser treatment in comparison with
untreated specimens. This increment can be due
to the fact that laser radiation has caused a
smoother surface. Generally, change in surface
hardness shows a microstructure modification in
metallic bonds. The comparison of linear
polarization curves indicate a few important
points which are as follows: the corrosion rate
for laser treated specimen reduced for treated
Co-Cr-Mo and Ni-Cr-Mo alloys only. Also
corrosion potentials shift toward noble direction
after the treatment process. This implies that
treated specimen release hydrogen easier and act
as an electron donor to electrolyte [18].
The corrosion current, also, decreased for
treated Co-Cr-Mo and Ni-Cr-Mo alloys after
surface treatment, which means a better
corrosion resistance. The passive region is
directly affected by laser radiation and has more
range in potential values. Thus a more noble
metal is achieved. Increase of corrosion
resistance probably means that most inclusions
at the surface have been dissolved in the
structure due to melting or alternatively, they
are covered by molten material. Treated Ti-Al-V
alloy shows no significant changes in its
behavior. An interesting feature is the
systematic shift of the pitting potential in the
active region with a laser treatment despite the
formation of a semipassive film at lower current
densities, i.e. corrosion is observed. This
indicates the formation of unstable passive film
that is subtle to severe pitting with laser
treatment. This is observed by NasserAl-Aqeeli
in his work about the corrosion behavior of
electrodeposited and laser irradiated Ni-Co
nanostructured alloy [19].
Cyclic polarization
Cyclic polarization data were recorded by
potentiostat with electrochemistry software. The
polarization scan was initiated after immersing
the specimen for 20 minutes and scanning the
potential in the more noble direction at the scan
rate of 0.5mA/sec. When 1000 or 2000mV were
reached, the scanning direction was reversed.
Potentiodynamic measurements were carried out
in order to determine the initiation and
propagation of local corrosion, which is
associated with the breakdown of passive
protective film.
The breakdown potential (Ebr) is the one at
which the anodic current increases considerably
with applied potential. The potential, at which
the hysteresis loop is completed upon reverse
polarization scan, is known as the protective
potential or repassivation potential.
Breakdown potential is a sign of local corrosion
but the measure of pitting susceptibility is the
difference between the breakdown potential and
the repassivation one. The protection potential
represents the potential at the intersection of
hysteresis curve with passive domain. Below
this potential the propagation of existing
localized corrosion will not occur. If the
difference between breakdown and the
repassivation potential is increasing, the chance
in the appearance of pitting is greater and its
propagation in depth is more intense. In other
words, the hysteresis loop increases as the
susceptibility of material to corrosion increases.
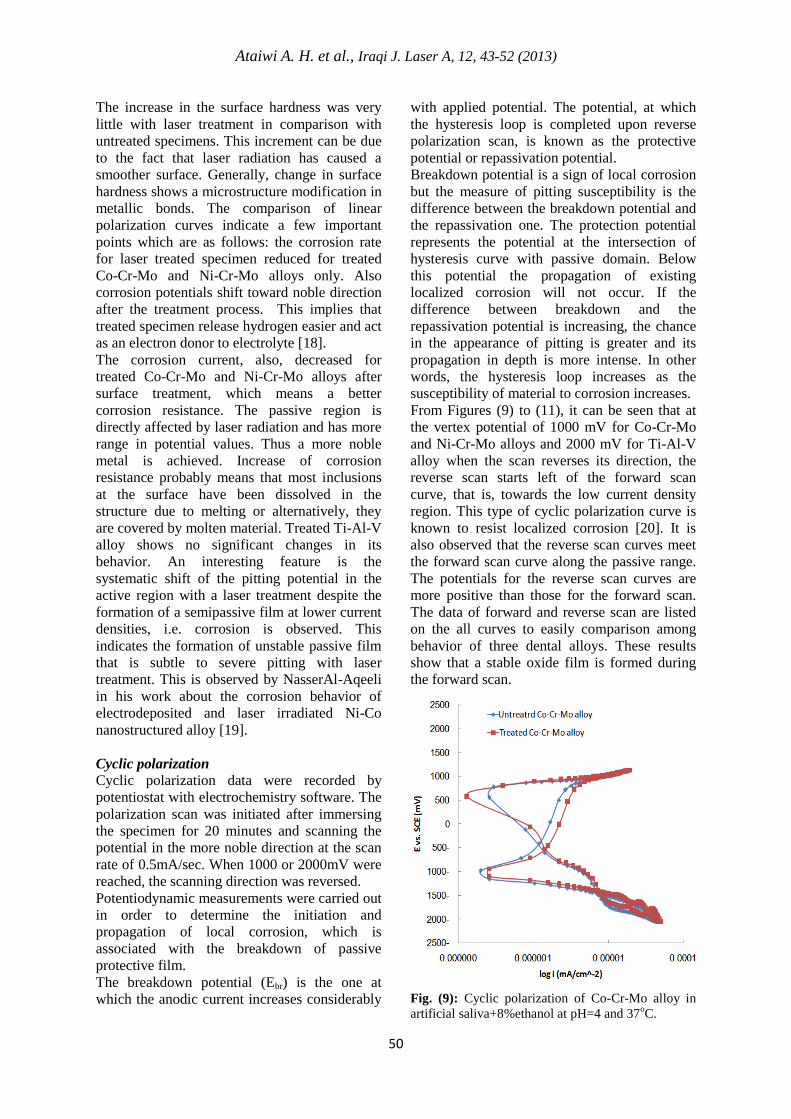
From Figures (9) to (11), it can be seen that at
the vertex potential of 1000 mV for Co-Cr-Mo
and Ni-Cr-Mo alloys and 2000 mV for Ti-Al-V
alloy when the scan reverses its direction, the
reverse scan starts left of the forward scan
curve, that is, towards the low current density
region. This type of cyclic polarization curve is
known to resist localized corrosion [20]. It is
also observed that the reverse scan curves meet
the forward scan curve along the passive range.
The potentials for the reverse scan curves are
more positive than those for the forward scan.
The data of forward and reverse scan are listed
on the all curves to easily comparison among
behavior of three dental alloys. These results
show that a stable oxide film is formed during
the forward scan.
Fig. (9): Cyclic polarization of Co-Cr-Mo alloy in
artificial saliva+8%ethanol at pH=4 and 37oC.
Ataiwi A. H. et al., Iraqi J. Laser A, 12, 43-52 (2013)
51
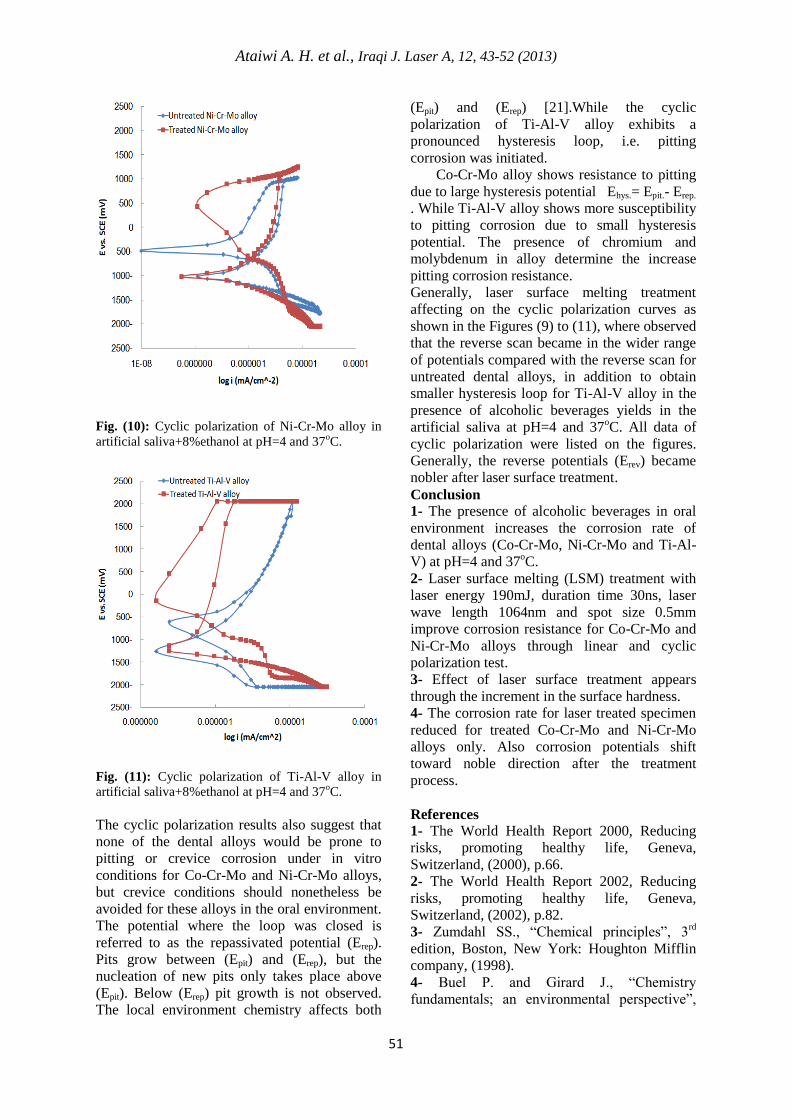
Fig. (10): Cyclic polarization of Ni-Cr-Mo alloy in
artificial saliva+8%ethanol at pH=4 and 37oC.
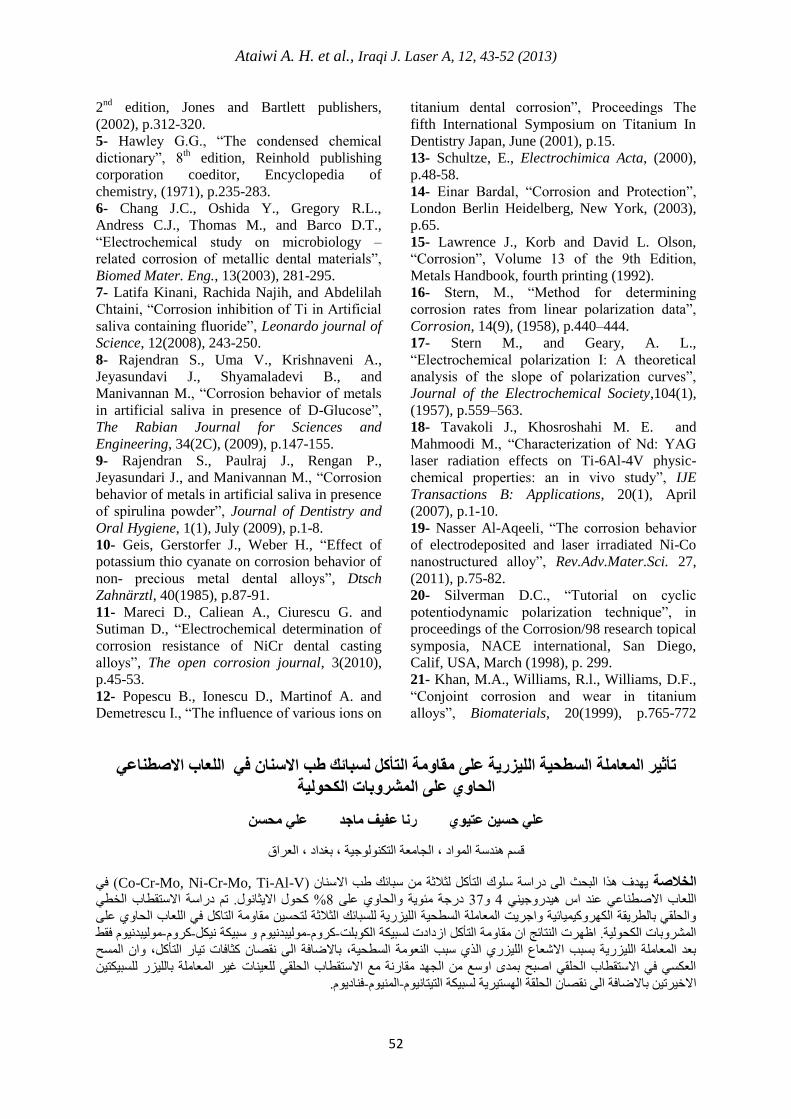
Fig. (11): Cyclic polarization of Ti-Al-V alloy in
artificial saliva+8%ethanol at pH=4 and 37oC.
The cyclic polarization results also suggest that
none of the dental alloys would be prone to
pitting or crevice corrosion under in vitro
conditions for Co-Cr-Mo and Ni-Cr-Mo alloys,
but crevice conditions should nonetheless be
avoided for these alloys in the oral environment.
The potential where the loop was closed is
referred to as the repassivated potential (Erep).
Pits grow between (Epit) and (Erep), but the
nucleation of new pits only takes place above
(Epit). Below (Erep) pit growth is not observed.
The local environment chemistry affects both
(Epit) and (Erep) [21].While the cyclic
polarization of Ti-Al-V alloy exhibits a
pronounced hysteresis loop, i.e. pitting
corrosion was initiated.
Co-Cr-Mo alloy shows resistance to pitting
due to large hysteresis potential Ehys.= Epit.- Erep.
. While Ti-Al-V alloy shows more susceptibility
to pitting corrosion due to small hysteresis
potential. The presence of chromium and
molybdenum in alloy determine the increase
pitting corrosion resistance.
Generally, laser surface melting treatment
affecting on the cyclic polarization curves as
shown in the Figures (9) to (11), where observed
that the reverse scan became in the wider range
of potentials compared with the reverse scan for
untreated dental alloys, in addition to obtain
smaller hysteresis loop for Ti-Al-V alloy in the
presence of alcoholic beverages yields in the
artificial saliva at pH=4 and 37oC. All data of
cyclic polarization were listed on the figures.
Generally, the reverse potentials (Erev) became
nobler after laser surface treatment.
Conclusion
1- The presence of alcoholic beverages in oral
environment increases the corrosion rate of
dental alloys (Co-Cr-Mo, Ni-Cr-Mo and Ti-Al-
V) at pH=4 and 37oC.
2- Laser surface melting (LSM) treatment with
laser energy 190mJ, duration time 30ns, laser
wave length 1064nm and spot size 0.5mm
improve corrosion resistance for Co-Cr-Mo and
Ni-Cr-Mo alloys through linear and cyclic
polarization test.
3- Effect of laser surface treatment appears
through the increment in the surface hardness.
4- The corrosion rate for laser treated specimen
reduced for treated Co-Cr-Mo and Ni-Cr-Mo
alloys only. Also corrosion potentials shift
toward noble direction after the treatment
process.
References
1- The World Health Report 2000, Reducing
risks, promoting healthy life, Geneva,
Switzerland, (2000), p.66.
2- The World Health Report 2002, Reducing
risks, promoting healthy life, Geneva,
Switzerland, (2002), p.82.
3- Zumdahl SS., “Chemical principles”, 3rd
edition, Boston, New York: Houghton Mifflin
company, (1998).
4- Buel P. and Girard J., “Chemistry
fundamentals; an environmental perspective”,
Ataiwi A. H. et al., Iraqi J. Laser A, 12, 43-52 (2013)
52
2nd
edition, Jones and Bartlett publishers,
(2002), p.312-320.
5- Hawley G.G., “The condensed chemical
dictionary”, 8th edition, Reinhold publishing
corporation coeditor, Encyclopedia of
chemistry, (1971), p.235-283.
6- Chang J.C., Oshida Y., Gregory R.L.,
Andress C.J., Thomas M., and Barco D.T.,
“Electrochemical study on microbiology –
related corrosion of metallic dental materials”,
Biomed Mater. Eng., 13(2003), 281-295.
7- Latifa Kinani, Rachida Najih, and Abdelilah
Chtaini, “Corrosion inhibition of Ti in Artificial
saliva containing fluoride”, Leonardo journal of
Science, 12(2008), 243-250.
8- Rajendran S., Uma V., Krishnaveni A.,
Jeyasundavi J., Shyamaladevi B., and
Manivannan M., “Corrosion behavior of metals
in artificial saliva in presence of D-Glucose”,
The Rabian Journal for Sciences and
Engineering, 34(2C), (2009), p.147-155.
9- Rajendran S., Paulraj J., Rengan P.,
Jeyasundari J., and Manivannan M., “Corrosion
behavior of metals in artificial saliva in presence
of spirulina powder”, Journal of Dentistry and
Oral Hygiene, 1(1), July (2009), p.1-8.
10- Geis, Gerstorfer J., Weber H., “Effect of
potassium thio cyanate on corrosion behavior of
non- precious metal dental alloys”, Dtsch
Zahnärztl, 40(1985), p.87-91.
11- Mareci D., Caliean A., Ciurescu G. and
Sutiman D., “Electrochemical determination of
corrosion resistance of NiCr dental casting
alloys”, The open corrosion journal, 3(2010),
p.45-53.
12- Popescu B., Ionescu D., Martinof A. and
Demetrescu I., “The influence of various ions on
titanium dental corrosion”, Proceedings The
fifth International Symposium on Titanium In
Dentistry Japan, June (2001), p.15.
13- Schultze, E., Electrochimica Acta, (2000),
p.48-58.
14- Einar Bardal, “Corrosion and Protection”,
London Berlin Heidelberg, New York, (2003),
p.65.
15- Lawrence J., Korb and David L. Olson,
“Corrosion”, Volume 13 of the 9th Edition,
Metals Handbook, fourth printing (1992).
16- Stern, M., “Method for determining
corrosion rates from linear polarization data”,
Corrosion, 14(9), (1958), p.440–444.
17- Stern M., and Geary, A. L.,
“Electrochemical polarization I: A theoretical
analysis of the slope of polarization curves”,
Journal of the Electrochemical Society,104(1),
(1957), p.559–563.
18- Tavakoli J., Khosroshahi M. E. and
Mahmoodi M., “Characterization of Nd: YAG
laser radiation effects on Ti-6Al-4V physic-
chemical properties: an in vivo study”, IJE
Transactions B: Applications, 20(1), April
(2007), p.1-10.
19- Nasser Al-Aqeeli, “The corrosion behavior
of electrodeposited and laser irradiated Ni-Co
nanostructured alloy”, Rev.Adv.Mater.Sci. 27,
(2011), p.75-82.
20- Silverman D.C., “Tutorial on cyclic
potentiodynamic polarization technique”, in
proceedings of the Corrosion/98 research topical
symposia, NACE international, San Diego,
Calif, USA, March (1998), p. 299.
21- Khan, M.A., Williams, R.l., Williams, D.F.,
“Conjoint corrosion and wear in titanium
alloys”, Biomaterials, 20(1999), p.765-772
السطحة اللزرة على مقاومة التأكل لسثائك طة االسىان ف اللعاب االصطىاع تأثر المعاملة
الحاوي على المشروتات الكحولة
عل محسه ماجدعل حسه عتوي روا عفف
قس هذسة اىىاد ، اىجبعة اىحنىىىجة ، ثغذاد ، اىعزاق
( ف Co-Cr-Mo, Ni-Cr-Mo, Ti-Al-Vىثالثة سجبئل طت االسب ) هذف هذا اىجحث اى دراسة سيىك اىحأمو الخالصة
% محىه االثبىه. ج دراسة االسحقطبة اىخط 8درجة ئىة واىحبو عي 34و 4اىيعبة االصطبع عذ اص هذروج
قبوة اىحبمو ف اىيعبة اىحبو عي واىحيق ثبىطزقة اىنهزومبئة واجزث اىعبية اىسطحة اىيشرة ىيسجبئل اىثالثة ىححس
ىىجذى فقط -مزو-ىىجذى و سجنة نو-مزو-اىشزوثبت اىنحىىة. اظهزت اىحبئج ا قبوة اىحأمو اسدادت ىسجنة اىنىثيث
اىحأمو، وا اىسح ثعذ اىعبية اىيشرة ثسجت االشعبع اىيشر اىذ سجت اىعىة اىسطحة، ثبالضبفة اى قصب مثبفبت جبر
اىعنس ف االسحقطبة اىحيق اصجح ثذي اوسع اىجهذ قبرة ع االسحقطبة اىحيق ىيعبت غز اىعبية ثبىيشر ىيسجنح
فبدى.-اىى-االخزج ثبالضبفة اى قصب اىحيقة اىهسحزة ىسجنة اىححبى


