Embed Size (px)
Citation preview
www.elsevier.com/locate/microc
Microchemical Journal 78 (2004) 27–33
A novel strategy to verification of adulteration in alcoholic beverages
based on Schlieren effect measurements and chemometric techniques
Renata S. da Costaa, Sergio R.B. Santosa, Luciano F. Almeidab, Elaine C.L. Nascimentoa,Marcio J.C. Pontesa, Ricardo A.C. Limab, Simone S. Simoesa, Mario Cesar U. Araujoa,*
aUniversidade Federal da Paraıba, CCEN, Departamento de Quımica, P.O. Box 5093, 58051-970 Joao Pessoa, PB, BrazilbUniversidade Federal de Pernambuco, CCEN, Departamento de Quımica Fundamental, Brazil
Accepted 11 March 2004
Available online 10 May 2004
Abstract
A novel strategy to evaluation of adulteration in alcoholic beverages based on the measurement of the Schlieren effect using an automated
FIA system with photometric detection is proposed. The assay is based on the Schlieren effect produced when beverage samples are injected
in a single-line FIA system that uses water as carrier stream and a light-emitting diode–phototransistor photometer controlled by
microcomputer as detector. The flow system presents limited mixing conditions which make possible to create gradients of refractive index
(Schlieren effect) in the injected sample zone. These gradients are reproducible, characteristic of each alcoholic beverage and undergo
specific modifications when adulterations with water or ethanol are imposed. Schlieren effect data of brandies, cachac�as, rums, whiskies and
vodkas were treated by SIMCA to elaborate class models applied in the evaluation of alcoholic beverages adulteration. Samples of the
original matrix of each sort of beverages were adulterated in laboratory by adding water, methanol and ethanol in levels of 5% and 10% (v/v).
These samples were used as test set to validate SIMCA class models. The verification of authenticity using Schlieren effect measurements
presented good results making possible to identify 100% of the beverages samples adulterated in laboratory and 93% of the actual adulterated
alcoholic beverages with confidence levels of 95%. As principal advantage, the automated system does not use reagents to carry out the
analysis.
D 2004 Elsevier B.V. All rights reserved.
Keywords: Schliren; Beverages; FIA; Adulteration
1. Introduction
The presence of falsified products in the Brazilian market
generates economical damages about US$12 billion a year,
according to data presented in the last Seminar of the
National Confederation of the Industry, Brazil. In 2001,
the performance of forgers and smugglers impeded the
Federal Govern to collect about R$2.5 billion in imposts [1].
The adulteration is usually accomplished by addition of
alcohol, water, dyes and aromas to beverages of minor
commercial value. As these beverages are usually produced
with inadequate conditions of hygiene, they become of
high risk for the human health. Another risk for the
consumer of adulterated alcoholic beverages is the inges-
tion of products not elaborated with raw materials con-
0026-265X/$ - see front matter D 2004 Elsevier B.V. All rights reserved.
doi:10.1016/j.microc.2004.03.006
* Corresponding author. Tel./fax: +55-83-216-7438.
E-mail address: [email protected] (M.C.U. Araujo).
trolled by control organs, mainly those containing high
methanol levels. The maximum limits of methanol in
beverages are established by the Brazilian legislation in
0.25 ml/100 ml of absolute alcohol for liquors and other
distilled beverages and 0.35 g/l for wines. These limits are
based on the acceptable daily ingestion and establish the
parameters that aid in the methanol detection added delib-
erate or accidentally in beverages. The toxicant doses of
methanol vary of an individual to another. Some authors
consider that the consumption of 20 ml causes blindness
and 60 ml constitutes a lethal dose [2].
Generally, analysis of volatile compounds is used to
characterise different types of beverages or varieties of a
same type, as well as analysis of minerals is used to
determine the origin area. Independently of the analytical
technique used for the characterisation of the alcoholic
beverage, chemometric techniques as the Principal Compo-
nents Analysis (PCA), Soft Independent Modelling of Class
R.S. da Costa et al. / Microchemical Journal 78 (2004) 27–3328
Analogy (SIMCA), Principal Component Regression
(PCR), Partial Least Square Analysis (PLS), Hierarchical
Cluster Analysis (HCA), Discriminant Analysis (DA) and
Canonical Analysis (CA) have been applied to elaborate
models that represent in a trustworthy way the intrinsic
characteristic of each beverage analysed.
Huerta et al. [3] used pH and acidity measurements,
titrable acidity and content of alcohol, ashes, reducers sugars
and volatile compounds, as parameters to classify several
types of wine. The data analysed by DA provided unsatis-
factory results.
Raptis et al. [4] used the period of maturation, the first
years of use of the barrel and its number of replenishments
to elaborate neural network and fuzzy logic models for
classification of aged wines distillates with good.
Schreyer and Mikkelsen [5] applied square wave vol-
tammetry with platinum electrodes in the analysis of several
kinds of beverages, including wines, coffees, milks, etc.,
and the resulting voltamograms were analysed by PCA,
PCR and PLS. A relative mean error of 3.5% was obtained.
Arvanitoyannis et al. [6] reviewed the principal methods
of analyses used for the characterisation and verification of
authenticity of alcoholic beverages. It was verified that the
high performance liquid chromatography (HPLC), the atom-
ic absorption spectroscopy (AAS), the gas chromatography
(GC) and the mass spectroscopy (MS) are the most used
analytical techniques.
Gonzales-San Jose et al. [7] applied methods of multi-
variate calibration on data of AAS and of several methods of
analysis of phenolic components, in order to classify rose
wines of different regions of Spain and observed that
ethanol and calcium were the most important parameters
for the characterisation of these drinks.
Recently, Palma and Barroso [8] applied Middle Infrared
Spectroscopy with Fourier transform for the characterisation
and classification of wines, brandies and other distilled
beverages using PCA and CA. Different degrees of ageing
and types of beverages were characterised by applying this
methodology with correlation coefficients superior to 0.986.
Nagato et al. [9] analysed 608 samples of alcoholic
beverages suspected to be falsified and determined that
391 drinks were falsified and 2 of them presented methanol
in an amount superior to that established by the Brazilian
Legislation. The adulteration percentile observed was as
follows: national whisky 81%, imported whisky 59%,
vodkas 65%, brandies 75%, ginger brandy 80%, bitter
88%, cachac�a 43%.
Chromatography is applied by fiscal organs in Brazil for
verification of authenticity but it is an expensive instrumen-
tation and a laborious technique besides presenting low
analytic frequency. Thereby, analytical methods based on
the flow injection analysis systems are important alterna-
tives to minimise the inherent difficulties of the chromato-
graphic methods.
In flow injection analysis (FIA) systems, the sample is
injected in a carrier stream continually pumped towards the
detection unit. While it is transported, the sample zone
disperses due to the contact with the carrier stream and
generates, consequently, a concentration gradient that pro-
duces a transient analytical signal in the detector. In some
cases, gradients of refraction index associate to the concen-
tration gradients formed by the sample zone so that the noise
increases and the analytical sensibility reduces (Schlieren
effect) [10,11]. Schlieren effect in FIA system was firstly
described by Krug et al. [12] when a turbidimetric procedure
for sulphate determination was proposed.
When the flow conditions and the optical configuration
of the detection system are appropriate, the gradients of
refraction index of colourless samples generate reproducible
Schlieren signals whose intensity depends on the refraction
indexes of the carrier stream and sample. The refraction
index of a colourless substance depends on the wavelength
in which it is measured, on the intensities of the ultraviolet
absorptions, on the temperature and, in the case of solutions,
on the solute concentration [13]. The exploitation of the
Schlieren effect with the aim at determining refraction
indexes of colourless solutions of organic and inorganic
compounds was proposed by Betteridge et al. [14], which
developed a flow refractometer based on LED and photo-
transistor and described the origin of the phenomenon and
the importance of the control the flow cell geometry and the
hydrodynamic conditions.
Zagatto et al. [11] studied the relation between the nature
of the injected substances and the profile of the Schlieren
signals and observed that the signals are highly dependent of
the chemical species. Easily soluble samples or samples
injected into a system with improved mixing conditions
present small intensity Schlieren signals.
Santos et al. [15] developed an automated flow injection
system with LED–phototransistor detection for the deter-
mination of the alcoholic grade of distilled beverages based
on the measure of the Schlieren effect. As advantages, no
reagents are used, only distilled water as carrier stream, and
it was possible to analyse 120 samples per hour.
In this work is proposed a novel strategy to determinate
adulteration of alcoholic beverages based on measurements
of Schlieren effect produced when beverage samples are
transported by a flow stream of deionised water in a FIA
system with limited mixing conditions. To carry out the
analysis, a flow injection automated system (FIAS) similar
to that described by Santos et al. [15] is used. As chemo-
metric technique, SIMCA is applied to data treatment so that
class models are created to describe with fidelity the
different sorts of the analysed alcoholic beverages.
2. Material and methods
2.1. Samples and reagents
To carry out the analysis in the FIAS, deionised water
was always used as carrier stream.
R.S. da Costa et al. / Microchemical Journal 78 (2004) 27–33 29
Pure vodkas, rums, whiskies, cachac�as and brandies
acquired in Brazilian markets were used as calibration sets
to construct chemometric models.
Two sets of adulterated beverages were used. One set
formed by laboratory adulterated beverages characterised by
addition of deionised water and ethanol (99.8% w/w) and
methanol (99.8% w/w) (Merck) in the proportions of 5% v/v
and 10% v/v to the pure beverages and the other set formed
by actual adulterated beverages (beverages acquired in
markets as a pure product but that presented unconformities)
furnished by a reference laboratory.
All measures were carried out at 26 jC.
2.2. The FIAS
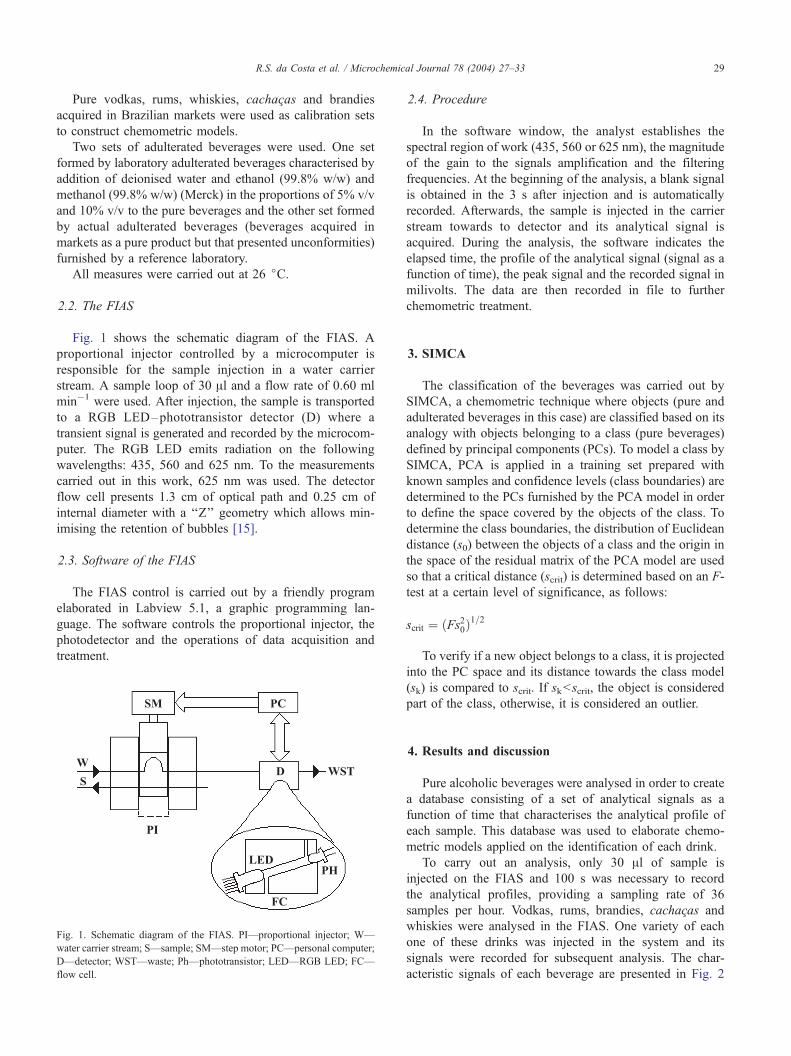
Fig. 1 shows the schematic diagram of the FIAS. A
proportional injector controlled by a microcomputer is
responsible for the sample injection in a water carrier
stream. A sample loop of 30 Al and a flow rate of 0.60 ml
min�1 were used. After injection, the sample is transported
to a RGB LED–phototransistor detector (D) where a
transient signal is generated and recorded by the microcom-
puter. The RGB LED emits radiation on the following
wavelengths: 435, 560 and 625 nm. To the measurements
carried out in this work, 625 nm was used. The detector
flow cell presents 1.3 cm of optical path and 0.25 cm of
internal diameter with a ‘‘Z’’ geometry which allows min-
imising the retention of bubbles [15].
2.3. Software of the FIAS
The FIAS control is carried out by a friendly program
elaborated in Labview 5.1, a graphic programming lan-
guage. The software controls the proportional injector, the
photodetector and the operations of data acquisition and
treatment.
Fig. 1. Schematic diagram of the FIAS. PI—proportional injector; W—
water carrier stream; S—sample; SM—step motor; PC—personal computer;
D—detector; WST—waste; Ph—phototransistor; LED—RGB LED; FC—
flow cell.
2.4. Procedure
In the software window, the analyst establishes the
spectral region of work (435, 560 or 625 nm), the magnitude
of the gain to the signals amplification and the filtering
frequencies. At the beginning of the analysis, a blank signal
is obtained in the 3 s after injection and is automatically
recorded. Afterwards, the sample is injected in the carrier
stream towards to detector and its analytical signal is
acquired. During the analysis, the software indicates the
elapsed time, the profile of the analytical signal (signal as a
function of time), the peak signal and the recorded signal in
milivolts. The data are then recorded in file to further
chemometric treatment.
3. SIMCA
The classification of the beverages was carried out by
SIMCA, a chemometric technique where objects (pure and
adulterated beverages in this case) are classified based on its
analogy with objects belonging to a class (pure beverages)
defined by principal components (PCs). To model a class by
SIMCA, PCA is applied in a training set prepared with
known samples and confidence levels (class boundaries) are
determined to the PCs furnished by the PCA model in order
to define the space covered by the objects of the class. To
determine the class boundaries, the distribution of Euclidean
distance (s0) between the objects of a class and the origin in
the space of the residual matrix of the PCA model are used
so that a critical distance (scrit) is determined based on an F-
test at a certain level of significance, as follows:
scrit ¼ ðFs20Þ1=2
To verify if a new object belongs to a class, it is projected
into the PC space and its distance towards the class model
(sk) is compared to scrit. If sk<scrit, the object is considered
part of the class, otherwise, it is considered an outlier.
4. Results and discussion
Pure alcoholic beverages were analysed in order to create
a database consisting of a set of analytical signals as a
function of time that characterises the analytical profile of
each sample. This database was used to elaborate chemo-
metric models applied on the identification of each drink.
To carry out an analysis, only 30 Al of sample is
injected on the FIAS and 100 s was necessary to record
the analytical profiles, providing a sampling rate of 36
samples per hour. Vodkas, rums, brandies, cachac�as and
whiskies were analysed in the FIAS. One variety of each
one of these drinks was injected in the system and its
signals were recorded for subsequent analysis. The char-
acteristic signals of each beverage are presented in Fig. 2
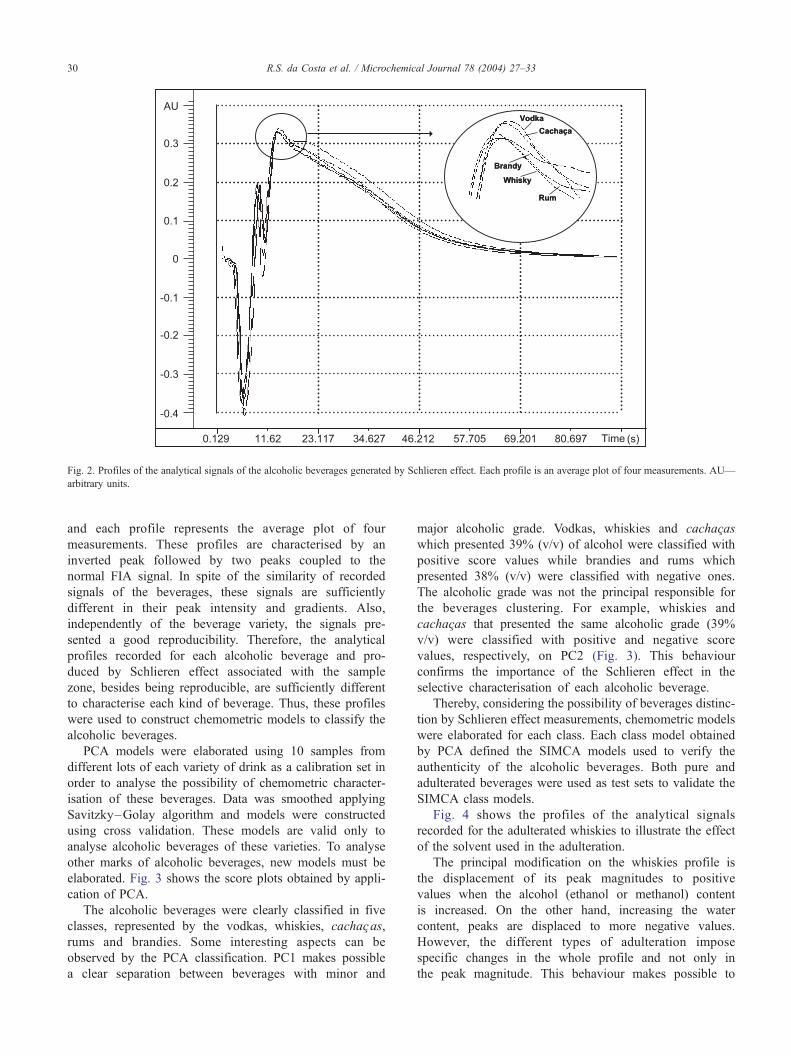
Fig. 2. Profiles of the analytical signals of the alcoholic beverages generated by Schlieren effect. Each profile is an average plot of four measurements. AU—
arbitrary units.
R.S. da Costa et al. / Microchemical Journal 78 (2004) 27–3330
and each profile represents the average plot of four
measurements. These profiles are characterised by an
inverted peak followed by two peaks coupled to the
normal FIA signal. In spite of the similarity of recorded
signals of the beverages, these signals are sufficiently
different in their peak intensity and gradients. Also,
independently of the beverage variety, the signals pre-
sented a good reproducibility. Therefore, the analytical
profiles recorded for each alcoholic beverage and pro-
duced by Schlieren effect associated with the sample
zone, besides being reproducible, are sufficiently different
to characterise each kind of beverage. Thus, these profiles
were used to construct chemometric models to classify the
alcoholic beverages.
PCA models were elaborated using 10 samples from
different lots of each variety of drink as a calibration set in
order to analyse the possibility of chemometric character-
isation of these beverages. Data was smoothed applying
Savitzky–Golay algorithm and models were constructed
using cross validation. These models are valid only to
analyse alcoholic beverages of these varieties. To analyse
other marks of alcoholic beverages, new models must be
elaborated. Fig. 3 shows the score plots obtained by appli-
cation of PCA.
The alcoholic beverages were clearly classified in five
classes, represented by the vodkas, whiskies, cachac�as,rums and brandies. Some interesting aspects can be
observed by the PCA classification. PC1 makes possible
a clear separation between beverages with minor and
major alcoholic grade. Vodkas, whiskies and cachac�aswhich presented 39% (v/v) of alcohol were classified with
positive score values while brandies and rums which
presented 38% (v/v) were classified with negative ones.
The alcoholic grade was not the principal responsible for
the beverages clustering. For example, whiskies and
cachac�as that presented the same alcoholic grade (39%
v/v) were classified with positive and negative score
values, respectively, on PC2 (Fig. 3). This behaviour
confirms the importance of the Schlieren effect in the
selective characterisation of each alcoholic beverage.
Thereby, considering the possibility of beverages distinc-
tion by Schlieren effect measurements, chemometric models
were elaborated for each class. Each class model obtained
by PCA defined the SIMCA models used to verify the
authenticity of the alcoholic beverages. Both pure and
adulterated beverages were used as test sets to validate the
SIMCA class models.
Fig. 4 shows the profiles of the analytical signals
recorded for the adulterated whiskies to illustrate the effect
of the solvent used in the adulteration.
The principal modification on the whiskies profile is
the displacement of its peak magnitudes to positive
values when the alcohol (ethanol or methanol) content
is increased. On the other hand, increasing the water
content, peaks are displaced to more negative values.
However, the different types of adulteration impose
specific changes in the whole profile and not only in
the peak magnitude. This behaviour makes possible to
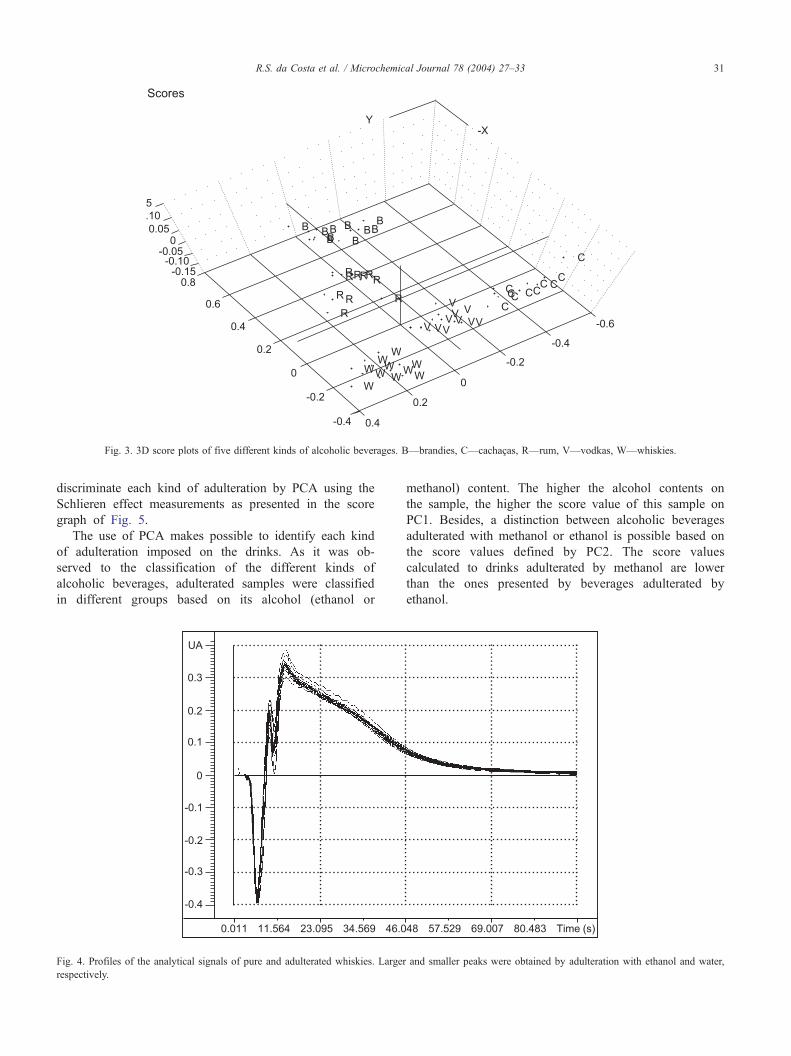
Fig. 3. 3D score plots of five different kinds of alcoholic beverages. B—brandies, C—cachac�as, R—rum, V—vodkas, W—whiskies.
R.S. da Costa et al. / Microchemical Journal 78 (2004) 27–33 31
discriminate each kind of adulteration by PCA using the
Schlieren effect measurements as presented in the score
graph of Fig. 5.
The use of PCA makes possible to identify each kind
of adulteration imposed on the drinks. As it was ob-
served to the classification of the different kinds of
alcoholic beverages, adulterated samples were classified
in different groups based on its alcohol (ethanol or
UA
Fig. 4. Profiles of the analytical signals of pure and adulterated whiskies. Larger
respectively.
methanol) content. The higher the alcohol contents on
the sample, the higher the score value of this sample on
PC1. Besides, a distinction between alcoholic beverages
adulterated with methanol or ethanol is possible based on
the score values defined by PC2. The score values
calculated to drinks adulterated by methanol are lower
than the ones presented by beverages adulterated by
ethanol.
and smaller peaks were obtained by adulteration with ethanol and water,
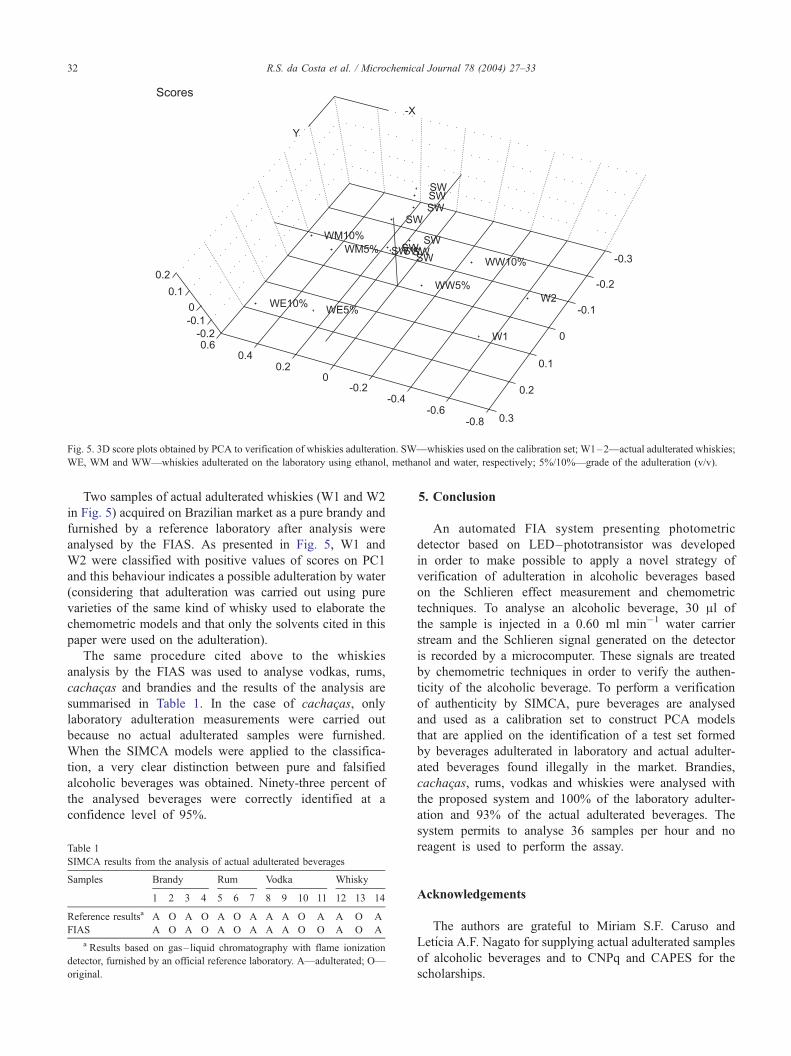
Fig. 5. 3D score plots obtained by PCA to verification of whiskies adulteration. SW—whiskies used on the calibration set; W1–2—actual adulterated whiskies;
WE, WM and WW—whiskies adulterated on the laboratory using ethanol, methanol and water, respectively; 5%/10%—grade of the adulteration (v/v).
R.S. da Costa et al. / Microchemical Journal 78 (2004) 27–3332
Two samples of actual adulterated whiskies (W1 and W2
in Fig. 5) acquired on Brazilian market as a pure brandy and
furnished by a reference laboratory after analysis were
analysed by the FIAS. As presented in Fig. 5, W1 and
W2 were classified with positive values of scores on PC1
and this behaviour indicates a possible adulteration by water
(considering that adulteration was carried out using pure
varieties of the same kind of whisky used to elaborate the
chemometric models and that only the solvents cited in this
paper were used on the adulteration).
The same procedure cited above to the whiskies
analysis by the FIAS was used to analyse vodkas, rums,
cachac�as and brandies and the results of the analysis are
summarised in Table 1. In the case of cachac�as, only
laboratory adulteration measurements were carried out
because no actual adulterated samples were furnished.
When the SIMCA models were applied to the classifica-
tion, a very clear distinction between pure and falsified
alcoholic beverages was obtained. Ninety-three percent of
the analysed beverages were correctly identified at a
confidence level of 95%.
Table 1
SIMCA results from the analysis of actual adulterated beverages
Samples Brandy Rum Vodka Whisky
1 2 3 4 5 6 7 8 9 10 11 12 13 14
Reference resultsa A O A O A O A A A O A A O A
FIAS A O A O A O A A A O O A O A
a Results based on gas– liquid chromatography with flame ionization
detector, furnished by an official reference laboratory. A—adulterated; O—
original.
5. Conclusion
An automated FIA system presenting photometric
detector based on LED–phototransistor was developed
in order to make possible to apply a novel strategy of
verification of adulteration in alcoholic beverages based
on the Schlieren effect measurement and chemometric
techniques. To analyse an alcoholic beverage, 30 Al of
the sample is injected in a 0.60 ml min�1 water carrier
stream and the Schlieren signal generated on the detector
is recorded by a microcomputer. These signals are treated
by chemometric techniques in order to verify the authen-
ticity of the alcoholic beverage. To perform a verification
of authenticity by SIMCA, pure beverages are analysed
and used as a calibration set to construct PCA models
that are applied on the identification of a test set formed
by beverages adulterated in laboratory and actual adulter-
ated beverages found illegally in the market. Brandies,
cachac�as, rums, vodkas and whiskies were analysed with
the proposed system and 100% of the laboratory adulter-
ation and 93% of the actual adulterated beverages. The
system permits to analyse 36 samples per hour and no
reagent is used to perform the assay.
Acknowledgements
The authors are grateful to Miriam S.F. Caruso and
Letıcia A.F. Nagato for supplying actual adulterated samples
of alcoholic beverages and to CNPq and CAPES for the
scholarships.

R.S. da Costa et al. / Microchemical Journal 78 (2004) 27–33 33
References
[1] R.J. Lombardi, O Estado de Sao Paulo, (2002 October) 21.
[2] F. Blinder, E. Voges, P. Lauge, Food Addit. Cont. 3 (1988) 343.
[3] M.D. Huerta, M.R. Salinas, T. Masoud, G.L. Alonso, J. Food
Compos. Anal. 11 (1998) 363.
[4] C.G. Raptis, C.I. Siettos, C.T. Kiranoudis, G.V. Bafas, J. Food Eng.
46 (2000) 267.
[5] S.K. Schreyer, S.R. Mikkelsen, Sens. Actuators 71 (2000) 147.
[6] I.S. Arvanitoyannis, M.N. Katsota, E.P. Psarra, E.H. Soufleros,
S. Kallithraka, Trends Food Sci. Technol. 10 (1999) 321.
[7] S. Perez-Magarino, M. Ortega-Heras, M.L. Gonzalez-San Jose, Anal.
Chim. Acta 458 (2002) 187.
[8] M. Palma, C.G. Barroso, Talanta 58 (2002) 265.
[9] L.A.F. Nagato, M.C. Duran, M.S.F. Caruso, R.C.F. Barsotti,
E.S.G. Badolato, Cienc. Tecnol. Aliment. 21 (2001) 39.
[10] J.A. Nobrega, F.R.P. Rocha, Quım. Nova 19 (1996) 636.
[11] E.A.G. Zagatto, M.A.Z. Arruda, A.O. Jacintho, I.L. Mattos, Anal.
Chim. Acta 234 (1990) 153.
[12] F.J. Krug, E.A.G. Zagatto, B.F. Reis, Anal. Chim. Acta 145 (1983)
179.
[13] A. Hanning, J. Roeraade, Anal. Chem. 69 (1997) 1496.
[14] D. Betteridge, E.L. Dagles, B. Fields, N.F. Graves, Analyst 103
(1978) 897.
[15] S.R.B. Santos, M.C.U. Araujo, R.A. Barbosa, Analyst 127 (2002)
324.


