Embed Size (px)
Citation preview

Department of Planning and Regional Development, School of Engineering, University of Thessaly Pedion Areos, 38334 Volos, Greece, Tel: +302421074462, e-mail: [email protected], http://www.prd.uth.gr
Available online at: http://www.prd.uth.gr/research/DP/2008/uth-prd-dp-2008-23_en.pdf
Discussion Paper Series, 14(23): 433-454
The Emerging Economic Geography Setting in New European Union Member-States: A Comparative Account of Regional-Industrial Performance and
Adjustment
Dimitris Kallioras Economist (MBA, PhD), Visiting Lecturer, [email protected]
George Petrakos Economist (MSc, PhD), Professor of Spatial Economic Analysis, [email protected]
Maria Tsiapa Planner (MSc), PhD Candidate, [email protected]
Abstract
The market-based process of economic integration, though it is perceived to generate higher levels of aggregate efficiency, is possible to be associated with higher levels of inequality. In spatial terms, this is believed to lead to regional imbalances with less advanced regions possibly experiencing, in the integration process, weaker gains, or, even, net losses, comparing to their more advanced counterparts. Such type of arguments are in variance with the neoclassical understanding for the operation of the spatial economy and contribute to an ongoing discussion among academics and politicians for the impact of integration on the growth potential of less advanced European Union (EU) regions. New EU member-states (NMS), that were former planned economies of the Eastern bloc, provide a “quasi laboratory” environment for the examination of the spatial impact of the EU economic integration process. The experience of EU NMS is a unique situation, where relatively closed economic systems opened, almost at once, to the world economy and, at the same time, market mechanisms replaced central planning. Thus, given that EU NMS are characterized as lagging-behind and structurally weak, understanding the factors behind their growth performance may provide valuable insight for both theory and policy, especially at a time when the European project is facing a number of challenges and European structural and cohesion policies are under scrutiny. The paper evaluates the emerging economic geography setting in EU NMS, and provides a comparative account with respect to regional-industrial performance and adjustment. The analysis covers the period 1995-2005, incorporating both the early shocks and the recent trends that EU NMS have experienced.
Key words: integration, regional-industrial performance, EU NMS
November 2008


The Emerging Economic Geography Setting in New European Union Member-States 435
Discussion Paper Series, 2008, 14(23)
1. Introduction
The market-based process of economic integration, though it is perceived to generate
higher levels of aggregate efficiency, is possible to be associated with higher levels of
inequality. In spatial terms, this is believed to lead to regional imbalances with less
advanced regions possibly experiencing, in the integration process, weaker gains, or,
even, net losses, comparing to their more advanced counterparts. Such type of
arguments are in variance with the neoclassical understanding for the operation of the
spatial economy and contribute to an ongoing discussion among academics and
politicians for the impact of integration on the growth potential of less advanced European Union (EU) regions.
New EU member-states (NMS)1, that were former planned economies of the Eastern
bloc, provide a “quasi laboratory” environment for the examination of the spatial impact
of the EU economic integration process. The experience of EU NMS is a unique
situation, where relatively closed economic systems opened, almost at once, to the
world economy and, at the same time, market mechanisms replaced central planning.
Thus, given that EU NMS are characterized as lagging-behind and structurally weak,
understanding the factors behind their growth performance may provide valuable insight
for both theory and policy, especially at a time when the European project is facing a number of challenges and European structural and cohesion policies are under scrutiny.
The chapter evaluates the emerging economic geography setting in EU NMS, and
provides a comparative account with respect to regional-industrial performance and
adjustment. The analysis covers the period 1995-2005, incorporating both the early
shocks and the recent trends that EU NMS have experienced. The analysis, also,
focuses on the sector of industry (manufacturing), as this sector constitutes the main
diffusion channel of the economic integration dynamics due to the displaceable
character of its activities and the tradeable character of its products, and due to the
linkages that retains with the other sectors of production being consumer of intermediate
goods and producer of final goods. The main part of the analysis is based on data
disaggregated at the Nomenclature of Territorial Units for Statistics (NUTS) III spatial
level and the Nomenclature for Classification of Economic Activities (NACE) 2-digit structural level.
The next section of the chapter summarizes the most interesting aspects of the literature
concerning the impact of economic integration, structure and geography on regional
growth. The third section reports key aspects of EU NMS industrial experience with a
critical discussion of its regional dimension. The fourth section detects the determinants 1 The notion “EU NMS” includes Slovenia, Hungary, Slovakia, Czech Republic, Poland, Latvia, Lithuania and Estonia that became EU members in May 2004, and Bulgaria and Romania that became EU members in January 2007.

436 Dimitris Kallioras, George Petrakos, Maria Tsiapa
UNIVERSITY OF THESSALY, Department of Planning and Regional Development
of regional-industrial performance in EU NMS. The last section of the chapter offers the conclusions.
2. Integration, Structure and Regional Growth: A Survey of
the Literature
There is widespread skepticism in the less advanced EU regions regarding their ability
to adjust to the requirements of the emerging European space. Imperfect competition is
deemed to result in an uneven distribution of the benefits of economic integration, due to
the inability of market to create conditions of optimum economic space. Such skepticism
questions the neoclassical understanding for the operation of the economy.
Proponents of the neoclassical theory (Solow 1956; Swan 1956; inter alia) argue that
economic integration is a long-term process that eventually leads to a reduction of
regional inequalities, through the activation of three equilibrating mechanisms: declining
marginal productivity of capital, interregional trade, and interregional movement of
production factors. Other schools of thought, however, such as the endogenous growth
theories (Romer 1986; Lucas 1988; inter alia), the new trade theories (Krugman 1979;
Helpman and Krugman 1985; inter alia) and the new economic geography (Krugman
1991; Fujita 1993; inter alia), claim that the costs and benefits of economic integration
are unlikely to be spread out uniformly in space2, stressing the role of policies in balancing growth patterns.
Yet, the EU experience (Brülhart and Torstensson 1996; Amiti 1999; Krieger-Boden
2000; inter alia) does not seem to support the neoclassical claim. Core EU regions
generate advantages, leading to differential growth performance, through the
entrenchment of agglomeration economies3 and operate as hubs for economic activities
associated with increasing returns to scale4 (IRS). Conversely, peripheral EU regions,
facing high(er) transaction costs (despite the ongoing improvement of transportation and
communication technology), host, mainly, economic activities associated with constant
returns to scale (CRS).
2 Bringing earliest explanatory approaches of economic space, such as the “big push” (Rosenstein-Rodan 1943), the “growth poles” (Perroux 1955), and the “cumulative causation” (Myrdal 1957), back in the forefront. 3 These are the cost-related benefits (such as spillovers of know-how and tacit knowledge, forward and backward linkages, efficient labor market pooling) arising from the external environment of firms due to the expansion of their economic sector (localization economies) and/or due to the expansion of the city services (urbanization economies) (cf. Segal 1976; Moomaw 1981). 4 Returns to scale refers to changes in output subsequent to a proportional change in all inputs (i.e. all inputs increase by a constant factor) used in the production process (cf. Carlino 1979).

The Emerging Economic Geography Setting in New European Union Member-States 437
Discussion Paper Series, 2008, 14(23)
Engaged in an integration process with distant and, possibly more advanced, partners,
peripheral EU regions tend to develop inter-industry type of trade relations5. This type of
trade relations, which imposes a specific economic structure with specialization typically
in labor-intensive or resource-intensive economic activities, is the outcome of the
inability of peripheral and less advanced regions to compete their more advanced
counterparts in the markets for capital-intensive and knowledge-intensive economic
activities (Brülhart and Elliott 1998). Even though it provides an alternative (and perhaps
the only feasible) route for the exploitation of the locally available skills, it is doubtful
whether such a structural differentiation can produce long-term income convergence
(Petrakos and Christodoulakis 2000). Peripheral and less advanced EU regions, having
weaker productive bases with a high share of sensitive, labor-intensive, sectors and
unfavorable geographic coordinates, are struggling in the process of integration to
effectively redeploy their resources in order to gain from the opening of markets6 (Camagni 1992).
The level and the type of specialization are, thus, essential parameters accounting for
regional growth. In an open economy, the level of specialization is related to the export
base of a region (North 1955; Tiebout 1956). Integration allows for greater specialization
(since domestic demand for some products can be served by imports), allowing inherent
and acquired comparative advantages to be exploited more intensively (Weinhold and
Rauch 1999). However, the positive impact of specialization on growth might be weaker
in regions that are not specialized in sectors associated with IRS (Paci and Usai 2000).
Moreover, excessive specialization might convert possible industry-specific shocks into
region-specific shocks, with, overall, negative effect on growth. A relatively high level of
diversification, in contrast, might work as a safeguard as downturn movements in some
sectors would not be as harmful to the local economy because human and other
resources can be diverted to other existing and more secure alternatives (Acemoglu and
Zilibotti 1997). Furthermore, emerging opportunities in cases of increasing demand in
specific sectors may not go unexploited, if even a small number of firms are present in the region (Feldman 2000).
Presumably, the trade-offs arising from this literature generate dilemmas and questions
about the mix of policies that may promote growth and at the same time decrease
regional inequalities in the EU (Morgenroth and Petrakos 2008). As excessive or
increasing regional disparities may destabilize politically the EU, the role of regional
policy becomes a significant and critical part of the integration process, largely bound to
offset the effects of the other, market-driven, factors. Thus, the impact of economic 5 Inter-industry trade is conducted mainly between economies with different productive structures, whereas intra-industry trade is conducted mainly between economies with similar productive structures. The latter type of trade activity is considered to be more beneficial because it stimulates innovation and exploits economies of scale (Ruffin 1999). 6 It should be noted here that low labor cost, a typical characteristic of less advanced economies, has lost much of its significance in relation to competition, mainly due to the operation of economies of time with the use of sophisticated management techniques (Best 1990) such as, for example, just-in-time (cf. Ohno and Mito 1988).

438 Dimitris Kallioras, George Petrakos, Maria Tsiapa
UNIVERSITY OF THESSALY, Department of Planning and Regional Development
integration on the EU regions depends, to a large extent, on the balance, but also the synergies, between market dynamics and policy interventions.
3. The Industrial Experience of the New European Union
Member-States
EU NMS have been experiencing the processes of transition, from central planning to a
free-market economy, and integration, into the European economic space, as pre-
conditions for historical (re)unification and catch-up with the affluent old EU member-
states (EU-15) coming from Western Europe (Petrakos and Kallioras 2007). During the
socialist period, EU NMS, being under the influence of the Soviet Union, were members
of the Council for Mutual Economic Assistance (CMEA)7. The dissolution of CMEA, after
the collapse of the Soviet Union, has led EU NMS to a state of economic isolation and,
consequently, recession8 (Rostowski 1997; Salvatore 2001). The prospect of EU
accession turned out to be, under such circumstances, one-way road9 for EU NMS10 (Daianu 1995).
The enhancement of the EU NMS integration process has contributed to the reversal of
the EU NMS downturn trends (EBRD 2001; Svenjar 2002). Nevertheless, the income
gap with the EU-15 countries remains wide, indicating the emergence of an “east-west”
pattern of development in the enlarged EU. This situation is even worse for the Balkan
countries (i.e. Bulgaria and Romania), indicating an eastwards shift of the maintained
EU-15 “north-south” pattern of development (Petrakos 2000; Petrakos et al 2000;
Petrakos 2008). Furthermore, internal regional inequalities recorded significant
intensification. Capital and western border regions enjoyed a relatively better
performance, especially in the Central European countries, while peripheral and eastern
regions had, in general, been worse (Map 1) (Petrakos 2001; Römisch 2003; Petrakos
et al 2004). This suggests that externalities generated under the prospect of EU
eastwards enlargement have redefined the European economic space, favoring mostly
7 CMEA, an economic organization equivalent to – but more geographically inclusive than - the EU, was founded in 1949 and disbanded in 1991. The primary factor in CMEA formation appears to have been the objective of the Soviet Union to enforce its domination of the lesser countries of Central and Eastern Europe (cf. Bideleux and Jeffries 1998). 8 Trade transactions under CMEA were held in fixed (and artificially low) prices over periods of years. The exposure to international competition for global markets and the accordance with the international price system caused the contraction of trade activity among the former CMEA member-states and contributed to the acute decline of output and employment (Hare 1997; Zloch-Christy 1998). 9 It is noteworthy that the process of EU accession was supported even when former communist parties regain the power in their countries i.e. Hungary and Poland (Thirkell et al 1998). 10 EU, aiming to expand its economic and political power, started, also, the necessary procedures in order to incorporate EU NMS. The signature of the European Agreements provided the legal background for the EU NMS gradual embedment to EU. The accession of EU NMS to EU finalized in 2003.

The Emerging Economic Geography Setting in New European Union Member-States 439
Discussion Paper Series, 2008, 14(23)
regions being spatially close to the new market center (Niebuhr and Stiller 2002;
Niebuhr 2004; Topaloglou et al 2005). This may, further, suggest that market forces do
not incorporate any automatic spatial convergence mechanism. On the contrary, they
tend to generate greater regional inequality, especially in the transition economies,
which have not developed active regional policies. This evidence casts doubts on the
claims of the neoclassical school, according to which markets have self-correcting mechanisms for regional imbalances.
Map 1: The geography of regional development in EU NMS, GDP per capita
(€/inhabitant; EU-15 = 100), Year 2005
Source: EUROSTAT REGIO Database
The emerging, unbalanced, pattern of regional development in the EU NMS turns
attention to the study of the EU NMS economic structures. Market forces and transition
policies of openness, privatization and deregulation changed the old internal
organization and external relations structures in ways often felt to be painful and forceful
(Zisman and Schwartz 1998; Cornett 1999). The sector of industry (manufacturing),
being a central element in the productive systems of the former regime (Gàcs 2003),

440 Dimitris Kallioras, George Petrakos, Maria Tsiapa
UNIVERSITY OF THESSALY, Department of Planning and Regional Development
has undergone the most pressure (Landesmann 1995; Bevan et al 2001). The
inefficiency of industrial enterprises in the international markets, ramification of their
inefficient management during the former regime (Landesmann and Abel 1995; Bradley
et al 2004), has boosted the levels of unemployment and reduced the levels of real
wages in the EU NMS (Lavigne 1998; Bornhorst and Commander 2004). Yet, the
majority of EU NMS regions experience the restructuring of their industrial bases,
coupling increases in terms of relative industrial productivity (i.e. the ratio of industrial
GDP share to industrial employment share) with decreases in terms of industrial
employment (Diagram 1).
Diagram 1: Relative industrial productivity change (%) and industrial employment
change (%) in the EU NMS regions, Period 1995-2005
INDUSTRIAL EMPLOYMENT GROWTH 1995-2005
3020100-10-20-30-40
RE
LA
TIV
E IN
DU
STR
IAL
PR
OD
UC
TIV
ITY
GR
OW
TH
199
5-20
05
80
60
40
20
0
-20
-40
SK
SI
RO
PL
LV
LT
HU
EE
CZ
BG
BG = Bulgaria, CZ = Czech Rep., EE = Estonia, HU = Hungary, LT = Lithuania, LV = Latvia, PL = Poland, RO = Romania, SI =
Slovenia, SK = Slovakia
Source: EUROSTAT REGIO Database

The Emerging Economic Geography Setting in New European Union Member-States 441
Discussion Paper Series, 2008, 14(23)
In addition to the diminution of industrial activities, during the period 1995-2005, the EU
NMS regions have experienced changes in the composition of industrial activities. The
pattern of structural change reflects the adaptability of the EU NMS regions to the emerging economic conditions (Zielinska-Glebocka 2005).
In an effort to capture the level of structural changes that took place in the EU NMS
regions during the period 1995-2005 the Coefficient of Structural Change (CSC), proposed by Havlik (1995), is estimated. CSC correlates (CORREL ) the shares ( S ) of
each industrial sector i ( ni ,...,2,1 ) to the total industrial activity of region r under
consideration, between an initial (base) year t and a final year kt , under the formula:
),( ,,,,1_, ktirtirnikttr SSCORRELCSC . CSC takes values in the interval [0, 1]. Values
close to 0 (i.e. almost no correlation) indicate that significant structural changes have
taken place during the period under consideration, whereas values close to 1 (i.e.
almost perfect correlation) indicate that almost no structural change has taken place.
The estimation of CSC, in terms of industrial employment, reveals that each EU NMS
region had a different reaction to the pressures of the emerging economic environment,
experiencing its own level of structural adjustment (Diagram 2). While some EU NMS
regions have undergone a more severe degree of structural change, some others have
undergone a modest one.
Diagram 2: Structural changes (CSC; industrial employment) in the EU NMS regions,
Period 1995-2005
CSC 1995-2005
0,500
0,550
0,600
0,650
0,700
0,750
0,800
0,850
0,900
0,950
1,000
BG CZ EE HU LT LV PL RO SI SK
BG = Bulgaria, CZ = Czech Rep., EE = Estonia, HU = Hungary, LT = Lithuania, LV = Latvia, PL = Poland, RO = Romania, SI =
Slovenia, SK = Slovakia
Source: EUROSTAT REGIO Database

442 Dimitris Kallioras, George Petrakos, Maria Tsiapa
UNIVERSITY OF THESSALY, Department of Planning and Regional Development
A further assessment of the nature of the emerging structural patterns in the EU NMS
regions is provided with the estimation of the Index of Dissimilarity in Industrial
Structures (IDIS), proposed by Jackson and Petrakos (2001). IDIS estimates the sum ( ) of the square differences between the shares ( S ) of each industrial sector i
( ni ,...,2,1 ) to the total industrial activity in region r under consideration and in a
benchmark economy b , in a given year t , under the formula:
])[( 2,,
1,,,_ tib
n
itirtbr SSIDIS
. IDIS takes values greater than (or equal to) 0. High
values are associated with high levels of structural dissimilarity, whereas low values are
associated with low levels of structural dissimilarity to a benchmark economy. Increasing
values of IDIS diachronically indicate that the economies under comparison are getting
more dissimilar, whereas decreasing values indicate that the corresponding economies
are getting more similar. In the cases of peripheral and less advanced economies,
increasing structural dissimilarity can be perceived as an indication of a negative
(defensive) structural change, whereas decreasing structural dissimilarity can be
perceived as an indication of a positive (offensive) structural change (Jackson and
Petrakos 2001). Defensive structural changes can be perceived as impulsive reactions
to the conditions and requirements of an emerging economic environment, whereas
offensive structural changes can be perceived as strategic choices (Petrakos and
Kallioras 2007). The estimation of IDIS, in terms of industrial employment, reveals that
the majority of EU NMS regions have increased their deviation from the benchmark
structural pattern of the average EU-15 economy, during the period 1995-2005
(Diagram 3). This indicates that the majority of EU NMS regions have been experiencing
an inter-industry type of economic integration, developing economic structures dissimilar from the respective (and dominant) EU-15 pattern.

The Emerging Economic Geography Setting in New European Union Member-States 443
Discussion Paper Series, 2008, 14(23)
Diagram 3: Structural dissimilarity from the EU-15 pattern (IDIS2005-IDIS1995;
industrial employment) of the EU NMS regions, Period 1995-2005
IDIS CHANGE 1995-2005
-300
-200
-100
0
100
200
300
400
500
600
BG CZ EE HU LT LV PL RO SI SK
BG = Bulgaria, CZ = Czech Rep., EE = Estonia, HU = Hungary, LT = Lithuania, LV = Latvia, PL = Poland, RO = Romania, SI =
Slovenia, SK = Slovakia
Source: EUROSTAT REGIO Database
Severe structural changes in the EU NMS regions with relatively poor performance is an
indication that structural change has, mostly, been an adjustment of a forceful and
defensive nature, imposed by the need for internationalisation and economic integration.
Besides the significant reduction of industrial activity in weak regional economic bases,
it seems that the process of economic integration has also altered significantly the
composition of regional-industrial activity. Weak and vulnerable or monostructure
regions typically lost the greatest part of their industrial base that, being in capital-
intensive sectors, was more exposed to international competition. Structural change and
industrial decline went hand in hand during the pre-accession period in a vicious cycle
that resulted to less output, less employment and loss of existing sectoral
specialisations. Nevertheless, this was not a universal experience in the EU NMS area.
A number of EU NMS regions, especially capital and western border regions of Central
European countries, have done relatively well in terms of industrial performance and
adjustment, benefiting from agglomeration economies, market size and proximity to Western markets (Resmini and Traistaru 2003; Petrakos and Kallioras 2007).

444 Dimitris Kallioras, George Petrakos, Maria Tsiapa
UNIVERSITY OF THESSALY, Department of Planning and Regional Development
4. The Determinants of Regional-Industrial Performance in
the New European Union Member-States
The industrial experience of the EU NMS regions indicates that a multi-directional
relationship among industrial performance, integration, geography and specialization is, currently, taking place.
The unbalanced pattern of regional-industrial development in the EU NMS attests the
spatial selectivity of the process of economic integration. The level of economic
integration can be captured with the estimation of the Index of Industrial Integration (III),
proposed by Petrakos and Kallioras (2007). III is estimated, in a first step, at the
country-sectoral level (since there are no trade data at the regional-sectoral level) as the ratio of the trade transactions ( tr ) of a country k (region r under consideration
belongs to country k ) with a benchmark economy b and the world w , in each
industrial sector i ( ni ,...,2,1 ), in value terms, in a given year t . Then, in a second
step, III is “regionalized” with the use of the respective employment ( e ) location quotient
of region r under consideration (i.e. the ratio of the share of each sector to the regional
and the country industrial employment). Thus, III is estimated under the formula:
)])([(
,
,,
,
,,
1 ,,_
,,_,
tk
tik
tr
tir
n
i tiwk
tibktr
e
ee
e
tr
trIII
, and values greater than (or equal to) 0. High values are
associated with high levels of economic integration, whereas low values are associated
with low levels of economic integration with the benchmark economy. The positive
relation between the level of industrial employment per capita11 and the level of III (the
average EU-15 economy is the benchmark economy) (Diagram 4) implies a two-way
causality. Obviously, the industrially advanced EU NMS regions are the ones enjoying
greater trade relations with the EU-15 countries. These relations are getting stronger, in
an ongoing integration context, with positive (and statistically significant) impact of the level of industrial performance.
11 This relation (and the respective following ones) also holds for industrial GDP per capita.

The Emerging Economic Geography Setting in New European Union Member-States 445
Discussion Paper Series, 2008, 14(23)
Diagram 4: The relationship between the level of industrial employment per capita and
the level of economic integration with the EU-15 countries, Years 1995 and 2005
III 1995
70605040302010
IND
UST
RIA
L EM
PLO
YM
ENT
PER
CA
PITA
199
5
,20
,18
,16
,14
,12
,10
,08
,06
,04
SK
SI
RO
PL
LV
LT
HU
EE
CZ
BG
TOTAL
III 2005
1009080706050403020IN
DU
STR
IAL
EMPL
OY
MEN
T PE
R C
API
TA 2
005
,18
,16
,14
,12
,10
,08
,06
,04
SK
SI
RO
PL
LV
LT
HU
EE
CZ
BG
TOTAL
r = 3,6% (0,801) r = 50,0% (0,000)***
BG = Bulgaria, CZ = Czech Rep., EE = Estonia, HU = Hungary, LT = Lithuania, LV = Latvia, PL = Poland, RO = Romania, SI =
Slovenia, SK = Slovakia
*** statistical at 1% level
Sources: EUROSTAT REGIO Database & EUROSTAT COMEXT Database
The spatial selectivity of the EU economic integration process favors certain types of EU
NMS regions. The relative centrality / peripherality of the EU NMS regions can be
assessed with the use of a Gravity Index, following Harris (1954). Gravity Index
describes geographic position as an increasing function of market size, proxied by the population p of the region r under consideration, and market potential, proxied by the
populations p of the regions of a benchmark economy b , and as a decreasing function
of transactions costs, proxied by the distance12 d between the region r under
consideration and the regions of a benchmark economy b , in a given year t . Gravity
Index takes the formula:
n
b tbr
tbtrtr d
ppGRAV
1 ,_
,,, , and values greater than (or equal to)
0. High values are associated with high levels of market size and/or potential, whereas
low values are associated with respective low levels. The positive relation between
Gravity Index and III (Diagram 5) provides support to theories stressing the importance
12 Distance is estimated between the centroids of the regions. In order to account for the intraregional distance of the region under consideration (i.e. the distance between the centroid of the region under consideration and its boundaries), the square root of the size (in square kilometers) of the region has been weighted by the factor
1
, according to the proposition made by Nitsch (2000).

446 Dimitris Kallioras, George Petrakos, Maria Tsiapa
UNIVERSITY OF THESSALY, Department of Planning and Regional Development
of place and size. The EU NMS regions with relatively favorable geographic position (i.e.
the capital and the western regions border the EU-15 area) gained immediate access to
the large market of the core EU-15 countries, being more integrated with the average
EU-15 economy, with positive impact on the level of industrial performance
(diachronically the relation becomes statistically insignificant). In contrast, the peripheral
position, with respect to the EU-15 market, of many EU NMS regions has operated as
major impediment to industrial performance, at least at the outset of the process of economic integration.
Diagram 5: The relationship between the relative centrality / peripherality and the level
of economic integration with the EU-15 countries, Years 1995 and 2005
GRAVITY INDEX 1995
3002001000
III 1
995
70
60
50
40
30
20
10
SK
SI
RO
PL
LV
LT
HU
EE
CZ
BG
TOTAL
GRAVITY INDEX 2005
3002001000
III 2
005
100
90
80
70
60
50
40
30
20
SK
SI
RO
PL
LV
LT
HU
EE
CZ
BG
TOTAL
r = 27,1% (0,050)** r = 7,4% (0,598)
BG = Bulgaria, CZ = Czech Rep., EE = Estonia, HU = Hungary, LT = Lithuania, LV = Latvia, PL = Poland, RO = Romania, SI =
Slovenia, SK = Slovakia
** statistical at 5% level
Sources: EUROSTAT REGIO Database & EUROSTAT COMEXT Database
The uneven impact of the process of economic integration on regional-industrial
structures has led to a variety of regional-industrial specialization patterns. The level of
regional specialization can be estimated with the use of absolute Theil Index of
specialization, proposed by Theil (1972). Absolute Theil Index takes into account the sum ( ) of the products of the employment shares ( e ) of each industrial sector i
( ni ,...,2,1 ) to the total industrial employment in region r under consideration, and
the natural logarithm of the product of the aforementioned shares and the number ( n )
of industrial sectors, in a given year t . Absolute Theil Index takes the formula:

The Emerging Economic Geography Setting in New European Union Member-States 447
Discussion Paper Series, 2008, 14(23)
n
itirtirtr eneTHEIL
1,,,,, )ln( , and values in the interval [0, ln( n )]. Values close to 0
indicate low levels of regional specialization, whereas values close to ln( n ) indicates
high levels of regional specialization. The negative (and statistically significant) relation
between geography and the level of regional specialization (Diagram 6), reveals that the
EU NMS regions with relatively better geographic position have managed to diversify
their industrial bases, attracting a variety of industrial activities, with positive impact on
industrial development. This finding challenges neoclassical theory, indicating that
variety – and not specialization – is more likely to stimulate a better growth performance
in less advanced regions. A greater diversity in the productive bases of less advanced
regions may result to external scale effects through local input-output relations and may
act as a safeguard against downturns in sectoral demand, and, possible, asymmetric, industry-specific, shocks.
Diagram 6: The relationship between the relative centrality / peripherality and the level
of regional-industrial specialization, Years 1995 and 2005
GRAVITY INDEX 1995
3002001000
ABS
OLU
TE T
HEI
L IN
DEX
199
5
,7
,6
,5
,4
,3
,2
SK
SI
RO
PL
LV
LT
HU
EE
CZ
BG
TOTAL
GRAVITY INDEX 2005
3002001000
ABS
OLU
TE T
HEI
L IN
DEX
200
5
,8
,7
,6
,5
,4
,3
,2
,1
SK
SI
RO
PL
LV
LT
HU
EE
CZ
BG
TOTAL
r = -26,4% (0,056)* r = -24,3% (0,080)*
BG = Bulgaria, CZ = Czech Rep., EE = Estonia, HU = Hungary, LT = Lithuania, LV = Latvia, PL = Poland, RO = Romania, SI =
Slovenia, SK = Slovakia
* statistical at 10% level
Source: EUROSTAT REGIO Database
The emerging different levels of regional-industrial specialization have, consequently,
led to emerging different types of economic integration. The positive (and statistically
significant) relation between the level of regional specialization and the level of structural
448 Dimitris Kallioras, George Petrakos, Maria Tsiapa
UNIVERSITY OF THESSALY, Department of Planning and Regional Development
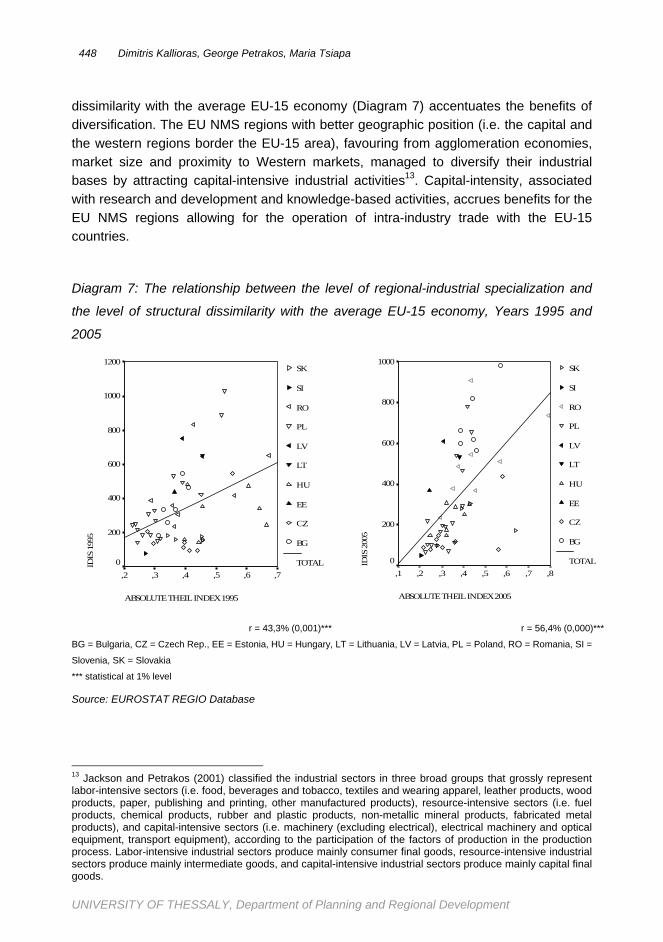
dissimilarity with the average EU-15 economy (Diagram 7) accentuates the benefits of
diversification. The EU NMS regions with better geographic position (i.e. the capital and
the western regions border the EU-15 area), favouring from agglomeration economies,
market size and proximity to Western markets, managed to diversify their industrial
bases by attracting capital-intensive industrial activities13. Capital-intensity, associated
with research and development and knowledge-based activities, accrues benefits for the
EU NMS regions allowing for the operation of intra-industry trade with the EU-15 countries.
Diagram 7: The relationship between the level of regional-industrial specialization and
the level of structural dissimilarity with the average EU-15 economy, Years 1995 and
2005
ABSOLUTE THEIL INDEX 1995
,7,6,5,4,3,2
IDIS
199
5
1200
1000
800
600
400
200
0
SK
SI
RO
PL
LV
LT
HU
EE
CZ
BG
TOTAL
ABSOLUTE THEIL INDEX 2005
,8,7,6,5,4,3,2,1
IDIS
200
51000
800
600
400
200
0
SK
SI
RO
PL
LV
LT
HU
EE
CZ
BG
TOTAL
r = 43,3% (0,001)*** r = 56,4% (0,000)***
BG = Bulgaria, CZ = Czech Rep., EE = Estonia, HU = Hungary, LT = Lithuania, LV = Latvia, PL = Poland, RO = Romania, SI =
Slovenia, SK = Slovakia
*** statistical at 1% level
Source: EUROSTAT REGIO Database
13 Jackson and Petrakos (2001) classified the industrial sectors in three broad groups that grossly represent labor-intensive sectors (i.e. food, beverages and tobacco, textiles and wearing apparel, leather products, wood products, paper, publishing and printing, other manufactured products), resource-intensive sectors (i.e. fuel products, chemical products, rubber and plastic products, non-metallic mineral products, fabricated metal products), and capital-intensive sectors (i.e. machinery (excluding electrical), electrical machinery and optical equipment, transport equipment), according to the participation of the factors of production in the production process. Labor-intensive industrial sectors produce mainly consumer final goods, resource-intensive industrial sectors produce mainly intermediate goods, and capital-intensive industrial sectors produce mainly capital final goods.
The Emerging Economic Geography Setting in New European Union Member-States 449
Discussion Paper Series, 2008, 14(23)
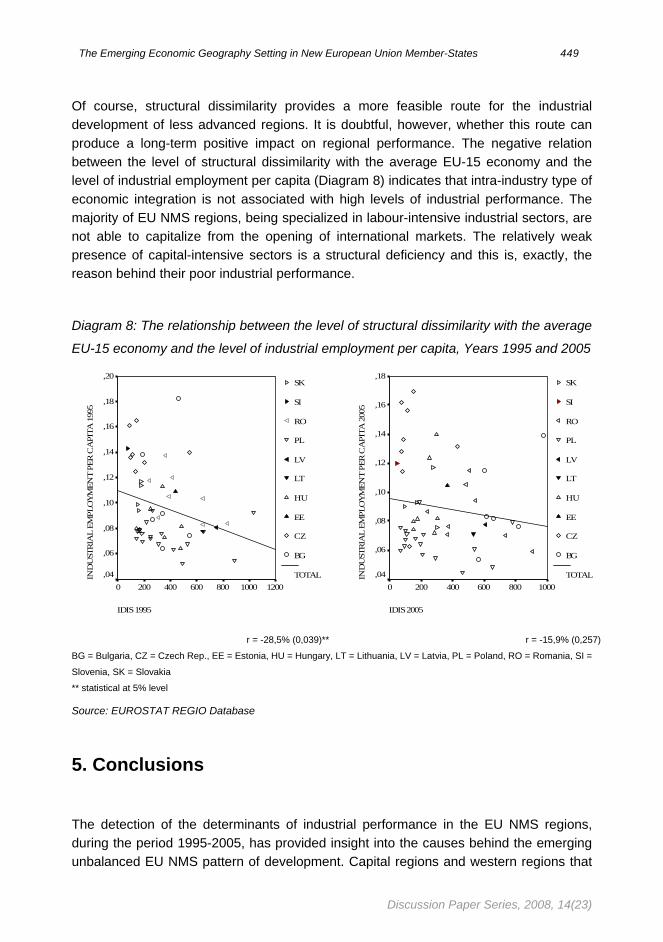
Of course, structural dissimilarity provides a more feasible route for the industrial
development of less advanced regions. It is doubtful, however, whether this route can
produce a long-term positive impact on regional performance. The negative relation
between the level of structural dissimilarity with the average EU-15 economy and the
level of industrial employment per capita (Diagram 8) indicates that intra-industry type of
economic integration is not associated with high levels of industrial performance. The
majority of EU NMS regions, being specialized in labour-intensive industrial sectors, are
not able to capitalize from the opening of international markets. The relatively weak
presence of capital-intensive sectors is a structural deficiency and this is, exactly, the reason behind their poor industrial performance.
Diagram 8: The relationship between the level of structural dissimilarity with the average
EU-15 economy and the level of industrial employment per capita, Years 1995 and 2005
IDIS 1995
120010008006004002000
IND
UST
RIA
L EM
PLO
YM
ENT
PER
CA
PITA
199
5
,20
,18
,16
,14
,12
,10
,08
,06
,04
SK
SI
RO
PL
LV
LT
HU
EE
CZ
BG
TOTAL
IDIS 2005
10008006004002000
IND
UST
RIA
L EM
PLO
YM
ENT
PER
CA
PITA
200
5
,18
,16
,14
,12
,10
,08
,06
,04
SK
SI
RO
PL
LV
LT
HU
EE
CZ
BG
TOTAL
r = -28,5% (0,039)** r = -15,9% (0,257)
BG = Bulgaria, CZ = Czech Rep., EE = Estonia, HU = Hungary, LT = Lithuania, LV = Latvia, PL = Poland, RO = Romania, SI =
Slovenia, SK = Slovakia
** statistical at 5% level
Source: EUROSTAT REGIO Database
5. Conclusions
The detection of the determinants of industrial performance in the EU NMS regions,
during the period 1995-2005, has provided insight into the causes behind the emerging
unbalanced EU NMS pattern of development. Capital regions and western regions that

450 Dimitris Kallioras, George Petrakos, Maria Tsiapa
UNIVERSITY OF THESSALY, Department of Planning and Regional Development
border the EU-15 area seem to be the relative winners since they have managed to
combine a set of positive, structural and geographical initial conditions with market
dynamics. The majority of the EU NMS regions, however, have followed a rather
different path. Endowed with an unfavorable set of initial conditions and being peripheral
in the national and the European setting, these regions have been faced in the new
economic environment with fewer opportunities and more threats. Unable to attract (or
maintain) a critical scale of industrial activities, they have witnessed the collapse of large
parts of their industrial bases, drastically cutting local demand and setting real
restrictions to efforts and policies of indigenous growth.
These results explain earlier findings concerning the evolution of regional inequalities in
the EU NMS area, casting doubts to the neoclassical framework of analysis.
Unavoidably, the attention of the discussion turns to regional policy at the EU level. It
becomes evident that the current balance of market process and policy responses
generates a variety of outcomes that, overall, favor more the competitiveness than the
cohesion pillar of the European policy. A critical reassessment of structural and
cohesion policies may be necessary.
Bibliography
ACEMOGLU D. and ZILIBOTTI F. (1997), Was Prometheus Unbound by Chance? Risk, Diversification and Growth, Journal of Political Economy, 105(4): 709-751
AMITY M. (1999), Specialization Patterns in Europe, Weltwirtschaftliches Archiv, 135: 1-21
BEST M. (1990), The New Competition: Institutions of Industrial Restructuring, Cambridge: Policy Press
BEVAN A., ESTRIN S. and MEYER K. (2001), Institution Building and the Integration of Eastern Europe in International Production, Brighton University Policy Paper, 16
BIDELEUX R. and JEFFRIES I. (1998), A History of Eastern Europe: Crisis and Change, London and New York: Routledge
BORNHORST F. and COMMANDER S. (2004), Regional Unemployment and its Persistence in Transition Countries, IZA Discussion Paper, 1074
BRADLEY J., GÁCS J., KANGUR A. and LUBENETS N. (2005), HERMIN: A Macro Model Framework for the Study of Cohesion and Transition, in BRADLEY J., PETRAKOS G. and TRAISTARU I. (eds), Integration, Growth and Cohesion in the Enlarged European Union, New York: Springer, 207-241
BRÜLHART M. and ELLIOTT R. (1998), Adjustment to the European Single Market: Inferences from Intra-Industry Trade Patterns, Journal of Economic Studies, 25: 225-247
BRÜLHART M. and TORSTENSSON J. (1996), Regional Integration, Scale Economies and Industry Location in the European Union, CEPR Discussion Paper, 1435
CAMAGNI R. (1992), Development Scenarios and Policy Guidelines for the Lagging Regions in the 90s, Regional Studies, 26(4): 361-374
CARLINO G. (1979), Increasing Returns to Scale in Metropolitan Manufacturing, Journal of Regional Science, 19: 363-373
CORNETT A. P. (1999), The Problem of Transition and Reintegration of East and Central Europe: Conceptual Remarks and Empirical Problems, in FISCHER M. M. and NIJKAMP P. (eds), Spatial

The Emerging Economic Geography Setting in New European Union Member-States 451
Discussion Paper Series, 2008, 14(23)
Dynamics of European Integration: Regional and Policy Issues at the Turn of the Century, Berlin: Springer, 255-279
DAIANU D. (1995), Europe under a Double Challenge, in DOBRINSKY R. and LANDESMANN M. (eds), Transforming Economies and European Integration, Aldershot: Edward Elgar, 15-31
EBRD (2001), Transition Report, London: EBRD
EUROSTAT REGIO Database, Economic and Social Data
EUROSTAT COMEXT Database, Foreign Trade Data
FELDMAN M. P. (2000), Location and Innovation: The New Economic Geography of Innovation, Spillovers and Agglomerations, in CLARK G. L., FELDMAN M. P. and GERTLER M. S. (eds), The Oxford Handbook of Economic Geography, Oxford: Oxford University Press, 373-394
FUJITA M. (1993), Monopolistic Competition and Urban Systems, European Economic Review, 37: 308-315
GÀCS J. (2003), Structural Change and Catching Up: The Experience of the Ten Candidate Countries, in TUMPEL-GUGERELL G. and MOOSLEICHNER P. (eds), Economic Convergence and Divergence in Europe: Growth and Regional Development in Enlarged European Union, Aldershot: Edward Elgar, 131-167
HARE P. (1997), The Distance between Eastern Europe and Brussels: Reform Deficits in Potential Member-States, in SIEBERT H. (ed), Quo Vadis Europe? Tübingen: J. C. B. Möhr, 127–145
HARRIS C. (1954), The Market as a Factor in the Localization of Industry in the United States, Annals of the Association of American Geographers, 64: 315-348
HAVLIK P. (1995), Trade Reorientation and Competitiveness in CEECs, in DOBRINSKY R. and LANDESMANN M. (eds), Transforming Economies and European Integration, Aldershot: Edward Elgar, 141-162
HELPMAN E. and KRUGMAN P. R. (1985), Market Structure and Foreign Trade, Cambridge Mass.: MIT Press
JACKSON M. and PETRAKOS G. (2001), Industrial Performance under Transition: The Impact of Structure and Geography, in PETRAKOS G. and TOTEV S. (eds), The Development of the Balkan Region, Aldershot: Ashgate, 141-174
KRIEGER-BODEN C. (2000), Globalization, Integration and Regional Specialization, HWWA Working Paper, 1009
KRUGMAN P. R. (1979), Increasing Returns, Monopolistic Competition and International Trade, Journal of International Economics, 9: 469-479
KRUGMAN P. R. (1991), Increasing Returns and Economic Geography, Journal of Political Economy, 99: 183-199
LANDESMANN M. (1995), The Patterns of East – West European Integration: Catching Up or Falling Behind? in DOBRINSKY R. and LANDESMANN M. (eds), Transforming Economies and European Integration, Aldershot: Edward Elgar, 116–140
LANDESMANN M. and ABEL I. (1995), Industrial Policy in Transition, in LANDESMANN M. and SZÉKELY I. P. (eds), Industrial Restructuring and Trade Reorientation in Eastern Europe, Cambridge: Cambridge University Press, 313-336
LAVIGNE M. (1998), Conditions for Accession to the EU, Comparative Economic Studies, 40: 38-57
LUCAS R. (1988), On the Mechanics of Economic Development, Journal of Monetary Economics, 22(1): 3-42
MOOMAW R. L. (1981), Productivity and City Size, Quarterly Journal of Economics, 96: 675-688
MORGENROTH E. and PETRAKOS G. (2008), Structural Change and Regional Policy: Concluding Remarks, in KRIEGER-BODEN C. MORGENROTH E. and PETRAKOS G. (eds), The Impact of European Integration on Regional Structural Change and Cohesion, London: Routledge, 266-284
MYRDAL G. (1957), Economic Theory and Underdeveloped Regions, London: Hutchinson

452 Dimitris Kallioras, George Petrakos, Maria Tsiapa
UNIVERSITY OF THESSALY, Department of Planning and Regional Development
NIEBUHR A. (2004), Spatial Effects of European Integration: Do Border Regions Benefit Above Average? HWWA Discussion Paper, 307
NIEBUHR A. and STILLER S. (2002), Integration Effects in Border Regions: A Survey of Economic Theory and Empirical Studies, HWWA Discussion Paper, 179
NITSCH V. (2000), National Borders and International Trade: Evidence from the European Union, Canadian Journal of Economics, 33(4): 1091-1105
NORTH D. C. (1955), Location Theory and Regional Economic Growth, Journal of Political Economy, 63: 243-258
OHNO T. and MITO S. (1988), Just-in-Time for Today and Tomorrow, Cambridge MA: Productivity Press
PACI R. and USAI S. (2000), Technological Enclaves and Industrial Districts: An Analysis of the Regional Distribution of Innovative Activity in Europe, Regional Studies, 34(2): 97-114
PERROUX F. (1955), Note on the Concept of Growth Poles, Economie Appliquee, 7: 307-320, (in French)
PETRAKOS G. (2000), The Spatial Impact of East-West Integration in Europe, in PETRAKOS G., MAIER G. and GORZELAK G. (eds), Integration and Transition in Europe, London: Routledge, 38-68
PETRAKOS G. (2001), Patterns of Regional Inequality in Transition Economics, European Planning Studies, 9(3): 359–383
PETRAKOS G. (2008), Regional Inequalities in Europe: Reflections on Evidence, Theory and Policy, Town Planning Review, (forthcoming)
PETRAKOS G. and CHRISTODOULAKIS N. (2000), Greece and the Balkans: The Challenge of Integration, in PETRAKOS G., MAIER G. and GORZELAK G. (eds), Integration and Transition in Europe: The Economic Geography of Interaction, London: Routledge, 269-294
PETRAKOS G. and KALLIORAS D. (2007), Integration and Structural Change: Pre-Accession Experience in the Regions of the EU New Member-States, in GETIMIS P. and KAFKALAS G. (eds), Overcoming Fragmentation in Southeast Europe: Spatial Development Trends and Integration Potential, Aldershot: Ashgate, 39-73
PETRAKOS G., MAIER G. and GORZELAK G (2000), The New Economic Geography of Europe, in PETRAKOS G., MAIER G. and GORZELAK G. (eds), Integration and Transition in Europe: The Economic Geography of Interaction, London: Routledge, 1-37
PETRAKOS G., PSYCHARIS Y. and KALLIORAS D. (2004), Regional Inequalities in the EU New Member-States: Evolution and Challenges, in BRADLEY J., PETRAKOS G. and TRAISTARU I (eds), The Economics and Policy of Cohesion in an Enlarged European Union, New York: Springer, 45-64
RESMINI L. and TRAISTARU I. (2003), Spatial Implications of Economic Integration in EU Accession Countries, in TRAISTARU I., NIJKAMP P. and RESMINI L. (eds), The Emerging Economic Geography in EU Accession Countries, Aldershot: Ashgate, 3-24
ROMER P. (1986), Increasing Returns and Long-Run Growth, Journal of Political Economy, 94(5): 1002-1037
RÖMISCH R. (2003), Regional Disparities within Accession Countries, in TUMPEL-GUGERELL G. and MOOSLECHNER P. (eds), Economic Convergence and Divergence in Europe: Growth and Regional Development in an Enlarged Europe, Aldershot: Edward Elgar, 183-208
ROSENSTEIN-RODAN P. (1943), Problems of Industrialization of Eastern and Southeastern Europe, Economic Journal, 53: 203-211
ROSTOWSKI J. (1997), Comparing Two Great Depressions: 1929-33 to 1989-93, in ZECCHINI S. (ed), Lessons from the Economic Transition: Central and Eastern Europe in the 1990s, Dordrecht: Kluwer, 225-239
RUFFIN R. (1999), The Nature and Significance of Intra-Industry Trade, Economic and Financial Review, 4: 1-8
SALVATORE D. (2001), The Problems of Transition, EU Enlargement and Globalization, Empirica, 28: 137-157

The Emerging Economic Geography Setting in New European Union Member-States 453
Discussion Paper Series, 2008, 14(23)
SEGAL D. (1976), Are There Returns of Scale in City Size? Review of Economics and Statistics, 89: 393-413
SOLOW R. (1956), A Contribution to the Theory of Economic Growth, Quarterly Journal of Economics, 70: 65-94
SVENJAR J. (2002), Transition Economies: Performance and Challenges, Journal of Economic Perspectives, 16(1): 3-28
SWAN T. (1956), Economic Growth and Capital Accumulation, Economic Record, 32: 334-361
THEIL H. (1972), Statistical Decomposition Analysis with Applications in the Social and Administrative Sciences, Amsterdam: North-Holland
THIRKELL J. E. M., PETKOV K. and VICKERSTAFF S. A. (1998), The Transformations of Labor Relations: Restructuring and Privatization in Eastern Europe and Russia, Oxford: Oxford University Press
TIEBOUT C. M. (1956), Exports and Regional Economic Growth, Journal of Political Economy, 64: 160-164
TOPALOGLOU L., KALLIORAS D., MANETOS P. and PETRAKOS G. (2005), Towards a Border Regions Typology in the Enlarged EU, Journal of Borderland Studies, 20(2): 67-89
WEINHOLD D. and RAUCH J. E. (1999), Openness, Specialization and Productivity Growth in Less Developed Countries, Canadian Journal of Economics, 32(4): 1009-1027
ZIELINSKA-GLEBOCKA A. (2005), Adaptability of Polish Manufacturing in the Face of EU Accession, South Eastern Europe Journal of Economics, 1: 97-120
ZISMAN J. and SCHWARTZ A. (1998), Reunifying Region in an Emerging World Economy: Economic Heterogeneity, New Industrial Options and Political Choices, Journal of Common Market Studies, 36(3): 405-429
ZLOCH-CHRISTY I. (1998), Eastern Europe and the World Economy: Challenges of Transition and Globalization, Cheltenham: Edward Elgar


