Embed Size (px)
Citation preview
An Industrial Strategy for
the Electrical Distribution Equipment and the
Professional Electronics Sectors
Richard Goode
ARCHIV 113601
jy Project
IDRC Li!,. I
AN INDUSTRIAL S TRA TEG Y FOR THE ELECTRICAL
DISTRIBUTION EQUIPMENT AND
THE PROFESSIONAL ELECTRONICS SECTORS
Richard Goode
Industrial Strategy Project Development Policy Research Unit
School of Economics University of Cape Town
1995 '1 (<Y!!
UCT PRESS
UCT Press (Pty) Ltd University of Cape Town
Private Bag Rondebosch
7700 South Africa
All rights are reserved. No part of this publication may be reproduced, stored in a retrieval system, or transmitted in any form or by any means, electronic, mechanical, photocopying, recording or otherwise, without prior permission of the publisher.
Cover illustration: Taken from Gavin Young's sculpture, "Hoerrikwagga", standing near Jameson Hall on the University of Cape Town campus.
Typesetting: Hayley Viljoen Cover design: Karren Visser
Printed and bound by Credit Press
Copyright: Industrial Strategy Project First published: 1995 ISBN: 0-7992-1581-3
EDITORIAL COMMENT
This report is one of a series produced by the Industrial Strategy Project.
The ISP has its origins in the Economic Trends Research Group, a collective of economists and other social scientists convened by the Congress of South African Trade Unions in 1986. COSATU, under attack for its support for sanctions, initially asked these researchers to examine the impact of enforced isolation on the South African economy. It soon became clear that sanctions were a small aspect of the problems besetting the South African economy, and the work of the Economic Trends Research Group expanded into a full-blown analysis of South Africa's economic crisis.
The poor performance of South Africa's manufacturing sector loomed large in the litany of problems bedeviling the South African economy. The 1980s had been, in economic terms, something of a lost decade. The manufacturing sector was particularly conspicuous by its inability to create jobs, and to produce commodities that satisfied the divergent requirements of the domestic and international markets. A range of factors contributed to this malaise — apartheid's impact on the skills profile of the workforce, repressive and outmoded industrial relations systems and work organisation, a highly concentrated industrial structure and a concomitantly weak and repressed SME and micro-enterprise sector, and a highly inward oriented trade regime, were the most obvious sources of the crisis in manufacturing.
However, the solutions were less obvious than the problems, and in 1990, again at COSATU's initiation, the ISP was conceived. From the outset, the political environment ensured that the ISP would not be an ordinary research project. The unbanning of the ANC and the certainty of the immediate accession to power of COSATU's political ally, coupled with the union federation's increasingly direct role in policy formulation, ensured that the ISP focus closely on policy, contributing to the development of the industrial policy that would address the poor performance of South African manufacturing.
To this end, the ISP engaged a range of researchers with the purpose of undertaking detailed examinations of the key sub-sectors of South African manufacturing. The fruits of the ISP are to be found in the reports, such as this one, most of which are to be published by the UCT Press. The authors of the reports were assigned, generally for a period of 14 months, to the study of a particular sector. The researchers were required to study the local sector and the factors promoting and restraining its development. They were required to assess its prospects in the light of the likely global trajectory of the industry. Detailed examination of local firms were complemented by international visits that enabled the researchers to consult with international experts and visit factories to enable them to situate South African firms in a comparative perspective.
In addition to the sectoral studies, the ISP also engaged researchers to examine key cross- cutting issues. Those selected for study were human resource development and industrial relations, technology development, market and ownership structures, trade performance and policies, and regional industrial strategies.

Industrial policy is not a pian easily contained between the covers of a single document. It is a process, a process of engagement between the key industrial stakeholders. South Africa's peculiar transition has given concrete expression to this credo, with, the tripartite National Economic Forum and the various sectoral task groups the key institutions and processes within which an evolving industrial policy is being developed. COSATU has played the leading role in this process. The ISP has, in turn, made a significant contribution to COSATU's capacities. It has done this by constant dialogue between the ISP and the COSATU leadership, and by a traineeship programme which saw a number of union leaders seconded to the ISP for its duration.
In addition the research process has engaged a range of key actors. Individual researchers have engaged with union and business leaders and experts within government. The ISP was punctuated by a series of intensive workshop attended by the researchers, COSATU and ANC leaders, and other local and international experts. The work-in-progress was thoroughly discussed and critiqued at these workshops and it is appropriate to see each report as owing a great deal to the ISP collective.
A number of researchers are continuing their work from within the industry task forces, the unions, and the structures of the new government. The ISP itself is moving into a second phase, taking up questions still unanswered, re-examining conclusions of the first phase and continuing the unending process of developing industrial policy. It is in this spirit that these reports should be read: they are not final plans, but simply attempts to start a vital process, one that will of necessity be taken forward by all of the major industry participants.
The Industrial Strategy Project was funded by generous grants from the Humanistisch Instituut Voor Ontwikkelingssamenwerking (HIVOS) of The Netherlands, the International Development Research Centre (IDRC), Ottawa, Canada, and the Olof Palme International Centre of Sweden. We benefitted not only from the financial resources of these institutions, but also from the wide-ranging experience of their staff members and their deep and abiding commitment to a democratic and prosperous South Africa.
Avril Joffe David Kaplan David Lewis Raphael Kaplinsky
ISP Co-Directors Development Policy Research Unit University of Cape Town
FOREWORD
In the late eighties COSATIJ commissioned a group of economists to prepare a report analysing the impact of sanctions on the South African economy. We commissioned this work in response to criticism in the media and elsewhere that held us — through our support for sanctions — responsible for the sorry state of the South African economy, including the miserable conditions of our members and others whose interests and aspirations we represented.
The research revealed that the crisis of the South African economy was rooted in the policies of the apartheid era and our commission to the economists was transformed into a full-scale critique of the economics of apartheid. A key consequence of the failures of apartheid's social and economic policies was its unproductive manufacturing sector. It was unable to produce basic goods of a suitable quality and at an affordable price; it was unable to produce goods that successfully penetrated international markets; it relied on low paid, poorly trained workers, and harsh, authoritarian shop floor supervision; above all, it proved incapable of generating desperately needed employment. While manufacturing's contribution to the global economy escalated, South Africa relied increasingly on its natural resource base and the cheap labour that mined and farmed it.
Appreciation of these problems inspired COSATU to request its research collective to undertake research in support of our attempt to formulate a new industrial policy. This request flowered into the Industrial Strategy Project whose output is represented in these reports.
The research process has been characterised by considerable dialogue between COSATU, its affiliates and the researchers. We have learnt much from this interaction; we are confident that we have taught the researchers much. However this work is the output of an independent research collective. As is to be expected in an arms length relationship of this kind, we do not agree with every line of each report, we do not accept every recommendation. But with regard to its major findings, we do agree that there is a real potential for building an efficient manufacturing base, rooted in well paid, productive workers. Above all we believe, and this is endorsed by the ISP, that an independent trade union movement actively and aggressively pursuing its interests is not merely compatible with rapid and sustainable industrial development - it is a precondition.
,p4 John Gomomo President, Congress of South African Trade Unions

Acknowledgments
Many people helped to produce this report. My thanks are due to numerous industry executives and trade unionists who provided much of the information these two studies are based upon, not all of who are acknowledged in the references. Colleagues in the Industrial Strategy Project and researchers consulted abroad have been of great assistance. Anna Trapido and Thicket Goode deserve special mention for their support during the project.
Preface
Two loosely related parts of the electrical engineering industry are examined in this book. Electrical distribution equipment was selected for study as an industry that plays a major role in the meeting of basic needs, one key objective of industrial strategy. Electrification is a key objective of the Reconstruction and Development Program the now democratic South Africa is committed to. Professional electronics was selected for study in recognition of the critical role that electronics technology plays in raising productivity and promoting competitiveness, another key objective of industrial strategy. Whilst these two industries are quite distinct, they share many of the same problems and consequently there are similarities in the policies proposed for each.
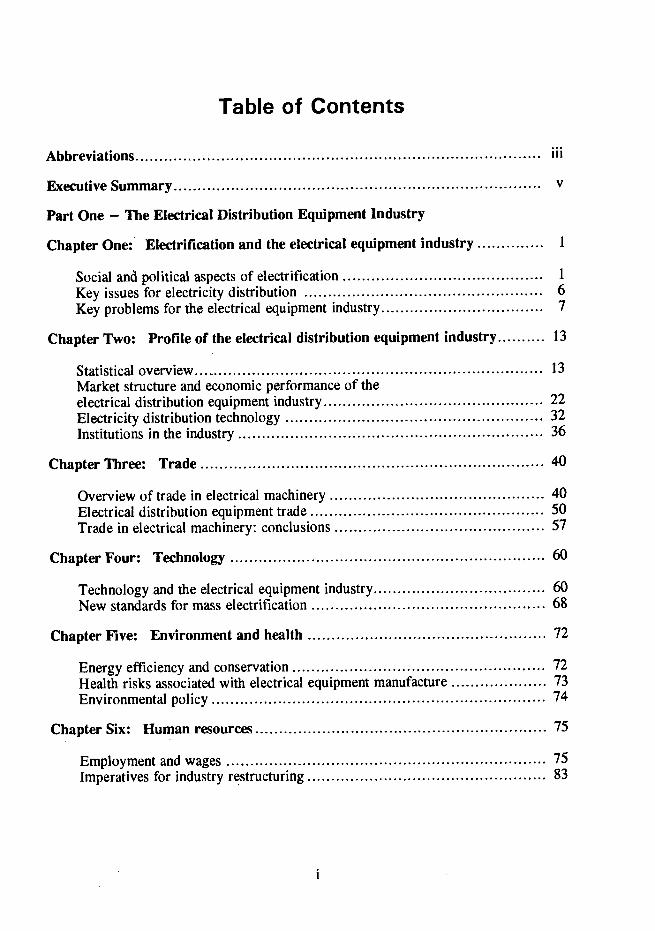
Table of Contents
Abbreviations
Executive Summary V
Part One — The Electrical Distribution Equipment Industry
Chapter One: Electrification and the electrical equipment industry 1
Social and political aspects of electrification 1
Key issues for electricity distribution 6
Key problems for the electrical equipment industry 7
Chapter Two: Profile of the electrical distribution equipment industry 13
Statistical overview 13
Market structure and economic performance of the electrical distribution equipment industry 22
Electricity distribution technology 32 Institutions in the industry 36
Chapter Three: Trade 40
Overview of trade in electrical machinery 40 Electrical distribution equipment trade 50 Trade in electrical machinery: conclusions 57
Chapter Four: Technology 60
Technology and the electrical equipment industry 60 New standards for mass electrification 68
Chapter Five: Environment and health 72
Energy efficiency and conservation 72 Health risks associated with electrical equipment manufacture 73 Environmental policy 74
Chapter Six: Human resources 75
Employment and wages 75
Imperatives for industry restructuring 83
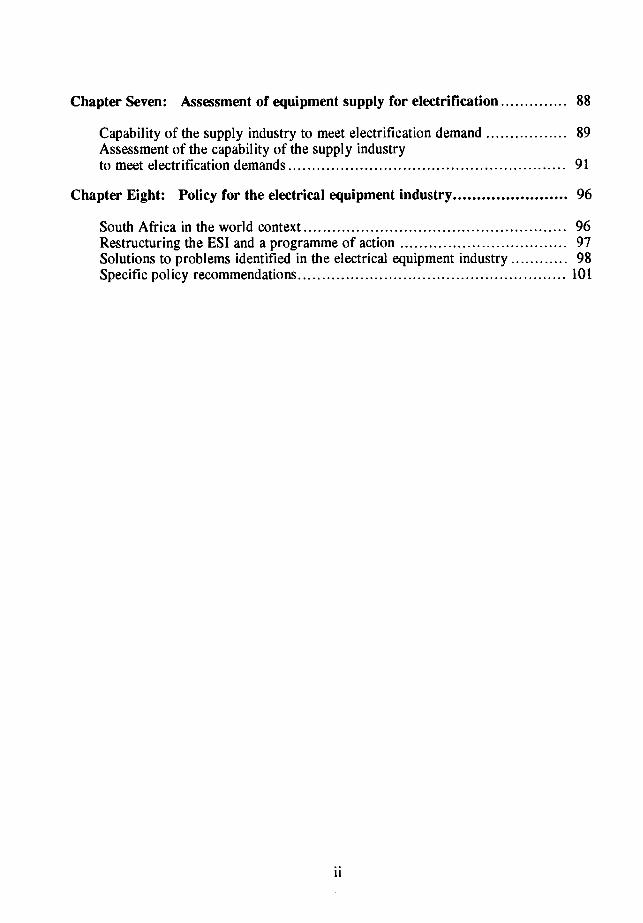
Chapter Seven: Assessment of equipment supply for electrification 88
Capability of the supply industry to meet electrification demand 89 Assessment of the capability of the supply industry to meet electrification demands 91
Chapter Eight: Policy for the electrical equipment industry 96
South Africa in the world context 96 Restructuring the ESI and a programme of action 97 Solutions to problems identified in the electrical equipment industry 98 Specific policy recommendations 101
11
Abbreviations
ABC Aerial Bundle Conductor ADEC Association of Distributors of Electronic Components AECM Association of Electric Cable Manufactures AEMU Association of Municipal Electrical Undertakings ANC African National Congress ANSI American National Standards Institute AS&TS Associated Scientific and Technical Societies of South Africa ASICS Application Specific Integrated Circuits BEC Budget Energy Controllers BLA Black Local Authority BMI Bureau of Market Intelligence BYE Board of Trade and Industry CAD Computer Aided Design CCMA Covered Conductor Manufacturers Association CEAS Central Economic Advisory Service CFC Chloroflurocarbon COMOS Complementary Metal Oxide Semiconductor COSATU Congress of South African Trade Unions CSIR Council for Scientific and Industrial Research CSP Completely Self-Protected transformer CSS Central Statistical Services DYE Department of Trade and Industries ECMA Electronic Component Manufacturers Association EDA Electronic Design Automation EDP Electronic Data Processing ElF Electronics Industries Federation EMAS Export Marketing Assistance Scheme EPI Electric Products International ES! Electrical Supply Industry FPGA Floating Point Gate Array FRD Foundation for Research and Development GATT General Agreement on Tariffs and Trade GElS General Export Incentive Scheme ICDC Integrated Circuit Design Center IDC Industrial Development Corporation IEC International E1eclrotechnical Commission TEE Institute of Electrical Engineers IEEE Institute of Electrical and Electronic Engineers
111
ILO International Labour Organisation IMF International Metalworkers Federation ISE Innovation Support for Electronics ISIC International Standard Industrial Classification ISO International Standards Organisation ISP Industrial Strategy Project JCSS Joint Council of Scientific Societies LME London Metal Exchange MC Methyl Chloroform MEWUSA Metal and Electrical Workers Union of South Africa MNC Multi National Corporations NACTU National Council of Trade Unions NRS National Rationalisation of Specifications Project NUMSA National Union of Metal Workers of South Africa OEM Original Equipment Manufacture PCB Polychiorinated biphenyls (Electrical equipment) PCB Printed Circuit Board (electronics equipment) PLD Programmable Logic Devices SAACE South African Association of Consulting Engineers SABS South African Bureau of Standards SAEWA South African Electrical Workers Association SAIEE South African Institute of Electrical Engineers SAIETh South African Institute of Electrical Technician Engineers SAIMC South African Institute of Measurement and Control SAMES South African Micro Electronics Systems SAVI South African Engineering Association SEIFSA Steel and Engineering Industries Federation of South Africa SET Science, Engineering and Technology SME Small Manufacturing Enterprises SMT Surface Mount Technology SAPT South African Posts and Telecommunications TNC Trans-National Corporation
iv
Executive Summary
The electrical distribution equipment industry A mass electrification programme for South Africa has the potential to bring considerable social, economic, and environmental benefits to the thirty million people currently without access to electricity. It has been argued that electrification represents one part of a new growth path for the South African economy that would meet basic needs, and simultaneously contribute to revitalising the manufacturing sector. An assessment of the capacity of the electrical distribution equipment industry to meet potential demand is presented in this report and is translated into industrial policy for the sector. The results reveal that the electrical distribution equipment industry is fully capable of supplying a mass electrification programme.
Obstacles to full electrification are primarily political. At the time writing in 1992, slow progress towards democracy made this acutely so. The country's generation authority Eskom has both the generation and transmission infrastructure required, however, the institutional structure of the electrical supply industry is fragmented and incapable in its current form of implementing an electrification programme. Institutional restructuring of the electrical supply industry is a prerequisite for financing and implementing a large scale electrification programme.
Efforts, primarily by Eskom, to electrify a target of three million households have begun. A mass electrification programme would involve making more than eight million new connections over a twenty year period.
The electrical distribution equipment industry is currently constrained with respect to lack of investment, fragmentation of demand, lack of standards, lack of scale economies, high raw material costs, and the low skill levels of workers. It also has a poor export performance.
This study considered foreign exchange requirements, supply bottle-necks, production inefficiencies and the potential for job creation in the equipment industry in the context of a mass electrification programme. In that context five themes are examined: the potential for stimulating the equipment industry, the implications of guiding the industry through demand, company responses in the face of expanding demand — either to engage in monopoly pricing or expand output. the need for far reaching productivity enhancement and export markets potential.
In order to build a profile of the electrical distribution equipment industry, this study is located within the broader context of the electrical machinery industry and within the
V
structure of the market for that equipment. Significant under use of productive capacity exists. The reticulation equipment market for 1992 is estimated to be R450 million, that is equal to 5% of total electrical machinery equipment sales for 1991. The market for key equipment is oligopolistic.
Trade union organisation in the industry is high. Together with professional, trade and scientific bodies unions are capable of implementing an industrial strategy to obtain the maximum social benefits from an electrification programme.
South African electrical equipment firms have a domestic orientation. Trade in electrical machinery shows import penetration to be low and exports from the sector limited, factors ascribed to the trade regime and a dependence on foreign technology. Recently exports have shown improvement but latest figures suggest that this revival may have been short lived. Imports offer a means to overcome supply bottle-necks, should these occur. Policy proposed for the sector is a phased reduction in protective tariffs for the most highly protected sectors of distribution transformers, domestic circuit breakers and insulated cable.
Low cost electrification presents technical challenges. Local finns are heavily dependent on foreign technology, however, new standards and methods are being developed in the low cost reticulation field which, if properly channelled, provide an avenue for indigenous technology development. Environmental risks posed by the use of hazardous substances call for phasing out dangerous chemicals and monitoring the results.
An examination of the human resource requirements of the electrical distribution equipment industry indicates that sufficient skills are available and expanded output should not be hampered by labour shortages. An international comparison of transformer manufacturing shows the need for substantial improvements to be made in increasing productivity. Aspects of the current structure of production, such as adversarial industrial relations and stifling workers creativity, is an obstacle to increasing productivity and points to the need for comprehensive restructuring.
A detailed analysis of the supply capacity of the equipment industry shows that it is fully able to meet the demands of a large scale electrification programme without experiencing bottle-necks or generating a large foreign exchange bill. There are no significant supply problems for equipment, with the exception of concrete poles, which may be substituted. Existing capacity is such that the rate of new connections could rise to 700 000 per annum without requiring firms to invest in new capital equipment. First order foreign exchange leaks are estimated to be in the region of 22 percent. Job creation within the equipment industry will not be large, as a doubling of output is estimated to add only a further 4000 jobs to the 21 000 people at present employed in the industry. Mass electrification will not on its own revitalise the metal sector.
An industrial policy for the electrical distribution equipment industry requires harassing the ample capacity of the industry to the needs of electrification through articulating with the prevailing market forces. The primary requirement for a successful industrial policy for this sector is the creation of an suitable institutional environment, in short, the restructuring of the electrical supply industry. This would provide the basis for the second
vi

essential requirement, the formulation of a comprehensive plan for electrification by all major stakeholders. Specific areas for action are as follows:
• Investment will be required to upgrade existing plant, although, in the short term, this is not a requirement for increased output. Clear electrification targets will provide signals to firms and allow them to formulate their investment strategies accordingly.
• Currently fragmented demand from varying standards can be eliminated by rationalisation and standardisation agreements and implemented via coordinated purchasing, which will also contribute to solving scale problems.
• High raw material cost requires interventions by fabricators or the state in the upstream raw materials chain to increase competition or to provide subsidies to down stream users linked to a simultaneous restructuring of the raw materials pipeline.
• Upgrading of the skills level of the workforce is required as an integral part of the restructuring needed to raise productivity. Given the existence of a range of capable institutions, joint agreement on a restructuring programme would have a high potential for success.
• Modifications to the trade regime are proposed to increase competitive pressure on firms. Attention to resolving the problems of high raw material costs and technology development efforts to create appropriate solutions will indirectly strengthen the local industries ability to export.
• The identification of equipment needs and timeous action to prevent bottle-necks occurring would be facilitated by close liaison between the national electrification coordinating body and manufacturers. It is recommended that a representative body for equipment manufacturers be formed.
• Control over possible rent seeking could be achieved through coordinated purchasing and, if necessary, selective importing.
• Job creation within the equipment industry appears to be limited. Potential for more labour intensive aspects of production needs to be further investigated.
• Measures to eliminate environmentally harmful substances are required.
The report concludes that the electrical distribution equipment industry has the capacity and institutions to meet the requirements for mass electrification. With appropriate restructuring the industry has the potential to provide competitively priced equipment to the local and export market.
VII

Part One
The Electrical Distribution Equipment Industry
Chapter One: Electrification and the electrical equipment industry
Electrification, along with housing, is a major focus of social infrastructure development programmes in South Africa. In the provision of a basic need for energy, electrification simultaneously has the potential to stimulate the electrical engineering industry and to create wider demand for consumer durables, thus it has been identified as a key element for an economic growth path. The capacity of local industry to provide the material requisites for mass electrification is the central theme of this report. In an effort to craft an industrial strategy for the electrical distribution equipment industry, the method employed in this report is to identify the problems posed by electrification and to specify solutions cast in terms of the available resources and capacities. In order to appreciate the broader context of electrification, this chapter will outline the major issues posed by widening access to electricity and then proceed to examine specific problems posed for the electrical distribution equipment supply industry.
Social and political aspects of electrification In order for the electrical equipment industry to take off in South Africa, a number of obstacles to electrification must be overcome. Central to any critique of the industry in South Africa is the lack of a coherent strategy, at the time of writing, to implement a mass electrification programme. It is evident that the elements of the Electrical Supply Industry, (ESI), are in place for wide spread electrification, however they are not yet properly harnessed to that end.
Social benefits of electrification
Approximately two thirds of the South African population has no access to household electricity. Access to electricity has a significant potential to improve peoples' standards of living; both in its primary effect of replacing other household fuel sources and in its potential secondary effects of facilitating economic enterprises in the home.
Electrification benefits households because it is lower in cost per unit than alternative fuels. When used carefully, with energy efficient appliances, considerable savings may be made. However, this must be seen in the context of new electricity consumers who, as a result of unfamiliarity, may use more electricity than they need; for example, leaving a light on whereas before they would have blown out a candle. Access to electricity brings with it the benefits of improved lighting for security and studying at night, improved hygiene, health and safety provision in terms of cooking and refrigerating facilities, improving access to hot water and by removing the reliance on dangerous, polluting fuels such as gas, paraffin and coal. Together these fuels account for health hazards ranging
2 INDUSTRIAL STRATEGY PROJECT
from child poisoning to respiratory diseases and fires. Electricity also opens greater access to entertainment and education from radio and television. In peri-urban and rural areas the deforestation and resultant environmental degradation caused by people's need for fire wood is an additional incentive to electrify. Electricity is thus critical for raising living standards, and international research shows people are prepared to pay a price to get it. A USAID study of four countries concluded 'Generally, people wanted electricity, valued it highly, and were willing to sacrifice to get it' (Dingly, 1990).
Since most domestic work, including fuel collecting, is done by women, the convenience and ready access afforded by electricity benefits women in particular.
Economic stimulus and employment creation
The role of electrification in revitalising the South African economy has been advocated by the African National Congress (ANC) and Congress of South African Trade Unions (COSATIJ). 'We believe that the future approach to electricity distribution should be linked to a new macro-economic growth. We need to restructure the economy, restructure industry, and institute a basic needs approach' (Manuel, 1992:6).
From an accelerated electrification programme employment will be generated in each successive interlinked phase. The industries principally affected will be the electrical contracting and consulting industry required to design, build, and commission new reticulation systems; the electrical engineering industry which will provide the inputs into new networks and the ES! itself, involved in the generation, transmission, maintenance and administration of networks and the electrical appliance industry expanding to service the needs of new consumers.
While an electrification programme will have a domestic focus, its impact on the balance of payments cannot be ignored. There are four areas to consider. First, the extensive foreign borrowings that have been undertaken to finance Eskoms' past capital development programme and constitutes the largest single share of the countries foreign debt at US $3 billion (Bond, 1992). Secondly, the extent to which foreign financing may be employed in an electrification programme, thirdly, the foreign exchange requirements of the electrical engineering industry and the impact that an expanded output will have on the industries requirements. Finally, the impact of an expansion of the demand for electrical appliances and consumer electronics, given the high import content of the latter industry in particular. Attention will be given to the foreign exchange implications for the electrical engineering industry in this report, other areas are merely noted here; being peripheral to the main focus.
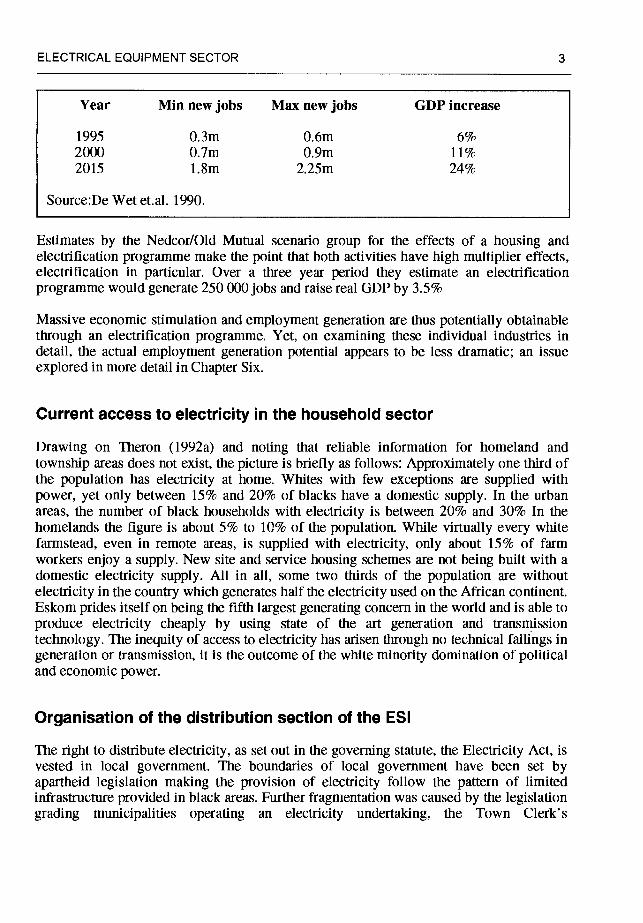
Research to date attempting to detail and quantify the economic impact of a widespread electrification programme has produced the following broad picture. Based on the assumption that 7.5 million urban homes be electrified over 25 years, a study commissioned by Eskom made the following projections using an input output model.
ELECTRICAL EQUIPMENT SECTOR 3
Year Mm new jobs Max new jobs GDP increase
1995 0.3m 0.6m 6% 2000 0.7m 0.9m 11% 2015 1.8m 2.25m 24%
Source:De Wet et.al. 1990.
Estimates by the Nedcor/Old Mutual scenario group for the effects of a housing and electrification programme make the point that both activities have high multiplier effects, electrification in particular. Over a three year period they estimate an electrification programme would generate 250 000 jobs and raise real GDP by 3.5%
Massive economic stimulation and employment generation are thus potentially obtainable through an electrification programme. Yet, on examining these individual industries in detail, the actual employment generation potential appears to be less dramatic; an issue explored in more detail in Chapter Six.
Current access to electricity in the household sector
Drawing on Theron (1992a) and noting that reliable information for homeland and township areas does not exist, the picture is briefly as follows: Approximately one third of the population has electricity at home. Whites with few exceptions are supplied with power, yet only between 15% and 20% of blacks have a domestic supply. In the urban areas, the number of black households with electricity is between 20% and 30% In the homelands the figure is about 5% to 10% of the population. While virtually every white farmstead, even in remote areas, is supplied with electricity, only about 15% of farm workers enjoy a supply. New site and service housing schemes are not being built with a domestic electricity supply. All in all, some two thirds of the population are without electricity in the country which generates half the electricity used on the African continent. Eskom prides itself on being the fifth largest generating concern in the world and is able to produce electricity cheaply by using state of the art generation and transmission technology. The inequity of access to electricity has arisen through no technical failings in generation or transmission, it is the outcome of the white minority domination of political and economic power.
Organisation of the distribution section of the ESI
The right to distribute electricity, as set out in the governing statute, the Electricity Act, is vested in local govermnent. The boundaries of local government have been set by apartheid legislation making the provision of electricity follow the pattern of limited infrastructure provided in black areas. Further fragmentation was caused by the legislation grading municipalities operating an electricity undertaking, the Town Clerk's
4 INDUSTRIAL STRATEGY PROJECT
Remuneration Act of 1985. The end result is that by 1990 there were some 450 electricity supply undertakings in the country serving a total of 2 million consumers.
Of the six different kinds of distribution authorities identified by Theron et. al. (1991), the three most important are white municipalities, Black Local Authorities and regional Eskom structures.
White municipalities operate electricity departments serving industrial, commercial and residential users in white and most coloured and Indian suburbs. This service is reliable and profitable. Municipalities set their own tariffs and normally budget to produce a
surplus on their electricity sales. Some 40% of white local authority revenue comes from electricity sales and profits from sales, thus a total of R600m is available to reduce rates.
Black Local Authorities have the right to distribute electricity in black townships. The BLA's either run their own electricity departments or contract out the function to neighbouring white municipalities or Eskom. BLA' s have lacked political legitimacy, financial viability and service efficiency from their inception and the situation has deteriorated. For electricity distribution they lacked the administrative and technical staff to provide accurate metering, reliable billing, continuity of service and maintenance.
Electricity prices in townships have risen on average higher than in white areas in order to repay the capital costs of new systems and also because of the poor load factors due to the absence of large commercial consumers in the townships. Coupled with poor service, high prices have resulted in non-payment campaigns in many townships. The results have left electricity distribution in many townships in crisis with BLA's in debt and has in turn led to the disconnection of bulk supplies to townships.
The third major distributors are the Eskom regional distribution authorities who sell to a limited number of domestic users, a large number of industrial users and commercial farmers. In the last year, the number of domestic users has grown substantially as Eskom has taken over the distribution rights to an increasing number of black townships, most notably Soweto in 1992 and many other townships in the Pretoria Witwatersrand Vereeniging region. Due to the breakdown in BLA distribution functions, the number of townships ceding their distribution rights to Eskom is likely to rise.
The need to restructure the ESI
It should be apparent that the current structure of the ES! is inadequate to implement a widespread electrification programme. Vested interests in the current structures of local government, the unwillingness of officials running profitable undertakings to tackle the financially more risky expansion into unelectrified areas and the apartheid legacy of racially structured local government calls for a major restructuring of the ESI.
Proposals to overcome the fragmentation of the distribution sector of the ES! have emerged in several quarters. Theron, Eberhardt and Dingly (1991) suggest the consolidation of the personnel, equipment and assets of the three existing distribution
ELECTRICAL EQUIPMENT SECTOR 5
authorities on a regional basis to form public regional distribution authorities with a sufficient spread of consumers to provide a rational and efficient service to existing and new consumers (Theron et. al. 1991). Further elaboration of the policy questions concerning the restructuring of the ESI is an aspect of the current Energy Policy Research and Training project being conducted by the Energy for Development Research Centre at the University of Cape Town.
Financing a mass electrification programme
How an accelerated programme of electrification is to be financed cannot escape mention. The proposals made by Theron 1992 are set out here (Theron, 1992a). Working on the assumption of 100% electrification of formal and informal urban households by the year 2000 and 50% of rural households by that year, rising to 90% by 2010, the following annual rates of connection are projected: 370 000 for ten years, thereafter 200 000 per annum to accommodate further urbanisation over the next ten years. Rural connections are needed at 120 000 per annum for twenty years. Electrification on such a scale would involve 8.1 million new connections.
Distribution costs on these assumptions are Ri. 32 billion per annum for ten years and R920m pa for the following ten years. Noting that electrification is a capital expense which will earn a payback in time and is not likely to be considered a candidate for grant allocations from the central state budget. Theron proposes capital could be raised from three sources: development loans to create serviced sites, home buyers and from the electricity distribution authorities themselves. Local authorities are empowered to raise loans and their ability to service debts from electrification would be facilitated by a new rationalised regional distribution structure permitting cross subsidisation. As has been noted above, white local authorities made a profit of R600m on sales of R5 billion. Eskom generated sales of R12.6 billion with a surplus of Ri.397 billion in 1992. Capital expenditure was R3.61 1 billion and finance charges R2.987 billion (Eskom, 1993).
Eskom's financial status is considerable and mainly applied to generation and transmission activities, the costs of which were not included in the above estimates of the cost of an electrification programme. Present resources are considerable. For example, the estimated cost of an accelerated electrification programme would require 36% of Eskoms' 1992 capital expenditure budget. This simply underscores the point that a restructured ES! has the financial potential to finance a mass electrification programme.
To summarise the argument thus far. Electricity has the potential to increase the standard of living and quality of life for the millions of South Africans who are currently excluded from access to it. An electrification programme has additional benefits of providing a major stimulus to the economy and generating a large number of jobs. Standing in the way of an accelerated programme is the current structure of the ES! which needs to be comprehensively restructured. The ESI nevertheless contains the potential to finance an electrification programme. Above all else is the need for a plan to coordinate electrification efforts. Steps in that direction have been made by interested parties which established a National Electrification Forum in 1992 for consultation purposes.
6 NDUSTR)AL STRATEGY PROJECT
Key issues for electricity distribution Of interest to this study are the equipment inputs into a mass electrification programme. Existing generation capacity in the South African national grid forms the point of departure for demarcating the study. Unrealised expectations of growth in the demand for electricity has resulted in an excess generating capacity of 6000 MW: a surplus which is sufficient to supply the needs of about five million new domestic consumers (Dingly, 1990). Large export processing projects, such as Columbus stainless steel and the Alusaf II aluminium smelter extension will be major new consumers of power but will not soak up all this reserve capacity. Alusaf II is planned to take 882 MW, a 4% increase in Eskoms current sales (Engineering News 11/12/92). Such is excess in current generating capacity 'it is expected there will be no need to acquire additional generating capacity until after the turn of the century' (Ashby, 1992:4). Eskom has budgeted R1.5 billion on generation to the year 2001 to complete existing projects and the bulk of capital expenditure will go to transmission projects, P5.02 billion for the period 1992 to 1996 (Engineering News 27/3/92).
In view of this surplus capacity on the national grid, the technical requirements of an electrification programme are essentially that of building new distribution networks and extending existing ones. In simple terms, a distribution network takes power to the end user. What this consists of, is the network which takes power from low voltage side of the transmission substations which step down the current from transmission levels of 138kV and above to distribution levels between 11kV and 88kV. Medium voltage networks, typically 11kV or 22kV, distribute power physically close to the customer. At that point transformers feed electricity into the low voltage reticulation system from where it is supplied to the customers service point. Comprehending the parts of the electrical power distribution equipment industry is made easy by the orderly progression of electricity through the various elements of the distribution network to arrive as useful energy in the customers home. It is an industry which lends itself to being conceptualised as a filière and provides coherent boundaries to the study. In terms of equipment this covers the following key items: conductor (medium, low voltage and service connectors) transformers, circuit breakers, insulators, poles, meters, electricity dispensers or house wiring. Luminaries, generally part of the reticulation infrastructure are not covered in this report.
Progress on electrification
Experience of low cost electrification programmes is relatively limited. In 1989 Eskom began to vigorously promote the idea of 'Electricity For All' linking electrification with wider economic recovery. Impetus was given to this programme by Eskom announcing plans to assist in electrifying three million households it considered were able to afford electricity by 1996. Of the three million targeted Eskom only had direct access to 0.7m households, the remaining 2.3m falling under the jurisdiction of other local authorities, mainly white municipalities and Black Local Authorities. A shift in Eskoms' favour has taken place as ineffective BLA distribution authorities have been pressurised by communities to cede their distribution rights. Such moves constitute a de facto restructuring of the ES! and will increase access for electrification projects but fall short of
ELECTRICAL EQUIPMENT SECTOR 7
the comprehensive restructuring required. Eskoms' budget for electrification has risen from R1.4 billion to R2.2 billion (Cape Times 23/2/93).
The 'Electricity for All' programme has been slow in getting off the ground. Eskom made only 14 000 new connections in 1990 and 31 000 in 1991.
What concerns and frustrates me is that in spite of general concurrence of the need for electrification in South Africa, in spite of numerous august bodies having conferred on the subject, and in spite of any number of authors having expounded on the reasons for the lack of progress and outlining recipes for progress, here we stand in May, 1992, with a pretty dismal performance to show. [Howard Whithead, Executive Director Durban
Electricity Service presenting the SAIEE invitation lecture.] (Elektrofl June 1992).
Late in 1992 the rate of new connections picked up to give a total for the year of 145 000 at cost of R442 million (Cape Times 30/30/93).
In the municipal sector little progress has been made, with the major exception of the City of Durban which plans to make 160 000 new connections in areas adjacent to the city over the next five years at a cost of R500m per annum. The required financing coming from the municipalities own capital budget. Other authorities that have made new connections are Bloemfontein, and the Cape Provincial Administration. New connections made in 1992 probably totalled 200000.
The electrical equipment industry
Electric power equipment is manufactured by the electrical engineering industry. Since the latter also covers electronics manufacture, statistics on the industry do not clearly reveal the status of either important branch of manufacturing. Here an effort will be made to focus on the branches of industry providing electrical distribution equipment; in 1985 electrical industrial machinery and apparatus employed 28 146 while 6 579 were employed in the insulated wires and cable industry (CSS, 1985).
Key problems facing the electrical equipment industry For the electrical equipment industry to play its part in realising the potential of a mass electrification programme a number of problems have to be overcome. Attention thus far has been given to deficiencies in the structure of the ESI and the need for it to be restructured. Problems in manufacturing equipment inputs are located in the present structure and scale of production; these will have to be substantially altered if obstacles are to be overcome.
Mass electrification designs and materials have been termed 'affordable' in preference to 'low cost' to avoid the impression new low cost systems that will be built in mainly low income Black areas will be of a low standard. No pejorative connotations are conveyed by term low cost, summarising as it does the aim of stretching resources to the limit and it is used interchangeably in this report.
8 INDUSTRIAL STRATEGY PROJECT
Policy for this sector will have to shape how firms respond to the growth in demand. Essentially, there are two options — for firms to exploit the expanding markets and engage in monopoly pricing or to expand their output to meet demand. In essence the task for
policy makers is to steer firms in the latter direction. Nine key problems facing the electrical distribution equipment sector need to be confronted.
1) Lack of investment in the equipment sector
At present, capacity utilization in the electrical equipment industry is low, for the industry as a whole, utilisation stood at 75.6% in 1991. However, demand is expected to grow dramatically and such initial over capacity in the start up phase of a major programme is desirable, in order to avoid running into short term bottle-necks. Over capacity has resulted in mergers of plants, particularly in the cable sector. Most importantly, the lack of progress to date has prevented significant new investments being made as industrialists are taking a conservative view of the anticipated demand for their products.
Uncertainty about the scale of the electrification programme has significantly contributed to the lack of investment. Eskom's target of 3 million new connections by 1996 has been the firmest figure produced thus far. This target falls far short of bringing electricity within the reach of most South Africans. A comprehensive electrification programme would be more than double the Eskom target and involve up to 8. im new connections over a twenty year period. The full scale of an electrification programme has not yet been full appreciated.
2) Fragmentation of demand and Jack of standards
The design and constructions of South Africa's electricity distribution network has been steered by regulations contained in the Electricity Act, South African Bureau of Standards (SABS) equipment standards and codes of practice developed by the Association of Municipal Electrical Undertakings (AEMU). Large municipalities have evolved codes of practice to suit their conditions and harmonize new equipment introduced into their networks. Equipment standards are therefore not uniform across the country, as municipal electrical networks differ in minor aspects. The lack of consistent standards fragments demand for equipment and results in suppliers having to make adaptations to tenders for each enquiry thus adding to production costs.
3) Lack of scale economies
Non uniform equipment requirements prevent manufacturers from setting up long production runs where they can reap the benefits of scale economies. As a result, some electrical engineering establishments operate along lines that would best be described as jobbing shops.
ELECTRICAL EQUIPMENT SECTOR 9
4) High raw material costs
South Africa's resource endowment does not confer benefits on local manufacturers. Electrical equipment manufacturers use large quantities of steel, copper and aluminium beneficiated in South Africa but do not obtain cost advantages on these local inputs as a result of producers applying export parity pricing for the domestic market. Other domestically produced raw materials, such as PVC made in tariff protected sub-optimally sized plants, are supplied at higher than world market prices.
5) Low skilled workers
Data is not available for the educational level of the work force in the electrical engineering industry. What is clear, is that much of the equipment requirements are low to medium technology and the skill level requirements are conespondingly low. Strategies to improve productivity require, in large part, greater responsibility to rest with workers themselves, however low skill levels make it more difficult for workers to play a larger role in coordinating production.
6) Foreign exchange requirements and balance of payments implications
Will an electrification programme run into balance of payments problems? With regard to the production of distribution equipment, three areas require attention. First, made up equipment such as circuit breakers, cable or transformers could be imported. To date insubstantial amounts of equipment have been imported but this will be influenced by the trade regime and the extent to which tariff protection is reduced. Secondly, imported intennediate inputs are required but account for a small portion of the value of local raw materials. Thirdly, the capital equipment used in the industry is imported and the existing capital stock is in need of replacement in some branches of the industry. The rate of new connections and the duration of the programme will determine the volume of capital equipment imports.
7) Poor export performance
Local electrical equipment manufacturers have a dismal export record. Factors which have contributed to this situation are the inward orientation of the industry, which was established in terms of an import substitution policy, export restrictions contained in licence agreements for much of the equipment made locally and a lack of indigenous research and development (R&D) directed to developing products suitable for export.
While the South African share of ownership of the major equipment supply companies has grown, technological dependence on foreign companies in this sector is still considerable. Since the technology used in distribution is mature the need for technology transfers from abroad is less important than for advanced engineering applications such as new power stations. On the whole, licence holders are restricted to exports to sub Saharan Africa. As a
10 INDUSTRIAL STRATEGY PROJECT
result of manufacturing under licence, little effort has been put into local R&D and what is done, focuses on adaptation to local conditions.
8) Supply bottle-necks and inefficiencies
Pre-empting disruption of an electrification programme caused by the unavailability of key materials will be important. Larger problems to overcome include production inefficiencies. There is a need to raise the productivity of the industry to contain costs and compete with imported products.
9) Limited job creation
One major goal of the electrification programme is to stimulate job creation. Output from the industry will rise and so will its labour requirements. However, the two and half fold increase in the current level of output that would be needed to meet an accelerated
programme of electrification will not require a commensurate increase in the labour force. This is a consequence of the higher efficiency of newer capital equipment; the promotion of appropriate, less complex, less labour intensive engineering standards and cost saving technologies in the affordable field.
Standards used in the design and construction of South African electrical netwOrks have been modelled mainly on British practice and, over time, these have been modified in the light of field experience. In order to make mass electrification economically feasible, new standards have been developed, largely at the behest of Eskom, aimed at reducing costs by reducing material requirements, simplifying equipment design and construction methods. In general tenns, this means less labour is utilised in the production of 'affordable', yet safe, electrical equipment.
The challenge of electrification
Having posed the problems that have to be overcome, the objectives of an industrial policy for this sector are to assist the electrical equipment supply industry to overcome these challenges.
The focus of the study will be on the capacity of the industry to re orientate itself to service the needs of affordable electrification. Five themes need to be explored.
First, mass electrification can contribute to revitalizing the economy. Yet for the economic gains to be captured a dynamic approach is needed. Without a coherent coordinating plan problems will not be overcome, nor will the scale of electrification be sufficient to make a substantial impact. Indeed a degree of optimism is required to ensure that potential gains of mass electrification are realised and that the promise of employment generation and economic revitalization is fulfilled. It is clear that political restructuring of the ES! is
ELECTRICAL EQUIPMENT SECTOR 11
necessary but insufficient. A comprehensive plan for the whole country and the institutions able to execute it enjoying the support of all stakeholders is required.
Secondly, the advantage of the industry is that it is demand led i.e. builds equipment to order. It receives modest tariff protection, but is by now a fully established industry. Purchasers of equipment will shape it by specifying their needs. Hence, if the demand side is properly coordinated the industry will respond appropriately. Power resides with the customer and the institutional restructuring of the ES! would permit more rational equipment requirements to be met.
Thirdly, there are essentially two options for firms to respond to the predicted growth in demand, either to exploit expanding markets and engage in monopoly pricing or to expand output to meet demand. One important factor which will influence finns' pricing behaviour will be the purchasing decisions made by Eskom which is 'committed to a reduction of the real price of electricity of 20% over the next five years' (Ashby, 1992:3).
Fourthly, productivity enhancement in the widest sense is essential. This requires the use of new materials, technology and better management of resources. There appears to be considerable scope for workplace reorganisation involving trade unions in the equipment industry. Part of the impetus for reorganisation will come in competitive pressure from imports, a pressure exacerbated by the current world recession.
Fiftlily, gearing the industry to meet expanded demand requires consideration of what will happen when mass electrification is wound down. Electrification will imply a domestic focus for the equipment industry. However, exports are potentially a significant factor for certain sections from the outset and a sustained domestic base load may provide a platform for the local industry to start exporting from. In the medium term growth in the rest of the economy should absorb output and in the longer term markets for electrification in Southern Africa may become increasingly important.
Contents of the report
Chapter Two provides a profile of the electrical distribution equipment industry describing its economic, technical and institutional features. It provides a statistical overview, a discussion of the size and nature of the market, and the financial performance of firms in the industry. Designs for reticulation systems are outlined and mention is made of institutions present in the industry.
Trade is discussed in Chapter Three in which the poor performance of this sector in exports becomes apparent. Reasons for this performance are analyzed and export potential of segments of the industry examined. It is argued that protection on certain sectors of the industry could be reduced.
Chapter Four reviews the technological capabilities of the sector and shows that a reliance on foreign technology has acted as a brake to local development. It reviews efforts to develop more rationalised standards and explores the implications of progress in that
12 INDUSTRIAL STRATEGY PROJECT
direction: positive steps for more standardised production runs but measures lower employment growth in equipment manufacturing.
Chapter Five discusses safety standards and hazardous substances used in the industry and identifies the need for measures to increase health, safety and environmental protection.
Chapter Six reviews employment and wages in the electrical machinery industry and compares productivity in the transformer manufacturing industry internationally.
Capabilities to meet expanded demand are examined in detail in Chapter Seven. Findings are that capacity utilization in equipment industry is low at current output levels. Without significant new plant being required, the industry has the capacity to supply equipment for the rate of new connections to rise to 800 000 per annum.
Policy conclusions drawn from each of the areas investigated are presented in the final chapter taking into account the capabilities of the industry, the institutions present and the need to develop a suitable vehicle to implement a mass electrification programme.
Conclusion
Bringing access to Electricity to the two thirds of the South African population currently denied access to it will have enormous social and economic advantages. The electrical equipment industry is on the brink of large scale expansion, if obstacles in the organisation of the ES! can be overcome. A number of problems have to be overcome for the electrical equipment industry to make full use of the potential offered by increased demand. However, it is argued in this report that the potential for meeting some, if not all, of the goals of industrial restructuring, namely the satisfaction of basic needs, employment creation and fostering internationally competitive manufacturing is good.
Chapter Two: Profile of the electrical distribution equipment industry
The purpose of this chapter is to locate this study within the broader electrical engineering industry. In four parts it constructs a profile of the electrical distribution equipment industry: first it presents a statistical overview of the electrical engineering industry; secondly, outlines the structure of the market for equipment; thirdly, the technology employed in low cost reticulation systems and fourthly, reviews the institutions present within the industry.
Statistical overview
Statistical categories
Data are not available at a sufficiently disaggregated level to provide a comprehensive view of the electrical distribution industry. What is available is limited, in detail as well as in currency. Nonetheless, data from the Central Statistical Services can describe the broad contours of the industry.
International Standard Industrial Classification (ISIC) codes, in their third revision, no longer match the categories used in South Africa closely, as certain activities have been reclassified. Hence South African codes are used throughout.
Major group ISIC 382 covers the manufacture of electrical machinery, apparatus, appliances and supplies, hereafter referred to as the electrical machinery industry. Four sub-groups are covered by this heading, two are germane to this study. First, ISIC 3831, the manufacture of electrical industrial machinery and apparatus, covering the manufacture and repair of electric motors, generators, transformers, switchgear, electrical transmission and distribution equipment, control devices and electrical industrial apparatus. Secondly, ISIC 3839, the manufacture of electrical apparatus and supplies not elsewhere classified. In this latter category are insulated wires and cables, batteries, electric bulbs, and fixtures. Thus, the industries of interest are classified, along with extraneous activities, under 3831 and 3839.
Value of sales of the electrical machinery industry
In 1991 the value of sales of the electrical machinery industry was R8 222.5 million, some 4.61% of the total value of manufacturing sales. This represents 3.07% of GDP. The position of each sub-group and its share of the sales of the manufacturing sector is as follows: Electrical industrial machinery accounts for R2 506.8 million sales equal to
14 INDUSTRIAL STRATEGY PROJECT
1.40% of manufacturing output and 0.94% of GDP. Insulated cable had sales of Ri 595.4 million equal to 0.89% of manufacturing output and 0.59% of GDP. Electrical goods not elsewhere specified had sales of Ri 020.9 million equal to 0.57% of the manufacturing total and 0.38% of GDP. (SA Statistics 1992)
Relative importance of the electrical machinery sector
By comparison with other manufacturing sectors, electrical machinery contributed 4.7% to gross output in 1979, 5.0% in 1982 and 4.8% in 1985, the three census years for which data are available. In 1982 the sector absorbed 5% of manufacturing employment and accounted for 3.1% of manufacturing capital stock. In 1985 the share of employment was 4.6% and capital stock share had fallen to 2.3%
Distribution of activity between firms
Data on the distribution of activity within the sector by number of firms, by employment size, and by output size is available for 1985. This, and subsequent discussions are derived from the last available Census of Manufacturing, 1985. Clearly the situation would have changed somewhat in the past decade, nonetheless, this data provides indications about the pattern of firm size and activity within the sector.
It should be noted that the Industrial Development Corporation (IDC) has produced time series data on the manufacturing sector from 1972 to 1990. As some statistics are not gathered annually, these values given by the IDC have been extrapolated from manufacturing census data and adjusted using aggregate measurements. The 1982 and 1985 manufacturing census were used as they provided greater detail and in more usefully disaggregated categories.
Taking the distribution of activity within the sector by employment size group, output from 845 establishments enumerated was dominated by larger firms. Establishments having 500 to 999 or 1000 employees upwards each produced 26% of gross output. Seventy five percent of the total number of establishments employed less than 50 people but account for only 12% of output. The largest group of these small firms employed between 10 and 19 people and produced only three percent of gross output.
Grouped in terms of gross output, firms with an output of RiOrn and above accounted for only 8.2% of the number of enterprises but employed 66% of the sectors workforce and produced 77.4% of its output, using 82.5% of the sectors fixed assets. Some 77% of the enterprises had a gross output of under Rim and as a group such firms accounted for only 5.2% of the total output.
ELECTRICAL EQUIPMENT SECTOR 15
Regional distribution of the electrical machinery industry
Data are available for manufacturing activity by development region for 1985. These development regions cover the whole country and combine cities with adjacent less industrialised districts. Not surprisingly, the development region covering the Pretoria, Witwatersrand and Vereeniging area contained the lions share of the industry: 70% of employment and 71% of gross output. Next came the Eastern Cape consisting of Port Elizabeth, Uitenhage, East London and surrounding districts, which accounted for 10% of employment and 12% of output. This was followed by the Western Cape which claimed 7.4% of employment and 8.3% of output. The remaining significant region was Natal with 6.7% of employment and 5% of output. Changes in the distribution of economic activity will obviously have altered these proportions, but to what extent it is not possible to say. The Eastern Cape region has experienced a significant reduction in manufacturing activity and therefore it is reasonable to suggest has declined in the rankings of electrical machinery manufacture locations to be on a par or below that of Natal and the Western Cape.
Employment in the electrical distribution machinery industry
In 1991, total employment in the electrical machinery industry stood at 66 100 (SA Labour Statistics, 1992), that is 4.6% of the total employment in manufacturing and 15.3% of the employment in the metal industry including basic iron and steel and fabricated metal products. The racial composition of the workforce in that year is given as 19 500 white; 12 000 coloured; 2 000 Indian and 32 600 African workers.
Employment in 1991 in the electrical industrial equipment industry was approximately 25 000, and in the insulated cable industry 5 000. From the first category employment in electric motors, generators and turbine equipment has to be excised, (as it is outside the scope of the study) which would shrink this number roughly a third. Total employment in the electrical power distribution equipment industry may be estimated to be in the region of 21000.
Manufacturing capital stock
Actual data on the value of assets in building and plant, representing the manufacturing capital stock for the sectors under investigation is no more recent than the 1985 manufacturing census. Electrical industrial machinery had a manufacturing capital stock of R129.5m in current prices, or R263.7m in constant 1990 prices and insulated wires and cable a capital stock of R129.5m (R263.7m in constant Rands). To get a sense of the relative size of the industries under investigation, together they amounted to a total of R31 l.3m which was 53% of the total manufacturing capital stock of the electrical machinery sector and 1.14% of the total manufacturing capital stock.
16 INDUSTRIAL STRATEGY PROJECT
1985 is a particularly bad year in which to assess the economy, as the output of the manufacturing sector was well below that of the average for the 1980's; a point taken up in more detail in the discussion on the physical volume of manufacturing production below. It is useful then, to go back to the manufacturing census of 1982 in order to provide a contrast at levels of output closer to those achieved in the current period.
In 1982, Electrical industrial machinery had a manufacturing capital stock of R92.03m in current prices, or R267.05m in constant 1990 prices, some 1.5% above the 1985 figure. Insulated wires and cable a capital stock of Ri 18.7m (R352.2m in constant Rands) which was 9.5% greater than in 1985. The total for these industrial equipment and the cable sectors was R211.7m or 50.2% of the manufacturing capital stock of the electrical equipment sector in 1982.
Capital labour ratios
The amount of manufacturing capital stock tied up in each job is a measure of capital intensity, i.e. the hypothetical capital cost of creating a job in the industry. The 1985 census reveals this was R 15 200 (1990 Rands) per worker for the electrical industrial equipment sector, 36% higher than the value for 1982. Cable manufacturing reflected a capital intensity more than twice that of the average for the electrical equipment industry at R42 100, albeit 10% lower than in 1982. In the mid 1980's, the cable sector underwent a major rationalisation which would explain the fall in the capital intensity of the industry. Between 1982 the average capital labour ratio for the electrical equipment industry had risen 15% to R20 400. Only the cable industry exhibits a capital intensity close to the average for the manufacturing sector. The electrical equipment industry average is about half that figure thus indicating that the industry is a labour intensive one. Between 1982 and 1985 the capital labour ratio gap widened from 61% of the manufacturing average to 49%.
Average capital output ratio
Measurements of productivity of labour or capital from the 1985 manufacturing census are beset with problems, due to the poor state of the economy during that census year. Nonetheless, the picture which emerges for the electrical equipment industry is that the average capital output ratio is 0.187 against the manufacturing average of 0.388. Industrial machinery with an output ratio of 0.154 was substantially below the cable industry ratio of 0.271. Net capital and output fell from the previous census period in 1982. The result of this fall was that the incremental capital output ratio over that period was a mere 0.014.
ELECTRICAL EQUIPMENT SECTOR 17
As would be expected in comparison with other manufacturing sectors, electrical engineering firms possessed fewer assets and, as a result, achieved a higher capital output ratio. In contrast, the cable industry is closer to the manufacturing average with a higher fixed assets component. Indications of efficiency of the use of assets are given in this ratio, but comparisons are only meaningful with sectors that have similar fixed asset components.
Average output labour ratios
Examining the output to labour ratio provides an estimated per capita contribution to sales. In 1991 the electrical machinery industry returned an output per worker of R124 400; industrial machinery R100 300 and insulated cable R31 8 700 (sales of R1593.4 million, employment estimated at 5000). The latter figure needs to be treated with some caution, as it is considerably higher than the Ri 78 181 of local output per worker recorded in a Department of Trade and Industries (Dli) report in 1988.
Productivity trends
Data on labour and capital productivity trends from 1972 to 1990 (IDC 1992a) show a long term decline in capital productivity and a long term increase in labour productivity for electrical industrial machinery. Similar trends apply to the manufacturing sector as a whole, except that the decline in capital productivity has been greater. Productivity measures for electrical apparatus and supplies show a long term increase in labour productivity. Capital productivity in that industry has undergone cyclical change but not a trend shift over the period reviewed.
Physical volume of manufacturing production
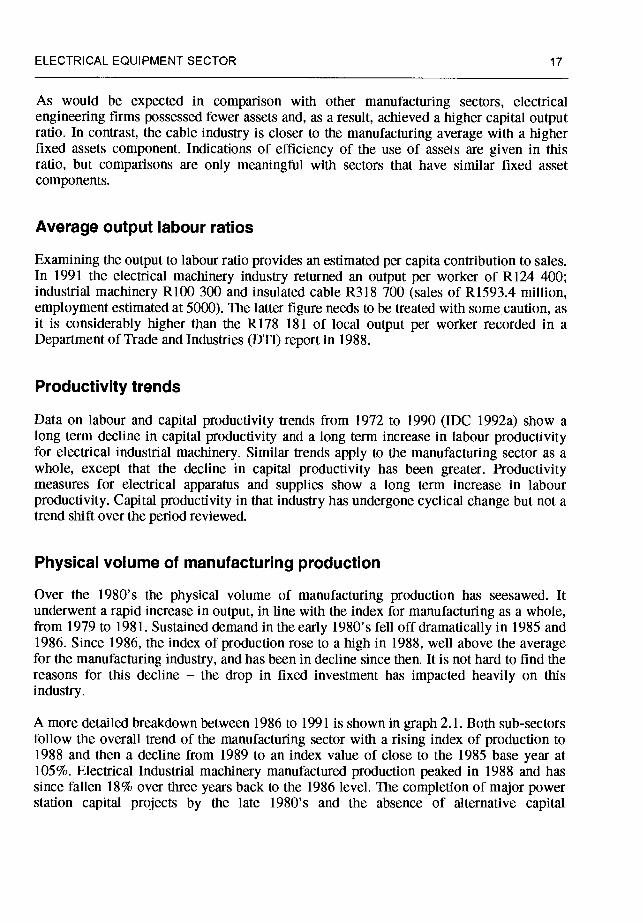
Over the 1980's the physical volume of manufacturing production has seesawed. It underwent a rapid increase in output, in line with the index for manufacturing as a whole, from 1979 to 1981. Sustained demand in the early 1980's fell off dramatically in 1985 and 1986. Since 1986, the index of production rose to a high in 1988, well above the average for the manufacturing industry, and has been in decline since then. It is not hard to find the reasons for this decline — the drop in fixed investment has impacted heavily on this industry.
A more detailed breakdown between 1986 to 1991 is shown in graph 2.1. Both sub-sectors follow the overall trend of the manufacturing sector with a rising index of production to 1988 and then a decline from 1989 to an index value of close to the 1985 base year at 105%. Electrical Industrial machinery manufactured production peaked in 1988 and has since fallen 18% over three years back to the 1986 level. The completion of major power station capital projects by the late 1980's and the absence of alternative capital
18 INDUSTRIAL STRATEGY PROJECT
expenditure has been the principal cause of the declining output from this sub-sector. The phrase 'varied fortunes' best describes the insulated cable indusiries story. Manufacturing production rose 36 index points from 1986 to a high in 1989 and has fallen just as rapidly since then. Poor performance of the mining sector, particularly gold mines, is the largest contributory factor to the decline in cable output.
Figure 2.1 Index of physical volume of manufacturing production 1986—1991
130
°-ioo _—
::. 1986 1987 1988 1989 1990 1991
—— Manuf total —I-— Elec mach tot —8— Indust mach —)<— Cable
Source: CSS, 1992a.
Utilization of productive capacity
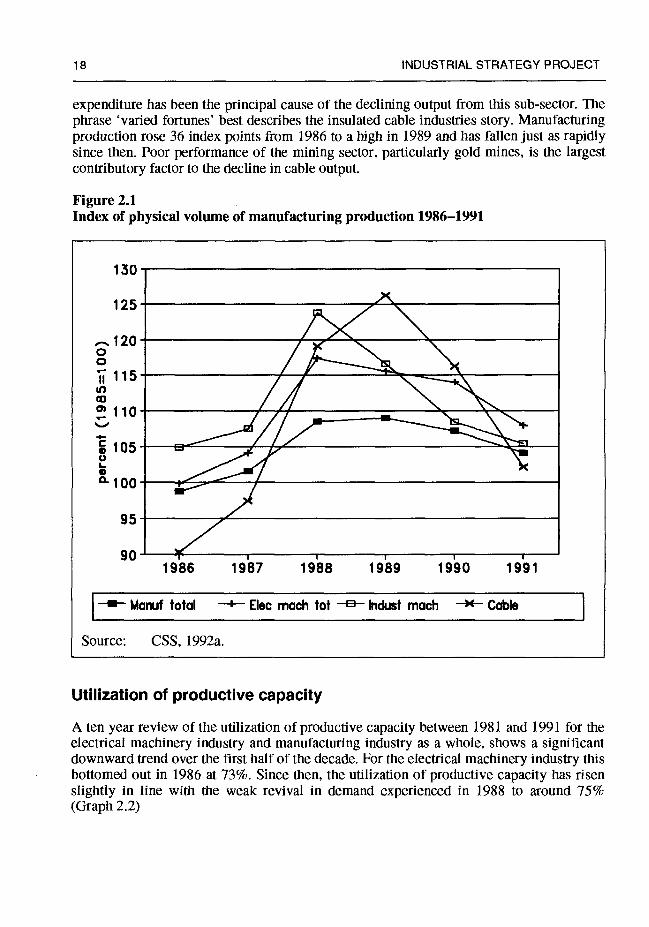
A ten year review of the utilization of productive capacity between 1981 and 1991 for the electrical machinery industry and manufacturing industry as a whole, shows a significant downward trend over the first half of the decade. For the electrical machinery industry this bottomed out in 1986 at 73%. Since then, the utilization of productive capacity has risen slightly in line with the weak revival in demand experienced in 1988 to around 75% (Graph 2.2)
ELECTRICAL EQUIPMENT SECTOR 19
Such low levels of capacity utilisation do not warrant investing in new assets. This macro picture lends support to evidence gained in interviews that plant and equipment are old and little new investment has taken place in the electrical distribution equipment industry. More detail is given to this question in Chapter Six.
Figure 2.2 Utilization of productive capacity 1981—1991
E
I I I 1981 1982 1983 1984 1985 1986 1987 1988 1989 1990 1991
I
— Manufactiring total —+— Electrical mach.
Source: CSS, 1992a.
20 INDUSTRIAL STRATEGY PROJECT
Physical output of key equipment
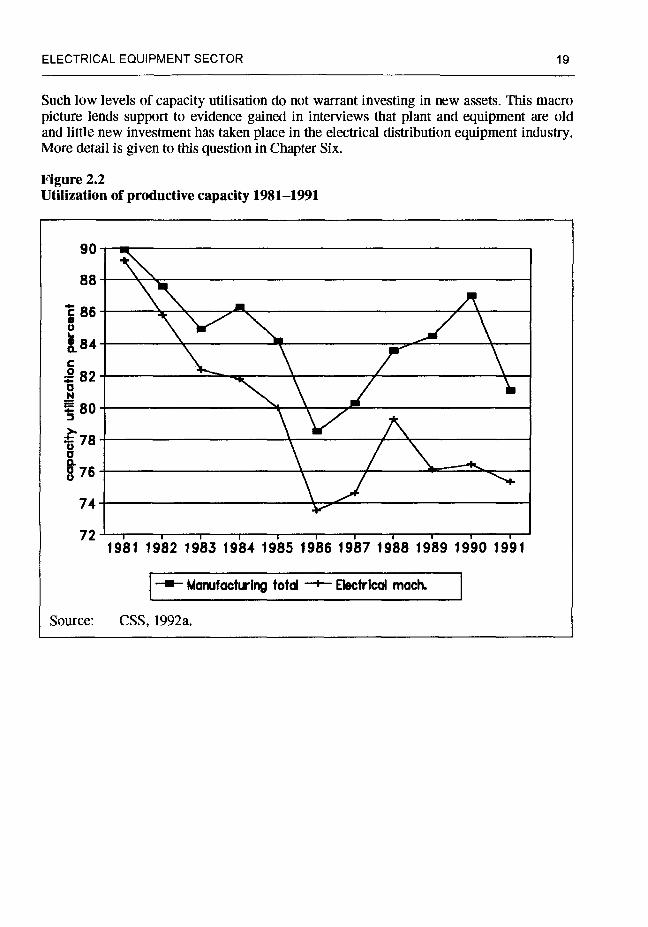
The lot of the distribution transformer and cable manufacturing industry is graphically illustrated in graphs 2.3 and 2.4 respectively. Transformer production in South Africa reached its zenith in the early 1980's and has since shrunk considerably. As unit values are not available since 1989, no indication of the revival of demand in the early phases of the electrification programmes is shown. Historical levels of output indicate the ability of the industry to meet higher demand.
I ——iOO—199 KV —--2OO—499 KV —*—500—2499 K —8—2500 >KVA
Source: CSS, 1992b.
Figure 2.3 Distribution transformer annual production 1975—1989
1976 1978 1980 1982 1984 1986 1988
ELECTRICAL EQUIPMENT SECTOR 21
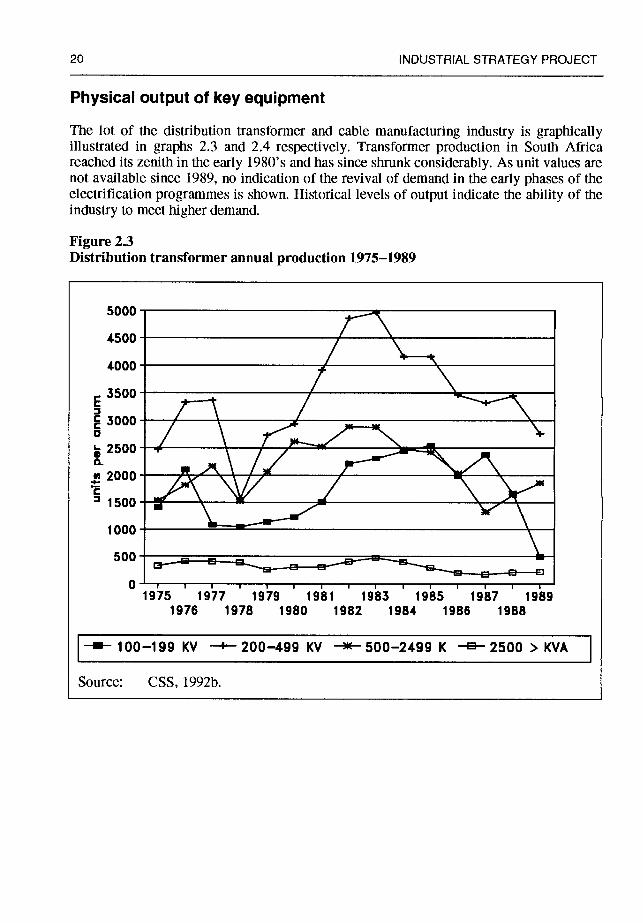
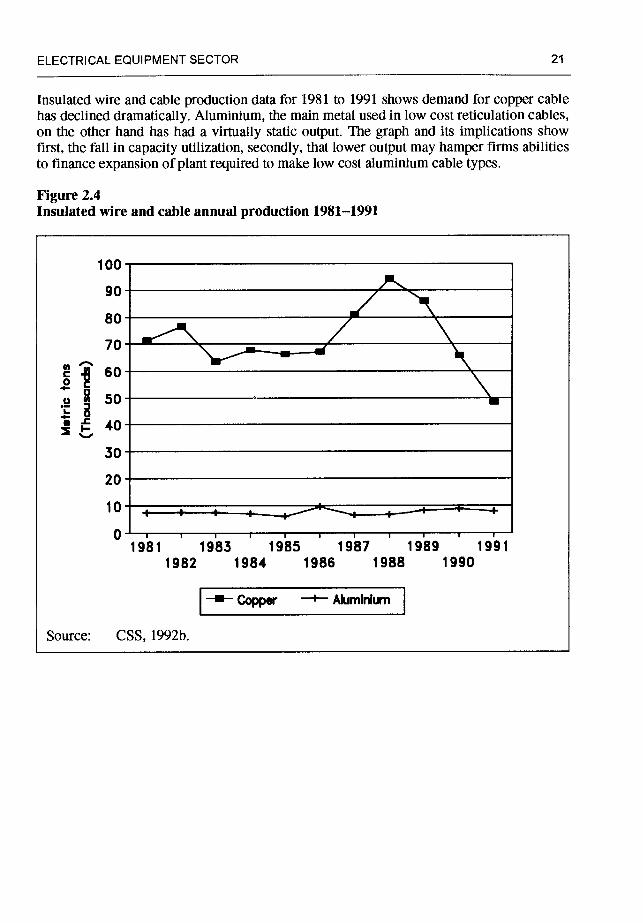
Insulated wire and cable production data for 1981 to 1991 shows demand for copper cable has declined dramatically. Aluminium, the main metal used in low cost reticulation cables, on the other hand has had a virtually static output. The graph and its implications show first, the fall in capacity utilization, secondly, that lower output may hamper firms abilities to finance expansion of plant required to make low cost aluminium cable types.
Figure 2.4 Insulated wire and cable annual production 1981—1991
100
11
30
20
10 , + + _____ 0 I I I I I I I I I
1981 1983 1985 1987 1989 1991 1982 1984 1986 1988 1990
I
—- Copp& —+-- Akiminfum
Source: CSS, 1992b.
22 INDUSTRiAL STRATEGY PROJECT
Market structure and economic performance of the electrical distribution equipment industry
Origins of the electrical distribution industry
The genesis of the firms which came to dominate the electrical equipment industry in South Africa lies in the twin development of demand for electricity by the gold mines on the Witwatersrand and the emergence of a centralised steam power generating industry. It was not until the Second World War, however, that local production of electrical equipment began on any scale, as prior to that equipment had been merely imported and serviced by the South African branch of the electrical engineering company concerned, the most notable being the English Electric Company, AEG, ASEA, Siemens and Brown Boveri.
Just as the war stimulated secondary industry and prompted the growth of the electrical goods industry, so too did it promote the production of heavy electrical equipment. Manufacturers in England saw South Africa as a significant market favoured by cheap raw materials, energy, and labour and made investment decisions accordingly. Firms such as Siemens, General Electric and Asea Electric which had been operating distribution branches in South Africa started factories to manufacture a growing range of equipment. (Christie, 1984) Post World War II state policy explicitly targeted the growth of domestic industry and put into effect a number of measures. For the electrical equipment industry access to state tender lists were used to encourage foreign firms to set up local manufacturing facilities (company interview). Higher tariff levels for imported machinery were set in the early 1950's. As a result the proportion of equipment manufactured locally rose sharply. Much of the electrical equipment required by mines and industry was, and still is, of medium level technology and therefore the establishment of factories in South Africa required relatively simple technology transfer from the parent company. Just how successful this policy was at stimulating the heavy engineering industry is shown by the rising share of local content in the boiler and steam plant of a power station: from an insignificant share in 1933 to 50% in 1950 and 75% a decade later (Christie, 1984:158).
Distribution equipment market size
During 1992 Eskom made 145 000 new connections and other local authorities between them added an estimated further 40 000 to bring the electrification total for the year to 185 000. Spending on new projects is difficult to establish, nevertheless, a picture has been constructed based on an assumption of costs per connection. Local authorities spent between R120 million and R160 million on electrification projects, taking the latter figure with Eskoms' known expenditure of R442, the total spending for 1992 amounts to R602
ELECTRICAL EQUIPMENT SECTOR 23
million. At an average labour content per contract of 23%, the market for equipment and supplies would have been in the region of R464 million.
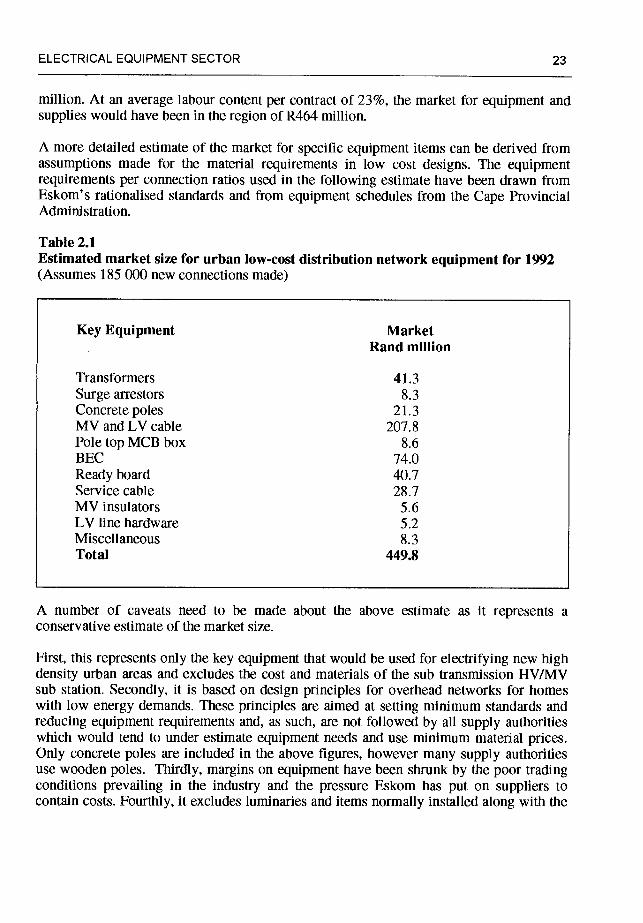
A more detailed estimate of the market for specific equipment items can be derived from assumptions made for the material requirements in low cost designs. The equipment requirements per connection ratios used in the following estimate have been drawn from Eskom's rationalised standards and from equipment schedules from the Cape Provincial Administration.
Table 2.1 Estimated market size for urban low-cost distribution network equipment for 1992 (Assumes 185 000 new connections made)
Key Equipment Market Rand million
Transformers 41.3 Surge arrestors 8.3 Concrete poles 21.3 MV and LV cable 207.8 Pole top MCB box 8.6 BEC 74.0 Ready board 40.7 Service cable 28.7 MV insulators 5.6 LV line hardware 5.2 Miscellaneous 8.3 Total 449.8
A number of caveats need to be made about the above estimate as it represents a conservative estimate of the market size.
First, this represents only the key equipment that would be used for electrifying new high density urban areas and excludes the cost and materials of the sub transmission HVIMV sub station. Secondly, it is based on design principles for overhead networks for homes with low energy demands. These principles are aimed at setting minimum standards and reducing equipment requirements and, as such, are not followed by all supply authorities which would tend to under estimate equipment needs and use minimum material prices. Only concrete poles are included in the above figures, however many supply authorities use wooden poles. Thirdly, margins on equipment have been shrunk by the poor trading conditions prevailing in the industry and the pressure Eskom has put on suppliers to contain costs. Fourthly, it excludes luminaries and items normally installed along with the
24 INDUSTRIAL STRATEGY PROJECT
domestic reticulation network. Fifthly, it excludes the house wiring (by stipulating Ready boards) and other fixtures normally used in the domestic electrification sector. Needless to
say, these figures relate only to new connections for electrification projects and not for the domestic electricity market as a whole, which would encompass equipment replacement and minor works.
Some scale may be given to these market estimates by comparing them to the value of sales of the electrical industry for 1991. The portion of the insulated cable market taken up by electrification would have taken 14.8% of the previous year's sales. By excluding the non electrical components i.e. concrete poles plus porcelain and cycloaliphatic MV insulators the total electrification equipment market would have represented 5.14% of total electrical machinery sales for 1991. The total estimate equals 0.25% of 1991
manufacturing sales.
Electrification equipment supply firms
Two types of firm supply electrification equipment; those of a generic light engineering character as well as divisions of the large electrical engineering groups active in the heavy power sector which have extended their business to cover the lower voltages sector. Table 2.1 in Appendix I lists the major players in the market along with the products they supply, the parent company and the conglomerate they are a part of. A major reason for the shift of the large electrical engineering firms into the distribution market has been the decline in other markets due to the shrinkage in fixed investment from the commercial, mining and industrial markets and the slowing down of Eskom's capital programme.
An examination of the firms active in this market shows that, in addition to electrical equipment manufacturers, there are firms involved in the concrete products industry, timber industry, electronics industry (specifically measurement), plastic converting and moulding as well as light engineering concerns which produce items such as pole stays and fasteners. The firms involved in manufacturing ready boards are a part of the larger electrical fittings industry, as ready boards are a innovative solution which effectively lower the cost of house wiring. The electrical fittings industry lies outside of the scope of the study, as house wiring will become the responsibility of the consumer beyond the electrical supply point installed in a home by the supply authorities.
Wooden pole manufactures are included on this list as wooden poles are likely to be used by supply authorities for some time. This is particularly so if problems are experienced in the supply of concrete poles, where there is a local supply of wooden poles or where the terrain is hilly and wooden poles with stays are more suitable.
What is common about these firms, and can they be classified as forming a distinct industry? At the final stages of the electrical distribution network the range of material requirements increases and diversifies to incorporate components outside of the core electrical engineering industry. The firms which make up the electrical distribution
ELECTRICAL EQUIPMENT SECTOR 25
industry are not all wholly involved in supplying electrification needs, as these firms also supply electrical distribution markets in the industrial and commercial sector.
Despite this qualification, by virtue of the destination of their output, the firms involved can be effectively grouped together and classified as the electrical distribution equipment industry.
Overview of the market structure of the electrical distribution equipment industry
It is clear that the firms involved in manufacturing electrical distribution equipment are in dissimilar markets, each of which requires consideration. What follows is an outline of the key features of each of the major categories, a fuller examination will be made when the public companies involved are reviewed.
Budget Energy Controllers are, in the main, manufactured by electronics finns which have created or expanded divisions covering electricity metering to produce BECs. Ash Industries and AEG Energy Control are two exceptions, having been set up dedicated to produce BECs. This industry is characterised by rapid innovation and technical change at a product and process level. The market for BECs has attracted a lot of new entrants and is highly competitive. As a local innovation there are no imports and some output is exported.
Circuit breakers, of the medium, low voltage and domestic type are produced by a small number of firms. Circuit Breaker Industries which manufactures the Heinemann range of domestic circuit breakers and earth leakage protection equipment has a monopoly in the domestic market.
Conductors are manufactured by a number of firms amongst whom a certain amount of specialisation exists, either by focusing on particular voltage ranges or producing uninsulated cable. For the main requirements for electrification using Aerial Bundle Conductor (ABC), the dominant firms are Aberdare and Voltex with competition from smaller firms such as Alverne Cables. To date, no significant imports have occurred for cable used for electrification.
Concrete poles are produced by a duopoloy of Roccla and Grinaker Precast which share the market evenly between themselves. Competition in this sector is from alternatives to concrete, either steel, extensively used for street lighting poles or from the slightly cheaper wooden poles. The market for wooden poles is shared by numerous firms which tend to market their output in the region they are based in, due to the proportionally high transport costs involved. Exports of poles have provided these firms with alternative markets and lessened their dependence upon supply authorities as customers. One consequence of exports has been to rise the cost of wooden poles and so hasten a shift to other pole types.
26 INDUSTRIAL STRATEGY PROJECT
Line hardware is a specialist business with a small number of firms active in the market. Preformed Line Products was set up by cable companies to extend the range of domestically produced line hardware. A limited amount of imports are made.
In the market for pole top boxes considerable competition exists. Since this is a simple item which may be fabricated out of a range of different materials, alternative sources of supply could be found to add to the four firms which share this market at present. A similar situations applies to small power distribution boards, where York Eclosures has lost its monopoly on these itenis as a number of other plastic moulding firms have entered the market.
Surge arrestors are imported by firms acting as agents for overseas manufacturers. The same applies to medium voltage insulators which are imported.
Transformer manufacturers are all part of larger electrical engineering groups and have divisions which are dedicated to producing distribution transformers. The market for distribution transformers is competitive and while market share at any time depends on which firms win tenders, the dominant suppliers are Power Engineers,
Brown Boveri Technologies and GEC Alsthom. Transformers for electrification projects have to date, not been imported.
Labour intensity in the distribution equipment industry
One of the propositions that is still to be tested about large scale electrification is that it will generate a large number of jobs in the supply industry. The veracity of this assumption will be examined in more detail in Chapter Six, it is based on the assumption that the labour complement in this industry is significant and that a rise in output would lead to a significant rise in employment.
The firms which make up the electrical distribution equipment sector are, as the above discussion has shown, heterogeneous, nevertheless certain important common features can be extracted. First, this sector produces equipment of a low to medium technology nature employing a similar range of technologies in production. Secondly, where assembly is required it is not highly mechanised, and ranges from a considerable amount of hand labour used in the building of BECs to the construction of transformers. Thirdly, where production is based on machine minding, as is the case in the cable industry, with the highest capital intensity within the industry, the amounts of labour required are not large. Overall then, this is a fairly labour intensive industry.
ELECTRICAL EQUIPMENT SECTOR 27
Linkages to the rest of the economy
Firms in the electrical distribution industry obtain raw materials and process these into final goods ready for building into distribution networks. As such the electrical distribution industry represents the lower reaches of an electrical engineering 'filière' drawing on raw material suppliers. These linkages are strong in the case of domestically produced raw materials such as copper and aluminium, as well as PVC for the manufacture of insulated cable. While the bulk of the industries raw materials are locally supplied, certain sections have a higher import content, such is the case for transformer raw materials and electronic components for BECs. Certain speciality chemicals are also imported for the manufacture of insulated cables.
This industry as a rule converts raw materials in house in a batch production process. Very little, if any, sub-contracting is done so final assembly of components is not a feature of the labour process in the industry.
Capital formation and wealth creation
A recurring theme in this study is speculation as to how well the electrical distribution equipment industry will respond to mass electrification demands. Capital could be a crucial constraint, therefore it is useful to assess the sectors' real fixed capital formation. Data is available for electrical industrial machinery, ISIC 3831, which shows that fixed capital stock grew at 7.4% between 1972 and 1980. Between 1980 and 1990 growth was 4.4% a level 2.4% above the average for manufacturing (IDC, 1992a:9). Value added, as a percentage of ex-factoty sales has been roughly 31% between 1972 and 1990. Labour's share of the value added has risen slightly from 73% in 1980—1982 to 77% in 1988—1990. Gross operating surplus has declined from 27% to 23% and net profit from 10% to 6% between the two respective periods (IDC, 1992a:9).
These measures can be treated as indicative trends at most, but they do show that capital formation was fairly healthy during the 1980's, however operating surpluses and net profit has gone into decline since the late 1980's. As the next section will elaborate, this trend has accelerated over the last two years.
Financial performance of the electrical distribution equipment industry
Financial details of the major firms involved in the industry are not uniformly available. Only three firms amongst the key suppliers are listed public companies for which financial statements are available, but many are owned by listed public companies. Subsidiaries of public companies, by far the largest category of the firms under review, are legally required to submit financial statements to the registrar of companies, a requirement honoured more in the breech than the observance. As a result, the economic performance
28 INDUSTRIAL STRATEGY PROJECT
of the firms of interest is available only in the consolidated statements of the controlling listed public company. Sufficient detail is available to comment on two components of the electrical equipment industry, the cable and transformer sections.
For the purposes of this study the key questions to pose are how profitable the industry has been, whether it has reserves sufficient to finance expansion and whether capital expenditure has been maintained to permit output to expand should demand rise. Emphasis will be given to the divisions in companies related to mass electrification markets. Pertinent details of ownership will also be presented.
The power cable sector
Aberdare
Aberdare cables started manufacturing paper insulated power cables in Port Elizabeth in 1947. Plastic insulated cable and telephone cables have subsequently been added. In 1956 the Nederlandsche Kabel Fabriken bought an interest in Aberdare, this Dutch company merged with Philips in 1970 and now Philips is the principal overseas technology partner.
Aggressive rationalisation of the cable industry took place in 1985 when Aberdare Cables Africa took over Aycliff cables, Scottish Cables and ASEA cables. These acquisitions were fuelled by Aberdare's controlling company, Powertech having taken over ASEA Electric (SA).
Starting in 1988, efforts were put into creating new products for low cost electrification. Extending the range of cable types required Aberdare to invest in new plant and steadily upgrade facilities.
The firms' economic performance in the 1990's has been badly effected by the lack of demand from traditional markets and the slow take off in demand for mass electrification products. Exports helped absorb slack in production, but did not boost overall profitability. As a result of stagnant markets power cable plant has not been expanded, but in the telecommunications market capital expenditure has been undertaken to facilitate exports.
Aberdare' s results for 1991 show that turnover fell 12% to R376.6 million and operating profits 22% to R 57.8 million. Net operating profit per worker fell from R37 362 in 1990 to R30 306. The company held fixed assets valued at R84.5 million. (Aberdare, 1992)
African cabies
African cables, long established in South Africa, has expanded its operations beyond the manufacture of higher voltage power cables to include low and medium voltage as well as house wiring. Control of the company has changed hands as a result of Reunert and
ELECTRICAL EQUIPMENT SECTOR 29
Siemens jointly acquiring the firm from the Cullinan group in 1991. It was recapitalised and installed new machinery to manufacture an expanded range of medium and high tension cables suitable for competing in niche markets. The following year the firm took over Siemens's cable manufacturing interests entirely.
As a result of the resiructuring, the companies turnover rose 80% to R310 million in 1992 and operating profit doubled to R36 million. Profit per worker also doubled to R34 873. (African Cables, 1992)
Usko
This company, owned by the parastatal steel company Iscor, ran into financial difficulties in 1991. Poor sales reduced demand by 20%, shrinking turnover to R554 million and turning an operating profit of R26 million in 1990 to a loss of R44.8 million (Usko, 1991).
Voltex
Voltex is a company involved in the manufacture of electric cable and wire along with elecirical fittings. Formally known as SA PVC, a light cable manufacturing operation, ownership is jointly held by the Berzack and Ilman families. Cable manufacturing contributed an unknown percentage of the groups' Rl .226 billion turnover in 1992, marginally down on the previous year. Operating profit fell 28% to R9 1 million in 1992 (Voltex, 1992).
Electric Products International
Cable manufactures have banded together and formed a single export company, Electric Products International (EPI). Under the rationalizations of the electric cable industry which took place during the 1980's, shrinking the industry from eleven to five major producers, co-operation on the international front appears logical, if not an extension of what was in fact occurring in the domestic market. EPI was founded with a 20% share by Aberdare, African Cables, Illman Group, Siemens and Usko. The Ilman Group cable interests are now held through Voltex. Subsequent rationalisation of the cable industry has seen Siemens's cable business go to African cables which has increased its share in the company.
The company represents its shareholders in overseas markets and exports on behalf of them. Orders won by the company are apportioned equitably between the shareholders.
30 INDUSTRIAL STRATEGY PROJECT
Power cable assessment
Cable companies profits have declined from the levels reached in the late 1980's yet face improved prospects in the medium term due to the demands of mass electrification (Business Day 28/4/92). Asset replacement has slowed to match the fall in demand but has not been frozen leaving firms attempting to compete with obsolete plant. This is the one part of the electrical distribution equipment industry which is predominantly made up of public listed companies, and it is rated as a growth sector by the finance sector (Stockbrokers interviewed).
Distribution transformer industry
Firms in this sector are either private companies or subsidiaries of listed groups. Details are available for the latter category only, hence only a partial review of the sector is possible.
Brown Boveri technologies
A major restructuring of the heavy power electrical industry in Europe with the merger of the Swedish ASEA and Swiss Brown Boveri to form ABB, now the worlds largest electrical engineering group, prompted change in the South African operation. ASEA Electric South Africa, owned by Powertech, merged with Brown Boveri in 1988 to form Brown Boveri Technologies (BBT). Half the equity was retained by the Swiss principle. BBT's operations cover the manufacture of power, industrial electrical and control equipment, of which the equipment required for low cost electrification is a relatively modest share. Being in the market suppling electrical infrastructure the firm has been constrained by low fixed investment spending. As a result restructuring exercises have been carried out, inevitably involving retrenchment. Powertech group employment has fallen 6% since 1990 to a total of 6665 in 1992.
Powertech has a power generation, transmission and distribution division which consists of a 50% share in BBT, wholly owned Yelland Power Management and Whiteleys, a company supplying transformer insulation. This division had a turnover of R462 million in 1992, a decline of 6% on 1991. Divisional assets total R196 million (Powertech, 1992). These figures are valid only for Powertech, but indicate the size of the division of which BBT is the significant component.
GEC Aisthom transformers
GEC in South Africa has been associated with the Reunert group for many years. Reunert holds 50% of the equity of the GEC holding company. Electrical engineering work in the power generation, motor and traction markets in the late 1980's has declined, prompting
ELECTRICAL EQUIPMENT SECTOR 31
the firm to downscale its operations. New markets in electrification equipment have been insufficient to offset the decline (Reunert, 1991). While small quantities of exports have helped to keep factories ticking over, poor electrification and capital project demand has meant excess manufacturing capacity, in turn eroding asset productivity (Reunert, 1992). No financial data is available on GEC's transformer divisions.
Power engineers
Ownership of Power Engineers is held by the public listed company Northern Engineering Industries Africa, in turn controlled by the English company Northern Engineering Industries. NEI also owns Reyrolle Switchgear. The groups margins have declined since 1989 as the effect of the recession has cut into the engineering industry. No financial information is available on Power Engineers, yet the transformer company has performed well within the group producing 'good profits and solid returns' in the 1992 financial year (Cape Times 11/3/93).
Distribution transformer assessment
It is not possible to make a hard and fast financial assessment of the transformer industry as company results are not available. Weak demand has impacted strongly on this industry and firms have been trimmed to suit the smaller markets. Capital stock has not been expanded in the industry but profitability appears to have been maintained.
Economic performance of the electrical distribution equipment industry — an assessment
Four points may be made in evaluating the economic performance of this sector. First, the market for equipment has declined, this has had a larger impact on the heavy power side, and the relatively smaller reticulation market has been put under more pressure as a result. As a corollary, electrification will revitalise the reticulation market, but will not compensate for the decline in the heavy power sector. The long term revitalisation of the electrical machinery industry has to be through expansion of the latter market. Secondly, firms have responded to the decline in demand by restructuring and downsizing, meaning simply that some divisions have been shut down and workers retrenched. Thirdly, the recession and high interest rates nullified asset replacement and attention shifted to controlling costs on ageing plant. This implies that an upturn will initiate spending on fixed assets. Fourthly, despite these negative factors, the industry has reportedly remained profitable on lower margins.
32 INDUSTRIAL STRATEGY PROJECT
Concentration of supply and concentration of ownership
For low technology items such as line hardware, readyboards, wooden poles and pole top boxes smaller firms are involved and such items could be sourced from alternative suppliers with relative ease. Some simple materials such as concrete poles are produced by a duopoloy and alternative sources able to supply on the scale required would be difficult to find. Budget Energy Controllers make an interesting case as finns competing in the market are both large firms which are part of conglomerates as well as some smaller independent firms. More consideration is given to BEC's in the study of professional electronics.
The markets for important electrical equipment are oligopolistic in character. Essentially it is a matter of foreign control over the required technology. In this, South Africa is not alone, for the world's electrical machinery industry is dominated by a small number of firms. The major producers have formed a cartel through the International Electrical Association, the rationale being to cooperate on technical standards. However, through cross-licencing agreements, barriers to entry are maintained (Faucher, 1991:239). A major consequence of the world wide oligopoly in electrical machinery is the restrictions it places on licensees freedom to trade. This will be shown when trade is discussed.
Company ownership in this industry is highly concentrated. This is particularly so for manufacturers of high value or complex equipment where firms are on the whole linked both to South African conglomerates and major trans national corporations. The main firms referred in this report started originally as subsidiaries and later accepted local shareholding. There are three electrical engineering groups which dominate the industry. They are, with their conglomerate: Powertech owned by Altech and part of Anglo American, GEC part of Barlow Rand through Reunert and Siemens which has South African ownership from the IDC and Federale Volksbeleggings.
Powertech and Reunert can be singled out as groups with significant shares of the electrical distribution equipment market. Both control firms which, amongst other electrical engineering activities, provide cable, transformers and BECs the key items for low cost electrification schemes.
Electricity distribution technology An electricity network typically consists of three distinct components: generation, transmission and distribution. Generation occurs at sites and on a scale where it is most cost effective (Laithwaite, 1980). In South Africa Eskom generates 97% of electricity used (Eskom, 1990) predominantly in coal fired power stations. Energy is conveyed to markets over a transmission network, at high voltages to minimise losses. South Africa has a national grid extending 226 817 Kin operating at voltages up to 765 kV (Eskom, 1992). This grid connects all major population centres and commercial farming areas. The electricity distribution system functions to:
ELECTRICAL EQUIPMENT SECTOR 33
deliver electrical energy from the transmission substations or small generating stations to each customer, transforming to a suitable voltage where necessary. (Lakervi & Holmes, 1989:7).
Feeding electricity from the transmission network directly to the customer is impractical due to large voltage drop required. Large amounts of insulation would be required and would thus make transformers excessively expensive. As a result a medium voltage (MV) network operating between 1kV and 36kV is used to deliver electricity as close to the customer as possible. The MV network provides a suitable backbone from which to tap off power into a low voltage (LV) network operating below 1kV which delivers power to each customer. Most MV networks are designed on a ring system to facilitate the isolation of faults and provide a continuity of supply to surrounding consumers. Rural or low density areas tend to be served by a single MV supply line which radiate as spurs from a substation. In the MV range higher voltages reduce power losses. Most domestic distribution in South Africa is done from 11 kV lines, but where new networks are to be built the preferred voltages are higher: 22 kV or 33 kV. In places where electricity demand will grow, the initially higher material costs of higher voltage lines will become economically justifiable as upgrading the system can be done more cheaply.
Electricity distribution, spans medium and low voltage networks. The layout of a distribution network will vary to suit conditions and design choices, yet have fundamentally the same features. Consumer density, current and future demand are the most important influences on the system configuration. The key items of equipment in a MV network are the high voltage / medium voltage substations, conductor of the required capacity either underground cable or overhead cable and protection equipment. Particular attention is paid to dealing with faults in the MV network through the installation of protection equipment, as their cost is warranted by the value network components. Protection equipment guards against over voltage situations or damage by lightning. By means of circuit breakers, autoreclosing and sectionaliser circuit breakers, parts of the network may be disconnected to deal with faults, maintenance and upgrading. Depending upon the design, continuity of supply may be maintained to all parts of the network apart from the section experiencing a fault through the use of circuit breakers where the network is laid out in a ring or grid pattern. Monitoring equipment to measure loads, losses and detect faults is frequently installed on MV networks, but would not be economically justifiable on LV networks.
The low voltage network consists of transformers, the appropriate conductor, either underground or overhead, service cables plus metering devices and terminating at the customers supply point. Isolation and protection equipment is usually kept to a minimum on low voltage networks, with a balance being struck by an installation sufficient to make maintenance easy. Street lighting is usually run directly off the LV network.
Operating costs influence network design and the specification of equipment. Networks inevitably lose a certain amount of energy through conductor inefficiency. Reticulation costs consist of the network capital costs, support costs and network losses (Barnard, 1991) with the former directly influencing the latter. An example for transformers serves
34 INDUSTRIAL STRATEGY PROJECT
to illustrate the point. The average distribution transformer loses some 2000W, (company interview) given off as heat. By increasing the material content of the transformers, losses can be reduced, which would raise their capital costs but reduce their operating costs. In view of the objectives of a mass electrification programme, this is a trade off which goes to the heart of the problem of widening access to electricity at the lowest cost. Most municipalities do not cost the operation of their networks over a fixed period and specify standard loss transformers, rationalising this by the fact that transforms constitute a small share of losses on a LV system since between 5% and 7% of total power is lost in the conductor. Eskom, in promoting energy efficiency encourages the use of low loss transformers. Losses on high voltage systems are very significant and carefully monitored.
Current practice for distribution network design
As has been pointed out in Chapter One, the design and construction of distribution networks is governed by regulations set out in the Electricity Act, by SABS specifications for equipment along with codes of practice and design guides, developed by the AMEU. In addition safety regulations laid down by the Machinery and Occupational Safety Act have to be observed.
Notwithstanding the problems of a lack of uniform standards between electricity supply authorities, a set of recommendations of preferred methods, equipment and materials has been drawn up by the National Rationalised Specifications Project, coordinated by Eskom, (NRS 1992). Drawing on NRS reports, an outline of the main features of low cost designs for low income areas and a low average energy consumption per household will be presented below.
Overhead reticulation has considerable cost advantages over other methods. A widely held view of South African electrical standards is that these are excessive in certain regards and need relaxation to stretch resources and bring them into line with international practice. Domestic reticulation using covered overhead cable is relatively new in South Africa and is regarded with scepticism by some electrical engineers. The move to overhead cable is motivated by cost, as it costs 40% to 50% the cost of equivalent underground cable. Covered overhead cable, Aerial Bundle Conductor in particular, is far more reliable than bare overhead networks, as the table below shows. New housing schemes will probably be electrified using overhead networks on a larger scale in future, and not only low cost schemes, it has been suggested.
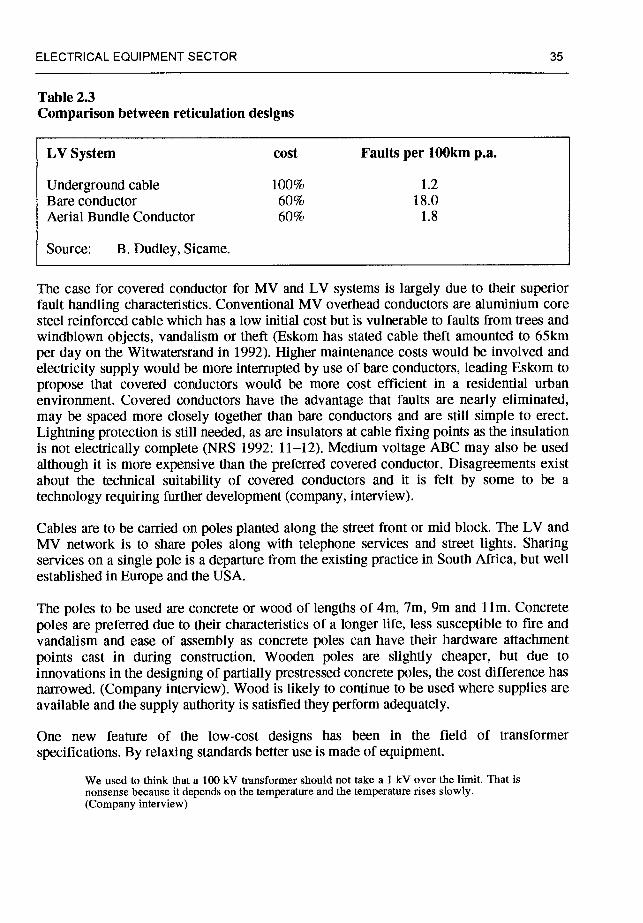
ELECTRICAL EQUIPMENT SECTOR 35
Table 2.3 Comparison between reticulation designs
LV System cost Faults per 190km p.a.
Underground cable 100% 1.2 Bare conductor 60% 18.0 Aerial Bundle Conductor 60% 1.8
Source: B. Dudley, Sicame.
The case for covered conductor for MV and LV systems is largely due to their superior fault handling characteristics. Conventional MV overhead conductors are aluminium core steel reinforced cable which has a low initial cost but is vulnerable to faults from trees and windblown objects, vandalism or theft (Eskom has stated cable theft amounted to 65km per day on the Witwatersrand in 1992). Higher maintenance costs would be involved and electricity supply would be more interrupted by use of bare conductors, leading Eskom to propose that covered conductors would be more cost efficient in a residential urban environment. Covered conductors have the advantage that faults are nearly eliminated, may be spaced more closely together than bare conductors and are still simple to erect. Lightning protection is still needed, as are insulators at cable fixing points as the insulation is not electrically complete (NRS 1992: 11—12). Medium voltage ABC may also be used although it is more expensive than the preferred covered conductor. Disagreements exist about the technical suitability of covered conductors and it is felt by some to be a technology requiring further development (company, interview).
Cables are to be carried on poles planted along the street front or mid block. The LV and MV network is to share poles along with telephone services and Street lights. Sharing services on a single pole is a departure from the existing practice in South Africa, but well established in Europe and the USA.
The poles to be used are concrete or wood of lengths of 4m, 7m, 9m and 11 m. Concrete poles are preferred due to their characteristics of a longer life, less susceptible to fire and vandalism and ease of assembly as concrete poles can have their hardware attachment points cast in during construction. Wooden poles are slightly cheaper, but due to innovations in the designing of partially prestressed concrete poles, the cost difference has narrowed. (Company interview). Wood is likely to continue to be used where supplies are available and the supply authority is satisfied they perform adequately.
One new feature of the low-cost designs has been in the field of transformer
specifications. By relaxing standards better use is made of equipment.
We used to think that a 100 kV transformer should not take a 1 kV over the limit. That is nonsense because it depends on the temperature and the temperature rises slowly. (Company interview)
36 INDUSTRIAL STRATEGY PROJECT
Domestic consumers have an erratic load patterns, which peaks for three hours at 5am and 4pm. A transformer rated for 100 kV can take an overload peak of 150 kV for some time while it heats up, and will not have reached its maximum safe temperature by the time the peak demand is over. Losses more than double during the peak period, however, the modifications needed to cope with the overload add only a further 25% to the cost, realising a saving of 75% on a transformer which would only reach a full capacity load for a quarter of its operating cycle. Transformers of this design have a nominal rating of 100 kVA and a cyclic overload rating of 160 kVA. They are fitted with built in circuit breakers which would isolate the transformer from the MV network in the event of a fault and are called completely self protected (CSP) transformers.
Low voltage reticulation is to be by means of aerial bundle conductor. There are two type of ABC in use in South Africa: a catenery supporting core type in which three aluminium phase cores are attached to an aluminium alloy supporting core, and a self supporting system in which four aluminium conductors all bear the strain of the cable. Both cable types are extensively used, however, Eskom has proposed the self supporting system be used.
Customers houses are to be connected to the LV ABC by a split concentric cable service cable. This type of cable is compact and designed for safety and to eliminate tampering, as efforts to reach the phase core will short it.
The choice of metering depends on the available infrastructure and may use conventional credit meters if the supply authority has facilities to properly bill customers and gather revenue. Where such circumstance do not prevail, Budget Energy Controllers (BEC) may be preferred. These pre-payment electricity meters have been extensively developed locally to suit the needs of supply authorities in South Africa and represent one of the most significant electronics product developments of the last four years.
In cases where electricity supplies are taken to houses with preexisting wiring, the supply. authorities responsibilities end at the customers distribution board. As the bulk of homes to be electrified have no internal wiring, a small power distribution unit or ready board, consisting of a light and two or more power points may be installed. New homes to be electrified do not need to be brick structures, for service connections may be safely made to poles planted next to informal housing and fed to BEC and distribution boards supported on poles in a wood or iron dwelling with an earth floor.
Institutions present in the industry The electrical equipment industry is well served by institutions which cover three main areas of activity: professional and scientific, employers associations and trade unions. In addition it is served by bodies which indirectly influence it such as major consumers of the industries products, or in dealings in the field of technical education or with state bodies concerned with tariffs and export incentives such as the Department of Trade and Tariffs.
ELECTRICAL EQUIPMENT SECTOR 37
Professional, scientific and user bodies
On the international front, the Conference on Large High Voltage Systems (CIGRE) and the International Conference on Electricity Distribution (CIRED) promote research on large electrical networks. Wide ranging technical standards are coordinated by the International Electroteclinical Commission (IEC) with whom the South African Bureau of Standards (SABS) liaises. Locally the South African Institute of Electrical Engineers (SAIEE) is the most important professional body for the industry which is a statutory engineering body representing the interests of eligible professionals. Functions performed by these bodies include professional education and the institute has been active in promoting research on low cost distribution networks through convening workshops on the subject. Related professional bodies are the South African Engineering Association (SAVI) and the South African Association of Consulting Engineers (SAACE). For non- professional engineers such as technicians and practicioners without formal qualifications, there exists the South African Institute of Electrical Technician Engineers (SAIETE).
Scientific bodies involved in the electrical engineering industry are the Council for Scientific and Industrial Research (CSIR) with a division of Energy Technology which has had a long term involvement in lightning protection engineering. In line with the commercialisation of the CSIR, this division has increased the amount of technical consultations it undertakes for the public and private sector. University based research on power systems is loosely coordinated by participating electrical engineering departments. The National Energy Council, a state body responsible for energy policy sponsors research on various topics related to the use of electricity. It does not deal with industrial research.
University and technikon electrical engineering departments are involved in training engineers and technicians as well as conducting research programmes.
The evaluation and testing services performed by the SABS ensure equipment conforms to performance and quality standards derived from international bodies or developed locally. In addition the SABS evaluates firms production engineering activities and issues certification for quality production, the SABS 0157 mark, which is a local variant of the International Standards Organisation (ISO) 9000 quality system.
Through the Association of Municipal Electrical Undertakings (AMEU) supply authorities are grouped together and represent the interests of purchasers and operators of electrical distribution equipment. This body has contributed to the work of the National Rationalisation of Specifications Project (NRS) which functions to promote standardization of electrical equipment used by distribution authorities. More will be said about it in due course.
38 INDUSTRIAL STRATEGY PROJECT
Representation of the interests of large users of electricity is coordinated through the Users Society of Engineering Resources and Services, which brings together the large mining houses, giant chemical concerns, and parastatals like the Atomic Energy Corporation, Eskom and Transnet. The objective of this body was to promote local development of the capital goods sector and monitor quality.
Trade associations
The umbrella body for producers of electrical equipment is the Electrical Manufacturers Federation (EMF). Firms in the industry fall under the Iron Steel and Metallurgical Industrial Council for the purposes of collective bargaining where they are collectively represented by the Steel and Engineering Industries Federation of South Africa (SEIFSA). Several industries maintain their own employers associations, some of which have regional bodies as well. In the electrical engineering industry these associations are Electrical Engineering and Allied Industries Association (EEAIA) and the Covered Conductor Manufacturers Association (CC MA).
The electric cable industry maintains its own body, the Association of Electric Cable Manufactures (AECM). This body represents the large manufacturers in the industry. It was established in 1956 to promote common ground between the manufacturers and brought into effect standard specifications, common tender formats and a standardisation of cost adjustment, as well as carrying company mandates to the industrial council for wage negotiations. Lobbying for tariff protection was the main rationale for the formation of the association and it made regular representations to the then Board of Trade and Industries. Since the formation of the joint marketing company Electric Products International (EPI), the EPI has undertaken the task of lobbying for the industry.
Trade unions
Trade union organisation in the electrical engineering industry is high. By virtue of the large scale enterprises involved, relative stability of the workforce and strategic focusing of unions, many of the large firms have been organised. The dominant union in the industry is the countries largest, the National Union of Metal Workers of South Africa (NUMSA) an affiliate of the Congress of South African Trade Unions (COSATU). NUMSA maintains an engineering division covering the whole engineering sector and does not have a permanent section dealing with electrical equipment on its own.
A significant presence is held by the Metal and Electrical Workers Union of South Africa (MEWUSA) a National Council of Trade Unions (NACTU) affiliate. A third union of note is the South African Electrical Workers Association, (SAEWA) which confines its organisation to white workers and was affiliated to the conservative whites only Council of Mining and Building Unions.
ELECTRICAL EQUIPMENT SECTOR 39
Other institutions
In moves to launch a mass electrification programme a number of bodies representing civic and political groups have been active. Early in 1992 the African National Congress convened a national meeting on electrification, from which a National Electrification Forum (NEF) has been formed bringing together the major interested parties consisting of development finance institutions, electricity supply authorities, civic and consumer bodies, trade unions and industry associations. The National Electrification Forum maintains a technology and environment sub-committee dealing inter alia with equipment manufacture.
Chapter Three: Trade
This chapter is to provide an account of the trade regime as it pertains to electrical distribution equipment and its trade performance, set in the wider context of trade in the electrical machinery industry.
As will be seen in due course, trade does not feature heavily in the key equipment used for electrification. In addition, the export performance of firms in this sector has been poor. However, this does not negate the need to develop policy on trade as part of an industrial
policy for the electrical equipment sector. Questions to be born in mind when approaching the subject are the likely consequences of a liberalisation in the trade regime as a whole and considerations of promoting growth in exports from the distribution equipment sector.
Trade matters are examined in two sections, the first section an overview of trade in the electrical machinery sector is provided, through which it is possible to see significant trends over time. In the second section a detailed discussion of trade in electrical distribution equipment is presented and the implications discussed.
Overview of trade in electrical machinery As has been referred to in the section on the history of the electrical equipment industry, the manufacture of electrical machinery was undertaken in South Africa as a part of government policy to industrialise by the encouragement of import substituting industries. The electrical machinery industry grew to provide for a domestic market, heavily influenced by the needs of mineral processing industries. Note that time series data used in this chapter is from the Central Economic Advisory Service (CEAS) statistical department.
Imports of electrical machinery
Imports for South Africa between 1969 and 1990 in constant 1985 rands are shown in graph 3.1. Electrical industrial machinery imports (ISIC 3831) grew in real 1985 rands on an upward trend to R850 million in 1976 and then declined to R400 million in 1979. During the 1980's imports fluctuated, rising to R800 million in 1981 and subsequently falling to 400 million in 1983. From 1984 onwards, imports have been on a mild downward trend and finished off the decade at R450 million. Sustained growth of the electricity network and the building of major capital projects by Eskom account for the rise of imports during the early 1970's. The gold boom of 1980 pushed up demand for
imports but the lack of fixed capital investment through the rest of the decade has resulted in a weakening of demand for this sector's products and as a result, import demand has slackened.
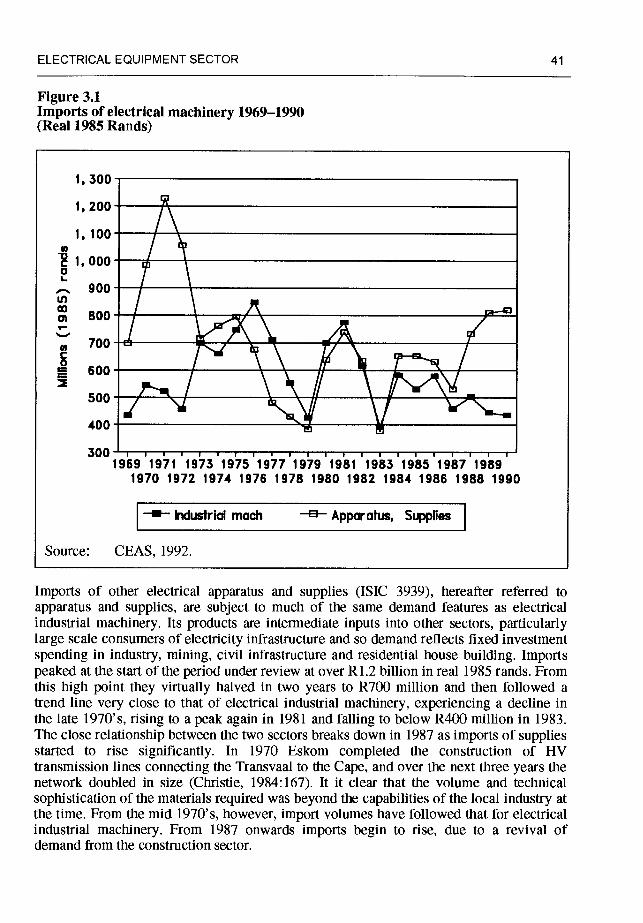
ELECTRICAL EQUIPMENT SECTOR 41
Figure 3.1 Imports of electrical machinery 1969—1990 (Real 1985 Rands)
1, 300
1, 200'
1, 100'
- 1,000
900
I \/yk 300 I
1969 1971 1973 1975 1977 1979 1981 1983 1985 1987 1989 1970 1972 1974 1976 1978 1980 1982 1984 1986 1988 1990
— Industrial mach —s— Apparatus, Supplies
Source: CEAS, 1992.
Imports of other electrical apparatus and supplies (ISIC 3939), hereafter referred to apparatus and supplies, are subject to much of the same demand features as electrical industrial machinery. Its products are intermediate inputs into other sectors, particularly large scale consumers of electricity infrastructure and so demand reflects fixed investment spending in industry, mining, civil infrastructure and residential house building. Imports peaked at the start of the period under review at over Ri .2 billion in real 1985 rands. From this high point they virtually halved in two years to R700 million and then followed a trend line very close to that of electrical industrial machinery, experiencing a decline in the late 1970's, rising to a peak again in 1981 and falling to below R400 million in 1983. The close relationship between the two sectors breaks down in 1987 as imports of supplies started to rise significantly. In 1970 Eskom completed the construction of HV transmission lines connecting the Transvaal to the Cape, and over the next three years the network doubled in size (Christie, 1984:167). It it clear that the volume and technical sophistication of the materials required was beyond the capabilities of the local industry at the time. From the mid 1970's, however, import volumes have followed that for electrical industrial machinery. From 1987 onwards imports begin to rise, due to a revival of demand from the construction sector.
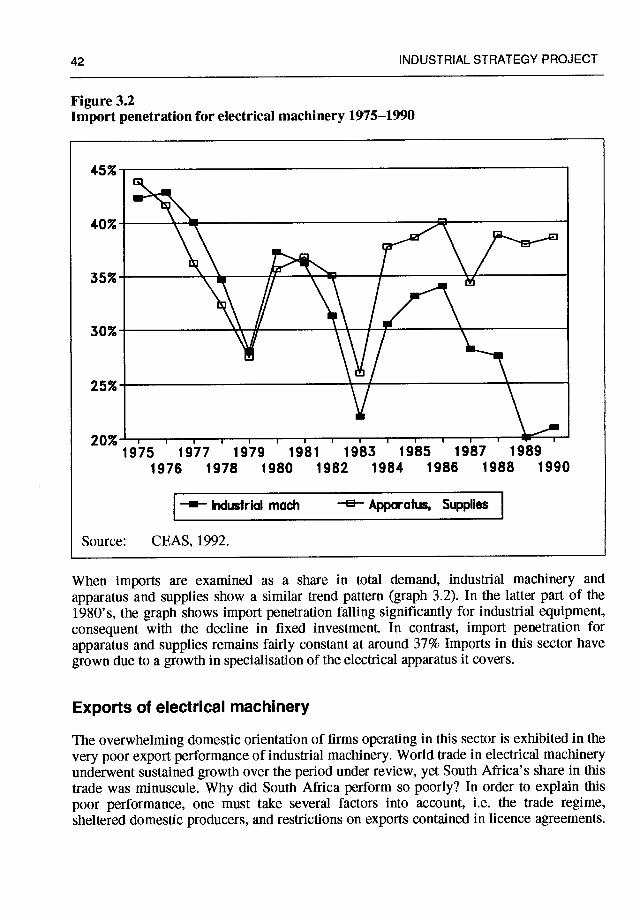
42 INDUSTRIAL STRATEGY PROJECT
Figure 3.2 Import penetration for electrical machinery 1975—1990
45%.
40%
35%. \\ 30%
20% 1975 1977 1979 1981 1983 1985 1987 1989
1976 1978 1980 1982 1984 1986 1988 1990
—— Industrial mach —s— Appratus, Supplies
Source: CEAS, 1992.
When imports are examined as a share in total demand, industrial machinery and
apparatus and supplies show a similar trend pattern (graph 3.2). In the latter part of the 1980's, the graph shows import penetration falling significantly for industrial equipment, consequent with the decline in fixed investment. In contrast, import penetration for
apparatus and supplies remains fairly constant at around 37% Imports in this sector have
grown due to a growth in specialisation of the electrical apparatus it covers.
Exports of electrical machinery
The overwhelming domestic orientation of firms operating in this sector is exhibited in the very poor export performance of industrial machinery. World trade in electrical machinery underwent sustained growth over the period under review, yet South Africa's share in this trade was minuscule. Why did South Africa perform so poorly? In order to explain this
poor performance, one must take several factors into account, i.e. the trade regime, sheltered domestic producers, and restrictions on exports contained in licence agreements.
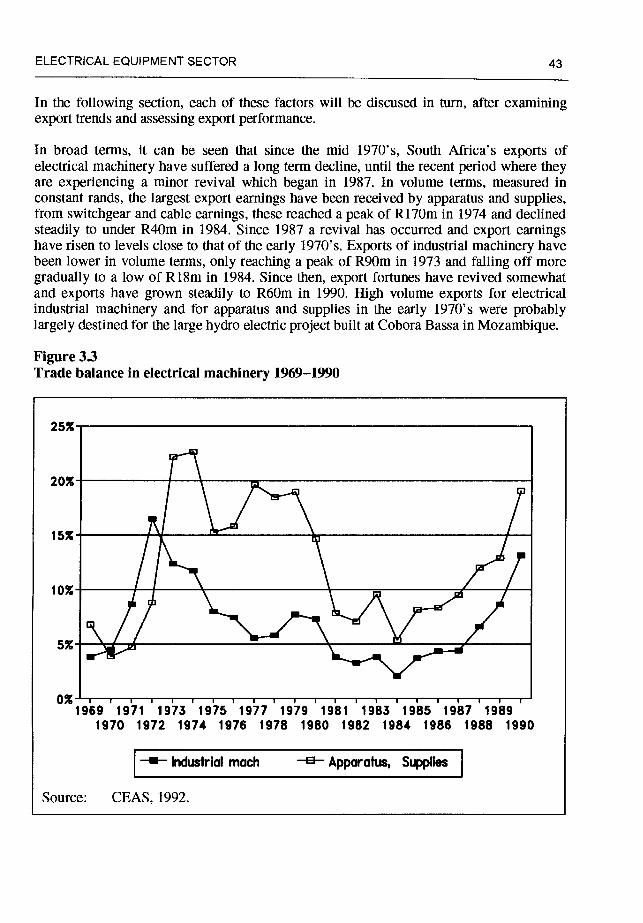
ELECTRICAL EQUIPMENT SECTOR 43
In the following section, each of these factors will be discused in turn, after examining export trends and assessing export performance.
In broad tenns, it can be seen that since the mid 1970's, South Africa's exports of electrical machinery have suffered a long term decline, until the recent period where they are experiencing a minor revival which began in 1987. In volume terms, measured in constant rands, the largest export earnings have been received by apparatus and supplies, from switchgear and cable earnings, these reached a peak of R170m in 1974 and declined steadily to under R40m in 1984. Since 1987 a revival has occurred and export earnings have risen to levels close to that of the early 1970's. Exports of industrial machinery have been lower in volume terms, only reaching a peak of R90m in 1973 and falling off more gradually to a low of R18m in 1984. Since then, export fortunes have revived somewhat and exports have grown steadily to R60m in 1990. High volume exports for electrical industrial machinery and for apparatus and supplies in the early 1970's were probably largely destined for the large hydro electric project built at Cobora Bassa in Mozambique.
Figure 33 Trade balance in electrical machinery 1969—1990
25%
20% I 5%.
0% 1969 1971 1973 1975 1977 1979 1981 1983 1985 1987 1989
1970 1972 1974 1976 1978 1980 1982 1984 1986 1988 1990
—— Industrial mach —— Apparatus, Supplies
Source: CEAS, 1992.
44 INDUSTRIAL STRATEGY PROJECT
An examination of the trade balance in electrical machinery shows exports as a percentage imports declined steadily for industrial electrical machinery from over 15% in 1972 to a mere 3% in the 1980's. The trade imbalance narrowed slightly in the period 1987—1992 as
exports when up to 14% of imports. Apparatus and supplies maintained a slightly better performance than electrical machinery. During the 1970's exports consistently held above 15% of imports, but in the early 1980's this declined and subsequently fluctuated around 7%. From 1987 onwards exports rose to 19% of imports.
Annual growth rates of exports for selected periods are shown in table 3.1 in Appendix I which indicates how poorly electrical machinery has performed in export markets for all
periods, bar the early 1970's and late 1980's. The fact that it has undergone something of a revival is encouraging and poses the question what has changed to prompt such export growth in the light of poor demand in this sector? The answer to this question requires a closer look at the trade regime, a matter to which we will return after examining the macro picture for exports in a little more detail.
Revealed comparative advantage of electrical machinery
An attempt to assess the international competitiveness of the industries under investigation is motivated as much by considerations of their potential to expand exports, as by the converse: a widening of the already large trade gap. One method to do this is to perform tests to show the revealed comparative advantage of the sector, as a form of proxy for measuring international competitiveness. Given that the tests of comparative advantage are normally undertaken to reveal the winners and losers of a number of sectors, the following is a partial application of the test.
First, we shall examine the ratio of exports to production shown in table 3.2. in Appendix I. The ratio of exports to production for electrical machinery as a whole has declined by almost a third, from 0.09 in 1975 to 0.064 in 1990. As has already been discussed above in relation to export volumes, the situation for electrical industrial machinery apparatus and
supplies is volatile but equally shows the proportion of exports in production to be declining until 1987.
The second test is of the proportion of net exports in trade which is a way of seeing how exports fare in relation to imports (table 3.3 in Appendix I). What this shows is that the revealed comparative advantage for electrical machinery as a whole has declined, making it, one of the least competitive manufacturing sectors in export markets.
When one considers trends in world trade, South Africa's poor performance is all the more starkly revealed. One recent study, which examined the question of how South Africa has performed relative to other developed and developing countries indicates that, between 1960 and 1987, the rate of growth of South African exports was below that of both developed and other developing countries. This study found that the magnitude of export growth of machinery and transport equipment from developing countries was is five times larger than that achieved by South Africa; and that the country failed to enter the markets which showed the greatest growth (Wood & Moll, 1992:14—15).
ELECTRICAL EQUIPMENT SECTOR 45
Data from the General Agreement on Tariffs and Trade show that world trade for machinery and transport equipment grew by an average annual rate of 9% from 1980 to 1990; a growth that South Africa clearly missed as an insignificant player in this important segment of world trade. Electrical machinery and apparatus exports in the world's largest markets of North America, Western Europe and Japan amounted to 100.7 billion dollars in 1990, of which South Africa's exports in that year would represent a mere 0.167%.
The trade regime for electrical machinery
A country's structure of tariffs on imports and its export assistance make up its trade regime. Historically, the major tools used by the South African government to promote industrialisation were the setting of tariffs at levels which afforded domestic producers protection from foreign competition. The cumulative effect of the trade regime has been to give the manufacturing industry an inward, domestic focus. Imports are subject to customs duties, add valorem duties, and quantitative restrictions in the form of import controls or formula duties, the latter consisting of an add valorem tariff backed with a minimum duty. In addition, a surcharge has been levied on imports to choke of demand when balance of payment problems have occurred. Initially introduced at 15%, this was reduced to a minimum level of 5% but has been retained as a source of revenue.
Steps towards more neutrality in the South African trade regime's bias against exports have been taken by the government in recognition of the need to develop exports and in a move towards a more outward orientated trade regime. However, trade liberalisation measures have not been consistent or sufficiently far reaching, indeed a great deal of confusion has surrounded the governments actions in this regard. Nevertheless, in successive steps, trade liberalisation was carried out in the early 1970's and again from 1983 onwards (Bell, 1992).
Rates of protection for electrical machinery
What are the protection rates affecting electrical machinery? The Industrial Development Corporation (IDC) calculated, as of May 1992, that electrical industrial machinery has an average nominal protection rate of 15%. The average for manufacturing is 20%. In terms of the tariffs applied of as a percentage of tariff headings the following pertains:
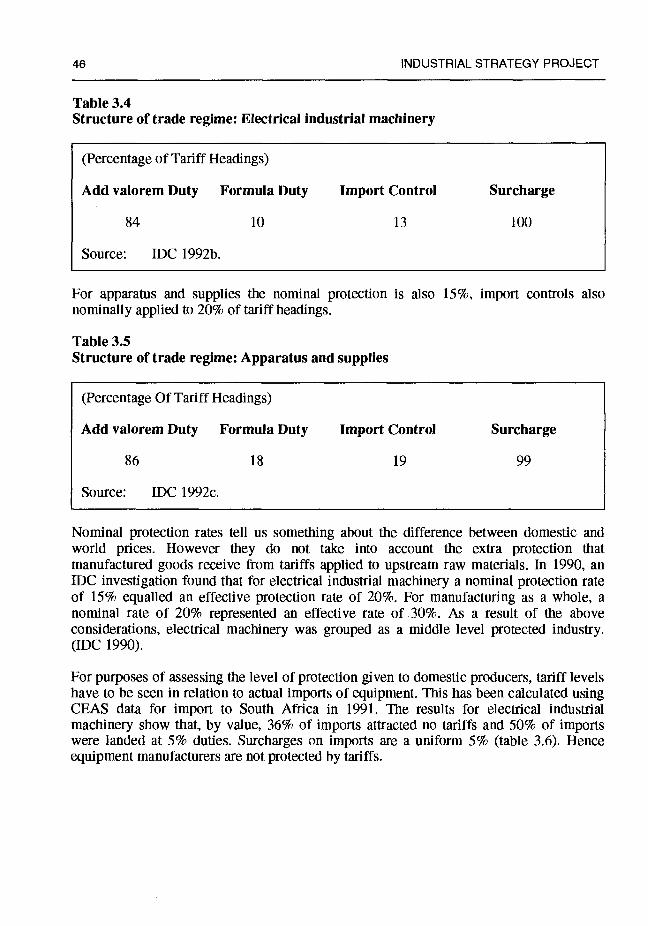
46 INDUSTRIAL STRATEGY PROJECT
Table 3.4 Structure of trade regime: Electrical industrial machinery
(Percentage of Tariff Headings)
Add valorem Duty Formula Duty Import Control Surcharge
84 10 13 100
Source: IDC 1992b.
For apparatus and supplies the nominal protection is also 15%, import controls also nominally applied to 20% of tariff headings.
Table 3.5 Structure of trade regime: Apparatus and supplies
(Percentage Of Tariff Headings)
Add valorem Duty Formula Duty Import Control Surcharge
86 18 19 99
Source: IDC 1992c.
Nominal protection rates tell us something about the difference between domestic and world prices. However they do not take into account the extra protection that manufactured goods receive from tariffs applied to upstream raw materials. In 1990, an IDC investigation found that for electrical industrial machinery a nominal protection rate of 15% equalled an effective protection rate of 20%. For manufacturing as a whole, a nominal rate of 20% represented an effective rate of 30%. As a result of the above considerations, electrical machinery was grouped as a middle level protected industry. (IDC 1990).
For purposes of assessing the level of protection given to domestic producers, tariff levels have to be seen in relation to actual imports of equipment. This has been calculated using CEAS data for import to South Africa in 1991. The results for electrical industrial machinery show that, by value, 36% of imports attracted no tariffs and 50% of imports were landed at 5% duties. Surcharges on imports are a uniform 5% (table 3.6). Hence equipment manufacturers are not protected by tariffs.
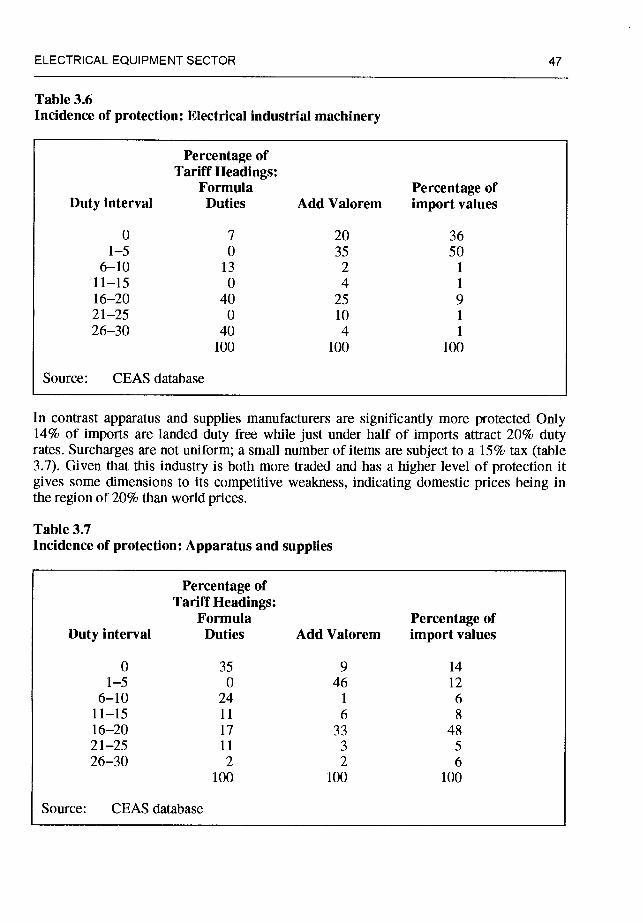
ELECTRICAL EQUIPMENT SECTOR 47
Table 3.6 Incidence of protection: Electrical industrial machinery
Percentage of Tariff Headings:
Formula Percentage of Duty interval Duties Add Valorem import values
0 7 20 36 1—5 0 35 50
6—10 13 2 1
11—15 0 4 1
16—20 40 25 9 21—25 0 10 1
26—30 40 4 1
100 100 100
Source: CEAS database
In contrast apparatus and supplies manufacturers are significantly more protected Only 14% of imports are landed duty free while just under half of imports attract 20% duty rates. Surcharges are not uniform; a small number of items are subject to a 15% tax (table 3.7). Given that this industry is both more traded and has a higher level of protection it gives some dimensions to its competitive weakness, indicating domestic prices being in the region of 20% than world prices.
Table 3.7 Incidence of protection: Apparatus and supplies
Percentage of Tariff Headings:
Formula Percentage of Duty interval Duties Add Valorem import values
0 35 9 14 1—5 0 46 12
6—10 24 1 6 11—15 11 6 8 16—20 17 33 48 21—25 11 3 5 26—30 2 2 6
100 100 100
Source: CEAS database
48 INDUSTRIAL STRATEGY PROJECT
Export incentives
Export incentives have been in place in different forms for several years, and from 1980 exporters were able to obtain rebates on duties of imported raw materials, subsidies for overseas marketing expenses and even assistance to overcome the effects of domestic tariff protection. Criticism of the earlier schemes ushered in the new incentive system with effect from 1990, the General Export Incentive Scheme (GElS) and complementary Export Marketing Assistance Scheme (EMAS). These are set to run until 1995.
GElS was intended to promote exports of higher value added products and also to take exchange rate fluctuations into account. Assistance is granted on a sliding scale in four categories: one, primary products; two, benificiated primary products; three, material intensive products and four, manufactured products. For 1992 the exchange rate factor was fixed at a level which gave manufactured products a rebate of 18.5% of the Free On Board (FOB) value of exports where local content reaches 75% or more. GElS credits are paid in cash to qualifying firms. Along with GElS, the Department of Trade and Tariffs administers the EMAS which provides assistance in primary export market research for firms and collective market research by trade associations. Assistance is also available for outward selling and inward buying trade missions, as well as for exhibition attendance. GElS is funded from the fiscus, and is expensive. It is estimated that the level of subsidies being given will absorb almost the entire DTI budget for 1992/93 of R3 billion. GElS has been criticised for its cost and also because it grants direct subsidies which runs counter to GAIT principles.
Export assistance is provided for automobile assemblers and component manufacturers under phase VI of the local content programme for the automobile industry. Where electrical machinery manufacturers provide products to the automobile industry for export they qualify assistance.
GElS support for exports of electrical industrial machinery is comprehensive; some 68% of exports by value were eligible for category four subsidies, while the remaining 32%
qualified under the phase VI programme (IDC, 1992b:7). For apparatus and supplies; one percent of exports fell under category three of GElS, 92% under category four and 7% under phase VI (IDC, 1992c:7).
Assessing export performance of electrical machinery
Evidence in this chapter has emphasised that the electrical machinery industry has been bad at exporting but improved somewhat since 1987. What then is driving these improvements. Can this be attributed to trade liberalisation? Exports as a proportion of production have grown faster than absolute exports. One possible explanation is that firms have shifted attention to export markets in response to declining domestic demand, a course of action which became more feasible as trade sanctions weakened. With regard to the trade regime, it is significant to note that the apparatus and supplies industry obtained the highest growth in exports; yet it receives greater protection than industrial machinery, indicating that lower protection does not, on its own, facilitate exports. In the light of the
ELECTRICAL EQUIPMENT SECTOR 49
moderate incidence of tariffs applicable, reducing the tariff rates for both these sub sectors will not substantially adversely affect them.
The poor export performance for electrical machinery cannot be explained by the import bias of the trade regime alone. The key problem from the point of view of manufacturers, above that of local cost structures, are the marketing restrictions placed on firms who manufacture under licence. Because virtually all the key technology in the electrical distribution equipment industry originates from foreign firms and is licensed to local producers, restrictions placed on licence agreements are particularly important. South African producers are predominantly confined to seeking export markets in sub-Saharan Africa and may only enter other markets where they do not compete with the parent company. Thus local firms are forced direct their export efforts to small African markets, which are by no means their exclusive preserve.
The importance of exporting
For the electrical distribution equipment industry, the question of trade is not simply a matter of understanding the role of imports in supplementing local production, and the effects of imports on domestic competitiveness and prices. While the substantive issue remains the role imports should play in electrification, the question of exports cannot be dismissed.
In the first instance, successful exporting is a means of overcoming low capacity utilization that results from the poor state of domestic demand. It has become widely accepted that the share of higher value added manufactures in exports needs to rise and that South Africa needs to increase its share of trade in the high growth, and high value trade categories of machinery and transport equipment. This is necessary to achieve economic growth and also to generate foreign exchange for balance of payments purposes. Associated with exports are a number of other important economic consequences involving the effects of such markets on the internal structure of firms. It is now widely acknowledged that exports provide very important learning influences. Participation in export markets extend firms' abilities by providing clear signals from the forefront of competition with respect to innovation, quality and cost.
Thus far, the discussion has been conducted at an industry and sub sector level. It is now time to look a lot more closely at the trade profile of the electrical distribution equipment industry to assess the degree of import penetration and export potential of key equipment items in terms of patterns of world trade.
50 INDUSTRIAL STRATEGY PROJECT
Electrical distribution equipment trade
Trade in electrical distribution equipment
A detailed breakdown of imports and exports for the South African Customs Union between 1988 and 1991 is provided in table 3.8 in Appendix I. As the customs union includes Botswana, Swaziland and Lesotho imports would be swollen by their markets but exports would be unaffected because they are not producers of electrical distribution equipment.
For the important categories of transformers, switchgear, insulated wire and cable and insulators imports in real terms have fallen 40.8% between 1988 and 1991. Real exports grew from a small base to R180 million in 1990 but collapsed dramatically the following year to 2.6% below 1988 volumes (table 3.9 in Appendix I) mainly due to a collapse in heavy switchgear and transformer exports.
Transformers
The growth of power networks around the world establishes the major markets for crucial equipment such as transformers, within which, a division may be made between high density networks in developed countries and new electrification projects. World markets experiencing growth are in Eastern Europe, the Middle East, Southern Africa, parts of Latin America and South East Asia.
Technical standards to some extent divide the world up into different regions of common frequencies, operating current and distribution voltages. The United States, for example, is a very large market for electrical equipment, but operates on standards not used in South Africa. To a certain extent this affords South Africa a degree of technical protection, but equally makes local manufactures incompatible with standards in the large North American and Asian markets. South African standards are closer to those of Europe, and it is from that quarter that the main import competition stems.
Owing to the simple technology inherent in distribution transformers, these may be regarded as commodity items (company interview). However, large power transformers remain speciality engineering products. Import substitution has been extensively followed in many countries with large domestic markets, in much the same way as in South Africa. Brazil, Argentina, India and Pakistan are relevant examples of highly protected markets. At least some raw materials for manufacturing transformers generally need to be imported, even by countries with import substituting policies. The consequence of high tariffs on inputs and finished goods is to raise the price to consumers as well as blocking foreign competition in the domestic market, thereby permitting the formation of cartels.
Features of competitiveness in the transformer market, as perceived by a major international exporter based in the European Union are: a) price; b) quality as a basic requirement in a buyers market; c) flexibility to adapt to customers needs; d) reliability of
ELECTRICAL EQUIPMENT SECTOR 51
delivery time. When consistent high quality is achieved, after sales service becomes less
important. Location is not an important factor with competitively priced freight services
(company interview).
At present the world is experiencing an oversupply in Iransformer manufacturing capacity. The causes of this oversupply are two fold: firstly, declining demand due to slow growth in the developed country economies and secondly, the additional capacity new entrants bring. The reason why new finns are being established is that transformer manufacture is an easy entry point for a country to industrialise an electrical machinery industry. Thus in growing markets where new electrification programmes are underway, import substitution frequently takes place. Since the technology involved is relatively simple, and the products mature, technology is not a major barrier for entry to the distribution transformer industry. Trade in smaller distribution transformers is accordingly a declining market and exports can expect to find this market segment increasingly competitive. The main strategic responses of the major exporters has been to move out of the distribution market into
higher power transformers, and also to increase their involvement in trading technology through licences and joint ventures (company interview).
South African transformer trade
Imports of transformers, rectifiers and inductors in 1991 amounted to some R158 million rand. However transformers per se accounted for only 22% of this figure, exports were an equal proportion. Moreover, the bulk of imports were small current transformers for use in electrical and electronic equipment. Imports of power transformers are subject to import controls. In 1991 imports of conventional power transformers were negligible. Some R3.9 million of the speciality 'dry type' transformers were imported. Exports of power transformers amounted to a mere Ri .6 million in 1991.
Electricity supply authorities interviewed indicated that they saw no benefit in sourcing distribution transformers from overseas and felt the local industry was satisfactory.
Tariff protection afforded the industry ranges between 15% and 25% ad valorem. In 1990 the Board of Trade and Industry (BTI) published a report on a structural adjustment plan for the industry. In this report, the BTI, stated that insufficient information had been
provided by the industry and this prompted them to conclude that the duties applicable to transformer were too high. (BTI, 1990a: 5).
Transformer exports
Foremost of the obstacles to exports are restrictions placed on licence agreements. Most affected by licence restrictions are the heavy power electrical engineering firms, as the technology involved is more complex and proprietary to the TNC firms from which it is sourced. For distribution transformers product development and adaptations have
substantially altered the equipment from its original designs. Manufacturers still employ the basic winding and core designs, so licence restrictions still apply.
52 INDUSTRIAL STRATEGY PROJECT
South African elecirical equipment manufacturers' export efforts in general are constrained in two respects. As subsidiaries of TNCs they are confined to marketing within the division allocated by their parent company, usually sub-Saharan Africa, markets which are small and difficult to operate in. As licensors of foreign technology they are bound by restrictive trade clauses. For example, one South African transformer firm secured an export order in the Middle East but was prevented from supplying complete units and instead had to supply sub-assemblies to another division within the company.
The importance of extending exports prompted GEC Alsthom to act on this obstacle —
'Licensing and royalty agreements impose territorial limitations on trading but in certain sectors a relaxation of these restrictions has been negotiated.' (Reunert, 1992:12).
None of the transformer finns interviewed maintained their own export departments or assigned sales staff to work exclusively on exports. Since these firms are mainly divisions of larger groups, export marketing has been centralised within the group. Trade sanctions against South African firms have affected transformer companies in that parent companies distanced themselves from their South African operations. Exports made in the late 1980's were erratic and those destined for African countries downplayed. Trade in a post sanctions period is likely to be influenced by more direct involvement of the parent companies; this trend is exemplified by the official return of ABB to South Africa. BBT will export via ABB henceforth. Attention to increasing exports by an order of magnitude features in company reports and mission statements. It is clear that this is a serious attempt to change the orientation of the electrical machinery industry and give it a more outward focus.
Exporting is a demanding task. As one manufacturer put it 'Who would want to do business with Zambia if you can do it at home? Seriously though, exports are to fill capacity or for growth.'
That exports do impose a disciplinary effect on manufacturers is explicitly recognised. 'you cant' do maintenance on exports easily so for service work you need to work through a good agent. It also means you have to work to best quality in the factory. If we have a problem of a transformer leaking oil locally, we can just bring it. You can not do that for exports' (company interview).
Transformer orders are made to specifications set by the customer. This applies no less in the case of exports where manufacturers' products are certified as confirming to SABS standards. To this certain firms have added conformity to American National Standards Institute (ANSI) for acceptability in exports markets. By demonstrating compliance with standards local producers can compete against other international firms on an equal standards footing, rather than with the much lower priced exports which are not certified.
Between 60% and 70% of the cost of a transformer is raw material, of which 24% is imported. Proportions for small distribution transformers are: Core steel, the largest import by value, at 15%, oil 5.5% and insulation 3.5%. Electrical silicon steel is not made locally
ELECTRICAL EQUIPMENT SECTOR 53
as the range of grades required and small volumes render this uneconomic. These are highly traded commodities, available from a number of sources and competitively priced.
'I pay nothing more for anything than people in my group pay overseas, except transport' (company interview) commented an executive of an TNC subsidiary. While imported raw materials are competitively priced, the same does not hold for local raw materials. Local producers pay slightly less than London Metal Exchange (LME) prices for their copper and aluminium i.e. prices calculated on a delivered Europe basis, despite the lower freight costs involved in domestic supply. These two critical locally produced raw materials give transformer manufacturers no advantage against foreign competitors in their export efforts.
Copper and aluminium together account for some 30% of the cost of a transformer. The premium local manufacturers pay is equivalent to CIF charges to London about 12% of the price. Being able to purchase copper, aluminium and steel at export parity prices would reduce the cost of inputs by 10 to 15 percent. This would potentially translate into an overall reduction of three to five percent in the finished product.
Transformer exports qualhly for full GElS subsidies.
'Geis is tremendous, there is no doubt about it, it makes all the difference' (company interview) commented one executive. South African firms have been able to use the subsidy of worth 19.5% of the FOB price of the export to bring their prices into line with international competitors. Without GElS support the industry is 15% to 20% higher priced in international terms. The rationale for GElS was to provide temporary support to firms to break into export markets. While the disciplining effects of exporting have been noted there is little evidence that finns are using GElS support to achieve long term competitiveness by raising productivity. As one interviewee said 'Firms are not learning from GElS. They are not doing enough to justify successful exports' (company interview).
Electrical switchgear
Three principle divisions are usually made in the switchgear market i.e. into domestic, industrial! commercial and large frame. The situation which pertains in the developed countries is the following. The United States is the world's biggest market, followed by Europe. In Europe the French company Merlin Germ is dominant in the industrial and commercial segment in which it faces competition from the Japanese manufacturer Teraskai. In the domestic market Hagar is ranked second, while in the heavy industrial range Mitsubishi is a major player along with Siemens.
South African switchgear trade
Tariff rates for switchgear vary considerably. For items of importance to electricity transmission and distribution the following apply: high voltage switchgear, 15% and low voltage automatic circuit breakers 20% to 25%.
54 INDUSTRIAL STRATEGY PROJECT
In 1990 a BTI investigation into the switchgear industry reported that local producers in the medium voltage section of the industry, with a market of some R100 million, faced a price disadvantage of between 13% and 31% on the FOB cost of imported circuit breakers. As a result, tariffs were increased to 15% (BTI, 1990b).
South Africa is a small market in world terms. The industrial market is dominated by Merlin Germ, with a smaller share being held by Fuchs, manufactured by Circuit Breaker Industries CBI, particularly in the mining industry. Other important players are Reyrolle Switchgear, GEC Switchgear, Hawker Siddley Switchgear and Mitsubishi. CBI is the only local manufacturer of a full range of circuit breakers, using designs originally licensed from Heinemann for the domestic range. All other firms engage in distribution and various degrees of local manufacture or assembly of imported kits.
In the domestic market the Heinemann range dominates with some 80% of a market estimated as being R300 million. Heinemann faces competition from two European producers, Merlin Germ and Hager. The price of imported products is virtually identical to that of locally made products. The local producer is sensitive to price competition and has taken up an anti-dumping case against an importer with the DTI.
Heinemann products dominate the local market. The firm was the first local large scale producer, and the SABS approved products are widely available and supported throughout the country. CBI dominance of the domestic market has been achieved by establishing the South African specific SAMITh dimensions as the de facto standard for domestic circuit breakers. Their entrenched position is derived not from their technical sophistication, as they use older hydraulic magnetic technology.
Electricians are familiar with the range and regard it as a good price and quality product. However, with the high rate of tariff protection given to local producers (20% to 30%) it becomes difficult to judge prices. A much smaller share of the domestic market is held by circuit breakers conforming to the DIN standard. The technology employed is thermal magnetic, this permits breakers to sense temperature rises as well as overload situations. DIN row breakers are smaller, more compact than SAMITE breakers and are favoured by some architects for new buildings and high rise blocks. As these standards are not interchangeable once a standard has been agreed upon it will be maintained, which means that South Africa has a well entrenched unique standard which reduces competition from imports and CBI has a monopoly of supply. As a unique standard, local production is not suitable for exports into world markets.
SAMITE standards have been used in a number of Southern African countries which has provided CBI with modest export markets. Conversion to DIN standards is a requirement for wider acceptability, which is feasible with modification of the case moulding, but not all aspects conform to IEC specifications. This clearly limits exports and requires tooling specifically for export markets. CBI is planning to raise exports above the current estimated 10% (company interview). To accomplish this R&D efforts have been expanded and production facilities enhanced (Reunert, 1992). Innovation by CBI has been recognised by winning technology awards.
ELECTRICAL EQUIPMENT SECTOR 55
As CBI has the capacity to supply the local market and enjoys a monopoly in the domestic range, it has embarked upon an export drive for expansion. The firms' strategy is to produce a DIN standard range utilizing proprietary technology to circumvent licence restrictions. This will continue to use hydraulic magnetic principles; a technology in which CBI operates one of the largest plants in the world. To overcome problems in the supply of raw materials, the firm has run a customer development programme for several years with the aim of eliminating the competitive disadvantage that it is at present faced with in respect to raw materials. Quality at source and Just In Time production methods have been evolved in the company for several years and these are factors underpining its hopes to raise exports to between 30% and 40% of turnover over the next four years. Competitiveness in export markets is not dependent upon GEtS subsidies the firm claims (company interview). Organisational changes embarked upon by CBI recognise that exporting and productivity changes are integrally linked.
Insulated electric cable
Insulated electric cable is highly traded in international markets in which price is the feature of competition, followed by delivery time. Quality and standards do not rate first as these are applied as requirements for tendering, so that many customers will not accept bids from firms which do not have certification to ISO, VDE, ANSI or UK standards. Exports and imports of cable to South Africa are much affected by currency movements and the cost of freight. The latter aspect can be a large cost component in a material as bulky as eleciric cable. South African manufacturers believe their main competition in the import and export markets to be European firms. Thus far, the Far East is not regarded as a major competitive threat.
South African insulated electric cable trade
In 1991 FOB imports of cable types suitable for electricity distribution amounted to R35.6 million. Exports in the same category came to R6. 33 million. The tariff applicable to imports is 17.5% Full rebates are granted on tariffs applicable to imported raw materials with the exception of PVC.
An investigation by the BTI in 1989 into the electrical cable market reported that the industry, then at a 12.5% duty, was uncompetitive in the domestic market by between 11% and 17%. It additionally faced undercutting by imports declared at lower tariff rates than intended for such types of cable. In the export market local producers' prices were found to be between 11% and 22% higher than overseas competitors. Export price disadvantages were blamed on the high cost of local raw materials. Examining the key raw materials in turn, copper is supplied to manufactures at the LME prices and South African supplies of PVC are well above rates obtainable in international chemical markets, 20% to 30% above North West European prices, and as much as 40% above South East Asian prices ISP research has found. Suppliers were prepared to give lower tariffs and lower prices on raw materials intended for exports, however, the BTI investigation reasoned that this alone would be insufficient to make South African firms competitive and steps would also be
56 INDUSTRIAL STRATEGY PROJECT
needed to reduce imports to improve factory throughput. Accordingly, the BTI recommended that tariffs be raised to 20% and then be lowered in successive 2.5% steps two years apart until it returns to 12.5% Tied to increased protection were export targets of 9%, 12% and 20% of turnover (BTI, 1990c).
Cable manufacturers rail against the high price of raw materials. An agreement has been reached between copper producers and Alusaf to supply metals for export orders at a lower cost, but for the domestic market they pay import parity prices. The bias against manufacturing in a primary products economy is well illustrated by the South African
copper market. Copper is a key raw material for the electrical machinery industry and South African copper posses above average electrical characteristics which make is suitable for manufacturing high quality products. No duties apply to copper imports, but taking import freight into account, local firms are unable to obtain the metal at a price and quality below that which the South African copper producers will supply them. In short, they are forced to accept LME prices on a delivered Europe basis and because the domestic copper offtake is small, the monopoly producer has no incentive to alter this
pricing structure.
Production quality to ISO 9000 standards are expected in export markets. Compliance with standards is essential for acceptance in export markets and the process of certification is a lengthy and expensive one. Conformity to SABS standards does not suffice, as this
body is not internationally recognised, hence further type testing has to be performed in the country exports are destined to. The major recognized standards authorities are UK standards and VDE. Since firms have to pay the SABS for certifying their products this can increase costs. With regard to imports, SABS approval is granted on sample batches submitted by import agents, whereas, local producers claim they pay more for continuous
testing done on a production run.
Imports are regarded as a major threat by the industry in its current circumstances of low demand since capacity utilization is around 50% to 60% (company interview). Eskom has discontinued its policy of granting local producers a preference of 2.5% and has imported cable for prices the local industry could not match. Customers, however, are not convinced that the current level of protection is warranted and suspect firms of practicing import parity pricing (company interview). As has been mentioned, there have been no major imports of cable types used for low cost electrification to date. Despite the high protection levels, imports are competitive and in view of the desire to lower material costs for electrification, cable imports may be made in future. PVC insulated electric cable is one of the commodities manufactured in Zambia and Zimbabwe, both of whom have recently started exporting to South Africa at prices which undercut local firms.
In 1992, the industry claimed 7.5% of its turnover was exported. Although the technology used for cable manufacture is licensed to South African firms, the major licences held do not affect their export activities.
Aberdare Cables started a dedicated export division in 1988 and succeeded in selling a range of cable types to countries in Africa, Latin America and the Far East.
ELECTRICAL EQUIPMENT SECTOR 57
Cable types used on low cost electrification schemes have been exported to Southern Africa and further afield, however, this is not regarded as a major export growth sector by the local sellers. The reasons being first, that low cost electrification designs use cable with a low proportion of value added and margins on such products are low. Secondly, it is expected that markets where electrification will be undertaken on a large scale will develop domestic industries to supply their needs.
Conventional types of cable make up the greater part of exports and this is expected to continue to be the case. South African firms still manufacture paper insulated cable which has been discontinued by most European producers (as it is regarded as obsolete technology) and local firms are able to pick up small orders for replacements. In contrast to European factories which are more specialised, the local industry has grown up supplying a diverse domestic market with a huge variety of cable types due to import substitutions (rather than specialising). As a result of the small and diverse market, local producers operate with small batch sizes. A production runs of, for example, five days, would be considered long against European producers typical production runs of three weeks (company interview).
The South African industry appears to possess a competitive advantage in making specially engineered cable types due to the way the market is structured. This provides it with greater flexibility in responding to niche cable export market opportunities that are below volumes more specialised plants would consider viable. By representing the whole industry, EPI eliminated competition between firms in the export market. The EPI also makes it possible to supply a larger range of cables for export as export orders are apportioned to firms on the basis of their suitability. By complementing each other, the seven factories in the EPI group can tender for a whole tender requiring a range of cable types or go for specific types, whereas other firms may only want a portion of the tender (company interview). By forming a joint export marketing company that provides synergies in international exporting activities, cable manufacturers have shown a degree of co-operation seldom found amongst South African companies.
Export subsidies are used to lower prices and have been critical in matching competition. In the longer term, exporters accept export subsidies will be withdrawn and that continued competitiveness will depend on lowering unit costs and raising exports. As the industry is still fairly heavily protected, a lowering of tariff barriers would be likely to force further rationalisation and specialisation on manufacturers and force them to focus on core areas of business and move away from the jobbing shop nature of current production. Lower protection would increase import penetration, and while this would run counter to employment generation goals of electrification it would encourage lower domestic cable costs.
Trade in electrical machinery: conclusions The electrical machinery sector was developed under an import substitution industrialisation policy and has succeeded in providing for a large proportion of the country's needs. The inward orientation, however, has resulted in a trade regime biased
58 INDUSTRIAL STRATEGY PROJECT
against exports and this is reflected in the sectors poor export performance over the last two decades. Prompted by weak domestic demand and state assistance to increase exports, strong growth from a low base has been evident since 1987, although these collapsed dramatically in 1991.
This chapter has shown in detail the situation for each of the main trade parts of the electrical distribution equipment industry. The following conclusions arise from this discussion.
Imports and the trade regime
The above discussion has demonstrated that the tariff levels applicable to distribution transformers, domestic circuit breakers and insulated cable are high and negligible amounts of equipment used for low cost electrification have been imported. The policy suggested is for a gradual tariff reduction to increase the competitive pressure on those sectors.
Exports
The following conclusions sum up the situation applicable to electrical distribution
equipment exports.
a) Firms have begun to reorientate their marketing and thinking towards exporting and are starting to make more serious efforts to build export business off a negligible base.
b) Licence restrictions are a severe limitation on exports for firms engaged in the local manufacture of foreign technology. The retention of licences to technology which firms have applied their own innovative efforts and successfully developed adaptations or hybrid products will continue to exclude firms from focusing on the major markets outside Africa.
c) Raw materials prices are high for local producers, either as a result of the uncompetitiveness of local upstream industries or the market structure. Local producers obtain no cost advantage in using South African raw materials which are supplied at import parity prices. Until the problems of high priced inputs into manufacturing industries are solved the anti-export bias of the country's economy will continue to prejudice the international competitiveness of the downstream fabricators of South African raw materials.
d) Export subsidies and incentives appear to be decisive in making exports in this sector cost competitive. The effectiveness of these subsides will be measured by the extent to which they permit firms to break into export markets and continue exporting unaided. Evidence suggests that the learning and productivity enhancement essential for sustained export activity has not been taking place in firms and exports may well decline after the withdrawal of subsidies.
ELECTRICAL EQUIPMENT SECTOR 59
e) Prospects for exports of electrical distribution equipment to Southern African countries are good in the longer term but they are conditional upon an economic revival of those countries and access to development finance.
t) Low cost electrification has stimulated the development of new products and systems. Increased demand for electrification equipment will contribute to raising capacity utilization, lower unit costs and thereby make exports of a range of equipment more competitive. Mass electrification is thus potentially able to provide a springboard to further exporting of traditional products as well as new products suited to electrification programmes in developing countries.
g) Standards are crucial for acceptance in export markets and local designs need to conform to international standards if firms are to increase their export volumes. Testing and certification by the SABS does not suffice to meet requirements for exports. Policy on this matter requires the restructuring of standards institutions in the country to obtain international recognition.
Chapter Four: Technology
Meeting the needs of mass electrification calls for an innovative approach to achieve a
lowering of cost and so spread available resources as widely as possible. This has presented the equipment industry with challenges as well as new opportunities. How well
placed the industry is to engage in technology development forms the first part of this chapter. The second part of this chapter examines progress being made to standardise
equipment and designs. The lack of standards, it has been argued, has been an obstacle to greater efficiency in the local industry. Environmental and health and safety matters are examined in the final section where the need for steps to eliminate hazardous substances used in electrical equipment is identified.
Technology and the electrical equipment industry Electrical distribution technology is mature and stable. A world market exists for electrical engineering technology, and South Africa has been tied into that market from the start of this century.
Consideration will be given below to technology development efforts of electrical
engineering firnis, with a particular emphasis on equipment destined for mass electrification. Details of international experience, wherever possible, will be presented.
The issue of technology capability in the industry under investigation cannot be reduced to whether or not firms are innovative. As Dahlman argues, for developing countries, the central issue is 'acquiring the capability to use existing technology — to produce more efficiently, to establish better production facilities, and to use the experience gained in production and investment to adapt and improve the technology in use' (Dahlman, et. al., 1987:774). No country in the world is technologically self-sufficient and obviously a
country with South Africa's resources needs to import technology. In order to be a 'clever follower', to underscore Dahlman, two essential components need to be fulfilled: an ability to identify applicable technology, and most crucially, the ability to absorb, utilize and then extend foreign technology.
Technology understood in this way is not merely about the electrical machinery or the blueprints for making them, but also about the human resources which embody technical knowledge and the social organisation of research and production within which these processes occur. It is necessary, then, to incorporate these elements in the discussion. But first, a look at the broad picture.
ELECTRICAL EQUIPMENT SECTOR 61
Research and development indicators in industry
Aggregate data for spending on R&D by firms shows that it is very low in South Africa. The 1982 Manufacturing census showed the electrical machinery, apparatus, appliance and supplies industry spent R19.7 million on R&D, equal to a niere 0.71% of the gross output of the industry; but, a 16% share of the total R&D expenditure in manufacturing. Copyright, trade names and patent expenditure amounted to an additional R2. 18 million. Three years later R&D spending totalled R31.3 million, equivalent to 0.88% of the sectors gross output. By comparison, the manufacturing industry spent 0.25% of its gross output on R&D in 1985 (CSS, 1985), putting the electrical machinery amongst the highest R&D spenders.
It would appear R&D spending rose 50% in the mid 1980's. For reasons explained below, little of what firms do properly qualifies as R&D and none of the firms sampled ran their own R&D laboratories. Judged by products that were brought to the market in that period that considerable efforts were made in product development and adaptation to suit local conditions.
Technology transfer in the electrical equipment industry
Foreign technology may be obtained in various ways, the most significant being the purchase of capital goods, licence agreements for local manufacture, through direct foreign investment and cooperative R&D arraignments more commonly called strategic alliances.
Technology transfer to South Africa has predominantly been by means of direct foreign investment and the licensing of foreign technology for local manufacture.
Several reasons explain the form that technology transfer has taken. South Africa's economic development has been characterised by import substitution indusirialisation. The very abundance of its mineral resources has retarded the growth of an all round capital goods sector, and orientated its technological efforts towards foreign licence or agency acquisition because of the historical ease of obtaining foreign exchange. Markets for equipment have been shown to be highly concentrated with a few large firms, frequently with direct foreign links, dominating the market. Protected domestic markets have reduced the pressure exerted on firms to innovate as a result of competition from imports. Further, the inward orientation of the trade regime has disinclined firms to export and so cut them off from the vigorous learning and technological development that exposure to international markets entails.
South Africa has achieved a high level of domestic production in electrical equipment, meeting over two thirds of market needs. For electrical reticulation equipment this figure is even higher. Yet there are major weaknesses in the technological capabilities of the industry. Considerable attention has been given to the limitations on exports caused by a dependence on foreign licences.
62 INDUSTRIAL STRATEGY PROJECT
The crucial elements that are missing are a preparedness to adapt and extend foreign technology to the point of commercialising local products. There is a strong impression that local firms have considerable adaptive ability in developing solutions to local conditions. 'South Africa has a poor culture of risk taking. Companies want security and are not prepared to invest. They think that a 3% royalty situation is quite acceptable, but big companies spend more than 3% on developing new products' (company interview).
International comparison — a firm level mini case study
Contrasting South African practice with international practices is a useful way to illuminate the local situation of technology development. The following section deals with transformer manufacturing, nonetheless the impressions gained apply to the electrical distribution industry more generally. Information was gathered by interview.
Pauwels is a transformer manufacturing company with head quarters in Belgium. It has factories in Ireland, Saudi Arabia, Indonesia and the United States. Turnover amounted to 8 billion Belgian Francs, half of which is achieved outside of Europe.
Basic research is not a feature of the finn's technology development, efforts are rather directed to a) product development; b) process development; and c) meeting clients
specialist needs. Of the design and technical marketing staff of 100, 20 engineers are engaged in product development. The focus of research is on monitoring developments in relevant fields of electrical engineering and applying such developments to the firms
product range; in short, an applied research focus. Research expenditure is born predominantly by the finn, and is supplemented by state subsidies where applied research can qualify.
Influences on the research process are not only technical. Engineers who follow technical developments are complemented by feedback from marketing agents who monitor
developments made by competing firms. In this way, applied research is brought close to developments in the market place.
An important source of technology development, mainly in the process field, are worker
proposals. These are taken seriously by the firm, financially rewarded and encouraged. They mainly involve incremental productivity enhancements, from material handling aids developed by workers themselves to revised production layouts. Trade union organisation is strong.
Facilities available in the national science and technology infrastructure are drawn upon, such as making use of universities for assistance or going further afield to consult with specialists elsewhere in Europe. The firm has achieved good results from commissioning student engineers to do work on the technical problems it faces, a practice it considers mutually advantageous. Translating technical developments into business enhancing results requires an emphasis on practical results. As a consequence, applied research tends not to show rapid or large scale changes, instead incremental progress results.
ELECTRICAL EQUIPMENT SECTOR 63
Technology development in South African firms
Research and development is an inappropriate term to use for most of the activity which is undertaken by local firms. Development work is, in the main, the focus of their activities. Resources devoted to development are limited and finns rely on technological advances to come from their principals. Few equipment suppliers have departments dedicated to technology development. Instead this is a function, where it is undertaken, performed by existing design departments, quality control or testing laboratories. Some examples will be used to substantiate this observation.
'We don't do basic research, but we do manufacturing research, in other words, how to build transformers better. On this we spend less than one percent of turnover. Our principal spends a minimum of 5 percent of turnover on R&D. We adapt stuff, in fact we are good at adapting things' (company interview).
Finns manufacturing under licences tend to see technology development strictly in terms of improving production processes: 'Innovation is what we push. What we try to do is to lower costs without lowering standards' (company, interview).
During the 1980's, political developments exerted a significant influence over the country's technological development efforts. As a consequence of the sanctions campaign directed against South Africa, firms were no longer assured supplies of technology. In addition, disinvestment, although not especially strong in the electrical equipment sector, contributed to the restructuring which took place and increased local ownership in the industry. Strategic factors contributed to an emphasis on import replacement and local technology development in the mid 1980's In the event, technology supplies were not curtailed by sanctions, but the experience gave a fillip to local development.
Innovations in the electricity reticulation field
Electrical engineering firms have featured in local technology awards for technology development and specific products, those relevant to mass electrification will be mentioned.
The switchgear company CBI won the energy category in the 'Technology Top 100' competition judged on the basis of resources committed to R&D, patent activity, technical training and capital investment (The Herald Times 1/5/92). Despite recent progress made in the field of local technology development, stimulated by sanctions against the country, only 53 companies met the competition's criteria.
Circuit Breaker Industries has also received recognition within the Barlow Rand group, winning the Barlow Rand Technology Award products category in 1991. The award was made for the development of a range of earth leakage protection devices to replace imported devices and designed to suit local conditions and installation skills (Electronic News March 1992).
64 INDUSTRIAL STRATEGY PROJECT
In the electric cable field, new cable types have been developed. At Aberdare, serious development work on products suited to low cost electrification began in 1988 when a
product development team was started. (Aberdare, 1988). Technology agreements with
Phillips enables the firm to obtain assistance on technical problems. The firm does not run a dedicated R&D department with a separate budget, instead technology development draws on technical staff involved in production and quality control laboratories. Incremental progress led to the development of a new service cable product Airdac, designed to prevent power theft. This product received recognition in the Reunert group by winning the Cullinan design award in 1991 (Engineering News 2 1/2/92).
Attention in the cable industry continues to be devoted to developing insulation materials to enhance electrical properties while reducing material content. Making greater use of cross linked polyethylene and focusing on process technology is an activity local finns are engaged in (Aberdare, 1991). Cost reductions have also been achieved by thinning insulation covering (company interview).
Budget energy controllers
In the field of electricity metering, local innovation has been considerable, founding an industry to manufacture Budget Energy Controllers (BEC). In the process, it has given a minor fillip to the local electronics industry. This innovation will be sketched out briefly.
Poor levels of service in many African townships rendered by illegitimate local authorities prompted many residents to boycott service payments. Residents protested against erratic, erroneous billing and power cuts. A vicious circle of non payment then developed: bulk
suppliers cut the power to townships as Black Local Authorities used their revenue from
electricity sales to pay salary bills (Cobbett, 1992).
In response to an Eskom tender in 1988, local development was undertaken on a new metering system. This took advantage of new micro-processor technology applied to well established pre-payment systems based on coin operated meters (Dingley, 1991:15). Use of BECs implies an integrated electricity sales system whereby customers purchase credit units, in some form of token, from dispensing equipment and load their personal BEC. The supply authority is provided with management information of sales on the system (Smart, 1991). In the consumer's home the BEC has a user interface which shows whether credits have been successfully transferred, credit level, rate of electricity consumption and low credit warning. When credit expires the unit disconnects the electrical supply. Consumers attitudes towards this method of electricity payment have been generally positive (De Beer, 1992 and Theron, 1992c). This method of metering is expected to become the norm in mass electrification.
As many as eleven firms entered the BEC market and fierce competition ensued. Rapid innovation succeeded in driving the price down by a third while reliability and
performance was increased. The process was largely driven by Eskom and efforts were made to rationalise standards. Firms use different metering technologies, some of which are foreign licensed, however, the development of the market on lines distinct from
ELECTRICAL EQUIPMENT SECTOR 65
electronic metering elsewhere in the world and the patenting of this technology by South African firms has resulted in a significant domestic capability in the technology. Exports of BECs have started on a small scale, for example obtained a R15 million order from a West African country (Engineering News 25/9/92).
Worker involvement in technology development
Evidence of worker participation in technology development and productivity enhancing programmes in the electrical equipment industry is patchy, but there appears to be little achieved in crucial area of the organisational and social context of technology development.
Contributions from the shop floor tend to be channelled through quality promotion programmes where these have been introduced by firms; while workers are encouraged to participate in these programmes, with prompting along the lines of 'We employ you not only for your hands but your brains as well' (company interview). Quality programmes of this nature tend to be of a top down nature with a questionable degree of worker involvement.
Firms in which programmes of 'Just In Time' production were being implemented made greater provision for the worker's role in process technology development, Reunert subsidiary CBI being one of them. In contrast to the European example of shop floor involvement in technology development, which are themselves modest in comparison to the role of such exercises in the dynamic Asian economies, firms interviewed could cite no examples spontaneously of worker prompted technology development.
The prevailing industrial relations regime tends to be adversarial and it is accordingly not difficult to see the reasons for such limited involvement of the shopfloor in technology development, exacerbated by the low level of education and training of the workforce. In parenthesis, it is interesting to note that several executives interviewed regarded any improvement in the situation as dependent upon a political settlement.
An international comparison — the Brazilian power equipment industry
Brazil's current economic crisis, the macroeconomic imbalances resulting from external debt which have significantly run down its industrial base should not blind us to the country's achievements of technological development in the power equipment sector. Drawing on Faucher (1991) Brazil's power equipment industry will be briefly contrasted with South Africa.
Brazil succeeded in substantially increasing its production of capital goods through a policy of import substitution, exchange controls and legislation prohibiting the importation of goods for which there were acceptable local substitutes. Tariffs on electric energy equipment, in the region of 32% were imposed. In the electric power field, the principal instruments of public intervention were development finance agencies which stipulated
66 INDUSTRIAL STRATEGY PROJECT
local content criteria for infrastructure projects, FINAME being the most important. The aim for the industry was to encourage local production with a high domestic content, not to indigenise ownership. Foreign investment was not restricted with the result national control in the sector waned while local content rose.
State owned enterprises in the power sector coordinated by the national electrical body Electrobras acted as monopsonists in the equipment sector. The Brazilian power sector successively elevated its technological capability through a negotiated framework with suppliers to develop qualified personal in the domestic engineering sector, through quality control measures to improve local production and finally through applied research. A central research body, CEPEL, was established to institutionally transfer foreign technology and produce local solutions. The range of institutions involved added to the imposed financial costs to projects but the learning processes involved created spillovers in the engineering sector that enhanced local capabilities.
Measures of Brazil's success in the power equipment sector are its 0.51 export to import ratio of made to order capital goods and the export of engineering services (Faucher, 199 1:252). In addition the strengthening of domestic technological capabilities allows firms better terms to negotiate technology transfers.
Brazil's power equipment sector cannot be treated as an unmitigated success, for it has not been free of inefficiencies, delays and huge cost over runs on projects. However, with respect to enhancing technological capabilities, South Africa in contrast, has made a far weaker effort to promote technological learning within firms. Licences granted to South African firms are not subject to an overall policy regarding technology transfer, nor are there measures to enhance local capabilities through strategies that explicitly cultivate 'spill overs' derived from technology transfers. At the root of the problem is the failure of the state to develop a coherent technology policy to address the above issues.
Eskom's promotion of local technology development
Concern over disruptions of supply of essential equipment which may jeopardise Eskom's long term stability, led the organisation to initiate a 'strategic technology' programme in 1987. The threat of import sanctions and technological isolation promoted the corporation to examine the capability of the manufacturing industry to supply its needs and to measures which would stimulate technology development and local manufacture. Eskom adopted the view that the common needs of major private and public sector users of electrical power equipment needed to be addressed jointly, in line with the government's White Paper on Industrial Development (Eskom, 1987). From this initiative developed a programme to promote the rationalisation of specification documents for electrical equipment. The subject of rationalisation will be discussed below in relation to new standards for mass electrification.
ELECTRICAL EQUIPMENT SECTOR 67
Technology capabilities in the electrical equipment sector
Technology development is clearly not absent from South African firms. Substantial adaptations to original designs have been made to suit equipment to local needs. New products have been developed specifically for the low cost market which have given a focus and boost to indigenous technology development. However, the industry is structured in a way which inhibits innovation and indigenous technology development. 'This means we can still be termed a 'Technological colony' relying almost entirely on overseas technology and the importation of higher technology products and systems in the power electrical sector of the industry' (Cardwell, 1991:8).
Technological challenge of mass electrification
Mass electrification holds out the prospect not only of bringing enormous social benefits to millions of South Africans and a significant stimulus to the equipment industry, it also poses a technological challenge to the equipment industry.
Newer reticulation technologies i.e. single wire earth return, electronic metering, new materials for cables, isolators, breakers etc. should be utilised to make electricity more affordable. The role of power electronics in power systems has not been fully investigated. Power processing can make a large impact on the affordability of electricity at all levels (Enslin, 1992:34).
As the above discussion shows, progress has been made with the CSP transformer, cable design and electronic metering, which have been shown to have export potential. Such developments need to be encouraged and extended.
The need for a technology policy for the electrical equipment industry
There is clearly a need for a policy to promote the technological capabilities of firms in this sector for specific ends to overcome the deficiencies in the present system of technology transfer and particularly in the balance of trade in electrical equipment.
Proposals for a policy to stimulate technology development and exports in the power electrical industry have been made by Cardwell (1991). These proposals include stimulating research in various engineering bodies in existence, extending state innovation support to the power electrical industry and adoption of a strategy for the industry to become self-reliant in the areas where local needs are greatest. Cardwell addresses the issue of the lack of incentives to invest in developing local technology and suggests large user organisations coordinate their equipment needs in order that local product markets be better utiuised. He suggests local R&D activities must be coordinated and proposes a body consisting of the major user organisations, scientific and standards bodies to perform this task (Cardwell, (1991:14—15).
On their own, the above suggestions are overly ambitious and need to be narrowed down. Given the prevailing market structure of the industry with a high proportion of foreign linked firms operating in the market, the diversified needs of the local market will continue to be met in large part by foreign technology. However, the need to adapt and
68 INDUSTRIAL STRATEGY PROJECT
better utilize technology is clearly evident and low cost electrification presents a focus for more concerted effort in local technology development.
New standards for mass electrification
Equipment suppliers to the mass electrification market are required to lower their costs to realize the goals of developing 'affordable electricity'. Non price influences come from two sources; first, technological changes, principally in the form of new materials and, secondly, changes to equipment specifications. In the section to follow the focus will be on the second aspect. Price influences, probably the most significant influences have been driven by competition for tenders set by Eskom acting as a monopsomst and setting prices which, manufacturers claim, make no provision for overhead recovery. It should be noted efforts to develop new approaches appropriate to the needs of mass electrification have been forthcoming from the SAIEE.
Electricity reticulation standards
South Africa has inherited electrical standards from England and has tended to follow European standards. This has been perpetuated by the training of generations of engineers on European standards and the high proportion of foreign firms in the equipment supply industry. Indeed, since 'the technology of electricity distribution is old, very well known, with no mystery to it' (Maepa, 1992:72) it has tended to breed conservatism in engineering terms by staying with tried and trusted methods.
South African standards are high and this has given existing consumers a safe, reliable and high quality energy source. Adaptations to South African conditions of higher ambient temperature and lightning resulted in local standards which often exceeded international ones. In the cable industry, for example, the opinion has been expressed that local products were, in the past, over designed and hence more expensive (company interview).
Low cost electrification design objectives
All reticulation network designs are required to take estimated loads into account to determine equipment specifications and apply the chosen method to amortized capital costs. In that respect, low cost designs are no different. Where there is a difference is in efforts to strip designs down to essential requirements through a process of rationalisation. In addition, Eskom is attempting to promote uniformity in network design to the greatest extent possible so that engineering costs are minimized. In this respect it is interesting to note that average costs per connection made in 1992 was R3000 for Eskom but around R4000 for other local authorities. Novel equipment has not been promoted as alternatives, rather efforts have been directed to 'stretch' existing reliable technology. The Completely Self Protected transformer designed to be used at 160% load at peak demand times exemplifies this approach.
ELECTRICAL EQUIPMENT SECTOR 69
National Rationalisation of Specifications Project
When equipment manufacturers were surveyed by Eskom in 1987 it emerged that one of the major problems they faced was that equipment users were writing their own specifications; thus preventing suppliers standardising their product range. Over- specification in tenns of appropriate technology and quality exacerbated the problem. Since users were creating these problems it was felt by Eskom that users should be brought together to eliminate the discrepancies. Out of this emerged the National Rationalisation of Specifications project (NRS).
In addition to the usual groups involved in standards setting, the government and the manufacturing industry, equipment users have been brought into the process. The NRS is not intended to replace the SABS, but as it has flexibility to get agreement on standards by actual users more speedily, recommended practice from the NRS is expected to adopted as SABS standards in time. The DTI has sponsored Eskom to manage the project (NRS, n.d.).
The NRS functions by identifying the generic requirements of users, such as electricity supply authorities, to identify the essential functional requirements for equipment and set these out for the manufacturers.
Technology upgrading is not an objective of the project, rather it is intended to push a sharper engineering understanding of real needs. 'Engineering training promotes engineers to produce better products and not commercially suitable products in terms of the right product for the circumstances' (company interview). Nor does the NRS set cost reduction targets, but the overall effects are aimed at lowering costs over the entire electricity system, and evidence suggests municipal electrical engineers are starting to down size systems to lower costs.
Compliance with international standards is critical in export markets and the NRS standards are evaluated to comply with IEC and ISO.
Equipment manufacturers interviewed on the whole support the NRS initiative in its broad goals. Instances where firms are producing non standard equipment inevitably exist and firms are reluctant to give this business up. For supply authorities, the move to rationalised standards is easier to apply to new electrification projects, as existing networks have been designed around a particular type of control and distribution system that cannot be departed from abruptly.
International experience with setting standards as mechanism to harmonise markets, as has been pursued extensively in Europe, suggests that it does not work as an industrial policy. The root of the problem is enforcement, which is particularly acute where efforts are made to bridge international differences (company interview). While the NRS approach overcomes one fundamental problem experienced elsewhere, as it coordinates users views, there are clearly limits to the process of achieving through going rationalisation.
70 tNDUSTRIAL STRATEGY PROJECT
Safety measures
House wiring constitutes a major proportion of the cost of installing electricity in a home. Means to reduce these costs are clearly in line with the overall objectives of lowering electrification costs. One expense is the mandatory earth leakage protection device, sourced from a single manufacturer, CBI. The supplier has a monopoly in the local market yet the product appears to be competitively priced as it is sold well below imported products which attract only a 10% tariff. The question is whether more rationalised wiring standards should exclude earth leakage devices to lower costs.
The argument in favour of retaining earth leakage protection has been strongly made by Cohen (1992). Protection against shock hazards and fire are provided by earth leakage circuit breakers. In addition, the circumstances whereby electricity is supplied to informal housing and where multiple extensions may be used the electrical hazards are a problem which cannot go unnoticed. Design approaches adopted thus far continue to incorporate earth leakage protection and there do not appear to be any serious moves to alter this.
Consequences of adopting more rationalised standards
For equipment manufacturers, the adoption of more rationalised standards has led to a lowering of the value added in production. Increased standardisation has lead to shortened set up times and longer production runs, adding to more efficient overhead recovery. Thus far, the real benefits of rationalised standards have yet to be reaped. The slow growth of electrification project construction has had its most notable effect in the increases in capacity utilisation.
The cable industry well illustrates the lowering of the value added in manufacturing implied in new methods. Previous methods of domestic reticulation using underground medium tension cables required the manufacture of a cable with several insulation layers, steel armour and requiring several winding machine passes to make. ABC in contrast is manufactured on a simplified line in a single pass. Insulation materials used in ABC is carbon loaded cross linked polyethylene which requires more sophisticated machinery but far less labour to make (company interview).
Labour demand in the equipment manufacturing industry, therefore, will grow slowly due to the consequences of the lowering of manufacturing value added that more rationalised specifications imply.
Alternative technologies
Innovations have been shown to be made in the South African industry in metering and cable technology. These by no means exhaust the list of possible technologies for low cost distribution systems. International experience shows a wide range of possibilities using single wire earth return designs, alternative generation approaches in remote area power systems (Foley, 1990) and thorough equipment rationalisation (Bertoni, 1991).
ELECTRICAL EQUIPMENT SECTOR 71
Some experiments are being undertaken using single phase systems, particularly in areas of low population density: yet the overall approach towards electrification design has not shifted substantially and vested interests in the equipment supply industry are likely to keep it that way.
Chapter Five: Environment and health issues
Mass electrification has considerable positive environmental consequences. Mention has
already been made of the health benefits of the use of electricity and the deforestation saved by replacing the use of wood as a fuel source. Mass electrification also has some
negative environmental consequences, primarily in the power generation and transmission field. It would be wrong to ignore the broader picture and the frequently cited trade off of the R7.5 billion need to bring electricity to all, a sum estimated to be the amount necessary to install flue gas desuiphurisation equipment in all of Eskom's major power stations. The point is that this 'trade off' is not a zero sum game, and that improvements can be achieved by a comprehensive environmental policy.
In the business of equipment manufacturing, environmental aspects are less obviously important. Two issues have been singled out for attention, energy conservation and the use of toxic substances in electrical equipment manufacture.
Energy efficiency and conservation
Cheap electricity is a disincentive to conservation. Eskom's commitment to lower the real price of electricity by 20% over five years has downplayed the need to increase energy efficiency by users. In the distribution equipment industry a good index of the priority attached to energy conservation is the specification of low loss transformers.
Transformers are designed to perform to a maximum loss level, these losses may be reduced by improved designs and the use of more materials, raising the price of the equipment. When life cycle costing is applied, low loss transformers may represent a more economic choice than the lower initial outlay on high loss equipment. Few local authorities specify low loss transformers and neither is the Eskom designed CPS transformer one.
In low voltage networks transformer losses represent a small proportion of the network losses, so it is not regarded as a significant issue. Far more attention is paid to losses in the higher voltage parts of the network (company interview).
Energy efficiency receives greater attention in countries with higher energy costs. Manufacturers are well aware of this and would be able to shift to make more efficient equipment if the market demand were to demand it.
ELECTRICAL EQUIPMENT SECTOR 73
Health risks associated with electrical equipment manufacture
Top priority among a range of health and safety issues for the electrical equipment industry is the handling of hazardous substances. This report focuses on the problem of polychlorinated biphenyls (PCB). Polychlorinated biphenyls are organochlorine compounds used for their properties of a high dielectric constant, high boiling point, stability and flame resistance. In the electrical industry they have been used in transformers, capacitors, insulated cables and fluorescent light ballasts. Outside of the electrical industry they have been used as plasticisers in paints and inks, textiles, paper, as vapour suppressants and in insecticide.
Commercial production of PCB started in the 1930's and their use increased in the electrical industry as a non flammable substitute for mineral oil. PCBs were imported into South Africa since the 1960's. Imports have since stopped.
PCBs are now known to represent an environmental and occupational health hazard. These substances originally sought for their non flammability were discovered to break down at very high temperatures and produce neurotoxins. PCBs also contain contaminants in the form of other organochiorine compounds which are more toxic, hence the greatest health risks they pose are when equipment is caught in fires or old oil is handled. Studies on people who ate rice accidentally contaminated with PCBs showed an excess of malignant tumours and reproductive impairment (ILO, 1992).
Occupational exposure to PCBs has demonstrated high residue levels. In people occupationally exposed a spectrum of adverse health effects have been observed. These include skin diseases, chronic acne, inflammation of mucous membranes, reduced respiratory capacity, digestive disorders and neurological symptoms. PCBs have been shown to be carcinogenic in animals. The US National Institute of Occupation Safety and Health recommends a threshold limit value of 1 micro gram per cubic meter in air levels of plants making or using PCBs (ILO, 1992:1754).
Internationally PCBs are regarded as a significant environmental and health risk. Notifications under Tokyo Round Agreement on Technical Barriers to Trade include six citations under grounds of protection of the environment and three under public health and safety for polychlorinated phenyls (GATT, 1992:31).
In South Africa there are no regulations applicable to the use of PCBs. Neither the Hazardous Substances Act which regulates the transportation, sale and disposal of defined substances, nor the Machinery and Occupational Safety Act which regulates the use of substances listed as a workplace risk, cover PCBs.
Electrical equipment manufacturers in South Africa discontinued the use of PCBs and returned to using mineral oil when the environmental hazards of PCBs became recognized. Equipment containing PCBs has largely been withdrawn, particularly by technically competent supply authorities (company interview). Despite steps being taken
74 INDUSTRIAL STRATEGY PROJECT
to dispose of PCBs they continue to exist in the country both in equipment in service and as contaminants in mineral oil for transformers and switchgear (company interview).
Environmental risks associated with PCBs exist in two areas: disposing of existing PCBs estimated to be 30 000 to 40 000 It (company interview) and risk of contamination from the recycled transformer oil pool. New equipment will not be made using PCB coolants, so with respect to equipment for mass electrification made with new mineral oil, PCBs do not pose risks.
The existence of much diluted concentrations of PCBs in the recycled transformer oil pool represents a major potential source of PCBs coming into contact with workers in the electrical industry. Contamination levels of up to 500 ppm have been observed in incoming oil for recycling (company interview). If these PCB contaminants are not removed they will build up to potentially harmful levels through bioaccumulation. Contamination levels of between 50 and 500 ppm are considered a risk by the CSIR Environmental Services (Engineering News 1/5/92), therefore this is a problem requiring action. As old equipment containing PCBs has already been withdrawn, in the absence of regulations, such disposal may have been environmentally unsafe, posing continued risks in land fills.
Finally, as South Africa does not regulate on PCB use, fears have been expressed it may be subject to dumping of PCBs from more regulated markets. Small oil companies are potentially a source of witting or unwitting importation of PCBs (company interview).
Environmental policy The development of more energy efficient equipment designs and energy conservation are matters that require attention, in the same way that rationalised standards for mass electrification should not lower safety regulations, energy efficiency needs to be included as a design consideration. A life cycle costing approach will better detennine the true economic cost of alternative reticulation systems than merely lowering capital outlay.
In addition, much stress has been placed on the requirements for equipment manufacturers to conform to international standards to be accepted in export markets. Environmental considerations will also be a feature of trade with respect to energy efficiency and the materials and methods used in manufacture.
Regulations prohibiting the use of PCB5 and governing their safe disposal are required. Specific measures are required to enforce first, the removal of PCBs from the recycled transformer oil pool, secondly, a prohibition on the importation of PCBs, thirdly, regulations to safely dispose of contaminated oil and to rectify faults in previous disposal activity.
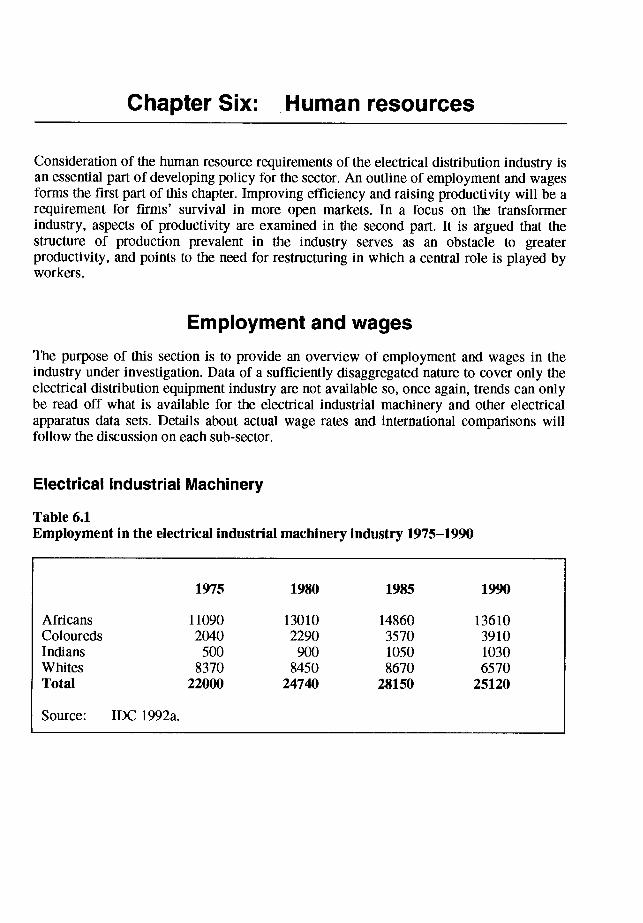
Chapter Six: Human resources
Consideration of the human resource requirements of the electrical distribution industry is an essential part of developing policy for the sector. An outline of employment and wages forms the first part of this chapter. Improving efficiency and raising productivity will be a requirement for firms' survival in more open markets. In a focus on the transformer industry, aspects of productivity are examined in the second part. It is argued that the structure of production prevalent in the industry serves as an obstacle to greater productivity, and points to the need for restructuring in which a central role is played by workers.
Employment and wages The purpose of this section is to provide an overview of employment and wages in the industry under investigation. Data of a sufficiently disaggregated nature to cover only the electrical distribution equipment industry are not available so, once again, trends can only be read off what is available for the electrical industrial machinery and other electrical apparatus data sets. Details about actual wage rates and international comparisons will follow the discussion on each sub-sector.
Electrical Industrial Machinery
Table 6.1 Employment in the electrical industrial machinery industry 1975—1990
1975 1980 1985 1990
Africans 11090 13010 14860 13610 Coloureds 2040 2290 3570 3910 Indians 500 900 1050 1030 Whites 8370 8450 8670 6570 Total 22000 24740 28150 25120
Source: IDC 1992a.
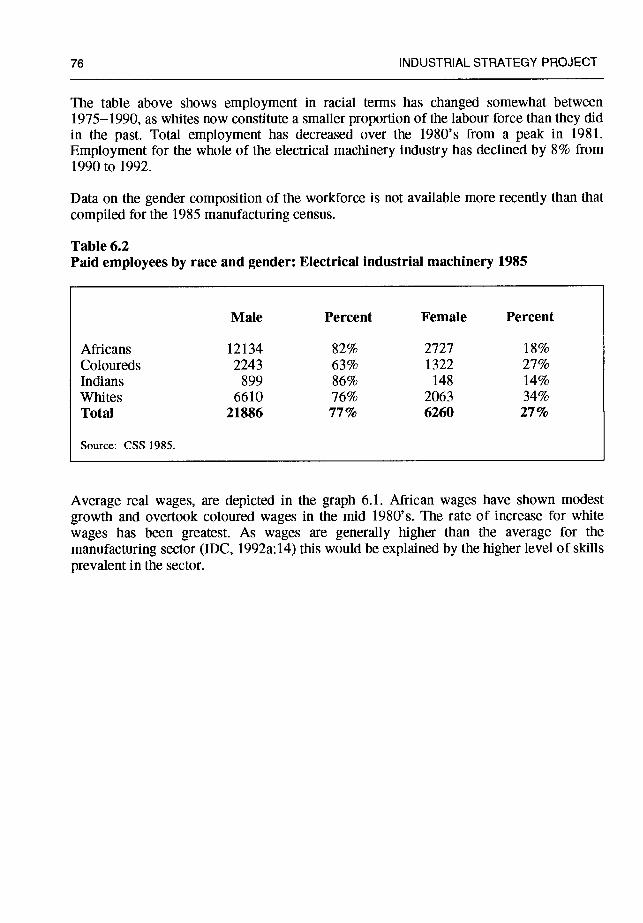
76 INDUSTRIAL STRATEGY PROJECT
The table above shows employment in racial terms has changed somewhat between 1975—1990, as whites now constitute a smaller proportion of the labour force than they did in the past. Total employment has decreased over the 1980's from a peak in 1981.
Employment for the whole of the electrical machinery industry has declined by 8% from 1990 to 1992.
Data on the gender composition of the workforce is not available more recently than that compiled for the 1985 manufacturing census.
Table 6.2 Paid employees by race and gender: Electrical industrial machinery 1985
Male Percent Female Percent
Africans 12134 82% 2727 18% Coloureds 2243 63% 1322 27% Indians 899 86% 148 14% Whites 6610 76% 2063 34% Total 21886 77% 6260 27%
Source: CSS 1985.
Average real wages, are depicted in the graph 6.1. African wages have shown modest
growth and overtook coloured wages in the mid 1980's. The rate of increase for white
wages has been greatest. As wages are generally higher than the average for the manufacturing sector (IDC, 1992a: 14) this would be explained by the higher level of skills prevalent in the sector.
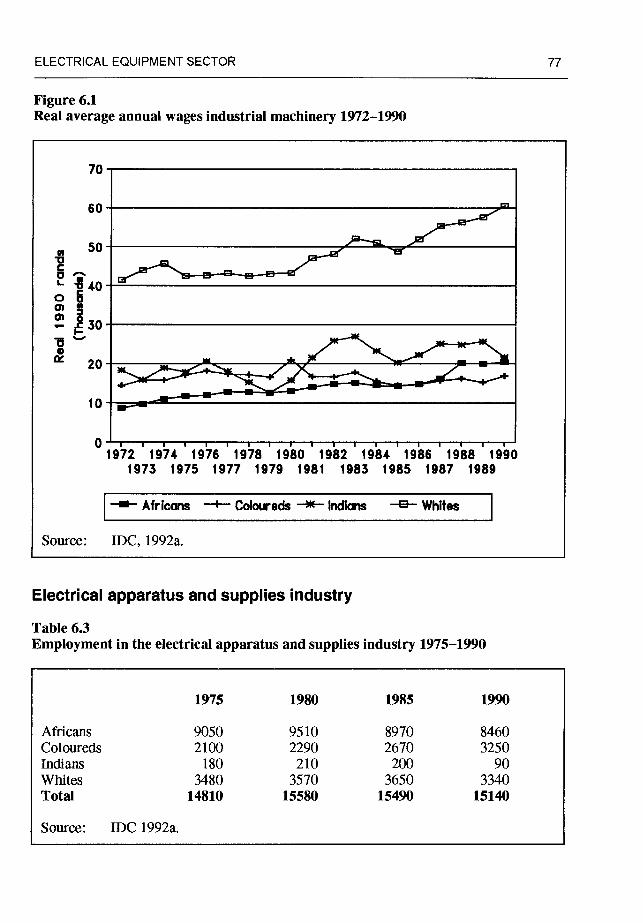
ELECTRICAL EQUIPMENT SECTOR 77
Figure 6.1 Real average annual wages industrial machinery 1972—1990
Table 63 Employment in the electrical apparatus and supplies industry 1975—1990
Electrical apparatus and supplies industry
1975 1980 1985 1990
Africans 9050 9510 8970 8460 Coloureds 2100 2290 2670 3250 Indians 180 210 200 90 Whites 3480 3570 3650 3340 Total 14810 15580 15490 15140
Source: IDC 1992a.
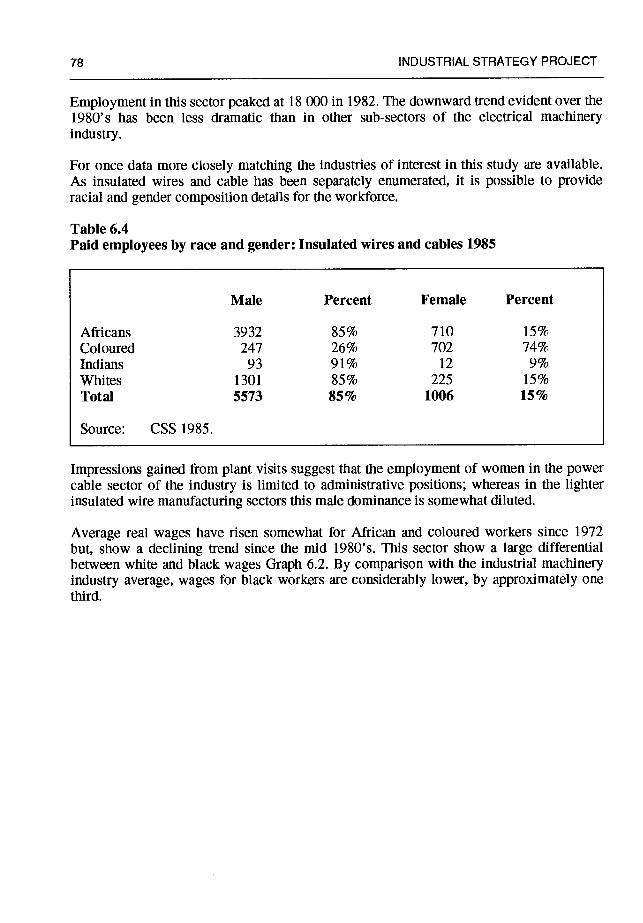
78 INDUSTRIAL STRATEGY PROJECT
Employment in this sector peaked at 18 000 in 1982. The downward trend evident over the 1980's has been less dramatic than in other sub-sectors of the electrical machinery industry.
For once data more closely matching the industries of interest in this study are available. As insulated wires and cable has been separately enumerated, it is possible to provide racial and gender composition details for the workforce.
Table 6.4 Paid employees by race and gender: Insulated wires and cables 1985
Male Percent Female Percent
Africans 3932 85% 710 15% Coloured 247 26% 702 74% Indians 93 91% 12 9% Whites 1301 85% 225 15% Total 5573 85% 1006 15%
Source: CSS 1985.
Impressions gained from plant visits suggest that the employment of women in the power cable sector of the industry is limited to administrative positions; whereas in the lighter insulated wire manufacturing sectors this male dominance is somewhat diluted.
Average real wages have risen somewhat for African and coloured workers since 1972 but, show a declining trend since the mid 1980's. This sector show a large differential between white and black wages Graph 6.2. By comparison with the industrial machinery industry average, wages for black workers are considerably lower, by approximately one third.
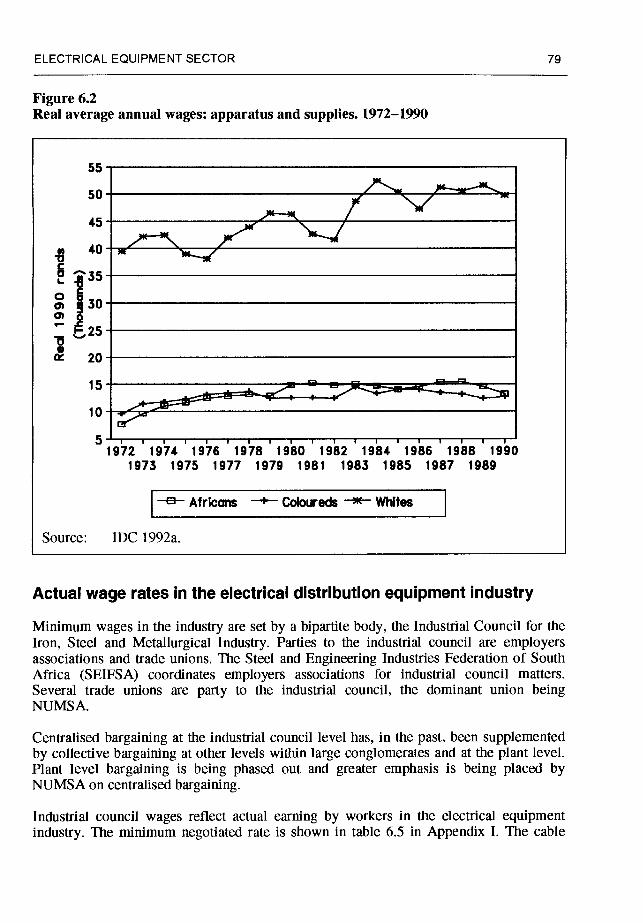
ELECTRICAL EQUIPMENT SECTOR 79
Figure 6.2 Real average annual wages: apparatus and supplies. 1972—1990
40" E
0) '.30 I- I- 25
20
15 ___ 10
5. U I I I I I I I I I I I I I I 1972 1974 1976 1978 1980 1982 1984 1986 1988 1990
1973 1975 1977 1979 1981 1983 1985 1987 1989
—— Africans —'— Colot.reds —-— Whites
Source: IDC 1992a.
Actual wage rates in the electrical distribution equipment industry
Minimum wages in the industry are set by a bipartite body, the Industrial Council for the Iron, Steel and Metallurgical Industry. Parties to the industrial council are employers associations and trade unions. The Steel and Engineering Industries Federation of South Africa (SEIFSA) coordinates employers associations for industrial council matters. Several trade unions are party to the industrial council, the dominant union being NUMSA.
Centralised bargaining at the industrial council level has, in the past, been supplemented by collective bargaining at other levels within large conglomerates and at the plant level. Plant level bargaining is being phased out and greater emphasis is being placed by NUMSA on centralised bargaining.
Industrial council wages reflect actual earning by workers in the electrical equipment industry. The minimum negotiated rate is shown in table 6.5 in Appendix I. The cable
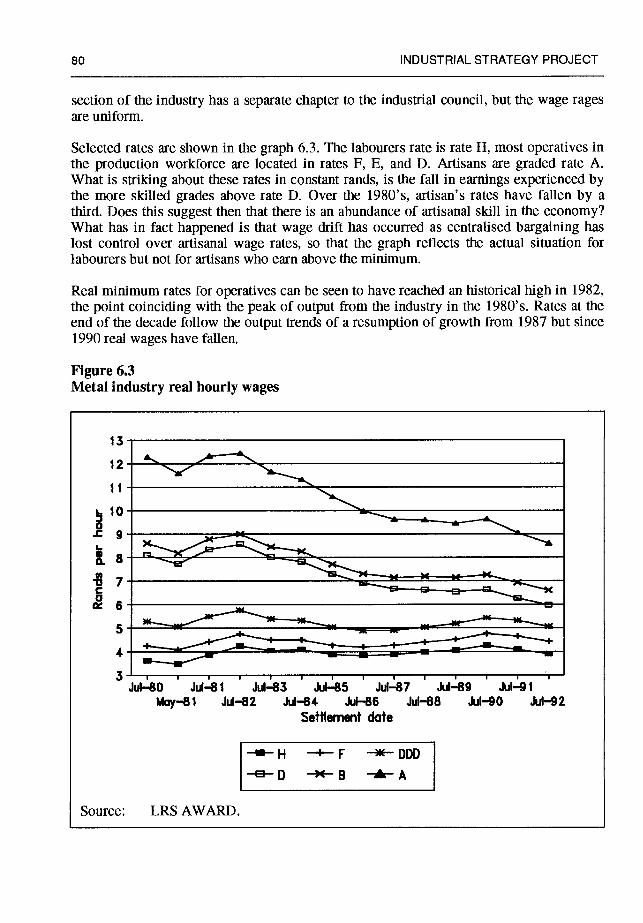
80 INDUSTRIAL STRATEGY PROJECT
section of the industry has a separate chapter to the industrial council, but the wage rages are uniform.
Selected rates are shown in the graph 6.3. The labourers rate is rate H, most operatives in the production workforce are located in rates F, E, and D. Artisans are graded rate A. What is striking about these rates in constant rands, is the fall in earnings experienced by the more skilled grades above rate D. Over the 1980's, artisan's rates have fallen by a third. Does this suggest then that there is an abundance of artisanal skill in the economy? What has in fact happened is that wage drift has occurred as centralised bargaining has lost control over artisanal wage rates, so that the graph reflects the actual situation for labourers but not for artisans who earn above the minimum.
Real minimum rates for operatives can be seen to have reached an historical high in 1982, the point coinciding with the peak of output from the industry in the 1980's. Rates at the end of the decade follow the output trends of a resumption of growth from 1987 but since 1990 real wages have fallen.
Figure 6.3 Metal industry real hourly wages
4. _ 3
Jul—80 Jul-81 Jul-83 Jul—85 Jul—87 Jul-89 Jul-91 May-81 Jul-82 Jul-84 Jul—86 Jul—88 Jul-90 Jul-92
Settlement date
—— H —'-- F —— DDD
——) —'--B —k-A
Source: LRS AWARD.
ELECTRICAL EQUIPMENT SECTOR 81
International wage comparisons
Labour costs are a key factor in international competition. South African wages have risen in real terms during the 1980's and since this rise has been quite rapid it has given rise to a perception that South African wage rates are far higher than our trade competitors. Wage rates in the dynamic Asian economies are especially poorly understood.
Finding a method to compare wages internationally is notoriously difficult due to the distortions imposed by currency fluctuations. A comparison based on purchasing power parity makes it possible to contrast wage rates in different countries better than a simple comparison based on official rates of exchange. This provides a good method to judge wage rates and trends across countries. South Africa has been included in surveys conducted by the International Metalworkers Federation (IMF). Table 6.6 in Appendix I shows the purchasing power parity of average wages in the electrical engineering industry, expressed in Swiss francs.
Two things are striking about the data. Ranked by the 1989 rates, South Africa falls in the lower quartile. The rates for South Korea, Taiwan and Hong Kong have risen rapidly since 1986 from a rate comparable to South African rates then to double or more by 1989. In these terms South African wages are neither higher than in the dynamic Asian economies nor have they risen so sharply. Furthermore, the rapid rate of increase of wages in those Asian economies has resulted in a structural shift in their economies and lead to the displacement of the more labour intensive aspects of production to the second tier Asian Newly Industrialising Economies (Todd, 1990:263—264).
Human resource requirements
In the event of increased demand for electrical equipment, are the human resources available to the industry sufficient to cope? New reticulation networks require engineering skills, and insofar as original design work is required, a potential shortage of trained engineers may be foreseen. However, the rationalised approach being promoted reduces the need for engineering input and the availability of existing skills is believed to be adequate to meet expanded demands (company interview). The following remarks will address the need for skills, training and availability of human resources for production workers in the equipment manufacturing industry.
Production skills required are the generic skills used in the engineering industry: mostiy metal or plastic forming, shaping, treating, finishing and assembly along with machine minding and testing. The extent of mechanisation varies, from the cable industry which utilises fairly advanced automated machinery to the hand assembly used in the construction of miniature circuit breakers.
82 INDUSTRIAL STRATEGY PROJECT
Training
Technicians required by the industry in the disciplines of electrical design, tool making, plastics and rubber and engineering maintenance are trained by the tertiary technical education system. The majority opinion amongst manufacturers about the quality and utility of the training provided by Technikons was favourable, and that the pool of technical labour was sufficient to meet their needs. Not all companies were satisfied with the availability of technicians and had plans to restart company training programmes due to a shortage of satisfactory candidates for technical positions.
Training for semi-skilled production workers is done in house. The training periods vary by occupation, and the methods used are not uniform as they are dependent upon individual company policy. Resources devoted to training vary widely, from companies which have full time training facilities, normally functioning as a part of their quality control systems, to firms who have no specialist training departments and simply induct new workers into the required skills by making them understudies of experienced workers.
Opinions gathered from the shopfloor found that workers felt that insufficient provision was made for training within firms. Only some companies had a policy of providing study loans to assist workers enrol for national technical courses where these were deemed to be related to the companies activities (company interview).
Under the severe economic recession, which has shrunk the electrical machinery industries' employment, firms have to turn job seekers away and experience no problems in filling positions. Given the enormity of unemployment in this country, shortages of production workers is hard to imagine.
Human resources policy
A human resources policy for the electrical equipment industry needs to be part of a broader plan for developing human resources in the engineering industry. Equipment manufacturers admit that the production choices, in terms of technique, are limited by the skills pool they operate with, and they claim they are constrained from using more advanced methods by the lower skill levels available in the workforce. Without training this is a self forfilling prophesy. Resources devoted to training should address both higher productivity through more efficient working methods as well as increasing flexibility in production.
Skills formation in the electrical equipment industry should be developed in line with overall restructuring of the engineering industry. Programmes developed by NUMSA for rationalisation for occupational grading, modular training and convertibility i.e. skills usable across all branches of industry point to the direction this restructuring should take.
ELECTRICAL EQUIPMENT SECTOR 83
Imperatives for restructuring How efficient the loca:1 electrical equipment industry is cannot easily be determined. International competitiveness is most reliably shown in terms of sustained trade. But as has been shown in the discussion on trade, the low volumes exported and the critical importance of export subsidies means that even trade is not a reliable measure. To overcome these problems more direct comparisons can be made, using a fairly simple criteria to benchmark production. The exercise presented below is not a comprehensive review of international best practice, as that was beyond the reach of this research project. South African firms are simply compared against a successful foreign firm and some revealing measures of performance emerge.
To elucidate the status of the comparator firm it operates facilities in the European Union with head quarters in Belgium, a country with a per capita GNP of 17 560 US $, somewhat below the global average for high income economies. South Africa, classified as a middle income economy, has a per capita GNP of 2 560 US $. In contrast to South Africa's total share of world exports of 0.4% and under a tenth of percent of metal
products exports, the compartor country's shares were 3.4% and 2.6% respectively. (All figures were for 1990).
Transformer firm performance measures compared
Details given below are cover the manufacture of distribution transformers in the range 100 kVA to 200 kVA, the common equipment required for mass electrification.
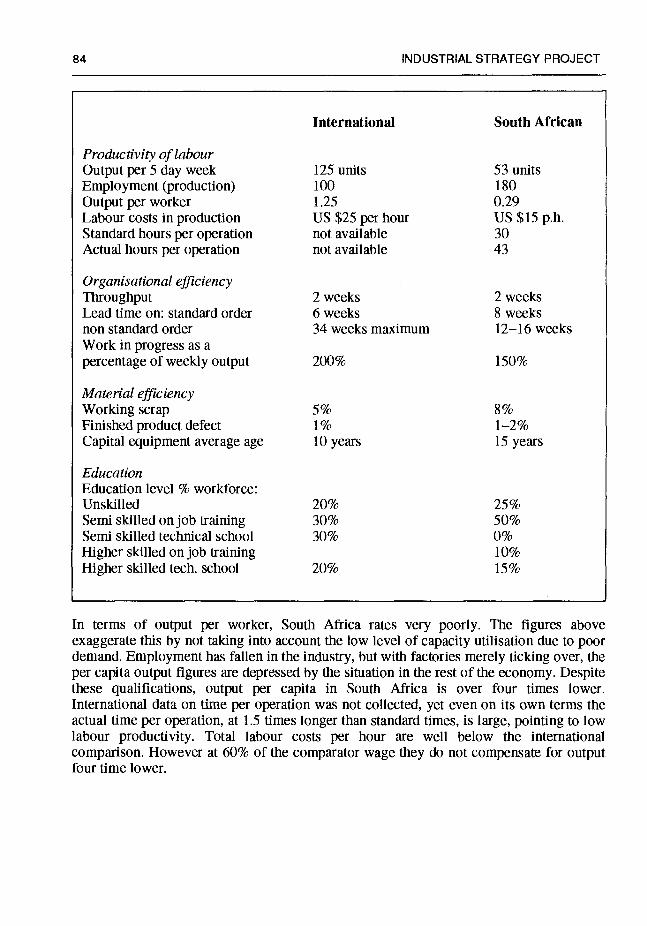
84 INDUSTRIAL STRATEGY PROJECT
International South African
Productivity of labour Output per 5 day week 125 units 53 units Employment (production) 100 180 Output per worker 1.25 0.29 Labour costs in production US $25 per hour US $15 p.h. Standard hours per operation not available 30 Actual hours per operation not available 43
Organisational efficiency Throughput 2 weeks 2 weeks Lead time on: standard order 6 weeks 8 weeks non standard order 34 weeks maximum 12—16 weeks Work in progress as a percentage of weekly output 200% 150%
Material efficiency Working scrap 5% 8% Finished product defect 1% 1—2%
Capital equipment average age 10 years 15 years
Education Education level % workforce: Unskilled 20% 25% Semi skilled on job training 30% 50% Semi skilled technical school 30% 0% Higher skilled on job training 10%
Higher skilled tech. school 20% 15%
In terms of output per worker, South Africa rates very poorly. The figures above exaggerate this by not taking into account the low level of capacity utiuisation due to poor demand. Employment has fallen in the industry, but with factories merely ticking over, the per capita output figures are depressed by the situation in the rest of the economy. Despite these qualifications, output per capita in South Africa is over four times lower. International data on time per operation was not collected, yet even on its own terms the actual time per operation, at 1.5 times longer than standard times, is large, pointing to low labour productivity. Total labour costs per hour are well below the international comparison. However at 60% of the comparator wage they do not compensate for output four time lower.
ELECTRICAL EQUIPMENT SECTOR 85
South African firms compare favourably with respect to organisational efficiency; throughput time is on a par and lead time on a standard order is only a little longer. Other comparisons are a little difficult to make, as it depends upon the factory work load. That the South African estimates are lower shows firstly, lower capacity use, and secondly flexibility does exist to respond to different requirements rapidly. Firms with broad product ranges and small batch sizes, as most South African companies do, have an inherent ability to be flexible as they have developed to serve the diverse needs of a the small local market. South African firms appear to work with lower work in progress levels, which may be one indicator of the attempts to implement Just In Time production. Local firms do not show a good static per capita output performance. Time series data is not available to reveal trends.
Local firms are working with older equipment but achieve defect levels close to the international comparison. Working material scrap rates are higher and manufacturers say that the biggest source of problems are material defects ex factory, accounting for one quarter to one half of all production faults. One firm stated that their quality assurance
system rejected 5% to 10% of all incoming material. This is significant in two respects, firstly as many of the raw material suppliers are SABS 9000 quality rated, the high errors transformer manufacturers claim they are receiving calls into question the validity of this quality standard. Secondly, high error rates on incoming materials frustrate finns moving to more advanced production techniques with lower inventories. It is not surprising that manufacturers are selecting few suppliers and trying to build better relations with suppliers.
Educational levels in South Africa are clearly lower than overseas and less evenly spread across skill bands. On the job training plays a larger role in the absence of technical education.
Workers views of current work organisation
Dramatic total factor productivity growth in the dynamic Asian economies has pin-pointed dynamic efficiency gains as contributing the largest share to overall productivity growth. In the process, a host of organisational and production practices have required re- examination in light of 'best practice' lessons learnt the hard way by European and American firms finding themselves unable to compete on quality, flexibility, technology and price with their Asian counter parts. South African firms are not exempt from this challenge of the 'New Competition' as Best (1991) refers to it, conceptually identifying the firm as the 'collective entrepreneur'. Distinguishing features of the entrepreneurial firm are a strategic orientation, continuous improvement in process and products and
organisational flexibility. 'A strategy of continuous improvement, however, demands an organisation in which a persistence to detail operates at every activity level. The persistence to detail is about incorporating learning from doing into improved ways of doing' (Best, 1991:13).
86 INDUSTRIAL STRATEGY PROJECT
The point to be made here is that under the current way that production is organised, and in the adversarial relations between management and the shopfloor, some fundamental lessons are being missed about the incremental productivity gains restructuring production can unlock.
As to whether workers have the knowledge to alter and improve the production process, there can be no doubt, despite the low levels of literacy and numeracy African production workers generally posses. Whether organisational changes can take place to the mutual advantage of workers and management is another matter entirely. Workers interviewed had this to say about work organisation.
In the stores they are using a circuitous way of ordering stuff. If I have to do it the way the boss does it then it means more work.
If the job takes nine hours work according to standard time schedules and if I can do it in six hours, I will spend the other three hours doing something that is profitable for me (worker interview).
Thereby squandering the productivity gains that 'working smarter' generates.
Existing efforts to involve workers in contributing to raising productivity and sharing their knowledge are not necessarily successful either, as the following remarks show.
Suggestion boxes are put out for people to get improvements. Supervisors collect them and then he does nothing about it. He waits three months and then the supervisors presents it as his own suggestion! Then the production manager comes to workers and says 'you must do things this way'. What do you think the worker feels about that? (worker interview).
There is a clear signal of alienation in these comments. Yet even modest changes were suggestive of gains that could be made. In this example new management opened up communication channels between the union and the chief executive. When a repeat export order hinged on meeting deadlines the 'high moral of the people got the order out two weeks before the time' (worker interview). While the above views are subjective, they suggest improvements could be made through restructuring.
By comparison with developed countries, South African education levels are much lower, but it is questionable whether more training alone is the key to raising productivity. Due to the type of markets firms operate in with short production runs and broad product ranges, workers are already fairly 'multi skilled' and able to perform a range of functions. The comparisons made above showed local firms to be quite flexible. Company executives questioned about skill requirements felt skills were adequate for the production techniques used i.e. a different skill mix in the workforce would allow alternative production strategies. There are interlinked problems here, one the one hand, low levels of education do not prevent competency at production tasks but are obstacles to autonomous organisation of work required by sophisticated production strategies. On the other hand workers are able to identify ways to improve productivity if company structure, decision making and lines of authority do not stifle their interest in doing so.
ELECTRICAL EQUIPMENT SECTOR 87
The need for restructuring
Imperatives to raise productivity in the industry exist in the competitive threat from imports. In addition it has been suggested in this report that tariff protection be lowered, in part to increase the pressures on firms to restructure. Raising efficiency is also necessary if 'low cost' electrification is to be achieved wherein the resources applied have the largest possible effect. The above discussion has shown that South African firms lag behind in comparative productivity assessments, but it also gives some insight into the potential to make improvements through restructuring production on the shop floor.
Chapter Seven: Assessment of equipment supply for electrification
Equipment requirements and supply capabilities
A central question this study has posed is how well the electrical distribution equipment industry would be able to respond to increased demand from a mass electrification programme. This chapter sets out to answer that question by drawing on a comprehensive review of manufacturers' estimates of their supply capacity. The foreign exchange impact of a mass electrification programme will also be assessed. Finally the employment creation potential will be examined.
In Chapter Two, an overview of the equipment used in low cost electricity networks was
presented. It is now necessary to apply that information to different rates of connection scenarios to identify any potential bottle-necks in equipment supply.
Equipment requirement ratios have been drawn up for urban, high density areas, and these are presented below. More variation in requirements apply to rural areas, taking into account different terrain factors and choices as to technology. Estimates of rural requirements are covered in the review of supply capability for the industry as a whole.
Equipment costs per connection
Table 7.1 lists the material costs for a standard low cost connection for urban networks. This is approximately Ri 300 per connection (1992 rands). Supply authorities recognise these prices are currently low, due to the shortage of work which has meant contractors are tendering on reduced margins. Actual averages per connection for 1992 have been shown to be higher, but these would have included provision for distribution sub-stations. The figure above will be retained as it refers solely to equipment covered in this study. On a sample of projects, labour costs vary between 18% and 23% of the material costs in the total value of the contract.
Metering and distribution boards constitute the largest single cost per connection. BEC metering technology is four time more expensive than the installation of credit meters, but considered justified by supply authorities. Again ready boards raise the capital cost per connection but save on house wiring costs to the consumer, which can come close to half the cost of electrifying a dwelling (Brooking, 1987).
ELECTRICAL EQUIPMENT SECTOR 89
Capability of the supply industry to meet electrification demand
A comprehensive survey has been conducted by Eskom to assess the capacity of its own contract suppliers and other supply firms to meet electrification targets (Nell, 1993). Existing capacity was assessed as well as potential maximum capacity, assuming existing technology and plant remained unchanged and all that was added was additional labour. The survey covered the period to 1997, by which time Eskom's 'Electricity For All' programme is due to be completed. It should be born in mind that in the original conception of this programme Eskom was expected to undertake a third of the target of three million new connections. The assumptions used in the above survey were that between 1993 and 1997 a total of 1.783 million new connections will be made, Eskom contributing 42 percent. For practical purposes what is important is the availability of equipment measured in terms of new connections covering urban, rural villages, rural and farm consumers.
Supply scenarios
Total equipment supply potential is shown in table 7.2. in Appendix I. All tables referred to in this chapter are in Appendix I. Concrete poles emerge as the Achilles heel of the electrification programme, having a annual connection potential of only 260 000. The next capacity constraint that would be run into is in the manufacture of service connection cable at 700 000 new connections per annum. Existing capacity in transformer manufacture would be sufficient for 830 000 new connections. Only two other items have a potential supply level of less than a million connections per annum: pole top boxes and ABC strain fittings.
Assuming manufacturing capacity were to be held constant, the ability of suppliers of key equipment to meet various electrification targets is shown in graph 7.1. The supply constraint in concrete poles has been disregarded. This is a valid indicator of the supply industries capacity as wooden poles can be substituted for concrete poles, as explained below.
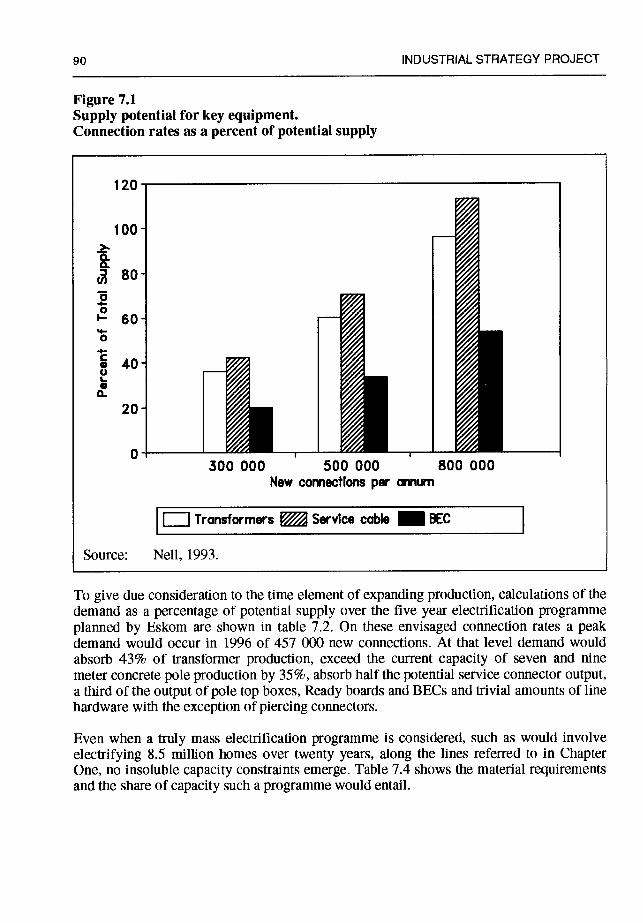
90 INDUSTRIAL STRATEGY PROJECT
Figure 7.1
Supply potential for key equipment. Connection rates as a percent of potential supply
I [J Transformers Service cable BEC
To give due consideration to the time element of expanding production, calculations of the demand as a percentage of potential supply over the five year electrification programme planned by Eskom are shown in table 7.2. On these envisaged connection rates a peak demand would occur in 1996 of 457 000 new connections. At that level demand would absorb 43% of transformer production, exceed the current capacity of seven and nine meter concrete pole production by 35%, absorb half the potential service connector output, a third of the output of pole top boxes, Ready boards and BECs and trivial amounts of line hardware with the exception of piercing connectors.
Even when a truly mass electrification programme is considered, such as would involve electrifying 8.5 million homes over twenty years, along the lines referred to in Chapter One, no insoluble capacity constraints emerge. Table 7.4 shows the material requirements and the share of capacity such a programme would entail.
120
100 2- 0. 0. 80 a 0 60
'4- 0
140
0
Source: Nell, 1993.
300 000 500 000 800 000 New comections per annum
ELECTRICAL EQUIPMENT SECTOR 91
Overcoming capacity constraints
Concrete poles have been identified as the most significant bottle-neck in material for electrification. This is not regarded as a serious problem. First, wooden poles are easily substitutable and total capacity in wooden poles is large, although it would impact on price in competition with other customers. Secondly, concrete poles are the preferred technology, particularly in the urban context, but not all supply authorities use concrete poles. Concrete pole manufacturers have the choice of doubling capacity by adding a second shift. Poles are cast in moulds, which would entail limited investment to increase capacity, were finns confident demand were to be sustained, say manufacturers (company interview).
Increasing output without new plant
Information was gathered through finn visits and by means of a survey to establish how well firms would be able to respond to increased demand. Capacity utilisation ranged between 55% and 80% in the sample and output could be increased between 100% and 160% simply by increasing shifts.
Investment requirements
At the current and projected future levels of demand, the electrical equipment industry does not require new investment. This generalisation must, however, be qualified in two respects. Firstly, plant in some sections of the industry is old, and its replacement would be justified once higher demand levels were reached. Secondly, greater efficiency will be required of the industry under pressure from imports and a more demanding local market, with the phasing out of a local preference of 2.5% granted by Eskom. Information gathered from firms indicates that in all instances where investment might be undertaken, unwarranted in current circumstances, it would be incremental. The two most capital intensive sectors — cable and transformer manufacture would accordingly require the largest investments.
Assessment of the capability of the supply industry to meet electrification demands
Evidence presented above paints an optimistic picture of the ability of the electrical distribution equipment industry to provide for an accelerated electrification programme. Constraints do exist at levels above 250000 new connections for concrete poles, but this is easily resolvable. Thus, either at rates of connection envisaged by Eskom's electrification programme, or at a higher and more sustained level there are no apparent equipment bottle-necks. The rate of connection could, conceivably rise as high as 700 000 per annum before running into the next level of constraints in terms of service connectors, transformers or pole top boxes. Higher output could be achieved using existing plant that would not require substantial investments. Therefore a mass electrification programme
92 INDUSTRIAL STRATEGY PROJECT
would not entail the importation of a substantial amount of manufacturing equipment to proceed, a point to which the discussion will return.
As an Eskom engineer commented in a sanguine fashion:
Eighteen months ago people asked how we were going to manage to electrify at the rate we planned to. At the height of the rural electrification programme we were using 16 000 kilometers of line per annum and the industry supplied us with poles — admittedly these were wooden. Now we are doing 150 000 connections per annum which requires 15 000 kilometers of line so the demand is roughly comparable. Transformers are not a problem. Speaking to Power Engineers about doing our order of 6000 over a year I was told they had done that in other orders in three months.
The rural electrification programme built capacity and it is now a question of whether the industry can adapt from 22 kV line equipment to ABC. In principle it should be possible (company interview).
Suppliers views of the electrification equipment market
In response to an ISP survey to identify the major problems facing the industry, manufacturers who expressed a view, ranked their answer in descending order of significance as follows:
1 Uncertainty over scale and nature of electrification programme;
2 limited alternative markets and exports;
3 cost of capital for expansion;
4 cost of raw materials;
5 cost of labour;
6 productivity of labour;
7 dumping by foreign competition;
8 shortages of engineering staff;
9 low skill levels of production workers.
In clarifying these responses it should be pointed out that firstly, the offtake for electrification varies considerably with some firms devoting only a small proportions of their turnover to electrification markets. Secondly, import competition is not experienced unifonnly.
Uncertainty was expressed both about the scale and the standards being pursued. Scepticism exists about the extent to which resources will be devoted to electrification, whether the rate of new connections will accelerate, and also how long the programme will run for. In the light of these uncertainties executives surveyed expressed an unwillingness to invest until firmer assurances were given about the scale of the electrification programme.
ELECTRICAL EQUIPMENT SECTOR 93
Low domestic demand clearly showed up in the high priority accorded to increasing exports and finding alternative markets to the low margins earned on electrification tenders. The ability to develop exports were linked, not surprisingly, given the source, to controlling costs of raw material and labour.
Foreign exchange consequences of electrification
Imports are estimated to make up some 22% of the total value of equipment for electrification (company interview). The bulk of this is made up by imported raw materials, principally for transformers, switchgear and electronics. Table 7.1 estimates the first round import content for key equipment.
Much of the equipment manufactured locally requires imported inputs of steel, chemicals, electronic components and sub assemblies like relays. Yet there are some items which are used in large quantities that are fully imported or have low amounts of value added locally, in particular surge arrestors and MV insulators. Import substitution of such items could be possible in terms of a large scale and sustained demand.
Foreign exchange leakages appear to be limited. Since it has been established that further investment, which would entail a high foreign exchange outlay, would not be required for until demand at least doubled, the balance of payments implications of electrification are limited.
Employment creation in the equipment industry
Will electrification generate many new jobs in the supply industry as part of fulfilling its promise of providing a stimulus to the economy?
The short answer is that employment creation will be limited. A more complex answer entails examining possibilities for revising production systems to explicitly generate more jobs. But first it is necessary to look at how manufacturers see the employment generation potential.
Output can be substantially raised in the industry by the addition of relatively small amounts of labour. Data collected from firms indicate that manufacturers expect to be able to double output with an increase of the existing labour force of between 7% and 20% Opinion in the industry is well expressed by one manufacturer who said 'Electrification will not create a lot of jobs. Employment will happen downstream, in the construction and contracting industry, also in white goods, the lighting markets will grow, but not ours' (company interview).
The skills required are overwhelmingly for semi-skilled production workers and then for skilled workers in small proportions. Since training periods for operators is short, between eight and 20 weeks, training workers would not pose a problem.
94 INDUSTRIAL STRATEGY PROJECT
Employment estimates made for electrification programmes have covered job creation in equipment manufacturing, contracting and electricity supply industry, as well as in the electrical appliance industry. One such estimate made by Dingly (1990) suggested that 50000 new jobs would be created in the aforementioned industries under a comprehensive national electrification strategy.
In a second study estimates of the total employment effects of a mass electrification programme throughout the economy have been made by De Wet, referred to in Chapter One. The authors of the report recognised most jobs would be indirectly generated, although no data was provided for the equipment industry or electrical supply industry. Estimates on pessimistic and optimistic assumptions suggested that over a twenty five year programme connecting 7.5 million homes, between 0.3 million and 0.6 million new jobs should be created by 1995; 0.7 million and 0.9 million by 2000 and 1.8 million to 2.25 million by 2015 (De Wet, 1990).
The De Wet report was based on an econometric model of the employment multiplier throughout the economy. The figures it provides appear overly optimistic on several grounds. Firstly, with the substantial under utilisation of productive capacity prevalent in the economy, output can rise faster than new employment. Secondly, in an effort to become better able to withstand greater competition, firms have focused attention on productivity growth and this is likely to slow the rate of new job creation.
On the basis of data collected, I estimate that electrification efforts in the region of 500 000 new connections per annum could increase direct employment by 20%. On the basis of estimates of total employment in the industry, the effects of such an increase would be to generate over 4 000 new jobs, raising the industries total employment to 25 200.
Employment in the electrical contractors industry and electrical supply industry has been recognised to be the major areas of new job creation. However, the modest figures for equipment manufacturing call forth a creative examination of alternatives that would result in greater employment generation. One area upon which more research is required is to examine employment generation in the simple fabrication sectors of the industry such as the building of metal enclosures for equipment. Such activities which require little dedicated machinery could be sub-contracted to small more labour intensive enterprises.
Capacity to meet electrification demands and economic effects —
concluding remarks
The South African electrical distribution equipment industry is fully capable of meeting the needs of a large scale electrification programme without running into bottle-necks or running up a large foreign exchange bill. This study has highlighted the following features.
ELECTRICAL EQUIPMENT SECTOR 95
There are no major supply problems in electrification equipment, with the exception of concrete poles. In the short term these are substitutable with wooden poles.
Investment requirements for expanding concrete pole production are modest, thus in the medium to longer term this bottle-neck may be easily overcome.
The equipment supply industry has the capacity to increase output sufficient for 700 000 new connections per annum, without requiring new investment.
First order foreign exchange leaks for electrification are in the region of 22%. Since supply can be expanded without requiring major new plant, an expansion of the scale of electrification will not carry a large foreign exchange burden. In the longer term the aged capital stock will require replacement and this will increase foreign exchange leaks.
Investment in the electrical machinery industry has been held down due to the poor state of the economy. For electrification equipment in particular, uncertainty over the scale and nature of the programme has dampened investment. A comprehensive and credible electrification plan is necessary to allow manufacturers to plan for up grading plant and to exploit import substitution possibilities that may be found.
Job creation in the equipment industry will be limited, in part because capacity utilization is so low and in part because restructuring, so necessary to raise efficiency will tend to create fewer, higher skilled jobs. As few as 4000 new jobs may be directly created through a doubling of current demand.
A final remark must be addressed to the impact of electrification on the electrical
machinery industry as a whole. The flagging fortunes of electrical equipment manufacturers have been somewhat revived by the increase in demand. Yet the size of the electrification market, even if it were to double its present size, is still too small to significantly boost the metal sector. Even within the electrical equipment industry, the evidence shows that, precisely the reason why supply could increase so dramatically, is because the electrification segment absorbs a relatively small portion of the market. Therefore, the industry will not grow on electrification alone, and sustained growth will only be feasible when industrial and commercial demand revives.
Chapter Eight: Policy for the electrical equipment industry
The formulation of an industrial policy for the electrical distribution equipment industry has to take cognizance of three issues. First, it needs to strengthen the existing structure and function of the industry to perform better, rather than to steer it in an entirely new direction. Secondly, policy to foster developments which will make the industry better able to meet electrification needs will not require major intervention measures. While market failure is evident in limited aspects of the industries operations, policy must essentially articulate with prevailing market forces. Thirdly, only certain specific areas require detailed policy. This report has discussed the problems presented in Chapter One and presented solutions in the chapters that followed. In this final chapter these points are consolidated. The presentation of policy is prefaced by some remarks placing South Africa in a world context.
South Africa in the world context Material presented in this report thus far has set out the structure of the local electrical distribution equipment industry, measured its performance in output, in trade, technology development and presented comparative performance data for the transformer industry.
This section will conclude by asking whether the local industry is in tune with international trends. Indeed what is the international trajectory of the electrical distribution equipment industry? Key features may be identified as follows:
First, large trans-national corporations in the industry show a trend towards conglomeration, particularly European and North American firms. Examples of this are the Assea Brown Boveri and General Electric Alsthom merger.
Secondly, technology in this industry is show changing and many products are mature. Areas of research activity are in the field of solid state power electronics, energy conservation and environmental protection.
Thirdly, developing countries are expanding their production of simple products such that there is a trend to relocate production of commodity products in switchgear, cable and transformers in developing countries. Allied to this are prospects of increased volumes of trade in standard items.
Fourthly, established firms in developed countries are concentrating on design intensive products and moving out of competing in simple product markets.
ELECTRICAL EQUIPMENT SECTOR 97
South Africa is likely to be affected by the trends in the following ways:
First, ownership changes, mergers or co-operative agreements between trans-national companies will impact on their local subsidiaries.
Secondly, growth in international trade will increase pressures on local producers.
Thirdly, the acceptability of products in developed markets will require meeting health and environmental standards.
Restructuring the ESI and a programme of action The top priority in a policy to develop the electrical equipment industry is not an industry specific one, rather it is about creating an environment for growth by restructuring the Electrical Supply Industry to remove the political obstacles in the way of a mass electrification programme. The case for restructuring has been made in Chapter One, and it is an essential prerequisite for progress.
The second essential requirement is for the development of a comprehensive national electrification programme and the formation of a suitable institution to bring together all the stakeholders be they the industry, local authorities or consumers. The National Electrification Forum represents a key institution to facilitate the development of such a plan that can set targets, mobilize capital and monitor progress.
Manufacturers are clearly uncertain about the scale of the electrification programme, and only towards the end of 1992 did it become clear that Eskom was committed to implementing its share of the targets set in the 'Electricity for All' programme. Only when a comprehensive and credible plan for electrification is developed will the full benefits of the electrification market be experienced by the industry. Whether the eventual plan will stop short at the 'Electricity for All' targets or be enlarged to cover the entire population depends on the political will of decision makers. But whatever is decided, the lack of a coherent plan is diminishing the ability of current electrification programmes to stimulate the industry.
The industrial policy issues to be judged are whether expanded demand will lead to firms adopting a rent seeking position or whether they will invest for expansion. Nine problems, critical to the development of the industry and goals for electrification were set out in Chapter One. Each problem will be examined in turn.
98 INDUSTRIAL STRATEGY PROJECT
Solutions to problems identified in the electrical equipment industry
1) Lack of investment in the equipment sector
The industry has ample capacity to meet the needs of increased demand without requiring any new investment. However, old plant will need to be upgraded in time, particularly if higher productivity is to be achieved and greater use is to be made of technical developments in equipment design and new materials.
Investment will be stimulated by clear signals that large scale electrification is to begin. It has been argued in this study that industrialists are adopting a cautious view of the scale of electrification, therefore attention needs to be given to generating a common vision of the scale of the undertaking and the timing involved. Involvement of the major players (i.e. state, companies, trade unions, distribution authorities) in drawing up the overall plan would facilitate this step. Annual targets would facilitate production planning by allowing manufacturers to clearly predict equipment requirement and to match this to capital expansion programmes.
2) Fragmentation of demand and lack of standards
This problem can be solved from two directions. Efforts to rationalise and standardise equipment will need to have been concluded so uniform standards apply throughout the country. The body coordinating rationalisation at present is the National Rationalisation of Standards Project and will thus need to be strengthened and have its recommendations accepted and implemented. Since field conditions vary in different regions, allowance will still need to be made for regional variations such as the availability of local raw materials. Channelling demand through a coordinated purchasing plan specifying rationalised standardised equipment would overcome the fragmentation of demand problem and effectively enforce standards.
3) Lack of scale economies
The solution to this problem will come primarily from the increase in demand flowing from an up scaled electrification programme. Exports may add to capacity utilization.
4) High raw material costs
High raw material costs from key up stream industries, such as PVC for cable coating, is built into the industrial structure of the South African economy and rapidly adjusting their prices is not possible. The solution to this problem lies in a larger scale restructuring of basic industries and falls beyond the immediate concern with the electrical equipment industry. Increasing competition in the supply of such raw materials or providing subsidies
ELECTRICAL EQUIPMENT SECTOR 99
to down stream users linked to a simultaneous restructuring of the raw material pipe line are policy options to overcome the problem of import parity pricing that deserve further research and consideration by the state as one aspect of industry-wide restructuring. It should be noted that firms are currently able to negotiate lower costs on copper and aluminium for export orders. However, the issue of potential competitive advantage that the industry should derive from being sited near to raw materials and, from which, it is currently deriving no benefit, needs to be addressed. Attention has been given to this
problem in current ISP research on beneficiation.
5) Low skilled workers
At present, South African factories in the electrical equipment industry sector run on the basis that operator labour has low levels of skills and therefore performs simple tasks. Training in order to redress the low skills levels of operator labour would expand the range of production choices available to a firm. Training in this industry should be part of a comprehensive metal industry human resources plan. In view of the scale of an electrification programme which will require the training of workers for electrical contracting, electrical supply maintenance as well as equipment manufacture, equipment industry training should not be separated from the broader training requirements. However, such training needs to encompass more than a simple expansion of opportunities for existing technical diplomas, as this will not change the way the work is done in the factory. There is a need for such courses to encompass production strategies, aspects of quality control, and efficiency. If the industry is to survive, these factors must be treated as trade union concerns as much as management concerns.
This study has argued that restructuring is essential to cope with competitive threats from imports, to raise productivity and most efficiently apply resources for electrification. The type of restructuring envisaged involves a fundamental changes on the shop floor, and evidence presented in the report suggests that considerable potential exists for productivity enhancing changes to be made when the terms are suitable for workers to apply their creative energies to the task.
6) Foreign exchange requirements and balance of payments implications
The findings of this study point to minor foreign exchange requirements for the equipment industry, the first round import bill for electrification equipment the for materials and
equipment imports being in the region of 22% Upgrading and replacement of capital equipment will have a high import content, but firms will not be required to do so simultaneously. Opportunities for import substitution will also become clearer as the scale of requirements is elaborated.
100 NDUSTRAL STRATEGY PROJECT
7) Trade regime and export development
This study has looked in detail at the trade regime and argued that, given the fairly high rates of protection applicable to key equipment that is locally made, import parity pricing is being followed by firms. Accordingly, the policy suggested is for a gradual tariff reduction to increase the competitive pressure on those sectors.
With regard to exports the focus of a large scale national electrification programme is on the domestic economy. However, exports may well be facilitated through the stimulation the local industry receives. No specific policy measures are proposed to stimulate exports over and above the currently available export incentive schemes.
Factors which will facilitate the growth of exports would be more competitive pricing brought about by resolving cost disadvantages on domestically beneficiated inputs and large scale production. The development of new low cost standards will promote local adaptive R&D with the two fold benefits of lessening dependence on licensed technology and developing equipment suited to developing country conditions. A stronger technological base will provide a better position from which to renegotiate licence agreements with a view to removing export restrictions. Local technology development will put the equipment industry in a better position to trade in the Southern African regional market where considerable long term potential lies.
8) Supply bottle-necks and inefficiencies
Evidence has been presented to show that there are no equipment bottle-necks, save for the supply of concrete poles. Therefore, the basic question posed at the start of this study concerning the ability of the industry to supply the necessary equipment for electrification has been answered in the affirmative.
Bottle-necks cannot be ruled out, particularly where the introduction of new technologies may cause disruptions to ongoing supply during their industrialisation phase, e.g. problems of this nature were experienced with the introduction of partially pre-stressed concrete poles. The solution to this problem lies in the creation of appropriate institutions, such as the National Electrification Forum liaising closely with manufacturers in a representative body to monitor, indentify and make provision for potential bottle-necks before they escalate into serious problems.
The study began by identifying two hypothetical sources of action for firms in response to an increase in demand: to invest and expand output to meet demand or to engage in monopoly pricing. Evidence presented showed that the supply capacity exists and while domestic demand from other sectors is low, competition for electrification business is very keen. Centralised purchasing has also set prices producers have been forced to accept.
Since at least some items of equipment may be imported, from the purchasing authorities perspective this meets two needs: that of being able to overcome short term shortages with imports and to maintain pressure on local producers to remain cost competitive. Imports
ELECTRICAL EQUIPMENT SECTOR 101
thus could be used to discipline the industry and prevent rent seeking. Resorting to imports would, however, signal a failure to achieve the expansion required.
9) Limited job creation
Evidence presented in this study points to very limited direct employment being generated by an increase in demand in the equipment industry. In that one respect, as a goal set for an electrification programme to generate employment, it seems to fall short. Policy in this regard needs to investigate the viability of sub-contracting certain aspects of equipment manufacturing which are labour intensive and require limited capital equipment, such as fabricating enclosures.
Specific policy recommendations
Past efforts at technology development for low cost reticulation systems need to be extended to create new solutions and products. The broad environment for innovation will be set by rationalised standards, but innovation will benefit from support measures. It is recommended that the scope of R&D matching grants made available to the electronics industry be widened to include the field of electrical engineering, and further, that attention be given to targeting support for innovations addressing low cost electricity reticulation problems and other infrastructure programmes that are directed to meeting basic human needs.
An overhaul of the standards authority in South Africa is required for it to obtain international recognition as a body able to certify compliance with international standards. The present situation where firms are required to submit their products for testing to both international and local authorities is costly and should be made unnecessary.
Environmental safety requires specific measures to eliminate the use of hazardous substances. Regulations prohibiting the use of PCBs and governing their safe disposal are required. Specific measures are required to enforce first, the removal of PCBs from the recycled transformer oil pool; secondly, a prohibition on the importation of PCBs, thirdly, regulations to safely dispose of contaminated oil and to rectify faults in previous disposal activity.
Policy conclusions
This study started by posing a number of issues identified as problems in the way of the electrical equipment industries' ability to meet the needs of mass electrification.
Having presented solutions and related policy it is necessary to examine incentives and institutions capable of implementing policy.

102 INDUSTRIAL STRATEGY PROJECT
Incentives
To repeat what has been previously argued: a coherent plan for mass electrification will shape the supply industry through the power purchasing authorities will have. Collective buying will solve problems of efficient production scales but will also provide the incentive for finns to reorganise their production to meet rigourous cost targets.
Institutions
Major institutions which will be instrumental in organising and implementing a mass electrification programme will be the state, industry associations, trade unions, professional associations, distribution authorities and electrical contractors. This list includes existing bodies whose functions may expand or alter to suit the necessary requirements. The ES! is far from been restructured, but progress has been made toward a more suitable vehicle to implement electrification plans and the National Electrification Forum is a crucial point of departure.
The equipment industry is reasonably well served at two levels, by professional engineering institutes like the SAIEE and SA chapter of the IEC, and by the trade associations. Engineers are grouped in special interest sections to deal with power matters in the SAIEE as well as the AMEU and power R&D sections of the CSIR and universities. These form the nucleus of engineering skills which can be directed to further research on affordable electricity distribution systems.
Within the equipment supply industry, cable manufactures maintain an independent industry association, whereas other sections rely on the metal industries industrial council to collectively represent their interests, particularly on employment matters.
The formation of a body grouping all manufacturers supplying electrification equipment is recommended to represent the equipment industry and improve information flows. Such a body would permit the industry to participate directly in electrification promotion bodies.
Trade unions are key institutions and will have a crucial role to play in shaping the future of the equipment supply industry. It has been argued that productivity development is essential in this industry. Productivity gains are also essential if the industry is to be cost competitive and to export.
A case has been made for restructuring, the institutional form that would require bringing together trade unions and employers. What is preposed is a joint union employer forum for the electrical equipment industry with the purpose of tackling three areas: human resource development and skills formation within a wider plan for the metal industry; restructuring directed at improving productivity and investigation of means to increase employment in the sector in a variety of ways.
ELECTRICAL EQUIPMENT SECTOR 103
A mass electrification programme will have substantial economic, social, environmental and employment effects. The electrical equipment industry stands to gain enormously from such a programme. The effects of a coordinated market, able to pull the industry along, together with some specific interventions in the field of human resource development and, most crucially, promoting productivity, should put the industry in a position to provide competitively priced equipment to the local and international market.
Part Two
The Professional Electronics Industry
Table of Contents
Executive Summary
Part Two — The Professional Electronics Industry
Chapter One: The economic significance of electronics 1
Defining electronics 1
Professional electronics 2
A special case for electronics in industrial policy 3
Chapter Two: Global trends in the electronics industry 6
The international character of electronics 6 South Africa's place in world electronics markets 7 Global trends in the electronics industry 9
Implications of global trends for South Africa 13
Chapter Three: A profile of the professional electronics industry 14
Statistical overview 14
Market structure of the professional sector 19
State intervention in the e'ectronics industry 22 Institutions present in the industry 30
Chapter Four: Trade 33
An overview of the electronics trade 33 Trade regime for professional electronics 39 Professional electronics exports 41
Chapter Five: Technology and the environment 46
Diffusion of electronics technology 46 South Africa electronics technology development efforts 48
Chapter Six: Environment and Health issues 58
Environmental issues, health and saftey 58 CFC use in electronics 58 CFS use and alternatives in South Africa 61
Policy on health and safety and eliminating the use of ozone depleting substances 64
Chapter Seven: Human resources . 65
Employment and earnings 65 Skill requirements and availability in the electronics industry 70
Chapter Eiht: Sub-sector assessment of the professional electronics industry 76
Electronics components 76 Transportation electronics 80 Control and automation 81
Security equipment 83 Power electronics 84 Military electronics 86 Test and measurement 88
Chapter Nine: Policy for the professional electronics industry 91
Policy objectives for industrial strategy 91 An industrial policy for the professional electronics industry 92 Policy on technology diffusion 93 Policy on international integration 95 Functional interventions for the electronics industry 96
Appendix I 99
Appendix II 112
Bibliography 119
11
Executive Summary
The professional electronics industry The economic significance of electronics has led to it being understood as a crucial enabling technology. It has been shown that spillover effects from innovations in electronics provide the largest contributions to raising productivity in other, non electronic sectors.
This report examines the professional electronics segment of the South African electronics industry. The sub-sectors covered are: components, security equipment, control and automation, power equipment, test and measurement, transport and military electronics. These sub-sectors have a market size of R3.2 billion or 24% of the total electronics market for 1992.
Electronics is a highly internationalised and fast changing industry; characterised by rapid technological change and shortening product life cycles. South Africa is a minor player in the world's industry, adding an estimated 0.12% to world production and consuming 1.32% of world sales in 1988.
Entry barriers in electronics are rising and an examination of global trends shows that the core elements of competition have shifted from price to R&D and the coordination of networks for sourcing components, technology and market access. The implications of these trends for South Africa are greater competition in general, less security in niche markets as leading firms adapt to serving heterogeneous markets, restricted access to leading edge technology and being locked out of cooperative networks.
South Africa's electronics industry was largely the creation of state policies pursued for strategic and military reasons. This has shaped its character and given it a domestic orientation. Since 1988 the sector has been contracting, mostly as a result of reduced levels of state support. Foreign ownership is limited. Profit levels have dropped, especially in smaller firms.
Considerable intervention was undertaken by the state in the past to promote the industry, mainly through procurement policies. State policy, however, has failed to produce a dynamic industry. The state has backed off from implementing a coordinated approach since the mid 1980's. A recent attempt to develop an industry wide plan with participation from trade unions, industry bodies, and the public sector was launched in 1992.
The South African electronics market is heavily import dependent, and exports are negligible. The professional sector shows a worsening trade account from the late 1970's.
ill
South Africa's share of world exports has declined since the mid 1970's as it did not participate in the growth of world trade in electronic products. Tariff protection levels were lowered in 1992. Exports from the professional sector have grown between 1988 and 1991 by 14% per annum from a very low base, yet still only equal 6% of imports.
Efforts at technological development in this industry are disproportionately concentrated in smaller firms. A high dependence on foreign technology exists with little evidence of learning strategies being pursued by firms. State support for technology development has been through grants for R&D. However, policy has given insufficient attention to the diffusion of technology, the activity from which most economic benefit is derived.
The continued use of fluorocarbons for cleaning purposes by South African electronics manufacturers poses a risk to the environment and calls for an environmental policy for the industry.
Electronics is a skills intensive industry: however, due to the contraction of the industry, there are no obvious skills shortages at present. South Africa's human resource base is critically short of science, engineering and technological skills. By implementing steps to meet its own skills requirements, the industry can contribute to enhancing the technological level of the country's human resources.
A sub-sector examination reveals that there are no clearly dynamic parts of the professional industry. The legacy of a domestic focus means there appear to be only isolated pockets of competitive strength, mainly based on innovations in applied technology. The military sector, responsible for much early growth, exhibits signs of declining competitiveness. Local firms have begun to employ more advanced production and design technology which will, in time, improve their competitiveness, which suggest a potential exists for some sub-sectors to be winners.
Policy for the sector addresses two broad areas:
• Measures to promote technology diffusion in order to spread the economic benefits of the application of electronics technology through the economy. If successful the electronics industry would become driven by downstream demand.
• Measures to promote the international integration of the industry to obtain technology, components and subsystems. Exporting is essential for growth and to achieve this firms will need to integrate more fully into world markets in sourcing activities as well as for market development.
A set of functional interventions are proposed to address key problems and reinforce the main policy goals.
• Support for R&D activities through a continuation of schemes providing matching grants for innovation activities.
iv
• The establishment of a scheme to subsidise the use of consultancy services by firms in order to promote the diffusion of technology. A related measure proposed is the establishment of an industrial extension service for small electronics firms to assist them with access to information on technology and market research.
• A human resource development programme to upgrade the skills base in the electronics sector. A comprehensive programme of skills development could act as a vehicle to upgrade the technological skill level of the metals sector.
• Measures to speed up the phasing out of ozone depleting substances and to assist finns to apply alternatives.
The report concludes South Africa will never be a major electronics producing country and that further contraction may result from more international integration. The measures advocated should allow the areas of competence and innovative capabilities which do exist to come to the fore, and promote the industry's role in stimulating the international competitiveness of other sectors of the manufacturing industry.
V
Chapter One: The economic significance of electronics
This report considers the problems facing the South African professional electronics industry and proposes policy for that industry. Before embarking upon that task, it is
necessary to define what electronics is and why it is important to study it. Thereafter the portion of the industry dealt with in this report, namely professional electronics and the sub-sectors within it will be defined.
Defining electronics
Despite the ubiquitous nature of the electronics sector in the global economy, a precise definition of electronics has not emerged; this in itself underscores how pervasive electronics has become.
In the classification of industrial activity, electronics is subsumed under electrical engineering, as the branch dealing 'extensively with the transfer and processing of information by means of electromagnetic energy' (Fitzgerald, 1981:329). From the view of physics it is 'an applied physical science concerned with the development of electrical circuits using semiconductors and other devices in which the motion of electrons is controlled for the purposes of communications, control or computing' (Uvarov, 1986:128).
A good way to appreciate electronics as an economic sector, encompassing the manufacture and application of equipment and systems, is to conceptualises the stages through which the products of this sector pass. As a result, most writers develop a system to capture the inter relatedness of the sectors' parts (Todd, 1990; Mackintosh,1989). One useful approach emanating from the Science Council of Canadian (SCC) helps draw out different skill levels and investment costs in a simple taxonomy of components, subsystems and systems (SCC, 1992:2), summarised below.
Components are the raw material for making electronic products. Semiconductors are the most important electronic components, making up the fundamental building blocks of electronics. Semiconductors possess the characteristics of fast switches, and when laid out in numbers in a logical pattern, make up integrated circuits. Integrated circuits (IC) are able to store and compute information. The suitability of IC for miniturisation, resulting in greater performance with lower material content, has created the term microelectronics. Along with semiconductors go passive components and other electronic components. Semiconductor fabrication is a highly capital intensive activity. IC design is a specialist engineering discipline requiring high skill levels.
2 INDUSTRIAL STRATEGY PROJECT
Software is the second fundamental component for electronics, required to direct the functioning of the electronic circuitry. Components are assembled into subsystems, capable of performing certain tasks in connection with other subsystems but not able to perform them in isolation. Examples would be signal acquisition equipment, electricity flow sensors or computer circuit boards. Electronic subsystems are assembled or manufactured in facilities with different degrees of direct labour where small runs may involve semi-skilled assembly workers, and large volumes would use automated assembly plant. Sub assembly design requires engineering skills.
Systems represent the end products of the electronics sector. Subsystems are integrated into a final product containing the required functions for its intended purpose. A factory automation system, road traffic controller or energy management system are examples of sub-assemblies integrated into a functional whole with the required software. High levels of engineering skills are required for systems integration.
End products of the electronics industry cover an assembly of equipment and systems: computers, industrial automation and control, electronic office equipment, telecommunications, consumer electronics and more.
Professional electronics Particular attention needs to be given to defining the boundaries of this study as it is focuses on a sub-set of the electronics industry which I shall refer to as professional electronics.
Distinguishing electronics production by the identity of the end user divides it in two: professional and consumer electronics. Professional in this sense means users which are public or private sector bodies. Three important characteristics apply to the professional sector, it involves the manufacture or integration of components or equipment; equipment is destined for a specific functional task; specifications are higher and life cycles expected to be longer than consumer equipment.
This study of the electronics sector in South Africa focuses on the professional sector but excludes telecommunications equipment, computer hardware, computer software and services sectors. As the principle objectives of the Industrial Strategy Project were to develop industrial policy for the country's manufacturing industry, the study was narrowed to focus on activities involving local manufacturing and providing inputs into other branches of the manufacturing sector. As will be shown in Chapter Three, the software, services and computer hardware market in South Africa accounts for approximately 44% of the total market, however, hardware is overwhelmingly supplied on an agency basis for foreign computer suppliers. Telecommunications, which has constituted a major part of the local electronics manufacturing industry has been examined in detail by Kaplan (1990). It is excluded from this study.
ELECTRONICS SECTOR 3
Professional electronics is the term which will be retained and will be defined to cover the following sub-sectors: components, security equipment, control and automation, power equipment, test and measurement, transport and military electronics. Out of a total market size estimated to be R13.3 billion in 1992, this segment accounts for approximately 24% of the total market with an estimated worth of R3.2 billion.
A note about software is appropriate, since it not treated as a separate category in this study. Software is an essential electronic component and integral to building electronic systems. It is possible to identify firms devoted to developing application software on a contract basis in South Africa, but the major activities of such firms are in retailing software and customer support. However, the largest amount of software effort in the professional electronics sector takes place within manufacturing firms themselves, as an integral part of the process of developing products and systems. For this reason it is not treated separately.
A special case for electronics in industrial policy Professional electronics is a part of the larger Information Technology (IT) industry and throughout this study the technical and economic dimensions of wider industry provide a backdrop. Information Technology has been defined as:
A new techo-economic paradigm affecting the management and control of production and service systems throughout the economy, based on an inter-connected set of radical innovations in electronic computers, software engineering, control systems, integrated circuits and telecommunications, which have drastically reduced the cost of storing, processing, communicating and disseminating information. It comprises a set of firms and industries supplying new equipment and software, but its development and applications are not limited to this specialised IT sector (Freeman and Soete, 1985:3).
Electronics has a 'pervasive and generic character' (Hoffman, 1985:263) that is by now so well understood as to be virtually taken for granted. The significance of electronics has the following dimensions: on the production side, growth has been meteoric, if past growth rates continue it will soon make up the largest share the manufacturing sector.
On the application side, electronics technology is an essential requirement for raising productivity amongst users, permitting superior methods of handling information to be made possible with each successive generation of technology. Electronics is a key leverage technology, as measurements of the effects of innovations produced in different sectors conclude 'more or less however one estimates it, the results always suggest the electronics innovations have the largest impact on user productivity' (Geroski, 1991:1446).
Electronics is a strategic industry, both in relation to military capabilities as well being the flag bearer for a country's high technology industries. For these reasons government's the world over have adopted policies to promote their national industries. So important is electronics, no government can afford to ignore it.
4 INDUSTRIAL STRATEGY PROJECT
The wide-ranging impact of electronics on production mechanisms and consumption makes it imperative that every developing country, whatever its stage of industrialisation, should actively participate in the ongoing evolution of electronics as users, and in certain circumstances later explained, as producers (UNIDO, 1990:5).
Objectives of industrial strategy
The overall objectives of this study are framed by those of the Industrial Strategy Project (ISP) namely, to develop policy to promote the emergence of an internationally competitive manufacturing sector. Three further themes inform policies proposed by the ISP: first, the promotion of industries that meet the basic needs of the population; secondly, the promotion of competitive exports; and thirdly, the generation of employment.
The objectives of this sectoral study of the electronics industry are fourfold: first, to assess in broad terms the structure of the market, employment and earnings, the industry's trade performance and the extent of its innovation activities. Secondly, to identify the principal problems confronting the industry. Thirdly, to assess the vitality of each of the seven sub- sectors investigated. Fourthly, to formulate policy to address problems identified and promote the industry in terms of the overall objectives of the ISP.
What will become apparent from the detailed discussion to follow, is that there are severe problems affecting the industry and that it is currently in something of a transition state. While it is possible to identify the character of the industry of old, the orientation it will follow in the future is still unclear.
The electronics sector in South Africa has enjoyed a degree of attention in industrial policy and state intervention well above other sectors. Despite these efforts, this report will argue that state policy for the sector has failed. The overall policy advocated in this report has two dimensions. The key policy objective proposed is to promote the diffusion of electronics technology as widely as possible, thereby spreading the economic benefits of the application of electronics to other sectors. The second leg of policy is to promote the international integration of the industry. In pursuit of these objectives, proposals are made for modest interventions on the supply side with some specifically targeted policies for R&D support, technical assistance to small manufacturing enterprises and human resource development.
Methodology
Extensive use has been made of interviews with electronic company management representatives. The reason for this stems from the lack of other information sources, and literature (relative to other sectors of the electronics industry such as computers). International tendencies weigh very heavily upon this industry, thus, use is made of the extensive literature, as well as information gathered on a field trip to Europe.
ELECTRONICS SECTOR 5
Report contents
Chapter Two makes the case for the importance of understanding the international character of electronics. It presents information describing key competitive trends in the world electronics industry and assess the implication of the argument that barriers to entry for electronics are rising.
Chapter Three provides a detailed profile of the professional electronics industry by providing a statistical overview, examining the history and origins of the South African industry and provides data on the economic performance of firms in the sector. South Africa's electronics industry owes its existence largely to state intervention. The measures adopted, and those not adopted are analysed. Finally, institutions present in the industry are described.
Chapter Four provides a review of trade performance, and shows the import dependence of the sector. Chapter Five presents an assessment of firms innovation activities. Chapter Six examines environmental problems associated with electronics manufacturing and notes a number of health and safety measures requiring attention.
Chapter Seven presents an overview of employment and earnings data and argues the need for a skills development strategy for the sector. It is argued that upgrading skills in the electronics sector can produce substantial beneficial spillovers in skills for the metal sector as a whole. Chapter Eight provides a detailed description of each sub sector and weighs up the evidence of competitiveness for each.
Policy proposals are presented in the final chapter building on the forgoing evidence about the industry. The policy proposed focuses on international integration of the South African professional electronics industry and technology diffusion to maximise the productivity enhancing properties of this important sector. A number of functional interventions to address some of the specific problems identified are proposed.
Chapter Two: Global trends in the electronics industry
Electronics is a truly global industry and comprehending the international character of the industry is, therefore, an essential requirement for policy making. The very volatility of the industry indeed underlines the need for policy to be globally orientated, lest policy declarations become obsolete before the ink has dried on them.
A well developed literature now exists on the electronics industry, much of it dealing with state policy to promote electronics as well as documenting individual country experiences, particularly in the dynamic Asian economies. This chapter does not intend to survey all the available literature, rather it's purpose is to identify the key trends in current theorizing about the electronic industry and to raise pertinent matters likely to have an impact upon the South African electronics industry.
The international character of electronics The factors which make electronics an international industry consist of the following set of inter-related elements. On the one hand there are technology push factors, in which the power and functionality of electronic devices rises while their unit cost falls in a cycle of innovation breeding concomitant obsolescence. The innovation cycle tends to reduce product life cycles, however, the resources required for innovation and production for increasingly complex systems have risen steadily. On the other hand there are market pull factors as not only are greater resources needed in production and innovation, but so too in marketing and support. Large scale economies become important to amortize both production and distribution costs. Since communication and control is central to electronics, the connectivity of equipment is critical and this has given rise to the creation of certain standards, either precisely defined such IEEE standards or de facto standards as exemplified by the IBM Personal Computer. Regardless of where it is undertaken, equipment is usually manufactured to a standard and can, in principle, be sold in any market around the world. Thus scale economies are measured in world scale terms for production as well as distribution. No country is self sufficient for all its electronics needs and this applies as much to the fundamental building blocks i.e. components as it does to sub-systems. Thus the sourcing of components is also done on a world wide basis.
Electronics is a relatively new industry, and developed rapidly in the post World War II period in an era of free trade (Mackintosh, 1989:6). Trade in electronic equipment, therefore has been a significant feature of its international character. Developing countries which have sought in the past to grow national electronics industries through domestically oriented policies, such as India and Brazil, have been no less affected by the global context than any other country. Due to the pervasiveness of electronics technology and a clear tendency for it to be used in larger proportions in other electro-mechanical systems,
ELECTRONICS SECTOR 7
the influence of the international trends, experienced as competition, is increasing for firms in all countries. International competition beats on the door of every electronics firm, and the discussion which follows is intended to draw out features of competition which characterize the global nature of the electronics industry. But first a word about the size and growth of the industry to put South Africa in an international context.
World growth in electrical machinery production
Electrical machinery at the category ISIC 383 level achieved a more rapid annual growth rate than any other sector during the 1980's, equalling 5.9% between 1975 and 1985 (Unido, 1988:104). As a share of total world manufacturing value added, electrical machinery rose from fourth place at 6.98% in 1975 to third place with 9.61% in 1985. The overwhelming proportion of production was attributable to developed countries, although developing countries obtained higher annual growth rates over the decade, so marginally increasing their share of production. Japan led this expansion by a phenomenal 50% increase in manufactured value added, followed by North America, Western Europe and East and South East Asia.
Estimates by Electronics (January 1992) for the size of the world wide electronic equipment and components market for 1992 were $673 billion. A breakdown by the major equipment categories for the United States, Japan and Europe produced estimates of $208.2 for computers and office equipment; $86.7 billion for communications equipment; $86.9 billion for consumer products; $50.9 billion for semiconductors; $20 billion for capital equipment, Computer Aided Design and instruments. The total industry of $673 billion includes some $152 billion in software and services as well as $73 billion in geographic markets and products such as non semiconductor components, industrial and military electronics.
Direct employment in the information technology industry in Japan, the United States and Western Europe was put at 4.5 million in 1983 and expected to rise to 7.16 million by 1995 (Mackintosh, 1989:45). Due to increasing automation in assembly, this employment projection may be an over estimation.
In quantitative terms the electronics industry is huge, and although its prodigious growth rates have slowed down during the 1990's it is nonetheless expected to become the world's largest manufacturing industry in the mid 1990's. In qualitative terms the significance of electronics technology will be explored in more detail in the discussion on technology.
South Africa's place in world electronics markets
Production and consumption estimates for 1988 for thirty countries are presented in tables 2.1 to 2.4 in Appendix II, figures are in 1988 US dollars, against which the South African
currency had depreciated significantly since 1986 and thus would tend to underestimate the size of the local industry. South Africa ranks bottom as a producer country, thirty
8 INDUSTRIAL STRATEGY PROJECT
percent smaller than next placed Indonesia. Local production contributed a 0.12% share to world production in that year (Table 2.1 Appendix II). In comparison South Africa ranked 19th as a consumption market, on a par with Austria, and ahead of Hong Kong and Finland, making it a market which absorbed 1.32% of world sales in 1988 (Table 2.2 Appendix II).
An examination of the local production share of the market shows that South Africa performed poorest of all countries with a trade deficit, with the value of local production meeting only 20% of domestic demand, Australia with a local production share of 29% was next worst, making them the only two countries in the sample which produced less than half the value of the local market (Table 3.3 Appendix II).
Against a selected group of developing countries showing main market segments, South Africa's weakness in all sectors becomes apparent. Countries which developed their industries on export orientated lines, Hong Kong, Singapore, South Korea and Taiwan reveal an industry structured around the production of electronic systems, EDP, office equipment, telecommunications equipment and consumer electronics and a components industry geared to feed the aforementioned equipment sectors. India and Brazil which have perused policies of self sufficiency can be seen to have achieved mixed results, even exceeding local consumption in some sectors. South Africa, in contrast, stands out with the only sector reaching close to half the local market, that for consumer electronics being an excessively protected one. In contrast to other countries the domestic share of local production is uniformly weak with no evident emphasis on any sectors, making it best characterised as 'broad and shallow'. This theme of industry structure is taken up in table 2.5 showing the South African market share in the sample of thirty countries as well as the structure of the local industry by sub-sector against the sample as a whole. Looking first at market share figures, minuscule production in world terms is performed locally. However, as a market South Africa registered as a more serious prospect in 1988, taking 2.5% of sales of telecommunications equipment, and over 1.7% of sales of components, consumer products and military electronics. The production structure deviates from the sample average by smaller shares in EDP and components and large shares in military, telecommunication and consumer products. On the consumption side this carries through to an above average market for military products and below average market for components due to the overall low levels of domestic manufacture.
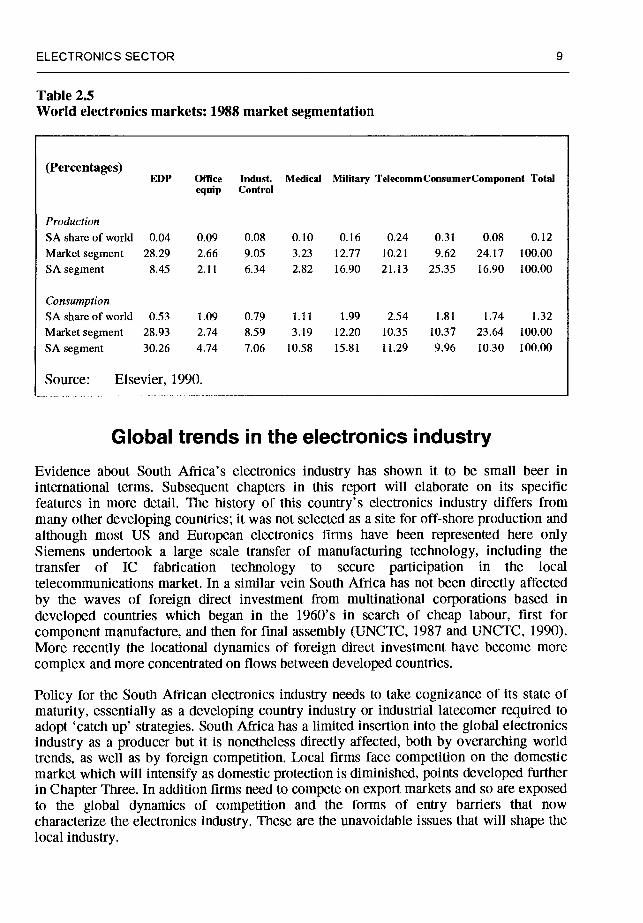
ELECTRONICS SECTOR 9
Table 2.5 World electronics markets: 1988 market segmentation
(Percentages) EDP Office Indust. Medical Military TelecommConsumerComponent Total
equip Control
Production SA share of world 0.04 0.09 0.08 0.10 0.16 0.24 0.31 0.08 0.12 Market segment 28.29 2.66 9.05 3.23 12.77 10.21 9.62 24.17 100.00
SAsegment 8.45 2.11 6.34 2.82 16.90 21.13 25.35 16.90 100.00
Consumption SAshareofworld 0.53 1.09 0.79 1.11 1.99 2.54 1.81 1.74 1.32 Market segment 28.93 2.74 8.59 3.19 12.20 10.35 10.37 23.64 100.00
SAsegment 30.26 4.74 7.06 10.58 15.81 11.29 9.96 10.30 100.00
Source: Elsevier, 1990.
Global trends in the electronics industry Evidence about South Africa's electronics industry has shown it to be small beer in international terms. Subsequent chapters in this report will elaborate on its specific features in more detail. The history of this country's electronics industry differs from many other developing countries; it was not selected as a site for off-shore production and although most US and European electronics firms have been represented here only Siemens undertook a large scale transfer of manufacturing technology, including the transfer of IC fabrication technology to secure participation in the local telecommunications market. In a similar vein South Africa has not been directly affected by the waves of foreign direct investment from multinational corporations based in developed countries which began in the 1960's in search of cheap labour, first for component manufacture, and then for final assembly (UNCTC, 1987 and UNCTC, 1990). More recently the locational dynamics of foreign direct investment have become more complex and more concentrated on flows between developed countries.
Policy for the South African electronics industry needs to take cognizance of its state of maturity, essentially as a developing country industry or industrial latecomer required to
adopt 'catch up' strategies. South Africa has a limited insertion into the global electronics industry as a producer but it is nonetheless directly affected, both by overarching world trends, as well as by foreign competition. Local firms face competition on the domestic market which will intensify as domestic protection is diminished, points developed further in Chapter Three. In addition firms need to compete on export markets and so are exposed to the global dynamics of competition and the forms of entry barriers that now characterize the electronics industry. These are the unavoidable issues that will shape the local industry.
10 INDUSTRIAL STRATEGY PROJECT
The dynamics of global competition
Semiconductors have attracted considerable attention as an electronics segment capable of capturing the volatile character of international competition (see Howell, 1988). By focusing upon 'cutting edge' activities in semiconductors and computers Ernst and O'Conner (1992) have developed an approach which synthesizes current thinking about competitive trends and the following discussion will draw heavily upon this work.
Rapid changes in technology and modifications in demand have created new markets and entry possibilities for developing country industries. However, entry barriers have risen in some production and distribution stages 'While production-related scale economies continue to matter, the epicenter of competition has shifted to R&D and other forms of intangible investment and to the co-ordination of increasingly complex corporate networks. Our research shows that competitive success increasingly depends on the capacity to reduce the huge co-ordination costs of network transactions, and this applies as much to supplier networks as to customer and technology networks' (Ernst & O'Conner, 1992:24). Their argument is constructed by examining five entry barriers in turn.
Production related scale economies have been cited as one of the features underlying the international character of electronics. Ernst and O'Conner (1992) draw out three qualitative dimensions of scale economies: learning economies, threshold barriers and economies of scope. First, improving yields and lowering average unit costs through accumulated production experience is essentially what is meant by capturing learning economies so applicable to mass production activity. Yet barriers to capturing learning economies are rising due to the growing complexity of devices and systems plus the tighter coupling of end systems with component design, resulting in a greater need to know and incorporate user requirements as part of learning economies. Secondly, entry threshold barriers are rising and the capital requirements for production becoming prohibitively large and concentrated, exemplified in the huge capital costs of building new semiconductor facilities. Thirdly, fluctuations in demand and shortening product life cycles have driven an expansion in economies of scope to cater for differentiated markets in a single facility, again making this costly for new entrants.
Significant barriers beyond the sphere of production now confront new entrants who have to contend with obstacles in distribution and support as competitive attention shifts to include post production matters. Research and Development has been a critical feature of entry barriers in high technology industries, yet while they remain important they have declined in relative importance to other intangible investments in human resources and complex sales and sourcing networks, argue Ernst and O'Conner (1992). In their view scale economy considerations apply as much to three areas: economies in sourcing materials and services from other firms; network economies of scale (explained below) and economies in market intelligence and distribution.
ELECTRONICS SECTOR 11
In the production of electronics systems a shift has occurred to increased reliance on external sourcing of materials, components and sub-assemblies. In addition these have evidently been supplemented by new relations linking firms in networks which transcend market relations. 'Networks differ from both markets and hierarchies and constitute a sui generis form of organising economic transactions. They are an attempt to respond to and to exploit market imperfections, particularly for technology, while at the same time trying to avoid the limitations of excessive vertical and horizontal integration' (Ernst and O'Conner, 1992:35). Technological improvements in the field of telecommunications and computing have made possible networks linking system builder to upstream suppliers. Concomitant with increased external sourcing has been a tendency to rationalise supplier networks in which a smaller number of privileged suppliers coordinate closely with purchasers, thereby narrowing the scope for entrants.
Convergence tendencies of basic technologies coupled with the intensifying science content has presented firms with the requirements to master a broader spread of technologies. Technological convergence has been evidence between computing and telecommunications and to this has been added image processing.
Post production costs have risen to claim a larger share of total costs due to the competitive requirements of obtaining market information, establishing distribution channels and providing customer services. Global competition which requires establishing distribution channels in the major markets and considerable resources to compete on customer service represents a major entry barrier.
The last two sets of entry barriers concern regulatory barriers set up by governments and strategies by leading firms to block new entrants. Governments have been reluctant to forgo promoting their high technology industries in the pursuit of international competitiveness, with the result the electronics industry, amongst others, has become more politicised. Intervention in various forms has earned the label 'high-tech neo- merchantilism' (Ernst and O'Conner, 1989).
Regulation of domestic markets is practised by virtually all governments to protect their national industries via measures combining trade and industrial policies in ways that are generally simply better disguised than the direct market reserve policies adopted, for example in Brazil. Various regulatory barriers ranging from market reservation or government procurement policies; restrictions on establishing firms in specific sectors; the use of standards on design, safety and compatibility; limitations on foreign firms gaining access to scientific knowledge or technological exports; restricting access to core componentry; restrictions on pricing behaviour and access to distribution channels and discriminatory financial behaviour. These barriers shape trade within developed countries as much as between developing countries and OECD members, but as Ernst and O'Conner (1992) point out, new entrants are likely to be more affected by such barriers and less able to lobby for changes.
Finally, although the oligopoly established by leading firms is itself unstable, leading firms possess a range of entry deterrence strategies to deploy against new entrants. Features of such strategies entail iiiter alia, concentrating on core technologies and
12 INDUSTRIAL STRATEGY PROJECT
subcontracting ancillary activities; establishing cost advantages in R&D activities; aggressively defending intellectual property rights and using automated factories to block
competitors gaining market shares. In the face of such strategies focusing on market niches may be considered appropriate for new entrants; however it does not represent a secure markets as large firms are required to become adroit at addressing niche markets themselves.
Access to technology
Access to technology is a fundamental requirement for developing a viable electronics
industry, hence an appreciation of global trends in technology transfer is essential for a development strategy for the industry. Yet there is a prima facie case to suggest that developing countries will face greater obstacles to obtaining access to technology in the light of the patterns of competition outlined above. Major features of the international technology market identified by Ernst and O'Conner (1992) will be examined: a rise in external technology sourcing and a shift to a sellers market in technology.
An appreciation of technological interdependence among electronics firms has existed for some time and it has been noted that this has been a growing phenomenon, taking various forms: foreign direct investment, joint ventures, licensing and cross-licensing, acquisitions and cooperative research. Such signs of convergence have been concurrent with ongoing competition (Langlois, 1988).
Cooperative agreements or strategic alliances are best understood as network transactions undertaken by firms for a range of motives, according to Ernst and O'Conner (1992), principally for sharing the burden of costs and risks associated with technological development, for access to markets, access to finance, to influence standards and access to key factors of production, particularly in R&D activities. Driven to a significant extent by the need to master a range of technologies, even large firms have been forced to focus on areas of core expertise and enter into alliances to obtain ancillary technologies. Predominantly these type of cooperative agreements have been between firms of equivalent competitive status in developing countries (company interview) thus confining technology flows to developed countries and 'locking out' firms from developing countries.
Ernst and O'Conner (1992) argue that the situation that prevails in international technology markets does not favour the diffusion of technology to developing countries as has been suggested in the past (Soete, 1985). At the same time as product markets are subject to more intense price and non price competition, international technology markets have shifted to become sellers markets in which developing countries face both a resistance to licensing key technologies as well as a more rigourously enforced intellectual
property regime.
ELECTRONICS SECTOR 13
Implications of global trends for South Africa South African firms will operate in a world context shaped by fiercer international competition at a price and non price level. Recognition of these trends would be the first appropriate response, and the following represent the major issues to contend with. First, competitive pressure can be expected to grow as the relative isolation firms have experienced on the local market will diminish as foreign firms review their participation in the South African market. Moreover this follows through into export markets and thus an overall more competitive environment will be a key feature for the 1990's. Secondly, firms will need to strengthen their ability to operate in increasingly heterogeneous markets by accelerating new product development to be able to compete where 'speed to market' is critical. Thirdly, the belief that a strategic response to evade competition through focusing on niche markets will provide better scope for South African firms to enter new markets is flawed on at least three grounds — niche markets are unstable with limited growth potential; they impose very high burdens of specialisation to cater for niche needs and, as the above argument has pointed out, dominant firms are themselves becoming attuned to cater for niche markets.
Fourthly, restrictions on access to leading edge technology carries with it a further entry barrier dimension, that of interaction with sophisticated users and the acquisition of market knowledge that goes with it.. Fifth, cooperative agreements have been seen to have increased in significance, involving the coordination of complex networks between roughly equivalent firms, thereby excluding weaker firms from such technology flows. South African firms accordingly are poorly placed to access leading edge technology or to participate in cooperative agreements. However, it may be speculatively suggested that South African firms locked out of technology flows in developed countries may search for potential partners in developing countries in the dynamic Asian economies, developed Latin America countries and 'second tier' Asian electronics countries of Malaysia, Thailand and the Philippines.
Competition in the world electronics industry requires from all participants a strengthening of innovation capabilities, and while such measures on their own are insufficient, given the significance of market intelligence and distribution elements in the electronics 'value chain', they are essential. The extent to which the South African electronics innovation system is able to meet this challenge is examined in Chapter Five.
Chapter Three: A profile of the professional electronics industry
A profile of the professional electronics industry in four parts is presented in this chapter. This study focuses on a segment of the professional sector; first by examining the vital
signs of the industry, secondly the structure of the market and details of some firms are then presented. Thirdly, South Africa's electronics industry has been very largely the product of state intervention, the evolution of state policy toward the sector is reviewed and consequences analysed. The profile concludes with a description of the main institutions active in the industry.
Statistical Overview
Dimensioning the South African electronics industry
By 1992 the total market size of the South African electronics industry was estimated to be R13.3 billion (BMI, 1992a). Growth in the early 1980s was very rapid, a real increase of 10.7% per annum between 1980 and 1984 (BTI, 1986a: 13). Real growth over the rest of the 1980s has been approximately 2% per annum but since 1989 total revenues have fallen sharply.
The telecommunications sector has declined in relative importance over the 1980s. From being the largest market segment, and the one with the highest proportion of local manufacturing activity, it has slipped to third place behind Electronic Data Processing (EDP) hardware and software. Graph 3.1 shows the current segmentation of the electronics market and how heavily weighted it is in terms of software, services and
computer hardware sales. Table 3.1 in Appendix II provides an estimate of market size for all of the industry's segments.
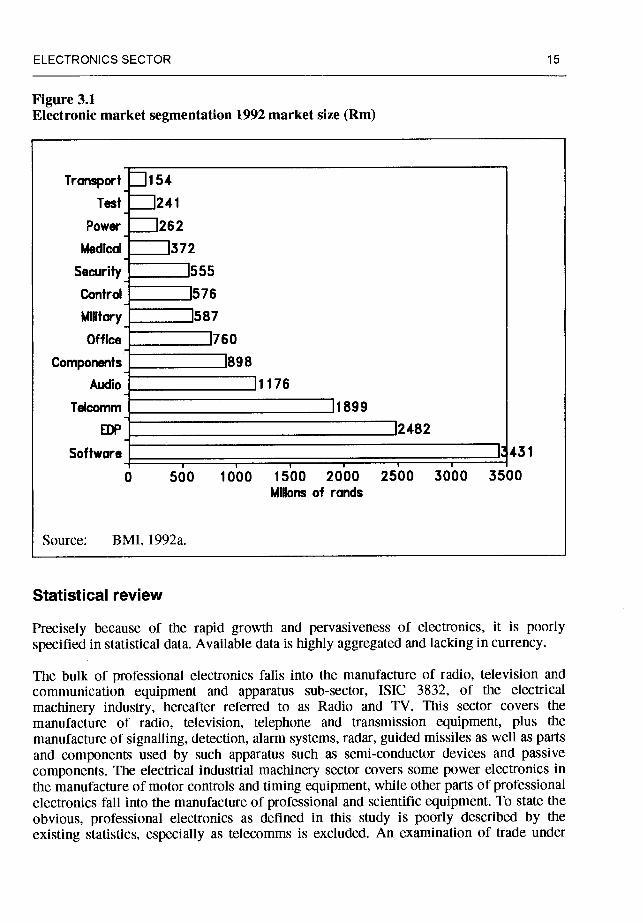
ELECTRONICS SECTOR 15
Figure 3.1 Electronic market segmentation 1992 market size (Rm)
Transport =1154
Test J241 Power i]262
MedIcal 1372
Security 1555
Control 1576
Military 1587
Office 1760
Components 1898
Audio 11176
Telcomm 11899
EDP 12482
Software I 431
0 500 1000 1500 2000 2500 3000 3500 Millons of rands
Source: BMI, 1992a.
Statistical review
Precisely because of the rapid growth and pervasiveness of electronics, it is poorly specified in statistical data. Available data is highly aggregated and lacking in currency.
The bulk of professional electronics falls into the manufacture of radio, television and communication equipment and apparatus sub-sector, ISIC 3832, of the electrical
machinery industry, hereafter referred to as Radio and TV. This sector covers the manufacture of radio, television, telephone and transmission equipment, plus the manufacture of signalling, detection, alarm systems, radar, guided missiles as well as parts and components used by such apparatus such as semi-conductor devices and passive components. The electrical industrial machinery sector covers some power electronics in the manufacture of motor controls and timing equipment, while other parts of professional electronics fall into the manufacture of professional and scientific equipment. To state the obvious, professional electronics as defined in this study is poorly described by the existing statistics, especially as telecomms is excluded. An examination of trade under
16 INDUSTRIAL STRATEGY PROJECT
radio and TV found 45% to be made up of items falling into the ambit of this study, rendering the category a wider data set than desired. In the absence of more suitable data the category is used in this report with circumspection.
In 1991, the value of sales of the electrical machinery industry was R8 222.5 million, some 4.61% of the total value of manufacturing sales. This represents 3.07% of GDP. Radio and TV manufacture had sales of R2 299.7 equal to 1.28% of manufacturing output and 0.86% of GDP.
Employment in the professional electronics industry
In 1991, total employment in the electrical machinery industry stood at 66 100 (SALS, 1992), that is 4.6% of the total employment in manufacturing and 15.3% of the employment in the metal industry including basic iron and steel and fabricated metal products. The racial composition of the workforce in that year is given as 32 600 African; 12 000 coloured; 2 000 Indian and 19 500 white workers. Employment in the Radio, TV and communications industry stood at approximately 22 000.
Estimates for employment in the electronics industry by the BMI are not consistent with CSS data as they include people not in manufacturing establishments. It is estimated that in 1991 the components sub-sector employed 5 000 people, the military electronics sector 3 000, telecommunications 8 000 and the remaining sub-sectors of control and automation, security equipment, power, test and measurement, and transport equipment a further 12 600 (BMI, 1992a). This gives a total employment of 20600 for professional electronics.
Historical growth compared to manufacturing
A measure of the historical growth of the radio, TV and communications sector in comparison to the manufacturing sector as a whole paints an overall picture of trends in the sector.
Table 3.2 Radio, TV and communications percentage share in manufacture
1972—1975 1980—1985 1988—1990
Demand 1.0 1.4 1.8 Local Production 1.0 1.1 1.3
Imports 0.9 3.3 3.9 Employment 1.7 1.6 1.5
Capital stock 0.7 0.6 0.6 Value Added 1.5 1.4 1.5
Source: IDC, 1992a.
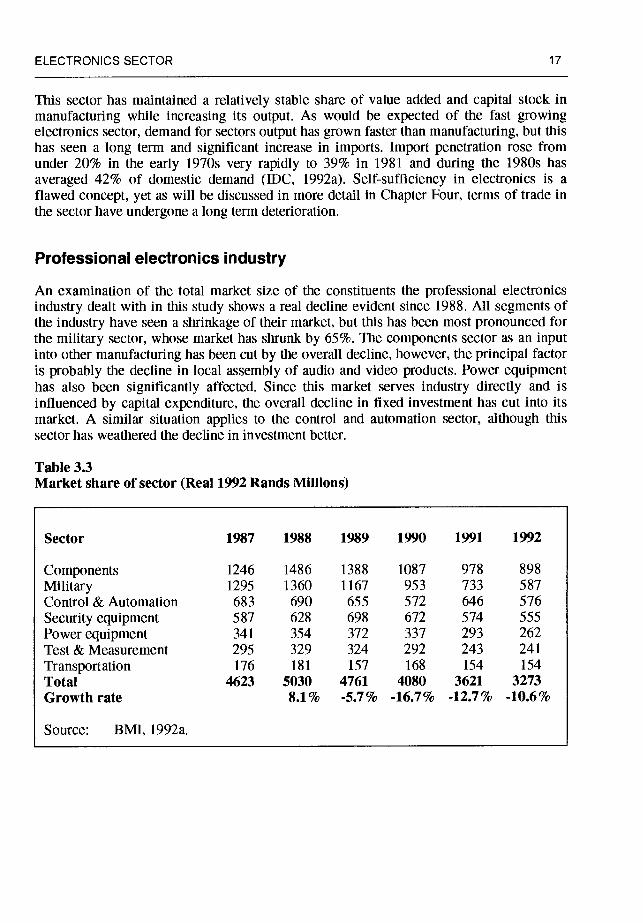
ELECTRONICS SECTOR 17
This sector has maintained a relatively stable share of value added and capital stock in manufacturing while increasing its output. As would be expected of the fast growing electronics sector, demand for sectors output has grown faster than manufacturing, but this has seen a long term and significant increase in imports. Import penetration rose from under 20% in the early 1970s very rapidly to 39% in 1981 and during the 1980s has averaged 42% of domestic demand (IDC, 1992a). Self-sufficiency in electronics is a flawed concept, yet as will be discussed in more detail in Chapter Four, terms of trade in the sector have undergone a long term deterioration.
Professional electronics industry
An examination of the total market size of the constituents the professional electronics industry dealt with in this study shows a real decline evident since 1988. All segments of the industry have seen a shrinkage of their market, but this has been most pronounced for the military sector, whose market has shrunk by 65%. The components sector as an input into other manufacturing has been cut by the overall decline, however, the principal factor is probably the decline in local assembly of audio and video products. Power equipment has also been significantly affected. Since this market serves industry directly and is influenced by capital expenditure, the overall decline in fixed investment has cut into its market. A similar situation applies to the control and automation sector, although this sector has weathered the decline in investment better.
Table 33 Market share of sector (Real 1992 Rands Millions)
Sector 1987 1988 1989 1990 1991 1992
Components 1246 1486 1388 1087 978 898 Military 1295 1360 1167 953 733 587 Control & Automation 683 690 655 572 646 576
Security equipment 587 628 698 672 574 555 Power equipment 341 354 372 337 293 262 Test & Measurement 295 329 324 292 243 241 Transportation 176 181 157 168 154 154
Total 4623 5030 4761 4080 3621 3273 Growth rate 8.1% -5.7% -16.7% -12.7% -10.6%
Source: BMI, 1992a.
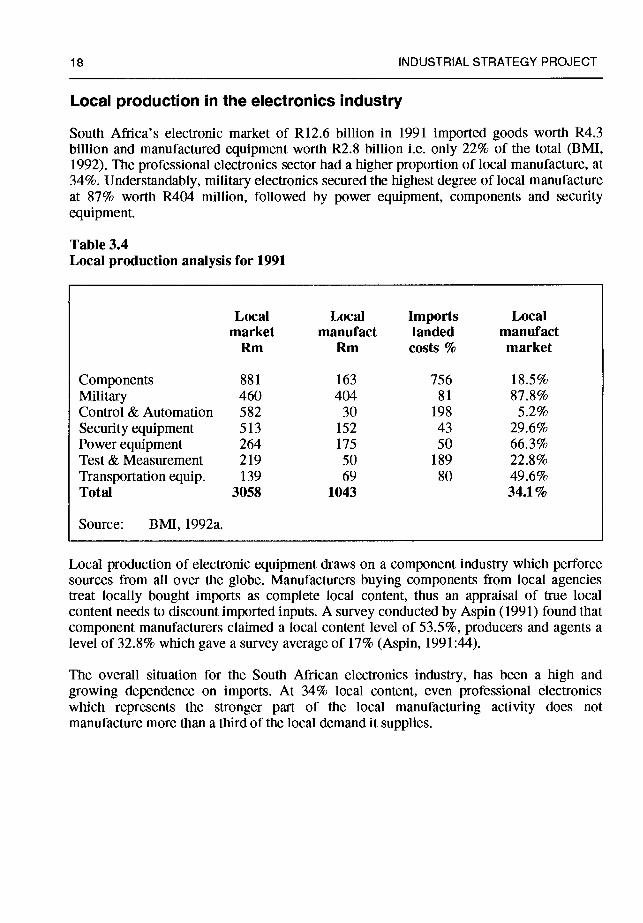
18 INDUSTRIAL STRATEGY PROJECT
Local production in the electronics industry
South Africa's electronic market of R12.6 billion in 1991 imported goods worth R4.3 billion and manufactured equipment worth R2.8 billion i.e. only 22% of the total (BMI, 1992). The professional electronics sector had a higher proportion of local manufacture, at 34%. Understandably, military electronics secured the highest degree of local manufacture at 87% worth R404 million, followed by power equipment, components and security equipment.
Table 3.4 Local production analysis for 1991
Local Local Imports Local market manufact landed manufact
Rm Rm costs % market
Components 881 163 756 18.5% Military 460 404 81 87.8% Control & Automation 582 30 198 5.2% Security equipment 513 152 43 29.6% Power equipment 264 175 50 66.3% Test & Measurement 219 50 189 22.8% Transportation equip. 139 69 80 49.6% Total 3058 1043 34.1%
Source: BMI, 1992a.
Local production of electronic equipment draws on a component industry which perforce sources from all over the globe. Manufacturers buying components from local agencies treat locally bought imports as complete local content, thus an appraisal of true local content needs to discount imported inputs. A survey conducted by Aspin (1991) found that component manufacturers claimed a local content level of 53.5%, producers and agents a level of 32.8% which gave a survey average of 17% (Aspin, 1991:44).
The overall situation for the South African electronics industry, has been a high and growing dependence on imports. At 34% local content, even professional electronics which represents the stronger part of the local manufacturing activity does not manufacture more than a third of the local demand it supplies.
ELECTRONICS SECTOR 19
Market structure of the professional sector
Firm size and output share in the South African electronics market is highly uneven. It is both highly concentrated and, like electronic industries elsewhere, contains a large number of small finns. In 1990 the Electronics Industries Federation, (ElF) estimated that some 1 600 firms were active in the electronics sector, but 80% of the sector's output is accounted for by some six South African or partially locally owned multinational corporations (Desmet, 1991). These dominant firms or groups are Altech, Grinaker, Plessey, Reutech, Siemens and the restructured Armscor enterprises grouped under a new name: Denel. The contraction of the industry in the early 1990s has cut across the board but not substantially altered distribution of output between firms (Engineering News 28/9/92).
Ownership in the electronics industry
Table 3.5 in Appendix II lists the major firms in each of the industries sub sectors, giving the controlling shareholders under ownership and the conglomerate to which the firm is linked. Conglomerate ownership is normally diluted through holding companies. The table clearly indicates the extent of control of the conglomerates in the industry. The Altech group, with a 1992 turnover of R929.9 million, is the largest South African electronics group. Altech's controlling shareholder is Mr. W.P. Venter, the conglomerate Anglo American has interests in the group. Barlow Rand interests in Reunert provide its controlling shareholder SA Mutual with a major stake in the electronics industry. Sanlam
through its industrial investment arm Sankorp and Anglovaal are the other major conglomerates involved. Of the six 'axes of capital' which control listed companies on the South African stock exchange, only two are not significantly involved in the electronics sector.
Foreign ownership is limited, and in most cases involves a degree of local ownership. Significant foreign owned firms are Siemens, with minority shares held by the IDC and Sanlam; AEG wholly foreign owned and SA Philips. Local ownership of electronics firms increased in the mid 1980s as a result of disinvestment pressure brought to bear on foreign principals. Technology flows, however, were not disrupted as local firms continued to have access to licensed technology.
Entry and exit from the industry
Contraction of the electronics industry has been most strongly felt in the defence sector where up to 45 000 jobs have been lost (Cock, 1992:5). Many of those retrenched were
engineers as a result of scaling down of military projects, for example 600 jobs were cut at the missile manufacturer Kentron (The Star 4/12/91). The loss of these electronics engineers has been lamented as a serious squandering of resources built up in the military sector at great cost to the country. It is believed (BMI, 1992) that many engineers formally engaged in military work have started new companies on their own. However, no data is available to corroborate this view. Company registrations are not classified by activity in
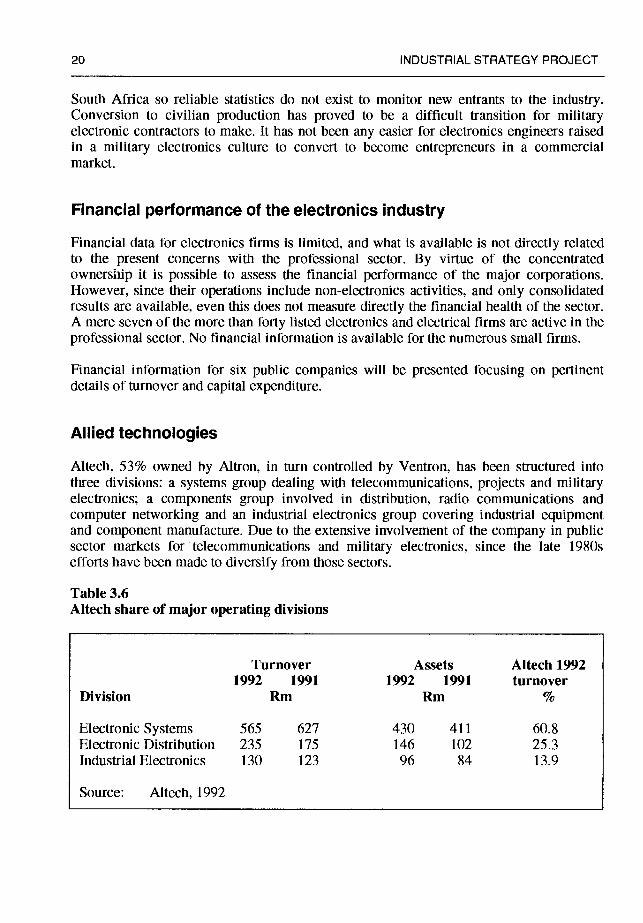
20 INDUSTRIAL STRATEGY PROJECT
South Africa so reliable statistics do not exist to monitor new entrants to the industry. Conversion to civilian production has proved to be a difficult transition for military electronic contractors to make. It has not been any easier for electronics engineers raised in a military electronics culture to convert to become entrepreneurs in a commercial market.
Financial performance of the electronics industry
Financial data for electronics firms is limited, and what is available is not directly related to the present concerns with the professional sector. By virtue of the concentrated ownership it is possible to assess the financial performance of the major corporations. However, since their operations include non-electronics activities, and only consolidated results are available, even this does not measure directly the financial health of the sector. A mere seven of the more than forty listed electronics and electrical firms are active in the professional sector. No financial information is available for the numerous small firms.
Financial information for six public companies will be presented focusing on pertinent details of turnover and capital expenditure.
Allied technologies
Altech, 53% owned by Aliron, in turn controlled by Ventron, has been structured into three divisions: a systems group dealing with telecommunications, projects and military electronics; a components group involved in distribution, radio communications and computer networking and an industrial electronics group covering industrial equipment and component manufacture. Due to the extensive involvement of the company in public sector markets for telecommunications and military electronics, since the late 1980s efforts have been made to diversify from those sectors.
Table 3.6 Altech share of major operating divisions
Turnover Assets Altech 1992 1992 1991 1992 1991 turnover
Division Rm Rm %
Electronic Systems 565 627 430 411 60.8 Electronic Distribution 235 175 146 102 25.3 Industrial Electronics 130 123 96 84 13.9
Source: Altech, 1992
ELECTRONICS SECTOR 21
Turnover in 1992 was R927.9 million, a fraction up on the previous year. Although turnover between 1985 and 1992 has been 12.4% per annum compounded, real growth has slowed considerably since 1988. Operating profit dropped 5.3% in 1992 to R120.4 million. Fixed assets amounted to RiOl million and operating profit R26 676 per worker in 1992. Operating profit margin, was 12,9% and return on shareholders equity 2 1.8% The groups cash reserves are considerable and it is positioned for expansion through acquisitions.
Control instruments
This firm is the holding company for the auto electronic manufacturing firm Electromatic as well as holding several instrument agencies. Turnover has fallen by 10% since 1989 to R66.3 million and operating profits have fallen dramatically from 6.7 million in 1988 to Ri .9 million in 1992, giving it an operating profit margin of 3% and a return on equity of 1.18% for 1992.
Grintek
Grinaker Electronics limited is 94.4% owned by the listed company Grintek. It consists of the following operating divisions: Grinel, Grinel Natal, Grinaker Avitronics, Grinaker Electronics Systems, Grinaker Stelsel-technologiee, Grinaker Electronic Agencies and Grinaker Professional Electronics. As a group heavily committed to military electronics, it has been much affected by the decline in defence spending: turnover declined from R278.2 million in 1990 to R256.2 million in 1992 and pre-tax profits have fallen over that period by 75% to R8.8 million. Employment in Grinel in 1992 was 1457. Limited success in export penetration of military markets account for the poor performance of the group. Grinaker's turnover in 1992 was Rl .235 billion and operating profit was R74.3 million; this gave it a net operating profit margin of 2.17% and return on equity of 16.68% Reduced profitability from the electronics division has been offset by the good performance of its computer division.
Kopp Electronics
A components distribution firm, 23% of its business was in the industrial process control and 10% in the military markets in 1990. This public firm, typical of the larger component distribution companies, had a turnover of R32.4 million and operating profit of Ri .8 million in 1992 and employment of 175. Its profitability ratios show a net profit margin of 2% and a return on equity of 8.96%
22 INDUSTRIAL STRATEGY PROJECT
Reunert
Electronics interests within the broad electrical engineering company Reunert are grouped within Reutech. From 1992, mechanical engineering and telecommunications activities have been removed from Reutech leaving Aserma, Barcom, ESD, Fuchs, Lassco and Reutech Radar Systems as the core companies. In 1988, 80% of the groups business was with the public sector, (at the time it included telecomms and military vehicles) so it has been much affected by the military cutbacks. No details are given of the divisional contribution to Reunert' s 1992 turnover of R2.277 billion and operating profit R209.7 million, giving an operating margin of 9.2% and return on equity of 37.8%.
Spescom Electronics
An investment holding company with manufacturing activities in electricity metering, security and military electronics as well as distribution agencies. Turnover was R45.9 million in 1992. Operating profit in that year was R3.3 million giving a net profit margin of 4% and return on equity of 11.5% Two hundred and sixteen people are employed by Spescom.
Assessment of the financial performance of the electronics sector
Information presented above does not represent the financial status of the electronics industry as a whole, rather it shows how large is the gap between the majors producer finns and small companies is. What does emerge is that larger firms have had the resources to cope with the down turn better than smaller firms and have retained reasonable profit levels. Profit levels in smaller firms have fallen very considerably.
Public electronic companies were highly rated up to the 1987 stock market crash, but since then they have performed worse than industrial companies and are not regarded highly by investors. Very little trade occurs in electronics shares with the exception of the Altron group and Reunert. As it appears 'there is no special status for high technology electronics finns in the investment community' (company interview) the ability of firms to attract capital is limited. Moreover, in the limited areas where manufacturing takes place these efforts are considered small scale and the financial returns they generate low. In the longer term, investment opinion may swing back in support of the sector as it is recognised that technological capabilities exist 'if firms can get products out and get overseas bases, they could do well. Getting overseas agencies would be very important' (company interview).
State intervention in the electronics industry In line with the view governments around the world have adopted towards nurturing their high technology industries, South Africa's electronics industry has been subject to considerable state intervention. An appreciation of its growth and cunent status requires an elucidation of state policy towards the industry. As will become evident, the extensive
ELECTRONICS SECTOR 23
intervention made by the state in the past and the down scaling of that support has been a key factor behind its current problems. First, a note on the key determinants that have shaped growth.
Origins of the local electronics industry
Strategic and military considerations created the genesis of the electronics industry. As Kaplan (1990) has shown, fears in the military establishment over access to equipment promoted the initiation of steps to create a local telecommunications / electronics industry in the early 1950s. The South African Posts and Telecommunications (SAPT) was selected as the vehicle to achieve this through public sector purchasing (Kaplan, 1990:29).
SAPT, although it centered on telecommunications, played a central role in the electronics industry's development. These general effects were: first, the scale of purchases made the public sector the largest market for equipment, 42% of the total market in 1985 (BMI, 1992), secondly, public sector purchasing gave the market depth and stability, thirdly, by opting for digital switching in late 1970s SAPT drove the local industry to develop capabilities in digital systems, fourthly, by specifying equipment requirements firms were
geared to build to specifications provided.
Military electronics became the second leg upon which the local industry was founded. From local production of communications equipment the industry diversified to achieve wider military electronics capabilities under the influence of the United Nations arms embargo of 1976. Again, the characteristics of the telecommunications market applied. Moreover, in the military sector large amounts of state resources were committed to activities justified on strategic grounds and not priced in the market.
Measures to promote the electronics industry
Steps taken to stimulate the domestic electronics industry form one part of the range of general measures applicable to all branches of manufacturing industry. These consist of tariff protection, investment deduction allowances and export incentives. Import substitution motives have guided tariff policies, such that consumer goods have received the highest levels of protection. Recognising that electronics is an input into other branches of industry, tariff levels were kept low on equipment not locally manufactured. However, in an effort to develop a components industry significant protection was afforded to this sector, consequently prejudicing local manufacturers with higher priced components in the process.
Where state intervention has had the most effect has been through direct measures, principally through local procurement policies in two forms. First, the instruments SAPT used to induce telecommunications firms to invest in South Africa were long term agreements with four firms, initially for ten years and later extended to fifteen years. These agreements the bulk of equipment requirements and the current round is due to expire in 1994. In addition 'arms length' agreements were negotiated for the supply
24 INDUSTRIAL STRATEGY PROJECT
of other equipment. In both cases, local content minimum requirements involving the sourcing of components from approved suppliers are conditions of the agreements.
The second thrust of the local procurement policy has consisted of steps to achieve a leveraging of state purchasing activities. A premium of up to 25% has been paid on a pro rata basis for locally manufactured equipment by the public sector in terms of a formula where local content exceed 25% Locally designed equipment qualify for up to an additional 10% on a pro rata basis. The combined value of these measures has a ceiling of 35%
State intervention has not rested on procurement alone. In order to facilitate the manufacture of digital exchanges and with a view to the strategic importance of a capability in semiconductor manufactor, Siemens was persuaded to provide technology and take a 49% share in South African Mirco Electronics Systems (SAMES), the Industrial Development Corporation took 51% with additional financing from the DTI. SAMES was set up to provide components for the telecommunications industry and state subsidies through SAPT were paid to keep prices for its more expensive output in line with world semiconductor prices.
State policy for the electronics industry
Recognition within the state of the strategic importance of electronics occurred relatively early on, but it was not until the early 1980s that steps were taken to develop policy on electronics on economic grounds. A number of investigations followed, IDC (1981), De Waal (1983), Working Group (1983); and BTI (i986a). These will be reviewed briefly as they made extensive recommendations for the promotion of the industry. These recommendations are interesting, not only for what they recommended, but for why they were not properly implemented.
De Waal committee
A BTI investigation into the electronics industry was launched in 1982 but feeling the need for guidance in the interim, the government appointed the De Waal committee which reported in 1983 and made recommendations on the following issues.
First, that measures be taken to stream line public purchasing and optimise the policy. Secondly, that the design and manufacture of inegrated circuits should be stimulated by establishing an Integrated Circuit Design Center (ICDC), financed by SAMES' shareholders. Thirdly, shareholding of SAMES be expanded to incorporate the major electronics players, its technology be upgraded and the state subsidise SArvIES for losses it incurred in its operations. Fourthly, a non-statutory Standing Committee for Electronics be established to implement policy on electronics and coordinate state bodies electronics requirements, as well as compile statistics and monitor training needs (Working Group, 1988).
ELECTROMCS SECTOR 25
A Standing Committee for Electronics was duly formed in 1984. It was charged with responsibility for implementing the local procurement policy and with the standardising of product specifications between government departments. Most significant of all was the governments inducement by virtue of its market power, to the major electronics firms to take a share in SAMES, which even after only four years of operation was technologically outmoded and required a subsidy to operate. Siemens reduced its stake to 25% and the IDC sold off its share to Altech 37%, Reunert 15%, Plessey 12%, TMSA 10% and Griaker 1%. The ICDC as proposed was formed by SAMES and linked with the University of Pretoria.
Board of Trade and Industry report on electronics
Far reaching recommendations were made in the BTI report, which after a comprehensive survey of world trends, took note of the following: the centrality of electronics in economic activity; the need for ongoing R&D to remain competitive and effective marketing to recoup resultant high costs through international markets; the high skills levels required. It was noted that state intervention had occurred in countries which had succeeded in manufacturing electronics and most governments created mechanisism for maintaining links with the manufacturing industry to support and guide it.
Of the industry in South Africa the BTI identified a number of key problems which are worth summarising. South Africa, it found, had a growing trade gap, a small local market, few unique products and lack of export culture; all factors which made local firms internationally uncompetitive. However, it rejected a policy of protection for the domestic market as cost raising and inducing technological stagnation which would harm productivity in the rest of the economy. Research and development was found to be a limiting factor with expenditure amounting to 2.9% of local electronics production in 1984 (BTI, 1986b:12). Furthermore, only 4.5% of the R&D in electronics was performed in the private sector, 91% being undertaken by public sector and state organisations. Research spending in South Africa was altogether out of step with the rest of the world by being skewed in favour of basic research and a shift to applied research was essential.
As a consequence, the report stated, there existed in the industry a lack of confidence in local design and manufacture, and a reliance on licensed designs and imported kits for assembly. The report was highly critical of long term supply agreements for being a disincentive to R&D, retarding local and international competition and excluding small firms, so critical for their entrepreneurial role. SAPT agreements had failed to develop a strong components manufacturing industry the report found, and stated this saddled local manufacturers with higher costs. It went on to argue protection on components should be lifted.
A negative consequence of the high level of public sector purchasing was the fostering of a business orientation which regarded the local market as the only market and the state as the most sought after customer. Other problems were a lack of venture capital and long term export strategy. As far as infrastructure was concerned, the report stressed the importance of developing and continually upgrading semiconductor design facilities.
26 INDUSTRIAL STRATEGY PROJECT
Shortages of human resources were identified as a critical limiting factor. In comparison with Israel, which had grown an electronics industry quite rapidly, where the proportion of engineers, technologists and technicians in the industry was 44.7%, in South Africa it was 10.9%. Only 2.7% of the workforce were engineers, against 23% in Israel and only 8.1% were technicians against 22% in Israel.
The report argued that by increasing production by a factor of 2.3 the industry could eliminate the negative trade balance in electronics. Exports were required to rise to 55% of production which, the BTI felt, were attainable targets.
For reasons of the economic importance of electronics as a lever technology, for the growth potential of the industry, its employment generating effects, and importance for national security, the BTI report argued any further delay in the required inevitable entry into electronics manufacturing would increase the obstacles to be overcome. With the existing infrastructure it was not too late for South Africa to actively enter manufacturing without enormous additional cost, provided it could be done within the present decade (BTI, 1986b: 17). The investigation concluded a comprehensive package of measures were needed with extensive state intervention.
As a result of the relative backlog experienced by the South African electronics manufacturing industry in the world, it is necessary that the local industry must be actively activated, coordinated, directed and stimulated from the side of the government, particularly with a view to enable it to enjoy development as a viable industry that can achieve on the export market (BTL 1986b:22).
A comprehensive set of recommendations were made along with proposals for institutions to implement them. The centerpiece of the strategy were measures intended to promote the technological development of the industry. The boards recommendations are set out below.
A National Development Programme was proposed under which product orientated research and development should be supported with low interest state loans of up to 50% of costs. Coordination of R&D should be contracted to a new body, the Development Corporation for Technology with CSIR, IDC and private sector stake holders. Funding should be maintained at at a real level of Rl 10 million (1992 rands) per annum. Only projects intended to produce products for general trade and the export market should receive support. Projects carried out at the request of the public sector and used mainly by them or qualifying for support from the IDC, CSIR and public sector should be supported. Original and unique products for export or using locally developed Application Specific Integrated Circuits (ASICS) should enjoy the highest priority. Small firms participation was to be encouraged and support for a firm should normally be restricted to one project at a time. R&D efforts should be spread over a wide range of projects. Special encouragement should go to projects applying electronic technology to other branches of industry. Firms should be able to receive support retrospectively for development work already undertaken. Small firms should qualify for assistance to undertake feasibility studies. Assistance to firms to purchase production equipment should considered by the IDC. Repayment of the loans should be at 2% of sales, however, consideration could be given to make the loans non-repayable.
ELECTRONICS SECTOR 27
A string of recommendations were made concerning the development of human resources. These covered the provision of bursaries for tertiary training in electronics, increasing technological literacy at school level, and the recruitment of Blacks into technical vocations.
Recommendations were also made on proposals for development finance institutions, establishing venture capital, technoparks, a state design institute, export promotion measures and the removal of protection on electronics components.
Implementation of these recommendations required the establishment of new institutions: a Branch for Technology in the BTI with a strong contingent of technocratic personnel to oversee the development of high technology industries, plus the formation of three task groups. The BTI recommended the existing Standing Committee for Electronics be converted into a Task Group for the co-ordination of state purchases with responsibility to curb unnecessary increases in state expenditure by examining cheaper imports; use world prices as the basis for offering price preferences, support smaller manufacturers and draw up purchasing orders against specifications not by specifying manufacturers. To make premiums paid by the public sector transparent consideration should be given to payment from the treasury rather than out of departments own budgets.
The Task Group on Manpower was conceived as a body to liaise with all relevant educational bodies. It made recommendations on means to improve the supply of the required engineering skills. The existing national R&D committee for microelectronics liaising between the CSIR and the universities should be converted into a Task Group for the coordination of microelectronics R&D (BTI, 1986b).
Comprehensive, far reaching, indeed radical in its outward orientation and emphasis on product development for exports, as well as being highly critical of the established practices of the electronics industry, the BTI report was virtually ignored by the government. Beyond the establishment of a Directorate of Technology within the DTI, not one of it recommendations received serious support.
The working group for the promotion of the electronic industry
In 1987 a Working Group was appointed to make recommendations for the promotion of the electronics industry, taking into account previous reports on the industry. Its membership included executives from the large private sector firms.
Guiding principles for the report which followed were that 'government should not prescribe to the industry. Support should be of an enabling and stimulatory nature' (Working Group, 1988:22). The proposals made constituted a package of measures, the main one being financial support for product development. Two forms were recommended, project specific measures and general measures. The former proposed non taxable cash grants for the commercialisation of projects aimed at import replacement or export. Support to approved projects would amount to 80% of total costs based on agreed performance milestones and the remainder based on sales incomes. The latter proposed
28 INDUSTRIAL STRATEGY PROJECT
matching grants for expanding technology development. These grants would be open to all firms and finance the cost of establishing and running technology development laboratories. Further recommendations covered the funding of R&D through the National Science Budget, steps to promote education, and recommendations on tariff protection: consideration to be given to removing tariffs on components and suggesting that moderate protection only be afforded to equipment not used in the production process. Estimates of the financial implications were that technology development grants should be funded to the level of R39 million rand per annum.
From these two investigations the government selected but one major recommendation. In 1989 a modified matching grant scheme for product development called the Innovation Support for Electronics scheme (ISE) was announced. A sum of R200 million was to be made available over five years and it was to be administered by the SCE. The functioning of the ISE will be addressed in due course.
Assessing state policy towards the electonics sector
Accounting for why the South African government implemented so few of the recommendations for the promotion of the electronics industry is not straight forward. Government commissions are, by their very nature, a means to defer decision making, yet the extent to which their recommendations are acted upon is a useful indicator of the power of economic and social actors within the state. The state has ostensibly embraced the need to develop a dynamic electronics industry, yet backed away from a coordinated approach in the mid 1980s.
Factors to be taken into account were the problems the SAPT were starting to experience. Up to that time it had been the principal vehicle driving the electronics industry. As Kaplan (1990) has shown, the transition from electromechanical to digital equipment and the rapid pace of change in the latter technology was outstripping local firms' ability to keep in step with an increasingly global industry. In addition, the cost of expanding the network rose as it began to address the backlog in black residential areas, a market with lower revenues. As a result the SAPT was forced to curtail its expansion plans.
Spending on military electronics continued to be a major element of state support for the industry, but priorities began to shift in the mid 1980s. Influenced by the South African Defence Force defeat in Southern Angola and the rising pressures of the liberation struggle internally, security priorities shifted from expenditure on conventional weaponry to the deployment of security forces within the country.
Finally, a set of three interrelated factors provide a plausible explanation. The BTI approach was aim at a large scale development of exports. However growing sanctions pressure would have been a negative factor to add to the difficulty of breaking into export markets. A comprehensive overhaul of the state's institutions dealing with high technology was proposed, but this poses questions about the institutional capacity of the state to embark on a plan of the scale proposed in the BTI report. Although modest, the costs involved would also have been a target for opposition to the proposals.
ELECTRONICS SECTOR 29
In short, while the state continued to use public procurement to support local industry, it abandoned a more interventionist role as well as attempting to deal systematically with the problems that had been repeatedly raised with regard to R&D and education.
Declining state support for the electronics industry
Diminished levels of state support have been a major contributory factor to the crisis the industry is currently experiencing. Due to a shift in state spending priorities in the late 1980s, in favor of social spending and the need to finance a growing budget deficit, the military sector has been substantially reduced. Overall, public sector purchasing as a proportion of the total market has fallen from 42% in 1984 to 26% in 1992 (BMI, 1992). In line with steps to commercialise the operation of public sector bodies, a phasing out of the local content price preference system over two year began in 1992 (Business Day 27/2/92). Public sector equipment sourcing from approved suppliers has been terminated. In addition, tariff protection on components was removed early in 1992 and the Dl'! advised tariffs on other equipment was likely to follow.
Current state policy on the electronic sector
Electronics is one of the sectors in which the state is currently attempting to develop an industry plan. Early in 1992 the composition of the Standing Committee for Electronics was broadened to include representatives from the industry, organised labour and equipment user groups. To its previous public sector membership have been added representatives from the Electronic Industries Federation, NUMSA, MEWUSA, SAEWA, Computer User Council and National Telematics Users Group.
This represents a significant departure from previous policy initiatives, both in terms of the composition of the group as it has incorporated the principal actors in the industry, as well as seeking opinions from all interested parties.
Five working groups have been established to develop proposals for restructuring the industry. A working group for strategy formulation is intended to provide overall recommendations to make the industry viable and competitive over the next four to six
years taking account of international trends; tariff reforms and international obligations under GATT; sustainable growth and job creation and projects being considered by other working groups. Some degree of specialization is contemplated as 'it is not necessarily feasible to conserve all sub-sectors of the electronics industry and it is not the aim to conserve sub-sectors which cannot be restructured to become viable and competitive' (SCE, 1992:1).
A project of national relevance working group aims to identify opportunities which can lead to significant new business for local producers while contributing to social upliftment, economic growth, job creation and exports. A smart card working group aims to optimise the use of local resource in this technology and investigate new areas for its application. A working group for technology based education aims to facilitate the use of
30 INDUSTRIAL STRATEGY PROJECT
appropriate technology for education and training to create opportunities for local hardware and software. Finally, a telecommunications working group aims to facilitate reliable, easy to maintain and cost effective telecommunications services throughout Sub- Saharan Africa (SCE, 1992).
No results have been made public from the SCE deliberations to date.
Institutions present in the industry Professional engineering bodies, scientific and technical bodies, industry associations and trade unions are active in the industry. In addition to state departments dealing with economic affairs such as the Department of Tariffs and Trade.
Professional, scientific and user bodies
The South African Institute of Electrical Engineers (SAIEE) is the most important professional body for the industry, a statutory engineering body representing the interests of eligible professionals. South African engineers also have membership of international electronics engineering associations, the English based lEE. Functions performed by these bodies focus on professional education and the convention of technical working groups. A related professional body is the South African Engineering Association (SAVI). Instrument and control technicians and engineers are eligible for membership of the South African Institute of Measurement and Control (SAIMC) (company interview).
The main scientific bodies involved in the electronics industry are the Council for Scientific and Industrial Research (CSIR) and academic research and teaching departments at universities and technikons. Three divisions of the CSIR undertake research related to electronics, the Division of Microelectronics and Communications Technology, Mikomtek; the Division of Production Technology involved in industrial electronics, automation, machine vision, robotics and laser technology as well as the Division of Aeronautical Systems Technology involved with avionics and radar technology. The CSIR has been required to raise a greater proportion of its budget from contract work for industry. Assistance to industry is mainly through sub-contracting but also includes joint ventures, commercialisation of products and sales of services (company interview).
University and Technikon electrical/electronics departments train engineers and technologists as well as undertake research, frequently on an industry commission basis. Starting in 1989 Technikons have increased their engineering training activities as well as undertaking projects commissioned by industry.
ELECTRONICS SECTOR 31
The evaluation and testing services performed by the SABS ensure equipment conforms to perfonnance and quality standards derived from international bodies or developed locally. In addition the SABS evaluates firms production engineering activities and issues certification for quality production, the SABS 0157 mark, which is a local variant of the International Standards Organisation (ISO) 9000 quality system.
Trade unions
Trade union organisation in the electronics industry is highly uneven. Due to the large number of small firms involved which are not organised overall levels of organisation are low. Trade union membership is strongest in the larger plants undertaking higher volume production in the telecommunications or consumer electronics sector. Overall trade union organisation in the professional sector is low.
The dominant union in the industry is the country's largest which is the 220 000 strong National Union of Metal Workers of South Africa (NUMSA) an affiliate of the Congress of South African Trade Unions (COSATU). Electronics firms are covered by NUMSA's engineering division.
A significant presence is held by the Metal and Electrical Workers Union of South Africa (MEWUSA) with 60 000 members, a National Council of Trade Unions (NACTU) affiliate. A third union of note is the South African Electrical Workers Association, (SAEWA) which confines its organisation to white workers in a range of electrical related industries, and was affiliated to the conservative whites only Council of Mining and Building Unions. There is also the very small Radio, TV, Electronic and Allied Workers Union.
Trade associations
Firms in the industry fall under the Iron Steel and Metallurgical Industrial Council for the purposes of collective bargaining where they are collectively represented by the Steel and Engineering Industries Federation of South Africa (SEIFSA). Within SEIFSA the Electronics and Telecommunications Industries Association handles labour matters on behalf of member firms. The association does not collect data on the industry as 'firms will not provide details as they are unco-operative and believe it will be to their competitive disadvantage' (company interview).
Several industries maintain their own associations, the Association of Distributors of Electronic Components (ADEC) represents the 25 larger firms in the industry. The Electronic Component Manufacturers Association (ECMA) represents 23 component manufacturing firms, a high proportion of the industry (company interview).
In 1990 the Electronics Industry Federation (ElF) was established in response to the crisis the industry was in. Its' aims were to be a body to represent all sections of the industry in dealings with the government and to formulate proposals for promoting the industry.
32 INDUSTRIAL STRATEGY PROJECT
Membership consists of associations, such as those listed above and twenty three of the major electronic companies, which the ElF believes covers three quarters of the industry. Smaller companies have a voice through membership of associations (company interview). To date the ElF has lobbied support for joint industry and government cooperation and made a number of proposals to promote the industry.
ElF proposals for the electronics industry
In proposing a strategy for the electronics industry the ElF proceeded by making a case for the economic importance of electronics and the need to remove obstacles manufacturers faced to adding value locally in order to 'level the playing fields' (ElF, 1991a). The ElF strategy in summary proposes an industry government partnership for building a home base and international market targeting. Parties to the partnership are the state, organised industry, suppliers of technology, principally the CSIR, and organised labour. The strategy proposes a major role for the state: 'No unstructured hand outs by government. Reasonable targeted incentives and select protection will be required' (ElF, 1991b). In a partnership the industry and the state are required to identify projects that have national relevance and identify and target international opportunities for which these projects have outlets; identify 'core competences' that exist in the electronics industry and lead to innovation; encourage firms with identified core competences to cooperate on selected projects and on gaining international opportunities; raise funds from government, private sector and institutions and commit funds to permit firms a global thrust to secure market channels, vertical integration by acquisition and niche domination; as well as to provide government incentives and protection for chosen projects. (ElF, 1991b). Action in pursuit of these objectives by the ElF has been in lobbying for support for the industries proposals that it needs assistance to adjust from its inward strategically justified orientation to a more outward, innovative, and manufacturing orientation.
Chapter Four: Trade
Imports constitute a large share of the South African electronics market, as is attested to by the low level of local production reported in Chapter Three. Since electronic equipment is a highly traded sector this is unremarkable. What is important is that the country runs a large negative trade balance in electronics. The export performance of this sector has been very poor, and has been one of the themes repeatedly raised by government commissions.
Trade is very important to electronics for two main reasons. On the supply side manufacturing volumes require access to large markets, increasingly these are required to be global to recoup the extensive resources required for new product development. On the demand side electronic equipment and systems are critical inputs into the rest of the economy. For the productivity enhancing benefits of their diffusion access to current technology is required without excessive cost raising tariffs. Therefore the trade regime for electronics is of critical importance for policy setting on this sector.
After a brief summation of the broader trends in trade for the electronics sector, the professional sector will be examined in more detail. Thereafter the current trade regime will be examined followed by a discussion on the export performance of the sector.
An overview of the electronics trade
A number of problems exist with the available data. Data for the Southern African customs union is set out under a harmonised code system which does not conform to the Standard International Trade Classification taxonomy, making international comparisons difficult. In addition, the code was reviewed in 1988, making the series discontinuous with earlier trade figures; hence a detailed breakdown of trade is only reviewed from that point onwards. Use is made of time series data from the CEAS. Again the radio, TV, and communications industry, ISIC 3832, will be used as a guide for professional electronics. An examination of the 1991 data showed that 45.3% of the volume of trade in that industry fell into the professional electronics category as defined in this study.
It is necessary to point out also that due to the very pervasiveness of electronics, trade statistics may not adequately capture its true volume. Trade in equipment with a large electronic content such as computer controlled machine tools, aircraft or weapons systems, is not recorded as electronics, which tends to understate its true magnitude.
34 INDUSTRIAL STRATEGY PROJECT
Trade for the South African electronics industry as a whole
Imports of electronics equipment, products and components worth some Ri .96 billion were landed in 1984, which the BTI estimated made up 43% of the total electronics market in that year (BTI, l986b:13). Exports amounted to R48 million in that year, equal to 2.5% of the value of imports and leaving South Africa with an adverse balance of trade in electronics of Rl.9 billion (BTI, 1986b:9). This in itself was cited as a major reason for action to be taken to stimulate local production.
Yet even this large figure needs adjustment, as Kaplan points out, since FOB values were used in calculating imports their true market value would include freight, duties and importers margins and thus be higher. This leads to the conclusion that 'only somewhere between one quarter and one third of local demand for electronics products is satisfied through local production' (Kaplan, 1990:71).
Surveys conducted by the BMI indicate that this poor trade account situation has improved somewhat. Their estimate for FOB imports in 1984 was R1.875 billion, equivalent to 42% of the industries value. Imports of R2.8 billion were landed in 1986, equivalent to a share of the local market of 45% Since that peak, the nominal value of imports has risen to R4. 3 billion in 1991, yet their share in the industry's value has fallen to 35% (DM1, 1992a). In part this can be explained by the depressed local economy's diminished demand for imports plus a rising share of the total market claimed by the local service sector.
Electronic data processing equipment constitutes the largest single category of electronic equipment imports at 43% in 1991 (BMI, 1992a). This is unsurprising, given the low level of domestic production of EDP equipment. Import's share in office and accounting machinery, (ISIC 3825) were calculated to make up over 95% of domestic demand (IDC, 1992a).
Trade trends for radio, TV and communications apparatus
Trends applicable to professional electronics will be read from the radio and TV industry. The annual trade volume graph 4.1 illustrates the high level of imports as well as the low level of exports. Exports for this sector are so low that only in 1971 did they exceed R100 million (1985) rands. The data show considerable fluctuation in import levels, with peaks in 1975, 1981, 1984 and 1988. Since this statistical category includes consumer electronic items which are highly traded, the volume of imports is tied to both the business cycle for professional equipment and also to changes in personal consumption expenditure which influence brown goods buying patterns.
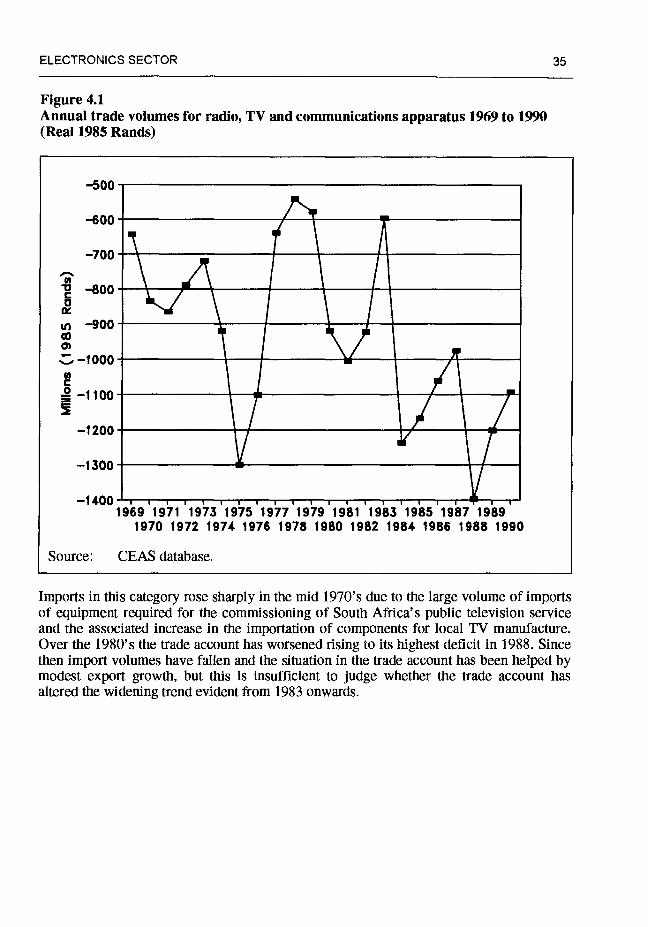
ELECTRONICS SECTOR 35
Figure 4.1 Annual trade volumes for radio, TV and communications apparatus 1969 to 1990 (Real 1985 Rands)
—500
—600
—700
-800 0
u.—9o0 0) :—iooo C g =
—1200
—1300
—14.00 1969 1971 1973 1975 1977 1979 1981 1983 1985 1987 1989
1970 1972 1974 1976 1978 1980 1982 1984 1986 1988 1990
Source: CEAS database.
Imports in this category rose sharply in the mid 1970's due to the large volume of imports of equipment required for the commissioning of South Africa's public television service and the associated increase in the importation of components for local TV manufacture. Over the 1980's the trade account has worsened rising to its highest deficit in 1988. Since then import volumes have fallen and the situation in the trade account has been helped by modest export growth, but this is insufficient to judge whether the trade account has altered the widening trend evident from 1983 onwards.
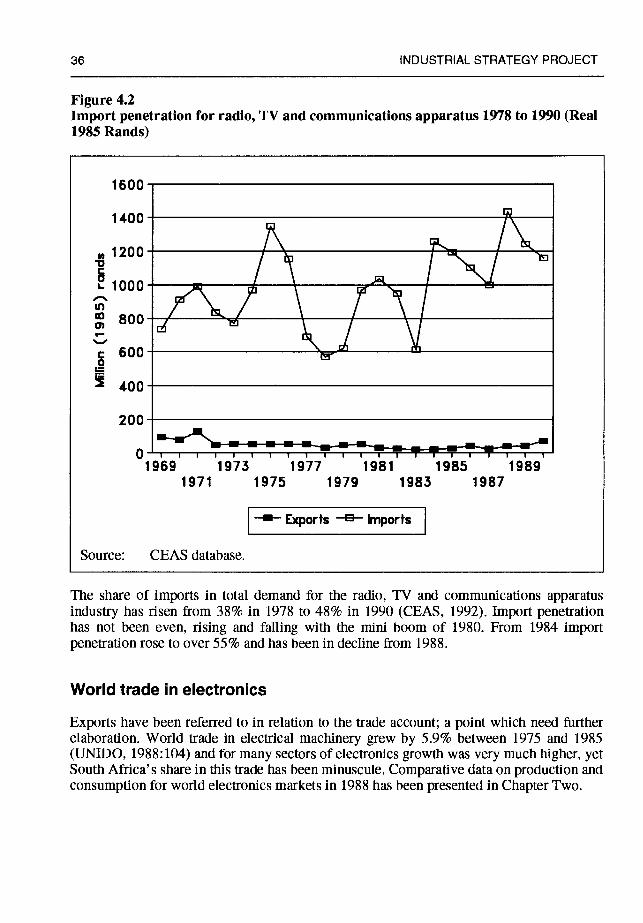
36 INDUSTRIAL STRATEGY PROJECT
Figure 4.2 Import penetration for radio, TV and communications apparatus 1978 to 1990 (Real 1985 Rands)
1600
i:::J N
400
200
1969 1973 1977 1981 1985 1989 1971 1975 1979 1983 1987
—R— Exports —a— Imports
Source: CEAS database.
The share of imports in total demand for the radio, TV and communications apparatus industry has risen from 38% in 1978 to 48% in 1990 (CEAS, 1992). Import penetration has not been even, rising and falling with the mini boom of 1980. From 1984 import penetration rose to over 55% and has been in decline from 1988.
World trade in electronics
Exports have been referred to in relation to the trade account; a point which need further elaboration. World trade in electrical machinery grew by 5.9% between 1975 and 1985 (UNIDO, 1988:104) and for many sectors of electronics growth was very much higher, yet South Africa's share in this trade has been minuscule. Comparative data on production and consumption for world electronics markets in 1988 has been presented in Chapter Two.
ELECTRONICS SECTOR 37
South African export shares in world trade provide an indication of export performance. For a view over time between 1970 and 1985 the country's share of world exports share of office machines halved from 0.060% to 0.031% For telecommunications equipment it fell even more sharply from 0.054% to 0.016%. Real export growth over the period was 73% and 27% respectively (UN, 1973 and UN, 1990). In a similar vein, but for two years only, South Africa's share in key categories of electrical machinery trade for 1984 and 1985 reveals the tiny fraction it's exports contributed, 0.052% and 0.058% respectively (Table 4.1 in Appendix II).
Why did South Africa perform so poorly? In order to explain this poor performance, one must take several factors into account, i.e. the trade regime, sheltered domestic producers, overwhelming domestic orientation of firms, and restrictions on exports contained in licence agreements. In the following section, each of these factors will be discussed after an examination of export performance.
Exports trends for radio, TV and communications apparatus
First it is necessary to point out that industry under discussion, ISIC 3832, contains three quite disparate categories of equipment — consumer electronics subject to import substitution policies, telecommunications equipment destined for the home market and professional electronics largely an input into other industries.
In the period from 1969 to 1990 real export values fell from a high point in 1971, maintained a fairly constant level of some R50 million during the 1970's, fell during the early 1980's and since 1986 have been rising steadily. Table 3.1 in Appendix I shows the real average percentage change in exports to have been negative from 1970 to 1985 but grown by 15.23% since 1986. Exports of electrical machinery as a whole rose by 32.5% between 1986 and 1990, yet the growth for radio, TV and communications subsection could only reach half that level.
When the ratio of exports to production is examined in a time series the impression generated from UN data in table 4.1 is amplified. What this reveals for the radio, TV and communications sector is that exports share of production fell from 0.108 to 0.016 between 1975 and 1983. Since then exports have grown their share of production to 0.053, still a negligible amount. The above discussion on the trade account referred to the low volume of exports. Net exports in proportion to trade is shown in table 3.3 in Appendix I. This shows the radio, TV and communications sector to have the lowest proportion of net exports for the whole of the electrical machinery sector between 1973 and 1990; and improvement since 1986 meant the gap has narrowed slightly from -0.95 in 1987 to -0.88 in 1990 but still a withering indication of international competitiveness reflected in trade.
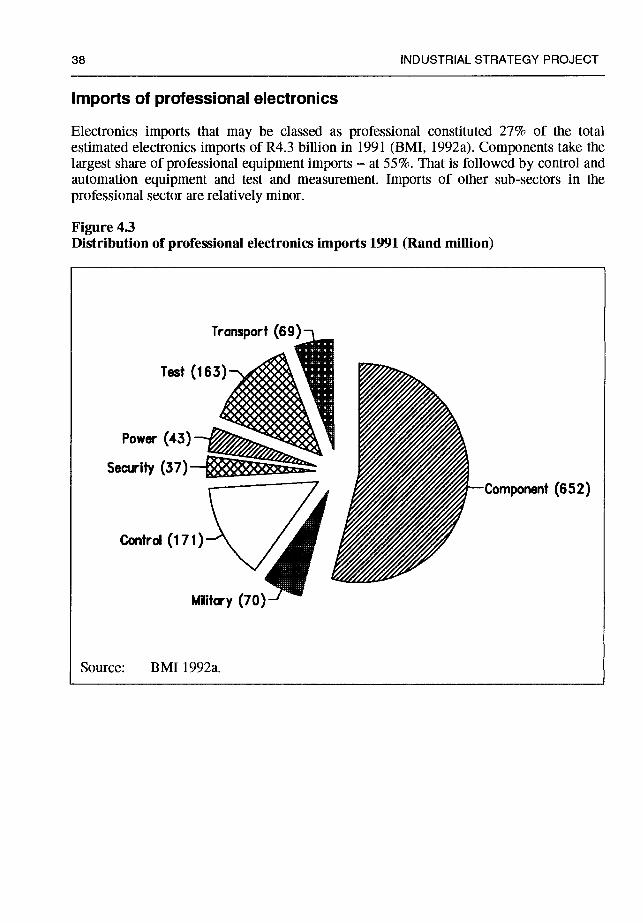
38 INDUSTRIAL STRATEGY PROJECT
Imports of professional electronics
Electronics imports that may be classed as professional constituted 27% of the total estimated electronics imports of R4.3 billion in 1991 (B MI, 1 992a). Components take the largest share of professional equipment imports — at 55%. That is followed by control and automation equipment and test and measurement. Imports of other sub-sectors in the professional sector are relatively minor.
Figure 4.3 Distribution of professional electronics imports 1991 (Rand million)
Source: BMI 1992a.
Transport (69)
Power
Security (37)•
Control
Component (652)
Military (70) —I
ELECTRONICS SECTOR 39
Trade regime for professional electronics As the electronics industry covers both the manufacture of equipment as an input into other industries and final consumer goods, the trade regime has reflected this duality. High levels of protection have been mixed with zero or low duties on certain categories of equipment. Imports are subject to the following: customs duties, add valorem duties, and quantitative restrictions in the form of import controls or formula duties, the latter consisting of an ad valorem tariff backed with a minimum duty. In addition, a surcharge has been levied on imports to choke of demand when balance of payment problems have occurred. Initially introduced at 15%, this was reduced to a minimum level of 5% and has been retained as a source of revenue. A higher surcharge level is applicable for a small number of tariff headings, notably in connection with television assembly. Export incentives, also part of the trade regime will be examined in the following section.
Unlike consumer electronics, the trade regime for professional electronics was less an instrument of state policy than procurement measures for professional equipment, except for component manufacturing. With a local content requirement placed upon equipment suppliers and direct intervention to create an IC facility, government policy was directed at developing a local electronic component industry to meet local telecommuications manufacturing goals and military requirements. As a result, protection was afforded to local manufacturers of a range of electronic components. Integrated circuits were not protected as the small output of the local facility was captive producer for telecommunications equipment. on which a direct subsidy was paid by SAPT to match world prices. This policy raise component costs to all local producers, increasing the cost of locally manufactured equipment.
Rates of protection for professional electronics
Nominal protection for the categories of equipment covered by this study have been calculated to be 10%, half the average nominal rate for the manufacturing industry as a whole, according to the IDC. Using import data for 1991, a trade weighted level of protection can be established. What this shows is that fully 60.4% of the items landed attract no duties and a further 20.2% are landed at 5% duties. The volume of exports in the higher duty brackets is low, only 5.6% for duties of 25% and no duties above 30% As such, the professional electronics sector is not highly protected.
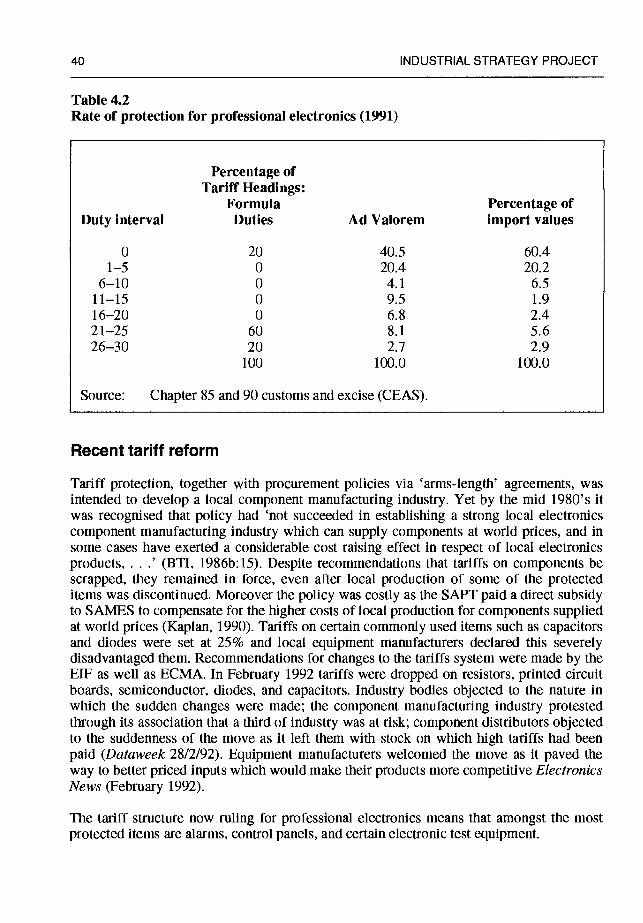
40 INDUSTRIAL STRATEGY PROJECT
Table 4.2 Rate of protection for professional electronics (1991)
Percentage of Tariff Headings:
Formula Percentage of Duty interval Duties Ad Valorem import values
0 20 40.5 60.4 1—5 0 20.4 20.2
6—10 0 4.1 6.5 11—15 0 9.5 1.9 16—20 0 6.8 2.4 21—25 60 8.1 5.6 26—30 20 2.7 2.9
100 100.0 100.0
Source: Chapter 85 and 90 customs and excise (CEAS).
Recent tariff reform
Tariff protection, together with procurement policies via 'arms-length' agreements, was intended to develop a local component manufacturing industry. Yet by the mid 1980's it was recognised that policy had 'not succeeded in establishing a strong local electronics component manufacturing industry which can supply components at world prices, and in some cases have exerted a considerable cost raising effect in respect of local electronics products, . . .' (BTI, 1986b: 15). Despite recommendations that tariffs on components be scrapped, they remained in force, even after local production of some of the protected items was discontinued. Moreover the policy was costly as the SAPT paid a direct subsidy to SAMES to compensate for the higher costs of local production for components supplied at world prices (Kaplan, 1990). Tariffs on certain commonly used items such as capacitors and diodes were set at 25% and local equipment manufacturers declared this severely disadvantaged them. Recommendations for changes to the tariffs system were made by the ElF as well as ECMA. In February 1992 tariffs were dropped on resistors, printed circuit boards, semiconductor, diodes, and capacitors. Industry bodies objected to the nature in which the sudden changes were made; the component manufacturing industry protested through its association that a third of industry was at risk; component distributors objected to the suddenness of the move as it left them with stock on which high tariffs had been paid (Dataweek 28/2/92). Equipment manufacturers welcomed the move as it paved the way to better priced inputs which would make their products more competitive Electronics News (February 1992).
The tariff structure now ruling for professional electronics means that amongst the most protected items are alarms, control panels, and certain electronic test equipment.
ELECTRONICS SECTOR 41
Professional electronics exports
The importance of exporting
Exporting is central to a strategy to revive and then grow the electronics industry. In the first instance, successful exporting is a means of overcoming low capacity utilization that results from the poor state of domestic demand. It has become a widely accepted that the share of higher value added manufacturers in exports needs to rise and South Africa needs to increase its share of trade in the high growth, and high value trade categories of machinery and transport equipment. This is necessary to achieve economic growth and also to generate foreign exchange for balance of payments purposes. Associated with exports are a number of other important economic consequences involving the effects of such markets on the internal structure of firms and this is now widely acknowledged to provide very important learning influences. Participation in export markets extend firms' abilities by providing clear signals from the forefront of competition with respect to
innovation, quality and cost exemplifying the benefits of 'learning by exporting'. Exporting involves a direct interface with international competition and as such provides a key benchmark of the success of policy designed to stimulate the industry. This has been well understood in the case of the Asian NICs.
Merely by their export activity, Korean firms have enjoyed virtually costless access to a tremendous range of information, diffused to them in various ways from the buyers of their exports. The minor innovations that have resulted have been significant in increasing production efficiency, changing product design, upgrading quality and improving management practices. Exporting thus appears to offer a direct means of improving productivity (World Bank, 1984:296).
Increasing the industry's exports have been recognised as being a high priority in government commissioned investigations. More recently the ElF has mooted a strategy which includes the promotion of niche exports. How capable firms will prove to be at succeeding in export markets will, in part, depend upon the infrastructure they use in exporting and the following section will examine the working of the export incentive system.
Export incentives
Export incentives have been in place in different forms for several years, and from 1980 exporters were able to obtain rebates on duties of imported raw materials, subsidies for overseas marketing expenses and even assistance to overcome the effects of domestic tariff protection. Criticism of the earlier schemes ushered in the new incentive system with effect from 1990, the General Export Incentive Scheme (GElS) and complementary Export Marketing Assistance Scheme (EMAS). These are set to run until 1995.
GElS was intended to promote exports of higher value added products and also to take exchange rate fluctuations into account. Assistance is granted on a sliding scale at four levels: first primary products; second, benificiated primary products; third, material intensive products and fourth manufactured products. For 1992 the exchange rate factor
42 INDUSTRIAL STRATEGY PROJECT
was fixed at a level which gave manufactured products a rebate of 18.5% of the FOB value of exports where local content reaches 75% or more. GElS credits are paid in cash to qualifying firms. Along with GElS, the Department of Trade and Tariffs administers the EMA which provides assistance in primary export market research for firms and collective market research by trade associations. Assistance is also available for outward selling and inward buying trade missions, as well as for exhibition attendance. GEISs is funded from the fiscus, and is expensive. It is estimated that, the level of subsidies being given will absorb almost the entire DTI budget for 1992/93 of R3 billion. GElS has been criticised for its cost and also because it grants direct subsidies it runs counter to GAiT principles.
Export assistance is provided for automobile assemblers and component manufacturers under phase VI of the local content programme for the automobile industry. Electronics manufacturers providing manufactured products to the automobile industry are able to qualify for phase VI assistance and a small number of exports qualify for this support. All other electronics exports are eligible for GElS support.
Export assistance for electronics firms
Electronics exports have grown significantly from the late 1980's off a modest base, but still constitute a tiny amount of the industries trade. Increased export activity has been driven by poor domestic demand and the recognition that sustained growth will require exporting, the decline in the efficacy of sanctions and the availability of export incentive schemes. How finns have been using these schemes is relevant for setting trade policy.
Exports share of production is low, seldom more than a marginal share of sales for many firms. Yet many firms anticipate expanding exports in the future as past trade restrictions are being removed, and they are at the start of their exporting activities. Lack of export experience is freely admitted.
No data is available on the direction of electronics exports. However research from firms indicates that, due to the low volumes and piecemeal nature of exports, there are no clearly dominant markets. Finns which are exporting products based on indigenous technology are not constrained by agreements and have sold into developed markets, this applies to some power electronic products, sold into Europe and other OECD countries far more than to African countries. While Africa is regarded as a market suited to South African technology, the lack of economic development restricts African markets for high technology products and as a result these markets constitute a small share of exports.
All finns involved in exporting make use of export incentives, but differ markedly in their reliance upon the schemes. Larger firms tended to regard GElS as a supplement, rather than crucial to their export efforts, 'GETS is a bonus, but exports must be able to fly on their own' (company interview). Impressions gathered from firms were that the current incentive structure was regarded as short term and liable to withdrawal at short notice and therefore could not be relied upon in constructing an export strategy.
ELECTRONICS SECTOR 43
Smaller firms tend to rely upon export incentives to a greater degree to succeed in export activities. 'We use GElS to the hilt. We would not be exporting without GElS. It is simply a case of competing against overseas firms with South African manufacturing costs being 25% higher. As a result we are selling at a 15% gross margin before marketing expenses are added and can only survive on GElS' (company interview).
Despite the reliance upon export incentives, and the recognition that they were of limited duration, firms did not appear to be making investment decisions to attack their sources of uncompetitiveness in the period when incentives were still available. The exception to this is in the Budget Energy Controller (BEC) market, where local production facilities have been established on a scale which necessitates exporting in volume.
Information gathered from firms about the value of support provided by government, parastatal and private agencies for firms export efforts indicates that better access to information is a crucial requirement. Electronics firms which are active in export markets were highly critical of the parastatal body the South African Foreign Trade Organisation (SAFTO) on the grounds that it was expensive to use for small firms and did not possess the technical expertise to assist firms operating in specialized markets. Many firms which had dealt with it in the past were dismissive and regarded it as costly and lacking in expertise.
Government assistance provided by the DTI for exhibiting at trade shows and in providing information was regarded as a more effective aid. In particular the assistance provided by overseas embassies trade representatives in providing information on foreign markets and trade contacts was regarded as the most useful of the available government services.
Private agencies to provide market research information and assist with identifying distribution channels are frequently resorted to, although small firms report it is expensive.
Exports of electronics
Tracking electronics exports is complicated by the wide range of categories equipment under which a large proportion of embedded electronics can be classified. The BMI estimates exports for the whole electronics industry for 1991 were worth R250m, roughly 6% of the FOB value of imports (BMI, 1992a).
Figures compiled from trade data for the professional electronics categories of interest to this study show that exports worth R57.5 million were made in 1991, over six percent of the value of imports in that year. In real terms since 1988, exports have risen by 42.6%, although the rate of growth has slowed since 1989 (Table 3.10 in Appendix I). The table shows data for components and some equipment. What is clearly apparent is that no single sector, or group of sectors, is a leading exporter and small volumes are involved in all cases. Printed circuit boards, the largest component export category for several years, fell
by two thirds in 1991 as South African producers failed to maintain export and domestic market share against far Eastern producers. The signaling equipment sectors have achieved sustained growth and an above average export to import ratio. Included in this
44 INDUSTRIAL STRATEGY PROJECT
sector are transport equipment, railway signalling, and security products, the latter sectors being one which has shown signs of local innovation.
Export limitations due to the use of foreign technology
Trade restraints contained in licence agreements pose a major constraint on exports of South African firms. Electronics firms, large and small, surveyed by Aspin (1991) used foreign technology for approximately half their turnover. Over one third of firms with technology agreements were subject to trade restraints; mostly precluding exports to developed markets where licensors had established operations. As a result, firms with licence restraints directed 72% of their exports to less developed countries, usually areas with more limited opportunities (Aspin, 1991:89). As some of the larger electronics firms are partly or wholly owned by multinationals, they have the advantage of foreign distribution channels yet permission to export which is determined externally by corporate policy restricts them.
Obstacles to exporting
Among the problems firms face in their efforts to become successful exporters is the country's lack of an electronics manufacturing reputation and unreliable deliveries. In the professional market, technical selection criteria are applied in addition to price and other non price factors, so this issue can be overcome. Unreliable deliveries are sufficient to lose export orders. Any disruption to production or in raw material supplies can potentially jeopardize exports. Manufacturers have responded to this problem in different ways, but with a common objective: to reduce exposure to potential disruptions, and generally involving a reduction in direct labour, which is very much in line with trends towards more automated production. One exporter has invested heavily to overcome a perceived vulnerability. 'We automated due to the volatile state of the workforce. With exports you cannot afford labour unrest to affect the factory.' (company interview). Production disruptions will potentially occur until South Africa obtains a democratic constitution.
Professional electronics trade: conclusions
For all that electronics is an international industry, South African firms have focused on the domestic market, consequently there is limited export experience and what exporting has been done in the past has tended to be symbolically important but a marginal share of sales. Shrinking domestic demand and a clear need to refocus attention away from a reliance on the public sector has elevated the importance of exporting for the industry as a whole. Export growth rates since 1988 have been good, yet the value of these exports is still minimal. Thus while the need to expand exports is recognised, export experience is limited, particularly among small firms.
Export market development has received little attention, only two of the largest firms, Altron and Plessey Tellumat, own firms in developed country markets to service export
ELECTRONICS SECTOR 45
markets. Smaller firms must rely on finding agents to act as distribution channels and are thus constrained in their ability to meet the increasing need for a high level of customer service in order to be competitive.
It is not clear how protection has influenced the export performance of different sectors in this study. In the category of more protected items, modest exports have been achieved for printed circuit boards until 1991, and sound and visual signalling equipment has shown steady growth. Less protected items such as uninterruptable power supplies (UPS) have also fared well in export markets, as have BECs, potentially a major export item.
Two policy proposals for trade are suggested by the findings of this study. First, concerning the trade regime it is proposed a phased lifting of existing tariffs should be undertaken. Tariffs on components should be removed without delay to allow the free importation of components for local manufacture of equipment. The recently removed tariffs on certain components needs to be extended to include items still subject to protection. As has been seen tariff levels on most professional equipment examined in this study are low. It is proposed remaining tariffs on equipment should be phased out. The overall motivation for this approach is to remove cost elevating factors and to emphasise the down stream application of electronics. It is accepted that the large negative trade balance will continue. As there are no sectors that currently exhibit any notable strengths in exports, there is no justification for selective treatment.
The second proposal addresses the type of export support that should be provided. In addition to the critical application of the existing export incentive schemes which have a known termination date, greater assistance should be provided to exporters by way of market intelligence information. Assistance should be provided for a range of market research activities and the results be freely available. Small firms in particular should benefit from intervention of this nature designed to lower information costs.
Chapter Five: Technology
Technology development is clearly central to the electronics industry and this is one area in which governments around the world have felt justified in intervening. For South Africa, recent state intervention for technology development in the narrow sense has been through direct support for R&D in firms. Yet current thinking on technology policy suggests that this is oniy one part of the process, and that measures to promote the diffusion of technology are more critical to capture the economic benefits of innovations. This study argues that policy pursued by the South African state in regard to innovation in the electronics industry has been flawed by neglecting measures to promote diffusion.
This chapter makes the case for the importance of diffusion of electronic technology to upgrade the competitiveness of the entire economy. It then examines the status of current innovative activities within local firms, to provide the background to developing a policy for the sector which will address both the generation and application of technology.
Diffusion of electronics technology It is through the diffusion of electronics technology, or any new technology, that most of the economic benefits are derived. Obviously innovation must take place to generate new technology in the first place, but economic benefits are only derived from the widespread application of innovations through the rest of the economy. The productivity gains derived from electronics occur through the diffusion of improvements in products and processes in downstream sectors so the effects are eventually felt throughout the rest of the economy. Productivity gains derived from electronics have been found to exceed those resulting from innovations from other sectors.
The significance of diffusion has important implications for policy dealing with technology development. Arising from the observation that the application of innovations have a greater impact on productivity growth than the production of innovations.
Broadly speaking this suggests that it is the use as much (if not more) as it is the production of innovation that one ought to encourage as part of one's efforts to increase UK competitiveness. In particular, the results are consistent with the view that industrial policies designed to stimulate the generation of new knowledge may prove to be much less effective than policies designed to stimulate the diffusion of existing knowledge (Geroski, 199 1: 1450).
Surveying the relevant diffusion literature Brainard, Leedman and Lumbers (1988), cited in Arnold and Guy (1992), have formulated the three conclusions reproduced here:
First, technology development and diffusion in particular are of considerable potential economic importance.
ELECTRONICS SECTOR 47
Secondly, technology diffusion is not reducible to the introduction of new machines. Additional measures, such as internal reorganisation of production and management processes and upgrading of skills may be required to capture the economic benefits of new technology.
Thirdly, whereas production of technology may not be necessary to reap its benefits, diffusion is essential to maximise potential national economic returns. Yet reaping the benefits of diffusion may require broader social and institutional changes, themselves the most important obstacles to success. (Arnold and Guy, 1992:6).
Obstacles to diffusion
State intervention in research has been justified on grounds of market failure: as the allocation of resources through the market is not capable of inducing individual actors (firms) to engage in activities which produce a public good. Several reasons have been advanced for this: problems of uncertainty and high risks associated with research; problems of inadequate information; problems of competition and market structure; problems in appropriation by individual firms giving rise to externalities; problems of scale and longer term dynamic aspects of innovation which are militated against by requirements for short term economic returns (Barber and White, 1987).
In relation to technology diffusion, Arnold and Guy (1992) argue two features of market failure are particularly pertinent: capability failure and information failure. They argue that the assumption that entrepreneurs have the capability of switching between production techniques and that they have adequate information to make such choices is fallacious.
They identify three capability failures: a shortfall in technical skills needed to adopt a new technique, when adoption would otherwise be rational; organisational inadequacies and weak capabilities in business skills within a firm or the business infrastructure on which it depends. This leads them to conclude 'Particularly among SMEs there are substantial barriers to rational behaviour assumed in mainstream economics and in a great deal of international policy discussion' (Arnold and Guy, 1992:10).
Information failure encompasses 'inadequate availability of information about new technological opportunities for entrepreneurs to know a choice-of-technique decision is possible; (and) presentation of the needed information in a way which is not useful or credible to the potential adopter' (Arnold and Guy, 1992:10).
Having made the case for the need for more attention to be given to aspects of technology diffusion, how well South Africa performs in technology development will be assessed in the following section.
48 INDUSTRIAL STRATEGY PROJECT
South Africa electronics technology development eftorts
Judged by a range of measures such as patenting activity, use of foreign licences or exports, South Africa's technological capacity in the electronics sector has a number of serious weaknesses. This situation has been characterised as '. . . technological colonialism where all efforts are aimed at assembly and not at technology development and technology transfer'(company interview).
The central role the state has played in the development of the electronics industry has been very evident in relation to Research and Development. In 1983 the BTI estimated that R&D expenditure was a mere 1.9% of turnover and as much as 94% of electronics R&D was carried out in the public sector, mainly in Armscor, CSIR, and SAPT. Moreover, the BTI was highly critical of the bias it identified against product development and in favour of basic research; the former receiving 16% and the latter 43%, ratios considerably different to other developing countries with successful electronics industries which led it to conclude 'the ability of the South African industry to convert research results into industrial products is 7.4 times weaker than that of the USA' (BTI, 1986a:44).
Indicators of R&D are usually expenditure or personnel engaged in innovation or development work. While this provides an indication of expenditure on research inputs only and does not indicate what results are obtained, it is the most widely available information on innovation efforts.
Estimates of the total R&D expenditure for South African electronics was Ri 12 million for 1991 (BMI, 1992b). This represents a decline of 30% in real terms since 1989. As a share of total electronics market this amount is a trifling 0.8% but as a share of the turnover of all firms involved in some form of technology development it represents a more respectable 5% The professional sector accounts for 44% of the total spend. The military electronics' share has shrunk from 26% to 18% and component and power sectors have grown.
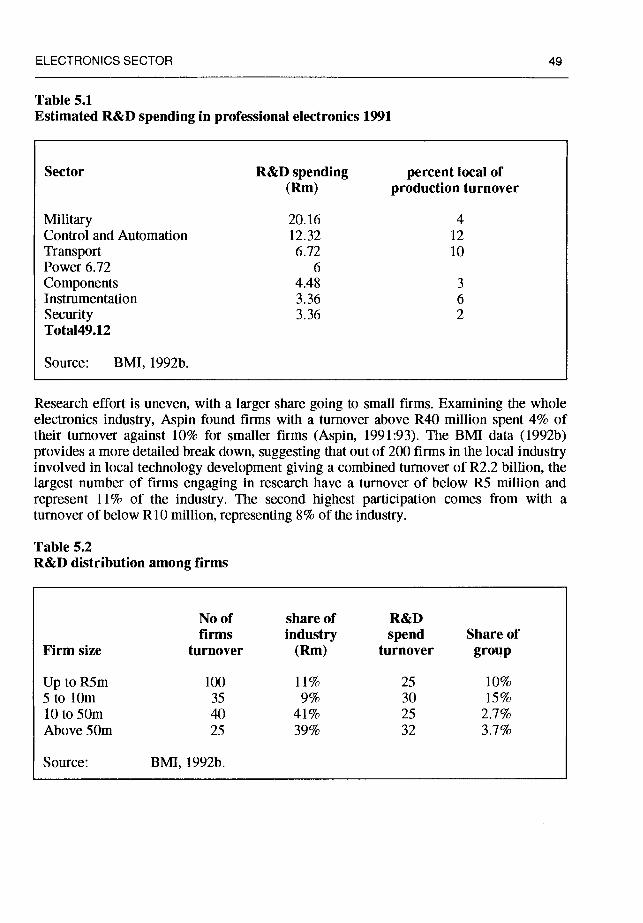
ELECTRONICS SECTOR 49
Table 5.1 Estimated R&D spending in professional electronics 1991
Sector R&D spending percent local of (Rm) production turnover
Military 20.16 4 Control and Automation 12.32 12
Transport 6.72 10 Power 6.72 6
Components 4.48 3 Instrumentation 3.36 6 Security 3.36 2 TotaI49.12
Source: BMI, 1992b.
Research effort is uneven, with a larger share going to small firms. Examining the whole electronics industry, Aspin found firms with a turnover above R40 million spent 4% of their turnover against 10% for smaller firms (Aspin, 1991:93). The BMI data (1992b) provides a more detailed break down, suggesting that out of 200 firms in the local industry involved in local technology development giving a combined turnover of R2.2 billion, the largest number of firms engaging in research have a turnover of below R5 million and represent 11% of the industry. The second highest participation comes from with a turnover of below RiO million, representing 8% of the industry.
Table 5.2 R&D distribution among firms
No of share of R&D firms industry spend Share of
Firm size turnover (Rm) turnover group
Up to R5m 100 11% 25 10% 5tolOm 35 9% 30 15% lOto5Om 40 41% 25 2.7% Above 50m 25 39% 32 3.7%
Source: BMI, 1992b.
50 INDUSTRIAL STRATEGY PROJECT
Some care is needed to interpret the above figures which show that small firms take a
disproportionate share of local development work. Small firms seldom have dedicated research departments, personnel tend to undertake development work in combination with production and marketing, thus identifying true R&D expenditure is obscured and tends to be collapsed into general overheads. The results of these efforts are likely to reflect incremental progress; as firms would be unable to undertake rapid development projects since staff have other commitments, but underline the vigour of small firms as innovators.
The low R&D efforts ascribed to the largest firms is a consequence of their dependence upon licensed technology supplied by TNC parents.
International comparisons of technological efforts
South African firms R&D effort are very low, and appear to have declined since last measured in 1983, a tendency which runs counter to the global trend of increasing R&D spending required by firms to position themselves advantageously to an ever widening and fast moving technological horizon.
Canada, for example, a country with an electronics market of $15 billion in 1988 and a negative trade balance of $8.5 billion, showed a growth in R&D expenditure during the 1980's to reach 7.9% of sales by 1988, with Canadian owned companies contributing a proportionally larger share of R&D effort (SCC, 1992:10).
Recently several South African firms have devoted considerable efforts to innovations in the field of energy metering but even here are somewhat constrained 'We have committed in excess of 7% of turnover on BECs but in the US firms would spend 15% on a hot fast breaking technology' (company interview). By comparison Schlumberger, a world leader in energy management spends 6.9% of its measurement and systems turnover on research and engineering (Schlumberger).
Orientation of technological effort in electronics firms
South African firms would characterise their R&D activities as technology development and application of mature technology to provide engineering solutions to perceived problems. Quite obviously local firms do not have the resources to engage in fundamental breakthrough research and must instead seek to innovate around the application of mature technology.
We are not at the cutting edge with the majority of our products. We use in the main, new proven technology two years away from the cutting edge. But we lean to the cutting edge in production technology. For products we use the latest components and techniques, aiming to be one year behind as we need stability in design (company interview).
Firms differ considerably in their capabilities to resource innovation activities and industrialise the results. Most efforts are directed at product development. While such an orientation keeps firms strongly focused on meeting market needs, it can lead to the
ELECTRONICS SECTOR 51
neglect of production process development and weaken firms ability to industrialise new products. However, this is not uniformly the case and attention to process development is given in some of the larger high technology firms
It is clear from table 5.1 that military elecironics still claims the largest share of R&D effort. South Africa rapidly built a military electronics capability from the mid 1970's onward in the face of mounting opposition to apartheid. The basis for this competency was 'firstly, the strategic need. People rose to the challenge and worked with zeal and enthusiasm. Secondly, there was substantial support, so the industry mastered state of the art technology, but at a high price' (company interview). Even in this sector, absorbing the largest amount of R&D effort, the emphasis was upon adaptive research and application of existing technology; indeed the success achieved in military electronics were through rapid innovation and delivery of systems based on established technology (company interview).
Although the early history of the US elecironics industry provides strong evidence of military technology diffusing into the commercial sector, it is not clear that this has been successfully achieved for the South African military electronics sector. In the restructuring of the defence industry, Armscor waived technology licences it held in order to facilitate the commercialisation of technology it had financed. However, there is, as yet little evidence of the successful diffusion of military technology into competitive commercial electronic products. The military sector will be examined in more detail in Chapter Seven.
Strategic fuel production goals of the state created a synfuel industry and this, with the petrochemical industry in general absorbed the largest share of fixed investment in manufacturing from the late 1970's to mid 1980's, consequently creating a large demand for equipment and systems from the control and automation sector. Mining and mineral processing along with food processing are sectors absorbing a large share of the development work being undertaken in the control and automation sector.
In ranking R&D spending, transportation and power electronics are active sectors. In the former, attention has been directed to developing vehicle security products: alarms, immobilisers, detection and tracking systems. Power electronics has absorbed considerable local R&D efforts to cope with the requirements of operating electrically driven plant at high altitudes and with a power supply prone to lightning disturbances.
A note on innovation theory
It is worth digressing to consider the implications of trends evident in the innovation process for South African firms. Innovation theory has attempted to make sense of the complex process at play in the practice of innovation and the taxonomy developed by Rothwell (1991, cited in Arnold and Guy, 1992) conveys this process well. In Rothwell' s five model schema, the last two generations possess the following elements:
52 INDUSTRIAL STRATEGY PROJECT
Integrated model: parallel development with integrated development teams. Strong upstream supplier linkages. Close coupling with leading edge customers, Emphasis on integration between R&D and manufacturing (design for makeability). Horizontal collaboration (joint ventures etc.)
Systems integration and networking model (SIN): fully integrated parallel development. Use of expert systems and simulation modelling in R&D. Strong linkages with leading edge customers ('customer focus' at the forefront of strategy). Strategic integration with primary suppliers including co-development of new products and linked CAD systems. Horizontal linkages: joint ventures; collaborative research groupings; collaborative marketing arrangements, etc. Emphasis on corporate flexibility and speed of development (time- based strategy). Increased focus on quality and other non-price factors (Arnold and Guy, 1992:fig 2).
This has been quoted at length, not because it describes the innovative process at work in South African firms, but as it emphasises the reverse by pointing to gaps and deficiencies in local practices. As a developing country, South Africa must remain a technological follower. However, the methodology applicable to the innovation process pursued by finns in developing countries also contains insights for industrial late corners, if they maximise their potential to 'catch up'. The challenge for the industry is not to lament the low local R&D effort in comparison to developed countries, inadequate though it is. Instead, what is required is to focus attention on becoming better learners and more adroit at applying technology.
Competitive barriers examined by Ernst and O'Conner (1992) show a tendency to centre on R&D and the development of cooperative networks between firms. Developing countries face the prospect of being increasingly locked out of international technology flows as a result. Clearly this argument focuses on leading edge technology. However, collaborative aspects of networking such as linkages to leading edge customers and design for makeability are highly relevant to developing countries. There is little evidence to suggest that South African firms have moved to become involved in international cooperative networks, or to create their own, although the impression from interviews suggests that such alliances are regarded as desirable. It is debatable whether South African finns will be able to enter international cooperative networks if they have little to offer. In Chapter Two it was suggested that such links if at all possible, could be with firms in other developing countries.
Measures of output from local innovation efforts
Full product innovations from the industry, as opposed to adaptations, are few and research output has produced a limited number of patents, estimated to be less than fifty domestic and international electronic patents (BMI, 1992b).
One consequence of the inward focus of the domestic industry has been the lack of attention to patenting due to the costs involved and the view that patented designs could be easily circumvented. This tendency to neglect giving attention to intellectual property rights and the importance of managing them in foreign markets works against firms now attempting to embark on export drives.
ELECTRONICS SECTOR 53
The picture that emerges of local R&D efforts shows it to be highly dispersed, directed to individual problem solving and the development of appropriate system solutions for clients. Thus, it may be characterised as 'bespoke' technology development. The advantages are adaptation and the creation of solutions to meet specific needs, but the disadvantages are the limited tradability of such innovation abilities. The 13M1 report suggested little reverse engineering is undertaken by local firms, possibly as the electronics industry is not orientated to volume manufacturing but indicative of a lack of concern with technological competition.
Workers contribution to technology development
Human resources development are increasingly becoming recognised as critical for firms to be successful innovators. 'We have been impressed by the importance of human knowledge as the driving force of international economic competition' concluded Mody and Wheeler (1990:6). In the growing complexity and knowledge intensity of production attention has increasingly moved to examine the orgamsational structures that can facilitate sustained learning by the whole workforce. On the whole South African firms fall short of becoming learning organisations and having the organisational flexibility to capture the quality and production enhancing contributions from the workforce due to the low level of education of the workforce and adversarial relations between management and the shopfloor. As a result, the country precludes capturing benefits from much of the productivity enhancing developments that have been so significant in Japan and other dynamic Asian economies.
Some firms have put workplace innovation schemes in place. 'We have green areas, communications and training systems and have seen a growth of ideas from employees' (company interview). In contrast to such developments, prevailing structures of decision making and production roles may block firms from capturing and harnessing learning experiences from workers: 'there are shopfloor suggestions but management is too busy to allow it to evolve' (company interview).
The above quotes refer to organisational changes that may have the potential to improve productivity within electronics firms, and point to the need for shopfloor restructuring efforts to be initiated by trade unions. Organisational obstacles to the diffusion of technology have been cited above as being critical, and these apply as much to firms within the electronics sector as to the economy more broadly.
Links to the science and technology system
A number of firms have made use of universities electronics departments for contract development work and assistance. The military sector has made extensive use of the public science and technology system and been the major client for work done at universities and the CSIR (company interview).
54 INDUSTRIAL STRATEGY PROJECT
For other commercial projects universities have been found to be amenable, if they have staff available and the project is funded, but these are not necessarily ongoing research activities within the institution, so such requests from the private sector lack continuity and are slow to be completed. In the opinion of firms, universities tend to be two to three steps ahead of commercial products and are poor at commercialising their results, lacking a permanent interface to the market place. Electronics firms now recognise that in order to raise income, universities are more energetically marketing their consultancy services to the benefit fo the industry (company interview).
Not all electronics finns have had good experiences in liaising with universities, and some are of the opinion that an academic approach produces an 'over engineered' solution out of step with commercial requirements (company interview).
The extent to which firms make use of the CSIR's technology is limited. According to a survey conducted by Aspin, the public sector contributed a mere 1.3% of locally sourced technology in use (Aspin, 1991:91).
Firms consulting the CSIR do so on matters which have a scientific edge beyond their own capabilities, for which they pay contract fees. For small firms, the CSIR and universities are often regarded as unhelpful and too expensive to engage. A number of small firms interviewed felt that the science and technology system was geared to meet the needs of large firms only, and that the existing institutional arrangement effectively excluded them from deriving assistance from public sector research bodies.
Type testing and certification required for certain markets, particularly the European Community, is a critical precondition for exporting and a costly and time consuming affair. For small firms, the resources required for testing and certification by the SABS for the local market plus submitting products for testing by European authorities such as the VDE in Germany or the British Board of Trade are considerable if prohibitive. Firms are effectively required to duplicate costs if they wish to export.
State assisted technology development
The Innovation Support for Electronics (ISE) programme, funded by the Dli and administered by the IDC, was launched in 1989 to provide firms' a matching grant for R&D expenditure qualifying for support on the grounds of generating local innovation with market potential, particularly in exports. It now represents the most direct form of support for innovation in the electronics industry.
As a means to overcome market failure among firms under-investing in research due to the technical risks, costs, cashflow obstacles and pressure for short term performance, support for innovation is a widely practiced form of state intervention. Non repayable grants are the most common form of support and by international standards, the share of state financed R&D in the private sector in South Africa is low. In the USA the figure is 32.7% in the UK 19.4% and in Australia 5.6% (OECD, 1990).
ELECTRONICS SECTOR 55
A number of objections have been raised about the administration of the scheme: principally that public funds were being used but details of allocations were kept secret; that the share of funding was disproportionately going to large firms and that the secrecy made the scheme open to abuse. Concerns were also raised about the indefinite delay of publication of details of allocations under the rule whereby information was released only after a project was completed, as this created the potential to suppress details of failed projects (company interview). Additional criticisms about the ISE administration cited delays in approving projects and the administrative overhead of the required progress reporting (company interview). If there is merit in the last point, it is only to suggest more streamlined methods are required.
The DTI defended the confidentiality of the ISE on the grounds that it protected recipient firms commercial advantage and delays occurred only at the commencement of the programme when a large volume of applications were received. After launching the ISE the DTI introduced a more comprehensive evaluation procedure to determine employment, increased sales, export opportunities achieved, increased R&D expenditure and tax generated as a result of the programme. (DTIa, 1992). In defence of support for large companies it has been pointed out that they have established research infrastructure, production and marketing facilities and accordingly were most competent to develop successful products (Hamlin, 1993). While it is true large companies have better established facilities, they have shown themselves to be the least prepared to devote resources to indigenous R&D efforts.
After two years of operation it is now possible to assess the scheme with the release of the fourth bi-annual report. Interestingly, the secrecy aspect has been dropped, largely as a result of public pressure. Since the inception of the scheme 247 applications were received and 123 49.8% funded to the value of R64.74 million, the 80% of which are still in progress. Thus, two years into the four year programme, half the available funds have been allocated. Three approved projects on which R0.38 million had been spent were cancelled and 11 approved projects did not take up allocated funds. Administrative staff numbered three full time and ten part time spread between the DTI and IDC.
An indication of the orientation of R&D efforts in local firms is indicated by the number of projects in progress. Telecommunications and control and automation projects predominate.
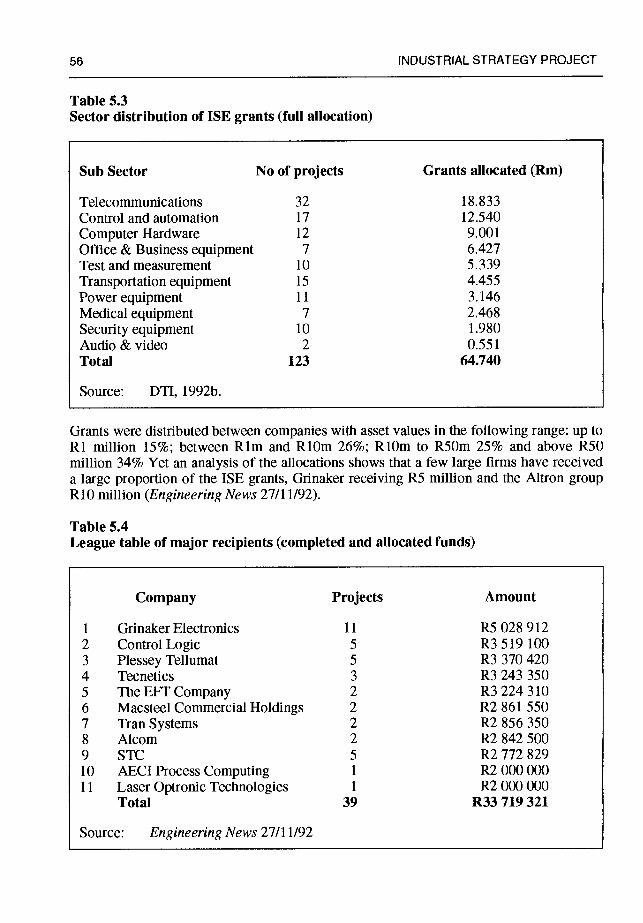
56 INDUSTRIAL STRATEGY PROJECT
Table 5.3 Sector distribution of ISE grants (full allocation)
Sub Sector No of projects Grants allocated (Rm)
Telecommunications 32 18.833 Control and automation 17 12.540 Computer Hardware 12 9.00 1
Office & Business equipment 7 6.427 Test and measurement 10 5.339 Transportation equipment 15 4.455 Power equipment 11 3.146 Medical equipment 7 2.468 Security equipment 10 1.980 Audio & video 2 0.55 1
Total 123 64.740
Source: DTI, 1992b.
Grants were distributed between companies with asset values in the following range: up to Ri million 15%; between Rim and RiOm 26%; RiOm to R50m 25% and above R50 million 34% Yet an analysis of the allocations shows that a few large firms have received a large proportion of the ISE grants, Grinaker receiving R5 million and the Altron group RiO million (Engineering News 27/11/92).
Table 5.4 League table of major recipients (completed and allocated funds)
Company Projects Amount
1 Grinaker Electronics 11 R5 028 912 2 Control Logic 5 R3 519 100 3 Plessey Tellumat 5 R3 370 420 4 Tecnetics 3 R3 243 350 5 The EFF Company 2 R3 224 310 6 Macsteel Commercial Holdings 2 R2 861 550 7 Tran Systems 2 R2 856 350 8 Alcom 2 R2842500 9 STC 5 R2 772 829 10 AECI Process Computing 1 R2 000000 11 Laser Optronic Technologies 1 R2 000 000
Total 39 R33 719 321
Source: Engineering News 27/11/92
ELECTRONICS SECTOR
Overall the programme has been judged a success. At the time of reporting, 27 projects had been completed which had received R5.8 million and from which new business to the value of R32.4 million had been generated. The government share of development costs was estimated to be 38% (DTI, 1992b). On the basis of the performance of the ISE to date, the DTI has recommended extending the support programme to other industrial sectors (DTI, 1992c).
Assessment of R&D activities in South Africa
In conclusion it can be seen that South African firms devote relatively low amounts of resources to technology development activities. Particularly striking is that the distribution of effort is unevenly loaded on small firm which devote a far higher proportion of their turnover to R&D than do the larger firms. Yet the share of state funding going to smaller firms is relatively low and many of the projects that received support came from a limited number of large firms.
South Africa's electronics industry has benefited from the direct support it has received for R&D. Evidence suggests that this modest programme has been successful in promoting innovation and the IDC has argued for it to be extended to other industrial sectors. Were this to happen it would end the targeted assistance electronics has enjoyed and dissipate research efforts in the sector. Removing targeted support would also disregard the uniquely enabling character of electronics technology. This report supports widening the scope of matching grant funds for R&D, as it argued in part I to cater for research in the electrical engineering field particularly for electrification. The main motivation to widen the scope of R&D support is in terms of the main policy advocated in this report, that of promoting the diffusion of electronics technology.
Chapter Six: Environment and Health issues
Environmental issues, health and safety Electronics is a high technology industry traditionally considered to be clean, non-
polluting and to be involved in non harmful production processes. However, this view has
changed as environmental and health research has identified problems associated with substances used in electronics manufacturing; exposure to materials which are harmful or hazardous to workers in electronics firms and hazards associated with the use of electronic
equipment. Three categories of problems may be identified: health and safety in production, external environmental protection and equipment safety. These topics will be examined briefly, with an emphasis on the progress South African electronics firms are
making to achieve compliance with the Montreal Protocol on reducing the use of ozone
depleting substances.
Environmental awareness in South African electronics firms tends to be low, as the domestic business environment has not attached much significance to environmental mailers and emission standards are generally lax. Internationally, the situation is quite different. In developed countries environmental acceptability features prominently, and impinge directly on trade. Notifications in terms of the GATT Tokyo Round Agreement on Technical Barriers to Trade number sixteen dealing with the protection of the environment cover ozone depleting substances (GATT, 1992:32) used for, amongst other things, cleaning electronics equipment.
Unsurprisingly, in South Africa environmental awareness is better developed amongst firms that are active in export markets. Firms that are actively involved in exporting confront standards in Europe and North America which have required giving greater attention to environmental acceptability and these firms have been the first to revise their production processes. Smaller firms, which are not under pressure from customers to change have no incentive to move away from existing production processes and, in the short term, will continue to have access to ozone depleting chemical stocks. To see how firms are responding to this problem requires an appreciation of the place these chemicals have in production.
CFC use in electronics
Chloroflurocarbon (CFC) form part of the family of chemicals which had a wide application as refrigerants, aerosols and solvents. These chemicals were favoured as being inexpensive, non flammable, non carcinogenic, with low boiling points and toxicity and possessing efficient cleaning properties. In electronics CFC—l 13 became the solvent of
ELECTRONICS SECTOR 59
choice for the above reasons and was widely used along with methyl chloroform (MC). (A CFC solvent used for similar cleaning activities, but with lower ozone damaging properties which has been used as an interim CFC—1 13 substitute over a longer phase out period). Drawing on O'Conner (1991) the uses of CFC—113 will be outlined.
CFC—1 13 has been extensively used to remove solder flux residue from printed circuit boards. Flux is used to facilitate soldering, but must be removed or the residue can, over time, cause corrosion of printed circuit board tracks and electrical short circuits, rendering the equipment unreliable. Because of its superior cleaning properties CFC—113, has been effective at cleaning high rosin fluxes. Degreasing components is the other major use of CFC—1 13, such as precision mechanical components and IC leads. Due to the insignificant volume of components manufactured in South Africa, the major uses of CFC—1 13 have been in cleaning and degreasing printed circuit boards, parts and equipment in assembly. Although reliable data on the volume of CFC—1 13 use in the South African electronics industry does not exist, it is nonetheless still a significant issue, for professional equipment manufacturers required high levels of cleanliness of their products to ensure reliability. Indeed, US Department of Defence standards, 'mil specs' laid down quality assurance standards requiring CFC—1 13 cleaning until a recent revision MTh STh 2000 rev. A. was issued discouraging its use and sanctioning alternative solvents (O'Conner, 1991:26).
In electronic production facilities CFC—1 13 is generally used in vapour degreasing equipment, either in a tank degreaser or an in-line degreaser. In the former case, parts to be cleaned are immersed in a CFC—1 13 bath contained under a vapour blanket and passed through a boiling bath, usually enhanced with ultrasonic generators to scrub the parts and then into a cooling bath to drain the solvent. In-line degreasers convey parts through the required stages on a conveyor belt. In both cases CFC—1 13 is lost to the atmosphere when parts are removed or through leaks in what are supposed to be closed systems due to the vapour blanket collapsing when work loads are uneven or when solvent is spilt in handling.
The Montreal protocol
South Africa is a signatory to the Montreal Protocol on Substances that Deplete the Ozone Layer, and as such committed by its strict time table to phase out the production and consumption of ozone damaging substances. By 2000 the country is expected to have phased out all CFCs, halons and carbon tetrachloride. As far as the electronics industry is concerned this requires the phasing out of CFC—1 13 and Methyl chloroform.
Since South Africa has no legal restriction on the use of CFCs compliance with the Montreal Protocol by firms is voluntary and requires their cooperation. However, by 1
January 1996 as stipulated in the protocol, no local manufacture or importation of CFCs will be permitted, this will be monitored by the Department of Health (company interview).
60 INDUSTRIAL STRATEGY PROJECT
CFC use in South Africa has been concentrated in the refrigeration, insulation, foam and aerosol industries, and the electronics share of the total consumption has been estimated to be 1% to 2% of the total. Total consumption in 1986 was 12 500 tons, setting the maximum amount available for commercial and industrial use to a limit of 3 125 tons by 1
January 1994. Local substitution programmes are fairly advanced, aerosol manufacturers have switched to substitutes, foam manufactures have reduced consumption by three quarters, ahead of schedule.
CFC—1 13 was never manufactured in South Africa and all domestic needs were satisfied from imports, mainly from France. Production is scheduled to cease in 1993 and South African importers have been informed they will not be able to obtain CFC—1 13 thereafter, thus the search for alternatives has been underway for some time.
Alternatives to CFC use in electronics
Technical alternatives to the use of CFC—1 13 involve alternative methods of cleaning, but for existing large users, the phasing out of CFC—1 13 requires strategies to reduce current use and find substitutes. Three complementary courses of action are open to firms: conservation in the short term, alternative cleaning technology and alternative soldering technology. This has called for R&D and innovation to develop alternatives (UNEP, 1989). Progress in these areas has been considerable, and although not all problems have been solved evidence suggests elimination will be reached well before the phase out deadline for CFC—l 13 by 2000.
Reducing consumption by improving the efficiency of degreasing machinery and better controls over handling solvents is the first course of action open to firms. Conservation measures such as replacing covers on batch degreasers; overhauling degreasing lines to eliminate leaks; redesigning work loads to optimize degreaser use and prevent solvent escaping require little outlay and mostly require retraining of operators. In a study of Asian firms, reductions in solvent use as a result of these and other simple measures was found to be at least 25%. Conservation measures were also being adopted in firms unaffected by multinational corporation links (which have corporate policy on CFC use) in anticipation of future CFC—113 shortages and price rises (O'Conner, 1991:25). Conservation programmes and phase out schedules adopted by multinational corporations have been the largest influence promoting conservation in all their subsidiary plants in developing countries, but this has not been a significant influence on South African firms since they are not linked into global production activities.
CFC—1 13 may be directly substituted by alternative solvents that only require minor modifications to degreasing processes. These solvents include the alcohol group such as isopropanol acetone; oxygenated hydrocarbons such as Prozone; Freon mixtures with lower ozone depleting properties; and other trichior solvents. The latter pair are classified as transitional substances under the Montreal Protocol with a longer permitted use period, hence they are at best an interim solution.
ELECTRONICS SECTOR 61
Alternative cleaning technology involves aqueous or semi-aqueous pressure jet cleaning systems, available in batch or in line variations. An aqueous cleaning system consists of equipment using de-ionised water, usually in combination with a saponifier or surfactant depending upon the flux types used. An aqueous system requires a considerable investment, including de-ionising equipment, storage and waste water treatment facilities as well as the use of more expensive water soluble flux.
Semi-aqueous cleaning systems use de-ionised water in combination with solvents like alcohol or terpenes. This equipment can be used with resin fluxes which are dissolved in the solvent and removed in a water wash. Semi-aqueous systems are more expensive than aqueous equipment and cairy the risk of autoignition, due to the inflammability of the solvents used.
'No-clean' flux technology uses low rosin fluxes in which the post solder residue does not compromise the performance of the equipment. In a sense, this represents the ideal solution, both by eliminating CFC—113 use and cutting out a process step, however, current technology does not eliminate all residUe. It can be expected that further developments will take place in the field of solder technology.
CFC use and alternatives in South Africa In the CFC phase out period electronics firms have access to CFC—1 13 as well as a complete range of alternative, cleaning technology supplied by the electronic capital goods sector. It is now necessary look at the diffusion of this technology, the costs involved and the factors influencing firms decisions on their choice of cleaning technology.
Adoption of CFC—1 13 reducing techniques has been more rapid in larger firms where the key determinant appears to be export acceptability. One example of an early adopter is a firm where aqueous equipment has been installed. The firm produces to 'mil spec' and is involved in exporting. Securing an export order will be the deciding factor for another firm's decision to install a second aqueous in-line cleaning system, (company interview). Within larger firms a greater level of environmental awareness appears to exist, which is not always tied to export activity. At least one firm installed aqueous cleaning equipment for servicing the domestic market, exports being a longer term goal (company interview).
Small firms are the most resistant to abandon existing CFC—l 13 cleaning technology, as they see no imminent threat to supplies. Moreover, they have invested in ultrasonic cleaning lines which would have to be discarded. In addition, their production processes are geared to small batch cleaning or using compact in-line degreasing equipment.
Alternative cleaning technologies have significant cost and process implications. A small aqueous cleaner and associated water treatment equipment would cost local firms between R45 000 and R100 000. Since cleaning takes up to 5 minutes per board such a system would be too slow for volume producers, necessitating the installation of in-line cleaning equipment which costs in the region of R0.5 million.
62 INDUSTRIAL STRATEGY PROJECT
A number of alternative solvents for use with rosin fluxes exist on the South African market such as Bioact EC7 made by Petroferm, a terpene based solvent. This represents a viable alternative in small volume production but necessitates a reorganisation of the cleaning process with manual scrubbing, rinsing and drying. The drying operation requires the addition of an extra step, including the possible use of hot air dryers and would raise costs, but in chemical costs, suppliers believe the substitute is comparable or cheaper than CFC—1 13 cleaning (company interview).
The use of 'no-clean' flux is a well established alternative, particularly for through hole boards. It is, however, between 1.8 and 3 times more expensive than ordinary rosin fluxes. 'No-clean' flux operates within more critical parameters of pre-heating, tighter temperature controls and has to be discarded after 40 production hours. It is only reliable on new boards and components. Ordinary flux, in contrast, is more aggressive and will work over a broader range of conditions, a factor which is particularly relevant to small firms which may source components from numerous suppliers and may not be able to guarantee they are less than three months old.
Successful cases of the application of new cleaning technology do exist in South Africa, a telecommunications manufacturer being one. On a standard high volume line for telephone instruments the firm has gone over to 'no-clean' flux and eliminated the cleaning stage altogether. After some learning this process has been found to work well and to be achieving a considerable cost saving.
In the absence of requirement changes coming from local customers for CFC—1 13 free cleaning to be used on their equipment, there exists no incentive for firms not induced by export requirements to change. Infonnation on alternative technologies is limited to advice from consumable suppliers and reports on cleaning system guide-lines drawn up by foreign firms, such as Northern Telcomm (Rubin, 1992).
Experience of CFC—1 13 reduction in the dynamic Asian economies
In reviewing the experience of electronics firms in the dynamic Asian economies in response to the Montreal Protocol, O'Conner (1991) concludes that the most progress has been made in countries which put into place quantitative restrictions on CFCs. Unlike the case for South Africa where the incentive for alternatives is export acceptance, rising costs of CFC have been the biggest incentive to find long term alternatives in Asian countries. These aspects intersect with the US CFC tax raising the cost of CFC use for any exporter to that market. The incentives to find substitutes have promoted firms to explore alternative solvents and adopted mainly aqueous based systems. Although there are numerous problems, particularly with surface mount boards, these do not seem insoluble (O'Conner 1991).
Small firms face the largest problem in making a transition, due to the high capital outlay involved on low volumes as well as the risks and disruption to production that adopting a new cleaning system would entail.
ELECTRONICS SECTOR 63
More rapid phasing in of CFC alternatives is hindered by customer resistance to specifying alternative cleaning technology, O'Conner argues but goes on to conclude that within the dynamic Asian economies, a considerable amount of technical know how and innovation experience has been accumulated on the use of CFC alternatives that can encourage other developing countries to reduce their damage to the ozone layer (O'Conner, 1991).
Health and safety of electronics production workers
Workers in the South African electronics industry are exposed to health risks associated with the assembly of electronic equipment; the most significant being cleaning and bonding processes which will be briefly examined.
The above discussion has focused on measures to reduce the use of ozone deleting substances but other cleaning agents, be they acids, alkalis or solvents such as alcohols, aliphatic hydrocarbons, aromatic hydrocarbons, acetates, ethers, glycols, ketones or carbon disulfide present a spectrum of health risks as carcinogens and causes of skin damage, respiratory diseases, neurological damage and reproductive impairment (IMF, 1986). One negative consequence of the use of CFC alternatives is the flammability of semi-aqueous cleaning solvents which pose additional safety risks, and higher costs for fire suppression equipment.
Soldering is the main electronic bonding process which involves the heating of metals such as copper, zinc, lead, tin, chromium and cadmium. Flux adds arsenic, antimony, chlorides, fluorides, bromides and halides to the process which generate the following by- products: polyanthone, cadmium oxide, zinc chloride, phenol, formaldehyde and phosgen vapours. Some of these are highly toxic, carcinogenic, bioaccumulate and present a spectrum of risks, particularly to the respiratory system (IMF, 1986). Where soldering is performed in wave soldering lines or infra red reflow ovens, toxic fumes may be ducted out of the workplace but workers are exposed to health hazards where hand soldering is performed without spot ventilation equipment.
Many of the harsher chemical substances used in electronics production require special treatment for safe disposal and are returned to suppliers for that purpose, but low level waste is the responsibility of firms to control. Waste water discharge is monitored by municipal authorities for pH levels and firms may incur fines if limits are exceeded (company interview). Thus, while controls exist, in practical terms these are limited by episodic monitoring to ensure enforcement.
Safety regulations affecting electronic equipment
Little regulation exists in South Africa governing the safety standards for electronic equipment. Historically telecommunications equipment has been the most extensively regulated to meet SAPT compatibility criteria, but only recently has the SABS begun to draw up standards for manufacturers on electromagnetic radiation levels. The one area of
64 INDUSTRIAL STRATEGY PROJECT
regulation is that covering the distribution and repair of electronic equipment classified under the Hazardous Substances Act, no. 15 of 1973. Into the category of group III hazardous substances fall mainly medical electronic equipment but include, lasers, microwave and low frequency electromagnetic radiation devices, high powered radar and radio frequency signal generation equipment.
Policy on health and safety and eliminating the use of ozone depleting substances
The above discussion has highlighted the limited amount of regulation covering health and safety in production. Short term improvements in this area require the attention of trade unions through their health and safety training and inspection departments in conjunction with employers, yet as this will affect only workplaces which are unionised, better regulation is necessary which calls for reforms to existing health and safety legislation.
As far as accelerating the substitution of CFCs is concerned the Asian experience has shown the benefits of restricting CFC availability to provide a stimulus to firms to adopt alternative technologies. The imposition of import quotas would be appropriate, given the current availability of alternatives. The above discussion has highlighted the lack of awareness of alternative cleaning technologies, particularly among small firms. This calls for the dissemination of technical information on CFC—l 13 alternatives through public research bodies such as the CSIR. Industry associations could also play a potentially useful role in facilitating the diffusion of knowledge of alternative cleaning technology, particularly as the main impetus for change has been identified as export acceptance. Growth in exports would assist financing the higher costs firms would bear in making the transition to cleaner technologies.
The standards of CFC free production are being set by TNCs in the developed countries, but followers cannot afford to lag too far behind 'For, the center of gravity of technological development in cleaning technology is decisively shifting away from CFC degreasers. Those who persist in their old ways may find themselves riding into competitive battle on a dinosaur' (O'Conner, 1991:16).
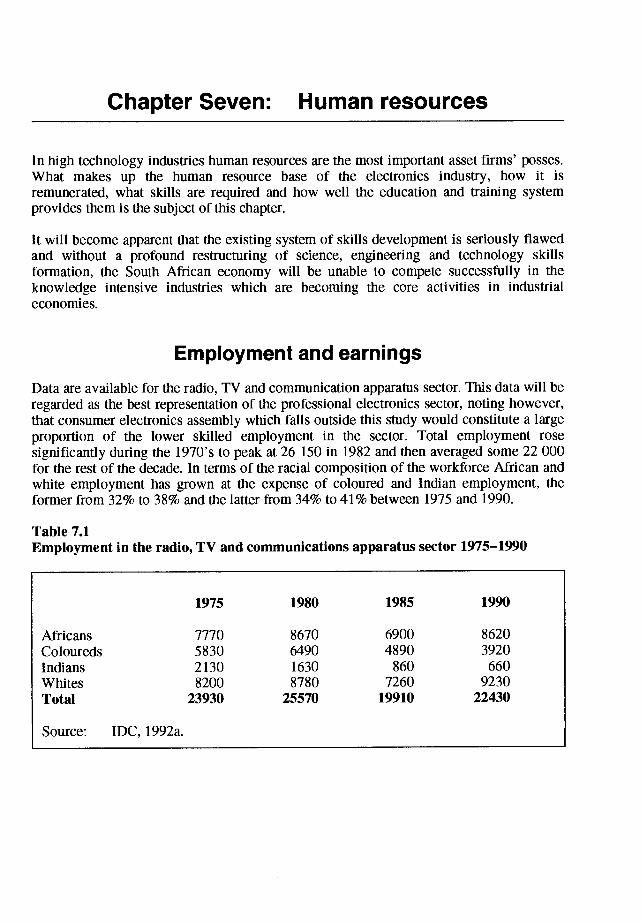
Chapter Seven: Human resources
In high technology industries human resources are the most important asset firms' posses. What makes up the human resource base of the electronics industry, how it is remunerated, what skills are required and how well the education and training system provides them is the subject of this chapter.
It will become apparent that the existing system of skills development is seriously flawed and without a profound restructuring of science, engineering and technology skills formation, the South African economy will be unable to compete successfully in the knowledge intensive industries which are becoming the core activities in industrial economies.
Employment and earnings Data are available for the radio, TV and communication apparatus sector. This data will be regarded as the best representation of the professional electronics sector, noting however, that consumer electronics assembly which falls outside this study would constitute a large proportion of the lower skilled employment in the sector. Total employment rose significantly during the 1970's to peak at 26 150 in 1982 and then averaged some 22 000 for the rest of the decade. In terms of the racial composition of the workforce African and white employment has grown at the expense of coloured and Indian employment, the former from 32% to 38% and the latter from 34% to 41% between 1975 and 1990.
Table 7.1 Employment in the radio, TV and communications apparatus sector 1975—1990
1975 1980 1985 1990
Africans 7770 8670 6900 8620 Coloureds 5830 6490 4890 3920 Indians 2130 1630 860 660 Whites 8200 8780 7260 9230 Total 23930 25570 19910 22430
Source: IDC, 1992a.
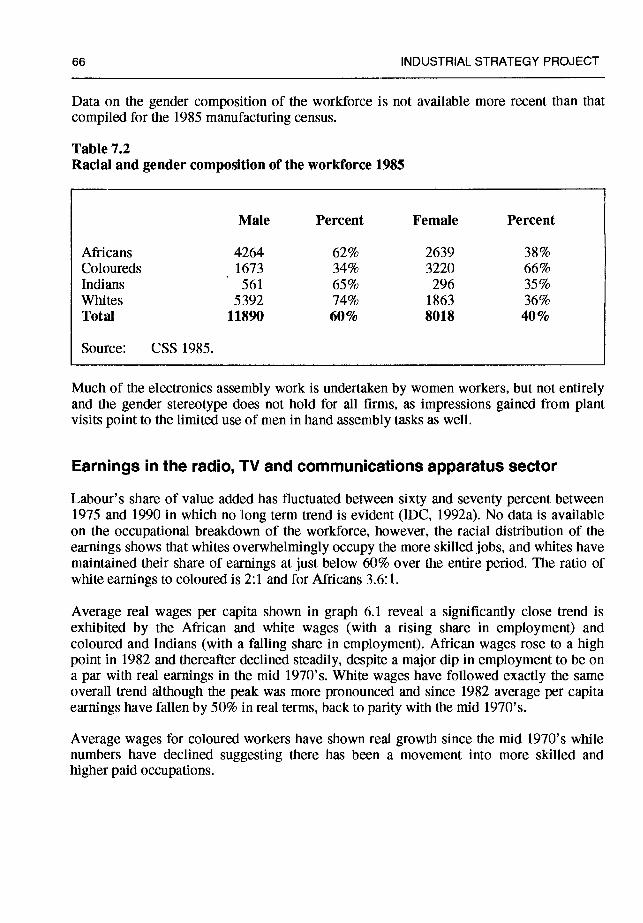
66 INDUSTRIAL STRATEGY PROJECT
Data on the gender composition of the workforce is not available more recent than that compiled for the 1985 manufacturing census.
Table 7.2 Racial and gender composition of the workforce 1985
Male Percent Female Percent
Africans 4264 62% 2639 38% Coloureds 1673 34% 3220 66% Indians 561 65% 296 35% Whites 5392 74% 1863 36% Total 11890 60% 8018 40%
Source: CSS 1985.
Much of the electronics assembly work is undertaken by women workers, but not entirely and the gender stereotype does not hold for all finns, as impressions gained from plant visits point to the limited use of men in hand assembly tasks as well.
Earnings in the radio, TV and communications apparatus sector
Labour's share of value added has fluctuated between sixty and seventy percent between 1975 and 1990 in which no long term trend is evident (IDC, 1992a). No data is available on the occupational breakdown of the workforce, however, the racial distribution of the earnings shows that whites overwhelmingly occupy the more skilled jobs, and whites have maintained their share of earnings at just below 60% over the entire period. The ratio of white earnings to coloured is 2:1 and for Africans 3.6:1.
Average real wages per capita shown in graph 6.1 reveal a significantly close trend is exhibited by the African and white wages (with a rising share in employment) and coloured and Indians (with a falling share in employment). African wages rose to a high point in 1982 and thereafter declined steadily, despite a major dip in employment to be on a par with real earnings in the mid 1970's. White wages have followed exactly the same overall trend although the peak was more pronounced and since 1982 average per capita earnings have fallen by 50% in real terms, back to parity with the mid 1970's.
Average wages for coloured workers have shown real growth since the mid 1970's while numbers have declined suggesting there has been a movement into more skilled and higher paid occupations.
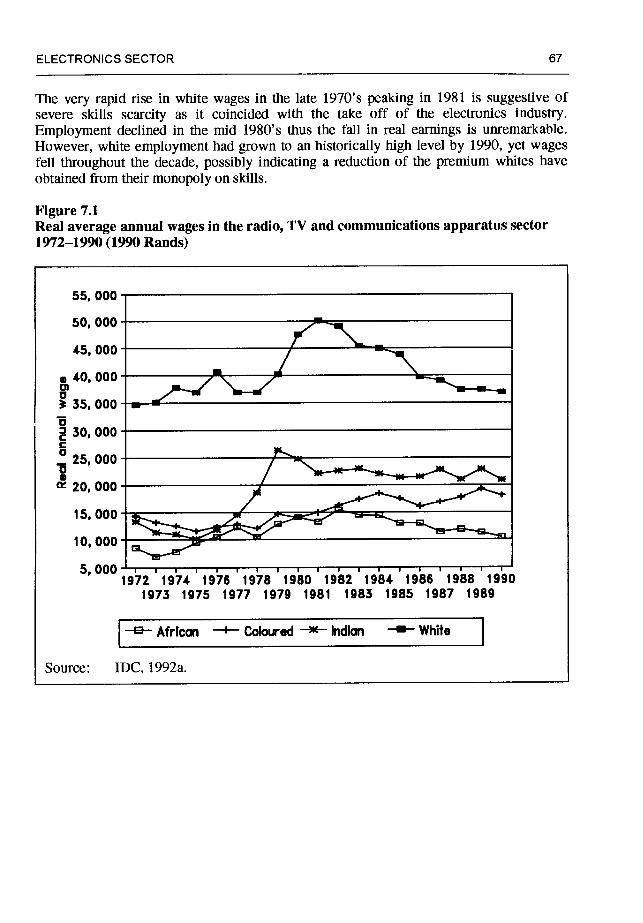
ELECTRONICS SECTOR 67
The very rapid rise in white wages in the late 1970's peaking in 1981 is suggestive of severe skills scarcity as it coincided with the take off of the electronics industry. Employment declined in the mid 1980's thus the fall in real earnings is unremarkable. However, white employment had grown to an historically high level by 1990, yet wages fell throughout the decade, possibly indicating a reduction of the premium whites have obtained from their monopoly on skills.
Figure 7.1 Real average annual wages in the radio, TV and communications apparatus sector 1972—1990 (1990 Rands)
25, 000
20. 000
15, 000
10, 000
Source: IDC, 1992a.
55, 000
50, 000
45, 000
• 40, 000 0
35, 000 0
30, 000 C 0
1972 1974 1976 1978 iao 1982 1984 1986 1988 1990 1973 1975 1977 1979 1981 1983 1985 1987 1989
1
5, 000
—8— African —+— Coloired —— Indian White
68 INDUSTRIAL STRATEGY PROJECT
Actual wage rates in the professional electronics industry Minimum wages in the industry are set by a bipartite body, the Industrial Council for the Iron, Steel and Metallurgicai Industry. Parties to the industrial council are employers associations and trade unions. The Steel and Engineering Industries Federation of South Africa (SEIFSA) coordinates employers associations for industrial council matters. Several trade unions are party to the industrial council, the dominant union being NUMSA.
Centralised bargaining at the industrial council level has, in the past, been supplemented by collective bargaining at other levels within large conglomerates and at the plant level. Plant level bargaining is being phased out and greater emphasis is being placed by NUMSA on centralised bargaining.
Industrial council wages reflect actual earning by workers in the electrical equipment industry. The minimum negotiated rate is shown in 5.5 in Appendix I. Although electronics firms are covered by provisions of the industrial council, the suitability of its occupational classification system for a fast changing industry like electronics has been questioned by employers (company interview).
Selected rates are shown in the graph. The labourers rate is rate H, most operative in the production workforce are located in rates F, E, and D. Artisans are graded rate A. What is striking about these rates in constant rands, is the fail in earnings experienced by the more skilled grades above rate D. Over the 1980's artisan's rates have fallen by a third. Does this suggest, then, that there is an abundance of artisanal skill in the economy? No, what has in fact happened is that centralised bargaining has lost control over artisanal wage rates and that wage drift has occurred. Skill scarcity has bid actual rates up above the minimum set by industrial council.
Real minimum rates for operatives can be seen to have reached an historical high in 1982, the point coinciding with the peak of output from the industry in the 1980's. Rates at the end of the decade follow the output trends of a resumption of growth from 1987 but since 1990 real wages have fallen.
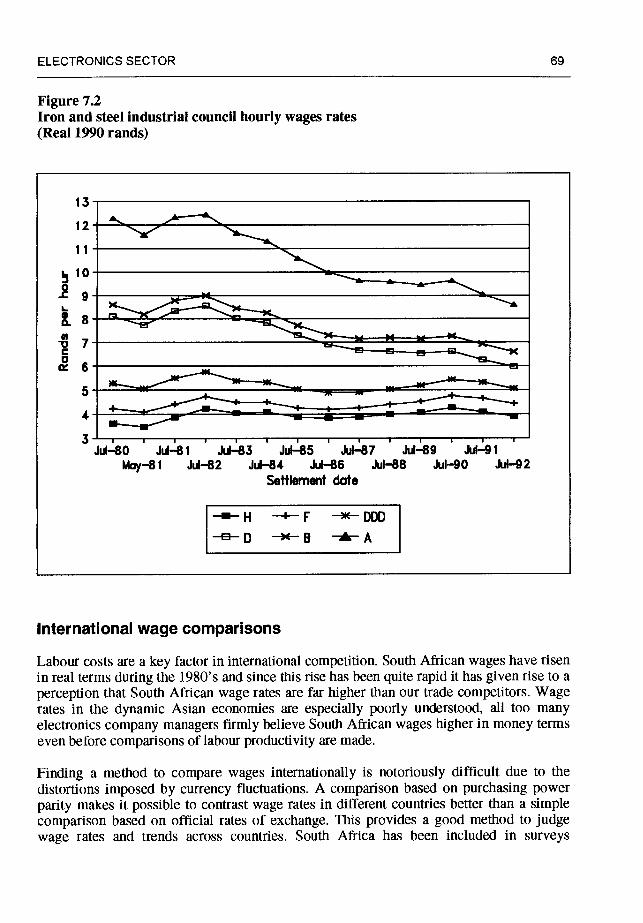
ELECTRONICS SECTOR 69
Figure 7.2 Iron and steel industrial council hourly wages rates (Real 1990 rands)
13
12
11
10 -c9
5
4 +_-4- 3
Jul—80 Jul-81 Jul-83 Jul—85 Jul—87 Jt.4—89 Jul-91
May—81 Jul—82 Jul—84 Jul—86 Jul—88 Jul-90 Jul—92 Settlement date
——H —4- F —*— DOD
—e-- ' B —— A
International wage comparisons
Labour costs are a key factor in international competition. South African wages have risen in real terms during the 1980's and since this rise has been quite rapid it has given rise to a perception that South African wage rates are far higher than our trade competitors. Wage rates in the dynamic Asian economies are especially poorly understood, all too many electronics company managers firmly believe South African wages higher in money terms even before comparisons of labour productivity are made.
Finding a method to compare wages internationally is notoriously difficult due to the distortions imposed by currency fluctuations. A comparison based on purchasing power parity makes it possible to contrast wage rates in different countries better than a simple comparison based on official rates of exchange. This provides a good method to judge wage rates and trends across countries. South Africa has been included in surveys
70 INDUSTRIAL STRATEGY PROJECT
conducted by the International Metaiworkers Federation (IMF). Table 6.6 in Appendix I shows the purchasing power parity of average wages in the electrical engineering industry, expressed in Swiss francs.
Two things are striking about the data. Ranked by the 1989 rates, South Africa falls in the lower quartile. The rates for South Korea, Taiwan and Hong Kong have risen rapidly since 1986 from a rate comparable to South African rates then to double or more by 1989. In these terms South African wages are neither higher than in the dynamic Asian economies nor have they risen so sharply. Furthermore, the rapid rate of increase of wages in those Asian economies has resulted in a structural shift in their economies and lead to the displacement of the more labour intensive aspects of production to the second tier Asian Newly Industrialising Economies (Todd, 1990:263—264). South Africa's suitability as an export platform does not appear unthinkable with regard to wage levels, however, when skill levels are taken into account the countries attractiveness substantially diminishes
Skill requirements and availability in the electronics industry
No comprehensive data on the occupational structure of the professional electronics industry exists, as a result information gathered from firms and general data about the availability of technical skills has been used as the basis for this section.
A broad breakdown of the occupational structure of the South African electronics industry has been given by Aspin as the following: unskilled, 20%; semi-skilled, 30%; clerical, 13%; skilled 20%; technical management, 11%; administrative management, 6% (Aspin, 1991:75). The foregoing figures do not indicate what technical skills are needed.
Currently, no firms expressed problems in obtaining sufficient staff to meet their own needs, yet a perception of shortages for higher skill levels persists. In 1986, the BTI investigation stated 'there is a shortage of engineers, technologists and technicians in South Africa' (BTI, 1986:120). Job losses since the start of down scaling the military electronics sector have increased the pool of available engineers and highly qualified technicians and there are indications, from reports in the trade press, that such skilled personnel have not necessarily been able to find employment in the industry, and recently graduated engineers have found difficulty in securing employment.
Superficially, the evidence points to the existence of an adequate supply technologically equipped labour, while in fact the reverse is true. First, the contraction of the industry has dampened demand for staff; secondly, ex-military engineers have often been found to be unsuitable for the cost sensitive and rapid results requirements of commercial design work (company interview). A related factor is the reliance on licensed technology which removes the imperative of developing skills within firms, moreover many engineers appear to be employed in roles dealing with production supervision or maintenance. In this regard, local firms have tended to renew licences rather than to treat them as temporary learning aids in an ongoing process of deepening the technological capacity of the enterprise.

ELECTRONICS SECTOR 71
The needs of individual firms in satisfying their skills requirements is seldom exactly matched by skills formation in the education system, hence training is invariably required. For an industry like electronics where the rapid pace of change is continually altering skill requirements, the need for upgrading is ongoing. Thus, manufacturers' views would predictably express faults with the education system, yet in South Africa the mismatch between technical skill needs of the economy and their formation is a deep structural problem with social and political dimensions that extend beyond the education system.
In response to the weak skills base of the industry firms have adapted their production and organisational structures accordingly but at the expense of using their resources to the full. 'I often question why there are so many T4 (high level) technicians behaving as artisans and why engineers are doing the work of technicians' (company interview). It is clear from employers that training is regarded as essential to integrate newly qualified staff, and graduates in particular, into existing practices, a situation which is common to high technology firms around the world.
A closer examination of each level of the skills needs of the professional electronics sector shows up the problems facing the industry. Starting at the low skill end, firms find there is a shortage of technically literate secondary school leavers 'schools are poor at training in lateral thinking, for example matriculants perform poorly in practical applications., is a fault of the entire system' (company interview). The problems identified here point to inadequacies in the school curriculum to develop problem solving skills. At the next level of required skills there are inadequacies in the supply of technicians to the industry. Here the problem is not a simply a matter of shortages, since the number of technician graduates has grown steadily since 1989. As one executive said 'I am fairly happy with the technikons with the better T4 and T3's. They are good at hands on work under a good project leader. But one has to search for the good ones, it is not the qualifications, it is more a matter of commitment and being prepared to do things properly' (company interview). This is a problem by no means unique to South Africa, as Hewitt shows in relation to Brazil by referring research on the scarcity of technicians which found 'an inadequacy of supply relative to the sector's demand which is more a problem of qualitative, as opposed to quantitative demand' (Hewitt, 1992:196). Remedying skills shortages cannot be achieved by simply aiming to increase the supply of electronics technicians, as has been implied by CSIR in pointing to the deployment of qualified engineers in roles normally reserved for technicians (Aspin, 1991:77).
At the top technical skill level South African firms find constraints on obtaining experienced engineers. This is compounded by two factors, first, engineers tend not to specialise extensively in their careers, due to the dearth of engineering skills and short time they spend on many projects. Secondly, engineers are frequently drawn into management or other non technical/design functions with the result South African
engineers may be described as generalists with broad skills but lack depth of specialisation.
Overall, then, there are problems at each successive level of the skills pyramid in the electronics sector. Due to the contraction of the sector these problems have not been experienced in absolute shortages, but the qualitative skills shortages and weakness of the
72 INDUSTRIAL STRATEGY PROJECT
skills supply has imposed an organisational structure upon firms and ascribed roles to skilled workers which are restrictive and do not maximize the productive potential within firms. Overcoming these problems requires a comprehensive approach.
Employment tendencies of technological change in electronics assembly processes
Rapid growth of the electronics industry world wide has attracted attention for its employment effects both as an employment generator, as well as displacing jobs through automation. For South Africa, with no history of large scale production local production or Original Equipment Manufacture (OEM) for export employment growth has been shown to be modest and to have declined in the 1980's. Future employment generation prospects for this industry are linked to its overall performance, where growth would be at best modest, but employment is likely to decline in assembly operations.
Technology is eroding the manual process in factories currently and certainly in the future. The technology is advancing overseas and this tends to drive local firms. The trend to smaller components requires the use of robots. Skilled jobs increase but manual labour is reduced. While this reduces employment it also makes producing other products viable so that niche products can be developed for volume production (company interview).
South African firms have in the past three years started to shift to a greater use of Surface Mount Technology (SMT) using pick and place machines and reducing assembly labour. The tendency to automation is restrained by continued manufacture of very low volume items, but has already significantly altered electronics assembly labour requirements by reducing the need for less skilled assemblers. Greater skill levels are accordingly required in electronics manufacture at every level from operator upwards in the relentless march of technological change.
Availability of skills in South Africa suitable for the electronics industry
The legacy of racial policies have impoverished the country's human resources and undermined the generation of a skills base so necessary to sustain high technology industries.
A policy document drawn up by Associated Scientific and Technical Societies of South Africa (AS&TS), the Joint Council of Scientific Societies (JCSS) and the South African Engineering Association (SAVI) describes the severity of the crisis in technical education by referring to the following factors. It is estimated that only about one third of the current workforce has basic literacy. During the 1980's the proportion of matriculants passing mathematics and science at the higher grade declined; in 1990 less than 2% of African matriculants passed mathematics, profoundly influencing the numbers suitable to take up science and engineering training.
ELECTRONICS SECTOR 73
Engineering graduates are a declining share relative to humanities, from 9% in 1971 to less than 5% in recent years. In addition, the ratio between university and technikon students is highly imbalanced: in 1991 there were 308 000 students at 21 universities but only 104 000 students at 13 technikons. In engineering the ratio between technicians from technikons to engineers from universities was 0.8:1. In contrast that for economically successful countries varies between 3:1 and 20:1.
Whereas South Africa had 35 graduating engineers per million of population, Australia had 220 in 1989 and plans to increase this number. Yet in South Africa engineering student enrollment at universities has declined (FRD, quoted in Dataweek 24/4/92).
Internationally the average expenditure on training by industry is in the region of 5% but in South Africa the industry average is less than 2% (AS&TS/JCSS/SAVI, 1993:4—6).
In the light of these figures the South Africa economy is seriously prejudiced in its ability to grow and become more internationally competitive without a rapid, and far reaching reorientation of its education system to produce the requisite technical skills. The electronics sector is but one claimant on the science and engineering skills pooi, thus a human resources programme for the sector needs to be formed as an integral part of a technological education strategy for the entire society.
Human resources policy for the electronics sector
Electronics is a knowledge intensive industry and a key enabling industry in industrial economies. Hence the skills it requires have wide applicability and policies to promote skills in this sector will have positive spillovers throughout the rest of the economy.
The development of the electronics sector will assume the same role now normally attributed to the capital goods industry as a crucial source of skills and innovation that will have a wide degree of applicability throughout the economy and society as a whole (Hoffman, 1985:266).
A human resources policy for the electronics sector would need to be formulated by all of the stakeholders in the industrial and educational spheres — industry, trade unions, professional associations, education policy makers and teaching institutions, and teachers. What follows is an outline of such a policy, taking into account current thinking about technical skills development.
It is clear that there is a shortage of core skills in South Africa and an urgent need to develop technical skills in science, engineering and technology (SET). Human resource development essential for technology development, proposed by AS&TS/JCSS/SAVI, envisages skill development at three levels: an advanced level for R&D, technology transfer and research specialization; a intermediate level with core skills based on mathematics, applied science and language and a basic level with core skills in literacy and numeracy. At all levels the reasoning and problem solving should be treated as core skills (AS&TS/JCSS/SAVI, 1993:8—9).
74 INDUSTRIAL STRATEGY PROJECT
For the electronics industry what is required is long term SET training in combination with industry specific training. At the level of industry training, electronics represents a suitable vehicle to build core competency in the metal industry by making information processing and electronic technology foundation subjects. What is required is the development of generic knowledge of electronics to upgrade general technical skills. Artisan training in South Africa may be criticised for the emphasis it has placed on rote learning of formulae and restricting practical applications to a focus on specific commercial products. A diametrically opposite approach is required which stresses generic skills, problem solving and transferability of practical applications so artisans are not restricted to particular commercial ranges. Very low enrollments of artisans needs to be reversed by revising the school education SET curicula and promoting careers in electronic engineering. Particular attention needs to be directed to the development of software skills.
AS&TS/JCSS/SAVI envisage industry training, in South Africa being put on an entirely new footing and to operate a four levels, their views are summarised below.
What is needed is multi-skilling, life-long education in which within-industry training and retraining is as important as education within the schools and tertiary sector. Moreover, what is required is long term training leading to continuous, incremental improvement or 'Kaizen', linked to set-by-step career progression, rather than short, one-off courses or 'big-bang' initiatives (AS&TS/JCSS/SAVI, 1993:37).
Institutions to run industry training with trade union and industry representation needs to be established, financed by training levies and education budget subsidies to run certified training within courses. The acquisition of skills needs to be linked to a grading system providing a clear career path. At the low skill level it is clear that there needs to be focused programme to raise numeracy and literacy levels as a prerequisite for raising productivity as the first level of training. Artisan training, outlined in the above proposals for the electronics industry would represent the second level.
Equipment manufacturers argue that they do not need to devote resources to training production workers for two reasons: they contend sufficient skills exist and that labour requirements are declining. It is true that electronics assembly has become more automated, however the market for professional equipment is not a mass market, rather it is one where maximum flexibility is sought. A high level of skills are required for rapid change overs required by short production runs. On the grounds that firms need the capacity to produce high quality products at low volumes greater investment in training is needed.
For intermediate and high level skills, ongoing firm based training is required to develop and redevelop new skills as technology changes. This would be the third level. Company based training in South Africa is limited, as the above figures show. In part there has been a reluctance of firms to invest in training staff who may leave before the benefits are felt by the firm. While 'job hopping' is a disincentive, the failure to institute ongoing training programmes for all levels of staff will leave firms with a deteriorating human resource base. In view of the resource problems of developing competent training facilities within firms, AS&TS/JCSS/SAVI, propose consortia of firms in conjunction with universities and technikons may be more viable methods to institutionalise structured and career linked retraining and upgrading of technical and research staff (AS&TS/JCSS/SAVI, 1993:39).

ELECTRONICS SECTOR 75
The fourth and final level envisaged is in 'leading edge' education between industry and the tertiary education system. In the electronics industry a small number of firms have established links with universities through funding research, chairs and student bursaries. These links require extension and broadening to widen the scope of high level human resource development.
A comprehensive human resources development programme is required for the electronics industry to develop skills necessary for the industry and for the wider application of electronics technology throughout the economy. A human resource development programme is also required as a necessary condition for raising productivity in the industry. Development of the industry's innovative capacity requires attention to the development of high level skills. In this regard the efficacy of existing links between industry and tertiary institutions requires evaluation to identify areas in which improvements may be made.
The South African electronics industry under the best circumstances is unlikely to ever grow to be a large sector of manufacturing industry. However, this study has argued that a human resources programme that upgrades skills in electronics technology could play a central role in upgrading the skills base of the metals sector and assist in the technological upgrading of manufacturing industry.
To summarise the key features of a human resource development policy for the electronics industry would cover the following:
First, a three tiered approach spanning basic skill development, and intermediate level and advanced level of firm based training.
Secondly, training in electronic technology and information processing which builds a core competency in these fields since those skills are applicable to a wide range of industries.
Thirdly, the establishment of an industry training center to run modular training courses for workers who would be able to advance their careers through the acquisition of skills.
Chapter Eight: Sub-sector assessment of the professional electronics industry
To move the discussion from generalities about the professional electronics industry to specific features of its varied parts, a detailed description of each of the seven sub-sectors is presented below. It cover the market, notable features and competitive status for each sub-sector.
Evaluating the professional electronics industry requires the development of an appropriate criteria. As Porter (1990) has pointed Out in developing an account of the determinants of national advantage, competitive advantage is not static for it is constantly threatened by other countries efforts to learn and close the gap. Employing this approach, Ernst and O'Conner (1992) have usefully isolated five broad sets of environmental factors to explain the ability of Newly Industrialized Economies to develop their own competitive electronics industries. These are, first, markets for production factors, especially advanced factors like skilled labour and venture capital, secondly, demand for electronics goods and services, thirdly, firm strategies and industry structure, fourthly, the state of development of supplier networks and related industries, fifthly, policy on institutional and regulatory frameworks for developing an electronics industry. Industry wide aspects of policy, trade, technology development and human resources, have been covered in previous chapters.
Electronics components A very wide variety of products fall into the category of electronic components. Included in this sector of the economy are active components such as cathode ray tubes, discrete semiconductors and integrated circuits, passive components such as resistors and capacitors, electro mechanical parts such as switches and relays and conductors, printed circuit boards and connectors.
The origins of a local components industry have been reviewed in Chapter Three. Component manufacturers, if they are not for export, naturally follow the requirements of original equipment manufacturers in the domestic economy. From the outset the local components base was shallow, set up principally to increase local content in telecommunications products. The narrow local base has shrunk for two reasons: first, an increasing divergence between the capacity of the local industry and the needs of local manufacturers producing small numbers of significantly different products (and hence requiring a multiplicity of components, none of which approach 'world scale'); secondly, the evolving technology that has enhanced the power and complexity of components. Under these circumstances segments of local production became unviable and were closed down. Recent tariff reforms, referred to in Chapter Three, signalled the acknowledgement of the failure of protection to grow the local components manufacturing sector.
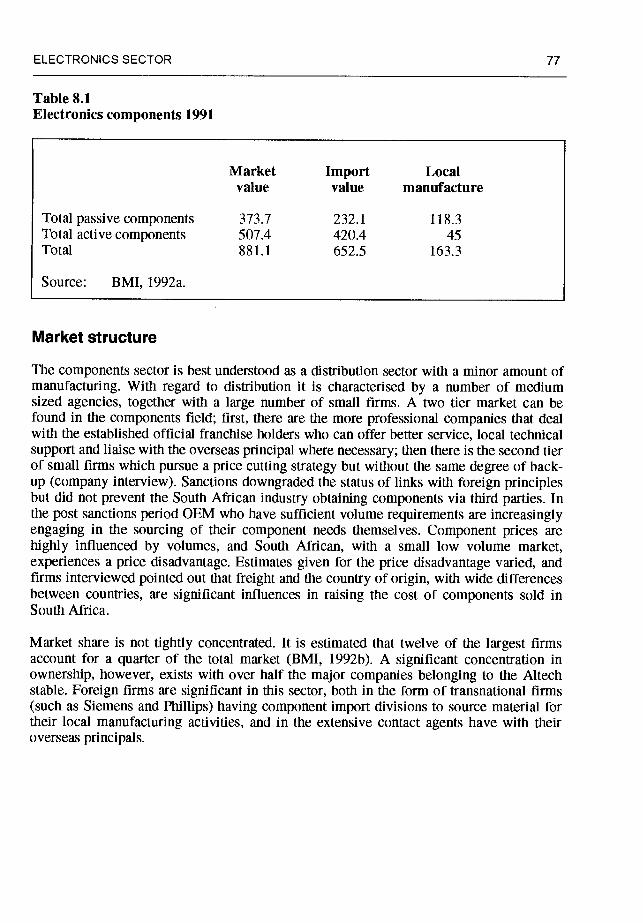
ELECTROMCS SECTOR 77
Table 8.1 Electronics components 1991
Market Import Local value value manufacture
Total passive components 373.7 232.1 118.3 Total active components 507.4 420.4 45 Total 881.1 652.5 163.3
Source: BMI, 1992a.
Market structure
The components sector is best understood as a distribution sector with a minor amount of manufacturing. With regard to distribution it is characterised by a number of medium sized agencies, together with a large number of small firms. A two tier market can be found in the components field; first, there are the more professional companies that deal with the established official franchise holders who can offer better service, local technical support and liaise with the overseas principal where necessary; then there is the second tier of small firms which pursue a price cutting strategy but without the same degree of back- up (company interview). Sanctions downgraded the status of links with foreign principles but did not prevent the South African industry obtaining components via third parties. In the post sanctions period OEM who have sufficient volume requirements are increasingly engaging in the sourcing of their component needs themselves. Component prices are highly influenced by volumes, and South African, with a small low volume market, experiences a price disadvantage. Estimates given for the price disadvantage varied, and firms interviewed pointed out that freight and the country of origin, with wide differences between countries, are significant influences in raising the cost of components sold in South Africa.
Market share is not tightly concentrated. It is estimated that twelve of the largest firms account for a quarter of the total market (BMI, 1992b). A significant concentration in ownership, however, exists with over half the major companies belonging to the Altech stable. Foreign firms are significant in this sector, both in the form of transnational firms (such as Siemens and Phillips) having component import divisions to source material for their local manufacturing activities, and in the extensive contact agents have with their overseas principals.
78 INDUSTRIAL STRATEGY PROJECT
Semiconductor fabrication
Semiconductors are the key electronic components and therefore merit special consideration. Due to the separation of the production process into design, wafer fabrication, assembly and testing, together with the huge scale requirements, semiconductor firms have traditionally been the most globalised of the electronics industry (Langlois, 1988). Semiconductor manufacturing is principally divided into commodity items such as memory devices and specialised items such as microprocessors. Developing countries have generally acquired this technology moving upstream from the early stages of being export processing platforms assembling semiconductors, to wafer fabrication and on into design, albeit with considerable specialisation in these efforts in the light of the global nature of the industry.
South Africa's acquisition of semiconductor technology has been detailed in Chapter Three. As SAMES was built to serve strategic ends, its financial viability was in question from the start. SAMES received a subsidy to bring its prices into line with world prices, over time this subsidy rose. On the domestic resource costs of SAMES in 1987, Kaplan has estimated a net foreign exchange saving of Ri 7 million to require local expenditure of R29.75 million (Kaplan, 1980:123).
Unsurprisingly, the desirability of maintaining this facility had been debatable. The case made for SAMES was that the products it made were suitable for niche markets and it provided a facility for engineers to work in silicon. Against this, as Dr Temple, MD of Plessey argued SAMES was unsuitable as the country needed either a low volume pilot plant abreast of new technology or a high volume, low cost 1.4 to sub-micron facility; SAMES was closer to the former but trying to recover costs by pushing volumes. Far more useful would be for the country to obtain free access to globally supplied components and to retain a silicon foundry for prototyping (Electronic News 29/4/90).
Matters came to a head when SAMES was destroyed by fire in 1990. Largely on the basis of replacement equipment being of the current generation, SAMES was restarted with a RlOO million cash injection from its shareholders which had been expanded to include all the major telecommunications companies — Altech, Siemens, Reunert, Plessey and Temsa. SAMES's plan was to focus on the telecomms and telephony market and, of crucial importance, the project went ahead with a technology tie up with a US company, International Microelectronic Products (Electronic News March 1991). In a four part agreement covering joint marketing, joint product development, design and process technology transfer to SAMES and complementary manufacturing the South African company will have its design centre put on an equal footing with the US firm (Dataweek 5/6/92). Products that are produced will be Application Specific Integrated Circuits, (ASIC), and Application Specific Standard Products. To the existing 2 micron CMOS process a 1.2 micron CMOS technology is being added to cater for a 25 million dollar export contract (Dataweek 31/7/92).
SAMES now claims to be operating on a sound economic footing (company interview). The company has won export orders. Operating the newest generation plant, with a stable process technology, SAMES claims production costs per unit are internationally
ELECTRONICS SECTOR 79
competitive. The company does not get government support and although local content requirements have given it tied telecommunications markets this is expected to fall away in the future. Over the next seven years the company expects to achieve a net foreign exchange saving of R550 million. Export sales are projected to rise from R3.5m for 1992/3 to R73m in 1996/7 while production for the domestic market reaches R94m and R99m respectively. One important feature of competitiveness is the lower cost of engineering skills in its design centre compared to US or European rates. SAMES design facilities currently employ 12 designers, a threefold increase is planned. Close proximity to customers confers additional benefits. The technological alliance provides additional capabilities on projects which cannot be done internally.
SAMES is expected to have a life of about 10 years, during which it will have a capital expenditure programme of around R5m per annum and double that in some years. It generates a positive cash flow sufficient for incremental investment but insufficient to recapitalise the operation for an entirely new future semiconductor fabrication technology. Thus its longer term future is not assured.
Electronic design automation
Design capabilities in semiconductors are a crucial requirement to produce differentiated products employing custom and semi-custom ICs, for which purpose the ICDC was established. In this respect SAMES provides a real facility on which to develop such competency, and interact with engineers able to guide designers on how to lower the fabrication cost of ICs they produce. The ICDC has extended its range of ASIC design services in gate array and standard cell technology to include Floating Point Gate Array (FPGA) and Programmable Logic Devices (PLD) technologies. Agreements have been established with leading firms such as Xilinx.
In the field of Electronic Design Automation (EDA), software tools appear to have diffused rapidly into the local industry. The recognition of the critical importance of ASIC in developing differentiated products rapidly has spurred firms to invest in EDA tools. In a relatively short period South African component distribution firms have extended their existing distribution relations with foreign semiconductor firms to include acting as design houses. In 1992 Vector EDA signed an agreement with Fujitsu and Asic design services
signed up with Samsung (Dataweek, 8/5/92).
Components assessment
The electronic components sector is pulled by demand from equipment manufacturers. It will follow the fortunes of the rest of the industry. Local manufacturing of standard commodity items under tariff protection proved to be a failure. Should sufficient demand develop, component manufacturing will be drawn into areas where sufficient volumes are generated. The remainder of components are best sourced from world markets, through the distribution sector or by the efforts of firms themselves to source the most competitively priced components.
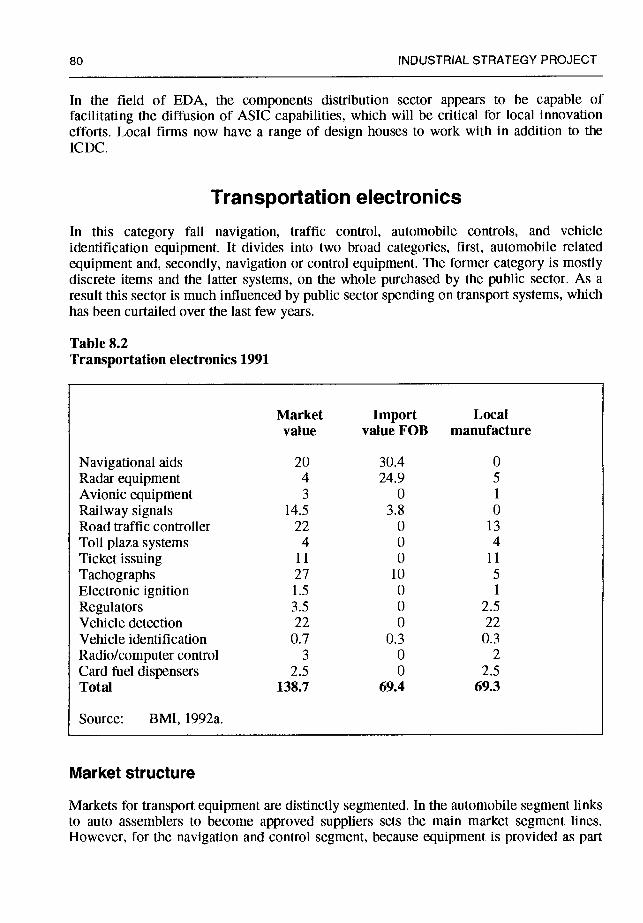
80 INDUSTRIAL STRATEGY PROJECT
In the field of EDA, the components distribution sector appears to be capable of facilitating the diffusion of ASIC capabilities, which will be critical for local innovation efforts. Local finns now have a range of design houses to work with in addition to the ICDC.
Transportation electronics In this category fall navigation, traffic control, automobile controls, and vehicle identification equipment. It divides into two broad categories, first, automobile related equipment and, secondly, navigation or control equipment. The former category is mostly discrete items and the latter systems, on the whole purchased by the public sector. As a result this sector is much influenced by public sector spending on transport systems, which has been curtailed over the last few years.
Table 8.2 Transportation electronics 1991
Market Import Local value value FOB manufacture
Navigational aids 20 30.4 0 Radar equipment 4 24.9 5 Avionic equipment 3 0 1
Railway signals 14.5 3.8 0 Road traffic controller 22 0 13 Toll plaza systems 4 0 4 Ticket issuing 11 0 11
Tachographs 27 10 5 Electronic ignition 1.5 0 1
Regulators 3.5 0 2.5 Vehicle detection 22 0 22 Vehicle identification 0.7 0.3 0.3 Radio/computer control 3 0 2 Card fuel dispensers 2.5 0 2.5 Total 138.7 69.4 69.3
Source: BMI, 1992a.
Market structure
Markets for transport equipment are distinctly segmented. In the automobile segment links to auto assemblers to become approved suppliers sets the main market segment lines. However, for the navigation and control segment, because equipment is provided as part
ELECTRONICS SECTOR 81
of a larger system, firms are required to show competency as providers of complete systems. This sector is fairly concentrated with the six leading firms accounting for 45 percent of the market (BMI, 1992b). Ownership is not highly concentrated. The leading electronics companies have interests in this sector through subsidiaries in addition to several independent firms.
Features of the automobile electronics market
The advent of phase VI of the automobile assembly programme provided a major stimulus to the automobile electronics sector. It generated a great deal of optimism about reviving the fortunes of the electronics industry and attracted companies such as STC and Siemens, who were faced with shrinking telecommunications markets, to enter the field. For new entrants the transition was not successful and Siemens ceased its automobile electronics activities. The problem in a nutshell is that in world markets 'South Africa must compete at the right price at a fraction of the volumes. To do this South Africa has to be very lean' (company interview). Local firms which have successfully grown the automobile electronics market have been presented with a window of opportunity, through the local content programme, to become approved suppliers. In so doing they have needed to adapt their practices. Acceptance by local auto assemblers required meeting competitive pricing requirements in international terms, the auto firms then being able to claim phase VI benefits. Critical ICs are available at fixed prices to automobile sub assemblies around the world, however duties on electro-mechanical parts raise local manufacturing costs. Quality and reliability are essential features for acceptance by automobile assemblers. Here South African firms have to prove to sceptical customers that they are able to perform. Achieving acceptance has entailed building a relationship with the auto assembler wherein the firm is pulled along and upgraded by quality programmes to become effective best practice producers. Where firms become approved suppliers they are able to successfully export. An example of such a firm is Electromatic. By qualifying as an approved supplier to local automobile assembler BMW, it has been able to export products to overseas BMW plants. These efforts have won export awards for the company.
South African firms do not have the scale of R&D efforts to move into the high end automotive electronics products such as vehicle management systems or anti-lock braking systems, but they do appear to have the potential to develop competency in supplying less sophisticated modules.
Control and automation
In this sector, a variety of engineering activities are brought together in order to monitor and control machines or processes. As a branch of electronics, it encompasses a wide range of processes, from the manufacturing of instruments and control devices to the integration of discrete modules into complete systems, mostly on a unique project basis. The system integration aspect, in which software production is a key feature, results in this sector having a significant service component.
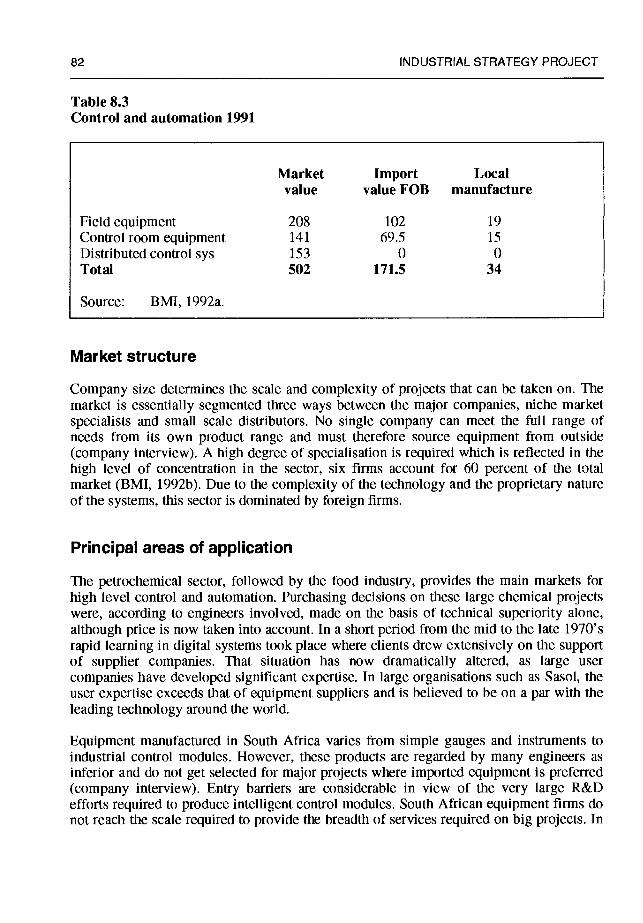
82 INDUSTRIAL STRATEGY PROJECT
Table 8.3 Control and automation 1991
Market Import Local value value FOB manufacture
Field equipment 208 102 19 Control room equipment 141 69.5 15 Distributed control sys 153 0 0 Total 502 171.5 34
Source: BMI, 1992a.
Market structure
Company size determines the scale and complexity of projects that can be taken on. The market is essentially segmented three ways between the major companies, niche market specialists and small scale distributors. No single company can meet the full range of needs from its own product range and must therefore source equipment from outside (company interview). A high degree of specialisation is required which is reflected in the high level of concentration in the sector, six firms account for 60 percent of the total market (BMI, 1992b). Due to the complexity of the technology and the proprietary nature of the systems, this sector is dominated by foreign firms.
Principal areas of application
The petrochemical sector, followed by the food industry, provides the main markets for high level control and automation. Purchasing decisions on these large chemical projects were, according to engineers involved, made on the basis of technical superiority alone, although price is now taken into account. In a short period from the mid to the late 1970's rapid learning in digital systems took place where clients drew extensively on the support of supplier companies. That situation has now dramatically altered, as large user companies have developed significant expertise. In large organisations such as Sasol, the user expertise exceeds that of equipment suppliers and is believed to be on a par with the leading technology around the world.
Equipment manufactured in South Africa varies from simple gauges and instruments to industrial control modules. However, these products are regarded by many engineers as inferior and do not get selected for major projects where imported equipment is preferred (company interview). Entry barriers are considerable in view of the very large R&D efforts required to produce intelligent control modules. South African equipment firms do not reach the scale required to provide the breadth of services required on big projects. In
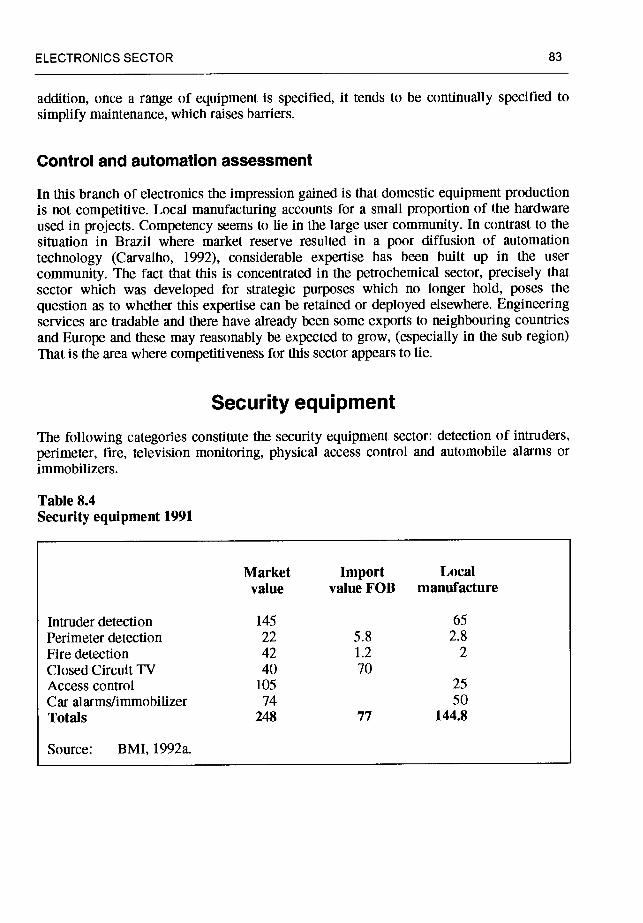
ELECTRONICS SECTOR 83
addition, once a range of equipment is specified, it tends to be continually specified to simplify maintenance, which raises barriers.
Control and automation assessment
In this branch of electronics the impression gained is that domestic equipment production is not competitive. Local manufacturing accounts for a small proportion of the hardware used in projects. Competency seems to lie in the large user community. In contrast to the situation in Brazil where market reserve resulted in a poor diffusion of automation
technology (Carvalho, 1992), considerable expertise has been built up in the user community. The fact that this is concentrated in the petrochemical sector, precisely that sector which was developed for strategic purposes which no longer hold, poses the question as to whether this expertise can be retained or deployed elsewhere. Engineering services are tradable and there have already been some exports to neighbouring countries and Europe and these may reasonably be expected to grow, (especially in the sub region) That is the area where competitiveness for this sector appears to lie.
Security equipment The following categories constitute the security equipment sector: detection of intruders, perimeter, fire, television monitoring, physical access control and automobile alarms or immobilizers.
Table 8.4 Security equipment 1991
Market Import Local value value FOB manufacture
Intruder detection 145 65
Perimeter detection 22 5.8 2.8
Fire detection 42 1.2 2
Closed Circuit TV 40 70 Access control 105 25 Car alarms/immobilizer 74 50 Totals 248 77 144.8
Source: BMI, 1992a.
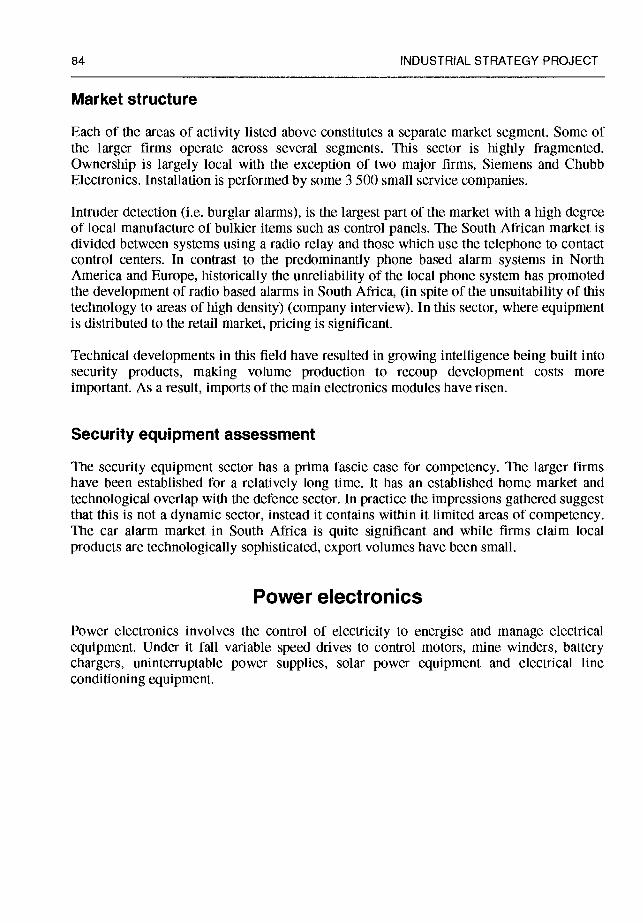
84 INDUSTRIAL STRATEGY PROJECT
Market structure
Each of the areas of activity listed above constitutes a separate market segment. Some of the larger firms operate across several segments. This sector is highly fragmented. Ownership is largely local with the exception of two major firms, Siemens and Chubb Electronics. Installation is performed by some 3 500 small service companies.
Intruder detection (i.e. burglar alarms), is the largest part of the market with a high degree of local manufacture of bulkier items such as control panels. The South African market is divided between systems using a radio relay and those which use the telephone to contact control centers. In contrast to the predominantly phone based alarm systems in North America and Europe, historically the unreliability of the local phone system has promoted the development of radio based alarms in South Africa, (in spite of the unsuitability of this technology to areas of high density) (company interview). In this sector, where equipment is distributed to the retail market, pricing is significant.
Technical developments in this field have resulted in growing intelligence being built into security products, making volume production to recoup development costs more important. As a result, imports of the main electronics modules have risen.
Security equipment assessment
The security equipment sector has a prima fascie case for competency. The larger firms have been established for a relatively long time. It has an established home market and technological overlap with the defence sector. In practice the impressions gathered suggest that this is not a dynamic sector, instead it contains within it limited areas of competency. The car alarm market in South Africa is quite significant and while firms claim local products are technologically sophisticated, export volumes have been small.
Power electronics Power electronics involves the control of electricity to energise and manage electrical equipment. Under it fall variable speed drives to control motors, mine winders, battery chargers, uninterruptable power supplies, solar power equipment and electrical line conditioning equipment.
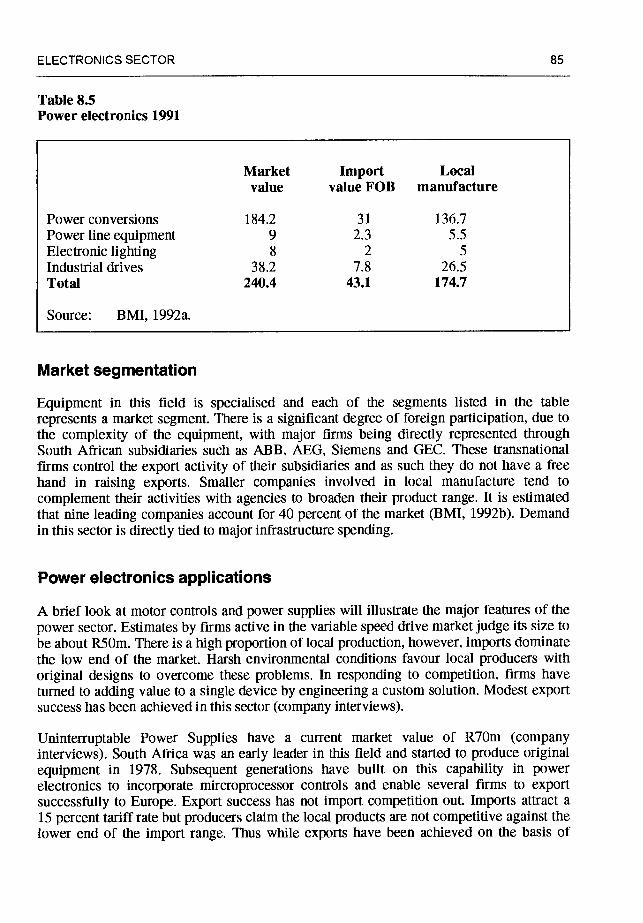
ELECTRONICS SECTOR 85
Table 8.5 Power electronics 1991
Market Import Local value value FOB manufacture
Power conversions 184.2 31 136.7 Power line equipment 9 2.3 5.5 Electronic lighting 8 2 5 Industrial drives 38.2 7.8 26.5 Total 240.4 43.1 174.7
Source: BMI, 1992a.
Market segmentation
Equipment in this field is specialised and each of the segments listed in the table represents a market segment. There is a significant degree of foreign participation, due to the complexity of the equipment, with major firms being directly represented through South African subsidiaries such as ABB, AEG, Siemens and GEC. These transnational firms control the export activity of their subsidiaries and as such they do not have a free hand in raising exports. Smaller companies involved in local manufacture tend to complement their activities with agencies to broaden their product range. It is estimated that nine leading companies account for 40 percent of the market (BMI, 1992b). Demand in this sector is directly tied to major infrastructure spending.
Power electronics applications
A brief look at motor controls and power supplies will illustrate the major features of the power sector. Estimates by firms active in the variable speed drive market judge its size to be about R50m. There is a high proportion of local production, however, imports dominate the low end of the market. Harsh enviromnental conditions favour local producers with original designs to overcome these problems. In responding to competition, firms have turned to adding value to a single device by engineering a custom solution. Modest export success has been achieved in this sector (company interviews).
Uninterruptable Power Supplies have a current market value of R70m (company interviews). South Africa was an early leader in this field and started to produce original equipment in 1978. Subsequent generations have built on this capability in power electronics to incorporate mircroprocessor controls and enable several firms to export successfully to Europe. Export success has not import competition out. Imports attract a 15 percent tariff rate but producers claim the local products are not competitive against the lower end of the import range. Thus while exports have been achieved on the basis of
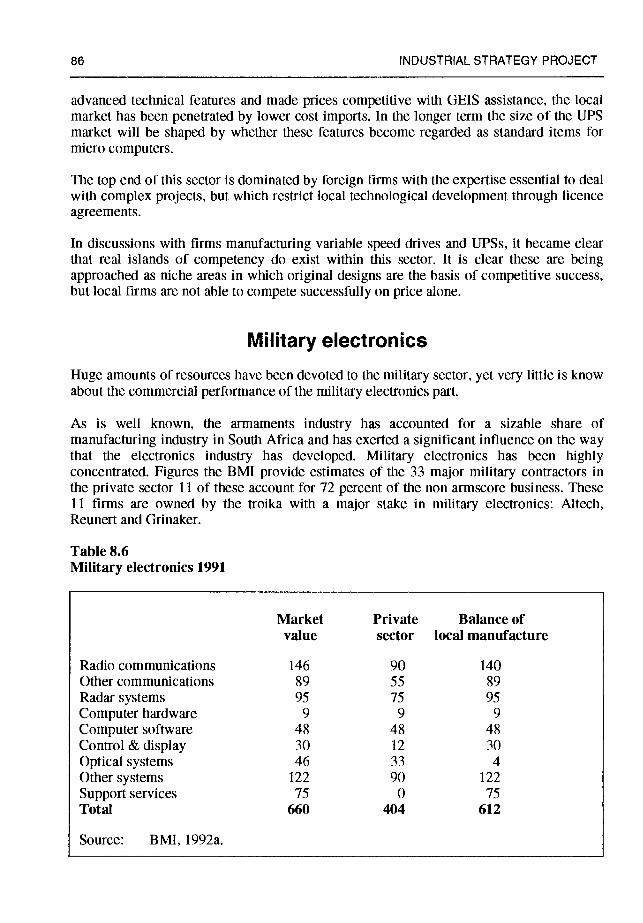
86 INDUSTRIAL STRATEGY PROJECT
advanced technical features and made prices competitive with GElS assistance, the local market has been penetrated by lower cost imports. In the longer term the size of the UPS market will be shaped by whether these features become regarded as standard items for micro computers.
The top end of this sector is dominated by foreign finns with the expertise essential to deal with complex projects, but which restrict local technological development through licence agreements.
In discussions with firms manufacturing variable speed drives and UPSs, it became clear that real islands of competency do exist within this sector. It is clear these are being approached as niche areas in which original designs are the basis of competitive success, but local firms are not able to compete successfully on price alone.
Military electronics
Huge amounts of resources have been devoted to the military sector, yet very little is know about the commercial performance of the military electronics part.
As is well known, the armaments industry has accounted for a sizable share of manufacturing industry in South Africa and has exerted a significant influence on the way that the electronics industry has developed. Military electronics has been highly concentrated. Figures the BMI provide estimates of the 33 major military contractors in the private sector 11 of these account for 72 percent of the non armscore business. These 11 firms are owned by the troika with a major stake in military electronics: Altech, Reunert and Grinaker.
Table 8.6 Military electronics 1991
Market Private Balance of value sector local manufacture
Radio communications 146 90 140 Other communications 89 55 89 Radar systems 95 75 95 Computer hardware 9 9 9 Computer software 48 48 48 Control & display 30 12 30 Optical systems 46 33 4 Other systems 122 90 122
Support services 75 0 75 Total 660 404 612
Source: BMI, 1992a.
ELECTRONICS SECTOR 87
The precise technological and commercial status of the electronic parts of South African's annaments industry is not easy to determine. Electronics form but one part of a larger weapon system and the quality of the electronics part cannot easily be distinguished. For example, the 'G' series fixed and self propelled howitzer has been judged as leading edge artillery pieces, but these owe much of their success to electro-mechnical engineering and not electronics per se. The same point applies to mobile fighting vehicles successfully exported. South African innovations are cited with respect to two electronic technologies regarded as leading edge: avionics and secure communications. Neither can be regarded as proof of sustainable success. The former contributed to refitting the South African Air Force's ancient Mirage fleet and may continue to have a market in other airforces unable to acquire current generation aircraft. The latter showed real world class ingenuity at the time, but the company making frequency hopping radios now admits it only ranks third or fourth in the world.
The explanation offered by military electronics contractors for the success of South African armaments is that isolated from the rest of the world and under pressure to perform, local designers became virtuosos in applying technology. It is freely admitted that existing technology was exploited, so the basis of competency was in translating existing technology into working systems more rapidly than done elsewhere. Technology was obtained through collaboration with Israel or from North American and European firms in violation of United Nations arms embargoes and national legislation.
The domestic market for military equipment is tighter at any time in the past decade. Domestic military spending has declined in real terms for three years. On the other hand, as South Africa looses its polecat status and becomes more internationally acceptable, local firms will have access to admissible armaments markets. An export strategy has to contend with the following obstacles. With greater acceptability will come the requirement to abide by the 'rules' of the Western defence establishment, under the hegemony of the USA. South Africa is expected to join the Missile Technology Control Regime, policed by the USA and will not have a free hand in selling its armaments, particularly the more sophisticated weapons systems. The arms trade is essentially political and large orders are tied to the granting of concessionary finance or trade credit access to purchaser, which has possibly more to do with the commercial and foreign policy objectives of national governments than with the technical merits of the products in question. South African firms are unable to match the state support their competitors for developed countries can garner. Also the 'battle tested' selling points are, thankfully, out of date.
Military electronics assessment
South Africa has inherited a significant, albeit downscaled military electronic sector with an arguably waning competitiveness. Diversification, particularly into telecommunications, has been the response from private sector military electronics contractors to shrinking markets. Assessing the sectors performance is complicated by the secrecy which pervades it and it is hard to scrutinize it objectively. Significant problems have, nevertheless, been identified with regard to a waning technological edge, domestic
88 INDUSTRIAL STRATEGY PROJECT
market contraction and export constraints driving me to the conclusion that the military electronics sector is no longer dynamic. In the final instance the status of this sector will be largely determined by the country's new defence policy.
Test and measurement
This is the branch of professional electronics which provides equipment essentially for the manufacture of other electronic equipment. Budget Energy Controllers fall into this category and the discussion will proceed to focus on them.
The total market size of this sector for 199i is approximately R220 million (BMI, 1992a). Virtually all the equipment traded in this sector is imported duty free. Foreign instrument makers are represented through agencies. This sector is not highly concentrated.
Budget energy controllers
Details of the functions and the niarket for BECs have been presented in the parallel study on electrical distribution equipment.
When Eskom launched its electrification plan and created a market for BECs many electronics firms saw this development as offering a major stimulus in an otherwise depressed market, and close to a dozen have launched BEC products during 1990—1992. The pool has shrunk but it remains an over traded market with seven active firms, four of them Eskom national contract suppliers. Throughout the short life of the BEC much stress has been put upon the fact that this was an indigenous South African technology. Various metering technologies have been developed, some of which use licensed technology for measurement, but none of these restrict sales of the meters and BEC were accordingly seen as having major export potential. In three years the technology was successfully matured and cheapened by a third through a programme of rationalisation of specifications carried out by Eskom and the intense competition between companies. From the outset the domestic market has been regarded as inadequate and that exports were essential.
With regard to the export potential of BECs, developing countries with similar electrification needs to South Africa have been proposed. BECs are not simply replacements for conventional credit meters, rather they are part of a comprehensive management system for the sale of electricity. Enquiries have been received from many countries and exports are starting to grow.
Internationally, there is no existing pre-paid metering market. To export successfully local firms would need to overcome barriers, particularly in the form of standards used for meters and regulations concerning the manor in which electricity utilities operate. BECs far exceed the cost of conventional meters, but the lower administration costs and elimination of arrears justifies the higher capital cost of installing BECs. In addition other metering technologies exist using intelligent devices against which BEC compete (company interview).
ELECTRONICS SECTOR 89
Two of the leading BEC manufacturers, Plessey Tellumat and Spescom have entered into an agreement to jointly develop their number based system (Weekend Argus 20/293). This action suggest a strategic alliance is being formed by these two firms as market leaders to entrench their technology and put them in a better position to penetrate global markets.
BEC do represent a measure of competency in this sector of the electronics market to develop technology and reduce the price of an item in successive generations. Future development will take this further. Export earnings have failed to meet the initially optimistic estimates, but the potential for significant growth for this sector exists.
Competitiveness of professional electronics
Taking the seven sectors together, common features of their competitiveness, or lack of it, require examining in relation to the determinants of competitive advantage stated earlier.
First, the predominant structure of demand affecting all these sectors is that emanating from the local market and in quite a large part, from the public sector. This study of professional electronics has argued that links to sophisticated customers is an important driving factor for innovation which is not assured in the South African case.
Secondly, it would appear that some parts of the chemical and mineral processing industries have indeed acted as sophisticated customers, but that has not been sustained, nor systematically linked to world markets electronics companies have then begun to exploit. Product and market development strategies employed by firms have an overwhelming domestic focus and are not premised on an export orientation.
Thirdly, electronics firms in South Africa are adequately provided with raw materials they need from the components distribution sector. Allied support industries undertaking plastics conversion and light metal fabrication, in contrast, are regarded as costly and slow.
Fourthly, with regard to manufacturing competence, evidence collected from the capital goods supply sector indicates that electronics firms have recently started to upgrade their production equipment to work with surface mount technology (company interview). As a result it can be deduced that many firms are climbing a learning curve in working with SMT production.
Fifthly, there is evidence to suggest that much attention is being given to the rapid development of systems using ASICs, as indicated by the diffusion of EDA equipment. Aided by the access component distributors now have to ASIC design services, the terms are set for a take off in the use of this important technology. Again South African electronics firms as comparative late-comers have steep learning curves to climb in applying this technology successfully.

90 INDUSTRIAL STRATEGY PROJECT
No single sub-sectors emerge as being thoroughly technologically dynamic with advanced production systems in place, access to componentry and support services at competitive prices, easy access to venture capital and skill labour as well as having invigorating demand from sophisticated customers and established export market channels. That would be idealistic. What does emerge from the above examination is that pockets of competency exists within each sub sector, in short there are firms, or clusters of leading firms that appear to hold a competitive advantage. Sectors suggesting themselves as having segments with the greatest potential for growth, particularly of exports are the power, security and measurement sub-sectors.
Chapter Nine: Policy for the professional electronics industry
Policy objectives for industrial strategy The Industrial Strategy Project undertook research with the objective of identifying problems in South Africa's manufacturing sector and proposing policy on promoting international competitiveness. Four themes informed this mission: policy on employment creation; policy on developing sectors able to cater for the basic needs of the population, exemplified by the electrical distribution equipment sector study in part one of this report; policy on promotion of competitive export industries with a long term viability and policy on encouraging the emergence of internationally competitive manufacturing sectors. The electronics industry has a bearing on all of these areas of industrial policy due to its pervasiveness. In this concluding chapter the implications of evidence presented in this report are drawn together to propose policy on the professional electronics sector. First the industry will be assessed in terms of the four mission areas. Thereafter industrial policy for the sector will be elaborated.
As a contributor to employment creation, in the narrow sense of jobs within the electronic industry, it is disappointing. The industry parts which constitute this study are not labour intensive and have shrunk their employment. Indeed, there is an evident trend towards
reducing numbers still further and automating more of production for technical reasons of miniaturization. Professional electronics, then will not be a significant source of employment in production, nor should policy make that a goal. From a broader perspective the electronics manufacturing industry has an important role in two respects: first, employment growth in downstream activities where electronics technology is applied and secondly, skills development occasioned by the needs of the electronics industry that could have beneficial consequences for human resources more widely. This point is expanded upon below.
As a contributor to the provision of basic needs the electronics industry has only an indirect, albeit important role to play. As a developing country with enormous inequality between Black and White, massive infrastructure building efforts will be required to overcome the legacy of apartheid. A democratic government is most assuredly to direct its efforts to that end. Professional electronics technology will have an enabling part to play in the provision of social and physical infrastructure by virtue of its control and information function in the design, manufacture and installation of works. Electronics more broadly will be used in a multitude of applications in telecommunications, health, education housing and other sectors stimulated by development programmes.
92 INDUSTRIAL STRATEGY PROJECT
As a contributor to manufactured exports the electronics industry is a failure. It runs a large negative trade balance and any expansion in exports that were to narrow the trade balance would be considered a major success. For electronics broadly, including consumer electronics and computer equipment, there is little that can be done to reverse this situation of being a large scale net importer. Existing and potential export growth areas are in specialised and niche products, many of them emanating from the professional sector. In short the electronics industry is highly unlikely to emerge as a major exporting sector and will remain a large importer, but there will be sub-sectors that South African firms have the potential to become export oriented.
As a contributor to promoting the revitalisation and competitive upgrading of South Africa's manufacturing sector, electronics has a major role to play. Through the process of a widespread application of electronic technology conferring benefits on individual firms, the consequent diffusion of these benefits has economy wide effects. Professional electronics has a critical role to play in industrial policy for the whole of the manufacturing sector and indeed wider than the scope of the ISP, focused as it is on manufacturing.
An industrial policy for the professional electronics industry
The thinking that underlies the prescriptive part of this report is animated by the argument that the application and diffusion of innovations in electronics technology confers greater benefits than innovations in other industries. The policy implications that flow from this are that stress should lie on the application of electronics technology. Therefore the industrial policy that flows from these propositions is focused on what will make the professional electronics industry better able to diffuse into other sectors of the economy. The objectives of an industrial policy for the professional electronics industry are to stimulate the industry in ways that will enhance productivity by the application of its technology in other industries.
Consideration has to be given to the specific circumstances of the country's professional electronics industry. As this report has shown there are very serious problems with this industry yet there are signs of vitality too. On the negative side it exhibits a number of serious weaknesses in technology development, an inward and not outward export orientating, a high cost structure relative to competitor countries and lacks any clearly competitive sub-sectors. Against this on the positive side it exhibits pockets of innovation, has been successful in developing solutions for local conditions, has begun to adopt advanced design and production technologies and has export successes in niche products.
Judged against the previously stated objectives for industrial policy, the professional electronics industry is not, and unlikely to become a leading sector of manufacturing industry. The industry is not a candidate for a grand growth plan, nor can large scale support requiring the diversion of large amounts of resources be justified, as they have been historically, in strategic terms. As consequence, only small scale intervention is justifiable for the policies to be explained below. Those sub-sectors where competitiveness
ELECTRONICS SECTOR 93
exists should survive and prosper, others will fail. It is accepted that certain sub-sectors will contract further and painful as it is to see jobs being lost, this is a necessary consequence of the restructuring that needs to take place. Due to the stress that has been placed on the benefits of the application of electronics technology in this report it becomes important to state a corrective point. Production and application are essentially complementary activities, and an over emphasis on either will undermine the beneficial interaction between the two. Moreover, the competencies required for successful application are enhanced by involvement in the three critical stages of conceptualization, design and production. As much as this report is implicitly arguing for the professional electronics industry to abandon production activities the country is no longer competitive in, it is arguing for production to be expanded in competitive sub-sectors.
The policy that is proposed for the professional electronics industry has three parts. First, policy on promoting technology diffusion. Secondly, policy to promote international integration of the electronics industry. Thirdly, a number of functional interventions concerning the following: human resource development; SME support measures; technology development measures and environmental protection measures.
Policy on technology diffusion This study has argued that failing of the innovation, or more properly, the technology development system in South Africa has been a neglect of measures to promote diffusion. Therefore the first aspect of policy is measures to promote the diffusion of electronics technology. This does not imply neglecting technology generation in such a policy, as the two processes need to be coupled to be successful. Specific measures to promote technology generation are discussed below.
The primary goal of a technology diffusion policy for the electronics industry needs to be the enhancement of productivity and competitiveness of other dynamic sectors. If successful, the professional electronics industry itself would become driven by sophisticated and demanding user requirements. The virtuous circle so conceived would shape and grow the industry in accordance with growing markets . Lest this be seen as a focus on the domestic market it misconstrues the notion of sophisticated and demanding users. Demanding users exist in at least three fonns: first, local companies which are already export oriented mainly in the primary sectors such as mining and pulp and paper. Secondly, through international partnerships or supply relationships, the export of auto- electronics discussed in this report being an example. Thirdly, in local large scale purchasers which set cost and performance targets, the BEC story being and example. In all these instances there is a domestic demand that extends into international markets, consequently this is not a strategy focused on an insulated domestic market.
Designing a suitable diffusion programme for South Africa needs to take cognizance of international experience. Experience from OECD countries' technology diffusion programmes point to the following characteristics of direct intervention measures:
94 INDUSTRIAL STRATEGY PROJECT
Effective technology transfer measures use broad-based counselling, consulting and extension services. Untargeted information dissemination has been found to be inefficient.
Technology diffusion is enhanced by firm based human resource development activities.
Intermediary third-party bodies and technological institutions can facilitate technology transfer programmes (Arnold and Guy, 1992). In developing a best practice approach for diffusion policies, the authors identify three areas for attention.
First, programme goals need to be framed by a through understanding of the nature of the problem, and of users business as well as technology needs. Monitoring a programme requires that goals when identified be systernatised, measurable and attainable.
Secondly, implementation requires a programme design that builds on the experience of other technology diffusion programmes to create a coherent and tested mechanism for diffusion. The scale of resources needs to be appropriate to tackle size of the problem. To be effective firms of different sizes need different policy instruments and resources.
Experience shows that people-embodied technology transfer mechanisms, such as
personnel loans, secondments and field experience, to be the most effective but also the most costly. Strategic considerations warrant a country maintaining capabilities in emerging technologies, the authors suggest. While that is feasible for developed countries with well established technical and scientific infrastructure, it is not the case for
developing countries. South Africa does not have the resources to spare on risky emerging technologies. Immature technology is not suitable for wide diffusion and policy should focus on mature technologies, except in areas of proven technological leadership. The appropriate model to follow for South Africa is to become a 'nimble follower' adroit at adopting technology and not aspire to be at the leading edge.
Thirdly, user concerns need to be fully appreciated by policy makers, since successful diffusion needs to dovetail with users' business priorities and need a commitment from senior management (Arnold and Guy, 1992:20—23). Technology demonstration projects are effective when they show incremental changes in realistic applications where a clear commercial advantage can be perceived by potential adopters.
Technology diffusion may be facilitated through the provision of assistance to firms to implement technology transfer where there are shortages of engineering skills and choice- of-technique knowledge. This is envisaged in two forms, first, through consultancy programmes and secondly, through an industrial extension services.
A scheme to provide subsidised consultancy services to all sectors of manufacturing industry is envisaged for medium or larger enterprises. The scheme would operate by subsidising the engagement of recognised consultants by firms on a matching fee basis for the purpose of evaluating the suitability of applying electronics technology to their business.
ELECTRONICS SECTOR 95
Small firms require more focused support for problems they experience in technology development, production upgrading and market intelligence. Policy in regard is needed to assist firms overcome information failure by providing them with information about technical choice, assistance with patent searches, and providing pooled market research information.
An Industrial Extension Service is envisaged as being a administered by the industrial division of the DTI and staffed with suitably qualified technocratic staff.
The brief of the subsidised consultants and industrial extension services should include the requirement to address internal firm structure and work practice matters. State sponsored support services should explicitly examine human resource practices and institutional structures to advise on best practice methods of work organisation. Social organisation or 'soft technologies' are frequently more significant to enhancing productivity than new equipment.
Repeated references have been made to the importance of people in technology diffusion and the need to remove institutional obstacles, often the main barriers to achieving effective applications of new technology. The participation of trade unions in technology application programmes is essential and the have a central role to play in shaping the reorganisation of the workplace to facilitate the application of new technology as well as to safeguard the interest of workers caught up in change.
Policy on international integration South Africa's electronics industry needs to become more fully internationally integrated to obtain leading edge technology and world priced components and subsystems. The orientation of the industry needs to shift from a domestic focus to take a more global view.
International integration requires action on three fronts. It would entail modification to the trade regime by applying a phased reduction in tariffs on equipment and components (where these still apply).
Access to foreign technology is essential, thus an important feature of promoting international integration would be to put in place measures to facilitate firms acquiring leading edge, or technologically appropriate, near leading edge technology. International trends appear to be hostile to the acquisition of advanced technology by developing countries. As Chapter Two has pointed out, the barriers to entry with respect to R&D are showing a tendency to rise, and South African firms may find increasing difficulty in their technology sourcing activity.
Finally, attention needs to be directed to the potential for South African firms to enter into cooperative network relations with other firms. The experience of competition and cooperation in the domestic market has thrown up few examples of strategic alliances, and the research failed to uncover any relationships between local and foreign firms that would qualify as strategic alliances. Yet cooperative networks have been identified as a new
96 INDUSTRIAL STRATEGY PROJECT
mode of competition in the electronics industry and a significant mechanism for established firms to block new entrants. Research shows that most cooperative networks group together firms of comparable status. Therefore firms in other developing countries may be most suitable for South African firms to contemplate as candidates for cooperative relations. While this may mean the country can only achieve links with 'second tier' players, since what is being sought are complementary strengths to address similar
problems this may be advantageous.
There are few policy mechanisms available to promote private companies acquiring state of the art technology or entering into technology enhancing cooperative alliances. One mechanism for which there are several successful country examples, such as Australia, concerns the localizing of R&D activities. The policy requires trans national corporations and foreign firms without a local design facility who wish to undertake large projects to indigenise part of their R&D activities, while simultaneously lifting local production requirements so much of the manufacture may occur off shore. The policy is most applicable to large scale projects in the public sector where the market is sufficient to attract foreign firms willing to locate some of their R&D work in the country. This policy invariable results in high levels of equipment imports, but at the same time has expanded local design activities and helped create advanced products for export. A policy of indigenising research and development is compatible with market development goals for local firms by creating opportunities for partnerships. The above measures proposed for the electronics industry should themselves conform to an overall framework for a South African science and technology policy and be adapted where necessary.
Greater competitive pressures upon the local electronics industry, certainly with respect to trade, will be result from a policy of increasing international integration. A strategic response by local firms to such pressures would be to raise their own competitive status and enter into intra firm co-operation agreements. Resources required to compete, even in the domestic markets, are rising, hence cooperative agreements represent a mechanism firms may use to overcome scale barriers.
Functional interventions for the electronics industry Many weaknesses and problem areas have been identified in this report. Three functional interventions to address specific problem areas are outlined below.
R&D support
Electronics is a high technology industry characterised by rapid technological change. Firms that fall to innovate will lose competitiveness. This report has presented evidence to show South Africa's electronics firms under resource innovation efforts, and that large firms spend proportionally less than small firms on R&D.
ELECTRONICS SECTOR 97
Measures to stimulate innovation activities within firms are therefore essential. Funding innovative activity by means of matching grants, as provided for under the DTI funded Innovation Scheme for Electronics administered by the IDC should be continued with two modifications. First, the scope of the scheme should be widened to include software development and system integration research. Secondly, the administration of the scheme should be improved to make approval more responsive and reporting on work done easier. The electrical distribution industry study argued for a similar scheme with a much wider brief to support innovation in industry.
With regard to public and private electronic design services, emphasis needs to be given to the promotion of a 'total system' design philosophy to capitalise on the higher valued added inherent in such systems. This is particularly significant for professional electronics, as the value of individual sub-systems is low compared to the total system. Measures to subsidise the engagement of consultancy services, contemplated above, would be a means to encourage the wider use custom semi-conductor devices and a systems design philosophy.
Existing relations between industry and tertiary institutions need to be evaluated by both parties to examine ways that better use can be made of institutions for genuine R&D work, not simply using universities as subsidised laboratories. Collaborative research and contracting universities to undertake research needs to recognise the essential differences between academic research and commercially driven product development, where academic research necessarily focuses on problems without regard to commercial considerations. The development of links is helped by the fact that most electronics companies are located in centers where tertiary institutions teaching electrical engineering and related disciplines are also located: the PWV, Durban region and Cape Town region.
Human resources development
This study has argued that a policy of human resource development for the electronics industry could have significant beneficial spillovers for the skills level of the metals sector, as a science, engineering and technology training strategy for the electronics industry could be used to upgrade the technological skills level of other sectors. This requires specific attention to the skill requirements of the industry as well as programme for instituting continuous upgrading of the high level skills.
The essential features of a human resources policy which operates at distinct levels has been outlined in Chapter Seven. At the first basic level is the need for institutional assistance to electronics companies to run their own in-house training for operators. It is therefore proposed that an electronics technology training support service, financed by training levies and education budget subsidies administered by the National Department of Education's vocational training wing be established.
The educational goal of the curicula for electronics training support should be to develop a generic knowledge of electronics to upgrade general technical skills. The training should adopt an approach which stresses the development of generic skills and problem solving
98 INDUSTRIAL STRATEGY PROJECT
rather than how to operate a particular commercial product range, the latter being the preserve of company training programmes. Particular attention needs to be directed to the
development of software skills. The second level of training is for technicians, senior operators and artisans who intersperse on the job training with study at a technical college.
Advanced technical and high level professional skills are the third and forth levels that require ongoing firm based training to develop and redevelop new skills as technology changes. Such training and retraining needs to be developed in conjunction with universities, technikons and state sponsored science and technology institutes.
Environment, health and safety
The use of ozone depleting substances by electronics manufacturers, CFC—1 13 in particular, has been found to be a small, but still significant environmental problem. As the volume of electronics production in South Africa has been small, the electronic industry has never been a major consumer compared to other industrial users, however, environmental awareness and product acceptability in export markets has made this an issue requiring action.
Policy to facilitate the phasing out of CFC—1 13 could be twofold. First the outright prohibition of imports would not be disruptive, given the real availability of alternatives. Secondly, the study has highlighted the lack of awareness of alternative cleaning technologies, particularly among small firms. This calls for the dissemination of technical information on CFC—1 13 alternatives through public research bodies such as the CS JR.
Industry associations could also play a potentially useful role in facilitating the diffusion of knowledge of alternative cleaning technology, particularly as the main impetus for
change has been identified as export acceptance. Growth in exports would assist financing the higher costs firms would bare in making the transition to cleaner technologies.
Production workers are exposed to a range of potential health risks. Short term improvements in this area require attention of trade unions through their health and safety departments to minimise exposure risks in cooperation with employers. Minimum standards laid down in regulatory legislation need to be monitored and revised to bring them into line with current practices in this fast changing industry.
Conclusion
The professional electronics industry is neither faced with extinction nor poised for rapid growth. This study has identified a host of weakness, yet there are also areas of competence in design and in the application of electronics technology. Policy on this
industry has proposed steps to increase its exposure to international markets, functional interventions to deal with critical weakness and policy on promoting the diffusion of electronics technology. If these are successful, there is hope that the electronics industry may realise its key role as an enabling technology by contributing to boosting the international combativeness of South Africa's manufacturing sector.
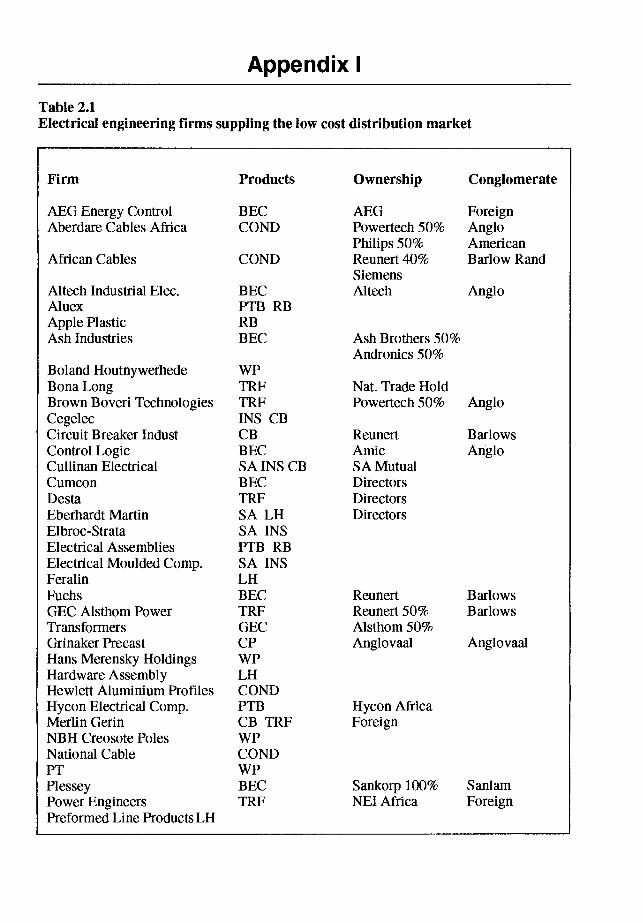
Appendix I
Table 2.1 Electrical engineering firms suppling the low cost distribution market
Firm Products Ownership Conglomerate
AEG Energy Control BEC AEG Foreign Aberdare Cables Africa COND Powertech 50% Anglo
Philips 50% American African Cables COND Reunert 40% Barlow Rand
Siemens Altech Industrial Elec. BEC Altech Anglo Aluex PTB RB Apple Plastic RB Ash Industries BEC Ash Brothers 50%
Andronics 50% Boland Houtnywerhede WP Bona Long TRF Nat. Trade Hold Brown Boveri Technologies TRF Powertech 50% Anglo Cegelec INS CB Circuit Breaker Indust CB Reunert Barlows Control Logic BEC Arnie Anglo Cullinan Electrical SA INS CB SA Mutual Cumcon BEC Directors Desta TRF Directors Eberhardt Martin SA LII Directors Elbroc-Strata SA INS Electrical Assemblies PTB RB Electrical Moulded Comp. SA INS Feralin LH Fuchs BEC Reunert Barlows GEC Aisthom Power TRF Reunert 50% Barlows Transformers GEC Alsthom 50% Grinaker Precast CP Anglovaal Anglovaal Hans Merensky Holdings WP Hardware Assembly LII Hewlett Aluminium Profiles COND Hycon Electrical Comp. PTB Hycon Africa Merlin Germ CB TRF Foreign NBH Creosote Poles WP National Cable COND PT WP Plessey BEC Sankorp 100% Sanllarn Power Engineers TRF NET Africa Foreign Preformed Line Products LH
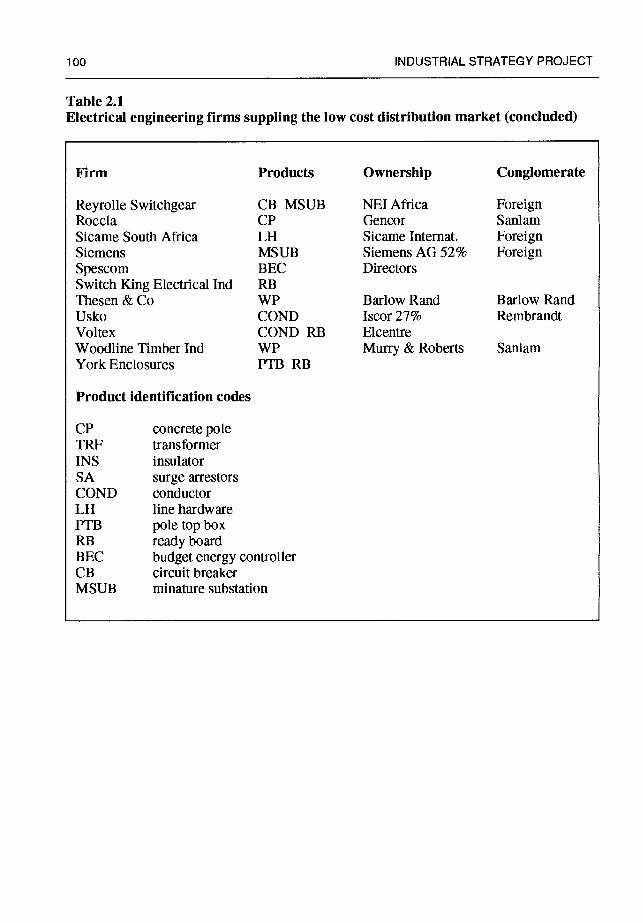
100 INDUSTRIAL STRATEGY PROJECT
Table 2.1 Electrical engineering firms suppling the low cost distribution market (concluded)
Firm Products Ownership Conglomerate
Reyrolle Switchgear C13 MSUB NEI Africa Foreign Roccia CP Gencor Sanlain Sicame South Africa LII Sicame Internat. Foreign Siemens MSUB Siemens AG 52% Foreign Spescom BEC Directors Switch King Electrical md RB Thesen & Co WP Barlow Rand Barlow Rand Usko COND Iscor 27% Rembrandt Voltex COND RB Elcentre Woodline Timber md Muny & Roberts Sanlarn York Enclosures PTB RB
Product identification codes
CP concrete pole TRF transformer INS insulator SA surge arrestors COND conductor LH line hardware PTB pole top box RB ready board BEC budget energy controller CB circuit breaker MSUB minature substation
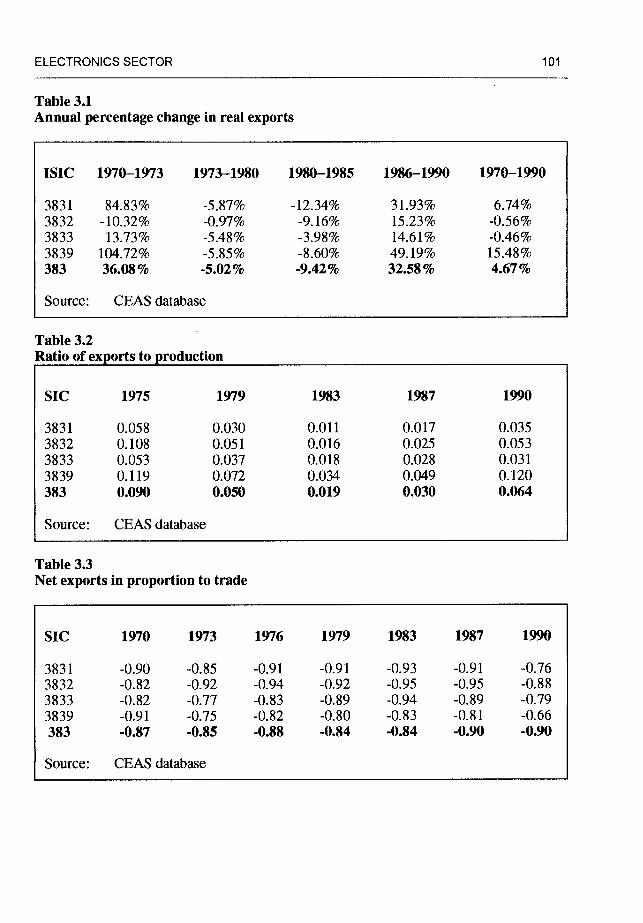
ELECTRONICS SECTOR 101
Table 3.1 Annual percentage change in real exports
ISIC 1970—1973 1973—1980 1980—1985 1986—1990 1970—1990
3831 84.83% -5.87% 3832 -10.32% -0.97% 3833 13.73% -5.48% 3839 104.72% -5.85% 383 36.08% -5.02%
-12.34% -9.16% -3.98% -8.60% -9.42%
31.93% 15.23% 14.61% 49.19% 32.58%
6.74% -0.56% -0.46% 15.48% 4.67%
Source: CEAS database
Table 3.2 Ratio of exports to production
SIC 1975 1979 1983 1987 1990
3831 0.058 0.030 3832 0.108 0.051 3833 0.053 0.037 3839 0.119 0.072 383 0.090 0.050
0.011 0.016 0.018 0.034 0.019
0.017 0.025 0.028 0.049 0.030
0.035 0.053 0.031 0.120 0.064
Source: CEAS database
Table 3.3 Net exports in proportion to trade
SIC 1970 1973 1976 1979 1983 1987 1990
3831 -0.90 -0.85 3832 -0.82 -0.92 3833 -0.82 -0.77 3839 -0.91 -0.75 383 -0.87 -0.85
-0.91 -0.94 -0.83 -0.82 -0.88
-0.91 -0.92 -0.89 -0.80 -0.84
-0.93 -0.95 -0.94 -0.83 -0.84
-0.91 -0.95 -0.89 -0.81 -0.90
-0.76 -0.88 -0.79 -0.66 -0.90
Source: CEAS database
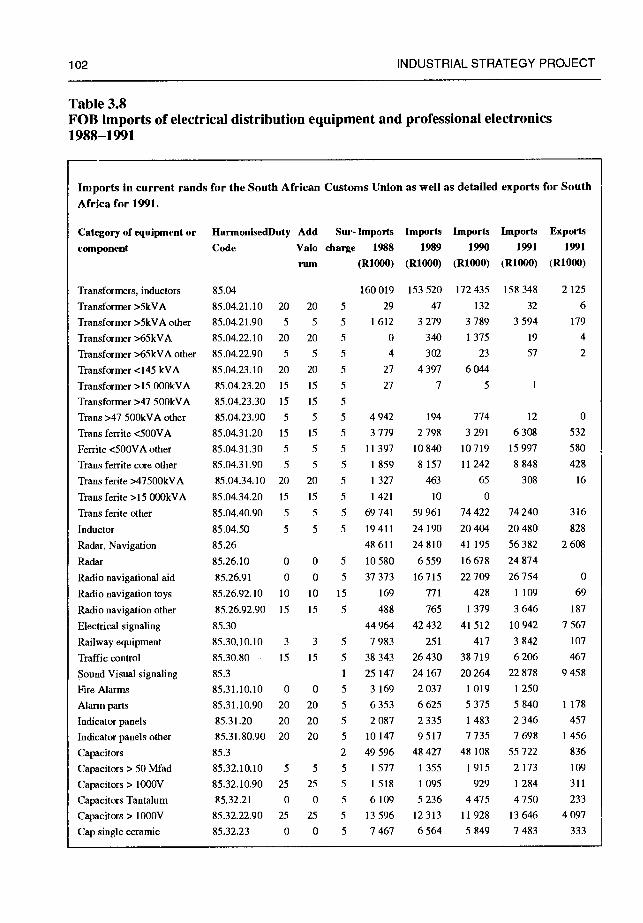
102 INDUSTRIAL STRATEGY PROJECT
Table 3.8 FOB imports of electrical distribution equipment and professional electronics 1988—1991
Imports in current rands for the South African Customs Union as well as detailed exports for South Africa for 1991.
Category of equipment or HarmonisedDuty Add Sur- Imports Imports Imports Imports Exports
component Code Valo charge 1988 1989 1990 1991 1991
rum (R1000) (R1000) (R1000) (R1000) (R1000)
Transformers, inductors 85.04 160 019 153 520 172 435 158 348 2 125
Transformer >5kVA 85.04.21.10 20 20 5 29 47 132 32 6 Transformer >5kVA other 85.04.21.90 5 5 5 1 612 3 279 3 789 3 594 179
Transformer >65kVA 85.04.22.10 20 20 5 0 340 1 375 19 4
Transformer >65kVA other 85.04.22.90 5 5 5 4 302 23 57 2
Transformer <145 kVA 85.04.23.10 20 20 5 27 4397 6 044
Transformer >15 000kVA 85.04.23.20 15 15 5 27 7 5
Transformer >47 500kVA 85.04.23.30 15 15 5
Trans >47 500kVA other 85.04.23.90 5 5 5 4942 194 774 12 0
Transferrite<500VA 85.04.31.20 15 15 5 3779 2798 3291 6308 532
Ferrite <SOOVAother 85.04.31.30 5 5 5 11397 10840 10719 15997 580
Trans ferrite core other 85.04.31.90 5 5 5 1 859 8 157 11242 8848 428
Trans ferite >47500kVA 85.04.34.10 20 20 5 1327 463 65 308 16
Transferite>15000kVA 85.04.34.20 15 15 5 1421 10 0
Trans ferite other 85.04.40.90 5 5 5 69741 59961 74422 74240 316
Inductor 85.04.50 5 5 5 19411 24190 20404 20480 828
Radar, Navigation 85.26 48611 24810 41195 56382 2608
Radar 85.26.10 0 0 5 10580 6559 16678 24874
Radio navigational aid 85.26.91 0 0 5 37 373 16715 22709 26754 0 Radio navigation toys 85.26.92.10 10 10 15 169 771 428 1109 69
Radio navigation other 85.26.92.90 15 15 5 488 765 1 379 3 646 187
Electrical signaling 85.30 44964 42 432 41 512 10942 7 567
Railwayequipment 85.30.10.10 3 3 5 7983 251 417 3842 107
Trafficcontrol 85.30.80 15 15 5 38343 26430 38719 6206 467
Sound Visual signaling 85.3 1 25 147 24 167 20 264 22 878 9 458
FireAlarms 85.31.10.10 0 0 5 3169 2037 1019 1250
Alarmparts 85.31.10.90 20 20 5 6353 6625 5375 5840 1178
Indicator panels 85.31.20 20 20 5 2087 2335 1483 2346 457
Indicator panels other 85.31.80.90 20 20 5 10 147 9517 7 735 7698 1 456
Capacitors 85.3 2 49 596 48 427 48 108 55 722 836
Capacitors >50 Mfad 85.32.10.10 5 5 5 1 577 1 355 1 915 2 173 109
Capacitors> 1000V 85.32. 10.90 25 25 5 1 518 1 095 929 1 284 311
Capacitors Tantalum 85. 32.21 0 0 5 6 109 5 236 4 475 4 750 233
Capacitors>1000V 85.32.22.90 25 25 5 13596 12313 11928 13646 4097
Cap single ceramic 85.32.23 0 0 5 7467 6564 5 849 7483 333
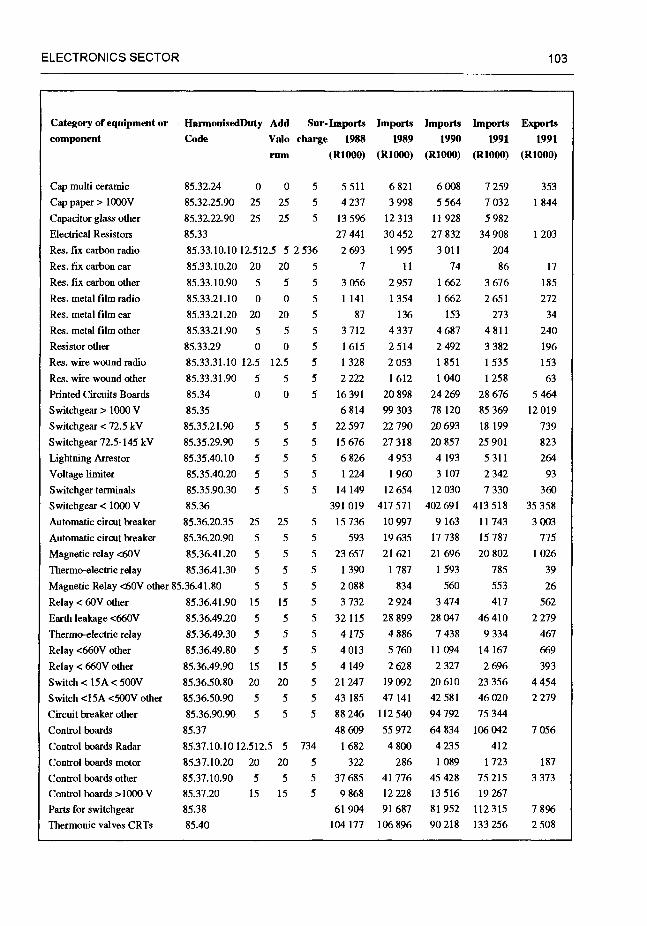
Category of equipment or HannonisedDuty Add Sur- Imports Imports Imports Imports Exports Code Valo charge 1988 1989 1990 1991 1991
rum (R1000) (R1000) (R1000) (R1000) (R1000)
Cap multi ceramic
Cap paper> 1000V
Capacitor glass other
Electrical Resistors
Res. fix carbon radio
Res. fix carbon car Res. fix carbon other
Res. metal film radio
Res. metal film car Res. metal film other Resistor other Res. wire wound radio
Res. wire wound other
Printed Circuits Boards
Switchgear> 1000 V Switchgear < 72.5 kV
Switchgear 72.5-145 kV
Lightning Arrestor
Voltage limiter
Switchger terminals
Switchgear < 1000 V Automatic circut breaker
Automatic circut breaker
Magnetic relay <60V
Thernio-electric relay Magnetic Relay <60V other
Relay < 60V other
Earth leakage <660V
Thermo-electric relay Relay <660V other
Relay < 660V other Switch < 15A < 500V
Switch <15A <500V other
Circuit breaker other
Control boards
Control boards Radar
Control boards motor
Control boards other Control boards >1000 V
Parts for switchgear Thermonic valves CRTs
85.32.24 0 0 5
85.32.25.90 25 25 5 85.32.22.90 25 25 5 85.33
85.33.10.10 12.512,5 5 2536 85.33. 10.20 20 20 5 85.33. 10.90 5 5 5 85.33.21.10 0 0 5 85.33.21.20 20 20 5
85.33.21.90 5 5 5
85.33.29 0 0 5
85.33.31.10 12.5 12.5 5
85.33.31.90 5 5 5
85.34 0 0 5
85.35
85.35.21.90 5 5 5
85.35.29.90 5 5 5
85.35.40.10 5 5 5
85.35.40.20 5 5 5
85.35.90.30 5 5 5
85.36
85.36.20.35 25 25
85.36.20.90 5 5
85.36.41.20 5 5
85.36.41.30 5 5
85.36.41.80 5 5
85.36.41.90 15 15
85.36.49.20 5 5
85.36.49.30 5 5
85.36.49.80 5 5
85.36.49.90 15 15
85.36.50. 80 20 20
85,36.50.90 5 5
85.36.90.90 5 5
85.37
5511 6821 6008 7259 4237 3998 5564 7032
13596 12313 11928 5982
27441 30452 27832 34908
2693 1995 3011 204
7 11 74 86
3056 2957 1662 3676
1141 1354 1662 2651
87 136 153 273
3712 4337 4687 4811
1615 2514 2492 3382
1328 2053 1851 1535
2222 1612 1040 1258
16391 20898 24269 28676
6814 99303 78120 85369
22597 22 790 20693 18 199
15676 27318 20857 25901
6826 4953 4193 5311
1224 1960 3107 2342
14149 12654 12030 7330
391019 417571 402691 413518
5 15736 10997 9163 11743
5 593 19635 17738 15787
5 23657 21621 21696 20802
5 1390 1787 1593 785
5 2088 834 560 553 5 3732 2924 3474 417
5 32115 28899 28047 46410 5 4175 4886 7438 9334
5 4013 5760 11094 14167
5 4149 2628 2327 2696
5 21247 19092 20610 23356
5 43185 47141 42581 46020
5 88246 112540 94792 75344
48609 55972 64834 106042
353
1 844
1 203
17
185
272
34
240 196
153
63
5 464 12019
739 823
264
93
360
35 358 3 003
775
1 026 39
26
562
2279
467
669
393 4454
2279
7 056
187
3 373
7 896 2508
ELECTRONICS SECTOR 103
component
85.37.10.10 12.512,5 5 734 1 682 4800 4235 412
85.37. 10.20 20 20 5 322 286 1 089 1 723
85.37.10.90 5 5 5 37685 41776 45428 75215
85.37.20 15 15 5 9868 12228 13516 19267
85.38 61904 91687 81952 112315
85.40 104177 106896 90218 133256
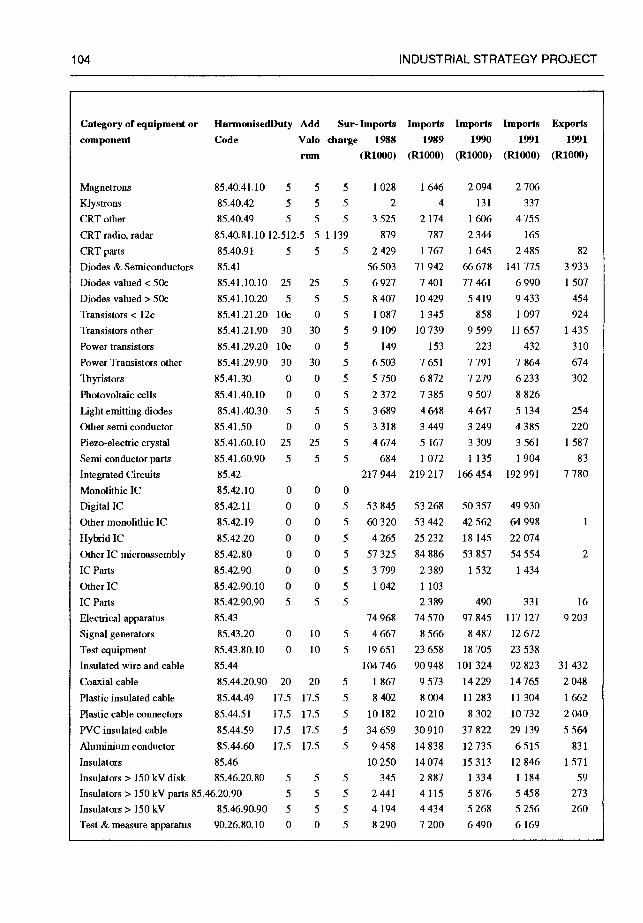
104 INDUSTRIAL STRATEGY PROJECT
Category of equipment or
component HarmonisedDuty Add Sur- Imports Imports Imports Imports Exports Code Valo charge 1988 1989 1990 1991 1991
rwn (R1000) (R1000) (R1000) (R1000) (R1000)
Magnetrons
Klystrons CRT other
CRT radio, radar
CRT parts Diodes & Semiconductors
Diodes valued < SOc
Diodes valued > 50c
Transistors < 1 2c
Transistors other
Power transistors
Power Transistors other
Thyristors Photovoltaic cells
Light emitting diodes
Other semi conductor
Piezo-electric crystal Semi conductor parts
Integrated Circuits
Monolithic IC
Digital IC Other monolithic IC
Hybrid IC
Other IC microassembly IC Parts
Other IC IC Parts
Electrical apparatus
Signal generators Test equipment Insulated wire and cable Coaxial cable
Plastic insulated cable Plastic cable connectors
PVC insulated cable
Aluminium conductor
Insulators
Insulators> 150 kV disk
85.40.41.10 5 5 5
85.40.42 5 5 5
85.40.49 5 5 5
85.40.81.10 12.512,5 5 1139 85.40.91 5 5
85.41
85.41.10.10 25 25
85.41.10.20 5 5
85.41.21.20 lOc 0 85.41.21.90 30 30
85.41.29.20 lOc 0 85.41.29.90 30 30
85.41,30 0 0
85.41.40.10 0 0 85.41.40.30 5 5
85.41.50 0 0 85.41.60.10 25 25
85.41.60.90 5 5
85.42
85.42.10 0 0 85.42.11 0 0
85.42.19 0 0 85.42.20 0 0
85.42.80 0 0 85.42.90 0 0
85.42.90.10 0 0
85.42.90.90 5 5 85.43
85.43.20 0 10
85.43.80. 10 0 10
85.44
85.44.20.90 20 20
85.44.49 17.5 17.5
85.44.51 17.5 17.5
85.44.59 17.5 17.5
85.44.60 17.5 17.5
85.46
85.46.20.80 5 5
1028 1646 2094 2706 2 4 131 337
3525 2174 1606 4755
879 787 2 344 165
5 2 429 1 767 1 645 2 485
56503 71942 66678 141775
5 6927 7401 77461 6990
5 8407 10429 5419 9433
5 1 087 1 345 858 1 097
5 9109 10739 9599 11657
5 149 153 223 432
5 6503 7651 7791 7864
5 5 750 6 872 7 279 6 233 5 2372 7385 9507 8826
5 3689 4648 4647 5134
5 3318 3449 3249 4385
5 4674 5167 3309 3561
5 684 1 072 1135 1 904
217944 219217 166454 192991
0
5 53845 53268 50357 49930
5 60320 53442 42562 64998
5 4265 25232 18145 22074
5 57325 84886 53857 54554
5 3 799 2389 1 532 1 434
5 1042 1103
5 2389 490 331
74968 74570 97845 117 127
5 4667 8566 8487 12672
5 19651 23658 18705 23538 104746 90948 101324 92823
5 1 867 9573 14229 14765
5 8 402 8 004 11 283 11 304
5 10182 10210 8302 10732 5 34659 30910 37822 29139
5 9458 14838 12735 6515
10250 14074 15313 12846 5 345 2887 1 334 1184
5 2441 4115 5876 5458
5 4194 4434 5268 5256
5 8 290 7 200 6490 6 169
82
3 933
1 507
454
924 1 435
310
674
302
254
220
1 587
83
7 780
16
9 203
31 432
2048
1 662
2040 5 564
831
1 571
59
273 260
2
Insulators> 150 kV parts 85.46.20.90 5 5
Insulators> 150 kV 85.46.90.90 5 5
Test & measure apparatus 90.26.80.10 0 0
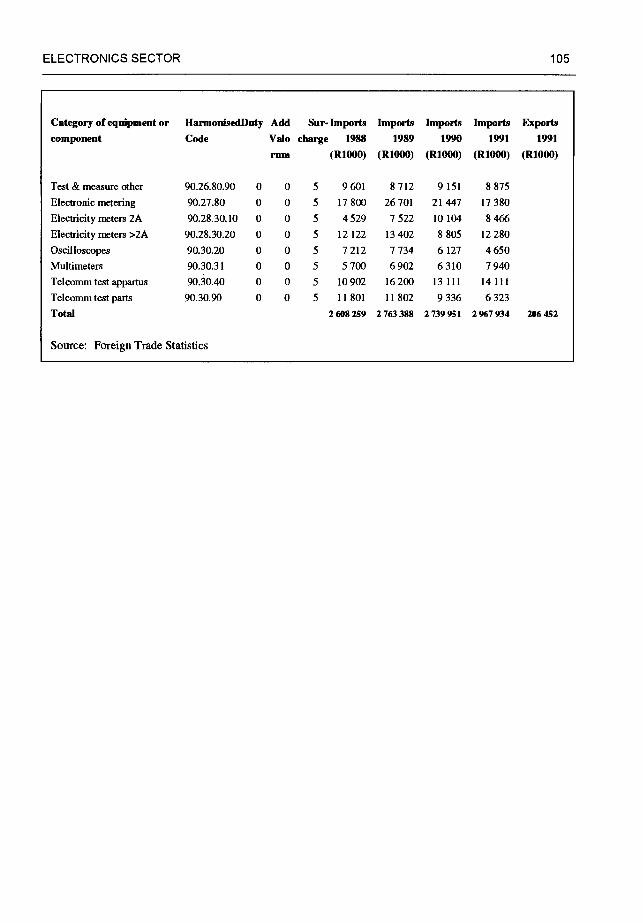
ELECTRONICS SECTOR 105
Category of equipment or HannonisedDuty Add Sur- Imports Imports Imports Imports Exports component Code Valo charge 1988 1989 1990 1991 1991
rum (R1000) (R1000) (R1000) (R1000) (R1000)
Test & measure other 90.26.80.90 0 0 5 9601 8712 9 151 8 875
Electronic metering 90.27.80 0 0 5 17 800 26701 21 447 17 380
Electricity meters 2A 90.28.30.10 0 0 5 4529 7522 10 104 8 466
Electricity meters >2A 90.28.30.20 0 0 5 12 122 13 402 8 805 12 280
Oscilloscopes 90.30.20 0 0 5 7 212 7 734 6 127 4650 Multimeters 90.30.31 0 0 5 5 700 6902 6 310 7 940
Telcommtestappartus 90.30.40 0 0 5 10902 16200 13 111 14111 Telcomm test parts 90.30.90 0 0 5 11 801 11 802 9 336 6 323
Total 2 608 259 2 763 388 2 739 951 2 967 934 206 452
Source: Foreign Trade Statistics
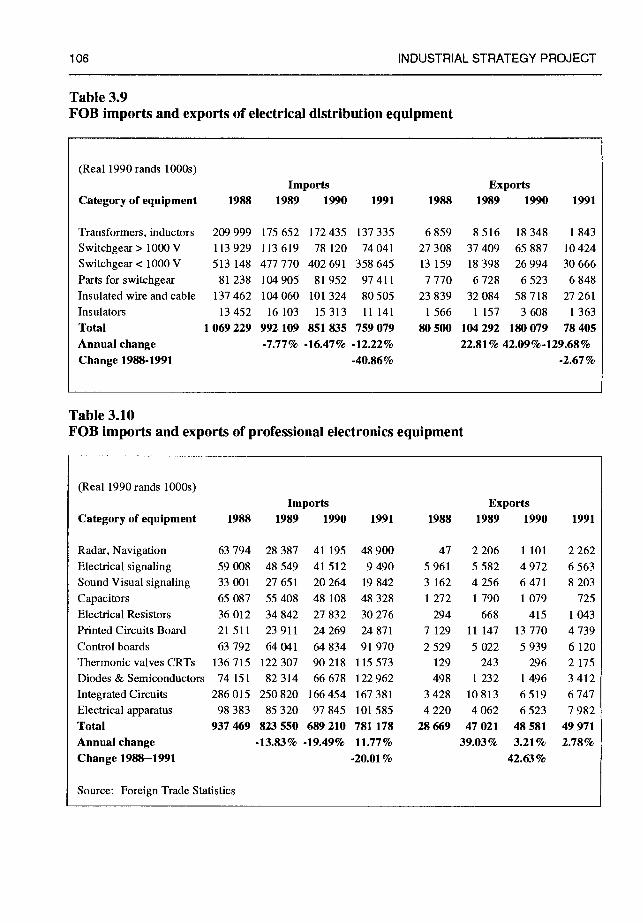
106 INDUSTRIAL STRATEGY PROJECT
Table 3.9 FOB imports and exports of electrical distribution equipment
Table 3.10 FOB imports and exports of professional electronics equipment
Source: Foreign Trade Statistics
(Real 1990 rands l000s)
Category of equipment Imports
1988 1989 1990 1991 Exports
1988 1989 1990
Transformers, inductors
Switchgear> 1000 V Switchgear < 1000 V Parts for switchgear Insulated wire and cable Insulators Total Annual change Change 1988-1991
209 999 113 929 513 148 81 238
137 462 13 452
1 069 229
1991
175 652 113 619 477 770 104905 104060
16 103 992 109 -7.77%
172435 137335 78120 74041
402691 358645 81952 97411
101324 80505 15313 11141
851 835 759 079 -16.47% -12.22%
-40.86%
6 859 27 308 13 159 7 770
23 839 1 566
80 500
8516 18348 1843 37409 65887 10424 18398 26994 30666 6728 6523 6848
32084 58718 27261 1157 3608 1363
104292 180079 78405 22.81% 42.09%-129.68%
-2.67%
(Real 1990 rands l000s) Imports Exports
Category of equipment 1988 1989 1990 1991 1988 1989 1990 1991
Radar, Navigation 63 794 28 387 41195 48 900 47 2 206 1101 2 262 Electrical signaling 59 008 48 549 41 512 9 490 5 961 5 582 4 972 6 563 Sound Visual signaling 33 001 27 651 20 264 19 842 3 162 4 256 6 471 8 203
Capacitors 65 087 55 408 48 108 48 328 1 272 1 790 1 079 725 Electrical Resistors 36 012 34 842 27 832 30 276 294 668 415 1 043 PrintedCircuitsBoard 21511 23911 24269 24871 7129 11147 13770 4739 Control boards 63 792 64 041 64 834 91 970 2 529 5 022 5 939 6 120 ThermonicvalvesCRTs 136715 122307 90218 115573 129 243 296 2175
Diodes & Semiconductors 74 151 82314 66 678 122 962 498 1 232 1 496 3 412
IntegratedCircuits 286015 250820 166454 167381 3428 10813 6519 6747
Electrical apparatus 98 383 85 320 97 845 101 585 4 220 4 062 6 523 7 982
Total 937469 823550 689210 781178 28669 47021 48581 49971 Annual change -13.83% -19.49% 11.77% 39.03% 3.21% 2.78%
Change 1988—1991 -20.01% 42.63%
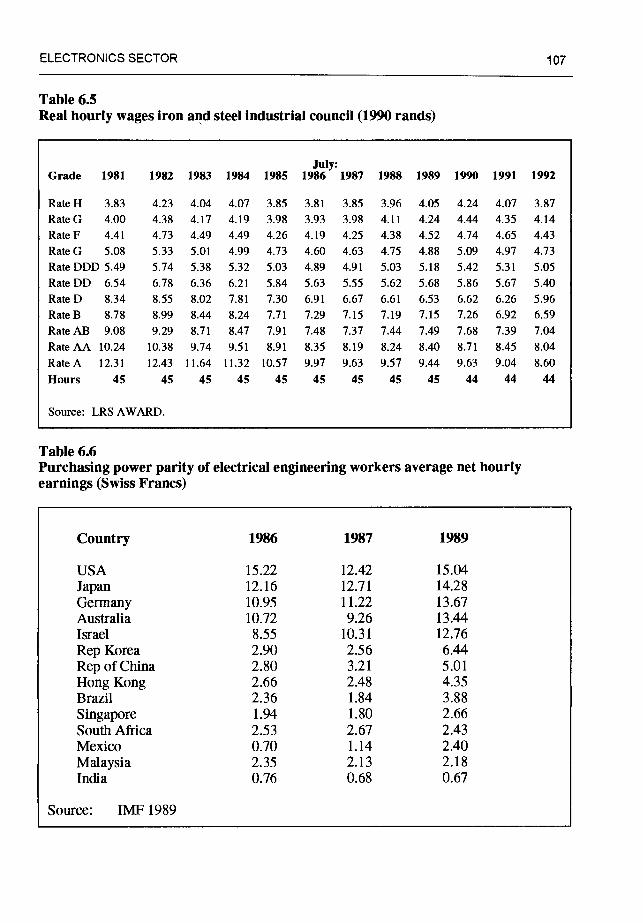
ELECTRONICS SECTOR 107
Table 63 Real hourly wages iron and steel industrial council (1990 rands)
July: Grade 1981 1982 1983 1984 1985 1986 1987 1988 1989 1990 1991 1992
Rate H 3.83 4.23 4.04 4.07 3.85 3.81 3.85 3.96 4.05 4.24 4.07 3.87 RateG 4.00 4.38 4.17 4.19 3.98 3.93 3.98 4.11 4.24 4.44 4.35 4.14 Rate F 4.41 4.73 4.49 4.49 4.26 4.19 4.25 4.38 4.52 4.74 4.65 4.43 Rate G 5.08 5.33 5.01 4.99 4.73 4.60 4.63 4.75 4.88 5.09 4.97 4.73 Rate DDD 5.49 5.74 5.38 5.32 5.03 4.89 4.91 5.03 5.18 5.42 5.31 5.05 Rate DD 6.54 6.78 6.36 6.21 5.84 5.63 5.55 5.62 5.68 5.86 5.67 5.40 RateD 8.34 8.55 8.02 7.81 7.30 6.91 6.67 6.61 6.53 6.62 6.26 5.96 Rate B 8.78 8.99 8.44 8.24 7.71 7.29 7.15 7.19 7.15 7.26 6.92 6.59 Rate AB 9.08 9.29 8.71 8.47 7.91 7.48 7.37 7.44 7.49 7.68 7.39 7.04 RateAA 10.24 10.38 9.74 9.51 8.91 8.35 8.19 8.24 8.40 8.71 8.45 8.04 Rate A 12.31 12.43 11.64 11.32 10.57 9.97 9.63 9.57 9.44 9.63 9.04 8.60 Hours 45 45 45 45 45 45 45 45 45 44 44 44
Source: LRS AWARD.
Table 6.6 Purchasing power parity of electrical engineering workers average net hourly earnings (Swiss Francs)
Country 1986 1987 1989
USA 15.22 12.42 15.04 Japan 12.16 12.71 14.28 Germany 10.95 11.22 13.67 Australia 10.72 9.26 13.44 Israel 8.55 10.31 12.76 Rep Korea 2.90 2.56 6.44 Rep of China 2.80 3.21 5.01 Hong Kong 2.66 2.48 4.35 Brazil 2.36 1.84 3.88 Singapore 1.94 1.80 2.66 South Africa 2.53 2.67 2.43 Mexico 0.70 1.14 2.40 Malaysia 2.35 2.13 2.18 India 0.76 0.68 0.67
Source: IMF 1989
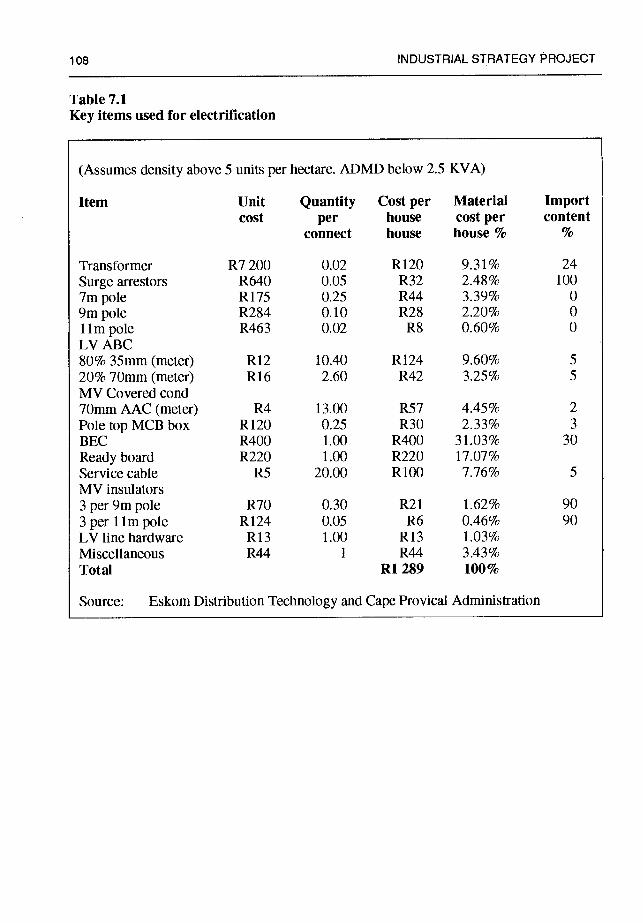
108 INDUSTRIAL STRATEGY PROJECT
Table 7.1 Key items used for electrification
(Assumes density above 5 units per hectare. ADMD below 2.5 KVA)
Item Unit Quantity Cost per Material Import cost per house cost per content
connect house house % %
Transformer R7 200 0.02 R120 9.3 1% 24 Surge arrestors R640 0.05 R32 2.48% 100 7m pole R175 0.25 R44 3.39% 0 9mpole R284 0.10 R28 2.20% 0 limpole R463 0.02 R8 0.60% 0 LV ABC 80% 35mm (meter) R12 10.40 R124 9.60% 5 20% 70mm (meter) R16 2.60 R42 3.25% 5
MV Covered cond 70mm AAC (meter) R4 13.00 R57 4.45% 2 PoletopMCBbox R120 0.25 R30 2.33% 3 BEC R400 1.00 R400 31.03% 30 Ready board R220 1.00 R220 17.07% Service cable R5 20.00 Rl00 7.76% 5 MV insulators 3 per 9m pole R70 0.30 R21 1.62% 90 3 per 1 im pole R124 0.05 R6 0.46% 90 LV line hardware R13 1.00 R13 1.03% Miscellaneous R44 1 R44 3.43% Total Ri 289 100%
Source: Eskom Distribution Technology and Cape Provical Administration
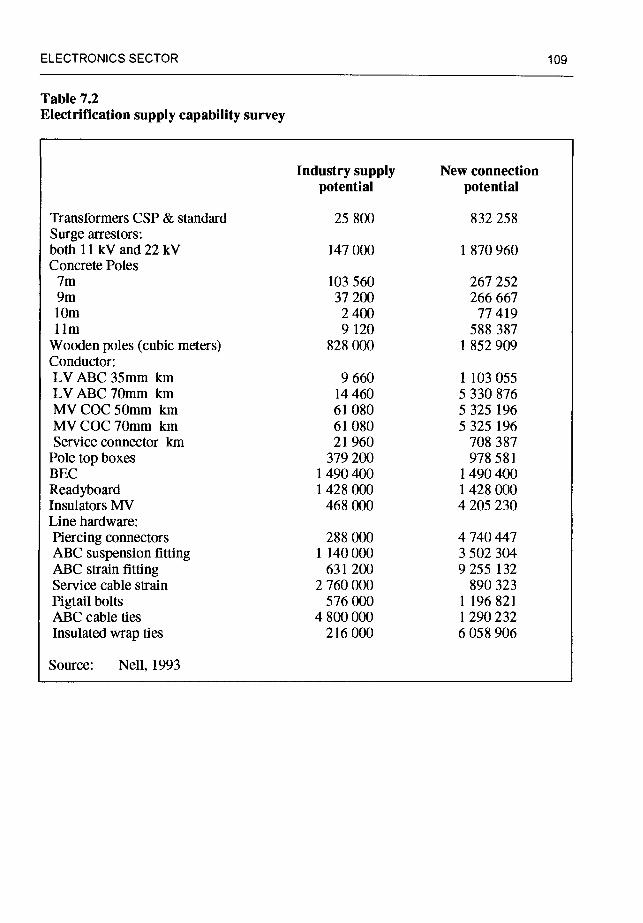
ELECTRONICS SECTOR 109
Table 7.2 Electrification supply capability survey
Industry supply New connection potential potential
Transformers CSP & standard 25 800 832 258 Surge arrestors: bothllkVand22kV 147000 1870960 Concrete Poles 7m 103 560 267 252 9m 37 200 266 667 lOm 2400 77419 urn 9120 588 387 Wooden poles (cubic meters) 828 000 1 852 909 Conductor:
LVABC35mmkm 9660 1103055 LVABC7Omm km 14460 5330876 MVCOC5Omm km 61080 5325196 MV COC 70mm km 61 080 5 325 196 Service connector km 21 960 708 387
Poletop boxes 379200 978581 BEC 1490400 1490400 Readyboard 1 428 000 1 428 000 Insulators MV 468 000 4205 230 Line hardware: Piercing connectors 288 000 4740447 ABC suspension fitting 1140000 3 502 304 ABC strain fitting 631 200 9255 132 Service cable strain 2 760 000 890 323 Pigtail bolts 576 000 1196 821 ABC cable ties 4 800000 1 290 232 Insulated wrap ties 216 000 6 058 906
Source: Nell, 1993
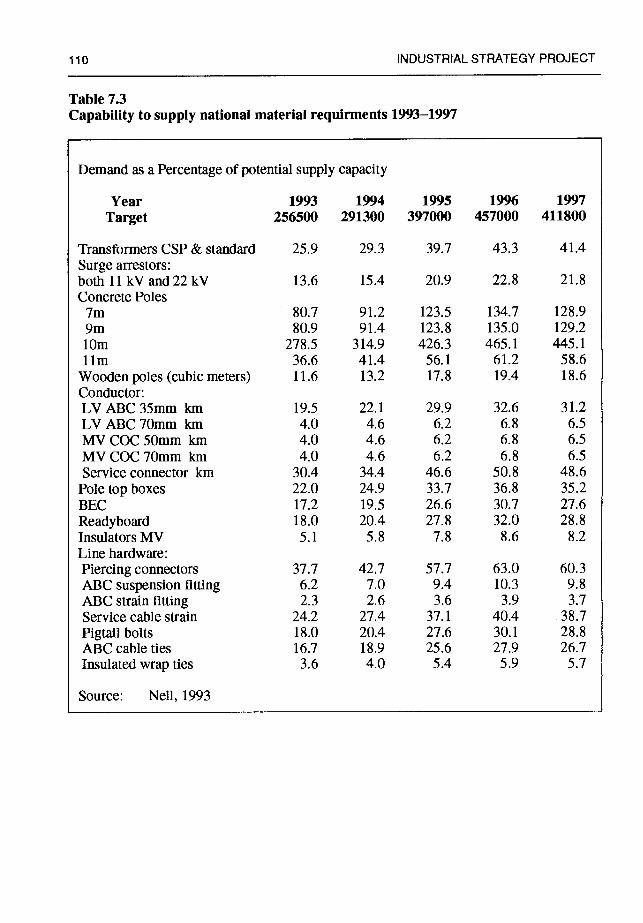
110 INDUSTRIAL STRATEGY PROJECT
Table 7.3 Capability to supply national material requirments 1993—1997
Demand as a Percentage of potential supply capacity
Year 1993 1994 1995 1996 1997
Target 256500 291300 397000 457000 411800
Transformers CSP & standard 25.9 29.3 39.7 43.3 41.4 Surge arrestors: both 11 kVand22kV 13.6 15.4 20.9 22.8 21.8 Concrete Poles 7m 80.7 91.2 123.5 134.7 128.9 9m 80.9 91.4 123.8 135.0 129.2 lOm 278.5 314.9 426.3 465.1 445.1 urn 36.6 41.4 56.1 61.2 58.6
Woodenpoles (cubic meters) 11.6 13.2 17.8 19.4 18.6 Conductor: LV ABC 35mm kin 19.5 22.1 29.9 32.6 31.2 LV ABC 70mm km 4.0 4.6 6.2 6.8 6.5 MV COC 50mm km 4.0 4.6 6.2 6.8 6.5 MV COC 70mm km 4.0 4.6 6.2 6.8 6.5 Service connector km 30.4 34.4 46.6 50.8 48.6
Pole top boxes 22.0 24.9 33.7 36.8 35.2 BEC 17.2 19.5 26.6 30.7 27.6 Readyboard 18.0 20.4 27.8 32.0 28.8 Insulators MV 5.1 5.8 7.8 8.6 8.2 Line hardware: Piercing connectors 37.7 42.7 57.7 63.0 60.3 ABC suspension fitting 6.2 7.0 9.4 10.3 9.8 ABC strain fitting 2.3 2.6 3.6 3.9 3.7 Service cable strain 24.2 27.4 37.1 40.4 38.7 Pigtail bolts 18.0 20.4 27.6 30.1 28.8 ABC cable ties 16.7 18.9 25.6 27.9 26.7 Insulatedwrapties 3.6 4.0 5.4 5.9 5.7
Source: Nell, 1993
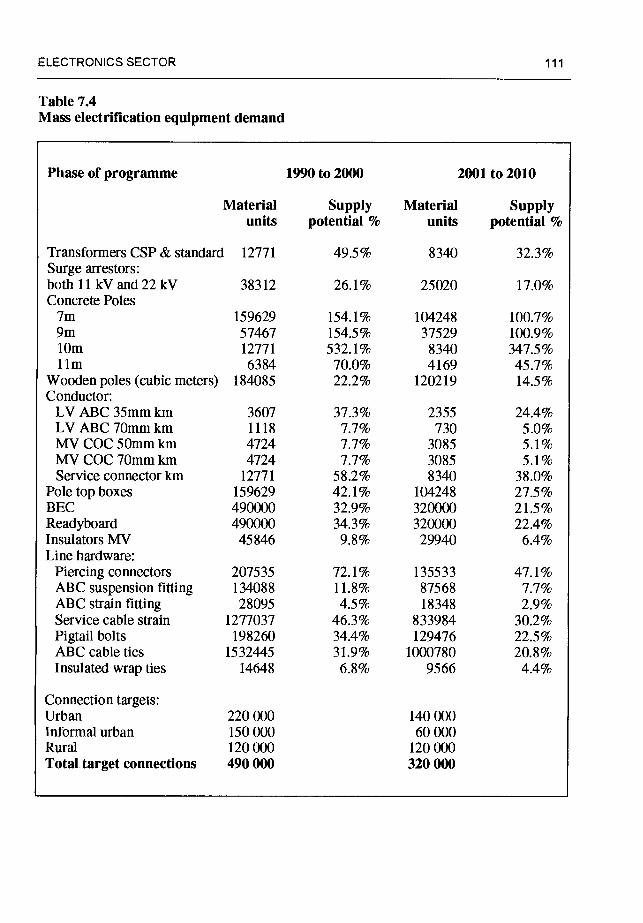
ELECTRONICS SECTOR 111
Table 7.4 Mass electrification equipment demand
Phase of programme 1990 to 2000 2001 to 2010
Material Supply Material Supply units potential % units potential %
Transformers CSP & standard 12771 49.5% 8340 32.3% Surge arrestors: both 11 kVand22kV 38312 26.1% 25020 17.0% Concrete Poles
7m 159629 154.1% 104248 100.7% 9m 57467 154.5% 37529 100.9% lOm 12771 532.1% 8340 347.5% urn 6384 70.0% 4169 45.7%
Wooden poles (cubic meters) 184085 22.2% 120219 14.5% Conductor:
LV ABC 35mm km 3607 37.3% 2355 24.4% LV ABC 70mm km 1118 7.7% 730 5.0% MV COC 50mm km 4724 7.7% 3085 5.1% MV COC 70mm km 4724 7.7% 3085 5.1% Serviceconnectorkm 12771 58.2% 8340 38.0%
Pole top boxes 159629 42.1% 104248 27.5% BEC 490000 32.9% 320000 21.5% Readyboard 490000 34.3% 320000 22.4% Insulators MV 45846 9.8% 29940 6.4% Line hardware:
Piercing connectors 207535 72.1% 135533 47.1% ABC suspension fitting 134088 11.8% 87568 7.7% ABC strain fitting 28095 4.5% 18348 2.9% Service cable strain 1277037 46.3% 833984 30.2% Pigtail bolts 198260 34.4% 129476 22.5% ABC cable ties 1532445 3 1.9% 1000780 20.8% Insulated wrap ties 14648 6.8% 9566 4.4%
Connection targets: Urban 220000 140000 Informal urban 150 000 60 000 Rural 120000 120000 Total target connections 490000 320 000
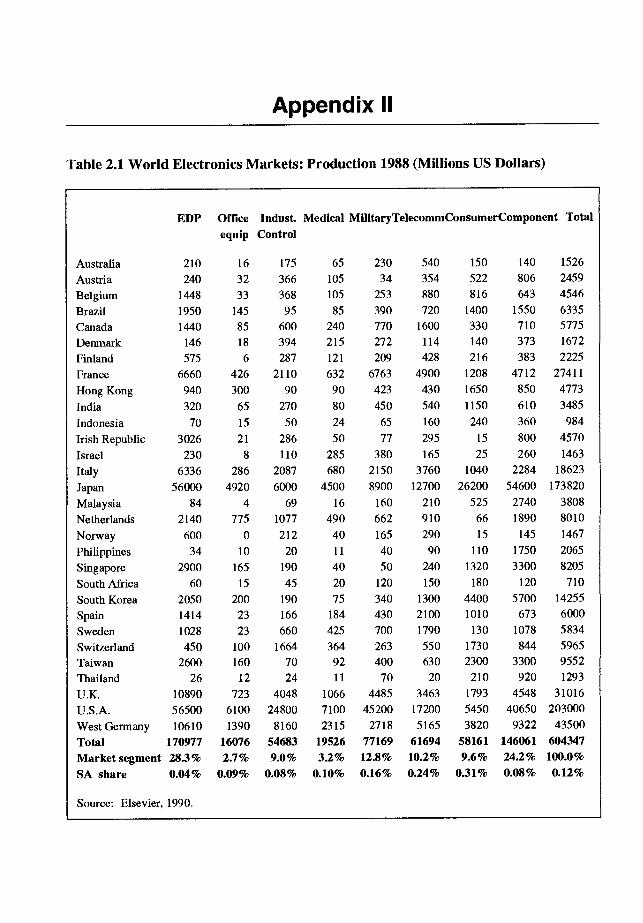
Appendix II
Table 2.1 World Electronics Markets: Production 1988 (Millions US Dollars)
EDP Office Indust. Medical MilitaryTelecommConsumerComponent Total
equip Control
Australia 210 16 175 65 230 540 150 140 1526
Austria 240 32 366 105 34 354 522 806 2459
Belgium 1448 33 368 105 253 880 816 643 4546
Brazil 1950 145 95 85 390 720 1400 1550 6335
Canada 1440 85 600 240 770 1600 330 710 5775
Denmark 146 18 394 215 272 114 140 373 1672
Finland 575 6 287 121 209 428 216 383 2225
France 6660 426 2110 632 6763 4900 1208 4712 27411
Hong Kong 940 300 90 90 423 430 1650 850 4773
India 320 65 270 80 450 540 1150 610 3485
Indonesia 70 15 50 24 65 160 240 360 984
Irish Republic 3026 21 286 50 77 295 15 800 4570
Israel 230 8 110 285 380 165 25 260 1463
Italy 6336 286 2087 680 2150 3760 1040 2284 18623
Japan 56000 4920 6000 4500 8900 12700 26200 54600 173820
Malaysia 84 4 69 16 160 210 525 2740 3808
Netherlands 2140 775 1077 490 662 910 66 1890 8010
Norway 600 0 212 40 165 290 15 145 1467
Philippines 34 10 20 11 40 90 110 1750 2065
Singapore 2900 165 190 40 50 240 1320 3300 8205
South Africa 60 15 45 20 120 150 180 120 710
South Korea 2050 200 190 75 340 1300 4400 5700 14255
Spain 1414 23 166 184 430 2100 1010 673 6000
Sweden 1028 23 660 425 700 1790 130 1078 5834
Switzerland 450 100 1664 364 263 550 1730 844 5965
Taiwan 2600 160 70 92 400 630 2300 3300 9552
Thailand 26 12 24 11 70 20 210 920 1293
U.K. 10890 723 4048 1066 4485 3463 1793 4548 31016
U.S.A. 56500 6100 24800 7100 45200 17200 5450 40650 203000
West Germany 10610 1390 8160 2315 2718 5165 3820 9322 43500
Total 170977 16076 54683 19526 77169 61694 58161 146061 604347
Market segment 28.3% 2.7% 9.0% 3.2% 12.8% 10.2% 9.6% 24.2% 100.0%
SA share 0.04% 0.09% 0.08% 0.10% 0.16% 0.24% 0.31% 0.08% 0.12%
Source: Elsevier, 1990.
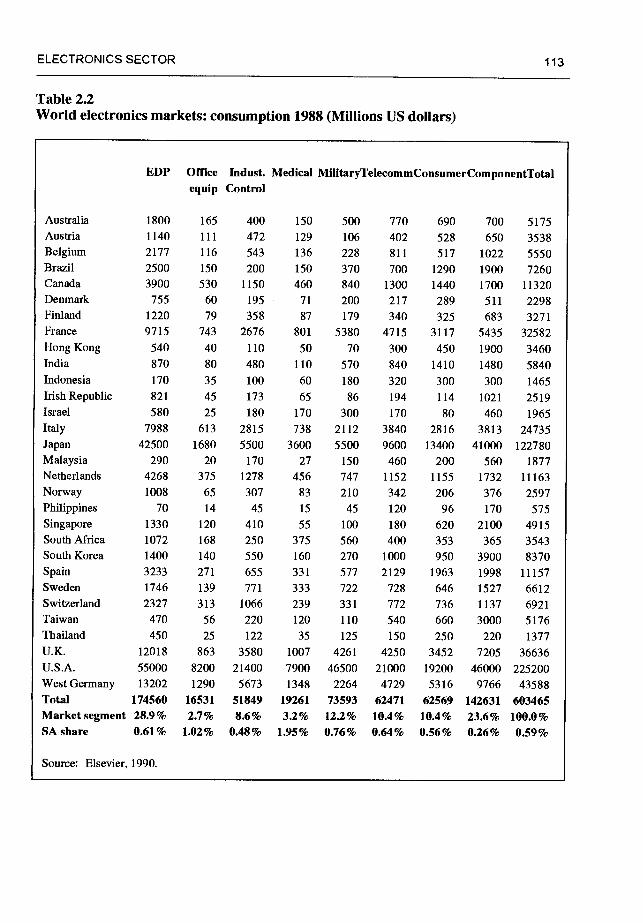
ELECTRONICS SECTOR 113
Table 2.2 World electronics markets: consumption 1988 (Millions US dollars)
Source: Elsevier, 1990.
Australia Austria Belgium Brazil Canada Denmark Finland France
Hong Kong India Indonesia Irish Republic Israel
Italy Japan Malaysia Netherlands
Norway Philippines Singapore South Africa South Korea
Spain Sweden Switzerland Taiwan Thailand U.K. U.S.A. West Germany
1800 1140 2177 2500 3900 755
1220 9715
540 870 170 821 580
7988 42500
290 4268 1008
70 1330 1072 1400 3233 1746 2327 470 450
12018 55000 13202
equip Control
Total 174560 16531 51849 Market segment 28.9% 2.7% 8.6% SA share 0.61% 1.02% 0.48%
165 400 150 111 472 129 116 543 136 150 200 150 530 1150 460
60 195 71 79 358 87
743 2676 801 40 110 50 80 480 110 35 100 60 45 173 65 25 180 170
613 2815 738 1680 5500 3600
20 170 27 375 1278 456 65 307 83 14 45 15
120 410 55 168 250 375 140 550 160 271 655 331 139 771 333 313 1066 239 56 220 120 25 122 35
863 3580 1007 8200 21400 1290 5673
500 770 690 106 402 528 228 811 517 370 700 1290 840 1300 1440 200 217 289 179 340 325
5380 4715 3117 70 300 450
570 840 1410 180 320 300 86 194 114
300 170 80 2112 3840 2816 5500 9600 13400
150 460 200 747 1152 1155 210 342 206 45 120 96
100 180 620 560 400 353 270 1000 950 577 2129 1963 722 728 646 331 772 736 110 540 660 125 150 250
4261 4250 3452
EDP Office Indust. Medical MilitaryTelecommConsumerComponentTotal
7900 46500 21000 19200 46000 225200 1348 2264 4729 5316 9766 43588
19261 73593 62471 62569 142631 603465 3.2% 12.2% 10.4% 10.4% 23.6% 100.0%
1.95% 0.76% 0.64% 0.56% 0.26% 0.59%
700 5175 650 3538
1022 5550 1900 7260 1700 11320 511 2298 683 3271
5435 32582
1900 3460 1480 5840 300 1465
1021 2519 460 1965
3813 24735 41000 122780
560 1877 1732 11163 376 2597 170 575
2100 4915 365 3543
3900 8370 1998 11157 1527 6612 1137 6921 3000 5176
220 1377 7205 36636
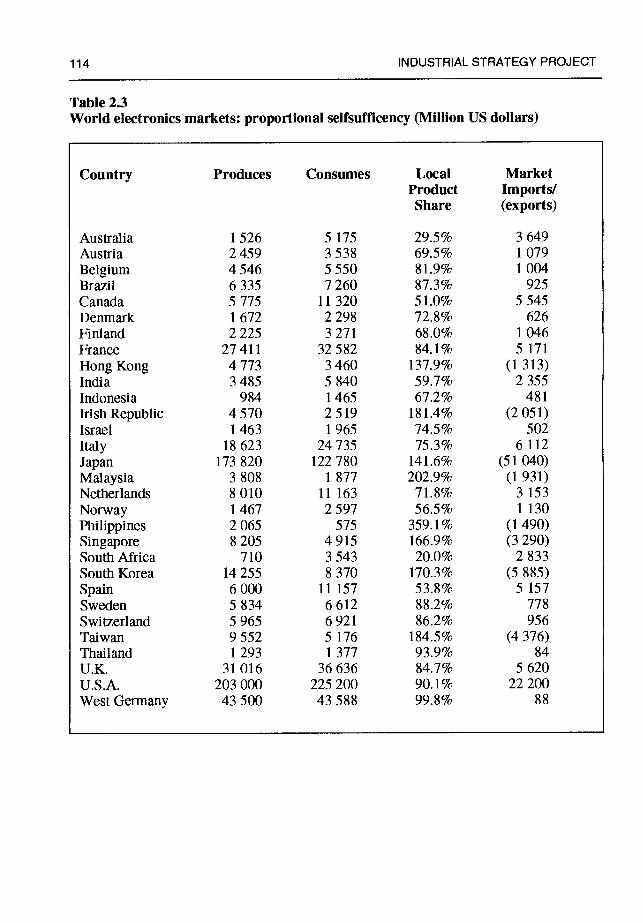
114 INDUSTRIAL STRATEGY PROJECT
Table 2.3 World electronics markets: proportional selfsufficency (Million US dollars)
Country Produces Consumes Local Market Product Imports/ Share (exports)
Australia 1 526 5 175 29.5% 3 649 Austria 2 459 3 538 69.5% 1 079
Belgium 4 546 5 550 8 1.9% 1 004 Brazil 6 335 7 260 87.3% 925 Canada 5775 11320 51.0% 5545 Denmark 1 672 2 298 72.8% 626 Finland 2 225 3 271 68.0% 1 046 France 27411 32582 84.1% 5171
HongKong 4773 3460 137.9% (1313) India 3 485 5 840 59.7% 2 355 Indonesia 984 1 465 67.2% 481 Irish Republic 4570 2519 181.4% (2051) Israel 1 463 1 965 74.5% 502 Italy 18623 24735 75.3% 6112 Japan 173820 122780 141.6% (51040)
Malaysia 3 808 1 877 202.9% (1 931) Netherlands 8010 11163 71.8% 3153 Norway 1 467 2597 56.5% 1130 Philippines 2 065 575 359.1% (1 490) Singapore 8 205 4915 166.9% (3 290) SouthAfrica 710 3543 20.0% 2833 SouthKorea 14255 8370 170.3% (5885) Spain 6000 11157 53.8% 5157 Sweden 5834 6612 88.2% 778
Switzerland 5 965 6 921 86.2% 956 Taiwan 9 552 5 176 184.5% (4 376)
Thailand 1 293 1 377 93.9% 84 U.K. 31016 36636 84.7% 5620 U.S.A. 203 000 225 200 90.1% 22 200 West Germany 43500 43588 99.8% 88
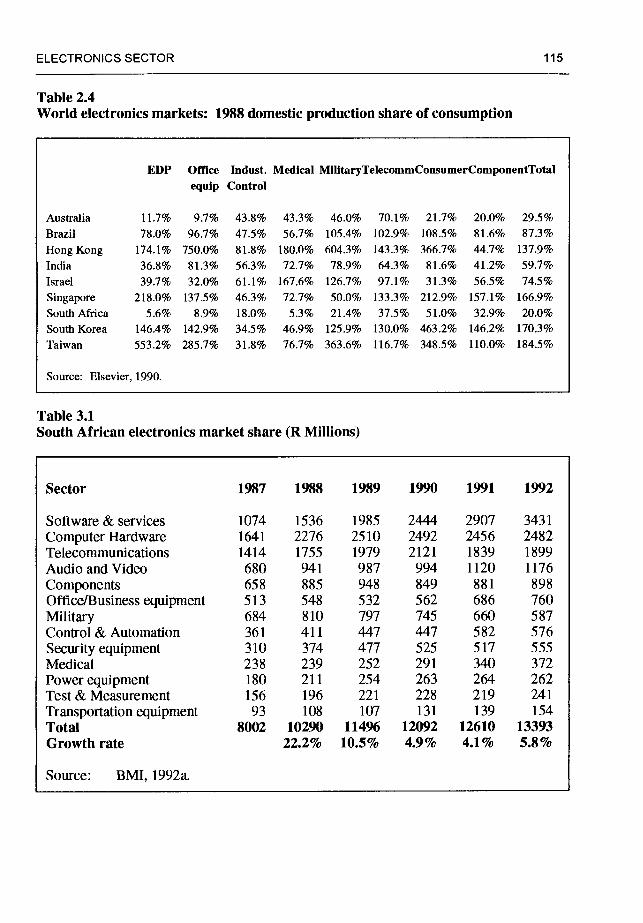
ELECTRONICS SECTOR 115
Table 2.4 World electronics markets: 1988 domestic production share of consumption
EDP Office Indust. Medical MilitaryTelecommConsumerComponentTotal equip Control
Australia 11.7% 9.7% 43.8% 43.3% 46.0% 70.1% 21.7% 20.0% 29.5% Brazil 78.0% 96.7% 47.5% 56.7% 105.4% 102.9% 108.5% 81.6% 87.3%
Hong Kong 174.1% 750.0% 81.8% 180.0% 604.3% 143 .3% 366.7% 44.7% 137.9% India 36.8% 81.3% 56.3% 72.7% 78.9% 64.3% 81.6% 41.2% 59.7% Israel 39.7% 32.0% 61.1% 167.6% 126.7% 97.1% 31.3% 56.5% 74.5%
Singapore 218.0% 137.5% 46.3% 72.7% 50.0% 133.3% 212.9% 157.1% 166.9% South Africa 5.6% 8.9% 18.0% 5.3% 21.4% 37.5% 51.0% 32.9% 20.0% South Korea 146.4% 142.9% 34.5% 46.9% 125.9% 130.0% 463.2% 146.2% 170.3% Taiwan 553.2% 285.7% 31.8% 76.7% 363.6% 116.7% 348.5% 110.0% 184.5%
Source: Elsevier, 1990.
Table 3.1 South African electronics market share (R Millions)
Sector 1987 1988 1989 1990 1991 1992
Software & services 1074 1536 1985 2444 2907 3431 Computer Hardware 1641 2276 2510 2492 2456 2482
Telecommunications 1414 1755 1979 2121 1839 1899 Audio and Video 680 941 987 994 1120 1176 Components 658 885 948 849 881 898
Office/Business equipment 513 548 532 562 686 760
Military 684 810 797 745 660 587 Control& Automation 361 411 447 447 582 576
Security equipment 310 374 477 525 517 555 Medical 238 239 252 291 340 372 Power equipment 180 211 254 263 264 262 Test& Measurement 156 196 221 228 219 241
Transportation equipment 93 108 107 131 139 154
Total 8002 10290 11496 12092 12610 13393
Growth rate 22.2% 10.5% 4.9% 4.1% 5.8%
Source: BMI, 1992a.
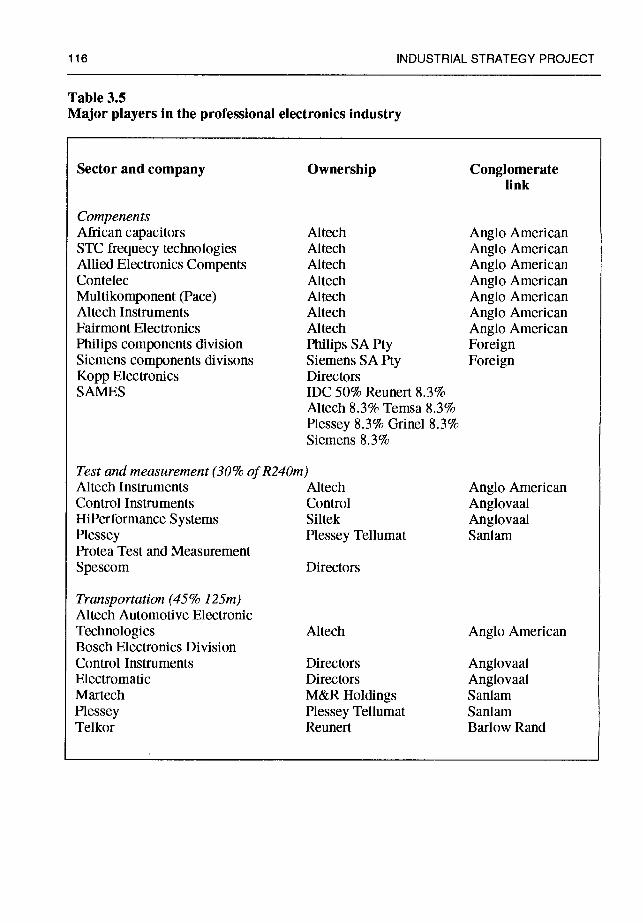
116 INDUSTRIAL STRATEGY PROJECT
Table 3.5 Major players in the professional electronics industry
Sector and company Ownership Conglomerate link
Compenents African capacitors Altech Anglo American STC frequecy technologies Altech Anglo American Allied Electronics Compents Altech Anglo American Contelec Altech Anglo American Multikomponent (Pace) Altech Anglo American Altech Instruments Altech Anglo American Fairmont Electronics Altech Anglo American Philips components division Philips SA Pty Foreign Siemens components divisons Siemens SA Pty Foreign Kopp Electronics Directors SAMES IDC 50% Reunert 8.3%
Altech 8.3% Temsa 8.3% Plessey 8.3% Grinel 8.3% Siemens 8.3%
Test and measurement (30% of R240m) Altech Instruments Altech Anglo American Control Instruments Control Anglovaal HiPerformance Systems Siltek Anglovaal Plessey Plessey Tellumat Sanlam Protea Test and Measurement Spescom Directors
Transportation (45% 125m) Altech Automotive Electronic Technologies Altech Anglo American Bosch Electronics Division Control Instruments Directors Anglovaal Electromatic Directors Anglovaal Martech M&R Holdings Sanlam Plessey Plessey Tellumat Sanlam Telkor Reunert Barlow Rand
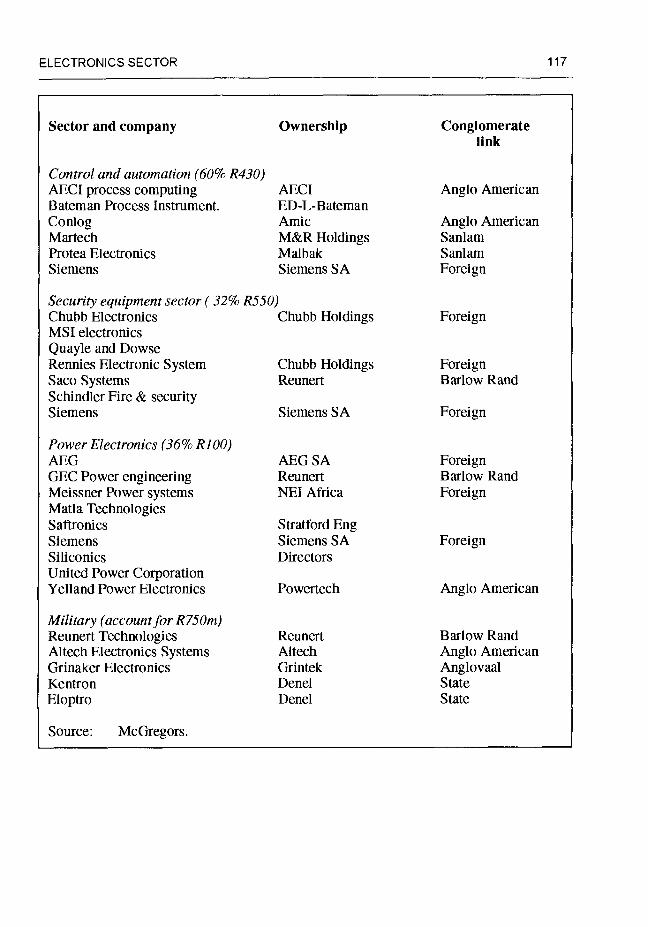
ELECTRONICS SECTOR 117
Sector and company Ownership Conglomerate link
Control and automation (60% R430) AECI process computing AECI Anglo American Bateman Process Instrument. ED-L-Bateman Conlog Amic Anglo American Martech M&R Holdings Sanlam Protea Electronics Malbak Sanlam Siemens Siemens SA Foreign
Security equipment sector ( 32% R550) Chubb Electronics Chubb Holdings Foreign MSI electronics Quayle and Dowse Rennies Electronic System Chubb Holdings Foreign Saco Systems Reunert Barlow Rand Schindler Fire & security Siemens Siemens SA Foreign
Power Electronics (36% R100) AEG AEG SA Foreign GEC Power engineering Reunert Barlow Rand Meissner Power systems NEI Africa Foreign Matla Technologies Safironics Stratford Eng Siemens Siemens SA Foreign Siliconics Directors United Power Corporation Yelland Power Electronics Powertech Anglo American
Military (account for R750m) Reunert Technologies Reunert Barlow Rand Altech Electronics Systems Altech Anglo American Grinaker Electronics Grintek Anglovaal Kentron Denel State Eloptro Denel State
Source: McGregors.
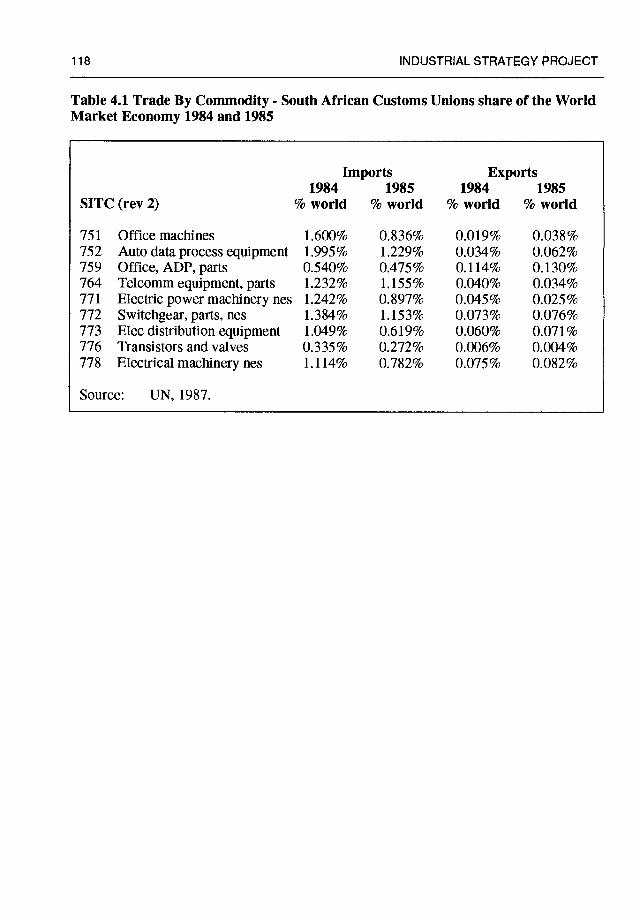
118 INDUSTRIAL STRATEGY PROJECT
Table 4.1 Trade By Commodity - South African Customs Unions share of the World Market Economy 1984 and 1985
Imports Exports 1984 1985 1984 1985
SITC (rev 2) % world % world % world % world
751 Office machines 1.600% 0.836% 0.019% 0.038% 752 Auto data process equipment 1.995% 1.229% 0.034% 0.062% 759 Office, ADP, parts 0.540% 0.475% 0.114% 0.130% 764 Telcomm equipment, parts 1.232% 1.155% 0.040% 0.034% 771 Electric power machinery nes 1.242% 0.897% 0.045% 0.025% 772 Switchgear, parts, nes 1.384% 1.153% 0.073% 0.076% 773 Elec distribution equipment 1.049% 0.6 19% 0.060% 0.071% 776 Transistors and valves 0.335% 0.272% 0.006% 0.004% 778 Electrical machinery nes 1.114% 0.782% 0.075% 0.082%
Source: UN, 1987.
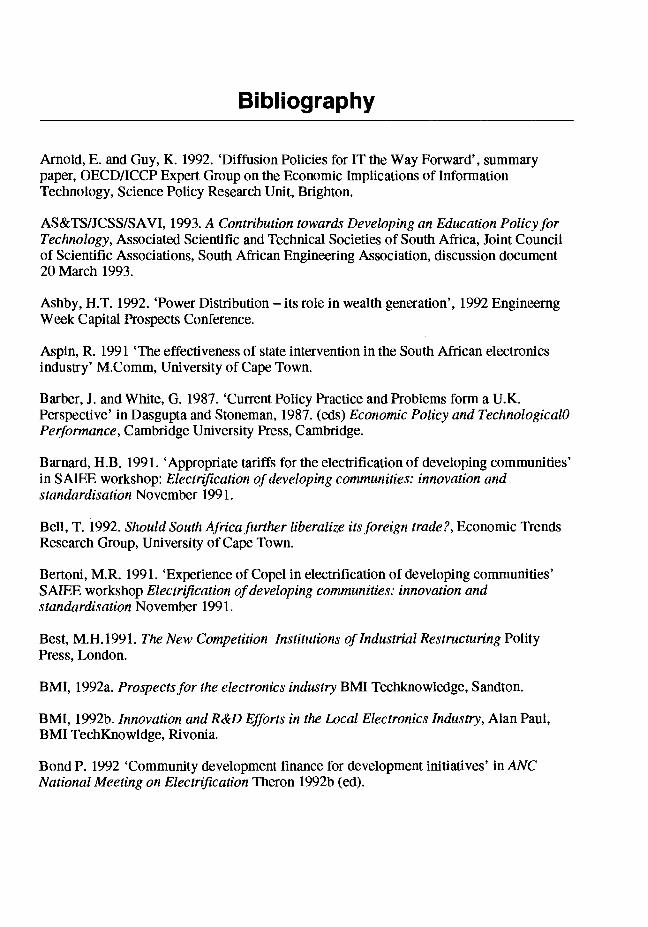
Bibliography
Arnold, E. and Guy, K. 1992. 'Diffusion Policies for IT the Way Forward', summary paper, OECD/ICCP Expert Group on the Economic Implications of Information Technology, Science Policy Research Unit, Brighton.
AS&TS/JCSS/SAVI, 1993. A Contribution towards Developing an Education Policy for Technology, Associated Scientific and Technical Societies of South Africa, Joint Council of Scientific Associations, South African Engineering Association, discussion document 20 March 1993.
Ashby, H.T. 1992. 'Power Distribution — its role in wealth generation', 1992 Engineemg Week Capital Prospects Conference.
Aspin, R. 1991 'The effectiveness of state intervention in the South African electronics industry' M.Comm, University of Cape Town.
Barber, J. and White, G. 1987. 'Current Policy Practice and Problems form a U.K. Perspective' in Dasgupta and Stoneman, 1987. (eds) Economic Policy and TechnologicalO Performance, Cambridge University Press, Cambridge.
Barnard, H.B. 1991. 'Appropriate tariffs for the electrification of developing communities' in SAIEE workshop: Electrification of developing communities: innovation and standardisation November 1991.
Bell, T. 1992. Should South Africa further liberalize its foreign trade?, Economic Trends Research Group, University of Cape Town.
Bertoni, M.R. 1991. 'Experience of Copel in electrification of developing communities' SAIEE workshop Electrification of developing communities: innovation and standardisation November 1991.
Best, M.H. 1991. The New Competition Institutions of Industrial Restructuring Polity Press, London.
BMI, 1992a. Prospects for the electronics industry BMI Techknowledge, Sandton.
BMI, 1992b. Innovation and R&D Efforts in the Local Electronics Industry, Alan Paul, BMI TechKnowldge, Rivonia.
Bond P. 1992 'Community development finance for development initiatives' in ANC National Meeting on Electrification Theron 1992b (ed).
120 NDUSTRtAL STRATEGY PROJECT
Brainard, R., Leedmand, C. and Lumbers, J. 1988. Science and Technology Policy Outlook, OECD, Paris.
Brooking, T.R. 1987. 'Cost Effective reticulation a system approach' SAIEE workshop on electrification.
Cardwell, G.R. 1991. 'Rationalisation, development and application of local power electrical technology towards maxmising economic growth' Elektron May 1991.
Carvaiho, R. dQ. 1992. 'Why the Market Reserve is not enough' lessions from the diffusion of industrial automation technology in Brazilian process industries, in Schmitz, H. and Cassiolato, J. (eds) Hi-tech for Industrial Development.
Christie, R. 1984. Electricity, Industry and Class in South Africa State University of New York Press, Albany.
Cobbeu, B. 1992. 'Electricity Distribution and Local Government in Urban Areas' in ANC National Meeting on Electrification Theron 1992b (ed).
Cock, J. 1992. 'Rocks, snakes and South Africa's arms industry 1, unpublished paper.
Cohen, V. 1992. 'South Africa — a pathfinder in earth leakage protection' Elektron January 1992.
Dahiman, C. Ross-Larson, B. Westphal, L. 1977. 'Managing Technical Development' World Development vol 15, no 6.
De Beer, J. 1992. 'Electricity Dispensers' Supplement to Elektron January 1992.
De Wet G.L. et. al. 1990 'n Ondersoek na die ekonomise invloed van die electrifisering van swart stedelike woonbuutes in Suid Afrika Buro vir Ekomomise Politiek en Analise, University of Pretoria.
Desmet D.P. 1991. The Electronics Industry Federation, Electronics 2000 conference, 14 May 1991.
Dingley, C.E. 1991. 'Electricity prepayment metering systems using encoded tokens 1 Journal of Energy Research and Development in Southern Africa May 1991
Dingly, C.E. 1990. Electricity For All in South Africa: The need and the means UCT, Cape Town.
ElF, 1991 a. Draft position paper on the electronics industry, Electronics Industry Federation, May 1991.
ElF, 1991b. Presentation given by ElF to minister Org Marais, Electronics Industry Federation, October 1991.
ELECTRONICS SECTOR 121
Elsevier, 1990. Yearbook of World Electronics Data 1990, Elsevier Advanced Technology, Oxford.
Enslin, J.H.R. 1992. 'Economics of Electrification' Elektron May 1992.
Ernst, D. and O'Connor, D. 1989. Technology and Global Competition the Challenge for Newly Industrialising Economies, Development Centre Organisation for Economic Cooperation and Development, Paris.
Ernst, D. and O'Connor, D. 1992. Competing in the Electronics Industry the Experience of Newly Industrialising Economies, Development Centre Organisation for Economic Cooperation and Development, Paris.
Eskom, 1987. Technology development and local manufacture for the power generation, distribution and utilisation industry Eskom, Sandton.
Eskom, 1990. Statistical Yearbook 1989. Sandton, Eskom.
Eskom, 1992. 'Eskom Electricity of All' in Flying Springbok July 1992.
Faucher, P. 1991. 'Public Investment and the Creation of Manufacturing Capacity in the Power Equipment Industry in Brazil' Journal of Developing Areas vol 25 part 2 January 1991.
Fitzgerald, A. et al 1981. Basic electrical engineering, McGraw-Hill, Singapore.
Foley, G. 1990. Electricity for rural people Panthos, London.
Freeman, C. and Soete, L. 1985. Information Technology and Employment: An Assesment Science Policy Research Unit, University of Sussex, Brighton.
GAIT 1992 International Trade 90—91, volume II. Geneva.
Geroski, P.A. 1991. 'Innovation and the Sectoral Sources of UK Productivity Growth', The Economic Journal, No. 101 November 1991.
Hamlin, M. 1993. 'IDC funding — we all stand together' Dataweek vol 16 no. 3.
Hewitt, T. 1992. 'Employment and skills in the Brazilian electronics industry' in Schmitz, H. and Cassiolato, J. (eds) Hi-tech for industrial development lessons from the Brazilian experience in electronics and automation Routledge, London.
Hoffman, K. 1985. 'Microelectronics, international competitiveness and development strategies: the unavoidable issues', World Development vol 13 no 3.
Howell, T. R. et. al. 1988. The Microelectronics Race the Impact of Government Policy on International C'ornpetition, Westview press, Boulder Colorado.
122 INDUSTRIAL STRATEGY PROJECT
ILO, 1992. Encyclopaedia of occupational health and safely third edition, International Labour Office, Geneva.
IMF 1989. Metal workers purchasing power IMF survey 1987, 1988 1989. International Metaiworkers Federation, Geneva.
IMF, 1986. The Electrical and Electronics Industry in Asia, 4th IMF Asian Electrical Seminar, May 23—24 1986 Bangkok, Thailand, International Metaiworkers Federation, Geneva.
Kaplan, D. 1990. The Crossed Line the South African Telecommunications Industry in Transition, Witwatersrand University Press, Johannesburg.
Laithwaite, E.R. and Feris, L.L. 1980. Electric Energy, its generation, transmission and use, McGraw Hill, Maidenhead.
Lakervi, E and Holmes, E.J. 1989. Electricity distribution network design, Peter Peregrinus, London.
Langlois, R.N. et.al. 1988. Microelectronics and Industry in Transition, Unwin Hyman, Boston.
Mackintosh, I. 1989. Europe 1992: the global impact — electrical and electronics industries, International Metalworkers Federation, Geneva.
Manuel, T. 1992. 'Keynote Address' in ANC National Meeting on Electrification Theron 1992b (ed).
Meapa, L.H.N. 1992. 'International Experience in Electrification Planning and Implementation' in ANC National Meeting on Electrification Theron 1992b (ed).
Mody, A. and Wheeler, D. 1990. Automation and World Competition New Technologies, Industrial Location and Trade, Macmillian, Handmills.
Nell, J.H. 1993. Electrification Supply Capability Survey Eskom, Sandton.
NRS 1992. NRSO23:1991 Recommended practice Electricity Distribution Low-Cost Urban Overhead Reticulation, First edition. Sandton, National Rationalisation of Specifications Project.
NRS, n.d. National Rationalisation of Specifications Project The Key Questions NRS, Sandton.
0' Conner, D. 1991. Policy and Entrepreneurial Responses to the Montreal Protocol: some Evidence from. the Dynamic Asian Economies OECD Development Centre technical paper no. 51, OECD, Paris.
ELECTRONICS SECTOR 123
OECD, 1990. Annual Review, Organisation for Economic Cooperation and Development, Paris.
Porter, M. 1990. The Competitive Advantage of Nations, The Macmillian Press, London.
Rubin, W. 1992. 'Relative feasibility of PCB cleaning systems' Dataweek 20 November 1992.
Rushing, F.W. and Brown, C. G. 1986. (eds.) National Policies for Developing High Technology Industries, Westview press, Boulder Colorado.
Science Council of Canada, 1992. Sectoral Technology Stragegy Series, no 14 The Canadian Electronics Sector, Science Council of Canada, Ottawa.
Smart, D.J. 1991. 'The implementation of a pre-paid electricity system' in SAIEE
workshop Electrification of developing communities: innovation and standardisation November 1991.
Soete, L. 1985. 'International Diffusion of Technology, Industrial Development and
Technological Leapfrogging' World Development vol 13. no. 3.
Theron, P. 1992a Electricity, Redistribution and Growth Econmic Trends Conference
May 1992.
Theron, P. 1992b. (ed) Proceedings of the ANC National Meeting on Electrification, ANC DEP, Centre for Development Studies, Beilville.
Theron, P. 1992c. 'Electricity use in low income areas in the Western Cape' mimeo, Energy for Development Research Center, University of Cape Town, Cape Town.
Theron, P. Eberhard, A. Dingly, C. 1991 Public and private sector roles in the provision of electricity in urban areas of South Africa Economic Trends working paper no 7
Todd, D. 1990 The world electronics industry, Routledge, London.
UN, 1973. Yearbook of International Trade Statistics 1970—1971, United Nations, New York 1973.
UN, 1989. 1987 International Trade Statistics Yearbook, United Nations, New York.
UN, 1990. Handbook of International Trade and Development Statistics 1989, United Nations, New York.
UNCTC, 1987. Transnational Corporations and the Electronics Industries of ASEAN Economies, United Nations Centre on Transnational Corporations, Series A. no 5. United Nations, New York.
124 INDUSTRiAL STRATEGY PROJECT
UNCTC, 1990. New approaches to best-practice manufacturing: the role of Transnational Corporations and the implications for developing countries, United Nations Centre on Transnational Corporations, Series A. no 12. United Nations, New York.
UNEP, 1989. Electronics, Degreasing, and Dry Cleaning Solvents: Technical Options Report, United Nations Environmental Programme, Nairobi.
UNIDO, 1988. Industry and development global report 1988/89 United Nations Industrial Development Organisation, Vienna.
UNIDO, 1990. First Consultation on the Electronics Industry, Unido, Vienna.
Uvarov, E. B. and Isacs, A. 1986 The Penguine dictionary of science, Penguine, Harmondsworth.
Wood, E. and Moll. T. 1992 'South Africa in World Exports' Structural Adjustment in South Africa: Trade sub project. African Studies Center, University of Cambridge, memeo.
World Bank, 1984. Korea Development in a Global Context, World Bank country study, Washington.
Government Publications
BTI 1990a. Structural adjustment programme for tile industry manufacturing transformers in South Africa Report no 2929. Board of Trade and Industry, Pretoria.
BTI 1 990b. Structural adjustment programme for tli.e industry manufacturing electrical switch gear in South Africa Report no 2963. Board of Trade and Industry, Pretoria.
BTI 1990c. Structural adjustment programme for the industry manufacturing insulated electric cable Report no 2829. Board of Trade and Industry, Pretoria.
BTI, 1986a. Investigation into the South African Electronics Industry report no 2455, Board of Trade and Industry, Unpublished report, Pretoria.
BTI, 1986b. Investigation into the South African Electronics Industry report no 2455, Board of Trade and Industry, Summary, Pretoria.
CEAS, 1992. Import and export datadbase Central Economic Advisory Service, Pretoria.
CSS, 1982. ('ensus of manufacturing 1982, Central Statistical Services, Pretoria.
CSS, 1985. Census of manufacturing 1985, Central Statistical Services, Pretoria.
ELECTRONICS SECTOR 125
CSS, 1992a. South African Statistics 1992, Central Statistical Services, Pretoria.
CSS, 1992b. Products manufactured P3051.4, Central Statistical Services, Pretoria.
De Waal Committee, 1983. Die Elektronika-Behoeftes van die Publieke Sektor, Verslag van die Ondersoekkomitee in opdrag van 'n ad-hoc ministeriele Komitee met sy Edele Hendirck Schoeman as voorsitter. Pretoria.
DTI, l992a. Innovation Support for Electronics Programme Bi-annual progress report, 31 March 1992, IDC, Sandton.
Dli, 1992b. Innovation Support for Electronics Programme Fourth Bi-annual progress report, 4 December 1992, IDC, Sandton.
Dli, 1992c. Innovating Growth Department of Trade and Industry, Pretoria.
IDC 1990. Ondersoek na die Tariejbeskermingsbeleid Ontleding van die Tartfstrusktuur Baylae C IDC, Sandton.
IDC 1992a. Sectoral Data Series Manufacturing (Revised January 1992) Department of Economic Research and Development, Industrial Development Corporation of South Africa, Sandton.
IDC 1992b. Industry profile: Electric Industrial Machinery IDC, Sandton.
IDC 1992c. Industry profile: Other Electrical Apparatus IDC, Sandton.
IDC, 1981. Die Elektroniese Bedryf in Suid-Afrika IDC, Sandton.
SALS, 1992. South African Labour Statistics 1992, Central Statistical Services, Pretoria.
SCE, 1992. 'Inviation to all interested parties to submit proposals and comments' Standing Committee for Electronics press release, November 1992.
Working Group, 1983. Final Report of The Working Group for the Promotion of the Electronics Industry Government Paper, Pretoria.
Working Group, 1988. Summary report of The Working Group for the Promotion of the Electronics Industry Government Paper, Pretoria.
126 INDUSTRIAL STRATEGY PROJECT
Annual financial statements various years
Aberdare African Cables Allied Technologies Control Instruments Eskom Grintek Kopp Electronics NEI Africa Powertech Reunert Schiumberger Spescom Usko
Interviews
Ahiers, J.H. Director, Division of Microelectronics and Communications Technology, CSIR, interview 27/11/92.
Alisop, T. investment analyst, Simpson Mackie, interview, 15/10/92.
Baker, K. secretary of the South African Institute of Measurement and Control, interview, 28/8/92.
Berkenshaw, Regional Director, Merlin Germ Cape Town, interview 12/10/92
Bos, H. Consultant to Control Logic, interview 7/9/92
Castleman, E. Export Director, Plessey Tellumat, interview, 14/8/92
Cilliers, B. MD AMS, interview 3/8/92
Cilliers, S. Manager of Distribution Technology division, Eskom, interview, 16/7/92.
Coetzee, R. Western Cape Chair SAIMC, 4/6/92
Couke, M. Director of Technology and Joint Ventures, Pauwls International, interiew 28/9/92
De Jager, secretary, Electronics and Telecommunications Industries Association, interview 2 6/5/92
Deeb, G. Assistant Marketing Manager Telkor, interview 26/8/92
ELECTRONICS SECTOR 127
Desmet, D. Chairman, Electronics Industry Federation, interview, 7/5/92.
Doak, J. Manufacturing Director, Conlog, interview, 7/9/92.
Dudley, H. MD SIC AME International, interview 7/4/92
Duff, G. Sales Engineer Martech, interview, , 28/8/92
Ede, V. Assistant Marketing Director EPI, interview 25/11/92
Els, R. General Manager GEC Alsthom SA, interview 25/11/92/
Esterhuizen, C. Executie Manager CBI, interiew 4/5/92
Fellinger, H. MD SAMES, Interview, 3/9/92
Fletcher, Sales Director, Plesse Electrical,interviewl3/10/92.
Forrester, R. MD Electromatic, Interview, 9/9/92.
Gaunt, T. Director, Hill, Kaplan and Scot, consulting engineers, interview, 13/4/92.
Geldenhuize, H. Manager Electric Power CSIR, interview 6/5/92
Gower, M. Durban Corporatioon Electricity Department, interview 6/5/92
Grithis, E. EPI, interiew 25/11/92
Hardie, D. EPI Marketing Division, interiew 25/11/92
Howe, Managing Director, Crabiree Cape Town, interview 12/10/92.
Irwin, J. Technical Marketing Director Abadare Cables, interview 26/11/92
James, V. Director, Trax Interconnect, interview, 19/8/92.
Jones, B. Substation Electrical Engineer, City of Cape Town Electricity Department, interview, 12/3/93.
Kuijpers, B. Chairman, Electronic Component Manufacturers Association, interview, 28/8/92.
Lappin, J. MD Power Engineers, interiew 16/4/92
Manesell, R. Reader CICT< SPRU, interiew 17/9/92
McDonald, J. Grinaker Electronics, interview, 1/8/92
128 INDUSTRIAL STRATEGY PROJECT
McKay, J. Assistant Chief Engineer, Cape Provincial Administration, Electricity Department, interview 12/6/92 and 1/7/92.
Metters, L. Schiumberger, intervew 21/8/92
Mokone, A and Lodi, J. Electrical equipment manufacturing firm shop stewards, interview, Transvaal, 25/11/92
Morgan, D. Sales Director Siliconics,interiew 3/9/92
Mr Swan, General Manager, Reunert Technology Systems, interview 1/8/92.
Muller, A. Managing Director, Fluritex, interview 15/3/93.
Price. D. MD Compu-power, interview 2/11/92
Roberts, D. Industrial lubricants manager, Shell SA, interview 12/3/93.
Rodgers, D. Sales Director Pace Electronic Components, Interview, 4/9/92
Rose, D.Alan McKinnion Cape Town branch manager, interview3/3/93
Rossouw, G. Chief Engineer Pauwls International, interview26/1 1/92
Roy, A. Technology Development Manager, Plessey Tellumat, interview, 14/8/92.
Shribner, Marketing Director, Meissner Power Systems, interview, 29/8/92.
Strafford, J. Director, Saftronics, inverview, 29/9/92
Styn, M. Sectretary to Committee on Compliance with the Montreal Protocol, Department of Health, interview, 12/3/93.
Swan, Reunert Technology Systems, Interview, 1/8/92
Temple, Dr J. Managing Director, Plessey Tellumat, interview, 14/8/92.
Witshead, D. Quayle and Dowse, Interview 2/9/92
An additional nine international and 21 local interiews were undertaken but are not cited in the text.
ELECTRONICS SECTOR 129
Newspapers
The Herald Times Electronic News Engineering News Cape Times Dataweek Electronics News
Databases
Labour Research Service Actual Wage Rates Database.
Other Industrial Strategy Project Publications
An Industrial Strategy for the Pulp and Paper Sector
An Industrial Strategy for the Motor Vehicle Assembly and Component Sector
An Industrial Strategy for the Clothing Sector
An Industrial Strategy for the Textile Sector
An Industrial Strategy for the Building Material Supplies Sector
An Industrial Strategy for the Household Electrical Durables Sector
An Industrial Strategy for the Commodity Plastics Sector
An Industrial Strategy for the Mineral Beneficiation and Mineral Based Fabrication Sectors
An Industrial Strategy for the Food Processing and Beverages Sector
An Industrial Strategy for the Footwear Sector
An Industrial Strategy for the Engineering Sector
An Industrial Strategy for the Microenterprise Sector
A Trade Policy for Industrial Growth
A Policy for Regional Industrial Development
There is widespread agreement that if post-apartheid South Africa is to succeed economically, there will have to be a sustained improvement in industrial performance. Thus far, there have been no malor policy oriented studies of South Africa's principal industrial sectors. This series of reports, published under the umbrella of the "Contemporary Policy Issues" series, seeks to fill this gap.
Electrical distribution equipment is key to the provision of electricity. This report examines the capability of the industry to meet electrification targets. It addresses issues such as high input costs, fragmented demand and the lack of economies of scale.
South Africa's professional electronics industry is an essential enabling technology, which could contribute significantly to improving productivity. Goode argues that policy for the industry should have a two-fold thrust — to
promote the more rapid diffusion of electronics products domestically and to foster the international integration of the industry.
ISBN 0—7992—1581—3
UCT 9 780799 215816 _________


