Embed Size (px)
Citation preview

Beatriz Pérez-Aradros Muro
Jaime Gomez Villascuerna y Idana Salazar Terreros
Facultad de Ciencias Empresariales
Economía y Empresa
Título
Director/es
Facultad
Titulación
Departamento
TESIS DOCTORAL
Curso Académico
The Effects of Entry Timing and Entry Mode Decisions onFirm Performance: the Role of Competitive Strategy and
Environmental Factors ᭯
Autor/es

© El autor© Universidad de La Rioja, Servicio de Publicaciones, 2020
publicaciones.unirioja.esE-mail: [email protected]
The Effects of Entry Timing and Entry Mode Decisions on Firm Performance:the Role of Competitive Strategy and Environmental Factors, tesis doctoral de
Beatriz Pérez-Aradros Muro, dirigida por Jaime Gomez Villascuerna y Idana SalazarTerreros (publicada por la Universidad de La Rioja), se difunde bajo una Licencia Creative
Commons Reconocimiento-NoComercial-SinObraDerivada 3.0 Unported. Permisos que vayan más allá de lo cubierto por esta licencia pueden solicitarse a los
titulares del copyright.

DOCTORAL THESIS
THE EFFECTS OF ENTRY TIMING AND ENTRY
MODE DECISIONS ON FIRM PERFORMANCE:
THE ROLE OF COMPETITIVE STRATEGY AND
ENVIRONMENTAL FACTORS
PhD. Candidate:
BEATRIZ PÉREZ-ARADROS MURO
Supervised by:
Dr. JAIME GÓMEZ VILLASCUERNA
Dra. IDANA SALAZAR TERREROS

Cuestiones preliminares
El artículo 3 de la Normativa para la defensa de tesis doctorales en la Universidad
de La Rioja recoge la posibilidad de que la tesis sea desarrollada y defendida en castellano
o en otro de los idiomas habituales para la comunicación científica en su campo de
conocimiento, distinta a cualquiera de las lenguas oficiales en España. En este último caso,
se precisa que, al menos, el resumen y las conclusiones sean redactados y presentados en
castellano. Se aplicará, no obstante, lo dispuesto en el artículo 16 en el caso de las tesis que
opten a la Mención Internacional.
El artículo 16 de dicha normativa exige que, para obtener la “Mención
Internacional”, parte de la tesis doctoral, al menos el resumen y las conclusiones, se hayan
redactado y sean presentadas en una lengua distinta a cualquiera de las oficiales en España.
Con el fin de cumplir con los requisitos anteriores, la totalidad de la presente tesis doctoral
ha sido elaborada y será defendida en inglés.
Esta tesis doctoral ha sido financiada con una ayuda obtenida en la convocatoria de
2014 de contratos predoctorales destinados a la formación de personal investigador
financiados por la Comunidad Autónoma de La Rioja.

INDEX OF CONTENTS
CHAPTER 1. INTRODUCTION…………………………………………………… 1
1.1. Introduction……………………………………………………………………….. 2
1.2. Structure of the thesis……………………………………………………………... 4
1.3. Theoretical framework……………………………………………………………. 9
1.3.1. Entry timing advantages and its evolution over time……………………. 9
1.3.2. Entry mode decisions when expanding abroad: a transaction cost perspective………………………………………………………………..
11
1.4. Research setting: The mobile telecommunication industry………………………. 14
1.5. References………………………………………………………………………… 18
CHAPTER 2. DOES ORDER OF ENTRY DETERMINE COMPETITIVE STRATEGIES? An analysis of European mobile operators………………………...
23
2.1. Introduction……………………………………………………………………...... 24
2.2. Background to first mover advantage and competitive strategy………………….. 28
2.2.1. The literature on first mover advantage…………………………………. 28
2.2.2. Order of entry and competitive strategy…………………………………. 30
2.3. Hypotheses……………………………………………………………………....... 33
2.3.1. Pioneers and followers use different strategies…………………………... 33
2.3.2. Pioneers’ strategies change over time……………………………………. 37
2.4. Empirical analysis………………………………………………………………… 39
2.4.1. Data and sample………………………………………………………….. 39
2.4.1.1. Research setting: mobile communications industry…………... 39
2.4.1.2. Variable description…………………………………………... 40
2.4.1.3. Descriptive statistics…………………………………………... 46
2.4.2. Methodology…………………………………………………………....... 48
2.5. Results…………………………………………………………………………….. 48
2.6. Conclusion and discussion………………………………………………………... 56
2.7. References………………………………………………………………………… 60
CHAPTER 3. HOW TO DEFEAT EARLY ENTRANTS: The role of competitive strategy and industry dynamism on early mover advantages in the telecommunications industry…………………………………………………………..
69
3.1. Introduction……………………………………………………………………….. 70
3.2. Literature review on entry-timing advantages……………………………………. 74
3.3. Hypotheses………………………………………………………………………... 76
3.3.1. Order of entry, competitive strategy and performance…………………... 77
3.3.2. The moderating role of industry dynamism……………………………… 79
3.4. Empirical analysis………………………………………………………………… 85
3.4.1. Data and Sample…………………………………………………………. 85
3.4.1.1. Research setting: The mobile communications industry……… 85
3.4.1.2. Variable description…………………………………………… 86
3.4.1.3. Descriptive statistics…………………………………………... 91
3.4.2. Methodology……………………………………………………………... 96
3.5. Results…………………………………………………………………………….. 96
3.6. Conclusion and discussion………………………………………………………... 106
3.7. References………………………………………………………………………… 110
CHAPTER 4. ENTRY MODE AND INNOVATION ADOPTION OF MULTINATIONAL FIRMS. The effect of cultural distance and home/host country development……………………………………………………………………
117
4.1. Introduction……………………………………………………………………….. 118
4.2. Literature review on MNES entry mode………………………………………….. 121
4.3. Hypotheses………………………………………………………………………... 125
4.3.1. Cultural distance and entry mode: The country-of-origin effect………… 125
4.3.2. Entry mode choice and subsidiaries’ innovation………………………… 128
4.3.3. The moderating effect of host country development on subsidiaries’ innovation ………………………………………………………………..
130
4.4. Empirical analysis………………………………………………………………… 132
4.4.1. Data and Sample…………………………………………………………. 132
4.4.1.1. Research setting: The mobile communications industry……… 132
4.4.1.2. Variable description…………………………………………... 133
4.4.1.3. Descriptive statistics………………………………………….. 138
4.4.2. Methodology…………………………………………………………….. 139
4.5. Results……………………………………………………………………………. 141
4.6. Conclusion and discussion………………………………………………………... 144
4.7. References………………………………………………………………………… 147
CHAPTER 5. SUMMARY AND CONCLUSIONS………………………………….. 155
5.1. Summary and conclusions………………………………………………………… 156
5.2. References………………………………………………………………………… 162
INDEX OF TABLES CHAPTER 1. INTRODUCTION
Table 1.1. Number of entries in the telecommunication industry worldwide…….... 16
CHAPTER 2. DOES ORDER OF ENTRY DETERMINE COMPETITIVE STRATEGIES? An analysis of European mobile operators
Table 2.1. Descriptive statistics and correlations……………………………………. 47
Table 2.2. Tobit estimates on relative quality, relative prices and relative operating efficiency………………………………………………………………… 49
Table 2.3. The effect of pioneer and second entrant on relative quality, relative prices and relative operating efficiency (further analyses)………………. 54
Table 2.4. Estimated predictive margins (further analysis)…………………………. 55
CHAPTER 3. HOW TO DEFEAT EARLY ENTRANTS: The role of competitive strategy and industry dynamism on early mover advantages in the telecommunications industry
Table 3.1. Descriptive analysis and correlations……………………………………. 93
Table 3.2. Firm performance by order of entry and competitive strategy…………... 94
Table 3.3. Entrant’s performance by competitive strategy…………………………………. 95
Table 3.4. Firm performance by order of entry and industry dynamism……………. 96
Table 3.5. The effect of order of entry and competitive strategy on profitability………….. 97
Table 3.6. Profitability of firms in the telecommunication sector (strategy comparison)….. 99
Table 3.7. Profitability of firms in the telecommunication sector (early entrant vs follower)…………………………………………………………………………
100
Table 3.8. Followers’ competitive strategy and industry dynamism………………... 102
Table 3.9. The effect of market growth on entrants’ profitability…………………... 103
Table 3.10. The effect of technological change on entrants’ profitability……………. 105
CHAPTER 4. ENTRY MODE AND INNOVATION ADOPTION OF MULTINATIONAL FIRMS. The effect of cultural distance and home/host country development
Table 4.1. Description of MNEs in the sample……………………………………… 133
Table 4.2. Descriptive analysis and correlations……………………………………. 140

Table 4.3. Heckman’s two-stage model……………………………………………... 142
INDEX OF FIGURES
CHAPTER 1. INTRODUCTION
Figure 1.1. Dissertation structure…………………………………………………….. 5
Figure 1.2. Total fixed and mobile subscriptions worldwide (per 100 people)……… 15
CHAPTER 3. HOW TO DEFEAT EARLY ENTRANTS: The role of competitive strategy and industry dynamism on early mover advantages in the telecommunications industry
Figure 3.1. Model of analysis………………………………………………………… 85
Figure 3.2. Competitive Strategy categories…………………………………………. 88
CHAPTER 4. ENTRY MODE AND INNOVATION ADOPTION OF MULTINATIONAL FIRMS. The effect of cultural distance and home/host country development
Figure 4.1. Model of analysis………………………………………………………… 132

1
Chapter 1.
INTRODUCTION
2
1.1. INTRODUCTION
Strategic management has traditionally focused on explaining the reasons
underlying firm success (Guerras-Martín, Madhok and Montoro-Sánchez, 2014) and,
particularly, the strategic choices that allow firms to achieve competitive advantages
over their rivals. Entering into a new market is one of the ways in which firms grow and
create economic value. This is one of the reasons why the analysis of market entry
decisions, as a key determinant of firm competitive advantages, has received
considerable attention during the last decades (Beugelsdijk, Kostova, Kunst, Spadafora
and Essen, 2018; Brouthers, 2002; Lieberman and Montgomery, 1988; 2013; Zachary,
Gianiodis, Payne, Markman, 2015). Moreover, although the relevance of research
carried out in the academic sphere is not always obvious for the interest of managers,
entry decisions has emerged as an area that seems to align the interest of both scholars
and practitioners (Fosfuri, Lanzolla and Suarez, 2013). There are many examples in the
business world that make clear the importance of entry decisions in firms’
competitiveness and success.
In this sense, pioneering a market has been confirmed to be a source of
sustainable advantage in a large number of industries. By launching a new product that
creates a whole industry, organizations such as Xerox, Freddie Laker or McCaw
Cellular Communications enjoyed competitive advantages over rivals in the plain-paper
copier industry, the airlines or the mass market for wireless telephony, respectively.
Likewise, entering foreign markets is also seen as a potential source of firms’
competitiveness. In an increasingly globalized world, organizations are meant to think
of competition from a broad perspective and consider the potential for growth offered
by markets worldwide. A considerable proportion of firms get involved in international
markets, seeking for new business opportunities. In that regard, the World Bank data
3
shows a significant increase in foreign direct investments during the last decades
worldwide. In particular, the net outflows of investment rose from $ 1.404 billion in
2000 to $ 1.915 billion in 2017, achieving the highest peak in 2007, with a global
amount of $ 3.195 billion (World Bank, 2018).
From an academic perspective, the decisions of when and how to enter new
markets have drawn scholars’ attention in both the strategic management and
international business fields. Regarding the entry timing literature, scholars have been
broadly interested in understanding the performance implications of order of entry
decisions. Studies focused on this line of research generally draw on the first-mover
advantages (FMAs) perspective (Lieberman and Montgomery, 1988) by arguing that
pioneering firms will enjoy greater competitive advantages than those later entrants.
Despite the idea that entry timing matters is widely acknowledged (VanderWelf and
Mahon, 1997), the empirical evidence has been unable to provide conclusive evidence
on this issue (Suarez and Lanzolla, 2007). To clarify conflicting findings, scholars have
recently claimed more attention on other contingency factors that may affect the order
of entry-performance relationship (Zachary et al., 2015). In that regard, firm-level
conditions (Coeurderoy and Durand, 2004; Markides and Sosa, 2013) or environmental
factors (Gómez, Lanzolla and Maicas, 2016; Suárez and Lanzolla, 2007) are highlighted
as possible moderators in this relationship. Surprisingly, the literature seems to have
overlooked its influence on the achievement and sustainability of first-mover and
followers advantages.
According to the international business perspective, scholars have focused their
interest on understanding multinationals enterprises (MNEs) decisions when expanding
abroad. Given its relevance for cross-border business transactions, the study of MNEs
entry mode choice when expanding abroad has proliferated in the last decades (see
4
Brouthers and Hennart, 2007, for a review). Studies on this line of research examine
factors that impact on MNEs entry decisions such as whether they decide to set up their
foreign affiliates by establishing a fully owned firm or whether they will share their
ownership with other firms. In particular, the distance between the home and the host
market is found to significantly affect MNEs entry mode choices when going
international, particularly the cultural distance between countries (Beugelsdijk et al.,
2018). Most studies state that MNEs will be more likely to choose lower-commitment
entry modes in greater culturally distant market as a way to share risks and reduce
potential cost of competing in unknown countries. Nevertheless, empirical evidence
remains mixed on this issue and further analysis is therefore required (Tihanyi, Griffith
and Russell, 2005). Similarly, future research efforts are need “on the other side of the
equation, that is, what happens once entry mode choice has been made” (Canabal and
White, 2008: 267). As several scholars claim, this seems to be a promising ground to
expand current knowledge on entry mode research.
Overall, this dissertation tries to shed light on these issues by providing new
insights aimed to disentangle existing contradictions, while advancing the current state
of these literatures.
1.2. STRUCTURE OF THE THESIS
This dissertation aims to analyze how market entry decisions affect firms’
subsequent competitive behavior and the achievement of competitive advantages. To
this end, several issues related to entry decisions, including timing and mode, are
addressed in the following chapters. In particular, Chapters 2 and 3 focus on the analysis
of the order of entry in a market and its effect on firms’ competitive behavior and
performance. In the case of Chapter 4, the focus is on the antecedents and consequences
5
of firms’ entry mode decisions when going abroad. Specifically, this chapter first
examines the effect of cultural distance and MNEs country of origin on entry mode.
Then, we analyze the impact of the entry mode choice on subsidiaries’ innovation.
Finally, Chapter 5 summarizes the main conclusions drawn from the three studies.
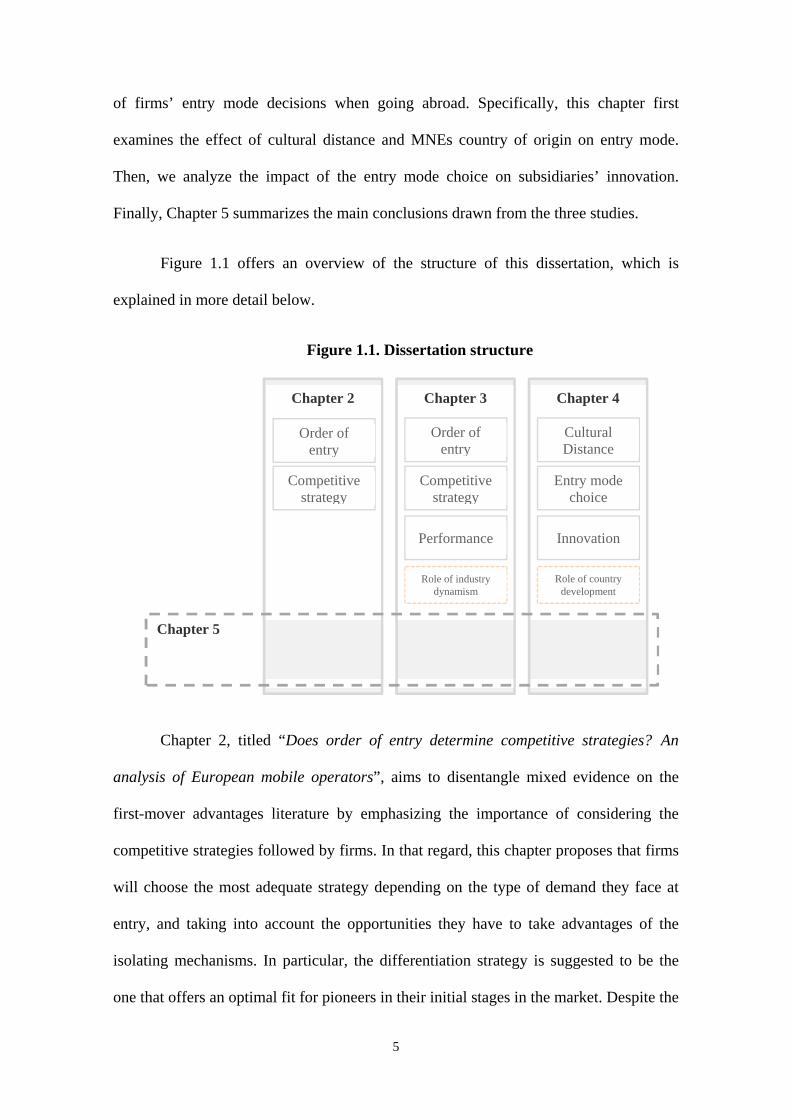
Figure 1.1 offers an overview of the structure of this dissertation, which is
explained in more detail below.
Figure 1.1. Dissertation structure
Chapter 2, titled “Does order of entry determine competitive strategies? An
analysis of European mobile operators”, aims to disentangle mixed evidence on the
first-mover advantages literature by emphasizing the importance of considering the
competitive strategies followed by firms. In that regard, this chapter proposes that firms
will choose the most adequate strategy depending on the type of demand they face at
entry, and taking into account the opportunities they have to take advantages of the
isolating mechanisms. In particular, the differentiation strategy is suggested to be the
one that offers an optimal fit for pioneers in their initial stages in the market. Despite the
Chapter 2
Chapter 3
Chapter 4
Chapter 5
Order of entry
Competitive strategy
Performance
Order of entry
Competitive strategy
Entry mode choice
Innovation
Cultural Distance
Role of industry dynamism
Role of country development
6
performance consequences of entry timing are not addressed in this Chapter, the
discovery of a pattern in the “order of entry-competitive strategy” relationship would
suggest that first mover advantages could be explained, at least partially, by the
competitive strategy chosen. This would advance in the explanation of the divergent
results in the literature regarding the effect of entering first. Furthermore, Chapter 2
considers the evolution of markets, as it could affect the way in which first movers
preserve their advantage over time, and condition their business strategy. In that regard,
it is suggested that pioneers might need to modify their business strategies to cope with
more competitive environments and changing consumers’ needs as the market matures.
Particularly, we propose that pioneers are more likely to change from an initial
differentiation orientation towards a hybrid position.
The main contributions of Chapter 2 are the following. First, from a theoretical
point of view, Chapter 2 includes a valuable integration between the order of entry and
the competitive strategy literatures aimed at improving current knowledge on first-
mover advantages. Second, the empirical evidence suggests a key role for competitive
strategies in explaining the relationship between order of entry and performance. Our
results confirm significant differences in the strategies chosen by each cohort of entrants.
Moreover, the longitudinal nature of the research presented in Chapter 2 contributes to
improve the comprehension of how pioneers obtain and sustain their competitive
advantages as the market matures. In particular, the evidence suggests that the value
created is reduced over time. In the long run, the gap between pioneers’ and followers’
competitive positions (in terms of relative quality, relative prices and relative operating
efficiency positions) seems to be eroded. These results address current scholars’
demands on post-entry strategies research in entry timing studies.
7
Chapter 3, “How to defeat early entrants: The role of competitive strategy and
industry dynamism on early mover advantages in the telecommunications industry”,
expands research from Chapter 2 by taking into account the effect of the “order of
entry-competitive strategy” relationship on firm profitability. Following a configural
approach, Chapter 3 proposes a theoretical model in which certain competitive
strategies, those that are presumed to offer an optimal fit with each cohort of entrants,
would offer greater performance levels than the rest. The differentiation strategy is
suggested for early entrants, whereas cost leadership is the best option for followers.
Moreover, Chapter 3 incorporates the effect of industry dynamism, as it has been
recently suggested to play a key role in explaining the sustainability of first-mover
advantages. In particular, factors such as the pace of market growth or the pace of
technology evolution have been shown to have a detrimental effect on pioneers’
advantages. To advance knowledge on this line of research, Chapter 3 emphasizes the
need to consider how industry dynamism could affect the effectiveness of the strategies
implemented by followers to erode early-mover advantages.
The main contributions of Chapter 3 are the following. First, to improve current
understanding of how each cohort of entrants create and sustain their performance
advantages, Chapter 3 proposes a theoretical model in which the joint effect of micro
(i.e. competitive strategies) and macro (i.e. industry dynamics) aspects is considered.
Second, the empirical evidence presented in Chapter 3 provides a nuanced picture of the
importance of considering competitive strategies to explain performance differences
associated to the order of entry. It is shown to be particularly relevant when assessing
followers’ success since they are better off when competing with a cost strategy, which
is presumed to offer an optimal fit with follower firms. Finally, the role of
environmental conditions is underlined. Industry dynamism is shown to significantly
8
influence the effectiveness of followers’ strategies in reducing the performance
advantages of entering first.
Chapter 4, “Entry mode and innovation adoption of multinational firms: The
effect of cultural distance and home/host country development”, aims to delve into the
understanding of the factors that influence multinational enterprises (MNEs) strategic
decisions when expanding abroad. Two main decisions are considered in this study.
Firstly, Chapter 4 examines the factors affecting the choice of entry mode in foreign
markets. In that regard, this chapter extends previous literature by analyzing the role
that the development of the country of origin of MNEs plays in explaining differences
in their internationalization behavior in culturally distant markets. Secondly, Chapter 4
expands current knowledge MNE-subsidiary relationship by analyzing how subsidiaries
create value in foreign markets after their entry. The focus of this second part is on the
influence exerted by the entry mode chosen on the subsidiary decision to innovate. In
particular, it is proposed that shared-owned subsidiaries will show lower adoption speed
of innovations than fully owned subsidiaries. The moderating role of the host market
development is suggested because of its potential in reducing the risks and the costs
associated to innovation.
The main contributions of Chapter 4 are the following. From a theoretical point
of view, Chapter 4 aims to shed light on the lack of consensus regarding the effect of
cultural distance on entry mode choice. To this end, Chapter 4 refines prior theoretical
arguments by emphasizing the need to consider the influence exerted by additional
factors, such as the country of origin of MNEs, commonly overlooked in prior analyses.
Moreover, this chapter expands current knowledge on MNEs’ after-entry decisions by
reflecting on the impact of the entry mode on the risks and costs assumed by firms when
carrying out innovation. Empirically, Chapter 4 contributes to the international business
9
literature in three main ways. First, the role of the country of origin is underlined as a
key moderating factor of multinationals’ internationalization behavior. Second, this
chapter provides new insights on MNEs subsidiaries’ behavior, as differences in
innovation are shown to be conditioned by entry mode choices. Finally, Chapter 4
addresses current scholars’ demands by taking into account the endogeneity associated
to entry mode decisions when analyzing MNEs post-entry strategic behavior.
Finally, the last chapter, “Summary and Conclusions”, presents a summary of
the main findings and contributions of this doctoral thesis.
1.3. THEORETICAL FRAMEWORK
The theories used to explain firms strategic entry decisions and their
consequences are described in more detail below. As indicated in prior sections, this
dissertation comprises two main dimensions of market entry: entry timing decision and
entry mode choice. Accordingly, the theoretical framework section has been divided
into two main parts. The first part provides a literature review regarding firms’ entry-
timing decisions. The theoretical perspective referred to MNEs decisions when going
abroad is presented in the second part.
1.3.1. Entry timing advantages and its evolution over time
The study of entry-timing strategies constitutes an established body of the
literature in the strategic management research. There has been a large volume of work
published on this issue during the last decades (see Fosfuri et al., 2013; Zachary et al.,
2015) and, particularly, on the idea that entering first a market matters (Kerin,
Varadarajan and Peterson, 1992; Lieberman and Montgomery, 1988). Based on the
seminal work of Lieberman and Montgomery, the theory of first-mover advantages
(FMAs) suggests the order of entry (i.e., being first) as a core predictor of firm
10
performance. Empirically, the hypothesis that firms that enter a market early obtain
higher performance advantages than followers is generally supported, though the
evidence is largely dependent on the characteristics of the study developed (VanderWelf
and Mahon, 1997).
Research on the FMAs theory has been developed around three main areas of
investigation. First, scholars have examined the “isolating mechanisms” that allow first-
movers to achieve advantages and protect their rents form future erosion (Lieberman
and Montgomery, 1988; Rumelt, 1987). Second, the resource-based view perspective
has been employed to explain the existence of FMAs in terms of the set of resources and
capabilities that allow firms to exploit advantages of entering first (Robinson, Fornell
and Sullivan, 1992). Finally, and less studied, the environmental-level conditions that
influence the achievement of FMAs by acting as enablers or disablers (see Suárez and
Lanzolla, 2007).
Despite the considerable body of research focused on this issue, “the academic
literature has been unable to provide conclusive empirical evidence to support or refute
the existence of FMA” (Suarez and Lanzolla, 2007: 377). Consequently, scholars have
recently emphasized the need to consider new perspectives that expand current
knowledge on the traditional “order of entry-performance” relationship (Fosfuri et al.,
2013). Particularly, it seems obvious the need to develop an more integrated theoretical
framework that allows researchers to improve current understanding on the mechanisms
and other contingency factors that affect the achievement of entry-timing advantages
(Zachary et al, 2015).
Chapters 2 and 3 aim to address scholars demands by incorporating the
examination of different elements that could affect the relationship between firms’ order
of entry and performance. The analysis of factors such as the competitive strategy used
11
by each cohort of entrants to create value and achieve competitive advantages
(Markides and Sosa, 2013), as well as the effect of market evolution on the
sustainability of first mover advantages (Suarez and Lanzolla, 2007) is considered.
To develop a more comprehensive and integrated conceptual framework,
Chapters 2 and 3 make use of two main theories related to the evolution of markets: the
product life cycle (Vernon, 1979) and the diffusion of innovations among consumers
(Rogers, 1995). Regarding the former, the product life cycle theory explains the
evolution of most products as a history of their passing through certain recognizable
stages: from introduction to decline. Each of them is characterized by presenting a few
peculiarities, in terms of demand levels or cost structures, which condition market
evolution. In the case of the theory of diffusion of innovations (Rogers, 1995), the focus
is on the features of the different categories of potential adopters existing in a market, as
the innovation is diffused over time among the social system.
Overall, the integration of the FMAs with these literatures serves as a basis for
the refinement of our understanding of the entry-timing literature. Likewise, it
contributes to advance research on the business strategy field and, more generally, on
the strategic management literature.
1.3.2. Entry mode decisions when expanding abroad: a transaction cost
perspective
As one of the most critical decisions for multinational enterprises (MNEs)
international expansion, the entry mode choice has attracted scholars’ attention during
the last decades. In particular, a large body of research has focused on examining
potential factors that may impact on the probability to choose higher or lower control
levels over the foreign subsidiary (see, Brouthers and Hennart, 2007, for a review).
12
Given its importance in the management and international business fields, the study of
MNEs entry mode has been approached from a wide variety of theoretical perspectives:
transaction cost theory, the resource-based view, the institutional theory or Dunning’s
eclectic framework, among others. Nevertheless, as Brouthers and Hennart (2007:400)
point out in their meta-analysis, the transaction cost theory (TCT) stands out for being
“the most widely used theoretical perspective in international entry mode research”.
TCT identifies two main characteristics of human nature: bounded rationality
and opportunistic behavior (Williamson, 1985). Regarding the former, Simon (1982)
states that the rationality of individuals is limited by their cognitive limitations, as well
as by the information available to take the decision. In the case of the latter,
opportunism has been related to an individuals’ behavior seeking for “self-interest with
guile” (Williamson, 1985:47). According to TCT, there are three main factors that may
influence individuals’ decisions: assets specificity, uncertainty and frequency.
Specificity of assets arises when investments made for a given transaction have a very
low value in alternative uses. Uncertainty refers to the lack of information about the
conditions surrounding the transaction or about the behavior of individuals. According
to the frequency with which transactions recur these can be classified into occasional or
recurrent (Williamson, 1985). On this basis, studies rooted in the transaction cost
perspective consider the entry mode choice (shared vs. full ownership) as a critical
decision of governance, in which managers seek for cost minimization. For instance,
firms may be more likely to choose a shared ownership entry mode in more culturally
distant countries in order to reduce the uncertainty involved in unknown markets by
sharing risks and costs with other partners (Gatignon and Anderson, 1988).
In spite of the large body of research on the transaction cost determinants that
drive MNEs entry mode choice, the theoretical arguments and the empirical findings are
13
mixed and further research on this issue is required (Brouthers and Hennart 2007; Zhao,
Luo and Suh, 2004). Among others, the country of origin of MNEs has been recently
suggested as a potential factor that may impact their internationalization behavior,
particularly when comparing firms from developed versus developing economies (see,
for instance, Cuervo-Cazurra, 2012). The rationale behind considering the influence of
the country of origin roots on the potential impact that the particular conditions of
developing and emerging economies (such as social, normative or economic voids) may
exert on their foreign expansion. Chapter 4 focuses on this emerging body of research
and examines the extent to which the development of the country of origin of MNEs
moderates the relationship between the cultural distance between home and host
markets and the entry mode.
TCT has also been broadly applied to studies examining firms’ decisions that
involve high levels of uncertainty and intangible assets, such as the ones related to
innovation (Gooroochurn and Hanley, 2007). In that context, firms must balance the
risks and costs when pursuing innovation in a shared or fully owned firm. On the one
hand, shared ownership may confer firms cost advantages in the innovation process,
while allowing partners to diminish risks and uncertainty surrounding the final output.
On the other hand, firms may run the risk of increasing costs due to two main reasons.
Firstly, firms incur in ex ante search costs of potential partners and bargaining costs to
enforce the contract that protects each parties’ interests when running the innovation
project. Secondly, firms may experience ex post renegotiation costs stemming from
partners opportunism as the collaborative relationship goes by (Williamson, 1985).
Therefore, organizations should balance the potential cost and risk incurred when
pursuing an innovation project with third parties. Despite its potential implications for
14
MNEs when going abroad with shared-owned ventures, scarce research has been
developed on this matter.
From an international business perspective, scholars have recently underlined
the need to further improve the understanding of MNEs post-entry behavior (Meyer and
Peng, 2016). It is important to know, not just how multinationals enter, but also how
they create value and grow in the host market (Canabal and White, 2008). Surprisingly,
there is a scant number of studies focused on the analysis of the internal processes of
MNEs’ subsidiaries such as the development, coordination, and exploitation of
resources (Meyer and Peng, 2016). Similarly, more studies are needed on subsidiaries’s
competitive behavior abroad (Zhou and Li, 2008).
In sum, a deeper understanding on how MNEs compete abroad may offer new
insights that cover the gaps identified in the international business literature. In that
regard, the integration of the entry mode literature with other bodies of research
explaining subsidiaries’s behavior would advance the state of the art. Chapter 4 tries to
shed light on this issue by addressing the relationship between MNEs entry mode and
its innovation behavior.
1.4. RESEARCH SETTING: THE MOBILE TELECOMMUNICATION
INDUSTRY
The mobile telecommunication industry has drawn the attention of numerous
scholars during the last decades, particularly in the management field (Bijwaard,
Janssen and Maasland, 2008; Fuentelsaz, Garrido and Maicas, 2015; Gómez and Maicas,
2011; Japokin and Klein, 2012; Kim, Park and Jeong, 2004). This is not surprising,
given the growing importance of the telecom industry in driving the digital
transformation of the society as well as its impact on worldwide economic growth.
15
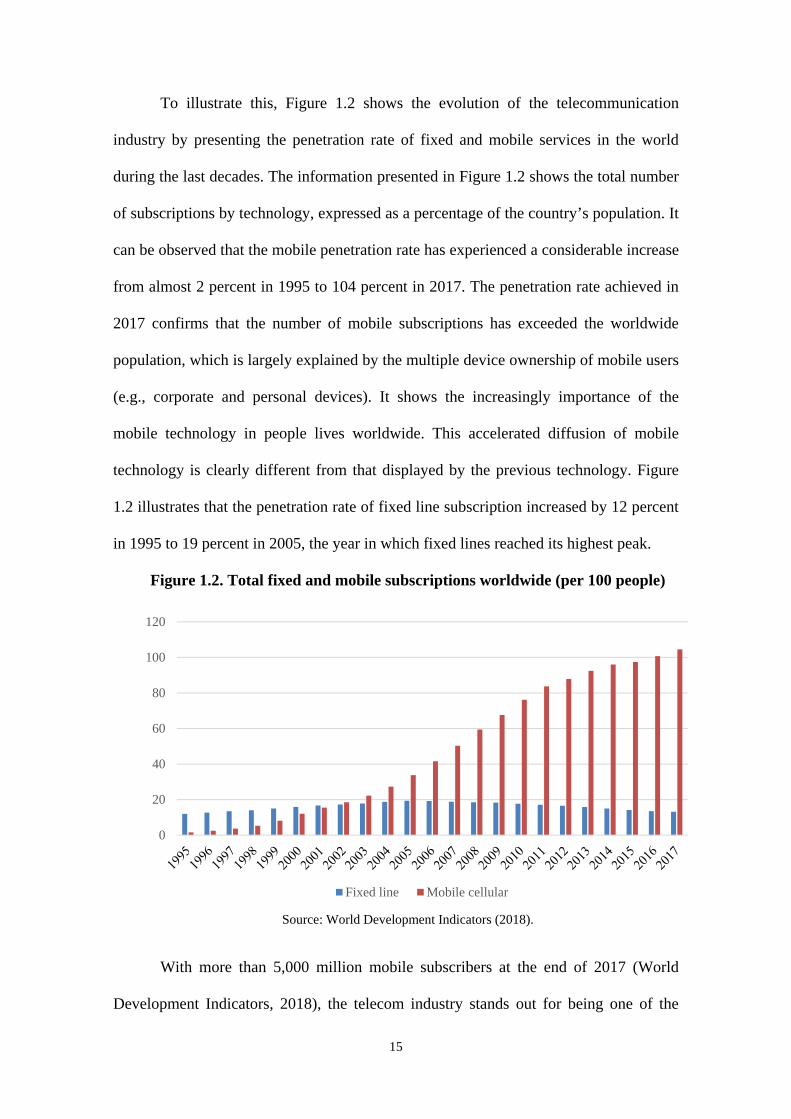
To illustrate this, Figure 1.2 shows the evolution of the telecommunication
industry by presenting the penetration rate of fixed and mobile services in the world
during the last decades. The information presented in Figure 1.2 shows the total number
of subscriptions by technology, expressed as a percentage of the country’s population. It
can be observed that the mobile penetration rate has experienced a considerable increase
from almost 2 percent in 1995 to 104 percent in 2017. The penetration rate achieved in
2017 confirms that the number of mobile subscriptions has exceeded the worldwide
population, which is largely explained by the multiple device ownership of mobile users
(e.g., corporate and personal devices). It shows the increasingly importance of the
mobile technology in people lives worldwide. This accelerated diffusion of mobile
technology is clearly different from that displayed by the previous technology. Figure
1.2 illustrates that the penetration rate of fixed line subscription increased by 12 percent
in 1995 to 19 percent in 2005, the year in which fixed lines reached its highest peak.
Figure 1.2. Total fixed and mobile subscriptions worldwide (per 100 people)
Source: World Development Indicators (2018).
With more than 5,000 million mobile subscribers at the end of 2017 (World
Development Indicators, 2018), the telecom industry stands out for being one of the
0
20
40
60
80
100
120
Fixed line Mobile cellular
16
industries with greater socioeconomic impact worldwide. Regarding its economic
implications, it is important to highlight that the mobile technologies and services
generated 4.5% of GDP globally in 2017, as reported by the GSM Association (2018).
This contribution, which amounted to $3.6 trillion of economic value added, is expected
to reach 5% of total GDP by 2022. Besides, the wider mobile network contributed to the
global economy by supporting a total of 29 million jobs (directly and indirectly) in 2017.
Overall, this illustrates the relevance of the telecom industry to the economic growth.
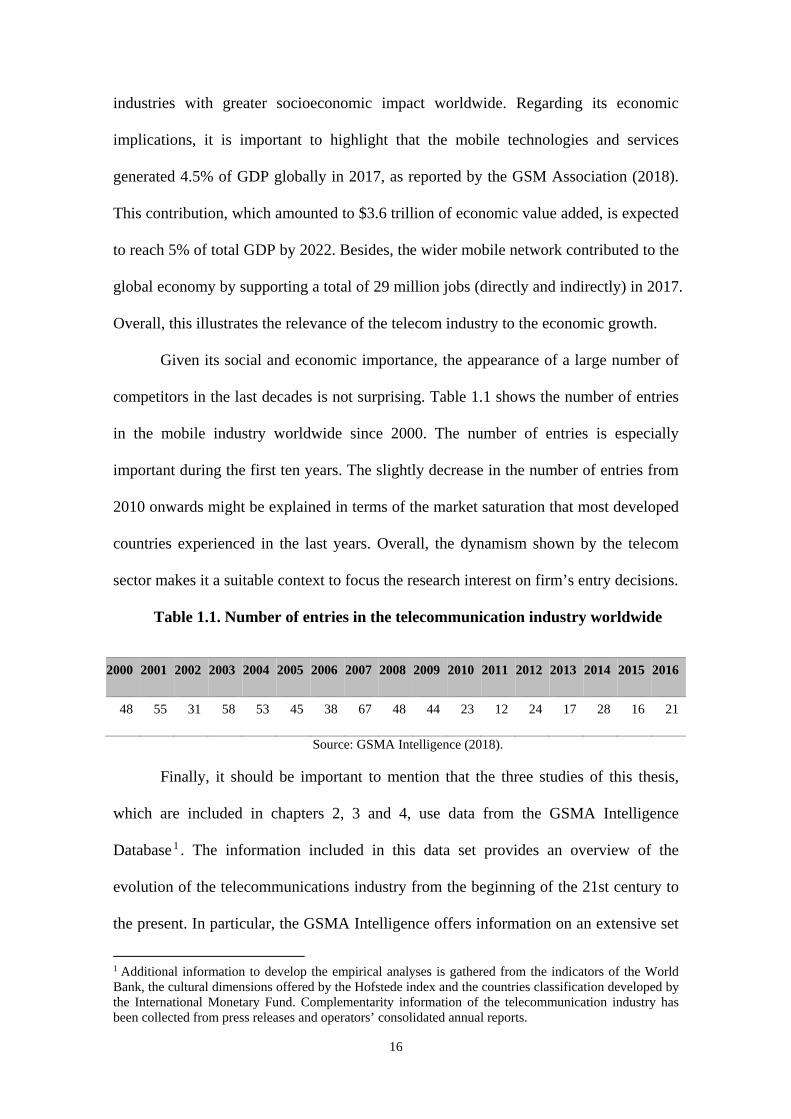
Given its social and economic importance, the appearance of a large number of
competitors in the last decades is not surprising. Table 1.1 shows the number of entries
in the mobile industry worldwide since 2000. The number of entries is especially
important during the first ten years. The slightly decrease in the number of entries from
2010 onwards might be explained in terms of the market saturation that most developed
countries experienced in the last years. Overall, the dynamism shown by the telecom
sector makes it a suitable context to focus the research interest on firm’s entry decisions.
Table 1.1. Number of entries in the telecommunication industry worldwide
2000 2001 2002 2003 2004 2005 2006 2007 2008 2009 2010 2011 2012 2013 2014 2015 2016
48 55 31 58 53 45 38 67 48 44 23 12 24 17 28 16 21
Source: GSMA Intelligence (2018).
Finally, it should be important to mention that the three studies of this thesis,
which are included in chapters 2, 3 and 4, use data from the GSMA Intelligence
Database1 . The information included in this data set provides an overview of the
evolution of the telecommunications industry from the beginning of the 21st century to
the present. In particular, the GSMA Intelligence offers information on an extensive set
1 Additional information to develop the empirical analyses is gathered from the indicators of the World Bank, the cultural dimensions offered by the Hofstede index and the countries classification developed by the International Monetary Fund. Complementarity information of the telecommunication industry has been collected from press releases and operators’ consolidated annual reports.

17
of mobile operator metrics, forecasts and industry reports in every country worldwide.
Among other operating and performance indicators, the database offers information
about firms’ dates of market entry, market share, revenues, ownership structure, price
levels, type and number of technologies launched and service coverage. Such a detailed
data set provides the information necessary to carry out rigorous empirical analyses. In
particular, this information allows us to define the variables used in Chapters 2, 3 and 4
to assess the moment of entry of each firm worldwide, as well as the competitive
position that operators adopt to enter, compete and create value in the long-run. Finally,
it should be highlighted that the GSMA Intelligence encompasses information from the
whole population of mobile communication operators (closed, merged and alive) over
the last two decades, which provides a promising research setting to perform an
exhaustive analysis.
18
1.5. REFERENCES
Beugelsdijk, S., Kostova, T., Kunst, V. E., Spadafora, E., van Essen, M. 2018. Cultural
distance and firm internationalization: A meta-analytical review and theoretical
implications. Journal of Management, 44(1), 89-130.
Bijwaard, G. E., Janssen, M. C., Maasland, E. 2008. Early mover advantages: An
empirical analysis of European mobile phone markets. Telecommunications Policy,
32(3-4), 246-261.
Brouthers, K. D. 2002. Institutional, cultural and transaction cost influences on entry
mode choice and performance. Journal of International Business Studies, 33(2), 203-
221.
Brouthers, K. D., Hennart, J. F. 2007. Boundaries of the firm: Insights from
international entry mode research. Journal of Management, 33(3), 395-425.
Canabal, A., White III, G. O. 2008. Entry mode research: Past and future. International
Business Review, 17(3), 267-284.
Coeurderoy, R., Durand, R. 2004. Leveraging the advantage of early entry: proprietary
technologies versus cost leadership. Journal of Business Research, 57(6), 583-590.
Cuervo‐Cazurra, A. 2012. Extending theory by analyzing developing country
multinational companies: Solving the Goldilocks debate. Global Strategy Journal, 2(3),
153-167.
Fosfuri A, Lanzolla G, Suarez F. 2013. Entry-Timing Strategies: The road ahead. Long
Range Planning, 46, 300-311.
19
Fuentelsaz, L., Garrido, E., Maicas, J.P. 2015. Incumbents, technological change and
institutions: How the value of complementary resources varies across markets. Strategic
Management Journal, 36, 1778–1801.
Gatignon, H., Anderson, E. 1988. The multinational corporation's degree of control over
foreign subsidiaries: An empirical test of a transaction cost explanation. Journal of Law,
Economic and Organizations, 4(2), 305-336.
Gomez, J., Lanzolla, G., Maicas, JP. 2016. The role of industry dynamics in the
persistence of first mover advantages. Long Range Planning, 49(2), 265-281.
Gómez, J., Maícas, JP. 2011. Do switching costs mediate the relationship between entry
timing and performance? Strategic Management Journal, 32(12), 1251-1269.
Gooroochurn, N., Hanley, A. 2007. A tale of two literatures: transaction costs and
property rights in innovation outsourcing. Research Policy, 36(10), 1483-1495.
GSM Association 2018. The Mobile Economy 2018. Available on the website:
https://www.gsma.com/mobileeconomy/wp-content/uploads/2018/05/The-Mobile-
Economy-2018.pdf
Guerras-Martín, LÁ., Madhok, A., Montoro-Sánchez, Á. 2014. The evolution of
strategic management research: Recent trends and current directions. Business Research
Quarterly, 17(2), 69-76.
Jakopin, N. M., Klein, A. 2012. First-mover and incumbency advantages in mobile
telecommunications. Journal of Business Research, 65(3), 362-370.
Kerin RA, Varadarajan PR, Peterson RA. 1992. First-mover advantage: A synthesis,
conceptual framework, and research propositions. The Journal of Marketing, 33-52.
20
Kim, M. K., Park, M. C., Jeong, D. H. 2004. The effects of customer satisfaction and
switching barrier on customer loyalty in Korean mobile telecommunication services.
Telecommunications Policy, 28(2), 145-159.
Lieberman, MB., Montgomery, DB. 1988. First‐mover advantages. Strategic
Management Journal, 9(S1), 41-58.
Lieberman, M.B., Montgomery, D.B., 2013. Conundra and progress: research on entry
order and performance. Long Range Planning, 46 (4-5), 312e324.
Markides, C., Sosa, L. 2013. Pioneering and first mover advantages: the importance of
business models. Long Range Planning, 46(4-5), 325-334.
Meyer, K. E., Peng, M. W. 2016. Theoretical foundations of emerging economy
business research. Journal of International Business Studies, 47(1), 3-22.
Robinson WT, Fornell C, Sullivan M. 1992. Are market pioneers intrinsically stronger
than later entrants? Strategic Management Journal, 13(8), 609-624.
Rogers EM. 1995. Diffusion of innovations. Free Press, New York, Third edition.
Rumelt RP. 1987. Theory, strategy, and entrepreneurship. In D.J. Teece (ed.), The
Competitive Challenge: Strategies for Industrial Innovation and Renewal, 137–158.
Cambridge, MA: Ballinger.
Simon, H. (1982) Models of Bounded Rationality: Behavioral Economics and Business
Organization. Vol. 2, MIT Press, Cambridge, MA.
Suarez, FF., Lanzolla, G. 2007. The role of environmental dynamics in building a first
mover advantage theory. Academy of Management Review, 32(2), 377-392.
21
Tihanyi, L., Griffith, D. A., Russell, C. J. 2005. The effect of cultural distance on entry
mode choice, international diversification, and MNE performance: A meta-analysis.
Journal of International Business Studies, 36(3), 270-283.
VanderWerf PA, Mahon JF. 1997. Meta-analysis of the impact of research methods on
findings of first-mover advantage. Management Science, 43(11), 1510-1519.
Vernon R. 1979. The product cycle hypothesis in a new international environment.
Oxford Bulletin of Economics and Statistics, 41(4), 255-267.
Williamson, O. E. 1985. The Economic Institutions of Capitalism. Free Press, New
York.
Zachary MA, Gianiodis PT, Payne GT, Markman GD. 2015. Entry Timing: Enduring
Lessons and Future Directions. Journal of Management, 41(5), 1388-1415.
Zhao, H., Luo, Y., Suh, T. 2004. Transaction cost determinants and ownership-based
entry mode choice: A meta-analytical review. Journal of International Business Studies,
35(6), 524-544.
Zhou, C., Li, J. 2008. Product innovation in emerging market-based international joint
ventures: An organizational ecology perspective. Journal of International Business
Studies, 39(7), 1114-1132.

22
23
Chapter 2.
DOES ORDER OF ENTRY DETERMINE
COMPETITIVE STRATEGIES?
An analysis of European mobile operators
24
2.1. INTRODUCTION
Entry-timing decisions have been one of the most relevant topics of research for
decades (for a review, see Fosfuri et al., 2013; Kerin et al., 1992; Lieberman and
Montgomery, 1988, 1998; Zachary et al., 2015). One reason is that order of entry has been
considered one of the essential strategic decisions that determine firm survival and growth
(Mascarenhas, 1992; Mitchell, 1991; Robinson and Min, 2002) and profitability (Lambkin,
1988). However, the lack of consensus on its ability to generate a sustainable competitive
advantage has attracted scholars’ attention. As Franco et al. (2009: 1842) maintain, “in spite
of 839 publications on first-mover advantage (FMA) in peer-reviewed journals, its existence
has neither been conclusively proved nor refuted”.
For some authors, this can be partly explained by conceptual problems or
shortcomings in the existing framework (Lieberman and Montgomery, 1998; Suarez and
Lanzolla, 2007; Zachary et al., 2015). Although recent research has improved our
understanding of the isolating mechanisms (Gómez and Maicas, 2011), of the role of firm
capabilities (Franco et al., 2009) and of the enabling effects of macro contingencies (Gómez,
Lanzolla and Maicas, 2016; Suarez and Lanzolla, 2007), there are still some gaps that need to
be filled. In this context, different studies emphasize the importance of business models
(Markides and Sosa, 2013) and competitive strategies (Zachary et al., 2015) in the
explanation of first mover advantages. Furthermore, they stress that there is “insufficient
research on postentry strategies” (Zachary et al., 2015: 1408). Despite the relevance of these
topics for the conceptual underpinnings of the theory of first mover advantages and for our
understanding of the empirical evidence, research on these two areas is scarce.
In this paper, we change the focus of research on first mover advantages from the
analysis of the entry timing strategy to the study of the strategy of entry. Our first objective in
this paper is to study whether the order of entry is associated with differences in the
25
competitive strategy followed by firms. Therefore, we do not focus on explaining the
performance effects of the order of entry, but on the choice of competitive strategy by the
different cohorts of entrant. We argue that pioneers are more likely to choose a differentiation
strategy at entry, the reason being that innovators and early adopter consumers, who are more
likely to be less concerned with uncertainty, are also likely to have a higher willingness to
pay (Rogers, 1995). In this context, a differentiation strategy offers the best fit with the type
of consumer found in the early stages of development of a market. At the same time, this
strategy also offers a way to take advantage of the isolating mechanisms proposed by
Lieberman and Montgomery (1988)—namely, switching costs, technological leadership and
pre-emption of scarce assets.
Our second objective is to study how the strategies of the pioneers evolve over time.
Conceptually, this implies an understanding of entry as a process and not as an isolated event
(Zachary et al., 2015). This is critical if we want to comprehend the way in which first
movers preserve their advantage over time through the competitive strategy chosen, or how
these advantages disappear, as the literature suggests (Lieberman and Montgomery, 1998,
2013). It also implies that we explicitly incorporate time in our theoretical framework and in
our analyses (Zachary et al., 2015).
After developing our conceptual model along those lines, we test our hypotheses on
data from the European mobile telecommunications industry for the period 2000–2016. This
industry generated three per cent of the European GDP in 2014 (GSMA, 2015) and has
experienced significant growth in the last two decades. For example, during the period 1998–
2017, the average mobile penetration rate increased from 20% to almost 135% in Europe,
according to the information provided by the GSM Association. Significant market growth
and the desire by regulatory authorities to introduce competition have offered opportunities
for new entrants that have attempted to erode the profitability of incumbents. This allows the
26
distinction of different cohorts of entrants, depending on their order of entry, and the
characterization of their competitive strategies. Importantly, previous research has shown the
importance of first mover advantages (Eggers, Grajeck and Kretschmer, 2011; Gómez et al.,
2016; Gómez and Maicas, 2011; Jakopin and Klein, 2012) and firm competitive behaviour
(Fernández and Usero, 2009) in this industry. However, research has not integrated their
analysis.
This paper contributes to the literature in several ways. Firstly, from a conceptual
perspective, we provide a valuable integration between the order of entry and the competitive
strategy literatures that expands our knowledge on first mover advantages (see, for example,
Markides and Sosa, 2013). To answer this question is important for the findings of first
mover advantages literature. If the order of entry were related to the competitive strategy
followed by firms, first mover advantages could in fact be explained by the competitive
strategy chosen. Therefore, at least a part of the effect attributed to order of market entry
would be explained by competitive strategy. From an empirical point of view, this would
suggest the need to control for this effect in the analysis of the order of entry-performance
relationship. This should contribute to the understanding of the divergent results found in
prior studies and to the comprehension of the way in which pioneers obtain competitive
advantage. Accordingly, we adopt a configural approach to the study of order of entry
advantage (Zachary et al., 2015) in which different cohorts of entrant have different optimal
competitive strategies. To make this integration effective, we use the product lifecycle
concept (Vernon, 1979) and we draw on the literature on diffusion of innovation among
consumers (Rogers, 1995). The characterization of the competitive strategies chosen by each
cohort of entrants will improve our understanding of how pioneers create value. Although we
do not analyse performance in this paper, the discovery of a pattern in this relationship (i.e.
27
that entry order is related to competitive strategy) would suggest that first mover advantages
depend on the competitive strategy chosen.
Secondly, although in this Chapter we do not analyse firm performance, the
assessment provides new insights on the persistence of first mover advantages by examining
how strategies evolve over time (Zachary et al., 2015). Taking advantage of the longitudinal
nature of our dataset, we are able to analyse a firm’s competitive behaviour throughout more
than a decade of competition. By doing so, we address recent demands for enriched studies
that take into consideration the dynamism of the competitive environment and the temporality
of firms’ advantages (Lieberman and Montgomery, 2013).
Finally, we also contribute to the literature on business strategies by studying the
determinants of strategic choices and competitive positioning at the business level (Argyres et
al., 2015). Dominant theories have considered the product lifecycle as an influential factor
when defining suitable business strategies (for a review, see Hofer, 1975). This study
proposes order of market entry as a central determinant of competitive strategy. This
relationship is consistent with that followed by scholars using a contingency perspective (see
Kerin et al., 1992; Szymanski et al., 1995).
The rest of the paper is structured as follows. In the next section, we provide a brief
review of the relevant literature, paying special attention to the relationship between order of
entry and competitive strategy. In the third section, we present our hypotheses. Section four
defines the research setting and the variables. Finally, the last part of the paper describes the
main results and highlights the key conclusions and suggestions for future research.
28
2.2. BACKGROUND TO FIRST MOVER ADVANTAGE AND COMPETITIVE
STRATEGY
2.2.1. The literature on first mover advantage
Pioneering a market has been frequently proposed as a source of competitive
advantage (Lieberman and Montgomery 1988). As a consequence, research on FMAs has
attracted the attention of numerous scholars and different explanations of the findings have
prompted a constant evolution of this literature in the last decades. Initial FMAs studies were
unable to present conclusive evidence related to the effectiveness of order of market entry.
While several papers supported the existence of FMAs (Lambkin, 1988; Mascarenhas, 1992;
Szymanski et al., 1995), others showed inconclusive evidence or even rejected its existence
(Golder and Tellis, 1993; Lilien and Yoon, 1990). The meta-analysis performed by
Vanderwerf and Mahon (1997) shows that FMAs was detected in the majority of the studies.
However, it also concluded that the results are largely dependent on certain characteristics,
such as the selection of the industry by the researcher, the methods used and a lack of control
for entrants’ strength. The conflicting evidence and the need to disentangle the mechanisms
creating FMAs have motivated the development of this line of research.
One of the first areas of investigation dealt with the “isolating mechanisms” that allow
early entrants to protect themselves from competition (Day and Freeman, 1990; Rumelt,
1987). Although different classifications have been developed, the most widely accepted is
that of Lieberman and Montgomery (1988). It distinguishes between technological
leadership, pre-emption of scarce assets and buyer’s switching cost. Based on this
classification, several studies have empirically tested how the isolating mechanisms influence
the relationship between order of market entry and performance (Bohlmann et al., 2002;
Boulding and Christen, 2008; Gómez and Maicas, 2011). For example, Gómez and Maicas
(2011) find that FMAs may be at least partly explained in terms of switching costs.
29
Bohlmann et al. (2002) demonstrate that pioneer advantages from pre-emption may not be so
strong as to avoid later entrants’ overtaking.
Research has also explored the macro and micro determinants of FMAs. These studies
are motivated by the need to consider certain contingencies that may affect the boundary
conditions of the theory and our understanding of the findings (Suarez and Lanzolla, 2007).
On the one hand, researchers have used the ideas of the structure-conduct-performance
paradigm (Bain, 1951; Mason, 1939) to analyse how factors such as market structure (Katz
and Shapiro, 1992) or the degree of competition (Farrell and Saloner, 1985) may affect FMAs
(for a review, see Fosfuri et al., 2013). Similarly, Suarez and Lanzolla (2007) have studied
the role of market growth and technological change in explaining first mover advantages (see
also Gómez et al., 2016).
On the other hand, research has also used the resource-based view (RBV) to identify
firm-specific factors that could explain FMAs. A firm’s resource strength will affect its
ability to take advantage of pioneering (Franco et al., 2009; Mitchell, 1991). For instance,
some studies argue that R&D capabilities may be associated with early entry (Robinson et al.,
1992) and that both larger firms and firms with a superior level of international experience
are often early movers (Gaba et al., 2002). Similarly, Hawk et al. (2013: 1533) find that firms
with higher intrinsic speed capabilities—that is, greater ability to execute investment projects
faster than competitors at the same cost—can wait longer to penetrate an emerging market
without experiencing a negative influence in their expected post-entry performance. This line
of enquiry emphasizes the importance of an alignment between the firm’s relevant resources
and capabilities and the order of entry to effectively obtain the benefits of entering in the first
place.
Finally, scholars have proposed other contingences that allow followers to create an
advantage and even surpass the pioneer (Fosfuri et al., 2013). This has led them to explore
30
the idea that the strategic orientation chosen by pioneers and followers may be different. This
is important, because systematic differences in the strategies employed by pioneers and
followers could explain some of the differences in performance found between them. Recent
research seems to confirm this idea. For example, Shamsie et al. (2004) show that strategic
positioning influences the capacity of late entrants to enter the market successfully. Similarly,
Klingebiel and Joseph (2015: 1013) conclude that “strategy varies with entry timing” in their
study of innovation strategies. Surprisingly, up to now this idea has received little attention.
Markides and Sosa (2013: 325) highlight that “the literature does not explicitly consider
either the strategy (or business model) that the pioneer uses to exploit FMAs or the
strategy/business model that later entrants use to attack the pioneer as important determinants
of the profitability of pioneering”. In this paper, we pay attention to this issue by considering
the relationship between entry timing and competitive strategy. Additionally, we study the
changes in pioneers’ strategy over time. Therefore, we address the “insufficient research on
postentry strategies” and analyse the post-entry plans that pioneers develop (Zachary et al.,
2015: 1408).
2.2.2. Order of entry and competitive strategy
A classic assumption in strategic management is that firm performance is critically
determined by industry and firm factors (McGahan and Porter, 1997; Rumelt, 1991). Among
the latter, the role of a firm’s strategy is one of the most important topics of study. In this
paper, we explore the role of strategy in the context of FMAs. To do so, we focus on business
level strategy, understood as the way in which a firm competes in a given business.
Several classifications of competitive strategy have been proposed (Abell, 1980;
Hambrick, 1984; Miles and Snow, 1978; Mintzberg, 1988). However, Porter's (1980)
taxonomy has been one of the most accepted within the field. Porter proposes two main
routes to achieve sustainable competitive advantage: differentiation and cost leadership.
31
Firms that pursue differentiation strategies focus on creating products and services perceived
as unique, for which considerable investments in design, quality or brand reputation are
required. Firms following a cost leadership strategy aim at becoming the lowest cost producer
in the industry. This implies continuous efforts focused on process cost reductions,
diminution of distribution expenses and product cost minimization in areas such as R&D,
customer service or advertising.
The two competitive strategies have traditionally been understood as mutually
exclusive, the reason being that the set of resources and organizational arrangements needed
to carry them out are basically incompatible. This has caused the emergence of an academic
debate about the possibilities and potential benefits of employing either pure or mixed
strategies (for a review, see Pertusa-Ortega et al., 2009). As a consequence, the literature has
explored the importance of hybrid strategies that combine the positive elements of both
differentiation and cost leadership to obtain a sustained advantage (Hill, 1988; Kim et al.,
2004; Li and Li, 2008; Miller, 1992; Miller and Dess, 1993). This exploration has still not
provided strong evidence of the supremacy of combined strategies in terms of firm
performance. While Thornhill and White (2007) claim that strategic purity tends to perform
better than hybrid strategies, the main results obtained by Spanos et al. (2004) confirm that
hybrid strategies are not only more desirable than pure ones but are also more profitable, as
the number of strategy components emphasized is increased.
In this paper, we argue that competitive strategies are determined by order of market
entry and that they evolve over time. The integration of the literatures on FMAs and
competitive strategy may benefit our understanding of the performance effects of competitive
strategy. For example, the suitability of some strategies (differentiation, for instance) may
depend on the ability of a firm to be the first in the market and to take advantage of certain
isolating mechanisms. Similarly, other strategies (cost leadership, for instance) may be the
32
best alternative to compete in markets populated by differentiated competitors. This
integration may also benefit our understanding of first mover advantages. In particular,
pioneers may take advantage of a competitive strategy that exploits the isolating mechanisms
to a higher extent. Similarly, their performance may suffer if they use a competitive strategy
that does not fit with the prevailing market conditions at entry.
Despite the convenience of a better understanding of the determinants of competitive
strategy and of the fit between pioneering and competitive strategy, the literature on this issue
is scarce. Hofer (1975) presents several theoretical propositions that link the product lifecycle
to business strategies. Research has also analysed competitive strategies in the context of
entry timing. The interest has focused on (1) whether following a specific competitive
strategy provides pioneers or followers with a greater sustainable advantage (De Castro and
Chrisman, 1995; Durand and Coeurderoy, 2001; Fernández and Usero, 2009; Ruiz-Ortega
and García-Villaverde, 2008); (2) the type of competitive actions that allow followers to
erode a pioneer’s advantage (Schnaars, 1994; Usero and Fernández, 2009); and (3) how
pioneers react to the feasible erosion of their competitive advantage (Shankar, 1997). Extant
research uses self-selected pioneers (De Castro and Chrisman, 1995), it is cross-sectional
(Durand and Coeurderoy, 2001; Ruiz-Ortega and García-Villaverde, 2008), it focuses on firm
actions and reactions, and not on strategy types (Fernández and Usero, 2009; Schnaars, 1994;
Shankar, 1997; Usero and Fernández, 2009), and it does not study the evolution of business
strategies over time. More recent research focuses on innovation strategies (Klingebiel and
Joseph, 2015) rather than on competitive strategies. Given the shortage of research in this
field, recent studies show an interest in developing a theoretical explanation about “who
chooses which strategy” or what events generate certain strategic responses (Argyres et al.,
2015: 221). Although Argyres et al. (2015) seek to address these concerns, their focus is
exclusively on the follower’s dilemma to strategically respond after an innovation shock. We
33
take a different perspective in which we focus on explaining entry and post-entry competitive
strategies of pioneers vis-à-vis follower firms.
In conclusion, the literature on FMAs shows a lack of emphasis on entry and post-
entry strategies (Zachary et al., 2015). In this paper, we adopt a configural approach to the
study of first mover advantages that suggests that the choice of a specific competitive strategy
is determined by the order of entry. Accordingly, we focus our analysis on an intermediate
step within the classical relationship between order of entry and performance by studying the
choice of competitive strategy.1 Furthermore, going beyond the common understanding of
entry as a punctual event, we consider its analysis as a dynamic process (Zachary et al.,
2015). In this sense, the strategy employed by a pioneer may vary across time according to its
experience and changing market conditions. For this purpose, we take advantage of the
longitudinal nature of our database to study whether pioneer strategies vary depending on a
firm’s time in the market. The following section uses the basic tenets of the product lifecycle
(Vernon, 1979) and the theory of diffusion of innovation among consumers (Rogers, 1995) to
develop our hypotheses.
2.3. HYPOTHESES
2.3.1. Pioneers and followers use different strategies
To understand the choice of a given competitive strategy, we integrate innovation
diffusion theory (Rogers, 1995) and the theory of first mover advantage (Lieberman and
Montgomery, 1998). In particular, we argue that firms will choose the most adequate
competitive strategy in terms of both the type of demand that they confront when they enter
the market and the opportunities to take advantage of the isolating mechanisms.
Innovation diffusion theory provides a useful model to understand how consumers
adopt innovations. There are two key insights that may contribute to our understanding of the
1 Although both order of entry and competitive strategy may influence performance, in this paper we limit our attention to the relationship between order of entry and competitive strategy.
34
types of strategy pioneers use. The first is that the rate of adoption of an innovation varies
over time according to a normal distribution (Rogers, 1995). In particular, when the
innovation appears in the market, consumers do not have much information over its utility,
and information spreading through social interaction is a slow mechanism, given the low
numbers of initial adopters. Therefore, at least initially, pioneers have to deal with lower
relative levels of demand and low adoption rates. Afterwards, if the innovation is accepted
and information on it diffuses, the rate of adoption accelerates until the market approaches
satiation.
The second insight is that the type of consumer is different depending on the time of
adoption. Rogers (1995) classifies consumers into five categories: innovators, early adopters,
early majority, late majority and laggards. Innovators and early adopters tend to be highly
demanding, technologically educated individuals, less concerned with uncertainty and risk,
and more willing to purchase and pay a high price to acquire new products, even when the
technology´s success is not fully guaranteed (Rogers, 1995). Since both categories of early
consumer are characterized by enjoying higher socioeconomic status, they would have the
available financial resources to acquire those higher-cost innovative products offered initially
in the marketplace. If those early adopters are satisfied, they will act as reliable opinion
leaders for the largest customer segments of the market.
At the same time, obtaining FMAs critically depends on the effectiveness of the
isolating mechanisms. Researchers have conceptualized and classified the isolating
mechanisms in several ways (Golder and Tellis, 1993; Kerin et al., 1992; Mueller, 1997).
However, the most widely accepted is Lieberman and Montgomery’s (1988) categorization
into three types: technology leadership, pre-emption of scarce assets and switching
costs/buyer choice under uncertainty. Our main argument is that firms will use a competitive
strategy that guarantees the best fit with the isolating mechanisms most suitable to provide
35
them with a performance advantage, given prevailing market conditions (levels of demand,
adoption rates and type of consumers). In our view, the differentiation strategy will be the
one that offers an optimal fit for pioneers.
Differentiation strategies are consistent with both the creation of high switching costs
and the characteristics of the demand in the initial stages of a market. The first product to hit
the market receives “disproportionate attention in the consumer’s mind” (Lieberman and
Montgomery, 1988: 46), which creates a preference for the product or service of the pioneer
that converts into a higher willingness to pay. The literature on marketing psychology shows
that the influence on preferences may be significant, with the first product hitting the market
becoming the prototype of the category (Carpenter and Nakamoto, 1989). Additionally, given
that customers are completely uninformed about valuable product features during the initial
stages of market development, pioneers usually invest considerable marketing expenditure to
educate potential users. Therefore, by achieving brand loyalty, customer recognition and even
by becoming the prototype of the category, pioneers can establish cognitive entry barriers that
protect from future market share erosion. At the same time, in the initial stages of the market,
adoption by less risk averse consumers with a higher socioeconomic status may convert these
benefits into profits.
The use of a differentiation strategy is also consistent with a second isolating
mechanism, the pre-emption of scarce assets of superior quality. Since a restricted number of
firms will be able to achieve a profitable position in most markets (Lieberman and
Montgomery, 1988), pioneers may take advantage of their early entry through strategic
selection of mobile and non-mobile assets. Regarding non-mobile assets, pioneers may
disincentive competitors’ entry as a consequence of spatial pre-emption (Rao and Rutenberg,
1979). Selecting the most attractive niches to exploit, first movers will diminish profitable
space through product and geographic expansion. It is expected that, in the initial stages of
36
development of a market, pioneers will show a preference to attract those users with higher
socioeconomic status. Recent studies confirm that essentially high-quality pioneers—those
with superior core technological experience—would be able to benefit from early entry by
capturing the smaller but more demanding and profitable market segments (Eggers et al.,
2013).
Additionally, pioneers may be able to acquire or control valuable mobile resources
such as the most skilled workforce, greater suppliers, a wide range of distribution channels,
higher quality inputs, or the most advanced technologies. These assets provide services of a
superior quality that may provide the basis for a differentiation strategy.
Finally, pioneers may benefit from taking advantage of technological leadership
through learning or experience curve economies, and from their success in patent or R&D
races. Although it could be argued that the first form of technological leadership (learning or
experience curve economies) is consistent with a preference for a cost leadership strategy, the
slow increase in market demand in the first stages of a new market makes this unlikely.
Additionally, learning cost advantages seem not to persist over time. Several studies confirm
that knowledge diffusion occurs rapidly in most industries and firm advantages derived from
learning curves are difficult to sustain (Agarwal and Gort, 2001; Lieberman and
Montgomery, 1988; Vidal and Mitchell, 2013). Moreover, the cost benefits from learning
curve effects are conditioned by the stability of both technological progress and customers’
preferences (Kerin et al., 1992). Finally, even if a low cost position is viable, product
differentiation may be an adequate strategy to achieve it by attracting customers and
capturing a greater market share that creates scale economies and a strong costs position in
the long run (Hill, 1988).

37
On the whole, these arguments allow us to propose the first hypothesis:2
Hypothesis 1: Pioneers will be more likely to choose a differentiation strategy in their
initial stages in the market compared to follower firms.
2.3.2. Pioneers’ strategies change over time
In hypothesis 1 we proposed that pioneers are more likely to follow a differentiation
strategy than late entrants. Now we focus on how the strategy of the pioneer evolves over
time. Research on the industry lifecycle shows that markets change over time by following a
general pattern (see, for example, Keppler, 1997; Vernon, 1979). As markets mature, the
development of a more competitive and demanding industry is highly probable and a change
in pioneers’ strategic positioning may be required. Therefore, our argument is that pioneers
will need to reposition in order to cope with changing competitive demands. These changes
would be motivated by a need to adapt to new market conditions, which may be due to the
entry of new competitors and increasing pressure over costs, or to changes in the type of
niche segments that pioneers must face. Under these circumstances, it is more likely that the
pioneer modifies its strategy from differentiation towards a hybrid strategy rather than
towards cost leadership over time (De Castro and Chrisman, 1995). There are several reasons
for this.
Firstly, changing from a pure strategy to a hybrid one involves complementing the
current competition base through the acquisition of new resources and the development of
capabilities and certain skills not previously used. However, moving from a pure
differentiation strategy to a cost strategy is much more risky, costly and unpredictable, given
2 There are additional reasons why we should expect pioneers to use a differentiation strategy. Firstly,
differentiation confers more flexibility to act strategically in the long run, and it also brings firms a specific and non-imitable basis of sustainable advantage to compete when a minimum cost position is achieved by competitors (Hill, 1988). Secondly, pioneering a market implies a significant investment and probably high initial fixed costs associated with entry. The investments in plant and equipment needed to create and maintain the infrastructure to operate will have to be compensated by a sufficient level of profits to cover such initial costs (Greenstein and Mazzeo, 2006). Accordingly, it seems reasonable to suspect that higher prices will be established to support initial loads and that a cost leadership strategy is less likely to be used.

38
that it involves a complete change of the set of capabilities the firm is using to compete (De
Castro and Chrisman, 1995). It is important to bear in mind that the successful
implementation of a strategy requires an alignment with different organizational elements
including culture, structure and tasks. Accordingly, strategy renewal will require a change in
these organizational elements, so that a fit between them and the strategy itself is achieved.
Achieving this fit is not easy. Firms may find highly complex to obtain the new conditions,
particularly the resources and capabilities necessary to carry out a radical new strategy. This
makes the change from a differentiation to a cost strategy less likely. Considerable
investment in differentiation can create rigidities. For example, a differentiation strategy can
cause rigid cost structures. Organizational inertia may be another obstacle to engagement in
radical strategy renewal (Gilbert, 2005).
Second, a combination of generic competitive strategies may be appropriate for firms
to adapt to different environments and changing consumer demands (Booth and Philip, 1998;
Miller, 1992; Pertusa-Ortega et al., 2009). In this context, it seems likely that pioneers would
prefer to combine competitive decisions that show effectiveness in both strategic dimensions.
This would allow pioneers to meet changing demands more successfully than pursuing a pure
strategy. Particularly as the market evolves through the industry lifecycle and more
competitors enter, the pressure over cost means that pioneers have to adapt their cost
structures (Grant, 2015). If they have initially followed a differentiation strategy, as proposed
in our first hypothesis, this means that they will also have to reduce their costs in order to
cope with competition.
Third, having a multifaceted strategy makes it difficult for rivals to pinpoint and
replicate (Booth and Philip, 1998). Thus, a more complex, creative, innovative and unknown
combination of both cost and differentiation drivers may help firms to take a superior
advantage and hinder competitors' imitation. Giachetti (2016) shows that the greater and
39
more complex a firm’s strategic repertoire in terms of a wider range of different types of
competitive action undertaken to outperform its rivals in the marketplace, the greater the
likelihood of success.
Finally, as previous studies support, pioneers in growing and mature markets tend to
be involved in the development of minor projects in preference to major ones (Robinson and
Chiang 2002), such as incremental product innovations or line extensions, to maintain their
differentiated position. Thus, although pioneers are consequently forced to invest a
considerable amount of resources in R&D projects, the incremental nature of those
improvements makes it possible to take advantage of its previous product development
experience. Making use of benefits from learning curves, pioneers would be able to continue
innovating while reducing manufacturing expenses along the product line.
Taking these arguments into account, we propose the second hypothesis:
Hypothesis 2: Over time, pioneers will be more likely to follow a hybrid strategy.
2.4. EMPIRICAL ANALYSIS
2.4.1. Data and sample
2.4.1.1. Research setting: mobile communications industry
In order to test our hypotheses, we draw on data covering all mobile network operators
(MNOs) in the European mobile communications sector.3 The information to carry out the
empirical analysis mainly comes from the GSMA Intelligence Database (2016), which
provides quarterly information about MNOs along multiple dimensions such as market
penetration, market share, revenues, coverage or technology launching dates of any
participant in the industry (active, merged or closed). Additional information has been
collected from press releases and operators’ consolidated annual reports.
3 We consider the following countries: Albania, Austria, Belgium, Bosnia and Herzegovina, Bulgaria, Croatia, Czech Republic, Denmark, Estonia, Finland, France, Germany, Greece, Hungary, Ireland, Italy, Latvia, Lithuania, Luxembourg, Malta, Montenegro, The Netherlands, Norway, Poland, Portugal, Romania, Serbia, Slovakia, Slovenia, Spain, Sweden, Switzerland and the United Kingdom.
40
The mobile telecommunications industry is highly dynamic and characterized by rapid
technological improvements. We focus the analysis on the period between the beginning of
2000 (or from the first point when an operator appeared if it entered at a later date) and the
first quarter of 2016. This allows us to observe significant changes in terms of product
evolution4 and competitive strategies. Regarding the latter, we are able to characterize the
competitive strategies of all the firms competing in the market through three measures that
capture the relative position of the different cohorts of entrant in terms of product quality,
prices and costs. Importantly, the data allow us to observe the evolution of competitive
strategy over time.
2.4.1.2. Variable description
Dependent variables
As Leitner and Güldenberg (2010) explain, there are diverse approaches to define a
firm’s competitive strategy as a result of the variety of variables and methods applied (see
also Campbell-Hunt, 2000). While some authors use managers’ perceptions (Bowman and
Ambrosini, 1997; Kotha and Vadlamani, 1995; Spanos and Lioukas, 2001; Thornhill and
White, 2007; Zahra and Covin, 1993), there are other scholars who use firms’ investments or
accomplished actions to capture their strategic conduct (David et al., 2002; Spanos et al.,
2004; Wu et al., 2007). In this paper, we follow the latter approach. Therefore, our analysis is
based on firms observed conduct, which determines (at least partially) the performance
obtained.
In order to represent the competitive orientation of each firm, we use three general
measures identified by prior studies as reflecting Porter’s (1980) cost leadership and
differentiation strategy. These measures capture relative quality, relative prices and relative
operating efficiency. 4 In the analysed period, the telecommunications industry experienced important changes, basically as a consequence of the irruption of 3G and 4G. New competitive scenarios emerged and multiple technological opportunities allowed both incumbents and new entrants to take advantage of them.

41
Relative quality. Quality is generally associated with differentiation strategies (De
Castro and Chrisman, 1995; Kotha and Vadlamani, 1995). Firms create consumer value and
provide a sense of uniqueness by improving product attributes and by increasing the quality
of the product offered. In contrast, firms pursuing cost strategies attempt to maintain a low
quality gap with differentiation leaders while being the minimum cost producers in the
industry (Porter, 1980).
Regarding the service offered, the mobile telecommunications sector has experienced
considerable changes in terms of product characteristics and functionalities since its
beginning (see GSMA Intelligence, 2014). Although the first generation (1G) only supported
analogue phone calls, the second generation (2G) included digital phone calls, messaging
and, for the first time, data services. However, limited data rates created difficulties in
supporting the demand for related services (e.g. e-mail access). This was a critical issue that
was solved by the third generation (3G), which offers improved data packages to achieve a
superior Internet experience. Finally, the evolution from 3G to 4G services offers users
access to substantially faster data rates and a reduction in the network latency. All in all, the
incremental improvements modify how people make use of the services available on mobile
devices.
To capture relative quality, we use three different measures (broadband speed, network
coverage and technological standard breadth). Broadband speed is calculated as the sum of
the download and upload speeds offered by an operator in megabits per second (Mb/s). We
include this measure under the assumption that the higher the speed offered, the better the
quality of the services provided to navigate. Network coverage is the total mobile coverage,
expressed as a percentage of the total market population. The greater the coverage offered,
the more likely it is that a user can call without connectivity errors (blocked calls because of
heavy demand on the network), unexpectedly dropped calls (as a result of, for instance, users
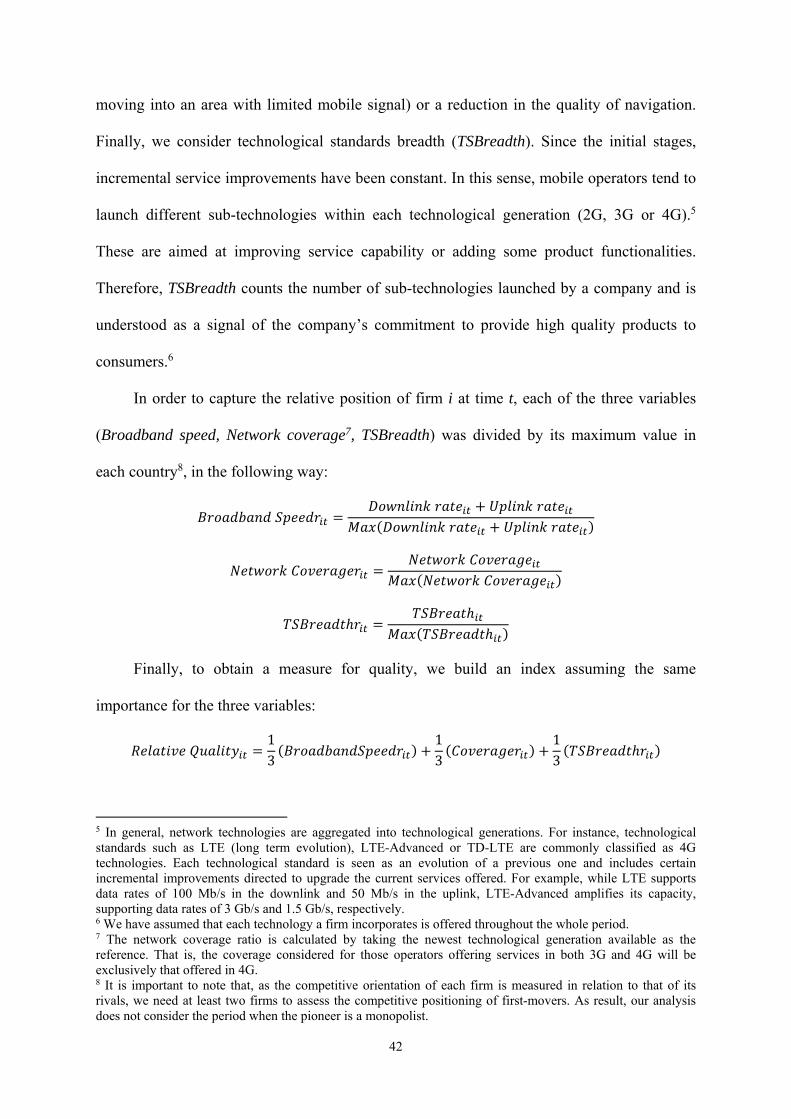
42
moving into an area with limited mobile signal) or a reduction in the quality of navigation.
Finally, we consider technological standards breadth (TSBreadth). Since the initial stages,
incremental service improvements have been constant. In this sense, mobile operators tend to
launch different sub-technologies within each technological generation (2G, 3G or 4G).5
These are aimed at improving service capability or adding some product functionalities.
Therefore, TSBreadth counts the number of sub-technologies launched by a company and is
understood as a signal of the company’s commitment to provide high quality products to
consumers.6
In order to capture the relative position of firm i at time t, each of the three variables
(Broadband speed, Network coverage7, TSBreadth) was divided by its maximum value in
each country8, in the following way:
Finally, to obtain a measure for quality, we build an index assuming the same
importance for the three variables:
13
13
13
5 In general, network technologies are aggregated into technological generations. For instance, technological standards such as LTE (long term evolution), LTE-Advanced or TD-LTE are commonly classified as 4G technologies. Each technological standard is seen as an evolution of a previous one and includes certain incremental improvements directed to upgrade the current services offered. For example, while LTE supports data rates of 100 Mb/s in the downlink and 50 Mb/s in the uplink, LTE-Advanced amplifies its capacity, supporting data rates of 3 Gb/s and 1.5 Gb/s, respectively. 6 We have assumed that each technology a firm incorporates is offered throughout the whole period. 7 The network coverage ratio is calculated by taking the newest technological generation available as the reference. That is, the coverage considered for those operators offering services in both 3G and 4G will be exclusively that offered in 4G. 8 It is important to note that, as the competitive orientation of each firm is measured in relation to that of its rivals, we need at least two firms to assess the competitive positioning of first-movers. As result, our analysis does not consider the period when the pioneer is a monopolist.
43
Therefore, higher values of this variable mean that the firm offers a higher quality
than competitors and that the firm is closer to a differentiation strategy.
Relative prices. Comparing firms’ and competitors’ prices is one way to identify
differentiation and costs strategies (Dess and Davis, 1984; Kotha and Vadlamani, 1995;
Miller et al., 1989; Zott and Amit, 2008). Differentiation usually requires greater investments
that are generally followed by high prices (De Castro and Chrisman, 1995). In contrast, firms
with a cost orientation are able to maintain lower prices due to their ability to benefit from
more favourable cost structures.
In our sector, the definition of homogeneous prices for the service offered is a
controversial issue. The main reason is that mobile telecommunications services are
multidimensional.9 This hinders the possibility of defining a homogeneous measure of mobile
operators’ prices, as opposed to other industries where prices could be perfectly compared in
each product category. In order to solve this, studies on the mobile telecommunications
industry employ different measures.
While Doganoglu and Grzybowski (2007) construct operator-specific price indexes
from public information on the multiple tariffs offered by each firm, Grajeck (2010: 135)
defines price as the “best-deal monthly bill” in terms of the lowest bill an average consumer
must pay. Both calculate prices through the available information in a single country, but our
study is international. To reduce the complexity of this exercise into simpler and more
comparable measures, two dimensions may be identified as the most commonly used from an
international perspective: the revenue per minute, or RpM (Maicas and Sesé, 2015) and the
average revenue per user, or ARpU (Shy 2002). Although RpM might seem to be a better
proxy for prices if the purchase decision is based on the per-minute cost assumed by the user,
9 Apart from diverse tariffs, which may differ depending on the time of day, prices tend to vary according to the characteristics of the receiver of the phone call, the usage of additional services such as short or multimedia messages, and the data packages hired.
44
ARpU shows the global cost of the multidimensional service offered (including additional
information related to, for example, data services which are not priced in a per-minute basis).
Taking these arguments into consideration, we adopt the latter measure to study
prices. As with quality, we build a measure of relative prices per country by dividing the
quarterly ARpU of an operator by the maximum ARpU generated by competitors in the same
period.
Relative operating efficiency. Finally, we capture the cost position of firms. Operating
costs are usually considered to identify the firms following cost strategies (Dess and Davis,
1984; Zahra and Covin, 1993). Several studies have linked a cost leadership orientation with
a minimization of product-related expenditures (Nayyar, 1993; Zott and Amit, 2008) and with
a reduction in general operating cost (Thornhill and White, 2007).
We obtain the ratio of relative operating efficiency in two steps. Firstly, for each firm,
we divide operational expenses by the total number of connections (subscriptions) registered
on the mobile network.10 Secondly, in order to calculate the relative cost position, the ratio is
divided by the maximum in the market. Therefore, the maximum value of this variable is 1.
The greater the value of this ratio, the more inefficient the operator is and the further it is
from a cost leadership strategy.
Independent variables
Order of entry. Different taxonomies have been employed to classify market entries.
Golder and Tellis (1993) define the market pioneer as the first firm that enters a new product
category. Similarly, Carpenter and Nakamoto (1989: 286) consider the pioneer as the first
firm to introduce a “competitively distinct” product. In this vein, several authors have
mentioned that the irruption of the second generation (2G) is the radical technological change
experienced by the mobile telecommunications industry (Fuentelsaz et al., 2015; Gómez and 10 Instead of considering the number of unique users that subscribe to mobile services, we take into account the number of subscriptions (or registered SIM cards) on the mobile network, mainly because one user tends to have, on average, more than one SIM card.

45
Maícas, 2011). The enhanced services and devices linked to this technological innovation
changed the way people communicate.
Taking into account the above arguments, we define a dummy variable that identifies
whether a firm is a pioneer or a follower firm in each of the European markets considered. To
codify this variable, we make use of information from the GSMA Intelligence Database,
which reports operators’ entry dates in each generation. Specifically, we create a dummy
variable (Pioneer) that equals 1 when the operator enters into 2G first, and 0 otherwise.
Time in the market. In order to evaluate our second hypothesis, we define a
continuous variable that measures how long a firm has been in a specific market (we count
the number of quarters from entry). By doing so, we are able to evaluate changes in firms’
strategies over time.
Control variables
We use seven control variables to capture the effect of other factors explaining the
choice of competitive strategy. Firstly, the international dimension of this study requires the
inclusion of country dummies to control for political, economic or social conditions that may
affect a firm’s competitive behaviour. Secondly, to control for rivalry, we include a variable
that counts the number of competitors operating in each national market. We also include
year and quarter dummies to assess time influences.
Additionally, we control for some firm-specific effects that could explain the
competitive strategy selected. Firstly, some first movers were incumbents in the fixed line
services and these two effects, pioneering and previous incumbency, should be clearly
distinguished. To do this, we introduce a dummy variable (incumbent) that captures that the
firm was previously established as an incumbent that provided fixed line services.11 This
11 Consumers might rely on the reputation of the former monopoly which enjoyed a leading and lonely position in the telecommunications sector during the previous decades. Furthermore, incumbent firms may make use of specialized assets and capabilities possessed by previous generations to enter a new product category (Mitchell, 1991) more effectively.
46
variable takes the value 1 if the firm provided fixed line services before the mobile
telecommunications services appeared, and 0 otherwise. Secondly, we include the dummy
variable merger, which identifies the resultant company after a merger or an acquisition
process.12 Finally, the dummy variable part of a group controls for possible advantages
derived from previous international experience and from resource strength. This variable
takes the value 1 if the firm belongs to an international group, and 0 otherwise.
2.4.1.3. Descriptive statistics
Table 2.1 shows the descriptive statistics and correlations of the variables used. The
different availability of data for the three dependent variables makes the number of
observations and the size of the sample used in each analysis different. The description of
independent variables is based on the larger sample (the one used for relative prices).13 As
can be seen in Table 2.1, the average number of operators in the market is 3.4. The average of
the ratio of relative quality is 0.678. This means that on average the quality offered by
operators in the market is, approximately, 67 per cent of that offered by the operator showing
the highest quality. The average relative prices and relative operating efficiency are,
respectively, 0.848 and 0.762.
12 Firms would be more likely to modify their strategy as a consequence of two main factors: (1) opportunities arising from the acquisition of a new set of resources, capabilities and skills they are not used to competing with; or (2) the need to readjust past competitive routines and accommodate user conditions in the merged firm. 13 Descriptive statistics and correlations of the variables are similar in the other two samples.
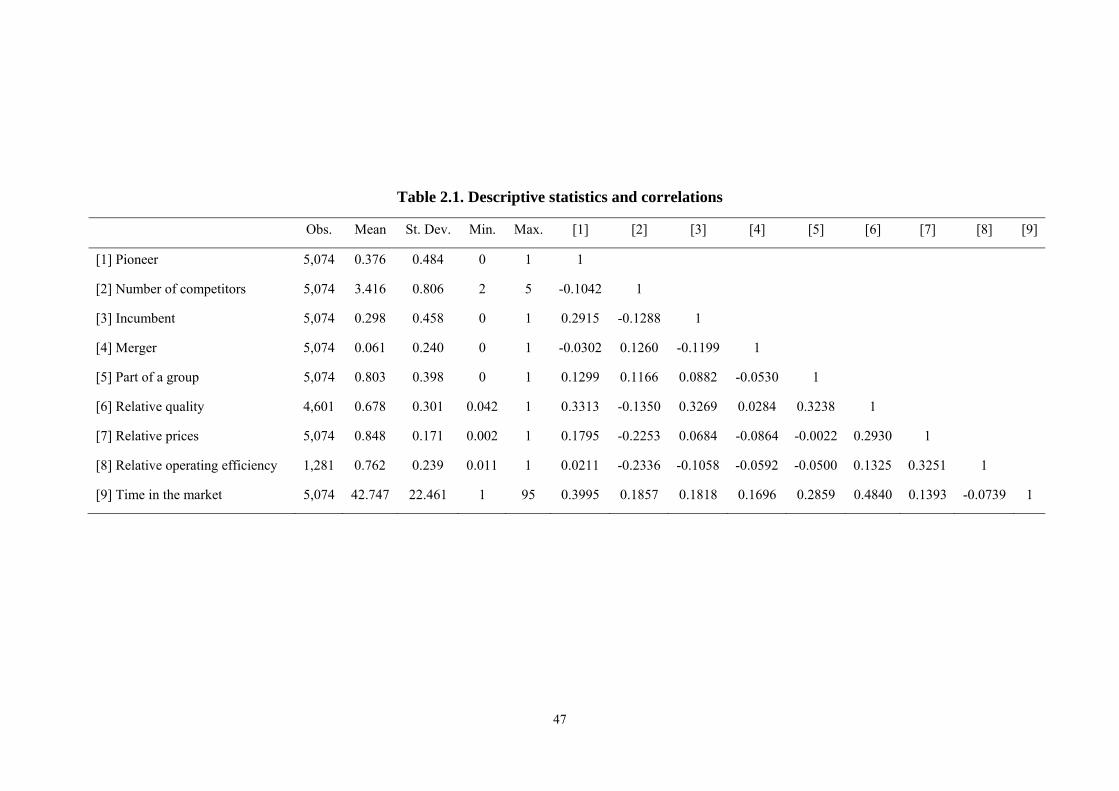
47
Table 2.1. Descriptive statistics and correlations
Obs. Mean St. Dev. Min. Max. [1] [2] [3] [4] [5] [6] [7] [8] [9]
[1] Pioneer 5,074 0.376 0.484 0 1 1
[2] Number of competitors 5,074 3.416 0.806 2 5 -0.1042 1
[3] Incumbent 5,074 0.298 0.458 0 1 0.2915 -0.1288 1
[4] Merger 5,074 0.061 0.240 0 1 -0.0302 0.1260 -0.1199 1
[5] Part of a group 5,074 0.803 0.398 0 1 0.1299 0.1166 0.0882 -0.0530 1
[6] Relative quality 4,601 0.678 0.301 0.042 1 0.3313 -0.1350 0.3269 0.0284 0.3238 1
[7] Relative prices 5,074 0.848 0.171 0.002 1 0.1795 -0.2253 0.0684 -0.0864 -0.0022 0.2930 1
[8] Relative operating efficiency 1,281 0.762 0.239 0.011 1 0.0211 -0.2336 -0.1058 -0.0592 -0.0500 0.1325 0.3251 1
[9] Time in the market 5,074 42.747 22.461 1 95 0.3995 0.1857 0.1818 0.1696 0.2859 0.4840 0.1393 -0.0739 1
48
2.4.2. Methodology
Given the censored nature of our dependent variables (relative quality, relative prices
and relative operating efficiency), we use a Tobit model. The general model is specified as
follows (Greene, 2008):
∗
where is a latent variable that is a function of a group of exogenous and control variables
and of , the error term. The latent variable equals the observed values when they exceed
0, and is censored at 0 otherwise:
0 ∗ 0∗ ∗ 0
Considering the panel structure of the data (2000–2016), we estimate a random effects
Tobit model.
2.5. RESULTS
Table 2.2 shows the results of a Tobit model that considers relative quality, relative
prices and relative operating efficiency as dependent variables. The first three columns of
Table 2.2 present the results of the estimation that uses relative quality as the dependent
variable. Columns 4, 5 and 6 present the estimations for relative prices. Finally, columns 7, 8
and 9 present the estimations for relative operating efficiency. For each trio of columns, the
first presents the baseline model, the second introduces the variable accounting for the order
of entry, and the third considers time in the market and the interaction terms to assess the
evolution of the strategy of pioneers. All the models are globally significant, as shown by the
value of the chi squared. Collinearity diagnostics reveal that all variance inflation factors are
below the recommended threshold of 10 (Marquard, 1970).
*y
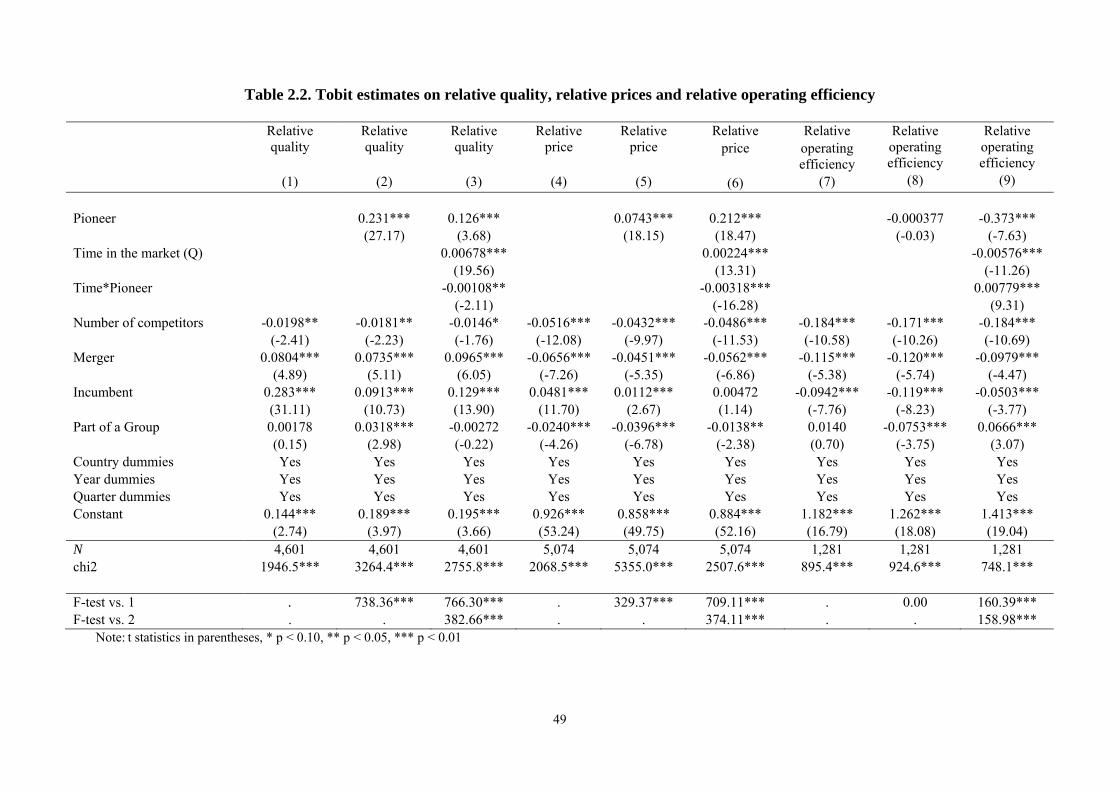
49
Table 2.2. Tobit estimates on relative quality, relative prices and relative operating efficiency
Note: t statistics in parentheses, * p < 0.10, ** p < 0.05, *** p < 0.01
Relative quality
(1)
Relative quality
(2)
Relative quality
(3)
Relative price
(4)
Relative price
(5)
Relative price
(6)
Relative operating efficiency
(7)
Relative operating efficiency
(8)
Relative operating efficiency
(9)
Pioneer 0.231*** 0.126*** 0.0743*** 0.212*** -0.000377 -0.373*** (27.17) (3.68) (18.15) (18.47) (-0.03) (-7.63) Time in the market (Q) 0.00678*** 0.00224*** -0.00576*** (19.56) (13.31) (-11.26) Time*Pioneer -0.00108** -0.00318*** 0.00779*** (-2.11) (-16.28) (9.31) Number of competitors -0.0198** -0.0181** -0.0146* -0.0516*** -0.0432*** -0.0486*** -0.184*** -0.171*** -0.184*** (-2.41) (-2.23) (-1.76) (-12.08) (-9.97) (-11.53) (-10.58) (-10.26) (-10.69) Merger 0.0804*** 0.0735*** 0.0965*** -0.0656*** -0.0451*** -0.0562*** -0.115*** -0.120*** -0.0979*** (4.89) (5.11) (6.05) (-7.26) (-5.35) (-6.86) (-5.38) (-5.74) (-4.47) Incumbent 0.283*** 0.0913*** 0.129*** 0.0481*** 0.0112*** 0.00472 -0.0942*** -0.119*** -0.0503*** (31.11) (10.73) (13.90) (11.70) (2.67) (1.14) (-7.76) (-8.23) (-3.77) Part of a Group 0.00178 0.0318*** -0.00272 -0.0240*** -0.0396*** -0.0138** 0.0140 -0.0753*** 0.0666*** (0.15) (2.98) (-0.22) (-4.26) (-6.78) (-2.38) (0.70) (-3.75) (3.07) Country dummies Yes Yes Yes Yes Yes Yes Yes Yes Yes Year dummies Yes Yes Yes Yes Yes Yes Yes Yes Yes Quarter dummies Yes Yes Yes Yes Yes Yes Yes Yes Yes Constant 0.144*** 0.189*** 0.195*** 0.926*** 0.858*** 0.884*** 1.182*** 1.262*** 1.413*** (2.74) (3.97) (3.66) (53.24) (49.75) (52.16) (16.79) (18.08) (19.04) N 4,601 4,601 4,601 5,074 5,074 5,074 1,281 1,281 1,281 chi2 1946.5*** 3264.4*** 2755.8*** 2068.5*** 5355.0*** 2507.6*** 895.4***
924.6***
748.1***
F-test vs. 1 . 738.36*** 766.30*** . 329.37*** 709.11*** . 0.00 160.39*** F-test vs. 2 . . 382.66*** . . 374.11*** . . 158.98***

50
In order to evaluate how pioneers compete in the market, we consider the second
column of each dependent variable. For relative quality (column 2), the positive and
significant coefficient of the variable pioneer (β=0.231; p<0.01) indicates that, on average,
earlier entrants offer higher quality than later entrants over the period analysed. Regarding
relative prices, the results presented in column 5 show that the coefficient of the variable
pioneer (β=0.0743; p<0.01) is positive and significant. Both results are consistent with our
expectations of first movers showing higher levels of differentiation in comparison with other
entrants. Finally, the results for operating efficiency (column 8) show a negative but not
significant coefficient of the variable pioneer (β=-0.000377; p>0.10). Therefore, no
differences can be observed when examining competitors’ average cost structures throughout
the period. On average, pioneers emphasize quality and prices and do not suffer from a costs
disadvantage.
Once the relative positioning of each cohort of entrants has been analysed, we focus
on the third column of each dependent variable to test our hypotheses. Firstly, to evaluate the
way first movers compete in the initial stages of our analysis, we must consider the direct
effect of the variable pioneer. According to hypothesis 1, we would expect pioneers to
present superior levels of relative quality and prices, while showing worse cost structures
than followers. Secondly, to assess the variation of competitive strategies over time, we
interact the variable time in the market and the dummy capturing the order of entry. A
positive sign in the accompanying coefficient would imply that the firm enhances its relative
position in terms of quality, prices and costs over time. A negative sign would imply the
opposite. Hypothesis 2 proposes that pioneers would move towards hybrid strategies.
Therefore, we would expect pioneers to keep their good positioning in terms of quality and
prices, and to improve their costs position.
51
Regarding our first hypothesis, the results obtained for relative quality show that the
coefficient of the variable pioneer (β=0.126; p<0.01) is positive and significant. As argued in
hypothesis 1, pioneers are more likely to follow a differentiation strategy in comparison with
other entrants when relative quality is considered. A second way to address hypothesis 1 is to
explore differences in prices between the different cohorts of entrants. Those firms following
a differentiation strategy generally keep prices high. The results presented in column 6 show
that the coefficient of the variable pioneer (β=0.212; p<0.01) is positive and significant,
which is consistent with our expectations. Finally, the results for relative operating efficiency
are shown in column 9. Regarding our contention, earlier entrants should show lower relative
operating efficiency levels in the initial stage of market development as a result of the
substantial investments required. However, the coefficient of the variable pioneer (β=-0.373;
p<0.01) is negative and significant, which means that, in general, first movers benefit from
lower costs. This is an unexpected result that allows us to partially confirm hypothesis 1,
since pioneers offer superior quality levels and charge higher prices, but they also seem to be
more efficient than followers in the initial stage of the market development.
According to hypothesis 2, the results for relative quality show that the interaction of
time in the market with pioneer (β=-0.00108; p<0.05) is negative and significant. This means
that pioneers’ quality position deteriorates over time vis-à-vis late followers. Similar results
are found for relative prices. Column 6 presents a negative and significant interaction of time
in the market and the pioneer dummy (β=-0.00318; p<0.01). Therefore, our estimations
confirm that differences in prices between the pioneer and its competitors tend to decrease.
Finally, column 9 shows how the cost position of the early entrants worsens over time, as the
coefficient of the interaction term (β=0.00779; p<0.01) is positive and significant. Hence,
although pioneers presented the lowest operating costs in the initial stages, their
advantageous position is lost as time elapses.
52
In terms of hypothesis 2, the results on these dimensions do not allow us to accept our
contention of first movers’ strategic repositioning towards a hybrid strategy, since the pioneer
competitive positioning seems to worsen over time in terms of quality, prices and operating
efficiency levels.
Further analyses
Up to now, we have analysed the strategic positioning of pioneers vis-à-vis followers,
considering the latter as a broad category. Nevertheless, research highlights the need to
distinguish among latecomers to develop a deeper understanding of this category (Lieberman
and Montgomery, 2013). A first reason is that followers may be heterogeneous in terms of
the resources and capabilities that they control, and this may affect the way in which they
compete (Hawk et al., 2013; Shamsie et al., 2004). A second reason is that the order of entry
of followers is different, and this should influence the chance followers have to take
advantage of market opportunities (Markides and Geroski, 2004) and to choose a business
strategy. For example, some of the second entrants in the industry entered the market shortly
after the pioneer.14 In this situation, market conditions could have been closer to those found
by the pioneer than to those encountered by late followers.
Table 2.3 shows the estimations of an augmented model in which we distinguish
between pioneers, second movers and late followers. The new variable (second entrant)
equals 1 when the operator enters into 2G in second place, and 0 otherwise. The reason for
adding just one category is that there are certain markets in which the maximum number of
operators is three. To facilitate interpretation of the results, Table 2.4 predicts the relative
quality, relative prices and relative operating efficiency for the average pioneer, the average
14 For instance, in the Hungarian market, we categorized as a pioneer the firm that penetrated the 2G market in March 1994 (Telenor) and as a second entrant the operator that entered the market in April 1994 (Magyar Telekom). In this case, there is an elapsed time of just one month between entries. Given this short period of time, we might consider that the two entrants would have had the chance of confronting similar market conditions and even of having equal opportunities to take advantage of the existing isolating mechanisms.
53
second entrant and the average late follower.15 When looking at the predictions for a given
year, it is important to note that there are differences in time in the market among the
categories of entrants. These have been considered by averaging time in the market for each
category of entrants in a given year.
The results reinforce our conclusions in terms of the initial positioning of pioneering
firms (hypothesis 1) and clarify prior findings regarding its evolution (hypothesis 2).
Specifically, results presented in Table 2.4 show that pioneers are initially able to benefit
from a hybrid strategy, since superior positions are obtained in terms of quality (βQp =
0.7910), prices (βPp = 0.9331) and cost efficiency (βOp = 0.8206) than those of second entrants
(βQs = 0.5616; βPs = 0.8002; βOs = 0.8671) and late followers (βQf = 0.4585; βPf = 0.7626; βOf =
0.9198). Nevertheless, the pioneer gradually loses its position as a cost leader. These findings
also suggest that first mover advantage is eroded over time.
Having confirmed the main results, we turn to analysis of the positioning of second
entrants and late followers. On the one hand, the results presented in Table 2.4 show that the
second entrant gradually evolves towards a more advantageous position in the three
dimensions considered. In fact, in the years considered in our observation window, they are
able to improve their positioning from an intermediate position in terms of relative quality
(βQs = 0.5616), prices (βPs = 0.8002) and efficiency (βOs = 0.8671) to one that is close to a
hybrid strategy (βQs = 1.003; βPs = 0.9022; βOs = 0.5098). By the end of the period, the average
second entrant is able to offer similar quality and price to first movers at significantly lower
operating costs.
15 The different observation windows considered are due to the availability of data.

54
Table 2.3. The effect of pioneer and second entrant on relative quality, relative prices and relative operating efficiency (further analyses)
Relative quality
(1)
Relative quality
(2)
Relative quality
(3)
Relative price
(4)
Relative price
(5)
Relative price
(6)
Relative operating efficiency
(7)
Relative operating efficiency
(8)
Relative operating efficiency
(9) Pioneer 0.342*** 0.127*** 0.150*** 0.236*** -0.0300** -0.179** (31.15) (3.38) (29.21) (15.65) (-2.01) (-2.51) Second entrant 0.272*** -0.129*** 0.0927*** 0.0473*** -0.0995*** 0.128** (25.56) (-4.10) (18.54) (3.79) (-6.61) (2.19) Time in the market (Q) 0.00281*** 0.00331*** -0.00668*** (5.61) (11.25) (-8.81) Time*Pioneer 0.00188*** -0.00423*** 0.00699*** (3.29) (-16.59) (5.91) Time*Second 0.00574*** -0.00157*** -0.00143 (10.40) (-6.20) (-1.29) Number of competitors -0.0198** -0.0192** -0.0203** -0.0516*** -0.0516*** -0.0416*** -0.141*** -0.150*** -0.127*** (-2.41) (-2.24) (-2.44) (-12.08) (-12.13) (-9.34) (-8.41) (-8.71) (-7.65) Merger 0.0804*** 0.0530*** 0.0992*** -0.0656*** -0.0381*** -0.0420*** -0.125*** -0.0359 -0.00806 (4.89) (2.96) (6.11) (-7.26) (-4.52) (-4.45) (-6.03) (-1.43) (-0.38) Incumbent 0.283*** 0.117*** 0.161*** 0.0481*** 0.00182 -0.0116*** -0.0930*** -0.0938*** -0.0699*** (31.11) (12.30) (18.00) (11.70) (0.43) (-2.71) (-7.82) (-7.61) (-5.64) Part of a Group 0.00178 0.0188 0.0373*** -0.0240*** -0.0172*** -0.0365*** -0.0900*** -0.0146 0.0223 (0.15) (1.35) (2.85) (-4.26) (-3.06) (-6.07) (-4.69) (-0.55) (1.19) Country dummies Yes Yes Yes Yes Yes Yes Yes Yes Yes Year dummies Yes Yes Yes Yes Yes Yes Yes Yes Yes Quarter dummies Yes Yes Yes Yes Yes Yes Yes Yes Yes Constant 0.144*** 0.133*** 0.309*** 0.926*** 0.784*** 0.796*** 0.875*** 0.801*** 0.839*** (2.74) (2.69) (5.85) (53.24) (44.63) (35.82) (14.09) (10.28) (11.45) N 4,601 4,601 4,601 5,074 5,074 5,074 1,174 1,174 1,174 chi2 1946.5*** 3305.9*** 3822.6*** 2068.5*** 2995.6*** 2736.8*** 722.8*** 1462.2*** 1275.2*** F-test vs. 1 . 1094.46*** 1336.41*** . 854.39*** 662.61*** . 48.95*** 259.25*** F-test vs. 2 . . 184.26*** . . 351.55*** . . 171.68*** Note: t statistics in parentheses, * p < 0.10, ** p < 0.05, *** p < 0.01
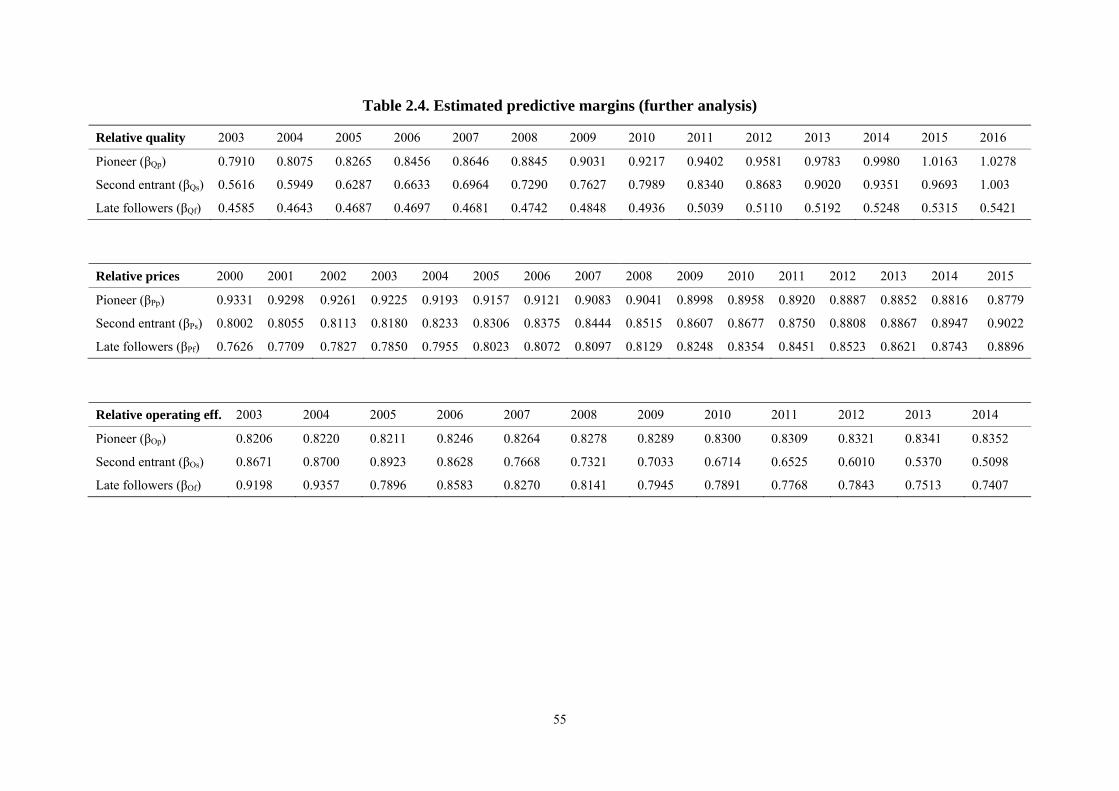
55
Table 2.4. Estimated predictive margins (further analysis)
Relative quality 2003 2004 2005 2006 2007 2008 2009 2010 2011 2012 2013 2014 2015 2016
Pioneer (βQp) 0.7910 0.8075 0.8265 0.8456 0.8646 0.8845 0.9031 0.9217 0.9402 0.9581 0.9783 0.9980 1.0163 1.0278
Second entrant (βQs) 0.5616 0.5949 0.6287 0.6633 0.6964 0.7290 0.7627 0.7989 0.8340 0.8683 0.9020 0.9351 0.9693 1.003
Late followers (βQf) 0.4585 0.4643 0.4687 0.4697 0.4681 0.4742 0.4848 0.4936 0.5039 0.5110 0.5192 0.5248 0.5315 0.5421
Relative prices 2000 2001 2002 2003 2004 2005 2006 2007 2008 2009 2010 2011 2012 2013 2014 2015
Pioneer (βPp) 0.9331 0.9298 0.9261 0.9225 0.9193 0.9157 0.9121 0.9083 0.9041 0.8998 0.8958 0.8920 0.8887 0.8852 0.8816 0.8779
Second entrant (βPs) 0.8002 0.8055 0.8113 0.8180 0.8233 0.8306 0.8375 0.8444 0.8515 0.8607 0.8677 0.8750 0.8808 0.8867 0.8947 0.9022
Late followers (βPf) 0.7626 0.7709 0.7827 0.7850 0.7955 0.8023 0.8072 0.8097 0.8129 0.8248 0.8354 0.8451 0.8523 0.8621 0.8743 0.8896
Relative operating eff. 2003 2004 2005 2006 2007 2008 2009 2010 2011 2012 2013 2014
Pioneer (βOp) 0.8206 0.8220 0.8211 0.8246 0.8264 0.8278 0.8289 0.8300 0.8309 0.8321 0.8341 0.8352
Second entrant (βOs) 0.8671 0.8700 0.8923 0.8628 0.7668 0.7321 0.7033 0.6714 0.6525 0.6010 0.5370 0.5098
Late followers (βOf) 0.9198 0.9357 0.7896 0.8583 0.8270 0.8141 0.7945 0.7891 0.7768 0.7843 0.7513 0.7407
56
On the other hand, the strategic profile of the late followers is characterized by the
lowest quality, the lowest prices and the highest costs. Over time, they improve their position
in terms of operating efficiency, although this is not enough to become the lowest cost
producer at the end of the period. It is also important to notice that they are the providers
offering the lowest quality, but at a similar prices to the pioneers and second entrants.
Overall, these results support prior conclusions and help to clarify our understanding of how
the strategies of different cohorts of entrant evolve over time.
2.6. CONCLUSION AND DISCUSSION
The objective of this paper has been to study the role of entry timing in determining a
firm’s competitive strategy using a sample of European telecommunications companies. Our
integration of the literatures on first mover advantages and competitive strategy led us to
develop two hypotheses: firstly, that pioneers are more likely to choose differentiation
strategies, given that they offer a better fit with demand characteristics and the isolating
mechanisms proposed by the literature; and secondly, that the competitive strategy of
pioneers evolves over time, moving towards hybrid strategies.
Two important conclusions can be drawn from the results obtained. Firstly, they show
that pioneers are more likely to offer higher quality in their services and to charge higher
prices than followers. Initially, pioneers also maintain low cost structures, benefiting from a
better cost position than follower firms. Therefore, pioneers are initially able to implement
hybrid strategies. Secondly, our results also lead us to conclude that their business strategy
does not evolve towards a hybrid strategy. On the contrary, the results suggest that the value
created is reduced as time goes by. Pioneers’ advantage in terms of relative quality and prices
diminishes, disappearing towards the end of the observation period, while their costs structure
worsens in relative terms. This suggests that value creation is reduced over time and that
57
FMAs tend to disappear, as some authors have suggested (Brown and Lattin, 1994;
Lieberman and Montgomery, 1998).
These conclusions offer several theoretical implications. Regarding its importance for
our understanding of the FMAs literature, the contribution of this study is threefold. Firstly,
our findings suggest that pioneers create value through alignment of the isolating mechanisms
that are enabled by early entry and certain competitive strategies. More precisely, pioneers
seem to take advantage of technological leadership, the pre-emption of superior resources and
higher switching costs that allow them to offer more quality and to charge higher prices at the
lowest cost.
Secondly, our results also suggest a role for competitive strategies in explaining the
relationship between order of entry and performance. To benefit from the isolating
mechanisms and to enjoy competitive advantages, pioneers have to choose the most adequate
strategy. Our results suggest that those strategies that emphasize value provide pioneers with
the opportunity to create a competitive advantage, at least in the short term. They also
suggests that, in the long term, these strategies run the risk of being matched by early entrants
that find their way into value strategies.
Thirdly, the results confirm that followers are able to reduce the competitive
advantage obtained by first movers. Our results show that the pioneers’ price gap and cost
structure worsen over time vis-à-vis the situation of the followers. In particular, our findings
confirm the importance of second entrants for competition. In this regard, we show that
second entrants are able to improve their relative quality position more quickly than pioneers.
Moreover, they suffer less from price erosion while becoming the most efficient participants
in the industry over time. These results complement current understanding of how followers
are able to erode a pioneer’s advantage (Usero and Fernández, 2009), and suggest the need to
follow a more granular approach in the study of followers.
58
In spite of these contributions, several issues should be considered in further analyses.
Firstly, we have focused on the relationship between order of entry and competitive strategy.
An analysis of firm performance seems to be the next logical step. In particular, the
distinction between an order of entry effect and a competitive strategy effect on performance
seems relevant. To study the extent to which following certain competitive strategies
enhances the performance levels of a given cohort of entrants, or whether the order of entry
effect is more (or less) important than competitive strategy in explaining variations in firm
results, seems valuable.
Secondly, we have proposed entry order as the main determinant when deciding a
competitive strategy. However, entry decisions could be based on a more complex
relationship in which internal and external interrelated factors affect the possibilities each
entrant has to compete, as some authors defend from the contingency perspective (e.g.
Szymanski et al., 1995). In that regard, the specific resources and capabilities possessed by
each firm (De Castro and Chrisman, 1995; Shamsie et al., 2004), or an appropriate fit
between environmental opportunities and organizational strengths (Kerin et al., 1992), may
condition the strategy implemented and the chance to obtain an advantage.
In line with the last point, the inverse of the relationship presented in this paper could
also be addressed. In other words, researchers could explore to what extent the competitive
strategy previously followed by a firm conditions the decision to enter a market by being an
early entrant or a late follower. Firms will be most likely to follow a given entry timing
strategy if their existing competitive strategy allows them to take advantage of economic
opportunities in a certain market.
Moreover, the emphasis in the study on first movers may be overlooking relevant
aspects of how their advantage is sustained or how it is eroded over time. Our results suggest
that followers are heterogeneous enough in their competitive strategies to deserve a more
59
detailed analysis. We believe it would be interesting to delve into a nascent area of research
that focuses on understanding the strategies pursued by different categories of follower firm
(Fosfuri et al., 2013; Markides and Sosa, 2013) to penetrate the market and to benefit from
late entry.
Finally, the industry studied is very interesting for our objectives. However, it is
important to bear in mind that it is just one particular setting in which the theory of first
mover advantages may be tested, and that it may have some peculiarities. For example, the
strategic patterns discovered may be conditional to the industry. In order to generalize the
results obtained, further analysis should seek to replicate this study in other settings.
Similarly, data limitations precluded us from measuring intended strategies rather than
realized strategies. For example, a late follower may attempt to follow a cost leadership
strategy and end up being stuck in the middle as a consequence of the existence of second
entrants that enjoy lower costs. This has to be taken into account when comparing our results
with previous research. Data limitations also conditioned the selection of the three variables
used in this paper and the fact that we did not use a synthetic measure of competitive
strategies as other papers do (Pertusa-Ortega et al., 2009; Spanos et al., 2004; Thornhill and
White, 2007). Further research into the link between order of entry, competitive strategy and
performance in different settings may improve our understanding of the nuances of the
relationship.
60
2.7. REFERENCES
Abell DF. 1980. Defining the business: The starting point of strategic planning. Englewood
Cliffs, NJ: Prentice-Hall.
Agarwal, R., Gort, M. 2001. First-mover advantage and the speed of competitive entry,
1887–1986. The Journal of Law and Economics, 44(1), 161-177.
Argyres N, Bigelow L, Nickerson JA. 2015. Dominant designs, innovation shocks, and the
follower's dilemma. Strategic Management Journal, 36(2), 216-234.
Bain JS. 1951 Relation of Profit Rate to Industry Concentration: American Manufacturing,
1936-1940. Quarterly Joumal of Economics, 65, 293-324.
Bohlmann JD, Golder PN, Mitra D. 2002. Deconstructing the pioneer's advantage:
Examining vintage effects and consumer valuations of quality and variety. Management
Science, 48(9), 1175-1195.
Booth ME, Philip G. 1998. Technology, competencies, and competitiveness: the case for
reconfigurable and flexible strategies. Journal of Business Research, 41, 29-40.
Boulding W, Christen M. 2008. Disentangling pioneering cost advantages and disadvantages.
Marketing Science, 27(4): 699-716.
Bowman C, Ambrosini V. 1997. Perceptions of strategic priorities, consensus and firm
performance. Journal of Management Studies, 34(2), 241-258.
Brown CL, Lattin JM. 1994. Investigating the relationship between time in market and
pioneering advantage. Management Science, 40(10), 1361-1369.
Campbell-Hunt C. 2000. What have we learned about generic competitive strategy? A meta-
analysis. Strategic Management Journal, 21(2), 127-154.
Carpenter GS, Nakamoto K. 1989. Consumer preference formation and pioneering
advantage. Journal of Marketing Research, 285-298.
61
David JS, Hwang Y, Pei BK, Reneau JH. 2002. The performance effects of congruence
between product competitive strategies and purchasing management design. Management
Science, 48(7), 866-885.
Day GS, Freeman JS. 1990. Burnout or fadeout: The risks of early entry into high technology
markets. In M. W. Lawless & L. R. Gomez-Mejia (Eds.), Strategic management in high
technology firms, 43–65. Greenwich, CT: JAI Press Inc.
De Castro JO, Chrisman JJ. 1995. Order of market entry, competitive strategy, and financial
performance. Journal of Business Research, 33(2), 165-177.
Dess GG, Davis PS. 1984. Porter's (1980) generic strategies as determinants of strategic
group membership and organizational performance. Academy of Management Journal, 27(3),
467-488.
Doganoglu T, Grzybowski L. 2007. Estimating network effects in mobile telephony in
Germany. Information Economics and Policy, 19(1), 65-79.
Durand R, Coeurderoy R. 2001. Age, order of entry, strategic orientation, and organizational
performance. Journal of Business Venturing, 16(5), 471-494.
Eggers JP, Grajek M, Kretschmer T. 2011. Decomposing first mover advantages in the
mobile telecommunications industry”. In: DRUID Working Paper 11-09.
Eggers JP, Grajek M, Kretschmer T. 2013. Performance Implications of Core and
Complementary Pre-Entry Experience: The Role of Consumer Heterogeneity in Mobile
Telephony. Working Paper, 1-43.
Farrell J, Saloner G. 1985. Standardization, compatibility, and innovation. RAND Journal of
Economics, 16, 70-83.
Fernández Z, Usero B. 2009. Competitive behaviour in the European mobile
telecommunications industry: Pioneers vs. followers. Telecommunications Policy, 33 (7),
339-347.
62
Fosfuri A, Lanzolla G, Suarez F. 2013. Entry-Timing Strategies: The road ahead. Long Range
Planning, 46, 300-311.
Franco AM, Sarkar MB, Agarwal R, Echambadi R. 2009. Swift and smart: The moderating
effects of technological capabilities on the market pioneering-firm survival relationship.
Management Science, 55(11), 1842-1860.
Fuentelsaz L, Garrido E, Maicas JP. 2015. Incumbents, technological change and institutions:
How the value of complementary resources varies across markets. Strategic Management
Journal, 36, 1778–1801
Gaba V, Pan Y, Ungson GR. 2002. Timing of entry in international market: An empirical
study of US Fortune 500 firms in China. Journal of International Business Studies, 39-55.
Giachetti C. 2016. Competing in Emerging Markets: Performance Implications of
Competitive Aggressiveness. Management International Review, 56, 325-352.
Gilbert CG. 2005. Unbundling the structure of inertia: Resource versus routine rigidity.
Academy of Management Journal, 48(5), 741-763.
Golder PN, Tellis GJ. 1993. Pioneer advantage: Marketing logic or marketing legend?
Journal of Marketing Research, 30(2), 158 –170.
Gómez J, Lanzolla G, Maicas JP. 2016. The role of industry dynamics in the persistence of
first mover advantages. Long Range Planning, 49(2), 265-281.
Gómez J, Maicas JP. 2011. Do switching costs mediate the relationship between entry timing
and performance? Strategic Management Journal, 32(12), 1251-1269.
Grajek M. 2010. Estimating network effects and compatibility: Evidence from the Polish
mobile market. Information Economics and Policy, 22(2), 130-143.
Greene WH. 2008. Econometric analysis. 6th ed. Upper Saddle River, NJ: Prentice-Hall.
63
Greenstein S, Mazzeo M. 2006. The role of differentiation strategy in local
telecommunication entry and market evolution: 1999–2002. The Journal of Industrial
Economics, 54(3), 323-350.
GSM Association 2011. European Mobile Industry Observatory 2011. Available on the
website: http://www.gsma.com/publicpolicy/wp-ontent/uploads/2012/04/emofullwebfinal.pdf
GSM Association 2014. Understanding 5G: Perspectives on future technological
advancements in mobile. Available on the website:
https://www.gsmaintelligence.com/research/?file=141208-5g.pdf&download
GSM Association 2015. The mobile economy: Europe 2015. Available on the website:
https://gsmaintelligence.com/research/?file=06d1c45d0528233e7a9560843d85c8bd&downlo
ad
Hambrick D. 1984. Taxonomic approaches to studying strategy: Some conceptual and
methodological issues. Journal of Management, 10, 27-41.
Hawk A, Pacheco‐De‐Almeida G, Yeung B. 2013. Fast‐mover advantages: Speed capabilities
and entry into the emerging submarket of Atlantic basin LNG. Strategic Management
Journal, 34(13), 1531-1550.
Hill CWL. 1988. Differentiation versus low cost or differentiation and low cost: a
contingency framework. Academy of Management Review, 13, 401–412.
Hofer CW. 1975. Toward a contingency theory of business strategy. Academy of
Management Journal, 18(4), 784-810.
Jakopin NM, Klein A. 2012. First-mover and incumbency advantages in mobile
telecommunications. Journal of Business Research, 65(3), 362-370.
Katz M, Shapiro C. 1992. Product introduction with network externalities. Journal of
Industrial Economics, 40, 55– 83
Keppler S. 1997. Industry life cycle. Industrial and corporate change, 6(1), 145-181.
64
Kerin RA, Varadarajan PR, Peterson RA. 1992. First-mover advantage: A synthesis,
conceptual framework, and research propositions. The Journal of Marketing, 33-52.
Kim E, Nam DI, Stimpert JL. 2004. The applicability of Porter’s generic strategies in the
digital age: Assumptions, conjectures, and suggestions. Journal of Management, 30(5), 569-
589.
Klingebiel R, Joseph J. 2015. Entry timing and innovation strategy in feature phones.
Strategic Management Journal, 37(6), 1002-1020.
Kotha S, Vadlamani BL. 1995. Assessing generic strategies: an empirical investigation of
two competing typologies in discrete manufacturing industries. Strategic Management
Journal, 16, 75-83.
Lambkin M. 1988. Order of entry and performance in new markets. Strategic Management
Journal, 9(S1), 127-140.
Leitner KH, Güldenberg S. 2010. Generic strategies and firm performance in SMEs: a
longitudinal study of Austrian SMEs. Small Business Economics, 35, 169-189
Li C, Li J. 2008. Achieving superior financial performance in China: differentiation, cost
leadership, or both? Journal of International Marketing, 16(3), 1-22.
Lieberman MB, Montgomery DB. 1988. First‐mover advantages. Strategic Management
Journal, 9(S1), 41-58.
Lieberman MB, Montgomery DB. 1998. First-mover (dis) advantages: Retrospective and link
with the resource-based view. Strategic Management Journal, 1111-1125.
Lieberman MB, Montgomery DB. 2013. Conundra and progress: Research on entry order and
performance. Long Range Planning, 46(4), 312-324.
Lilien GL, Yoon E. 1990. The timing of competitive market entry: An exploratory study of
new industrial products. Management Science, 36(5), 568-585.
65
Maicas JP, Sesé FJ. 2015. Customer-Base Management in Network Industries: The
Moderating Role of Network Size and Market Growth. European Management Review,
12(4), 209-220.
Markides C, Sosa L. 2013. Pioneering and first mover advantages: the importance of business
models. Long Range Planning, 46(4), 325-334.
Markides CC, Geroski PA. 2004. Fast second: How smart companies bypass radical
innovation to enter and dominate new markets, vol. (325). John Wiley & Sons.
Marquard DW. 1970. Generalized Inverses, Ridge Regression and Linear Biased Estimation.
Technometrics, 12, 591-612.
Mascarenhas B. 1992. Order of entry and performance in international markets. Strategic
Management Journal, 13(7), 499-510.
Mason ES. 1939. Price and production policies of large-scale enterprise. American Economic
Review, 29, 61-74
McGahan M, Porter ME. 1997. How Much Does Industry Matter, Really? Strategic
Management Journal, 18(S1), 15-30.
Miles R, Snow C. 1978. Organizational strategy, structure and process. New York: McGraw-
Hill.
Miller A, Dess GG. 1993. Assessing Porter's (1980) model in terms of its generalizability,
accuracy and simplicity. Journal of Management Studies, 30(4), 553-585.
Miller A, Gartner WB, Wilson R. 1989. Entry order, market share, and competitive
advantage: A study of their relationships in new corporate ventures. Journal of Business
Venturing, 4(3), 197-209.
Miller D. 1992. The generic strategy trap. Journal of Business Strategy, 13(1), 37-41.
Mintzberg H. 1988. Generic Strategies: Toward a Comprehensive Framework. Advances in
Strategic Management, 5, 1-67. Greenwich, CT: JAI Press.
66
Mitchell W. 1991. Dual clocks: Entry order influences on incumbent and newcomer market
share and survival when specialized assets retain their value. Strategic Management Journal,
12(2), 85-100.
Mueller DC. 1997. First-mover advantages and path dependence. International Journal of
Industrial Organization, 15, 827-850.
Nayyar PR. 1993. On the measurement of competitive strategy: Evidence from a large
multiproduct US firm. Academy of Management Journal, 36(6), 1652-1669.
Pertusa‐Ortega EM, Molina‐Azorín JF, Claver‐Cortés E. 2009. Competitive Strategies and
Firm Performance: a Comparative Analysis of Pure, Hybrid and ‘Stuck‐in‐the‐middle’
Strategies in Spanish Firms. British Journal of Management, 20(4), 508-523.
Porter M. 1980. Competitive Strategy. New York: Free Press.
Rao RC, Rutenberg DP. 1979. Preemption Alert Rival: Strategic Timing of the First Plant by
Analysis of Sophisticated Rivalry. Bell Journal of Economics, 10(Autumn), 412-428.
Robinson WT, Chiang J. 2002. Product development strategies for established market
pioneers, early followers, and late entrants. Strategic Management Journal, 23(9), 855-866.
Robinson WT, Fornell C, Sullivan M. 1992. Are market pioneers intrinsically stronger than
later entrants? Strategic Management Journal, 13(8), 609-624.
Robinson WT, Min S. 2002. Is the first to market the first to fail? Empirical evidence for
industrial goods businesses, Journal of Marketing Research, 39(1), 120-128.
Rogers EM. 1995. Diffusion of innovations. Free Press, New York, Third edition.
Ruiz-Ortega MJ, García-Villaverde PM. 2008. Capabilities and competitive tactics influences
on performance: Implications of the moment of entry. Journal of Business Research, 61(4),
332-345.
67
Rumelt RP. 1987. Theory, strategy, and entrepreneurship. In D.J. Teece (ed.), The
Competitive Challenge: Strategies for Industrial Innovation and Renewal, 137–158.
Cambridge, MA: Ballinger.
Rumelt RP. 1991. How much does industry matter? Strategic Management Journal, 12(3),
167-185.
Schnaars SP. 1994. Managing Imitation Strategies. FreePress: New York
Shamsie J, Phelps C, Kuperman J. 2004. Better late than never: A study of late entrants in
household electrical equipment. Strategic Management Journal, 25(1), 69-84.
Shankar V. 1997. Pioneers' marketing mix reactions to entry in different competitive game
structures: Theoretical analysis and empirical illustration. Marketing Science, 16(3), 271-293.
Shy O. 2002. A quick-and-easy method for estimating switching costs. International Journal
of Industrial Organization, 20(1), 71-87.
Spanos YE, Lioukas S. 2001. An examination into the causal logic of rent generation:
contrasting Porter's competitive strategy framework and the resource‐based perspective.
Strategic Management Journal, 22(10), 907-934.
Spanos YE, Zaralis G, Lioukas S. 2004. Strategy and industry effects on profitability:
evidence from Greece. Strategic Management Journal, 25(2), 139-165.
Suarez FF, Lanzolla G. 2007. The role of environmental dynamics in building a first mover
advantage theory. Academy of Management Review, 32(2), 377-392.
Szymanski DM, Troy LC, Bharadwaj SG. 1995. Order of entry and business performance:
An empirical synthesis and reexamination. The Journal of Marketing, 17-33.
Thornhill S, White RE. 2007. Strategic purity: A multi-industry evaluation of pure vs. hybrid
business strategies. Strategic Management Journal, 28, 553–561.
Usero B, Fernández Z. 2009. First come, first served: The effect of market and non-market
actions on pioneer market share. Journal of Business Research, 62(11), 1139-1145.
68
VanderWerf PA, Mahon JF. 1997. Meta-analysis of the impact of research methods on
findings of first-mover advantage. Management Science, 43(11), 1510-1519.
Vernon R. 1979. The product cycle hypothesis in a new international environment. Oxford
Bulletin of Economics and Statistics, 41(4), 255-267.
Vidal, E., Mitchell, W. 2013. When do first entrants become first survivors? Long Range
Planning, 46(4-5), 335-347.
Wu HL, Lin BW, Chen CJ. 2007. Contingency view on technological differentiation and firm
performance: Evidence in an economic downturn. R&D Management, 37(1), 75–88.
Zachary MA, Gianiodis PT, Payne GT, Markman GD. 2015. Entry Timing: Enduring
Lessons and Future Directions. Journal of Management, 41(5), 1388-1415.
Zahra SA, Covin JG. 1993. Business strategy, technology policy and firm performance.
Strategic Management Journal, 14(6), 451-478.
Zott C, Amit R. 2008. The fit between product market strategy and business model:
implications for firm performance. Strategic Management Journal, 29(1), 1-26.

69
Chapter 3.
HOW TO DEFEAT EARLY ENTRANTS:
The role of competitive strategy and industry
dynamism on early mover advantages in the
telecommunications industry
70
3.1. INTRODUCTION
Recent papers on first mover advantages (FMAs) have attributed an important role to
firm competitive strategies (Zachary, Gianodis, Payne and Markman, 2015) and business
models (Markides and Sosa, 2013). The main suggestion is that, to achieve competitive
advantage, first-movers might use different strategies than followers. However, research on
the relationship between order of entry, competitive strategy and competitive advantage is
scarce (but see, De Castro and Chrisman, 1995, Durand and Coeurderoy, 2001 or Fernández
and Usero, 2009). Moreover, as we explained in Chapter 2 of this dissertation, different
studies have found opposite results when studying order of entry advantages and when
analyzing the most appropriate strategy for each cohort of entrants to create value.
Along with this lack of consensus in the Academy, several scholars have brought back
the debate of whether early mover advantages are sustainable over time (see Greve and
Seidel, 2014; Lieberman and Montgomery, 2013; Suarez and Lanzolla, 2007; Tellis, 2014).
For instance, Tellis (2014) reflects on the widely recognized importance of pioneering a
market. While acknowledging the attractiveness of the concept, the author highlights that, in
fact, first-movers are seldom able to sustain their competitive advantage in the long run.
Contrarily, Greve and Seidel (2014) confirm that being early actually compensates for being
worse. Moreover, they show that early moving is not only crucial, but that early mover
advantages increase over time.
This discussion suggests the exploration of two ideas that we analyze in this paper.
First, we study whether the use of a given competitive strategy (for example, differentiation
vs. costs) is important or not for early movers advantages. Following the results of Greve and
Seidel (2014), early entrants with lower quality could still earn a competitive advantage.
However, as discussed in Chapter 2, previous research has argued that pioneers should use
differentiation strategies if they want to profit from an early entry (De Castro and Chrisman
71
1995).1 In this paper we move Chapter 2 forward by assessing whether the use of the
competitive strategy that is presumed to offer an optimal fit with an early entry is the most
profitable option for first movers. In particular, we propose that early movers should use
differentiation-like strategies (i.e., differentiation and hybrid) rather than cost strategies.
Similarly, we contend that a cost strategy is the best for those followers that want to close the
performance gap that pioneers usually obtain.
Second, we study whether the early mover advantage is sustainable over time by
taking into account how followers compete to defeat early entrants. Tellis (2014) argues that
“a surge of later entrants learns from mistakes of pioneers, envisions opportunities and rides
on the explosion of new superior technologies”. Moreover, Professor Tellis claims that
pioneers “focus on the small initial market, failing to envision that vast mass market that they
just opened up” (Tellis, 2014: A17). Both ideas suggest that the way each cohort of entrants
capitalizes on shifting market opportunities will be important in the effective sustainability of
early-movers advantages. Accordingly, our study pays special attention to the competitive
behavior of followers and to the role that the evolution of the industry in which firms
compete plays in the maintenance of competitive advantages. Following recent demands, we
analyze how the joint effect of micro and macro aspects shapes each cohort of entrants’
profitability (Lieberman and Montgomery, 2013). Firstly, we reflect on the way certain
competitive strategies favor follower firms to successfully enter new markets (Fosfuri,
Lanzolla and Suarez, 2013). Secondly, our research proposes that the pace of industry
dynamism (Suarez and Lanzolla, 2007) will affect the effectiveness of the strategies
implemented by follower firms to erode early-mover advantages. In particular, we argue that,
in contexts with greater market growth, the cost strategy will show higher effectiveness in
eroding the competitive advantage of early movers. Conversely, in rapidly changing
1 However, their results do not support this idea.
72
technology contexts, the effectiveness of the cost strategy will be weaker. In other words, we
build on Suarez and Lanzolla (2007) and Gómez, Lanzolla and Maicas (2016) to integrate
competitive strategies and market dynamism when studying the sustainability of the early-
mover advantage. To our knowledge, this integration has not previously been explored in the
context of first moving advantages.
We test our hypotheses on a panel data collected from the Wireless Intelligence
Database. This study focuses on the European mobile telecommunication industry for the
period 2006-2017. Our findings show the relevance of considering competitive strategies
when explaining firm performance differences among each group of entrants. Competitive
strategies seem to be less important for early entrants –they outperform late movers in all
competitive scenarios2–, but their correct use is essential for followers. Moreover, the
contextual environment-level dimensions play a key role in explaining the effectiveness of
followers’ strategies in eroding early entrants’ advantages.
Our contribution to the entry-timing literature is twofold. First, we focus on the
current debate around entry-timing advantages by considering the relevance of competitive
strategies for early-movers’ and late entrants’ performance (Markides and Sosa, 2013). We
adopt a configural approach and theorise in favour of an appropriate fit between a firm’s
order of entry and the competitive strategy, as suggested by the literature (Zachary et al.,
2015). This approach assumes that there is an optimal fit between order of entry and
competitive strategies. However, it also considers that strategic misalignments may occur
(Handley and Angst, 2015) and develops a comparative analysis to assess all the possible
scenarios in terms of the match between competitive strategies and order of entry. To our
2 Our study assesses the profitability of early movers and followers with each of the competitive strategies considered (i.e. differentiation like, cost leadership and stuck-in-the-middle). In that regard, we use the term “competitive scenarios” to refer to all the possible situations that can take place in a market regarding firms’ entry timing and the competitive strategy used. For instance, a situation in which an early entrant differentiates and followers use cost leadership refers to one competitive scenario, whereas a situation in which both cohorts of entrants differentiate refers to another. Overall, we develop a comparative analysis that contemplates a total of nine competitive scenarios.
73
knowledge, with the exception of De Castro and Chrisman (1995), there is no empirical
evidence evaluating the most appropriate strategy for each cohort of entrants.
Second, our study advances research on the sustainability of early-mover advantages
by exploring the impact of environmental dynamics on the effectiveness of followers’
competitive strategy in FMA erosion. In that regard, our study does not focus exclusively on
early entrants’ behavior to create and maintain their advantages, but also on the way
followers may successfully enter and compete (Fosfuri et al., 2013) regarding changing
market conditions (Suarez and Lanzolla, 2007). The combination of micro and macro aspects
in the same setting allows for a complete understanding of the effectiveness of different
competitive strategies to obtain a sustainable competitive advantage. To our knowledge, this
possibility has not been explicitly contemplated either theoretically or empirically, but it
might be essential to offer a more nuanced picture of why early-entrants advantages might
disappear, as the literature suggests (Lieberman and Montgomery, 1998, 2013; Tellis, 2014).
Moreover, we offer scholars and practitioners novel insights about how changing
environmental conditions impact the extent to which followers’ strategies enhance the
achievement of performance advantages (Fosfuri et al., 2013). This dynamic approach also
responds to the call to study post-entry strategies (Zachary et al., 2015).
The rest of the paper is structured as follows. The next Section includes a brief
literature review and reveals the opportunities for additional research that we have found. In
Section 3, we present the hypotheses that relate order of entry, competitive strategy, industry
dynamism and profitability. Section 4 presents the research setting, the variables and the
methodology used. Finally, in Section 5 the empirical results are presented and in Section 6
we discuss the relevance of our key findings.
74
3.2. LITERATURE REVIEW ON ENTRY-TIMING ADVANTAGES
Despite decades of research, the analysis of the relationship between order of entry
and performance has produced puzzling results (see Zachary et al., 2015 for a review). The
discussion presented in the Introduction is perhaps the best reflection of this (please, see
Greve and Seidel, 2014 and Tellis, 2014). One approach that has been followed to clarify
prior findings has been to explore how competitive strategies influence the way in which each
cohort of entrants competes and creates value. Following Porter’s categorization (1980),
scholars have generally distinguished between two main ways to achieve competitive
advantages: differentiation and cost leadership3. Whereas the former emphasizes the need to
offer unique and high-quality products to reach a superior position, the later seeks to gain
advantages over its rivals by becoming the lowest cost producer in the industry. Despite
research carried out on this issue (please, see the discussion below), opposite findings have
also been obtained and researchers have called for more research on the role of business
models (Markides and Sosa, 2013) and competitive strategies on the performance of early
and later movers (Zachary et al., 2015).
A concurrent suggestion from this literature is that differentiation may be the most
appropriate path for pioneers to gain market share, improve profitability and to hinder
prospective rivals’ entry (Durand and Coeurderoy, 2001; Ruiz-Ortega and García-Villaverde,
2008). However, empirical studies fail to confirm this, as cost leadership is apparently as
better as differentiation for first-movers (De Castro and Chrisman, 1995). Similarly, the
competitive orientation for successful follower firms is far from clear. While competing on a
low-cost basis seems to be the best option for followers (Coeurderoy and Durand, 2004;
Covin, Slevin and Heeley, 1999; Fernández and Usero, 2009; Ruiz-Ortega and García-
3 Note that, together with the generic strategies, Porter coins the expression “stuck-in-the-middle” to refer to those firms that pursue the both differentiation and cost leadership, but fail to develop any of them. More recently, scholars have distinguished between firms that are stuck in the middle from those following hybrid strategies that successfully emphasize efficiency and differentiation (please see the literature review developed in Chapter 2).
75
Villaverde, 2008), several studies point at the use of differentiation actions, such as product
innovativeness (Robinson and Chiang, 2002; Shamsie, Phelps and Kuperman, 2004),
advertising efforts (Schnaars, 1994) or greater relative quality (Shamsie et al., 2004), as a
suitable way to create competitive advantage and to catch up with pioneers.
In this paper we seek to tackle this still puzzling side of the entry timing literature by
delving into the relationship between order of entry, competitive strategy and firm
performance. A deterministic model would assume that all pioneers follow a specific
strategy, different from that of followers (see Lambkin, 1988), as proposed in Chapter 2. In
Chapter 2 this is justified in terms of the ability of each cohort of entrants to take advantage
of the isolating mechanisms that prevail at entry. However, this fit (Kerin et al., 1992; De
Castro and Chrisman, 1995) may be conditioned by other factors. First, each cohort of
entrants will not necessarily have similar resources and skills, strategic objectives or
decision-makers and, consequently, we should not expect a unique behaviour (De Castro and
Chrisman, 1995; Shamsie et al., 2004). Second, as management scholars have recently
pointed out, firms may make mistakes when competing in uncertain environments (Handley
and Angst, 2015) and, as a result, they do not take optimal decisions. These misalignments
would inevitably influence the achievement and sustainability of competitive advantages. By
delving into the interplay between the order of entry and competitive strategies, this study
aims to clarify the ambiguous evidence regarding performance differences at the firm-level.
In addition to this issue, Fosfuri et al., (2013) have recently pointed out that, despite
its importance in the field of strategy, just a limited amount of studies analysed the role of the
environment on the achievement and maintenance of entry-timing advantages. Some scholars
have drawn attention to this matter by examining the effect of external contingencies on the
analysis of entry-timing decisions and its effects (e.g. Lieberman and Montgomery, 2013;
Suarez and Lanzolla, 2007; Zachary et al., 2015). In particular, industry dynamism has been
76
recently attributed a key role in explaining the sustainability of first movers advantages
(Suarez and Lanzolla, 2007). The empirical evidence confirms that the pace of market growth
and technology evolution have a detrimental effect on pioneers advantages (see, for instance,
Gómez et al., 2016). Despite significant progress made on this issue during the last years,
there are still open questions that need to be addressed (Zachary et al., 2015). In particular,
the field lacks clarity about the external conditions that could affect the optimal fit between
the order of entry and firm-based factors (i.e. resources and capabilities, strategy, business
models).
Our paper seeks to address prior gaps by arguing that certain competitive strategies
might have a different effectiveness in sustaining the entry timing advantages in different
contexts. In particular, we mainly focus on the ability of latecomers to erode early entrants’
advantages when different external conditions and competitive scenarios are considered.
3.3. HYPOTHESES
The review of the literature undertaken in the previous section shows that the fit
between competitive strategy and order of entry is not well understood when firm
performance is considered. It also suggests that certain competitive strategies could have
different effectiveness when confronting various industry conditions and, therefore, when
explaining the sustainability of early mover’s performance. In this section we theorize on
these two dimensions in order to extend the proposals of Chapter 2. First, we argue that
differentiation like strategies are the ones that offer the best promise of performance
advantages for early entrants. Second, we reflect on those competitive strategies more likely
to be used by followers. Specifically, we examine those that offer the highest likelihood of
eroding early movers’ advantages when two key industry dynamics are considered: market
growth and technological change.
77
3.3.1. Order of entry, competitive strategy and performance
Our first hypothesis proposes that differentiation like strategies (those that emphasize
value rather than cost) are likely to generate the best performance for early-movers. The
reasons have to do with the characteristics of early adopters, with the evolution of industries
over time and with the isolating mechanisms. On the one hand, according to Rogers (1995)’s
adopter categorization, two main types of consumers are identified during the first stages of
market development. Firstly, those individuals labelled as innovators, which show greater
willingness to pay for innovative and high standard products, even when they are surrounded
by uncertainty. Secondly, the category of early adopters, which mainly consists of
individuals who act as influencers or opinion leaders in most social communities. While
innovators play the role of introducing new products into the social system, early adopters
are responsible for reducing uncertainty and giving advice to the largest customers’ segments.
The two groups have substantial financial resources and enjoy higher social status. Moreover,
they tend to use “the adoption of innovations as one means of getting there” (Rogers, 1995:
251).
On the other hand, the initial stages of market development are characterized by slow
market growth (Levitt, 1965). This makes highly unlikely that first-movers can profit from
costs reductions through scale economies (Agarwal and Gort, 2001). Additionally, the early
stages of industry development tend to be characterised by uncertainty around product
features and technology development (Day, 1981), which makes costs a secondary aspect
when market competition is considered.
In this context, designing a strategy that emphasises the value of a firm’s offering for
consumers shows the best fit with the isolating mechanisms suggested by Lieberman and
Montgomery (1988), namely, switching costs, technological leadership and pre-emption of
scarce assets. The higher socioeconomic characteristics of first adopters, together with the
78
low market growth create opportunities to take advantage from the three isolating
mechanisms. For example, first-movers may take advantage of first moving and of a
temporary absence of competition to build a base of loyal customers and influencing their
preference structure towards its product attributes (Carpenter and Nakamoto, 1989). This
creates switching costs from which early entrants may extract a price premium. First-movers
may also pre-empt superior quality assets to attend current demands by offering the best
product to the most profitable customer niches (Lieberman and Montgomery, 1988).
Similarly, they can gain advantage through technological leadership and use patent protected
knowledge to design offerings with the best performance characteristics that may appeal to
innovators and early adopters. This logic supports the idea that the use of differentiation
strategies that attract the most profitable consumers is the most profitable option for first-
movers.
One important observation is that, as markets mature, uncertainty is reduced and
potential customers increase their willingness to acquire the new product. This is likely to
have market growth and new entries as a consequence. However, the type of customers that
follower firms will face when entering the marketplace is completely different from
innovators and early adopters. According to Rogers (1995), the main categories of users that
can be identified are, in this order, early majority, late majority, and laggards. As the
innovation diffusion progresses in the social system, buyers tend to present lower risk
acceptance levels, lower willingness to pay if success is not guaranteed and, in general, an
inferior desire to acquire the newness. Given that adopters in more advanced stages of market
development tend to see adoption as “an economic necessity and the answer to increasing
network pressures” (Rogers, 1995: 249), a standardized product may be enough to satisfy
maturity and traditional demands. Acquiring a standard-quality and low-priced product might
be their goal, since they have more limited financial resources than early adopters.
79
Given the features of these new categories of users, it is likely that costs pressures
increase as the market grows and that followers compete through a cost leadership strategy to
capture the demand not willing to pay for the pioneers’ offering or “previously uneconomic
to serve” (Day 1981: 65). Although our contention is that all early-movers will suffer from
competition as a consequence of increasing pressures over costs, those that are able to
successfully combine positive elements of both differentiation, to preserve prior competitive
advantages, and cost, to resists the increasing pressures over costs, are the ones more likely to
sustain their competitive advantage. Stated differently, those differentiated early movers,
capable of improving its cost efficiency levels as market grows, will enjoy greater advantages
while protecting themselves from market share erosion (Pertusa-Ortega, Molina-Azorín and
Claver-Cortés, 2009).
Taken together, all these arguments allow us to propose that the use of differentiation
like strategies (differentiation and hybrid) is the most profitable option for early movers,
whereas the cost strategy will be the optimal for followers. Accordingly, we state that:
Hypothesis 1a: Early-movers following differentiation like strategies will obtain better
performance than early-movers following costs strategies or being stuck in the middle.
Hypothesis 1b: Followers using cost strategies will obtain better performance than
followers using differentiation like strategies or being stuck in the middle.
3.3.2. The moderating role of industry dynamism
As for now, we have argued in terms of the most suitable competitive strategy to
confer each cohort of entrants with a greater performance advantage when industries follow a
typical development pattern. However, when analysing the persistence of entry-timing
advantages, scholars have recently remarked the importance to consider a wider variety of
external forces that may affect the ability of firms to achieve success, such as the evolution of
80
consumers’ needs and technological and market changes (Fosfuri et al., 2013; Lierberman
and Montgomery, 2013). In that regard, recent research on entry-timing literature reflects on
the way the pace of evolution of environmental-level conditions may enable or disable the
isolating mechanisms that give rise to early-mover advantages (Suarez and Lanzolla, 2007).
Along with this theoretical approach, the influence of industry dynamics on the entry timing
advantages has been empirically confirmed (Durand and Couderoy; 2001; Gómez et al.,
2016). Nevertheless, to our knowledge, the joint effect of macro and micro aspects on the
persistence of early entrants’ performance advantages is unexplored. So, we seek to advance
entry-timing advantage research by considering both followers’ competitive behaviour and
the influence of environmental contingencies as potential detrimental factors for early-mover
advantages. We argue that certain environment-level conditions will affect the effectiveness
of the competitive strategy that is assumed to be optimal for follower firms. In particular, our
study focuses on analysing how effective a cost strategy is to reduce the performance gap of
followers with early movers. To do that, we focus on the role of industry dynamism by
examining the influence of the pace of market growth and technological change (Suarez and
Lanzolla, 2007).
Market Growth
The pace of market evolution is generally characterized by presenting initial stages of
low demand, followed by a period of rapid growth in which sales take-off, and a phase of
maturity and decline (Levitt, 1965). As market grows and increases in demand take place
followers will have a greater chance to successfully enter and meet emerging customer
groups (Day, 1981). As previously suggested, the cost strategy will offer a better fit for
followers to successfully compete with pioneers in an industry with a typical evolution.
However, the pace of market evolution is suggested to significantly influence the
effectiveness of the isolating mechanisms that give rise to early-entrants advantages (Suárez
81
and Lanzolla, 2007) and, consequently, the chance of later movers to successfully enter and
reduce the performance advantage of the pioneer. Therefore, the pace of market growth might
shape followers opportunities to benefit from a cost strategy. Accordingly, we suggest that
the effectiveness of followers’ cost strategy to erode early-entrants advantage will be
conditioned by the pace of market evolution because of three main reasons.
First, the ability of a firm to pre-empt scarce assets has been identified as an effective
driver to achieve early mover advantages. However, in contexts with a higher pace of market
growth, the existence of enough resources (such as potential buyers, suppliers or distribution
channels) for all potential entrants is guaranteed, facilitating followers’ successful entry
(Suarez and Lanzolla, 2007). In those environments, there will be a faster emergence of new
sorts of consumers whose preferences (e.g., demand for low cost products), as previously
noted, will significantly differ from those of innovators and early adopters (Rogers, 1995).
Accordingly, we would expect later movers in contexts of high market growth to have more
opportunities to meet a greater number of potential buyers demanding standardized and low
cost products.
Second, a highly growing market would diminish early-mover advantages derived
from learning curves since it allows later entrants to “travel along the experience curve more
quickly” (Gómez et al., 2016: 268) and to benefit from economies of scale and scope. To the
extent cost advantages are a function of firms’ cumulative experience and market leadership
(Kerin et al., 1992), rapid market growth will result in greater opportunities for followers to
build a strong cost position in a shorter period of time.
Third, higher rates of market growth could disable switching costs that usually favor
early-movers advantages. Potential entrants at initial stages of market development must deal
with the fact that a broad portion of the market is already committed to the incumbent’s
product (Lierberman and Montgomery, 1988). However, in a context of high market growth,
82
the proportion of locked-in buyers will be notably reduced (Beggs and Klemperer, 1992).
This means that the initial locked-in consumers, who show a better fit with the early entrant
offering, will quickly reduce its weight on total demand as the new group of buyers appear on
the market. Therefore, we expect that the chances of followers with a cost strategy to gain
acceptance and erode early-entrants advantage will be higher when market growth is also
higher.
Under these assumptions, our second hypothesis states that:
Hypothesis 2: The higher the market growth, the greater the effectiveness of the
cost strategy used by a follower to erode early movers’ advantages.
Technology evolution
Technology evolution refers to exogenous technical changes that shift the competitive
marketplace by modifying the systems needed for producing outputs and creating value
(Lavie, 2006). Technological discontinuities have been traditionally seen as a catalyst for
market dynamism, since new opportunity windows arise for potential entrants after its
emergence (Lee and Malerba, 2017). In that regard, Tellis (2014) reflects on how later
movers may venture out the exploitation of new opportunities that arise from the appearance
of superior technologies. Suarez and Lanzolla (2007) discuss how the pace of technology
evolution may potentially enable or disable FMAs. Empirically, the evidence confirms the
detrimental effect of technological changes on the persistence of early entrants’ advantage
(e.g. Bohlmann, Golder and Mitra, 2002; Gómez et al., 2016). Our study delves into this
relationship, taking into account the way followers compete when explaining the erosion of
early-movers advantages in contexts of technology evolution.
As argued in our hypothesis 1b, cost leadership seems to be the best competitive
strategy for follower firms to achieve competitive advantages (see, for instance, Coeurderoy
and Durand, 2004; Fernández and Usero, 2009; Ruiz-Ortega and García-Villaverde, 2008).
83
However, when environmental-level factors are considered, this statement seems to be
subject to other nuances (Suarez and Lanzolla, 2007). In particular, it is argued that contexts
of rapid technological change allow latecomers to invent around and compete with improved
products. It seems that, in those contexts, they might have greater chances to benefit from
superior quality products, which would be more close to a differentiation orientation. This
leads us to consider that, in markets of high technology evolution, followers may take
advantages from the development of a differentiation strategy as well as from a cost strategy.
Therefore, we suggest that both versions complement each other to some extent since,
although the cost strategy is preferred, it might not be as aligned with the external
environment as in contexts with a slow technological change. Accordingly, our contention is
that the effectiveness of the followers’ cost strategy to erode early-entrants advantages will be
lower in environments characterized by higher technology dynamism than in contexts where
technology moves at a smooth pace. Our arguments are presented in more detail below.
It has been claimed that technology evolution could affect the chances of early
entrants to sustain advantages from technology leadership (Bohlmann et al., 2002). For
instance, a smooth pace of technology evolution usually favors first-movers, as later entrants
have lower opportunities to challenge their competitive advantage by using improvements to
differentiate their product (Suárez and Lanzolla, 2007). However, rapid technology
environments reduce the effectiveness of patents in protecting innovations, giving later
entrants greater possibilities to “invent around” (Lieberman and Montgomery, 1988) and
come up with improved products to compete on differentiation.
A rapid pace of technology dynamism also creates uncertainty over the performance
trajectories of new technical innovations within an industry (Bower and Christensen, 1995);
thus creating greater difficulties for firms to preempt strategic assets such as technological
resources or potential consumers (Suarez and Lanzolla, 2007). Prior studies state that first-
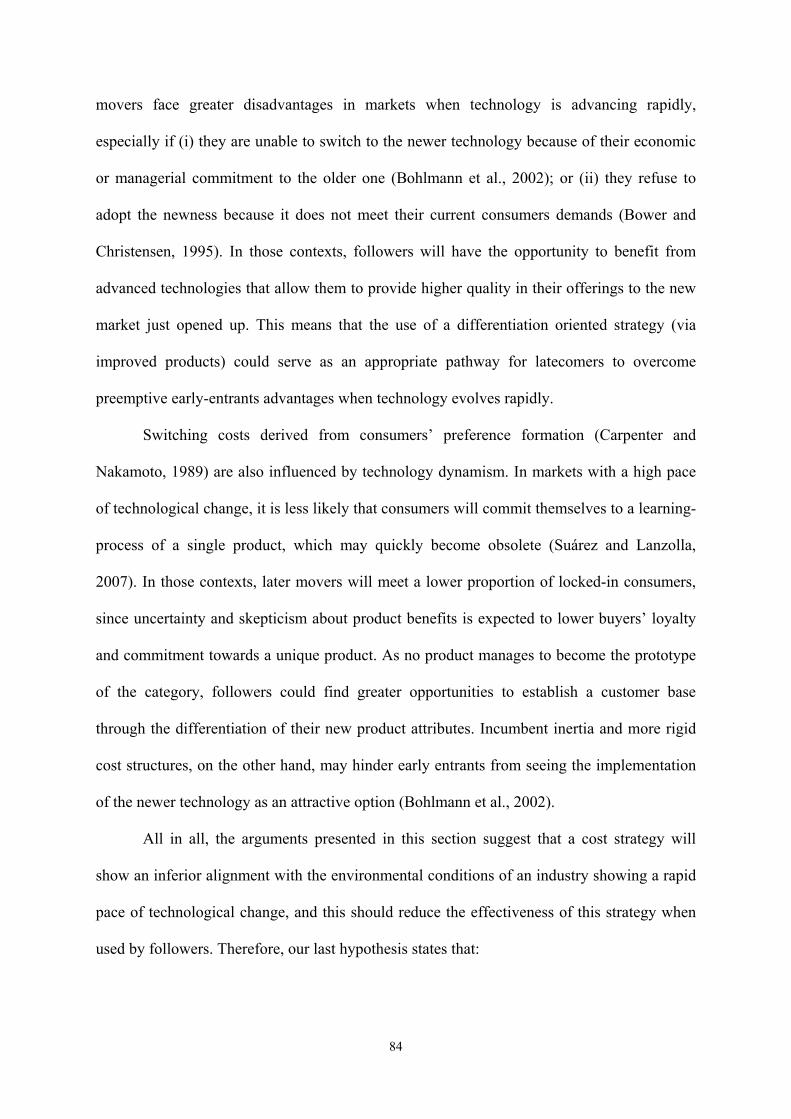
84
movers face greater disadvantages in markets when technology is advancing rapidly,
especially if (i) they are unable to switch to the newer technology because of their economic
or managerial commitment to the older one (Bohlmann et al., 2002); or (ii) they refuse to
adopt the newness because it does not meet their current consumers demands (Bower and
Christensen, 1995). In those contexts, followers will have the opportunity to benefit from
advanced technologies that allow them to provide higher quality in their offerings to the new
market just opened up. This means that the use of a differentiation oriented strategy (via
improved products) could serve as an appropriate pathway for latecomers to overcome
preemptive early-entrants advantages when technology evolves rapidly.
Switching costs derived from consumers’ preference formation (Carpenter and
Nakamoto, 1989) are also influenced by technology dynamism. In markets with a high pace
of technological change, it is less likely that consumers will commit themselves to a learning-
process of a single product, which may quickly become obsolete (Suárez and Lanzolla,
2007). In those contexts, later movers will meet a lower proportion of locked-in consumers,
since uncertainty and skepticism about product benefits is expected to lower buyers’ loyalty
and commitment towards a unique product. As no product manages to become the prototype
of the category, followers could find greater opportunities to establish a customer base
through the differentiation of their new product attributes. Incumbent inertia and more rigid
cost structures, on the other hand, may hinder early entrants from seeing the implementation
of the newer technology as an attractive option (Bohlmann et al., 2002).
All in all, the arguments presented in this section suggest that a cost strategy will
show an inferior alignment with the environmental conditions of an industry showing a rapid
pace of technological change, and this should reduce the effectiveness of this strategy when
used by followers. Therefore, our last hypothesis states that:
85
Hypothesis 3: The higher the pace of technological change, the lower the effectiveness
of the cost strategy used by a follower to erode early movers’ advantages.
In sum, our first two hypotheses propose the existence of an optimal fit between each
cohort of entrants and certain competitive strategies to successfully compete in a stable
marketplace. In particular, differentiation like strategies will offer early entrants a more
profitable position, whereas the cost strategy will be the optimal choice for follower firms to
compete when markets follow a typical development pattern. However, when an industry
shows higher dynamism, our contention is that the effectiveness of the competitive strategy
that is presumed to offer a better adjustment with follower firms will vary. Specifically, in
contexts of high market growth, the cost strategy will be better aligned with the
environmental conditions. Conversely, contexts of rapid technology evolution will offer a
worse fit with followers cost strategies.
Our model of analysis is presented below in Figure 3.1.
Figure 3.1. Model of analysis
3.4. EMPIRICAL ANALYSIS
3.4.1. Data and Sample
3.4.1.1. Research setting: The mobile telecommunications industry
In order to test our hypotheses, we use longitudinal data of Mobile Network Operators
(MNOs) in the European mobile telecommunication industry. Our multi-country sample
Performance
Order of entry
Competitive strategy
INDUSTRY DYNAMISM
Market growth Technological change
86
considers a total of 67 companies that operate in 18 markets4. The data used to develop the
empirical analysis mainly comes from the GSMA Intelligence Database (2017), though
additional information has been collected from the International Telecommunication Union,
press releases and operators’ consolidated annual reports.
3.4.1.2. Variable description
Dependent variable
Most traditional studies on FMAs have evaluated market share when assessing
pioneer performance (Szymanski, Troy and Bharadwaj, 1995; VanderWerf and Mahon,
1997). Since using market share might influence the estimation of pioneer effects
(VanderWerf and Mahon, 1997), scholars have stressed the importance of using profitability
measures to evaluate first mover advantages (Lieberman and Montgomery, 1998).
Accordingly, we use a firm’s EBITDA (Earnings Before Interests, Tax, Depreciation and
Amortization) as a dependent variable in our empirical test. Concretely, the GSMA
Intelligence Database provides information on EBITDA on a quarterly basis, expressed as a
percentage of the firm total revenues.
Independent variables
Order of entry
The variable early entrant identifies those firms that penetrate the mobile
telecommunication industry in the initial stages of market development. It is important to
note that, in the telecommunication sector, the emergence of a new industry took place with
the shift from fixed to wireless technology (Fuentelsaz, Garrido and Maicas, 2015). Despite
the first generation of mobile phones started to be commercialized in the late 1980s, it was
not until the emergence of the Second Generation (2G) when the real take off of wireless
technology took place and its diffusion process accelerated. 4 Our data set includes the following European countries: Austria, Belgium, Croatia, Finland, France, Germany, Greece, Ireland, Montenegro, Netherlands, Norway, Poland, Portugal, Serbia, Slovakia, Spain, Sweden and United Kingdom.
87
In this study, we take into account the mobile telecommunication service diffusion to
categorize our order of entry variable. In particular, we defined an early entrant dummy that
equals 1 if the adoption rate of the mobile technology is below 16 percent when the firm
entered the market, and 0 otherwise. By classifying an early entrant in that way, we identify
those first movers that meet innovators and early adopters when penetrating the mobile
telecommunication industry (Rogers, 1995).
It is important to note that the highest rate of mobile adoption in the European markets
took place during the last years of the 20th century (OECD, 2000). For instance, whereas in
the early 1990s there was just one mobile subscriber per 100 inhabitants in Germany, the
proportion increased up to more than 20 per cent by 1999. As the GSMA Intelligence
database only offers information from the first quarter of year 2000, we use data collected
from the International Telecommunication Union (ITU) to define our early entrant variable.
In particular, we use the number of mobile-cellular subscription expressed as a percentage of
the total population to identify the penetration rate of the mobile technology per market.
Competitive Strategy
Scholars in the management field have employed a wide diversity of methods to
conceptualize firms’ competitive strategies (see, for instance, Bowman and Ambrosini, 1997;
Pertusa-Ortega et al., 2009; Spanos et al., 2004; Thornhill and White, 2007; White, 1986). In
line with White (1986)’s study, we categorize competitive strategies using a two-dimensional
chart, whose axes are price and cost inefficiency. According to Porter (1980), differentiation-
oriented organizations are more involved in producing better quality products, which may be
reflected by a higher customer willingness to pay (Lieberman et al., 2016). Thus, we link
higher prices to a differentiation like strategy. On the other hand, firms following cost
strategies fail to achieve high quality levels because their efforts are mainly aimed at
diminishing product-related expenditures (Nayyar, 1993; Zott and Amit, 2008), while
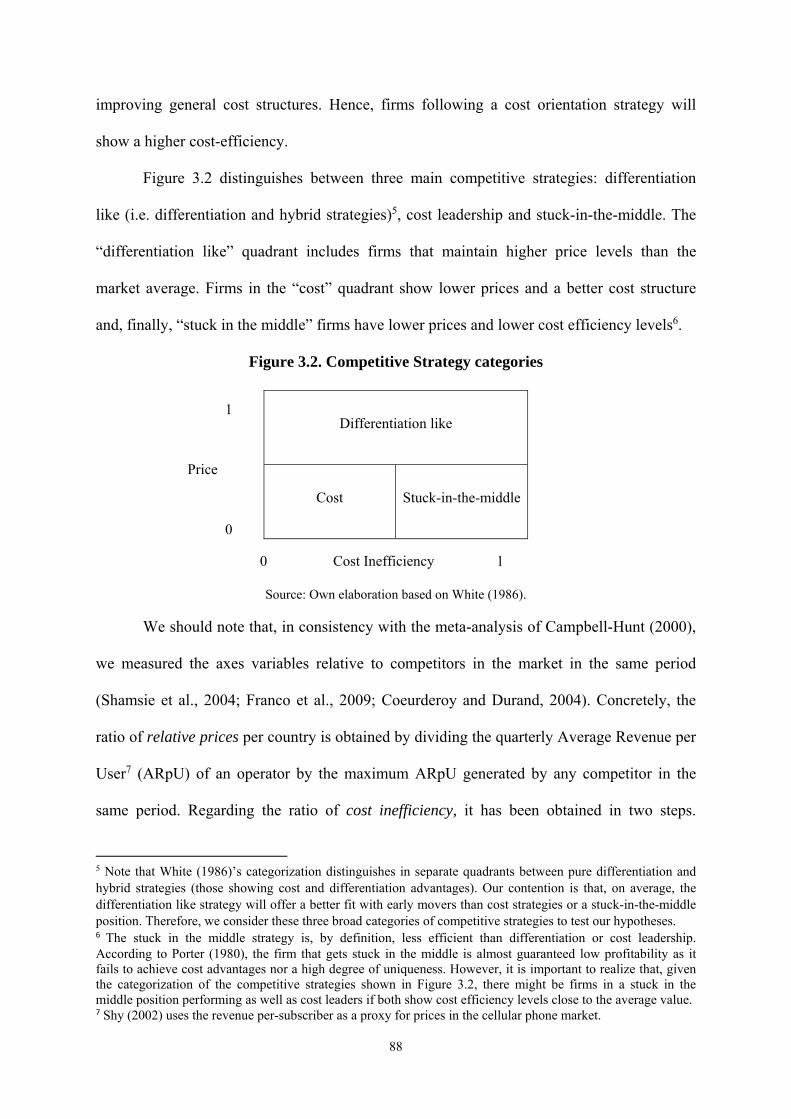
88
improving general cost structures. Hence, firms following a cost orientation strategy will
show a higher cost-efficiency.
Figure 3.2 distinguishes between three main competitive strategies: differentiation
like (i.e. differentiation and hybrid strategies)5, cost leadership and stuck-in-the-middle. The
“differentiation like” quadrant includes firms that maintain higher price levels than the
market average. Firms in the “cost” quadrant show lower prices and a better cost structure
and, finally, “stuck in the middle” firms have lower prices and lower cost efficiency levels6.
Figure 3.2. Competitive Strategy categories
Differentiation like
Cost Stuck-in-the-middle
Source: Own elaboration based on White (1986).
We should note that, in consistency with the meta-analysis of Campbell-Hunt (2000),
we measured the axes variables relative to competitors in the market in the same period
(Shamsie et al., 2004; Franco et al., 2009; Coeurderoy and Durand, 2004). Concretely, the
ratio of relative prices per country is obtained by dividing the quarterly Average Revenue per
User7 (ARpU) of an operator by the maximum ARpU generated by any competitor in the
same period. Regarding the ratio of cost inefficiency, it has been obtained in two steps.
5 Note that White (1986)’s categorization distinguishes in separate quadrants between pure differentiation and hybrid strategies (those showing cost and differentiation advantages). Our contention is that, on average, the differentiation like strategy will offer a better fit with early movers than cost strategies or a stuck-in-the-middle position. Therefore, we consider these three broad categories of competitive strategies to test our hypotheses. 6 The stuck in the middle strategy is, by definition, less efficient than differentiation or cost leadership. According to Porter (1980), the firm that gets stuck in the middle is almost guaranteed low profitability as it fails to achieve cost advantages nor a high degree of uniqueness. However, it is important to realize that, given the categorization of the competitive strategies shown in Figure 3.2, there might be firms in a stuck in the middle position performing as well as cost leaders if both show cost efficiency levels close to the average value. 7 Shy (2002) uses the revenue per-subscriber as a proxy for prices in the cellular phone market.
1
Price
0
0 Cost Inefficiency 1
89
Firstly, we have divided each firm operational expenses by the number total of connections
(subscriptions) registered on the mobile network. Then, we calculated the relative cost
position of each firm by dividing the value obtained by the maximum in the market. The
greater the value of this ratio, the more inefficient the operator is and the further it is from a
cost leadership strategy.
To classify the competitive strategy followed by a firm, we calculated the mean value
of each ratio (relative prices and cost inefficiency) per country and quarter. Once the country-
mean is obtained, we categorize the competitive position of each firm in relation to the
national average8. A firm that presents values below the mean in both ratios will be labelled
as a cost leader. The corresponding dummy, cost strategy, will take a value of 1 for that firm;
otherwise, it will take a value of 0. Firms presenting values above the national average for
relative prices are classified as differentiators and for these cases the dummy differentiation
like strategy will take a value of 1, and 0 otherwise. Finally, firms that present values above
the mean in the cost inefficiency ratio and below the mean in the case of the relative prices
ratio are considered as firms with a stuck in the middle position. The corresponding stuck in
the middle dummy will equal 1 for those firms, and 0 otherwise. Firms following a stuck in
the middle strategy are used as the base case in our empirical analysis.
Industry dynamism
To evaluate how environmental contingencies influence the persistence of early
movers’ advantages, we use two main dimensions identified by prior studies as reflecting the
industry dynamism: market growth and technological change (Suarez and Lanzolla, 2007).
Both variables are measured at the market level. Regarding the former, our variable market
growth measures the percentage variation in the number of mobile users in a market in
8 Note that the competitive strategy of each firm is defined per country and quarter in relation to the competitive position of its rivals in the market. Accordingly, we remove the observations of a country when there is no information for all the industry players at a given time.
90
comparison to the previous year. Specifically, we divided the number of new mobile users in
a specific quarter by the total of mobile users in the year-ago quarter. On the other hand, the
technological change variable counts the number of technological innovations that have
taken place in the mobile telecommunication industry per country from the emergence of 2G
until the second quarter of 2017. By identifying when a new technology is available in each
market, this variable allows us to capture the pace of technological evolution per market at
different times.
By way of clarification, it might be convenient to note that mobile technologies in the
telecommunication industry can be described as technology standards that are traditionally
aggregated into technological generations. Each of them is considered an evolution of the
previous one, since it improves the service to a greater or a lesser extent. To define our
variable of technology evolution, we have considered the technological changes that
significantly upgrade the service offered and, consequently, the way people have benefited
from their mobile phone service. According to the GSMA classification, the most important
technological changes in the telecom industry have been, in this order, the change from GSM
technology (commonly known as the Second Generation or 2G) to WCDMA (3G), the
introduction of WCDMA-HSPA (3.5G), the change towards LTE (4G), and finally, the
introduction of LTE Advanced (the upgraded form of LTE). On this basis, our technological
change variable ranges from 0 to 4. Whereas 0 identifies environments characterized by a
slow pace of technological change (the only technology available is GSM), a value of 4
identifies those markets presenting a higher pace of technology evolution (they have
experienced the four technological changes considered).
Control variables
Apart from the variables described above, we also control for other factors. First, we
define a set of year dummies and quarter dummies to assess any time-specific influences.
91
Second, we also include country dummies to control for contextual factors that might
influence the implementation and effectiveness of firms’ competitive strategies. Third, we
count the number of competitors per country to control for competition in each period.
Finally, as previously done in Chapter 2, we control for possible firm-specific effects
by including three dummy variables: merger, part of a group and incumbent. The variable
merger equals 1 when the firm is the result of an acquisition or a merger process, and 0
otherwise. The part of a group dummy takes a value of 1 when an operator is majority-owned
by a multinational telecommunication group; otherwise, it takes the value 0. Finally, we
identify those firms that were previously established as an incumbent that provided fixed line
services in a market through the variable incumbent. It takes the value 1 if the firm offered
fixed line services before the mobile telecommunications services appeared, and 0 otherwise.
3.4.1.3. Descriptive Statistics
Table 3.1 presents the descriptive analysis and correlations of the variables considered
to measure the empirical model. Our final sample includes a total of 1,025 observations for a
period covering from 2006 to the second quarter of 2017. Overall, Table 3.1 shows that the
correlation among all variables included in our model is moderate. As could be expected, the
only exception is the negative relationship between the differentiation and cost strategy (r=-
0.747). Besides, we can observed that EBITDA margin is positively correlated with an early
entry, and with all the strategy variables considered.
Regarding the industry variables included in our model, Table 3.1 shows an average
market growth of 0.032. This result reflects a slower pace of market growth than shown in
prior studies developed within the mobile telecommunications industry (see, for instance,
Gómez et al., 2016). In the case of the technological change, the mean of the variable is
2.387. This means that the degree of technology evolution in our sample is, on average, close
92
to advanced stages of the Third Generation (i.e. those in which the latest technological
standard is the WCDMA-HSPA)9.
9 Please note that our variable technological change identifies with a value of 1 those periods in which the WCDMA (3G) is the newest technology in a given market. It equals 2, 3 and 4 when the introduction of WCDMA-HSPA (3.5G), LTE (4G) and LTE-Advanced have taken place, respectively.
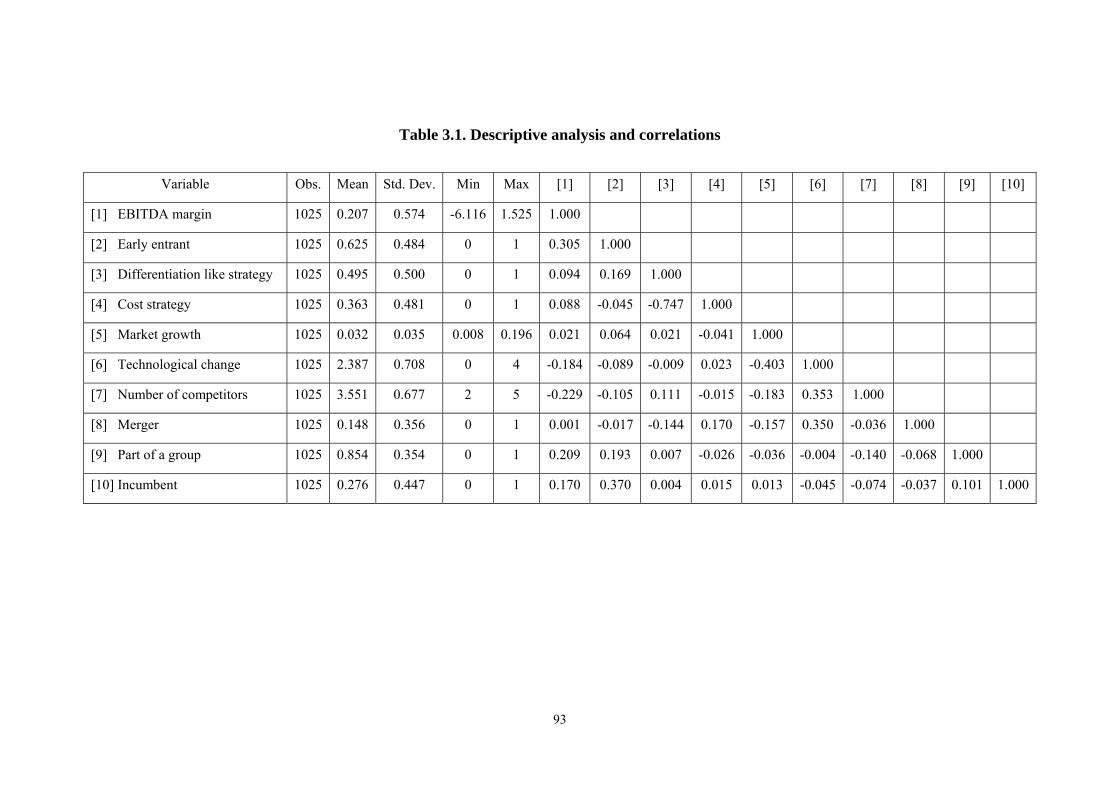
93
Table 3.1. Descriptive analysis and correlations
Variable Obs. Mean Std. Dev. Min Max [1] [2] [3] [4] [5] [6] [7] [8] [9] [10]
[1] EBITDA margin 1025 0.207 0.574 -6.116 1.525 1.000
[2] Early entrant 1025 0.625 0.484 0 1 0.305 1.000
[3] Differentiation like strategy 1025 0.495 0.500 0 1 0.094 0.169 1.000
[4] Cost strategy 1025 0.363 0.481 0 1 0.088 -0.045 -0.747 1.000
[5] Market growth 1025 0.032 0.035 0.008 0.196 0.021 0.064 0.021 -0.041 1.000
[6] Technological change 1025 2.387 0.708 0 4 -0.184 -0.089 -0.009 0.023 -0.403 1.000
[7] Number of competitors 1025 3.551 0.677 2 5 -0.229 -0.105 0.111 -0.015 -0.183 0.353 1.000
[8] Merger 1025 0.148 0.356 0 1 0.001 -0.017 -0.144 0.170 -0.157 0.350 -0.036 1.000
[9] Part of a group 1025 0.854 0.354 0 1 0.209 0.193 0.007 -0.026 -0.036 -0.004 -0.140 -0.068 1.000
[10] Incumbent 1025 0.276 0.447 0 1 0.170 0.370 0.004 0.015 0.013 -0.045 -0.074 -0.037 0.101 1.000
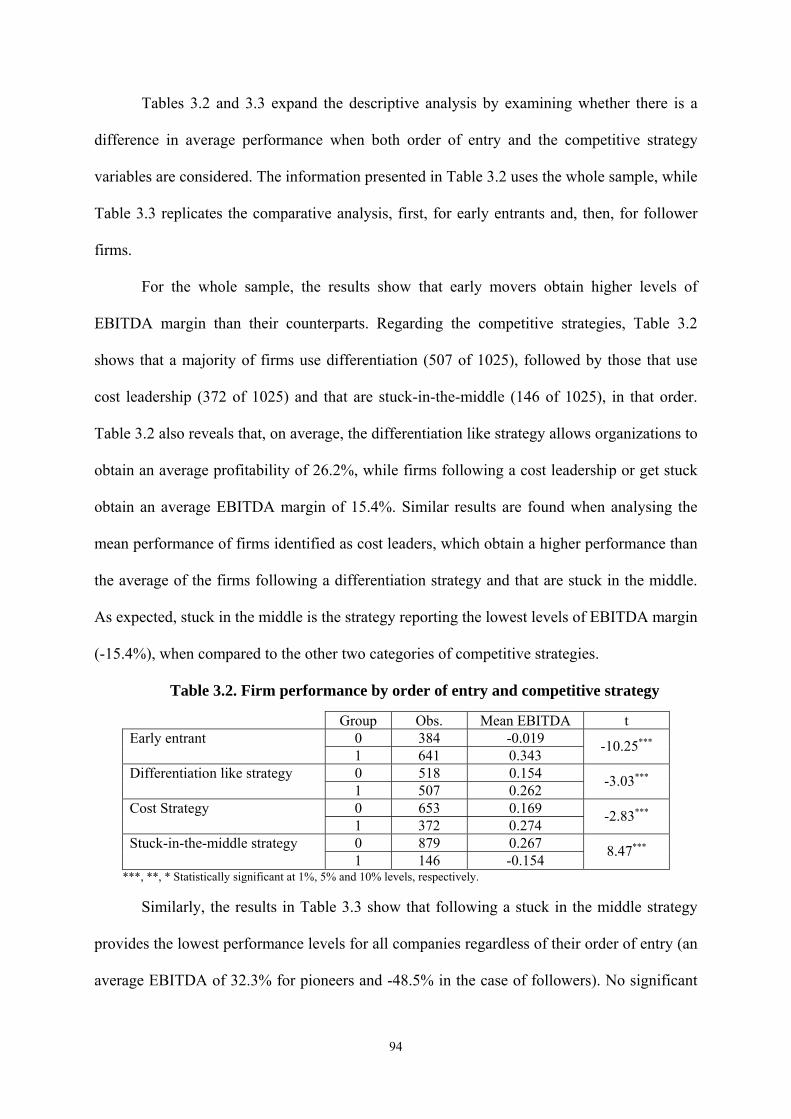
94
Tables 3.2 and 3.3 expand the descriptive analysis by examining whether there is a
difference in average performance when both order of entry and the competitive strategy
variables are considered. The information presented in Table 3.2 uses the whole sample, while
Table 3.3 replicates the comparative analysis, first, for early entrants and, then, for follower
firms.
For the whole sample, the results show that early movers obtain higher levels of
EBITDA margin than their counterparts. Regarding the competitive strategies, Table 3.2
shows that a majority of firms use differentiation (507 of 1025), followed by those that use
cost leadership (372 of 1025) and that are stuck-in-the-middle (146 of 1025), in that order.
Table 3.2 also reveals that, on average, the differentiation like strategy allows organizations to
obtain an average profitability of 26.2%, while firms following a cost leadership or get stuck
obtain an average EBITDA margin of 15.4%. Similar results are found when analysing the
mean performance of firms identified as cost leaders, which obtain a higher performance than
the average of the firms following a differentiation strategy and that are stuck in the middle.
As expected, stuck in the middle is the strategy reporting the lowest levels of EBITDA margin
(-15.4%), when compared to the other two categories of competitive strategies.
Table 3.2. Firm performance by order of entry and competitive strategy
Group Obs. Mean EBITDA t Early entrant 0 384 -0.019 -10.25***
1 641 0.343 Differentiation like strategy 0 518 0.154 -3.03***
1 507 0.262 Cost Strategy 0 653 0.169 -2.83***
1 372 0.274 Stuck-in-the-middle strategy 0 879 0.267 8.47***
1 146 -0.154 ***, **, * Statistically significant at 1%, 5% and 10% levels, respectively.
Similarly, the results in Table 3.3 show that following a stuck in the middle strategy
provides the lowest performance levels for all companies regardless of their order of entry (an
average EBITDA of 32.3% for pioneers and -48.5% in the case of followers). No significant
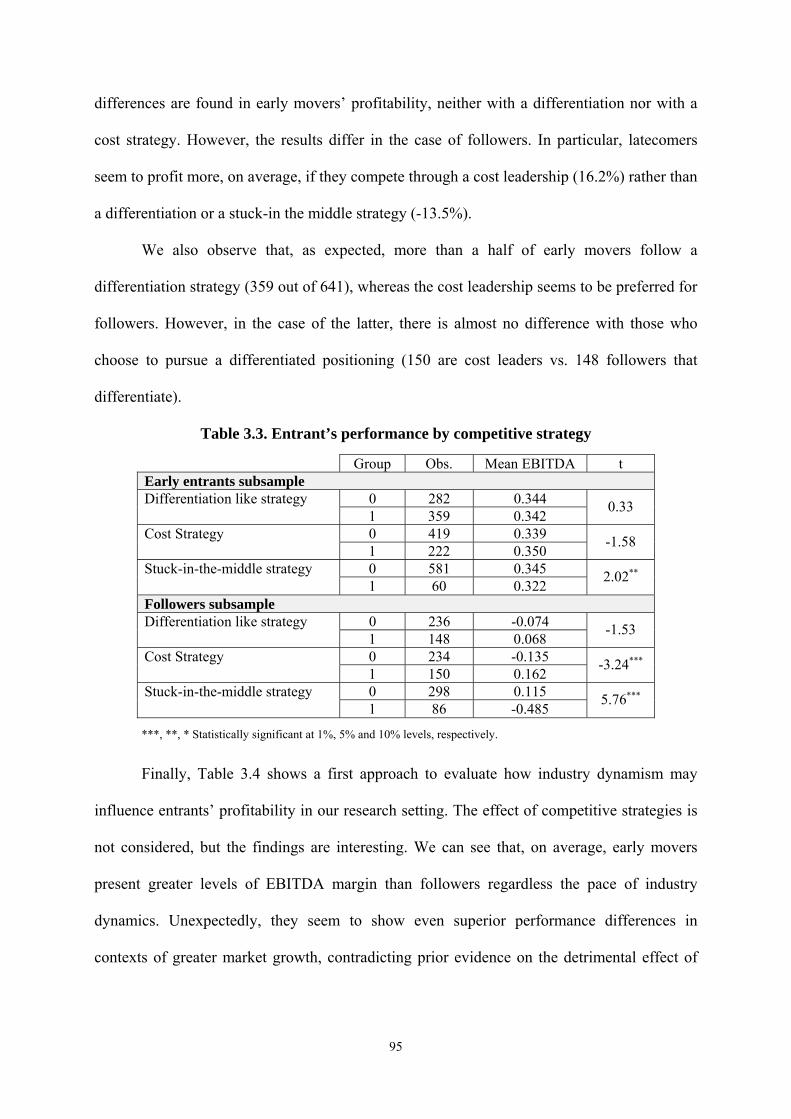
95
differences are found in early movers’ profitability, neither with a differentiation nor with a
cost strategy. However, the results differ in the case of followers. In particular, latecomers
seem to profit more, on average, if they compete through a cost leadership (16.2%) rather than
a differentiation or a stuck-in the middle strategy (-13.5%).
We also observe that, as expected, more than a half of early movers follow a
differentiation strategy (359 out of 641), whereas the cost leadership seems to be preferred for
followers. However, in the case of the latter, there is almost no difference with those who
choose to pursue a differentiated positioning (150 are cost leaders vs. 148 followers that
differentiate).
Table 3.3. Entrant’s performance by competitive strategy
Group Obs. Mean EBITDA t Early entrants subsample Differentiation like strategy 0 282 0.344 0.33
1 359 0.342 Cost Strategy 0 419 0.339 -1.58
1 222 0.350 Stuck-in-the-middle strategy 0 581 0.345 2.02**
1 60 0.322 Followers subsample Differentiation like strategy 0 236 -0.074 -1.53
1 148 0.068 Cost Strategy 0 234 -0.135 -3.24***
1 150 0.162 Stuck-in-the-middle strategy 0 298 0.115 5.76***
1 86 -0.485
***, **, * Statistically significant at 1%, 5% and 10% levels, respectively.
Finally, Table 3.4 shows a first approach to evaluate how industry dynamism may
influence entrants’ profitability in our research setting. The effect of competitive strategies is
not considered, but the findings are interesting. We can see that, on average, early movers
present greater levels of EBITDA margin than followers regardless the pace of industry
dynamics. Unexpectedly, they seem to show even superior performance differences in
contexts of greater market growth, contradicting prior evidence on the detrimental effect of
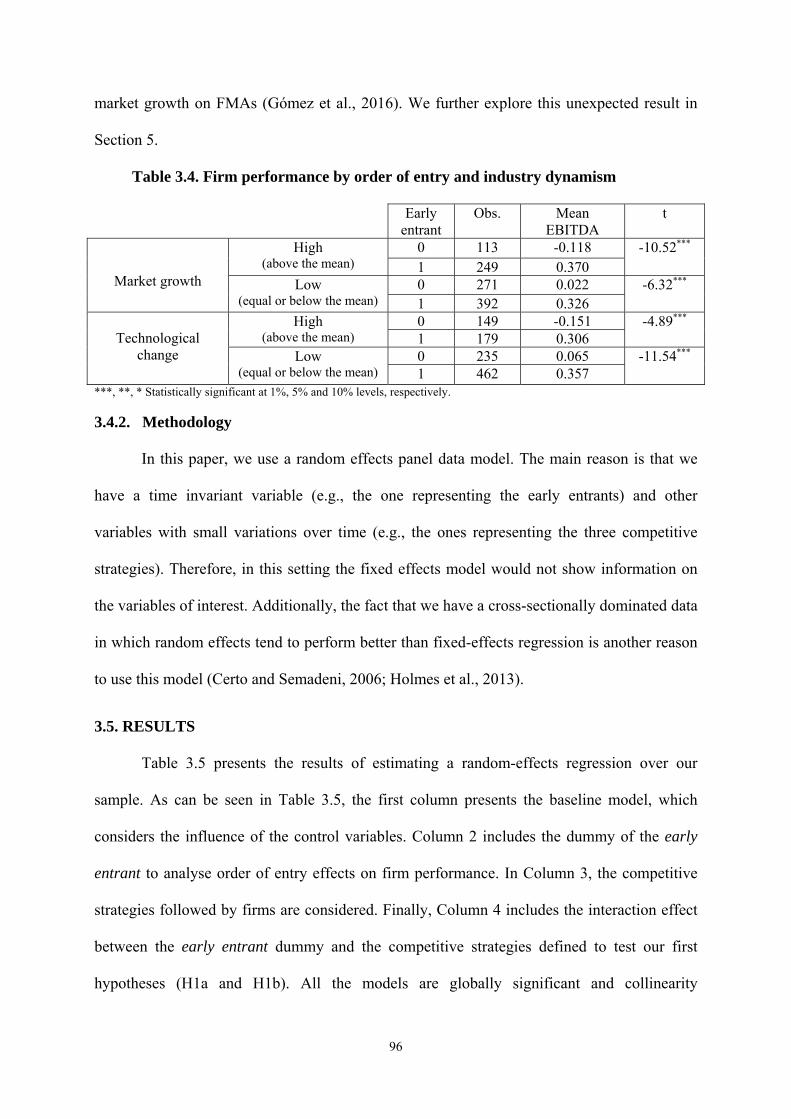
96
market growth on FMAs (Gómez et al., 2016). We further explore this unexpected result in
Section 5.
Table 3.4. Firm performance by order of entry and industry dynamism
Early entrant
Obs. Mean EBITDA
t
Market growth
High (above the mean)
0 113 -0.118 -10.52*** 1 249 0.370
Low (equal or below the mean)
0 271 0.022 -6.32***
1 392 0.326
Technological change
High (above the mean)
0 149 -0.151 -4.89*** 1 179 0.306
Low (equal or below the mean)
0 235 0.065 -11.54*** 1 462 0.357
***, **, * Statistically significant at 1%, 5% and 10% levels, respectively.
3.4.2. Methodology
In this paper, we use a random effects panel data model. The main reason is that we
have a time invariant variable (e.g., the one representing the early entrants) and other
variables with small variations over time (e.g., the ones representing the three competitive
strategies). Therefore, in this setting the fixed effects model would not show information on
the variables of interest. Additionally, the fact that we have a cross-sectionally dominated data
in which random effects tend to perform better than fixed-effects regression is another reason
to use this model (Certo and Semadeni, 2006; Holmes et al., 2013).
3.5. RESULTS
Table 3.5 presents the results of estimating a random-effects regression over our
sample. As can be seen in Table 3.5, the first column presents the baseline model, which
considers the influence of the control variables. Column 2 includes the dummy of the early
entrant to analyse order of entry effects on firm performance. In Column 3, the competitive
strategies followed by firms are considered. Finally, Column 4 includes the interaction effect
between the early entrant dummy and the competitive strategies defined to test our first
hypotheses (H1a and H1b). All the models are globally significant and collinearity
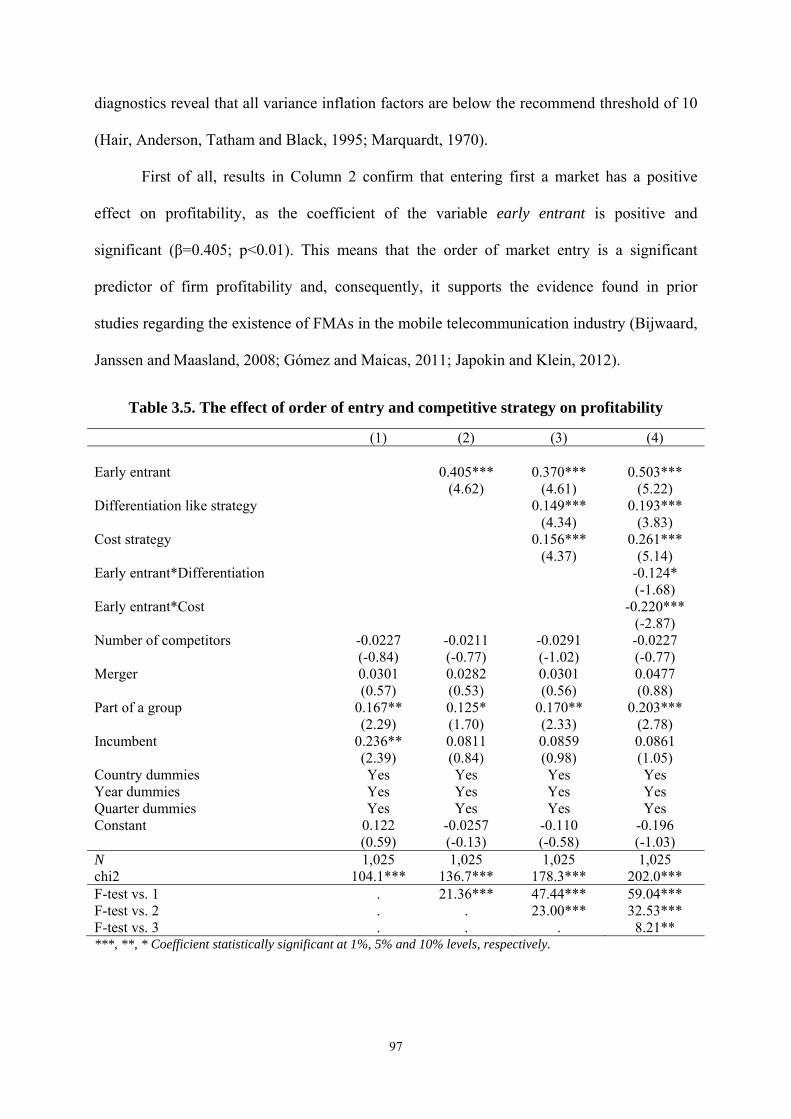
97
diagnostics reveal that all variance inflation factors are below the recommend threshold of 10
(Hair, Anderson, Tatham and Black, 1995; Marquardt, 1970).
First of all, results in Column 2 confirm that entering first a market has a positive
effect on profitability, as the coefficient of the variable early entrant is positive and
significant (β=0.405; p<0.01). This means that the order of market entry is a significant
predictor of firm profitability and, consequently, it supports the evidence found in prior
studies regarding the existence of FMAs in the mobile telecommunication industry (Bijwaard,
Janssen and Maasland, 2008; Gómez and Maicas, 2011; Japokin and Klein, 2012).
Table 3.5. The effect of order of entry and competitive strategy on profitability
(1) (2) (3) (4) Early entrant 0.405*** 0.370*** 0.503*** (4.62) (4.61) (5.22) Differentiation like strategy 0.149*** 0.193*** (4.34) (3.83) Cost strategy 0.156*** 0.261*** (4.37) (5.14) Early entrant*Differentiation -0.124* (-1.68) Early entrant*Cost -0.220*** (-2.87) Number of competitors -0.0227 -0.0211 -0.0291 -0.0227 (-0.84) (-0.77) (-1.02) (-0.77) Merger 0.0301 0.0282 0.0301 0.0477 (0.57) (0.53) (0.56) (0.88) Part of a group 0.167** 0.125* 0.170** 0.203*** (2.29) (1.70) (2.33) (2.78) Incumbent 0.236** 0.0811 0.0859 0.0861 (2.39) (0.84) (0.98) (1.05) Country dummies Yes Yes Yes Yes Year dummies Yes Yes Yes Yes Quarter dummies Yes Yes Yes Yes Constant 0.122 -0.0257 -0.110 -0.196 (0.59) (-0.13) (-0.58) (-1.03) N 1,025 1,025 1,025 1,025 chi2 104.1*** 136.7*** 178.3*** 202.0*** F-test vs. 1 . 21.36*** 47.44*** 59.04*** F-test vs. 2 . . 23.00*** 32.53*** F-test vs. 3 . . . 8.21** ***, **, * Coefficient statistically significant at 1%, 5% and 10% levels, respectively.
98
This entry-order effect remains positive and significant in Column 3, where the
variables capturing the competitive strategy are included. Both strategies, differentiation like
(β=0.149; p<0.01) and cost leadership (β=0.156; p<0.01), provide firms with higher
profitability than being stuck in the middle. However, no differences are found for the
comparison of differentiation and cost strategies (Chi2(1)=0.05; p>0.10). This means that
competitive strategies, on their own, do not explain differences on firms’ profitability.
Therefore, these results would be in line with our contention about the importance to jointly
analysing the effect of the order of entry and competitive strategies to explain firms’
performance differences.
The effect of competitive strategy on early movers and followers advantages
Column 4 incorporates the interactions between the early entrant dummy and the
competitive strategies defined. The interactions effects are negative and statistically
significant in all cases. To facilitate the interpretation of the results, we predicted firm
performance for early movers and followers in different scenarios10.
To this aim, we predicted EBITDA margin using the full model presented in Table 3.5
(Column 4) and compared the predictions for the different categories of entrants and the
different competitive strategies followed. More precisely, we followed a two-stage procedure.
First, we estimated the prediction of the average EBITDA margin for each group of entrants
with different competitive strategies. For instance, the predicted EBITDA for an early entrant
with a differentiation strategy is 0.321, whereas cost leadership leads early movers to obtain
an EBITDA of 0.293. Second, we compared the results obtained in the first stage to confirm
whether there are significant differences between the predicted performance levels. We can
see that the performance differences between first-movers with a differentiation or a cost
10 We used STATA “margins” command to predict firm performance in the competitive scenarios considered and “margins, pwcompare” to make pairwise comparisons of EBITDA margins.
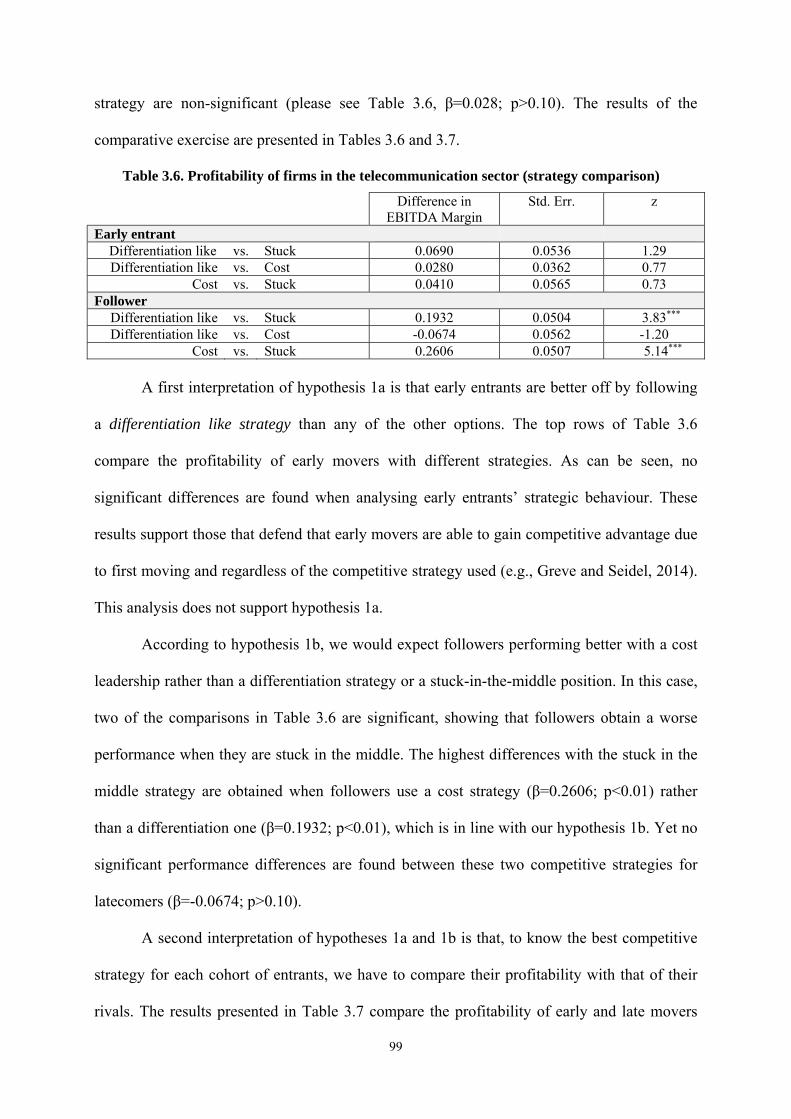
99
strategy are non-significant (please see Table 3.6, β=0.028; p>0.10). The results of the
comparative exercise are presented in Tables 3.6 and 3.7.
Table 3.6. Profitability of firms in the telecommunication sector (strategy comparison)
Difference in EBITDA Margin
Std. Err. z
Early entrant Differentiation like vs. Stuck 0.0690 0.0536 1.29 Differentiation like vs. Cost 0.0280 0.0362 0.77
Cost vs. Stuck 0.0410 0.0565 0.73 Follower
Differentiation like vs. Stuck 0.1932 0.0504 3.83*** Differentiation like vs. Cost -0.0674 0.0562 -1.20
Cost vs. Stuck 0.2606 0.0507 5.14***
A first interpretation of hypothesis 1a is that early entrants are better off by following
a differentiation like strategy than any of the other options. The top rows of Table 3.6
compare the profitability of early movers with different strategies. As can be seen, no
significant differences are found when analysing early entrants’ strategic behaviour. These
results support those that defend that early movers are able to gain competitive advantage due
to first moving and regardless of the competitive strategy used (e.g., Greve and Seidel, 2014).
This analysis does not support hypothesis 1a.
According to hypothesis 1b, we would expect followers performing better with a cost
leadership rather than a differentiation strategy or a stuck-in-the-middle position. In this case,
two of the comparisons in Table 3.6 are significant, showing that followers obtain a worse
performance when they are stuck in the middle. The highest differences with the stuck in the
middle strategy are obtained when followers use a cost strategy (β=0.2606; p<0.01) rather
than a differentiation one (β=0.1932; p<0.01), which is in line with our hypothesis 1b. Yet no
significant performance differences are found between these two competitive strategies for
latecomers (β=-0.0674; p>0.10).
A second interpretation of hypotheses 1a and 1b is that, to know the best competitive
strategy for each cohort of entrants, we have to compare their profitability with that of their
rivals. The results presented in Table 3.7 compare the profitability of early and late movers
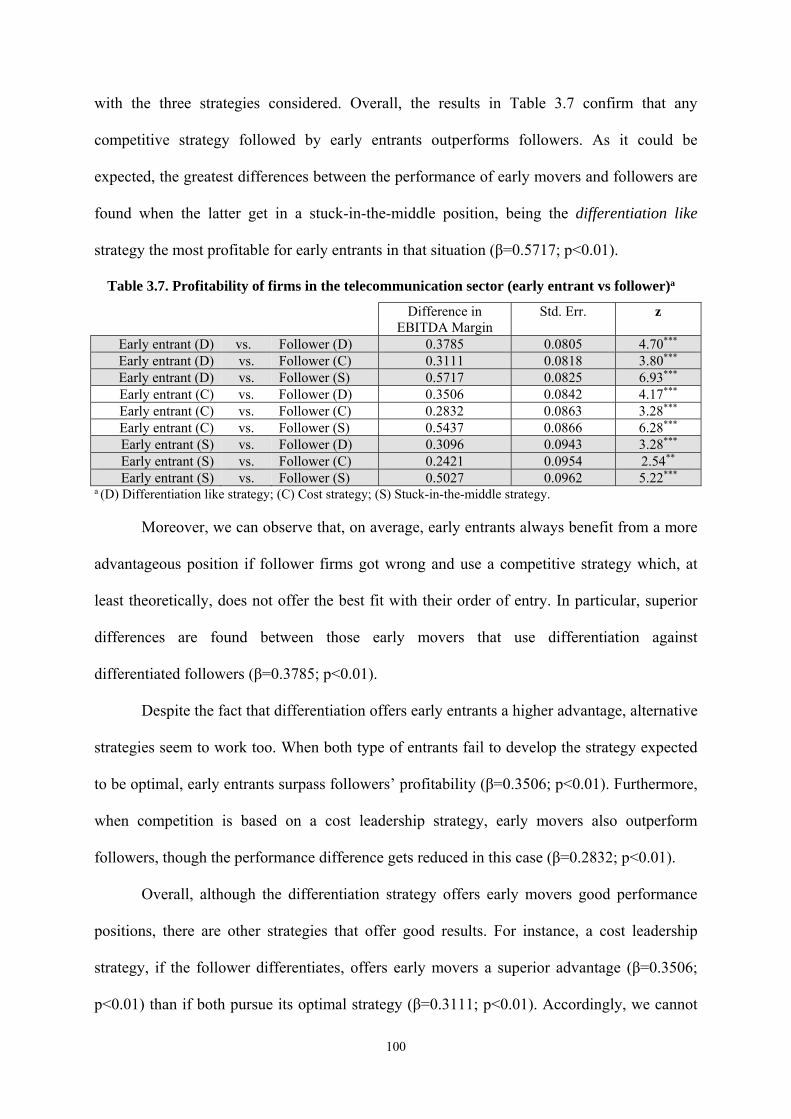
100
with the three strategies considered. Overall, the results in Table 3.7 confirm that any
competitive strategy followed by early entrants outperforms followers. As it could be
expected, the greatest differences between the performance of early movers and followers are
found when the latter get in a stuck-in-the-middle position, being the differentiation like
strategy the most profitable for early entrants in that situation (β=0.5717; p<0.01).
Table 3.7. Profitability of firms in the telecommunication sector (early entrant vs follower)a
Difference in EBITDA Margin
Std. Err. z
Early entrant (D) vs. Follower (D) 0.3785 0.0805 4.70*** Early entrant (D) vs. Follower (C) 0.3111 0.0818 3.80*** Early entrant (D) vs. Follower (S) 0.5717 0.0825 6.93*** Early entrant (C) vs. Follower (D) 0.3506 0.0842 4.17*** Early entrant (C) vs. Follower (C) 0.2832 0.0863 3.28*** Early entrant (C) vs. Follower (S) 0.5437 0.0866 6.28*** Early entrant (S) vs. Follower (D) 0.3096 0.0943 3.28*** Early entrant (S) vs. Follower (C) 0.2421 0.0954 2.54** Early entrant (S) vs. Follower (S) 0.5027 0.0962 5.22***
a (D) Differentiation like strategy; (C) Cost strategy; (S) Stuck-in-the-middle strategy.
Moreover, we can observe that, on average, early entrants always benefit from a more
advantageous position if follower firms got wrong and use a competitive strategy which, at
least theoretically, does not offer the best fit with their order of entry. In particular, superior
differences are found between those early movers that use differentiation against
differentiated followers (β=0.3785; p<0.01).
Despite the fact that differentiation offers early entrants a higher advantage, alternative
strategies seem to work too. When both type of entrants fail to develop the strategy expected
to be optimal, early entrants surpass followers’ profitability (β=0.3506; p<0.01). Furthermore,
when competition is based on a cost leadership strategy, early movers also outperform
followers, though the performance difference gets reduced in this case (β=0.2832; p<0.01).
Overall, although the differentiation strategy offers early movers good performance
positions, there are other strategies that offer good results. For instance, a cost leadership
strategy, if the follower differentiates, offers early movers a superior advantage (β=0.3506;
p<0.01) than if both pursue its optimal strategy (β=0.3111; p<0.01). Accordingly, we cannot
101
confirm our hypothesis 1a as the competitive strategy followed by first-movers seems to not
be as much determinant as expected. Again, the evidence for early entrants indicates that the
order of entry explains to a greater extent the competitive advantages obtained by first-movers
than the strategies do.
In the case of followers, however, the results confirm that their choice is important to
reduce early mover advantages. Though no strategy allows them to be better than early
entrants, it seems clear from Table 3.7 that the lowest differences between first and later
movers profitability are found when followers use cost leadership. In those situations,
latecomers are able to reduce to a greater extent the performance gap with early movers. This
is the case when the later are in a stuck-in-the-middle position (β=0.2421; p<0.05), follow a
cost leadership strategy (β=0.2832; p<0.01) or differentiate (β=0.3111; p<0.01), in that order.
This gives support to Hypothesis 1b.
The effect of industry dynamism on the effectiveness of followers’ competitive strategy
Once the fit between the order of entry and the competitive strategy has been
analyzed, we move forward to the second part of our analysis to test whether industry
dynamism moderates this relationship. In particular, we analyze the effectiveness of
followers’ competitive strategies when the variables market growth and technological change
are included in the model. To this aim, we identified follower firms by defining the dummy
follower as the opposite of the early entrant variable. In this case, follower takes the value 1
whether the adoption rate of the mobile technology is above 16 percent when the firm
penetrates the market, and 0 otherwise.
In order to test Hypotheses 2 and 3, we must go through Tables 3.8, 3.9 and 3.10.
Table 3.8 presents the results of the random-effects regression. In particular, Column 4 shows
the full model specification once the variables referred to firms’ order of entry, competitive
strategies, industry dynamism and their interactions are considered. As done in Hypothesis 1a
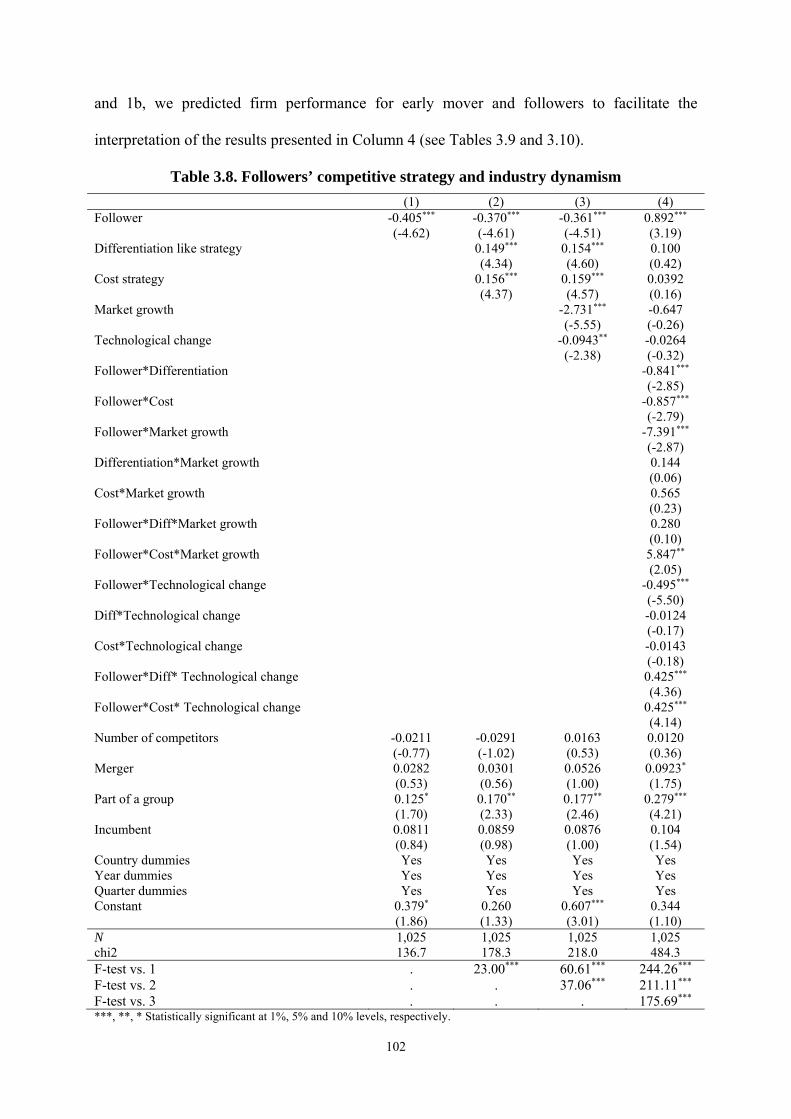
102
and 1b, we predicted firm performance for early mover and followers to facilitate the
interpretation of the results presented in Column 4 (see Tables 3.9 and 3.10).
Table 3.8. Followers’ competitive strategy and industry dynamism
(1) (2) (3) (4) Follower -0.405*** -0.370*** -0.361*** 0.892*** (-4.62) (-4.61) (-4.51) (3.19) Differentiation like strategy 0.149*** 0.154*** 0.100 (4.34) (4.60) (0.42) Cost strategy 0.156*** 0.159*** 0.0392 (4.37) (4.57) (0.16) Market growth -2.731*** -0.647 (-5.55) (-0.26) Technological change -0.0943** -0.0264 (-2.38) (-0.32) Follower*Differentiation -0.841*** (-2.85) Follower*Cost -0.857*** (-2.79) Follower*Market growth -7.391*** (-2.87) Differentiation*Market growth 0.144 (0.06) Cost*Market growth 0.565 (0.23) Follower*Diff*Market growth 0.280 (0.10) Follower*Cost*Market growth 5.847** (2.05) Follower*Technological change -0.495*** (-5.50) Diff*Technological change -0.0124 (-0.17) Cost*Technological change -0.0143 (-0.18) Follower*Diff* Technological change 0.425*** (4.36) Follower*Cost* Technological change 0.425*** (4.14) Number of competitors -0.0211 -0.0291 0.0163 0.0120 (-0.77) (-1.02) (0.53) (0.36) Merger 0.0282 0.0301 0.0526 0.0923* (0.53) (0.56) (1.00) (1.75) Part of a group 0.125* 0.170** 0.177** 0.279*** (1.70) (2.33) (2.46) (4.21) Incumbent 0.0811 0.0859 0.0876 0.104 (0.84) (0.98) (1.00) (1.54) Country dummies Yes Yes Yes Yes Year dummies Yes Yes Yes Yes Quarter dummies Yes Yes Yes Yes Constant 0.379* 0.260 0.607*** 0.344 (1.86) (1.33) (3.01) (1.10) N 1,025 1,025 1,025 1,025 chi2 136.7 178.3 218.0 484.3 F-test vs. 1 . 23.00*** 60.61*** 244.26*** F-test vs. 2 . . 37.06*** 211.11*** F-test vs. 3 . . . 175.69*** ***, **, * Statistically significant at 1%, 5% and 10% levels, respectively.
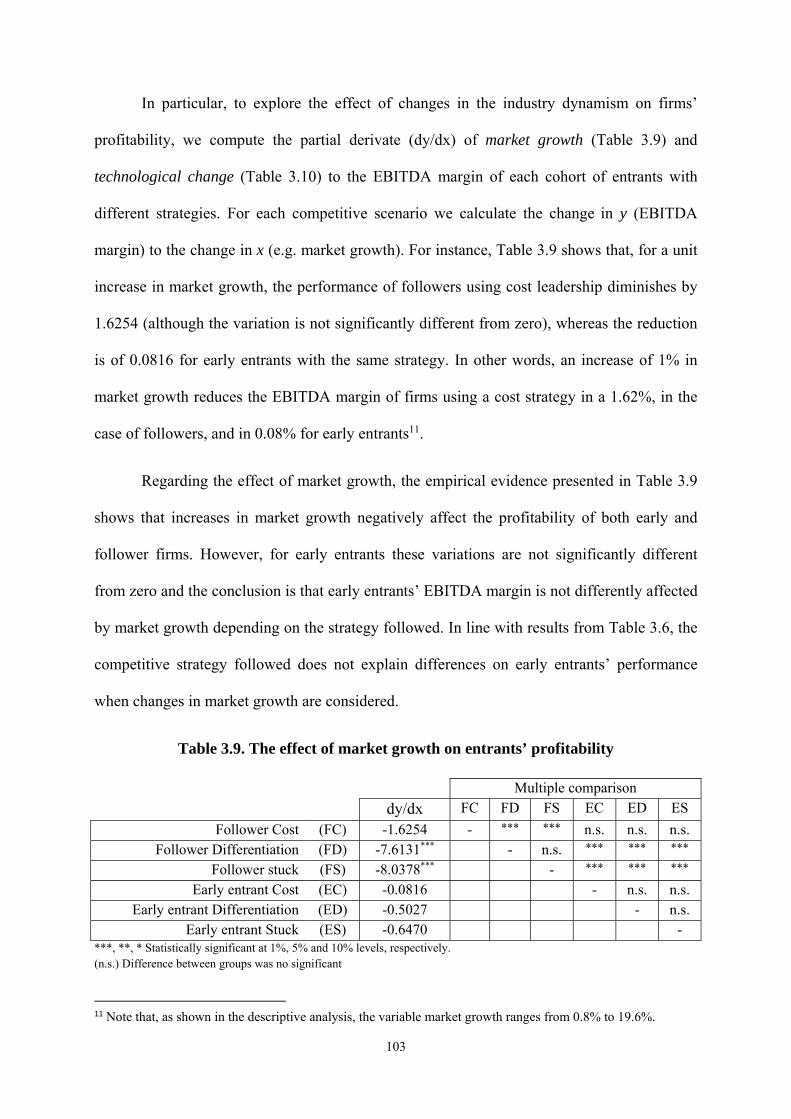
103
In particular, to explore the effect of changes in the industry dynamism on firms’
profitability, we compute the partial derivate (dy/dx) of market growth (Table 3.9) and
technological change (Table 3.10) to the EBITDA margin of each cohort of entrants with
different strategies. For each competitive scenario we calculate the change in y (EBITDA
margin) to the change in x (e.g. market growth). For instance, Table 3.9 shows that, for a unit
increase in market growth, the performance of followers using cost leadership diminishes by
1.6254 (although the variation is not significantly different from zero), whereas the reduction
is of 0.0816 for early entrants with the same strategy. In other words, an increase of 1% in
market growth reduces the EBITDA margin of firms using a cost strategy in a 1.62%, in the
case of followers, and in 0.08% for early entrants11.
Regarding the effect of market growth, the empirical evidence presented in Table 3.9
shows that increases in market growth negatively affect the profitability of both early and
follower firms. However, for early entrants these variations are not significantly different
from zero and the conclusion is that early entrants’ EBITDA margin is not differently affected
by market growth depending on the strategy followed. In line with results from Table 3.6, the
competitive strategy followed does not explain differences on early entrants’ performance
when changes in market growth are considered.
Table 3.9. The effect of market growth on entrants’ profitability
Multiple comparison dy/dx FC FD FS EC ED ES
Follower Cost (FC) -1.6254 - *** *** n.s. n.s. n.s. Follower Differentiation (FD) -7.6131*** - n.s. *** *** ***
Follower stuck (FS) -8.0378*** - *** *** ***
Early entrant Cost (EC) -0.0816 - n.s. n.s. Early entrant Differentiation (ED) -0.5027 - n.s.
Early entrant Stuck (ES) -0.6470 - ***, **, * Statistically significant at 1%, 5% and 10% levels, respectively. (n.s.) Difference between groups was no significant
11 Note that, as shown in the descriptive analysis, the variable market growth ranges from 0.8% to 19.6%.
104
In the case of followers, we would expect the effectiveness of the cost strategy to be
higher in contexts of higher market growth. As predicted by Hypothesis 2, the evidence
presented in Table 3.9 confirms that following a cost leadership strategy is more favorable for
followers, since the reduction of their profitability is not significant (β=-1.6254; p>0.10),
while they experience a significant decrease in performance if they differentiate (β=-7.6131;
p<0.01) or if they get stuck in the middle (β=-8.0378; p<0.01) as market grows. As expected,
the comparison between the different categories of followers shows that these differences are
significant: using a cost strategy implies a significantly lower variation in EBITDA margin
than using differentiation or being stuck in the middle (please see columns 2 and 3 in the first
row of the multiple comparison in Table 3.9).
As done in hypotheses H1a and H1b, we also compare the variations in EBITDA
margin shown by early entrants vs. followers when market growth increases. It is important to
take into account that Table 3.9 reveals that early entrants’ profitability is not significantly
affected by increases in market growth. The comparative analysis presented in the three first
rows and the last three columns of Table 3.9 shows significant differences between early
entrants and followers when the later pursue a strategy of differentiation or if they are stuck-
in-the-middle. More precisely, the reduction of the performance of followers that differentiate
(β=-7.6131) or get stuck (β=-8.0378) is greater than the variations shown by early movers
when market grows, which are non-significant (β=-0.0816, β=-0.5027, and β=-0.6470 for
cost, differentiation and stuck, respectively). However, the variation of the profitability of
followers using a cost leadership strategy when market growth increases is not significantly
different from the corresponding variations of early entrants, whatever the strategy followed
by the later (please, see the last three columns in the first row). Overall, these results support
Hypothesis 2 and suggest that cost leadership is the strategy most effective for followers in a
context of market growth.
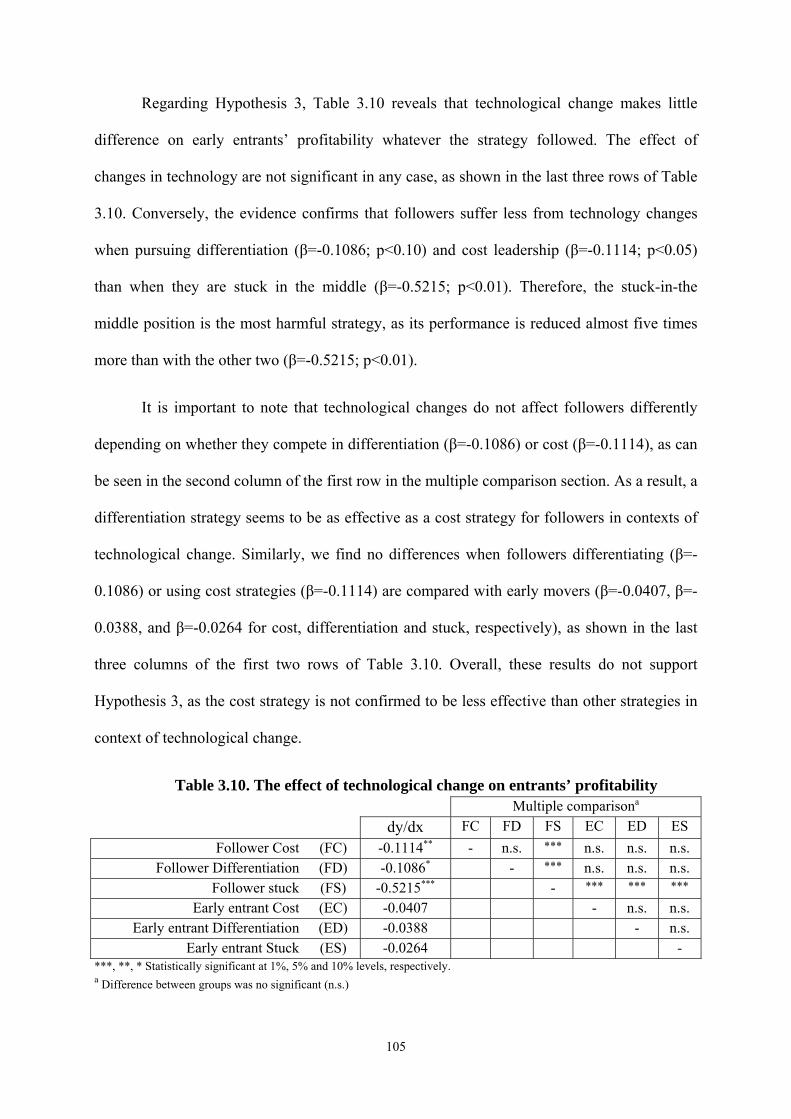
105
Regarding Hypothesis 3, Table 3.10 reveals that technological change makes little
difference on early entrants’ profitability whatever the strategy followed. The effect of
changes in technology are not significant in any case, as shown in the last three rows of Table
3.10. Conversely, the evidence confirms that followers suffer less from technology changes
when pursuing differentiation (β=-0.1086; p<0.10) and cost leadership (β=-0.1114; p<0.05)
than when they are stuck in the middle (β=-0.5215; p<0.01). Therefore, the stuck-in-the
middle position is the most harmful strategy, as its performance is reduced almost five times
more than with the other two (β=-0.5215; p<0.01).
It is important to note that technological changes do not affect followers differently
depending on whether they compete in differentiation (β=-0.1086) or cost (β=-0.1114), as can
be seen in the second column of the first row in the multiple comparison section. As a result, a
differentiation strategy seems to be as effective as a cost strategy for followers in contexts of
technological change. Similarly, we find no differences when followers differentiating (β=-
0.1086) or using cost strategies (β=-0.1114) are compared with early movers (β=-0.0407, β=-
0.0388, and β=-0.0264 for cost, differentiation and stuck, respectively), as shown in the last
three columns of the first two rows of Table 3.10. Overall, these results do not support
Hypothesis 3, as the cost strategy is not confirmed to be less effective than other strategies in
context of technological change.
Table 3.10. The effect of technological change on entrants’ profitability Multiple comparisona dy/dx FC FD FS EC ED ES
Follower Cost (FC) -0.1114** - n.s. *** n.s. n.s. n.s. Follower Differentiation (FD) -0.1086* - *** n.s. n.s. n.s.
Follower stuck (FS) -0.5215*** - *** *** ***
Early entrant Cost (EC) -0.0407 - n.s. n.s. Early entrant Differentiation (ED) -0.0388 - n.s.
Early entrant Stuck (ES) -0.0264 - ***, **, * Statistically significant at 1%, 5% and 10% levels, respectively. a Difference between groups was no significant (n.s.)

106
3.6. CONCLUSION AND DISCUSSION
Our study advances research on the entry timing literature by exploring the role of
competitive strategy and industry dynamism in the traditional relationship order of entry-
performance. Firstly, we argue in terms of an optimal fit between the order of entry and the
competitive strategy followed by firms to achieve superior advantages. In particular, our study
proposes that differentiation like strategies will offer early-movers greater performance levels,
whereas cost leadership will be the most profitable strategy for followers. Secondly, we
integrate competitive strategies and industry dynamism to study the sustainability of the early-
entrant advantages. Specifically, the effectiveness of the followers’ cost strategy to erode
advantages from entering first is expected to be higher in contexts of greater market growth,
whereas cost leadership will be less effective in contexts of higher pace of technological
change. The empirical results obtained offer interesting insights that can be summarized in
three main conclusions.
First, it seems clear from the empirical evidence that entering first leads firms to
obtain superior performance, thus confirming the existence of early mover advantages in the
mobile telecommunication industry. More interestingly, our study reveals that the order of
entry effect prevails over that of the competitive strategy. Stated differently, the fact of using
one or another strategy seems to make little difference on early movers’ profitability. In that
regard, when early entrants with different strategies are compared, no significant differences
in profitability are found in any case. Moreover, on average, early entrants also outperform
follower firms regardless of the strategic choice of the latter. Therefore, the empirical
evidence shows that early movers are always better than latecomers in all the competitive
scenarios considered.
Second, our findings confirm that the competitive strategy chosen does matter for
follower firms. The relevance of considering the way latecomers compete seems to be

107
essential to explain performance differences among them. In particular, cost leadership is
confirmed to be the most suitable strategy to reduce the performance advantages of entering
early.
Finally, the pace of industry dynamism has been shown to play a significant role when
examining the effectiveness of the competitive strategies used by followers in eroding
advantages from entering first. Whereas growing markets are more suitable for cost leaders to
defeat early entrants’ advantages, the use of a cost strategy seems to be as good as
differentiation in contexts of high technological change.
Overall, these conclusions have both theoretical and managerial implications.
From a theoretical point of view, the contribution of this study is threefold. First, our
paper seeks to advance existing knowledge on relationship between order of entry and
performance and to contribute to the current debate on the sustainability of early-movers
advantages (Greve and Seidel, 2014; Tellis, 2014; Zachary et al., 2015). In particular, we
clarify prior conflicting evidence by exploring how competitive strategies influence the way
early entrants compete and create value. Our research evidences that the importance of being
early prevails over the way first-movers compete, supporting those studies that advocate for
the benefits of being first (Greve and Seidel, 2014).
Second, our study contributes to the emerging line of research that investigates the
way in which follower firms are able to successfully penetrate the market and enjoy
advantages over its rivals (Fosfuri et al., 2013; Shamsie et al., 2004). The empirical evidence
presented in this chapter suggests that the sustainability of early mover advantages may be
threatened, to a greater extent, if followers use the strategy that is presumed to offer a better
fit with the prevailing market demands they face when entering the market (as the reading of
Rogers, 1995, would suggest). More precisely, cost leadership is confirmed to be more
108
appropriate to reduce the performance gap between early and late movers, at least in markets
following a typical development pattern.
This brings us to the third contribution of our research. Our analysis incorporates
industry dynamics to study the effectiveness of followers’ strategies to compete in different
marketplaces and gain profitability. Whereas a cost leadership position seems to be more
effective in reducing performance advantages of entering first when a rapid-pace market
growth occurs, differentiation like strategies seems to be as useful as cost strategies in
contexts characterized by a higher pace of technology evolution. Hence, our findings reveal
the need of considering the influence exerted by both micro and macro aspects in those
studies aimed at explaining performance differences among different cohort of entrants. These
results contribute to advancing research on the most suitable competitive orientation for
successful follower firms (De Castro and Chrisman, 1995; Durand and Coeurderoy, 2001;
Shamsie et al., 2004), while complementing current understanding on the effect of industry
dynamics on early mover advantages (Suárez and Lanzolla, 2007).
Regarding managerial practices, our study has several implications for market entry
decisions. First of all, managers must take into account the relevance of entering first as it has
been broadly confirmed to confer firms substantial performance advantages over its rivals. In
the case of follower firms, however, the critical implication of this study is that the
competitive disadvantages of entering later could be reduced with a right decision of how to
compete. Moreover, managers should also look carefully at the pace of evolution of the
industry, as it might influence their chances of success. Despite our study has confirmed the
detrimental effect of market growth and technological change for followers’ advantages, it has
also revealed key insights about the competitive positions they should pursue to reduce the
performance gap with early movers. Greater levels of market growth will be less harmful for
follower firms that enter with a cost strategy. However, differentiation has been confirmed to
109
be as good as cost leadership when there is a high degree of technological change. Therefore,
it is important to stress the need of paying equal attention to both micro- and macro-level
aspects when thinking about how to compete in dynamic markets.
Despite these contributions, several issues could be considered in future studies. First,
the empirical analysis carried out in this research focuses on the telecommunication industry,
which has been characterized by a high level of dynamism since the emergence of the mobile
services. It might be convenient, therefore, to replicate the empirical analyses across different
research settings in order to know whether scholars obtain similar results, thus allowing the
generalization of current findings. Second, our study is based on prior entry-timing research
(Suárez and Lanzolla, 2007) that conceptualizes industry dynamism in terms of market
growth and technology evolution. However, it would also be interesting to delve into the
understanding of other environmental level factors that may condition firms’ competitive
behavior and performance. Further studies could analyze, for instance, the way in which the
degree of development of formal and informal institutions (North, 1990) enables or disables
the isolating mechanisms from which first movers benefit (Fosfuri et al., 2013), which might
affect the opportunities early entrants have to take advantage from the competitive strategy
implemented.
110
3.7. REFERENCES
Agarwal, R., Gort, M. 2001. First-mover advantage and the speed of competitive entry,
1887–1986. The Journal of Law and Economics, 44(1), 161-177.
Beggs, A., Klemperer, P., 1992. Multi-period competition with switching costs.
Econometrica: Journal of the Econometric Society 60 (3), 651-666.
Bijwaard, G. E., Janssen, M. C., Maasland, E. 2008. Early mover advantages: An
empirical analysis of European mobile phone markets. Telecommunications Policy,
32(3-4), 246-261.
Bohlmann, J.D., Golder, P.N., Mitra, D. 2002. Deconstructing the pioneer's advantage:
Examining vintage effects and consumer valuations of quality and variety. Management
Science, 48(9), 1175-1195.
Bower, J. L., Christensen, C. M. 1995. Disruptive technologies: Catching the wave.
Harvard Business Review.
Bowman, C., Ambrosini, V. 1997. Perceptions of strategic priorities, consensus and
firm performance. Journal of Management Studies, 34(2), 241-258.
Campbell-Hunt, C. 2000. What have we learned about generic competitive strategy? A
meta-analysis. Strategic Management Journal, 21(2), 127-154.
Carpenter, G. S., Nakamoto, K. 1989. Consumer preference formation and pioneering
advantage. Journal of Marketing Research, 285-298.
Certo, S. T., Semadeni, M. 2006. Strategy research and panel data: Evidence and
implications. Journal of Management, 32(3), 449-471.
Coeurderoy, R., Durand, R. 2004. Leveraging the advantage of early entry: proprietary
technologies versus cost leadership. Journal of Business Research, 57(6), 583-590.
Covin, J.G., Slevin, D.P., Heeley, M.B. 1999. Pioneers and followers: Competitive
tactics, environment, and firm growth. Journal of Business Venturing, 15(2), 175-210.
111
Day, G. S. 1981. The product life cycle: analysis and applications issues. The Journal of
Marketing, 60-67.
De Castro, J. O., Chrisman, J. J. 1995. Order of market entry, competitive strategy, and
financial performance. Journal of Business Research, 33(2), 165-177.
Durand, R., Coeurderoy, R. 2001. Age, order of entry, strategic orientation, and
organizational performance. Journal of Business Venturing, 16(5), 471-494.
Fernández, Z., Usero, B. 2009. Competitive behavior in the European mobile
telecommunications industry: Pioneers vs. followers, Telecommunications Policy, 33
(7), 339-347.
Fosfuri, A., Lanzolla, G., Suarez, F. F. 2013. Entry-timing strategies: the road ahead.
Long Range Planning, 46(4), 300-311.
Franco, A. M., Sarkar, M. B., Agarwal, R., Echambadi, R. 2009. Swift and smart: The
moderating effects of technological capabilities on the market pioneering-firm survival
relationship. Management Science, 55(11), 1842-1860.
Fuentelsaz, L., Garrido, E., Maicas, J.P. 2015. Incumbents, technological change and
institutions: How the value of complementary resources varies across markets. Strategic
Management Journal, 36, 1778–1801.
Gomez, J., Lanzolla, G., Maicas, J.P. 2016. The role of industry dynamics in the
persistence of first mover advantages. Long Range Planning, 49, 265-281.
Gómez, J., Maícas, J. P. 2011. Do switching costs mediate the relationship between
entry timing and performance? Strategic Management Journal, 32(12), 1251-1269.
Greve, H.L., Seidel. M. L. 2014. Being early beats being better. Harvard Business
Review.
Hair, J. F., Jr, Anderson, R. E., Tatham, R. L., Black, W. C. 1995. Multivariate data
analysis (3rd ed). New York: Macmillan Publishing Company.
112
Handley, S. M., Angst, C. M. 2015. The impact of culture on the relationship between
governance and opportunism in outsourcing relationships. Strategic Management
Journal, 36(9), 1412-1434.
Holmes, R.M., Miller, T., Hitt, M.A. Salmador, M.P. 2013. The Interrelationships
among Informal Institutions, Formal Institutions, and Inward Foreign Direct
Investment. Journal of Management, 39(2): 531-566.
Jakopin, N. M., Klein, A. 2012. First-mover and incumbency advantages in mobile
telecommunications. Journal of Business Research, 65(3), 362-370.
Kerin, R. A., Varadarajan, P. R., Peterson, R. A. 1992. First-mover advantage: A
synthesis, conceptual framework, and research propositions. The Journal of Marketing,
33-52.
Lambkin, M. 1988. Order of entry and performance in new markets. Strategic
Management Journal, 9(S1), 127-140.
Lavie, D. 2006. Capability reconfiguration: An analysis of incumbent responses to
technological change. Academy of Management Review, 31(1), 153-174.
Lee, K., Malerba, F. 2017. Catch-up cycles and changes in industrial leadership:
Windows of opportunity and responses of firms and countries in the evolution of
sectoral systems. Research Policy, 46(2), 338-351.
Levitt, T. 1965. Exploit the product life cycle. Harvard Business Review, 43(6), 81-94.
Lieberman, M. B., Garcia‐Castro, R., Balasubramanian, N. 2016. Measuring Value
Creation and Appropriation in Firms: The VCA Model. Strategic Management Journal.
Lieberman, M. B., Montgomery, D. B. 1988. First‐mover advantages. Strategic
Management Journal, 9(S1), 41-58.
113
Lieberman, M. B., Montgomery, D. B. 1998. First-mover (dis) advantages:
Retrospective and link with the resource-based view. Strategic Management Journal,
19, 1111-1125.
Lieberman, M.B., Montgomery, D.B., 2013. Conundra and progress: research on entry
order and performance. Long Range Planning, 46 (4-5), 312e324.
Markides, C., Sosa, L. 2013. Pioneering and first mover advantages: the importance of
business models. Long Range Planning, 46(4), 325-334.
Marquard DW. 1970. Generalized Inverses, Ridge Regression and Linear Biased
Estimation. Technometrics, 12, 591-612.
Nayyar, P. R. 1993. On the measurement of competitive strategy: Evidence from a large
multiproduct US firm. Academy of Management Journal, 36(6), 1652-1669.
North, D. C. 1990. Institutions, institutional change and economic performance.
Harvard University Press, Cambridge, MA.
OECD. 2000. Cellular mobile pricing structures and trends. Working Party on
Telecommunication and Information Services Policies. Organisation for Economic Co-
operation and Development.
Pertusa‐Ortega, E. M., Molina‐Azorín, J. F., Claver‐Cortés, E. 2009. Competitive
Strategies and Firm Performance: a Comparative Analysis of Pure, Hybrid and ‘Stuck‐
in‐the‐middle’ Strategies in Spanish Firms. British Journal of Management, 20(4), 508-
523.
Porter, M. 1980. Competitive Strategy. New York: Free Press.
Robinson, W. T., Chiang, J. 2002. Product development strategies for established
market pioneers, early followers, and late entrants. Strategic Management Journal,
23(9), 855-866.
Rogers, E. M. 1995. Diffusion of innovations. Free Press, New York, Third edition.
114
Ruiz-Ortega, M. J., García-Villaverde, P. M. 2008. Capabilities and competitive tactics
influences on performance: Implications of the moment of entry. Journal of Business
Research, 61(4), 332-345.
Schnaars S.P. 1994. Managing Imitation Strategies. Free Press: New York.
Shamsie, J., Phelps, C., Kuperman, J. 2004. Better late than never: A study of late
entrants in household electrical equipment. Strategic Management Journal, 25(1), 69-
84.
Shy, O. 2002. A quick-and-easy method for estimating switching costs. International
Journal of Industrial Organization, 20(1), 71-87.
Spanos, Y. E., Zaralis, G., Lioukas, S. 2004. Strategy and industry effects on
profitability: evidence from Greece. Strategic Management Journal, 25(2), 139-165.
Suarez, F.F., Lanzolla G. 2007. The role of environmental dynamics in building a first
mover advantage theory. Academy of Management Review, 32(2), 377-392.
Szymanski, D. M., Troy, L. C., Bharadwaj, S. G. 1995. Order of entry and business
performance: An empirical synthesis and reexamination. The Journal of Marketing, 17-
33.
Tellis, J. G. 2014. The Columbus Effect in Business, The Wall Street Journal, A17.
Thornhill, S., White, R. E. 2007. Strategic purity: A multi-industry evaluation of pure
vs. hybrid business strategies. Strategic Management Journal, 28, 553–561.
VanderWerf, P. A., Mahon, J. F. 1997. Meta-analysis of the impact of research methods
on findings of first-mover advantage. Management Science, 43(11), 1510-1519.
White, R. E. 1986. Generic business strategies, organizational context and performance:
An empirical investigation. Strategic Management Journal, 7(3), 217-231.
Zachary, M. A., Gianiodis, P. T., Payne, G. T., Markman, G. D. 2015. Entry Timing
Enduring Lessons and Future Directions. Journal of Management, 41 (5), 1388-1415.

115
Zott, C., Amit, R 2008. The fit between product market strategy and business model:
implications for firm performance, Strategic Management Journal, 29(1), 1-26.

116

117
Chapter 4.
ENTRY MODE AND INNOVATION
ADOPTION OF MULTINATIONAL FIRMS.
The effect of cultural distance and home/host
country development
118
4.1. INTRODUCTION
The remarkable worldwide growth of foreign direct investment during the last
decades has led to a considerable body of research that examines what factors influence
multinational enterprises (MNEs) entry mode decisions when going abroad (Barkema, Bell,
and Pennings, 1996; Brouthers and Hennart, 2007; Mutinelli and Piscitello, 1998). In
particular, the differences in national cultures between the MNE home country and the
subsidiaries host markets have gained attention (Brouthers and Brouthers, 2001; Kogut and
Singh, 1988; Tihanyi, Griffith and Russel, 2005). Despite the literature seems to be
“unanimous in recognizing that the higher the sociocultural distance between home and host
countries, the lower the degree of control demanded by foreign investors” (Mutinelli and
Piscitello, 1998: 499), the empirical evidence remains inconclusive (see Beugelsdijk,
Kostova, Kunst, Spadafora and van Essen, 2018; Tihanyi et al., 2005). As a result,
researchers claim for further research to fully understand the role of cultural distance in
determining firms’ entry mode decisions. Factors such as the type of industry or the country
of origin of the MNEs (Beugelsdijk et al., 2018; Liou, Chao and Yang, 2016; Tihanyi, et al.,
2005; Zhao, Luo and Suh, 2004) have been suggested as worth of being taken into account.
Moreover, as most studies have examined factors influencing MNEs entry decisions
(Meyer and Estrin, 2001; Mutinelli and Piscitello, 1998), there is a lack of research on
analyzing post-entry competitive behaviors. To delve into the understanding of how MNEs’
subsidiaries create value and grow in foreign markets (Canabal and White, 2008; Chang,
Gong and Peng, 2012) is worthwhile if we want to advance research on international
business. In that regard, Meyer and Peng (2016) point out that the understanding of
headquarter-subsidiary relationships in the different markets where they operate could be one
of the most prominent areas of research.
119
This study seeks to offer a more fine-grained analysis of the factors that may affect
MNEs strategic decision-making when engaging in cross-border business activities. Firstly,
we assess the role of the degree of development of the country of origin of MNEs in the
relationship between cultural distance and entry mode choice1. By doing so, we address
current demands for a detailed understanding of “new MNEs” from emerging and developing
economies (EMNEs, hereafter) that are claimed to behave differently from multinational
enterprises from developed economies (DMNEs, hereafter) (Cuervo-Cazurra, 2012; Guillén
and García-Canal, 2009; Hoskisson, Wright, Filatotchev and Peng, 2013; Ramamurti, 2012).
Then, we reflect on how the entry mode choice shapes subsidiaries strategic decisions by
analyzing its influence on the adoption speed of innovations. Finally, our study considers
how contextual conditions may influence the way subsidiaries behave. We explicitly control
for the moderating effect of the development of the host country where subsidiaries compete,
as it could influence the costs and risks perceived by firms and, therefore, the proposed
relationship between the degree of control exerted by the MNE and the adoption speed of
innovations.
Overall, the contribution of this study is twofold. First, we shed light on the
conflicting evidence regarding the effect of cultural distance on the entry mode (see, Tihanyi
et al., 2005). In that regard, our study aims to refine prior theoretical arguments (Cuervo-
Cazurra, 2012) by emphasizing the need to consider additional factors, formerly overlooked,
but essential in a worldwide research. In particular, the development of the MNEs country of
origin is brought to the foreground in order to analyze the extent to which it can explain
1 Following the review performed by Brouthers and Hennart (2007), two main classifications of MNEs modes of entry can be distinguished in the international entry mode literature: the entry mode choice and the establishment mode choice. Whereas the entry mode choice mainly considers ownership differences between shared and fully owned subsidiaries, the establishment mode refers to the decision of entering a foreign market via greenfields or acquisitions. In this study we focus on the former and, from now on, we refer to the entry mode decision as the degree of control exerted by the MNE over the subsidiary (Anderson and Gatignon, 1986; Brouthers, 2002; Erramilli and Rao, 1993; Gatignon and Anderson, 1988; Mutinelly and Piscitello, 1998). Those firms choosing full ownership entry modes “want maximum control and are willing to make maximum commitment and take on maximum risk” (Brouthers and Hennart, 2007: 396).
120
differences in their internationalization behavior (Beugelsdijk et al., 2018; Guillén and
García-Canal, 2009).
Second, we contribute to the international management literature by examining how
MNEs behave once they have entered a target market (Canabal and White, 2008; Meyer and
Peng, 2016; Zhou and Li, 2008). Specifically, we expand current knowledge on MNE-
subsidiary relationship as we test whether the control exerted by MNEs over subsidiaries
influences its innovation behavior. Our contention is that MNEs operating with a shared-
owned subsidiary may show a lower adoption speed of innovations than fully-owned ventures
because of superior costs and risks incurred when conducting innovation with partners. The
empirical evidence supports our hypothesis as shared-owned ventures take longer to adopt
innovations in comparison with fully-owned subsidiaries. Contrary to our expectations, we do
not find a significant influence exerted by the degree of development of the host country.
We test our hypotheses within the worldwide mobile telecommunication industry by
using a panel data for the period 2000–2017. The data used mainly comes from the Wireless
Intelligence Database (2017) and refers to the internationalization process of 18 multinational
groups that entered in 91 countries. The wide scope of the research setting allows us to
examine how MNEs compete in the five continents over the past two decades.
The rest of the paper is structured as follows. The next section develops the theoretical
framework. Then, the three hypotheses proposed are presented in Section 3. The database, the
description of the variables and the methodology used to test the hypotheses are shown in
Section 4. The main results of the empirical analysis are presented in Section 5. Finally, we
close the paper by discussing our main findings and proposing further lines of research.
121
4.2. LITERATURE REVIEW ON MNES ENTRY MODE
Delving into the understanding of factors influencing the MNE internationalization
process has been a key concern in the international business (IB) literature. In particular,
scholars have shown a particular interest in the concept of “distance” between countries and
the way it may influence managers’ decisions and outcomes of MNEs when expanding
abroad (see, for instance, López-Duarte and Vidal-Suárez, 2013). Distance is considered a
major impediment in MNEs expansion as it has been confirmed to affect location choices,
entry mode and performance, among others (Johanson and Vahlne, 1977; Kogut and Singh,
1988; Tihanyi et al, 2005). The greater the distance, the higher the difficulties to collect,
analyze and interpret information about the foreign country and, consequently, to do business
abroad (Håkanson and Ambos, 2010). Due to its importance in the process of MNEs
internationalization, studies from different domains have analyzed the effect of distance from
diverse points of view including linguistic distance (Demirbag, Glaister and Tatoglu, 2007),
economic distance (Tsang and Yip, 2007) or geographic distance (Eden and Miller, 2004),
among others. However, as recently stated by Beugelsdijk et al. (2018: 90) “despite such
proliferation, cultural distance, that is, the difference in cultural values between two
countries, remains the most widely used type of distance in international business”. Given its
relevance in the IB literature for decades (see, for instance, Anderson and Gatignon, 1986;
Brouthers and Brouthers, 2001; Hutzschenreuter, Voll, and Verbeke, 2011; Kogut and Singh,
1988; Tihanyi et al., 2005), the way cultural distance affects firms internationalization
decisions has been addressed from different theoretical perspectives.
According to the stages model of internationalization (Johanson and Vahlne, 1977),
firms are assumed to firstly expand to those countries that present similar characteristics to
the home country. Following an incremental internationalization process, managers would
prefer to expand to more similar countries, in terms of physic distance, as similar linguistic

122
and cultural codes are shared. Lower differences between foreign and home countries would
reduce the cost entry by facilitating the flow of information and coordination.
Likewise, the idea that firms prefer to enter cultural distant markets by sharing control
and risks with others -due to cost and uncertainty constraints- has been widely recognized.
Using a transaction cost perspective, scholars have pointed out the cultural distance between
the firm’s home and the host country as a source of uncertainty (Anderson and Gatignon,
1986; Erramilli and Rao, 1993; Gatignon and Anderson, 1988). The greater the cultural
distance, the lower the degree of control a firm “should and does demand” (Gatignon and
Anderson, 1988: 311). These authors reflect on the idea that the uncertainty that managers
perceived in more distant markets makes them more willing to transfer risk to others by
sharing ownership. Root (1983) states that sociocultural differences commonly lead to higher
information-acquisition costs, which firms may avoid by turning management over other
partners. More specifically, firms might prefer to cooperate with local partners to reduce
knowledge barriers, speed the organization learning and diminish the risk exposure associated
with entries into less similar cultural markets (Brouthers and Brouthers, 2001). Thus, MNEs
entering more culturally distant markets would show higher preference for entering via
shared-owned over fully controlled subsidiaries.
Despite this idea has been broadly supported by the empirical evidence (Demirbag et
al, 2007; Liou et al., 2016; Mutinelli and Piscitello, 1998), some studies have shown opposite
results, as firms in more culturally distant countries are found to choose higher equity modes
of entry as well (e.g. Erramilli, Agarwal and Kim, 1997; Padmanabhan and Cho, 1996).
Higher equity modes might facilitate MNEs to better control their international operations
and diminish information costs when transferring competences to more distant markets.
Accordingly, MNEs may be expected to react to large cultural differences by demanding
rather than avoiding ownership in order to reduce the transaction costs associated with more
123
dispersed modes of entry (see, Brouthers and Brouthers, 2001; Tihanyi et al., 2005, for a
review).
In an attempt to reconcile conflicting evidence, several studies have recently
emphasized the need of considering additional factors, such as the country of origin of MNEs
or the development of investment target markets, as they may enrich current insights on
MNEs entry mode decisions (Beugelsdijk et al., 2018; Cuervo-Cazurra, 2012; Tihanyi et al.,
2005). In particular, the study of how the country of origin of MNEs influences its
internationalization process has become a key area of debate in the IB literature (Cuervo-
Cazurra, 2012; Guillén and García-Canal, 2009; Khanna and Papelu, 2010; Peng, 2012;
Ramamurti, 2012). As claimed by Cuervo-Cazurra (2012: 163), “most studies in the
international business literature focus on analyzing how the conditions of the host country
affect inward foreign investment”. Nevertheless, the way the conditions of the country of
origin shape firms’ outward foreign investments has received limited attention.
It is important to note that scholars have traditionally associated the concept of MNEs
to the possession of overwhelming domestic assets, which are exploited abroad and confer
multinationals superior advantages (Mathews, 2006). Proprietary technologies, brands or
managerial capabilities are commonly linked to DMNEs-specific assets. Early studies
focused on the phenomenon of “new” MNEs from emerging, developing, or lower-middle-
income countries have pointed out the existence of different advantages –as a reflection of
distinctive conditions of their home country–, that may shape their internationalization
decisions (Guillén and García-Canal, 2009; Ramamurti, 2012). Whereas marketing or
technological capabilities are emphasized for DMNEs, political and networking skills in more
turbulent environments (among other non-conventional ones) may be crucial in EMNEs
internationalization. Contrarily, the lack of strategic resources is seen as an important
obstacle in their expansion abroad.
124
Besides, IB studies underline how, in an attempt to “close the gap between their
market reach and the global presence of the MNEs from developed countries”, EMNEs have
shown an extraordinarily accelerated pace of internationalization in the last decades (Guillén
and García-Canal, 2009: 27). As most MNEs have already achieved a high degree of
internationalization, subsidiaries’ strategic behavior seems to inevitably draw researchers’
attention as a key concern for MNEs competitiveness and growth in each market (Meyer and
Peng, 2016). In that regard, scholars highlight the study of “how a firm’s entry mode choice
will influence post-entry decisions and performance” (Canabal and White, 2008: 277) as a
fruitful avenue of research. As a response to this void, several studies have shown its interest
in the innovation carried out by MNEs foreign affiliates when competing abroad (Belderbos,
2003; Zhang, Li, Hitt and Cui, 2007; Zhou and Li, 2008), given its influence on firm growth
(García-Manjón and Romero-Merino, 2012).
On this point, it seems sensible to underline the lack of research analyzing the
influence exerted by MNEs entry mode on subsidiaries’ innovation. Furthermore, the existing
work on this issue has focused, for the most part, on examining innovation carried out by
subsidiaries operating in emerging countries with a specific type of entry mode: international
joint ventures (e.g., Zhang et al., 2007; Zhou and Li, 2008). Scholars on this line of research
state that the ownership structure shown by the international joint venture (i.e. the proportion
of ownership controlled by foreign and local partners) exerts an imprinting impact on its
innovation behavior. Two main arguments are used. On the one hand, studies that suggest the
need of a balanced ownership structure. Conducting innovation activities will require, not
only advanced foreign technology, but also local partners’ thorough understanding of market
opportunities and domestic needs (e.g., Zhou and Li, 2008). On the other, scholars that
defend greater ownership levels as a mechanism to protect foreign MNEs proprietary
knowledge, while mitigating local partners’ opportunism (see Zhang et al., 2007).
125
In any case, the few studies on this issue focus specifically on firms operating through
a particular type of entry mode, which offers evidence on MNEs innovation behavior from a
very specific point of view. Our study progresses in the international business literature by
analyzing how the MNEs entry mode (i.e. shared owned vs. fully owned subsidiaries) affects
their innovation behavior when competing abroad. Moreover, the existing evidence is
generally focused on analyzing subsidiaries innovation in a specific country, such as
international joint ventures in China (Zhang et al., 2007; Zhou and Li, 2008). However, it
seems reasonable to suspect that the conditions of the context in which subsidiaries operate
might influence their innovation behavior (Chang, Chung and Mahmood, 2006).
Accordingly, our study proposes that the development of the host market could affect the
incentives that subsidiaries have to invest in innovation, thus moderating the entry mode-
innovation relationship.
Overall, the aim of this research is twofold. First, we deep the analysis on how the
relationship between the cultural distance between countries and MNEs entry mode decisions
is moderated by the conditions of the country of origin2. Then, we argue that, once MNEs
have entered the market, the way subsidiaries behave will be conditioned by both their entry
mode and the degree of development of the host country in which firms operate.
4.3. HYPOTHESES
4.3.1. Cultural distance and entry mode: The country-of-origin effect
Despite the positive influence of sociocultural distance on the propensity of firms to
enter in a new market exerting a lower control is an argument commonly accepted in
international business studies (Erramilli and Rao, 1993; Gatignon and Anderson, 1988;
2 There are multiple terms used to refer to those non-advanced economies in prior literature (e.g. underdeveloped, developing, Third World, among others). In our study, we differentiate between developed and developing and emerging economies according to the International Monetary Fund classification. Despite the heterogeneity across countries included in each group, we use this broad classification to facilitate the discussion.

126
Mutinelly and Piscello, 1988), the empirical evidence is still conflicting on this matter. To
clarify this question, recent theoretical studies point out the need to examine other factors,
such as MNEs origin, as it might directly affect their competitive behavior and, specifically,
their internationalization decisions (see, for instance, Beugelsdijk et al., 2018). In that regard,
specific contingencies of their home countries would lead managers to act differently in
cross-border transactions. Hence, our contention is that differences in the country of origin of
MNEs will moderate the positive effect of cultural distance on the preference for choosing a
shared-ownership entry mode (vs a fully owned subsidiary). Two opposing arguments can be
found on this issue in the IB literature.
Some studies suggest that the uncertainty involved in greater distant markets may be
compensated by managers’ superior tolerance levels for competing in low trustworthy
contexts (Cuervo-Cazurra, 2012). In that regard, managers of EMNEs would be characterized
by presenting lower levels of risk aversion because of the higher levels of uncertainty,
instability and crises prevalent in their home country. This ability to adequately operate in
more difficult business environments has been suggested as a different ownership advantage
possessed by MNEs from emerging and developing economies (Ramamurti, 2012; Guillén
and García-Canal, 2009). This capability to better deal with risk might alleviate the negative
impact of cultural distance on higher-equity entry modes of EMNEs subsidiaries.
However, it would be also noteworthy to recognize the existence of other contextual
conditions that will influence the way MNEs behave. Specific characteristics of the country
of origin when referring to EMNEs lead scholars to consider possible restrictions that might
affect their ownership strategies in the opposite direction. Due to financial and managerial
resource constrains, MNEs from emerging and developing countries might prefer low
commitment entry modes (such as shared ownership) to retain maximum financial flexibility
while compensating the cost of entering in markets with greater cultural differences (Chung
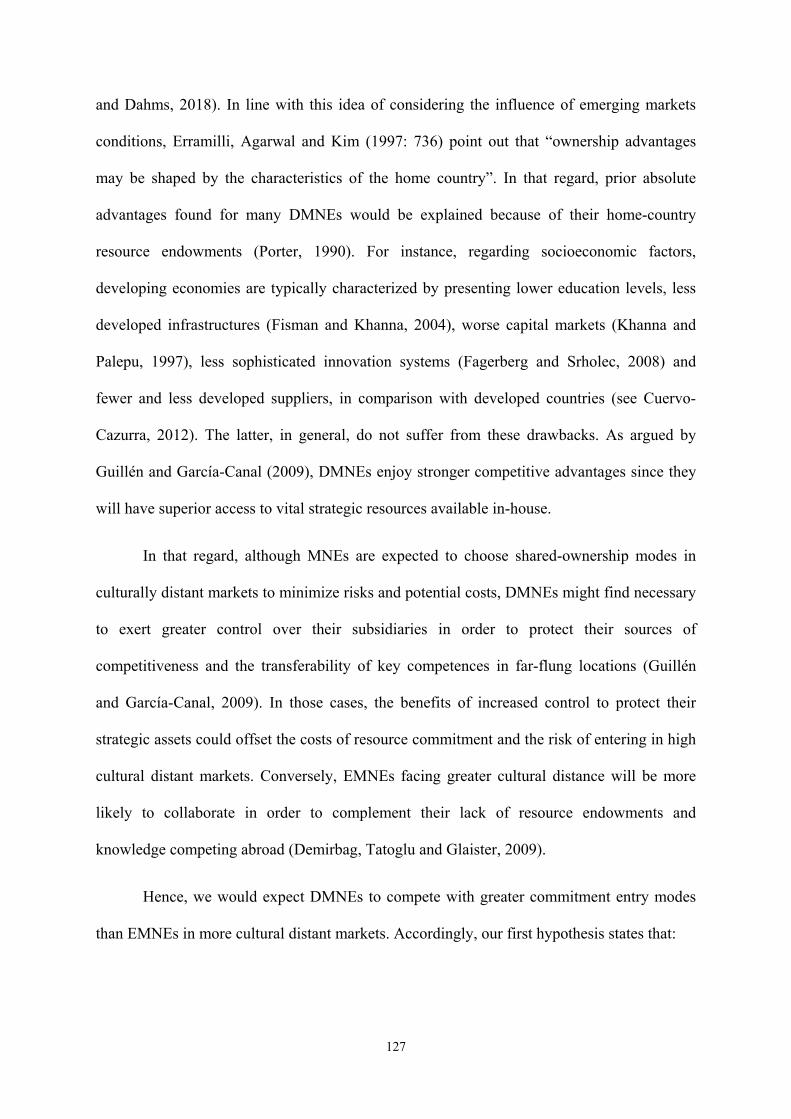
127
and Dahms, 2018). In line with this idea of considering the influence of emerging markets
conditions, Erramilli, Agarwal and Kim (1997: 736) point out that “ownership advantages
may be shaped by the characteristics of the home country”. In that regard, prior absolute
advantages found for many DMNEs would be explained because of their home-country
resource endowments (Porter, 1990). For instance, regarding socioeconomic factors,
developing economies are typically characterized by presenting lower education levels, less
developed infrastructures (Fisman and Khanna, 2004), worse capital markets (Khanna and
Palepu, 1997), less sophisticated innovation systems (Fagerberg and Srholec, 2008) and
fewer and less developed suppliers, in comparison with developed countries (see Cuervo-
Cazurra, 2012). The latter, in general, do not suffer from these drawbacks. As argued by
Guillén and García-Canal (2009), DMNEs enjoy stronger competitive advantages since they
will have superior access to vital strategic resources available in-house.
In that regard, although MNEs are expected to choose shared-ownership modes in
culturally distant markets to minimize risks and potential costs, DMNEs might find necessary
to exert greater control over their subsidiaries in order to protect their sources of
competitiveness and the transferability of key competences in far-flung locations (Guillén
and García-Canal, 2009). In those cases, the benefits of increased control to protect their
strategic assets could offset the costs of resource commitment and the risk of entering in high
cultural distant markets. Conversely, EMNEs facing greater cultural distance will be more
likely to collaborate in order to complement their lack of resource endowments and
knowledge competing abroad (Demirbag, Tatoglu and Glaister, 2009).
Hence, we would expect DMNEs to compete with greater commitment entry modes
than EMNEs in more cultural distant markets. Accordingly, our first hypothesis states that:
128
Hypothesis 1: The positive effect of cultural distance on the probability of choosing a
shared ownership entry mode (vs. a full ownership entry mode) will be lower for MNEs from
developed countries than for MNEs from developing or emerging countries.
4.3.2. Entry mode choice and subsidiaries’ innovation
It might be important to note that, by 2018, most MNEs have entered in a broad range
of developed and developing economies and their concern of how to enter may have been
replaced by how to compete (Meyer and Peng, 2016). Once entry barriers are overcome,
MNEs efforts must be focused on coordinating and adequately exploiting resources and skills
in different marketplaces where they operate. Hence, current MNEs’ challenge is to manage
the way their subsidiaries compete overseas to ensure sustainable growth and profitability
(Canabal and White, 2008).
In highly competitive and dynamic contexts, innovation is suggested as an engine
driving firm growth (Coad and Rao, 2008; García-Manjón and Romero-Merino, 2012).
Accordingly, a considerable body of research has been focused on examining those factors
that influence firms’ innovation. Traditionally, market structure was suggested as a key
determinant of firms’ innovation behavior (Schumpeter, 1934, 1942). Nevertheless, even
those studies based on an individual sector were unable to explain why firms, facing similar
external conditions, showed such variability regarding their innovation performance (see
Belloc, 2011; Fagerberg et al., 2005). Due to this lack of consensus, scholars began to look
inside the firm and, specifically, to look at its system of corporate governance. As firms differ
in their internal governments’ structures (Coase, 1937), scholars suggest that such differences
will inevitably influence decision making-processes and, consequently, firms’ innovation
performance. Surprisingly, “this field of research has not benefited so far from a systematic
discussion” (Belloc, 2011: 3).
129
Delving into this line of work, empirical studies examining the link “corporate
governance-firm innovation” have suggested the corporate ownership concentration as a key
factor influencing firms’ decisions (Choi et al., 2011; Choi et al., 2012). Though different
approaches have been used to address the relationship (see Belloc, 2011, for a review),
transaction cost theory (TCT) has been commonly employed when firms decisions involve
high levels of uncertainty and intangible assets (see, for instance, Chang, Chung and Moon,
2013; Robertson and Gatignon, 1998). According to TCT (Williamson, 1975; 1985), firms
make decisions between markets or hierarchies depending on certain factors that may affect
transaction costs between parties such as asset specificity, uncertainty, information
asymmetry and opportunism, among others. Consistent with the premises of the TCT, we
contend that entry modes (shared-owned vs. fully owned subsidiaries) will influence the costs
and risks assumed by partners when making innovation investments. Specifically, we propose
that the mode of entry will affect the adoption speed of innovation shown by subsidiary firms.
First, investments in assets presenting high levels of specificity (such as, for instance,
expenditures in innovation projects) might increase the risks of partners’ opportunism. As a
result, firms would incur in higher costs of preventing potential self-interest (ex ante) as well
as renegotiating costs (ex post), as the collaborative relationship goes by (Williamson, 1985).
Hence, in presence of asset specificity, partners’ opportunistic behavior can make the shared-
owned firms option more costly (Chang et al., 2013).
Second, the existence of asymmetric information and of different interests between
partners might slow down the innovation process. In presence of hidden agendas and parties’
self-interest to maximize their utility (Das and Teng, 1998), the negotiation process to
establish a common goal, and more specifically, to pursue a project whose final result is
surrounded by a high degree of uncertainty could be complex and time-consuming. By
considering equity ownership as a proxy for partners’ control over subsidiaries innovation

130
investment decisions (Zhang et al., 2007), we would expect shared-owned firms to show a
slower innovation process than fully owned subsidiaries.
Finally, it has been also suggested that fully owned subsidiaries could make decisions
faster since they do not have to incur in negotiation cost with partners (Chang et al., 2013).
Reflecting on the external uncertainty of the economic context where firms compete, superior
levels of control over the management and decision system facilitate an easier and quicker
adaptability to environmental changes (Robertson and Gatignon, 1998). Shared-owned firms
might be less effective decision-makers as external uncertainty increases and, therefore, it
seems reasonable to consider that a higher decision control will favor a quicker adoption and
implementation of innovations.
For all these reasons, in our second hypothesis we postulate that:
Hypothesis 2: Shared-owned subsidiaries will show lower adoption speed of
innovations than fully-owned subsidiaries.
4.3.3. The moderating effect of host country development on subsidiaries’ innovation
One important thing to consider at this point is that the economic context in which
firms compete may also influence the way they behave (Shinkle and Mccann, 2014). In
particular, we consider that the degree of development of the host market may affect the costs
and risks firms assume when performing their innovation strategy, while diminishing
potential opportunism.
As aforementioned, developed economies present certain characteristics significantly
different from those of developing countries. Regarding socioeconomic and regulatory
factors, less developed countries generally present poorer infrastructure, worse regulative
regimens, unpredictable government policies, less transparency, fewer rights and lower
freedom levels (Cuervo-Cazurra, 2012). These are basic national dimensions to secure a well-

131
functioning of the economic framework in any country. Most of these factors have been
confirmed to play an essential role in explaining cross-country innovation differences
(Furman, Porter and Stern, 2002; Varsakelis, 2006). For instance, an effective enforcement of
property rights protection will positively influence firms’ innovation, as it would reduce the
likelihood of suffering from private property expropriation.
Taking into account the impact exerted by the economic context on firm behavior,
we suggest that the degree of development of the host country will affect the costs and risks
perceived by subsidiaries when investing in innovation. In particular, our contention is that
the degree of development will affect shared-owned subsidiaries to a greater extent, as their
investments would be subject to the other parties’ opportunism. On the one hand, less
developed environments may increase the risks and costs that firms assume when they are
involved in a shared-owned subsidiary. Emerging economies are generally characterized by
presenting market failures (Hoskisson, Eden, Lau, Wright, 2000). This implies that
transactions between parties will be subject to higher contractual hazards because of the
weaker regulatory and legal regimes that generally characterize those contexts. In those
contexts, the possibility of a partner acting opportunistically along the innovation process
might cause renegotiating costs to increase and the process of adoption and implementation
of innovations to slow down. Conversely, more developed contexts will reduce the threat of
opportunism and, therefore, will protect shared-ownership firms when pursuing innovation
investments with partners. In our framework, this involves that the negative influence of
competing through a shared-ownership subsidiary on the adoption speed of innovation will be
weaker, the greater the development of the environment is. Therefore, we state our third
hypothesis as follows:
Hypothesis 3: The degree of economic development of the host country will positively
moderate the negative effect of shared-owned subsidiaries on the innovation adoption speed.
132
Accordingly, we develop a two-stage model that is graphically presented in Figure 4.1.
Figure 4.1. Model of analysis
4.4. EMPIRICAL ANALYSIS
4.4.1. Data and sample
4.4.1.1. Research setting: The mobile communications industry
We test our hypotheses in the mobile telecommunication industry. The information
about international group entries and subsidiaries behavior mainly comes from the GSMA
Intelligence Database (2017). To evaluate the influence of nation-level factors, we collect
data from The World Bank indicators and the cultural dimensions of the Hofstede index. We
use the country classification of the International Monetary Fund (IMF) to differentiate
between developed and developing economies.
Our data set includes quarterly information of 18 international groups and 260
subsidiaries for the period 2000-2017. A detailed list of the multinational groups considered
is shown in Table 4.1. It might be noteworthy to mention that we are using information from
MNEs operating in the five continents3. Hence, we consider that our research setting is
3 In particular, the multinational groups included in this study compete in the following countries: Albania, Angola, Argentina, Australia, Austria, Bangladesh, Belgium, Brazil, Bulgaria, Burkina Faso, Cabo Verde, Canada, Chile, Colombia, Costa Rica, Croatia, Czech Republic, Denmark, Dominican Republic, Ecuador, Egypt, El Salvador, Estonia, Fiji, Finland, France, Germany, Ghana, Greece, Guatemala, Honduras, Hong Kong, Hungary, India, Indonesia, Iran, Iraq, Ireland, Israel, Italy, Jamaica, Jordan, Kenya, Kuwait, Latvia, Lebanon, Lithuania, Luxembourg, Malawi, Malaysia, Malta, Mexico, Morocco, Mozambique, Namibia, Nepal, Netherlands, New Zealand, Nigeria, Norway, Pakistan, Panama, Peru, Philippines, Poland, Portugal, Puerto Rico, Romania, Russian Federation, Saudi Arabia, Senegal, Serbia, Sierra Leone, Singapore, Slovakia,
Cultural distance
Entry mode decision
(shared vs. full ownership)
Adoption speed of innovations
Developed home country Developed host country
H1 (-)
H2 (-)
H3 (+)

133
adequate to test our hypotheses as it offers considerable variability of cultural and economic
environments.
Table 4.1. Description of MNEs in the sample Multinational enterprise Home Country Group origina
1. AT&T Group United States of America Developed
2. America Movil Group Mexico Developing
3. Axiata Group Malaysia Developing
4. CK Hutchison Group Hong Kong Developed
5. Deutsche Telekom Group Germany Developed
6. Etisalat Group United Arabic Emirates Developing
7. KPN Group The Netherlands Developed
8. Oi Group Brazil Developing
9. Orange Group France Developed
10. Orascom Telecom Egypt Developing
11. STC Group Saudi Arabia Developing
12. Singtel Group Singapore Developed
13. Telecom Italia Group Italy Developed
14. Telefonica Group Spain Developed
15. Telenor Group Norway Developed
16. Telia Sonera Group Finland Developed
17. Turkcell Group Turkey Developing
18. Vodafone Group United Kingdom Developed aAccording to the International Monetary Fund classification.
4.4.1.2. Variable description
Dependent variables
As shown in Figure 4.1, we build a two-stage model to test our hypotheses.
Accordingly, two dependent variables are included in this study. First, in testing the effect of
cultural distance and MNEs home country development on the entry mode decision, we
defined the variable shared ownership. Second, to assess whether the entry mode decision
Slovenia, South Africa, Spain, Sri Lanka, Sweden, Switzerland, Thailand, Turkey, Ukraine, United Arab Emirates, United Kingdom, United States of America, Uruguay, Venezuela, Vietnam, Zambia.
134
and the development of the host country shape subsidiaries innovation behavior, we used the
adoption speed of innovations as the dependent variable. Each of these variables is described
in more detailed below.
Shared ownership
Our definition of firms’ entry mode is based on percentages of ownership equity
controlled by MNEs. In line with the majority of empirical studies, we use a stake of 10% in
a foreign company as a minimum to be considered as a foreign direct investment (Benito and
Gripsrud, 1992; Dikova and van Witteloostuijn, 2007; López-Duarte and Vidal-Suárez, 2013;
Liou et al., 2016; Mutinelly and Piscitello, 1998)4. In particular, we identify the control
exerted by the MNE over the subsidiary by defining a dummy variable, shared ownership,
which equals 1 whether the MNE owns at least 10% and less than 95% of the foreign
subsidiary equity. Shared ownership takes the value 0 when the equity owned by the MNE is
95% or more (Mutinelly and Piscitello, 1998).
Adoption speed of innovations
In the telecommunication sector, the emergence of a new industry took place with the
shift from fixed to wireless technology. As previously noted in Chapter 3, this technological
disruption resulted in the appearance of the mobile telecommunication industry in the last
decades of the 20th century, which experienced its real takeoff with the irruption of the
digital technologies (second generation or 2G). After that, a succession of technological
generations (i.e. the third generation (3G), the fourth generation (4G) and the upcoming fifth
generation (5G) of mobile communication systems) has marked the evolution of the industry.
4 The Organization for Economic Cooperation and Development (OECD) or the International Monetary Fund (IMF) also qualify as investors that make foreign direct investments to those that own at least 10% of a subsidiary equity to exercise management control rights.
135
These are exogenous technological innovations that telecommunication operators adopt to
improve the quality and functionalities of the service offered to the final user.
To define our variable adoption of speed innovation, we considered as technological
innovations the launch of the 3G and 4G by a firm in any market. As the 2G introduction
mostly took place during the early 90s, it was almost fully diffused in all markets at the
beginning of our observation window. Therefore, we decided to limit the second part of our
empirical analysis to the period 2003-2017, since it covers the period from the first year a
firm adopts 3G in our sample and the last one with information available.
Consistent with the extant innovation literature, the variable adoption speed of
innovations is measured as the mean value of the difference between the period a firm adopts
a technological innovation and the last period of adoption of that innovation by any firm in
our sample plus one (Damanpour and Gopalakrishnan, 2001; Subramanian and Nilakanta,
1996). We measure this variable on a quarterly basis.
By way of clarification, it might be worth presenting an example to explain how the
variable adoption speed of innovations is defined. For instance, in the case of the Third
Generation (3G) in the mobile telecommunication sector, if firm A introduced the 3G in the
first quarter of 2005 (equivalent to the 9th quarter from 2003) and the last adopter launched it
by the end of 2011 (equivalent to the 36th quarter), then the adoption speed of firm A is
calculated by subtracting 9 from 37 (36+1). Therefore, the adoption speed of innovations
index is specified as follows:
Σ Yi 1 Xi /N
where Yi stands for the last period of adoption of technological innovation i by any firm in
the sample, Xi is the period of adoption of technological innovation i by firm A, and N refers
to the number of technological innovations adopted by firm A.
136
According to this measure, early adopters would present higher values than late
adopters of each technological innovation, showing the last adopter a score of 1. Besides,
those firms that did not adopt an innovation were given a score of 0. So, they are considered
as very late adopters, showing a score even lower than the actual last adopter (see
Subramanian and Nilakanta, 1996).
Independent variables
Cultural distance
Our cultural distance variable is measured through the Kogut and Singh's (1988)
index, widely used in studies of foreign entries (e.g. Barkema et al., 1996, 1997; Erramilli and
Rao, 1993; Hutzschenreuter et al., 2011; Liou et al., 2016; Mutinelly and Piscitelly, 1998).
This index is an aggregate of four scores of the Hofstede (1980) national dimensions (power
distance, individualism, masculinity and uncertainty avoidance) and it is calculated as
differences in scores between pairs of countries.
MNEs origin
To know whether the degree of development of the MNE home country shapes
multinationals entry mode decisions, we define the dummy variable developed home country.
According to the classification of the IMF, the variable developed home country takes the
value 1 if the country of origin of the MNE belongs to the group of economies classified as
developed, and 0 in the case of countries considered as emerging or developing economies
(see Table 4.1). Besides examining whether the developed home country moderates the
relationship between cultural distance and entry mode in the first-stage of our model, we
maintain it as a control variable in the second stage.
137
MNEs host country
To test whether the degree of development of the host country affects subsidiaries
innovation strategies, we defined the dummy variable developed host country. As with
developed home country, we have used the IMF classification to differentiate the degree of
development of host markets. Accordingly, the developed host country equals 1 if the
subsidiary competes in a developed economy, and 0 otherwise. Since the type of country in
which MNEs invest may influence their entry decisions (Tihanyi et al., 2005), we decided to
use the developed host country as a control variable in the first stage of our model.
Control variables
Apart from those described above, we include several control variables that might
affect MNEs entry decisions and subsidiaries innovation strategies. To control for the size of
the MNEs, we incorporate the variable group size that counts the number of subsidiaries a
MNEs has in each period. Greater internationalization experience of large multinationals is
expected to diminish the uncertainty of MNEs when expanding abroad, thus reducing the
negative impact of cultural distance on higher-control entry modes. Moreover, our model
control for the presence of the MNE in host markets which are geographically close5 to the
ones of each subsidiary by including the variable regional intensity. We express this variable
as the percentage of subsidiaries within a geographic area over the total MNEs’ subsidiaries6.
In that regard, this variable accounts for any possible effects due to MNEs´ regional strategic
emphasis. Besides, we include a set of international group variables to control for other
5 We define geographic areas according to the United Nations classification. Available at: https://unstats.un.org/unsd/methodology/m49/ 6 For instance, the CK Hutchison Group was present in twelve countries in the last quarter of 2009. In particular, the group offered telecommunication services in Australia, Austria, Denmark, Hong Kong, Indonesia, Ireland, Italy, Sri Lanka, Sweden, Thailand, United Kingdom and Vietnam. To build our variable of regional intensity, we take into account the presence that the group has in different geographical areas. So, at that moment, there were six of the twelve subsidiaries, which were located in the European market, whereas five were in the Asian market and just one was in Oceania. Therefore, the variable regional intensity takes the value 0.50 in the case of operators located in Austria, Denmark, Ireland, Italy, Sweden and United Kingdom; 0.42 when the firm operates in Hong Kong, Indonesia, Sri Lanka, Thailand or Vietnam; and 0.08 when the operator identified is in Australia.
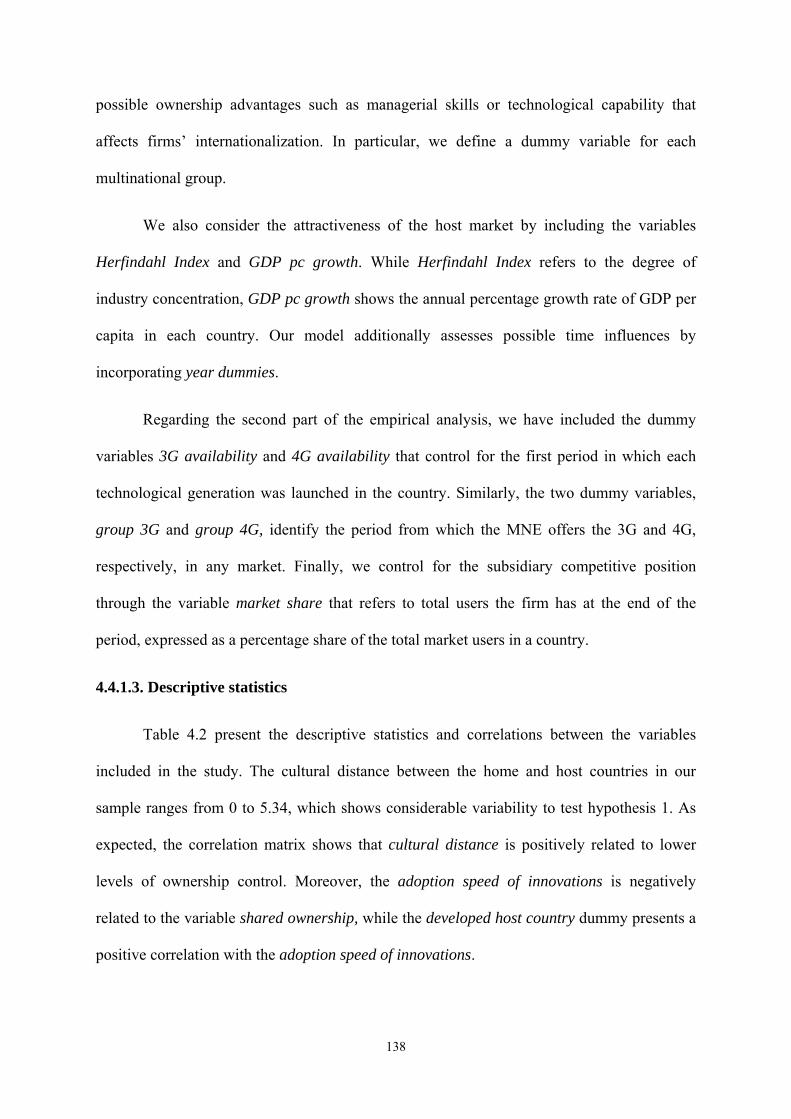
138
possible ownership advantages such as managerial skills or technological capability that
affects firms’ internationalization. In particular, we define a dummy variable for each
multinational group.
We also consider the attractiveness of the host market by including the variables
Herfindahl Index and GDP pc growth. While Herfindahl Index refers to the degree of
industry concentration, GDP pc growth shows the annual percentage growth rate of GDP per
capita in each country. Our model additionally assesses possible time influences by
incorporating year dummies.
Regarding the second part of the empirical analysis, we have included the dummy
variables 3G availability and 4G availability that control for the first period in which each
technological generation was launched in the country. Similarly, the two dummy variables,
group 3G and group 4G, identify the period from which the MNE offers the 3G and 4G,
respectively, in any market. Finally, we control for the subsidiary competitive position
through the variable market share that refers to total users the firm has at the end of the
period, expressed as a percentage share of the total market users in a country.
4.4.1.3. Descriptive statistics
Table 4.2 present the descriptive statistics and correlations between the variables
included in the study. The cultural distance between the home and host countries in our
sample ranges from 0 to 5.34, which shows considerable variability to test hypothesis 1. As
expected, the correlation matrix shows that cultural distance is positively related to lower
levels of ownership control. Moreover, the adoption speed of innovations is negatively
related to the variable shared ownership, while the developed host country dummy presents a
positive correlation with the adoption speed of innovations.
139
4.4.2. Methodology
The aim of our study is twofold. Firstly, it attempts to disentangle conflicting
evidence about those factors that influence MNEs entry mode decisions. Specifically, we
consider that MNEs entry mode decisions in culturally distant markets may vary depending
on the MNE home country. To test this initial conjecture, we define a binary variable that
identify multinationals entry mode according to the control exerted by MNEs over its
subsidiaries (shared ownership vs. full ownership). Secondly, our contention is that, once
entered a given market, the entry mode choice will influence firms’ innovation behavior.
Nevertheless, as mentioned above, the decision of how to enter would be influenced by
several factors such as the cultural distance between the MNE home and the subsidiary host
country. Therefore, the analysis of how the entry mode choice shapes subsidiaries innovation
should take into account that such choice is endogenous.
The failure to consider endogeneity in entry mode studies may have lead researchers
to incorrect or misleading conclusions (see Brouthers and Hennart, 2007). In order to correct
for such endogeneity related to the entry mode choice, we estimate a Heckman two-stage
model (Heckman, 1979). In the first stage, a probit regression is used estimate the probability
of choosing a shared-owned entry mode when expanding to a foreign market (Hypothesis 1).
This regression is used to estimate the inverse Mills ratio for each firm, which is used as an
instrument in the second regression that accounts for potential sample selection bias. Then,
we estimate in a second stage a random-effects GLS regression to test whether the entry
mode affect subsidiaries’ adoption speed of innovation (Hypotheses 2 and 3). The correction
for self-selection variable (the Mills ratio) is included in the second stage to control for
unobservable characteristics that may affect the entry mode choice.
140
Table 4.2. Descriptive analysis and correlations
Variable Obs. Mean St.
Dv.
Min Max [1] [2] [3] [4] [5] [6] [7] [8] [9] [10] [11] [12] [13] [14]
[1] Shared ownership 9223 0.51 0.50 0 1 1.00
[2] Adoption speed of innovations 9223 32.06 14.03 0 55 -0.33 1.00
[3] Cultural distance 9223 1.48 1.33 0 5.34 0.11 -0.12 1.00
[4] Developed home country 9223 0.78 0.42 0 1 0.02 0.18 0.27 1.00
[5] Developed host country 9223 0.38 0.48 0 1 -0.23 0.51 -0.01 0.33 1.00
[6] Group size 9223 14.62 6.53 1 27 -0.10 0.09 0.25 0.34 0.09 1.00
[7] Regional intensity 9223 0.60 0.27 0.037 1 -0.23 0.13 -0.23 -0.30 -0.05 -0.42 1.00
[8] Herfindahl Index 9223 3.55 1.13 1.15 10 -0.01 -0.03 0.05 -0.14 -0.19 0.08 -0.08 1.00
[9] GDP pc growth 9223 2.21 3.52 -22.23 24.67 0.11 -0.15 0.03 -0.01 -0.24 -0.03 0.03 -0.00 1.00
[10] 3G availability 9223 0.84 0.37 0 1 -0.10 0.13 -0.04 -0.01 0.20 0.09 -0.02 -0.23 -0.22 1.00
[11] 4G availability 9223 0.29 0.46 0 1 -0.05 -0.14 -0.06 -0.05 0.12 0.02 -0.04 -0.13 -0.08 0.28 1.00
[12] Group 3G 9223 0.91 0.29 0 1 -0.01 -0.05 0.06 0.11 0.03 0.17 -0.09 -0.13 -0.06 0.50 0.17 1.00
[13] Group 4G 9223 0.43 0.50 0 1 0.04 -0.30 0.02 -0.03 -0.03 0.14 -0.13 -0.12 -0.08 0.38 0.68 0.27 1.00
[14] Market share 9223 0.31 0.17 0 1 -0.10 0.15 -0.08 -0.07 -0.09 0.09 0.02 0.53 -0.03 -0.09 -0.01 -0.10 -0.00 1.00
141
4.5. RESULTS
Table 4.3 reports the results of the Heckman model carried out in our empirical
analysis. As can be seen, the first three columns refer to the first stage of the Heckman
estimation, whereas the last trio encompasses the second stage in which the inverse Mills
ratio is included.
In order to test Hypothesis 1, we should take a look at the first three columns, which
considers shared ownership as the dependent variable. Model 1 shows the results of the
baseline model, which only contains the control variables. Model 2 includes the effect of
cultural distance and developed home country as independent variables, while Model 3
incorporates its interaction effect to test Hypothesis 1. As shown at the bottom of Table 4.3,
all models are globally significant and the values of F-tests confirm that the full model is
preferred to its simple counterparts.
Firstly, it is important to note that the variable cultural distance shows a positive and
significant coefficient in Model 2 (β=0.581; p<0.01) and Model 3 (β=1.811; p<0.01). Thus,
in line with prior literature, a greater cultural distance seems to be positively associated with
shared ownership entry modes. In other words, the more culturally distant markets are, the
lower the probability of entering with higher equity entry modes. Regarding the effect that
the MNEs origin exerts on their entry decisions, the negative coefficient of the developed
home country seems to be in line with our expectations, though its effect is not significant
(β=-3.346; p>0.10). However, as can be seen in Model 3, the interaction term between the
cultural distance and the developed home country shows a negative and statistically
significant coefficient (β=-1.318; p<0.10). The development of MNEs home country seems to
reduce the positive effect of cultural distance previously found, supporting Hypothesis 1.
Therefore, the probability of choosing shared ownership in more distant markets is confirmed
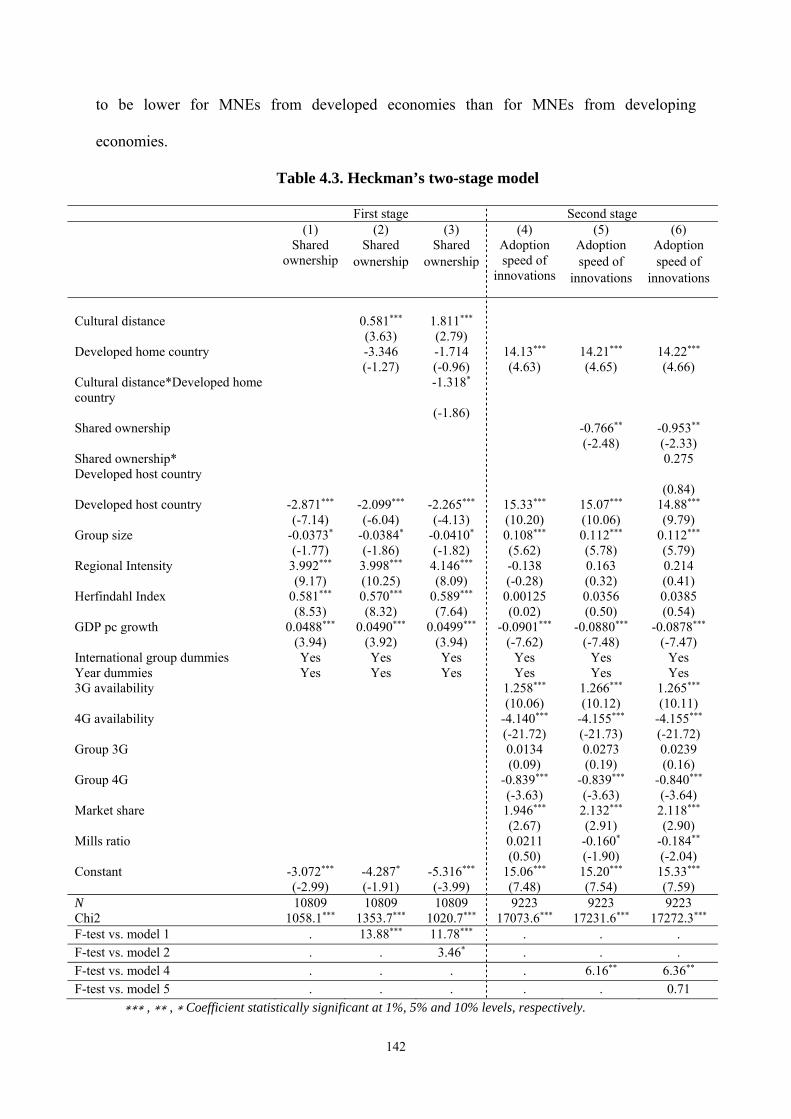
142
to be lower for MNEs from developed economies than for MNEs from developing
economies.
Table 4.3. Heckman’s two-stage model
First stage Second stage (1) (2) (3) (4) (5) (6) Shared
ownership Shared
ownership Shared
ownershipAdoption speed of
innovations
Adoption speed of
innovations
Adoption speed of
innovations
Cultural distance 0.581*** 1.811*** (3.63) (2.79) Developed home country -3.346 -1.714 14.13*** 14.21*** 14.22*** (-1.27) (-0.96) (4.63) (4.65) (4.66) Cultural distance*Developed home country
-1.318*
(-1.86) Shared ownership -0.766** -0.953** (-2.48) (-2.33) Shared ownership* Developed host country
0.275
(0.84) Developed host country -2.871*** -2.099*** -2.265*** 15.33*** 15.07*** 14.88*** (-7.14) (-6.04) (-4.13) (10.20) (10.06) (9.79) Group size -0.0373* -0.0384* -0.0410* 0.108*** 0.112*** 0.112*** (-1.77) (-1.86) (-1.82) (5.62) (5.78) (5.79) Regional Intensity 3.992*** 3.998*** 4.146*** -0.138 0.163 0.214 (9.17) (10.25) (8.09) (-0.28) (0.32) (0.41) Herfindahl Index 0.581*** 0.570*** 0.589*** 0.00125 0.0356 0.0385 (8.53) (8.32) (7.64) (0.02) (0.50) (0.54) GDP pc growth 0.0488*** 0.0490*** 0.0499*** -0.0901*** -0.0880*** -0.0878*** (3.94) (3.92) (3.94) (-7.62) (-7.48) (-7.47) International group dummies Yes Yes Yes Yes Yes Yes Year dummies Yes Yes Yes Yes Yes Yes 3G availability 1.258*** 1.266*** 1.265*** (10.06) (10.12) (10.11) 4G availability -4.140*** -4.155*** -4.155*** (-21.72) (-21.73) (-21.72) Group 3G 0.0134 0.0273 0.0239 (0.09) (0.19) (0.16) Group 4G -0.839*** -0.839*** -0.840*** (-3.63) (-3.63) (-3.64) Market share 1.946*** 2.132*** 2.118*** (2.67) (2.91) (2.90) Mills ratio 0.0211 -0.160* -0.184** (0.50) (-1.90) (-2.04) Constant -3.072*** -4.287* -5.316*** 15.06*** 15.20*** 15.33*** (-2.99) (-1.91) (-3.99) (7.48) (7.54) (7.59) N 10809 10809 10809 9223 9223 9223 Chi2 1058.1*** 1353.7*** 1020.7*** 17073.6*** 17231.6*** 17272.3*** F-test vs. model 1 . 13.88*** 11.78*** . . . F-test vs. model 2 . . 3.46* . . . F-test vs. model 4 . . . . 6.16** 6.36** F-test vs. model 5 . . . . . 0.71
∗∗∗ , ∗∗ , ∗ Coefficient statistically significant at 1%, 5% and 10% levels, respectively.
143
To evaluate how the entry mode decision influences subsidiaries innovation, we
consider the last three columns in Table 4.3. As in the first stage, Model 4 shows the effect of
the control variables on the dependent variable adoption speed of innovations. Model 5
incorporates the effect of shared ownership as an independent variable. Finally, Model 6
includes the interaction term between shared ownership and developed host country to test
the moderating effect of the host country on the relationship between ownership
concentration and adoption speed of innovations. The correction for self-selection variable is
included in all models of the second stage. The statistical significance of the inverse Mills
ratio indicates the presence of a sample selection bias in our model. As shown at the bottom
of Table 4.3, the explanatory power of all models is adequate according to their chi-squared
values and the F-tests confirm that Model 5 is the preferred one.
Regarding Hypothesis 2, results in Table 4.3 show that the coefficient of the variable
shared ownership in Model 5 (β=-0.766; p<0.05) and Model 6 (β=-0.953; p<0.05) is negative
and significant. This means that, as predicted, those subsidiaries with a more dispersed
ownership present lower adoption speed of innovations, all other factors being constant.
These results support Hypothesis 2.
Finally, contrary to our expectations, the degree of development of the host country
does not moderate the relationship between the ownership concentration and the adoption
speed of innovations. It can be observed that the interaction term between the variables
shared ownership and developed host country is positive but not significant (β=0.275;
p>0.10). Despite the positive impact is in line with our expectations, Hypothesis 3 cannot be
accepted.
144
4.6. CONCLUSION AND DISCUSSION
The purpose of this research has been to shed light on those factors that trigger MNEs
behavior when entering foreign countries and implementing their innovation strategies. In
particular, it has focused on (1) the effects of development of the country of origin of the
MNEs, as a moderator in the relationship between cultural distance and the mode of entry, (2)
the consequences of the mode of entry on the speed of adoption of innovations by the MNEs
and (3) the moderating behavior of the development of the host country in the relationship
between the mode of entry and the adoption of innovations. Mainly using the IB literature
and TCT, we have proposed that (1) MNEs originated in more developed countries would
show a preference for fully owned subsidiaries, reducing the negative effects of cultural
distance on this mode of entry; (2) shared owned subsidiaries would be slower than fully-
owned subsidiaries in adopting innovations and (3) that shared-owned subsidiaries will be
more prone to quickly adopt innovations in more developed countries, reducing the negative
effects of shared ownership on their adoption behavior. If we distinguish between the
decision on the mode of entry of the MNE and the innovating behavior of the subsidiary we
can draw the following two groups of conclusions.
First, our study confirms the negative influence of cultural distance between home and
host countries in MNEs entry mode decisions when internationalizing. In line with prior
literature, the greater the cultural distance, the more likely the decision of entering with a
shared-owned subsidiary. Furthermore, the empirical evidence reveals the key role played by
the country of origin when explaining differences in MNEs international expansion. In that
regard, our results confirm that MNEs from developed economies are more likely to penetrate
new markets via fully owned-subsidiaries, diminishing the negative effect of cultural distance
on foreign affiliates ownership concentration.
145
Second, the entry mode choice is confirmed to significantly influence firm innovation.
Our findings show that the speed of adoption of innovations is negatively related to the
degree of subsidiaries ownership concentration. As predicted, our findings show greater
levels of adoption speed for fully owned rather than shared-owned ventures. However, we do
not find evidence of the moderating role played by the development of the host country on
the entry mode-innovation relationship.
Overall, these findings contribute to the improvement of both international business
and innovation research in the following ways. From an international business perspective,
our study reveals the potential of context-country moderator effects in explaining prior
conflicting evidence in entry mode studies (Beugelsdijk et al., 2018; Tihanyi et al., 2005).
The examination of home country moderators yielded significant differences in MNEs
decisions regarding entry mode decisions in culturally distant markets. Moreover, this
research addresses scholars’ demands on studies that focus on MNEs post-entry behaviors
(Canabal and White, 2008). By focusing on the innovation behavior of the subsidiary, our
research provides new insights regarding differences in their behavior that are conditioned by
ownership structure. In particular, we expand prior knowledge on product innovation of
international joint ventures in emerging economies (Zhang et al, 2007; Zhou and Li, 2008) by
considering the speed of adoption of innovations. Not only that, our setting, which includes a
much wider set of subsidiaries, operating worldwide, and different modes of entry, is much
more comprehensive that the ones found in previous research. Finally, our methodology
controls for the potential endogeneity of the entry mode decision in the analysis of the
innovating behavior of subsidiaries. This is important, as our results show, and underscore the
importance of controlling for endogeneity in those studies analyzing entry mode as main
determinant of firms’ strategies or performance, as suggested by Shaver (1998).
146
Regarding the implications for the innovation literature, we contribute to the
understanding of how ownership concentration enhances firm innovation (Belloc, 2011; Choi
et al., 2011, 2012). By drawing attention to the role of MNEs ownership structures (Zhang et
al., 2007; Zhou and Li, 2008), our study reveals that more concentrated ownership ventures
are able to adopt innovations more quickly than those presenting shared ownership. This
evidence complements previous studies and underlines the importance of considering the
ownership structure of subsidiaries as a key driver of innovation and, consequently, of
competitiveness and value creation abroad.
Finally, several issues are presented as they might improve further analysis. On the
one hand, it would be convenient to delve into the understanding of those context factors that
influence MNEs behavior. Specifically, further studies could elaborate a fine-grained
classification of countries, going beyond our dichotomous categorization of developed-
developing economies. Moreover, it would be interesting to evaluate the extent to which
different national dimensions, such as university education density, government efficiency or
supportive innovation infrastructure (Furman et al., 2002), influence firms’ innovation
decisions. On the other hand, our study considers MNEs entry modes as a main determinant
of subsidiaries innovation. Future research would benefit from extending our analysis by
examining not just the antecedents, but also the consequences of subsidiaries innovation. For
instance, the analysis of the extent to which subsidiaries innovation affects their performance
(e.g., sales growth, profitability) could enrich current evidence.
147
4.7. REFERENCES
Anderson, E., Gatignon, H. 1986. Modes of foreign entry: A transaction cost analysis and
propositions. Journal of International Business Studies, 17(3), 1-26.
Barkema H. G., Shenkar O., Vermeulen F., Bell J. H. 1997. Working abroad, working with
others: How firms learn to operate international joint ventures. Academy of Management
Journal, 40(2), 426-442.
Barkema, H. G., Bell, J. H., Pennings, J. M. 1996. Foreign entry, cultural barriers, and
learning. Strategic Management Journal, 151-166.
Belderbos, R. 2003. Entry mode, organizational learning, and R&D in foreign affiliates:
Evidence from Japanese firms. Strategic Management Journal, 24(3), 235-259.
Belloc, F. 2011. Corporate governance and innovation: A survey. Journal of Economic
Surveys, 26(5), 835-864.
Benito, G. R., Gripsrud, G. 1992. The expansion of foreign direct investments: discrete
rational location choices or a cultural learning process? Journal of International Business
Studies, 23(3), 461-476.
Beugelsdijk, S., Kostova, T., Kunst, V. E., Spadafora, E., van Essen, M. 2018. Cultural
distance and firm internationalization: A meta-analytical review and theoretical
implications. Journal of Management, 44(1), 89-130.
Brouthers, K. D. 2002. Institutional, cultural and transaction cost influences on entry mode
choice and performance. Journal of International Business Studies, 33(2), 203-221.
Brouthers, K. D., Brouthers, L. E. 2001. Explaining the national cultural distance paradox.
Journal of International Business Studies, 32(1), 177-189.
148
Brouthers, K. D., Hennart, J. F. 2007. Boundaries of the firm: Insights from international
entry mode research. Journal of Management, 33(3), 395-425.
Canabal, A., White III, G. O. 2008. Entry mode research: Past and future. International
Business Review, 17(3), 267-284.
Chang, S. J., Chung, C. N., Mahmood, I. P. 2006. When and how does business group
affiliation promote firm innovation? A tale of two emerging economies. Organization
Science, 17(5), 637-656.
Chang, S.J., Chung, J., Moon, J. J. 2013. When do wholly owned subsidiaries perform
better than joint ventures? Strategic Management Journal, 34(3), 317–337.
Chang, Y. Y., Gong, Y., Peng, M. W. 2012. Expatriate knowledge transfer, subsidiary
absorptive capacity, and subsidiary performance. Academy of Management Journal, 55(4),
927-948.
Choi, S. B., Lee, S. H., Williams, C. 2011. Ownership and firm innovation in a transition
economy: Evidence from China. Research Policy, 40(3), 441-452.
Choi, S. B., Park, B. I., Hong, P. 2012. Does ownership structure matter for firm
technological innovation performance? The case of Korean firms. Corporate Governance:
An International Review, 20(3), 267-288.
Chung, H. M., Dahms, S. 2018. Ownership Strategy and Foreign Affiliate Performance in
Multinational Family Business Groups: A Double-edged Sword. Journal of International
Management.
Coad, A., Rao, R. 2008. Innovation and firm growth in high-tech sectors: A quantile
regression approach. Research Policy, 37(4), 633-648.
Coase, R.H. 1937. The nature of the firm. Economica 4(16): 386–405.
149
Cuervo‐Cazurra, A. 2012. Extending theory by analyzing developing country multinational
companies: Solving the Goldilocks debate. Global Strategy Journal, 2(3), 153-167.
Damanpour F., Gopalakrishnan S. 2001. The dynamics of the adoption of product and
process innovations in organizations. Journal of Management Studies, 38(1), 45-65.
Das, T. K., Teng, B. S. 1998. Resource and risk management in the strategic alliance
making process. Journal of Management, 24(1), 21-42.
Demirbag, M., Glaister, K. W., Tatoglu, E. 2007. Institutional and transaction cost
influences on MNEs’ ownership strategies of their affiliates: Evidence from an emerging
market. Journal of World Business, 42(4), 418-434.
Demirbag, M., Tatoglu, E., Glaister, K. W. 2009. Equity-based entry modes of emerging
country multinationals: Lessons from Turkey. Journal of World Business, 44(4), 445-462.
Dikova, D., Van Witteloostuijn, A. 2007. Foreign direct investment mode choice: entry
and establishment modes in transition economies. Journal of International Business
Studies, 38(6), 1013-1033.
Eden, L. Miller, S. R. 2004. Distance matters: Liability of foreignness, institutional
distance and ownership strategy. In " Theories of the Multinational Enterprise: Diversity,
Complexity and Relevance" (pp. 187-221). Emerald Group Publishing Limited.
Erramilli, M. K., Rao, C. P. 1993. Service firms' international entry-mode choice: A
modified transaction-cost analysis approach. The Journal of Marketing, 19-38.
Erramilli, M.K., Agarwal, S., Kim, S.S. 1997. Are firm-specific advantages location-
specific too? Journal of International Business Studies, 28(4), 735–757.
Fagerberg, J., Mowery, D.C. and Nelson, R.R. (eds). 2005. The Oxford Handbook of
Innovation. Oxford: Oxford University Press.
150
Fagerberg, J., Srholec, M. 2008. National innovation systems, capabilities and economic
development. Research Policy, 37(9), 1417-1435.
Fisman R, Khanna T. 2004. Facilitating development: the role of business groups. World
Development 32, 609-628.
Furman, J. L., Porter, M. E., Stern, S. 2002. The determinants of national innovative
capacity. Research Policy, 31(6), 899-933.
García-Manjón, J. V., Romero-Merino, M. E. 2012. Research, development, and firm
growth. Empirical evidence from European top R&D spending firms. Research Policy,
41(6), 1084-1092.
Gatignon, H., Anderson, E. 1988. The multinational corporation's degree of control over
foreign subsidiaries: An empirical test of a transaction cost explanation. Journal of Law,
Economic, and Organization, 4(2), 305-336.
Guillén, M. F., García-Canal, E. 2009. The American model of the multinational firm and
the “new” multinationals from emerging economies. The Academy of Management
Perspectives, 23(2), 23-35.
Håkanson, L., Ambos, B. 2010. The antecedents of psychic distance. Journal of
International Management, 16(3), 195-210.
Heckman, J. 1979. Sample selection bias as a specification error. Econometrica 47, 153-
161.
Hofstede, G. (1980). Culture’s consequences. New York: Sage
Hoskisson, R. E., Eden, L., Lau, C. M., Wright, M. 2000. Strategy in emerging economies.
Academy of Management Journal, 43(3), 249-267.
151
Hoskisson, R. E., Wright, M., Filatotchev, I., Peng, M. W. 2013. Emerging multinationals
from mid‐range economies: The influence of institutions and factor markets. Journal of
Management Studies, 50(7), 1295-1321.
Hutzschenreuter, T., Voll, J. C., Verbeke, A. 2011. The impact of added cultural distance
and cultural diversity on international expansion patterns: A Penrosean perspective.
Journal of Management Studies, 48(2), 305-329.
Johanson, J., Vahlne, J. E. 1977. The internationalization process of the firm-A model of
knowledge development and increasing foreign market commitments. Journal of
International Business Studies, 8, 23-32.
Khanna T, Palepu K. 1997. Why focused strategies may be wrong for emerging markets.
Harvard Business Review, 75(4), 41-48.
Khanna T, Palepu K. 2010. Winning in Emerging Markets: A Road Map for Strategy and
Execution. Harvard Business School Press: Boston, MA.
Kogut, B., Singh, H. 1988. The effect of national culture on the choice of entry mode.
Journal of International Business Studies, 19(3), 411-432.
Liou, R. S., Chao, M. C. H., Yang, M. 2016. Emerging economies and institutional quality:
Assessing the differential effects of institutional distances on ownership strategy. Journal
of World Business, 51(4), 600-611.
López-Duarte, C., Vidal-Suárez, M. M. 2013. Cultural distance and the choice between
wholly owned subsidiaries and joint ventures. Journal of Business Research, 66(11), 2252-
2261.
Mathews, J. A. 2006. Dragon multinationals: New players in 21st century globalization.
Asia Pacific Journal of Management, 23(1), 5-27.
152
Meyer, K. E., Estrin, S. 2001. Brownfield entry in emerging markets. Journal of
International Business Studies, 32(3), 575-584.
Meyer, K. E., Peng, M. W. 2016. Theoretical foundations of emerging economy business
research. Journal of International Business Studies, 47(1), 3-22.
Mutinelli, M., Piscitello, L. 1998. The entry mode choice of MNEs: an evolutionary
approach. Research Policy, 27(5), 491-506.
Padmanabhan, P., Cho, K. R. 1996. Ownership strategy for a foreign affiliate: An
empirical investigation of Japanese firms. Management International Review, 36, 45-65.
Peng, M. W. 2012. The global strategy of emerging multinationals from China. Global
Strategy Journal, 2(2), 97-107.
Porter, M. E. 1990. Competitive advantage of nations. New York: The Free Press.
Ramamurti, R. 2012. What is really different about emerging market multinationals?.
Global Strategy Journal, 2(1), 41-47.
Robertson, T. S., Gatignon, H. 1998. Technology development mode: a transaction cost
conceptualization. Strategic Management Journal, 19(6), 515-531.
Root, Franklin J. 1983. Foreign Market Entry Strategies, New York: AMACON.
Schumpeter, J.A. 1934.The Theory of Economic Development. Cambridge, MA: Harvard
University Press.
Schumpeter, J.A. 1942. Capitalism, Socialism and Democracy. New York: Harper and
Row.
Shaver, J. M. 1998. Accounting for endogeneity when assessing strategy performance:
does entry mode choice affect FDI survival? Management Science, 44(4), 571-585.
153
Shinkle G.A., McCann B. T. 2014. New product deployment: The moderating influence of
economic institutional context. Strategic Management Journal, 35(7), 1090-1101.
Subramanian A., Nilakanta S. 1996. Organizational innovativeness: Exploring the
relationship between organizational determinants of innovation, types of innovations, and
measures of organizational performance. Omega, 24, 631–47.
Tihanyi, L., Griffith, D. A., Russell, C. J. 2005. The effect of cultural distance on entry
mode choice, international diversification, and MNE performance: A meta-analysis.
Journal of International Business Studies, 36(3), 270-283.
Tsang, E. W., Yip, P. S. 2007. Economic distance and the survival of foreign direct
investments. Academy of Management Journal, 50(5), 1156-1168.
Varsakelis, N. C. 2006. Education, political institutions and innovative activity: A cross-
country empirical investigation. Research Policy, 35(7), 1083-1090.
Williamson, O. E. 1975. Markets and hierarchies: analysis and antitrust implications: a
study in the economics of internal organization.
Williamson, O. E. 1985. The Economic Institutions of Capitalism. Free Press, New York.
Zhang, Y., Li, H., Hitt, M. A., Cui, G. 2007. R&D intensity and international joint venture
performance in an emerging market: Moderating effects of market focus and ownership
structure. Journal of International Business Studies, 38(6), 944-960.
Zhao, H., Luo, Y., Suh, T. 2004. Transaction cost determinants and ownership-based entry
mode choice: A meta-analytical review. Journal of International Business Studies, 35(6),
524-544.
154
Zhou, C., Li, J. 2008. Product innovation in emerging market-based international joint
ventures: An organizational ecology perspective. Journal of International Business
Studies, 39(7), 1114-1132.

155
Chapter 5.
SUMMARY AND CONCLUSIONS
156
5.1. SUMMARY AND CONCLUSIONS
This dissertation comprises five chapters. The introduction developed in Chapter
1 aims at showing the main objectives of this thesis. Chapters 2, 3 and 4 aim to offer
theoretical arguments as well as empirical evidence to expand current knowledge on
firms’ entry timing and entry mode decisions. Finally, Chapter 5 provides an overview
of this dissertation by presenting a brief summary. Particularly, it highlights the
objectives proposed and the main conclusions and contributions that can be drawn from
each of them.
Chapter 1 presents the introduction of the dissertation, which is divided in four
sections. The first section aims at motivating the research questions that are addressed
in the studies presented in the following chapters. We show that strategic decisions on
market entry are crucial in determining organizations’ competitiveness and success.
Given its importance, a wide body of research has shown interest in analyzing the effect
of entry-timing decisions on firm performance (Zachary et al., 2015) and the
determinants of multinationals entry mode decisions when going abroad (e.g., Mutinelly
and Piscitello, 1998). Despite extensive research, both conceptual development and
further empirical evidence are needed in both lines of research. This dissertation aims to
provide new insights on conflicting evidence shown in previous research by addressing
different gaps in the following chapters.
The second section presents the structure of the dissertation. Then, the
theoretical frameworks used in Chapters 2, 3 and 4 are presented. Finally, the forth
section describes the evolution of the mobile industry, highlighting its increasing
worldwide social and economic importance worldwide, as well as its suitability to
analyze firms’ market entry decisions.
157
Chapter 2, “Does order of entry determine competitive strategies? An analysis of
European mobile operators”, has analyzed the effect of the order of entry on the
competitive strategies implemented by firms. Traditional studies on the entry-timing
literature have analyzed the impact of the order of entry on the achievement of
competitive advantages (Fosfuri et al., 2013; Lieberman and Montgomery, 1988; 2013;
Zachary et al., 2015). Despite a considerable body of research focused on analyzing the
benefits of entering first, there is still a lack of consensus on empirical evidence (Suarez
and Lanzolla, 2007). To clarify mixed results on this issue, Chapter 2 highlights the
importance of entry-timing decisions in determining firms’ competitive strategies. In
particular, the theoretical model proposes that first-movers will be more likely to follow
a differentiation strategy in the initial stages of the market because of two main reasons.
First, differentiation strategies will offer a better fit with consumers’ characteristics and
demands in the early stages of the industry life cycle. Second, differentiation strategies
will be also consistent with the isolating mechanisms that give rise to first-mover
advantages. Besides, Chapter 2 considers the way in which the industry life cycle
affects the evolution of firms’ strategy. As a way to readapt their strategy to new market
demands, this chapter proposes that, over time, pioneers will be more likely to modify
their strategy towards a hybrid one.
The empirical analysis is based on the whole population of mobile
telecommunication operators that compete in 33 European countries between 2000 and
2016. The empirical evidence shows that pioneers are able to offer greater quality in
their services and charge superior prices than followers. Surprisingly, they present better
cost structures, which suggests that first-movers enjoy a hybrid position in the initial
stages of market development. Contrary to our expectations, the pioneer is shown to
gradually worse its position as a cost leader over time. Moreover, the results confirm
158
that second entrants evolve towards a more advantageous position as they are able to
reduce the gap between them and pioneers in terms of quality, price and cost positions.
Overall, Chapter 2 has several contributions to the first-mover advantage
literature. In line with the theoretical model, pioneers seem to be able to create value
through an alignment of certain competitive strategies and the isolation mechanisms that
are enabled by an early entry in the market. The pattern discovered between the order of
entry and the competitive strategy chosen by each cohort of entrants reveals the
relevance of considering the strategy followed by firms when studying entry-timing
advantages. Moreover, the empirical evidence from Chapter 2 provides new insights on
the sustainability of first-mover advantages over time by taking into account how
strategies evolve. In particular, we find the advantageous positions shown initially by
pioneers are eroded as time goes by. More importantly, the results reveal key insights
regarding how followers reduce the competitive advantages of entering first. In
particular, second entrants are able to improve their relative quality position more
quickly than pioneers, while suffering less from price erosion. This evidence expands
current knowledge on how first-mover advantages are eroded.
Chapter 3, “How to defeat early entrants: The role of competitive strategy and
industry dynamism on early mover advantages in the telecommunications industry”,
moves Chapter 2 forward by analyzing whether the competitive strategies play a role in
the theory of first mover advantages. It studies whether the best competitive strategy for
each cohort of entrants is the most profitable option for them. In particular, early movers
are expected to obtain greater profitability by using differentiation-like strategies,
whereas cost leadership will be the best option for followers. Chapter 3 also advances
the entry-timing agenda by addressing the effect of environmental factors on the
maintenance of first-mover advantages (Fosfuri et al., 2013; Suarez and Lanzolla,
159
2007). The pace of industry dynamism is suggested to influence the effectiveness of the
strategies implemented by followers to erode early-movers advantages. In particular, the
effectiveness of cost leadership is expected to be higher for followers in context of
greater market growth, whereas cost strategies are expected to be less effective in
industries showing a higher pace of technological change.
The empirical analysis in Chapter 3 considers a total of 67 mobile operators
competing in 18 European countries from 2006 to 2017. The empirical evidence
confirms the existence of early mover advantages, as those firms that enter the market in
first place achieve greater performance levels than followers. Chapter 3 also reveals that
the order of entry is more important than competitive strategies as a predictor of firms’
profitability. The fact of using one or another strategy makes little difference on early
mover’s performance. Conversely, competitive strategies do matter for followers, being
cost leadership the strategy more profitable for them. Finally, the moderating role of
industry dynamism is confirmed in the expected direction. Whereas a cost leadership
position is shown to be more effective in contexts of high market growth, differentiation
strategies seem to be as useful as cost strategies when technology evolves rapidly.
Three main theoretical contributions can be drawn from evidence in Chapter 3.
First, it advances knowledge on the order of entry-performance relationship by
examining how competitive strategies influence the way early entrants create and
maintain their advantages over time. In that regard, Chapter 3 addresses current
demands by explicitly considering the competitive strategies used to exploit of first-
mover advantages. Second, this chapter contributes to the emerging body of research
interested in analyzing how followers compete to beat early entrants. The comparative
study developed offers valuable insights into the competitive positions that followers
should pursue to reduce the performance gap with early movers. Finally, the
160
incorporation of environmental factors complements current research on the effect of
industry dynamics on the persistence of early mover advantages.
Chapter 4, “Entry mode and innovation adoption of multinational firms: The
effect of cultural distance and home/host country development”, focuses on the
international business perspective. It addresses recent claims related to the potential
determinants of multinational enterprises (MNEs) strategic decisions when expanding
abroad. In particular, Chapter 4 delves into the examination of two main ideas.
First, international business studies have broadly examined the effect that the
cultural distance between home and host countries have on MNEs entry mode decision.
Despite the broadly accepted idea that cultural distance has a negative impact on the
degree of control demanded by foreign investor (Mutinelly and Piscitello, 1998), the
empirical evidence remains contradictory. Taking into account the mixed evidence on
this issue, Chapter 4 considers the moderating effect of a MNE’ country of origin. As a
result of cross country differences in social, regulatory or economic factors (Cuervo-
Cazurra, 2012), MNEs from developing and developed economies are expected to
behave differently in their internationalization process. In particular, it is proposed that
the positive effect of cultural distance on the probability of choosing a shared ownership
entry mode (vs. a full ownership entry mode) will be lower for MNEs from developed
countries.
Second, Chapter 4 addresses current gaps in the literature by analyzing what
happens after the entry mode choice has been made (Canabal and White, 2008). In
particular, this chapter expands current knowledge on how subsidiaries compete and
create value in foreign markets (Meyer and Peng, 2016) by analyzing the effect of entry
mode on its innovation behavior. Based on arguments from the transaction cost theory,
161
shared owned subsidiaries are expected to show a lower adoption speed of innovations
than fully owned ventures. Finally, the moderating role of the host country development
in reducing potential opportunism is considered.
The data set used to carry out the empirical analysis consists of a total of 18
multinational groups operating in 91 countries during the period 2000-2017. Overall,
the empirical evidence mostly confirms the hypotheses proposed in Chapter 4.
However, contrary to our expectations, the moderating role played by the development
of the host country on the entry mode-innovation relationship does not find support.
Overall, the contributions than can be drawn from Chapter 4 are the following.
First, this chapter refines prior theoretical arguments by considering the key role of
country conditions in shaping how MNEs behave when entering foreign markets. It
contributes to the emerging body of research that focuses on analyzing the patterns of
MNEs internationalization by taking into account the development of the home country.
Moreover, Chapter 4 advances research by integrating the entry mode and the
innovation literatures. In that regard, it expands current knowledge on MNEs post-entry
behavior, while contributing to the analysis of the determinants of innovation by
considering the role of ownership concentration.
162
5.2. REFERENCES
Canabal, A., White III, G. O. 2008. Entry mode research: Past and future. International
Business Review, 17(3), 267-284
Cuervo‐Cazurra, A. 2012. Extending theory by analyzing developing country
multinational companies: Solving the Goldilocks debate. Global Strategy Journal, 2(3),
153-167.
Fosfuri, A., Lanzolla, G., Suarez, F. F. 2013. Entry-timing strategies: the road ahead. Long
Range Planning, 46(4), 300-311.
Lieberman, MB., Montgomery, DB. 1988. First‐mover advantages. Strategic
Management Journal, 9(S1), 41-58.
Lieberman, M.B., Montgomery, D.B., 2013. Conundra and progress: research on entry
order and performance. Long Range Planning, 46 (4-5), 312e324.
Meyer, K. E., Peng, M. W. 2016. Theoretical foundations of emerging economy business
research. Journal of International Business Studies, 47(1), 3-22.
Mutinelli, M., Piscitello, L. 1998. The entry mode choice of MNEs: an evolutionary
approach. Research Policy, 27(5), 491-506.
Suarez, F.F., Lanzolla G. 2007. The role of environmental dynamics in building a first
mover advantage theory. Academy of Management Review, 32(2), 377-392.
Zachary, M. A., Gianiodis, P. T., Payne, G. T., Markman, G. D. 2015. Entry Timing
Enduring Lessons and Future Directions. Journal of Management, 41 (5), 1388-1415.