Embed Size (px)
Citation preview

DOCUMENT RESUME
ED 037 351 SE 008 091
AUTHOR White, Arthur L.TITLE The Development of Models to Explain the Relation of
Important Variables to Laboratory InstructionalStrategies.
INSTITUTION Ohio State Univ., Columbus.PUB DATE Mar 70NOTE 43p.; Paper presented at Annual Meeting of the
National Association for Research in ScienceTeaching (43rd, Minneapolis, Minne., March 5-8, 1970)
EDRS PRICEDESCRIPTORS
EDRS Price MF-$0.25 HC-$2.25*Inductive Methods, *Instruction, *LaboratoryProcedures, Lecture, School Conditions, *SecondatySchool Science, Student Characteristics, TeacherCharacteristics, Teaching Methods
ABSTRACTModels were developed to identify important
variables and their causal relationships to strategies of laboratoryinstruction in secondary school science: Data from studentchecklists, questionnaires, tests, and direct observations oflaboratory activities were factor analyzed. Two teaching strategiesidentified by factor analysis were Inductive-Indirect Teaching andLecture Method. Eighteen other factors were included in path analysesused to postulate and test the fit of models for the causal effect ofthe other factors on the two teaching strategies: Factors identifiedas causally related to teaching strategies were Instructional Load,Educational Level (of students), Teacher Morale, Academic Preparationof Teacher, School Size, Student Attitude, Budget, and Age ofCurriculum. Educational level of students had a negative effect onboth strategies, suggesting that teachers in the upper grades providestudents with more written materials so that the amount of teachertalk is not necessarily a valid indicator of the degree to which ateacher uses an inductive-indirect strategy. Teacher Morale had apositive effect on inductive-indirect strategy and a negative effecton Lecture Method. (EB)

FEB 2 6 1970
The Development of Models
To Explain The Relation Of Important Variables
To Laboratory Instructional Strategies
DEPARTMENT OF HEALTH. EDUCATION i WELFARE
OFFKE OF EDUCATION
THIS DOCUMENT HAS SEEN REPRODUCED EXACTLY AS RECEIVED FROM THE
PERSON OR ONIMUTION MUTING IT. POINTS Of VIEW OR OPINIONS
STATED DO NOT NECESSAPIAY REPRESENT OFFICIAL OFFICE OF EDUCATION
POSITION OR POLICY.
Arthur L. White
The Ohio State University
A paper presented at the annual conventionof the National Association for Research in Science Teaching
Minneapolis, Minnesota, March 5-8, 1970

Science educators have studied a variety of teaching methods in search
of the most effective combination for promoting learning by the students.
Most school learning is aimed at transfer from limited classroom experiences
to practical applications under new conditions. One of the functions of
science courses as given by Cronbach (1963) is to develop what are sometimes
called "scientific" patterns of thought. It would be futile to try to
duplicate all of the significant situations where a particular idea or
skill would be used. A question that science educators must investigate
is "How can science teaching methods be combined and modified to improve
the transfer probability of what students learns?"
Importance of Study
The study of this problem has centered around comparison of laboratory-
centered and lecture-demonstration centered methods of science instruction
and comparison of direct-expository teaching as opposed to indirect-inductive
strategies. Much of the accumulated research in these areas is difficult
to interpret because of many conflicting and contradictory results.
This dilemma is due to the confounding of the data by the use of a
variety of methods and strategies within the laboratory treatment groups.
There may be more variance within the laboratory method of instruction and
between the different strategies used than there is between the methods of
lecture-demonstration and laboratory instruction.
The lack of reproducibility in studies comparing the effectiveness of
lecture-demonstration methods and laboratory methods of science teaching may
well be due to the lack of control of variables related to the strategies
used. The confounding factors involved in the variety of strategies used
must be identified and their relationships resolved before they can be

effectively controlled in experimental work.
"Until a learning theory of laboratory methodology is clearlydefined the results of studies of laboratory methods and othermethods of teaching will continue to be contradictory, unpat-terned and fragmented." (Hurd: 1964, p. 288).
This study was designed to develop models to explain the causal
relationships of teacher, student, administrative, environmental, and class
activity variables to the laboratory instructional strategies used in
secondary school science classes.
Research comparing two or more methods of instruction too often
involve variation in content, instructors, and other variables as well as
method. Any differences in student performance on a criterion measure may
be due to differences other than method differences. The availability of
data processing equipment makes large scale analysis with many factors
highly practical. In science education, possible interactions between
content, method, age, and ability levels may be at least as important as
the main effects themselves. Studies by Knox (1935), Johnson (1928),
White (1943), Lucow (1954) and Ward (1956) were related to the differential
effects of treatment on different ability levels of students. No recent
studies using higher order factorial designs with random assignment of
subjects to treatment groups were found. Before designs of this nature are
used it is first necessary to identify the crucial variables underlying the
teaching- learning processes.
There is a need for more and better instrumentation for measuring
the expected outcomes of science instruction. Better observational techniques
are needed to accurately and objectively assess the characteristics of
classroom practices and instructional activities. General subjective ratings
and opinions have some value but the reliability of such measures is low and

-3-
objective instruments should be used when possible. Finally the causal
influences of learning conditions need to be identified so that patterns
can be recognized and interpreted. If questions are to be answered con-
cerning the value of one strategy of laboratoryinstruction compared to
another it is necessary to have a clear conception of what the strategies
are and how they can be identified.
Laboratory strategies are influenced by a great number of variables
in a variety of ways. Models for the causal relationships of these variables
and the strategies of instruction used can be tested and continually
improved upon by use of a combination of multivariate techniques such as
factor analysis and path analysis.
These models should help to clarify the role of the major variables
affecting particular strategies of laboratory instruction by describing thepatterns and sequences of their influence in producing the characteristics
of the instructional strategies being considered.
Basic Assumptions
This study is directed toward two strategies of laboratory instruction.
One is the expository-direct approach where students are passive learners
and the other an inductive-indirect approach where students are active
learners. Learning is demonstrated by students as a change in behavior
as a result of experience. If these experiences are the product of activitiesthat are organized and highly structured such that students are told what is
to be learned, the students are considered to be passive learners. On the
*otherhand if these experiences are a result of student planning and
participation with a minimum of teacher involvement, the students tend to
be active learners.
-4-
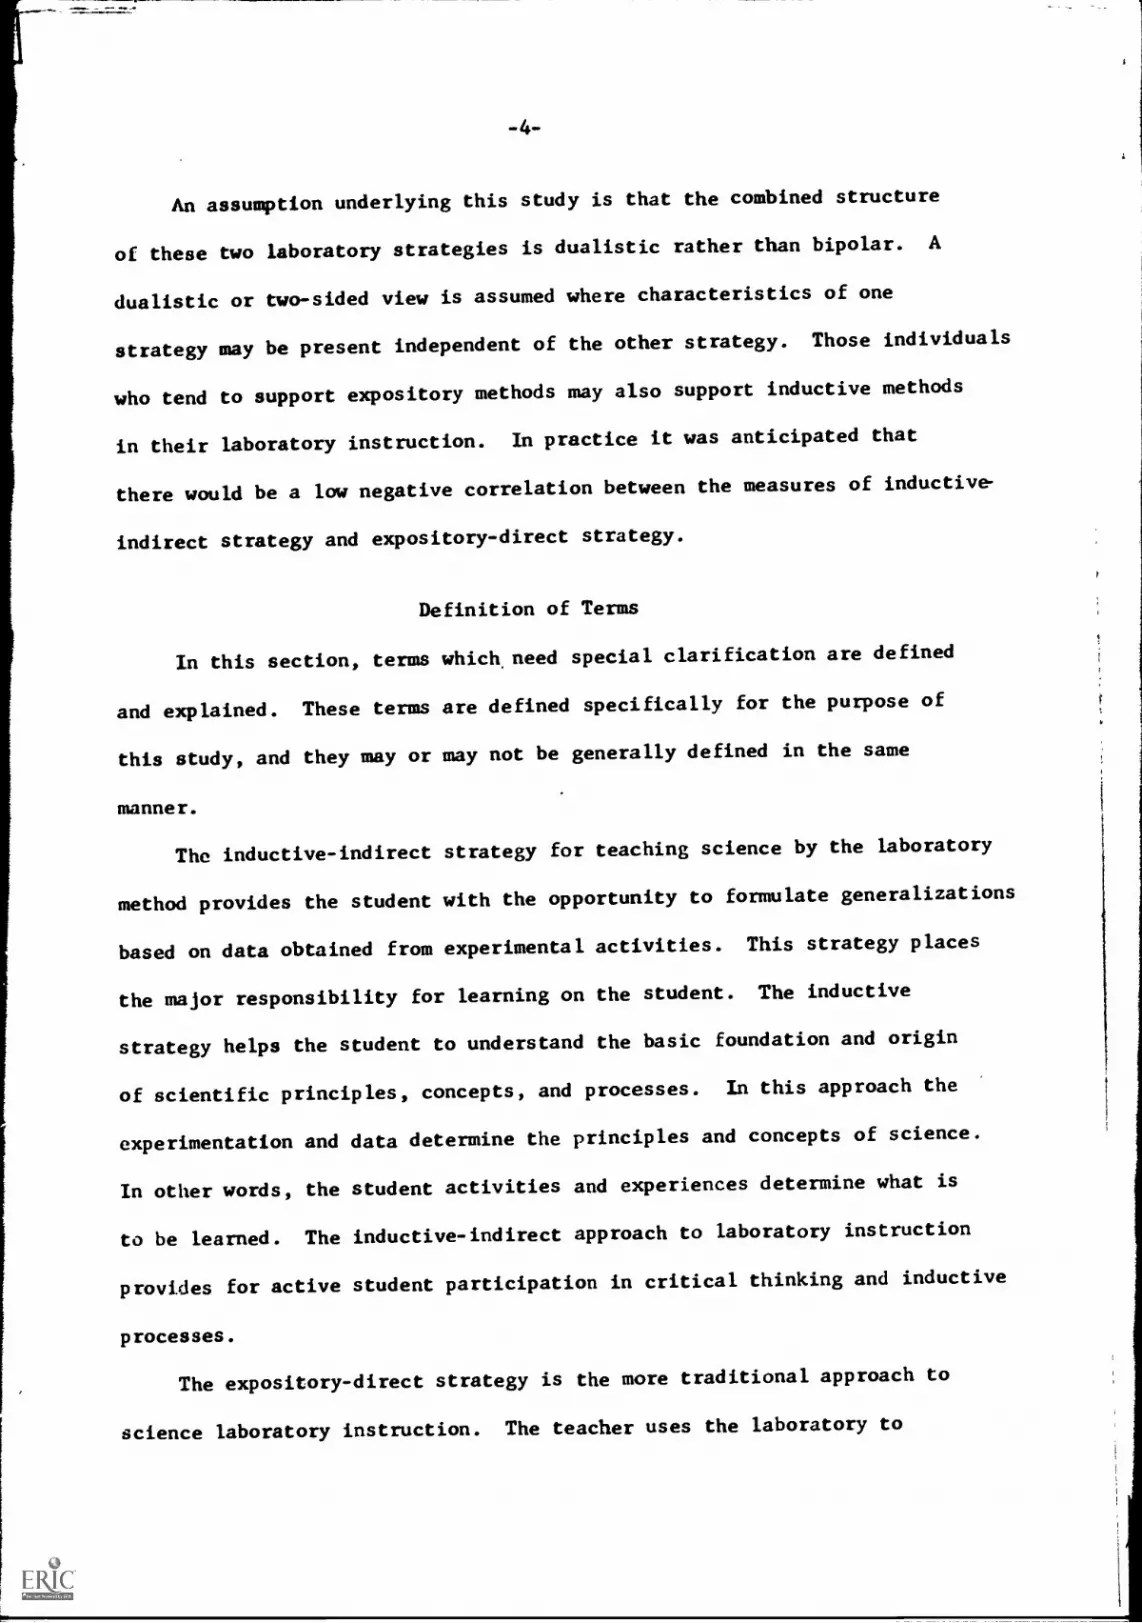
An assumption underlying this study is that the combined structure
of these two laboratory strategies is dualistic rather than bipolar.
dualistic or two-sided view is assumed where characteristics of one
strategy may be present independent of the other strategy. Those individuals
who tend to support expository methods may also support inductive methods
in their laboratory instruction. In practice it was anticipated that
there would be a low negative correlation between the measures of inductive-
indirect strategy and expository-direct strategy.
A
Definition of Terms
In this section, terms which, need special clarification are defined
and explained. These terms are defined specifically for the purpose of
this study, and they may or may not be generally defined in the same
manner.
The inductive-indirect strategy for teaching science by the laboratory
method provides the student with the opportunity to formulate generalizations
based on data obtained from experimental activities. This strategy places
the major responsibility for learning on the student. The inductive
strategy helps the student to understand the basic foundation and origin
of scientific principles, concepts, and processes. In this approach the
experimentation and data determine the principles and concepts of science.
In other words, the student activities and experiences determine what is
to be learned. The inductive-indirect approach to laboratory instruction
provides for active student participation in critical thinking and inductive
processes.
The expository-direct strategy is the more traditional approach to
science laboratory instruction. The teacher uses the laboratory to

-5-
illustrate established scientific principles and to verify facts previously
learned by the students during classroom discussions and lectures. This
strategy places the responsibility for what is learned with the teacher while
the student is placed in a more passive role than in the inductive-indirect
strategy.
The teacher employing this approach uses the principles and concepts
of science to determine the means and type of experimentation. In this
approach certain results are expected and experimental designs and techniques
are manipulated by the teacher so as to obtain these results. A basic
assumption of the expository-direct strategy is that the existing knowledge
is sound, and consequently students are rarely encouraged to challenge the
limitations of the present paradigms.
The expository-direct strategy is based on the simple and compelling
fact that often the best way to teach students something is to tell it to
them.
According to the dualistic nature of these approaches assumed by this
study the presence of properties describing one strategy does not
automatically exclude or include the presence of properties describing the
other strategy. In practice most laboratory instructional situations are
expected to include a composite of activities related in varying degrees to
inductive-indirect and expository-direct approaches.
General Plan of Procedures
The major purpose of this study is to develop causal models relating
to inductive-indirect and expository-direct laboratory teaching strategies
in science at the secondary level. These models should serve to identify
variables critical to the nature of the laboratory strategy used and to

-6-
clarify the effect of these variables upon the laboratory learning conditions.
To accomplish this purpose the procedures followed were:
1. Development of instruments to measure the degree of inductive-indirect and expository-direct strategy used in a laboratory
situation.
2. Identification and measurement of the relevant variables whichcontribute to the character of the laboratory strategy used.
3. Formulation of causal models for explaining the order andmagnitude of the influence of the relevant variables on thelaboratory method used.
Preparation of Student Checklist
No standardized instrument is available which measures the degree of
inductive-indirect or expository-direct strategy used in a laboratory
teaching situation. An instrument was constructed for this purpose.
The instrument developed was a student checklist consisting of items
describing laboratory activities and procedures characteristic of the
strategy being assessed. The checklist included twenty-two items character-
istic of expository-direct laboratory strategy and twenty-three characteristic
of inductive-indirect strategy. Barnes (1967) and Kochendorfer (1967)
developed similar student checklists to identify classroom and laboratory
practices in high school biology. The major purpose of the checklist
items was to determine what activities are included in the science laboratory
as viewed by the students. Regardless of either the teacher's or observer's
judgement, the perception of the activity by the students is what determines
its effective character. A score representing the degree of expository-
direct strategy was determined for each laboratory situation by totaling
the number of "yes" responses to the expository scale. Likewise, the degree
of inductive-indirect strategy was determined by summing the number of
"yes" responses to items on the inductive scale.
- 7-
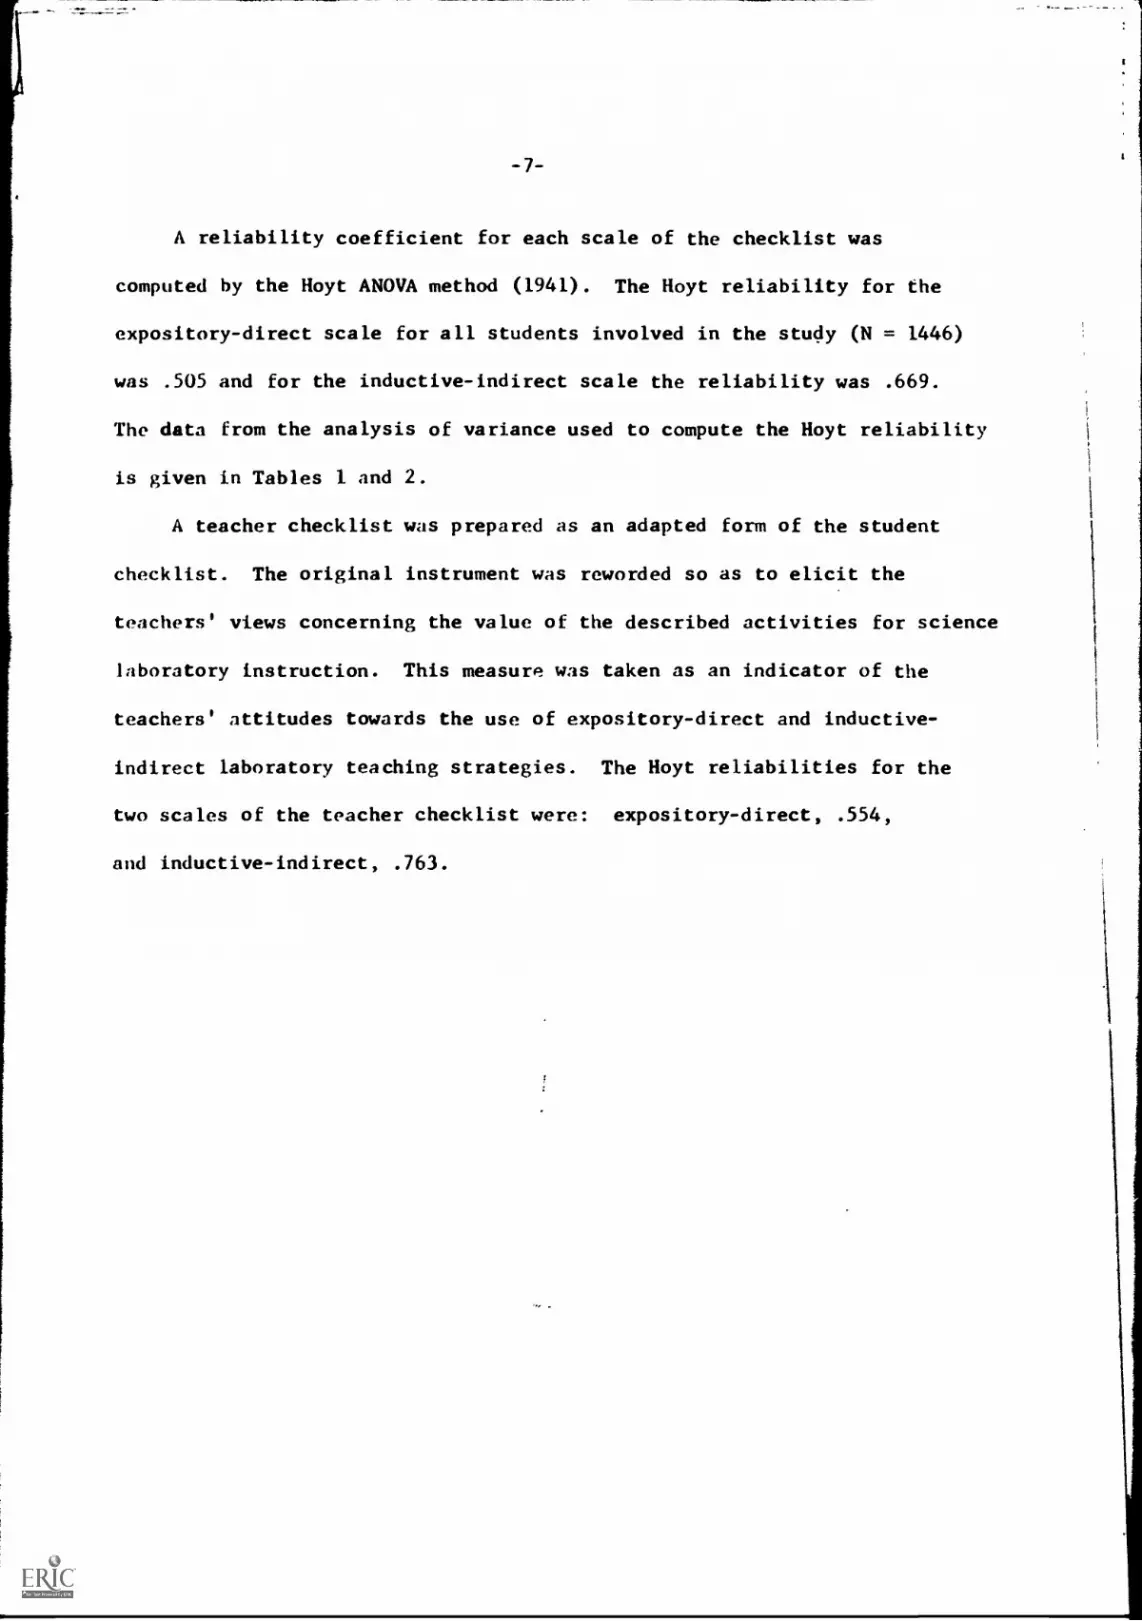
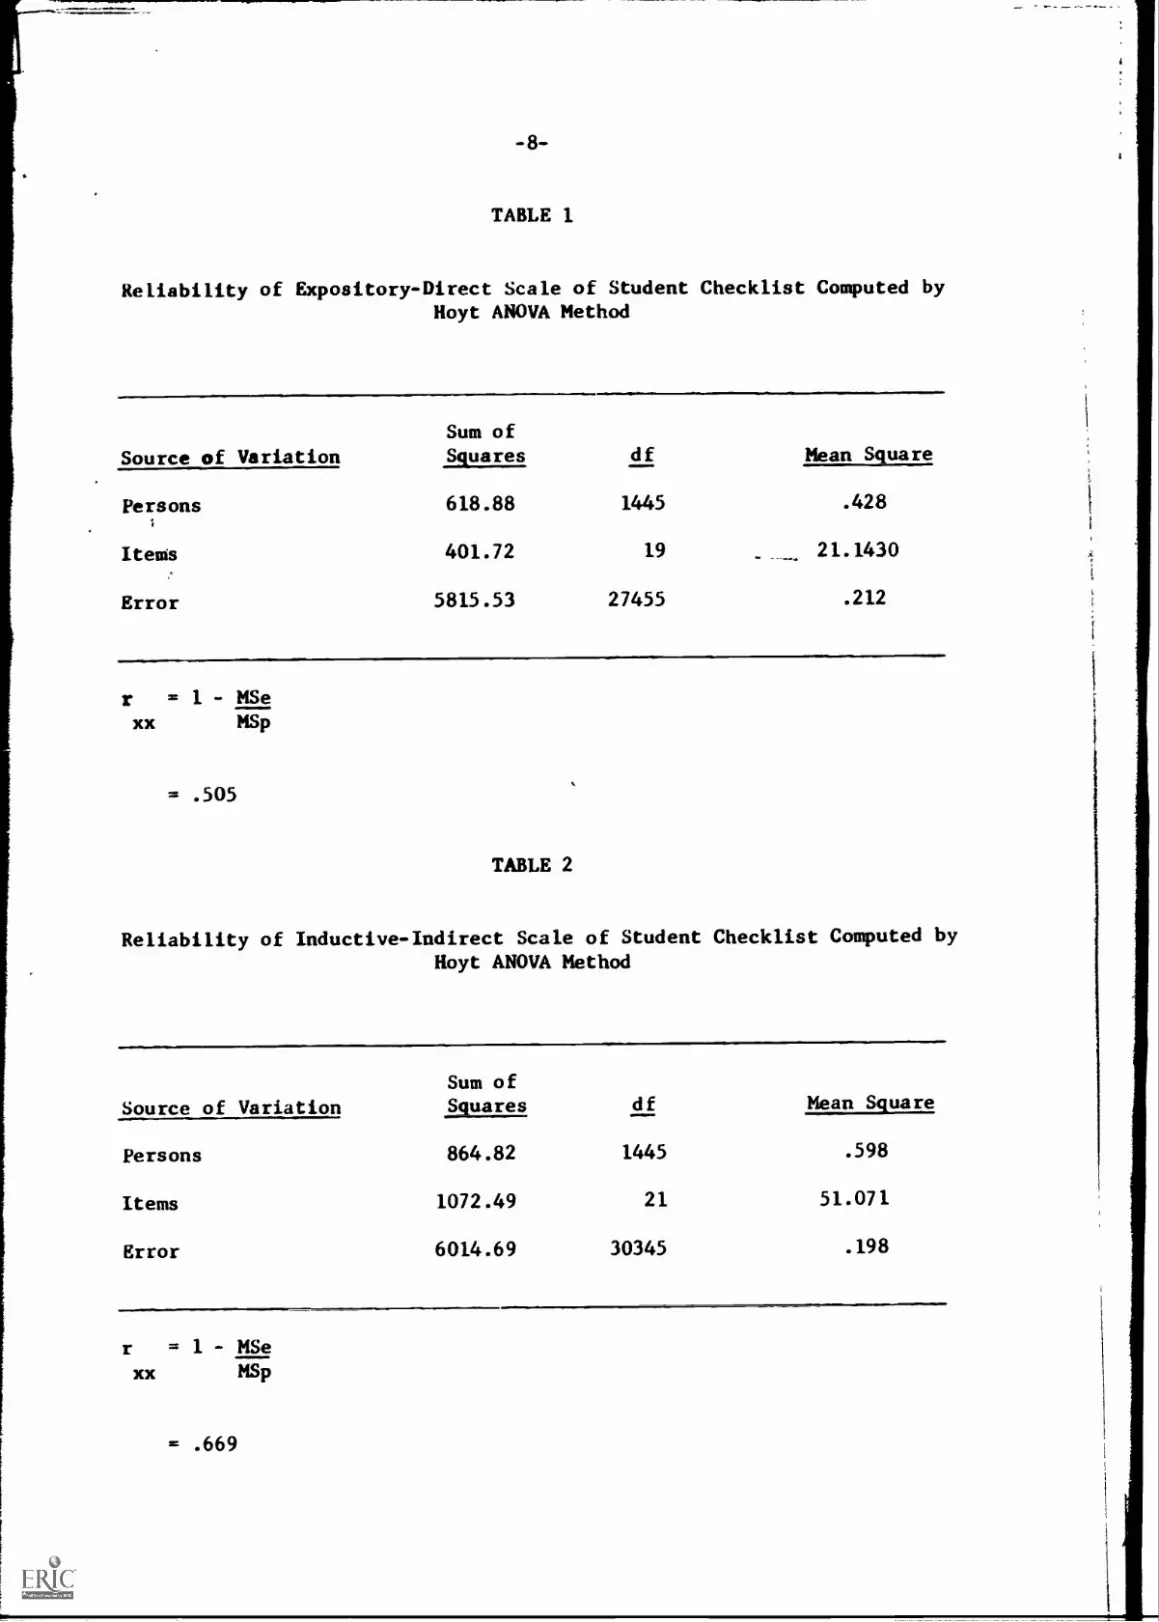
A reliability coefficient for each scale of the checklist was
computed by the Hoyt ANOVA method (1941). The Hoyt reliability for the
expository-direct scale for all students involved in the study (N = 1446)
was .505 and for the inductive-indirect scale the reliability was .669.
The data from the analysis of variance used to compute the Hoyt reliability
is given in Tables 1 and 2.
A teacher checklist was prepared as an adapted form of the student
checklist. The original instrument was reworded so as to elicit the
teachers' views concerning the value of the described activities for science
laboratory instruction. This measure was taken as an indicator of the
teachers' attitudes towards the use of expository-direct and inductive-
indirect laboratory teaching strategies. The Hoyt reliabilities for the
two scales of the teacher checklist were: expository-direct, .554,
and inductive-indirect, .763.
-8-
TABLE 1
Reliability of Expository-Direct Scale of Student Checklist Computed byHoyt ANOVA Method
Source of Variation
Sum of
JSRSESA df Mean Square
Persons 618.88 1445 .428
Items 401.72 19 . 21.1430
Error 5815.53 27455 .212
r = 1 - MSexx MSp
= .505
TABLE 2
Reliability of Inductive-Indirect Scale of Student Checklist Computed by
Hoyt ANOVA Method
Sum of
Source of Variation Squares df Mean Square
Persons 864.82 1445 .598
Items 1072.49 21 51.071
Error 6014.69 30345 .198
r = 1 - MSe
xx MSp
= .669

-9-
The Sample and the Population
This study was made during the spring of 1969 in the Boulder Valley
Schools. 1446 studentsamd57 teachers in 12 school buildings participated
in the study. The sample was comprised of thirty-two junior high school
classes (grades 7 thru 9) and twenty-five high school classes (grades 10
thru 12). The subject matter content of the classes included biology,
earth science, physical science,anatomy, advanced biology, physics, chemistry,
geology, and physical science. The size of the schools selected for the
study rangeiffrom 163 to 1608. The communities serviced by the schools
included a small mountain community, the large urban community of Boulder,
two small rural farming and coal mining communities, and one community
comprised to a large extent of families in which the wage earner commutes
to his place of employment.
The Boulder Valley is heavily populated with various scientific and
technological business corporations. The presence of the University of
Colorado and the many corporations holding government contracts for
scientific projects tends to make the community very science conscious.
The average I.Q. for the students in this study was 118.351.
Selection of Variables
Variables considered important to the nature of science Listruction
in the classroom were discussed in studies by Cunningham (1946), Colyer
and Anderson (1952), Novak (1963), Rutledge (1966), Blankenship (1967),
'Composite on Lorge Thorndike Test of Intelligence.
1
A

-10-
Hurd and Rowe (1964), and Kleinman (1965). This previous research was
used as guidance for the selection of variables to be included in the study.
The variables selected were identified by five major categories: student
characteristics, teacher characteristics, environmental and administrative
conditions, materials, and instructional variables such as student
activities.
Sixty-five variables were measured by the use of the following
instruments: student questionnaire (S.Q.) 1 , teacher questionnaire (T.Q.),
observation form (O.F.), student checklist (S.C.), teacher checklist (T.C.),
and record fiDIMD (R.F.). A listing of the variables by categories, a brief
description of the measure, and the title of the instrument used to
measure each variable follows.
Student Variables Source
1. Sex (male or female) S.Q.
2. Age (years) S.Q.
3. Grade Level (7,8,9,10,11,12) S.Q.
4. Socio-Economic Status (Determined from parental S.Q.occupation information provided by the student)using the Hatt-North Occupational PrestigeIndex (1947).
5. Years of Science (number of full year science S.Q.courses completed in grades 7 thru 12)
6. Attitude (towards science course-- S.Q.like or dislike)
7. Science Career Plans (yes or no) S.Q.
1These abreviations will be used in the listing of the variables toindicate the instrument used for collecting data.

Student Variables
8. Last Grade (received on report card inscience course--A,B,C,D,F)
9. I.Q. (Lorge-Thorndike Intelligence Tests--composite score).
10. Achievement (composite percentile on IowaTests of Basic Skills or Iowa Tests ofEducational Development)
11. G.P.A. (grade point average in science)
Teacher Variables
1. Sex (male or female)
2. Age (years)
3. College Credits Science(semester hours)
Source
S.Q.
R.F.
R.F.
R.F.
Source
T.Q.
T.Q.
T.Q.
4. College Credits Course Taught T.Q.___(semester hours)..
5. Year Since Last College Course T.Q.(education or science)
6. College Credits History and Philosophy T.Q.of Science
7. Government Institute Participation T.Q.(yes or no)
8. Type of College (State University, StateCollege, City College or University, TeachersCollege, Private School, Church AffiliatedSchool, or other)
T.Q.
9. Teacher Degree (BA or BS, Masters, Specialist, T.Q.Ed.D., or Ph.D.)
10. Teacher Experience (years)
11. Employment Status (full time or part time)
12. Salary (dollars per year)
T.Q.
T.Q.
T.Q.
13. Teacher Attitude (toward teaching course T.Q.selected for sample -- like or dislike)

-12-
Teacher Variables Source
14. Expository-Direct Teacher Attitude(sum of "yes" responses to expository-direct scale of teacher checklist)
15. Inductive-Indirect Teacher Attitude (sumof "yes responses to inductive-indirectscale of teacher checklist)
Administrative and Environmental Variables
1. Classes per day (total)
2. Students per day (total)
3. Laboratory time (minutes per week)
4. Class size (number)
5. Teacher Preparations (number of differentcourses taught per day)
T.C.
T.C.
Source
T.Q.
T.Q.
T.Q.
T.Q.
T.Q.
6. Ratio of Boys to Girls T.Q.
7. Class Status (elective or required) T.Q.
8. Budget (the amount of money spent for theclass per year)
T.Q.
9. Planning Periods (number per day) T.Q.
10. School Size (total enrollment) R.F.
11. Full Time Equivalent Science Teachers(the number of full time equivalents inscience per school)
R.F.
12. Separate Laboratory Facility (separate from R.F.the lecture discussion area or not)
Material Source
1. Course Content
A. Biology (yes or no)
B. Physical Science (yes or no)
C. Earth Science (yes or no)
S.Q.
S.Q.
S.Q.

-13-
Material
2. Laboratory Manual (yes or no)
3. Nature of Text (curriculum study project
or other)
Source
R.F.
R.F.
Instructional VariablesSource
I. Expository-Direct Strategy (as measured by
the expository-direct scale of the student
checklist)
2. Inductive-Indirect Strategy (as measured by
the inductive-indirect scale of the student
checklist)
S.C.
S.C.
3. Group Size (average number of students in O.F.
each group during the class observed)
4. Discipline (rigid, average, or lenient as O.F.
judged by the experimenter)
5. Interruptions (number of events which
disturbed or distracted the students
during experimental activities)
O.F.
The following variables relate to the frequency of the student activity
described as observed by the experimenter during laboratory classes. The
total frequency count for each activity was divided by the total time in
minutes that observations were recorded. These values were used as an
index to the relative frequencies for the various student activities.
1. Preparation and Cleanup O.F.
2. Manipulation of Equipment O. F .
3. Reading Instructions (for experiment) O.F.
4. Recording Data O.F.
5. Reading Resource Material (related to experiment) O.F.
6. Observing Experiment O.F.

-14-
7. Writeup (of experiment) O.F.
8. Reading Total (sum of 3 and 5) O.F.
9. Writing Total (sum of 4 and 7) O.F.
10. Experimenting Total (sum of 1 thru 7) O.F.
11. Talking to Teacher O.F.
12. Talking Lo Students O.F.
13. Talking Total (sum 11 and 12) O.F.
14. Listening to Teacher O.F.
15. Listening to Students O.F.
16. Listening Total (sum 14 and 15) O.F.
17. Non-Related Activity O.F.
Treatment of Data
The experimental unit in the study was assumed to be the science
class. The measurements of the variables collected on the student check-
list, questionnaire, and the classroom observation form were condensed by
computing a mean for each variable for each class. The BMDO3D (1964)
computer program was used to compute a 65 by 65 intercorrelation matrix of
all the variables. A factor analysis of this matrix was done using the
BMDO3M (1965) computer program to obtain a principal components analysis
of the data based on eigenvalues and eigenvectors with unity in the diagonal.
The number of factors to be rotated was determined by the Scree Method
(Cattell, 1966) which led to the selection of twenty factors to be rotated,
all of which had eigenvalues greater than one except for the last one which
was .971. The BMDO3M computes an orthogonal rotated solution by the Varimax
procedure (Kaiser, 1958). In addition to the Varimax rotation an oblique
transformation according to the Harris-Kaiser (1964) Independent Clusters

-15-
method of oblique transformation was computed. These computations were
made using the Harris-Kaiser computer program as modified by Hakstian (1969)
for the inclusion of the Equamax (Saunders, 1962) orthogonal rotation
procedure. The major purpose of the factor analysis was to reduce the
original set of 65 variables to a smaller number of underlying factors.
In addition the intercorrelations of these resulting factors were to be
used as the correlations for a path analysis. It was desirable then to
use a rotation that not only achieved simple structure but also maximum
factor inter-correlations. The Independent Clusters analysis met these
criteria.
The coefficients of the factors were examined and all variables with
loadings of .30 or greater were considered in identifying and naming the
factors. The intercorrelations of these factors were treated as correl-
ations between variables for the path analysis. These composite variables
were logically ordered into patterns hypothesizing causal relationships of
independent variables such as student ability and teacher experience with
dependent variables such as inductive-indirect teaching strategy and lecture
method. The use of regression coefficients and partial regression coefficients
with recursive restrictions on the nature of the causal relationships were
used to compute the regression coefficients between variables not connected
by postulated causal paths. These calculated valum were compared to pre-
dicted values of zero to test the fit of the postulated path model. Two
models were developed, one using the Inductive-Indirect Teaching factor'
as the dependent variable and the second model using the Lecture Method
factor2 as the dependent variable.
1Factor (4) resulting from factor analysis.
2Factor (7) resulting from factor analysis.

-16-
Factor Analysis
The 65 variables selected for this study were intercorrelated to
obtain a correlation matrix for the factor analysis. A factor analysis
was computed and twenty factors rotated to obtain simple structure. The
twenty factor solution accounted for 87 percent of the total variance in
the 65 variables. Factor loadings with an absolute value of .30 or greater
were included in the factor. The interpretation and labeling of the factors
was determined primarily by loadings of absolute value .50 or larger.
Factors that had large negative loadings were reflected for convenience
of interpretation.
Interpretation of Factors
Factor 1 is defined as Educational Level, the grade in school and the
maturity of the students being the emphasis. The primary factor loadings
were for Grade Level, Years of Science, and Age of Student. The smaller
factor loadings related to conditions in the schools due to grade level
of the students. Class Status (elective or required), Planning Periods,
and Students Per Day, all with negative loadings, are characteristics
distinguishing between junior and senior high school organization.
Factor 2 included 7 variables, all with positive factor loadings.
Grade Point Average, Achievement, I.Q., and Last Grade all loaded above .80
on this factor which was labeled Student Ability.
Factor 3 was called Teacher Experience. The variables with high factor
loadings were all related to the length of time the teacher had been teaching.
The two variables, Inductive-Indirect Strategy and Inductive-Indirect
Teacher Attitude, load on factor 4. In addition the variables, Nature of
Text and Non-Related Activity, are included by this factor. These

-17-
characteristics are common to unstructured laboratory activities where
student independence is encouraged. The Nature of Text variable indicates
that the curriculum study materials in the various subject areas have
characteristics in common with the inductive-indirect strategy used by
teachers. This factor was called Inductive-Indirect Teaching and was used
as the dependent variable in a path model designed to identify the causal
effects of variables on the use of inductive-indirect teaching strategies.
Factor 5 is descriptive of the activities in which students were
involved during the laboratory period. The major factor loadings deal
with writtrn work accompanying laboratory experimentation. The factor was
called Recording Data.
Factor 6 is similar to factor 5 with high factor loadings relating
to reading activities during the laboratory period. This factor was labeled
Reading.
The variables with high loadings on factor 7 are listening variables.
Listening to Teacher, had the highest factor loading with total listening
next. These variables are descriptive of teaching strategy where the
students are in a passive role as learners. Teachers with large classes
are less likely to involve the students in independent experimental activity.
The negative factor loading for Preparation and Cleanup indicates that
class time does not include as much involvement of students in experimental
activity. The variables loading on this factor all contribute to
characteristics of highly structured teaching methods. This factor was
labeled Lecture Method and was used as a dependent variable in a postulated
model for path analysis.
Factor 8 was called School Size. The variables relating to number of
science teachers and number of students had the largest factor loadings.

-18-
Socio-Economic Status loaded moderately high, apparently because the smaller
communities and rural areas are served by smaller schools and the occupational
standing of wage earners in these more isolated areas tends to be lower.
Teacher Preparations and Expository-Direct Teacher Attitude both had
substantial negative factor loadings on this factor. A correlation of .44
between Teacher Preparations and Expository-Direct Teacher Attitude, indicates
that teachers with large time demands for planning are positively inclined
towards expository teaching methods.
The two top factor loadings for factor 9 were related to the sex of
the students in the classes. The variables, Ratio of Boys to Girls and
Sex (students), were coded with opposite scaling so that one factor loading
was opposite in sign to the other. Other variables with substantial positive
loadings describe the type of college from which the teacher graduated and
teacher attitudes toward teaching strategies. The factor is complex with
the element of sex mixed with teacher preparation and attitude. Sex (teacher)
had a substantial negative factor loading. This factor may be related to
the identification of institutions, activities, and attitudes as "male-
like" or "female-like" in nature. This factor was labeled Femininity.
Factor 10 included 3 variables. The highest loading variable was
Classes Taught per Day and the factor was labeled Instructional Load.
The largest factor loading for factor 11 was for the variable, Budget.
Other variables loading on this factor are related to availability of
materials for use by students in laboratory activities. Listening to
Students had a substantial negative loading. This variable is an indication
of the time spent by students listening to other students during laboratory
activity. The negative loading indicates that greater availability of
materials and equipment is related to the lesser amounts of verbal interaction.
-19-
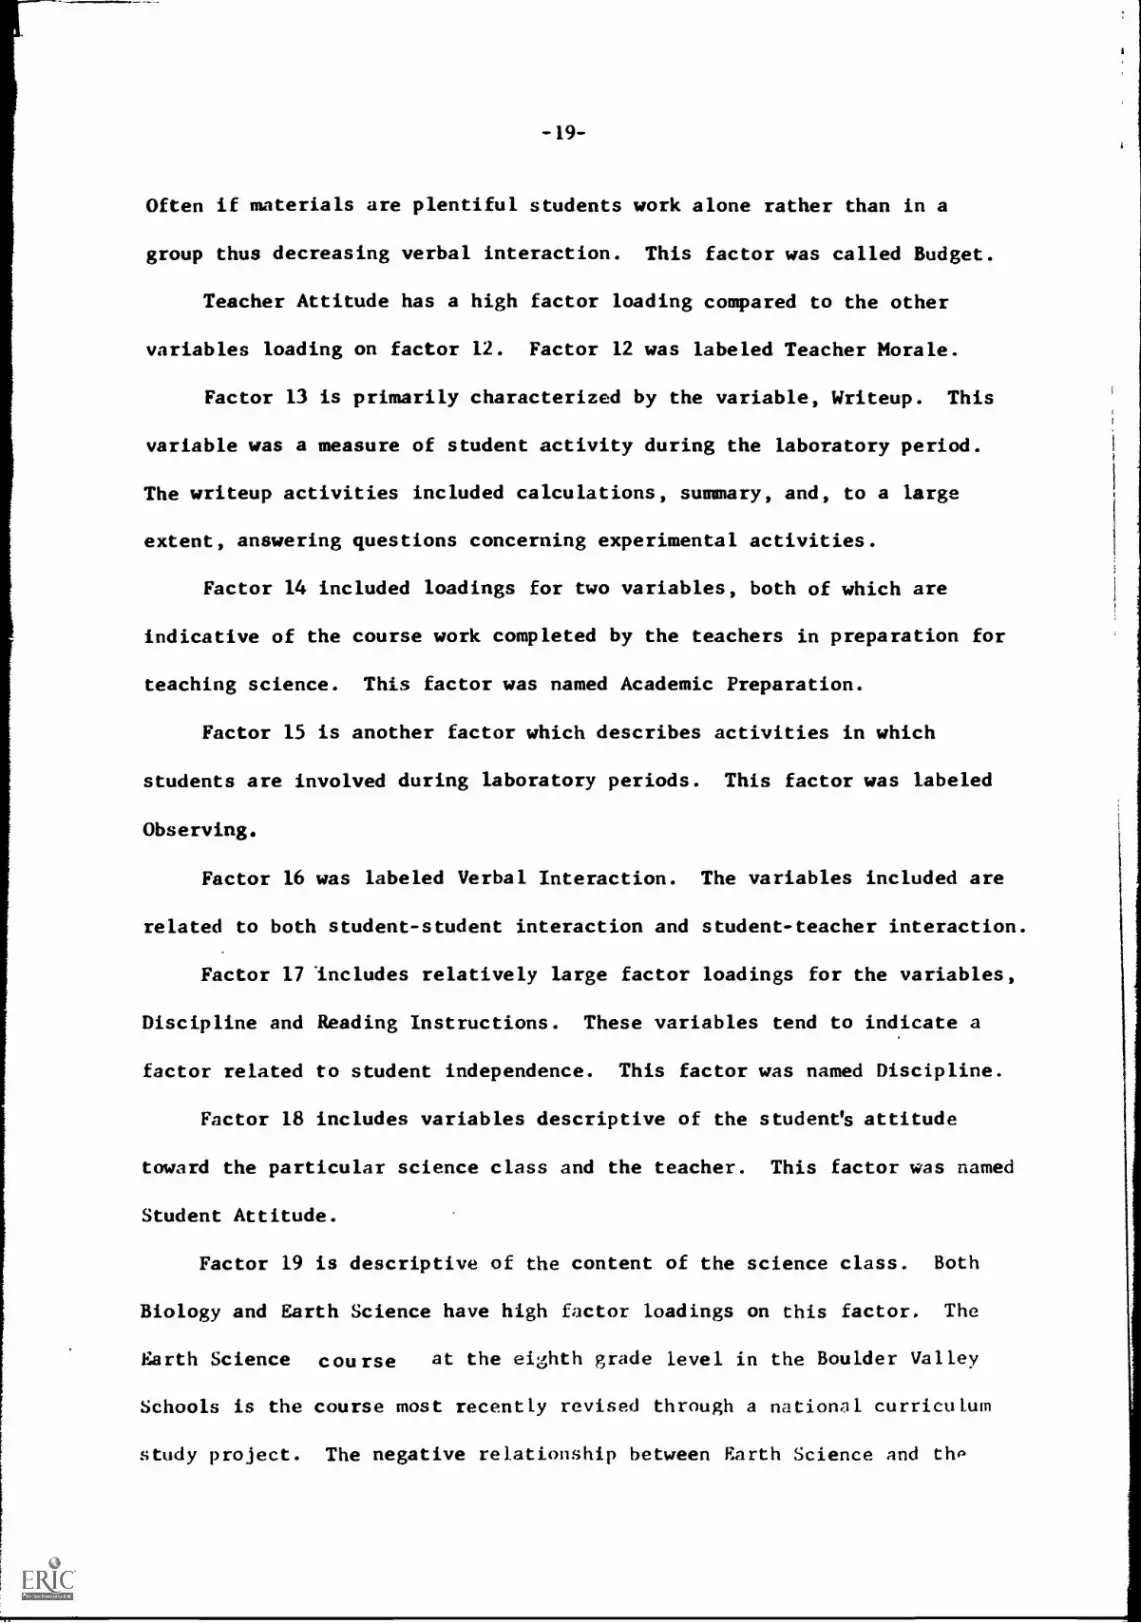
Often if materials are plentiful students work alone rather than in a
group thus decreasing verbal interaction. This factor was called Budget.
Teacher Attitude has a high factor loading compared to the other
variables loading on factor 12. Factor 12 was labeled Teacher Morale.
Factor 13 is primarily characterized by the variable, Writeup. This
variable was a measure of student activity during the laboratory period.
The writeup activities included calculations, summary, and, to a large
extent, answering questions concerning experimental activities.
Factor 14 included loadings for two variables, both of which are
indicative of the course work completed by the teachers in preparation for
teaching science. This factor was named Academic Preparation.
Factor 15 is another factor which describes activities in which
students are involved during laboratory periods. This factor was labeled
Observing.
Factor 16 was labeled Verbal Interaction. The variables included are
related to both student-student interaction and student-teacher interaction.
Factor 17 Includes relatively large factor loadings for the variables,
Discipline and Reading Instructions. These variables tend to indicate a
factor related to student independence. This factor was named Discipline.
Factor 18 includes variables descriptive of the student's attitude
toward the particular science class and the teacher. This factor was named
Student Attitude.
Factor 19 is descriptive of the content of the science class. Both
Biology and Earth Science have high factor loadings on this factor. The
Earth Science cou rse at the eighth grade level in the Boulder Valley
Schools is the course most recently revised through a national curriculum
study project. The negative relationship between Earth Science and the

-20-
number of years since the teacher attended a college course provides infor-
mation concerning the contemporary nature of the course. This factor was
labeled Age of Curriculum where curriculum is considered to be inclusive of
the educational content within the classroom.
Factor 20 was labeled Confusion. The variables loading the highest
on this factor were Class Interruptions and Sex of Teacher. Since sex was
coded with female as the higher value this factor infers some commonality
between sex and class interruptions. These two variables did not correlate
highly so the relationship is not clear.
Path Analysis
Factor 4 and factor 7 from the factor analysis are most closely related
to the two teaching strategies toward which this study is directed. Factor
4, Inductive-Indirect Teaching, very effectively represents the inductive-
indirect strategy for teaching laboratory science at the secondary level.
Factor 7, Lecture Method, was selected to investigate a model of a teaching
strategy where students have a passive role in the learning process.
The intercorrelations of each of the factors with the factor selected
as the dependent variable were inspected to identify factors having possible
causal relationships with the dependent variable. Correlational data does
not provide direct information for inferring causal relationships that
exist but it does provide a means for determining conditions where causal
relationships are absent. A zero correlation between two variables not
only can be interpreted to mean no relationship exists but in addition it
means that no causal influence is present.
The factors with the greatest positive correlation with the Inductive-
Indirect Teaching factor were School Size, Femininity, Teacher Morale,

I
-21-
Academic Preparation, and Student Attitude. The factors with the greatest
negative correlation with the Inductive-Indirect Teaching factor were
Educational Level, Observing, Verbal Interaction, and Age of Curriculum.
Factor 15, Observing, and factor 16, Verbal Interaction, were eliminated
from the factors to be used as causal variables in the path analysis because
they were considered to be dependent variables, causally affected by the
inductive-indirect teaching methods.
Seven factors, Educational Level, School Size, Femininity, Teacher
Morale, Academic Preparation, Student Attitude, and Age of Curriculum,
were included in a recursive causal model with the factor 4, Inductive-
Indirect Teaching, as the dependent variable. This model was labeled
Model 1. In pairings of factors where the question of direct or indirect
causal influence occurred, the intercorrelation matrix of factors was
consulted. The larger correlation coefficients were used to infer possible
direct causal relationship while the smaller coefficients were used to
infer indirect or no relationship. The direction of these influences were
decided upon by the judgment of the experimenter. A path model diagram,
prepared according to the principles developed by Wright (1934, 1960), was
used to represent the pattern and directional influences postulated.
The order, spatial arrangement, and length of lines in the diagram are not
significant properties of the representation. Arrows, connecting pairs of
factors represent a direct causal relationship operating in the direction
indicated by the arrow. The diagram representing the causal influences of
factors on Inductive-Indirect Teaching as proposed by Model 1 is given in
Figure 1.
Path regression coefficients, which are slopes of the regression lines
representing the least squares estimates of the linear relations between

-22-
FIGURE 1
Path Diagram for Model 1 Representing the Causal
Relationships of Factorsa With Inductive-
Indirect Teaching
aVariables are factors: 1, Educational Level; 8, School Size; 9,Femininity; 12, Teacher Morale; 4, Inductive-Indirect Teaching; 14,Academic Preparation (of teacher); 18, Student Attitude; 19, Age ofCurriculum.
bpath regression coefficients.

-23-
pairs of variables, were computed from the correlations according to a
series of equations of the following form:1
_Pii--(Pik) (POPij.k 1 (kj) (Pjk)
where Pijk is the path regression coefficient for the effect of factor 1
on factor i with the effects of factor k held constant. These path regression
coefficients are analogous to partial regression coefficients except that
the path coefficients apply only to the system of variables in the postulated
mode. These computations were done by means of a Fortran program prepared
by Mendro (1969) for computing up to fifth order partial regression coef-
ficients.
The regression coefficients are slopes of regression lines and are
indicative of the strength of the relationship between two factors.
Correlation coefficients indicate a degree of association between variables
and do not provide information as to the strength of the relationship unless
the correlation is zero, in which case the slope will also be zero. The
path regression coefficients for Model 1 were computed for each postulated
causal path as represented by the path diagram and can be found in Table 3.
The path regression coefficients were computed by partialling out the effects
of all other factors that have direct or indirect causal influences postulated
by the model. This resulted in a path regression coefficient for each arrow
in the path diagram with the magnitude and algebraic sign of the path
coefficients representative of the strength and nature of the relationships.
1This equation is for the computation of first order partial regression
coefficients. Similar equations were used for higher order partials
Blalock: p. 101, 1964).

-24-
TABLE 3
Path Regression Coefficients for Fitting Model 1
Coefficients Values
p 8 1 a .237*
p 9 1 -.308**
p 4 1 9 12 14 18 -.224*
p 12 8 1 19 .296**
p 14 8 1 .229*
p 18 8 ' 1 12 .195*
p 4 9 1 12 14 18 .055
p 4 12 - 1 8 9 14 18 19 .122
p 4 14 - 1 8 9 12 18 .126
p 4 18 1 8 9 12 14 .122
p 12 19 8 -.272**
p 18 12 8
St
aNumbers correspond to factors from factor analysis.*Greater than one standard error. %
**Greater than two standard errors.
.046

-25-
The path regression coefficients for the postulated model may be used
in modification of the model due to path coefficients of zero for postulated
paths. This would indicate that the strength of the relationship is zero
and that the postulated relationship between the two factors involved should
be eliminated. The path regression coefficients for each direct causal effect
are included in the diagram of the path mode. At this point, the model was
modified by removing the direct causal effects postulated for relations
with zero path coefficients.
Inspection of the path regression coefficients for the Inductive--
Indirect Teaching model revealed two paths with nearly zero path regression
coefficients. These relationships were between Teacher Morale and Student
Attitude and the effect of Femininity on Inductive-Indirect Teaching.
These low values infer no relationship in these two instances so the direct
paths between each of the pairs were removed. Factor 9, Femininity was
tIvan left with no postulated effect, direct or indirect, on Inductive-
Indirect Teaching. Due to these circumstances, Femininity was removed from
the model and a seven variable revised model was postulated. The revised
model was labeled, Model 2. The path regression coefficients for Model 2
are given in Table 4 and the path diagram for Model 2 is presented in
Figure 2.

-26-
TABLE 4
Path Regression Coefficients for Fitting Model 2
Coefficients
18
18 19
Values
p 8 la
p 4 1
p 14 8
12 14
.237*
-.241*
.229*
.208*
.129
.130*
.148
-.272**
.296**
1
1
1 8 14
p 18 _8
p 4 12
p 4 14 1 8
1 8
8
1 19
12
12
18
14p 4 18
p 12 19
p 12 8
aNumbers refer to factors from factor analysis.*Greater than one standard error.
**Greater than two standard errors.
-27-
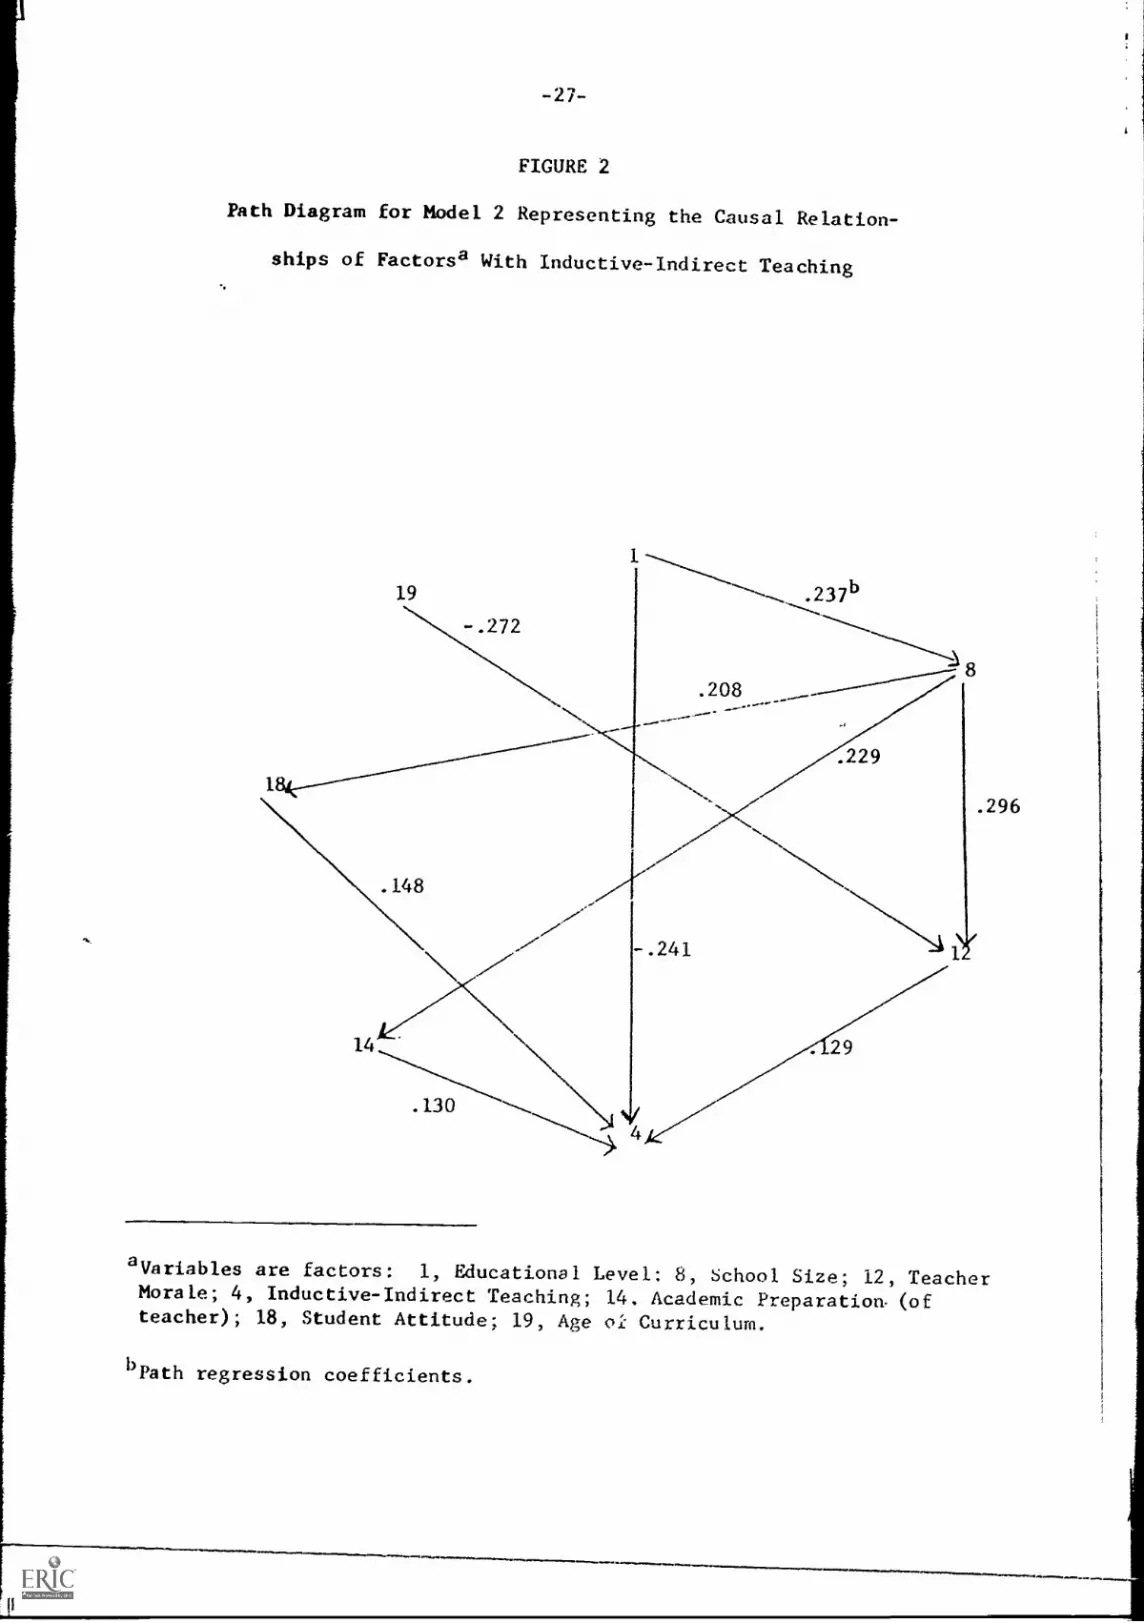
FIGURE 2
Path Diagram for Model 2 Representing the Causal Relation-
ships of Factorsa With Inductive-Indirect Teaching
aVariables are factors: 1, Educational Level: 8, School Size; 12, TeacherMorale; 4, Inductive-Indirect Teaching; 14, Academic Preparation. (ofteacher); 18, Student Attitude; 19, Age c);: Curriculum.
bPath regression coefficients.
...,,........

-28-
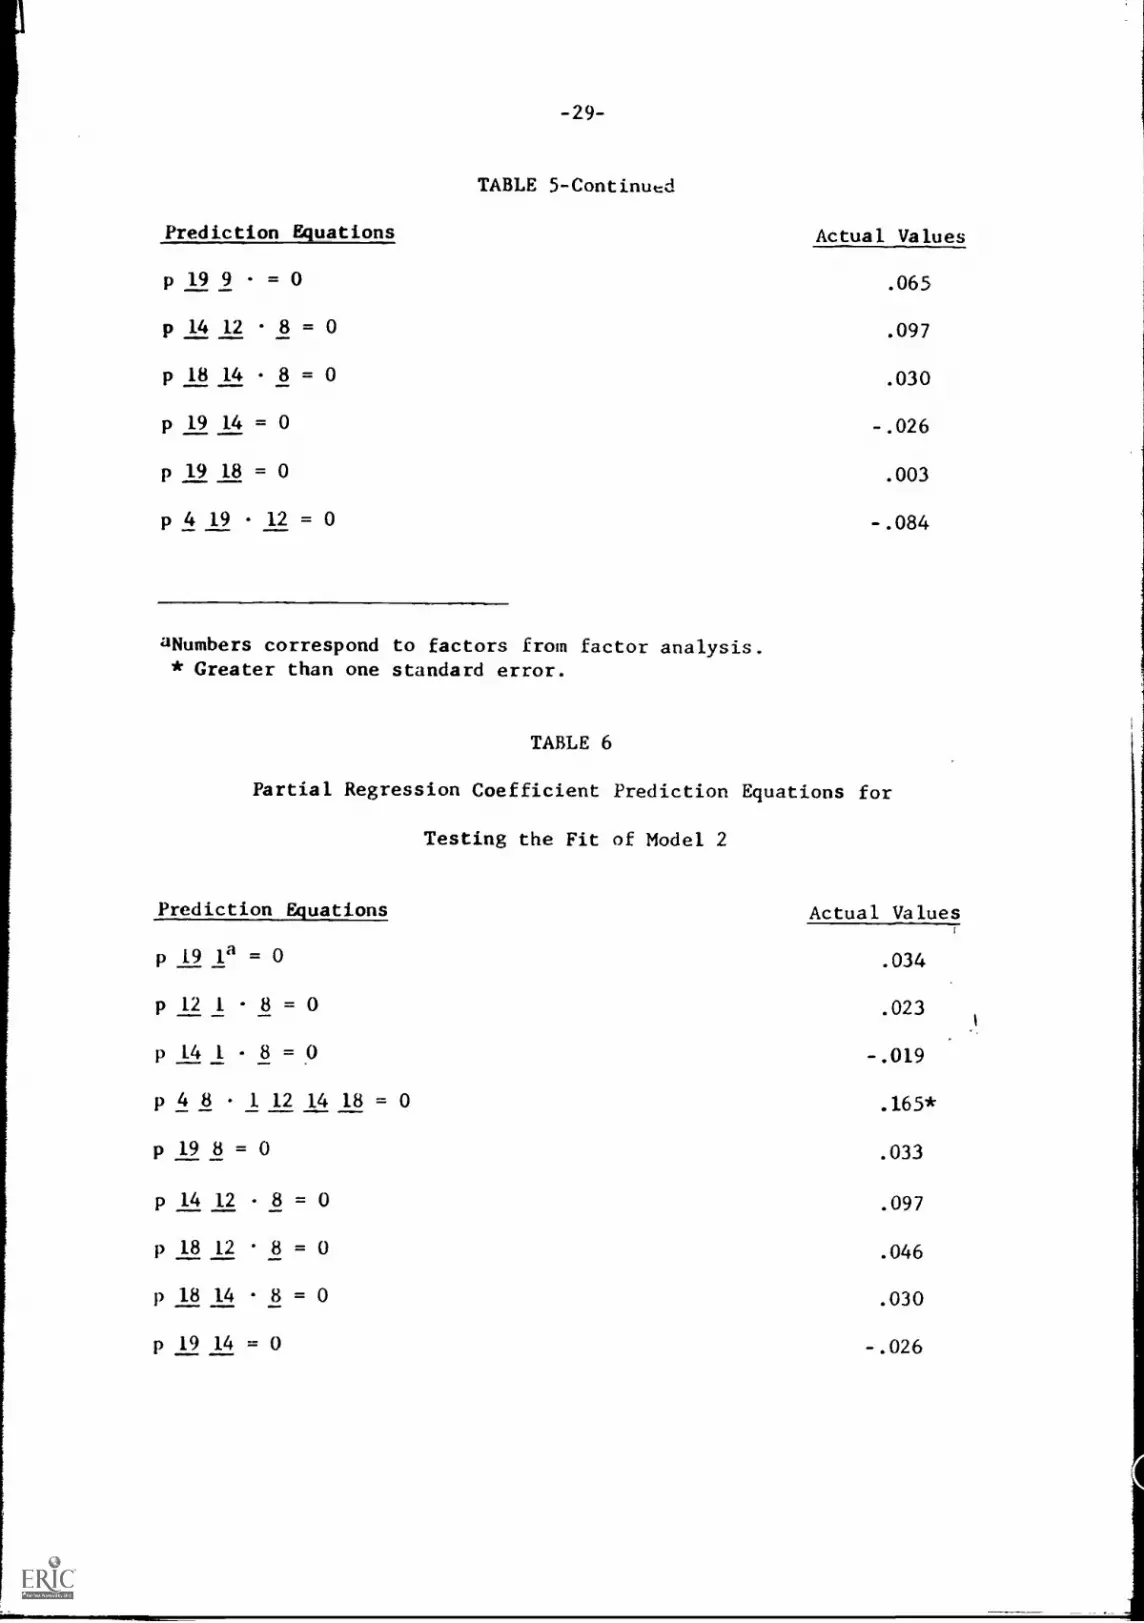
To test the fit of the model the pairings of the factors for which
no direct effects were postulated, were predicted to have regression
coefficients of zero when the indirect effects of other factors were held
constant by partialling out the influence of intermediate factors. One
such prediction equation was identified for each pairing of factors where
no direct relation had been postulated. If the corresponding partial
regression coefficients, computed from the data, are not significantly
different from zero then the test of fit of the.model tends to support
the causal relationships postulated. The partial regression coefficient
prediction equations for testing the fit of Model 1 and Model 2 are given
in Tables 5 and 6 respectively.
TABLE 5
Partial Regression Coefficient Prediction Equations for
Testing the Fit of Model 1
Preetction Equations
0
Actual Values
p 12 1
1
1
1
8
9
9
9
- 8a = 0
- 8 = 0
8 = 0
= 0
1 = 0
1 12 14 18 =
.023
-.019
.057
.034
.029
.165*
.033
.022
.085
-032
p 14
p 18
p 19
P 9 8
p 4 8
p 19 = 0
1
- 1
1
=
=
=
0
0
0
p 12
p 14
p 18
-29-
TABLE 5-Continued
Prediction Equations Actual Values
p 19 9 = 0 .065
p 14 12 8 = 0 .097
p 18 14 8 = 0 .030
p 19 14 = 0 -.026
p 19 18 = 0 .003
p4 19 - 12 = 0 -.084
aNumbers correspond to factors from factor analysis.* Greater than one standard error.
TABLE 6
Partial Regression Coefficient Prediction Equations for
Testing the Fit of Model 2
Prediction Equations Actual Values
p 19 la = 0 .034
p 12 1 - 8 = 0 .023
p L4 L - 8 = 0 -.019
p 4 8 112 14 18 = 0 .165*
p 19 8 = 0 .033
p 14 12 - 8 = 0 .097
p 18 12 8 = 0 .046
p 18 14 8 = 0 .030
p 19 14 = 0 -.026

i
TABLE 6-Continued
Prediction Equations Actual Values
p 19 18 = 0 .003
p 4 19 - 12 = 0 -.084
aNumbers refer to factors from factor analysis.*Greater than one standard error.
Interpretation of Model 2
Model 2 indicates that Educational Level of students has both direct
and indirect influence on Inductive-Indirect Teaching. The direct effect
has a negative path coefficient indicating that students in the upper grade
levels, with previous science courses, influence the teacher towards the
use of less inductive-indirect strategies of science teaching in the
laboratory. Educational Level also has an indirect effect on Inductive -
indirect Teaching through its effect on School Size. It is difficult to
interpret the educational level of the teaching-learning situation as a
cause of school size without considering some additional outside influences.
Higher levels of our educational system in science require more specialized
equipment and centralized facilities than do the lower grades. This results
in fewer attendance centers with greater school enrollments per
building for high schools than for junior high schools. This causal
relation seems to be confounded somewhat by outside social and economic
influences.
School size affects the Academic Preparation of teachers. Large schools
include a greater variety of students with broader interests, needs and
abilities than smaller schools, apparently causing teachers to return to
i
k
-31-
college for additional course work and training. Academic Preparation
(of teachers) directly affects Inductive-Indirect Teaching. The familiarity
with and knowledge of subject matter may cause teachers to use methods
involving greater student participation and less formftl structure.
Laboratory work, planned and organized by students, often creates a wide
variety of problems both in scope and in depth. The teacher with a
minimum of preparation will be reluctant to use theso methods.
School size has indirect effects on Inductive - Indirect Teaching via
its influence on Teacher Morale and Student Attitude. This may be due to
an element of prestige, associated with larger schools, which could serve
to improve Teacher Morale. A positive feeling of teachers toward the
courses they teach and the conditions in which they work will make them
more apt to use inductive-indirect teaching methods. In a similar fashion
Student Attitude will be affecrPd by School Size. According to this
model large schools tend to create more positive student attitudes toward
science courses. These student attitudes stimulate teachers to involve
the class in Inductive-Indirect learning situati3ns. Factor 19, Age of
Curriculum, has an indirect effect on Inductive-Indirect Teaching by way
of a negative effect on Teacher Morale. According to the model the use
of old materials, books, and equipment may tent: to discourage teachers and
prevent them from using inductive-indirect methods. On the other hand
summer institutes, and new texts with fresh approaches to teaching will
improve teacher morale and cause the use of inductive-indirect strategies
to increase.
Path Model 3 was postulated for the causal relations of Educational
Level, Instructional Load, Budget, Teacher Morale, and Academic Preparation
with Lecture Method as the dependent variable. The diagram of path Model 3

1
-32-
is given in Figure 3. The path regression coefficients for Model 3 and
Model 4 are given in Table 7. The partial regression coefficient prediction
equations for testing the fit of Model 3 and Model 4 are given in Table 8.
TABLE 7
Path Regression Coefficients for Fitting Model 3 and
Model 4
ValuesCoefficientsa Model 3 Model 4
p 7 1 10 11 12 14b -.208* -.200*
p 10 1 -.239* -.239*
p 11 1 14 .290** .290**
p 7 10 1 11 12 14b .181* .190*
p 7 11 1 10 12 14 -.100 -.100
P 1 12 1 10 11 14 -.249* -.249*
p 7 14 1 10 11 12 .082 - - --
p 11 14 1 -.142* -.142*
p 12 14 10 .155* .155*
aNumbers relate to factors from factor analysis.
bVariable 14 was not partialed out for Model 4.*Greater than one standard error.**Greater than two standard errors.

-33-
FIGURE 3
Path Diagram for Model 3 Representing the Causal Re-
lationships of Factorsa With Lecture Method
14-
.155 -.142
12
11
.290
........
.100
.208b
----- .082--------,
7
aVariables are factors: 1, Educational Level; 7, Lecture Method; 10,Instruciifmal Load: 11, Budget; 12, Teacher Morale; 14, AcademicPreparation (of teacher).
bPath regression coefficient.
-34-
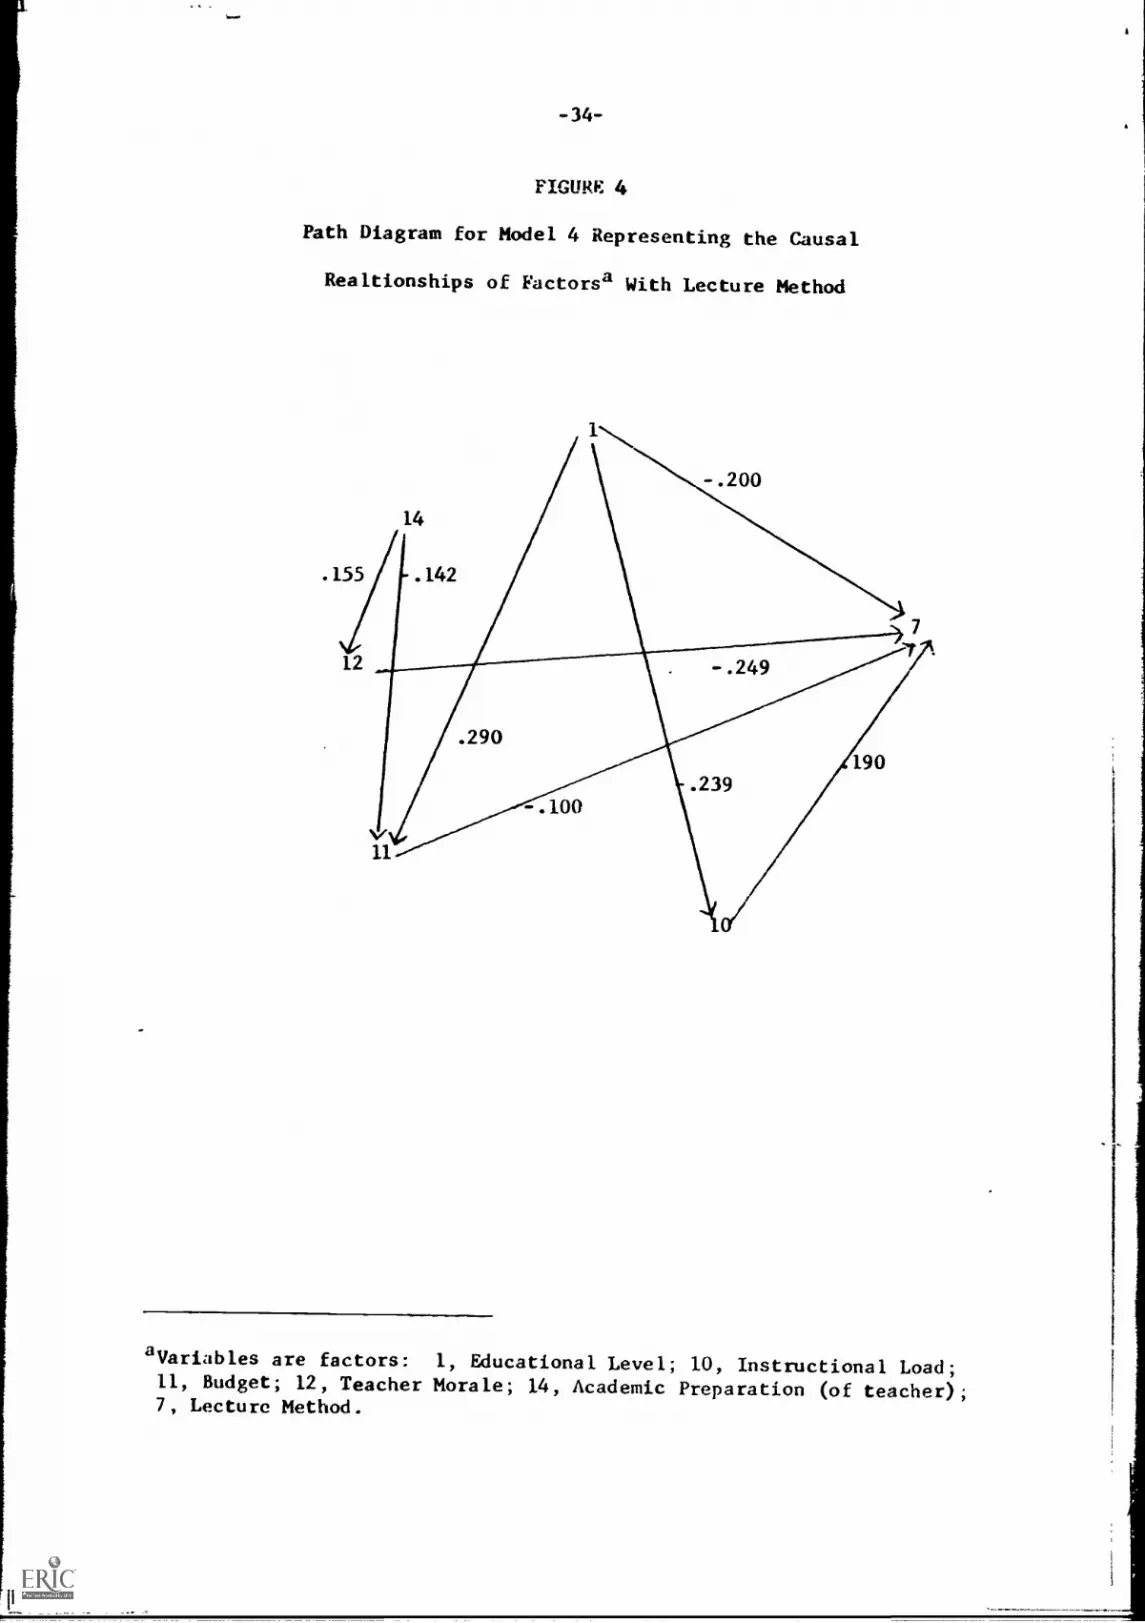
FIGURE 4
Path Diagram for Model 4 Representing the Causal
Realtionships of Factorsa With Lecture Method
14
12
.290
-.100v11
aVariables are factors: 1, Educational Level; 10, Instructional Load;11, Budget; 12, Teacher Morale; 14, Academic Preparation (of teacher);7, Lecture Method.

-35-
TABLE 8
Partial Regression Coefficient Prediction Equations and
Values for Model 3
Prediction EquationsActual Values
Model 3 Model 4
P JZ la = 0 .091 .091
p 14 1 = 0 .035 .035
p 11 10 1 = 0 .080 .080
p 12 10 = 0 .009 .009
p 14 10 = 0 .089 .089
p 12 11 14 = 0 .083 .083
p 7 14 = 0 .065
aNumbers related to factors from factor analysis.
Interpretation of Model 4
Model 4 shows Educational Level to have direct and indirect effects
on Lecture Method. The direct effect is negative as it was in Model 2 for
the effect of Educational Level on Inductive-Indirect Teaching. The
educational maturity of students may cause the teachers to rely on written
materials such as text books and laboratory manuals. According to Model 2
the content of such materials must provide direction and guidance to the
students for structured laboratory activities and a minimum of Inductive-
Indirect Teaching. The lower grade level student characteristics cause
teachers to give verbal instruction and use more Inductive-Indirect Teaching.

-36-
The indirect effects of Educational Level on Lecture Method are
through Instructional Load and Budget. Instructional Load is negatively
affected by Educational Level. The maturity of older students causes the
teacher to have less disciplinary responsibility than teachers of the
younger classes. The science courses in the junior and senior years in
high school are elective and result in smaller classes than the required
courses at lower educational levels. A large Instructional Load causes
teachers to rely on the Lecture Method. Teacher load must be decreased if
they are expected to plan and provide more student-centered laboratory
activities.
Academic Preparation has indirect effects on Lecture Method thru Budget
and Teacher Morale. Model 2 did not show a direct path from Academic Pre-
paration to Teacher Morale and resulted in a partial regression coefficient
of .093. Both models show a relationship that is positive but of a
questionable magnitude. Assuming the relationship postulated in Model 4,
it would be interpreted to mean that a higher degree of training increases
Teacher Morale. High Teacher Morale causes teachers to use more student-
centered non-verbal presentation in science laboratory instruction.
The effect of Academic Preparation on Budget is the same magnitude
but opposite in sign to that of Academic Preparation on Teacher Morale.
This implies that teachers with more training spend less money on equipment
and supplies than do the teachers just out of college. The lack of equip-
ment and supplies may cause teachers to present information verbally.
According to this model, Academic Preparation influences the use of the
lecture method negatively via Teacher Morale and positively via Budget.
-37-
The causal models developed in this study, Model 2 using Inductive-
Indirect Teaching as the dependent variable and Model 4 using Lecture
Method as the dependent variable, both involve Educational Level of
Students, Teacher Morale, and Academic Preparation of Teacher. The
negative influence of Educational Level upon Inductive-Indirect Teaching
in Model 2 and upon Lecture Method in Model 4 indicates that use of the
lecture method does not necessarily eliminate inductive-indirect teaching
strategies. Assessment of the degree of inductive-indirect teaching in
laboratory situations can result in lower inductive ratings and higher
expository ratings for teachers who talk when various observational instru-
ments are used, regardless of what is said. More attention should be given
to what is said by the teacher in the classroom and not just the amount of
teacher talk. The influence of Academic Preparation in Model 2 and Model 4
is similar to the influence of Educational Level. Academic Preparation
has a direct positive effect on Inductive-Indirect Teaching and an indirect
positive effect on Lecture Method. Teachers who have more college training
are inclined toward the use of inductive methods in the laboratory as well
as the use of lecture methods.
Teacher Morale seems to be important in its effects on both Inductive-
Indirect Teaching and Lecture Method. The opposite signs for the influence
of these variables in the two models shows the tendency for the teachers
with positive attitudes to use inductive-indirect laboratory methods and
less verbal presentation. This factor is an aspect of teacher differences
which may be a major confounding variable in studies comparing one method
of science teaching with another.
-38-
Summary and Conclusions
Generalizations of the results of this study are limited by the
characteristics of the population sampled and the accuracy of the models
postulated. All inferences and conclusions expressed in the following
section are Lased upon the acceptance of the models developed.
The final models for Inductive-Indirect Teaching and for Lecture
Method both included large negative influences of Educational Level on the
method of laboratory instruction. Students at a more mature level of
education cause teachers to use less Indirect-Inductive Teaching and less
Lecture Method in science laboratory instruction at the secondary level.
It can be concluded from these findings that teachers of students at high
educational level within the secondary grades, provide structure for
laboratory activities through the use of methods other than lecture. The
educational maturity of high school students may cause teachers to use
written materials which completely structure the student activities.
According to this study the particular strategy or combination of
strategies used by teachers in secondary science laboratory is influenced
by Teacher Morale. In the model for Inductive-Indirect Teaching a small
positive effect resulted while for the Lecture Method a large negative
influence was discovered. Lack of control for this factor in experiments
comparing science teaching in the past, may have been a source of con-
founding.
Science education research is being conducted in efforts to identify
the best way to provide students with the knowledges and skills that
science educators feel students should have. The identification of the
best methods will involve randomization to control for factors such as
Teacher Morale, Instructional Load, Academic Preparation, Student Attitude.

-39-
It Is generally not feasible to include these factors as main effects in a
factorial experimental design. Other variables which could be controlled
by randomization or used as independent variables for factorial studies are
Educational Level, School Size, and Age of Curriculum. This study suggests
an interaction between Educational Level and the use of certain laboratory
methods of teaching. There may also be an interaction between Educational
Level and method of teaching laboratory science when criterion measures of
achievement, attitudes toward science, understanding of the processes of
science, critical thinking abilities, and technical skills are considered
as dependent variables. Once experimental studies have been made to
accurately determine which laboratory teaching strategies are more effective
and at what educational levels, the question of changing teachers' methods
becomes appropriate. Effective approaches to bringing about such changes
may be identified using the results of this study. Causal paths with high
path coefficients will have the greatest influence on the dependent variable
although the causal variables in these relations may not be easily manipulated.
For the Inductive-Indirect Teaching model in this study, the manipulation
of Educational Level would not serve the purposes intended. There would be
little advantage to the students and the system in moving a teacher from
one educational level of teaching to another in order to change the methods
ti
used by the teacher. It would be more appropriate to focus on such factors
as Teacher Morale, Academic Preparation, and Age of Curriculum even though
the direct causal effects on use of teaching methods may be small. The
science educator should give particular attention to these three areas.
Bibliography
Baker, F. B. and Martin, T. J., FORTAP A Fortran Test Analysis Package,Madison: Laboratory of Experimental Design, Wisconsin Research andDevelopment Center for Cognitive Learning, University of Wisconsin,March 1, 1968.
Barnes, Lehman J..Jr., "The Development of A Student Checklist to DetermineLaboratory PraCtices In High School Biology," The University of TexasPublication, 6720: 90-96, October 15, 1967.
Blalock, H. M., "Four-Variable Causal Models and Partial Correlations,"American Journal of Sociology, 68: 182-94, September, 1962.
Blankenship, Jacob W., "An Analysis of Certain Characteristics of BiologyTeachers in Relation to Their Reactions to the BSCS Biology Program,"The University of Texas Publication, 6720: 29-36, October 15, 1967.
BMDO3D-Health Science Computing Facility, U.C.L.A., "BMD03D, CorrelationWith Item Deletion," Biomedical Computer Programs, Novermber 13, 1964.
BMDO3M- Health Science Computing Facility, U.C.L.A., "BMDO3M-Factor Analysis,'Biomedical Computer Programs, March 3, 1965.
Borgatta, Edgar F., Sociological Methodology 1969, San Francisco: Jossey-Bass Inc., Publishers, 1969.
Cattell, Raymond B., Handbook of Multivariate Experimental Psychology,Chicago: Rand McNally and Company, 1966.
Colver, Luther M. and Anderson, Kenneth E., "A Comparison of Two Methodsof Teaching Formula Writing in High School Chemistry," School Scienceand Mathematics, 52: 50-59, January, 1952.
Cronbach, Lee J., Educational Psychology, (2nd Edition), New York: Harcourt,Brace, and World Inc., 1963.
Cunningham, Harry A., "Lecture Demonstration Versus Individual LaboratoryMethod in Science Teaching-A Summary," Science Education, 30: 70-82,March, 1946.
Duncan, O. D., "Path Analysis: Sociological Examples," American Journal ofSociology, 72: 1-16, 1966.
Hakstian, A. Ralph, "Methods of Oblique Factor Transformations," UnpublishedDissertation, University of Colorado, 1969.
Harris, C. W., and Kaiser, H. F., "Oblique Factor Analytic Solutions ByOrthogonal Transformations," Psychometrika, 29: 347-62, 1964.
Hatt, Paul K. and North, C. C., "Jobs and Occupations: A Popular Evaluation,"Opinion News, pp. 3-13, September, 1947.

Hoyt, C., "Test Reliability Established by Analysis of Variance,"Psychometrika, 6: 153-60, 1941.
Hurd, DeHart P. and Rowe, Mary B., "Science in the Secondary School, Reviewof Educational Research, 34: 287-298, June, 1964.
Johnson, Palmer 0., "A Comparison of The Lecture-Demonstration Group-Laboratory-Experimentation Methods of Teaching High School Biology,"Journal of Educational Research, 18: 103-11, September, 1928.
Kaiser, H. F., "The Varimax Criterion for Analytic Rotation Analysis,"Psychometrika, 23: 187-200, 1958.
Kerlinger, Fred N., "Social Attitudes and Their Criterial Referents: AStructural Theory," Psychological Review, 74: 110-22, No. 2, 1967.
Kleinman, Gladys S., "Teachers' Questions and Student Understanding ofScience," Journal of Research in Science Teaching, 3: 307-17, 1965.
Kochendorfer, Leonard H., "The Development of a Student Checklist toDetermine Classroom Teaching Practices in High School Biology," TheUniversity of Texas Publication, 6720: 71-78, October 15, 1967a.
Lucow, William H., "Estimating Components of Variation in an ExperimentalStudy of Learning," Journal of Experimental Education, 22: 265-71,March, 1954.
Mendro, Robert L., "Computer Program for Computing Fourth Order PartialRegression Coefficients," Laboratory of Educational Research, Universityof Colorado., 1969.
Miller, Delbert C., Handbook of Research Design and Social Measurement,New York: David McKay Company, Inc., 1967.
Novak, Alfred, "Scientific Inquiry in the Laboratory," The American BiologyTeacher, 25: 342-46, No. 5, May, 1963.
Ramsey, Gregor A., and Howe, Robert W., "An Analysis of Research onInstructional Procedures in Secondary School Science. Part I-Outcomesof Instruction," Science Teacher, 36: 62-6, March, 1969.
Robinson, W. S., " Asymmetric Causal Models," American Sociological Review,27: 545-48, August, 1962.
Rutledge, James A., "Inquiry in the High School Science Laboratory,"Science Education, 50: 411-17, December, 1966.
Saunders, D. R., "Trans-Varimax: Some Properties of the Ratiomax andEquamax Criteria for Blind Orthogonal Rotation," Paper delivered atAPA Meeting, 1962.
Tukey, John, "Causation, Regression, and Path Analysis," in Oscar Kempthorne,et. al., Statistics and Mathematics in Biology, Ames, Iowa; Iowa StateCollege Press, 1954.

Ward, John N., "Group Study Versus Lecture Demonstration," Journal ofExperimental Education, 24: 197-210, 1956.
White, John R., "A Comparison of the Laboratory and the Lecture-DemonstrationMethods in Engineering Instruction," An Unpublished Doctor's Dissertation,School of Education, New York University, 1943.
Wright, Sewall, "Path Coefficients and Path Regressions: Alternative orComplementary Concepts?" Biometrics, 16, 189-202, June, 1960.
"The Interpretation of Multivariate Systems," in 0. Kempthorneet. al., Statistics and Mathematics in Biology, Ames: Iowa StateCollege Press, 1954.
. "The Method of Path Coefficients," Annals of MathematicalStatistics, 5: 161-215, September, 1934.


