Embed Size (px)
Citation preview
UvA-DARE is a service provided by the library of the University of Amsterdam (https://dare.uva.nl)
UvA-DARE (Digital Academic Repository)
The Dagara farmer at home and away: migration, environment and developmentin Ghana
van der Geest, K.A.M.
Publication date2011Document VersionFinal published version
Link to publication
Citation for published version (APA):van der Geest, K. A. M. (2011). The Dagara farmer at home and away: migration,environment and development in Ghana. African Studies Centre.
General rightsIt is not permitted to download or to forward/distribute the text or part of it without the consent of the author(s)and/or copyright holder(s), other than for strictly personal, individual use, unless the work is under an opencontent license (like Creative Commons).
Disclaimer/Complaints regulationsIf you believe that digital publication of certain material infringes any of your rights or (privacy) interests, pleaselet the Library know, stating your reasons. In case of a legitimate complaint, the Library will make the materialinaccessible and/or remove it from the website. Please Ask the Library: https://uba.uva.nl/en/contact, or a letterto: Library of the University of Amsterdam, Secretariat, Singel 425, 1012 WP Amsterdam, The Netherlands. Youwill be contacted as soon as possible.
Download date:02 Jun 2022
The Dagara farmer at home and away
Migration, environment and development in Ghana
ACADEMISCH PROEFSCHRIFT
ter verkrijging van de graad van doctor aan de Universiteit van Amsterdam op gezag van de Rector Magnificus
prof. dr. D.C. van den Boom ten overstaan van een door het college voor promoties
ingestelde commissie, in het openbaar te verdedigen in de Agnietenkapel
op dinsdag 21 juni 2011, te 12:00 uur
door
Kees Anton Martinus van der Geest
Geboren te Haskerland
Promotiecommissie
Promotor: Prof. dr. Ton Dietz Co-promotor: Dr. Kees Burger Overige leden: Prof. dr. Richard Black Prof. dr. Saa Dittoh Prof. dr. Valentina Mazzucato Prof. dr. Isa Baud Prof. dr. James Sidaway
FACULTEIT DER MAATSCHAPPIJ- EN GEDRAGSWETENSCHAPPEN
African Studies Centre
African Studies Collection, vol. 33
The Dagara farmer at home and away
Migration, environment and development in Ghana
Kees van der Geest
Institutional support for this study was provided by the Amsterdam institute for Metropolitan and International Development Studies (AMIDSt), now Amsterdam Institute for Social Science Research (AISSR), Faculty of Social and Behavioural Sciences, University of Amsterdam. The Netherlands Organization for Scientific Research (NWO) funded this research as part of the Milieu & Economie (Environ-ment & Economics) programme. The Research School for Resource Studies for Development (CERES) provided academic training. Published by: African Studies Centre P.O. Box 9555 2300 RB Leiden The Netherlands Tel: +31 (0)71-5273372 E-mail: [email protected] Website: http://www.ascleiden.nl Cover design: Heike Slingerland Photographs: Kees van der Geest Maps and artwork: Kees van der Geest Printed by Ipskamp Drukkers, Enschede ISSN: 1876-018x ISBN: 978-90-5448-103-4 © Kees van der Geest, 2011
To:
Eva, amor de mi vida &
Ruben Kontana, luz de mis ojos

vii
Contents
List of tables x
List of figures xi
List of maps xi
List of pictures xii
Preface and acknowledgements xiii
1 INTRODUCTION 1 The Dagara 3 At home and away 4 Problem statement, disciplinary embedding and research questions 8 Outline of the thesis 15 Final remarks 18
2 MIGRATION AND ENVIRONMENT IN GHANA: A CROSS-DISTRICT
ANALYSIS OF HUMAN MOBILITY AND VEGETATION DYNAMICS 19 Introduction 20 Materials and methods 22 Migration in Ghana 24 Vegetation and rainfall in Ghana 27 Migration and vegetation dynamics 29 Conclusion 37
3 NORTH-SOUTH MIGRATION IN GHANA: WHAT ROLE FOR THE
ENVIRONMENT? 39 Introduction 40 Migration from Northern Ghana: patterns and trends 42 Cross-sectional analysis 45 Longitudinal analysis 51 Case study: The Dagara of Northwest Ghana 53 A note on international migration 59 Conclusion 61
viii
4 DAGARA MIGRATION AND ENVIRONMENTAL CHANGE IN GHANA’S
FOREST-SAVANNAH TRANSITION ZONE 63 Introduction 64 Dagara migration 69 Population growth 70 Land Use and Land Cover Studies 73 Research locations and methodology 76 Local discourses of environmental change 79 Perceptions of land use by ‘the other’ 82 Land use sustainability of settlers and native farmers 84 Conclusion 96
5 LOCAL PERCEPTIONS OF MIGRATION FROM NORTHWEST GHANA 99 Introduction 100 Migration and development 102 A short history of migration from Northwest Ghana 104 Methodology 105 Migration propensities 107 Perceptions of seasonal migration 108 Perceptions of long-term migration 112 Perceptions of return migration 116 Use of savings and remittances 119 Conclusion 120
6 THE MALTHUS-BOSERUP CURVE AND MIGRATION IN NORTHERN
GHANA 123 Introduction 124 Northern Ghana 131 Cross-district analysis of migration and agricultural productivity 137 Conclusion and implication for policy 145
7 MIGRATION AND AGRICULTURAL DEVELOPMENT IN NANDOM, NORTHWEST GHANA 149 Introduction 149 Agricultural productivity 152 Policy environment 155 Survey and sample design 161 Description of the research population 164 Migration propensities 167 Impact of migration on agriculture 173
ix
Summary of survey findings 198 Conclusion 201
8 CONCLUSIONS 205 Driving forces in the Dagara migration system 207 The environmental refugee debate 209 The population-environment debate 211 The migration and development debate 216 Concluding remark 219
Appendix 220
References 223
Summary 232
Samenvatting (summary in Dutch) 241
About the author 251
x
List of tables
1.1 Coverage of migration, environment and development linkages 15 3.1 Trend in North-South migration propensities (1931-2000) 44 3.2 Migration causes of Dagara settlers in the Brong Ahafo Region 54 4.1 Population growth in the Brong Ahafo Region (1960-2000) 72 4.2 Survey sample of Dagara settlers 78 4.3 Perception of differences in farming methods by settlers and natives 83 4.4 Socio-economic profile by migrant status, ecological zone and market access 86 4.5 Land tenure (% of fields) 87 4.6 Farm size (acres) 88 4.7 Crop mix (% of farmers cultivating each crop) 90 4.8 Crop sales (¢ 1000) 90 4.9 Tools used for land preparation and weeding (% of farmers) 91 4.10 Farming techniques (% of farmers) 92 4.11 Farm expenditure (¢ 1000) 93 4.12 Tree cutting and planting 94 5.1 Uses of migrant savings and remittances 120 6.1 Out-migration, population density and agricultural productivity 140 6.2 Out-migration, population density and agricultural productivity, subset of districts
in the first half of the Malthus-Boserup curve 141 7.1 Production of five principal crops in Lawra District (1993-2007) 153 7.2 Production of five principal crops in the Upper West Region (1993-2007) 153 7.3 Perceptions of agricultural and environmental change in Nandom 157 7.4 An overview of external interventions in agriculture and environment 160 7.5 Demographic and economic characteristics of the surveyed households 164 7.6 Population density and migration characteristics in the research villages 172 7.7 Correlations between migration and household sex and age structure 176 7.8 Household composition, migration propensities and farm characteristics 178 7.9 Household composition and adoption of labour intensive farm practices 181 7.10 Migration propensities and adoption of labour intensive farm practices 181 7.11 Other drivers of labour-led intensification 182 7.12 Remittances of children and siblings 186 7.13 Remittances by level of migrants’ education 186 7.14 Distribution of remittances among income groups 188 7.15 Use of remittances and investments in agriculture 189 7.16 Sources of investment in crop cultivation 190 7.17 Remittances and capital-led intensification 192 7.18 Other drivers of capital-led intensification 193 7.19 Other factors explaining farm investments 193
xi
7.20 Return migration and farm characteristics 196 7.21 Return migration and income groups 197
List of figures
1.1 Disciplinary embedding, academic debates and research questions 10 3.1 Annual population growth in six inter-censal periods (1911-2000) 43 3.2 Rainfall and migration propensities in Northern Ghana (1960-2000) 52 3.3 Annual average NDVI trend in Northern Ghana (1982-2006) 52 4.1 Land degradation in the Brong Ahafo Region (LANDSAT, 1973 – 2003) 64 4.2 Average monthly NDVI and NDVI trend in Wenchi District (1982-2006) 66 4.3 Population density (inh/km2) in the Brong Ahafo Region (1960-2000) 72 6.1 The Malthus-Boserup curve between population density and crop yields 126 6.2 Simple model of migration, population density and agricultural productivity 128 6.3 Causal model of migration, population density and agricultural productivity 138 6.4 Migration, population density and agricultural productivity in N-Ghana 143 6.5 Findings for districts in the first half of the Malthus-Boserup curve 144 6.6 Policy implications 147 7.1 Annual rainfall (mm) in Nandom (1980-2008) 150 7.2 Agricultural production in Lawra and the Upper West Region (1993-2007) 154 7.3 Prices of the principal food crops cultivated in Lawra District (1991-2008) 155 7.4 Population density and migration indicators in the research villages 173
List of maps
1.1 Map of Ghana showing the research areas 4 2.1 Inter-regional migration in Ghana 25 2.2 In-migration per district in Ghana (%) 26 2.3 Out-migration per district in Ghana (%) 26 2.4 Net-migration per district in Ghana (%) 26 2.5 Rural population density per district in Ghana 26 2.6 Average vegetation density (NDVI) per district in Ghana (1982-2006) 28 2.7 Average annual rainfall (mm) per district in Ghana (1982-2002) 28 2.8 NDVI change per district in Ghana (1982-2006) 28 2.9 Rainfall change per district in Ghana (1982-2002) 28 2.10 Average Maximum NDVI per district in Ghana (1982-2006) 34 2.11 Maximum NDVI change per district in Ghana (1982-2006) 34 2.12 Average Minimum NDVI (1982-2006) 34
xii
2.13 Minimum NDVI change (1982-2006) 34 3.1 Map of North-South migration in Ghana (2000) 45 3.2 North-South migration propensities per district in Northern Ghana (2000) 46 3.3 Average annual rainfall per district in Northern Ghana (1982 to 2002) 47 3.4 Average NDVI per district in Northern Ghana (1982-2006) 48 3.5 Average crop yields per district in Northern Ghana (1998-2002) 49 3.6 Rural population density per district in Northern Ghana (2000) 49 4.1 Ghana, Dagara migration and coverage of the LANDSAT image 67 4.2 Dagara in-migration per district of the Brong Ahafo Region 70 4.3 Administrative map of the Brong Ahafo Region in 1960 72 4.4 The study area and its location in the Brong Ahafo Region 78 6.1 Population density and growth, crop yields and migration in Northern Ghana 132 6.2 Rainfall, soils and rain use efficiency in Northern Ghana 134 7.1 Location of Nandom and population density in the survey villages 163
List of pictures
1 The author with his principal assistant and a respondent in Nandom xvi 2 The author’s host family in Nandom xvii 3 The Nandom station with on the left the Kumasi bus 6 4 Street view in Wenchi Town with on the left a charcoal truck 6 5 Farmer in Nandom gathering stones to sell to builders 31 6 Migrant farmer in front of his house in Droboso 31 7 Empty lands in the Northwest of Wenchi District 56 8 A migrant farmer’s granary in Droboso 59 9 Farmer drying her meagre harvest on the roof 110 10 Young migrant leaving home (Nandom-Kogle) 114 11 Woman brewing pito 114 12 Building activities in Mr Kontana’s mud castle 114 13 Farming group preparing a field in Nandom 200 14 An important change in the local farming system is the use of ploughs 200
xiii
Preface and acknowledgements
An olive tree can reach fruit-bearing age after four years, but it may take longer. This depends mostly on the type of olive tree, soil and weather conditions, cultivation practices and the amount of competing weeds. In the Dutch university system, a PhD project is supposed to mature after four years, but it often takes longer, depending mostly on the capacities and ambitions of the PhD candidate, the quality of supervision, institutional support, a bit of luck and the side activities the candidate engages in, or to put it negatively, the amount of competing weeds. My PhD project took more than eight years to mature. How come? I was more than happy with my supervisors, the institutional support was good, and in eight years, it is inevitable to experience bad luck sometimes. My capacities can best be judged by others. My ambition is to become a good researcher rather than to have a fast career. Another ambition is to become a homo universalis, in the spirit of Alexander von Humboldt. These ambitions and the freedom that comes with a PhD project made me to invest quite some time in developing qualitative and quantitative research skills and to engage in quite a number of side activities – competing weeds some would say – that caused some of the delay. The analogy between an olive tree and a PhD project could be taken further to discuss the volume of the harvest, the oil content and the number of years a tree remains productive, but let me leave it here.
In this pre-amble, I summarise the story of my PhD trajectory and express my gratitude to the many people I met on the way, people who shared the joy of the good times, people who stood by me during hard times, people who made this PhD project possible and people who contributed to the quality of the output.
In April 2002 I finished my Master’s thesis about climate change and livelihood vulnerability among rural households in Nandom (Northwest Ghana). By choice, the data gathering for this study had taken unusually long, a full year. During that year I had come to love life in Nandom and I had established warm friendships with people in the area. I had been adopted as a son by Mr. Constantio Nurudong – better known as Mr. Kontana – and I had had the privilege to live in Mr. Kontana’s ‘mud castle’ for a year. This gave me the opportunity to experience the beauty, but also the hardships, of daily life in a rural community in Northern Ghana. Mr. Kontana taught me some basics of the Dagaare language; he shared his vast knowledge of Dagara culture with me; and he encouraged me to participate in all realms of village life, for example by giving me a small piece of land to cultivate. I had the time of my life. Back in the Netherlands, while writing my Master’s thesis, I had just one desire: to return as soon as possible.
xiv
The chance to return to Nandom came sooner than expected. About half a year before the completion of my Master’s thesis, my supervisor, Professor Ton Dietz, had brought me into contact with Dr. Kees Burger, econometrician at the Free University of Amsterdam, who was working on a research proposal about migration and environment in Burkina Faso and Ghana. I contributed some ideas to the proposal and a few months later the news came that the proposal had been accepted for funding by the Dutch Council for Scientific Research (NWO). Within the research project there was a vacancy for a PhD candidate to study the environmental and economic consequences of migration from Northwest Ghana. This was a great opportunity to continue work among the Dagara of Nandom along the lines of my previous research, which had found that human mobility has a central place in rural household strategies to deal with environmental scarcity and natural hazards. After a discussion with Kees Burger, in which he reassured me that I would be free to choose a research design that best fitted my disciplinary background in human geography, I decided to accept the offer, and started work in October 2002.
I spent the first three months of my PhD project in Brighton (UK) at the Sussex Centre for Migration Research. This centre offered an excellent course in theories and typologies of migration, and an extremely stimulating academic environment. I would like to thank tutor Professor Russell King and course convenor Professor Richard Black for introducing me to the rich field of migration studies and for their valuable feedback on my research plans. The University of Sussex, and especially the Institute of Development Studies, proved to be an excellent place to develop my research plan, to find and study relevant literature and engage with leading academics in the field of migration, environment and development. I have very fond memories of my encounters, however short, with Robert Chambers, Melissa Leach, Ronald Skeldon and Ann Whitehead, scholars whom I hitherto only knew from the world of paper. I further want to thank my fellow PhDs in the research project – Fleur Wouterse and Victor Owusu – who also followed the migration course in Brighton. We had a few good sessions in which we shared and discussed the best pieces of literature we came across and in which we commented on each other’s research plans.
In January 2003 I travelled to Ghana to carry out a two-month pilot study in a principal destination area of Dagara migrants, the Brong Ahafo Region. I settled in Wenchi Town, a district capital with about thirty thousand inhabitants and a large Dagara community. Through the local office of CARE International I met Cyril Yabepone, a Dagara from Nandom who invited me to stay in his house. I gratefully accepted Cyril’s hospitality and through him I met several other Dagara, some of whom would come to play an important role in the research. Cyril introduced me to Constance Saasie, circuit supervisor at Ghana Education Services and Ben Tibo, extension worker at the Ministry of Food and Agriculture. They accompanied me on
xv
several exploration tours on the back of a motorbike and helped me to organize focus group discussions with Dagara migrants in the – often remote – villages we visited. They were wonderful facilitators and skilful interpreters. In Wenchi I also met my friend Emmanuel Wassah. Our frequent beer sessions were a great source of entertainment and his accounts of life as a Northerner in Southern Ghana were a great source of inspiration.
After the pilot study in the Brong Ahafo Region, I returned to the Netherlands for a three month PhD training at CERES, the Dutch inter-university research school for development studies in Utrecht. Initially, I was not all that pleased to abort my stay in Ghana to follow this course. However, I was soon convinced of its usefulness. The very diverse programme, coordinated by Ab van Eldijk, offered a great opportunity to engage with other PhDs and senior academics in the field of development studies. I particularly liked the inspiring lectures by Frans Schuurman, Mirjam de Bruijn, Han van Dijk, Emiel Drooglever Fortuijn, Gerben Nooteboom, Lorraine Nencel and Ben White. The fruitful discussions with fellow PhDs, which extended far beyond the class room, and in which we gave continuous and critical feedback on each other’s research design and theoretical underpinnings, proved to be an important asset for improvement of our proposals. I particularly appreciated sharing ideas with Bram Buscher, Udan Fernando, Marjan Koster and Theofile Djedjebi. Long after the PhD training, CERES continues to be an important network for young development scholars. The annual conference, in which PhD candidates are encouraged to organize panels and present their findings, is a very accessible and friendly event that helps young researchers to develop their academic skills beyond the daily task of data gathering, analysis and write-up. I had the opportunity to organize two panels for which I wish to thank my co-organizers Annelies Zoomers, Ton van Naerssen and Rico Lie. A special word of thanks is also due to the CERES secretariat, particularly Lolita van Toledo.
Having finished the PhD training and having completed the research plan and test versions of the questionnaires, it was now time to embark on the main fieldwork. Instead of taking a plane, I decided to buy a van and head for Ghana overland. Thank you, Linda van der Zwet and André van der Zijden, for accompanying me on this unforgettable trip.
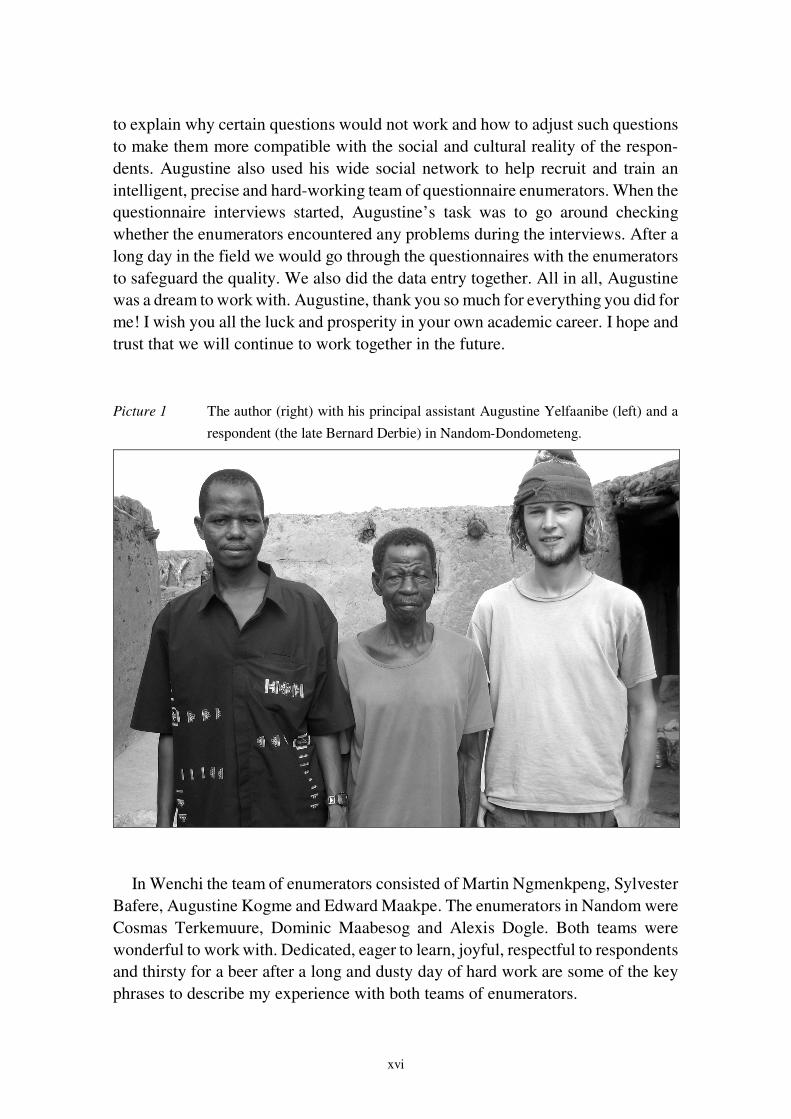
The main fieldwork would last for sixteen months (September 2003 to December 2004). I spent the first half of the fieldwork period in a destination area of Dagara migrants (Wenchi), and the second half in a migrant source area (Nandom). In both areas, I could count on the splendid services of my principal research assistant Augustine Yelfaanibe (see picture 1). It is difficult to express the importance of his input in my research. During many months we shared almost literally every moment of the day. Augustine gave very valuable feedback on the test questionnaires, using his knowledge of Dagara language and culture and his experience with own research
xvi
to explain why certain questions would not work and how to adjust such questions to make them more compatible with the social and cultural reality of the respon-dents. Augustine also used his wide social network to help recruit and train an intelligent, precise and hard-working team of questionnaire enumerators. When the questionnaire interviews started, Augustine’s task was to go around checking whether the enumerators encountered any problems during the interviews. After a long day in the field we would go through the questionnaires with the enumerators to safeguard the quality. We also did the data entry together. All in all, Augustine was a dream to work with. Augustine, thank you so much for everything you did for me! I wish you all the luck and prosperity in your own academic career. I hope and trust that we will continue to work together in the future. Picture 1 The author (right) with his principal assistant Augustine Yelfaanibe (left) and a
respondent (the late Bernard Derbie) in Nandom-Dondometeng.
In Wenchi the team of enumerators consisted of Martin Ngmenkpeng, Sylvester Bafere, Augustine Kogme and Edward Maakpe. The enumerators in Nandom were Cosmas Terkemuure, Dominic Maabesog and Alexis Dogle. Both teams were wonderful to work with. Dedicated, eager to learn, joyful, respectful to respondents and thirsty for a beer after a long and dusty day of hard work are some of the key phrases to describe my experience with both teams of enumerators.
xvii
A big and loud barka yaga (thank you very much) is also due to all respondents of the questionnaires, totalling almost six hundred. The questionnaire interviews took about two hours of their valuable time, but the respondents almost invariably expressed gratitude for getting a chance to share their experiences with us. Although I sometimes have my doubts, I sincerely hope that the kind of research development scholars engage in can in one way or the other contribute to an improvement of the situation of the people we work with.
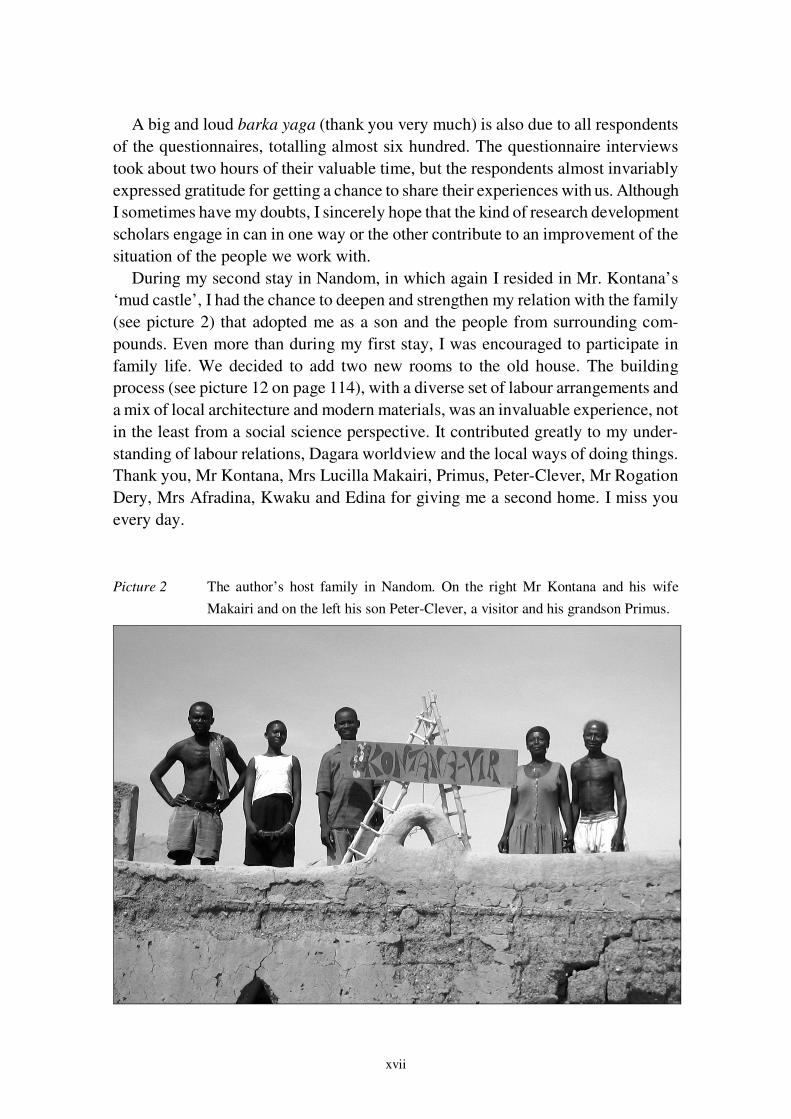
During my second stay in Nandom, in which again I resided in Mr. Kontana’s ‘mud castle’, I had the chance to deepen and strengthen my relation with the family (see picture 2) that adopted me as a son and the people from surrounding com-pounds. Even more than during my first stay, I was encouraged to participate in family life. We decided to add two new rooms to the old house. The building process (see picture 12 on page 114), with a diverse set of labour arrangements and a mix of local architecture and modern materials, was an invaluable experience, not in the least from a social science perspective. It contributed greatly to my under-standing of labour relations, Dagara worldview and the local ways of doing things. Thank you, Mr Kontana, Mrs Lucilla Makairi, Primus, Peter-Clever, Mr Rogation Dery, Mrs Afradina, Kwaku and Edina for giving me a second home. I miss you every day.
Picture 2 The author’s host family in Nandom. On the right Mr Kontana and his wife
Makairi and on the left his son Peter-Clever, a visitor and his grandson Primus.
xviii
The fieldwork in Ghana involved more than administering questionnaires alone. Besides other primary data collection methods, such as life histories and focus group discussions, my analysis of migration, environment and development linkages also relied on secondary data that I collected from several governmental and non- governmental organizations in Ghana. I wish to thank the staff of the Nandom Agricultural Project (rainfall data), the Ministry of Food and Agriculture in Wa, Wenchi and Accra (crop production data), the Meteorological Services Department in Wa and Accra (rainfall data), Ghana Statistical Services in Accra (population census data), Town and Country Planning in Wa (survey maps) and the Geography Department of the University of Ghana in Legon (digital maps and GIS data) for their kind services. Many thanks also to the library of the African Studies Centre (ASC) in Leiden for conserving hidden treasures, like historic census reports of the Gold Coast, going back to the early 20th century. Thank you, Ella Verkaik, librarian at the ASC, for your enthusiasm and interest in my work, and for always taking ample time to show me the way to the treasures.
The secondary data gathering and other activities, such as literature searches and a one-week intensive guest lectureship at the University for Development Studies, compelled me to travel to other parts of Ghana on a regular basis. Fortunately, I had friends – Ghanaian, Dutch and American – who offered me their kind hospitality in most of these places: Abraham Navele, Cindy Noordermeer and Apollo Panou in Wa, Prof David Millar in Bolgatanga, Father Kofi Ron Lange and Father Jon Kirby in Tamale, and Albertine de Lange, Marloes Kraan, Jan van der Horst and Tenzu Navele in Accra. However, I most frequently lodged with my paternal uncle, Reverend Brother Dick van der Geest, in Wa. Ome Dick, it was really nice to have a close relative nearby. Thank you for all you did for me and for many Ghanaian friends over the years. I very much enjoyed the time we spent together and I admire your resilience. You had to deal with many adversities in the past ten years, but you always kept up the spirit. I am very happy to have come to know you better and I hope we will continue to meet often, in Ghana, the Netherlands and in Spain.
A large number of friends made my stay in Ghana a particularly pleasant one. Besides the ones I already mentioned, I would like to thank the following persons for sharing enjoyable moments and helping me out in numerous ways: Patrick Nakpenaa, Festus Langkuu, Mr. Stanislaus Nasaal, Mr. Nilus Kabobah, Mr. Boniface Nakaar, Mr. Raymond Zinser, nurse Mary Bagdome, Dick Elhorst, Brother Wim Luyten and Father Patrick.
During my long fieldwork, several Dutch friends came to visit me. Their many critical questions and comments helped me to see my life and work in Ghana with fresh eyes. Their visits also encouraged me to take short breaks from the fieldwork and to explore parts of the country that I was not yet familiar with. Thank you, Arjen Schijf, Monique Lempers, Geeske Hovingh and Albertine de Lange for sharing
xix
those good times. One visit, by Eva and her sister Raquel had a very special outcome. Ten years after we first met in Granada (Spain) and fell in love, her visit to Ghana rejuvenated the old love that never died, and made us decide to embark on a life-long journey together. Five years later, in September 2009, our beautiful son Ruben Kontana was born. I dedicate this book to both of you. Os quiero muchísimo! Evita, thank you for standing by me in tough times and sharing many beautiful moments. Sorry for being absent-minded, totally absorbed by my work and not in the best of moods sometimes. I look forward to the future now the thesis work is over!
Although I originally planned to do part of the write-up in Ghana, love made me to travel back to Europe as soon as the data gathering was completed in December 2004. In 2005 and the first half of 2006 I enjoyed the liberty that comes with writing a PhD thesis to alternate between the Netherlands and Spain. During periods in Spain, I could withdraw to write. In the Netherlands, I could communicate more intensively with my supervisors and be part of an active academic community. I was very lucky to have Ton Dietz and Kees Burger as my supervisory team. Kees, thank you for initiating this research, for always having time for me and for being so open to my human geographical approach of the research topic. In the past years, I have met quite a number of econometricians and economists who seemed to speak a different language. I never met one with whom it was so easy and pleasant to communicate – for a human geographer – as with you. Thank you for our long, intensive and constructive meetings, which always gave me new ideas and the energy to move on. I want to apologize for the delay in the completion of this thesis. You were the one who had to send progress reports to the funding agency and it must have been frustrating to have one of the three PhD projects delaying so much.
Ton, where should I start, thanking you? You are my father in human geography. Thank you for your confidence and patience. You never doubted that this project would be completed successfully and this gave me the strength to carry on even in times when there was little progress. You were the best supervisor I could imagine because you gave me the freedom to develop my own ideas and the time to let these ideas mature. When you saw that it was really taking too long, you increased the pressure, but always in a constructive and realistic way. Thank you also for your inspiring visit to my fieldwork area in the Brong Ahafo Region – in the equally inspiring company of Valentina Mazzucato. Lastly, I would like to thank you for supporting my decision to write a PhD dissertation based on journal articles. This decision caused extra delay, but it was a step I felt I needed to take in a time when publishing in international journals has become such an important yardstick of success as an academic scholar.
In the summer of 2006, I was asked to take up a position as junior lecturer in the department of Geography, Planning and International Development Studies at the
xx
University of Amsterdam. My tasks would be to teach the courses ‘human geography of developing countries’ and ‘environment and sustainable development’, to assist in a lecture series on education and development and to supervise students in their Master’s thesis project. Erroneously thinking I was pretty close to completing my own thesis work, and assuming that I would have enough time in between the teaching tasks to finish the dissertation within a year or so, I accepted the offer. The reality was different. Teaching used up most of my time and for two years there was very little progress in my PhD work. Things changed for the better after I moved to Spain in the autumn of 2008. I still had to divide my energy between thesis writing and earning an income, but the work I did was less fragmented in time, which allowed me to make more progress in the thesis work.
The demanding nature of the teaching duties was not the only cause of my lack of progress between 2006 and 2008. In the summer of 2004, I had followed a fantastic course at Open Studio in Amsterdam that taught me the basics of video filming and editing. The reason for taking this course was that I wanted to integrate the use of video in my research and, if feasible, make a documentary to disseminate my findings to a wider audience. The first result was a short film, called Shit & Chicks, about a poultry farmer in Northwest Ghana who uses an age-old and environmen-tally sustainable technique to feed his chickens. I initially made this film as a try-out before embarking on a larger film project covering the findings of my PhD research. Despite the simplicity of its storyboard and the primitive camera work and editing, Shit & Chicks became a success and reached a large audience after it entered the short-docs competition at the International Documentary Festival Amsterdam (IDFA) in 2006. In the following years, the film was screened at over twenty documentary film festivals worldwide, on all five continents. I had a great time visiting some festivals and engaging with other film makers from whom I learned a lot. After the success of Shit & Chicks, it was difficult to resist the temptation to concentrate more on film making. However, I realised that it was important to finish the thesis first and explore possibilities for new films afterwards. In the past three years, I did get a few opportunities to combine development studies and film making, for example for the Royal Tropical Institute in Amsterdam and for the PADEV research project (see below).
I very much enjoyed my time as a PhD candidate and junior lecturer at the geography and planning department of the University of Amsterdam (UvA), the place where I started my academic training in 1994. Although I was sometimes frustrated by my lack of progress, I am grateful to our former teaching director Johan Post for giving me the chance to gain experience as a lecturer. The contact with enthusiastic students was very gratifying and the need to leave the niche topic of my own thesis to cover the broader field of development studies was very enlightening. Thank you, Niels Beerepoot, Mirjam Ros-Tonen and Mario Novelli
xxi
for co-organizing the courses. It was a great pleasure to work with you. Also, it was very nice to become a colleague of my old teachers, particularly Ad de Bruijne, Isa Baud, Fred Zaal, Johan Post, Maarten Bavinck, Michaela Hordijk, Leo de Klerk, Sjoerd de Vos and Joos Drooglever Fortuijn. Thank you all for your frequent, but not too frequent hallway or coffee machine inquiries about the progress of my work. Thank you, Sjoerd, for always having your door open to answer my questions about statistics. Thank you, Maarten, for having your house, garden and kitchen open for the great dinner meetings of our Geographies of Inclusive Development group. Thank you, Leo de Haan, for showing me the way in development geography.
The Amsterdam institute of Metropolitan and International Development Studies1 (AMIDSt) had a lively group of PhD candidates, including several who worked on Ghana. Our academic interaction was inspiring and constructive and our social interaction more than pleasant. We commented on each other’s work; some of us visited each other in the field; and we occasionally had a Friday afternoon drink. I hope – and I am confident – that our relation is strong enough to keep in close touch in the future. Thank you, in particular, Koen Kusters, Anna Laven, Marloes Kraan, Toni Verger, Lothar Smith, Udan Fernando, Aenne Post, Hebe Verrest and Mirjam Kabki for being great colleagues and friends. Thank you also, Joram Grünfeld, for being the best possible office mate one can desire.
Besides the UvA colleagues I already mentioned, I am indebted to many more and for many reasons. Thank you, Evert Verkuijlen and Els Veldhuizen, for your encouragement and assistance in integrating Geographic Information System (GIS) analysis in my work. Thank you, Marianne Heelsbergen, Puikang Chan and Guida Morais e Castro for your secretarial support and for being the lively social centre of our department. Thank you, Gert van der Meer, for being the kind of financial manager our university needs in order not to become a ruthless enterprise. Thank you, Arjen Sas, for your software support and for the leading role you played – with Anna Laven – in promoting the use of video in our work. Thank you, Clara Mulder, for your comments on an early draft of Chapter six, and for drawing my attention to the phenomenon of spatial autocorrelation. Thank you, Margriet Poppema, Olga Nieuwenhuijs, Reyna Veldhuis and Marian Hamann for always showing interest and sharing a smile or a laugh. Thank you, Annemieke van Haastrecht, for keeping me informed about the project budget, and thank you, Barbara Lawa, for carrying the administrative burden.
As I mentioned earlier, one of my teaching tasks was to supervise Master students in their thesis work. Lucky enough I managed to lure a total of seven students into doing their fieldwork in Ghana and most of them on a migration topic. Their work contributed a great deal to my understanding of migration dynamics and develop-ment issues in Ghana. Thank you, Wemmy Harteveld, Carolien Primavera, Hester 1 In 2010 AMIDSt merged into the Amsterdam Institute for Social Science Research (AISSR).
xxii
van Deutekom, Christa van der Berg, Kersti Wissenbach, Renske Meilof and Alexander Boer. Supervising you was the teaching task I enjoyed most. And thank you, Maarten Delmeire, for joining Carolien in the fieldwork. Initially, I did not think it was a very good idea for Carolien to bring her boyfriend to the field, but if you had not come, we would never have become such good friends. The Alhambra is waiting for you!
Besides colleagues and students at the University of Amsterdam, I had the privilege to work with or receive feedback from academics from several other universities. Ronald Skeldon and Hein de Haas (migration scholars at the University of Sussex and Oxford respectively) provided valuable comments on an early draft of Chapter five. Richard de Jeu (earth scientist at the Free University of Amsterdam) and Anton Vrieling (remote sensing specialist at the International Institute for Geo-Information Science and Earth Observation in Enschede) generously shared their knowledge of the Normalized Difference Vegetation Index, and contributed their skills in extracting, analysing and interpreting the vast amount of data this index generates. Thank you, Hans Eenhoorn (UN Task Force on Hunger and Wageningen University and Research Centre), for sharing your insights about the opportunities and constraints of smallholder farming in Northern Ghana. Laurens Nijzink (human geographer at the African Studies Centre in Leiden) joined me in some long, intensive and highly abstract sessions that aimed to disentangle the causal structure of migration, population density and agricultural development. In its simplicity, perhaps, the results of our brain-breaking sessions could have been invented by a school boy, but nevertheless, on these sunny afternoons in the beautiful village of Holysloot, I felt closest to being a social scientist.
After having acknowledged the efforts of so many colleagues and friends, it seems paradoxical to state that conducting a PhD research is a lonely enterprise. But it is, at least in my experience and particularly in the writing phase. I spent most of the time behind a computer, trying to make sense of the data and struggling to find the right structure and words to convey the most relevant findings to paper. Even though there were people around with the same disciplinary background or geographic focus, nobody in my direct environment had the same thematic interest. This changed when I was invited by Alfons Fermin and Han Entzinger (Erasmus University of Rotterdam) to conduct a Ghanaian case study for the Environmental Change and Forced Migration Scenarios (EACH-FOR) project. This research, in which seven European universities participated, involved case studies in over twenty countries across the world. Through intensive e-mail contact, newsletters and several workshops and conferences, this project created a network of researchers studying the migration-environment nexus, from which I benefitted greatly. Thank you, Olivia Dun, François Gemenne, Oscar Alvarez Gila, Koko Warner, Tamer Afifi, Stefan Alscher, Jill Jäger, Janos Bogardi, Thomas Faist and Marc Stahl, for
xxiii
sharing ideas. And thank you, Valentina Mazzucato, for drawing Alfons Fermin’s attention to my work.
A second research project that alleviated the loneliness of the PhD writing process involves the – ongoing – Participatory Assessment of Development project (http://www.padev.nl). In this research, the joy of team work rules, thanks to a large extent to the contagious enthusiasm of its coordinator, Ton Dietz. The team is very diverse in terms of nationality and academic status. Master students, PhD students, junior lecturers, senior lecturers, full professors and development practitioners from seven different countries work together, not as equals, but with much freedom, or even encouragement, to express one’s point of view and to criticize one’s seniors. Being taken serious produces a sense of ownership that brings out the best in the team members. Thank you, Ton, for bringing me on board, for the many lessons I am learning, and for keeping me in the shade – temporarily – to complete the thesis work. Thank you, Fred Zaal, Wouter Rijneveld, Dieneke de Groot, Adama Belemvire, Saa Dittoh, David Millar, Francis Obeng, Richard Yeboah, Nicky Pouw, Anika Altaf, Agnieszka Kazimierczuk, Roger Bymolt and other PADEV colleagues for the good times in the field.
This preface may seem a dizzying trip through names, but I have not mentioned the most important ones. Who would I be without my wonderful parents and sisters? I was privileged to grow up in a home with a worldview that combined the tender care of nursing and the openness to other cultures of anthropology. Thank you, Sjaak and Betty, for introducing me to Ghana, even before I was born. Thank you for your continuous support over the years, for your confidence and patience, for your love. Thank you for having your doors open in those in-between periods in which I did not have my own place to stay. Thank you for opening my eyes to the beauty and adventures of the world while at the same time showing me the importance of a warm home. Now that I have become a father myself, I often think of the Chinese poem on my birth announcement, about a bird in an open cage, about the green summerwood with all its attractions, and about the tender care that awaits the bird at home any time it pleases to return. Thank you for putting these beautiful words into practice. Thank you, Rimke and Geertje, for being not only my sisters, but also my best friends. It is amazing how much we share. You are always close to me, no matter how far away.
I would also like to thank my in-laws for welcoming me in the family so warmly. Thank you, Melitón and Mari-Angeles, for letting me use your comfortable and quiet apartment in Granada to write. Many thanks also to my brother-in-law, Pablo, for letting me benefit from his great skills in graphic design, and to my other brother-in-law, Miquel, for introducing me to the great game of chess. Thank you, Raquel, for always letting us use your car to escape the city and go to the country-
xxiv
side. And thank you, Fernando, for too many things to mention here. I hope we will come to visit you in Niger soon.
Finally, I would like to thank the African Studies Centre, and particularly Dick Foeken, for making this publication possible and for their incessant effort to make research on Africa available to a broader public. Thank you also, Howard Turner, for correcting my English in part of this thesis (Chapter three to six). Thank you, Koen Kusters and Bram Buscher for agreeing to be my paranimfen. It’s a big honour to have two great scholars in the field of environment and development by my side. It is also a big honour to have Richard Black, Saa Dittoh, Valentina Mazzucato, Isa Baud and James Sidaway as members of the reading committee. Thank you for your effort to read my work and for coming all the way to Amster-dam to be present at my defence.
Jesse, a few days before this book went to press, you lost your brother in a horrific bomb attack in Marrakesh. As I write these words, I am still in a shock and there are tears on my keyboard. I cannot even start to imagine the pain and emptiness of losing your big brother Sem. He was so full of energy and he had such a positive attitude towards life. I always enjoyed talking with him about his many journeys through Africa. Sem is irreplaceable, but I will do whatever I can to be like a brother to you.
1 Introduction
The title of this PhD thesis was inspired by a classic in social science: ‘The Polish
peasant in Europe and America: Monograph of on immigrant group.’ This work by William Isaac Thomas and Florian Znaniecki, which appeared in five volumes between 1918 and 1920, became a classic for many reasons. One of its qualities was that the authors studied both the source and destination areas of Polish migrants.
At the start of this PhD project, the aim was to study the economic and environ-mental consequences of North-South migration in Ghana, with a focus on rural-rural migration. The impact of migration was to be studied both in source and destination areas of migrants. The causes of North-South migration in Ghana had already been studied quite extensively by other scholars, especially in the 1970s and 1980s. As was common in this period – in which structuralist views dominated social and development theory1 – these studies emphasized structural-historical causes of migration. Northern Ghana was considered a labour reservoir, consciously created by the colonial government to guarantee a constant supply of cheap manpower for the development of an export economy in Southern Ghana.2 More recent studies of underdevelopment and out-migration in Northern Ghana do not completely discard such structural-historical explanations. Some of the root causes of out-migration from Northern Ghana indeed go back to colonial times and some shifts in contemporary migration patterns can partly be attributed to changes in the structural constraints that migrants face. However, the structural-historical perspective is one-sided as it completely ignores migrants’ agency and because it underrates drivers of
1 De Haas (2010) shows convincingly how changing insights in the relation between migration and
development reflect wider paradigm shifts in social and development theory. 2 See for example Thomas (1973); Plange (1979); Shepeherd (1981); van Hear (1982); Songsore (1983);
Sutton (1989) and Cleveland (1991). There is some debate about whether the role of Northern Ghana as a labour reservoir resulted from colonial neglect or deliberate policy (see Sutton 1989).
2
migration that do not fit the centre-periphery model. These weaknesses have been addressed in several Ghanaian case studies3, but one weak point remains, namely the rather crude treatment of environmental factors. Environmental causes of migration, such as erratic rainfall and poor soils, are not ignored, but are usually taken for granted and not subjected to critical scrutiny and empirical testing.
In the course of this research, it became clear that a study of the impact of migration would have serious flaws without a more thorough understanding of migration causes. The same factors that influence people’s decision to migrate also influence the impact of migration (Taylor 1999). For example, a young farmer who migrates because of a quarrel with his father over access to land is less likely to send remittances than a professional whose education has been financed by relatives at home and who migrates to take up a white-collar job. Vice versa, the impact of migration shapes the conditions in which people decide to migrate, stay put or return. For example, if a domestic migrant has assisted a relative at home to set up a successful business, this relative will have less reason to migrate. At the same time he or she will have more means to migrate, including possibly to international destinations. The separation of migration causes and impacts, as is common in much of the migration literature, prevents a proper understanding of the relation between migration and wider societal processes (de Haas 2010). Therefore, it was decided to integrate migration causes in the research design. After including migration causes in the analysis, the content of this thesis is best described as a study of migration, environment and development linkages in migrant source and destination areas. In the study of migration causes, the emphasis lies on factors pertaining to the natural environment. However, an attempt is made to assess the importance of environ-mental causes vis-à-vis other drivers of migration.
Ghana’s Upper West Region was chosen as a migrant source area, and the Brong Ahafo Region as a destination area.4 Ecologically, this migration flow involves a movement from the interior savannah with one rainy season to the forest-savannah transition zone with two rainy seasons. In political-economical terms the movement is from a poor and underdeveloped periphery, not to a core of political and economic power, but to a semi-peripheral food crop frontier. Within the Upper West Region, numerically, there are three dominant groups: the Dagara, the Wala and the Sisala. In the present study, the analysis is limited to the Dagara who make up 57.5 percent of the region’s population (Ghana Statistical Service 2005).
3 See for example Brydon (1992); Gyasi & Ayivor (1992); Twum-Baa et al. (1995); Abdulai (1996); Mensa
Bonsu (2003); Abdul-Korah (2008); Lobnibe (2010) 4 Project colleague Victor Owusu studied migration from the Upper East Region to the Brong Ahafo
Region (Owusu 2007). The Brong Ahafo Region was selected as a research area because it is the principle destination area of Dagara migrants. Moreover, contrary to other destination regions, the Brong Ahafo Region primarily attracts rural-rural migrants.
3
The Dagara
The Dagara people are an ethnic group whose home area is located in Northwest Ghana and Southwest Burkina Faso. There is some debate about the correct name for this group, resulting from the fact that ethnic boundaries in Northwest Ghana are not clear-cut (Goody 1967; Lentz 2006). Alternative labels for this group are Dagaaba, Dagaba, Dagarti, Lobi-Dagarti and Dagari. Sometimes a distinction is made between the Dagaaba who live around Jirapa, Nadowli and Wa – called Dagarti by the colonial rulers – and the Dagara of Lawra and Nandom – called Lobi-Dagarti by the colonial rulers (Lentz 2006). Indeed, there are considerable linguistic differences between these areas and there are some cultural differences, too. The term Dagari is more common in Burkina Faso. In this study, I have chosen to use the term Dagara because fieldwork in the North (migrant source area) was carried out in the villages around Nandom. Data gathering in the migrant destination area in the Brong Ahafo Region was carried out among Dagara (or Dagaba) from different source areas, including Nandom, Lawra, Jirapa, Nadowli and further South. The lively debate among Ghanaian and international scholars about ethnic labels is very interesting for studies of migration, identity and regional politics, but in the present study, the discussion is of less relevance.
Linguistically, the Dagara are part of the Mole-Dagbane group, which also includes the Mossi, Dagomba, Frafra, Mamprusi, Wala and others. The origins of the people who are now called Dagara are also subject to considerable debate. The most commonly adhered to thesis nowadays is that the Dagara are the descendants of people who moved west from the more centrally organized Dagomba state. They settled in empty lands along the Black Volta or absorbed earlier settlers trough conquest and inter-marriage. Until the advent of colonial rule, the social and political organization of the Dagara was based on lineage groups and earth shrine areas. Each earth shrine area was controlled by an earth priest (tendaana or tengansob) who was usually a descendant of the first Dagara settler in the area. The earth priest made sacrifices to the land gods and allocated land to new settlers and established families who wished to expand their farms. Unlike neighbouring groups like the Wala and the Dagomba, the Dagara had no central authority beyond the village level until the British introduced a system of chieftaincy as was common in other parts of Ghana. However, up to date, earth priests maintained their function of custodians of the land.5
The Dagara are predominantly small-scale farmers who engage in food crop cultivation and animal husbandry. The most common crops they cultivate are millet, sorghum, maize, rice, groundnuts, beans and yam and the most common animals
5 See Van der Geest (2004) for a more detailed review of the literature about the social organization and
origins of Dagara people.
4
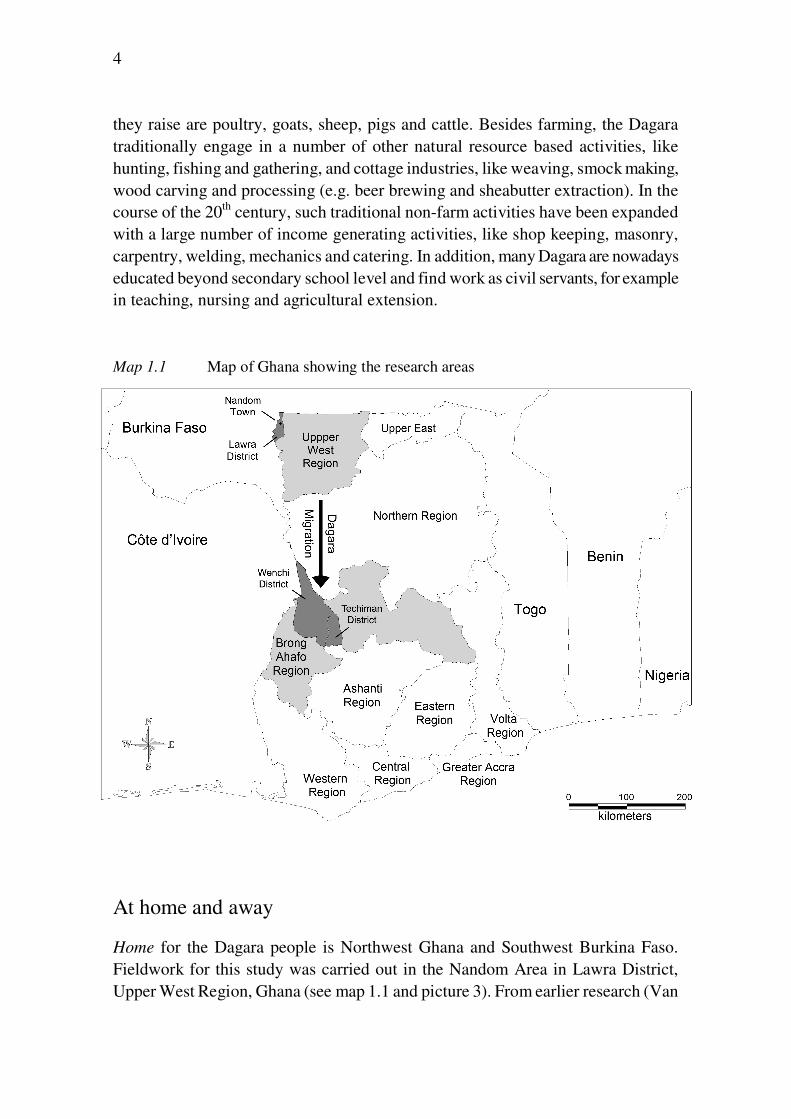
they raise are poultry, goats, sheep, pigs and cattle. Besides farming, the Dagara traditionally engage in a number of other natural resource based activities, like hunting, fishing and gathering, and cottage industries, like weaving, smock making, wood carving and processing (e.g. beer brewing and sheabutter extraction). In the course of the 20th century, such traditional non-farm activities have been expanded with a large number of income generating activities, like shop keeping, masonry, carpentry, welding, mechanics and catering. In addition, many Dagara are nowadays educated beyond secondary school level and find work as civil servants, for example in teaching, nursing and agricultural extension. Map 1.1 Map of Ghana showing the research areas
At home and away
Home for the Dagara people is Northwest Ghana and Southwest Burkina Faso. Fieldwork for this study was carried out in the Nandom Area in Lawra District, Upper West Region, Ghana (see map 1.1 and picture 3). From earlier research (Van
5
der Geest 2004), it was known that migration, both seasonal and more permanent, is a central element of rural livelihoods in this area. Away could theoretically be anywhere in the world, but so far, only a very small minority of Dagara people have migrated out of Ghana. For most Dagara migrants, presently, away is the Brong Ahafo Region in Ghana’s middle belt.6 This region has become Ghana’s principal food crop frontier in the past decades. Whereas migration to other regions is predominantly rural-urban, most Dagara in the Brong Ahafo Region settle in rural areas. Migrants from the Upper West Region are concentrated in the North of the Brong Ahafo Region, along the Wa-Kumasi road. Wenchi District was selected as the principal research area in the destination region (see map 1.1 and picture 4). This district had the highest number (23,965) and proportion (14.38 percent) of Dagara migrants according to the last population census in 2000. However, one of the nine study village was in the neighbouring Techiman District, which has the second largest Dagara community (20,805 or 11.92 percent).
According to the population census of 2000, of all ten regions in Ghana, the Upper West Region had the highest migration deficit. A total of 227,874 people who were born in the Upper West Region (31 percent) had migrated out of the region, mostly to Southern Ghana. The counter flow of people born in other regions living in the Upper West was much smaller (36,221). The Brong Ahafo Region was the main destination area of migrants from the Upper West (90,704). Almost half of them (44.7 percent) were women. People born in the Upper West constitute 5.3 percent of the total population of the Brong Ahafo Region. This figure excludes second generation migrants. A way to include the children and grand-children of first-generation migrants is to look at the number of people with an ‘Upper West ethnic background’. Together, the Dagara, Wala and Sisala constitute 9.3 percent of the total population of the Brong Ahafo Region. The Dagara are most numerous (6.4 percent) followed by the Wala (1.6 percent) and the Sisala (1.3 percent).
The documented history of Dagara migration starts only twelve years before the publication of ‘The Polish Peasant’ by Thomas & Znaniecki (1918). In 1906, a delegation of thirty ‘community representatives’ from Northern Ghana were taken on a ‘reconnaissance tour’ to the gold mines in Tarkwa in the present Western Region. In the next year, the first group of twenty-six labour migrants travelled to Southern Ghana to work in the mines (Lentz 2006: 140). An important research method in ‘The Polish Peasant’ was to study correspondence between migrants and their relatives and friends at home. It would have been very interesting to study, like Thomas and Znaniecky, the personal experiences of the first Dagara migrants in
6 At the time of the last population census, in the year 2000, 35.7 percent of all Dagara in Ghana were living
in Southern Ghana, of whom 50.6 percent in the Brong Ahafo Region.
6
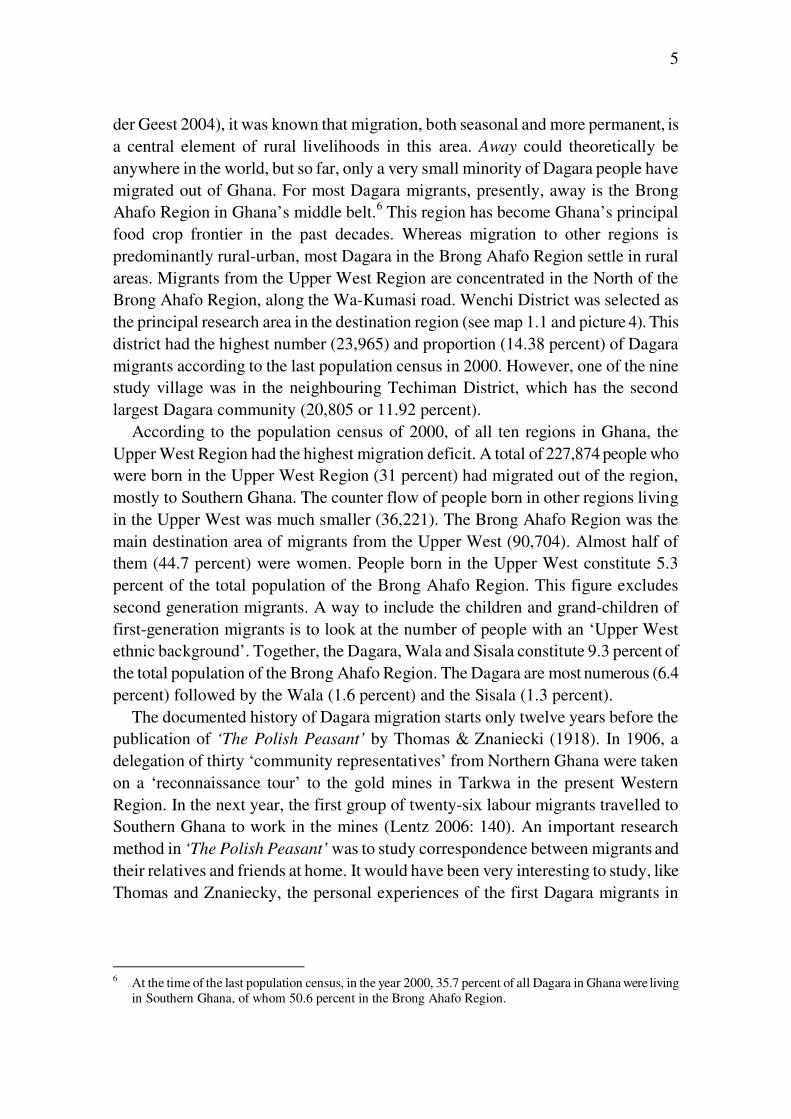
Picture 3 The Nandom station with on the left the Kumasi bus. In 2007 the central street of
Nandom was tarred (not in picture).
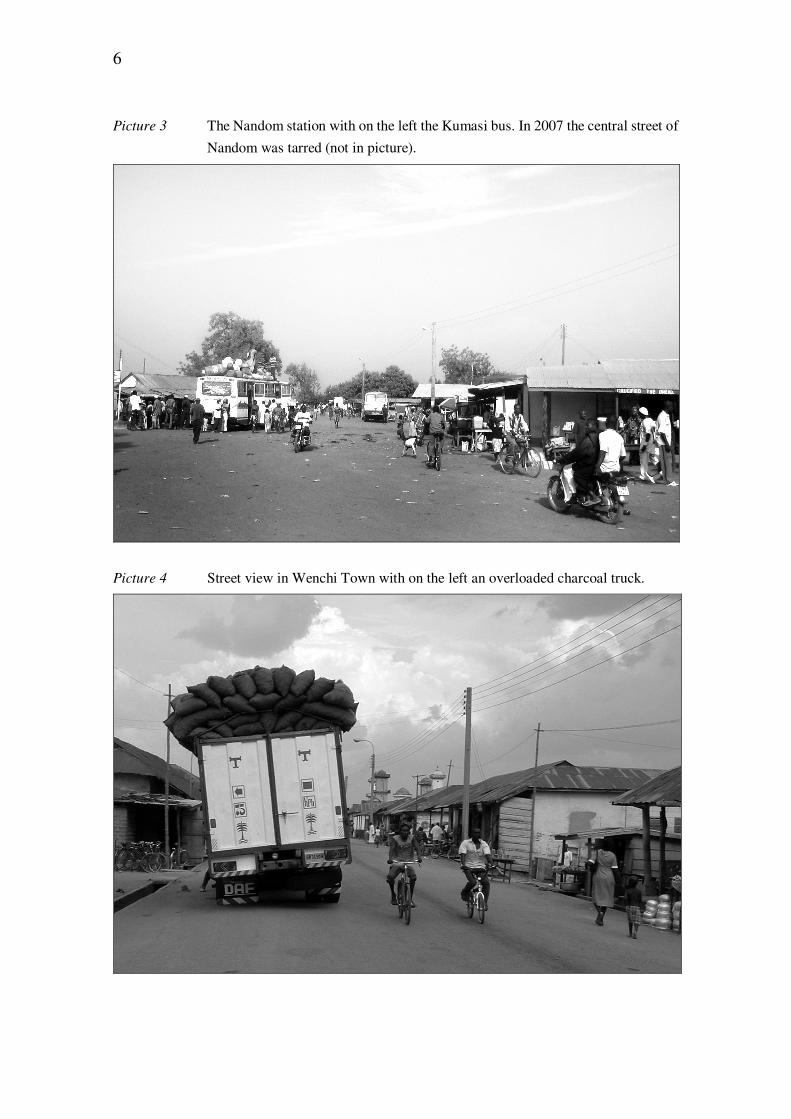
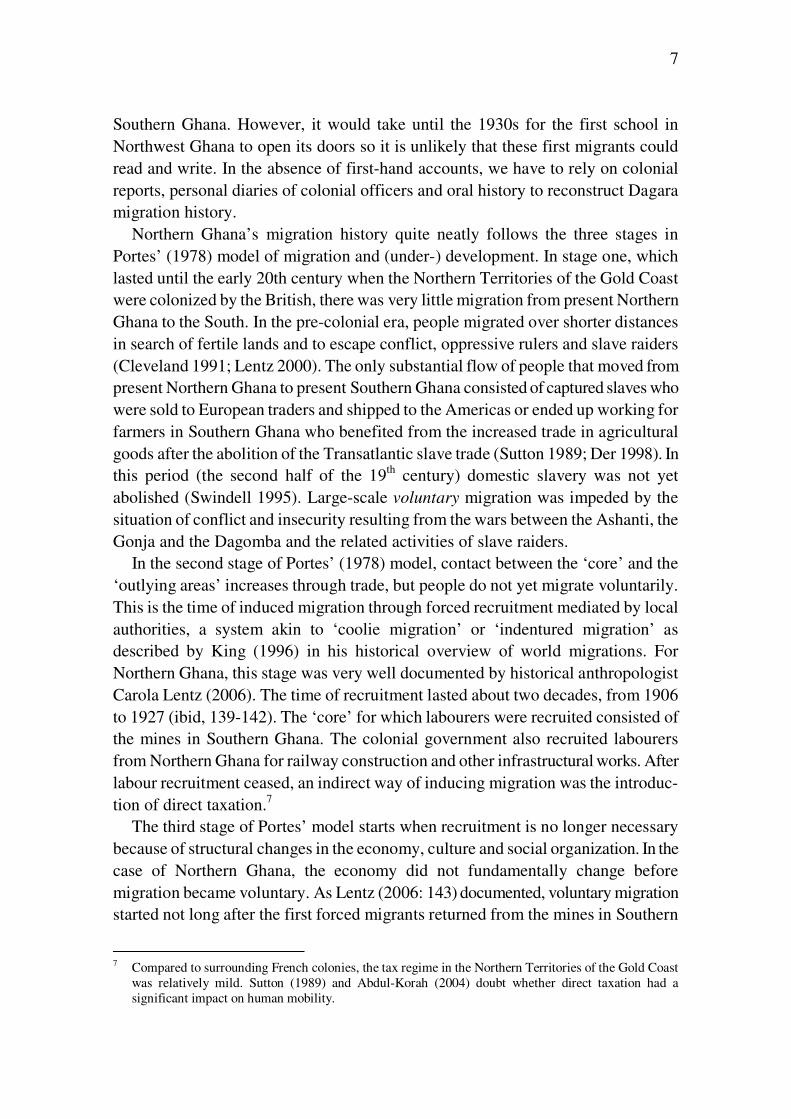
Picture 4 Street view in Wenchi Town with on the left an overloaded charcoal truck.
7
Southern Ghana. However, it would take until the 1930s for the first school in Northwest Ghana to open its doors so it is unlikely that these first migrants could read and write. In the absence of first-hand accounts, we have to rely on colonial reports, personal diaries of colonial officers and oral history to reconstruct Dagara migration history.
Northern Ghana’s migration history quite neatly follows the three stages in Portes’ (1978) model of migration and (under-) development. In stage one, which lasted until the early 20th century when the Northern Territories of the Gold Coast were colonized by the British, there was very little migration from present Northern Ghana to the South. In the pre-colonial era, people migrated over shorter distances in search of fertile lands and to escape conflict, oppressive rulers and slave raiders (Cleveland 1991; Lentz 2000). The only substantial flow of people that moved from present Northern Ghana to present Southern Ghana consisted of captured slaves who were sold to European traders and shipped to the Americas or ended up working for farmers in Southern Ghana who benefited from the increased trade in agricultural goods after the abolition of the Transatlantic slave trade (Sutton 1989; Der 1998). In this period (the second half of the 19th century) domestic slavery was not yet abolished (Swindell 1995). Large-scale voluntary migration was impeded by the situation of conflict and insecurity resulting from the wars between the Ashanti, the Gonja and the Dagomba and the related activities of slave raiders.
In the second stage of Portes’ (1978) model, contact between the ‘core’ and the ‘outlying areas’ increases through trade, but people do not yet migrate voluntarily. This is the time of induced migration through forced recruitment mediated by local authorities, a system akin to ‘coolie migration’ or ‘indentured migration’ as described by King (1996) in his historical overview of world migrations. For Northern Ghana, this stage was very well documented by historical anthropologist Carola Lentz (2006). The time of recruitment lasted about two decades, from 1906 to 1927 (ibid, 139-142). The ‘core’ for which labourers were recruited consisted of the mines in Southern Ghana. The colonial government also recruited labourers from Northern Ghana for railway construction and other infrastructural works. After labour recruitment ceased, an indirect way of inducing migration was the introduc-tion of direct taxation.7
The third stage of Portes’ model starts when recruitment is no longer necessary because of structural changes in the economy, culture and social organization. In the case of Northern Ghana, the economy did not fundamentally change before migration became voluntary. As Lentz (2006: 143) documented, voluntary migration started not long after the first forced migrants returned from the mines in Southern
7 Compared to surrounding French colonies, the tax regime in the Northern Territories of the Gold Coast
was relatively mild. Sutton (1989) and Abdul-Korah (2004) doubt whether direct taxation had a significant impact on human mobility.
8
Ghana. Although most mine workers returned with possessions that impressed their friends and relatives at home, the reports about work in the mines were not positive. The conditions were poor and the dead rates were high. There were much better opportunities for work in the booming cocoa sector where wages and working conditions were better. Another advantage of work in the cocoa sector was that labour demand peaked during the off-season in the North, which lasted from October to April. In the early stages of the North-South migration system, migration was predominantly seasonal and male-dominated. Migrants tried to return to the North for the farming season even though until the 1930s, they had to walk all the way to the South, which took them about two weeks.
Portes’ model only has three stages. In the case of the Dagara from Northwest Ghana, a fourth stage has been entered. In this – present – stage, the migration system has matured. A shift has been made from labour migration to a variety of migration types. In the early stages of the Dagara migration system, almost all migrants were employed as mine workers, farmhands, labourers in infrastructural projects or night-soil collectors (toilet cleaners) who regarded their stay as temporary. Nowadays, Dagara migrants increasingly settle in Southern Ghana to establish their own farms; to earn an income through self-employment in the informal economy; or to work in white-collar jobs like teaching and nursing. Other changes in the Dagara migration system are a shift from individual, male-dominated migration to the movement of entire households with more gender balance. It has also become more common for women to migrate independently. Many Dagara migrants still return to the Upper West after some years, but the movement to Southern Ghana has become increasingly permanent.8
Problem statement, disciplinary embedding and research questions
This PhD project is part of a larger research entitled ‘Rural migration and the environment in West-Africa’, which was funded by the Dutch Council for Scientific Research (NWO). The problem statement of this larger research project is summarized as follows:
“The Sahelian zone in Africa shows significant but fluctuating flows of migrants from relatively dry areas to more humid zones. In the absence of such migration, the extent of soil depletion would be considerably higher in the place of origin, whereas migration leads to environmental damage in the areas of destination where forest is turned into cultivated land. Do the benefits of reduced depletion outweigh the costs of deforestation? This central question is analyzed in two sub -projects that investigate details of the process in Burkina-Faso and in Ghana. (..) In Ghana,
8 The Dagara migration system is not exceptional in this sense. In the second half of the 20th century, a
similar shift in migration patterns has taken place more generally in West African migration systems (Amin 1974).
9
the research focuses on the impact of migration and remittances on the cropping patterns and investments in the place of origin, and compares this with the type of land use of the ‘typical’ migrant from that region in the place of destination. (..) The common factors of the two projects are the comparison of economic and environmental effects of migration in regions of origin and destination, and the assessment of factors underlying the migration and remittance decisions” (Burger 2001: 1).
The phrasing of the problem statement contains an implicit assumption that population growth has a negative impact on the environment. A second assumption is that environmental gains and losses in migrant source and destination areas are comparable. These assumptions were not incorporated in the research design of this PhD project. A more open approach to population-environment relations was adopted (see figure 1.1) and no attempt was made to quantify the question whether “the benefits of reduced depletion outweigh the costs of deforestation”.
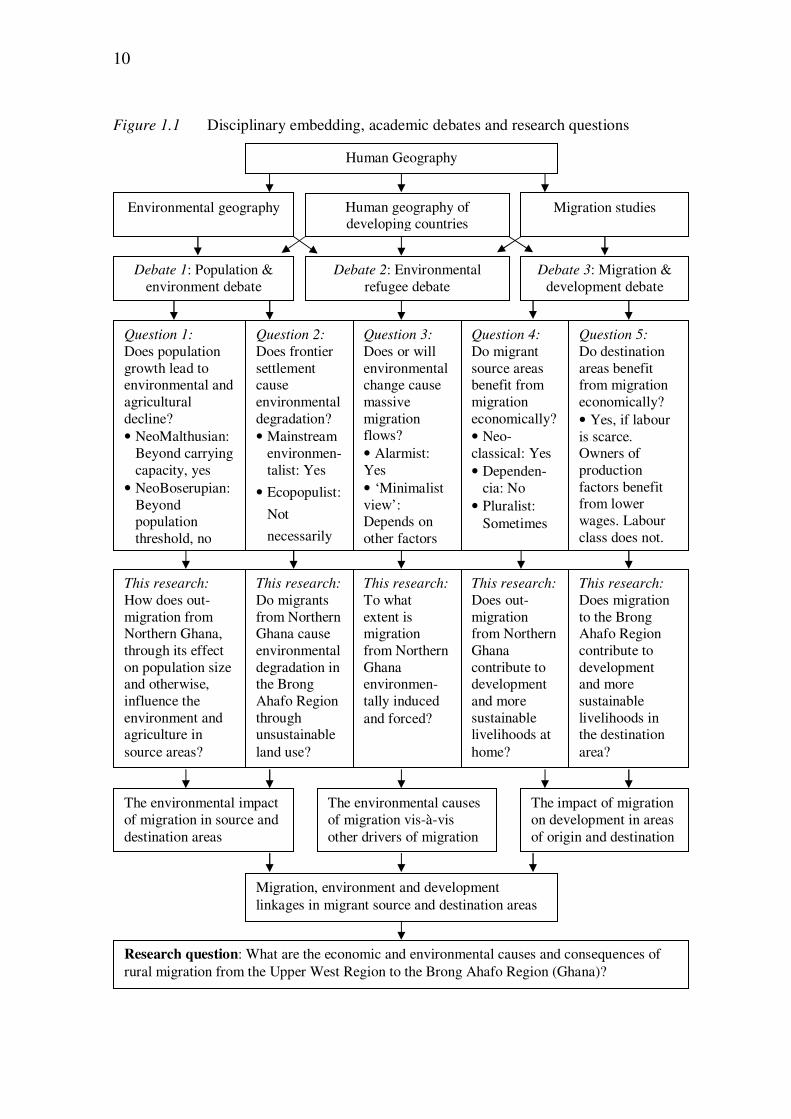
Figure 1.1 shows the disciplinary embedding of this research. First and foremost, this PhD project has been an exercise in human geography. In my view, human geography is multi-disciplinary by nature. In this study, methods and insights are borrowed from other disciplines like physical geography, remote sensing, history, demography, migration studies, anthropology, economics and agronomy. What more makes this research an exercise in human geography? First, the topic of migration, although fruitfully studied by academics from many disciplines, is particularly suitable for geographic analysis. Human geography studies the multiple links between humans and their natural, social, economic, cultural and political environment. Causes of migration are to a large extent rooted in the characteristics of source and destination areas and migration can have profound impacts on the natural, social, economic, cultural and political environment at home and away. Second, one of the strengths of much geographic research is the combination of analyses at different levels of scale. Linking local processes and patterns of human behaviour with wider regional structures and outcomes is essential for studies in the field of population and environment (Blaikie 1994). In the present research this tradition in human geography was explicitly followed. Third, at the regional and national level, Geographic Information System (GIS) applications were used to enable a spatial analysis of migration, environment and development linkages and to embed the local case study findings in a regional context. In the data presentation ample use is made of maps. Fourth, the importance of population density – which is a key variable in much geographic research – as an intervening variable in migration, environment and development linkages was highlighted throughout this study. Population pressure in rural areas has been widely acknowledged as an important driver of migration to urban centres and to sparsely populated frontier areas (King 1996), but the role of population density in mediating migration impacts has largely been ignored by migration scholars.
10
Figure 1.1 Disciplinary embedding, academic debates and research questions
Question 2:
Does frontier settlement cause environmental degradation? • Mainstream
environmen-talist: Yes
• Ecopopulist:
Not
necessarily
This research:
How does out-migration from Northern Ghana, through its effect on population size and otherwise, influence the environment and agriculture in source areas?
This research:
Do migrants from Northern Ghana cause environmental degradation in the Brong Ahafo Region through unsustainable land use?
Question 1:
Does population growth lead to environmental and agricultural decline? • NeoMalthusian:
Beyond carrying capacity, yes
• NeoBoserupian: Beyond population threshold, no
Debate 1: Population & environment debate
Human Geography
The impact of migration on development in areas of origin and destination
Migration, environment and development linkages in migrant source and destination areas
Question 4:
Do migrant source areas benefit from migration economically? • Neo-classical: Yes • Dependen-
cia: No • Pluralist:
Sometimes
This research:
Does migration to the Brong Ahafo Region contribute to development and more sustainable livelihoods in the destination area?
Environmental geography
Debate 3: Migration & development debate
Migration studies
This research:
To what extent is migration from Northern Ghana environmen-tally induced and forced?
The environmental impact of migration in source and destination areas
Human geography of developing countries
Question 5:
Do destination areas benefit from migration economically? • Yes, if labour is scarce. Owners of production factors benefit from lower wages. Labour class does not.
Research question: What are the economic and environmental causes and consequences of rural migration from the Upper West Region to the Brong Ahafo Region (Ghana)?
Debate 2: Environmental refugee debate
Question 3:
Does or will environmental change cause massive migration flows? • Alarmist: Yes • ‘Minimalist view’: Depends on other factors
The environmental causes of migration vis-à-vis other drivers of migration
This research:
Does out-migration from Northern Ghana contribute to development and more sustainable livelihoods at home?
11
At the core of the research are three academic debates: the population and environment debate, the migration and development debate and the environmental refugee debate. Some key questions of these debates, which are relevant for the present research, are highlighted in figure 1.1, and the crude positions of different schools of thought are indicated. The relevance of different bodies of literature and theory varies between migrant source and destination areas. In the case of the population-environment debate, for example, Malthusian theory about the effect of population growth beyond an area’s carrying capacity and Boserupian theory about transition to more intensive and sustainable land use under increasing population pressure are more relevant in densely populated migrant source areas than in sparsely populated tropical frontiers. In the latter areas, the academic debate about the role of settler farmers in deforestation processes is more relevant for studying the environmental effect of migration. Similarly, separate bodies of literature have evolved with regard to the impact of migration on development in source and destination areas. In the case of the environmental refugee debate, the focus has been primarily on environmental push factors in migrant source areas.
The environmental refugee debate deals with the question whether environmental scarcity, environmental degradation and sudden-onset environmental hazards are major drivers of involuntary migration – or whether they will be in the future. Recent interest in this theme results from the widespread attention for climate change and public perceptions of a ‘wave of migrants’ from the world’s poorer areas into more affluent parts. Within this debate, two broad views can be distinguished: the alarmist view and the minimalist view9. Alarmist scientists predict a massive exodus of refugees from areas that are struck by environmental disaster. By contrast, advocates of the minimalist view consider the natural environment not more than a ‘contextual factor’ that influences human mobility only in combination with other forces in the social, economic and political domain. The alarmist view has also been criticized by livelihood researchers who emphasize that migration from poorly endowed and risk-prone areas is not a ‘last resort’, but rather an element in a larger package of coping mechanisms and adaptive strategies. Northern Ghana is commonly portrayed as a drought-prone area with poor agro-ecological conditions and chronic food security problems. It is also an area that experiences large-scale out-migration. Insights from the environmental refugee debate are used in this dissertation to determine the role of the environment as a driver of North-South migration and to assess to what extent people are forced to migrate.
The population-environment debate primarily deals with the impact of demo-graphic and socio-economic change on natural resources management and environmental quality. Migration alters population size and composition in migrant source and destination areas, and can bring about changes in production and 9 The term ‘minimalist view’ was taken from Suhrke (1994).
12
consumption patterns that can have an impact on the environment. So far, the environmental impact of out-migration in migrant source areas has received very little attention in academia and no different schools of thought have evolved around this theme. In this dissertation, insights from the Malthus-Boserup debate are combined with insights and methods from the migration and development literature to study the effect of out-migration on land use sustainability in migrant source areas. In addition, a twenty-five years time series of remotely sensed vegetation data and population census data are used to explore migration-environment linkages in Ghana.
The environmental impact of migration to tropical frontier areas has received more attention in academia. Principal views in this field of research could be labelled ‘mainstream environmentalist’ and ‘neo-populist’ (Blaikie 1998) or ‘ecopopulist’ (Dietz 1996). In the early mainstream environmentalist view, local people were considered “irrational and ignorant and a major part of the problem” (Post & Snel 2003: 86). In this view, the traditional land use systems of small-scale farmers who settle in agricultural frontiers are a major driver of deforestation. In the past two decades, mainstream environmentalist approaches have shifted towards neo-liberalism, which views local people as rational actors who are responsive to incentives to conserve the environment (ibid). The neo-populist approach is strongly actor oriented and considers indigenous knowledge just as important as scientific knowledge (Dietz 1996; de Haan 2000). It challenges mainstream environmental degradation and deforestation discourses, and has a more positive outlook on local farmers’ land use sustainability.10 Neo-populist ideas about land use sustainability of migrant farmers, who are less familiar with local ecological conditions and who are subject to insecure land tenure regimes, are more ambiguous. In the present study, the environmental impact of Dagara migration to the agricultural frontier in Ghana’s Brong Ahafo Region is assessed from multiple angles, including LANDSAT images, census data, local discourses of environmental change and a survey comparing farming methods of settlers and native farmers.
The third body of literature that is of relevance in the present research involves the migration and development debate. Elements of this broad field of research include the impact of migration on development in migrant source and destination areas and vice versa the impact of development on human mobility. The literature on these sub-fields of the migration and development debate is somewhat dispersed. Studies about the impact of migration on development in migrant sending areas have primarily been conducted in less developed countries. The economic impact of migration in migrant receiving areas has been studied mostly in more developed countries (e.g. studies of ethnic entrepreneurship). This would make sense if
10 See for example Leach & Mearns (1996) and Leach & Fairhead (2000). These authors are cited by de
Haan (2000) as pioneers of the neo-populist approach, but do not use this term themselves.
13
migration flows would exclusively run from less developed to more developed countries, but this is not the case. The vast majority of migrants in the world migrate within the borders of their home country. A reason why the impact of migration on development in domestic destinations in the Global South has received relatively little attention is perhaps that the relation is relatively straightforward, at least as compared to the effect of migration in sending areas and as compared to the effect of in-migration in more developed countries where the existence of social security systems makes the relation more complex. The two schools of thought that have dominated the migration and development debate up to the 1980s – neo-classical equilibrium theory and dependency theory – and whose positions with regard to the impact of migration on sending areas were diametrically opposite, do not seem to disagree greatly about the impact of migration on development and labour markets in destination areas. Both schools of thought postulate that migrants tend to move from areas where labour is abundant and where other factors of production are scarce to areas where labour is scarce and other factors of production are abundant.11 Migration contributes to development in destination areas through a more balanced allocation of production factors. This primarily benefits owners of the production factors land and capital. For labourers and tenant farmers the effect is more likely to be negative as they compete with migrants over jobs and in the case of farm migration over access to land. In-migration may reduce wages and increase land rents. Negative effects of migration on development in destination areas tend to be emphasized when the flow is perceived to be too large to be absorbed in terms of employment, housing and other amenities. This is most common in the case of massive rural-urban migration and large-scale refugee flows.
The impact of migration on development in migrant source areas has been studied extensively over the past decades and continues to attract attention from scientists and policy makers. In the 1950s and 1960s neo-classical equilibrium and moderniza-tion theories dominated this field. The effect of out-migration in areas of origin was thought to be positive. Migration of surplus labour would result in higher wages and in the end reduce the need to migrate. It was also expected that return migrants would become ‘agents of change’ in their home areas. In the 1970s and 1980s dependencia theory became more influential. In this view migration is part and parcel of the capitalist system that removes resources from peripheral regions to centres of economic growth, leaving migrant source areas in a state of dependency. Since the 1990s pluralist views have dominated the field. It is now commonly accepted that the impact of migration on development is time and place specific and the focus is now on finding out under which circumstances migration has positive and negative effects on development in migrant source areas.
11 The observation that migrants move from labour-abundant to labour scarce areas is somewhat simplistic.
Many additional factors that contribute to or constrain migration flows have been identified.
14
The research questions posed in this PhD project (see figure 1.1) were to be answered primarily with data from household level questionnaires. Separate questionnaires were designed for migrant households in rural destinations (N = 203) and households in the source area (N = 204).12 Besides these two core surveys, an additional questionnaire was designed for native households in the destination area (N = 73). This questionnaire had two aims: firstly, to compare the environmental sustainability of migrants’ and native farmers’ cultivation practices; and secondly, to explore economic linkages between migrants and the native population, for example in land rent and labour relations.13 Separate questionnaires were further conducted among seasonal migrants (N = 71) and rural-urban migrants (N = 30) in the Brong Ahafo Region. A mainly qualitative community questionnaire was carried out in the destination villages to discuss issues that went beyond the household level (e.g. settlement history, perceptions of environmental change and market conditions).14
An implication of the initial research design, with much emphasis on household questionnaires, was that it would provide insights on the links between migration, economy and environment at the household level, which could not automatically be upgraded to the area level at which the central research question was posed. It would tell us something about the relation between migration and livelihood strategies (instead of economy) and natural resource management (instead of environment). This was considered problematic, especially in the case of migration-environment linkages. An option could have been to simply accept this limitation and to change the main question into a more people-centred one, like: What are the consequences
of migration for the sustainability of rural livelihoods in areas of origin and
destination? The term ‘sustainability’ incorporates economic as well as environ-mental (and social) aspects of rural people’s livelihoods, both in the short term and in the long term. However, in the course of the research, it became clear that the analysis would benefit greatly from integration of secondary data on a higher level of scale. Triangulation of household survey data with a combination of inter alia census data (both recent and historical), agricultural production data and remote sensing data was sought to better understand the dynamics of migration, environ-ment and development in Ghana, and to place the local research areas in a broader geographic and historical context. A disadvantage of this shift is that much of the wealth of data at the household level remains under-reported here. The questionnaire
12 Virtually all households in the source area had migrant children or siblings so there was no need to stratify
the survey sample into migrant sending and non-migrant sending households. 13 This questionnaire also enables a comparison of living standards of settlers and natives. Such an analysis
is presented in a paper with the provisional title “We farm for them: Economic consequences of Dagara migration to the Brong Ahafo Region”. The paper is in progress, but could not be included in this book because of time constraints.
14 All questionnaires can be downloaded from the researcher’s website (www.keesvandergeest.nl).
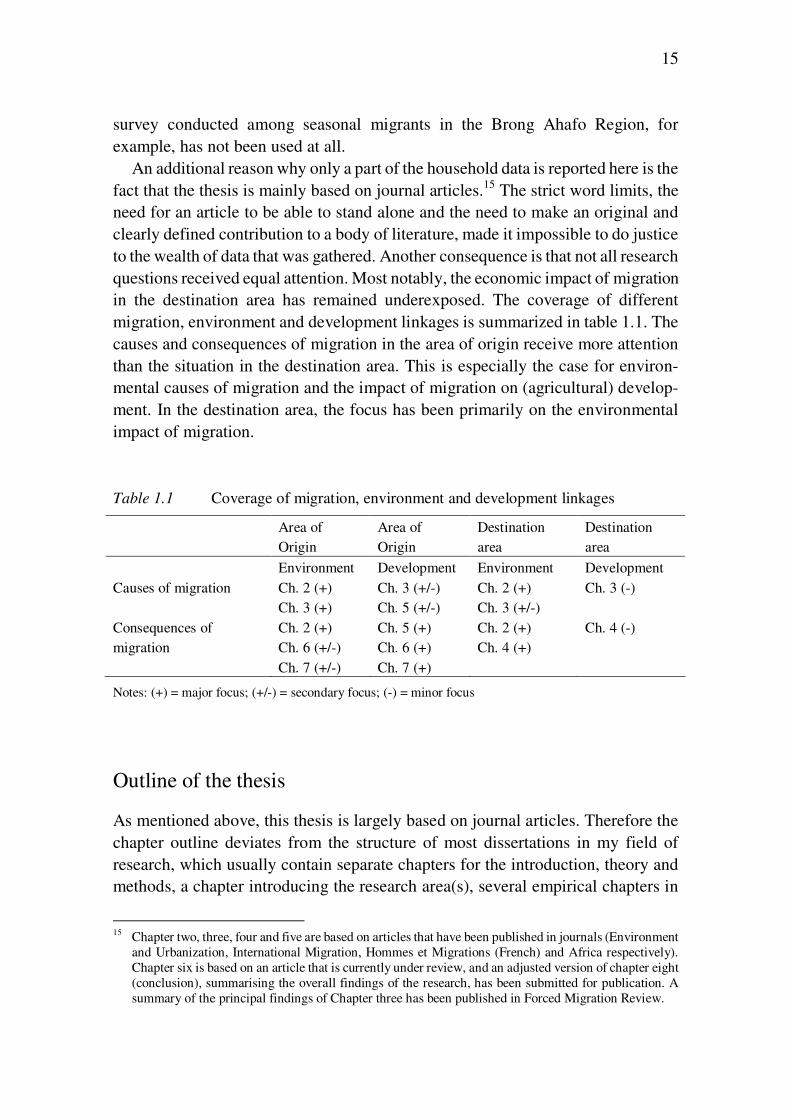
15
survey conducted among seasonal migrants in the Brong Ahafo Region, for example, has not been used at all.
An additional reason why only a part of the household data is reported here is the fact that the thesis is mainly based on journal articles.15 The strict word limits, the need for an article to be able to stand alone and the need to make an original and clearly defined contribution to a body of literature, made it impossible to do justice to the wealth of data that was gathered. Another consequence is that not all research questions received equal attention. Most notably, the economic impact of migration in the destination area has remained underexposed. The coverage of different migration, environment and development linkages is summarized in table 1.1. The causes and consequences of migration in the area of origin receive more attention than the situation in the destination area. This is especially the case for environ-mental causes of migration and the impact of migration on (agricultural) develop-ment. In the destination area, the focus has been primarily on the environmental impact of migration. Table 1.1 Coverage of migration, environment and development linkages
Area of Origin
Area of Origin
Destination area
Destination area
Environment Development Environment Development Causes of migration Ch. 2 (+)
Ch. 3 (+) Ch. 3 (+/-) Ch. 5 (+/-)
Ch. 2 (+) Ch. 3 (+/-)
Ch. 3 (-)
Consequences of migration
Ch. 2 (+) Ch. 6 (+/-) Ch. 7 (+/-)
Ch. 5 (+) Ch. 6 (+) Ch. 7 (+)
Ch. 2 (+) Ch. 4 (+)
Ch. 4 (-)
Notes: (+) = major focus; (+/-) = secondary focus; (-) = minor focus
Outline of the thesis
As mentioned above, this thesis is largely based on journal articles. Therefore the chapter outline deviates from the structure of most dissertations in my field of research, which usually contain separate chapters for the introduction, theory and methods, a chapter introducing the research area(s), several empirical chapters in
15 Chapter two, three, four and five are based on articles that have been published in journals (Environment
and Urbanization, International Migration, Hommes et Migrations (French) and Africa respectively). Chapter six is based on an article that is currently under review, and an adjusted version of chapter eight (conclusion), summarising the overall findings of the research, has been submitted for publication. A summary of the principal findings of Chapter three has been published in Forced Migration Review.
16
which the findings are presented and a concluding chapter. In this thesis, theory, methodology and basic descriptions of the research areas are integrated in the introduction and empirical chapters. Another implication of basing the thesis on journal articles is that the internal structure of the empirical chapters differs according to the author instructions of the journals. Where desirable and possible, I have edited the original articles to avoid too much repetition, while at the same time aiming to maintain the readability of the chapters as separate units.
Chapter two offers a first exploration of migration-environment linkages in Ghana. This chapter is quite broad as it discusses environmental causes as well as environmental consequences of migration, both in source areas and destination areas of migrants. It compares district-level migration data from the population census with remotely sensed vegetation data, first at national level and then for three principal migration systems in Ghana separately: North-South migration, cacao frontier settlement and migration to the capital Accra. The national analysis indicates that the environment matters in explaining migration flows and that migration matters in explaining changes in vegetation cover. However, these statistics say little about the processes behind migration and vegetation dynamics. In the second part of this chapter, supplementary sources are used that enable a more insightful interpretation of migration and environment linkages in the three principal migration systems.
Chapter three looks in more detail at the environmental causes of North-South migration, both in source and destination areas of migrants. This chapter contributes to the environmental refugee debate by assessing to what extent North-South migration is environmentally induced and forced. The first part of the chapter contains a cross-sectional and longitudinal analysis of migration propensities and different indicators of natural resources scarcity (rainfall, vegetation, crop yields and population pressure). In the second part, the reasons that Dagara migrants in the Brong Ahafo Region mentioned for their decision to migrate are analysed.
In Chapter four, the environmental impact of Dagara migration in a prime destination area is investigated. LANDSAT images from 1973 and 2003, published by the United Nations Environmental Program (UNEP), suggest that the Northwest of the Brong Ahafo Region has experienced widespread land degradation over the past decades. According to UNEP, land degradation in Ghana is primarily caused by unsustainable farm practices. Several studies comparing the land use of settlers and native farmers conclude that migrants’ farming methods are particularly detrimental for the environment. This chapter uses a variety of data at different levels of scale to challenge the ‘easy conclusion’ that Dagara in-migration must have been an important cause of land degradation. First, the validity of UNEP’s degradation narrative is challenged and then remotely sensed vegetation data and historic census data are used to show that most degradation has probably occurred before the area
17
became a major destination of Dagara migrants. Lastly, survey data show that there are appreciable differences in farming methods between Dagara settlers and native farmers, but no evidence is found that settlers’ farm practices are less sustainable.
Chapter five, six and seven focus on the consequences of out-migration in the area of origin. In Chapter five, local perceptions of migration from the Nandom Area in Northwest Ghana are studied. A qualitative analysis of 204 respondents’ answers to open question about the consequences of seasonal migration, long-term migration and return migration yields a holistic view of the matter, encompassing consequences in many different realms of life (e.g. food security, income, health, education, agriculture, social cohesion, communal labour, funerals, architecture and knowledge).
Chapter six looks at the relation between out-migration, population density and agricultural productivity in the twenty-four districts of Northern Ghana. In the theoretical part of this chapter the migration and development debate is linked to the Malthus-Boserup debate about population growth and land use sustainability. The objective is to address the reverse causality problem in studies about the impact of migration on agricultural development by recognizing the intervening role of population density. The empirical part of this chapter identifies a U-shaped ‘Malthus-Boserup curve’ between population density and crop yields in Northern Ghana. The central thesis of this chapter is that one has to know where a region is situated in the transition to more intensive land use to understand the impact of out-migration on agricultural development.
Compared to other districts in Northern Ghana, Lawra District – in which the Nandom area lies – has medium to high population density and is situated right at the bottom of the Malthus-Boserup curve. While respondents in the Nandom Area emphasized that out-migration relieves pressure on farmland (see Chapter five), a negative effect may be that out-migration can remove the incentives for a transition to more intensive land use.
In Chapter seven, demographic and farm characteristics of 204 rural household in the Nandom Area are used to study the impact of seasonal migration, long-term migration and return migration on agricultural development. The survey data are complemented with an analysis of changes in the policy16 and market environment, which are assumed to influence the conditions for agricultural development. Three broad avenues of migration impact on agriculture are investigated. First, the effect of migration on household composition, farm size and the adoption of labour-led intensification measures; second the impact of migrant savings and remittances on capital-led intensification measures; and third, the impact of return migration.
16 An in-depth study of governmental and non-governmental development interventions in Nandom was
made possible through a three-day workshop organised as part of a research project called ‘Participatory Assessment of Development’ (see http://www.padev.nl and Van der Geest 2010b).
18
Final remarks
Two papers that are based on the present research are still in preparation and could not be integrated in this thesis because of constraints of time and space. The first paper is called Trailing wives? The migration experience of Dagara women in the
Brong Ahafo Region17 and the working title of the second paper is ‘We farm for
them’: Economic consequences of Dagara migration to the Brong Ahafo Region. The first paper, which is based on in-depth interviews with twenty-nine Dagara women18 and survey data from migrant source and destination areas, shows that virtually all women had migrated with their husbands. The decision to migrate was usually made by the husband and women had had little influence over this decision. With regard to the economic consequences of migration, most women indicated that household food security had increased substantially, but their own opportunities to engage in non-farm income generating activities had reduced. In the North, they used the dry season to earn a personal income with activities like beer brewing, pottery, sheabutter extraction and weaving. In the Brong Ahafo Region, with its bi-modal rainfall pattern, they work on the household farm throughout the year. For Dagara women migration involved a loss of autonomy over financial resources because the household income from crop sales was controlled by the husband.
The second paper that could not be included in this thesis compares the liveli-hoods of three groups: Dagara migrant households in the Brong Ahafo Region, households of native farmers in the Brong Ahafo Region and rural households in a principal source area of Dagara migrants. The findings show that for the vast majority of Dagara households in the Brong Ahafo Region, migration has had a positive impact on agricultural production, crop sales and food security. However, a large part of this gain is lost because they have to share the harvest with local landowners and they are expected to send remittances to their relatives at home. This paper also provides insights in the economic effects of Dagara in-migration for the host population. Only a minority of the native population benefits from the settlement of farmers from Northwest Ghana by renting out land. For native farmers who have to rent land themselves the in-migration of Dagara farmers may have a negative effect because it creates more scarcity and higher prices on the land market. Much more native farmers benefit from Dagara in-migration through cheap farm labour. For native farmers who supplement their own farm income by working on other people’s farms Dagara in-migration is likely to be negative because they compete for the same jobs and the increased supply of labour can be expected to cause lower wages. 17 This paper was presented in the International Workshop on History and Migration: Beyond the Border,
Behind the Men. The Invisibility of Female Migration, held in Victoria-Gasteiz, 16-17 December 2010. 18 These interviews were conducted by Wemmy Harteveld for her Master’s fieldwork in social anthropology
(see Harteveld 2004).
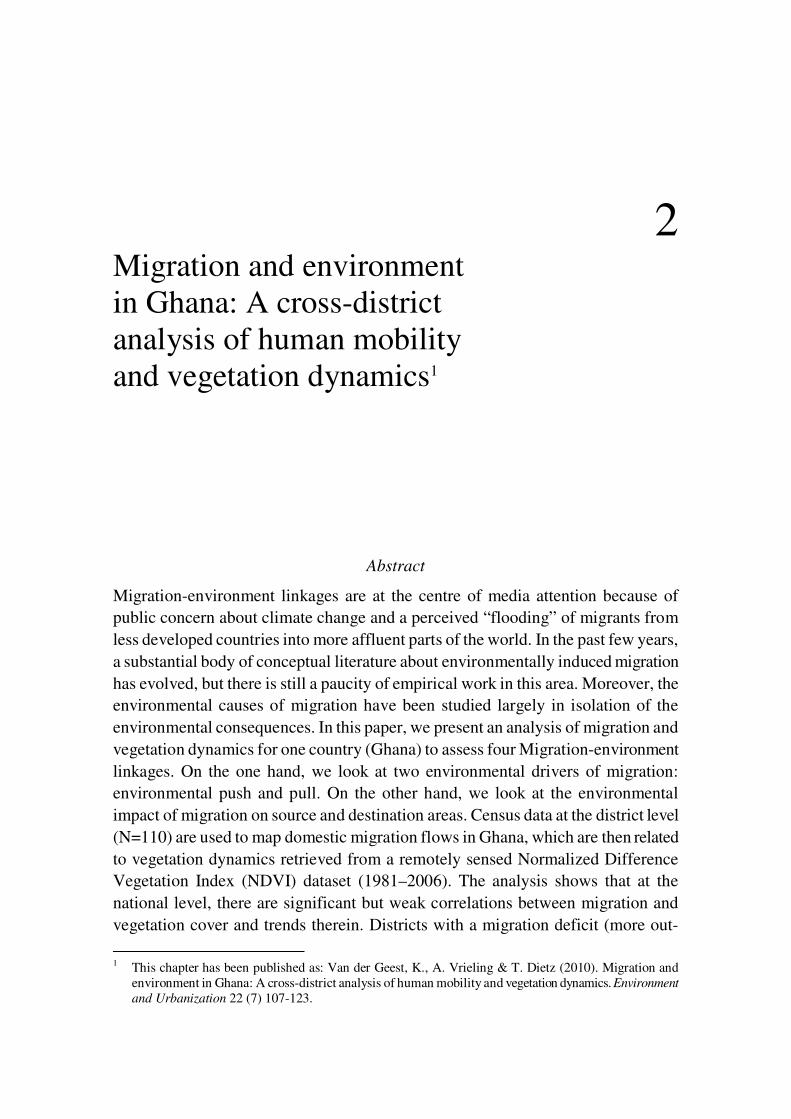
2 Migration and environment in Ghana: A cross-district analysis of human mobility and vegetation dynamics1
Abstract
Migration-environment linkages are at the centre of media attention because of public concern about climate change and a perceived “flooding” of migrants from less developed countries into more affluent parts of the world. In the past few years, a substantial body of conceptual literature about environmentally induced migration has evolved, but there is still a paucity of empirical work in this area. Moreover, the environmental causes of migration have been studied largely in isolation of the environmental consequences. In this paper, we present an analysis of migration and vegetation dynamics for one country (Ghana) to assess four Migration-environment linkages. On the one hand, we look at two environmental drivers of migration: environmental push and pull. On the other hand, we look at the environmental impact of migration on source and destination areas. Census data at the district level (N=110) are used to map domestic migration flows in Ghana, which are then related to vegetation dynamics retrieved from a remotely sensed Normalized Difference Vegetation Index (NDVI) dataset (1981–2006). The analysis shows that at the national level, there are significant but weak correlations between migration and vegetation cover and trends therein. Districts with a migration deficit (more out-
1 This chapter has been published as: Van der Geest, K., A. Vrieling & T. Dietz (2010). Migration and
environment in Ghana: A cross-district analysis of human mobility and vegetation dynamics. Environment
and Urbanization 22 (7) 107-123.
20
migration than in-migration) tend to be more sparsely vegetated and have experienced a more positive NDVI trend over the past quarter century than districts with a migration surplus. A disaggregation of data in three principal migration systems shows stronger correlations: north–south migration and cocoa frontier settlement have important environmental dimensions. Environmental factors do not seem to play a major role in migration to the capital, Accra. An important insight from this paper is that migration flows in Ghana can be explained partly by vegetation dynamics, but are also strongly related to rural population densities. This is because access to natural resources is often more important than the scarcity or abundance of natural resources per se. This study further shows that satellite remote sensing can provide valuable input to analyses of Migration-environment linkages.
Introduction
The past few years have witnessed a growing attention on the phenomenon of environmentally induced migration as a result of climate change. Journalists and “alarmist” academics often use the terms “environmental refugees” and “climate refugees” (Meyers 2005; Welzer 2008) and at present, heated debates are taking place about the use of these labels, not least because of the legal dimensions (Dun & Gemenne 2008). Estimates of the number of people who will be displaced due to adverse effects of climate change vary widely. Brown (2008) labels such estimates as little more than “well-educated guesswork”. We know that climate change will alter the distribution of population within countries and, to a lesser extent, also between countries, but it is impossible to achieve any degree of accuracy in the predictions. The present data and level of knowledge about the complex relation between climate change and human mobility are just too limited. Moreover, climate change is not the only threat (environmental and other) facing millions of people. Deforestation, land degradation, biodiversity loss and pollution are just a few other environmental hazards that jeopardize rural people’s livelihoods. In addition, some observers emphasize that natural resource scarcity and environmental degradation can cause conflicts and violence, which in turn can trigger population flows (Homer-Dixon 1999; Welzer 2008). More generally, the ‘minimalist view’ (Suhrke 1994) of the role of environmental drivers of migration emphasizes that environmental change is not more than a contextual variable that interacts with a wide range of economic and political factors in causing migration flows.
The recent attention on environmentally induced migration does not come as a surprise. Climate change is at the top of the research and policy agenda, and so are public concerns about the migration of people from less-developed countries (LDCs) to more affluent parts of the world. After an initial phase of mostly theoretical and conceptual contributions to the Migration-environment debate (Black
21
2001; Castles 2002) and repeated complaints about the lack of empirical studies (Jäger et al. 2009) gradually more efforts are being made to assess to what extent climatic changes and other environmental threats generate migration flows. The present study of Ghana aims to contribute to this emerging body of knowledge. The rationale is that we need to know how environmental degradation, scarcity and disasters have influenced migration flows in the past in order to be better prepared for the future.
As mentioned above, public concerns about migration from LDCs to “the West” may have played an important role in generating attention for Migration-environment linkages. The majority of people who are most vulnerable to environmental change, however, will never make it to “the West”. They are usually among the poorest in their home countries and most of them lack the resources and the contacts to migrate internationally. The bulk of people who are displaced by or who decide to migrate because of environmental problems will move to areas within their home countries or to neighbouring states (Tacoli 2009).
One of the problems in predicting migration flows caused by climate change and other environmental adversities is that for most regions in the world, and especially for less-developed countries, the scientific community does not have adequate data of past environmental changes and migration flows to build reliable models (Brown 2008). Also, due to the relatively recent interest in this topic, it seems that scientists have not yet fully explored and analyzed the data that are available. It is quite telling, for example, that Myers’ oft-quoted prediction of 200 million environmental refugees by the year 2050 is based on data that he first used in a 1995 publication.2
Time-series of satellite imagery can be an important input to studying relations between migration flows and environmental change. A dataset that is regularly used for applications in agriculture and ecology is the Normalized Difference Vegetation Index (NDVI) of the Global Inventory Modelling and Mapping Studies (GIMMS) group, which provides a worldwide measure of the presence of green vegetation at a 15-day time step for 1981-2006 (Tucker et al. 2005). Vegetation density is determined to a large extent by climatic and soil conditions. These two factors are crucial for farmers living in risk-prone and poorly endowed environments, and these people are most likely to be affected by future climate change and land degradation. Until now, the GIMMS–NDVI dataset has hardly been used by geographers and social scientists interested in population–environment linkages.3
This paper aims to provide a first exploration of the relation between vegetation dynamics and migration flows in one country, Ghana. The reason for choosing
2 Recent publications mostly quote Myers (2005), see reference 1; this publication uses the same figures as
Myers, N and J Kent (1995), Environmental Exodus: an Emergent Crisis in the Global Arena, Climate Institute, Washington DC.
3 Notable exceptions are Henry et al. (2004) and Song et al. (2008).
22
Ghana is two-fold: first, Ghana has a reasonably good record of migration statistics derived from the population census; and second, the main author of this paper has ten years experience studying climate variability and migration in Ghana. This enables an insightful interpretation of the data from the aforementioned secondary data sources. In this paper, we try to answer two questions: first, we want to find out to what extent migration flows in Ghana are influenced by the amount of green cover in source and destination areas; and second, we try to assess the impact of these migration flows on vegetation dynamics. To answer the first question, we relate average NDVI values to net migration flows. To answer the second question, we explore whether districts with high in-migration rates experience more negative NDVI trends than districts that experience more out-migration.
Materials and methods
To assess the relation between human mobility and vegetation dynamics in Ghana, we make use of Ghana’s 2000 population and housing census and remote sensing data. Census data were used to determine in-migration, out-migration and net migration rates at the regional (N=10) and district (N=110) levels. The census further provided data on population densities, urbanization rates and gender and age structure that were used to better understand the nature of the migration flows. Remote sensing data were used to determine the geographic distribution and trends in green cover. Where appropriate, we relate our findings on migration–vegetation linkages to rainfall patterns and trends. The different datasets and methods of extraction are described in more detail below.
Migration data
The 2000 population and housing census of Ghana inquired about people’s place of birth, using three categories: place of enumeration; elsewhere in the region; and outside the region of enumeration. In the third category, people were asked to specify in which region or country they were born. The regional census reports mention the intra-regional, inter-regional and international in-migration rates per district (Ghana Statistical Services 2005b). Unfortunately, the reports do not specify whether intra-regional migrants were born elsewhere in the same district or in another district in the region. Hence, movements between districts within one region could not be included in the district migration figures. This paper deals purely with domestic inter-regional migration.
Domestic out-migration rates are reported at the regional level. Since the census questionnaire does not inquire about birth district (only birth region), no exact out-migration figures exist at the district level. We estimated the district out-migration rates by means of a regional level regression of: percentage elderly population (65+); sex ratio (number of men per 100 women); and urbanization rate (proportion
23
of the population living in localities with more than 5,000 inhabitants). The three variables together explain 93.0 per cent of the variation in out-migration rates at the regional level. District level out-migration rates were estimated with the resulting equation4, and subsequently corrected to match the known regional figures. The net migration rates were then calculated as in-migration minus out-migration.
Another important constraint of the birthplace-based migration data is that they just tell us something about the accumulated number of migrants per district. The data do not disclose the timing of these migrations. In theory, this problem can – to some extent – be addressed in a longitudinal analysis of district level migration figures. In the case of Ghana, however, this has not been possible. Due to continu-ous restructuring of administrative areas and census boundaries, district level migration data are not comparable over time.
Vegetation data
The GIMMS–NDVI dataset is derived from spectral measurements of the AVHRR (Advanced Very High Resolution Radiometer) sensor that was flown onboard different satellites. NDVI is calculated from the red reflection (ρr) and infrared reflection (ρir) as follows:
rir
rirNDVIρρ
ρρ
+
−=
Vegetation has a high ρir and a low ρr, thus high NDVI values indicate that green vegetation is abundant, while low values relate to bare soil. Although data are obtained on a daily basis from the satellites, cloud cover limits the usefulness of the observations. The GIMMS dataset suppresses the cloud signal by constructing bi-monthly (15-day) temporal composites. The dataset has an 8x8-kilometre resolution and ranges from July 1981 to December 2006. We further reduced remaining cloud effects by creating a maximum value composite with a monthly time-step, and applying a temporal filter to the data (Chen et al. 2004). The final result is an 8x8-kilometre resolution monthly NDVI dataset.5
To analyze the relation between migration and vegetation dynamics, we aggre-gated the 8x8-kilometre cells to the district level. The weighted average NDVI was calculated per district, per month, based on the percentage of the cell surface covering the district. Cells falling entirely within the district received a 100 per cent weighting, while partly overlapping cells received lower weightings. Cells that overlapped with water, especially the Volta Lake and the Gulf of Guinea, were excluded from the calculation of aggregate district NDVI values.
4 Out-migration (%) = 175.015 + (3.561* population aged over 65) - (1.715 * sex ratio) - (0.153 *
urbanization rate). The estimation procedure is described in more detail in the Appendix. 5 The source for the GIMMS NDVI dataset was the Global Land Cover Facility (www.landcover.org).
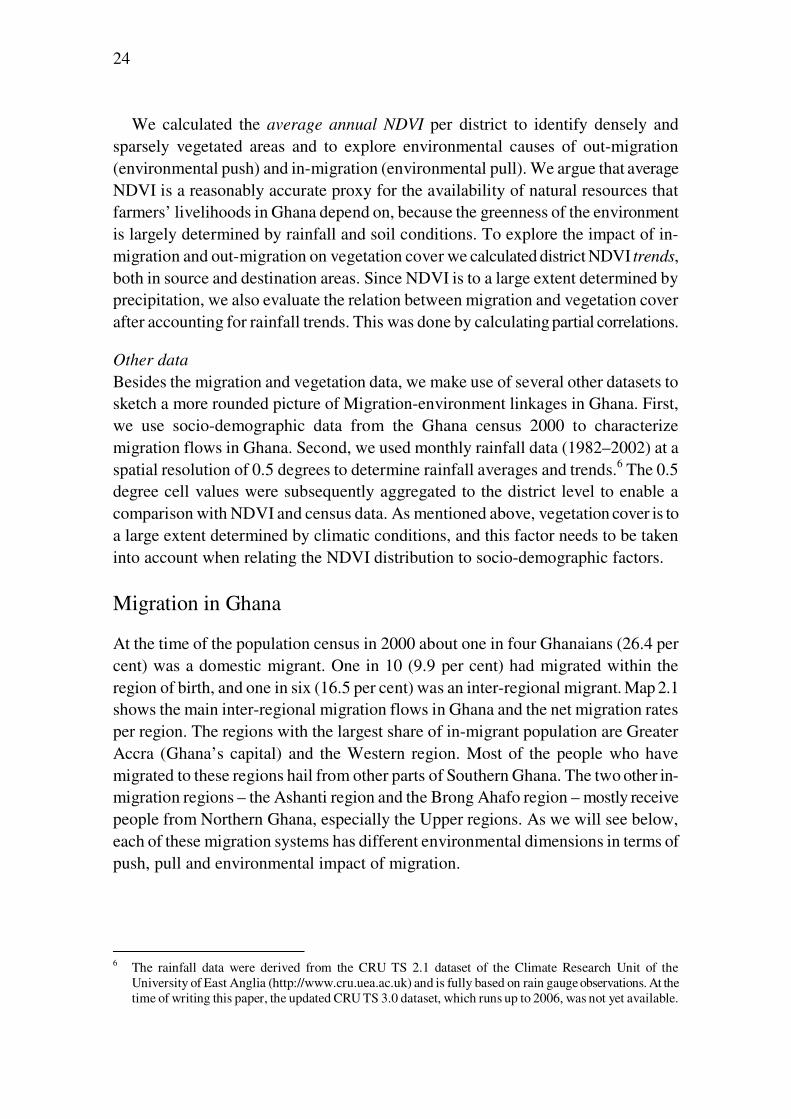
24
We calculated the average annual NDVI per district to identify densely and sparsely vegetated areas and to explore environmental causes of out-migration (environmental push) and in-migration (environmental pull). We argue that average NDVI is a reasonably accurate proxy for the availability of natural resources that farmers’ livelihoods in Ghana depend on, because the greenness of the environment is largely determined by rainfall and soil conditions. To explore the impact of in-migration and out-migration on vegetation cover we calculated district NDVI trends, both in source and destination areas. Since NDVI is to a large extent determined by precipitation, we also evaluate the relation between migration and vegetation cover after accounting for rainfall trends. This was done by calculating partial correlations.
Other data
Besides the migration and vegetation data, we make use of several other datasets to sketch a more rounded picture of Migration-environment linkages in Ghana. First, we use socio-demographic data from the Ghana census 2000 to characterize migration flows in Ghana. Second, we used monthly rainfall data (1982–2002) at a spatial resolution of 0.5 degrees to determine rainfall averages and trends.6 The 0.5 degree cell values were subsequently aggregated to the district level to enable a comparison with NDVI and census data. As mentioned above, vegetation cover is to a large extent determined by climatic conditions, and this factor needs to be taken into account when relating the NDVI distribution to socio-demographic factors.
Migration in Ghana
At the time of the population census in 2000 about one in four Ghanaians (26.4 per cent) was a domestic migrant. One in 10 (9.9 per cent) had migrated within the region of birth, and one in six (16.5 per cent) was an inter-regional migrant. Map 2.1 shows the main inter-regional migration flows in Ghana and the net migration rates per region. The regions with the largest share of in-migrant population are Greater Accra (Ghana’s capital) and the Western region. Most of the people who have migrated to these regions hail from other parts of Southern Ghana. The two other in-migration regions – the Ashanti region and the Brong Ahafo region – mostly receive people from Northern Ghana, especially the Upper regions. As we will see below, each of these migration systems has different environmental dimensions in terms of push, pull and environmental impact of migration.
6 The rainfall data were derived from the CRU TS 2.1 dataset of the Climate Research Unit of the
University of East Anglia (http://www.cru.uea.ac.uk) and is fully based on rain gauge observations. At the time of writing this paper, the updated CRU TS 3.0 dataset, which runs up to 2006, was not yet available.
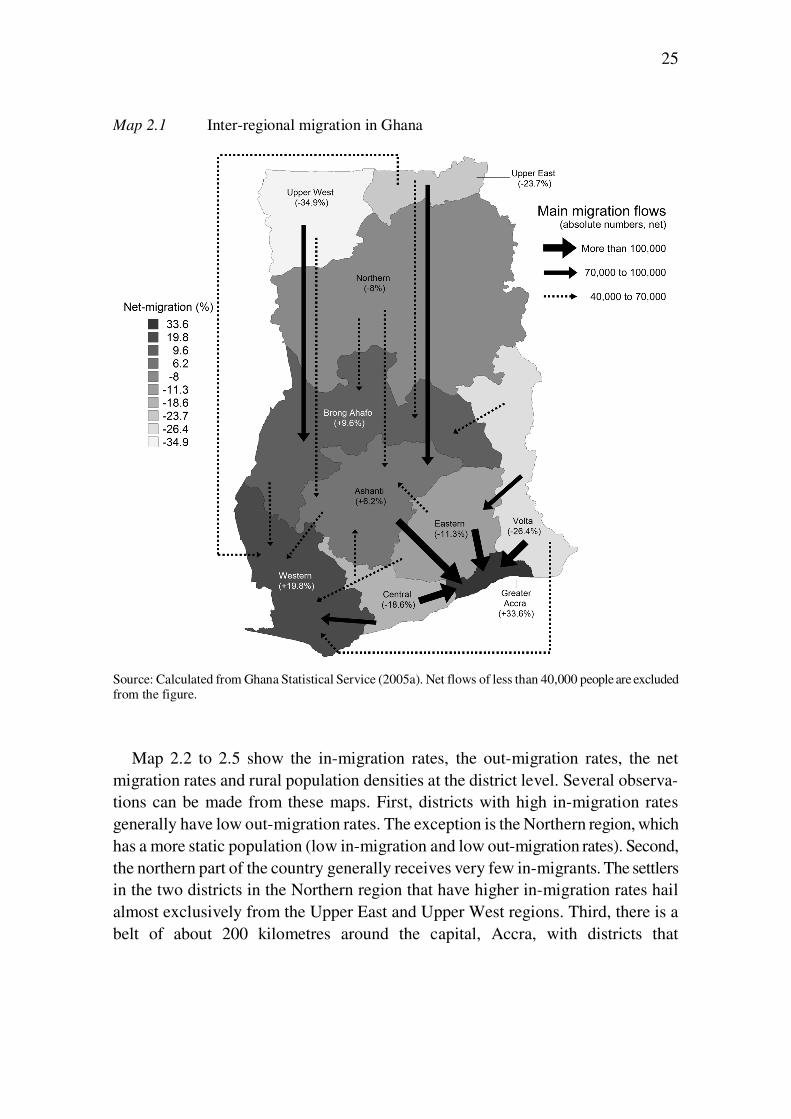
25
Map 2.1 Inter-regional migration in Ghana
Source: Calculated from Ghana Statistical Service (2005a). Net flows of less than 40,000 people are excluded from the figure.
Map 2.2 to 2.5 show the in-migration rates, the out-migration rates, the net migration rates and rural population densities at the district level. Several observa-tions can be made from these maps. First, districts with high in-migration rates generally have low out-migration rates. The exception is the Northern region, which has a more static population (low in-migration and low out-migration rates). Second, the northern part of the country generally receives very few in-migrants. The settlers in the two districts in the Northern region that have higher in-migration rates hail almost exclusively from the Upper East and Upper West regions. Third, there is a belt of about 200 kilometres around the capital, Accra, with districts that
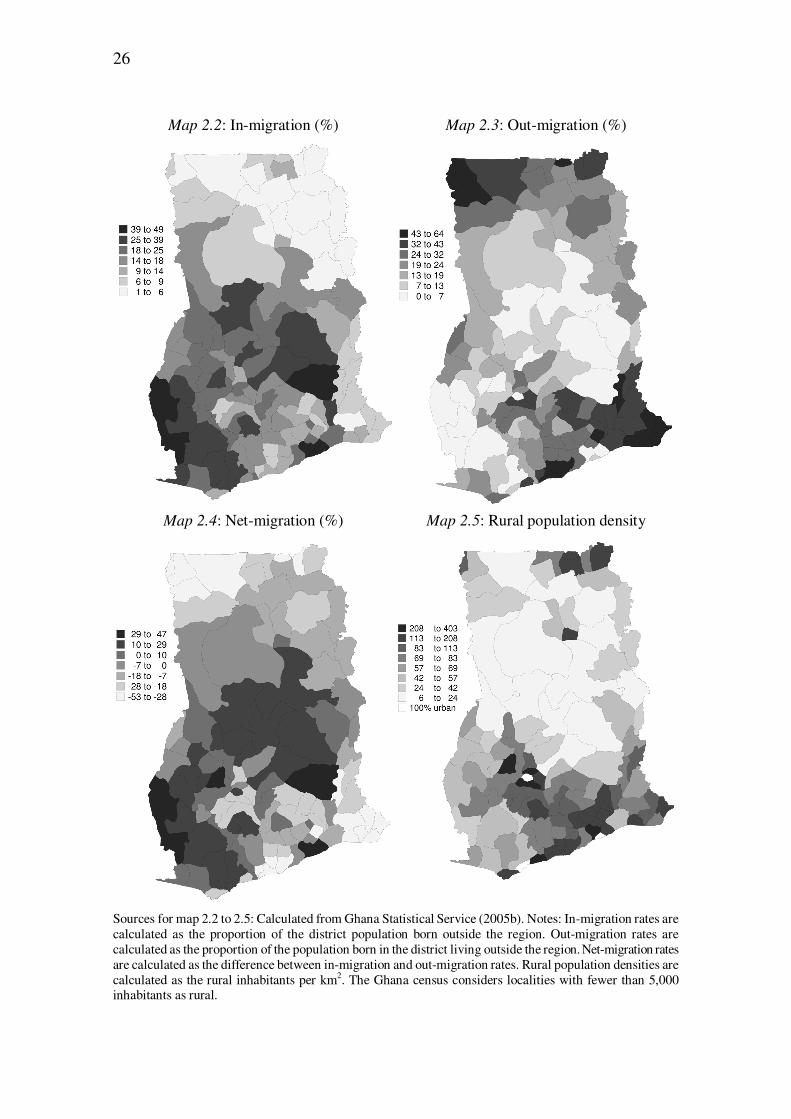
26
Map 2.2: In-migration (%) Map 2.3: Out-migration (%)
Map 2.4: Net-migration (%) Map 2.5: Rural population density
Sources for map 2.2 to 2.5: Calculated from Ghana Statistical Service (2005b). Notes: In-migration rates are calculated as the proportion of the district population born outside the region. Out-migration rates are calculated as the proportion of the population born in the district living outside the region. Net-migration rates are calculated as the difference between in-migration and out-migration rates. Rural population densities are calculated as the rural inhabitants per km2. The Ghana census considers localities with fewer than 5,000 inhabitants as rural.
27
have high rural population densities and negative net migration rates. Many of the former inhabitants of these districts seem to have relocated to the capital, Accra. An important alternative has been to relocate to the new cocoa frontier in the Western region. A fourth observation is that beyond the belt of densely populated out-migration districts, there is a belt of sparsely populated in-migration districts. This belt curves from the southwest through Ghana’s middle belt, ending in the Afram plains. In sum, it seems that the most important migration flows in Southern Ghana are from districts with high rural population densities to the capital, Accra, or to the more sparsely populated Western region. North Ghanaians predominantly migrate to sparsely populated districts in the country’s middle belt.
Vegetation and rainfall in Ghana
Map 2.6 shows the average annual NDVI values per district in Ghana. The country has four main ecological zones: the southeast coastal savannah, the forest zone, the forest–savannah transition zone and the interior savannah in the north. NDVI values are highest in the forest zone, followed by the forest–savannah transition zone, the interior savannah and lastly the coastal savannah. As shown in map 2.7, average annual NDVI values are closely related to annual rainfall figures. Humid districts tend to have a denser vegetation cover than drier districts (R = 0.659, p < 0.01). Besides the average distribution of vegetation in Ghana, we also looked at vegetation trends to assess possible impacts of migration on vegetation cover. Map 2.8 shows that the north of Ghana has experienced a steady increase in NDVI values over the past 25 years. It should be noted that the NDVI time-series starts at the peak of the Sahel droughts in the early 1980s, which also hit Northern Ghana (Dietz et al. 2004). We performed a t-test on the trend and found that the increase was consistent for all northern districts (p < 0.01). The picture for Southern Ghana is much less clear. Most Southern districts have experienced little change in average annual NDVI values, except for some coastal districts that have seen a significant decrease in vegetation cover. Map 2.9 shows the district trends in annual rainfall. Contrary to what we expected, we found no positive correlation between NDVI trend and rainfall trend. The positive NDVI trend in Northern Ghana seems to have other causes than increased rainfall, and some coastal districts with negative NDVI trends have experienced a very positive rainfall trend between 1982 and 2002.
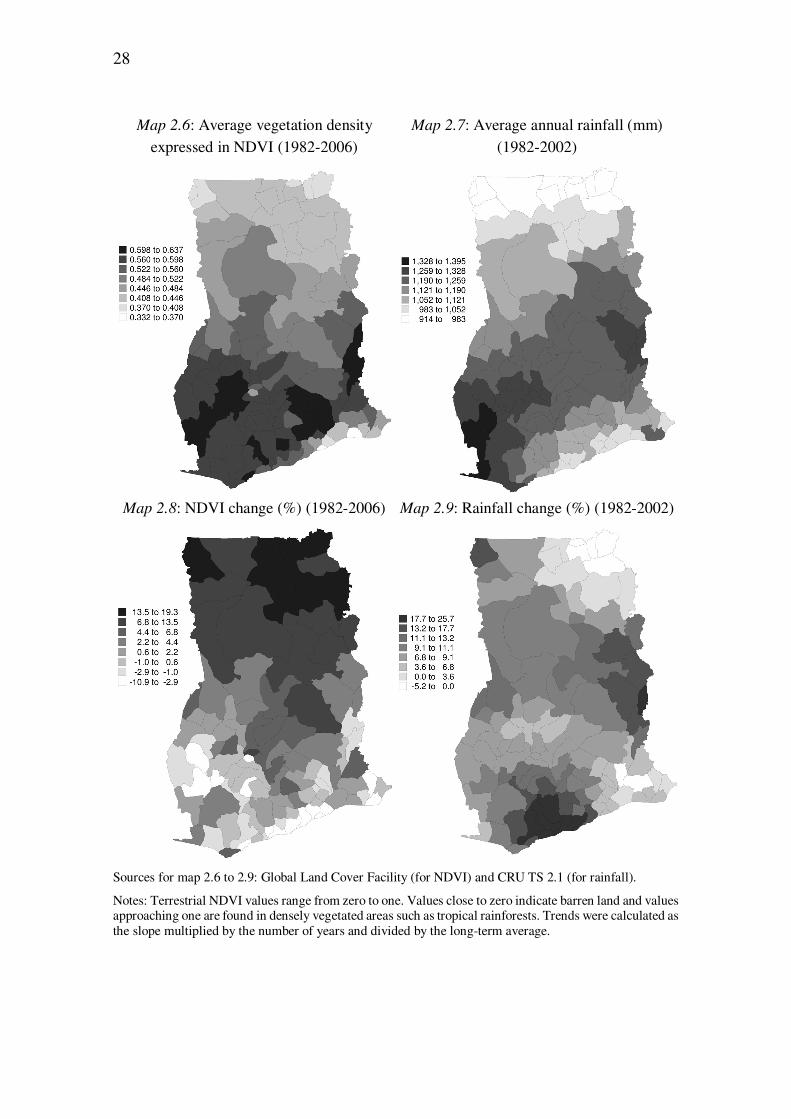
28
Map 2.6: Average vegetation density expressed in NDVI (1982-2006)
Map 2.7: Average annual rainfall (mm) (1982-2002)
Map 2.8: NDVI change (%) (1982-2006) Map 2.9: Rainfall change (%) (1982-2002)
Sources for map 2.6 to 2.9: Global Land Cover Facility (for NDVI) and CRU TS 2.1 (for rainfall).
Notes: Terrestrial NDVI values range from zero to one. Values close to zero indicate barren land and values approaching one are found in densely vegetated areas such as tropical rainforests. Trends were calculated as the slope multiplied by the number of years and divided by the long-term average.
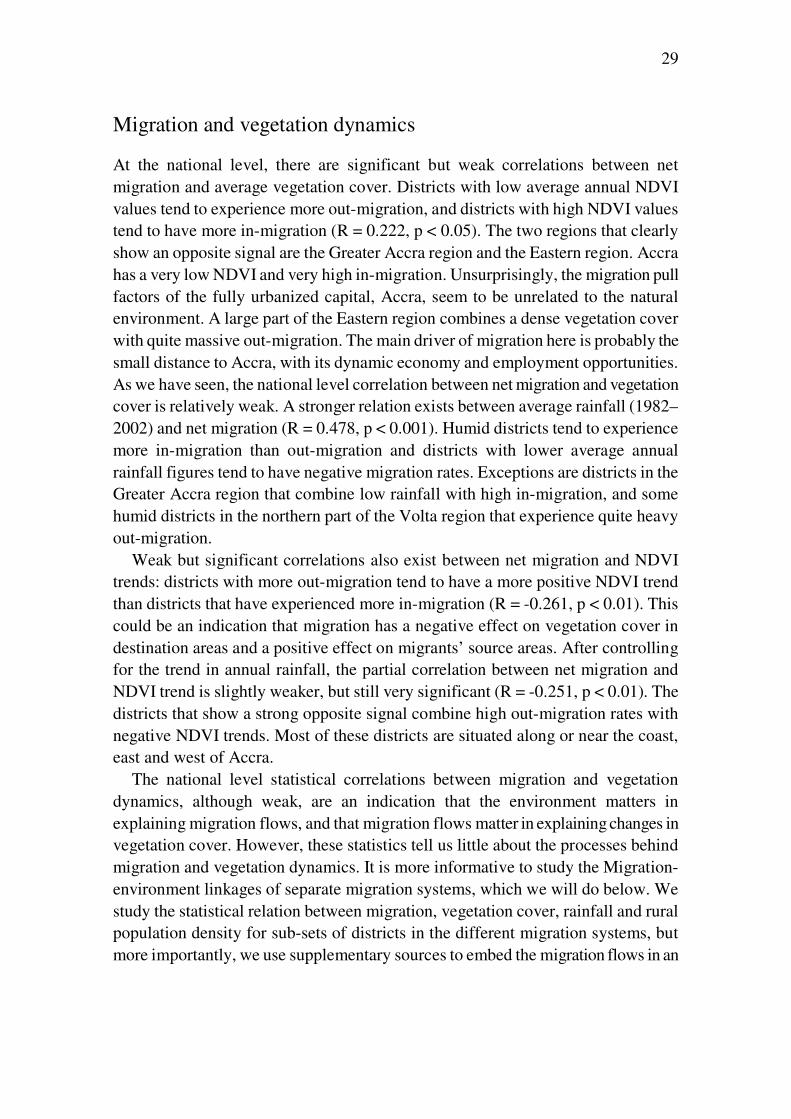
29
Migration and vegetation dynamics
At the national level, there are significant but weak correlations between net migration and average vegetation cover. Districts with low average annual NDVI values tend to experience more out-migration, and districts with high NDVI values tend to have more in-migration (R = 0.222, p < 0.05). The two regions that clearly show an opposite signal are the Greater Accra region and the Eastern region. Accra has a very low NDVI and very high in-migration. Unsurprisingly, the migration pull factors of the fully urbanized capital, Accra, seem to be unrelated to the natural environment. A large part of the Eastern region combines a dense vegetation cover with quite massive out-migration. The main driver of migration here is probably the small distance to Accra, with its dynamic economy and employment opportunities. As we have seen, the national level correlation between net migration and vegetation cover is relatively weak. A stronger relation exists between average rainfall (1982–2002) and net migration (R = 0.478, p < 0.001). Humid districts tend to experience more in-migration than out-migration and districts with lower average annual rainfall figures tend to have negative migration rates. Exceptions are districts in the Greater Accra region that combine low rainfall with high in-migration, and some humid districts in the northern part of the Volta region that experience quite heavy out-migration.
Weak but significant correlations also exist between net migration and NDVI trends: districts with more out-migration tend to have a more positive NDVI trend than districts that have experienced more in-migration (R = -0.261, p < 0.01). This could be an indication that migration has a negative effect on vegetation cover in destination areas and a positive effect on migrants’ source areas. After controlling for the trend in annual rainfall, the partial correlation between net migration and NDVI trend is slightly weaker, but still very significant (R = -0.251, p < 0.01). The districts that show a strong opposite signal combine high out-migration rates with negative NDVI trends. Most of these districts are situated along or near the coast, east and west of Accra.
The national level statistical correlations between migration and vegetation dynamics, although weak, are an indication that the environment matters in explaining migration flows, and that migration flows matter in explaining changes in vegetation cover. However, these statistics tell us little about the processes behind migration and vegetation dynamics. It is more informative to study the Migration-environment linkages of separate migration systems, which we will do below. We study the statistical relation between migration, vegetation cover, rainfall and rural population density for sub-sets of districts in the different migration systems, but more importantly, we use supplementary sources to embed the migration flows in an
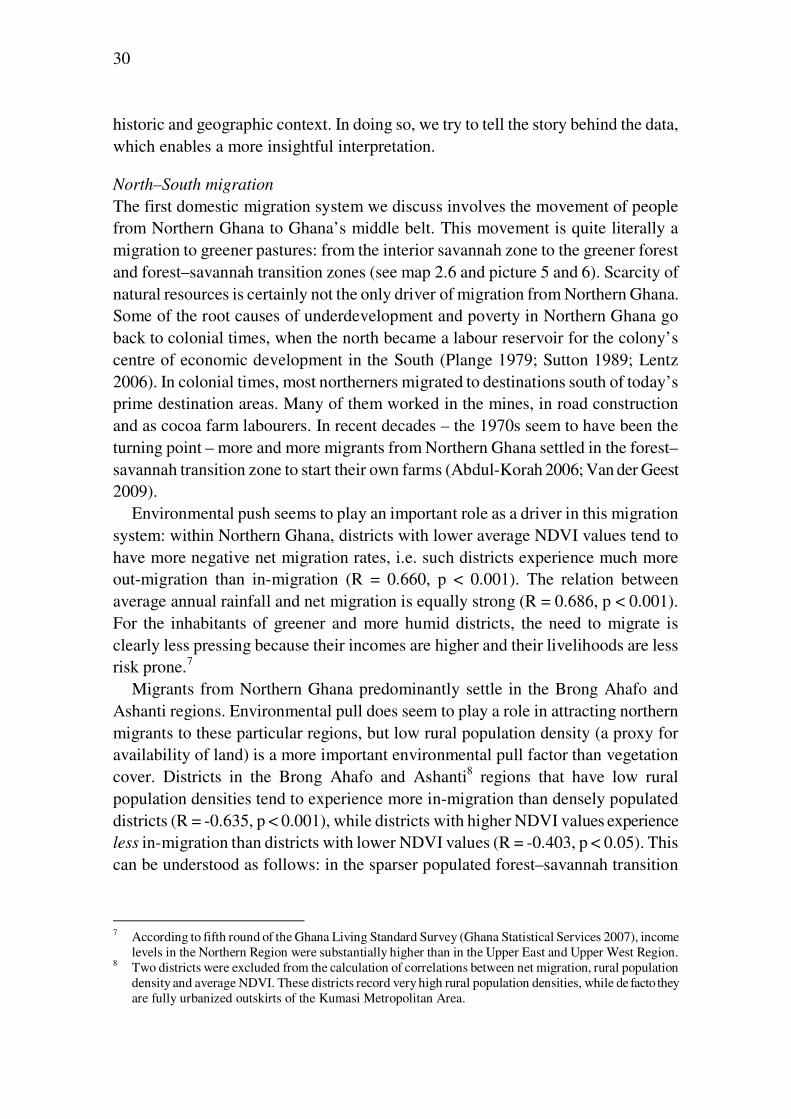
30
historic and geographic context. In doing so, we try to tell the story behind the data, which enables a more insightful interpretation.
North–South migration
The first domestic migration system we discuss involves the movement of people from Northern Ghana to Ghana’s middle belt. This movement is quite literally a migration to greener pastures: from the interior savannah zone to the greener forest and forest–savannah transition zones (see map 2.6 and picture 5 and 6). Scarcity of natural resources is certainly not the only driver of migration from Northern Ghana. Some of the root causes of underdevelopment and poverty in Northern Ghana go back to colonial times, when the north became a labour reservoir for the colony’s centre of economic development in the South (Plange 1979; Sutton 1989; Lentz 2006). In colonial times, most northerners migrated to destinations south of today’s prime destination areas. Many of them worked in the mines, in road construction and as cocoa farm labourers. In recent decades – the 1970s seem to have been the turning point – more and more migrants from Northern Ghana settled in the forest–savannah transition zone to start their own farms (Abdul-Korah 2006; Van der Geest 2009).
Environmental push seems to play an important role as a driver in this migration system: within Northern Ghana, districts with lower average NDVI values tend to have more negative net migration rates, i.e. such districts experience much more out-migration than in-migration (R = 0.660, p < 0.001). The relation between average annual rainfall and net migration is equally strong (R = 0.686, p < 0.001). For the inhabitants of greener and more humid districts, the need to migrate is clearly less pressing because their incomes are higher and their livelihoods are less risk prone.7
Migrants from Northern Ghana predominantly settle in the Brong Ahafo and Ashanti regions. Environmental pull does seem to play a role in attracting northern migrants to these particular regions, but low rural population density (a proxy for availability of land) is a more important environmental pull factor than vegetation cover. Districts in the Brong Ahafo and Ashanti8 regions that have low rural population densities tend to experience more in-migration than densely populated districts (R = -0.635, p < 0.001), while districts with higher NDVI values experience less in-migration than districts with lower NDVI values (R = -0.403, p < 0.05). This can be understood as follows: in the sparser populated forest–savannah transition
7 According to fifth round of the Ghana Living Standard Survey (Ghana Statistical Services 2007), income
levels in the Northern Region were substantially higher than in the Upper East and Upper West Region. 8 Two districts were excluded from the calculation of correlations between net migration, rural population
density and average NDVI. These districts record very high rural population densities, while de facto they are fully urbanized outskirts of the Kumasi Metropolitan Area.
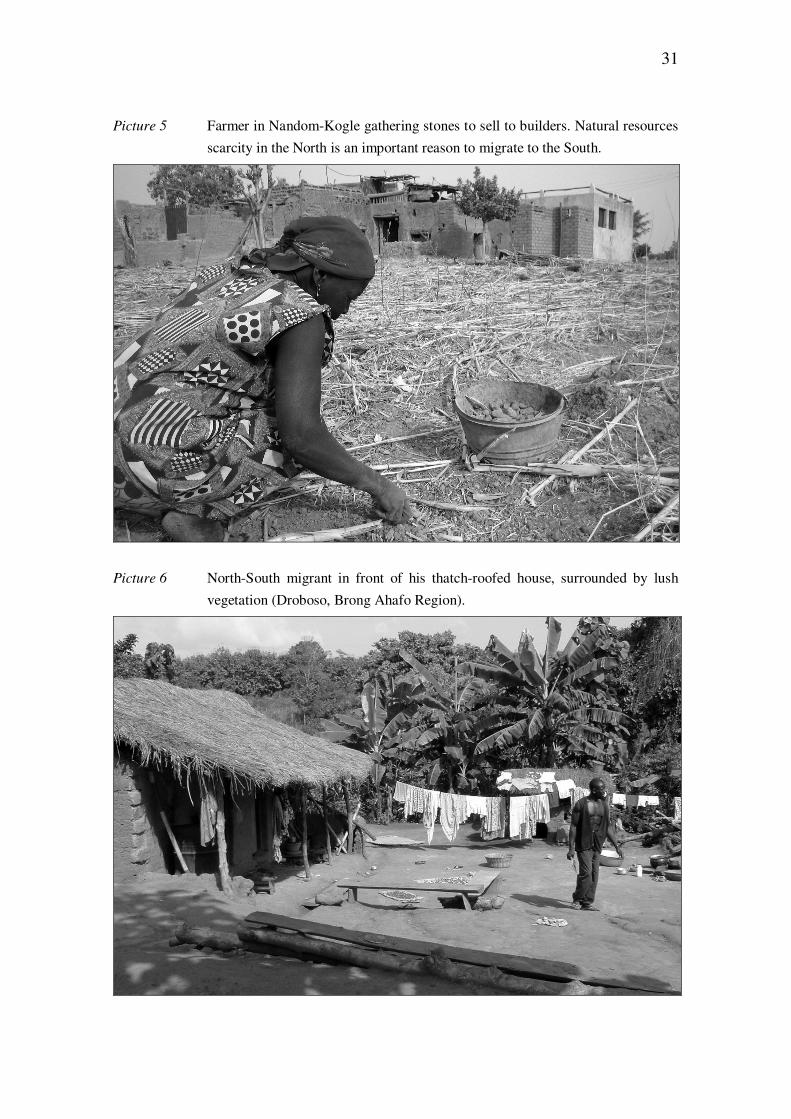
31
Picture 5 Farmer in Nandom-Kogle gathering stones to sell to builders. Natural resources
scarcity in the North is an important reason to migrate to the South.
Picture 6 North-South migrant in front of his thatch-roofed house, surrounded by lush
vegetation (Droboso, Brong Ahafo Region).
32
zone, land is less commoditized and tenure conditions for settler farmers from the north are more favourable than in the greener forest zone, with its tradition of commercial cocoa farming and individualized land-holding regimes. Moreover, the natural environment in the forest–savannah transition zone resembles farming conditions in their area of origin, with the advantage of having two rainy seasons.
To assess the environmental impact of migration, we looked at the NDVI trends in the source and destination areas of migrants. Map 2.4 and 2.8 show that Northern Ghana, and especially the Upper regions, is an area with quite massive out-migration and a very positive vegetation trend. Annual NDVI values in Northern Ghana have increased 12.1 per cent between 1982 and 2006. Massive out-migration may reduce the pressure on natural resources and thus have a positive influence on vegetation cover. Indeed, within Northern Ghana, we see that the districts with greater migration deficits tend to have more positive NDVI trends (R = -0.649, p < 0.01). It would be appropriate, however, to also consider the rainfall trend. In most districts in Northern Ghana, as in the rest of the country, rainfall has increased between 1982 and 2002 (map 2.9). The exception is the northeast corner, which has experienced a slightly negative rainfall trend but similar increases in NDVI values as the rest of Northern Ghana. After controlling for changes in annual amounts of rainfall, the partial correlation between net migration and NDVI becomes even stronger (R = -0.692, p < 0.001). A tentative conclusion would be that massive out-migration in Northern Ghana reduces the pressure on natural resources, which has a positive effect on vegetation cover. It should be noted, however, that despite heavy out-migration, the population of Northern Ghana is still growing. Population pressure increases more slowly due to out-migration, but is still increasing. Hence, other factors than out-migration are also likely to contribute to the positive NDVI trend. Some of these factors could be livelihood diversification, more sustainable farming techniques, reforestation programmes or CO2 fertilization.
Within the main destination regions of migrants from Northern Ghana, the trend in average annual NDVI values is slightly positive, and no significant correlation was found between net migration rates and NDVI trends of districts in the Brong Ahafo and Ashanti regions. This did not change after correcting for rainfall trends. This could be an indication that the in-migration of farmers from Northern Ghana has not resulted in a massive conversion of forest into cropland. A possible explanation is that migrant farmers usually do not get access to virgin farmland. They primarily farm the old fallows of the native population that increasingly moves out of agriculture and into (semi-) urban and non-farm livelihoods. The environ-mental impact of migration in the Brong Ahafo Region is studied in more detail in Chapter four.
33
Migration to the cocoa frontier
The second migration system we discuss concerns the movement of people from different Southern Ghanaian regions to the cocoa frontier in southwest Ghana. Cocoa was introduced in Ghana in the late nineteenth century in the southeast of the forest zone, in the present Eastern region. In the first decades of the twentieth century, cocoa cultivation expanded rapidly to the Ashanti region, the Central region, the Brong Ahafo region and the Volta region. In Hill’s (1961) landmark study of migrant cocoa farmers, the process of this expansion is described in detail, with much attention given to the role of migration, capital and social organization. An important insight from Hill’s study is that the early expansion of cocoa in Ghana occurred in an atypical way. Instead of diffusing through a government-induced process of adoption by other farmers, early cocoa expansion occurred in a process of migration from existing cocoa areas to new lands.
Important requisites of potential cocoa-growing areas were “…favourable
ecological conditions, low population densities and favourable conditions for land
acquisition” (Awanyo 1998). During the early expansion of cocoa cultivation in Ghana, southwest Ghana was not very attractive because of its humidity: it lacked a short but pronounced dry period, as is common in the rest of Southern Ghana. In the late 1960s, 1970s and early 1980s, Ghana witnessed a severe decline in cocoa production because of diseases such as swollen shoot and black pod, ageing trees, soil fertility decline, adverse climatic conditions, low producer prices and a political environment that removed the incentives for cocoa production (Crook 2001; Leiter & Harding 2004). Farmers in the densely populated old cocoa areas were confronted with falling incomes and limited opportunities for local expansion. When the macroeconomic conditions and policy environment improved from the mid-1980s onwards (Laven 2010), and when new cocoa varieties became available that did not require a pronounced dry period, many farmers decided to migrate to the sparsely populated new cocoa frontier in the interior of the Western region and the southernmost districts of the Brong Ahafo region (Ruf 2007). Since the late 1980s, the cocoa sector has recovered gradually, and between 2002 and 2006 cocoa production in Ghana more than doubled.9 The bulk of the sector’s growth took place in the new cocoa frontier, which has become the prime cocoa-producing region in Ghana (Gockowski 2007). Cocoa production in the Western region, contrary to the other cocoa-producing regions, shows few signs of intensification. Output growth is almost entirely due to expansion into new lands (Teal et al. 2006), and this is likely to have negative impacts on the vegetation cover.
9 The cocoa production data were retrieved from the FAOSTAT website of the Food and Agriculture
Organization of the United Nations (http://www.faostat.fao.org).
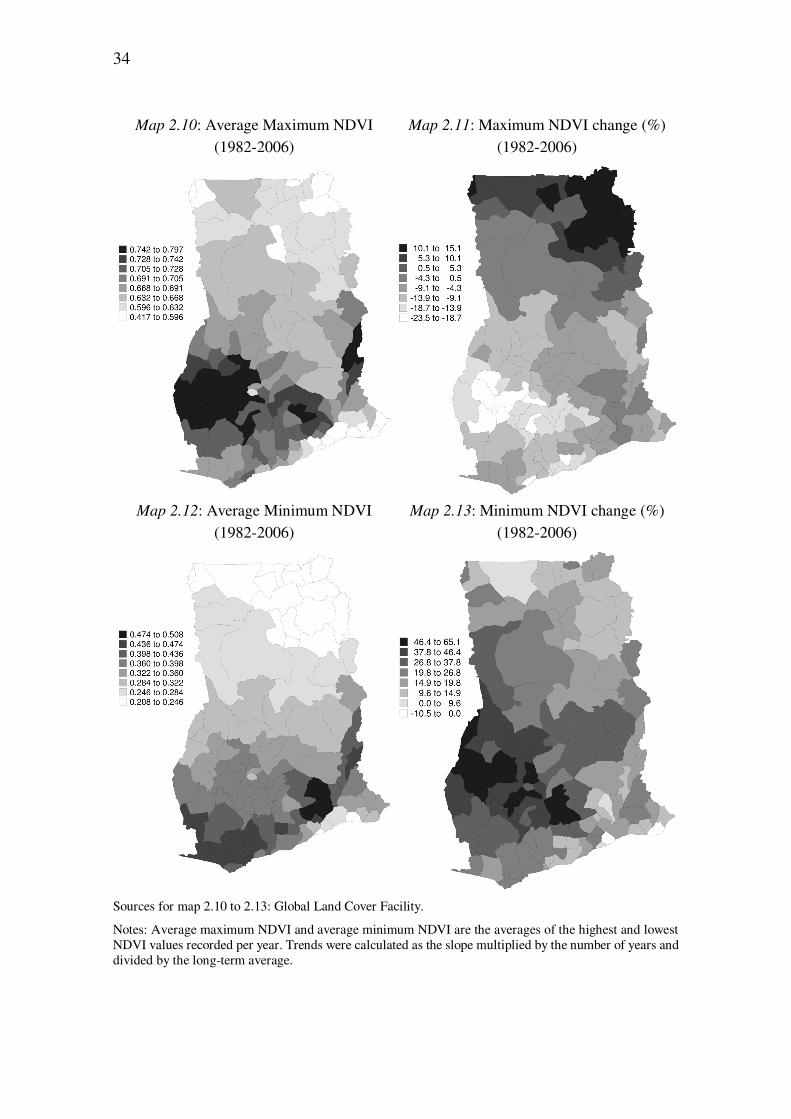
34
Map 2.10: Average Maximum NDVI (1982-2006)
Map 2.11: Maximum NDVI change (%) (1982-2006)
Map 2.12: Average Minimum NDVI
(1982-2006) Map 2.13: Minimum NDVI change (%)
(1982-2006)
Sources for map 2.10 to 2.13: Global Land Cover Facility.
Notes: Average maximum NDVI and average minimum NDVI are the averages of the highest and lowest NDVI values recorded per year. Trends were calculated as the slope multiplied by the number of years and divided by the long-term average.
35
Map 2.6 shows that the average annual NDVI values of the old cocoa-producing areas are similar to those of the Western region. Hence, a superficial conclusion would be that environmental push and pull do not play a major role in this migration system. As in the case of the main destination area in the north–south migration system, however, it seems that the environmental pull factor of the Western region is low rural population density (and hence ample room for settlers) rather than dense vegetation. In sparsely populated areas, it is easier and cheaper to gain access to natural resources – in this case land to plant cocoa trees. Cocoa frontier settlement in Ghana involves a movement from areas with high rural population densities to more sparsely populated areas (map 2.5). This is not the full story, however. Cocoa frontier settlement also involves a movement from areas with scanty patches of remaining tropical forest to a region that had and still has a much larger stock of tropical forest, but this is not adequately expressed in the average annual NDVI values. Mature cocoa plantations, which abound in the old cocoa areas, are evergreen and have closed canopies. The average annual NDVI values measured over mature cocoa plantations are quite similar to those of semi-deciduous forests. A geographical analysis of average annual NDVI does not identify this difference. For this we have to look at the NDVI amplitude – the difference between maximum annual NDVI and minimum annual NDVI – which is higher over semi-deciduous tropical forests than over cocoa plantations. In areas planted with cocoa, the minimum annual NDVI tends to be higher and the maximum NDVI tends to be lower. Looking at the geographical distribution and trends in NDVI minimum and maximum (map 2.10 to 2.13), we see that over the 1982–2006 period, districts situated in the cocoa frontier indeed had high, but sharply decreasing, maximum NDVI values. In the same area, the minimum NDVI trend was very positive. Although other factors also influence the trend in NDVI amplitude, our hypothesis is that conversion from forest to cocoa plays an important role. The reduction in amplitude is especially pronounced since 2001, when cocoa production in Ghana soared.
In a case study of the Western region, Alo and Pontius (2008) conclude that most deforestation in forest reserves is caused by illegal logging activities, and that deforestation outside protected areas is due to cocoa expansion. Although our analysis suggests that this does not negatively affect annual average green cover, it is likely to have negative effects on biodiversity and ecosystem health. Biodiversity loss is also a problem in the remaining forests of southwest Ghana. In this vein, Oates (1999) writes about “the empty forests of Ghana”. Such negative environ-mental trends are not identified by the NDVI dataset, which simply evaluates green cover.
36
Migration to Accra
The largest domestic migrant flow in Ghana consists of people who move to the national capital, Accra. At the time of the 2000 population census, more than 1.1 million inhabitants of the Greater Accra Region (41.3 per cent) were born outside the region. Most of these migrants hailed from the Eastern, Volta, Central and Ashanti regions, i.e. the regions closest to Accra (Ghana Statistical Services 2005a). Environmental pull does not play a major role in this migration system. The Accra Metropolitan Area is fully urbanized, and due to its location in the coastal savannah, the area was already sparsely vegetated in pre-colonial times. The natural environ-ment did play an anecdotal role in Accra’s migration history. In pre-colonial times, Accra was a small coastal fishing port situated near two European forts from where gold and slaves were traded. In 1874, the Gold Coast became a Crown Colony of the British, and in 1877 the colonial rulers decided the move the seat of government from Cape Coast to Accra because of its drier conditions, which they hoped would benefit the health of the colonial officers (Varley & White 1958). After Accra became the administrative centre of the colony, it started its impressive growth from a small town into a metropolis with almost 2 million inhabitants. Most of Accra’s growth has been due to in-migration (Smith 2007). Although this migration is often assumed to be “rural–urban”, the Ghana Living Standards Survey revealed that 89 per cent of Accra’s in-migrants lived in other urban centres prior to their migration to Accra (Ghana Statistical Services 2008). Due to income disparities between rural and urban areas in Ghana and the relatively high cost of living in the national capital, it is more difficult for rural people to settle in Accra. This may also explain why relatively few people from the poorer north of Ghana have migrated to Accra. In this paper’s Introduction, we wrote that the people most affected by environ-mental scarcity and climate change are least likely to migrate to “the West” because they lack the funds and contacts for such an endeavour. In the case of Ghana, this insight also seems to be valid for domestic migration to the national capital, Accra.
Employment and prospects of wealth seem to be the major pull factors of Accra. The 2005–2006 Ghana Living Standards Survey revealed that “seeking employ-ment” and “job transfer” were mentioned twice as often in Accra than in other parts of Ghana as reasons to migrate. Unemployment rates in Accra are substantially higher (9.8 per cent) than the national average (3.5 per cent), but the potential rewards for moving to Accra are perceived to be substantial (Ghana Statistical Service 2008).
As mentioned above, most migrants in Accra resided in urban centres in Southern Ghana prior to their change of residence. Data from the Ghana Living Standards Survey reveal that within Ghana, these localities rank second behind Accra in terms
37
of per capita income levels and low poverty rates.10 Hence, it seems reasonable to conclude that migration to Accra is mainly opportunity driven, and that neither environmental push nor pull play an important role in this migration system. Within the major source regions of Accra-bound migrants (Eastern, Volta, Central and Ashanti regions), no significant correlation was found between net migration and average annual NDVI values. Turning to the environmental impact of migration, we see that the NDVI trend in Accra has been very negative over the past quarter century. This could be because the city’s “empty spots” are gradually filled with houses and businesses, which is to a great extent due to fast population growth caused partly by in-migration. 11
In sum, environmental push and pull do not seem to influence migration to Accra. The reason why we did include a discussion of this migration system here is that it constitutes the largest movement of people in the country. The discussion of this migration system serves as a counterweight to the first two migration systems we examined, which had clear environmental dimensions. In the course of the twentieth century, the livelihoods of more and more Ghanaians have become less dependent on the natural environment. Ghanaians nowadays migrate for a large variety of reasons, including environmental ones.
Conclusion
This paper aimed to contribute to the emerging body of knowledge about Migration-environment linkages by exploring the multiple ties between human mobility and vegetation dynamics in Ghana. We evaluated the role of environmental push and pull in Ghana’s three major migration flows, and we explored the impact of migration on vegetation cover. Our analytical approach has been to map migration flows and relate these to vegetation distribution and trends in 110 districts. A disaggregation in three domestic migration systems allowed for a better interpreta-tion of the data, embedded in a geographic and historical context.
Despite limitations in our analysis, this paper provides an insightful exploration of migration and vegetation dynamics in Ghana. Our findings suggest that environmental factors play an important role in causing migration from Northern Ghana to Ghana’s middle belt, and within Southern Ghana to the cocoa frontier
10 The Ghana Living Standard Survey distinguishes the following locality types: rural savannah, urban
savannah, rural forest, urban forest, rural coastal, urban coastal and Accra. In the two years prior to the population census in 2000, urban forest and urban coastal had the lowest poverty rates and highest incomes after Accra. During the last round of the Ghana Living Standard Survey, in 2005/2006, the incidence of poverty was actually higher in Accra than in urban forest and urban coastal communities (Ghana Statistical Service 2007).
11 Migration to Accra is also likely to aggravate ‘Brown Agenda’ environmental problems, like inadequate waste management, poor access to clean water and air pollution.
38
settlement. The natural environment is not an important driver of migration to Ghana’s capital, Accra.
Low rural population density turned out to be an even stronger environmental pull factor than vegetation cover. This is because access to natural resources is more important than the availability of natural resources per se. Densely populated districts in the forest zone are less popular destinations for migrants from Northern Ghana who cannot afford to rent or purchase land there. Even autochthonous farmers in these areas find it hard to get access to land to expand their cocoa plantations, and many of them move to sparsely populated new cocoa areas in the southwest.
To assess the environmental impact of migration, we related the trends in vegeta-tion cover over the past 25 years to net migration figures at the district level. In the new cocoa frontier, strongly reducing NDVI amplitudes indicate a conversion from forest to cocoa. In the forest–savannah transition zone – the main destination of northern migrants – no clear trend was discernible in NDVI values. A possible explanation could be that most settler farmers do not get access to virgin forest. A very significant positive trend in vegetation cover has taken place in Northern Ghana, especially in districts with high out-migration rates. We found a strong correlation between net migration and vegetation change, even after accounting for rainfall trends. This could be an indication that out-migration has a positive effect on vegetation cover by reducing pressure on natural resources.
Spatial–temporal data derived from satellite sensors can provide an important input for analyzing migration factors. This is especially true when longer time-series are available, which match with demographic and socioeconomic data. However, knowledge of migration systems and the physical environment is required for making useful interpretations of such satellite-derived data. This study underlines the need for more collaboration between remote sensing experts and social scientists in analyzing environmental causes and consequences of migration.
3 North-South migration in Ghana: What role for the environment?1
Abstract
The purpose of this paper is to determine the importance of the environment as a driver of North-South migration in Ghana. Almost one in every five people born in Northern Ghana is living in Southern Ghana. Interviews with 203 migrant farmers suggest that migration from the North to the South is, to a large extent, environmen-tally induced. Many Northerners decided to migrate because of poor agro-ecological conditions at home combined with easy access to fertile lands in the more humid destination area. The interviews with migrant farmers yielded several insights that are relevant for the environmental refugee debate. Firstly, environmental pull appears to be at least as important as environmental push. Secondly, scarcity of fertile land was mentioned much more often as a reason to migrate than climate change or erratic rainfall. Thirdly, none of the respondents ascribed the migration decision to sudden-onset environmental stress. If the environment is indeed an important driver of migration, one would expect migration rates to be higher in places with and times of more severe scarcity. A cross-sectional analysis of migration propensities and natural resources scarcity confirms that out-migration
1 This chapter has been published as: Van der Geest, K. (2011). North-South migration in Ghana: What role
for the environment? International Migration 49 (S1): e69-e94. There are minor differences between the article and this chapter. The main difference is the inclusion of table 3.2 (migration reasons mentioned by Dagara settlers in the Brong Ahafo Region). A summary of the findings from this chapter has been published as: Van der Geest, K. & R. de Jeu (2008). Climate Change and Displacement: Ghana. Forced
Migration Review 16: 31.
40
rates are significantly higher in poorly endowed districts. A longitudinal analysis of migration and rainfall shows that the period of worst environmental stress – during the Sahelian droughts of the late 1970s and early 1980s – was a time of reduced out-migration from Northern Ghana. In this period of Northern Ghana’s migration history, economic and political factors weighed heavier than environmental factors. The picture that emerges for Northern Ghana is not one of distress migration in the face of environmental disaster but rather of migration as a way of dealing with structural environmental scarcity.
Introduction
Rural people in developing countries, and particularly in Sub-Saharan Africa, are among the most vulnerable to climate change. Most of them depend on rain-fed agriculture for their livelihood and their governments often lack the resources to protect citizens against the adverse effects of climate change and other environ-mental disruptions. High levels of poverty limit their capacity to cope with extreme weather events and to adapt to more permanent changes in the climate. However, in risk-prone environments where the state has little to offer, surprisingly adaptable livelihood systems can evolve. In the savannah of West Africa, for example, people have had to deal with climatic variability and environmental stresses since time immemorial, and most of the time they have done so quite successfully. Human mobility has a very central place in the adaptive strategies of farmers and pastoral-ists in this region (Mortimore 1989; Davies 1996; Van der Geest 2004; Dietz et al. 2004; De Bruijn & van Dijk 2004; Broekhuis et al. 2004).
The International Panel on Climate Change (2007) foresees that one of the consequences of climate change will be increased migration flows from affected areas. This sounds commonsensical but, so far, studies of migration-environment linkages have shown above all that explaining migration flows is a very complex undertaking.2 There are numerous overlapping theories that each have some explanatory power.3 Environmental push and pull can be important contributing factors in many migration flows, but except under very specific circumstances, they never act alone.
In a survey among 203 migrants from the savannah in Northwest Ghana, the majority stated that they left their homes for environmental reasons. The respon-dents were farmers living in rural destinations in the forest-savannah transition zone in Ghana’s Brong Ahafo Region. Most of them indicated that they decided to migrate because of the scarcity of fertile land, low crop yields and food security
2 See Renaud et al. (2007) for an overview of earlier studies in the field of migration-environment linkages. 3 See Massey et al. (1993) for a good review of migration theories. A shortcoming of this article is that it
makes no mention of the environmental causes of migration.
41
problems in the North. The main attraction of their destination area in Southern Ghana was access to fertile land to farm. Unreliable rainfall and climate change were mentioned by much fewer respondents than expected. Many migrants stated quite generally that poverty and financial problems were an important reason for them to migrate. Being farmers, one can reasonably expect a link between their lack of income and poor agro-ecological conditions. A minority mentioned non-environmental reasons for migrating, like family conflicts, witchcraft, lack of non-farm income opportunities and the desire to be free and independent.
The purpose of this paper is to determine the importance of the environment as a driver of North-South migration in Ghana. The survey findings summarized above indicate that this group of migrants indeed experienced a certain degree of environmental push and pull. However, such survey findings provide an insufficient basis for a proper assessment of the environment-migration link. If the survey respondents had been migrants in urban localities, for example, the answers would have been different. Moreover, respondents will not refer to certain underlying causes of migration and underdevelopment when asked about their personal motivation to migrate. The environment, on the other hand, easily becomes part of local discourses on migration because farmers experience the environment every day.
One of the problems in migration-environment studies is the difficulty of estab-lishing causal relations (see e.g. Black 2001; Castles 2002; Renaud et al. 2007). In his critical review of the environmental refugee debate, Black (2001: 6) states:
For the ‘environmental refugees’ thesis to be plausible in the Sahel and other semi-arid regions, what is required is not simply evidence of migration from what have always been harsh, marginal environments; rather evidence is needed of an increase in migration at times, or in places, of more severe environmental degradation.
Indeed, if the environment is an important factor in explaining migration from the West African interior savannah to the moister forest and coastal zones, one can reasonably expect migration propensities to be higher (1) in less environmentally endowed areas and (2) in times of increased environmental scarcity. In this paper, these hypotheses are tested for Northern Ghana. The analysis is based on a variety of secondary data sources, including population censuses, meteorological data, remote sensing data and agricultural statistics. This part of the paper does not include the views of migrants. However, in the last part of this paper, survey findings are presented that detail people’s personal motivations to migrate. None of these sources alone can adequately address the complex reality of migration-environment relations. It is only through a sensible combination of sources that a ‘moving picture’ can emerge that holds some degree of trustworthiness.
The structure of this paper is as follows. The patterns and trends of North-South migration in Ghana are introduced in section two. Section three presents a cross-
42
sectional analysis of migration, rainfall, vegetation, agricultural productivity and rural population density to show that migration propensities indeed tend to be higher in districts with more natural resources scarcity. The longitudinal analysis of migration, rainfall and vegetation in section four provides no evidence of increased migration in times of more severe environmental stress. The findings from section three and four indicate that the environmental driver of migration from Northern Ghana is not so much degradation, but rather structural scarcity. The survey data presented in section five confirms this finding: very few respondents talked of environmental change, while the vast majority did allude to structural characteristics of the environment in Northern Ghana.
Migration from Northern Ghana: patterns and trends
In pre-colonial times there seems to have been little migration from present-day Northern Ghana to the South. Cleveland (1991: 222) describes human mobility in this era as “a tradition of local migration by many and long-distance migration by a minority of warriors and traders.” As in many other parts of Africa, people migrated over shorter distances in search of fertile lands and to escape conflict and slave raiders (Adepoju 1995; Van Dijk et al. 2001). In the 18th and 19th centuries, large-scale voluntary migration was impeded by conflict and insecurity resulting from the wars between the Ashanti, the Gonja and the Dagomba and the related activities of slave raiders. The Northern Territories of the Gold Coast (now Northern Ghana) were colonised by the British at the turn of the century. The first decades of colonial rule were the time of forced migration through labour recruitment. This period lasted about two decades, from 1906 to 1927 (Lentz 2006: 139-142). The colonial government recruited labourers for the mines and for railway and road construction in Southern Ghana. Voluntary migration started not long after the first forced migrants had returned from Southern Ghana. Most of the early voluntary migrants were attracted by good labour opportunities in the booming cocoa sector.
Figure 3.1 shows the long-term trend in annual population growth for different parts of Ghana. It also depicts the rough trend in migration propensities in Northern Ghana. The trend is rough because the quality of the early census data is question-able and because population change is not only determined by migration rates, but also by fertility and mortality. However, spatio-temporal variations in fertility and mortality are much smaller than regional and temporal variations in net migration rates.4 Therefore, it can be argued that periods in which population growth declined
4 In the first half of the 20th century, mortality rates declined rapidly while fertility remained high
throughout the country: around 7 children per woman (Ghana Statistical Service 2005a). In the past two to three decades, Ghana has gone through a ‘reproductive revolution’ (Chucks 2002). Fertility rates dropped sharply, especially in urban areas. This trend is also discernible in the Upper East and Upper West Region, but in the Northern Region fertility remains high (Ghana Statistical Service 2004).
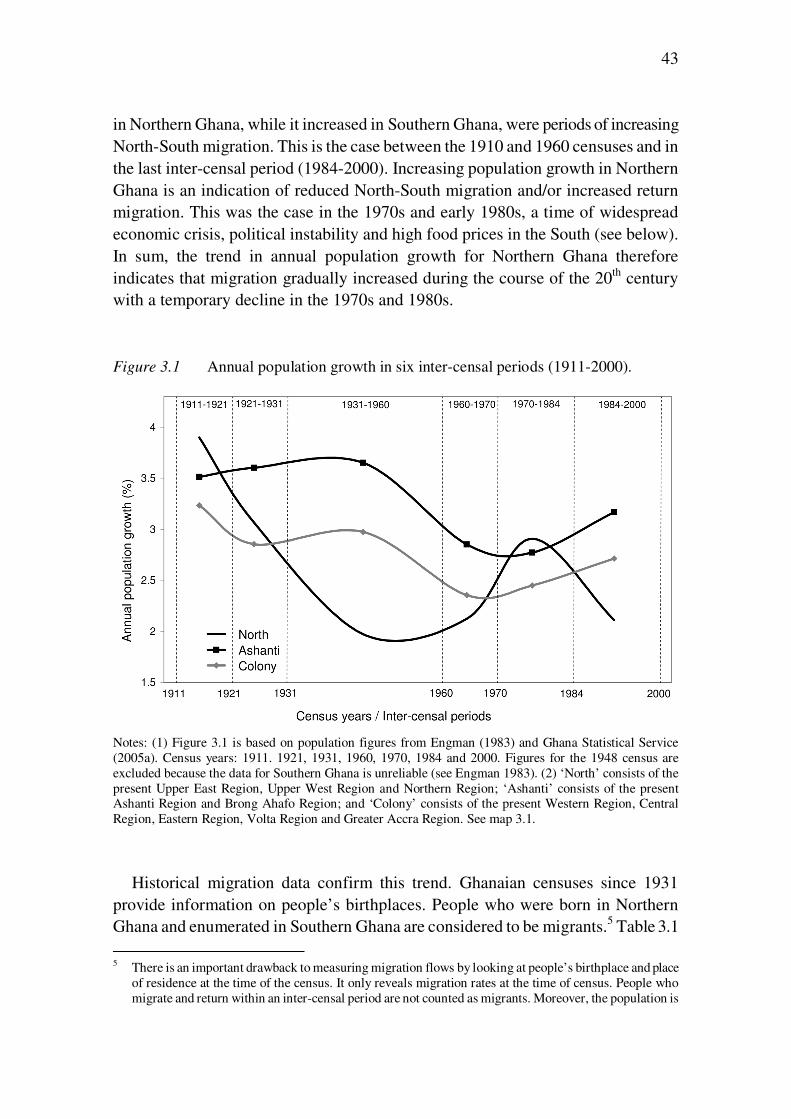
43
in Northern Ghana, while it increased in Southern Ghana, were periods of increasing North-South migration. This is the case between the 1910 and 1960 censuses and in the last inter-censal period (1984-2000). Increasing population growth in Northern Ghana is an indication of reduced North-South migration and/or increased return migration. This was the case in the 1970s and early 1980s, a time of widespread economic crisis, political instability and high food prices in the South (see below). In sum, the trend in annual population growth for Northern Ghana therefore indicates that migration gradually increased during the course of the 20th century with a temporary decline in the 1970s and 1980s. Figure 3.1 Annual population growth in six inter-censal periods (1911-2000).
Notes: (1) Figure 3.1 is based on population figures from Engman (1983) and Ghana Statistical Service (2005a). Census years: 1911. 1921, 1931, 1960, 1970, 1984 and 2000. Figures for the 1948 census are excluded because the data for Southern Ghana is unreliable (see Engman 1983). (2) ‘North’ consists of the present Upper East Region, Upper West Region and Northern Region; ‘Ashanti’ consists of the present Ashanti Region and Brong Ahafo Region; and ‘Colony’ consists of the present Western Region, Central Region, Eastern Region, Volta Region and Greater Accra Region. See map 3.1.
Historical migration data confirm this trend. Ghanaian censuses since 1931 provide information on people’s birthplaces. People who were born in Northern Ghana and enumerated in Southern Ghana are considered to be migrants.5 Table 3.1 5 There is an important drawback to measuring migration flows by looking at people’s birthplace and place
of residence at the time of the census. It only reveals migration rates at the time of census. People who migrate and return within an inter-censal period are not counted as migrants. Moreover, the population is
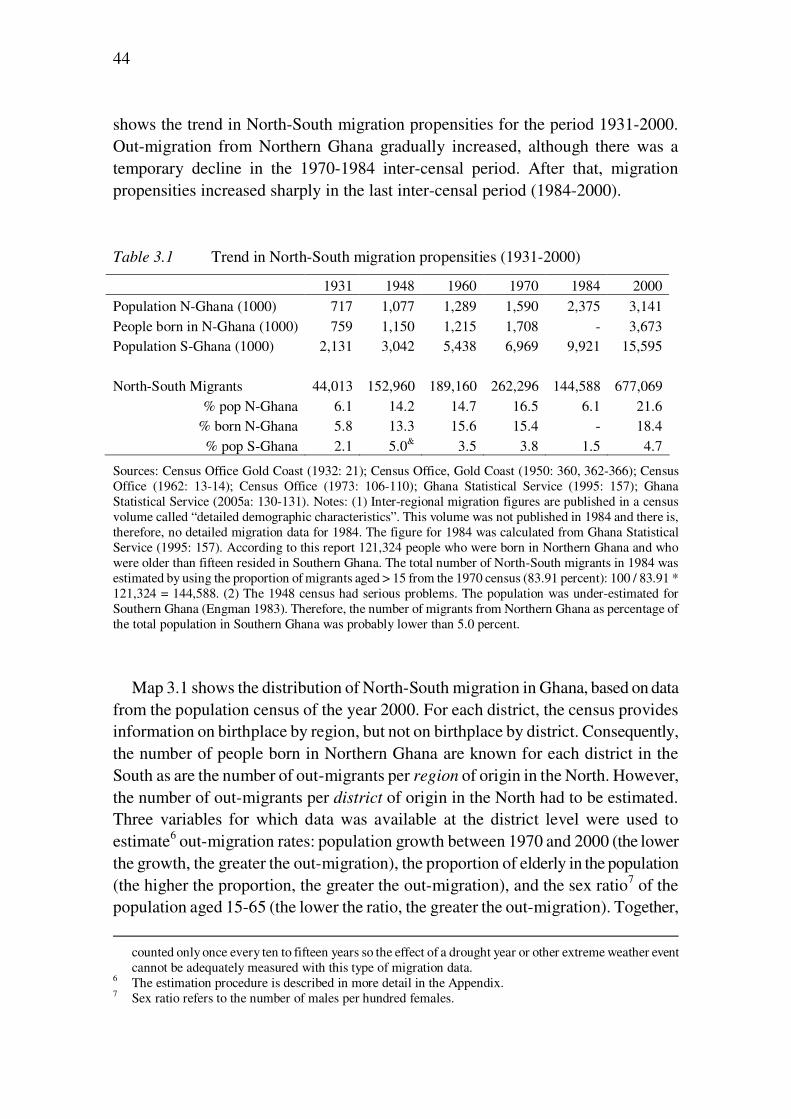
44
shows the trend in North-South migration propensities for the period 1931-2000. Out-migration from Northern Ghana gradually increased, although there was a temporary decline in the 1970-1984 inter-censal period. After that, migration propensities increased sharply in the last inter-censal period (1984-2000). Table 3.1 Trend in North-South migration propensities (1931-2000)
1931 1948 1960 1970 1984 2000
Population N-Ghana (1000) 717 1,077 1,289 1,590 2,375 3,141 People born in N-Ghana (1000) 759 1,150 1,215 1,708 - 3,673 Population S-Ghana (1000) 2,131 3,042 5,438 6,969 9,921 15,595 North-South Migrants 44,013 152,960 189,160 262,296 144,588 677,069
% pop N-Ghana 6.1 14.2 14.7 16.5 6.1 21.6 % born N-Ghana 5.8 13.3 15.6 15.4 - 18.4
% pop S-Ghana 2.1 5.0& 3.5 3.8 1.5 4.7
Sources: Census Office Gold Coast (1932: 21); Census Office, Gold Coast (1950: 360, 362-366); Census Office (1962: 13-14); Census Office (1973: 106-110); Ghana Statistical Service (1995: 157); Ghana Statistical Service (2005a: 130-131). Notes: (1) Inter-regional migration figures are published in a census volume called “detailed demographic characteristics”. This volume was not published in 1984 and there is, therefore, no detailed migration data for 1984. The figure for 1984 was calculated from Ghana Statistical Service (1995: 157). According to this report 121,324 people who were born in Northern Ghana and who were older than fifteen resided in Southern Ghana. The total number of North-South migrants in 1984 was estimated by using the proportion of migrants aged > 15 from the 1970 census (83.91 percent): 100 / 83.91 * 121,324 = 144,588. (2) The 1948 census had serious problems. The population was under-estimated for Southern Ghana (Engman 1983). Therefore, the number of migrants from Northern Ghana as percentage of the total population in Southern Ghana was probably lower than 5.0 percent.
Map 3.1 shows the distribution of North-South migration in Ghana, based on data from the population census of the year 2000. For each district, the census provides information on birthplace by region, but not on birthplace by district. Consequently, the number of people born in Northern Ghana are known for each district in the South as are the number of out-migrants per region of origin in the North. However, the number of out-migrants per district of origin in the North had to be estimated. Three variables for which data was available at the district level were used to estimate6 out-migration rates: population growth between 1970 and 2000 (the lower the growth, the greater the out-migration), the proportion of elderly in the population (the higher the proportion, the greater the out-migration), and the sex ratio7 of the population aged 15-65 (the lower the ratio, the greater the out-migration). Together,
counted only once every ten to fifteen years so the effect of a drought year or other extreme weather event cannot be adequately measured with this type of migration data.
6 The estimation procedure is described in more detail in the Appendix. 7 Sex ratio refers to the number of males per hundred females.
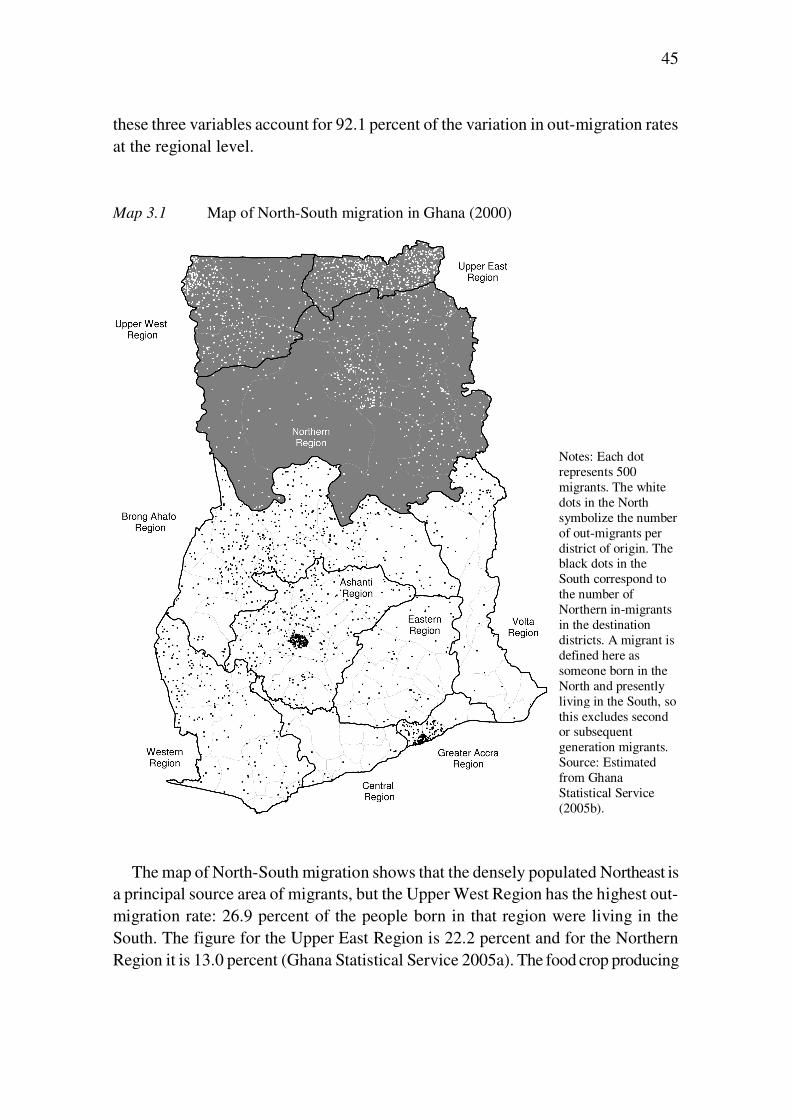
45
these three variables account for 92.1 percent of the variation in out-migration rates at the regional level. Map 3.1 Map of North-South migration in Ghana (2000)
Notes: Each dot represents 500 migrants. The white dots in the North symbolize the number of out-migrants per district of origin. The black dots in the South correspond to the number of Northern in-migrants in the destination districts. A migrant is defined here as someone born in the North and presently living in the South, so this excludes second or subsequent generation migrants. Source: Estimated from Ghana Statistical Service (2005b).
The map of North-South migration shows that the densely populated Northeast is a principal source area of migrants, but the Upper West Region has the highest out-migration rate: 26.9 percent of the people born in that region were living in the South. The figure for the Upper East Region is 22.2 percent and for the Northern Region it is 13.0 percent (Ghana Statistical Service 2005a). The food crop producing
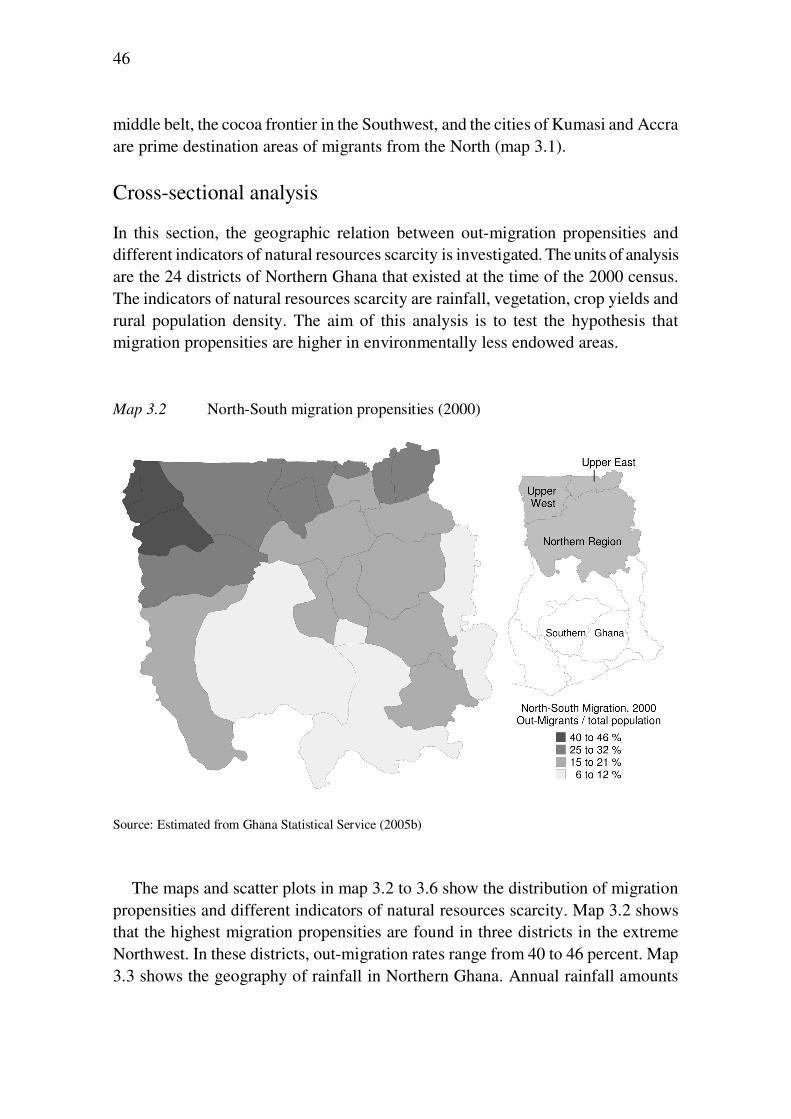
46
middle belt, the cocoa frontier in the Southwest, and the cities of Kumasi and Accra are prime destination areas of migrants from the North (map 3.1).
Cross-sectional analysis
In this section, the geographic relation between out-migration propensities and different indicators of natural resources scarcity is investigated. The units of analysis are the 24 districts of Northern Ghana that existed at the time of the 2000 census. The indicators of natural resources scarcity are rainfall, vegetation, crop yields and rural population density. The aim of this analysis is to test the hypothesis that migration propensities are higher in environmentally less endowed areas. Map 3.2 North-South migration propensities (2000)
Source: Estimated from Ghana Statistical Service (2005b)
The maps and scatter plots in map 3.2 to 3.6 show the distribution of migration propensities and different indicators of natural resources scarcity. Map 3.2 shows that the highest migration propensities are found in three districts in the extreme Northwest. In these districts, out-migration rates range from 40 to 46 percent. Map 3.3 shows the geography of rainfall in Northern Ghana. Annual rainfall amounts
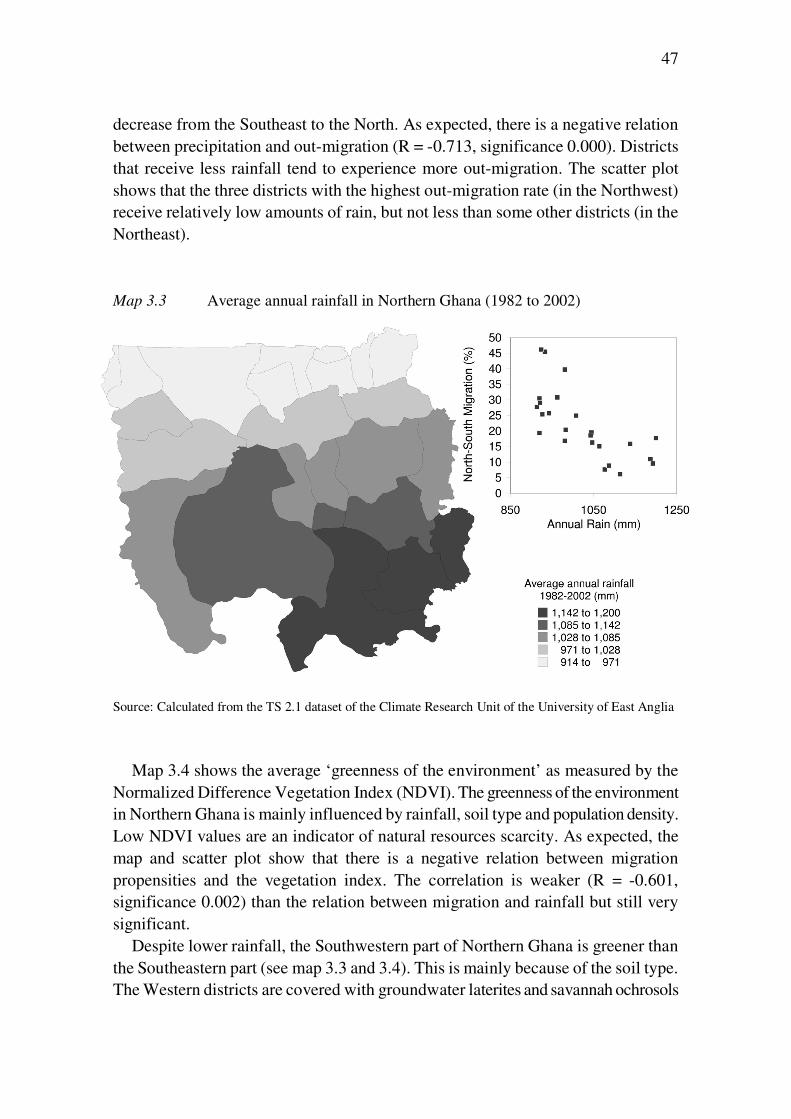
47
decrease from the Southeast to the North. As expected, there is a negative relation between precipitation and out-migration (R = -0.713, significance 0.000). Districts that receive less rainfall tend to experience more out-migration. The scatter plot shows that the three districts with the highest out-migration rate (in the Northwest) receive relatively low amounts of rain, but not less than some other districts (in the Northeast). Map 3.3 Average annual rainfall in Northern Ghana (1982 to 2002)
Source: Calculated from the TS 2.1 dataset of the Climate Research Unit of the University of East Anglia
Map 3.4 shows the average ‘greenness of the environment’ as measured by the Normalized Difference Vegetation Index (NDVI). The greenness of the environment in Northern Ghana is mainly influenced by rainfall, soil type and population density. Low NDVI values are an indicator of natural resources scarcity. As expected, the map and scatter plot show that there is a negative relation between migration propensities and the vegetation index. The correlation is weaker (R = -0.601, significance 0.002) than the relation between migration and rainfall but still very significant.
Despite lower rainfall, the Southwestern part of Northern Ghana is greener than the Southeastern part (see map 3.3 and 3.4). This is mainly because of the soil type. The Western districts are covered with groundwater laterites and savannah ochrosols
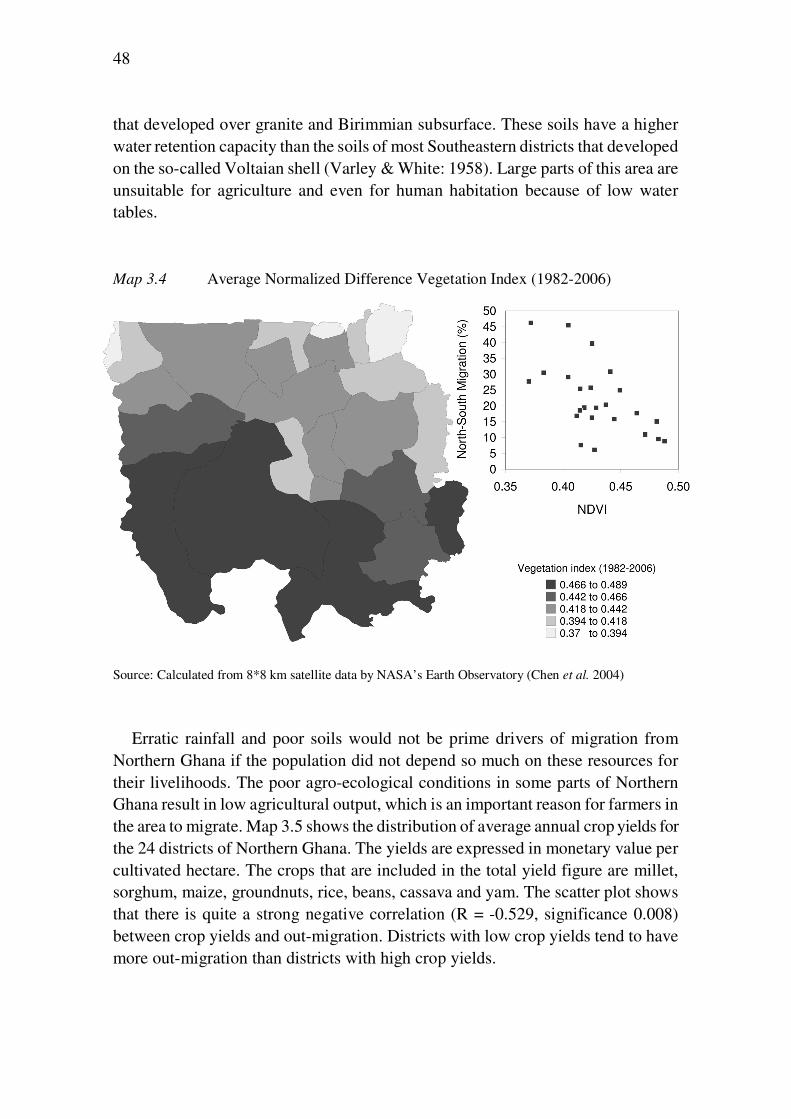
48
that developed over granite and Birimmian subsurface. These soils have a higher water retention capacity than the soils of most Southeastern districts that developed on the so-called Voltaian shell (Varley & White: 1958). Large parts of this area are unsuitable for agriculture and even for human habitation because of low water tables. Map 3.4 Average Normalized Difference Vegetation Index (1982-2006)
Source: Calculated from 8*8 km satellite data by NASA’s Earth Observatory (Chen et al. 2004)
Erratic rainfall and poor soils would not be prime drivers of migration from Northern Ghana if the population did not depend so much on these resources for their livelihoods. The poor agro-ecological conditions in some parts of Northern Ghana result in low agricultural output, which is an important reason for farmers in the area to migrate. Map 3.5 shows the distribution of average annual crop yields for the 24 districts of Northern Ghana. The yields are expressed in monetary value per cultivated hectare. The crops that are included in the total yield figure are millet, sorghum, maize, groundnuts, rice, beans, cassava and yam. The scatter plot shows that there is quite a strong negative correlation (R = -0.529, significance 0.008) between crop yields and out-migration. Districts with low crop yields tend to have more out-migration than districts with high crop yields.
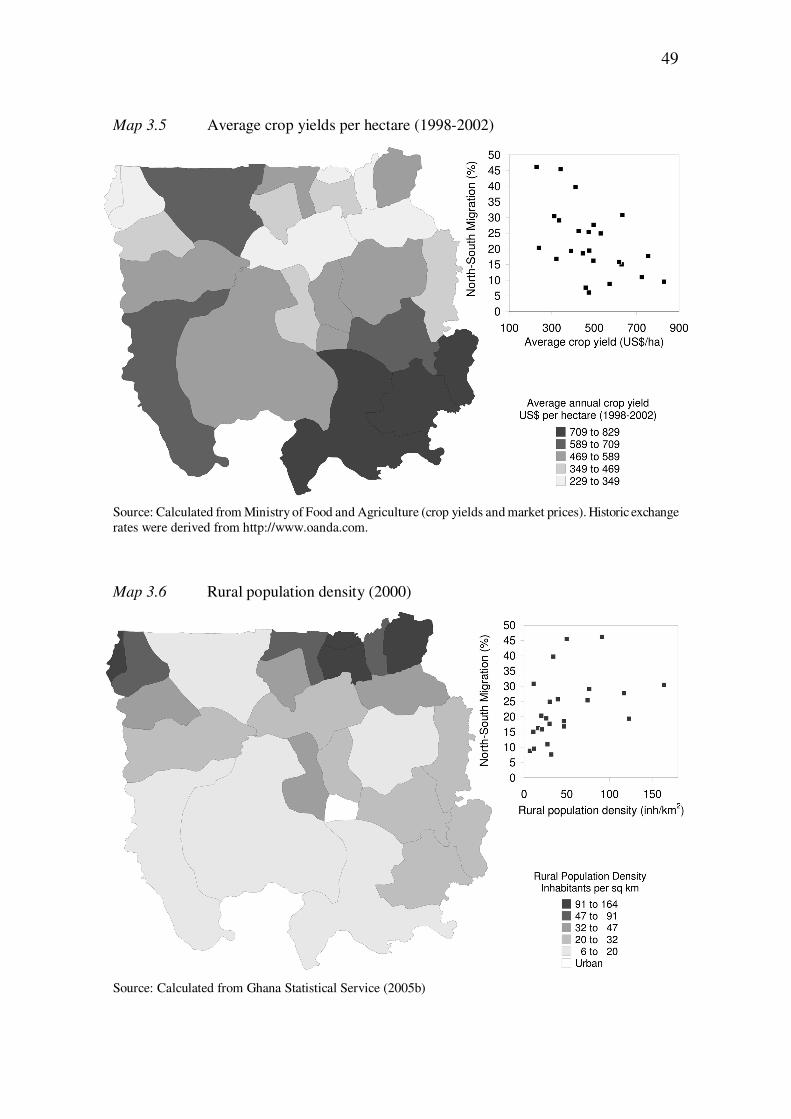
49
Map 3.5 Average crop yields per hectare (1998-2002)
Source: Calculated from Ministry of Food and Agriculture (crop yields and market prices). Historic exchange rates were derived from http://www.oanda.com.
Map 3.6 Rural population density (2000)
Source: Calculated from Ghana Statistical Service (2005b)
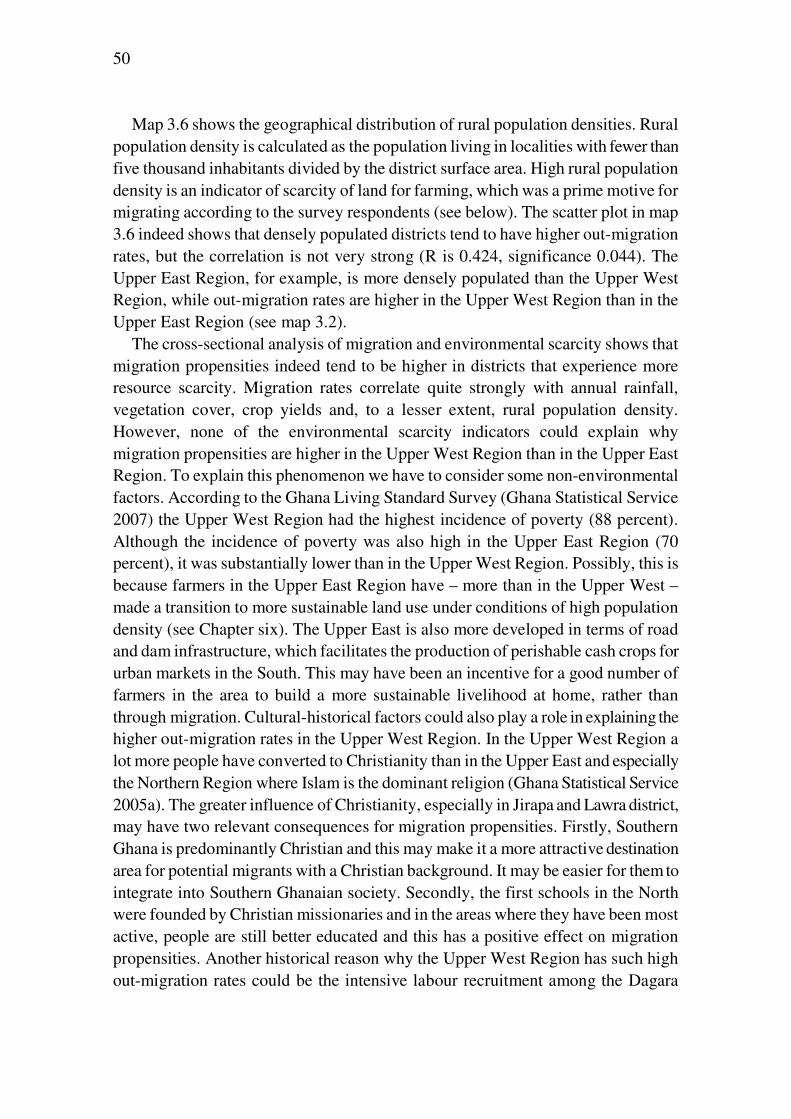
50
Map 3.6 shows the geographical distribution of rural population densities. Rural population density is calculated as the population living in localities with fewer than five thousand inhabitants divided by the district surface area. High rural population density is an indicator of scarcity of land for farming, which was a prime motive for migrating according to the survey respondents (see below). The scatter plot in map 3.6 indeed shows that densely populated districts tend to have higher out-migration rates, but the correlation is not very strong (R is 0.424, significance 0.044). The Upper East Region, for example, is more densely populated than the Upper West Region, while out-migration rates are higher in the Upper West Region than in the Upper East Region (see map 3.2).
The cross-sectional analysis of migration and environmental scarcity shows that migration propensities indeed tend to be higher in districts that experience more resource scarcity. Migration rates correlate quite strongly with annual rainfall, vegetation cover, crop yields and, to a lesser extent, rural population density. However, none of the environmental scarcity indicators could explain why migration propensities are higher in the Upper West Region than in the Upper East Region. To explain this phenomenon we have to consider some non-environmental factors. According to the Ghana Living Standard Survey (Ghana Statistical Service 2007) the Upper West Region had the highest incidence of poverty (88 percent). Although the incidence of poverty was also high in the Upper East Region (70 percent), it was substantially lower than in the Upper West Region. Possibly, this is because farmers in the Upper East Region have – more than in the Upper West – made a transition to more sustainable land use under conditions of high population density (see Chapter six). The Upper East is also more developed in terms of road and dam infrastructure, which facilitates the production of perishable cash crops for urban markets in the South. This may have been an incentive for a good number of farmers in the area to build a more sustainable livelihood at home, rather than through migration. Cultural-historical factors could also play a role in explaining the higher out-migration rates in the Upper West Region. In the Upper West Region a lot more people have converted to Christianity than in the Upper East and especially the Northern Region where Islam is the dominant religion (Ghana Statistical Service 2005a). The greater influence of Christianity, especially in Jirapa and Lawra district, may have two relevant consequences for migration propensities. Firstly, Southern Ghana is predominantly Christian and this may make it a more attractive destination area for potential migrants with a Christian background. It may be easier for them to integrate into Southern Ghanaian society. Secondly, the first schools in the North were founded by Christian missionaries and in the areas where they have been most active, people are still better educated and this has a positive effect on migration propensities. Another historical reason why the Upper West Region has such high out-migration rates could be the intensive labour recruitment among the Dagara
51
people of Northwest Ghana in the colonial era (Lentz 2006). Since the early decades of the 20th century a culture of migration evolved and the influence may still be felt today.
Longitudinal analysis
In this section the hypothesis is tested that migration propensities increase in times of greater environmental stress. Figure 3.2 shows the trends in annual rainfall and migration propensities in Northern Ghana. The figure shows that after the relatively wet 1960s, rainfall conditions deteriorated in the late 1970s and early 1980s. This was the time of the great Sahelian droughts that also affected Northern Ghana (Dietz et al. 2004). Most people in Northern Ghana practice rain-fed agriculture and the drought years of the late 1970s and 1980s have entered collective memory as an extremely harsh time (Van der Geest 2004). If environmental degradation is a prime driver of migration, one would expect an increase in migration during this period. Surprisingly, this was a period of reduced out-migration from Northern Ghana (see also figure 3.1 and table 3.1). Apparently, stronger forces were at play.
The 1970s and 1980s were times of widespread economic crisis, political instabil-ity and high food prices in Ghana. Southern Ghana, the main destination area of Northern migrants, was particularly affected. The adverse conditions in the South made many decide to refrain from migrating. Many migrants also returned to the North. The census data does not disclose when exactly the drastic reduction in out-migration from Northern Ghana started. GDP growth figures for Ghana as a whole indicate that the worst economic crisis lasted from the mid 1970s to the early 1980s (Aryeetey and Fosu 2004). There were two military coups in 1979 and 1981. In the pre-census year (1983) the drought also reached Southern Ghana, causing widespread bush fires and destroying large areas planted with cocoa. Moreover, about one million Ghanaians were forcefully expelled from Nigeria in 1983. The shops were almost empty and people had to queue for long hours to buy basic commodities and foodstuffs. In the same year, the Ghanaian government accepted the structural adjustment policies of the IMF and many government workers were laid off causing large-scale unemployment. Southern Ghanaians started competing with Northern migrants for the unpopular jobs that were previously occupied by the latter. For many Northerners, a return to their farm-based livelihoods in the North seemed the best option, at least for the time being. In the last inter-censal period (1984-2000), annual rainfall figures in Northern Ghana partially recovered, the economy stabilized (Aryeetey and Fosu 2004), and out-migration from Northern Ghana increased sharply.
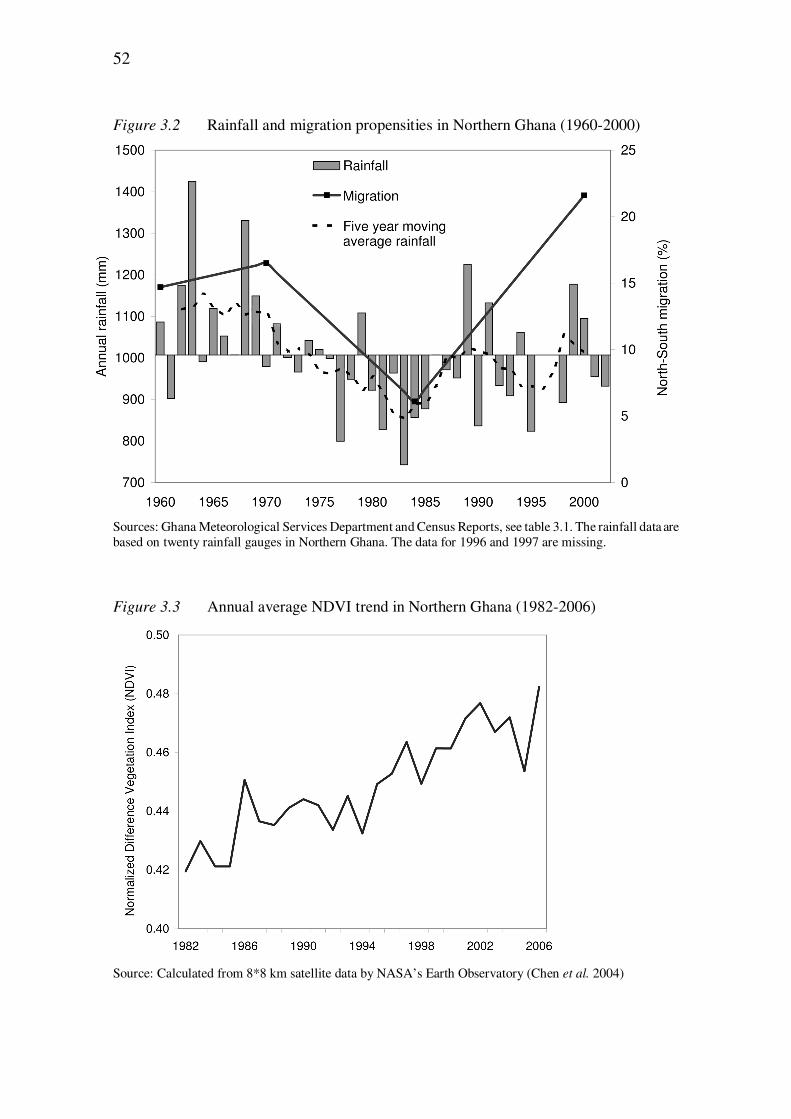
52
Figure 3.2 Rainfall and migration propensities in Northern Ghana (1960-2000)
Sources: Ghana Meteorological Services Department and Census Reports, see table 3.1. The rainfall data are based on twenty rainfall gauges in Northern Ghana. The data for 1996 and 1997 are missing.
Figure 3.3 Annual average NDVI trend in Northern Ghana (1982-2006)
Source: Calculated from 8*8 km satellite data by NASA’s Earth Observatory (Chen et al. 2004)
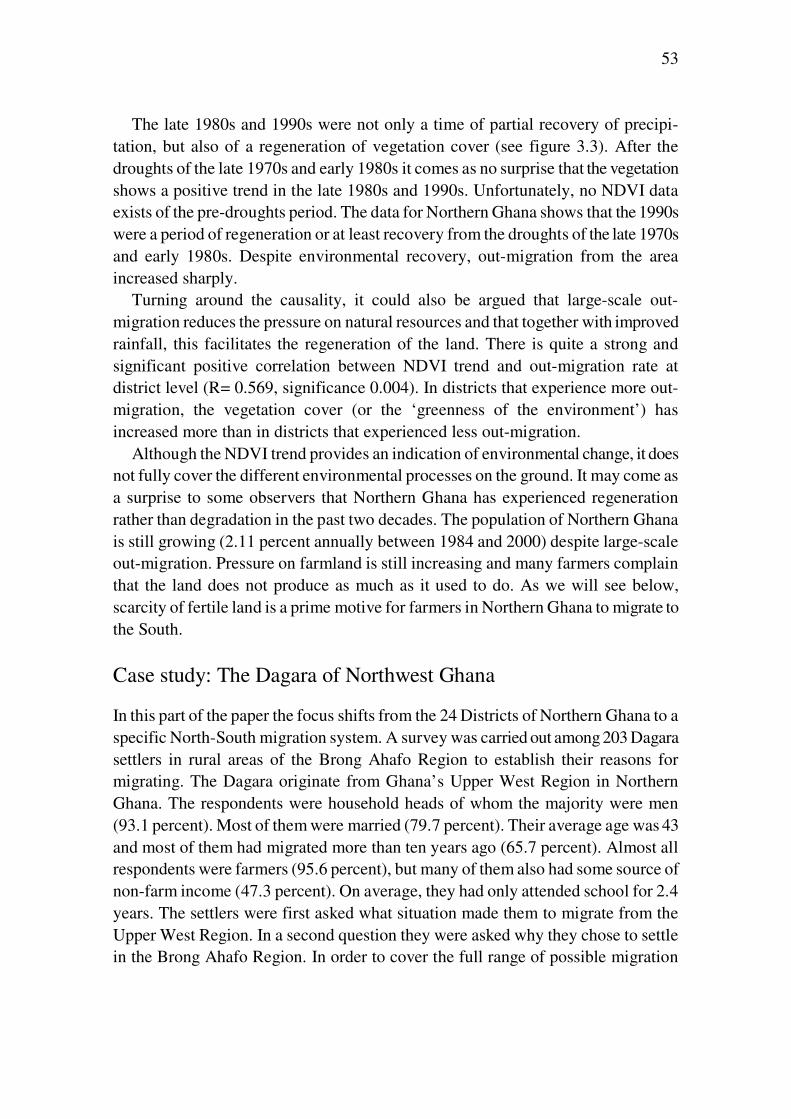
53
The late 1980s and 1990s were not only a time of partial recovery of precipi-tation, but also of a regeneration of vegetation cover (see figure 3.3). After the droughts of the late 1970s and early 1980s it comes as no surprise that the vegetation shows a positive trend in the late 1980s and 1990s. Unfortunately, no NDVI data exists of the pre-droughts period. The data for Northern Ghana shows that the 1990s were a period of regeneration or at least recovery from the droughts of the late 1970s and early 1980s. Despite environmental recovery, out-migration from the area increased sharply.
Turning around the causality, it could also be argued that large-scale out-migration reduces the pressure on natural resources and that together with improved rainfall, this facilitates the regeneration of the land. There is quite a strong and significant positive correlation between NDVI trend and out-migration rate at district level (R= 0.569, significance 0.004). In districts that experience more out-migration, the vegetation cover (or the ‘greenness of the environment’) has increased more than in districts that experienced less out-migration.
Although the NDVI trend provides an indication of environmental change, it does not fully cover the different environmental processes on the ground. It may come as a surprise to some observers that Northern Ghana has experienced regeneration rather than degradation in the past two decades. The population of Northern Ghana is still growing (2.11 percent annually between 1984 and 2000) despite large-scale out-migration. Pressure on farmland is still increasing and many farmers complain that the land does not produce as much as it used to do. As we will see below, scarcity of fertile land is a prime motive for farmers in Northern Ghana to migrate to the South.
Case study: The Dagara of Northwest Ghana
In this part of the paper the focus shifts from the 24 Districts of Northern Ghana to a specific North-South migration system. A survey was carried out among 203 Dagara settlers in rural areas of the Brong Ahafo Region to establish their reasons for migrating. The Dagara originate from Ghana’s Upper West Region in Northern Ghana. The respondents were household heads of whom the majority were men (93.1 percent). Most of them were married (79.7 percent). Their average age was 43 and most of them had migrated more than ten years ago (65.7 percent). Almost all respondents were farmers (95.6 percent), but many of them also had some source of non-farm income (47.3 percent). On average, they had only attended school for 2.4 years. The settlers were first asked what situation made them to migrate from the Upper West Region. In a second question they were asked why they chose to settle in the Brong Ahafo Region. In order to cover the full range of possible migration
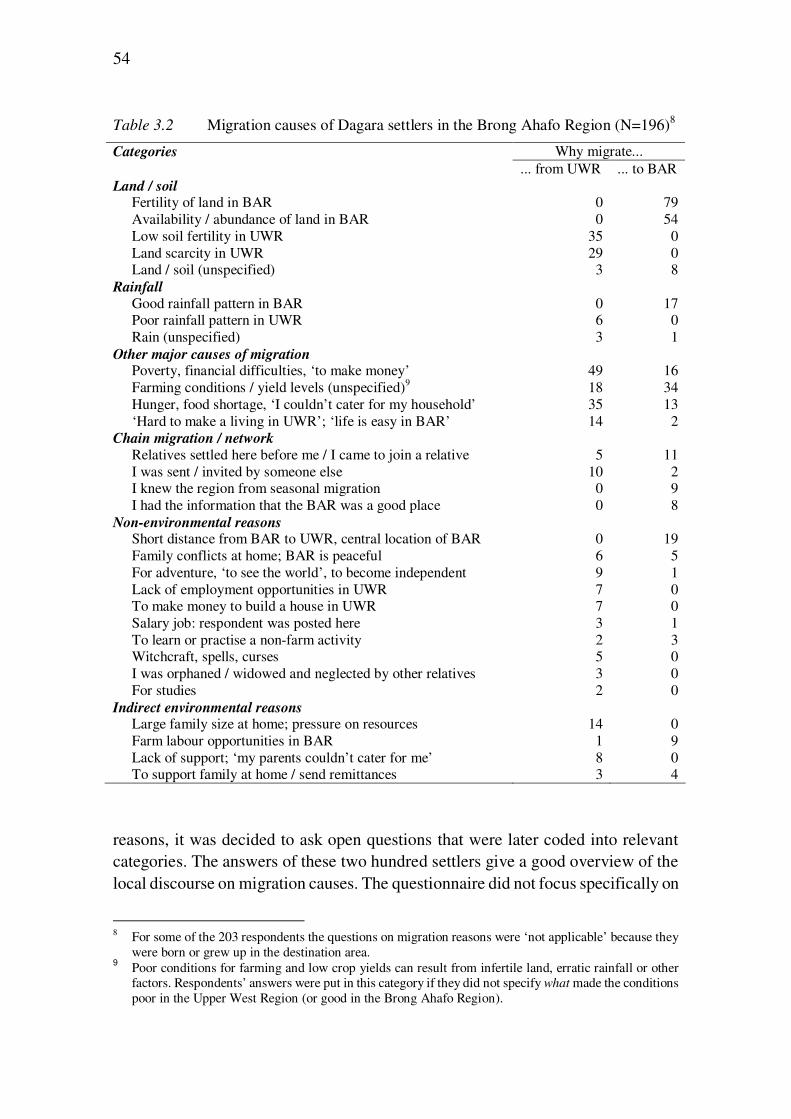
54
Table 3.2 Migration causes of Dagara settlers in the Brong Ahafo Region (N=196)8
Why migrate... Categories
... from UWR ... to BAR Land / soil
Fertility of land in BAR 0 79 Availability / abundance of land in BAR 0 54 Low soil fertility in UWR 35 0 Land scarcity in UWR 29 0 Land / soil (unspecified) 3 8
Rainfall Good rainfall pattern in BAR 0 17 Poor rainfall pattern in UWR 6 0 Rain (unspecified) 3 1
Other major causes of migration Poverty, financial difficulties, ‘to make money’ 49 16 Farming conditions / yield levels (unspecified)9 18 34 Hunger, food shortage, ‘I couldn’t cater for my household’ 35 13 ‘Hard to make a living in UWR’; ‘life is easy in BAR’ 14 2
Chain migration / network Relatives settled here before me / I came to join a relative 5 11 I was sent / invited by someone else 10 2 I knew the region from seasonal migration 0 9 I had the information that the BAR was a good place 0 8
Non-environmental reasons Short distance from BAR to UWR, central location of BAR 0 19 Family conflicts at home; BAR is peaceful 6 5 For adventure, ‘to see the world’, to become independent 9 1 Lack of employment opportunities in UWR 7 0 To make money to build a house in UWR 7 0 Salary job: respondent was posted here 3 1 To learn or practise a non-farm activity 2 3 Witchcraft, spells, curses 5 0 I was orphaned / widowed and neglected by other relatives 3 0 For studies 2 0
Indirect environmental reasons Large family size at home; pressure on resources 14 0 Farm labour opportunities in BAR 1 9 Lack of support; ‘my parents couldn’t cater for me’ 8 0 To support family at home / send remittances 3 4
reasons, it was decided to ask open questions that were later coded into relevant categories. The answers of these two hundred settlers give a good overview of the local discourse on migration causes. The questionnaire did not focus specifically on
8 For some of the 203 respondents the questions on migration reasons were ‘not applicable’ because they
were born or grew up in the destination area. 9 Poor conditions for farming and low crop yields can result from infertile land, erratic rainfall or other
factors. Respondents’ answers were put in this category if they did not specify what made the conditions poor in the Upper West Region (or good in the Brong Ahafo Region).
55
environmental causes of migration. Hence, respondents were not pushed in their answers in any way.
A migration decision usually results from a complex set of overlapping causes at different levels. At micro-level there are individual reasons pertaining to the respondent’s specific situation. At a higher geographical level, there are underlying causes of migration that are related to the characteristics of the source area and the destination area of the migrants. In Hugo’s (1996: 111) ‘simple model of environ-mentally induced migration’ the latter are called ‘predisposing conditions’. Hugo also identifies ‘precipitating events’ and ‘facilitators and constraints to migration’. All these factors could potentially feature in the respondents’ answers. Indeed, as shown in table 3.2, some respondents chose to mention underlying causes (e.g. ‘poor conditions for farming’); others mentioned the objective of their migration (e.g. ‘to make money to build a house’); some referred to individual circumstances (e.g. ‘my parents couldn’t cater for me’); others emphasized factors relating to the process of migrating (e.g. ‘I worked here as a seasonal labourer and saw that it was a good place to settle’); and facilitators of migration were also mentioned (‘relatives settled here before me’).
In the sections below, the survey findings are discussed with a focus on some theoretical issues in the environmental refugee debate. This should help to answer the complicated question of whether North-South migration in Ghana is environ-mentally induced and to what extent migrants are forced to migrate.
Relative importance of environmental reasons to migrate
Land turned out to be the key factor in causing Dagara migration to the Brong Ahafo Region. Many respondents mentioned land scarcity (29) or infertility (35) at home, but even more indicated that they were attracted to the Brong Ahafo Region because of the abundance (54) and fertility (79) of land. Seventy percent of the respondents mentioned one of these four reasons for migrating. More generally, one can say that Dagara migrants settle in the Brong Ahafo Region because the conditions for farming are much better than at home. Surprisingly, few Dagara settlers referred to the poor rainfall pattern at home (6) or the more attractive rainfall pattern in the destination area (17). The Upper West has only one rainy season while the main destination areas in the Brong Ahafo Region have two rainy seasons with enough precipitation to sustain two harvests per year. Moreover, farmers in the Upper West Region often complain about the increased unreliability of rainfall (Van der Geest 2004). None of the respondents mentioned this factor, and neither did they mention droughts or floods.10 Another important observation is that there was no mention of environmental stresses other than those related to soil and rain.
10 Similar results were found by Henry et al. (2004) for Burkina Faso.
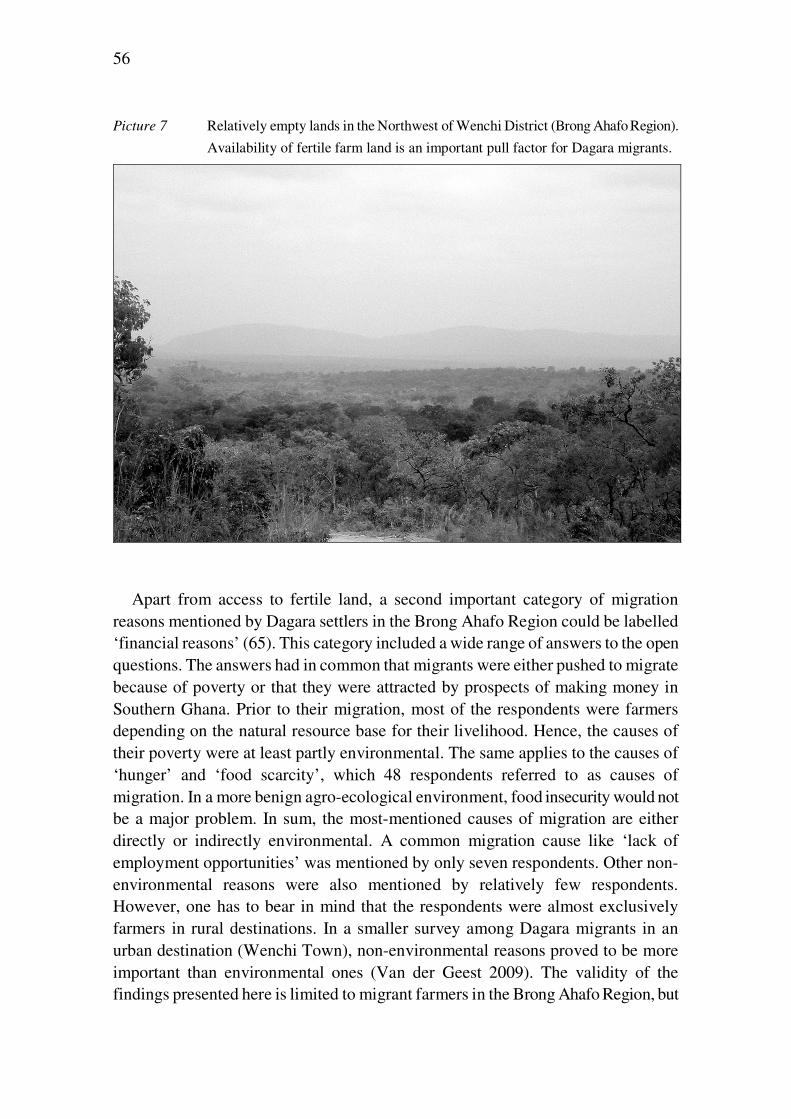
56
Picture 7 Relatively empty lands in the Northwest of Wenchi District (Brong Ahafo Region).
Availability of fertile farm land is an important pull factor for Dagara migrants.
Apart from access to fertile land, a second important category of migration reasons mentioned by Dagara settlers in the Brong Ahafo Region could be labelled ‘financial reasons’ (65). This category included a wide range of answers to the open questions. The answers had in common that migrants were either pushed to migrate because of poverty or that they were attracted by prospects of making money in Southern Ghana. Prior to their migration, most of the respondents were farmers depending on the natural resource base for their livelihood. Hence, the causes of their poverty were at least partly environmental. The same applies to the causes of ‘hunger’ and ‘food scarcity’, which 48 respondents referred to as causes of migration. In a more benign agro-ecological environment, food insecurity would not be a major problem. In sum, the most-mentioned causes of migration are either directly or indirectly environmental. A common migration cause like ‘lack of employment opportunities’ was mentioned by only seven respondents. Other non-environmental reasons were also mentioned by relatively few respondents. However, one has to bear in mind that the respondents were almost exclusively farmers in rural destinations. In a smaller survey among Dagara migrants in an urban destination (Wenchi Town), non-environmental reasons proved to be more important than environmental ones (Van der Geest 2009). The validity of the findings presented here is limited to migrant farmers in the Brong Ahafo Region, but
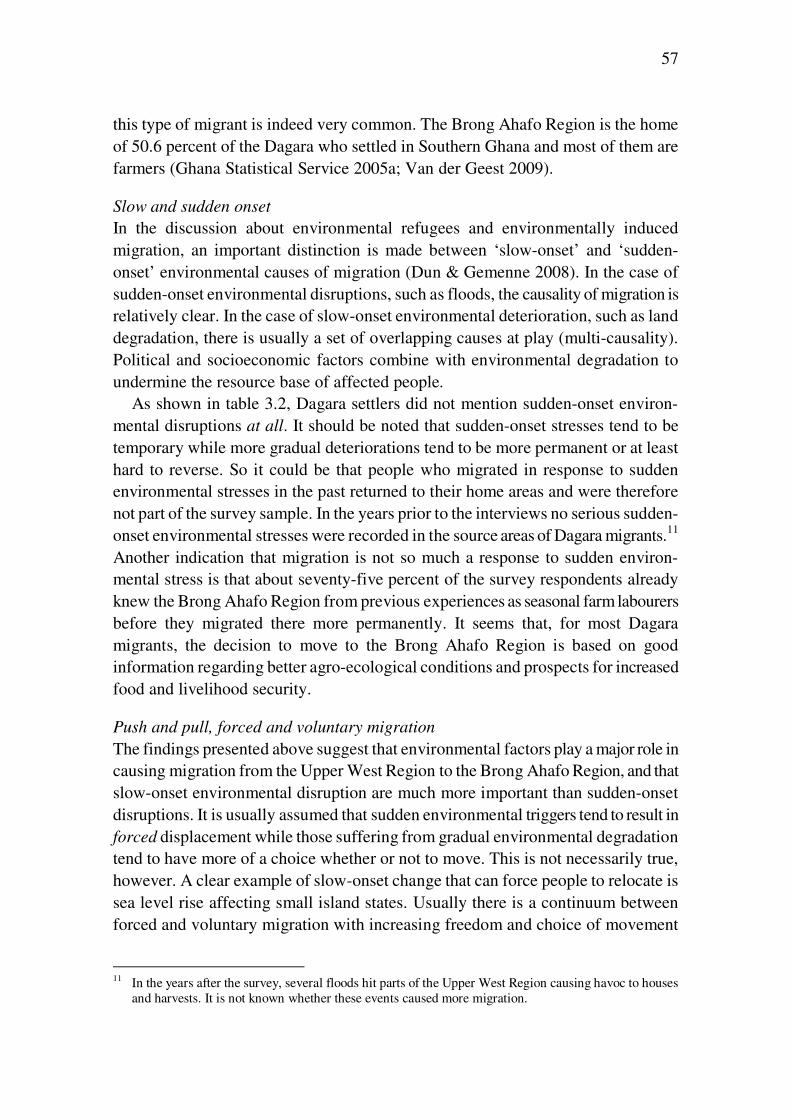
57
this type of migrant is indeed very common. The Brong Ahafo Region is the home of 50.6 percent of the Dagara who settled in Southern Ghana and most of them are farmers (Ghana Statistical Service 2005a; Van der Geest 2009).
Slow and sudden onset
In the discussion about environmental refugees and environmentally induced migration, an important distinction is made between ‘slow-onset’ and ‘sudden-onset’ environmental causes of migration (Dun & Gemenne 2008). In the case of sudden-onset environmental disruptions, such as floods, the causality of migration is relatively clear. In the case of slow-onset environmental deterioration, such as land degradation, there is usually a set of overlapping causes at play (multi-causality). Political and socioeconomic factors combine with environmental degradation to undermine the resource base of affected people.
As shown in table 3.2, Dagara settlers did not mention sudden-onset environ-mental disruptions at all. It should be noted that sudden-onset stresses tend to be temporary while more gradual deteriorations tend to be more permanent or at least hard to reverse. So it could be that people who migrated in response to sudden environmental stresses in the past returned to their home areas and were therefore not part of the survey sample. In the years prior to the interviews no serious sudden-onset environmental stresses were recorded in the source areas of Dagara migrants.11 Another indication that migration is not so much a response to sudden environ-mental stress is that about seventy-five percent of the survey respondents already knew the Brong Ahafo Region from previous experiences as seasonal farm labourers before they migrated there more permanently. It seems that, for most Dagara migrants, the decision to move to the Brong Ahafo Region is based on good information regarding better agro-ecological conditions and prospects for increased food and livelihood security.
Push and pull, forced and voluntary migration
The findings presented above suggest that environmental factors play a major role in causing migration from the Upper West Region to the Brong Ahafo Region, and that slow-onset environmental disruption are much more important than sudden-onset disruptions. It is usually assumed that sudden environmental triggers tend to result in forced displacement while those suffering from gradual environmental degradation tend to have more of a choice whether or not to move. This is not necessarily true, however. A clear example of slow-onset change that can force people to relocate is sea level rise affecting small island states. Usually there is a continuum between forced and voluntary migration with increasing freedom and choice of movement
11 In the years after the survey, several floods hit parts of the Upper West Region causing havoc to houses
and harvests. It is not known whether these events caused more migration.
58
when one moves from forced to voluntary on the continuum (Hugo 1996; Faist 2000; Bates 2002; Renaud et al. 2007).
One way to determine the extent to which migrants from Northwest Ghana are forced to relocate due to environmental pressure is to differentiate between environmental push and environmental pull. Environmental push suggests that people are forced out of their home region while environmental pull suggests that people opt to relocate to a region with a more benign environment. Another way to determine the degree of force is to carefully analyse people’s motivation to migrate and differentiate levels of urgency. A migrant who indicates that he or she has travelled ‘to see the world’ experienced less force than someone who migrated because he or she could not feed the children due to a prolonged drought and subsequent crop failures.
In the migration reasons mentioned by Dagara settlers, environmental pull factors seem to be stronger than environmental push factors. Land scarcity and soil infertility in the home area are mentioned by a substantial number of Dagara migrants (64), but the abundance and fertility of land in the Brong Ahafo Region is mentioned by more than twice as many (133). The same applies to the poor rainfall pattern in the North (6) and the more attractive rainfall pattern in the Brong Ahafo Region (17).
An examination of the level of urgency in the migration reasons mentioned by Dagara settlers shows that a substantial group of migrants (48) indicated that they moved because of food insecurity or hunger. This indicates a high level of urgency and force. This is not surprising because many farm households in Northwest Ghana experience chronic food insecurity. Their harvest is below subsistence levels and they do not have enough non-farm income to supplement their own food production (Van der Geest 2004). Since the late 1970s and early 1980s there have not been any widespread famines in Northwest Ghana, but each year a substantial part of the population experiences a ‘food gap’ in the months prior to the first harvests. Migration to the Brong Ahafo Region is a well-established strategy for the migrants to increase their own food security and that of their relatives at home. Migration is perceived to contribute to food security by decreasing pressure on land and through remittances of money and foodstuff back to migrants’ area of origin (Van der Geest 2010a). In this vein, Luginaah et al. (2009: 25) speak of an “intensifying system of domestic food aid” and a “migration-remittance lifeline for the Upper West Region” (ibid 31).
For a large group of migrants, the level of urgency is clearly lower. Their migra-tion is not one of distress but an attempt to accumulate some wealth and to structurally improve their livelihood by making use of better agro-ecological conditions in a region that is already familiar to them because of past experiences as
59
seasonal migrants and because they have other relatives who settled there before them. Picture 8 A migrant farmer’s granary in Droboso (Brong Ahafo Region). An important
reason for Dagara people to migrate is to increase household food security.
A note on international migration
In a recent paper King & Skeldon (2010) lament the gap that exists between the literatures on internal and international migration. In their view, studying one type of migration without considering its linkages with the other results in a “partial and unbalanced interpretation” (ibid, 1640). This critique is particularly relevant for studies of environmentally induced migration because for legal reasons the distinction between internal and international population flows is an important element in the environmental refugee debate.12
12 The definition of a refugee according to the 1951 United Nations Convention Relating to the Status of
Refugees requires that a person must be outside his country of nationality to be granted the refugee status. People who have been forced to move from their homes, but who are still within their country’s borders are considered ‘internally displaced people’ (Renaud et al. 2007). Internally displaced people do not enjoy the same rights as refugees. A good review of legal frameworks of protection for different types of
60
In the past three decades, Ghana has become an important source country for international migrants to Europe and North America. Recent studies on migration from Ghana to non-African destinations show that inter-continental migrants hail almost exclusively from Southern Ghana, especially the Ashanti, Eastern and Central Regions (Litchfield & Waddington 2003; Asiedu 2005; Mazzucato et al. 2008). Entry costs for international migration are high and people from Northern Ghana generally do not have the means and the networks to make it to Europe or North-America. In my sample of 204 rural households in Ghana’s Upper West Region, none of the respondents had direct relatives (children, siblings, parents) who had migrated to a non-African destination. In Southern Ghana, by contrast, it is very common to have inter-continental migrant relatives (Smith 2007; Kabki 2007). The fact that Northern Ghanaians hardly migrate internationally is in line with the ‘migration hump’ theory which postulates that the poorest people are not the ones who migrate internationally, and the most deprived regions are not the main source areas of international migrants (Martin & Taylor 1996; De Haas 2005). If environmental conditions in Northern Ghana were to deteriorate in the future, it is very unlikely that the people affected would migrate to non-African destinations, at least not in a ‘legal’ way. Those who suffer most from environmental stress are farmers and other people who depend on the natural resources base for their livelihoods. In Northern Ghana, farmers are the most deprived occupational group (Ghana Statistical Service 2000; Ghana Statistical Service 2007) and they will not be able to migrate internationally as a response to environmental degradation or climate change.
In King & Skeldon’s (2010) paper, one of the trajectories in which internal and international migration interface with each other involves ‘stepwise migration’ in which a person first migrates internally from a rural area to an urban area, followed by an international move. The stepwise migrant typically needs to spend some years in an urban centre to accumulate enough money and contacts to be able to move abroad. In the case of Ghana, it is very unlikely that a rural-urban migrant hailing from the North can accumulate enough resources to migrate out of Africa unless he or she has a profession that is in high demand in potential destination countries (e.g. nurses in the United Kingdom). It is more likely that a stepwise migration from Northern Ghana would span two or more generations. For the children of some of the more successful rural-urban migrants from Northern Ghana the option to migrate abroad may be within reach.13
migrants and refugees, with special reference to environmentally induced movements, is provided by Zetter (2010).
13 In the past few years I have met several Ghanaians in Europe who had their family roots in Northern Ghana. However, all of them were born and grew up in Southern Ghana and particularly in Kumasi and Accra.
61
Conclusion
The data presented in this paper suggests that the environment plays an important role in explaining migration from Northern Ghana to Southern Ghana and that the environmental driver of migration is structural scarcity rather than degradation. Structural agro-ecological differences between Northern Ghana and Southern Ghana are an important incentive for people to move. In the centuries preceding colonial rule, these differences did not result in widespread migration to present-day Southern Ghana because of a situation of insecurity due to warfare and slave raiding. In the course of the 20th century, pacification, forced labour, unequal development and increased cash needs were the necessary triggers for the North-South migration system to evolve. Once the migration flow was set in motion, environmental scarcity became an important additional factor in the course of the 20th century. The cross-sectional analysis showed that migration propensities are significantly higher in environmentally less-endowed districts. Dagara migrants in rural destinations of the Brong Ahafo Region attribute their migration decision strongly to soil fertility problems. Adverse climatic conditions in the North featured less strongly in the migration reasons they mentioned. The longitudinal analysis revealed that out-migration from Northern Ghana declined in the most pronounced era of environmental stress (the late 1970s and early 1980s). In this period of the region’s migration history, political and macro-economic factors played a more decisive role than environmental stress. In the late 1980s and in the 1990s, a time of environmental recovery in Northern Ghana, migration increased again.
An important constraint of the analysis presented in this paper is the limited availability of historical data on natural resources. The longitudinal analysis covers forty-three years in the case of rainfall and twenty-five years in the case of vegetation cover. These variables are important indicators of environmental change, but for a more thorough analysis of the agro-ecological conditions in which farmers in Northern Ghana eke out a living, long-term longitudinal data on soil fertility and land degradation would be needed in addition. This paper has shown that North-South migration propensities have steadily increased in the course of the 20th century; that environmentally poor districts tend to have higher out-migration rates; and that, somewhat surprisingly, North-South migration declined in a period of severe environmental stress. Without a more complete set of agro-ecological data, going back three to four generations, it is not possible to determine whether environmental conditions in Northern Ghana have deteriorated in the long run and if so, whether this has accelerated migration to the South.
If environmental conditions in Northern Ghana deteriorate in the future, migra-tion to Southern Ghana is likely to increase more than it already does, but this also depends on social, economic and political changes, both in the source areas and in
62
the prime destination areas. The picture that emerges for Northern Ghana is not one of distress migration in the face of environmental disaster. Rather, migration is a way of dealing with structural environmental scarcity and limited non-farm opportunities. Human mobility has become an omnipresent characteristic of the livelihoods and culture of Northern Ghanaians. Policies to curb migration will be met with suspicion and may have very negative effects in terms of livelihood security and environmental management.
4 Dagara migration and environmental change in Ghana’s forest-savannah transition zone1
Abstract
LANDSAT images published by the United Nations Environment Program in 2008 reveal large-scale land degradation in Ghana's forest-savannah transition zone (1973-2003). Most degradation has allegedly occurred in the North of the transition zone, which is a prime settlement area of migrants from Northwest Ghana. This paper investigates to what extent deforestation can be attributed to in-migration of farmers from the Upper West Region. In-migration can contribute to land cover change by increasing population size and pressure on natural resources. In addition, settlers may have less sustainable land use practices. The study uses a variety of data at different geographical levels, including remotely sensed vegetation data, census data, group discussions and a household survey (N=276). The findings show that migrants’ farm practices differ from those of native farmers, but no evidence is found that their practices are less sustainable. The findings challenge earlier studies that blamed settler farmers for environmental degradation.
1 A shorter version of this chapter has been submitted for publication and is currently under review (co-
authors: Kees Burger and Augustine Yelfaanibe). In addition, part of the chapter has been translated in French and published as: Van der Geest, K. (2010). Migration agricole et usages durables de la terre dans la zone de transition forêt-savane au Ghana. Hommes et Migrations. No. 1284 (mars-avril 2010): 112-127.
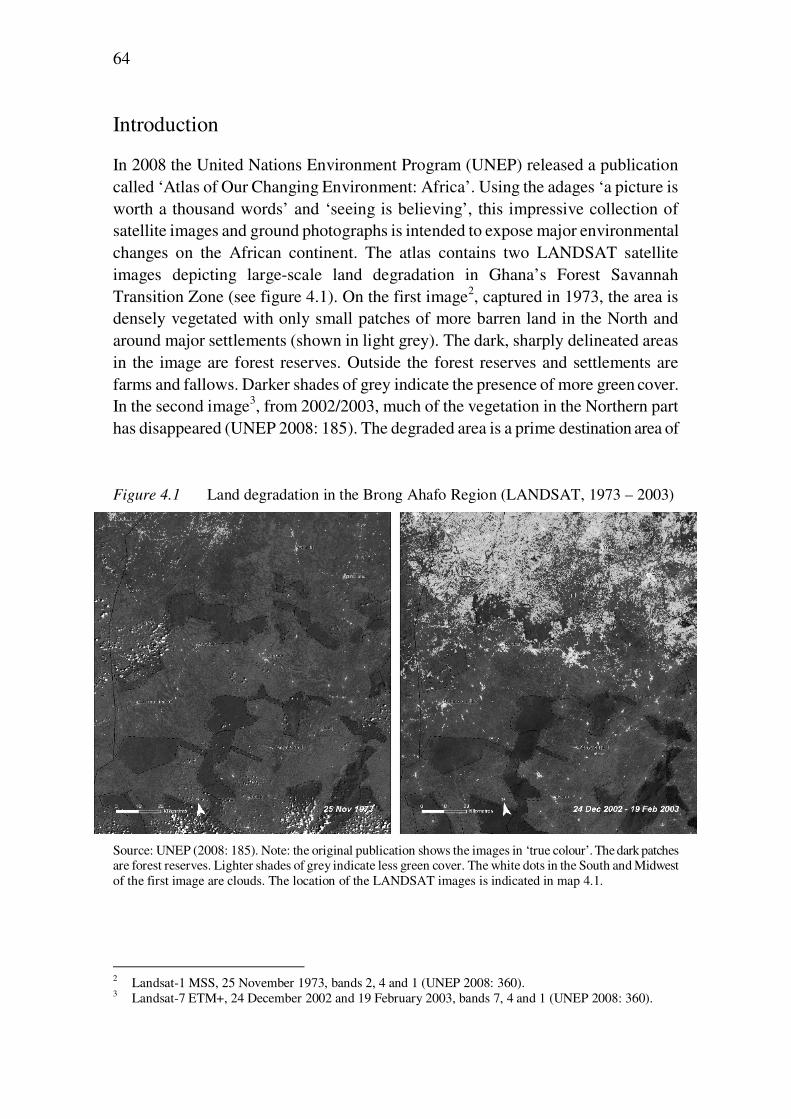
64
Introduction
In 2008 the United Nations Environment Program (UNEP) released a publication called ‘Atlas of Our Changing Environment: Africa’. Using the adages ‘a picture is worth a thousand words’ and ‘seeing is believing’, this impressive collection of satellite images and ground photographs is intended to expose major environmental changes on the African continent. The atlas contains two LANDSAT satellite images depicting large-scale land degradation in Ghana’s Forest Savannah Transition Zone (see figure 4.1). On the first image2, captured in 1973, the area is densely vegetated with only small patches of more barren land in the North and around major settlements (shown in light grey). The dark, sharply delineated areas in the image are forest reserves. Outside the forest reserves and settlements are farms and fallows. Darker shades of grey indicate the presence of more green cover. In the second image3, from 2002/2003, much of the vegetation in the Northern part has disappeared (UNEP 2008: 185). The degraded area is a prime destination area of Figure 4.1 Land degradation in the Brong Ahafo Region (LANDSAT, 1973 – 2003)
Source: UNEP (2008: 185). Note: the original publication shows the images in ‘true colour’. The dark patches are forest reserves. Lighter shades of grey indicate less green cover. The white dots in the South and Midwest of the first image are clouds. The location of the LANDSAT images is indicated in map 4.1.
2 Landsat-1 MSS, 25 November 1973, bands 2, 4 and 1 (UNEP 2008: 360). 3 Landsat-7 ETM+, 24 December 2002 and 19 February 2003, bands 7, 4 and 1 (UNEP 2008: 360).
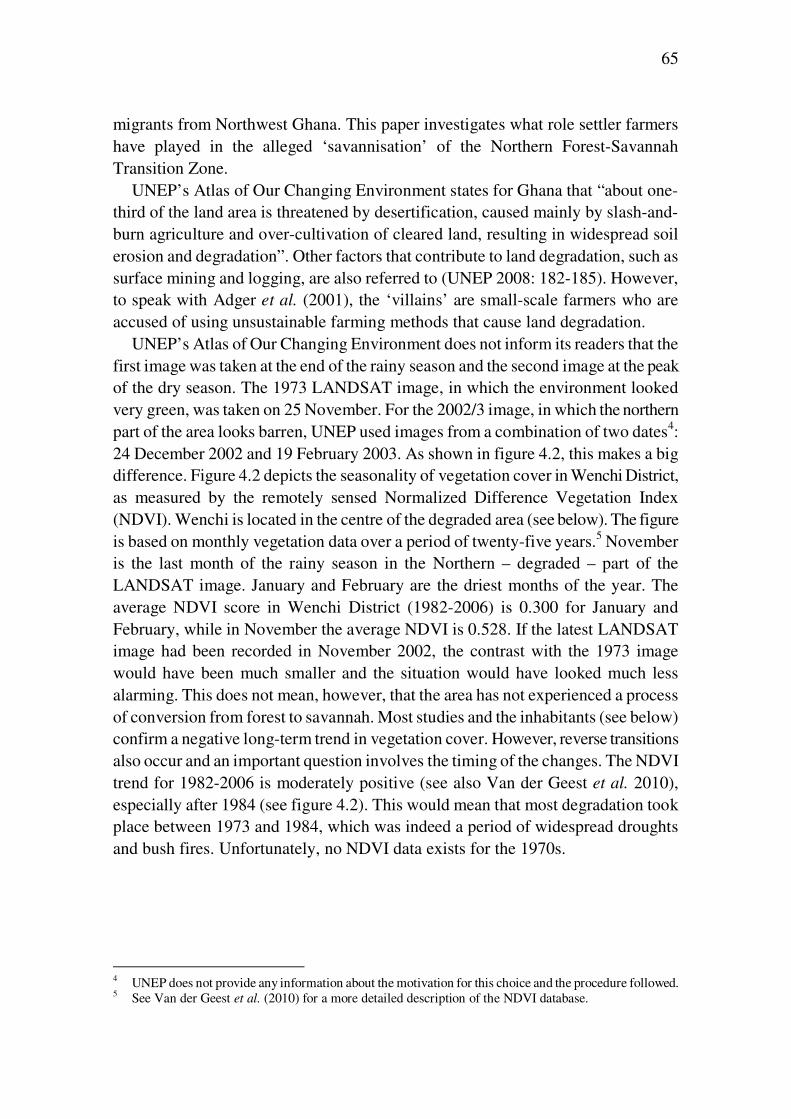
65
migrants from Northwest Ghana. This paper investigates what role settler farmers have played in the alleged ‘savannisation’ of the Northern Forest-Savannah Transition Zone.
UNEP’s Atlas of Our Changing Environment states for Ghana that “about one-third of the land area is threatened by desertification, caused mainly by slash-and-burn agriculture and over-cultivation of cleared land, resulting in widespread soil erosion and degradation”. Other factors that contribute to land degradation, such as surface mining and logging, are also referred to (UNEP 2008: 182-185). However, to speak with Adger et al. (2001), the ‘villains’ are small-scale farmers who are accused of using unsustainable farming methods that cause land degradation.
UNEP’s Atlas of Our Changing Environment does not inform its readers that the first image was taken at the end of the rainy season and the second image at the peak of the dry season. The 1973 LANDSAT image, in which the environment looked very green, was taken on 25 November. For the 2002/3 image, in which the northern part of the area looks barren, UNEP used images from a combination of two dates4: 24 December 2002 and 19 February 2003. As shown in figure 4.2, this makes a big difference. Figure 4.2 depicts the seasonality of vegetation cover in Wenchi District, as measured by the remotely sensed Normalized Difference Vegetation Index (NDVI). Wenchi is located in the centre of the degraded area (see below). The figure is based on monthly vegetation data over a period of twenty-five years.5 November is the last month of the rainy season in the Northern – degraded – part of the LANDSAT image. January and February are the driest months of the year. The average NDVI score in Wenchi District (1982-2006) is 0.300 for January and February, while in November the average NDVI is 0.528. If the latest LANDSAT image had been recorded in November 2002, the contrast with the 1973 image would have been much smaller and the situation would have looked much less alarming. This does not mean, however, that the area has not experienced a process of conversion from forest to savannah. Most studies and the inhabitants (see below) confirm a negative long-term trend in vegetation cover. However, reverse transitions also occur and an important question involves the timing of the changes. The NDVI trend for 1982-2006 is moderately positive (see also Van der Geest et al. 2010), especially after 1984 (see figure 4.2). This would mean that most degradation took place between 1973 and 1984, which was indeed a period of widespread droughts and bush fires. Unfortunately, no NDVI data exists for the 1970s.
4 UNEP does not provide any information about the motivation for this choice and the procedure followed. 5 See Van der Geest et al. (2010) for a more detailed description of the NDVI database.
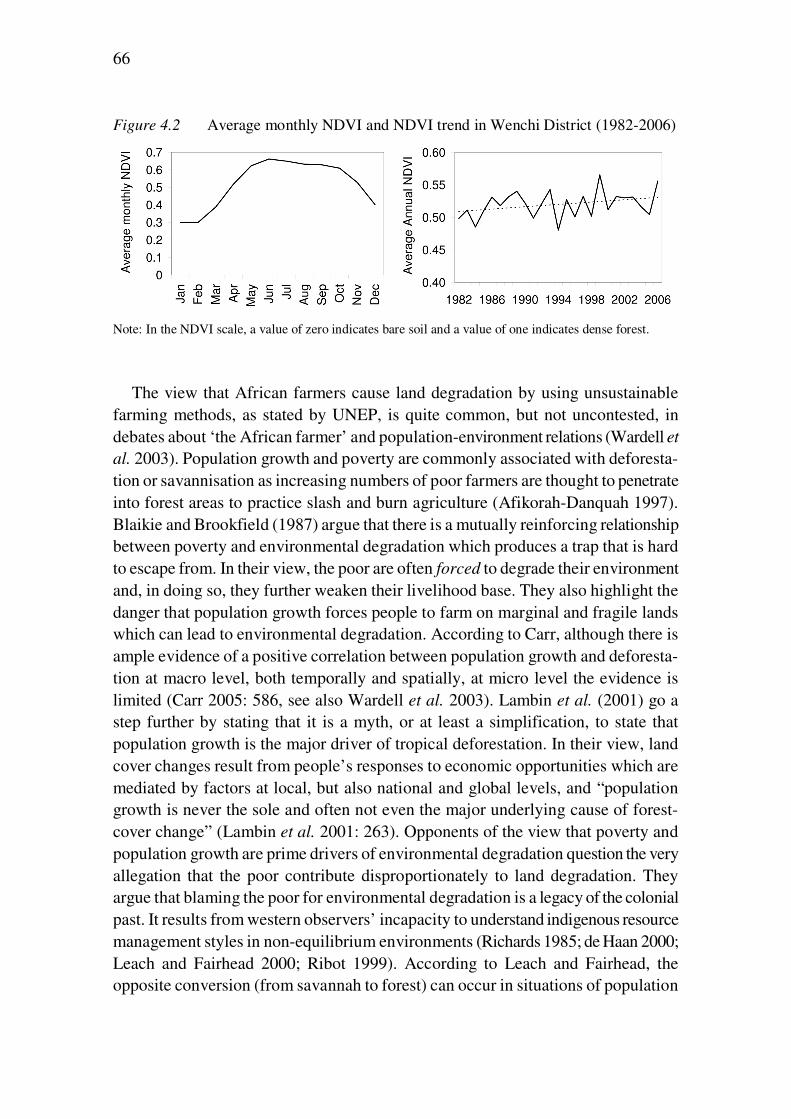
66
Figure 4.2 Average monthly NDVI and NDVI trend in Wenchi District (1982-2006)
Note: In the NDVI scale, a value of zero indicates bare soil and a value of one indicates dense forest.
The view that African farmers cause land degradation by using unsustainable farming methods, as stated by UNEP, is quite common, but not uncontested, in debates about ‘the African farmer’ and population-environment relations (Wardell et
al. 2003). Population growth and poverty are commonly associated with deforesta-tion or savannisation as increasing numbers of poor farmers are thought to penetrate into forest areas to practice slash and burn agriculture (Afikorah-Danquah 1997). Blaikie and Brookfield (1987) argue that there is a mutually reinforcing relationship between poverty and environmental degradation which produces a trap that is hard to escape from. In their view, the poor are often forced to degrade their environment and, in doing so, they further weaken their livelihood base. They also highlight the danger that population growth forces people to farm on marginal and fragile lands which can lead to environmental degradation. According to Carr, although there is ample evidence of a positive correlation between population growth and deforesta-tion at macro level, both temporally and spatially, at micro level the evidence is limited (Carr 2005: 586, see also Wardell et al. 2003). Lambin et al. (2001) go a step further by stating that it is a myth, or at least a simplification, to state that population growth is the major driver of tropical deforestation. In their view, land cover changes result from people’s responses to economic opportunities which are mediated by factors at local, but also national and global levels, and “population growth is never the sole and often not even the major underlying cause of forest-cover change” (Lambin et al. 2001: 263). Opponents of the view that poverty and population growth are prime drivers of environmental degradation question the very allegation that the poor contribute disproportionately to land degradation. They argue that blaming the poor for environmental degradation is a legacy of the colonial past. It results from western observers’ incapacity to understand indigenous resource management styles in non-equilibrium environments (Richards 1985; de Haan 2000; Leach and Fairhead 2000; Ribot 1999). According to Leach and Fairhead, the opposite conversion (from savannah to forest) can occur in situations of population
67
growth when people benefit from protecting their environment. They found this in their case study in Guinea (Fairhead and Leach 1996) and also present evidence from other locations around the world (Fairhead and Leach 1998). Map 4.1 Ghana, Dagara migration and coverage of the LANDSAT image
The area covered by the LANDSAT images that depict widespread land degrada-tion is mostly located in Ghana’s Brong Ahafo Region (see map 4.1). The Northern part of the LANDSAT image, which experienced most degradation, is a prime destination area of Dagara migrants from Ghana’s Upper West Region. Most of the degraded area lies in the former Wenchi District.6 This area became an important destination for settler farmers in the 1970s and 1980s. Before that, most Dagara migrated to the mines, cocoa plantations or urban destinations further south, especially to the Ashanti Region and the Western Region. The vast majority of the Dagara who settle in the Brong Ahafo Region are small-scale farmers who migrate
6 In this paper, we use the boundaries of Wenchi District as it existed until 2004. In that year, the district
was split into Wenchi Municipal District in the West and Tain District in the East.
68
in search of better agro-ecological conditions (Abdul-Korah 2006; Van der Geest 2011). They mostly settle in rural destinations. Their area of origin in the North of Ghana has only one rainy season and the soils are less fertile, especially in the more densely populated parts of the Upper West Region (Amanor and Pabi 2007; Van der Geest 2004).
Theoretically, the environmental impact of in-migration can follow two lines. Firstly, migration alters the population size in the areas of origin and destination. As Hugo (1996: 121) states: “Other things being equal (which of course they rarely are), emigration will reduce environmental pressures at the origin and increase them at the destination.” Secondly, if other things are not equal, the impact of migrants on the natural environment differs from that of non-migrants. Hugo uses Ehrlich and Ehrlich’s (1990: 58) IPAT equation7, to indicate that differential environmental impacts of migrants and natives can be caused by differences in the productive and consumptive domains. The focus in this paper will be on the productive domain.
In studies dealing with sustainability of farming methods, migrant farmers are often found to have more environmentally destructive cultivation practices than native farmers. A key explanation is that they usually do not own the land they farm and that they often regard their stay as temporary. This would reduce the incentive to apply environmentally sound farming methods. Moreover, they often have to rent land which would encourage them to ‘mine the soil’ (Afikorah-Danquah 1997; Codjoe 2006). Another common explanation is that migrant farmers do not have the same knowledge about local environmental conditions as native farmers, which can also lead to unsustainable farm practices (Lambin et al. 2001).
This paper studies to what extent the cultivation practices of Dagara migrant farmers have contributed to land degradation in Ghana’s forest-savannah transition zone. The analytical approach is guided by Batterbury and Bebbington (1999: 281) who warn that dynamics of land-use change should be studied “within the context of longer histories of society-environment interactions.” In section two the history of Dagara migration to the Brong Ahafo Region is discussed. In section three census data are used to identify periods and areas of increased population growth in the region (1960-2000). In section four the findings of some studies of land use / cover change (LUCC) in the Wenchi District are reviewed to assess what kind of land use systems are most detrimental and beneficial for vegetation cover in this particular ecological zone. Sections five to eight are based on primary data collected in Wenchi District and Techiman District. Section five provides some background to the methodology used. In section six, local discourses of environmental change in the study area are discussed to find out which trends people perceive and what they regard as common causes of environmental change. Sections seven and eight
7 Environmental impact (I) is a function of population size (P), affluence (A) and technology (T) (Ehrlich
and Ehrlich 1990: 58).
69
compare the farming methods of migrant and native farmers in the area and of migrant farmers in geographically different areas (in terms of ecology and accessibility). This part is divided into a section in which qualitative data on perceptions of land use by ‘the other’ (settlers of natives, natives of settlers) is analysed and a section in which the findings from a questionnaire survey are discussed. The results of this analysis show that there are clear differences between settlers’ and natives’ farming methods in terms of land tenure, farm size, crop mix, tree planting and tillage methods. However, the results do not confirm that settlers’ cultivation practices are less sustainable.
Dagara migration
The Dagara people’s homeland is on the savannah of Northwest Ghana, although many have migrated southward. At the time of the population census in 2000, fifty-one percent of the Dagara were living outside the Upper West Region, thirty-six percent in Southern Ghana and eighteen percent in the Brong Ahafo Region where they constituted 6.8 percent of the total population (Ghana Statistical Services 2005a). Apart from the more permanent Dagara settlers, there is also a seasonal in-flow of Dagara migrants who use the off-season in the North to earn some money as farm labourers in the South.
Within the Brong Ahafo Region the most popular destination districts of Dagara migrants were situated in the North of the Region (see map 4.2). Wenchi District had the largest number and proportion of Dagara people (23,965; 14.38 percent of the total population), followed by neighbouring Techiman District (20,805; 11.92 percent). The districts in the Southwest of the Brong Ahafo Region receive few Dagara migrants. Map 4.2 also shows the location of the LANDSAT image. The districts that had received more Dagara in-migrants had experienced much more land degradation than the districts with less in-migration of Dagara. The question addressed in this paper is to what extent there is causality in this correlation. To follow Hugo’s (1996) line of reasoning: is degradation just a consequence of increased population pressure or do migrant farmers have a more negative impact on green cover than native farmers? Before we move on to the comparison of settlers’ and natives’ farming methods, we first look at population growth in the Brong Ahafo Region to find out whether the more degraded Northern part of the region has experienced more population growth than the Southern part which has preserved most of its vegetation cover according to the LANDSAT images.
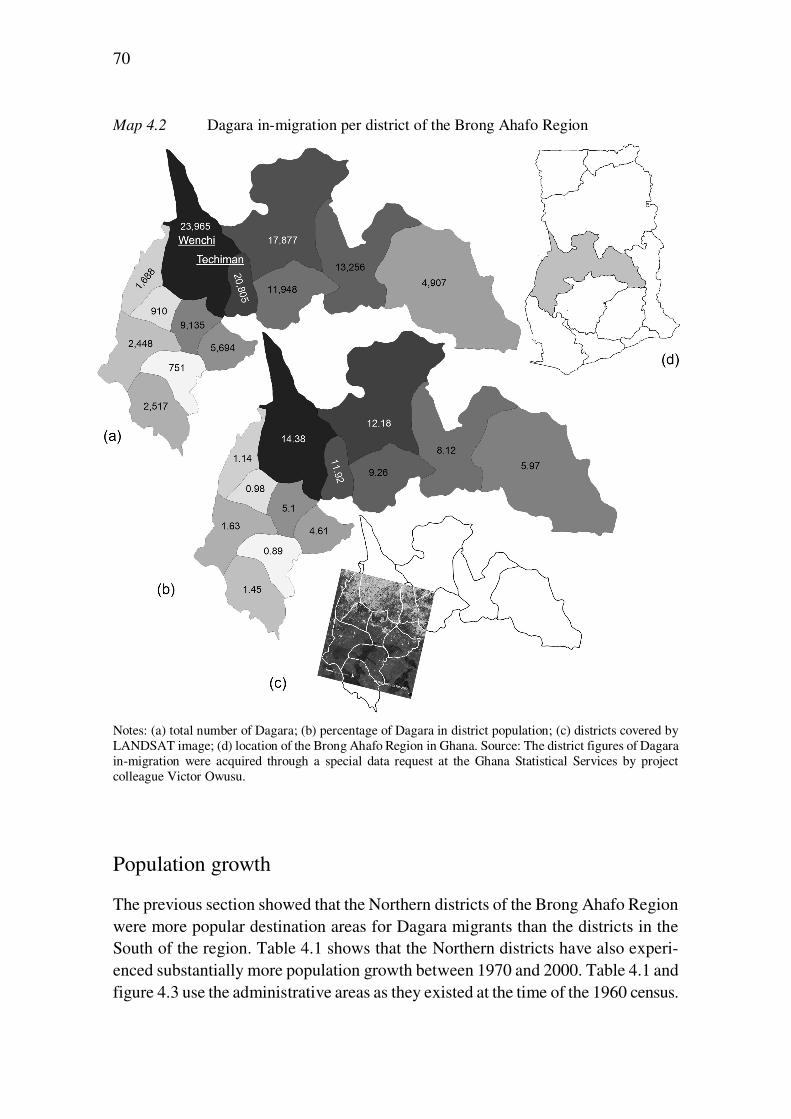
70
Map 4.2 Dagara in-migration per district of the Brong Ahafo Region
Notes: (a) total number of Dagara; (b) percentage of Dagara in district population; (c) districts covered by LANDSAT image; (d) location of the Brong Ahafo Region in Ghana. Source: The district figures of Dagara in-migration were acquired through a special data request at the Ghana Statistical Services by project colleague Victor Owusu.
Population growth
The previous section showed that the Northern districts of the Brong Ahafo Region were more popular destination areas for Dagara migrants than the districts in the South of the region. Table 4.1 shows that the Northern districts have also experi-enced substantially more population growth between 1970 and 2000. Table 4.1 and figure 4.3 use the administrative areas as they existed at the time of the 1960 census.
71
‘North’ includes the present Wenchi, Techiman, Kintampo and Nkoranza districts. Between 1970 and 2000 – roughly the time between the first and second LANDSAT image shown in the introduction of this paper – the population in the Northern districts of the Brong Ahafo Region almost tripled while the districts in the South ‘only’ doubled their population size. The annual growth rate in Brong Ahafo North has been over three percent annually between 1970 and 2000.
In the 1948-1960 and 1960-1970 inter-censal periods, when Brong Ahafo South was an important cocoa frontier, the population growth rates were higher in the Southern districts of the Brong Ahafo Region (9.4 percent! and 4.3 percent per year respectively). In those days, more than half the population in Brong Ahafo South were in-migrants from outside the region or outside Ghana (60.9 percent in 1960 and 51.4 in 1970).8 Brong Ahafo North had a much smaller proportion of in-migrant population (12.3 percent in 1960 and 20.2 percent in 1970).9 In the 1970s and early 1980s, when the cocoa sector was in crisis and some hitherto inaccessible and uninviting areas in the North of the region had been ‘opened up’ through govern-ment interventions (Amanor and Pabi 2007), the agricultural frontier shifted from South to North and from cocoa cultivation to food crop farming.
Despite substantial population growth, the districts in the North and especially the East of the region are still much less densely populated than the districts in the South (see figure 4.3). Most of the settler farmers from Northern Ghana are attracted by the availability of land for farming in the Northern and Eastern Districts of the Brong Ahafo Region (Amanor & Pabi 2007; Van der Geest 2011). In the Southern districts of the region land is less readily available because of higher population densities. Moreover, due to the cultivation of cocoa there, land has become more commoditized and harder to access for in-migrants. To sum up, the areas in the Brong Ahafo Region that received more Dagara in-migrants were less densely populated and experienced more population growth between 1970 and 2000 than the areas that received fewer Dagara settlers. The areas in the South had more green cover in the early 1970s due to their favourable situation in the forest zone and despite higher population densities. According to the LANDSAT images discussed in the introduction, these areas were able to maintain most of their green cover between 1973 and 2002/3. Relatively low population growth rates may have contributed here but, more importantly, the mature cocoa plantations in this part of the region help to preserve green cover much more effectively than the annual crops (mostly maize, yam and cassava) that are cultivated in the Northern part of the region.
8 Sources: Census Office (1964: 27) and Census Office (1972: xxxviii). At the time of the 1970 census, the
1960 “Brong Ahafo South” consisted of three local councils: Goaso, Kukuom and Asutifi. 9 The extra-regional migration rate for the old Wenchi District in 1970 was 17.6 percent (including 3.1
percent international migrants, mostly from Burkina Faso).
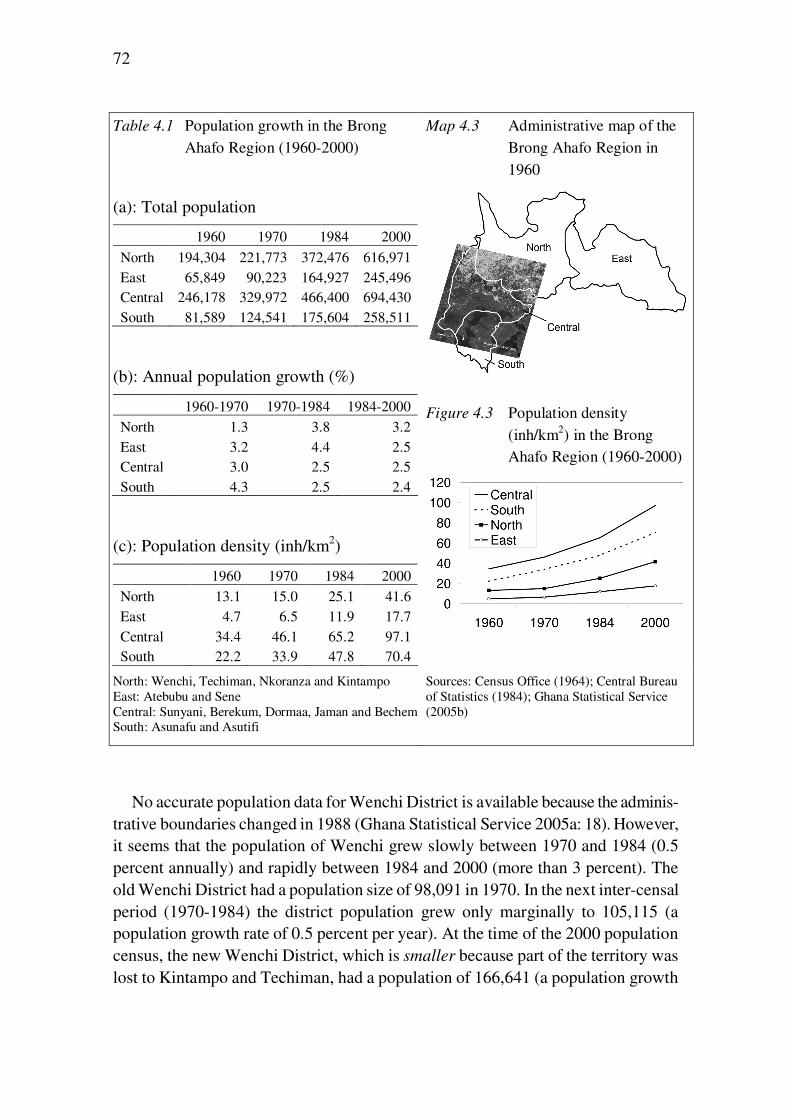
72
Table 4.1 Population growth in the Brong Ahafo Region (1960-2000)
(a): Total population
1960 1970 1984 2000
North 194,304 221,773 372,476 616,971 East 65,849 90,223 164,927 245,496 Central 246,178 329,972 466,400 694,430 South 81,589 124,541 175,604 258,511
(b): Annual population growth (%)
1960-1970 1970-1984 1984-2000
North 1.3 3.8 3.2 East 3.2 4.4 2.5 Central 3.0 2.5 2.5 South 4.3 2.5 2.4
(c): Population density (inh/km2)
1960 1970 1984 2000
North 13.1 15.0 25.1 41.6 East 4.7 6.5 11.9 17.7 Central 34.4 46.1 65.2 97.1 South 22.2 33.9 47.8 70.4
Map 4.3 Administrative map of the Brong Ahafo Region in 1960
Figure 4.3 Population density (inh/km2) in the Brong Ahafo Region (1960-2000)
North: Wenchi, Techiman, Nkoranza and Kintampo East: Atebubu and Sene Central: Sunyani, Berekum, Dormaa, Jaman and Bechem South: Asunafu and Asutifi
Sources: Census Office (1964); Central Bureau of Statistics (1984); Ghana Statistical Service (2005b)
No accurate population data for Wenchi District is available because the adminis-trative boundaries changed in 1988 (Ghana Statistical Service 2005a: 18). However, it seems that the population of Wenchi grew slowly between 1970 and 1984 (0.5 percent annually) and rapidly between 1984 and 2000 (more than 3 percent). The old Wenchi District had a population size of 98,091 in 1970. In the next inter-censal period (1970-1984) the district population grew only marginally to 105,115 (a population growth rate of 0.5 percent per year). At the time of the 2000 population census, the new Wenchi District, which is smaller because part of the territory was lost to Kintampo and Techiman, had a population of 166,641 (a population growth
73
rate of 2.9 percent per year). The population within the old district boundaries must have grown by well over 3 percent annually. The low growth figures for 1970-1984 and the high growth figures for 1984-2000 indicate that most migrants probably came to Wenchi District in the late 1980s and 1990s, as confirmed by household survey data and community questionnaires. Survey data from a major source area of migrants further indicates that the Brong Ahafo Region is a relatively new settlement area for Dagara migrants.
To sum up, the census data shows that, between 1970 and 2000, the area that is most affected by land degradation according to the LANDSAT images has experienced more Dagara in-migration and more population growth than the area that did not experience much deforestation. The longitudinal vegetation data suggests that most degradation must have taken place before 1984 and the census data suggests that most Dagara migrants settled in the area after 1984. The question remains as to whether degradation is just a consequence of increased population pressure or whether migrant farmers have a more negative impact on green cover than native farmers. To answer this question we first look at some land use and land cover (LUCC) studies conducted in the research area to assess what kind of land use practices are detrimental and beneficial for vegetation cover in the forest-savannah transition zone. After that, survey findings are presented that compare the farming methods of settlers and natives in Wenchi District and Techiman District.
Land use and land cover studies
Several scholars have studied land use / cover changes (LU/CC) in the Northwest of Ghana’s Forest-Savannah Transition zone. Most of these studies used LANDSAT images in combination with socio-economic and agricultural surveys and sometimes with macro-economic information. Pabi & Attua (2005) analysed land cover change in six locations in the Wenchi District based on 1984 and 2000/1 LANDSAT images. They found that ‘dense woodland’ (forest) had reduced in five out of six sites, both inside and outside forest reserves. However, they emphasize that land conversion in the forest-savannah transition zone is not a uni-linear process towards degradation, but rather a complex, dynamic and multi-directional interplay of human and natural factors, such as farming system, land tenure, market access and policy environment. The sites with mechanised and high-input agriculture showed least potential for regeneration because all the vegetation, as well as the stumps and roots, are removed. Most mechanised cultivation takes place in the vicinity of former state farms that were established in the 1960s and later privatised. In areas where bush fallow systems dominated, there was considerable conversion of forest to farmland, but also numerous changes in the opposite direction. Based on the same data, Amanor and Pabi (2007: 61) conclude: “In contrast with the main narratives of
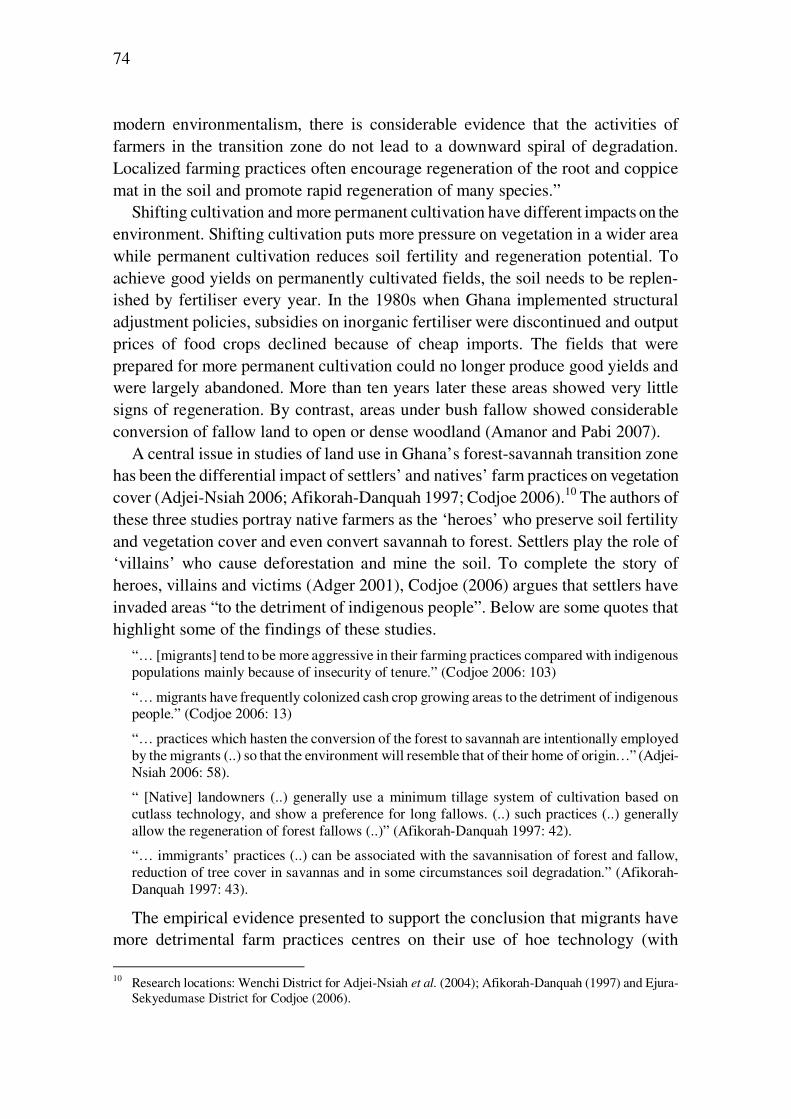
74
modern environmentalism, there is considerable evidence that the activities of farmers in the transition zone do not lead to a downward spiral of degradation. Localized farming practices often encourage regeneration of the root and coppice mat in the soil and promote rapid regeneration of many species.”
Shifting cultivation and more permanent cultivation have different impacts on the environment. Shifting cultivation puts more pressure on vegetation in a wider area while permanent cultivation reduces soil fertility and regeneration potential. To achieve good yields on permanently cultivated fields, the soil needs to be replen-ished by fertiliser every year. In the 1980s when Ghana implemented structural adjustment policies, subsidies on inorganic fertiliser were discontinued and output prices of food crops declined because of cheap imports. The fields that were prepared for more permanent cultivation could no longer produce good yields and were largely abandoned. More than ten years later these areas showed very little signs of regeneration. By contrast, areas under bush fallow showed considerable conversion of fallow land to open or dense woodland (Amanor and Pabi 2007).
A central issue in studies of land use in Ghana’s forest-savannah transition zone has been the differential impact of settlers’ and natives’ farm practices on vegetation cover (Adjei-Nsiah 2006; Afikorah-Danquah 1997; Codjoe 2006).10 The authors of these three studies portray native farmers as the ‘heroes’ who preserve soil fertility and vegetation cover and even convert savannah to forest. Settlers play the role of ‘villains’ who cause deforestation and mine the soil. To complete the story of heroes, villains and victims (Adger 2001), Codjoe (2006) argues that settlers have invaded areas “to the detriment of indigenous people”. Below are some quotes that highlight some of the findings of these studies.
“… [migrants] tend to be more aggressive in their farming practices compared with indigenous populations mainly because of insecurity of tenure.” (Codjoe 2006: 103)
“… migrants have frequently colonized cash crop growing areas to the detriment of indigenous people.” (Codjoe 2006: 13)
“… practices which hasten the conversion of the forest to savannah are intentionally employed by the migrants (..) so that the environment will resemble that of their home of origin…” (Adjei-Nsiah 2006: 58).
“ [Native] landowners (..) generally use a minimum tillage system of cultivation based on cutlass technology, and show a preference for long fallows. (..) such practices (..) generally allow the regeneration of forest fallows (..)” (Afikorah-Danquah 1997: 42).
“… immigrants’ practices (..) can be associated with the savannisation of forest and fallow, reduction of tree cover in savannas and in some circumstances soil degradation.” (Afikorah-Danquah 1997: 43).
The empirical evidence presented to support the conclusion that migrants have more detrimental farm practices centres on their use of hoe technology (with
10 Research locations: Wenchi District for Adjei-Nsiah et al. (2004); Afikorah-Danquah (1997) and Ejura-
Sekyedumase District for Codjoe (2006).
75
mounds and ridges), the fact that they are not allowed to plant trees, their larger farm sizes, crop rotations11 and their alleged preference for savannah conditions. All studies give primacy to insecure land tenure conditions as an important underlying cause of migrants’ short-term exploitation of the land.
Adjei-Nsiah, who voices the complaints of native farmers, is particularly negative about the farm practices and social behaviour of the Wala (from the Upper West Region) who look for quick ways to amass wealth through “soil mining cropping strategies” (Adjei-Nsiah 2006: 60) to invest in their home areas. Adjei-Nsiah relates the soil fertility management strategies of different groups of migrants to their different ‘time horizons’ meaning their length of stay in the destination area:
“…the differences in future horizons and ambitions regarding the stay in Wenchi match important differences in cropping systems and soil fertility management. While the Bonos [natives], Mossi and Lobis tend to have cropping systems that can be expected to partially regenerate soil fertility, the Walas tend indeed to mine the soil, while the Dagarbas [sic!] seem to take an in-between position in this respect.”
In Techiman district and Nkoranza district, Owusu (2007) also compared the sustainability of migrants’ and native landowners’ farm practices. Contrary to the studies discussed above, he found little difference in these groups’ application of “short-term land improvement methods” like zero tillage, crop rotation, legume intercropping, application of organic and inorganic fertiliser and erosion control (Owusu 2007: 148-149). Owusu also looked at the differential application of two long-term land improvement methods among migrants and landowners: fallowing and tree planting. Although migrants are not allowed to plant trees on their farms for fear that this would give them a claim of ownership of the land, many migrants did contribute to afforestation programs of the Forestry Department (the so-called Taungya system). He further found that migrant farmers do not fallow their farms for the simple reason that they rent their plots for short periods. However, when they abandon the land to rent a new plot, the land will be left fallow by the landowner until the next cycle of cultivation.
To summarise, the empirical evidence presented to support the conclusion that migrants have more detrimental farm practices (Adjei-Nsiah et al. 2004; Afikorah-Danquah 1997; Codjoe 2006) centres on their use of hoes, the fact that they are not allowed to plant trees, their larger farm sizes and their preference for savannah conditions. None of these studies tried to complement survey findings with on-the-spot assessments of deforestation and regeneration to validate their assumptions. Amanor & Pabi (2007), who analysed land cover change in Wenchi District under different farming systems, concluded that mechanization and monocropping had more detrimental effects on vegetation cover than the bush fallow system that 11 Adjei-Nsiah (2006) considers crop rotations with pigeon pea (common among native farmers) positive
strategies while crop rotations with cowpea or groundnuts (common among migrant farmers) are not considered positive.
76
allowed quick regeneration of vegetation after farmlands were abandoned. None of the case studies comparing the farming systems of migrants and natives looked at these factors. The quite negative assessment of migrants’ farming practices may include a certain degree of scapegoating. As Hugo (1996: 123) warns: “there are considerable dangers that the migrants involved can become scapegoats for a general failure to adopt sustainable policies of land and other resource use in the destination areas.”
Research locations and methodology
The present study of the environmental sustainability of migrants’ farming methods is based on questionnaire data gathered among 203 Dagara migrant households in eight rural destinations in Wenchi District and one location in Techiman District. To enable a settler-native comparison of farming methods we also carried out a questionnaire involving 73 families of native farmers in four of the nine villages. The questionnaire survey was carried out over a period of four months12 with five enumerators. In each research site we also administered a community questionnaire. The questions in this questionnaire were more open to debate and were answered in small group discussions in which both settlers and natives, men and women, and young and elderly people participated. The community questionnaire included topics such as settlement history, population composition, access to services, infrastructure, environmental change (soil, vegetation and rainfall), charcoal burning, timber logging, bush fire occurrence, land tenure, farm labour arrangements and conflicts between different types of land users.
Before the questionnaires and survey sample were designed, the researcher had carried out a three-week pilot study in which the research area was explored and areas with substantial numbers of Dagara migrants were identified. Two long-term Dagara migrants13 working for the Ministry of Agriculture and Ghana Education Services assisted in this phase. Both had a profound knowledge of the area due to their work which involved them having to travel around the district on a daily basis. We organised group discussions in which we were informed about issues such as land tenure, agro-ecological conditions, crop mix, farming methods, non-farm income opportunities, access to schools, clinics and potable water, migrants’ areas of origin, remittance behaviour, etc.
We soon discovered in this pilot phase that we would have no problems finding Dagara settler farmers. In many villages in Wenchi District the Dagara constitute a large part of the population, often even a majority. We also found out that, due to its
12 The questionnaire survey was administered among Dagara settlers between November 2003 and January
2004. In February and March 2004 we carried out the survey among natives of Wenchi District. 13 Mr Ben Tibo (MoFA) and Mr Constance Sasie (GES).
77
location in the forest-savannah transition zone, the district has a very diverse ecology. Afikorah-Danquah (1997) describes the ecology of the district as follows: “… the southern part of the district largely comprises dry semi-deciduous forest, while the northern part consists of a mosaic of gallery forests and forest patches in more or less wooded savannah grassland.” There were areas in the North that were typical savannah environments, producing savannah crops (yam, cassava, sorghum, legumes) and having very accessible land tenure regimes for migrant farmers. In the South of the district forest conditions prevailed with a different crop mix (maize, plantain, pepper) and a land tenure system based on sharecropping. In between there was a transition zone with a land tenure system based on annual rents and a crop mix containing both savannah and forest crops.
In the group discussions in the pilot phase we also discovered that there were important differences between remote and accessible villages in terms of population composition, access to land, social amenities and type of migrants attracted to these locations. In accessible villages, which are located along a major tarred road and/or close to an urban centre (see map 4.4), less fertile land was available and settlers had to pay higher rents. On the other hand, access to amenities like education, healthcare and agricultural extension was better in these villages. Dagara migrants in accessible locations tend to have higher levels of formal education and more non-farm income (see survey findings below). In the remote villages, which are far off the major road network and hard to reach in the rainy season, it is easier and cheaper to get access to land, but farmers depended on traders and lorry owners from the market centres to sell their produce. Dagara migrants in remote locations have larger farms and are more often traditional believers. We noticed in the data gathering phase that migrants in these remote locations were quite anarchistic and suspicious. The enumerators had to gain their trust by making clear that they were not government officials and by identifying a person both parties knew, preferably somebody in the home area.
In the design of the sample framework, Bilsborrow’s (1984) guideline of using probability sampling at household level and judgment sampling for the selection of villages was followed. Villages were selected in such a way that migrant households in the three ecological zones as well as in remote and accessible villages were represented in similar numbers (see table 4.2). In each location, we first contacted the local chief to introduce ourselves, to ask permission to carry out our research and to pour libation to appease the ancestors. The local chief would then introduce us to the Dagara chief. In most Ghanaian villages and towns with a substantial in-migrant population, migrants have their own chief who is usually the first settler, the earliest settler (in the event that the first settlers died or returned) or a descendent of the first settler. This person intermediates between migrants and the native population. The Dagara chiefs assisted us in drawing up lists of Dagara migrants. In eight out of nine
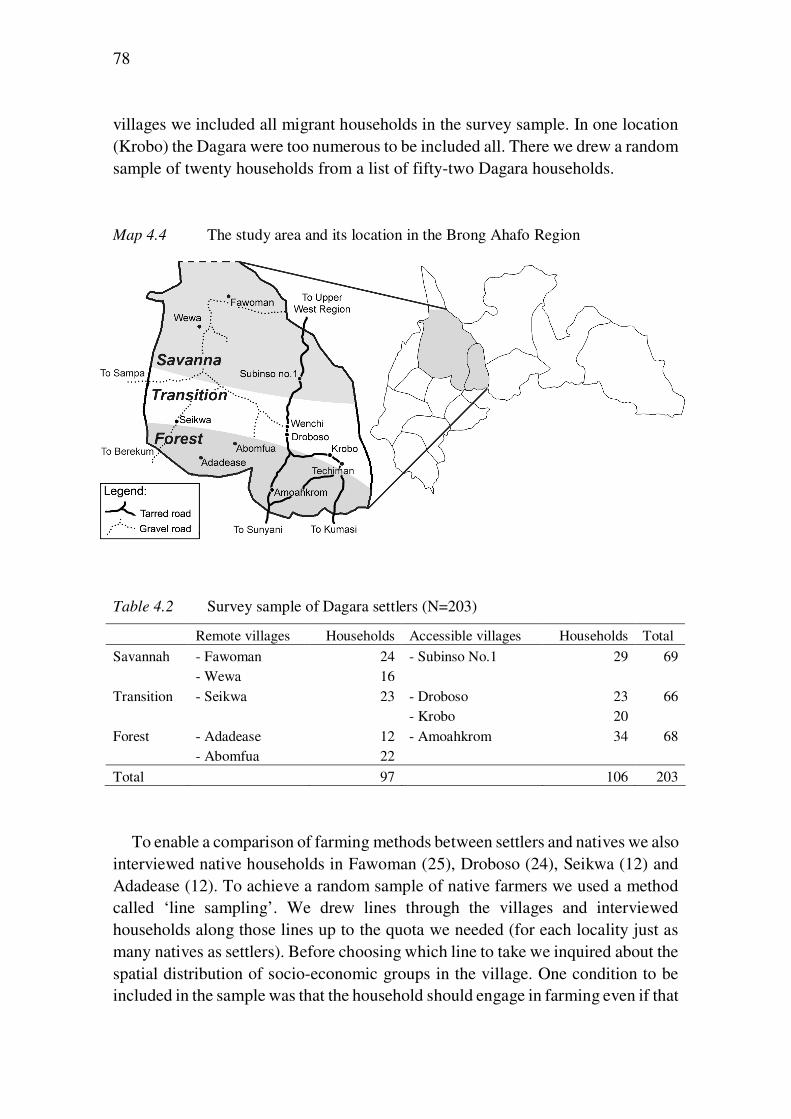
78
villages we included all migrant households in the survey sample. In one location (Krobo) the Dagara were too numerous to be included all. There we drew a random sample of twenty households from a list of fifty-two Dagara households. Map 4.4 The study area and its location in the Brong Ahafo Region
Table 4.2 Survey sample of Dagara settlers (N=203)
Remote villages Households Accessible villages Households Total
Savannah - Fawoman - Wewa
24 16
- Subinso No.1 29 69
Transition - Seikwa 23 - Droboso - Krobo
23 20
66
Forest - Adadease - Abomfua
12 22
- Amoahkrom 34 68
Total 97 106 203
To enable a comparison of farming methods between settlers and natives we also interviewed native households in Fawoman (25), Droboso (24), Seikwa (12) and Adadease (12). To achieve a random sample of native farmers we used a method called ‘line sampling’. We drew lines through the villages and interviewed households along those lines up to the quota we needed (for each locality just as many natives as settlers). Before choosing which line to take we inquired about the spatial distribution of socio-economic groups in the village. One condition to be included in the sample was that the household should engage in farming even if that
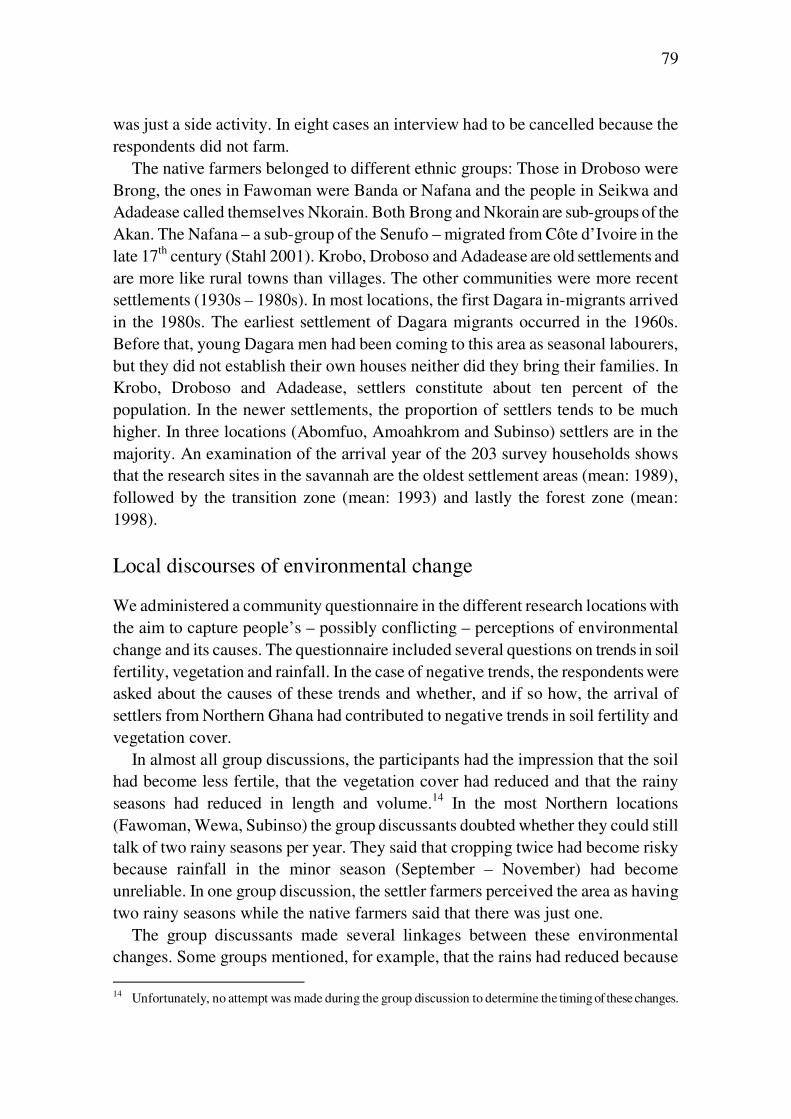
79
was just a side activity. In eight cases an interview had to be cancelled because the respondents did not farm.
The native farmers belonged to different ethnic groups: Those in Droboso were Brong, the ones in Fawoman were Banda or Nafana and the people in Seikwa and Adadease called themselves Nkorain. Both Brong and Nkorain are sub-groups of the Akan. The Nafana – a sub-group of the Senufo – migrated from Côte d’Ivoire in the late 17th century (Stahl 2001). Krobo, Droboso and Adadease are old settlements and are more like rural towns than villages. The other communities were more recent settlements (1930s – 1980s). In most locations, the first Dagara in-migrants arrived in the 1980s. The earliest settlement of Dagara migrants occurred in the 1960s. Before that, young Dagara men had been coming to this area as seasonal labourers, but they did not establish their own houses neither did they bring their families. In Krobo, Droboso and Adadease, settlers constitute about ten percent of the population. In the newer settlements, the proportion of settlers tends to be much higher. In three locations (Abomfuo, Amoahkrom and Subinso) settlers are in the majority. An examination of the arrival year of the 203 survey households shows that the research sites in the savannah are the oldest settlement areas (mean: 1989), followed by the transition zone (mean: 1993) and lastly the forest zone (mean: 1998).
Local discourses of environmental change
We administered a community questionnaire in the different research locations with the aim to capture people’s – possibly conflicting – perceptions of environmental change and its causes. The questionnaire included several questions on trends in soil fertility, vegetation and rainfall. In the case of negative trends, the respondents were asked about the causes of these trends and whether, and if so how, the arrival of settlers from Northern Ghana had contributed to negative trends in soil fertility and vegetation cover.
In almost all group discussions, the participants had the impression that the soil had become less fertile, that the vegetation cover had reduced and that the rainy seasons had reduced in length and volume.14 In the most Northern locations (Fawoman, Wewa, Subinso) the group discussants doubted whether they could still talk of two rainy seasons per year. They said that cropping twice had become risky because rainfall in the minor season (September – November) had become unreliable. In one group discussion, the settler farmers perceived the area as having two rainy seasons while the native farmers said that there was just one.
The group discussants made several linkages between these environmental changes. Some groups mentioned, for example, that the rains had reduced because
14 Unfortunately, no attempt was made during the group discussion to determine the timing of these changes.
80
the forest used to attract rain. Due to deforestation, they said, the rains also became less heavy. As a sign of fertility decline, several groups said they now had to apply fertilizer to get good yields. In one group, the farmers mentioned that they had had to abandon maize cultivation and concentrate on cassava because of soil fertility decline. Reduced fallows were seen as an important cause of soil fertility decline in the accessible villages. One group (in Krobo) explicitly linked this to population growth and in-migration of Dagara. The group discussants in the more remote locations said that the land was ‘too plenty to over-cultivate’. These groups mentioned uncontrolled bush fires as a more common cause of fertility decline and also of deforestation. Hunters, palm wine tappers and charcoal burners were most commonly blamed for causing uncontrolled bush fire. Farming was not regarded as a common cause of bush fires because strict regulations governing the use of fire on farms during the dry season were put in place after the devastating drought and bush fires of 1982-1983. People try to clear new farms at the end of the rainy season. If they are late, they have to call the community fire volunteers who create a fire belt around the farms (against a small fee). According to the group discussants in all villages, these rules are quite strictly adhered to.
When asked specifically about the contribution of Dagara migrants to soil fertility decline, most groups could not think of any, but one group (in Krobo) mentioned that the tenure system (fixed rent for a number of years) contributed to mining the soil. One participant said: “If the land is given out for, say four years, the settler will make sure he gets the maximum out of it and won’t leave the land to rest.” Another group (in Abomfua) mentioned a more indirect contribution. They said that the settlers had shown that “there is money in farming” causing the natives – who had gradually abandoned agriculture to focus on non-farm activities – to go back to farming. This, they said, had caused increased pressure on farmlands and reduced fallows.
As mentioned above, most groups thought that there was a negative trend in vegetation cover (deforestation/savannization) in their area. In one location (Wewa), the discussants emphasized, like Amanor & Pabi’s (2007) land cover / change study, that there are also changes in the opposite direction. They said: “Some areas were like ‘savannah forest’ and have become savannah due to farming, but the forest comes back after some time.” In another Northern location (Fawoman) the respondents perceived a positive trend in vegetation cover. They said that the presence of spear grass15 in the area was reducing and being replaced by ‘Akyeam-pong’16, a grass that is more common in the forest area and that is associated with more fertile soil. In places where the trend was perceived to be negative, timber logging, farming and charcoal burning were mentioned as causes of deforestation
15 Imperata cylindrical. 16 Elephant grass, Chromolaena odorata.
81
apart from uncontrolled bush fire. When asked specifically about Dagara migrants’ contribution to deforestation, most groups said that they did not see why migrants would be more to blame than others, but in one locality (Krobo) they said that the Dagara are more expansive farmers, that they try to make their farms as large as possible, which causes more deforestation.
The occurrence, timing and impact of timber logging varied greatly between the localities, but it has been less extensive in the Northern part of the District. In some places, large-scale extraction took place in the past, but stopped when the quality species, like mahogany, kapok and odum,17 were depleted. In other places logging is ongoing, either illegally or with authorization. Illegal chainsaw operators negotiate with land owners while official timber companies have to pay the District Assembly. Some relatively new settlements in the forest zone were established in the wake of logging operations. In Abomfua, for example, the discussants said: “Timber operators came to fell big trees which farmers could not have felled with their simple tools. The place was opened up and became suitable for farming.” In these cases land cover change occurred in an interplay between timber extraction and in-migration of settler farmers, a process that is well-recorded in other parts of the world, for example in Amazonia (see Lambin et al. 2001). It should be noted, however, that the ‘opening up’ of the Brong Ahafo Region is not only a result of timber logging. Amanor & Pabi (2007) emphasize that the state farms that were established in the 1960s played a crucial role in opening this new food crop frontier.
The occurrence of charcoal burning also varies largely between different places in the study area, as do the rules and byelaws governing this activity. Charcoal burning is most widespread in the Northern part of Wenchi District. In most locations charcoal burning is not permitted in the dry season and only dead trees can be used. However, in Adadease the group discussant maintained that they are allowed to fell trees deliberately and then process them into charcoal. In some places, charcoal burning is carried out by the farmers themselves while in other locations the work is done exclusively by ‘professionals’, mostly Sisalas from the Upper West Region. They negotiate the right to burn with local chiefs (uncultivated land) or farm-ers/landowners (farmland or fallow land), either for a fixed amount or by sharing one out of three bags of charcoal with the landowner. Settler farmers’ rights to tree resources vary per locality and type of land tenure arrangement. In some locations, the person who cultivates the land has the right to use the dead trees for charcoal, but is not allowed to ‘sell’ the trees to professional burners. In other locations the land owner has full control over the trees and, if the settler farmer wants to use the dead trees for charcoal, he has to negotiate with the owner. Settler farmers in Amoahkrom are allowed to use trees for charcoal if the land tenure is an annual rent, but not if they farm on a sharecropping basis. 17 The scientific name of odum is Milicia excelsa/regia or Chlorophora.
82
The group discussions yielded an interesting overview of local discourses of environmental change and its causes. The participants perceive the trends mostly as negative and they attribute these negative trends to a combination of timber logging, increased pressure on farmland, charcoal burning and uncontrolled bush fire caused by hunters, palm wine tappers and charcoal burners. The discussion also yielded interesting information about the different institutional setups that govern access to natural resources. Dagara in-migration did not turn out to be an important contributing factor to soil fertility decline and deforestation except in one location (Krobo). It could be argued that the findings would perhaps have been different had we talked to settlers and natives separately, but the findings of the survey presented in the following two sections indicate that this is not the case.
Perceptions of land use by ‘the other’
As part of the household questionnaire we asked Dagara settlers whether they could identify differences in the way they farmed and the way natives farmed. Similarly, the native farmers were asked whether there were any differences between the farming methods used by them and settler farmers. This was an open question without any pre-determined answers to choose from. The answers of both settlers and natives were coded and clustered. The respondents’ answers sometimes contained more than one cluster. Table 4.3 shows the differences identified by both settlers and natives in descending order of frequency.
About a quarter of the settler farmers and about a tenth of the native farmers said that they could not think of any differences in farming methods between the two groups (#1).18 In addition, three respondents said that they did not know because they never visited the other group’s farms (#18). The other perceptions listed in table 4.3 give a rough idea about some differences in farm behaviour. Firstly, settlers are perceived as having bigger farms and larger harvests than natives (#2, #5, #25). Secondly, farming is more often the main occupation of settlers (#7, #8, #22). Thirdly, native farms are more capital-intensive while settler farms are more labour-intensive (#3, #7, #9, #11, #13, #24, #32, #33, #34). Fourthly, native farmers are more likely to farm on their own land while settlers have to rent land (#7). Fifthly, settlers and natives grow different crops, with natives being more likely to grow cash crops and settlers food crops. There was no agreement on which group cultivated a larger variety of crops (#10, #14, #15, #19). A final and frequently referred to difference is that settler farmers tend to make more use of hoes to prepare the land and weed while natives prefer to use cutlasses (#5). The picture that emerges from this analysis is that the settlers’ style of farming is one of hard work with little capital input. The natives’ farming style seems to be more capital-
18 The number between parentheses refers to the item number in table 3.
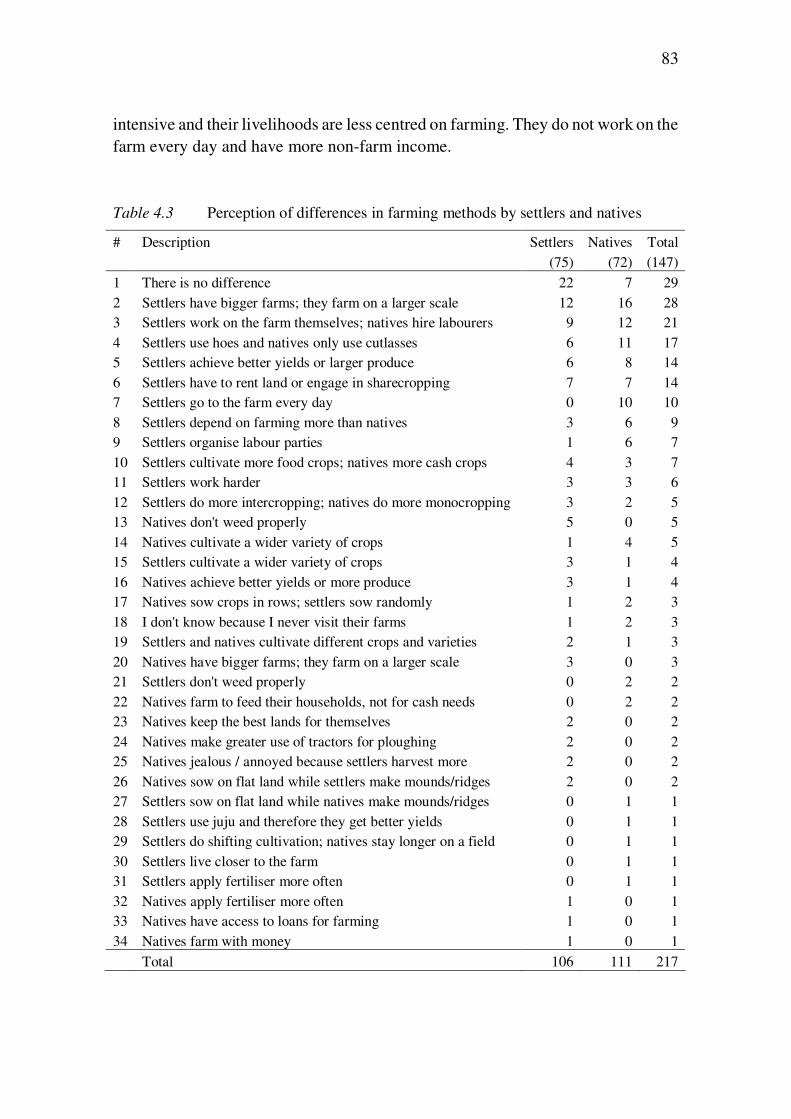
83
intensive and their livelihoods are less centred on farming. They do not work on the farm every day and have more non-farm income.
Table 4.3 Perception of differences in farming methods by settlers and natives
# Description Settlers (75)
Natives (72)
Total (147)
1 There is no difference 22 7 29 2 Settlers have bigger farms; they farm on a larger scale 12 16 28 3 Settlers work on the farm themselves; natives hire labourers 9 12 21 4 Settlers use hoes and natives only use cutlasses 6 11 17 5 Settlers achieve better yields or larger produce 6 8 14 6 Settlers have to rent land or engage in sharecropping 7 7 14 7 Settlers go to the farm every day 0 10 10 8 Settlers depend on farming more than natives 3 6 9 9 Settlers organise labour parties 1 6 7 10 Settlers cultivate more food crops; natives more cash crops 4 3 7 11 Settlers work harder 3 3 6 12 Settlers do more intercropping; natives do more monocropping 3 2 5 13 Natives don't weed properly 5 0 5 14 Natives cultivate a wider variety of crops 1 4 5 15 Settlers cultivate a wider variety of crops 3 1 4 16 Natives achieve better yields or more produce 3 1 4 17 Natives sow crops in rows; settlers sow randomly 1 2 3 18 I don't know because I never visit their farms 1 2 3 19 Settlers and natives cultivate different crops and varieties 2 1 3 20 Natives have bigger farms; they farm on a larger scale 3 0 3 21 Settlers don't weed properly 0 2 2 22 Natives farm to feed their households, not for cash needs 0 2 2 23 Natives keep the best lands for themselves 2 0 2 24 Natives make greater use of tractors for ploughing 2 0 2 25 Natives jealous / annoyed because settlers harvest more 2 0 2 26 Natives sow on flat land while settlers make mounds/ridges 2 0 2 27 Settlers sow on flat land while natives make mounds/ridges 0 1 1 28 Settlers use juju and therefore they get better yields 0 1 1 29 Settlers do shifting cultivation; natives stay longer on a field 0 1 1 30 Settlers live closer to the farm 0 1 1 31 Settlers apply fertiliser more often 0 1 1 32 Natives apply fertiliser more often 1 0 1 33 Natives have access to loans for farming 1 0 1 34 Natives farm with money 1 0 1
Total 106 111 217
84
Natives did not explicitly accuse settler farmers of contributing to land degrada-tion through environmentally unsustainable farm practices. Only one native respondent said that the migrants’ use of hoes “spoils the soil”. The use of mounds and ridges, which is lamented in Adjei-Nsiah’s work (2004, 2006) was not linked to negative effects on the land at all. In general, natives had a quite positive perception of settlers’ farming skills. They seem to admire the Dagara’s strength and dedication. Very few negative remarks were made. Even the respondent who mentioned settlers’ use of juju19 made this comment with a certain admiration. Settler farmers did make some negative statements about natives’ farm practices and behaviour. Five of them mentioned that natives do not weed properly. Two settlers also said that the settlers’ agricultural achievements created jealousy and annoyance among native farmers. Lastly, two settlers complained that natives keep the best lands for themselves and only allow settler farmers to cultivate the infertile portions.20
Environmental sustainability did not emerge as a big issue in the analysis of perceptions of differences in farming methods between settlers and natives. However, the analysis did yield a few clues about differences in land use sustain-ability. Perceived differences that suggest that the Dagara cause more land degradation are: (1) they have larger farms; (2) they do not engage in tree cropping; (3) their use of the hoe may cause more soil erosion than natives’ minimum tillage with cutlasses; and (4) settler farmers seem to shift faster to a new plot, which can put more pressure on vegetation cover. Conversely, factors that suggest that native farmers cause more land degradation are: (1) natives are perceived to engage more in monocropping; (2) they make more use of tractor services for ploughing; and (3) they stay longer on one plot, which can exhaust the soil.
In the next section, we analyse the results of a socio-economic and land use survey among native and settler farmers. Some of the findings on perceptions are confirmed, some are refuted and some additional differences are identified.
Land use sustainability of settlers and native farmers
In this section the environmental sustainability of migrants’ and natives’ farm practices are compared. Several aspects of their farming systems are discussed, such as land tenure, farm size, crop mix, tools used, tillage methods, capital inputs and tree cutting and planting. As mentioned earlier, there are substantial differences in agro-ecological conditions and market access within the study area. Therefore, differences between ecological zones and between accessible and remote areas also
19 See also Sarfo-Mensah & Oduro (2010) for a very interesting paper on the spiritual aspects of natural
resource management in Ghana’s FSTZ. 20 See also Leach and Fairhead (2000: 34).
85
receive attention. To avoid ecological fallacy in the comparison of farming methods, a distinction is made between all Dagara settlers and only those Dagara migrant households that settled in the communities in which native farmers were inter-viewed.
As mentioned in the methodology section, all Dagara migrants in the survey villages were selected, irrespective of whether they farmed or not. Ninety-six percent turned out to be farmers (194). Four worked as farm labourers (mostly recent arrivals), three were full-time charcoal burners and two engaged only in non-farm activities (a pito brewer and a driver). Beside the three professional charcoal burners, 17 out of 203 Dagara respondents (8.4 percent) also engage in charcoal burning as an extra source of income. Charcoal burning was more common among native farmers though: 11 out of 73 respondents (15.1 percent) engaged in this activity. Among the native population, it was more common to find non-farm households.21 Since the purpose of this study was to compare farm practices, we only included those households that engaged in crop cultivation.
The respondents
Before the farm practices of settlers and natives are compared, some basic socio-economic information of the respondents and their households is given (see table 4.4). The main difference between migrants and settlers (column 2 and 3) in the four selected localities was that the native household heads had higher levels of education and non-farm income. Within the group of migrants, there were substantial differences between ecological zones (column 4, 5 and 6) and between accessible and remote areas (column 7 and 8). Migrants who had settled in savannah locations tended to be older and had migrated longer ago than those in the forest zone. Another difference between migrants in the different ecological zones was that non-farm incomes were much higher in the transition zone. This is because two relatively large rural towns (Droboso and Krobo) were located in the transition zone. Non-farm income opportunities are better there, and this also explains the higher proportion of female headed households. The same difference is evident between remote and accessible locations. An additional difference is that, on average, migrants in accessible locations had higher levels of education than migrants in remote areas.
As noted above, natives have substantially higher non-farm incomes than settlers. Non-farm income includes remittances from migrant relatives. An important difference between settlers and natives is that settlers are expected to send remittances to their relatives in the Upper West Region, while native farmers received appreciable amounts of money from children and siblings in Kumasi,
21 As mentioned in the methodology section, eight interviews were cancelled because the respondents did
not farm.
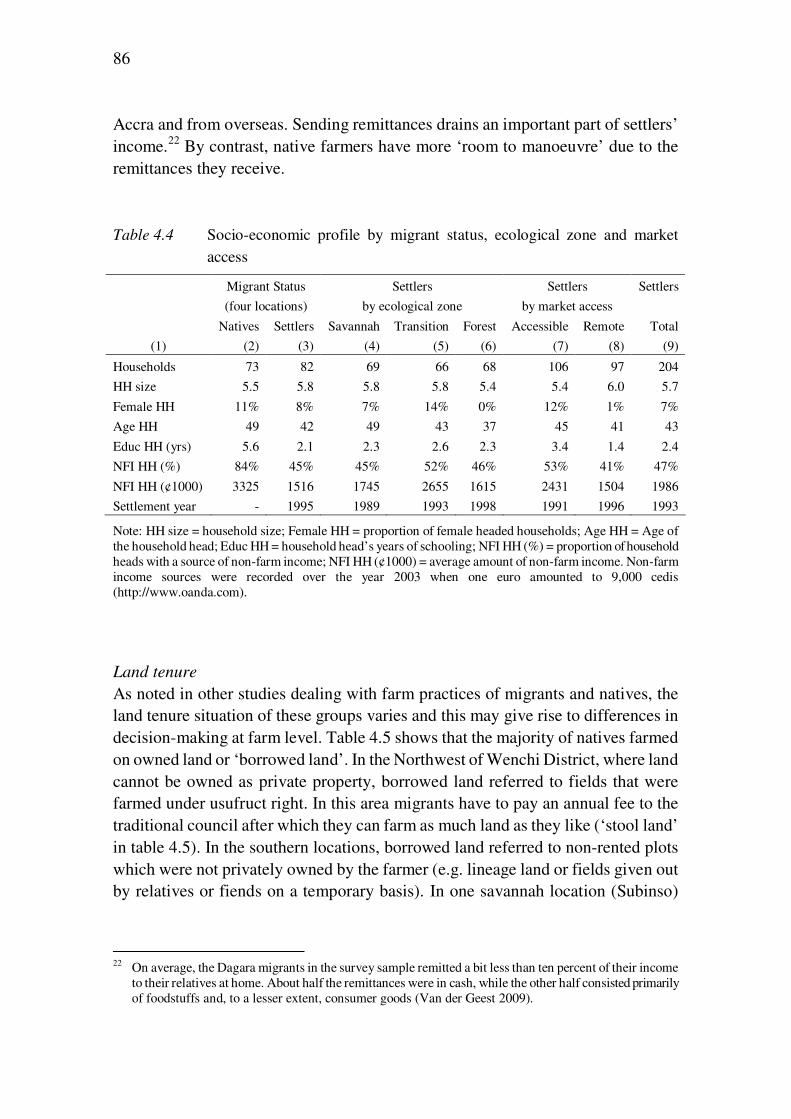
86
Accra and from overseas. Sending remittances drains an important part of settlers’ income.22 By contrast, native farmers have more ‘room to manoeuvre’ due to the remittances they receive. Table 4.4 Socio-economic profile by migrant status, ecological zone and market
access
Migrant Status
(four locations)
Settlers
by ecological zone
Settlers
by market access
Settlers
(1)
Natives
(2)
Settlers
(3)
Savannah
(4)
Transition
(5)
Forest
(6)
Accessible
(7)
Remote
(8)
Total
(9)
Households 73 82 69 66 68 106 97 204
HH size 5.5 5.8 5.8 5.8 5.4 5.4 6.0 5.7
Female HH 11% 8% 7% 14% 0% 12% 1% 7%
Age HH 49 42 49 43 37 45 41 43
Educ HH (yrs) 5.6 2.1 2.3 2.6 2.3 3.4 1.4 2.4
NFI HH (%) 84% 45% 45% 52% 46% 53% 41% 47%
NFI HH (¢1000) 3325 1516 1745 2655 1615 2431 1504 1986
Settlement year - 1995 1989 1993 1998 1991 1996 1993
Note: HH size = household size; Female HH = proportion of female headed households; Age HH = Age of the household head; Educ HH = household head’s years of schooling; NFI HH (%) = proportion of household heads with a source of non-farm income; NFI HH (¢1000) = average amount of non-farm income. Non-farm income sources were recorded over the year 2003 when one euro amounted to 9,000 cedis (http://www.oanda.com).
Land tenure
As noted in other studies dealing with farm practices of migrants and natives, the land tenure situation of these groups varies and this may give rise to differences in decision-making at farm level. Table 4.5 shows that the majority of natives farmed on owned land or ‘borrowed land’. In the Northwest of Wenchi District, where land cannot be owned as private property, borrowed land referred to fields that were farmed under usufruct right. In this area migrants have to pay an annual fee to the traditional council after which they can farm as much land as they like (‘stool land’ in table 4.5). In the southern locations, borrowed land referred to non-rented plots which were not privately owned by the farmer (e.g. lineage land or fields given out by relatives or fiends on a temporary basis). In one savannah location (Subinso)
22 On average, the Dagara migrants in the survey sample remitted a bit less than ten percent of their income
to their relatives at home. About half the remittances were in cash, while the other half consisted primarily of foodstuffs and, to a lesser extent, consumer goods (Van der Geest 2009).
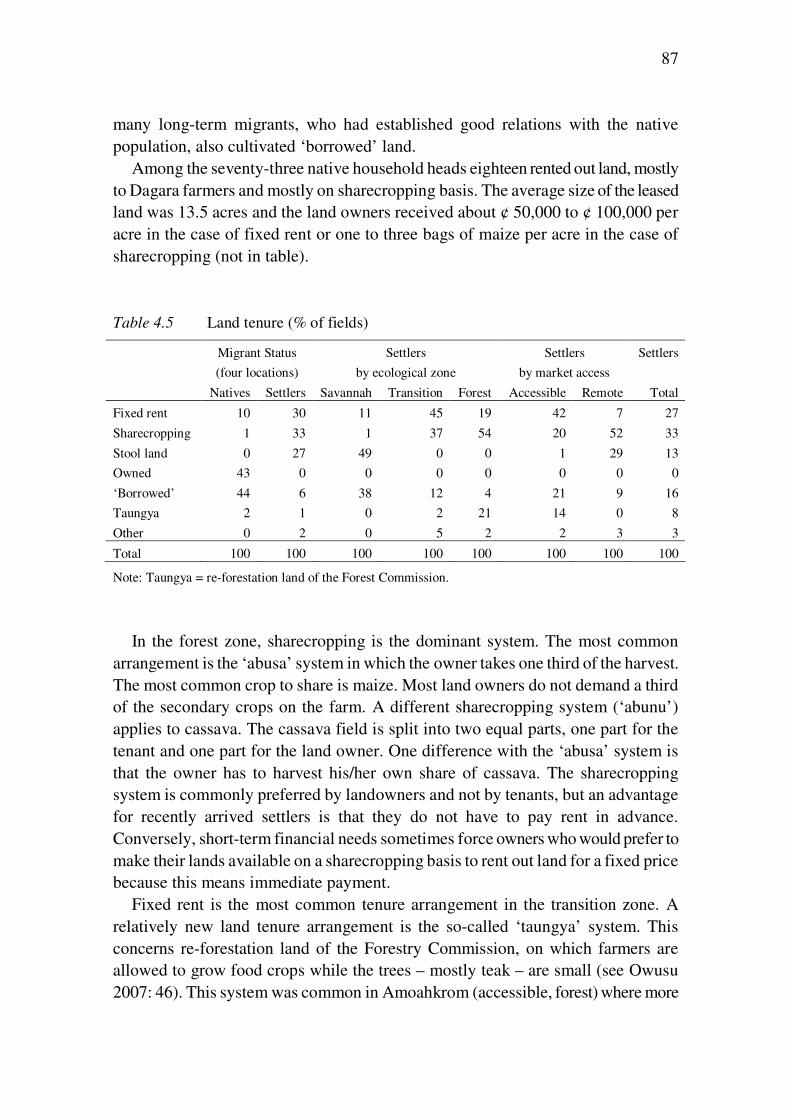
87
many long-term migrants, who had established good relations with the native population, also cultivated ‘borrowed’ land.
Among the seventy-three native household heads eighteen rented out land, mostly to Dagara farmers and mostly on sharecropping basis. The average size of the leased land was 13.5 acres and the land owners received about ¢ 50,000 to ¢ 100,000 per acre in the case of fixed rent or one to three bags of maize per acre in the case of sharecropping (not in table). Table 4.5 Land tenure (% of fields)
Migrant Status
(four locations)
Settlers
by ecological zone
Settlers
by market access
Settlers
Natives Settlers Savannah Transition Forest Accessible Remote Total
Fixed rent 10 30 11 45 19 42 7 27
Sharecropping 1 33 1 37 54 20 52 33
Stool land 0 27 49 0 0 1 29 13
Owned 43 0 0 0 0 0 0 0
‘Borrowed’ 44 6 38 12 4 21 9 16
Taungya 2 1 0 2 21 14 0 8
Other 0 2 0 5 2 2 3 3
Total 100 100 100 100 100 100 100 100
Note: Taungya = re-forestation land of the Forest Commission.
In the forest zone, sharecropping is the dominant system. The most common arrangement is the ‘abusa’ system in which the owner takes one third of the harvest. The most common crop to share is maize. Most land owners do not demand a third of the secondary crops on the farm. A different sharecropping system (‘abunu’) applies to cassava. The cassava field is split into two equal parts, one part for the tenant and one part for the land owner. One difference with the ‘abusa’ system is that the owner has to harvest his/her own share of cassava. The sharecropping system is commonly preferred by landowners and not by tenants, but an advantage for recently arrived settlers is that they do not have to pay rent in advance. Conversely, short-term financial needs sometimes force owners who would prefer to make their lands available on a sharecropping basis to rent out land for a fixed price because this means immediate payment.
Fixed rent is the most common tenure arrangement in the transition zone. A relatively new land tenure arrangement is the so-called ‘taungya’ system. This concerns re-forestation land of the Forestry Commission, on which farmers are allowed to grow food crops while the trees – mostly teak – are small (see Owusu 2007: 46). This system was common in Amoahkrom (accessible, forest) where more
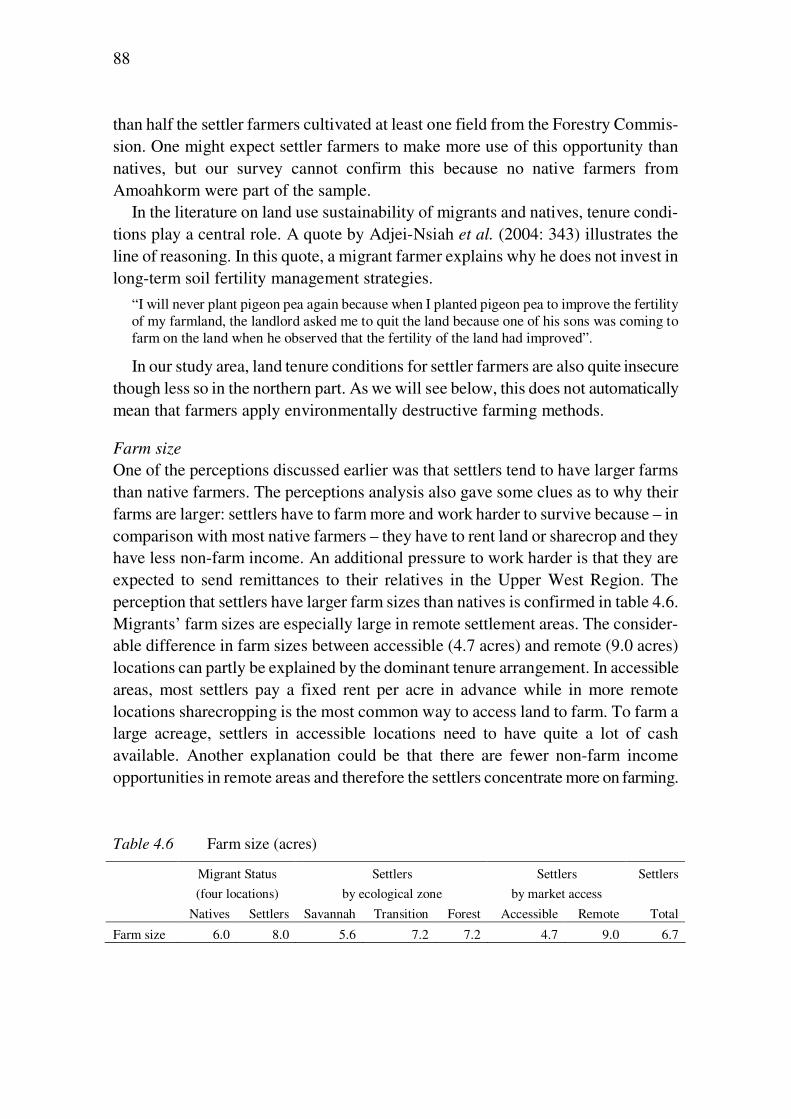
88
than half the settler farmers cultivated at least one field from the Forestry Commis-sion. One might expect settler farmers to make more use of this opportunity than natives, but our survey cannot confirm this because no native farmers from Amoahkorm were part of the sample.
In the literature on land use sustainability of migrants and natives, tenure condi-tions play a central role. A quote by Adjei-Nsiah et al. (2004: 343) illustrates the line of reasoning. In this quote, a migrant farmer explains why he does not invest in long-term soil fertility management strategies.
“I will never plant pigeon pea again because when I planted pigeon pea to improve the fertility of my farmland, the landlord asked me to quit the land because one of his sons was coming to farm on the land when he observed that the fertility of the land had improved”.
In our study area, land tenure conditions for settler farmers are also quite insecure though less so in the northern part. As we will see below, this does not automatically mean that farmers apply environmentally destructive farming methods.
Farm size
One of the perceptions discussed earlier was that settlers tend to have larger farms than native farmers. The perceptions analysis also gave some clues as to why their farms are larger: settlers have to farm more and work harder to survive because – in comparison with most native farmers – they have to rent land or sharecrop and they have less non-farm income. An additional pressure to work harder is that they are expected to send remittances to their relatives in the Upper West Region. The perception that settlers have larger farm sizes than natives is confirmed in table 4.6. Migrants’ farm sizes are especially large in remote settlement areas. The consider-able difference in farm sizes between accessible (4.7 acres) and remote (9.0 acres) locations can partly be explained by the dominant tenure arrangement. In accessible areas, most settlers pay a fixed rent per acre in advance while in more remote locations sharecropping is the most common way to access land to farm. To farm a large acreage, settlers in accessible locations need to have quite a lot of cash available. Another explanation could be that there are fewer non-farm income opportunities in remote areas and therefore the settlers concentrate more on farming. Table 4.6 Farm size (acres)
Migrant Status
(four locations)
Settlers
by ecological zone
Settlers
by market access
Settlers
Natives Settlers Savannah Transition Forest Accessible Remote Total
Farm size 6.0 8.0 5.6 7.2 7.2 4.7 9.0 6.7
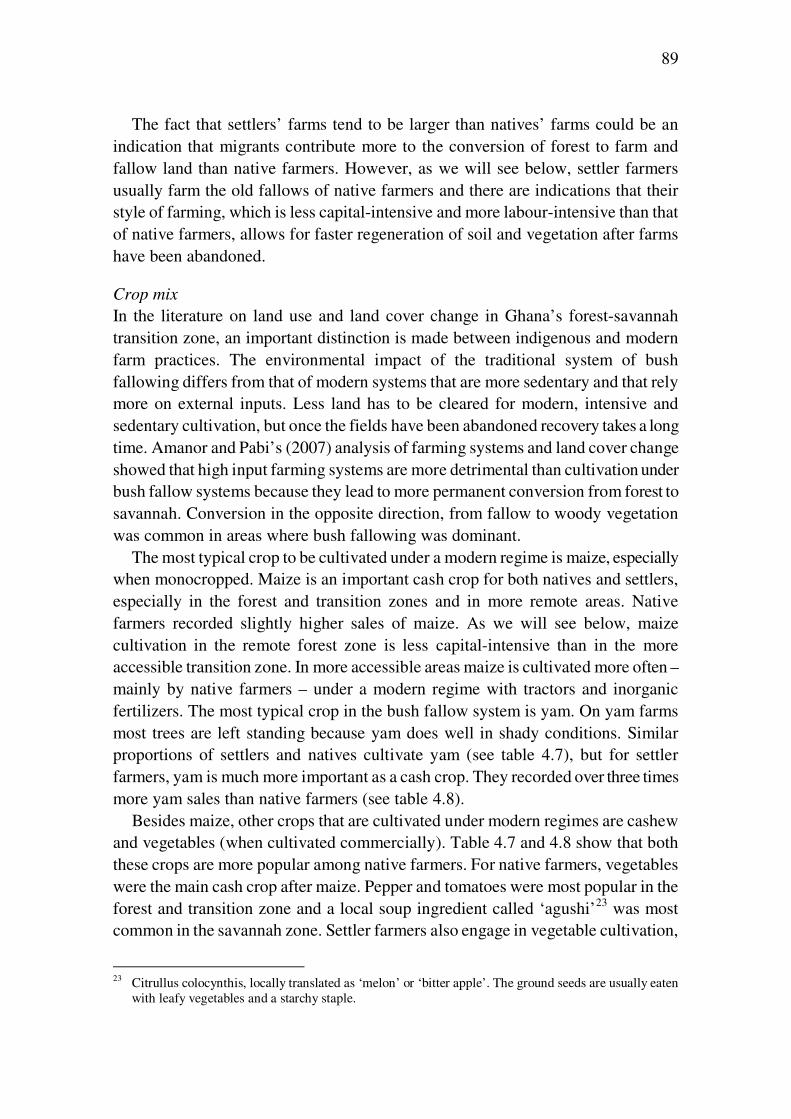
89
The fact that settlers’ farms tend to be larger than natives’ farms could be an indication that migrants contribute more to the conversion of forest to farm and fallow land than native farmers. However, as we will see below, settler farmers usually farm the old fallows of native farmers and there are indications that their style of farming, which is less capital-intensive and more labour-intensive than that of native farmers, allows for faster regeneration of soil and vegetation after farms have been abandoned.
Crop mix
In the literature on land use and land cover change in Ghana’s forest-savannah transition zone, an important distinction is made between indigenous and modern farm practices. The environmental impact of the traditional system of bush fallowing differs from that of modern systems that are more sedentary and that rely more on external inputs. Less land has to be cleared for modern, intensive and sedentary cultivation, but once the fields have been abandoned recovery takes a long time. Amanor and Pabi’s (2007) analysis of farming systems and land cover change showed that high input farming systems are more detrimental than cultivation under bush fallow systems because they lead to more permanent conversion from forest to savannah. Conversion in the opposite direction, from fallow to woody vegetation was common in areas where bush fallowing was dominant.
The most typical crop to be cultivated under a modern regime is maize, especially when monocropped. Maize is an important cash crop for both natives and settlers, especially in the forest and transition zones and in more remote areas. Native farmers recorded slightly higher sales of maize. As we will see below, maize cultivation in the remote forest zone is less capital-intensive than in the more accessible transition zone. In more accessible areas maize is cultivated more often – mainly by native farmers – under a modern regime with tractors and inorganic fertilizers. The most typical crop in the bush fallow system is yam. On yam farms most trees are left standing because yam does well in shady conditions. Similar proportions of settlers and natives cultivate yam (see table 4.7), but for settler farmers, yam is much more important as a cash crop. They recorded over three times more yam sales than native farmers (see table 4.8).
Besides maize, other crops that are cultivated under modern regimes are cashew and vegetables (when cultivated commercially). Table 4.7 and 4.8 show that both these crops are more popular among native farmers. For native farmers, vegetables were the main cash crop after maize. Pepper and tomatoes were most popular in the forest and transition zone and a local soup ingredient called ‘agushi’23 was most common in the savannah zone. Settler farmers also engage in vegetable cultivation,
23 Citrullus colocynthis, locally translated as ‘melon’ or ‘bitter apple’. The ground seeds are usually eaten
with leafy vegetables and a starchy staple.
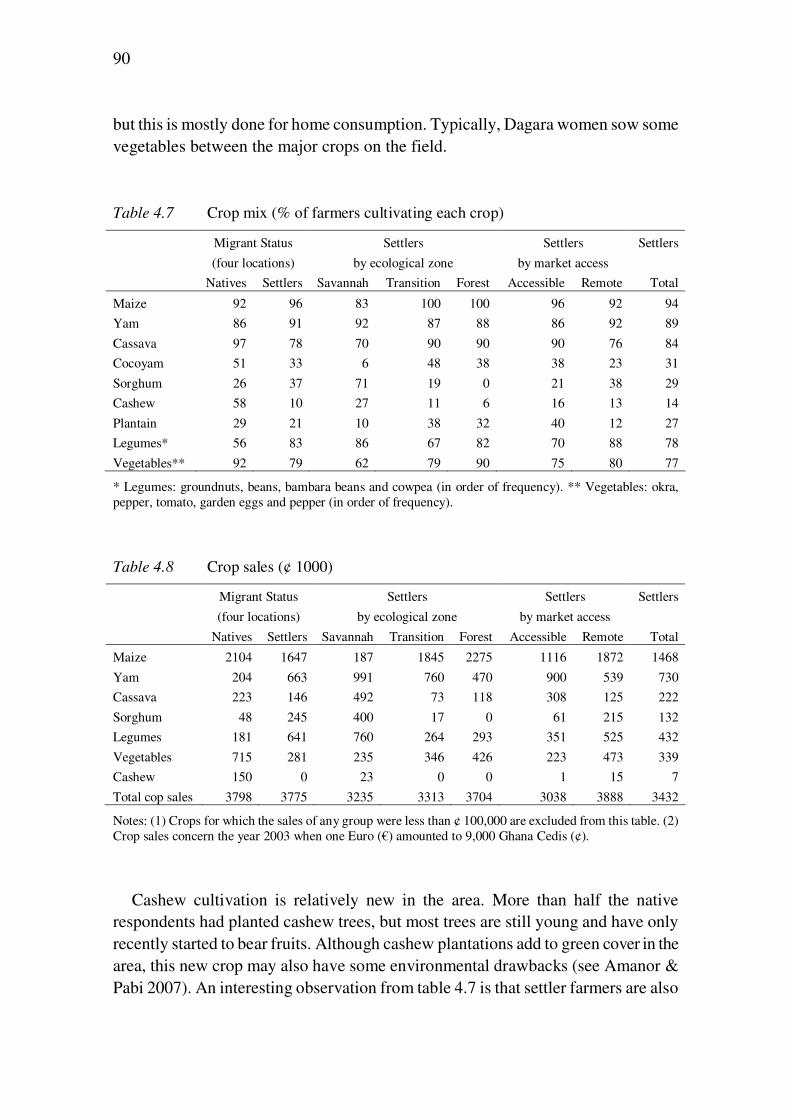
90
but this is mostly done for home consumption. Typically, Dagara women sow some vegetables between the major crops on the field. Table 4.7 Crop mix (% of farmers cultivating each crop)
Migrant Status
(four locations)
Settlers
by ecological zone
Settlers
by market access
Settlers
Natives Settlers Savannah Transition Forest Accessible Remote Total
Maize 92 96 83 100 100 96 92 94
Yam 86 91 92 87 88 86 92 89
Cassava 97 78 70 90 90 90 76 84
Cocoyam 51 33 6 48 38 38 23 31
Sorghum 26 37 71 19 0 21 38 29
Cashew 58 10 27 11 6 16 13 14
Plantain 29 21 10 38 32 40 12 27
Legumes* 56 83 86 67 82 70 88 78
Vegetables** 92 79 62 79 90 75 80 77
* Legumes: groundnuts, beans, bambara beans and cowpea (in order of frequency). ** Vegetables: okra, pepper, tomato, garden eggs and pepper (in order of frequency).
Table 4.8 Crop sales (¢ 1000)
Migrant Status
(four locations)
Settlers
by ecological zone
Settlers
by market access
Settlers
Natives Settlers Savannah Transition Forest Accessible Remote Total
Maize 2104 1647 187 1845 2275 1116 1872 1468
Yam 204 663 991 760 470 900 539 730
Cassava 223 146 492 73 118 308 125 222
Sorghum 48 245 400 17 0 61 215 132
Legumes 181 641 760 264 293 351 525 432
Vegetables 715 281 235 346 426 223 473 339
Cashew 150 0 23 0 0 1 15 7
Total cop sales 3798 3775 3235 3313 3704 3038 3888 3432
Notes: (1) Crops for which the sales of any group were less than ¢ 100,000 are excluded from this table. (2) Crop sales concern the year 2003 when one Euro (€) amounted to 9,000 Ghana Cedis (¢).
Cashew cultivation is relatively new in the area. More than half the native respondents had planted cashew trees, but most trees are still young and have only recently started to bear fruits. Although cashew plantations add to green cover in the area, this new crop may also have some environmental drawbacks (see Amanor & Pabi 2007). An interesting observation from table 4.7 is that settler farmers are also
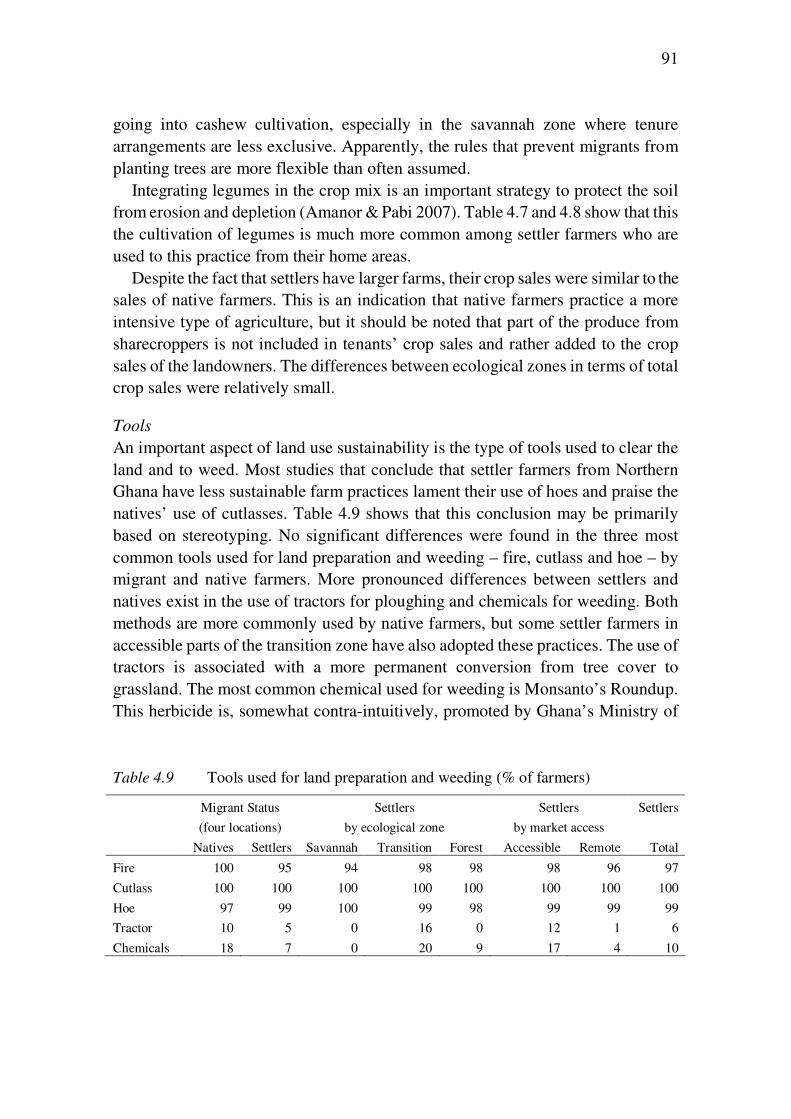
91
going into cashew cultivation, especially in the savannah zone where tenure arrangements are less exclusive. Apparently, the rules that prevent migrants from planting trees are more flexible than often assumed.
Integrating legumes in the crop mix is an important strategy to protect the soil from erosion and depletion (Amanor & Pabi 2007). Table 4.7 and 4.8 show that this the cultivation of legumes is much more common among settler farmers who are used to this practice from their home areas.
Despite the fact that settlers have larger farms, their crop sales were similar to the sales of native farmers. This is an indication that native farmers practice a more intensive type of agriculture, but it should be noted that part of the produce from sharecroppers is not included in tenants’ crop sales and rather added to the crop sales of the landowners. The differences between ecological zones in terms of total crop sales were relatively small.
Tools
An important aspect of land use sustainability is the type of tools used to clear the land and to weed. Most studies that conclude that settler farmers from Northern Ghana have less sustainable farm practices lament their use of hoes and praise the natives’ use of cutlasses. Table 4.9 shows that this conclusion may be primarily based on stereotyping. No significant differences were found in the three most common tools used for land preparation and weeding – fire, cutlass and hoe – by migrant and native farmers. More pronounced differences between settlers and natives exist in the use of tractors for ploughing and chemicals for weeding. Both methods are more commonly used by native farmers, but some settler farmers in accessible parts of the transition zone have also adopted these practices. The use of tractors is associated with a more permanent conversion from tree cover to grassland. The most common chemical used for weeding is Monsanto’s Roundup. This herbicide is, somewhat contra-intuitively, promoted by Ghana’s Ministry of Table 4.9 Tools used for land preparation and weeding (% of farmers)
Migrant Status
(four locations)
Settlers
by ecological zone
Settlers
by market access
Settlers
Natives Settlers Savannah Transition Forest Accessible Remote Total
Fire 100 95 94 98 98 98 96 97
Cutlass 100 100 100 100 100 100 100 100
Hoe 97 99 100 99 98 99 99 99
Tractor 10 5 0 16 0 12 1 6
Chemicals 18 7 0 20 9 17 4 10
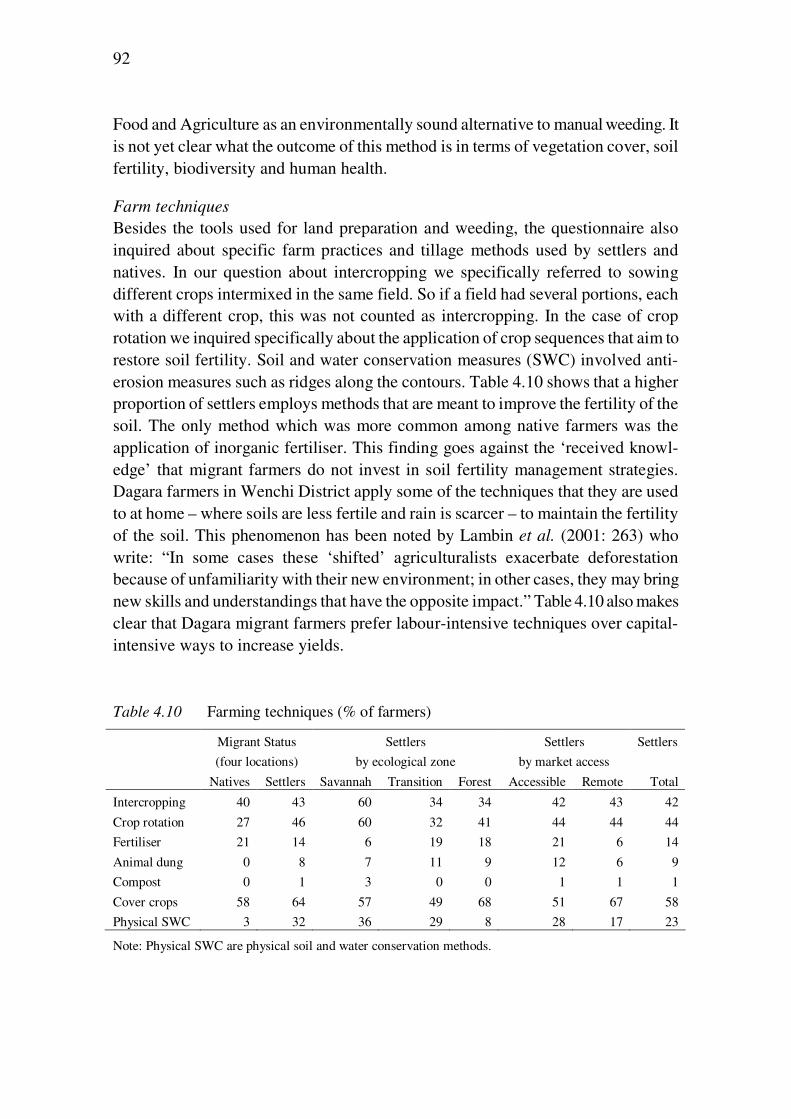
92
Food and Agriculture as an environmentally sound alternative to manual weeding. It is not yet clear what the outcome of this method is in terms of vegetation cover, soil fertility, biodiversity and human health.
Farm techniques
Besides the tools used for land preparation and weeding, the questionnaire also inquired about specific farm practices and tillage methods used by settlers and natives. In our question about intercropping we specifically referred to sowing different crops intermixed in the same field. So if a field had several portions, each with a different crop, this was not counted as intercropping. In the case of crop rotation we inquired specifically about the application of crop sequences that aim to restore soil fertility. Soil and water conservation measures (SWC) involved anti-erosion measures such as ridges along the contours. Table 4.10 shows that a higher proportion of settlers employs methods that are meant to improve the fertility of the soil. The only method which was more common among native farmers was the application of inorganic fertiliser. This finding goes against the ‘received knowl-edge’ that migrant farmers do not invest in soil fertility management strategies. Dagara farmers in Wenchi District apply some of the techniques that they are used to at home – where soils are less fertile and rain is scarcer – to maintain the fertility of the soil. This phenomenon has been noted by Lambin et al. (2001: 263) who write: “In some cases these ‘shifted’ agriculturalists exacerbate deforestation because of unfamiliarity with their new environment; in other cases, they may bring new skills and understandings that have the opposite impact.” Table 4.10 also makes clear that Dagara migrant farmers prefer labour-intensive techniques over capital-intensive ways to increase yields. Table 4.10 Farming techniques (% of farmers)
Migrant Status
(four locations)
Settlers
by ecological zone
Settlers
by market access
Settlers
Natives Settlers Savannah Transition Forest Accessible Remote Total
Intercropping 40 43 60 34 34 42 43 42
Crop rotation 27 46 60 32 41 44 44 44
Fertiliser 21 14 6 19 18 21 6 14
Animal dung 0 8 7 11 9 12 6 9
Compost 0 1 3 0 0 1 1 1
Cover crops 58 64 57 49 68 51 67 58
Physical SWC 3 32 36 29 8 28 17 23
Note: Physical SWC are physical soil and water conservation methods.
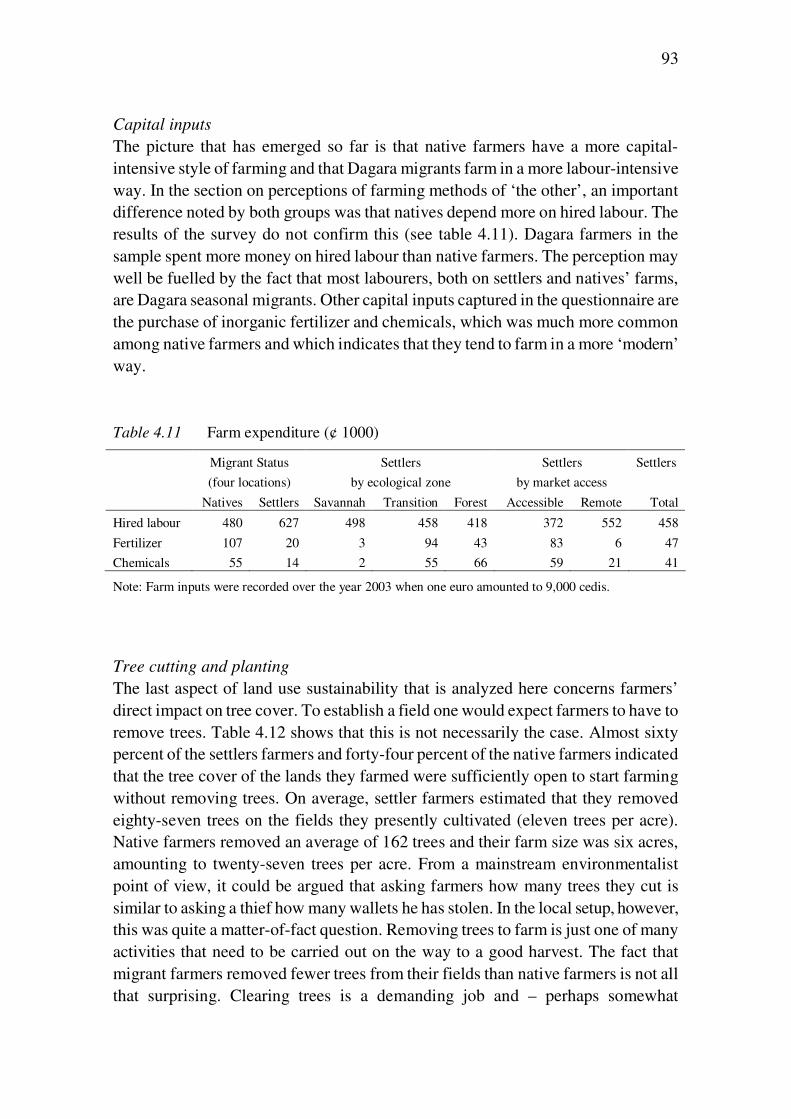
93
Capital inputs
The picture that has emerged so far is that native farmers have a more capital-intensive style of farming and that Dagara migrants farm in a more labour-intensive way. In the section on perceptions of farming methods of ‘the other’, an important difference noted by both groups was that natives depend more on hired labour. The results of the survey do not confirm this (see table 4.11). Dagara farmers in the sample spent more money on hired labour than native farmers. The perception may well be fuelled by the fact that most labourers, both on settlers and natives’ farms, are Dagara seasonal migrants. Other capital inputs captured in the questionnaire are the purchase of inorganic fertilizer and chemicals, which was much more common among native farmers and which indicates that they tend to farm in a more ‘modern’ way. Table 4.11 Farm expenditure (¢ 1000)
Migrant Status
(four locations)
Settlers
by ecological zone
Settlers
by market access
Settlers
Natives Settlers Savannah Transition Forest Accessible Remote Total
Hired labour 480 627 498 458 418 372 552 458
Fertilizer 107 20 3 94 43 83 6 47
Chemicals 55 14 2 55 66 59 21 41
Note: Farm inputs were recorded over the year 2003 when one euro amounted to 9,000 cedis.
Tree cutting and planting
The last aspect of land use sustainability that is analyzed here concerns farmers’ direct impact on tree cover. To establish a field one would expect farmers to have to remove trees. Table 4.12 shows that this is not necessarily the case. Almost sixty percent of the settlers farmers and forty-four percent of the native farmers indicated that the tree cover of the lands they farmed were sufficiently open to start farming without removing trees. On average, settler farmers estimated that they removed eighty-seven trees on the fields they presently cultivated (eleven trees per acre). Native farmers removed an average of 162 trees and their farm size was six acres, amounting to twenty-seven trees per acre. From a mainstream environmentalist point of view, it could be argued that asking farmers how many trees they cut is similar to asking a thief how many wallets he has stolen. In the local setup, however, this was quite a matter-of-fact question. Removing trees to farm is just one of many activities that need to be carried out on the way to a good harvest. The fact that migrant farmers removed fewer trees from their fields than native farmers is not all that surprising. Clearing trees is a demanding job and – perhaps somewhat
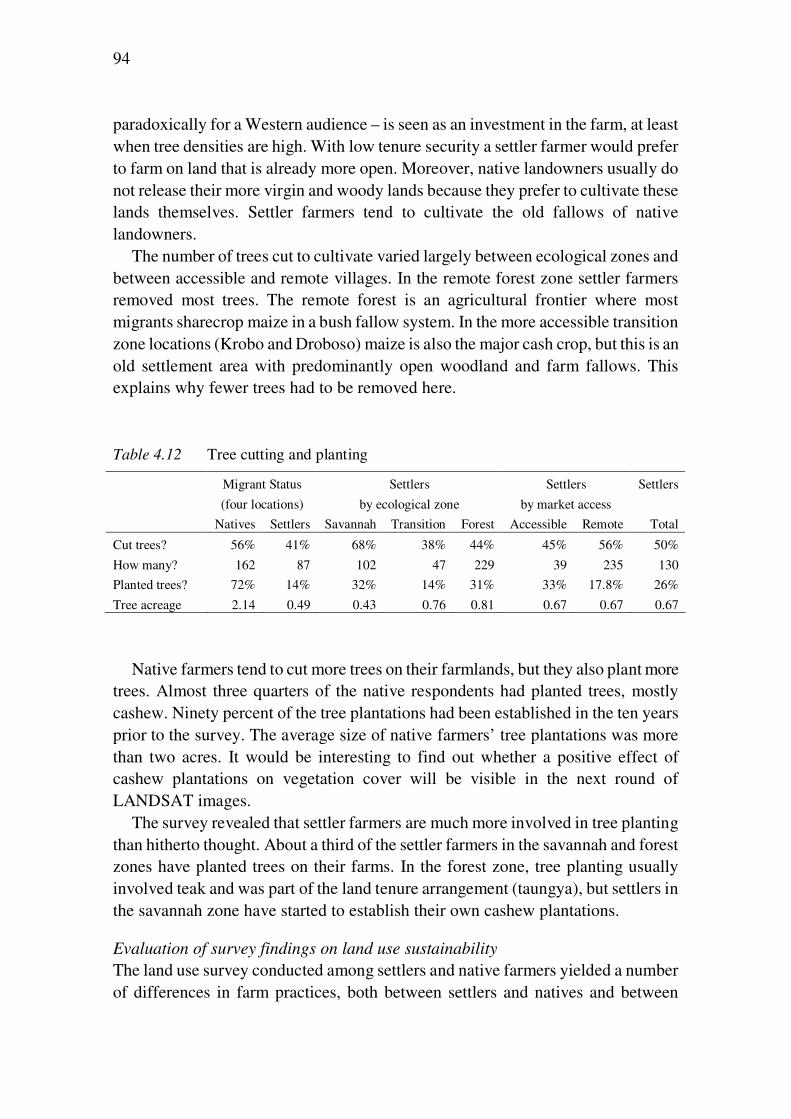
94
paradoxically for a Western audience – is seen as an investment in the farm, at least when tree densities are high. With low tenure security a settler farmer would prefer to farm on land that is already more open. Moreover, native landowners usually do not release their more virgin and woody lands because they prefer to cultivate these lands themselves. Settler farmers tend to cultivate the old fallows of native landowners.
The number of trees cut to cultivate varied largely between ecological zones and between accessible and remote villages. In the remote forest zone settler farmers removed most trees. The remote forest is an agricultural frontier where most migrants sharecrop maize in a bush fallow system. In the more accessible transition zone locations (Krobo and Droboso) maize is also the major cash crop, but this is an old settlement area with predominantly open woodland and farm fallows. This explains why fewer trees had to be removed here. Table 4.12 Tree cutting and planting
Migrant Status
(four locations)
Settlers
by ecological zone
Settlers
by market access
Settlers
Natives Settlers Savannah Transition Forest Accessible Remote Total
Cut trees? 56% 41% 68% 38% 44% 45% 56% 50%
How many? 162 87 102 47 229 39 235 130
Planted trees? 72% 14% 32% 14% 31% 33% 17.8% 26%
Tree acreage 2.14 0.49 0.43 0.76 0.81 0.67 0.67 0.67
Native farmers tend to cut more trees on their farmlands, but they also plant more trees. Almost three quarters of the native respondents had planted trees, mostly cashew. Ninety percent of the tree plantations had been established in the ten years prior to the survey. The average size of native farmers’ tree plantations was more than two acres. It would be interesting to find out whether a positive effect of cashew plantations on vegetation cover will be visible in the next round of LANDSAT images.
The survey revealed that settler farmers are much more involved in tree planting than hitherto thought. About a third of the settler farmers in the savannah and forest zones have planted trees on their farms. In the forest zone, tree planting usually involved teak and was part of the land tenure arrangement (taungya), but settlers in the savannah zone have started to establish their own cashew plantations.
Evaluation of survey findings on land use sustainability
The land use survey conducted among settlers and native farmers yielded a number of differences in farm practices, both between settlers and natives and between
95
settlers in different zones. However, the findings do not confirm the common belief that migrants have more detrimental farm practices. Although they have larger farms and plant less trees than natives, migrants’ performance on most other aspects of land use sustainability was better. Settlers cut fewer trees. They make less use of tractors and other capital inputs that are associated with more permanent land cover change. Migrants cultivate more yam, which is associated with fast regeneration of vegetation cover. Integrating legumes into the crop mix, which is an effective soil fertility management strategy, is also more common among settler farmers. Migrants are used to this technique because it is widely practised on the poorer soils of Northern Ghana. Some migrant farmers also maintain their use of physical soil and water conservation measures on their farms in the Brong Ahafo Region. This practice is not common among native farmers.
Important differences were also found between settlers in different ecological zones and between settlers in accessible and remote destination areas. The cultivation practices of migrants in the savannah zone seem to be most sustainable. Their farms were smallest in size, but their crop sales were comparable to migrants in the other areas because they concentrated on the labour-intensive and high-yielding cultivation of yam. About a third of the migrant farmers in the savannah zone had planted trees. None of them used tractor services or chemicals, and the use of inorganic fertiliser was negligible. Moreover, several sustainable farm practices such as inter-cropping, crop rotation and integration of legumes in the crop mix were most commonly used by settlers in the savannah zone. Migrants in the forest and transition zone concentrated mostly on maize as a cash crop, but their farming styles seemed to differ significantly. Maize cultivation in the forest zone, and especially in the remote forest, is practised in a bush fallow system, while more capital-intensive practices are common in the transition zone, especially in the more accessible villages. Dagara migrants in the forest zone removed most trees, but their methods, without the use of tractors, allows for faster regeneration. Settlers in the accessible transition zone seem to be more inclined to adopt the farming style of native farmers. Their farms are smaller and they use more capital inputs, including tractor services, inorganic fertiliser and chemicals. They cut less trees, but their fields probably need more time to regenerate after they are left to fallow.
Two limitations in the data prevent a more thorough analysis of differences in land use sustainability of migrant and indigenes in different zones. Firstly, in an early phase of this study, the research villages were selected with the aim of achieving equal coverage of the three principal ecological zones (savannah, forest, transition) and accessible and remote areas. The large presence of Dagara migrants made this possible while still retaining an acceptable level of randomness in the sampling procedure (see methodology section). The rationale for using this stratified sampling method was to avoid a bias towards particular destination area types.
96
However, within the ecological zones, accessible and remote areas were not equally represented. In the transition zone, for example, twice as many migrants we interviewed lived in accessible villages.
Secondly, and more importantly, much fewer native farmers (73) than settler farmers (204) were interviewed and most of the native farmers (49) lived in more remote localities (see table 4.2 in the methodology section). In the present analysis, whose primary aim was to compare the farming methods of settlers and natives, a distinction was made between all settlers and a sub-group of settlers who lived in the villages where we interviewed native farmers. This made it possible to study differences in farm practices between migrants and natives without risking errors because of ecological fallacy. The information about settlers’ land use in different types of destination areas was retained in the analysis because ecological zone and accessibility appeared to be important determinants of land use. In order to acquire a better grasp of the environmental impact of in-migration it is important to know where migrants settle. The survey findings indicate that there are a number of similarities and differences in land use between settlers and native farmers and between different zones. The findings question the claim of earlier studies that migrants have more detrimental farm practices than native farmers. However, no reliable statements can be made with regard to the explanatory power of migrant status vis-à-vis ecological zone, accessibility and control variables, such as age and gender of the household head, household size, education level and non-farm income.
Conclusion
The aim of this chapter was to study the environmental impact of Dagara migration to the Brong Ahafo Region. Several sources suggest that this impact could be considerably negative. Firstly, LANDSAT images from 1973 and 2003, published by the United Nations Environment Program (UNEP 2008), reveal large-scale land degradation in a prime destination area of Dagara migrants. UNEP identifies population growth and primitive agricultural practices as major causes of deforesta-tion in this region. Secondly, several studies that compare the land use of migrants and native farmers in Ghana’s forest-savannah transition zone conclude that migrants’ farm practices are less sustainable and contribute to deforestation and soil fertility decline. Insecure land tenure is usually identified as a major underlying cause of unsustainable farm practices. Native farmers tend to be portrayed as the ‘heroes’ who conserve and even contribute to tree cover. The picture that emerges is that in-migration contributes to environmental degradation both by increasing the human pressure on natural resources, and by applying less sustainable farm practices. In this chapter, the notion that migration must be an important cause of land degradation – no smoke without fire – is challenged with a variety of data.
97
Firstly, UNEP’s land degradation narrative is challenged by highlighting the seasonality of vegetation cover. The 1973 LANDSAT image, in which the vegetation looks lush, was taken in November, at the end of the rainy season. The 2003 image, in which the area looks more degraded, was taken at the peak of the dry season. Data from a remotely sensed vegetation index (NDVI) is used to show that this makes a considerable difference. In the allegedly degraded area, NDVI values are almost twice as high in November as in January-February. This data also shows that, between 1982 and 2006, the trend in vegetation has not been negative. This could mean that most land degradation took place in the 1970s and early 1980s, that not much degradation has occurred at all, or a combination of the two.
Secondly, census data is used to show that most population growth in the alleg-edly degraded area took place in the 1984-2000 inter-censal period (annual growth rates of over three percent). In the 1970-1984 inter-censal period, annual growth rates were less than one percent. The census data for 1984 does not provide district level in-migration data, but the settlement history of Dagara migrants in the area suggests that most arrived in the last inter-censal period.24 If most degradation took place before the mid 1980s and population growth and in-migration increased sharply after the mid 1980s, other factors must have been at play. It may well be the case that the widespread drought and bush fires that caused havoc in the early 1980s have had a lasting impact. Cocoa plantations in the area were decimated and were never replanted because of increased risk of fire invasion (Afikorah Danquah 1997; Amanor 1993, in Leach & Fairhead 2000). The positive NDVI trend over the 1982-2006 period is probably one of ecosystem recovery despite population growth and in-migration.
Thirdly, in group discussions with both settlers and natives, we inquired about participants’ perceptions of environmental change. In most areas people perceived more negative than positive environmental trends (less rainfall, deforestation and soil fertility decline). Unfortunately, the timing of these changes was not deter-mined. In the local discourse of environmental change, a variety of causes is given for negative trends. Uncontrolled bush fire, caused mainly by hunters, charcoal burners and palm wine tappers, played an important role. Increased pressure on natural resources because of population growth was also mentioned, as was the role of timber logging. When asked specifically about the role of migrant farmers, all but one group said that migration does not play a role except by altering population size. In one locality, migrants were perceived as being more expansive farmers and that they over-cultivate their fields before moving on to a new plot. Besides the group discussions, native farmers were also asked individually whether they perceived any differences in farming methods between themselves and migrant farmers. Many
24 Only 16.4 percent arrived before 1984. Other data also confirms that the Northern Brong Ahafo Region
became a major settlement area for Dagara migrants more recently.
98
differences were mentioned, but native farmers did not perceive migrants as having less sustainable farm practices.
Fourthly, a land use survey was conducted among settlers and native farmers to assess differences in farming methods. Once again substantial differences were found, but migrants’ methods were not found to be less sustainable. They have larger farms and the land tenure system limits their rights to plant trees but they perform better on most other indicators. Migrant farmers tend to have more labour-intensive practices that are associated with faster regeneration of vegetation cover. Native farmers tend to have more capital-intensive practices that cause a more permanent conversion to grassland.
The findings of this study challenge the validity of earlier studies that blame migrants for land degradation in the forest-savannah transition zone. The arrival of migrants from Northwest Ghana may have increased pressure on farmland and vegetation cover, but no evidence was found that their farm practices have a more negative environmental impact than the practices of native farmers. Earlier studies comparing the farm practices of settlers and native farmers were all carried out by academics from Southern Ghana who may be more familiar with land use practices of Southern Ghanaians. My impression is that these studies hold a certain degree of scapegoating of Northerners, which is a known danger in studies dealing with the environmental impact of in-migration.
5 Local perceptions of migration from Northwest Ghana1
Abstract
The Upper West Region in Northern Ghana is a major source area of migrants who travel to Southern Ghana seasonally or for longer periods. This has important implications for the lives and livelihoods of the migrants themselves and their relatives at home. The impact of out-migration on sending areas has almost invariably been studied using ‘Western’ academic parameters. Little is known about how the people themselves value the profound changes that migration causes in their societies. In this article, findings are presented from interviews with 204 rural household heads who were asked to express their opinion about the consequences of seasonal, long-term and return migration. A quantitative approach to qualitative data was adopted to differentiate between collective perceptions and individual opinions. It was found that almost all respondents were positive about the consequences of seasonal labour migration. They applauded its contribution to food security and considered it one of the few ways of gaining access to money and goods. The respondents were much more ambivalent about the consequences of long-term migration and return migration. On the positive side, they emphasised that out-migration reduced the pressure on farmland, and that some migrants attain higher living standards, both for themselves and for their relatives at home. On the negative side, many long-term migrants are not able to improve their livelihood or lose their
1 This chapter has been published as: Van der Geest, K. (2010). Local perceptions of migration from
Northwest Ghana. Africa 80 (4).
100
interest in the home community. The lack of support of some migrants is greatly lamented, especially if they later return empty-handed and become a burden on their relatives at home. The methodology used in this study yielded a holistic view of the consequences of migration on the source area as seen through the eyes of the home community.
Introduction
Sebastian is a 44-year-old farmer and cobbler from Nandom-Goziire in Northwest Ghana. He was born in Southern Ghana where his father worked as a road construction labourer and toilet cleaner. When Sebastian was eight years old, the family returned to the North and Sebastian went to school there. After he dropped out of school at the age of fifteen, he worked with his father on the farm and learnt the trade of cobbling in the dry season. After a few years, he decided to migrate to Southern Ghana ‘to look for money’ to buy better tools and to invest in a workshop for his cobbling business. He worked as a farm labourer for one year and then started his own farm. According to Sebastian, the Brong Ahafo Region was a good destination region. ‘That place is very nice for farming. If you work hard, you can get plenty money.’ During the dry season in the North, Sebastian’s younger brother used to come to help him on the farm. After four years, his brother told him he wanted to settle in the South more permanently. Sebastian had earned quite a lot of money from his crop sales, but his health was troubling him and he decided to return to the North to farm for his parents. His brother took over the farm in the South. Sebastian had made enough savings to buy a bicycle, a sewing machine and other tools and materials for cobbling. Apart from these tangible assets, he had also acquired an important skill during his years in the South. ‘I didn’t learn any new farming techniques that were of much use to me at home, but I learned how to think big, how to farm with money.’
Five of Sebastian’s brothers and his two sisters are presently living in Southern Ghana. They all go home on a regular basis, about once a year, and all support the household in different ways. They send money home and they have financed the construction of some zinc rooms (roofed with corrugated zinc) in the house. Some years ago, they helped Sebastian to buy two bullocks and a plough. ‘Whenever my brothers send money to the house, I make sure I spend it wisely. I want them to be happy when they visit the house and see what I have done with their money. That’s why they continue to support me.’
Simon2 is a 64-year-old farmer from Nandom-Ko in Northwest Ghana. Before Simon married, at the age of twenty-two, he went on seasonal labour migration to the Brong Ahafo Region twice. Soon after his marriage, he left for Southern Ghana
2 I have changed the original name and the village of residence to protect the privacy of this respondent.
101
again but he failed to return when the farming season started at home. He stayed away for seven years without making any visits to, or providing any financial support for, his wife and the daughter he had never seen. It was not easy to reconstruct the events that lead to Simon’s refusal or inability to come home. During our fourth interview, he revealed that he had decided not to return because he was angry with his three brothers who were all working in the goldmines in Southern Ghana. He was the only son who stayed at home to help his father on the farm. The brothers used to support the family, but suddenly they stopped sending money. When Simon visited them in the goldmines and witnessed their lifestyles and their refusal to support, he became angry and frustrated. ‘I was suffering at home, while they were enjoying life in the South, so I also refused to go home for the farming season.’ Simon started to work as a farm labourer in the Brong Ahafo Region. ‘I was just struggling to earn my daily bread. In the second year I wanted to go home, but I couldn’t even earn enough money for the lorry fare back. I was trapped. And it became more and more difficult to return because I felt ashamed to return empty-handed.’
After seven years in the South, Simon’s father traced his whereabouts and helped him to return to the North, to his wife and daughter. Simon returned virtually empty-handed and without having invested in zinc rooms at home, which is a common yardstick of migration success. His migration adventure did not bring about any sustainable improvement in his livelihood. After his return to Nandom, Simon had few other options than to take up his former life as a small-scale hoe farmer.
In the course of the twentieth century, migration has played an increasingly important role in the lives and livelihoods of the Dagara people in Northwest Ghana. Every year, a large proportion of the adult male population travels hundreds of kilometres to Southern Ghana to work as seasonal farm labourers. In their home villages there are few employment opportunities during the dry season (November to May) while in the same period labour demands peak for some crops in Southern Ghana. Apart from this seasonal migration, 26.9 percent of the people born in the Upper West Region (UWR) have settled in Southern Ghana more permanently as farmers, informal sector workers, charcoal burners, civil servants or traders (Ghana Statistical Service 2002).3 Some of them will stay in Southern Ghana and some will eventually return home. These three types of migration – seasonal labour migration, long-term migration and return migration – have important implications for the lives and livelihoods of the migrants as well as for the people who stay behind. As the migration history of Sebastian illustrates, migration can greatly contribute to livelihood security in the migrants’ source area. On the other hand Simon’s case shows that migration can also have very negative effects.
3 See Van der Geest (2009) for more detailed migration patterns and trends, based on census data from
1911, 1921, 1931, 1948, 1960, 1970, 1984 and 2000.
102
In the past thirty to forty years an abundance of research has been conducted, particularly by economists, geographers and sociologists, on the consequences of migration for development in the source areas of migrants.4 These studies show a wide variety of outcomes, depending on location, time, methodology, theoretical perspective, type of migration and definition of development. However, a common feature of this scholarly work is that migration-development linkages have almost invariably been analysed using Western academic parameters. In this article, by contrast, I examine the impact of out-migration through the eyes of people who are directly involved, namely the home community. This includes returned migrants, like Sebastian and Simon, and relatives of current migrants. Their perception of the impacts of migration has largely been ignored in conventional contributions to the migration-development debate.
Contrary to many economists, sociologists and geographers who study migration, most anthropologists base their findings on the experiences and views of migrants or their relatives at home. This has greatly enriched our understanding of decision-making in different cultural contexts. However, the focus in anthropological studies of migration has mostly been on cultural change, social organisation, integration, adaptation, ethnicity and identity (Brettell 2000). The consequences of migration for economic development have received much less attention from anthropologists. Hence the aim of this paper is to contribute to the ongoing debate on migration-development linkages with a somewhat more anthropological approach than most contributions in this field.
Migration and development
As mentioned above, migration-development linkages have been studied extensively during recent decades. Initially, scholarship in this area was heavily coloured by political ideology and adherence to grand theories like neo-classical equilibrium and modernization theory on the one hand, and structuralist and Dependencia theory on the other. This resulted in two opposite camps: migration optimists and migration pessimists (de Haas 2006). The former emphasised the merits of migration as a catalyst of development while the latter stressed that out-migration from peripheral regions perpetuated underdevelopment in these areas. In the past two decades scholars have increasingly bridged this political-ideological divide and have tried to find out under which circumstances out-migration has beneficial and adverse effects. Positive contributions to economic development are usually found when investments of migrant savings and remittances in the area of origin are viable, not too risky, and not hindered by too much bureaucracy. Savings and remittances are
4 For good literature reviews, see Kearney (1986); Appleyard (1989); Skeldon (1997), Nyberg-Sorensen et
al. (2002) and De Haas (2003).
103
more likely to be used for consumption and survival purposes when the conditions for investment in productive activities are less favourable ( Taylor 1999; De Haas 2001; Black and Castaldo 2009). Within one region, however, the impact of migration can vary greatly between households as the case studies of Sebastian and Simon illustrate.
Many empirical studies of migration and development linkages focused on whether remittances were used for ‘conspicuous consumption’ or productive investments. Since the 1990s, insights from the New Economics of Labour Migration (Stark 1991; Taylor 1999) and the popularity of sustainable livelihood frameworks (Carney 1998; Scoones 1998) have caused a shift in thinking about the role of migration in rural people’s lives. New Economics of Labour Migration scholars recognized that the relationship between migration and development is far too complex to be covered by simple consumption-investment dichotomies. For instance, remittances used for consumption purposes can stimulate economic activity in migrant sending areas by rising demand for domestically produced goods and services (Taylor 1999). A nice Ghanaian example is provided by Mazzucato et
al. (2006) who found substantial multiplier effects of remittances used for organising lavish funeral ceremonies. In rural livelihood frameworks, remittances joined agriculture and local non-farm activities as one of the three main sources of livelihood. Migration and remittances are increasingly seen as essential components of people’s economic life. Moreover, in the poorest out-migration regions, the dichotomy between conspicuous consumption and productive investment may not be relevant because most people in these areas cannot afford luxury consumption, and the conditions for productive investments are not favourable. In such regions, the lion’s share of migrant savings and remittances is needed for food and other basic needs or, in other words, for survival.
From a Malthusian point of view, migration from densely populated rural areas is a way of reducing the pressure on the available natural resources, especially farmland (Bilsborrow 1987 and 1992). Dietz et al. (2004) have shown that a very substantial migration flow indeed takes place in West Africa from the poorly endowed interior savannah to the forest belt and more urbanised coastal areas. Population growth optimists would argue that rural out-migration perpetuates unsustainable farm practices as it removes the incentives for investment in agricultural intensification (Tiffen 1995; Dietz et al. 2009). Seasonal migration and remittances from migrant relatives can also be seen as a way to diversify liveli-hoods, to supplement the farm produce in risk-prone and poorly endowed agro-ecological zones (De Haan 1999; Stark 1991; Van der Geest & Dietz 2004). Furthermore, migration can be a means of overcoming capital constraints for investments in economic activities at home (De Haas 2001). Negative economic
104
impacts of migration for the sending areas, emphasized by Dependencia scholars, include the loss of labour and increased dependency ratios (Shresta 1988).
In the 1970s and 1980s, most research on migration and development in Ghana was undertaken by Dependencia scholars with a structural-historical perspective. The peripheral, migrant-sending areas, mainly in Northern Ghana, were seen as ‘labour reservoirs’ for the development of the economic core of Ghana: the Southern regions. The consequences of migration for the areas of origin were found to be predominantly negative (Nabila 1972; Plange 1979; Shepherd 1981; Sutton 1989; Van Hear 1982). Although Dependencia theory has not lost all its relevance for explaining underdevelopment in Northern Ghana, since the 1990s migration in Ghana has been increasingly studied on the basis of an actor-oriented approach and population mobility has been regarded more and more as a prerequisite for development (Abdulai 1996; Addo & Kwegyir 1990; Braimoh 2004; Cour 2001; Eades 1993; Gyasi & Ayivor 1992; Twumasi-Ankrah 1995).
A short history of migration from Northwest Ghana
The inhabitants of the present Upper West Region were already quite mobile in pre-colonial times, but they migrated over shorter distances. They moved in search of fertile land and bountiful hunting grounds, and also to escape from slave raiders (Goody 1967; Lentz 2006). Apart from short-distance migration, there was also a substantial involuntary migration flow to the South consisting of captured slaves that were sold to traders and sent to Ashanti, the Gold Coast and the Americas (Der 1998).
In 1901 the present Northern Ghana was colonized by the British, and in the first decade of the 20th century, colonial officers came to the Northwest to recruit labourers for the mines and for road construction in the South. The working conditions were poor and mortality in the mines was high, but the first groups of labour migrants returned with possessions and stories that enticed others to follow in their footsteps. Within a few decades of the first recruitment campaigns, labour migration to the South had become a very common source of livelihood and even a rite of passage for young men in the area (Lentz 2006).
In the first decades of the 20th century, migration was almost exclusively a young-adult-men-affair. However, during the second half of the 20th century there was a progressive feminization of the North-South migration flow (Abdul-Korah 2006). Three other – but related – trends in the Dagara migration system are worth mentioning. Firstly, migration has become increasingly permanent. The first groups of male migrants moved alone or with friends and worked in the South on relatively short contracts. Although short-term migration is still very common, many migrants now settle in the South with their nuclear families, and their children also grow up
105
there. Secondly, an occupational shift has taken place among the migrants. In the first half of the 20th century, most Dagara in the South were unskilled labourers. The present generation of migrants also include professionals, but nowadays the most common occupation of Dagara migrants is farming. Closely tied to this occupational shift is a change in destination region. Initially, most Dagara migrated to urban settlements in the Ashanti Region and the Western Region. Nowadays, rural areas in the Brong Ahafo Region are the prime destination area. Unlike Northern Ghana the Brong Ahafo Region has two rainy seasons and, unlike most other parts of Southern Ghana, gaining access to land for farming is a relatively easy and cheap process. To sum up it could be argued that, after a sixty to seventy year intermezzo of predominantly rural-urban wage labour migration, the Dagara have increasingly returned to their pre-colonial system of migration in search of fertile land. The difference is that their action radius has expanded to Southern Ghana.
Methodology
In this study, I try to find the middle ground between qualitative and quantitative methods by analysing the answers given by 204 respondents to six open questions about the consequences of migration. The open questions were part of a larger questionnaire dealing with migration and livelihood issues. The research involved a random sample of household heads in eight villages in the vicinity of Nandom Town in the Lawra District of Northwest Ghana. Nearly all respondents were subsistence farmers with low levels of formal education.5 A disadvantage of interviewing household heads was that it introduced a male bias and an age bias to the analysis given that the respondents were predominantly men (89 percent) and their age (51) was far higher than the average of the population in the research area (29). Although wives and other household members were often present during the interviews, the picture would probably have been different had we talked to them separately.
The questionnaire survey was carried out by a team of four enumerators who were young men, all four university graduates, and born and bred in the research area. They had the same ethnic background as the respondents (Dagara) and spoke the same language. The quotes in this article are translations by the enumerators, and the answers to the open questions that I used in my analysis are summaries in English by the same enumerators.
In the first two open questions we asked the respondents to express their opinion about the consequences of seasonal labour migration and long-term migration. Two follow-up questions asked whether – and why – the village would have been ‘better’
5 Sixty-one percent of the respondents had never been to school; thirty-nine percent had only attended
primary school; twenty percent had attended secondary school and one respondent (0.5 percent) had enjoyed tertiary education. On average, the respondents had been to school for two and a half years.
106
now if no such migration had taken place. In connection with long-term migration, we also asked whether and why (or why not) returned migrants in the research area were considered ‘better off’ than non-migrants and people who had only gone on seasonal migration. In a sixth question, we asked the respondents to indicate the items on which, according to them, the money that enters their village through migration was mainly spent. This was the only question with predetermined categories.
For the analysis of the data I used software designed for qualitative data analysis (Kwalitan) to identify clusters of responses about the consequences of migration. After identifying the clusters, I returned to the raw data and assigned codes to the answers. In one answer, the respondent could refer to different consequences of migration. To determine the relative importance of each cluster of responses, I counted the number of respondents that referred to each cluster. In this way I could differentiate between collective perceptions and more individual opinions or less obvious consequences of migration. I occasionally link the findings on migration perception to more quantitative data that result from the same questionnaire survey in the Lawra District of Northwest Ghana.
The distinction between seasonal migration and long-term migration that I used in the questionnaire is based on local concepts that became apparent during a pilot study that I carried out before embarking on the structural data gathering. Group discussions and informal interviews revealed two types of migration to Southern Ghana. The first type involved mostly young men who work as farm labourers in Southern Ghana during the dry season. They return when the cropping season starts in the North. The second type of migration to Southern Ghana involved non-seasonal and longer stays with occasional visits to the relatives at home. Long-term migrants usually have a fixed place of residence and most of them migrate with their nuclear households. A third type of human mobility that is discussed in this paper is return migration. This involves people who have returned to their home areas after having lived outside the area for longer periods, mostly in Southern Ghana. Someone who returns from a seasonal stay in the South is not considered a return migrant here.
Although people in Northwest Ghana clearly distinguish between seasonal and more permanent migration, in practice the concepts can overlap, for instance when a seasonal migrant fails to return after the dry season. The possible overlap between the two types of migration can be problematic in more positivistic research approaches, but it is of no influence for the purpose of this paper. The difference between the two concepts was clear to the people we interviewed and, as we will see below, they have different opinions about the consequences of these two types of migration.
107
Migration propensities
It is important to realise that the ‘home community’ whose perception of migration is discussed in this paper largely consists of people who have their own migration history. The vast majority (83.3 percent) of the 204 interviewed household heads had travelled to Southern Ghana as seasonal labourers. Moreover, many respondents (41.2 percent) were returned migrants who had lived in Southern Ghana non-seasonally. Their average length of stay in the South was nine years. The fact that the ‘home community’ consists of many people who have their own migration history has important implications for the interpretation of the findings. Their perceptions of the consequences of migration are not only based on their interactions with migrant relatives, but also on their own migration experiences. A summary of survey findings relating to migration propensities and remittance behaviour of household members and migrant relatives is included below. These findings underline the pervasiveness of migration from the research area and facilitate a better interpretation of the core findings about perceptions of the consequences of migration.
Seasonal labour migration
In exactly fifty percent of the 204 households surveyed, at least one person had gone on seasonal migration in the twelve months prior to the questionnaire interview. In 28.4 percent of the households, the number of seasonal migrants was between two and five. Seasonal migration was most common in the middle income group.6 The poorest households had relatively few members in the productive age and the wealthier households had more profitable local non-farm activities in the dry season. Seasonal labour migration is an activity engaged in mostly by men. In the age group of 20 to 59, 41.4 percent of the male household members had worked in Southern Ghana in the previous dry season. They mostly migrated to the Brong Ahafo Region (59 percent) and most of them worked as farm labourers (77.6 percent). Among the women in the same age group, migration propensities were much lower: 3.7 percent. On average, seasonal migrants returned with € 37 of savings and in addition most of them brought home goods that are cheaper in Southern Ghana, especially clothes, bicycles, maize, farm tools, furniture and corrugated zinc for roofing. On average, the cash savings of seasonal migrants represent about 15.5 percent of the total cash income7 of their households.
6 In the poorest 67 households, 34 members went on seasonal migration in the previous twelve months. The
figure for the middle group of 66 households was 67. For the group of 67 wealthiest households, the figure was 42. The distribution of wealth groups is based on cash income plus the estimated value of subsistence production.
7 The total cash income was calculated as the sum of crop sales, livestock sales, seasonal migrants’ savings, remittances and the revenues from local non-farm activities.
108
Migrant relatives
The survey data on migrant relatives confirms that the population of the research area is extremely mobile. When we asked the 204 respondents about the residence of their brothers, it turned out that 41.9 percent were living in Southern Ghana. An additional 9.0 percent of the brothers had migrated to a destination within Northern Ghana. The out-migration propensities of the respondents’ sisters were substantially lower than those of the brothers: 19.5 percent were living in Southern Ghana and 11.0 percent had migrated within Northern Ghana. The proportion of sons (24.7 percent) and daughters (19.6 percent) living in Southern Ghana was also substantial, despite the fact that many were children who were still living with their parents. Seven households had first line relatives living in other African countries and none had immediate relatives who had migrated out of Africa.
Almost every household head in the sample (91.2 percent) had at least one sibling or child who had migrated out of the area. On average, they had 3.5 migrant siblings or children, of whom 2.5 were living in Southern Ghana. The majority of these migrants (61.3 percent) had at some point supported the respondent’s household with remittances, either in cash or in kind. In the twelve months prior to the questionnaire interview, 68.0 percent had visited the family house and 42.2 percent had contributed money, goods or foodstuffs with an average total value of € 10 per migrant (this figure excludes remittances to people outside the respondents’ households). In the previous twelve months, 90.2 percent of the households in the sample had received some support from migrant relatives with an average total value of € 38. The average sum of cash remittances was € 18, which amounted to 5.5 percent of the total household cash income. These amounts seem relatively small8 but, as we will see below, these contributions play an important role in people’s evaluation of the consequences of migration.
Perceptions of seasonal migration
In the eyes of farmers in the villages around Nandom Town, seasonal labour migration contributes greatly to livelihood security. Only seven percent of the household heads whose opinion we asked mentioned any negative consequences of seasonal migration, and only eight percent thought that the village would have been ‘better’ if people had not been going to Southern Ghana in the dry season. The positive as well as the negative consequences of seasonal labour migration, as perceived by the respondents, can be subdivided into (i) direct attributes of seasonal
8 In a study by Mazzucato et al. (2008), based on the 1998/99 Ghana Living Standard Survey, households
in the Upper West Region received the lowest amount of remittances while the region has the highest domestic out-migration rate (Ghana Statistical Service 2002). In Southern Ghana, households received much more remittances from abroad.
109
labour migration and (ii) descriptions of what the situation would have been like without seasonal labour migration.
Positive perceptions of seasonal labour migration
‘Seasonal migration enables us to get money and food to supplement the little that we produce here.’ (male, 35, slm, rm9) ‘Seasonal migrants bring back money to assist in farming, to renovate the house, to buy bicycles and to share with their parents.’ (male, 60, slm) ‘Seasonal migrants are able to cater for their personal and household needs; moreover, they come to farm for us.’ (female, 57, nm) ‘Without seasonal migration, there would be no money and this would cause quarrels and theft.’ (male, 47, slm, rm)
The survey revealed that food security has a very central position in the respon-dents’ perception of seasonal labour migration. They mentioned food-related consequences 175 times (see figures between parentheses below for a breakdown). Seasonal migration contributes to food security in five different ways: firstly, seasonal labour migrants bring home food from Southern Ghana (30); secondly, they bring home money to buy food (48); thirdly, they contribute their labour to domestic food production (9) while their seasonal absence reduces the pressure on the food stock because they do not eat at home10 (11); fourthly, without seasonal migrant income, the lack of money for daily cash needs would compel people to sell food after the harvest and go hungry in the lean season (6); and fifthly, seasonal migration is an important coping strategy for gaining access to food in drought years (3). This leads people to hypothesize that without seasonal migration there would be food shortage and hunger (45). These responses indicate that many farmers in the research area perceive their environment as one in which food and livelihood security cannot be attained by farming alone and in which seasonal migration is a necessary way to supplement what is produced at home (23).
The money that seasonal migrants earn is not only used to buy food but also to purchase durable goods (mentioned 76 times), to invest in housing (45) and productive activities (33) and to pay hospital bills (15) and school fees (13). Four respondents also mentioned that seasonal migrants use their savings for bride wealth payments. The purchase of durable goods mostly concerned basic items like clothes, bicycles, furniture and cassette-players. Investments in farming (27) were mentioned more frequently than investments in non-farm activities (6). Agricultural invest-ments concerned labour parties, simple farm tools like hoe blades and the purchase of livestock. Although investment in non-farm activities was mentioned only six times, the indirect positive impact of seasonal labour migration on non-farm
9 In the quotes, ‘slm’ refers to seasonal labour migrant (past or present); ‘rm’ means returned long-term
migrant; and ‘nm’ refers to a person who has never engaged in seasonal or more permanent migration. The number in the quotes represents the age of the respondent.
10 In the Sahel, this is a well-documented phenomenon. In Northern Nigeria for example seasonal migration is referred to as ‘cin rani’ which literally means ‘to eat away the dry season’ (Swindell 1984; Rain 1999).
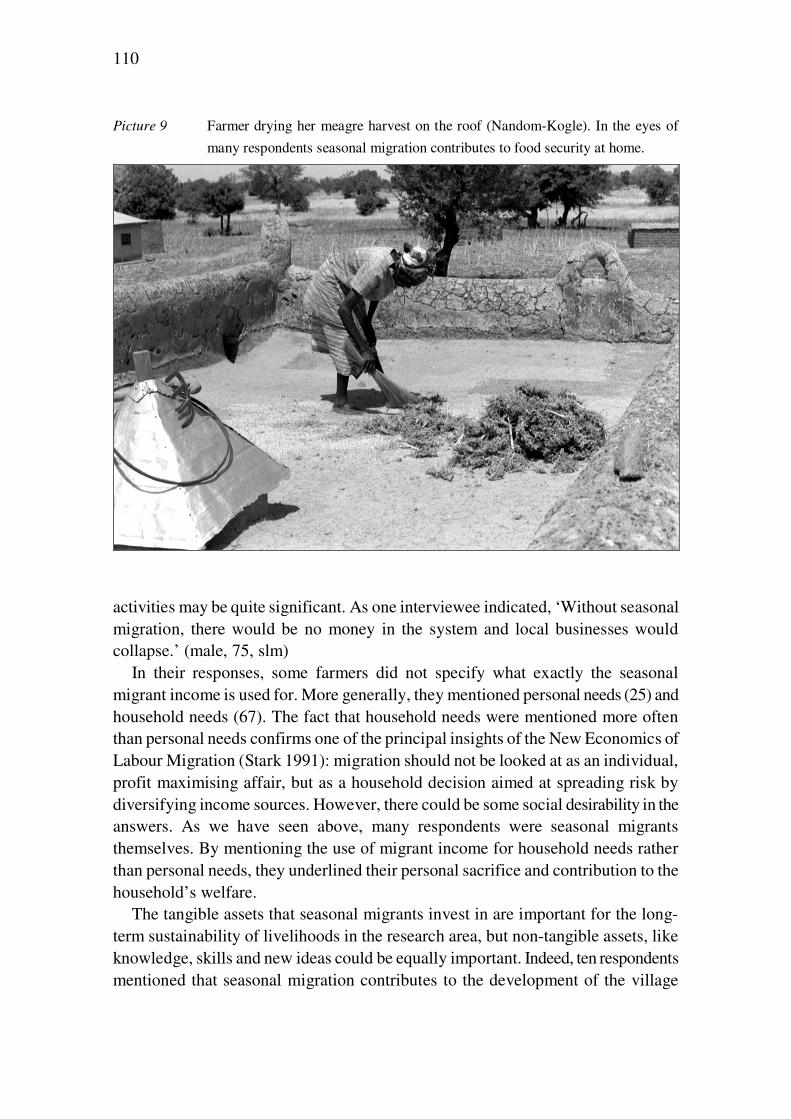
110
Picture 9 Farmer drying her meagre harvest on the roof (Nandom-Kogle). In the eyes of
many respondents seasonal migration contributes to food security at home.
activities may be quite significant. As one interviewee indicated, ‘Without seasonal migration, there would be no money in the system and local businesses would collapse.’ (male, 75, slm)
In their responses, some farmers did not specify what exactly the seasonal migrant income is used for. More generally, they mentioned personal needs (25) and household needs (67). The fact that household needs were mentioned more often than personal needs confirms one of the principal insights of the New Economics of Labour Migration (Stark 1991): migration should not be looked at as an individual, profit maximising affair, but as a household decision aimed at spreading risk by diversifying income sources. However, there could be some social desirability in the answers. As we have seen above, many respondents were seasonal migrants themselves. By mentioning the use of migrant income for household needs rather than personal needs, they underlined their personal sacrifice and contribution to the household’s welfare.
The tangible assets that seasonal migrants invest in are important for the long-term sustainability of livelihoods in the research area, but non-tangible assets, like knowledge, skills and new ideas could be equally important. Indeed, ten respondents mentioned that seasonal migration contributes to the development of the village
111
because migrants return home with new ideas and knowledge that can generate innovations.
Some of the interviewees predict that without seasonal labour migration, there would be unemployment (42), idleness (21), a lack of money to meet daily cash needs (32) and massive poverty (46), which in turn would result in stealing (55), quarrels, violence (30) and ‘social vices’ like teenage pregnancy and rape (7).11 The household heads in the research area feel that the option to go on seasonal migration prevents the young men from looking for unlawful ways of meeting their increased cash needs.
The analysis of positive perceptions of seasonal migration revealed that people particularly appreciate its contribution to food security. For many people in the research area seasonal migration is a central element in their overall survival strategy. However, as we have seen in the previous paragraphs, seasonal migrant earnings are also used for accumulation: to buy durable goods, to invest in housing and to invest in economic activities. Respondents who mentioned only accumulation clusters were significantly wealthier than those who only referred to seasonal migration as a means of supplementing food supplies.12 For the poorer sections of the population, seasonal migration is mainly a survival strategy. They have to use part of the income from seasonal migration to buy food. Better off farm households can meet their food needs with the produce from their own fields. They are more likely to use seasonal migrant savings for investments and non-food consumption.
Negative perceptions of seasonal labour migration
‘Seasonal migration makes people become weak early and some come home empty-handed.’ (male, 22, slm) ‘Without seasonal migration, there would not have been strange diseases like HIV/AIDS that are killing us now.’ (female, 52, rm)
Only a few respondents held negative opinions about seasonal labour migration, but their reasoning revealed a wide range of aspects of seasonal migration that are perceived to be detrimental to the social and economic development of the research area. Firstly, there are negative health implications. Due to the physically demand-ing nature of agricultural labour and poor accommodation in the rural destination areas, some seasonal labour migrants become weak, get ill or even die in Southern Ghana (mentioned 7 times). Another negative health aspect is the spread of HIV/AIDS that is associated with seasonal migration (6). Many unmarried young men have their first sexual experience in Southern Ghana, away from parental 11 Conversely, migration – or the absence of the husband – can also cause social problems. See Lobnibe
(2005) for an interesting anthropological account of adultery involving the wife of a migrant with her ‘classificatory brother’.
12 The households of respondents who only mentioned accumulation clusters (N=45) had an annual cash income of €59.38 per capita and an annual income including subsistence production of € 100.73 per capita. The households of respondents who only mentioned food security (N=51) had an annual cash income of €35.70 per capita and an annual income including subsistence production of € 72.59 per capita.
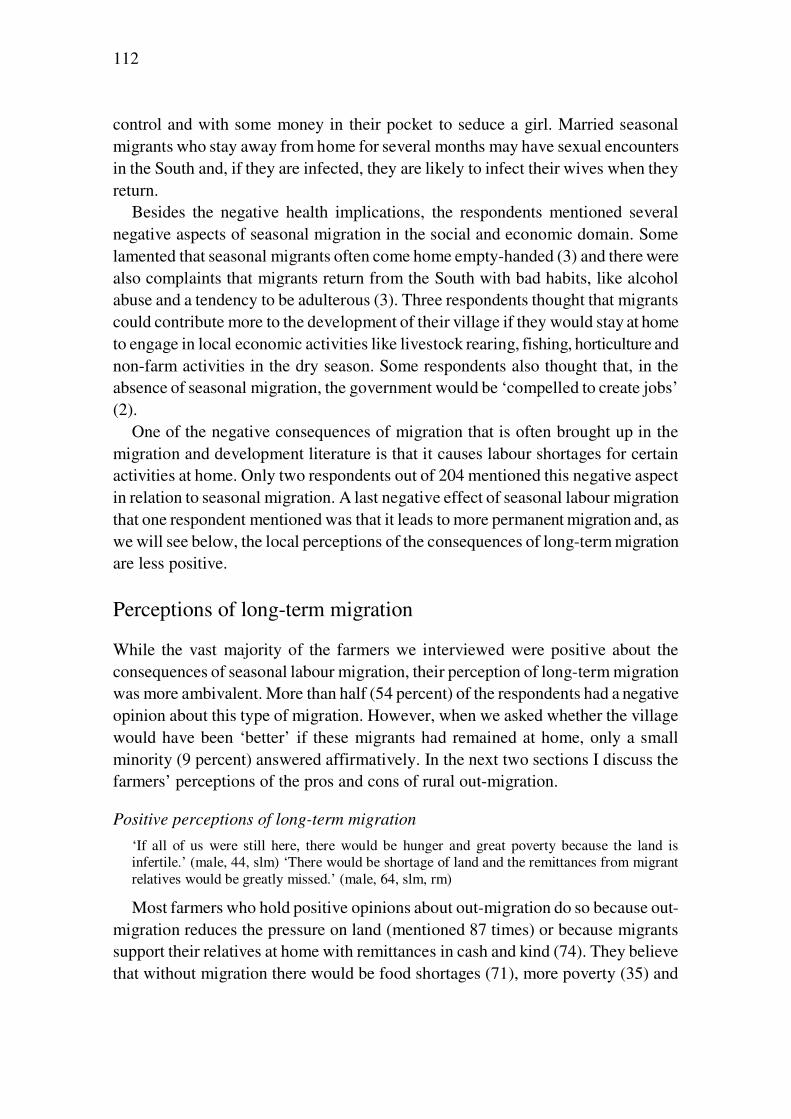
112
control and with some money in their pocket to seduce a girl. Married seasonal migrants who stay away from home for several months may have sexual encounters in the South and, if they are infected, they are likely to infect their wives when they return.
Besides the negative health implications, the respondents mentioned several negative aspects of seasonal migration in the social and economic domain. Some lamented that seasonal migrants often come home empty-handed (3) and there were also complaints that migrants return from the South with bad habits, like alcohol abuse and a tendency to be adulterous (3). Three respondents thought that migrants could contribute more to the development of their village if they would stay at home to engage in local economic activities like livestock rearing, fishing, horticulture and non-farm activities in the dry season. Some respondents also thought that, in the absence of seasonal migration, the government would be ‘compelled to create jobs’ (2).
One of the negative consequences of migration that is often brought up in the migration and development literature is that it causes labour shortages for certain activities at home. Only two respondents out of 204 mentioned this negative aspect in relation to seasonal migration. A last negative effect of seasonal labour migration that one respondent mentioned was that it leads to more permanent migration and, as we will see below, the local perceptions of the consequences of long-term migration are less positive.
Perceptions of long-term migration
While the vast majority of the farmers we interviewed were positive about the consequences of seasonal labour migration, their perception of long-term migration was more ambivalent. More than half (54 percent) of the respondents had a negative opinion about this type of migration. However, when we asked whether the village would have been ‘better’ if these migrants had remained at home, only a small minority (9 percent) answered affirmatively. In the next two sections I discuss the farmers’ perceptions of the pros and cons of rural out-migration.
Positive perceptions of long-term migration
‘If all of us were still here, there would be hunger and great poverty because the land is infertile.’ (male, 44, slm) ‘There would be shortage of land and the remittances from migrant relatives would be greatly missed.’ (male, 64, slm, rm)
Most farmers who hold positive opinions about out-migration do so because out-migration reduces the pressure on land (mentioned 87 times) or because migrants support their relatives at home with remittances in cash and kind (74). They believe that without migration there would be food shortages (71), more poverty (35) and
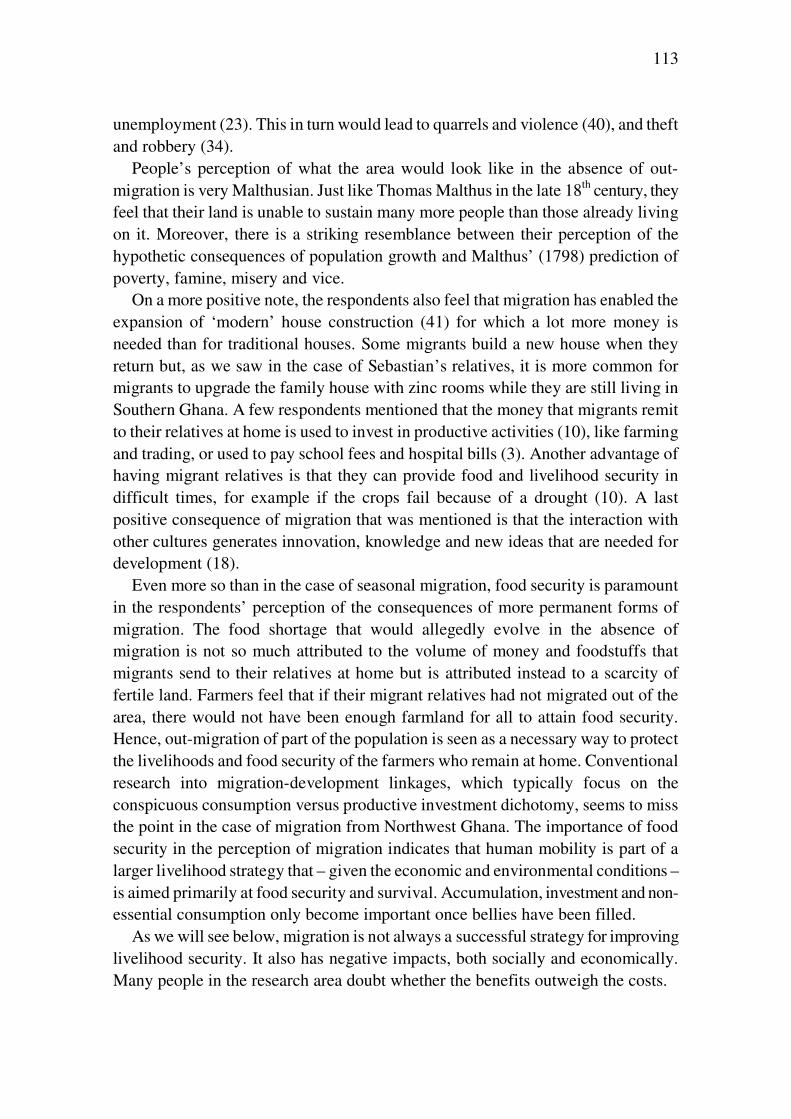
113
unemployment (23). This in turn would lead to quarrels and violence (40), and theft and robbery (34).
People’s perception of what the area would look like in the absence of out-migration is very Malthusian. Just like Thomas Malthus in the late 18th century, they feel that their land is unable to sustain many more people than those already living on it. Moreover, there is a striking resemblance between their perception of the hypothetic consequences of population growth and Malthus’ (1798) prediction of poverty, famine, misery and vice.
On a more positive note, the respondents also feel that migration has enabled the expansion of ‘modern’ house construction (41) for which a lot more money is needed than for traditional houses. Some migrants build a new house when they return but, as we saw in the case of Sebastian’s relatives, it is more common for migrants to upgrade the family house with zinc rooms while they are still living in Southern Ghana. A few respondents mentioned that the money that migrants remit to their relatives at home is used to invest in productive activities (10), like farming and trading, or used to pay school fees and hospital bills (3). Another advantage of having migrant relatives is that they can provide food and livelihood security in difficult times, for example if the crops fail because of a drought (10). A last positive consequence of migration that was mentioned is that the interaction with other cultures generates innovation, knowledge and new ideas that are needed for development (18).
Even more so than in the case of seasonal migration, food security is paramount in the respondents’ perception of the consequences of more permanent forms of migration. The food shortage that would allegedly evolve in the absence of migration is not so much attributed to the volume of money and foodstuffs that migrants send to their relatives at home but is attributed instead to a scarcity of fertile land. Farmers feel that if their migrant relatives had not migrated out of the area, there would not have been enough farmland for all to attain food security. Hence, out-migration of part of the population is seen as a necessary way to protect the livelihoods and food security of the farmers who remain at home. Conventional research into migration-development linkages, which typically focus on the conspicuous consumption versus productive investment dichotomy, seems to miss the point in the case of migration from Northwest Ghana. The importance of food security in the perception of migration indicates that human mobility is part of a larger livelihood strategy that – given the economic and environmental conditions – is aimed primarily at food security and survival. Accumulation, investment and non-essential consumption only become important once bellies have been filled.
As we will see below, migration is not always a successful strategy for improving livelihood security. It also has negative impacts, both socially and economically. Many people in the research area doubt whether the benefits outweigh the costs.
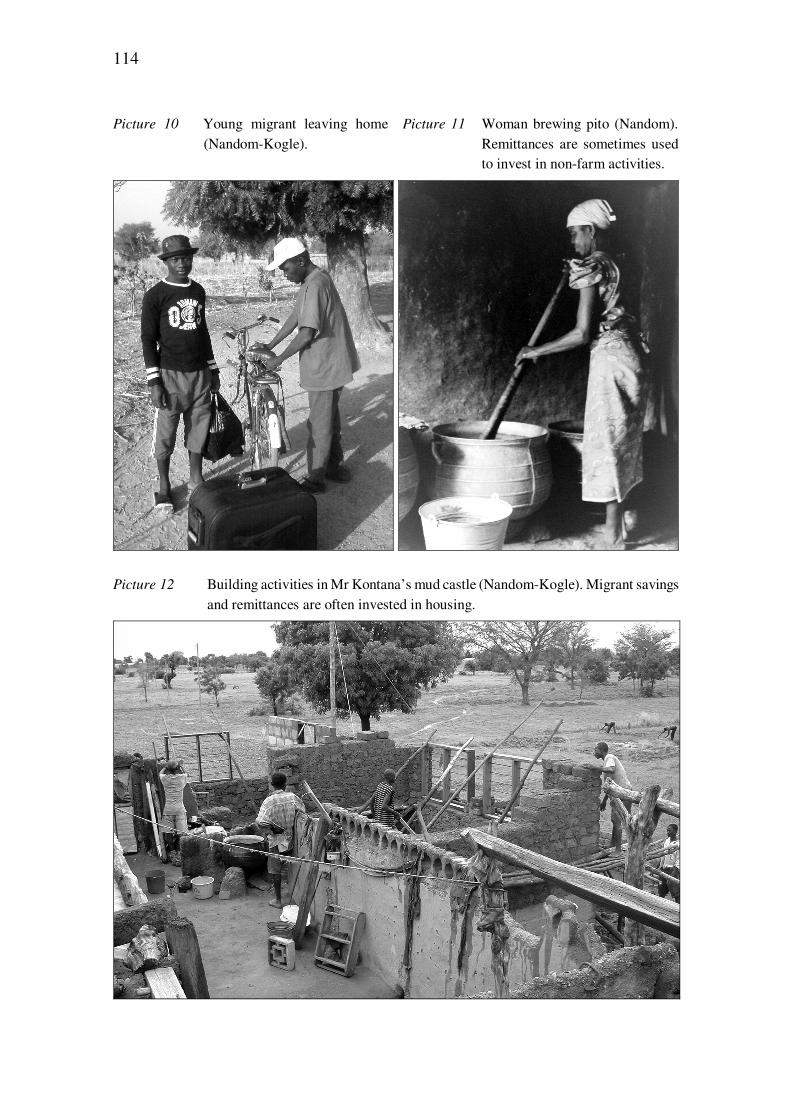
114
Picture 10 Young migrant leaving home (Nandom-Kogle).
Picture 11 Woman brewing pito (Nandom). Remittances are sometimes used to invest in non-farm activities.
Picture 12 Building activities in Mr Kontana’s mud castle (Nandom-Kogle). Migrant savings and remittances are often invested in housing.
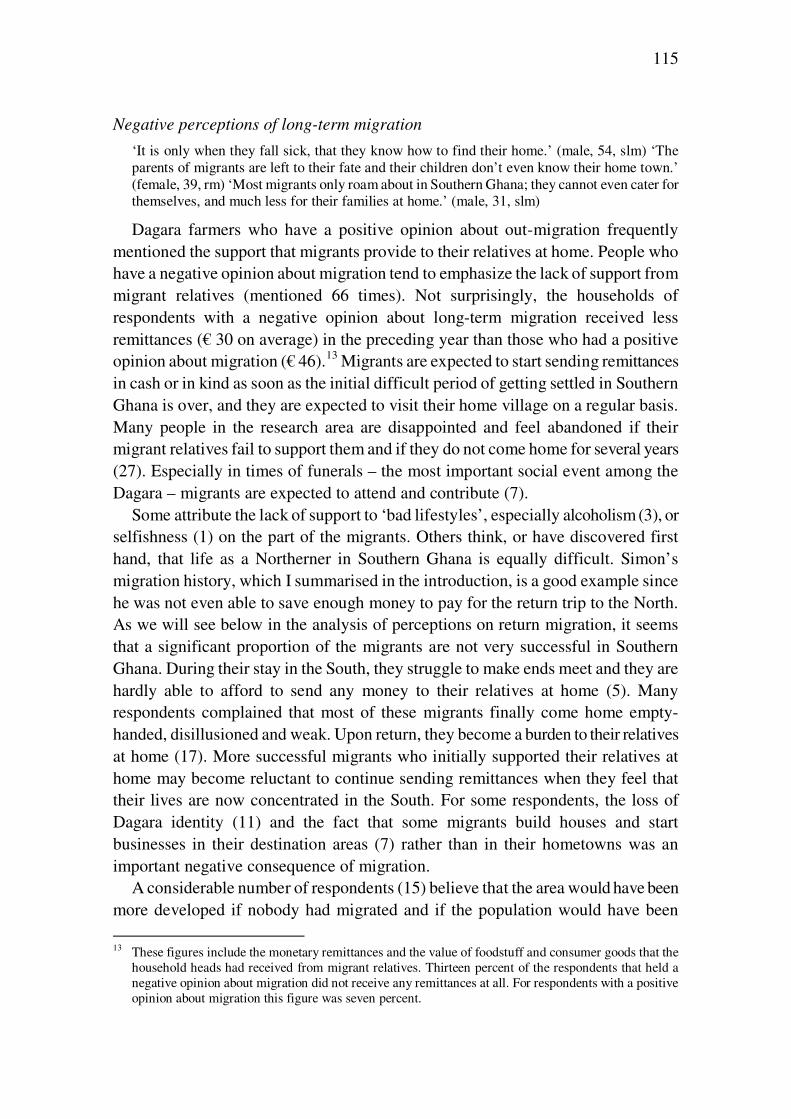
115
Negative perceptions of long-term migration
‘It is only when they fall sick, that they know how to find their home.’ (male, 54, slm) ‘The parents of migrants are left to their fate and their children don’t even know their home town.’ (female, 39, rm) ‘Most migrants only roam about in Southern Ghana; they cannot even cater for themselves, and much less for their families at home.’ (male, 31, slm)
Dagara farmers who have a positive opinion about out-migration frequently mentioned the support that migrants provide to their relatives at home. People who have a negative opinion about migration tend to emphasize the lack of support from migrant relatives (mentioned 66 times). Not surprisingly, the households of respondents with a negative opinion about long-term migration received less remittances (€ 30 on average) in the preceding year than those who had a positive opinion about migration (€ 46).13 Migrants are expected to start sending remittances in cash or in kind as soon as the initial difficult period of getting settled in Southern Ghana is over, and they are expected to visit their home village on a regular basis. Many people in the research area are disappointed and feel abandoned if their migrant relatives fail to support them and if they do not come home for several years (27). Especially in times of funerals – the most important social event among the Dagara – migrants are expected to attend and contribute (7).
Some attribute the lack of support to ‘bad lifestyles’, especially alcoholism (3), or selfishness (1) on the part of the migrants. Others think, or have discovered first hand, that life as a Northerner in Southern Ghana is equally difficult. Simon’s migration history, which I summarised in the introduction, is a good example since he was not even able to save enough money to pay for the return trip to the North. As we will see below in the analysis of perceptions on return migration, it seems that a significant proportion of the migrants are not very successful in Southern Ghana. During their stay in the South, they struggle to make ends meet and they are hardly able to afford to send any money to their relatives at home (5). Many respondents complained that most of these migrants finally come home empty-handed, disillusioned and weak. Upon return, they become a burden to their relatives at home (17). More successful migrants who initially supported their relatives at home may become reluctant to continue sending remittances when they feel that their lives are now concentrated in the South. For some respondents, the loss of Dagara identity (11) and the fact that some migrants build houses and start businesses in their destination areas (7) rather than in their hometowns was an important negative consequence of migration.
A considerable number of respondents (15) believe that the area would have been more developed if nobody had migrated and if the population would have been
13 These figures include the monetary remittances and the value of foodstuff and consumer goods that the
household heads had received from migrant relatives. Thirteen percent of the respondents that held a negative opinion about migration did not receive any remittances at all. For respondents with a positive opinion about migration this figure was seven percent.
116
larger. Instead of emphasizing pressure on natural resources, like those who favour out-migration, they think that migrants can contribute more to the development of the area by staying put. However, they did not reason in a Boserupian way, saying that more population pressure would lead to agricultural intensification (Boserup 1965). Instead, they thought that migrants could contribute to the development of the area by dedicating themselves to non-agricultural economic activities like carpentry, masonry and trading. Some argued that the area would have been more developed with a larger population because, especially after the decentralization of the 1990s, the distribution of many government services depends on the number of inhabitants (3).
Migration is a selective phenomenon: people usually migrate during the produc-tive period of their lives. The cost of bringing up children and caring for the elderly falls on the home region. In other words, migration leads to higher dependency ratios in the area of origin. It may therefore be surprising that only one respondent mentioned ‘loss of labour’ as a negative consequence of out-migration. In the case of the Dagara in Lawra District, people who migrate for longer periods usually do so with their wives and children. Consequently, long-term migration does alter population size, but its influence on population composition and dependency ratios is limited to old age dependency. As we saw in the migration history of Sebastian, parents are usually left in the care of a non-migrant brother. However, a lot of respondents (28) complained that the elderly are neglected and not properly cared for because of out-migration.14
A last negative aspect of long-term migration, mentioned by eleven respondents, is that migrants’ funerals are brought home, in other words, many of them do not return. One could wonder what is worse: coming back to be a burden to one’s relatives or never coming back at all. Probably these respondents especially lamented the fact that many of the more successful migrants, who could potentially contribute their savings and knowledge to development in the area, preferred to stay in the South. In the next section, I focus on the situation of the migrants who did return.
Perceptions of return migration
‘Most returnees come home with nothing and have to depend on those at home.’ (male, 33, slm) ‘Only returnees who have been in formal employment and get a pension are better off.’ (male, 68, slm) ‘Only those who build houses and invest prior to return are better off.’ (male, 75, slm) ‘Only those who plan carefully and are able to manage their resources well are better off.’ (male, 57, slm, rm)
14 This is partly confirmed in a Southern Ghanaian case study about care for the elderly. Migrants are not
around to look after their parents, but they often organise reasonably good care from a distance (Van der Geest 2002).
117
To explore local perceptions of return migration, we asked the respondents whether and why, in their opinion, returnees were usually ‘better off’ than people who had never migrated to Southern Ghana or people who had only migrated on a seasonal basis. No specific wealth criteria were given. The respondents used their own criteria for wealth and poverty, some of which clearly became apparent in the answers to the open question.
Many migration studies report that returnees are wealthier than non-migrants and that migration increases inequality (Barham & Boucher 1998; De Haas 2001; Lipton 1980). This is especially the case when there are large wage differentials between the areas of origin and destination. In the case of Nandom, return migration does not seem to cause inequality. In the eyes of 74 percent of the respondents, returnees are usually not wealthier than non-migrants. In the sample of farmers that we interviewed, 42 percent were returned migrants themselves, and 25 percent had stayed in Southern Ghana for more than five years. In this last category of respondents an even higher percentage (80) thought that returned migrants were not wealthier than non-migrants. According to fifty respondents, most migrants return empty-handed and fourteen added that many of them only return when they are sick, old and weak. Following Cerase’s (1974) typology of returnees, according to these respondents, most belong to the category of migration failure.15 So it seems that Simon’s sad migration history is not an exception. When he returned from the South, he had few other options than to work the land just the way he did before he left.
Due to better economic and agro-ecological conditions in Southern Ghana, migration usually involves a significant improvement in income and food security, but long-term benefits from migration after return requires careful planning and resource management, as eleven respondents also indicated. It seems that only a minority of the return migrants succeeds in doing that.
Long-term migrants face numerous problems when they return. In their re-sponses, interviewees expressed some bitterness about the behaviour of these returnees. Migrants who prepare properly for their return to Northern Ghana and Dagara society by building a house and by investing in animal traction or non-farm activities are well-respected citizens. However, in the view of most farmers we interviewed they are the exception rather than the rule. As mentioned above, most migrants return without any significant possessions (50) and they often have to
15 In Cerase’s typology, ‘return of failure’ involves those migrants who stayed away just a few years and
who failed to “get lanched in the new society (..) and to live up to their expectations of the advantages to be derived from emigration.” (Cerase 1974: 254). I agree with Black (1993) that the pejorative nature of the term ‘migration failure’ does not necessarily reflect migrants’ own perceptions of their migration experience. It should also be noted that the period spent away from home is not necessarily an adequate yardstick for migration success or failure though perhaps more so in the case of Italian migration to the United States on which Cerase based his typology.
118
depend on their relatives at home for food (54) and shelter (20). Frustration about their migration failure and forced return sometimes causes severe behavioural problems (11). Some respondents said that those migrants that return with some possessions or money in the pocket become just as poor as the others because they spend their money carelessly (8). In the South they were used to having more cash at hand, and when they return to the North, they find it difficult to adjust to a new situation of poverty (7).
Most of the reasons that respondents mentioned to explain why return migrants are not better off have to do with poor management on the part of the migrants. Some respondents, however, mentioned an advantage that non-migrants have vis-à-vis return migrants: access to fertile land (7). This depends on the situation in which migrants return. In many cases, they come home when their father or only resident brother dies. In such instances, access to land is not a major problem. In other situations, when the returned migrant has brothers who farm in the village, he is likely to have restricted access to the more fertile portions of the family land. This is also dependent on the migrant’s remittance behaviour. If he has always supported his relatives, they are less likely to deny him access to fertile land. Another difficulty for return migrants is that, despite the low external input character of the farming system (Van der Geest 2004), they initially lack some basic resources to cultivate, like tools, seeds and manure. For farmers in the research area, livestock is an important asset that provides livelihood security and access to money for consumption or investments. It may take some years before returned migrants are able to build up a herd size that equals the livestock of non-migrants (19).
A minority of the respondents (26 percent) thought that return migrants were usually wealthier than non-migrants. In their perception, most migrants build a modern house before they return (mentioned 28 times), and they usually return with possessions that are beyond the reach of most non-migrants (12). More generally, twelve respondents thought that migrants prepare their return very well by investing (unspecified) in the home area. Seven respondents stated that migrants invest in non-farm activities, such as grinding mills and trade. Another reason for return migrants to be better off, as mentioned by six respondents, is that many of them receive pension payments, especially those who have worked in the mines and as civil servants in the South.
According to this minority of respondents the effect of these well-planned returns is that return migrants usually have more money (8), are able to cater for their household needs and even support others who are in need (6), and have no problem paying school fees and hospital bills (2). None of the respondents stated that return migrants have an advantage because of the skills they acquired during their time in Southern Ghana. In the eyes of some respondents migration rather involves a loss of
119
skills that are necessary for survival in Northern Ghana (10).16 Their long absence makes it difficult for migrants to reintegrate into Dagara society in a satisfactory way as they are no longer used to the harsh conditions that prevail in the North of Ghana (26).
The view of most respondents – that returned migrants are not wealthier than non-migrants – is confirmed by my survey data on income sources, expenditure and properties. The aggregated living standards of the two groups were very similar. The total household income of returned migrants was a bit lower than that of non-migrants, but their per capita income was slightly higher because they had smaller households.
In the next section, I briefly look at how, according to the interviewees, the money flowing into the region through migration is mostly used.
Use of savings and remittances
One of the positive consequences of migration is that it generates savings and remittances. In the open questions about seasonal migration and long-term migration, some respondents already mentioned specific purposes for which migrants’ money is used. After the open questions, we asked the respondents how most of the money that is brought in by seasonal migrants and long-term migrants is spent. This was not an open question as there were eight predetermined categories (see table 5.1). Each respondent was able to mention three categories of remittance use.
As one might expect after reading the earlier sections, the majority of the respon-dents mentioned purchase of food. Interestingly, a lot more people mentioned hospital bills than school fees. Although the people in my survey sample spent slightly more on education (€16 per household per year) than on healthcare (€ 14), it may be easier for them to pay school fees with their own resources because they know in advance when and how much they have to pay. At the time of the fieldwork for this research this was not the case for healthcare expenditure. When people in the research area were unable to pay a hospital bill, many of them would call on a migrant relative for assistance. In that sense, migration could be seen as an insurance strategy. Recently, the government’s National Health Insurance Scheme, for which people pay a fixed annual amount, was introduced quite successfully into the research area. Informal discussions during my last field trip in March 2009 revealed that migrants often pay the fees for their relatives at home, but this needs further investigation.
16 In an early review of the literature on return migration King (1986) already made mention of the
phenomena of ‘downward occupational mobility’ and ‘loss of skills’.
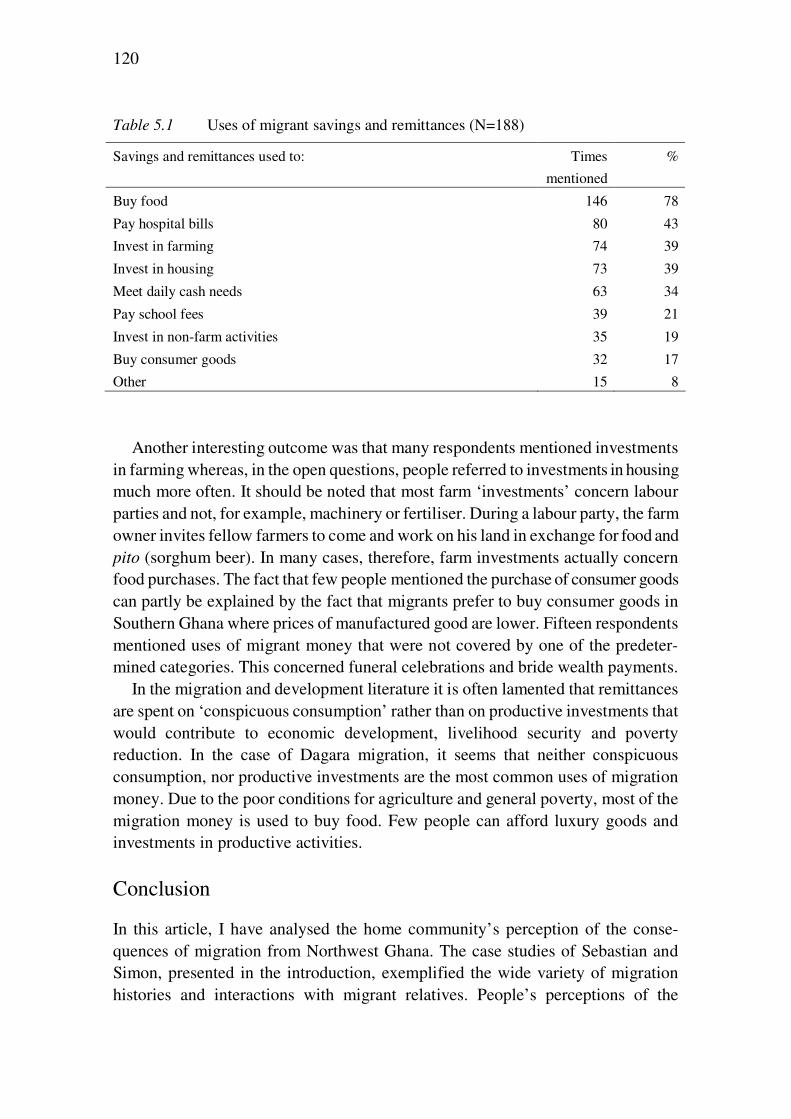
120
Table 5.1 Uses of migrant savings and remittances (N=188)
Savings and remittances used to: Times
mentioned
%
Buy food 146 78
Pay hospital bills 80 43
Invest in farming 74 39
Invest in housing 73 39
Meet daily cash needs 63 34
Pay school fees 39 21
Invest in non-farm activities 35 19
Buy consumer goods 32 17
Other 15 8
Another interesting outcome was that many respondents mentioned investments in farming whereas, in the open questions, people referred to investments in housing much more often. It should be noted that most farm ‘investments’ concern labour parties and not, for example, machinery or fertiliser. During a labour party, the farm owner invites fellow farmers to come and work on his land in exchange for food and pito (sorghum beer). In many cases, therefore, farm investments actually concern food purchases. The fact that few people mentioned the purchase of consumer goods can partly be explained by the fact that migrants prefer to buy consumer goods in Southern Ghana where prices of manufactured good are lower. Fifteen respondents mentioned uses of migrant money that were not covered by one of the predeter-mined categories. This concerned funeral celebrations and bride wealth payments.
In the migration and development literature it is often lamented that remittances are spent on ‘conspicuous consumption’ rather than on productive investments that would contribute to economic development, livelihood security and poverty reduction. In the case of Dagara migration, it seems that neither conspicuous consumption, nor productive investments are the most common uses of migration money. Due to the poor conditions for agriculture and general poverty, most of the migration money is used to buy food. Few people can afford luxury goods and investments in productive activities.
Conclusion
In this article, I have analysed the home community’s perception of the conse-quences of migration from Northwest Ghana. The case studies of Sebastian and Simon, presented in the introduction, exemplified the wide variety of migration histories and interactions with migrant relatives. People’s perceptions of the
121
consequences of migration are based, to a large extent, on their own experiences. Therefore it is not surprising that the 204 respondents had many different opinions about the impact of migration. Despite these divergent views, some clear patterns could be identified.
The analysis shows that it is important to distinguish between different types of mobility. While the respondents were overwhelmingly positive about seasonal labour migration, they were much more critical about long-term migration, and most of them thought that returned migrants were not wealthier than non-migrants. The positive evaluation of seasonal migration can be understood as follows: seasonal migrants contribute their labour at home in the farming season, their departure reduces the pressure on available food stocks, and they come home with food and money that supplement home production. Many respondents considered long-term migration to be less beneficial. They lamented the lack of support from migrant relatives. Some migrants are barely able to make ends meet in the South and others have lost interest in their home community. Despite their ambivalent opinion about the remittance behaviour of migrants, most respondents do regard out-migration as a necessity. They argue in a Malthusian way that without migration there would be scarcity of fertile land for farming, and this would lead to hunger and conflicts.
Besides the differences between seasonal and long-term migration, there are also similarities. Firstly, many respondents think that the absence of seasonal as well as more permanent migration would worsen the food situation and create more poverty, which in turn would lead to disputes and theft. Secondly, both forms of migration have contributed to the expansion of ‘modern’ zinc houses. Thirdly, travelling to Southern Ghana – whether seasonally or more permanently – exposes people to new ideas, which can have a positive effect on development. Fourthly, for both seasonal and long-term migration a similar (low) proportion of the respondents mentioned that remittances were invested in farming and non-farm activities.
Two negative impacts of migration for source areas, emphasized by Dependencia scholars, concern loss of labour and increased dependency ratios. Only two respondents mentioned ‘loss of labour’ as a consequence of seasonal migration in the open question. The dry season is generally seen as a slack period in which few productive activities take place. The impact of more permanent migration on dependency ratios turned out to be limited to old age dependency because nowadays long-term migrants usually settle in Southern Ghana with their wives and children. The respondents did indicate that migrants’ ageing parents are sometimes ‘left to their fate’.
The method used for this paper – open questions in a survey that was admin-istered among 204 rural households – has resulted in an analysis that does not have the depth of much anthropological, qualitative research because each respondent could only express a few very concise opinions about the consequences of different
122
types of migration. However, the advantage of interviewing a large group of people was that I could determine whether the answer of each respondent involved a collective perception or an individual opinion. In most qualitative research, when a limited number of people are interviewed, an exceptional opinion can easily be understood and presented as a common view. An advantage of the methodology vis-à-vis more quantitative work by economists, sociologists and geographers is that it yielded a very holistic view of the consequences of migration seen through the eyes of the people whom it really concerns.
A significant limitation of this study was the male bias in the analysis. Nine out of ten household heads were men, and I expect the opinion of women, especially about the male-dominated seasonal migration, to differ from that of men. Most women would have agreed with the positive contribution of seasonal migration to food security, but I believe that they would also have emphasized more negative social aspects and they would have complained more about labour shortages for certain dry season activities. Besides the male bias, the fact that four out of five respondents had ever engaged in seasonal migration may also have influenced the positive perception of this type of migration. Negative statements about the impact of seasonal migration on development would amount to blaming oneself for poverty and underdevelopment in the area. Indeed, respondents who had never gone to Southern Ghana for seasonal labour were three times more likely (18 versus 6 percent) to have negative opinions about seasonal migration than people with a seasonal migration history.
Despite its limitations, this study clearly shows that people in Northwest Ghana view migration as an essential part of their diverse livelihood. The majority argue that poverty levels and food shortages would be more severe without migration. I want to be careful not to draw too optimistic a conclusion from these findings. The key importance of food security in the perception of migration confirms the view of Dependencia scholars that migration from peripheral regions keeps the sending areas in a state of underdevelopment. In their seminal study of migration in neighbouring Burkina Faso, Cordell et al. (1996) concluded that migration “is geared to survival rather than accumulation and development” and that it has contributed to “structural underdevelopment and massive poverty” in the source areas of migrants. My findings on local perceptions of migration in Northwest Ghana confirm the importance of migration as a survival strategy, but the people whose perceptions I have studied do not go so far as to conclude that migration has caused poverty and underdevelopment.
6 The Malthus-Boserup curve and migration in Northern Ghana1
Abstract
The impact of rural out-migration on agricultural development in migrants’ source areas has been studied extensively, but with very mixed results. A common problem in these studies is reverse causality. This paper highlights the role of population density as a mediator in the relation between rural out-migration and agricultural development. It links the academic field of migration and development to the Malthus-Boserup debate about population growth and agricultural change. The central thesis is that one has to know where a region is situated in the transition to more intensive land use to understand the impact of out-migration on agricultural development. Once the intervening role of population density has been acknowl-edged, more cogent statements can be made with regard to directions of causality. Demographic and agricultural production data of twenty-four districts in Northern Ghana are used to illustrate this. A U-shaped ‘Malthus-Boserup curve’ between population density and agricultural productivity is discernible in Northern Ghana. A negative correlation between crop yields and out-migration is found in the twenty districts situated in the first half of the curve, where Malthusian tendencies dominate. After controlling for the effect of population density it is shown that low crop yields are a cause and not a consequence of migration. Furthermore, there is a positive effect of out-migration on farm sizes and output per capita. Out-migration in Northern Ghana leads to agricultural extensification. In districts at the bottom of
1 A shorter version of this chapter has been submitted for publication and is currently under review.
124
the Malthus-Boserup curve, large-scale out-migration removes the incentives for a necessary intensification of agricultural practices.
Introduction
Marginal rural areas in developing countries are important migrant source areas. Stagnant agricultural economies and a lack of non-farm income sources are common push factors in these migration flows. The perceived opportunities in urban areas, more favourably located rural areas and places abroad exert a pull on potential migrants. A common objective of these migrants is to amass some wealth or at least improve their livelihood security. Although levels of success vary, most migrants do achieve some improvement in their living standards (UNDP 2009). The impact of rural out-migration on development in migrant source areas is more contentious. In the 1950s and 1960s neo-classical economists and modernization theorists were optimistic about the effect of out-migration in areas of origin and destination. Migration was thought to transfer surplus labour from sub-productive rural areas to centres of economic growth where it would be used more effectively. Migration would lead to more labour shortage and – so they thought – higher wages in source areas. Return migrants would become ‘agents of change’ in their home societies. In the 1970s and 1980s structural-historical and dependencia scholars drew much more negative conclusions. In their view, migration contributed to underdevelopment in migrants’ marginalized home areas by removing vital human resources to the benefit of the capitalist ‘core’ destination areas. Migration, they argued, caused increased inter-regional disparity and dependency, which in turn would lead to more migration. In the 1990s and 2000s, pluralist views dominated, with the perspective shifting to households, risk spreading and the development potential of remittances. This generally resulted in more positive conclusions (de Haas 2010).
A specific branch of research in the migration-development nexus deals with the impact of rural out-migration on agricultural development. Most scholarship in this area focused on the balance between the negative effect of labour loss and the positive effect of the investment of migrant savings and remittances in agriculture (e.g. Cleveland 1991; Rozelle et al. 1999). This balance was often found to be negative (Lipton 1980; Rubenstein 1992), albeit with notable exceptions. For example, a famous case study from the Indian Punjab showed that remittances contributed greatly to agricultural development (Oberai and Singh 1980). More recently, De Haas (2006) found that international migration and remittances played a pervasive role in transforming agriculture in his case study area in Morocco.
Some studies also stress that out-migration from densely populated rural areas reduces the pressure on land, which is commonly judged as being positive (Piore
125
1979; Bilsborrow 1987; King 1996; Hugo 2008).2 The assumption behind this ‘safety valve’ argument is essentially Malthusian or Neo-Malthusian.3 It presup-poses that migrant source areas benefit from a reduction in population pressure, leaving more fertile land to farm for those who stay behind. However, in the aftermath of Ester Boserup’s (1965) groundbreaking work on population growth and agricultural change, and especially after the publication of the book “More People Less Erosion” by Tiffen et al. (1994), it is increasingly acknowledged that population growth can provide important incentives for a transition to more sustainable land use and higher yields. In this vein, Mortimore and Adams (2001: 51) speak of a “challenge to the Neo-Malthusian paradigm of population growth, and its effects on agricultural productivity and resource sustainability.”
Studies of transitions to more sustainable land use in the context of population growth usually identify ‘population thresholds’ at which major changes occur. Such thresholds vary per location because population density is not the same as population pressure, and because change may be induced under different conditions (Dietz et al. 2009). Before the threshold is reached, yields tend to decrease with increasing population pressure. This is due to fallow periods becoming shorter and the inadequacy of measures taken to counter the concomitant soil fertility decline. In areas where such conditions exist, land use dynamics are dominated by Malthusian processes. The short-term effect of out-migration in this situation is that it slows down population growth and makes crop yields decline less rapidly. In Malthusian theory, out-migration is one of the population checks that increase the means of subsistence of those who stay behind. When population pressure reaches a critically high point and expansion to new lands is no longer possible, Malthus expected famine, misery and vice. By contrast, Boserup found that a shift in farm technology and/or labour input resulting in higher crop yields is more likely in such conditions. Not surprisingly, a key phrase in Boserupian theory is that ‘necessity is the mother of invention’. If population growth up to a certain threshold indeed causes declining crop yields and if population growth beyond a certain threshold leads to a transition to more intensive land use and higher yields, there would be a U-shaped curve between population density and yields. This U-shape could be called the ‘Malthus-
2 In a case study of Northwest Ghana in which the home community’s perceptions of migration were
investigated, this effect was mentioned very frequently by respondents (see Van der Geest, 2010a). 3 Strictly speaking, the words Malthusian and Neo-Malthusian have different meanings. However, in
practice, these words are often used interchangeably. The same applies to the words Boserupian and Neo-Boserupian. A difference between Neo-Maltusianism and the original ideas of Thomas Malthus is that Neo-Malthusians advocate birth control through anti-conception as a population check. Ideas are usually labelled Neo-Boserupian when they involve extensions of Ester Boserup’s thesis that population growth is an incentive for technological change. For this paper, these differences are not so relevant. The purpose here is to perform an empirical examination of the relation between population density and agricultural productivity in the case of Northern Ghana. Negative relations point to Malthusian processes and positive correlations would indicate that the population and/or institutions in Northern Ghana respond positively to increased population pressure.
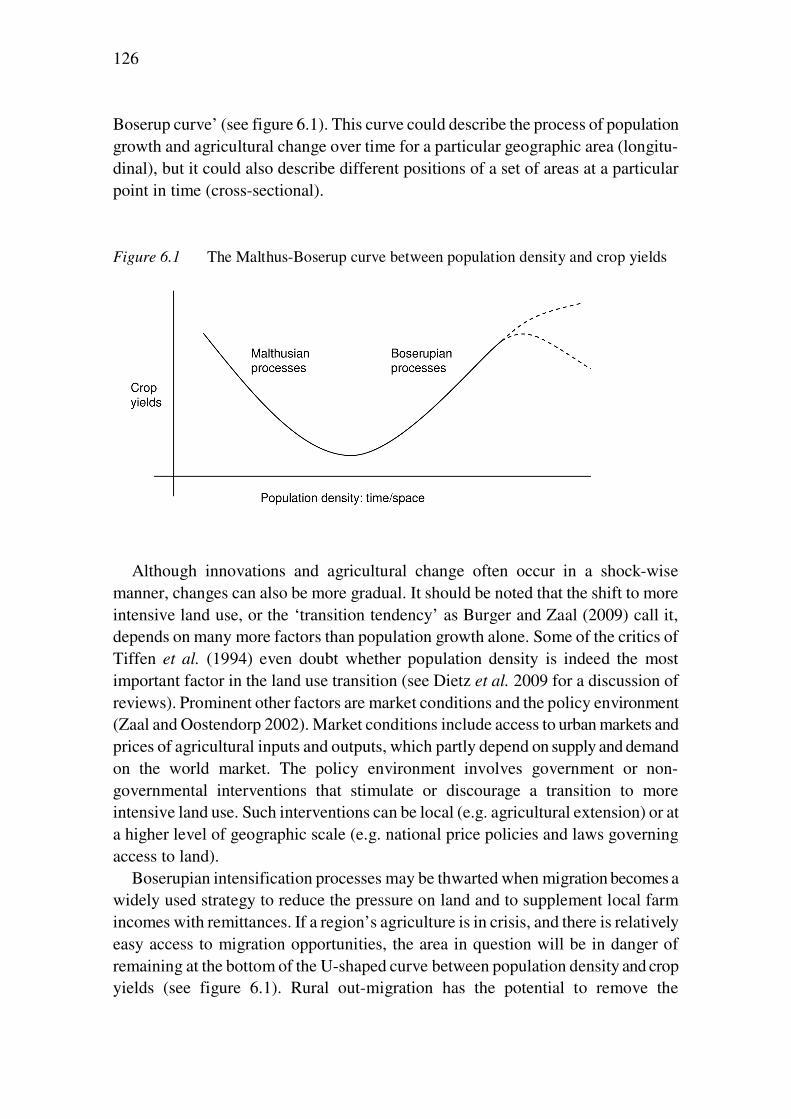
126
Boserup curve’ (see figure 6.1). This curve could describe the process of population growth and agricultural change over time for a particular geographic area (longitu-dinal), but it could also describe different positions of a set of areas at a particular point in time (cross-sectional). Figure 6.1 The Malthus-Boserup curve between population density and crop yields
Although innovations and agricultural change often occur in a shock-wise manner, changes can also be more gradual. It should be noted that the shift to more intensive land use, or the ‘transition tendency’ as Burger and Zaal (2009) call it, depends on many more factors than population growth alone. Some of the critics of Tiffen et al. (1994) even doubt whether population density is indeed the most important factor in the land use transition (see Dietz et al. 2009 for a discussion of reviews). Prominent other factors are market conditions and the policy environment (Zaal and Oostendorp 2002). Market conditions include access to urban markets and prices of agricultural inputs and outputs, which partly depend on supply and demand on the world market. The policy environment involves government or non-governmental interventions that stimulate or discourage a transition to more intensive land use. Such interventions can be local (e.g. agricultural extension) or at a higher level of geographic scale (e.g. national price policies and laws governing access to land).
Boserupian intensification processes may be thwarted when migration becomes a widely used strategy to reduce the pressure on land and to supplement local farm incomes with remittances. If a region’s agriculture is in crisis, and there is relatively easy access to migration opportunities, the area in question will be in danger of remaining at the bottom of the U-shaped curve between population density and crop yields (see figure 6.1). Rural out-migration has the potential to remove the
127
incentives for a transition to more sustainable and rewarding land use. This indirect effect of rural out-migration on agricultural development has – to the best of my knowledge – not yet been identified or described in the literature. A likely reason is that its existence is hard to measure or prove. The effect is somehow hypothetical: it requires the researcher to ‘imagine’ what the area would have looked like if no out-migration had taken place and if population density had been much higher than it is in reality. Another complicating factor is that land use intensity is not determined by population density alone. This makes it more difficult to ‘see’ the causalities clearly. As mentioned above, the policy environment and market conditions can play an important role in determining the course of the Malthus-Boserup curve shown in figure 6.1. In addition, other factors like climatic conditions, soil type and terrain may influence the ‘transition tendency’.
The theory that out-migration can remove the incentives for a transition to more intensive land use can only be validated (or falsified) in study areas with long records of population, migration and agricultural statistics.4 In addition, longitudinal data on market access, climatic conditions, soil dynamics and the policy environ-ment would strengthen the analysis. In the absence of sound time series data, an – admittedly imperfect – way of looking into the hypothetical future is to compare a study region with areas in similar agro-ecological zones that already have higher population densities. In other words, a cross-sectional analysis could be used to see how different population densities and migration rates relate to agricultural productivity.
This paper studies the complex relation between rural out-migration and agricul-tural development in Northern Ghana. It links the academic debate on migration and development to the debate on population growth and agricultural change (known as the Malthus-Boserup debate). Figure 6.2 shows a simple causal model that links these two debates. The model identifies a direct effect of rural out-migration on agricultural productivity and an indirect effect that is mediated by population density. In this causal model, out-migration is defined as the number of out-migrants as a proportion of the total population. Population density is defined as an area’s total population divided by its surface (inhabitants per square kilometre). When data availability allows, this crude measure could be refined to rural population density or agricultural population density. The cross-sectional analysis presented below uses agricultural population density. Agricultural productivity can involve returns to land (crop yields per hectare) or returns to labour (agricultural output per capita). In this paper, a slightly more complex version of the model, which will be tested for
4 In more exceptional circumstances, local case-study material can also go a long way to proving the
relation between out-migration and land use sustainability. In a study of the Mandara Mountains in Cameroon, for example, an intensive and sustainable farming system under high population density collapsed when large-scale out-migration to the adjacent plains became possible and population densities reduced (de Groot and Zuiderwijk, 2009).
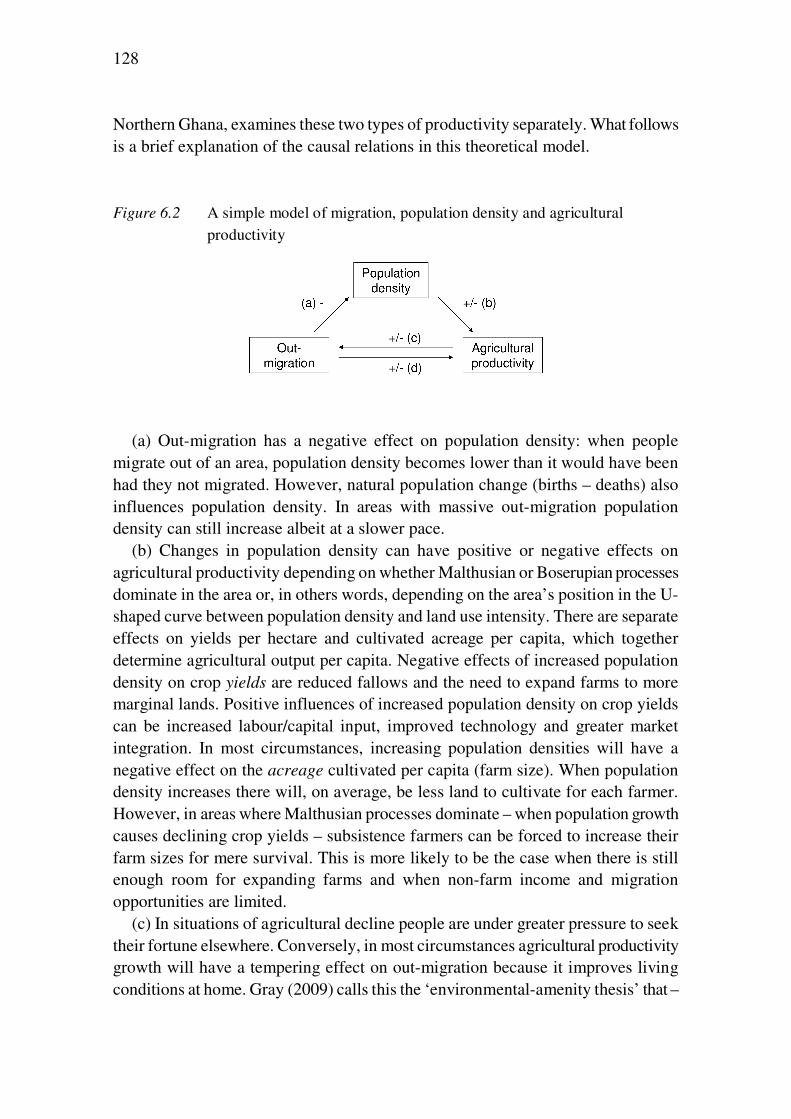
128
Northern Ghana, examines these two types of productivity separately. What follows is a brief explanation of the causal relations in this theoretical model. Figure 6.2 A simple model of migration, population density and agricultural
productivity
(a) Out-migration has a negative effect on population density: when people migrate out of an area, population density becomes lower than it would have been had they not migrated. However, natural population change (births – deaths) also influences population density. In areas with massive out-migration population density can still increase albeit at a slower pace.
(b) Changes in population density can have positive or negative effects on agricultural productivity depending on whether Malthusian or Boserupian processes dominate in the area or, in others words, depending on the area’s position in the U-shaped curve between population density and land use intensity. There are separate effects on yields per hectare and cultivated acreage per capita, which together determine agricultural output per capita. Negative effects of increased population density on crop yields are reduced fallows and the need to expand farms to more marginal lands. Positive influences of increased population density on crop yields can be increased labour/capital input, improved technology and greater market integration. In most circumstances, increasing population densities will have a negative effect on the acreage cultivated per capita (farm size). When population density increases there will, on average, be less land to cultivate for each farmer. However, in areas where Malthusian processes dominate – when population growth causes declining crop yields – subsistence farmers can be forced to increase their farm sizes for mere survival. This is more likely to be the case when there is still enough room for expanding farms and when non-farm income and migration opportunities are limited.
(c) In situations of agricultural decline people are under greater pressure to seek their fortune elsewhere. Conversely, in most circumstances agricultural productivity growth will have a tempering effect on out-migration because it improves living conditions at home. Gray (2009) calls this the ‘environmental-amenity thesis’ that –
129
in his Ecuadorian case study – was most relevant for internal migration flows. A cross-district analysis of Northern Ghana confirmed that districts with scarcer natural resources and lower crop yields experience more out-migration. Interviews with 203 rural-rural migrants also revealed that scarcity of fertile land was the primary reason to migrate (Van der Geest 2011). In more exceptional cases increased agricultural productivity could lead to more out-migration if it enables farmers to overcome capital constraints that previously made it impossible for them to migrate. Gray (2009) calls this the environmental-capital thesis. This hypothesis is most relevant in the case of international migration and in other situations in which the cost of migration is high (e.g. migration from a remote rural area to a national capital with relatively high cost of living).
(d) The direct effect of rural out-migration on agricultural productivity can be positive or negative. A first positive influence can be that migrants return with new ideas, knowledge and skills that can boost agricultural production. Secondly, migrants’ remittances and savings can be invested in agricultural inputs that have a positive effect on crop yields or farm sizes (e.g. fertilizer, improved seed varieties or bullock ploughs). Thirdly, the removal of labour can contribute to a trend towards more mechanization and higher-yielding cultivation practices. A direct negative effect of out-migration on agriculture is related to the selectivity of migration. People at a productive age tend to migrate more, and this may have a negative effect on agricultural production at home. Moreover, if more enterprising and innovative people are more likely to migrate, as is usually assumed, this may curb agricultural development. Secondly, a substitution effect may occur when income from remittances reduces the need to invest in more rewarding land use practices. Thirdly, migrants may return with new ideas and knowledge about – and preferences for – non-farm activities that may reduce their involvement in agriculture. In the long term, this effect can be positive if it creates an internal market for farm produce, which can provide a price incentive for agricultural intensification.
In practice, the direct and indirect effects of migration on agriculture are likely to interact. In an early phase, when migration reduces the pressure on land, it may also reduce the need for a transition to more intensive land use. However, if migrants return in a situation of increased pressure they might become the pioneers of agricultural change.5 This depends on the skills they learned in the migration process, the level of savings they were able to make and the viability of investment in agriculture vis-à-vis other income generating activities. This again depends on the context of market conditions and the policy environment.
5 A Kenyan case study shows that investments in terracing to counter soil erosion were most often made by
farmers who had recently bought a plot of land (Oostendorp and Zaal 2009). In a similar way, migrants could use the ‘momentum’ of their return to do things in a radically different way.
130
A long-standing problem in migration and development studies is how to isolate different directions of causality (de Haan et al. 2000; de Haas 2009). The same is true of the relation between migration and agricultural development. When a correlation exists, for example when households, villages or regions that experience more out-migration have lower levels of agricultural productivity, we do not know whether low productivity is an effect or a cause of out-migration or both. Similarly, in the absence of correlation between out-migration and agricultural development, there can be causal effects that work in opposite directions and therefore nullify each other. For example, when out-migration has a positive effect on agricultural productivity, this effect can be rendered invisible when agricultural development reduces out-migration rates. When the effect is negative in both directions, a dynamic of cumulative causation (a vicious circle) evolves to the detriment of the home area of migrants. Different directions of causality exercise their influence simultaneously. However, so far academics have not been able to separate such effects in a satisfactory way. Human geographers, anthropologists and development scholars tend to ignore this problem and simply focus on the effect they are interested in. At most, they acknowledge that correlations found do not imply causality in a certain direction. Economists and econometricians usually try to tackle the causality problem with statistical methods that are often incomprehensible to other academics. They mostly fail to translate their findings in a satisfactory way.
This paper does not pretend to solve the causality problem in migration and development studies. However, it does try to deal with the causality dilemma in a particular geographic setup. An important step in the procedure is to recognize the importance of population density as an intervening variable and to understand that some of the mixed findings in migration and (rural) development studies are the same as those found in studies focusing on the impact of population growth on agricultural productivity. The central thesis of this paper is that one has to know where a region is situated in the transition to more intensive land use (the Malthus-Boserup curve, see figure 6.1) to be able to assess the impact of out-migration on agricultural development.
Methods and outline
To study the relation between population density, migration and agricultural development in Northern Ghana, demographic and agricultural production data for the twenty-four districts in Northern Ghana was retrieved from population censuses and the Ministry of Food and Agriculture. Additional information on rainfall, soils and vegetation in Northern Ghana was retrieved from rainfall gauges, soil maps and remote sensing. The cross-district analysis presented below focuses primarily on the relation between agricultural population density, out-migration and three measures of agricultural productivity: acreage per capita, yield per hectare and output per
131
capita. Agricultural population density was calculated as the crude population density (inhabitants per km2) at the time of last population census in 2000 multiplied by the proportion of the economically active population engaged in agriculture.6 The agricultural production data are calculated over a five-year period before and after the census year (1998-2002) to reduce the influence of idiosyncrasies caused by good and bad rainfall years. Acreage and output per capita involve the total production of eight crops: maize, millet, sorghum, groundnuts, cowpea, rice, yam and cassava. Crop yields are weighed for acreage and are expressed in caloric terms instead of weight because yam and cassava yields are much bulkier, but with lower energy values per unit weight.7 Out-migration rates are expressed as the people who migrated out of the district divided by the total district population. The Ghana Population and Housing Census provides data on out-migration at regional level, but not at district level. Therefore, district out-migration rates were estimated as a function8 of population aged over sixty-five, sex ratio of the population aged 15-64 and population growth between 1970 and 2000. These variables explain 92.1 percent of the variation in out-migration rates at regional level.
This paper is organized as follows. Section two provides a descriptive and spatial analysis of population dynamics and agricultural productivity in Northern Ghana. Special attention is paid to rainfall, soil characteristics and population distribution in Northern Ghana. A cross-district analysis of migration, population density and agricultural productivity in Northern Ghana is presented in section three.9 Due to the nature of the data, the cross-district analysis examines outcomes rather than the mechanisms through which migration can have positive and negative effects on agriculture.10 Section four is the conclusion.
Northern Ghana
Ghana is situated on the West Coast of Africa. The study area in the North of Ghana has a savannah ecology and is located on the Southern fringes of the semi-arid Sahel. Northern Ghana is divided into three administrative regions: the Northern Region, the Upper West Region and the Upper East Region. At national level, Ghana has been faring quite well in terms of economic growth and poverty
6 The average proportion of the economically active population engaged in agriculture in Northern Ghana is
70.8 percent. The range for all districts except the predominantly urban Tamale Municipal Area is 50.6 percent to 87.7 percent. The proportion for Tamale is 29.1 percent.
7 Conversion factors: Sorghum: 3,430 kcal/kg; millet: 3,400 kcal/kg; maize: 3,560 kcal/kg; rice: 3,360 kcal/kg; groundnuts: 4,140 kcal/kg; cowpea: 3,420 kcal/kg; yam: 1,010 kcal/kg; cassava: 1,090 kcal/kg (source: FAO 2010).
8 Out-migration rate (%) = 80.48 – 0.073 * population growth 1970-2000 (%) – 0.643 * sex ratio (15-64) + 1.528 * proportion elderly (65+)(%). The estimation procedure is elaborated in the Appendix.
9 See Van der Geest et al. (2010) for a more detailed description of migration data in the Ghana population census.
10 These mechanisms are studied in more detail in the next chapter.
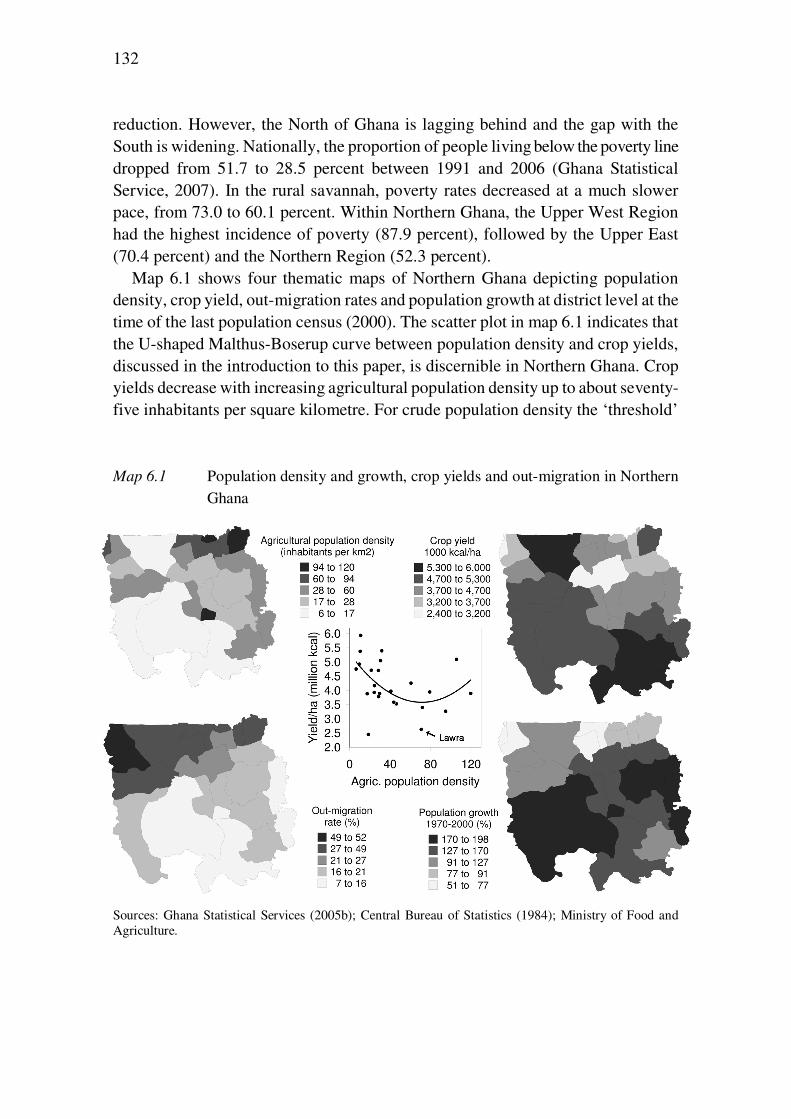
132
reduction. However, the North of Ghana is lagging behind and the gap with the South is widening. Nationally, the proportion of people living below the poverty line dropped from 51.7 to 28.5 percent between 1991 and 2006 (Ghana Statistical Service, 2007). In the rural savannah, poverty rates decreased at a much slower pace, from 73.0 to 60.1 percent. Within Northern Ghana, the Upper West Region had the highest incidence of poverty (87.9 percent), followed by the Upper East (70.4 percent) and the Northern Region (52.3 percent).
Map 6.1 shows four thematic maps of Northern Ghana depicting population density, crop yield, out-migration rates and population growth at district level at the time of the last population census (2000). The scatter plot in map 6.1 indicates that the U-shaped Malthus-Boserup curve between population density and crop yields, discussed in the introduction to this paper, is discernible in Northern Ghana. Crop yields decrease with increasing agricultural population density up to about seventy-five inhabitants per square kilometre. For crude population density the ‘threshold’ Map 6.1 Population density and growth, crop yields and out-migration in Northern
Ghana
Sources: Ghana Statistical Services (2005b); Central Bureau of Statistics (1984); Ministry of Food and Agriculture.
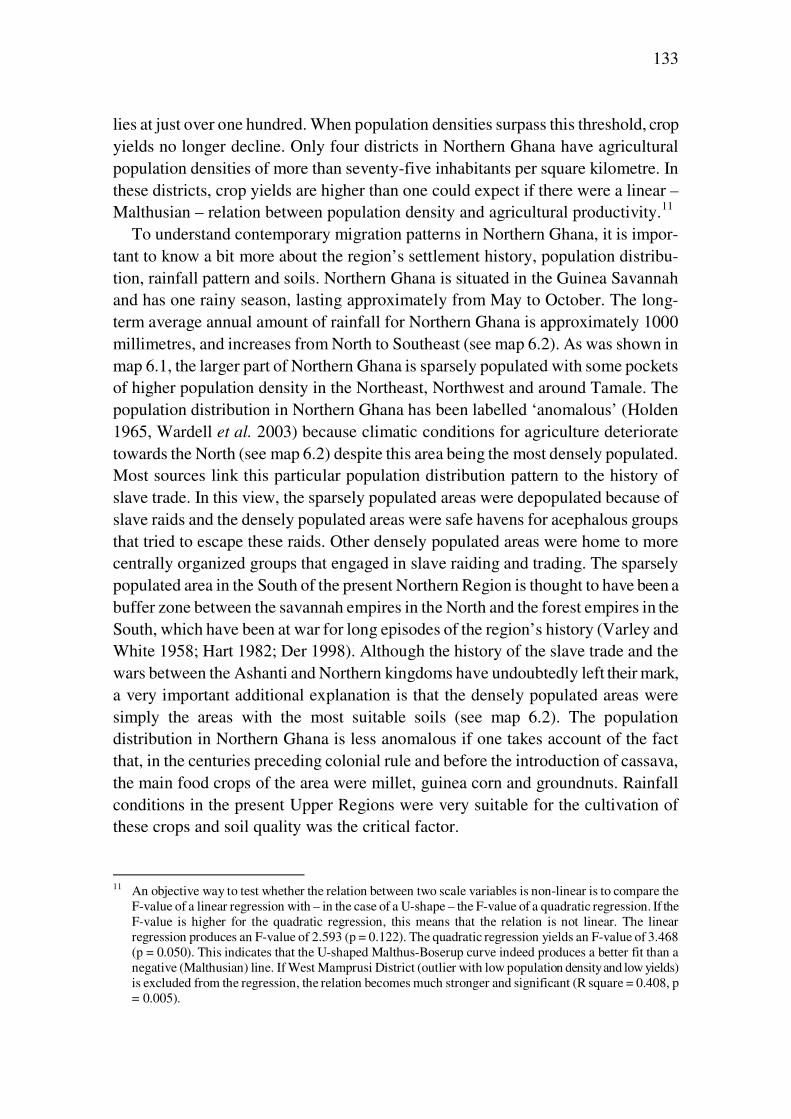
133
lies at just over one hundred. When population densities surpass this threshold, crop yields no longer decline. Only four districts in Northern Ghana have agricultural population densities of more than seventy-five inhabitants per square kilometre. In these districts, crop yields are higher than one could expect if there were a linear – Malthusian – relation between population density and agricultural productivity.11
To understand contemporary migration patterns in Northern Ghana, it is impor-tant to know a bit more about the region’s settlement history, population distribu-tion, rainfall pattern and soils. Northern Ghana is situated in the Guinea Savannah and has one rainy season, lasting approximately from May to October. The long-term average annual amount of rainfall for Northern Ghana is approximately 1000 millimetres, and increases from North to Southeast (see map 6.2). As was shown in map 6.1, the larger part of Northern Ghana is sparsely populated with some pockets of higher population density in the Northeast, Northwest and around Tamale. The population distribution in Northern Ghana has been labelled ‘anomalous’ (Holden 1965, Wardell et al. 2003) because climatic conditions for agriculture deteriorate towards the North (see map 6.2) despite this area being the most densely populated. Most sources link this particular population distribution pattern to the history of slave trade. In this view, the sparsely populated areas were depopulated because of slave raids and the densely populated areas were safe havens for acephalous groups that tried to escape these raids. Other densely populated areas were home to more centrally organized groups that engaged in slave raiding and trading. The sparsely populated area in the South of the present Northern Region is thought to have been a buffer zone between the savannah empires in the North and the forest empires in the South, which have been at war for long episodes of the region’s history (Varley and White 1958; Hart 1982; Der 1998). Although the history of the slave trade and the wars between the Ashanti and Northern kingdoms have undoubtedly left their mark, a very important additional explanation is that the densely populated areas were simply the areas with the most suitable soils (see map 6.2). The population distribution in Northern Ghana is less anomalous if one takes account of the fact that, in the centuries preceding colonial rule and before the introduction of cassava, the main food crops of the area were millet, guinea corn and groundnuts. Rainfall conditions in the present Upper Regions were very suitable for the cultivation of these crops and soil quality was the critical factor.
11 An objective way to test whether the relation between two scale variables is non-linear is to compare the
F-value of a linear regression with – in the case of a U-shape – the F-value of a quadratic regression. If the F-value is higher for the quadratic regression, this means that the relation is not linear. The linear regression produces an F-value of 2.593 (p = 0.122). The quadratic regression yields an F-value of 3.468 (p = 0.050). This indicates that the U-shaped Malthus-Boserup curve indeed produces a better fit than a negative (Malthusian) line. If West Mamprusi District (outlier with low population density and low yields) is excluded from the regression, the relation becomes much stronger and significant (R square = 0.408, p = 0.005).
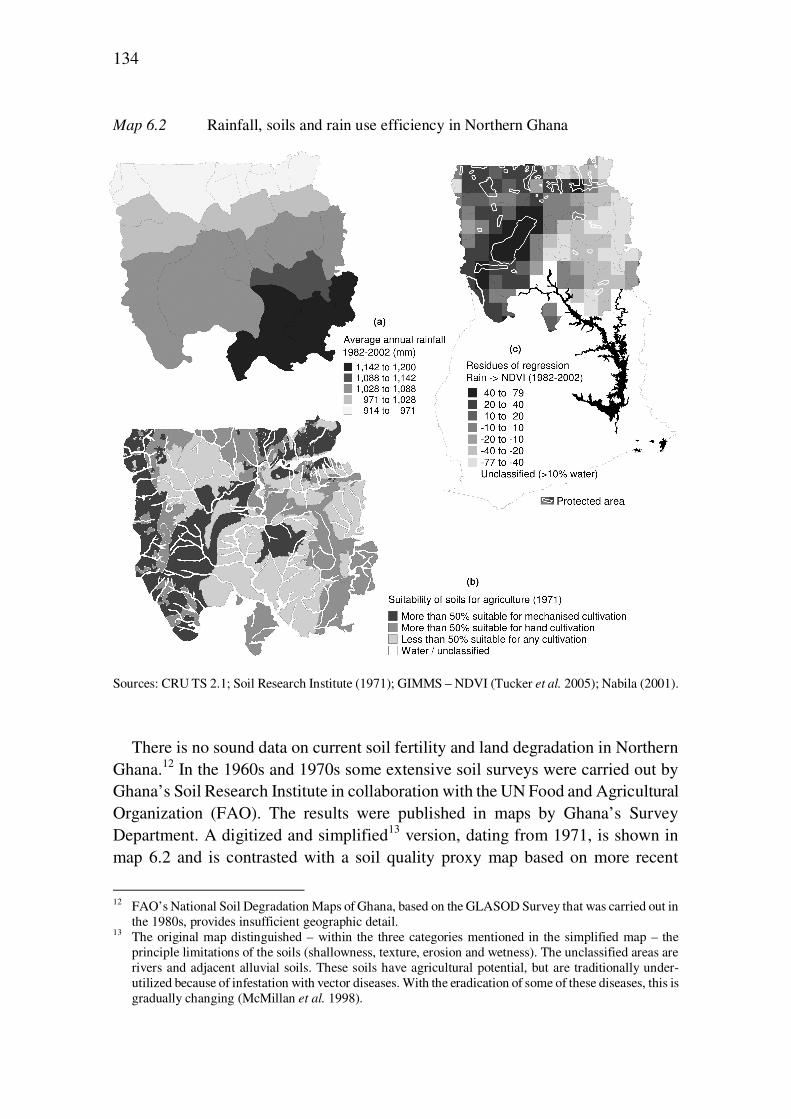
134
Map 6.2 Rainfall, soils and rain use efficiency in Northern Ghana
Sources: CRU TS 2.1; Soil Research Institute (1971); GIMMS – NDVI (Tucker et al. 2005); Nabila (2001).
There is no sound data on current soil fertility and land degradation in Northern Ghana.12 In the 1960s and 1970s some extensive soil surveys were carried out by Ghana’s Soil Research Institute in collaboration with the UN Food and Agricultural Organization (FAO). The results were published in maps by Ghana’s Survey Department. A digitized and simplified13 version, dating from 1971, is shown in map 6.2 and is contrasted with a soil quality proxy map based on more recent
12 FAO’s National Soil Degradation Maps of Ghana, based on the GLASOD Survey that was carried out in
the 1980s, provides insufficient geographic detail. 13 The original map distinguished – within the three categories mentioned in the simplified map – the
principle limitations of the soils (shallowness, texture, erosion and wetness). The unclassified areas are rivers and adjacent alluvial soils. These soils have agricultural potential, but are traditionally under-utilized because of infestation with vector diseases. With the eradication of some of these diseases, this is gradually changing (McMillan et al. 1998).
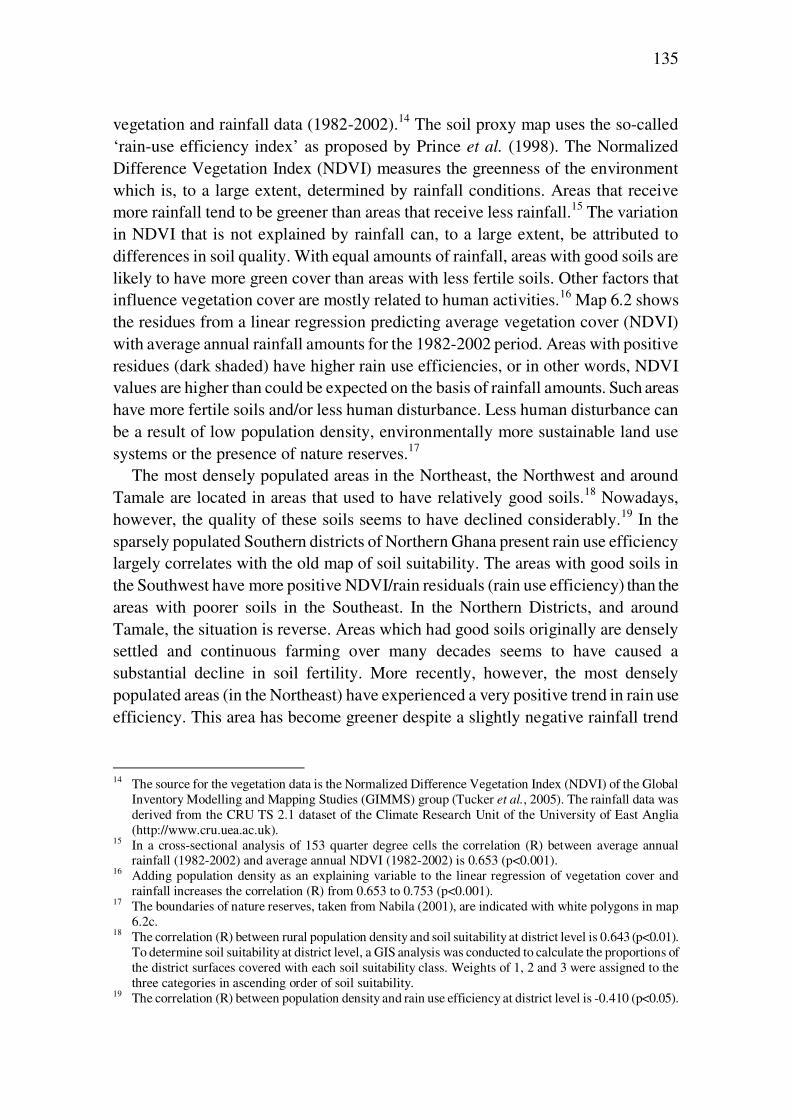
135
vegetation and rainfall data (1982-2002).14 The soil proxy map uses the so-called ‘rain-use efficiency index’ as proposed by Prince et al. (1998). The Normalized Difference Vegetation Index (NDVI) measures the greenness of the environment which is, to a large extent, determined by rainfall conditions. Areas that receive more rainfall tend to be greener than areas that receive less rainfall.15 The variation in NDVI that is not explained by rainfall can, to a large extent, be attributed to differences in soil quality. With equal amounts of rainfall, areas with good soils are likely to have more green cover than areas with less fertile soils. Other factors that influence vegetation cover are mostly related to human activities.16 Map 6.2 shows the residues from a linear regression predicting average vegetation cover (NDVI) with average annual rainfall amounts for the 1982-2002 period. Areas with positive residues (dark shaded) have higher rain use efficiencies, or in other words, NDVI values are higher than could be expected on the basis of rainfall amounts. Such areas have more fertile soils and/or less human disturbance. Less human disturbance can be a result of low population density, environmentally more sustainable land use systems or the presence of nature reserves.17
The most densely populated areas in the Northeast, the Northwest and around Tamale are located in areas that used to have relatively good soils.18 Nowadays, however, the quality of these soils seems to have declined considerably.19 In the sparsely populated Southern districts of Northern Ghana present rain use efficiency largely correlates with the old map of soil suitability. The areas with good soils in the Southwest have more positive NDVI/rain residuals (rain use efficiency) than the areas with poorer soils in the Southeast. In the Northern Districts, and around Tamale, the situation is reverse. Areas which had good soils originally are densely settled and continuous farming over many decades seems to have caused a substantial decline in soil fertility. More recently, however, the most densely populated areas (in the Northeast) have experienced a very positive trend in rain use efficiency. This area has become greener despite a slightly negative rainfall trend
14 The source for the vegetation data is the Normalized Difference Vegetation Index (NDVI) of the Global
Inventory Modelling and Mapping Studies (GIMMS) group (Tucker et al., 2005). The rainfall data was derived from the CRU TS 2.1 dataset of the Climate Research Unit of the University of East Anglia (http://www.cru.uea.ac.uk).
15 In a cross-sectional analysis of 153 quarter degree cells the correlation (R) between average annual rainfall (1982-2002) and average annual NDVI (1982-2002) is 0.653 (p<0.001).
16 Adding population density as an explaining variable to the linear regression of vegetation cover and rainfall increases the correlation (R) from 0.653 to 0.753 (p<0.001).
17 The boundaries of nature reserves, taken from Nabila (2001), are indicated with white polygons in map 6.2c.
18 The correlation (R) between rural population density and soil suitability at district level is 0.643 (p<0.01). To determine soil suitability at district level, a GIS analysis was conducted to calculate the proportions of the district surfaces covered with each soil suitability class. Weights of 1, 2 and 3 were assigned to the three categories in ascending order of soil suitability.
19 The correlation (R) between population density and rain use efficiency at district level is -0.410 (p<0.05).
136
(Van der Geest et al. 2010). This could be an indication of a U-shape relation between population density and the environmental sustainability of land use.
Historic sources describe the sparsely populated districts in the Northern Region as very unattractive places. In his ‘Geography of Ghana’, Boateng (1966: 60) writes that these areas have “… the poorest soils in Ghana. (..) They tend to get water-logged during the rains and to dry out during the long dry season.” Earlier, Cardinall (1931)20 wrote that these areas were “to all intents and purposes uninhabitable” because of the poor soils and lack of access to groundwater. In recent decades, the sparsely populated districts in the Northern Region seem to have become more attractive. They experience substantial population growth (see map 6.1), partly because of in-migration from the Upper Regions. Crop yields are higher there nowadays than in the old settlement areas further North. A possible explanation for this trend could be that parts of this area are quite suitable for cassava production, which soared in the 1990s (FAO-STAT 2010).
A recent study of the relation between out-migration and natural resources scarcity in Northern Ghana showed that districts which are poorly endowed in terms of rainfall, vegetation cover and crop yields experience more out-migration (Van der Geest 2011). A similar analysis can be conducted for the relation between migration and soil suitability after calculating the proportion of district surfaces within each soil category. This analysis yields a positive correlation coefficient of 0.554 (p = 0.006). Areas that (used to) have more suitable soils for agriculture experience more out-migration than areas that used to have less suitable soils. This finding is paradoxical or at least counter-intuitive. The explanation is that areas which used to have good soils are now densely populated, resulting in increased pressure on land with inadequate measures to maintain soil fertility. This has resulted in more out-migration. An analysis of the relation between out-migration and the more current soil quality proxy, based on rain use efficiency (map 6.2), yielded no significant correlation (R = -0.157, p = 0.475).
The more densely populated areas that existed at the turn of the 20th century when Northern Ghana was colonized by the British later became the prime source areas of migrants who were recruited – by force – to work in the mines and infrastructural projects in Southern Ghana. Pressure on farmlands and reduced fallows may already have played a role, but it is more likely that the colonial officers simply preferred to concentrate recruitment in these areas because the concentration of people made it easier and cheaper to recruit. In the course of the 20th century population density increased and the North-South migration system matured. Forced labour recruitment stopped in the mid 1920s, but by that time a culture of migration had evolved and people now migrated voluntarily (Lentz 2006), especially from the more densely populated areas. Mobility remained a young adult male affair for some decades, but 20 In Hilton (1960: 25).
137
gradually it also became more common for women and entire households to migrate. Population density in Northeast and Northwest Ghana increased much more slowly than in the rest of the country because of large-scale out-migration.
Cross-district analysis of migration and agricultural productivity
Causal model
In the introduction to this paper, a simple causal model of out-migration, population density and agricultural productivity was presented. In this section, a slightly more complex version of this causal model (figure 6.3) is used to analyze the complex relation between migration and agricultural productivity in Northern Ghana, and to explore the intervening role of population density. The main addition in this second model is that the variable ‘agricultural productivity’ is made more explicit. A distinction is made between returns to land (yield per hectare) and returns to labour (production per capita). Agricultural production per capita is a function of cultivated acreage per capita and crop yield per hectare. This elaboration of the causal model enables an analysis of the differential effect of out-migration on agricultural intensification (higher yield per hectare) and extensification (higher acreage per capita). Strictly speaking, the causal model describes processes over time. However, in the absence of longitudinal data with a long-enough time span, it is tested in a cross-sectional analysis of 24 districts in Northern Ghana. Population densities vary widely within the North of Ghana, from less than ten to over a hundred inhabitants per square kilometre. These districts are in different stages of land use intensity, as was also illustrated by the U-shape in map 6.1.
The solid lines in figure 6.3 are causal or logical relations that do not necessarily need to coincide with statistical correlations. Arrow (a) for example, indicates that out-migration – logically – has a negative effect on population density. The correlation between out-migration and population density does not need to be negative, however. This is because the opposite effect can be positive and stronger, i.e. when population pressure is an important cause of out-migration. In such a situation densely populated areas tend to experience more out-migration than sparsely populated areas (spatial relation) and increasing population pressure will cause more out-migration (temporal relation). It is important to realize, however, that out-migration does not increase because of increasing population density per se, but because increasing population density may have a negative effect on agricultural livelihoods. When increasing population pressure has a negative (Malthusian) effect on agricultural productivity and when agricultural decline pushes people to migrate, the correlation between population density and out-migration rates will be positive.
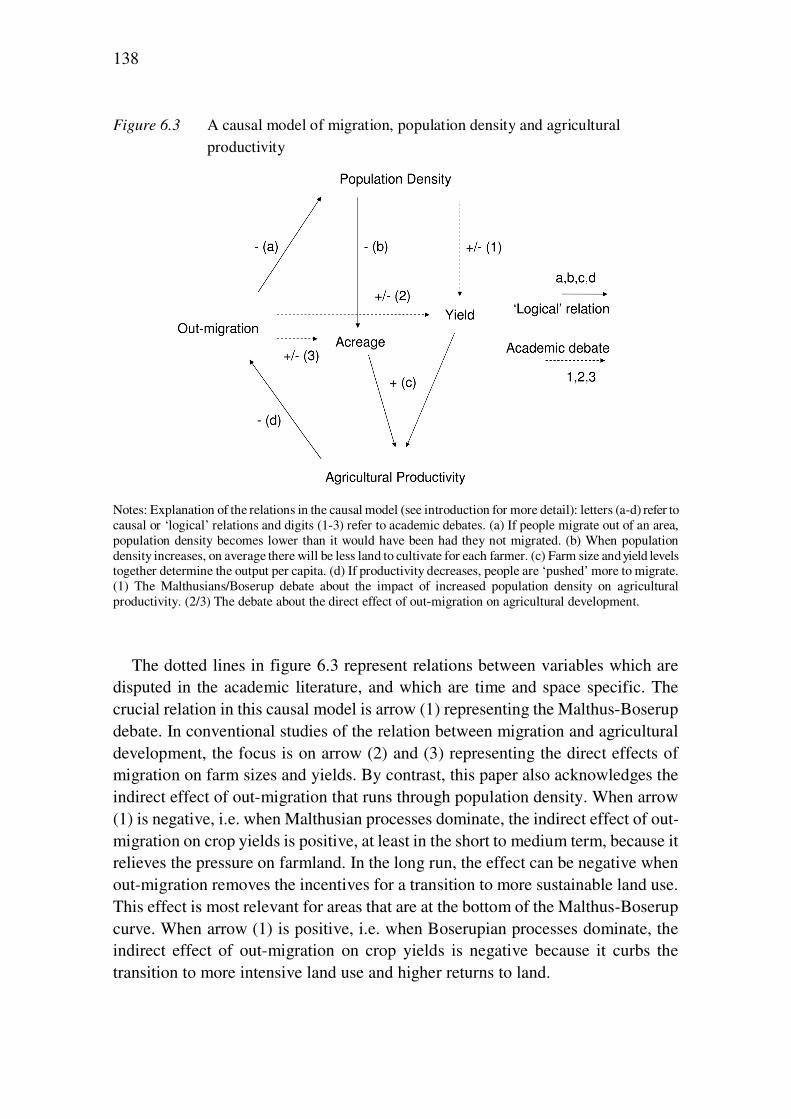
138
Figure 6.3 A causal model of migration, population density and agricultural productivity
Notes: Explanation of the relations in the causal model (see introduction for more detail): letters (a-d) refer to causal or ‘logical’ relations and digits (1-3) refer to academic debates. (a) If people migrate out of an area, population density becomes lower than it would have been had they not migrated. (b) When population density increases, on average there will be less land to cultivate for each farmer. (c) Farm size and yield levels together determine the output per capita. (d) If productivity decreases, people are ‘pushed’ more to migrate. (1) The Malthusians/Boserup debate about the impact of increased population density on agricultural productivity. (2/3) The debate about the direct effect of out-migration on agricultural development.
The dotted lines in figure 6.3 represent relations between variables which are disputed in the academic literature, and which are time and space specific. The crucial relation in this causal model is arrow (1) representing the Malthus-Boserup debate. In conventional studies of the relation between migration and agricultural development, the focus is on arrow (2) and (3) representing the direct effects of migration on farm sizes and yields. By contrast, this paper also acknowledges the indirect effect of out-migration that runs through population density. When arrow (1) is negative, i.e. when Malthusian processes dominate, the indirect effect of out-migration on crop yields is positive, at least in the short to medium term, because it relieves the pressure on farmland. In the long run, the effect can be negative when out-migration removes the incentives for a transition to more sustainable land use. This effect is most relevant for areas that are at the bottom of the Malthus-Boserup curve. When arrow (1) is positive, i.e. when Boserupian processes dominate, the indirect effect of out-migration on crop yields is negative because it curbs the transition to more intensive land use and higher returns to land.
139
The causal framework shown in figure 6.3 is a closed model. In reality, however, all variables in the model can be influenced by a large variety of external factors like, for example, market conditions, the policy environment, climate change and developments in the non-farm economy, both in the source and destination areas of migrants. In addition, the direct and indirect effects of out-migration on agricultural development interact. For example, in a region where Boserupian processes dominate, remittances are more likely to be invested in agricultural production than in a region where Malthusian processes dominate. Moreover, if the land use transition is capital-intensive, the negative ‘loss of labour effect’ of out-migration will be less detrimental than when the transition is labour-intensive.
Results
In Northern Ghana a negative spatial correlation exists between out-migration and crop yields.21 Districts with more out-migration tend to have lower crop yields than districts with less out-migration (see also Van der Geest 2011). The question is: what is the direction of causality? Does out-migration have a negative effect on crop yields or is low agricultural productivity a major cause for people to migrate? Or does the causality work in both directions? And what is the relation between out-migration and per capita farm size, the variable that together with yield per hectare determines per capita food production?
Table 6.1 shows the statistical relations between out-migration, population density, cultivated acreage per capita, crop yields and output per capita in Northern Ghana. Instead of using the crude population measure, population density is expressed as districts’ agricultural population per square kilometre. The table shows the correlations between (agricultural) population density and out-migration on the one hand, and the agricultural production variables on the other. The correlations between population density, crop yield and output per capita are moderately negative, and insignificant because the most densely populated districts show an upward turn in crop yields. The bivariate correlations between out-migration and the agricultural productivity indicators are a bit stronger, but also insignificant at the p < 0.05 level. Crop yields tend to be lower in districts with more out-migration, but the acreage under cultivation tends to be higher, resulting in a weakly positive correlation between out-migration and output per capita. It seems surprising that the correlation between out-migration and agricultural output per capita is positive (but not significant). One would expect low food security to be an important stimulus of migration (Gray’s environmental amenity thesis, discussed in the introduction). As we will see below, this effect does indeed exist, but is countered by an opposite
21 R = -0.396, p = 0.062 when expressed in caloric terms (see table 1). The correlation is stronger and
significant (R = - 0.517, p = 0.012) when yield is expressed in monetary terms. If outlier West Mamprusi (see figure 4) is excluded from the analysis, the relation between agricultural population density and crop yield is also stronger and significant (R = 0.500, p = 0.029).
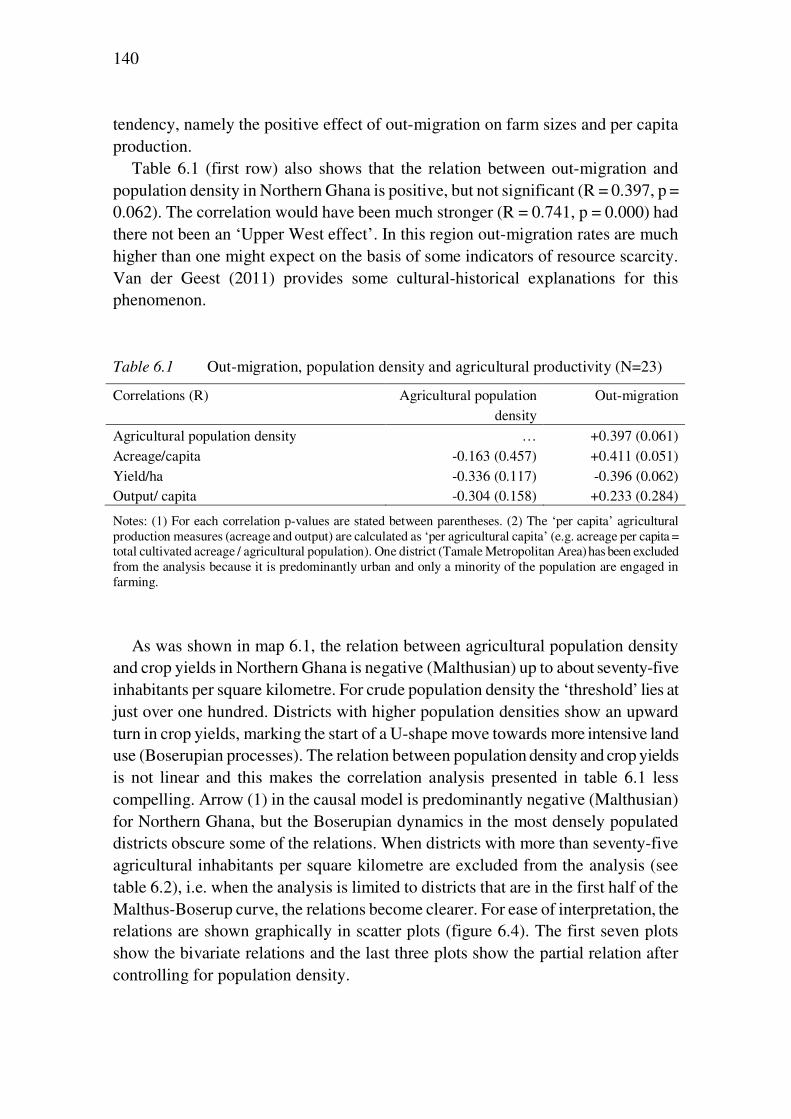
140
tendency, namely the positive effect of out-migration on farm sizes and per capita production.
Table 6.1 (first row) also shows that the relation between out-migration and population density in Northern Ghana is positive, but not significant (R = 0.397, p = 0.062). The correlation would have been much stronger (R = 0.741, p = 0.000) had there not been an ‘Upper West effect’. In this region out-migration rates are much higher than one might expect on the basis of some indicators of resource scarcity. Van der Geest (2011) provides some cultural-historical explanations for this phenomenon. Table 6.1 Out-migration, population density and agricultural productivity (N=23)
Correlations (R) Agricultural population density
Out-migration
Agricultural population density … +0.397 (0.061) Acreage/capita -0.163 (0.457) +0.411 (0.051) Yield/ha -0.336 (0.117) -0.396 (0.062) Output/ capita -0.304 (0.158) +0.233 (0.284)
Notes: (1) For each correlation p-values are stated between parentheses. (2) The ‘per capita’ agricultural production measures (acreage and output) are calculated as ‘per agricultural capita’ (e.g. acreage per capita = total cultivated acreage / agricultural population). One district (Tamale Metropolitan Area) has been excluded from the analysis because it is predominantly urban and only a minority of the population are engaged in farming.
As was shown in map 6.1, the relation between agricultural population density and crop yields in Northern Ghana is negative (Malthusian) up to about seventy-five inhabitants per square kilometre. For crude population density the ‘threshold’ lies at just over one hundred. Districts with higher population densities show an upward turn in crop yields, marking the start of a U-shape move towards more intensive land use (Boserupian processes). The relation between population density and crop yields is not linear and this makes the correlation analysis presented in table 6.1 less compelling. Arrow (1) in the causal model is predominantly negative (Malthusian) for Northern Ghana, but the Boserupian dynamics in the most densely populated districts obscure some of the relations. When districts with more than seventy-five agricultural inhabitants per square kilometre are excluded from the analysis (see table 6.2), i.e. when the analysis is limited to districts that are in the first half of the Malthus-Boserup curve, the relations become clearer. For ease of interpretation, the relations are shown graphically in scatter plots (figure 6.4). The first seven plots show the bivariate relations and the last three plots show the partial relation after controlling for population density.
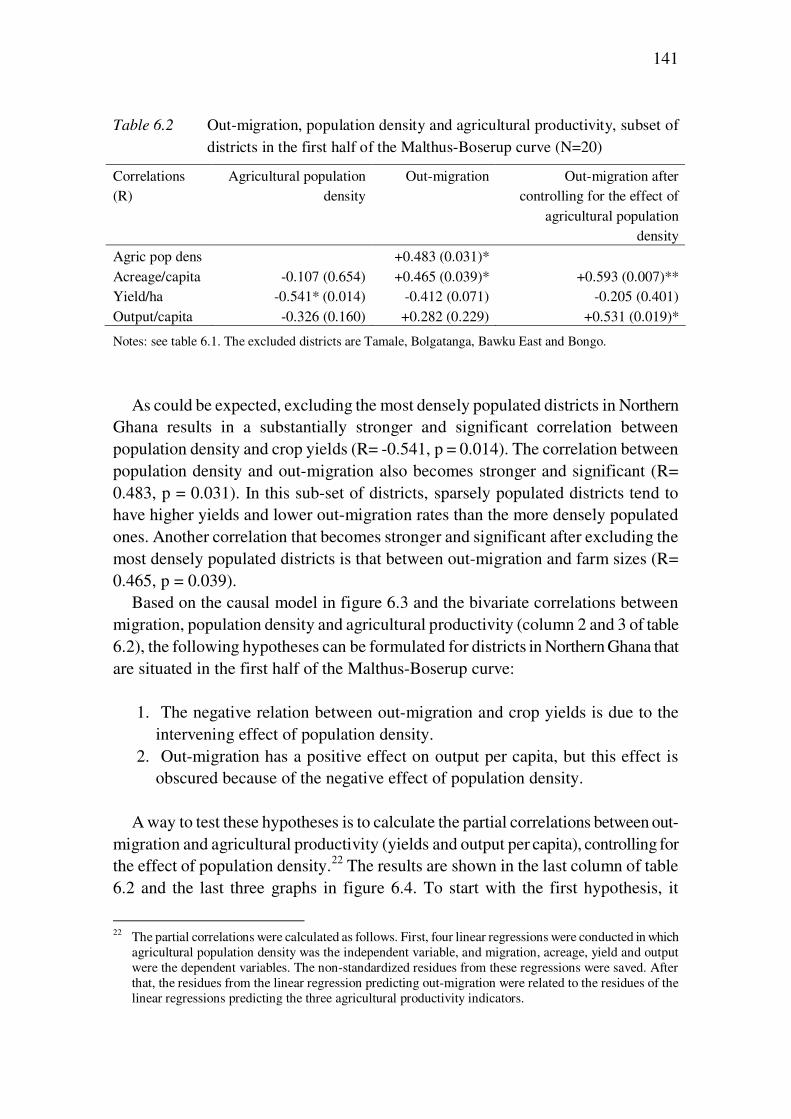
141
Table 6.2 Out-migration, population density and agricultural productivity, subset of districts in the first half of the Malthus-Boserup curve (N=20)
Correlations (R)
Agricultural population density
Out-migration Out-migration after controlling for the effect of
agricultural population density
Agric pop dens +0.483 (0.031)* Acreage/capita -0.107 (0.654) +0.465 (0.039)* +0.593 (0.007)** Yield/ha -0.541* (0.014) -0.412 (0.071) -0.205 (0.401) Output/capita -0.326 (0.160) +0.282 (0.229) +0.531 (0.019)*
Notes: see table 6.1. The excluded districts are Tamale, Bolgatanga, Bawku East and Bongo.
As could be expected, excluding the most densely populated districts in Northern Ghana results in a substantially stronger and significant correlation between population density and crop yields (R= -0.541, p = 0.014). The correlation between population density and out-migration also becomes stronger and significant (R= 0.483, p = 0.031). In this sub-set of districts, sparsely populated districts tend to have higher yields and lower out-migration rates than the more densely populated ones. Another correlation that becomes stronger and significant after excluding the most densely populated districts is that between out-migration and farm sizes (R= 0.465, p = 0.039).
Based on the causal model in figure 6.3 and the bivariate correlations between migration, population density and agricultural productivity (column 2 and 3 of table 6.2), the following hypotheses can be formulated for districts in Northern Ghana that are situated in the first half of the Malthus-Boserup curve:
1. The negative relation between out-migration and crop yields is due to the intervening effect of population density.
2. Out-migration has a positive effect on output per capita, but this effect is obscured because of the negative effect of population density.
A way to test these hypotheses is to calculate the partial correlations between out-
migration and agricultural productivity (yields and output per capita), controlling for the effect of population density.22 The results are shown in the last column of table 6.2 and the last three graphs in figure 6.4. To start with the first hypothesis, it
22 The partial correlations were calculated as follows. First, four linear regressions were conducted in which
agricultural population density was the independent variable, and migration, acreage, yield and output were the dependent variables. The non-standardized residues from these regressions were saved. After that, the residues from the linear regression predicting out-migration were related to the residues of the linear regressions predicting the three agricultural productivity indicators.
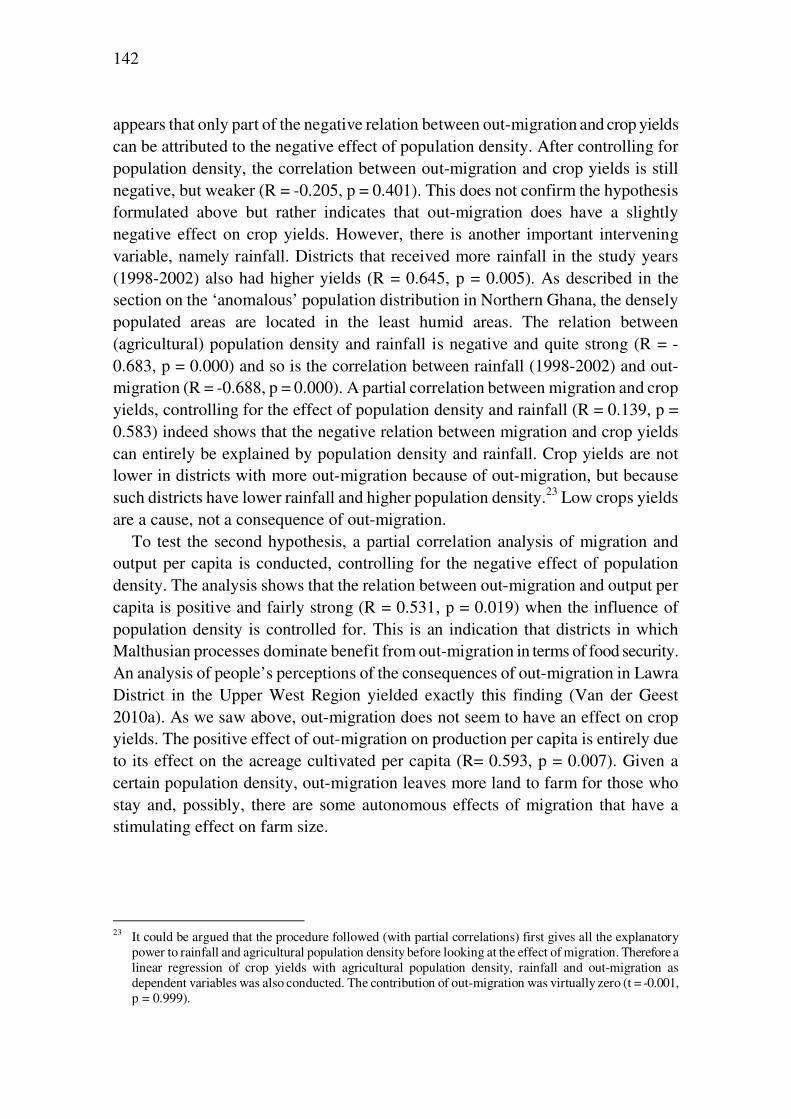
142
appears that only part of the negative relation between out-migration and crop yields can be attributed to the negative effect of population density. After controlling for population density, the correlation between out-migration and crop yields is still negative, but weaker (R = -0.205, p = 0.401). This does not confirm the hypothesis formulated above but rather indicates that out-migration does have a slightly negative effect on crop yields. However, there is another important intervening variable, namely rainfall. Districts that received more rainfall in the study years (1998-2002) also had higher yields (R = 0.645, p = 0.005). As described in the section on the ‘anomalous’ population distribution in Northern Ghana, the densely populated areas are located in the least humid areas. The relation between (agricultural) population density and rainfall is negative and quite strong (R = -0.683, p = 0.000) and so is the correlation between rainfall (1998-2002) and out-migration (R = -0.688, p = 0.000). A partial correlation between migration and crop yields, controlling for the effect of population density and rainfall (R = 0.139, p = 0.583) indeed shows that the negative relation between migration and crop yields can entirely be explained by population density and rainfall. Crop yields are not lower in districts with more out-migration because of out-migration, but because such districts have lower rainfall and higher population density.23 Low crops yields are a cause, not a consequence of out-migration.
To test the second hypothesis, a partial correlation analysis of migration and output per capita is conducted, controlling for the negative effect of population density. The analysis shows that the relation between out-migration and output per capita is positive and fairly strong (R = 0.531, p = 0.019) when the influence of population density is controlled for. This is an indication that districts in which Malthusian processes dominate benefit from out-migration in terms of food security. An analysis of people’s perceptions of the consequences of out-migration in Lawra District in the Upper West Region yielded exactly this finding (Van der Geest 2010a). As we saw above, out-migration does not seem to have an effect on crop yields. The positive effect of out-migration on production per capita is entirely due to its effect on the acreage cultivated per capita (R= 0.593, p = 0.007). Given a certain population density, out-migration leaves more land to farm for those who stay and, possibly, there are some autonomous effects of migration that have a stimulating effect on farm size.
23 It could be argued that the procedure followed (with partial correlations) first gives all the explanatory
power to rainfall and agricultural population density before looking at the effect of migration. Therefore a linear regression of crop yields with agricultural population density, rainfall and out-migration as dependent variables was also conducted. The contribution of out-migration was virtually zero (t = -0.001, p = 0.999).
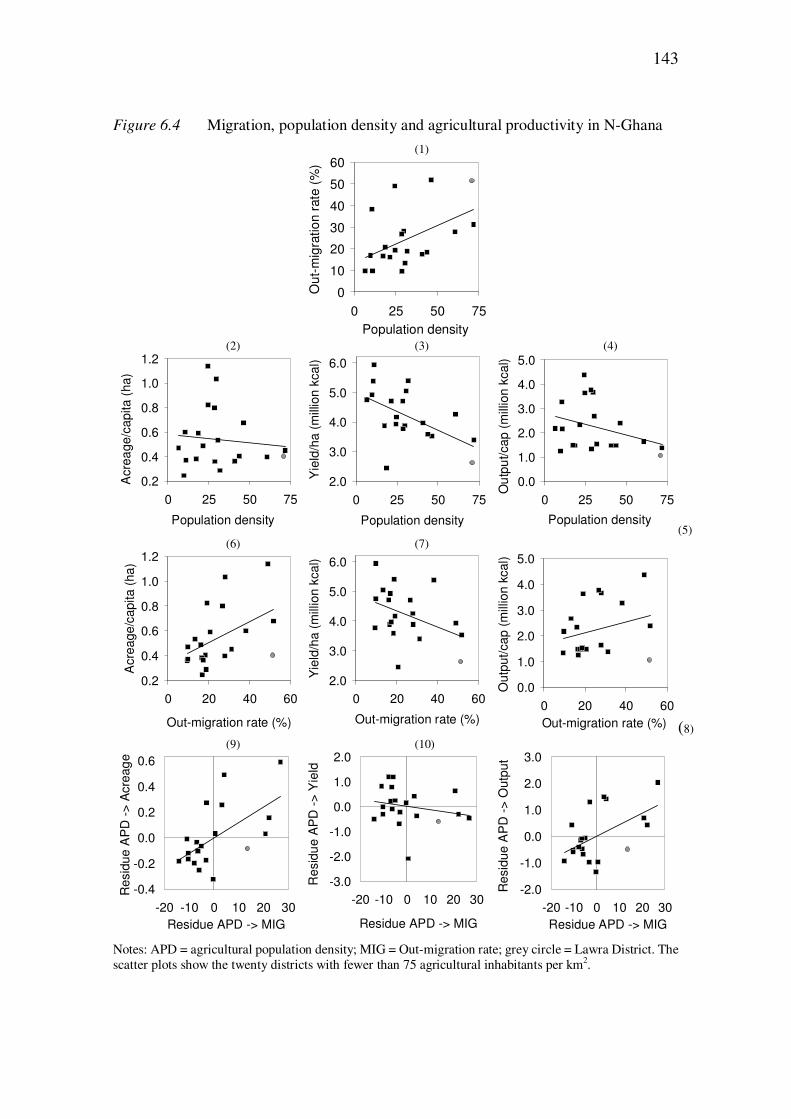
143
Figure 6.4 Migration, population density and agricultural productivity in N-Ghana
(1)
0
10
20
30
40
50
60
0 25 50 75
Population densityO
ut-
mig
ratio
n r
ate
(%
)
(2) (3) (4)
0.2
0.4
0.6
0.8
1.0
1.2
0 25 50 75
Population density
Acre
ag
e/c
ap
ita
(h
a)
2.0
3.0
4.0
5.0
6.0
0 25 50 75
Population density
Yie
ld/h
a (
mill
ion
kca
l)
0.0
1.0
2.0
3.0
4.0
5.0
0 25 50 75
Population density
Ou
tpu
t/ca
p (
mill
ion
kca
l)
(5) (6) (7)
0.2
0.4
0.6
0.8
1.0
1.2
0 20 40 60
Out-migration rate (%)
Acre
ag
e/c
ap
ita
(h
a)
2.0
3.0
4.0
5.0
6.0
0 20 40 60
Out-migration rate (%)
Yie
ld/h
a (
mill
ion
kca
l)
0.0
1.0
2.0
3.0
4.0
5.0
0 20 40 60
Out-migration rate (%)
Ou
tpu
t/ca
p (
mill
ion
kca
l)
(8) (9) (10)
-0.4
-0.2
0.0
0.2
0.4
0.6
-20 -10 0 10 20 30
Residue APD -> MIG
Re
sid
ue
AP
D -
> A
cre
ag
e
-3.0
-2.0
-1.0
0.0
1.0
2.0
-20 -10 0 10 20 30
Residue APD -> MIG
Re
sid
ue
AP
D -
> Y
ield
-2.0
-1.0
0.0
1.0
2.0
3.0
-20 -10 0 10 20 30
Residue APD -> MIG
Re
sid
ue
AP
D -
> O
utp
ut
Notes: APD = agricultural population density; MIG = Out-migration rate; grey circle = Lawra District. The scatter plots show the twenty districts with fewer than 75 agricultural inhabitants per km2.
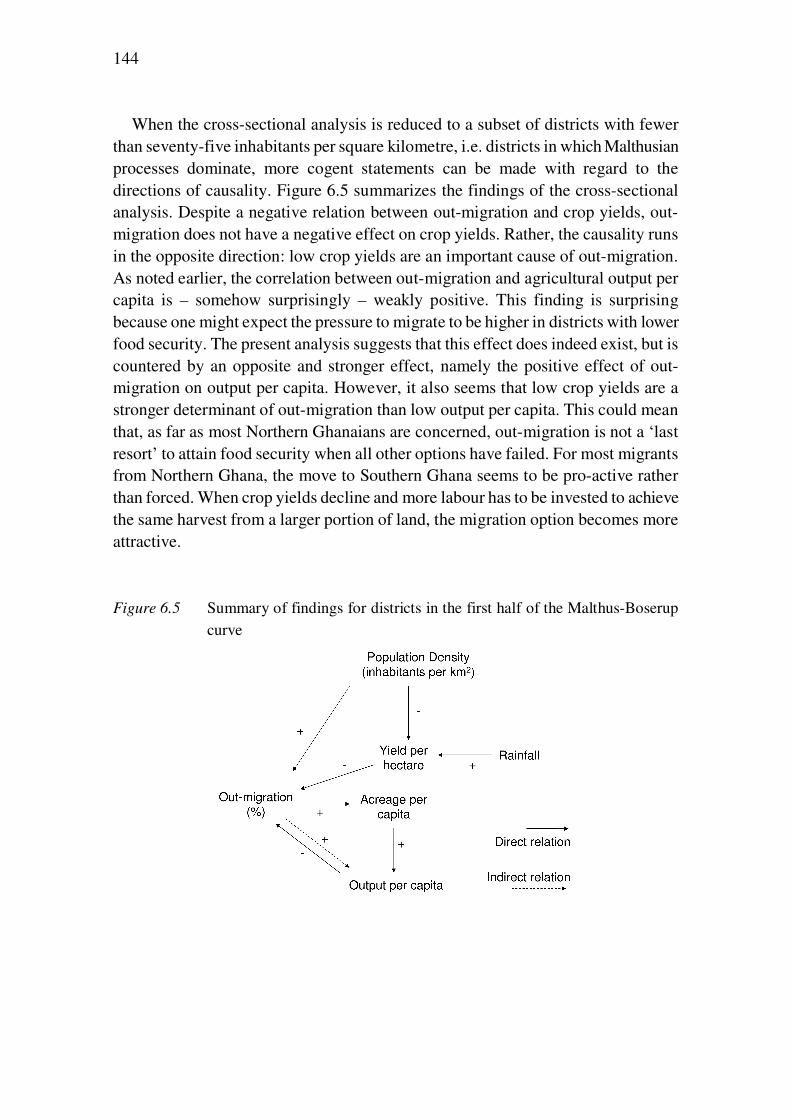
144
When the cross-sectional analysis is reduced to a subset of districts with fewer than seventy-five inhabitants per square kilometre, i.e. districts in which Malthusian processes dominate, more cogent statements can be made with regard to the directions of causality. Figure 6.5 summarizes the findings of the cross-sectional analysis. Despite a negative relation between out-migration and crop yields, out-migration does not have a negative effect on crop yields. Rather, the causality runs in the opposite direction: low crop yields are an important cause of out-migration. As noted earlier, the correlation between out-migration and agricultural output per capita is – somehow surprisingly – weakly positive. This finding is surprising because one might expect the pressure to migrate to be higher in districts with lower food security. The present analysis suggests that this effect does indeed exist, but is countered by an opposite and stronger effect, namely the positive effect of out-migration on output per capita. However, it also seems that low crop yields are a stronger determinant of out-migration than low output per capita. This could mean that, as far as most Northern Ghanaians are concerned, out-migration is not a ‘last resort’ to attain food security when all other options have failed. For most migrants from Northern Ghana, the move to Southern Ghana seems to be pro-active rather than forced. When crop yields decline and more labour has to be invested to achieve the same harvest from a larger portion of land, the migration option becomes more attractive. Figure 6.5 Summary of findings for districts in the first half of the Malthus-Boserup
curve
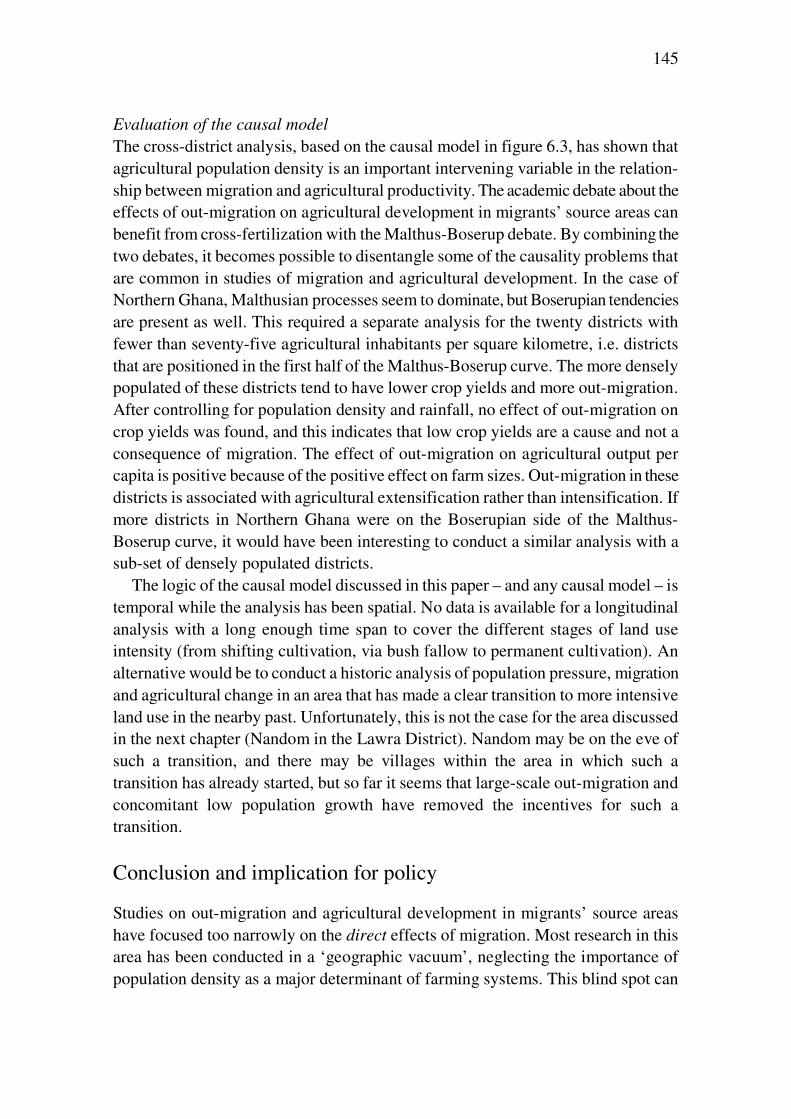
145
Evaluation of the causal model
The cross-district analysis, based on the causal model in figure 6.3, has shown that agricultural population density is an important intervening variable in the relation-ship between migration and agricultural productivity. The academic debate about the effects of out-migration on agricultural development in migrants’ source areas can benefit from cross-fertilization with the Malthus-Boserup debate. By combining the two debates, it becomes possible to disentangle some of the causality problems that are common in studies of migration and agricultural development. In the case of Northern Ghana, Malthusian processes seem to dominate, but Boserupian tendencies are present as well. This required a separate analysis for the twenty districts with fewer than seventy-five agricultural inhabitants per square kilometre, i.e. districts that are positioned in the first half of the Malthus-Boserup curve. The more densely populated of these districts tend to have lower crop yields and more out-migration. After controlling for population density and rainfall, no effect of out-migration on crop yields was found, and this indicates that low crop yields are a cause and not a consequence of migration. The effect of out-migration on agricultural output per capita is positive because of the positive effect on farm sizes. Out-migration in these districts is associated with agricultural extensification rather than intensification. If more districts in Northern Ghana were on the Boserupian side of the Malthus-Boserup curve, it would have been interesting to conduct a similar analysis with a sub-set of densely populated districts.
The logic of the causal model discussed in this paper – and any causal model – is temporal while the analysis has been spatial. No data is available for a longitudinal analysis with a long enough time span to cover the different stages of land use intensity (from shifting cultivation, via bush fallow to permanent cultivation). An alternative would be to conduct a historic analysis of population pressure, migration and agricultural change in an area that has made a clear transition to more intensive land use in the nearby past. Unfortunately, this is not the case for the area discussed in the next chapter (Nandom in the Lawra District). Nandom may be on the eve of such a transition, and there may be villages within the area in which such a transition has already started, but so far it seems that large-scale out-migration and concomitant low population growth have removed the incentives for such a transition.
Conclusion and implication for policy
Studies on out-migration and agricultural development in migrants’ source areas have focused too narrowly on the direct effects of migration. Most research in this area has been conducted in a ‘geographic vacuum’, neglecting the importance of population density as a major determinant of farming systems. This blind spot can
146
explain some of the mixed findings in the migration and agricultural development literature. Cross-fertilization with the Malthus-Boserup debate could offer an escape from this impasse.
A cross-district analysis of population density and agricultural productivity in Northern Ghana shows that there is a non-linear, U-shaped, relation between agricultural population density and crop yields. This curve could be labelled the Malthus-Boserup curve. In districts with fewer than 75 agricultural inhabitants per square kilometre, Malthusian processes dominate and increasing population density is associated with declining yields. Beyond this population threshold, however, Boserupian processes dominate and crop yields increase. Farmers in these areas have been able to make a successful shift to more intensive land use resulting in higher yields. The Malthus-Boserup curve has important implications for the study of migration and agricultural production.
The curve could be divided into three parts: low population density, medium population density and high population density. In areas that find themselves in the first part of the curve, with low population densities, out-migration rates tend to be low. An effect of out-migration in this stage is that it slows down population growth, making fallow periods and yields reduce less rapidly. A transition to more intensive land use is not yet necessary in this stage and it is unlikely that migrant savings and remittances will be invested in more intensive farm practices. In the second part of the curve, with medium population densities and lower crop yields resulting from reduced fallows and inadequate soil fertility management, out-migration rates are higher and population growth lower. In this stage, the need for a transition to more intensive land use is apparent, but the out-migration option may be more attractive, especially if there are suitable destination areas. An effect of out-migration in this stage is that it may remove the incentives for a land use transition, thereby keeping the area at the bottom of the Malthus-Boserup curve. In this stage, agricultural systems are in crisis and people become more dependent on remittances for survival. The third part of the curve, with high population densities, marks the transition to more intensive land use resulting in higher yields. If migration was driven purely by low crop yields – which it is not – out-migration rates could be expected to reduce during this stage. In reality, they are likely to remain high for some time. In this stage, investments of migrant savings and remittances in agriculture are more viable. An important question is: under what conditions were farming systems in the most densely populated areas able to intensify? Migration, remittances and return may play a role, but other factors, such as improved access to markets and a high density of government and NGO projects have probably been more decisive.
The findings from this chapter have important implications for government agencies and non-governmental organisations working in Northern Ghana. The course of the Malthus-Boserup curve depends to a large extent on market conditions,
147
infrastructure and support to farmers. For districts with medium population densities, which are at the bottom of the Malthus-Boserup curve, policy should focus on lowering the population threshold for a transition to more intensive and environmentally sustainable land use (see figure 6.6). In such areas, the need to intensify cultivation practices is apparent, but intensification requires substantial amounts of human and/or financial capital, and it may take some years before the fruits of increased labour and money input are reaped. In the short term, the out-migration option may seem easier and more rewarding, but out-migration diverts the attention away from livelihood sustainability problems in the long run. Moreover, the potential contribution of migration and remittances to agricultural development does not materialize as long as the conditions for investment of remittances in farming are poor. If agricultural investments become more viable, these areas can move from a position in which they partly depend on remittances for survival to a position in which remittances will be used to bring about more sustainable improvement in livelihoods. Figure 6.6 Policy implications
In recent years, large quantities of oil and gas were found just off the coast of Ghana and exploitation of these resources will start soon. The government would do well to avoid a similar path as nearby Nigeria where the oil boom of the 1970s resulted in agricultural decline, urban bias and uneven development (Watts 1988; Nyatepo-Coo 1994; Berry 2008). A Comparative study of four minerals-dependent countries shows that a focus on small-scale agriculture, as has been common in Indonesia, produces the most sustainable effects on development (Berry 2008). An
148
important lesson from Berry’s study is that large-scale investment in capital-intensive development in countries with a labour surplus produces undesirable effects. This is the moment for the Ghanaian government and its international partners to create the conditions for viable agricultural livelihoods and poverty reduction in Northern Ghana. The objective should not be to reduce migration, but to enable migrants and their relatives at home to realize the full development potential of migration and remittances in their strategy to attain more sustainable livelihoods. The findings from this study suggest that policies should be tailored to suit the specific needs of areas at different stages of transition to more intensive land use.
7 Migration and agricultural development in Nandom, Northwest Ghana
Introduction
Just like the previous chapter, the present chapter looks at the impact of out-migration on agricultural development, but the focus shifts (1) from Northern Ghana to the Nandom Area in Lawra District; (2) from outcomes to mechanisms; and (3) from secondary data to primary data. The main tool to analyse the relation between migration and agricultural development is a questionnaire survey carried out among 204 farm households. Another difference with the previous chapter is that this chapter does not only look at long-term migration, but also at seasonal migration and return migration.
The primary data gathering for this research took place in the Nandom Area in the extreme Northwest of Ghana, close to the border with Burkina Faso. Nandom lies in the Lawra District of the Upper West Region. The Nandom Traditional Area covers about half the district surface and is home to about half the district population. The area is situated in the Guinea Savannah and has one rainy season, lasting approxi-mately from May to October. Annual rainfall fluctuates around 900 millimetres per year (see figure 7.1). After a number of dry years in the 1980s, rainfall levels have recovered in the 1990s and 2000s, but farmers in the area complain that rainfall has become more erratic and this is confirmed by intra-annual rainfall data (Van der Geest 2004).
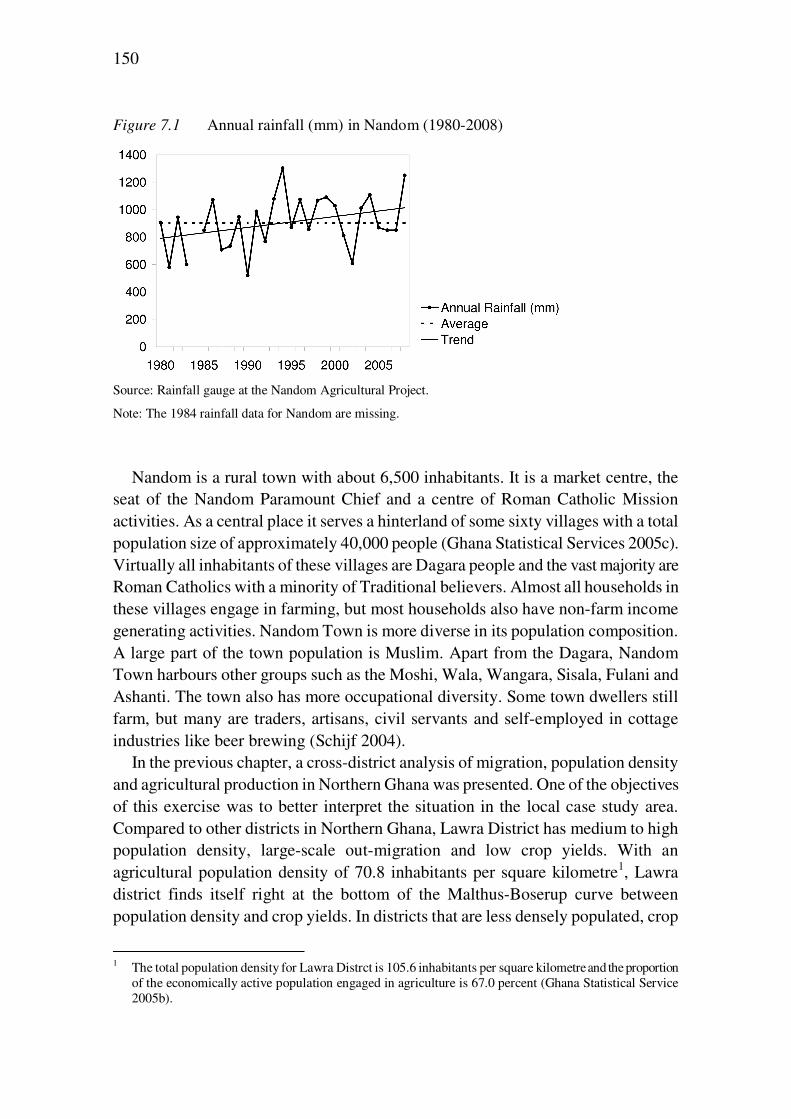
150
Figure 7.1 Annual rainfall (mm) in Nandom (1980-2008)
Source: Rainfall gauge at the Nandom Agricultural Project.
Note: The 1984 rainfall data for Nandom are missing.
Nandom is a rural town with about 6,500 inhabitants. It is a market centre, the seat of the Nandom Paramount Chief and a centre of Roman Catholic Mission activities. As a central place it serves a hinterland of some sixty villages with a total population size of approximately 40,000 people (Ghana Statistical Services 2005c). Virtually all inhabitants of these villages are Dagara people and the vast majority are Roman Catholics with a minority of Traditional believers. Almost all households in these villages engage in farming, but most households also have non-farm income generating activities. Nandom Town is more diverse in its population composition. A large part of the town population is Muslim. Apart from the Dagara, Nandom Town harbours other groups such as the Moshi, Wala, Wangara, Sisala, Fulani and Ashanti. The town also has more occupational diversity. Some town dwellers still farm, but many are traders, artisans, civil servants and self-employed in cottage industries like beer brewing (Schijf 2004).
In the previous chapter, a cross-district analysis of migration, population density and agricultural production in Northern Ghana was presented. One of the objectives of this exercise was to better interpret the situation in the local case study area. Compared to other districts in Northern Ghana, Lawra District has medium to high population density, large-scale out-migration and low crop yields. With an agricultural population density of 70.8 inhabitants per square kilometre1, Lawra district finds itself right at the bottom of the Malthus-Boserup curve between population density and crop yields. In districts that are less densely populated, crop
1 The total population density for Lawra Distrct is 105.6 inhabitants per square kilometre and the proportion
of the economically active population engaged in agriculture is 67.0 percent (Ghana Statistical Service 2005b).
151
yields tend to be higher. In such districts, land is less scarce, allowing for longer fallows. The districts that are more densely populated than Lawra seem to have made a transition to more intensive land use resulting in higher yields. In such districts, the old system of bush fallowing has been replaced by soil fertility management strategies that allow for more permanent cultivation without a decline in yields. In Lawra District the need for such a land use transition is apparent, but the aggregate production data suggest that no such transition has taken place yet. In the next section, the agricultural production data for Lawra are studied in some more detail.
In the early 1990s, Runge-Metzger & Diehl (1993) carried out a large research project that classified and described farming systems in Northern Ghana. In their geographic distribution of farming systems, Lawra District has a high population density farming system in which – compared to low density systems – compound farms are more important than bush farms; in which land is more of a constraint than labour and in which low soil fertility is more of a problem than lack of infrastructure (ibid: 164). In the compound farming system, the fields surrounding the house are farmed permanently. Household waste and animal droppings are used to maintain the fertility of those fields. Besides the compound farm most households have fields at varying distances from the house.2 Contrary to the compound farms, these fields are periodically left to fallow.
Due to large-scale out-migration, population growth in Lawra District has been relatively slow: about fifty percent between 1970 and 2000 (1.3 percent annually) against a national average of 120 percent (or 2.7 percent annually). The picture that emerges for Lawra District is that out-migration may have been regarded as a more attractive or feasible livelihood option than agricultural intensification. Whereas out-migration has the potential to contribute to agricultural development in various ways, it can also remove the incentives for agricultural change. In other words, migration can ‘allow’ farming systems to stand still. The cross-district analysis presented in Chapter six indicates that this may indeed be the case in Lawra District. The survey data presented in this chapter confirm that agricultural productivity is very low, but also reveal some changes in the local farming system.
In Runge-Metzger & Diehl’s (1993) study of farming systems in Northern Ghana, population density was the main determinant of agricultural practices, but they acknowledge that agricultural systems and agrarian change are not determined by population density and population growth alone. Other factors such as market conditions and interventions by external actors, like the government, NGOs and the private sector, can play an important role. To assess the impact of rural out-migration on agricultural development in Nandom, as is the objective of this
2 In the Nandom sample, 95.4 percent of the fields were located within four kilometre distance from the
house.
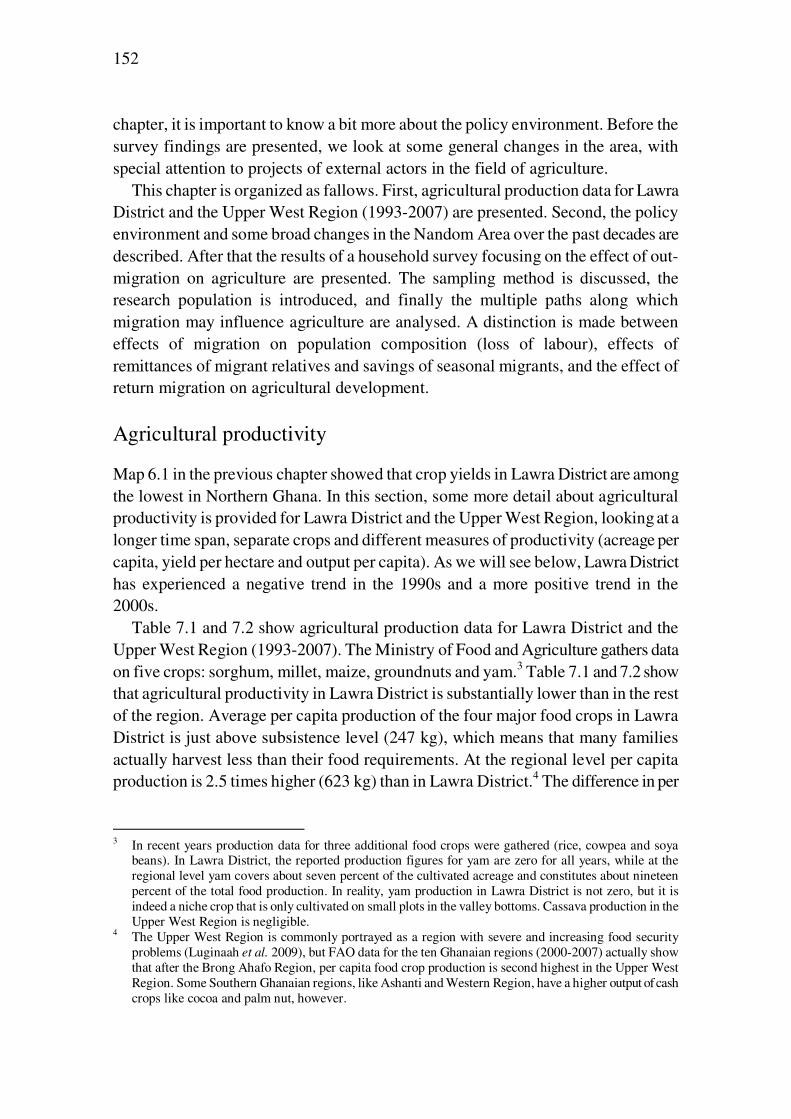
152
chapter, it is important to know a bit more about the policy environment. Before the survey findings are presented, we look at some general changes in the area, with special attention to projects of external actors in the field of agriculture.
This chapter is organized as fallows. First, agricultural production data for Lawra District and the Upper West Region (1993-2007) are presented. Second, the policy environment and some broad changes in the Nandom Area over the past decades are described. After that the results of a household survey focusing on the effect of out-migration on agriculture are presented. The sampling method is discussed, the research population is introduced, and finally the multiple paths along which migration may influence agriculture are analysed. A distinction is made between effects of migration on population composition (loss of labour), effects of remittances of migrant relatives and savings of seasonal migrants, and the effect of return migration on agricultural development.
Agricultural productivity
Map 6.1 in the previous chapter showed that crop yields in Lawra District are among the lowest in Northern Ghana. In this section, some more detail about agricultural productivity is provided for Lawra District and the Upper West Region, looking at a longer time span, separate crops and different measures of productivity (acreage per capita, yield per hectare and output per capita). As we will see below, Lawra District has experienced a negative trend in the 1990s and a more positive trend in the 2000s.
Table 7.1 and 7.2 show agricultural production data for Lawra District and the Upper West Region (1993-2007). The Ministry of Food and Agriculture gathers data on five crops: sorghum, millet, maize, groundnuts and yam.3 Table 7.1 and 7.2 show that agricultural productivity in Lawra District is substantially lower than in the rest of the region. Average per capita production of the four major food crops in Lawra District is just above subsistence level (247 kg), which means that many families actually harvest less than their food requirements. At the regional level per capita production is 2.5 times higher (623 kg) than in Lawra District.4 The difference in per
3 In recent years production data for three additional food crops were gathered (rice, cowpea and soya
beans). In Lawra District, the reported production figures for yam are zero for all years, while at the regional level yam covers about seven percent of the cultivated acreage and constitutes about nineteen percent of the total food production. In reality, yam production in Lawra District is not zero, but it is indeed a niche crop that is only cultivated on small plots in the valley bottoms. Cassava production in the Upper West Region is negligible.
4 The Upper West Region is commonly portrayed as a region with severe and increasing food security problems (Luginaah et al. 2009), but FAO data for the ten Ghanaian regions (2000-2007) actually show that after the Brong Ahafo Region, per capita food crop production is second highest in the Upper West Region. Some Southern Ghanaian regions, like Ashanti and Western Region, have a higher output of cash crops like cocoa and palm nut, however.
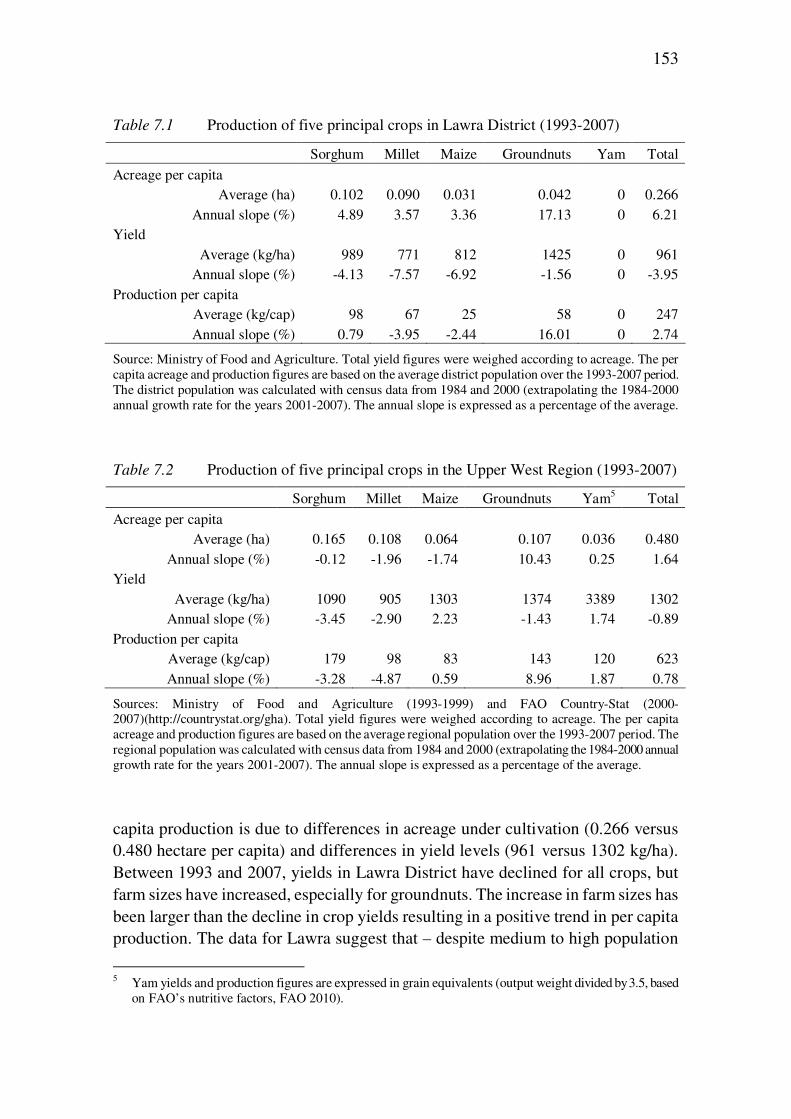
153
Table 7.1 Production of five principal crops in Lawra District (1993-2007)
Sorghum Millet Maize Groundnuts Yam Total
Acreage per capita Average (ha) 0.102 0.090 0.031 0.042 0 0.266
Annual slope (%) 4.89 3.57 3.36 17.13 0 6.21 Yield
Average (kg/ha) 989 771 812 1425 0 961 Annual slope (%) -4.13 -7.57 -6.92 -1.56 0 -3.95
Production per capita
Average (kg/cap) 98 67 25 58 0 247 Annual slope (%) 0.79 -3.95 -2.44 16.01 0 2.74
Source: Ministry of Food and Agriculture. Total yield figures were weighed according to acreage. The per capita acreage and production figures are based on the average district population over the 1993-2007 period. The district population was calculated with census data from 1984 and 2000 (extrapolating the 1984-2000 annual growth rate for the years 2001-2007). The annual slope is expressed as a percentage of the average.
Table 7.2 Production of five principal crops in the Upper West Region (1993-2007)
Sorghum Millet Maize Groundnuts Yam5 Total
Acreage per capita Average (ha) 0.165 0.108 0.064 0.107 0.036 0.480
Annual slope (%) -0.12 -1.96 -1.74 10.43 0.25 1.64 Yield
Average (kg/ha) 1090 905 1303 1374 3389 1302 Annual slope (%) -3.45 -2.90 2.23 -1.43 1.74 -0.89
Production per capita
Average (kg/cap) 179 98 83 143 120 623 Annual slope (%) -3.28 -4.87 0.59 8.96 1.87 0.78
Sources: Ministry of Food and Agriculture (1993-1999) and FAO Country-Stat (2000-2007)(http://countrystat.org/gha). Total yield figures were weighed according to acreage. The per capita acreage and production figures are based on the average regional population over the 1993-2007 period. The regional population was calculated with census data from 1984 and 2000 (extrapolating the 1984-2000 annual growth rate for the years 2001-2007). The annual slope is expressed as a percentage of the average.
capita production is due to differences in acreage under cultivation (0.266 versus 0.480 hectare per capita) and differences in yield levels (961 versus 1302 kg/ha). Between 1993 and 2007, yields in Lawra District have declined for all crops, but farm sizes have increased, especially for groundnuts. The increase in farm sizes has been larger than the decline in crop yields resulting in a positive trend in per capita production. The data for Lawra suggest that – despite medium to high population
5 Yam yields and production figures are expressed in grain equivalents (output weight divided by 3.5, based
on FAO’s nutritive factors, FAO 2010).
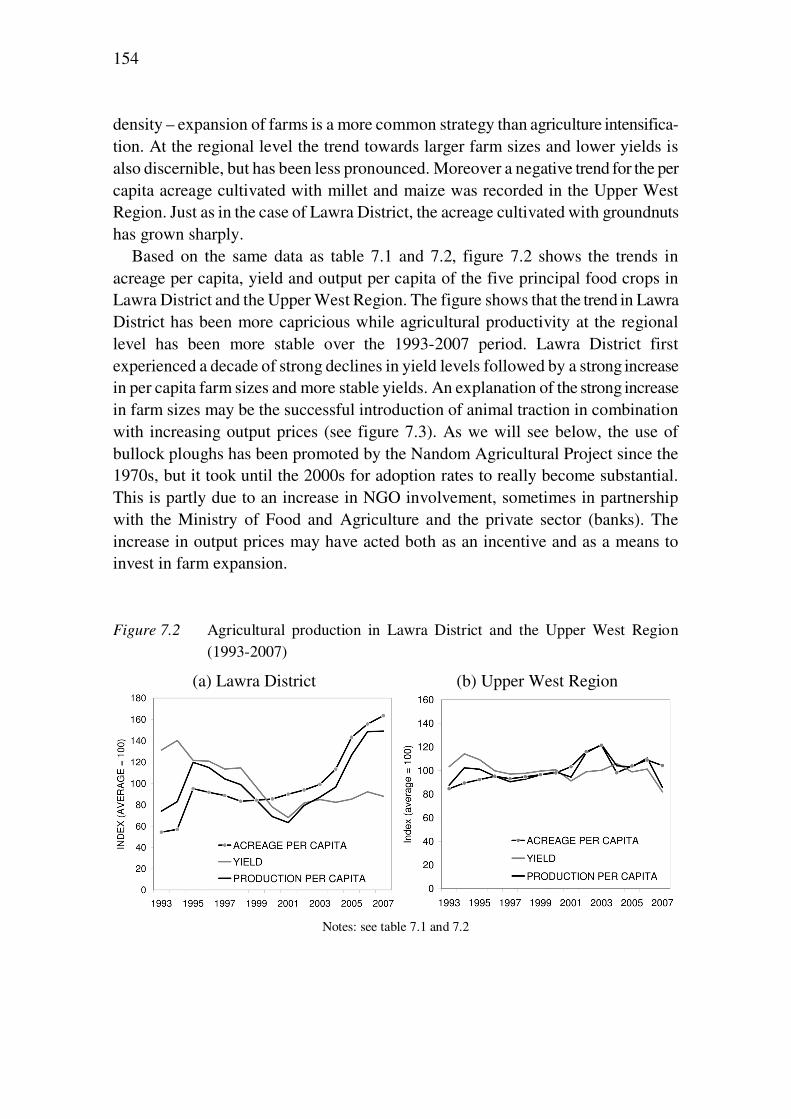
154
density – expansion of farms is a more common strategy than agriculture intensifica-tion. At the regional level the trend towards larger farm sizes and lower yields is also discernible, but has been less pronounced. Moreover a negative trend for the per capita acreage cultivated with millet and maize was recorded in the Upper West Region. Just as in the case of Lawra District, the acreage cultivated with groundnuts has grown sharply.
Based on the same data as table 7.1 and 7.2, figure 7.2 shows the trends in acreage per capita, yield and output per capita of the five principal food crops in Lawra District and the Upper West Region. The figure shows that the trend in Lawra District has been more capricious while agricultural productivity at the regional level has been more stable over the 1993-2007 period. Lawra District first experienced a decade of strong declines in yield levels followed by a strong increase in per capita farm sizes and more stable yields. An explanation of the strong increase in farm sizes may be the successful introduction of animal traction in combination with increasing output prices (see figure 7.3). As we will see below, the use of bullock ploughs has been promoted by the Nandom Agricultural Project since the 1970s, but it took until the 2000s for adoption rates to really become substantial. This is partly due to an increase in NGO involvement, sometimes in partnership with the Ministry of Food and Agriculture and the private sector (banks). The increase in output prices may have acted both as an incentive and as a means to invest in farm expansion. Figure 7.2 Agricultural production in Lawra District and the Upper West Region
(1993-2007)
(a) Lawra District (b) Upper West Region
Notes: see table 7.1 and 7.2
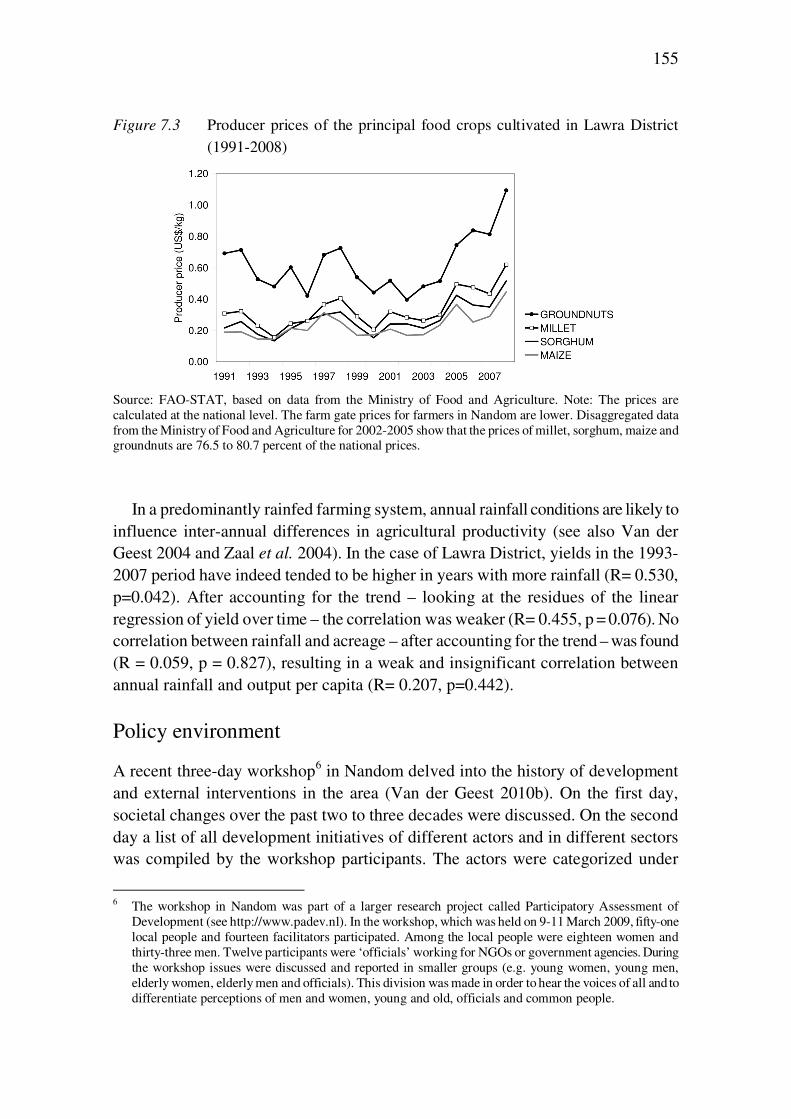
155
Figure 7.3 Producer prices of the principal food crops cultivated in Lawra District (1991-2008)
Source: FAO-STAT, based on data from the Ministry of Food and Agriculture. Note: The prices are calculated at the national level. The farm gate prices for farmers in Nandom are lower. Disaggregated data from the Ministry of Food and Agriculture for 2002-2005 show that the prices of millet, sorghum, maize and groundnuts are 76.5 to 80.7 percent of the national prices.
In a predominantly rainfed farming system, annual rainfall conditions are likely to influence inter-annual differences in agricultural productivity (see also Van der Geest 2004 and Zaal et al. 2004). In the case of Lawra District, yields in the 1993-2007 period have indeed tended to be higher in years with more rainfall (R= 0.530, p=0.042). After accounting for the trend – looking at the residues of the linear regression of yield over time – the correlation was weaker (R= 0.455, p = 0.076). No correlation between rainfall and acreage – after accounting for the trend – was found (R = 0.059, p = 0.827), resulting in a weak and insignificant correlation between annual rainfall and output per capita (R= 0.207, p=0.442).
Policy environment
A recent three-day workshop6 in Nandom delved into the history of development and external interventions in the area (Van der Geest 2010b). On the first day, societal changes over the past two to three decades were discussed. On the second day a list of all development initiatives of different actors and in different sectors was compiled by the workshop participants. The actors were categorized under
6 The workshop in Nandom was part of a larger research project called Participatory Assessment of
Development (see http://www.padev.nl). In the workshop, which was held on 9-11 March 2009, fifty-one local people and fourteen facilitators participated. Among the local people were eighteen women and thirty-three men. Twelve participants were ‘officials’ working for NGOs or government agencies. During the workshop issues were discussed and reported in smaller groups (e.g. young women, young men, elderly women, elderly men and officials). This division was made in order to hear the voices of all and to differentiate perceptions of men and women, young and old, officials and common people.
156
government agencies, faith-based organisations, secular NGOs, supra-national agencies and the private sector. Among the intervention sectors were education, health, infrastructure, water, agriculture, credit, environment, religion and social cohesion. On the third day, the projects on the list were evaluated, looking inter alia at their contribution to positive and negative changes in the area. The workshop revealed that the Roman Catholic Mission, established in 1933, played a very important role in Nandom. Right from the establishment of the Catholic Church, the ‘White Fathers’7 dedicated much of their time to development (see also McCoy 1988; Hawkins 1997). They initially concentrated their efforts on education and health, and later expanded to other sectors like credit, water, agriculture and environment. The Roman Catholic Mission in Nandom has acted as a kind of pseudo-government for decades. The White Fathers and different congregations of Reverend Brothers and Sisters established the first schools and clinics, a hospital, a credit union and an agricultural project long before governmental agencies started to play a significant role. The government and secular NGOs became more active in the area in the 1990s.
The workshop exercise about perceptions of change over the past two to three decades looked at changes in six domains: the natural environment, the physical or man-made environment, human capital, the local economy, the social and political domain and culture (religion, language, ethnicity, food habits, clothing, traditional rites, music and moral codes). The exercise showed that in the eyes of the participants much has improved in the past few decades. Positive changes outweighed negatives changes in most domains. The most outstanding improve-ments were noted in the physical, human and economic domains. Non-farm income opportunities have increased; there has been a large improvement in access to water, reducing the incidence of water-borne diseases; school enrolment has increased sharply; healthcare has become more accessible due to the National Health Insurance Scheme; the position of women in social and economic life has improved; and contact with the rest of the country (and beyond) has been facilitated due to improvements in roads, connection to the electricity grid and more recently the establishment of mobile phone networks. Negative changes were mentioned much less frequently. Moreover, these changes were often adverse effects of positively evaluated changes (e.g. high electricity bills). Most negative trends were noted in the environmental and cultural domain. Examples of negative changes are land degradation and the loss of Dagara culture. In the field of agriculture and environ-ment, both positive and negative changes were mentioned by the workshop participants (see table 7.3). The perceptions of change indicate that the Nandom Area is in a stage of agricultural crisis (declining yields, reduced farm sizes, less
7 The ‘White Fathers’ are the ‘Missionaries of Africa’. Their name does not refer to the color of their skin,
but the color of their dresses.
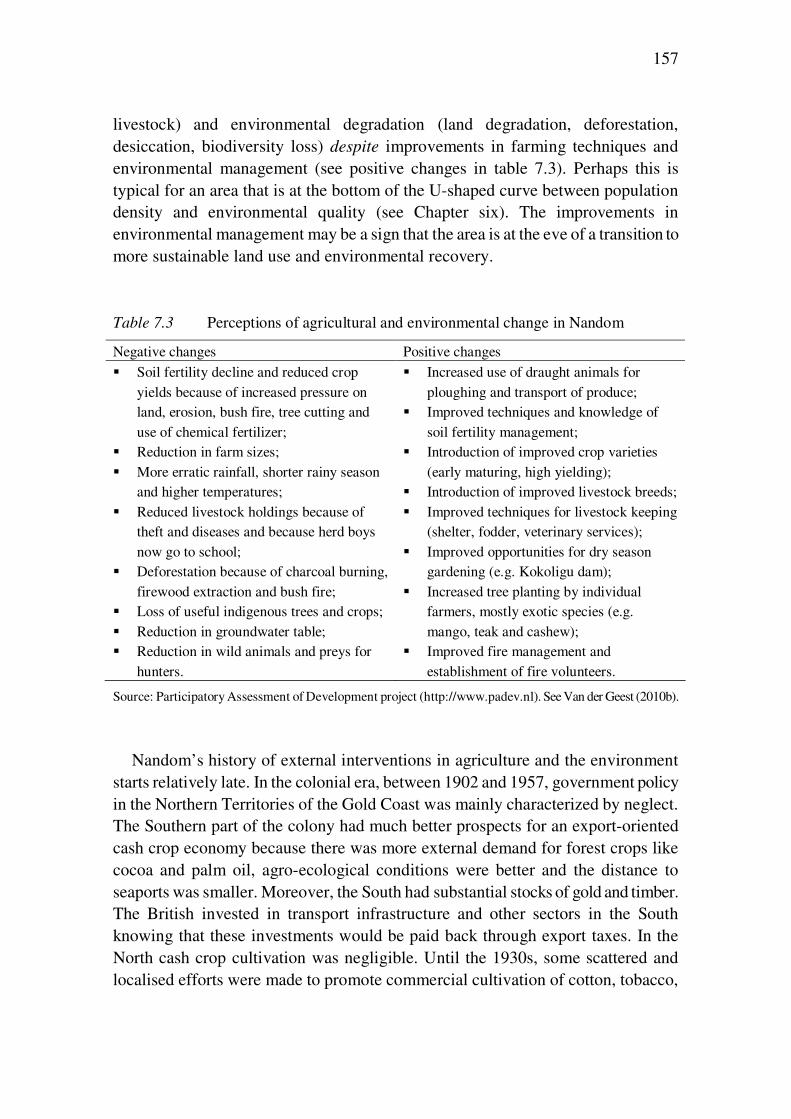
157
livestock) and environmental degradation (land degradation, deforestation, desiccation, biodiversity loss) despite improvements in farming techniques and environmental management (see positive changes in table 7.3). Perhaps this is typical for an area that is at the bottom of the U-shaped curve between population density and environmental quality (see Chapter six). The improvements in environmental management may be a sign that the area is at the eve of a transition to more sustainable land use and environmental recovery. Table 7.3 Perceptions of agricultural and environmental change in Nandom
Negative changes Positive changes
� Soil fertility decline and reduced crop yields because of increased pressure on land, erosion, bush fire, tree cutting and use of chemical fertilizer;
� Reduction in farm sizes; � More erratic rainfall, shorter rainy season
and higher temperatures; � Reduced livestock holdings because of
theft and diseases and because herd boys now go to school;
� Deforestation because of charcoal burning, firewood extraction and bush fire;
� Loss of useful indigenous trees and crops; � Reduction in groundwater table; � Reduction in wild animals and preys for
hunters.
� Increased use of draught animals for ploughing and transport of produce;
� Improved techniques and knowledge of soil fertility management;
� Introduction of improved crop varieties (early maturing, high yielding);
� Introduction of improved livestock breeds; � Improved techniques for livestock keeping
(shelter, fodder, veterinary services); � Improved opportunities for dry season
gardening (e.g. Kokoligu dam); � Increased tree planting by individual
farmers, mostly exotic species (e.g. mango, teak and cashew);
� Improved fire management and establishment of fire volunteers.
Source: Participatory Assessment of Development project (http://www.padev.nl). See Van der Geest (2010b).
Nandom’s history of external interventions in agriculture and the environment starts relatively late. In the colonial era, between 1902 and 1957, government policy in the Northern Territories of the Gold Coast was mainly characterized by neglect. The Southern part of the colony had much better prospects for an export-oriented cash crop economy because there was more external demand for forest crops like cocoa and palm oil, agro-ecological conditions were better and the distance to seaports was smaller. Moreover, the South had substantial stocks of gold and timber. The British invested in transport infrastructure and other sectors in the South knowing that these investments would be paid back through export taxes. In the North cash crop cultivation was negligible. Until the 1930s, some scattered and localised efforts were made to promote commercial cultivation of cotton, tobacco,
158
indigo, groundnut, rice, sheanut and dawadawa. These efforts were not successful, however, partly because of production constraints, but mostly because the policies were implemented half-heartedly. In the late 1930s agricultural policy in the Northern Territories shifted towards an attempt to increase the productivity of subsistence crops through the introduction of mixed farming (use of bullock ploughs and application of manure). This policy was more sensible because the Northern savanna was and is particularly suitable for crop-livestock integration. However, this policy also failed because of poor implementation and lack of funding (Der; 1979; Sutton 1989). Most colonial officers that were stationed in the North were genuine in their intentions to contribute to better living standards in Northern Ghana, but their efforts were frustrated by officers in the South and the U.K. who were reluctant to invest in infrastructure and extension services. An infamous quote by colonial governor Frederick Hodgson illustrates this. He wrote:
“I would not at present spend upon the Northern Territories – upon in fact the hinterland of the Colony – a single penny more than is absolutely necessary for their suitable administration and the encouragement of the transit trade.” Ladouceur (1979: 45)
On several occasions, there have been plans to construct a railroad to the North, but these plans never materialized because the investment costs were deemed too high. In the absence of a tradition of cash crop cultivation, it was not sure whether the investment would pay itself back. Ironically, the non-investment in transport infrastructure prevented growth in the agricultural economy. Without good access to urban or international markets, agriculture in Northern Ghana remained subsistence-oriented. According to several authors (Thomas 1973; Plange 1979; Shepherd 1981; Cleveland 1991), colonial neglect in the Northern Territories was part of a larger policy to extract surplus (in the form of migrant labour) from the North for development in the South. Following Frank’s (1969) centre-periphery model, they argue that this is a principal cause of underdevelopment in Northern Ghana. Sutton (1989) broadly shares the policy analyses of these authors, but she is more careful in her judgment about the long-term impact of colonial policy and labour migration in Northern Ghana. According to her the scale of surplus extraction was not large enough to cause serious damage. The northern farm-based economy simply changed very little during the colonial period. Agriculture did not collapse, nor did it improve much. In that sense the term non-development would be more appropriate than the term underdevelopment. Sutton concludes: “Frank’s [centre-periphery] model assumes that if the centre proceeds forward, the periphery regresses, but in this case the periphery simply changed less and more slowly; the aim of colonial policy was to develop the South, ignoring (my emphasis) rather than underdeveloping the north” (Sutton 1989: 169).
In the Nandom workshop, the only colonial government intervention in agricul-ture that was mentioned involved vaccination of livestock in the 1950s. During
159
colonial rule, some forest reserves were also created at the fringes of the Nandom Area. After independence in 1957, neglect of the North largely continued. In its optimism, the first colonial government initiated some rather unrealistic and overly ‘modern’ projects that centred on mechanization (e.g. the Gonja groundnut scheme) and industrialization (e.g. a meat factory in Bolgatanga). These projects became expensive failures (Quansah 1972; Kelly & Benning 2007). Moreover, policies of most post-independence governments had a strong urban bias (Shepherd 1981). Food prices were kept artificially low to appease the urban population. In the mid 1980s, when Ghana implemented the structural adjustment policies designed by the International Monetary Fund, price regulation was gradually abandoned, which could have benefitted food crop farmers. However, structural adjustment also forced the government to remove subsidies on fertilisers and extension services and to accept cheap food imports, which deteriorated the conditions for food crop farmers.8 After a sequence of military rules, coups d’état and poor governance in the 1960s, 1970s and 1980s – aggravated by a period of climatic and environmental stress – the return to democracy in 1992 marked the beginning of a period of better governance. In Nandom, the only in situ government intervention in agriculture in the post-independence and pre-democracy era was the Farmer Services Company (FASCOM), a store selling seeds, inorganic fertiliser, pesticides and tools at reduced prices. In the workshop in Nandom, this intervention was evaluated very negatively because of mismanagement and corruption by its clerks. In this era of poor governance, the Catholic Mission started the Nandom Agricultural Project (NAP, 1973) and the Nandom Food Farmers Cooperatives Union (NACOP, 1977). These projects are still operational at present. NAP provides technical know-how and inputs. NACOP organises the farmers and provides loans or helps farmers to get access to loans from other organizations and from the Nandom Rural Bank. Initially, the focus of the agricultural project was on promoting animal traction. Inputs were sold at moderate prices and farmers were trained to use draught animals to plough. Adoption of bullock farming was quite low initially, but in the past few years substantial numbers of farmers have started to use ploughs.9 Besides promoting animal traction, the agricultural project has engaged in a wide range of extension activities in the field of rainfed agriculture, dry season gardening, tree planting and animal husbandry (see table 7.4). In the early 2000s, the main donor organisation (Cordaid from the Netherlands) withdrew its support to the Diocesan Development Office in the regional capital Wa. This organization channelled resources to local
8 The policy changes in the mid 1980s were more beneficial to the (export-oriented) cocoa sector. The
objective of the structural adjustment was to get public spending in balance with government revenues. Taxed export of cocoa played an important role in generating more revenues.
9 In a survey of 204 households thirty-one percent had used bullocks, donkeys or a tractor to plough at least one of their fields (see below).
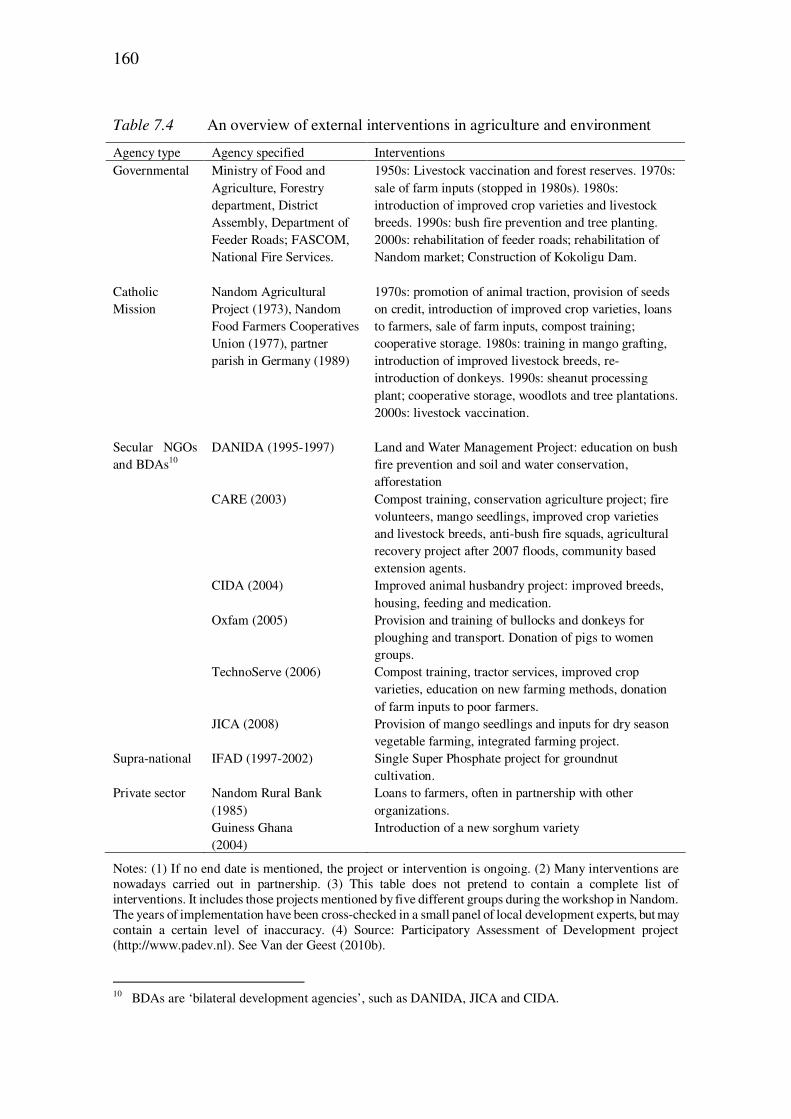
160
Table 7.4 An overview of external interventions in agriculture and environment
Agency type Agency specified Interventions Governmental Ministry of Food and
Agriculture, Forestry department, District Assembly, Department of Feeder Roads; FASCOM, National Fire Services.
1950s: Livestock vaccination and forest reserves. 1970s: sale of farm inputs (stopped in 1980s). 1980s: introduction of improved crop varieties and livestock breeds. 1990s: bush fire prevention and tree planting. 2000s: rehabilitation of feeder roads; rehabilitation of Nandom market; Construction of Kokoligu Dam.
Catholic Mission
Nandom Agricultural Project (1973), Nandom Food Farmers Cooperatives Union (1977), partner parish in Germany (1989)
1970s: promotion of animal traction, provision of seeds on credit, introduction of improved crop varieties, loans to farmers, sale of farm inputs, compost training; cooperative storage. 1980s: training in mango grafting, introduction of improved livestock breeds, re-introduction of donkeys. 1990s: sheanut processing plant; cooperative storage, woodlots and tree plantations. 2000s: livestock vaccination.
Secular NGOs and BDAs10
DANIDA (1995-1997) Land and Water Management Project: education on bush fire prevention and soil and water conservation, afforestation
CARE (2003) Compost training, conservation agriculture project; fire volunteers, mango seedlings, improved crop varieties and livestock breeds, anti-bush fire squads, agricultural recovery project after 2007 floods, community based extension agents.
CIDA (2004) Improved animal husbandry project: improved breeds, housing, feeding and medication.
Oxfam (2005) Provision and training of bullocks and donkeys for ploughing and transport. Donation of pigs to women groups.
TechnoServe (2006) Compost training, tractor services, improved crop varieties, education on new farming methods, donation of farm inputs to poor farmers.
JICA (2008) Provision of mango seedlings and inputs for dry season vegetable farming, integrated farming project.
Supra-national
IFAD (1997-2002) Single Super Phosphate project for groundnut cultivation.
Private sector Nandom Rural Bank (1985)
Loans to farmers, often in partnership with other organizations.
Guiness Ghana (2004)
Introduction of a new sorghum variety
Notes: (1) If no end date is mentioned, the project or intervention is ongoing. (2) Many interventions are nowadays carried out in partnership. (3) This table does not pretend to contain a complete list of interventions. It includes those projects mentioned by five different groups during the workshop in Nandom. The years of implementation have been cross-checked in a small panel of local development experts, but may contain a certain level of inaccuracy. (4) Source: Participatory Assessment of Development project (http://www.padev.nl). See Van der Geest (2010b).
10 BDAs are ‘bilateral development agencies’, such as DANIDA, JICA and CIDA.
161
NGOs, like the Nandom Agricultural Project. In recent years, NAP has survived mainly by partnering with international NGOs and government agencies, which do not have permanent offices in Nandom. Since the implementation of decentraliza-tion policies in 1988 and the return to democracy in 1992 there has been more government involvement in Nandom. More recently, new players appeared on the stage: the secular, mostly international NGOs.
Looking at the type of projects in the field of environment and agriculture (see table 7.4), it becomes clear that there is considerable overlap between different types of agencies. The most common interventions have been: promotion of animal traction, introduction of new crop varieties and livestock breeds, sale of farm inputs, improved livestock keeping, prevention of bush fire, tree planting and soil fertility management. A difference between governmental agencies and NGOs is that the former have put some emphasis on infrastructural projects, like the rehabilitation of feeder roads and the construction of a dam. The most important change over the past two decades is that the Nandom Agricultural Project no longer stands alone in promoting agricultural development. Throughout its existence, a limited budget and lack of man power have limited NAP’s capacity to really have a large impact on local agriculture. Their interventions were somehow piecemeal and lacked the critical mass to really get things moving. The number of projects in the field of agriculture and the natural environment has increased sharply in the last decade. This is not because agriculture receives more attention, but because nowadays there are more projects by external actors in general. The proportion of projects dedicated to agricultural development and environmental sustainability has been quite stable at 30 – 35 percent over the past three decades (Van der Geest 2010b). With the appearance of new players on the stage, and fruitful partnerships, it seems that the conditions are finally being created for Nandom to start moving out of its agricul-tural and environmental crisis. Figure 7.2 showed that agricultural output per capita in Lawra increased sharply in the past few years (mostly because of increased farm sizes; crop yields stabilized after a period of decline). This improvement largely coincided with the arrival of projects in the agricultural sector by organizations like CARE, CIDA, Oxfam and TechnoServe, increasing output prices (figure 7.3) and relatively good rainfall years (figure 7.1).
Survey and sample design
In the section below the findings from a questionnaire survey, administered among 204 rural households in the Nandom Area, are presented. The focus is on migration and land use. Non-farm income generating activities appear to play an important role, however, and will also be given attention. Before the more detailed analysis is presented, the sampling method and some general socio-demographic and economic
162
characteristics of the surveyed population are discussed that sketch a rough profile of the research area. The questionnaire had a broad livelihood setup, but with specific focus on migration history, remittances of migrant relatives, seasonal migration, land use and non-farm income. Special attention was paid to transfers of resources between different livelihood activities. When resources were invested in a certain activity – for example the purchase of a bullock plough – we asked which source of income they had used to make the investment.
The villages around Nandom Town predominantly have a dispersed settlement pattern and boundaries between villages are blurred. A particular house can belong to different villages depending on the type of boundary used (chieftaincy, administration, parish, census enumeration area). In this circumstance the con-ventional method of drawing a random sample from a list of houses or households at the village level was not suitable. Moreover, in the data gathering face, it was already envisaged that population density could be an important intervening variable in the migration – development nexus. A sample framework using villages with unclear boundaries would make it difficult to determine population density. Therefore it was decided to design a sample framework in which the dispersed settlement pattern and the need to determine population densities at the village level were accommodated. The method used could be labelled ‘area sampling’. The research area was divided in cells of 0.01 by 0.01 degrees (a bit more than a square kilometre). All cells were first numbered and then listed in random order. One by one, following the randomly ordered list, the cells were then visited with a GPS unit to determine which houses were located within the cell boundaries. All houses encountered were included11 in the survey sample. In the Nandom Area, it is common for a house (yir) to be divided in several courtyards (davra), each inhabited by a separate household. If a house was divided in several households, all household heads were interviewed. A quota of two hundred households was determined. After having surveyed eleven randomly selected cells, of which three turned out to be uninhabited, the quota was reached. The surveyed households comprised a total of 1,395 people or about 3.5 percent of the population in the research area. The population density could be determined by dividing the population size of each cell by its surface (1.21 square kilometre). The average population density in the eight inhabited cells was over 158 people per square kilometre (range: 26 – 293).
Some cells that were relatively densely populated were surrounded by more sparsely populated areas where the sampled households had some of their farms. Conversely, some sparsely populated cells were surrounded by more densely populated areas. Therefore, the crude population density did not adequately reflect the pressure on land. The majority of the fields cultivated by the respondents lay
11 Due to time constraints, only the Northern half of the last cell (Nabugangn) was covered. In the Southern
half of the cell we only determined the number of households and household members.
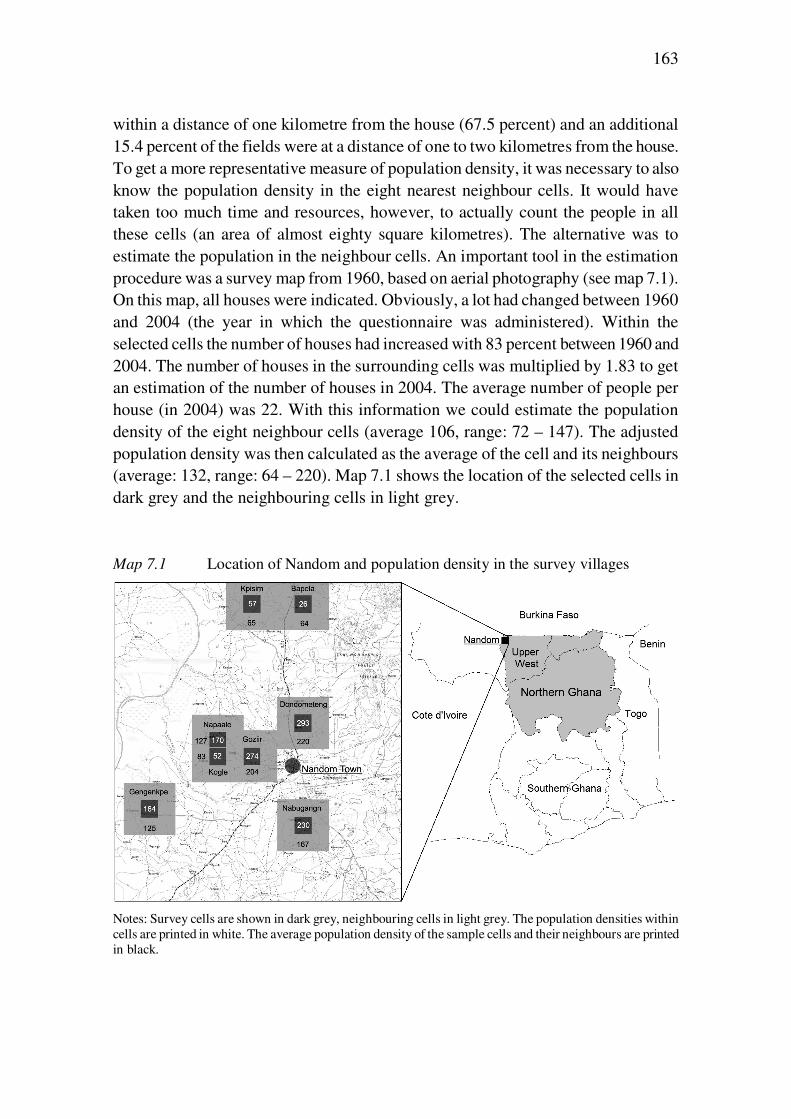
163
within a distance of one kilometre from the house (67.5 percent) and an additional 15.4 percent of the fields were at a distance of one to two kilometres from the house. To get a more representative measure of population density, it was necessary to also know the population density in the eight nearest neighbour cells. It would have taken too much time and resources, however, to actually count the people in all these cells (an area of almost eighty square kilometres). The alternative was to estimate the population in the neighbour cells. An important tool in the estimation procedure was a survey map from 1960, based on aerial photography (see map 7.1). On this map, all houses were indicated. Obviously, a lot had changed between 1960 and 2004 (the year in which the questionnaire was administered). Within the selected cells the number of houses had increased with 83 percent between 1960 and 2004. The number of houses in the surrounding cells was multiplied by 1.83 to get an estimation of the number of houses in 2004. The average number of people per house (in 2004) was 22. With this information we could estimate the population density of the eight neighbour cells (average 106, range: 72 – 147). The adjusted population density was then calculated as the average of the cell and its neighbours (average: 132, range: 64 – 220). Map 7.1 shows the location of the selected cells in dark grey and the neighbouring cells in light grey. Map 7.1 Location of Nandom and population density in the survey villages
Notes: Survey cells are shown in dark grey, neighbouring cells in light grey. The population densities within cells are printed in white. The average population density of the sample cells and their neighbours are printed in black.
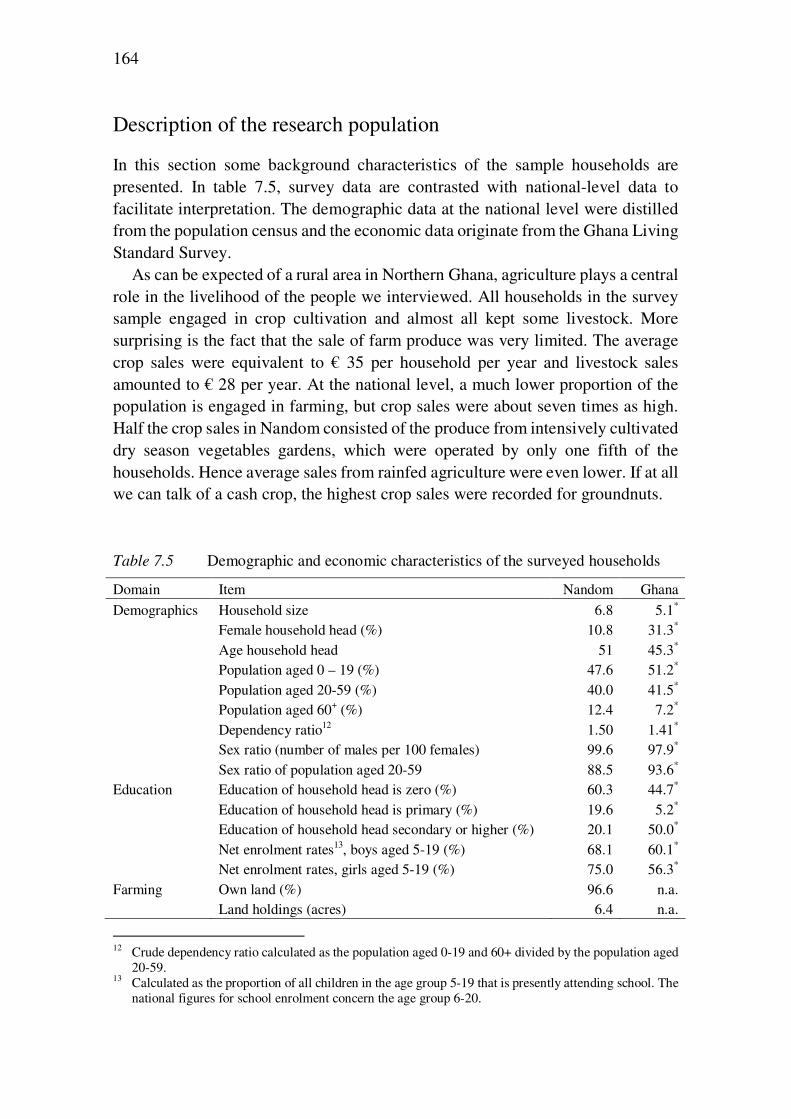
164
Description of the research population
In this section some background characteristics of the sample households are presented. In table 7.5, survey data are contrasted with national-level data to facilitate interpretation. The demographic data at the national level were distilled from the population census and the economic data originate from the Ghana Living Standard Survey.
As can be expected of a rural area in Northern Ghana, agriculture plays a central role in the livelihood of the people we interviewed. All households in the survey sample engaged in crop cultivation and almost all kept some livestock. More surprising is the fact that the sale of farm produce was very limited. The average crop sales were equivalent to € 35 per household per year and livestock sales amounted to € 28 per year. At the national level, a much lower proportion of the population is engaged in farming, but crop sales were about seven times as high. Half the crop sales in Nandom consisted of the produce from intensively cultivated dry season vegetables gardens, which were operated by only one fifth of the households. Hence average sales from rainfed agriculture were even lower. If at all we can talk of a cash crop, the highest crop sales were recorded for groundnuts. Table 7.5 Demographic and economic characteristics of the surveyed households
Domain Item Nandom Ghana
Demographics Household size 6.8 5.1* Female household head (%) 10.8 31.3* Age household head 51 45.3* Population aged 0 – 19 (%) 47.6 51.2* Population aged 20-59 (%) 40.0 41.5* Population aged 60+ (%) 12.4 7.2* Dependency ratio12 1.50 1.41* Sex ratio (number of males per 100 females) 99.6 97.9* Sex ratio of population aged 20-59 88.5 93.6* Education Education of household head is zero (%) 60.3 44.7* Education of household head is primary (%) 19.6 5.2* Education of household head secondary or higher (%) 20.1 50.0* Net enrolment rates13, boys aged 5-19 (%) 68.1 60.1* Net enrolment rates, girls aged 5-19 (%) 75.0 56.3* Farming Own land (%) 96.6 n.a. Land holdings (acres) 6.4 n.a.
12 Crude dependency ratio calculated as the population aged 0-19 and 60+ divided by the population aged
20-59. 13 Calculated as the proportion of all children in the age group 5-19 that is presently attending school. The
national figures for school enrolment concern the age group 6-20.
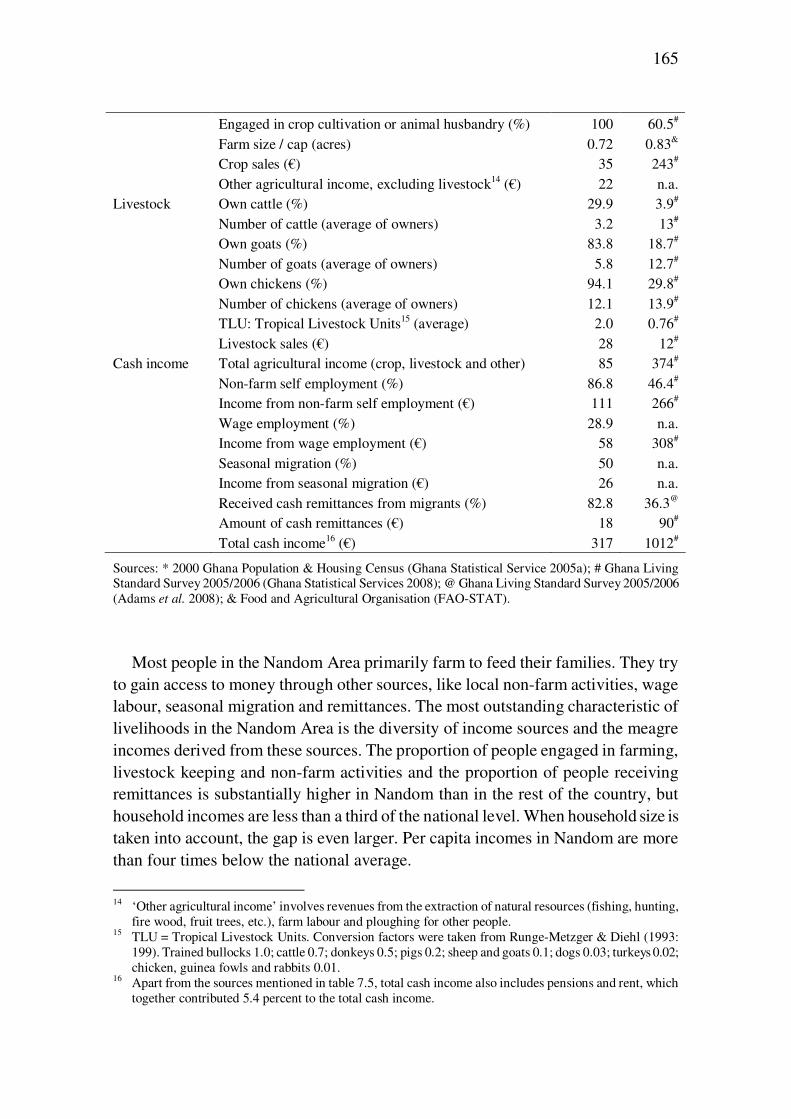
165
Engaged in crop cultivation or animal husbandry (%) 100 60.5# Farm size / cap (acres) 0.72 0.83& Crop sales (€) 35 243# Other agricultural income, excluding livestock14 (€) 22 n.a. Livestock Own cattle (%) 29.9 3.9# Number of cattle (average of owners) 3.2 13# Own goats (%) 83.8 18.7# Number of goats (average of owners) 5.8 12.7# Own chickens (%) 94.1 29.8# Number of chickens (average of owners) 12.1 13.9# TLU: Tropical Livestock Units15 (average) 2.0 0.76# Livestock sales (€) 28 12# Cash income Total agricultural income (crop, livestock and other) 85 374# Non-farm self employment (%) 86.8 46.4# Income from non-farm self employment (€) 111 266# Wage employment (%) 28.9 n.a. Income from wage employment (€) 58 308# Seasonal migration (%) 50 n.a. Income from seasonal migration (€) 26 n.a. Received cash remittances from migrants (%) 82.8 36.3@ Amount of cash remittances (€) 18 90# Total cash income16 (€) 317 1012#
Sources: * 2000 Ghana Population & Housing Census (Ghana Statistical Service 2005a); # Ghana Living Standard Survey 2005/2006 (Ghana Statistical Services 2008); @ Ghana Living Standard Survey 2005/2006 (Adams et al. 2008); & Food and Agricultural Organisation (FAO-STAT).
Most people in the Nandom Area primarily farm to feed their families. They try to gain access to money through other sources, like local non-farm activities, wage labour, seasonal migration and remittances. The most outstanding characteristic of livelihoods in the Nandom Area is the diversity of income sources and the meagre incomes derived from these sources. The proportion of people engaged in farming, livestock keeping and non-farm activities and the proportion of people receiving remittances is substantially higher in Nandom than in the rest of the country, but household incomes are less than a third of the national level. When household size is taken into account, the gap is even larger. Per capita incomes in Nandom are more than four times below the national average.
14 ‘Other agricultural income’ involves revenues from the extraction of natural resources (fishing, hunting,
fire wood, fruit trees, etc.), farm labour and ploughing for other people. 15 TLU = Tropical Livestock Units. Conversion factors were taken from Runge-Metzger & Diehl (1993:
199). Trained bullocks 1.0; cattle 0.7; donkeys 0.5; pigs 0.2; sheep and goats 0.1; dogs 0.03; turkeys 0.02; chicken, guinea fowls and rabbits 0.01.
16 Apart from the sources mentioned in table 7.5, total cash income also includes pensions and rent, which together contributed 5.4 percent to the total cash income.
166
In the next section, migration propensities are discussed, but in table 7.5 some effects of migration are already visible. In the early stages of the Dagara migration system, the vast majority of the migrants were young men who temporarily left their families and either returned permanently after some time or came home on annual visits. In the course of the 20th century it became more common for entire households to migrate and, although many still return, migration to the South has become increasingly permanent (see also Luginaah et al. 2009). The effect of this change in migration patterns on population composition is that sex ratios and dependency ratios have become less extreme. At the time of the 1960 census, for example, Lawra District had a sex ratio of just over sixty-five males per hundred females in the age group 20-59 (Census Office 1964: 10).17 In the survey sample, sex ratios of the total population were almost hundred, and for the population aged 20-59 the ratio was 88.5.
High dependency ratios are a common consequence of large-scale out-migration, especially when people migrate in their productive age. Due to the shift from individual to household migration among the Dagara of Nandom, this effect is limited to old-age dependency.18 The proportion of elderly people in Nandom is very high compared to the rest of the country despite lower living standards and presumably lower life expectancy.
The influence of migration can also be seen in the survey findings on education. The level of schooling of household heads in the survey sample is far below the national level, but the net enrolment levels of children aged 5-19 is substantially higher in Nandom. The explanation of this paradox is that people in Nandom attach high value to education but the educated are more likely to migrate because there are not enough jobs for them locally. Some of the first schools in Northern Ghana were established in Nandom by Catholic missionaries (in the 1930s).19 The Dagara of Nandom are known in Ghana for producing large numbers of medical doctors, lawyers, politicians, teachers, nurses, priests and other high-skilled professionals. Until quite recently, it was common for Dagara families to send some of their children to school, but keep at least one son in the house. The children who went to school were destined to get salary jobs – most likely outside the Nandom Area – and contribute to household welfare through remittances and other forms of support. The
17 In the age group 20-39 the sex ratio was even more extreme: 55 males per 100 females. 18 See Van der Geest (2010a) for a more in-depth discussion of the perceived effect of out-migration on old-
age dependency. 19 Other hotspots of education in Northern Ghana, created by Catholic Missionaries were Navrongo (1906)
and Jirapa (1927). In the rest of Northern Ghana, formal education started later, and the long-term effects are still clearly visible in the 1970 population census. Less than twenty percent of the population aged 6-24 in other districts had attended school, whereas in Nandom and Navrongo more than forty percent of the children and young adults had received some formal education. For the population aged 25 and above such difference was not found, probably because the educated were more likely to have migrated out of the area (Census Office 1972: xxxix-xli).
167
children who stayed at home were meant to continue the tradition of farming the family lands (Van der Geest 2004). This diversification strategy is rooted in the risk-prone environment of the West-African interior savannah, but is also a response to high population density and agricultural crisis. Education, migration and de-agrarianization among the Dagara of Nandom are part of larger family strategies to avoid further fragmentation of farmlands. Rural-rural migration to Ghana’s sparsely populated and well-endowed middle belt is an increasingly common alternative for those who do not have enough qualifications or contacts to secure salary jobs. With increasing education levels nationally and high costs of schooling beyond the junior secondary school level, it is increasingly difficult for poorer Dagara families to follow the educational path to more secure livelihoods. This may partly explain why rural areas in the Brong Ahafo Region have become more popular destination areas for Dagara migrants in recent decades.
Migration propensities
Most studies that look at the impact of migration on development in the area of origin compare migrant-sending households with households that have no migrant members. Sometimes a distinction is made between internal and international migrants (e.g. de Haas 2006; Wouterse and Taylor 2008). In other studies the comparison is between household heads with and without a migration history (in other words a comparison between returned migrants and non-migrants). Such analyses can provide interesting insights in migration effects, but they also conceal some of the complexities that exist in reality. Migration exercises its influence on household livelihoods in many ways, and to study the joint effect an attempt should be made to include different aspects of migration in the analysis. In the present case-study of out-migration from Nandom, three broad avenues of migration impact are distinguished: the migration history of the household head (including seasonal and long-term migration); the household members’ seasonal migration propensities and their levels of savings; and the long-term migration propensities and remittance behaviour of relatives who are no longer part of the household.20 Within these three aspects of migration, further distinctions can be made according to length of stay, years passed since return and the frequency of seasonal migrations. In the analysis of migration and agricultural development in Nandom, migration variables are linked to the agricultural development variables on which they can be expected to exercise most influence. For example, migration propensities of different types of relatives (sons, daughters, brothers and sisters) are related to household composition and the adoption of cultivation practices that represent a labour-intensive land use
20 In this study, long-term migrants who have their own household in their destination area are no longer
considered part of the household in Nandom.
168
transition, and the volume of remittances is linked to the adoption of cultivation practices that represent a capital-led land use transition.
Migration history of household heads
Among the 204 interviewed household heads we interviewed, seasonal migration to Southern Ghana was very common. A majority of 83.3 percent had ever migrated to Southern Ghana to work as a seasonal labourer. Among male household heads the figure was even higher (92.9 percent). On average they had gone on seasonal migration fourteen times (range: one to forty). The most important destination regions for seasonal migrants were the Brong Ahafo Region (47.3 percent) and the Ashanti Region (33.7 percent). Apart from short-term migration, many respondents (41.2 percent) were returned migrants who had lived in Southern Ghana non-seasonally, for periods of at least one year.21 On average they had stayed in the South for nine years (range: one to forty-three). The average departure year was 1971 (range: 1945 to 2000) and the average return year22 was 1982 (range: 1958 to 2004). Within the group of former migrants, twenty percent had returned in the past ten years. About a third had been rural-rural migrants and the rest had stayed in urban areas, but the proportion of rural-rural migrants strongly increased over time. Among those who migrated in the 1980s and 1990s more had stayed in rural areas. The most important destination regions for long-term migrants were the Ashanti Region (39.8 percent) and the Brong Ahafo Region (18.2 percent). Most returned household heads had worked as wage labourers (52.8 percent), especially those who migrated in the 1960s and 1970s. Among the more recently returned household heads most had worked as tenant farmers. This reflects a shift in the Dagara migration system from labour migration to more farm migration, mostly to the Brong Ahafo Region (Abdul-Korah 2006; Van der Geest 2011). The first household head in the survey sample who had established a farm in the South migrated in 1970 and returned in 1989.
Besides the migration history of the household heads we also gathered informa-tion about seasonal migrations of other household members and about long-term migration propensities of direct relatives (siblings and children). In the setup of the questionnaire, a person who migrated seasonally was still considered a household member while a person who had migrated for a period longer than one year was not considered a member of the household anymore.
21 Among the twenty-two female household heads in the sample, the proportion of return migrants was
slightly higher (45.5 percent) than among male household heads (40.7 percent). In addition to the eighty-four respondents who had stayed in Southern Ghana, four had migrated only to destinations within Northern Ghana.
22 The difference between average departure year and average return year is eleven while the average length of stay was only nine years. This is because some migrants returned to the North temporarily between two migrations.
169
Seasonal labour migration of household members
In exactly fifty percent of the 204 surveyed households, at least one person had gone on seasonal migration in the twelve months prior to the questionnaire interview. In 28.4 percent of the households, the number of seasonal migrants was between two and five. In total, 141 persons had gone on a seasonal trip to Southern Ghana in the previous year, which amounts to a ‘seasonal migration rate’ for the whole survey population – including small children and elderly – of 10.4 percent. The average length of stay in the South was a bit more than three months (range: one to nine). Most seasonal labour migrants were men. In the age group of 20 to 59, 41.4 percent of the male household members had worked in Southern Ghana in the previous dry season. They mostly migrated to the Brong Ahafo Region (59 percent) and most of them worked as farm labourers (77.6 percent). Within the 20 to 59 age group, the highest seasonal migration propensities were found among brothers of the household head (54.8 percent), followed by sons of the household head (47.3 percent) and the household heads themselves (30.7 percent). Among women aged 20-59, seasonal migration propensities were much lower: 3.7 percent. A likely explanation for the large difference in seasonal migration propensities of men and women is that the latter are more constrained in their movements because of child care. Seasonal migration is more common among girls aged 13 to 19 (9.6 percent) than among adult women. Most of these girls had worked as domestic servants or bar attendants in urban destinations. In the 13 to 19 age group, less boys than girls had migrated seasonally in the previous twelve months: only 4.6 percent.
The questionnaire also inquired about seasonal migrations of household members in the ten years prior to the questionnaire interview. Among the whole survey population – again including small children and elderly – 17.8 percent had travelled to Southern Ghana for seasonal labour at least once in the past decade. On average, they went five times. Among men aged 20-59, the majority (71.8 percent) had gone on seasonal migration at least once in the past ten years. Within this group the average number of seasonal trips to the South was six and 17.6 percent had gone every year.
Migrant relatives
In the questionnaire, we inquired about the migration status of all first-line relatives, including children, siblings, spouses and parents. This yielded a total of 707 migrants, of which almost all (706) were either a child or a sibling. Clearly, it was not common for spouses or parents of the present household heads to migrate. For more distant relatives (uncles, cousins, nephews, nieces, etc.), the survey included questions only if they had sent remittances.
The survey data on migrant relatives confirm that the people of the Nandom Area are very mobile. When we asked the 204 respondents about the residence of their
170
brothers (n=473), it turned out that 41.9 percent were living in Southern Ghana. An additional 9.0 percent of the brothers had migrated to a destination within Northern Ghana. Two brothers were living in Burkina Faso; one in Nigeria; and for five the destination was unknown. The out-migration propensities of the respondents’ sisters (n=580) were substantially lower than those of the brothers: 19.5 percent were living in Southern Ghana; 11.0 percent had migrated within Northern Ghana; two sisters were living in Burkina Faso and one was living in Kenya. The proportion of sons (24.7 percent, n=489) and daughters (19.6 percent, n=444) living in Southern Ghana was also substantial despite the fact that many were children still living with their parents. Almost every household head in the sample (91.2 percent) had at least one sibling or child (average 3.5) who had migrated out of the area, and 84.3 percent had direct relatives in Southern Ghana (average 2.5). The most important destination regions of migrant relatives were the Brong Ahafo Region (32.6 percent) and the Ashanti Region (22.0 percent). Most migrant relatives settled in urban localities (64.5 percent), except those that migrated to the Brong Ahafo Region. Relatives in this region mostly settled in villages (63.4 percent). Farming was the most common occupation of the migrant relatives (37.3 percent, but 69.2 percent in the Brong Ahafo Region), followed by non-farm self employment (29.0 percent), white collar jobs (14.8 percent), wage labour (7.3 percent) and religious clergy (1.9 percent). In addition, 7.4 percent of the migrant relatives were students or apprentices. Among the migrant siblings and children, one out of six (16.3 percent) had enjoyed tertiary education against only one out of 204 household heads in Nandom. The more educated relatives were more likely to have migrated within Northern Ghana than those who had received less formal education. The national capital (Accra) was also a common destination of relatives with tertiary education.
Population density and migration propensities
As we have seen in Chapter six, districts in Northern Ghana that are densely populated tend to have higher out-migration rates than districts that are sparsely populated. The cross-district analysis also showed that low crop yields were an important cause of migration and that out-migration has a positive effect on farm sizes. To study the relation between rural out-migration and agricultural develop-ment in the Nandom Area and the intervening role of population density, a first step is to find out whether densely populated villages experience more out-migration than sparsely populated villages. The hypothesis that out-migration rates are higher in densely populated areas primarily involves long-term migration. The assumption is that pressure on land is higher in densely populated areas, and that there is more need for part of the population to migrate out of the area23, especially if no major
23 In a survey among 203 Dagara migrant household heads in the Brong Ahafo Region scarcity of fertile
land was identified as the major reason to migrate (Van der Geest 2011).
171
transition to more intensive land use has taken place yet. With regard to short-term migration, it could be expected that in areas with high population density and lower crop yields there is also more need to supplement farm incomes with seasonal labour trips.
Table 7.6 shows the relation between population density, out-migration character-istics and some other key variables in the survey villages. To see the relation between population density and migration variables more clearly, a selection of the data from table 7.6 is shown graphically in figure 7.4. Both table 7.6 and figure 7.4 show that the relation between population density and migration in the villages of the Nandom Area is not very straightforward. Long-term out-migration (the black data points in figure 7.4) does tend to increase with population density, except in the most densely populated village (Dondometeng) where out-migration is common. This village is located just outside Nandom Town and non-farm income levels are about twice as high as in the other villages (see table 7.6). This could be an explanation why out-migration is much less than could be expected on the basis of population density. Instead of relieving the pressure on land through out-migration, the alternative path of local livelihood diversification or de-agrarianization seems to be used more often in Dondometeng.
Seasonal migration is not more common in densely populated villages (see white data points in figure 7.4). The least densely populated village rather had the highest score on the seasonal migration variables and the two most densely populated villages had the lowest scores. Here again, non-farm income generating opportuni-ties may play an important role. Sparsely populated villages have less of an internal market for non-farm activities and these villages tend to be located at a larger distance from Nandom Town (see table 7.6). This makes the non-farm option less attractive and more people will choose to supplement their farm income through seasonal migration to Southern Ghana.
While in Northern Ghana out-migration rates tend to be higher in densely populated districts than in sparsely populated districts, this relation is less clear at the local level. Besides the possible explanations mentioned above, which mainly relate to non-farm income opportunities and distance to Nandom Town, it could also be that farm households that experience more population pressure have found effective ways to deal with this stress. Whereas Lawra District is at the bottom of the Malthus-Boserup curve, within the district there can be localities where the transition to more sustainable land use is well underway. However, in the sections below, which look at the multiple relations between migration and agricultural development, neither population density nor distance to Nandom Town seem to have much explanatory power.
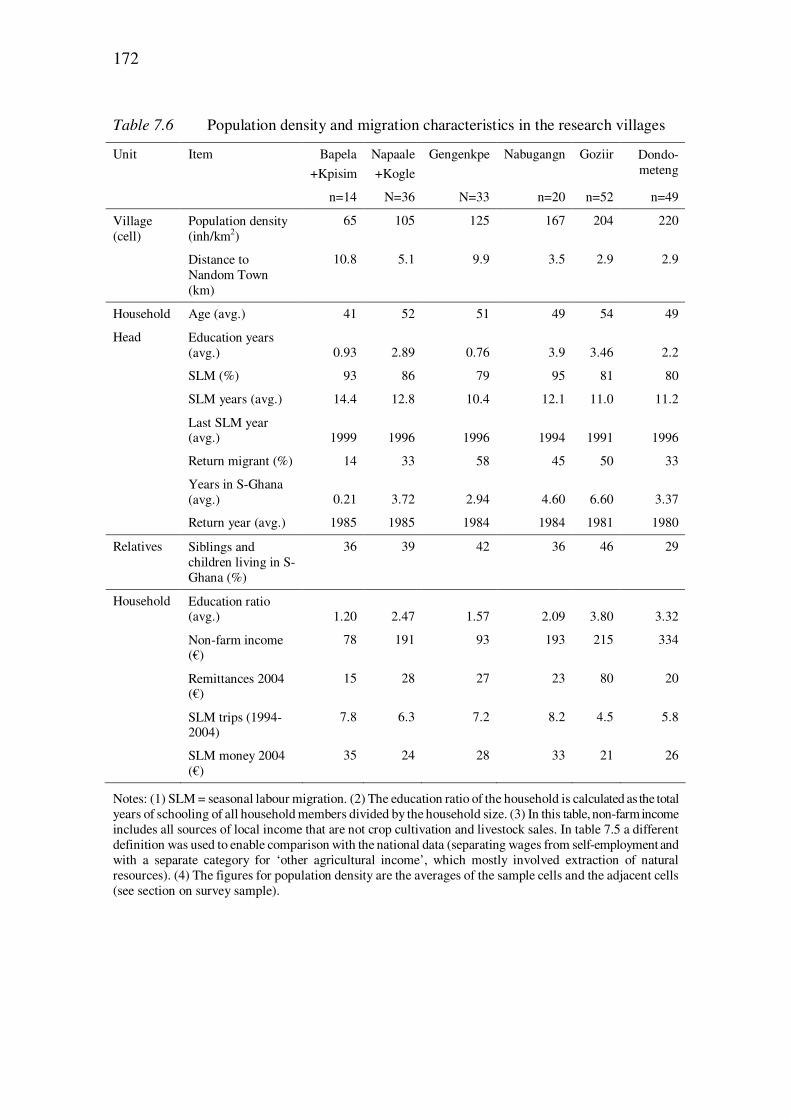
172
Table 7.6 Population density and migration characteristics in the research villages
Unit Item Bapela
+Kpisim
Napaale
+Kogle
Gengenkpe Nabugangn Goziir Dondo-meteng
n=14 N=36 N=33 n=20 n=52 n=49
Village (cell)
Population density (inh/km2)
65 105 125 167 204 220
Distance to Nandom Town (km)
10.8 5.1 9.9 3.5 2.9 2.9
Household Age (avg.) 41 52 51 49 54 49
Head Education years (avg.) 0.93 2.89 0.76 3.9 3.46 2.2
SLM (%) 93 86 79 95 81 80
SLM years (avg.) 14.4 12.8 10.4 12.1 11.0 11.2
Last SLM year (avg.) 1999 1996 1996 1994 1991 1996
Return migrant (%) 14 33 58 45 50 33
Years in S-Ghana (avg.) 0.21 3.72 2.94 4.60 6.60 3.37
Return year (avg.) 1985 1985 1984 1984 1981 1980
Relatives Siblings and children living in S-Ghana (%)
36 39 42 36 46 29
Household Education ratio (avg.) 1.20 2.47 1.57 2.09 3.80 3.32
Non-farm income (€)
78 191 93 193 215 334
Remittances 2004 (€)
15 28 27 23 80 20
SLM trips (1994-2004)
7.8 6.3 7.2 8.2 4.5 5.8
SLM money 2004 (€)
35 24 28 33 21 26
Notes: (1) SLM = seasonal labour migration. (2) The education ratio of the household is calculated as the total years of schooling of all household members divided by the household size. (3) In this table, non-farm income includes all sources of local income that are not crop cultivation and livestock sales. In table 7.5 a different definition was used to enable comparison with the national data (separating wages from self-employment and with a separate category for ‘other agricultural income’, which mostly involved extraction of natural resources). (4) The figures for population density are the averages of the sample cells and the adjacent cells (see section on survey sample).
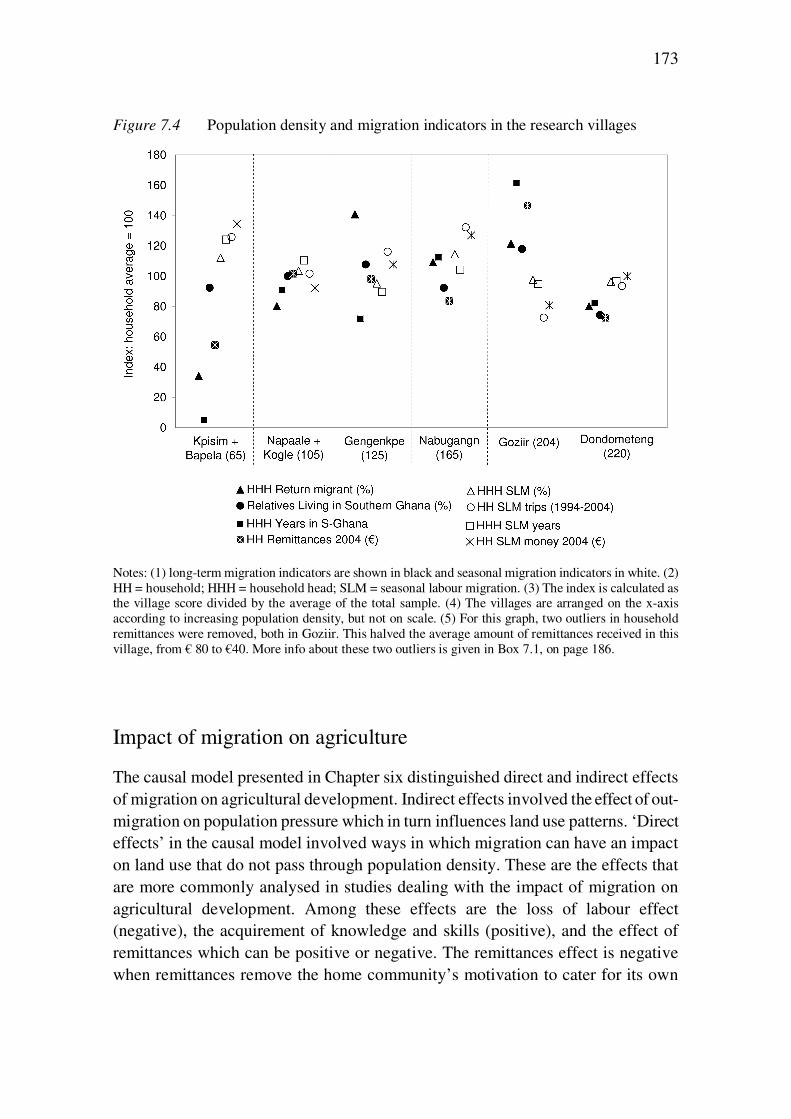
173
Figure 7.4 Population density and migration indicators in the research villages
Notes: (1) long-term migration indicators are shown in black and seasonal migration indicators in white. (2) HH = household; HHH = household head; SLM = seasonal labour migration. (3) The index is calculated as the village score divided by the average of the total sample. (4) The villages are arranged on the x-axis according to increasing population density, but not on scale. (5) For this graph, two outliers in household remittances were removed, both in Goziir. This halved the average amount of remittances received in this village, from € 80 to €40. More info about these two outliers is given in Box 7.1, on page 186.
Impact of migration on agriculture
The causal model presented in Chapter six distinguished direct and indirect effects of migration on agricultural development. Indirect effects involved the effect of out-migration on population pressure which in turn influences land use patterns. ‘Direct effects’ in the causal model involved ways in which migration can have an impact on land use that do not pass through population density. These are the effects that are more commonly analysed in studies dealing with the impact of migration on agricultural development. Among these effects are the loss of labour effect (negative), the acquirement of knowledge and skills (positive), and the effect of remittances which can be positive or negative. The remittances effect is negative when remittances remove the home community’s motivation to cater for its own
174
needs. This ‘substitution effect’ creates dependency and reduces local production. The effect is positive when remittances enable households to invest in agricultural production (purchase of farm inputs like animal traction, fertiliser or labour). In the migration and development literature, and most commonly in the New Economics of Labour Migration (NELM), this effect is called ‘overcoming capital constraints’. Another aspect of migration that is often mentioned by NELM scholars is that migration and remittances are part of a household risk-diversifying strategy. When rural households in the source areas of migrants know they can call on their relatives for assistance or supplement farm income with seasonal labour trips, they might be willing to take more risks in their cropping strategies, which could lead to increased production.
In the sections below different effects of out-migration on agriculture are studied. First the loss of labour effect will be analysed by looking at the relation between migration of first line relatives and households’ gender and age structure (sex ratios and dependency ratios). This will then be related to a number of farm techniques that represent a labour-led intensification path.
Loss of labour
One of the oft-mentioned negative consequences of out-migration is the loss of labour effect. Migration propensities are usually highest among people in their productive age and this may have a negative effect on the composition of the labour force in migrants’ areas of origin. Particularly, migration can increase household dependency ratios (number of children and elderly per adult). Source areas of migrants bear the costs of raising children and caring for the elderly while destination regions benefit from a relatively productive and healthy inflow of young adults. In addition, when a migration flow is gender-selective, it will alter sex ratios (number of men per hundred women). Below, the effect of out-migration on dependency, sex ratios and labour shortage will be analysed, first by looking at perceptions of farmers in the area and then by looking at the more quantitative survey data. A distinction is made between seasonal and long-term migration.
Perceptions of labour shortage
The questionnaire survey included a section with open questions inquiring about people’s perceptions of the consequences of seasonal and more permanent migration. Without probing, only two out of 204 respondents mentioned loss of labour as a negative consequence of seasonal migration (Van der Geest 2010a). However, in a separate question, we asked specifically whether respondents thought that seasonal migration caused shortage of labour for certain activities at home, and if so for which. A majority of 83 percent confirmed this, and they specified that seasonal migration caused labour shortage for the maintenance of traditional houses (mentioned 77 times), farming (61), funeral activities (56), care for sick people (25),
175
and communal labour for development projects, e.g. digging toilets and wells, construction of school buildings and road maintenance (26). Lack of labour for livestock rearing was only mentioned by three respondents. An explanation could be that there is a ‘free range’ system for livestock (except for pigs) in the dry season and less labour is therefore needed to look after the domestic animals. Another explanation is that the care for livestock primarily falls on children who are considered too young to go on seasonal migration.
A breakdown of specific farm tasks for which seasonal labour migration can lead to labour shortage reveals that this is mostly the case for land preparation (35) and harvesting (25), i.e. the first and last activity in the agricultural cycle. The intermediate activities, sowing and weeding, were hardly mentioned. Neither did respondents mention any agricultural activities outside the growing season, like maintenance of soil and water conservation structures. According to most respondents, seasonal migration only causes labour shortage for land preparation when the migrants ‘overstay’, i.e. when they return late. Most land preparation takes place after the first rains, in May and June. If seasonal migrants return late, the land is not prepared in time, which leads to late sowing and reduced yields. Some men go to Southern Ghana as early as August or September, after the third weeding of millet and guinea corn, which, in the traditional division of labour, is a male responsibility. Such early migration causes a shortage of labour for harvesting, even though most of the harvest activities are carried out by women. 24
Long-term migration usually leads to higher dependency ratios in the area of origin and this could also be expected to cause labour shortages. However, in the questionnaire section about perceptions of migration, none of the 204 respondents mentioned labour shortage as a negative consequence of long-term migration (Van der Geest 2010a). A likely explanation is that long-term migrants from the Nandom Area increasingly move with their nuclear households, i.e. husbands, wives and children. Consequently, long-term migration does alter population size, but its influence on population composition and dependency ratios is mostly limited to old age dependency. Although parents are usually left under the care of a non-migrant brother25, many respondents did mention that the elderly are often neglected and not properly cared for because of out-migration (Van der Geest 2010a).
In sum, in people’s perceptions about the effect of seasonal and more permanent out-migration not much importance was attached to the ‘loss of labour’ argument. With regard to seasonal migration, the dry season is generally seen as a slack period
24 In the traditional division of labour, land preparation and weeding are male tasks while sowing and
harvesting are female tasks. It is a bit surprising, therefore, that seasonal migration, which is clearly male-dominated, causes shortage of labour for harvesting. An explanation could be that the gender division of labour has become more flexible over time.
25 In the viri-local marriage system that is common among the Dagara of Nandom, daughters move from their own family’s house to the family house of their husband.
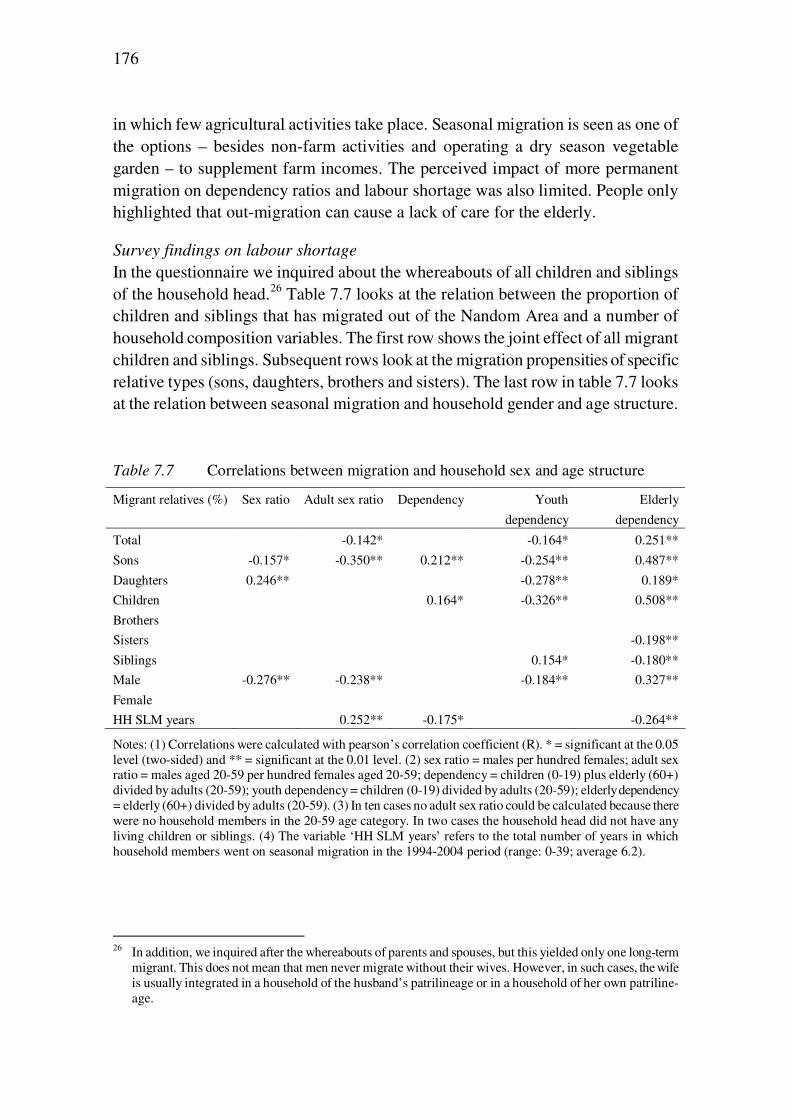
176
in which few agricultural activities take place. Seasonal migration is seen as one of the options – besides non-farm activities and operating a dry season vegetable garden – to supplement farm incomes. The perceived impact of more permanent migration on dependency ratios and labour shortage was also limited. People only highlighted that out-migration can cause a lack of care for the elderly.
Survey findings on labour shortage
In the questionnaire we inquired about the whereabouts of all children and siblings of the household head.26 Table 7.7 looks at the relation between the proportion of children and siblings that has migrated out of the Nandom Area and a number of household composition variables. The first row shows the joint effect of all migrant children and siblings. Subsequent rows look at the migration propensities of specific relative types (sons, daughters, brothers and sisters). The last row in table 7.7 looks at the relation between seasonal migration and household gender and age structure. Table 7.7 Correlations between migration and household sex and age structure
Migrant relatives (%) Sex ratio Adult sex ratio Dependency Youth
dependency
Elderly
dependency
Total -0.142* -0.164* 0.251**
Sons -0.157* -0.350** 0.212** -0.254** 0.487**
Daughters 0.246** -0.278** 0.189*
Children 0.164* -0.326** 0.508**
Brothers
Sisters -0.198**
Siblings 0.154* -0.180**
Male -0.276** -0.238** -0.184** 0.327**
Female
HH SLM years 0.252** -0.175* -0.264**
Notes: (1) Correlations were calculated with pearson’s correlation coefficient (R). * = significant at the 0.05 level (two-sided) and ** = significant at the 0.01 level. (2) sex ratio = males per hundred females; adult sex ratio = males aged 20-59 per hundred females aged 20-59; dependency = children (0-19) plus elderly (60+) divided by adults (20-59); youth dependency = children (0-19) divided by adults (20-59); elderly dependency = elderly (60+) divided by adults (20-59). (3) In ten cases no adult sex ratio could be calculated because there were no household members in the 20-59 age category. In two cases the household head did not have any living children or siblings. (4) The variable ‘HH SLM years’ refers to the total number of years in which household members went on seasonal migration in the 1994-2004 period (range: 0-39; average 6.2).
26 In addition, we inquired after the whereabouts of parents and spouses, but this yielded only one long-term
migrant. This does not mean that men never migrate without their wives. However, in such cases, the wife is usually integrated in a household of the husband’s patrilineage or in a household of her own patriline-age.
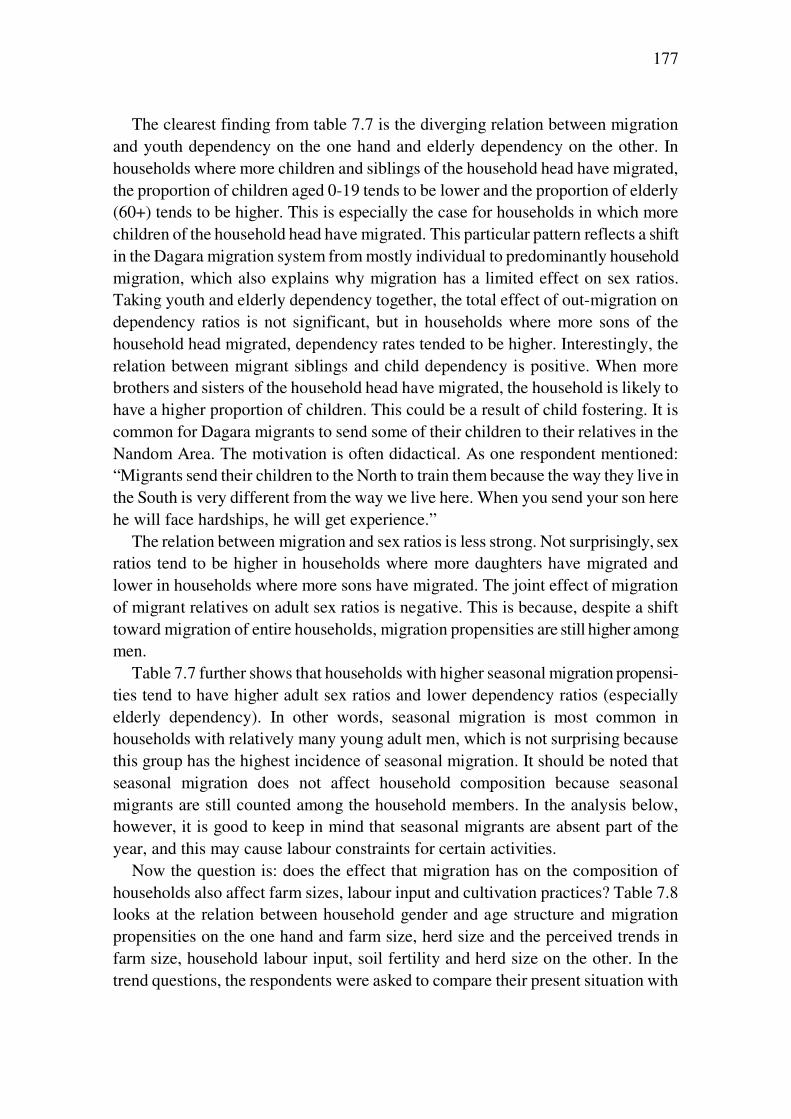
177
The clearest finding from table 7.7 is the diverging relation between migration and youth dependency on the one hand and elderly dependency on the other. In households where more children and siblings of the household head have migrated, the proportion of children aged 0-19 tends to be lower and the proportion of elderly (60+) tends to be higher. This is especially the case for households in which more children of the household head have migrated. This particular pattern reflects a shift in the Dagara migration system from mostly individual to predominantly household migration, which also explains why migration has a limited effect on sex ratios. Taking youth and elderly dependency together, the total effect of out-migration on dependency ratios is not significant, but in households where more sons of the household head migrated, dependency rates tended to be higher. Interestingly, the relation between migrant siblings and child dependency is positive. When more brothers and sisters of the household head have migrated, the household is likely to have a higher proportion of children. This could be a result of child fostering. It is common for Dagara migrants to send some of their children to their relatives in the Nandom Area. The motivation is often didactical. As one respondent mentioned: “Migrants send their children to the North to train them because the way they live in the South is very different from the way we live here. When you send your son here he will face hardships, he will get experience.”
The relation between migration and sex ratios is less strong. Not surprisingly, sex ratios tend to be higher in households where more daughters have migrated and lower in households where more sons have migrated. The joint effect of migration of migrant relatives on adult sex ratios is negative. This is because, despite a shift toward migration of entire households, migration propensities are still higher among men.
Table 7.7 further shows that households with higher seasonal migration propensi-ties tend to have higher adult sex ratios and lower dependency ratios (especially elderly dependency). In other words, seasonal migration is most common in households with relatively many young adult men, which is not surprising because this group has the highest incidence of seasonal migration. It should be noted that seasonal migration does not affect household composition because seasonal migrants are still counted among the household members. In the analysis below, however, it is good to keep in mind that seasonal migrants are absent part of the year, and this may cause labour constraints for certain activities.
Now the question is: does the effect that migration has on the composition of households also affect farm sizes, labour input and cultivation practices? Table 7.8 looks at the relation between household gender and age structure and migration propensities on the one hand and farm size, herd size and the perceived trends in farm size, household labour input, soil fertility and herd size on the other. In the trend questions, the respondents were asked to compare their present situation with
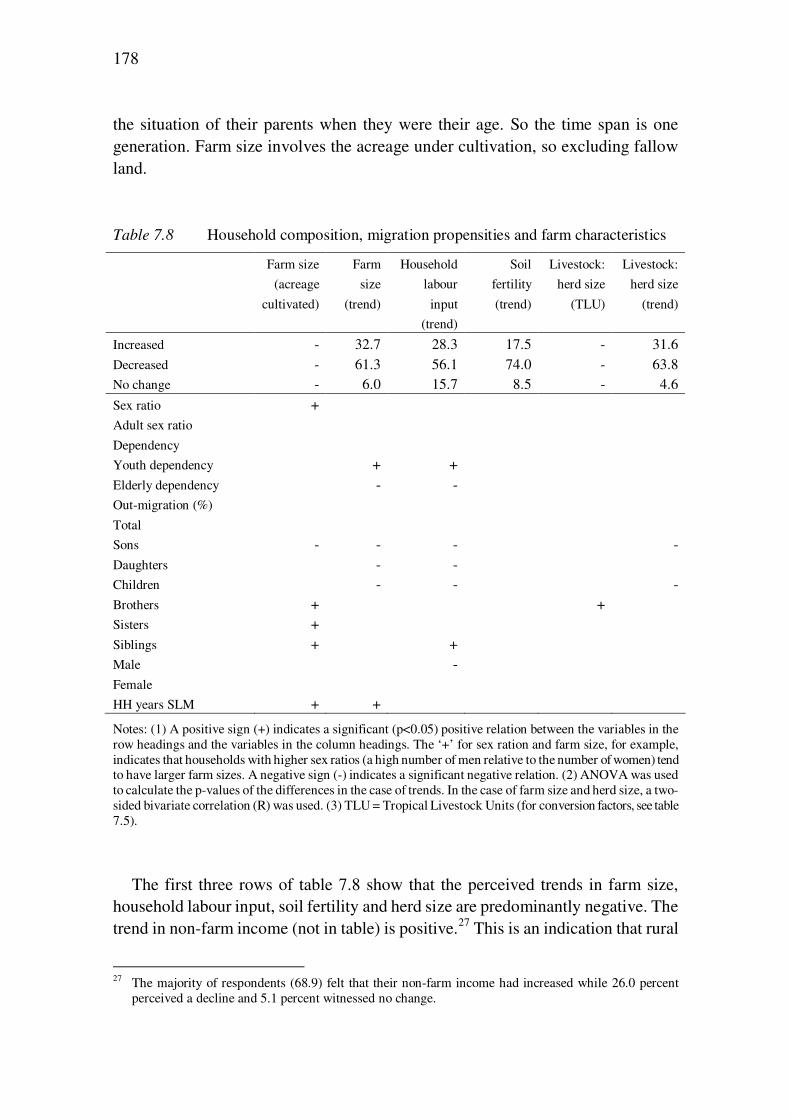
178
the situation of their parents when they were their age. So the time span is one generation. Farm size involves the acreage under cultivation, so excluding fallow land. Table 7.8 Household composition, migration propensities and farm characteristics
Farm size
(acreage
cultivated)
Farm
size
(trend)
Household
labour
input
(trend)
Soil
fertility
(trend)
Livestock:
herd size
(TLU)
Livestock:
herd size
(trend)
Increased - 32.7 28.3 17.5 - 31.6 Decreased - 61.3 56.1 74.0 - 63.8 No change - 6.0 15.7 8.5 - 4.6
Sex ratio + Adult sex ratio Dependency Youth dependency + + Elderly dependency - - Out-migration (%) Total Sons - - - - Daughters - - Children - - - Brothers + + Sisters + Siblings + + Male - Female HH years SLM + +
Notes: (1) A positive sign (+) indicates a significant (p<0.05) positive relation between the variables in the row headings and the variables in the column headings. The ‘+’ for sex ration and farm size, for example, indicates that households with higher sex ratios (a high number of men relative to the number of women) tend to have larger farm sizes. A negative sign (-) indicates a significant negative relation. (2) ANOVA was used to calculate the p-values of the differences in the case of trends. In the case of farm size and herd size, a two-sided bivariate correlation (R) was used. (3) TLU = Tropical Livestock Units (for conversion factors, see table 7.5).
The first three rows of table 7.8 show that the perceived trends in farm size, household labour input, soil fertility and herd size are predominantly negative. The trend in non-farm income (not in table) is positive.27 This is an indication that rural
27 The majority of respondents (68.9) felt that their non-farm income had increased while 26.0 percent
perceived a decline and 5.1 percent witnessed no change.
179
livelihoods in the Nandom have become less centred on agriculture in the past two to three decades.28 Rural households in the Nandom Area nowadays spend less time on the farm, and more time on non-farm activities.
No significant relation was found between the total proportion of migrant relatives and farm size, herd size and trends. A breakdown according to migrants’ relation with the household head shows that such relations do exist, but that they work in opposite directions. When more sons and daughters of the household head have migrated, the perceived trends in farm size, labour input and herd sizes are more often negative, and in the case of migrant sons actual farm sizes also tend to be smaller. This could indeed be a ‘loss of labour’ effect. In the social organization of the Dagara, sons tend to farm under the authority of their father, even after marriage. When the father dies, brothers may farm together for some years, but eventually form their own households. Adult daughters move to their husband’s house upon marriage. In households where more sons of the household head have migrated there may be limited labour available for maintaining a sizeable farm.
In contrast with the loss of labour effect for migrant children, the out-migration of brothers and sisters is positively associated with a number of farm variables. When more brothers and sisters of the household head have migrated, household farm sizes tend to be larger. A partial explanation could be that when a farmer’s sibling migrates, he or she has more land available to farm. Farmland in the Nandom Area is not privately owned. The land tenure system could be described as ‘communal with individual user rights’ (Adolph et al. 1993). Traditionally, the tengansob (custodian of the land) allocates uncultivated land to families in his area of jurisdiction (tengan). The tengansob has the power to take back land given out to patrilineages if this land remains unused for a long time, but this is rare. In the densely populated areas, virtually all land has been given out and needs to be shared between the households that constitute a patrilineage. When a father has several sons, the land over which he has usufruct rights is divided among his sons when they start their own households (Van der Geest 2004). When a brother migrates, this leaves more land to farm for those who stay. In the virilocal marriage system of the Dagara, a woman becomes part of the lineage of her husband. Therefore, it is not clear why the migration of sisters is also correlated positively with farm size.
Household heads of whom more brothers have migrated also tend to own more livestock. This could be because migrants may leave some of their livestock under the care of a brother. So called ‘family cattle’ may also play a role, however. Cattle and other farm animals can be owned privately, but can also be family property. Family cattle are primarily used for bride price payments and funeral celebrations. If more brothers of a household head migrate, he is more likely to become the
28 An additional explanation for the predominantly negative trends in farm size and herd size may be that
household sizes have reduced.
180
custodian of the family cattle. Having more livestock is helpful in maintaining a large farm because livestock plays a central role in traditional labour arrangements.
Another finding from table 7.8 is that households which perceive a positive trend in farm sizes are more likely to have higher child dependency rates and lower elderly dependency rates. This could have a Chayanovian life-cycle explanation. Parents that have to cater for many small children are probably forced to work harder and increase their farm sizes. It could also mean, however, that children are still an essential part of the labour force, despite high school enrolment. A last observation from table 7.8 is that household sex and age structure and migration propensities seem to be unrelated to the perceived trend in soil fertility.
Table 7.9 and 7.10 look at the relation between household composition, migration propensities and a number of labour-centred farm techniques that aim to improve soil fertility and increase yields. The question to be answered here is whether out-migration – through loss of labour – has a negative impact on the adoption of labour-led intensification measures. The six measures analysed in table 7.9 and 7.10 were selected from a larger set29 of agricultural practices because of their medium adoption rates (see second column of table 7.9). Instead of looking at the application of manure (adoption rate: 90 percent), for example, we look at whether households transport manure to fields other than the compound farm (adoption rate: 43 percent). The medium adoption rates produce more variation in the analysis.
Before we look at the relation with demographic indicators it is worthwhile to emphasize that adoption of labour-led intensification measures is substantial. The cross-district analysis positioned Lawra District at the bottom of the Malthus-Boserup curve and indicated that out-migration seemed to remove the incentives for a transition to more intensive land use. A more disaggregated analysis of agricultural production data at the district level (1993-2007) already showed some more positive signs for recent years (see table 7.1 and figure 7.2). Crop yields have stabilised after a period of decline in the 1990s and farm sizes have increased, possibly as a result of increasing food prices and adoption of bullock and donkey ploughing. The survey data on farm management and land use indicate that a substantial number of farmers in the area has adopted labour-intensive cultivation practices to increase their farm produce. Unfortunately, the survey did not include questions about the years in which each technique was used for the first time. This information was only gathered for the use of ploughs (pulled by bullocks, donkeys or tractors).
In table 7.9, the group of adopters and non-adopters of each cultivation practice was compared in terms of sex ratio and dependency ratio. When a significant difference (using ANOVA) was found it was indicated in the table. The plus for sex
29 Besides the cultivation practices shown in table 7.9 and 7.10, some of the other practices we looked at are
intercropping, fixed crop rotation, improved fallows, line sowing, the use of leguminous cover crops and the use of grass strips to counter soil erosion.
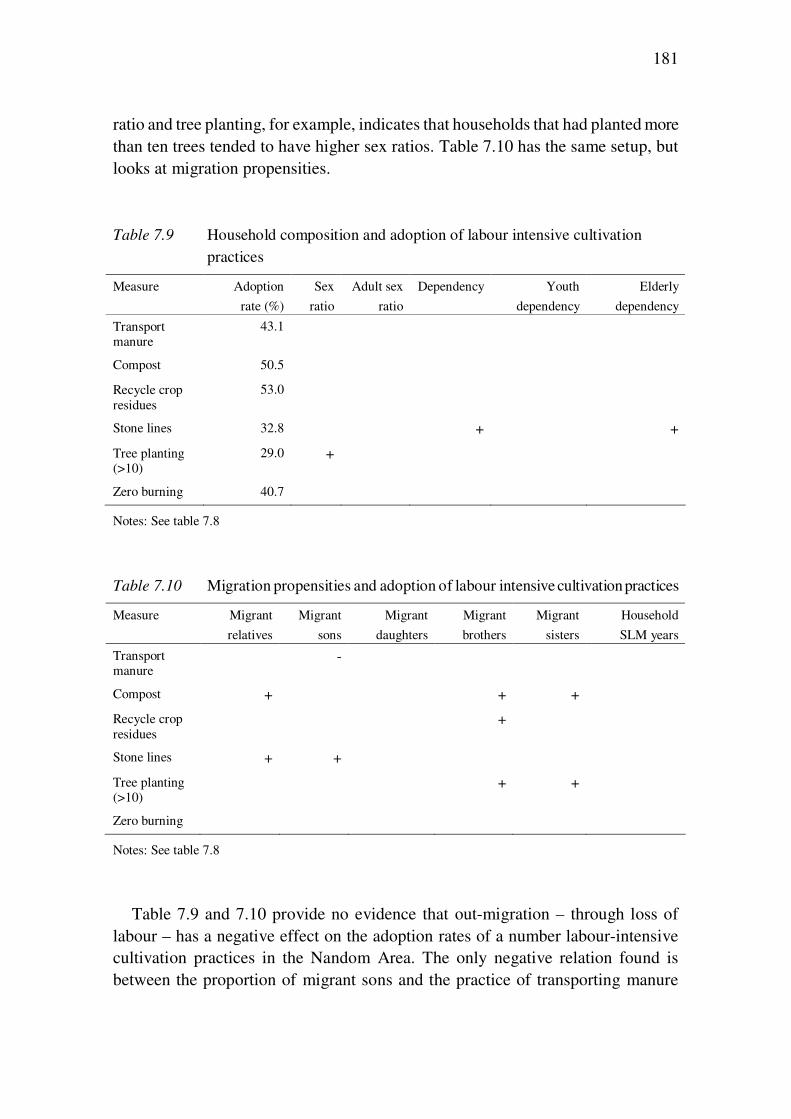
181
ratio and tree planting, for example, indicates that households that had planted more than ten trees tended to have higher sex ratios. Table 7.10 has the same setup, but looks at migration propensities. Table 7.9 Household composition and adoption of labour intensive cultivation
practices
Measure Adoption
rate (%)
Sex
ratio
Adult sex
ratio
Dependency Youth
dependency
Elderly
dependency
Transport manure
43.1
Compost 50.5
Recycle crop residues
53.0
Stone lines 32.8 + +
Tree planting (>10)
29.0 +
Zero burning 40.7
Notes: See table 7.8
Table 7.10 Migration propensities and adoption of labour intensive cultivation practices
Measure Migrant
relatives
Migrant
sons
Migrant
daughters
Migrant
brothers
Migrant
sisters
Household
SLM years
Transport manure
-
Compost + + +
Recycle crop residues
+
Stone lines + +
Tree planting (>10)
+ +
Zero burning
Notes: See table 7.8
Table 7.9 and 7.10 provide no evidence that out-migration – through loss of labour – has a negative effect on the adoption rates of a number labour-intensive cultivation practices in the Nandom Area. The only negative relation found is between the proportion of migrant sons and the practice of transporting manure
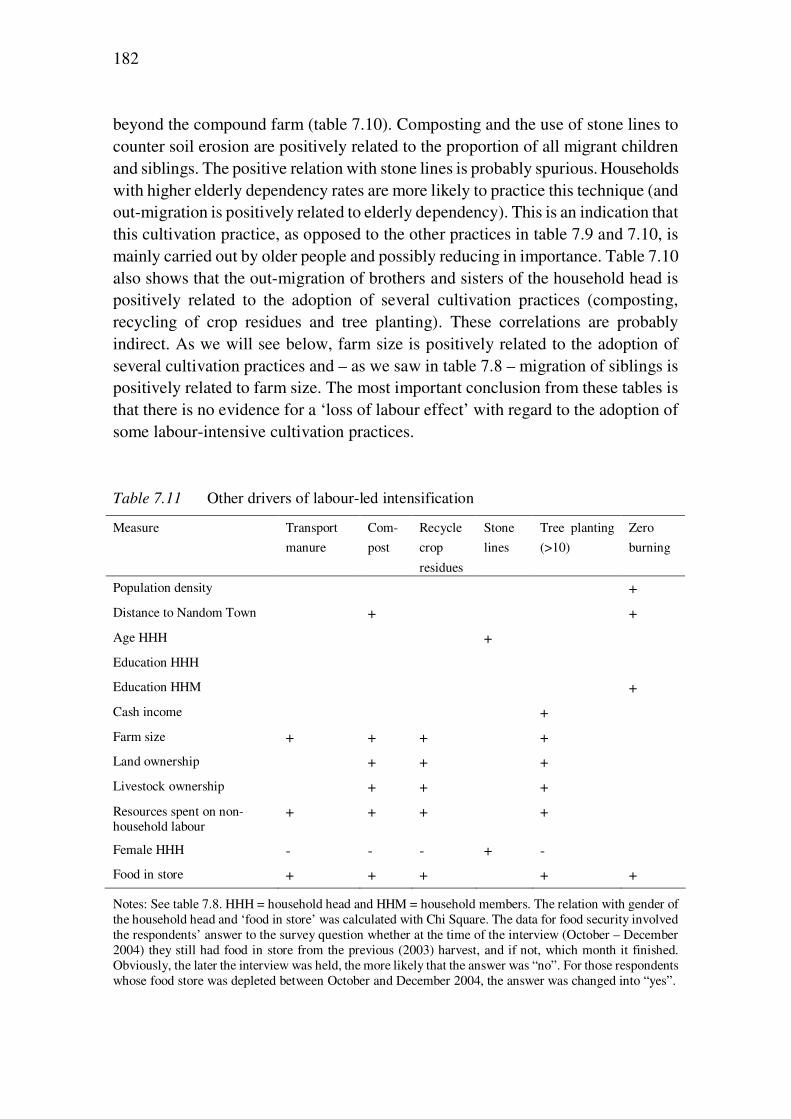
182
beyond the compound farm (table 7.10). Composting and the use of stone lines to counter soil erosion are positively related to the proportion of all migrant children and siblings. The positive relation with stone lines is probably spurious. Households with higher elderly dependency rates are more likely to practice this technique (and out-migration is positively related to elderly dependency). This is an indication that this cultivation practice, as opposed to the other practices in table 7.9 and 7.10, is mainly carried out by older people and possibly reducing in importance. Table 7.10 also shows that the out-migration of brothers and sisters of the household head is positively related to the adoption of several cultivation practices (composting, recycling of crop residues and tree planting). These correlations are probably indirect. As we will see below, farm size is positively related to the adoption of several cultivation practices and – as we saw in table 7.8 – migration of siblings is positively related to farm size. The most important conclusion from these tables is that there is no evidence for a ‘loss of labour effect’ with regard to the adoption of some labour-intensive cultivation practices. Table 7.11 Other drivers of labour-led intensification
Measure Transport
manure
Com-
post
Recycle
crop
residues
Stone
lines
Tree planting
(>10)
Zero
burning
Population density +
Distance to Nandom Town + +
Age HHH +
Education HHH
Education HHM +
Cash income +
Farm size + + + +
Land ownership + + +
Livestock ownership + + +
Resources spent on non-household labour
+ + + +
Female HHH - - - + -
Food in store + + + + +
Notes: See table 7.8. HHH = household head and HHM = household members. The relation with gender of the household head and ‘food in store’ was calculated with Chi Square. The data for food security involved the respondents’ answer to the survey question whether at the time of the interview (October – December 2004) they still had food in store from the previous (2003) harvest, and if not, which month it finished. Obviously, the later the interview was held, the more likely that the answer was “no”. For those respondents whose food store was depleted between October and December 2004, the answer was changed into “yes”.
183
If sex ratios, dependency ratios and migration factors do not play a major role in the adoption of labour-intensive and environmentally sustainable cultivation practices, the question is: which factors do play a role? In table 7.11 the relation between adoption rates and some other key variables is analysed. Factors like population density, distance to Nandom Town, age of the household head, education levels and cash income seem to play a limited role. In the migration and develop-ment literature, an oft-mentioned negative effect of out-migration is the fact that the more educated people tend to migrate more. This is also the case for Nandom, but it seems to be of little influence with regard to the transition to more labour-intensive farm practices. As we will see below, education level also has little influence on capital-led intensification.
Farms size, land ownership, livestock ownership, external labour input and food security (see note under table 7.11) turned out to be more closely related to adoption rates of the selected labour-intensive cultivation practices. Households that own more land and livestock and cultivate more land are more likely to adopt such practices. The relation was particularly strong for households’ ability to attract labour from outside the household. Female headed households were less likely to adopt these measures, probably because such households had significantly smaller farms and less livestock. As we will see below, farm size, land ownership, livestock ownership and food security also relate positively to capital-led intensification measures. This could be an indication of a divide between different ‘farming styles’ (Nooteboom 2003) or perhaps a divide between poorer and wealthier farmers. It seems that there is a group of poorer households that lack the resources and strength to accomplish a transition to more intensive and sustainable land use. Year in year out they farm the family land to fill the granaries for as many months as possible, but right when the farming season starts, their stocks run low, and they will have to participate in wealthier farmers’ labour parties to get instant access to food. Their style of farming is conservative, not because they don’t want to change, but because they don’t have the resources and strength to do so. The group of better-endowed farm households have more ‘room to manoeuvre’ and perhaps a more optimistic outlook on the future. Moreover, they have food in store throughout the farming season, which gives them the strength to work hard on the farm. For NGOs and government agencies that try to promote a transition to more sustainable land use, it is important to know this. They could – understandably, but erroneously – think that the labour-intensive ‘low external input’ cultivation practices are accessible to all households regardless of their economic situation. In reality, households probably need a basic level of food security for short-term investments of labour resources in long-term sustainability of land use.
184
Migrant savings and remittances
An important effect of migration for the home area is that it generates savings and remittances. Whether the effect is positive or negative for development depends mainly on the distribution and use of remittances. In the migration and development literature, remittance flows are sometimes associated with increasing inequality, which is generally judged as negative, especially when the focus is on poverty reduction. Moreover, migration can under certain conditions create dependency and passiveness rather than development. On the positive side, remittances can remove capital constraints for household investments that can improve living standards and local productivity. In addition, remittances can function as a fallback or insurance mechanism that allows people to take more risk in their production strategies and livelihood choices. Lastly, when poverty is widespread and the home area offers limited prospects for improving food and livelihood security, remittances can simply be a lifeline. In reality, all these effects may operate simultaneously, but with different strength and relevance depending on each household’s situation. In this section, we first look at the volume and distribution of remittances. After that, the uses of remittances are discussed. In the final part of this section the relation between remittances and capital-led intensification measures is analysed.
Remittances flow from migrants to their home areas, but there may be important counter-flows of resources moving from home areas to the migrants (Mensah-Bonsu 2003; Owusu 2007). The Nandom questionnaire did not systematically inquire about such counter-flows. However, informal conversations and information from a questionnaire conducted among 203 Dagara migrants in the Brong Ahafo Region indicate that there are five main avenues through which resources flow from the home area to the migrants. (1) Financial assistance at the time of the first migration. (2) Transport fees for migrants who have come to visit the home area and have spent all their money. (3) School fees and ‘pocket money’ for students and apprentices who are receiving their education outside the Nandom Area. (4) Sustenance of visiting migrants who eat from their relatives’ granaries. (5) Home-produced traditional foodstuffs like sheabutter and dawadawa that are hard to come by in migrants’ destination areas.
Volume and distribution of remittances
The questionnaire survey inquired about the remittance behaviour of all migrant children and siblings. In addition, remittances from other relatives30 were recorded. In a survey among migrants in the Brong Ahafo Region, a three-year reference period was used to ameliorate the problem that remittances may vary greatly from year to year. The volume of remittances will be higher in years in which households experience calamities, like crop failure, sickness and funerals (see Kabki 2007 for a
30 We also included remittances by friends, but this was very rare (only one case).
185
Ghanaian case study). The three-year reference period worked very well for respondents who sent remittances, but in the test phase of the Nandom question-naire, it turned out that it was more difficult for the receivers to exactly remember the timing and volume of remittances from different relatives over such a long period. Therefore, a one-year period was chosen. We inquired about monetary as well as in-kind remittances. For remittances in kind the value had to be estimated.
A majority (61.3 percent) of migrant children and siblings had at some point supported the respondents’ household with remittances. In the twelve months prior to the questionnaire interview, 68.0 percent had visited the family house and 42.2 percent had contributed money, goods or foodstuffs. Less than half the remittances involved money (45.5 percent). Much consisted of goods (39.7 percent) and an appreciable amount (14.8 percent) of the total value of remittances was sent in the form of foodstuffs (mostly maize). Remittances could be ‘transacted’ during a visit of the migrant to the home area (56.1 percent), during a visit of relatives to the migrant’s destination area (9.3 percent) or through a relative, friend or bus driver (34.6 percent).
The average value of remittances per migrant child or sibling was € 9 (excluding remittances to people outside the respondents’ households). There were significant differences in volume of remittances with regard to the relation of the migrant with the household head. Sons remitted most, followed by brothers, sisters and daughters respectively (see table 7.12). Sons and daughters remitted more in kind and brothers and sisters sent a higher proportion of remittances in the form of cash. The relatively low volume of remittances by daughters has a cultural explanation. When a daughter marries, she becomes a member of the yir (house, patrilineage) of her husband. When she sends remittances to her parental house, this is often met with suspicion, as if she is preparing to separate from her husband (Harteveld 2004). Women with secondary or tertiary education seem to have more power or agency to break with this custom. They remit just as much as men with the same level of education (not in table). The volume of remittances increases with education level (see table 7.13). This is probably because higher educated migrants also have higher incomes and because they feel – more than those with low levels of education – that they have a ‘debt’ to pay back to their relatives at home who made it possible for them to further their education. Higher educated migrants also send a large proportion of remit-tances in the form of cash.
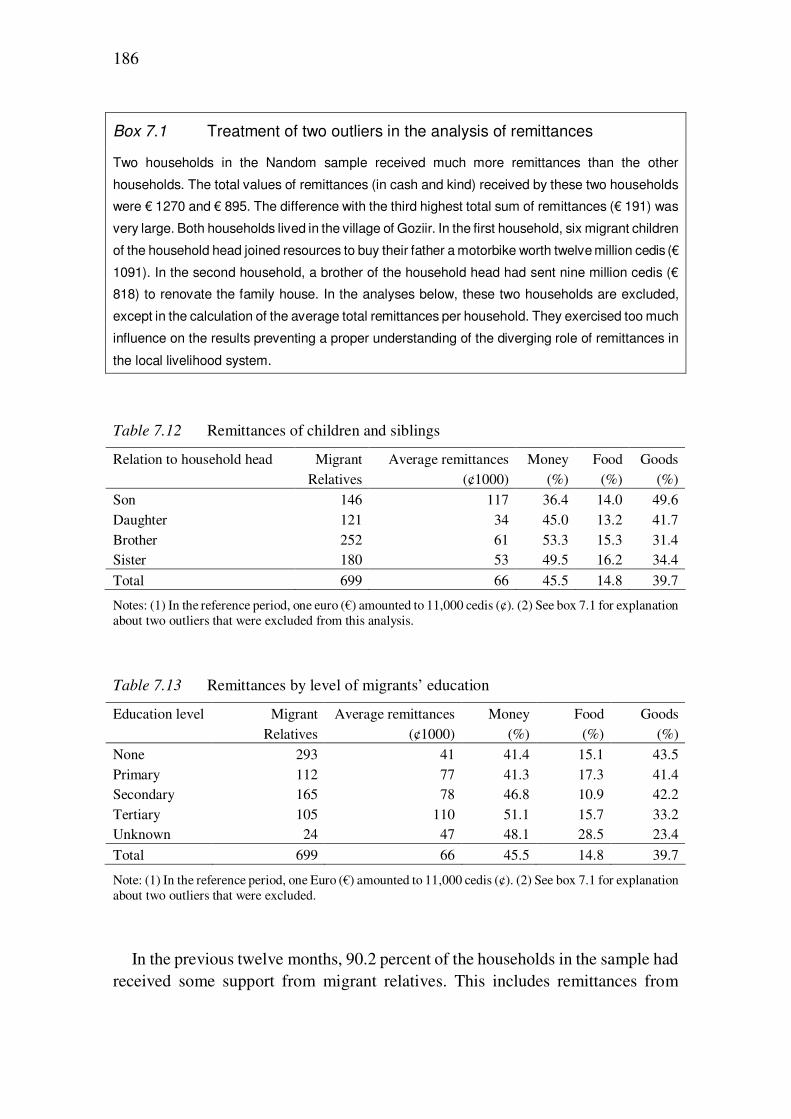
186
Box 7.1 Treatment of two outliers in the analysis of remittances
Two households in the Nandom sample received much more remittances than the other
households. The total values of remittances (in cash and kind) received by these two households
were € 1270 and € 895. The difference with the third highest total sum of remittances (€ 191) was
very large. Both households lived in the village of Goziir. In the first household, six migrant children
of the household head joined resources to buy their father a motorbike worth twelve million cedis (€
1091). In the second household, a brother of the household head had sent nine million cedis (€
818) to renovate the family house. In the analyses below, these two households are excluded,
except in the calculation of the average total remittances per household. They exercised too much
influence on the results preventing a proper understanding of the diverging role of remittances in
the local livelihood system.
Table 7.12 Remittances of children and siblings
Relation to household head Migrant Relatives
Average remittances (¢1000)
Money (%)
Food (%)
Goods (%)
Son 146 117 36.4 14.0 49.6 Daughter 121 34 45.0 13.2 41.7 Brother 252 61 53.3 15.3 31.4 Sister 180 53 49.5 16.2 34.4
Total 699 66 45.5 14.8 39.7
Notes: (1) In the reference period, one euro (€) amounted to 11,000 cedis (¢). (2) See box 7.1 for explanation about two outliers that were excluded from this analysis.
Table 7.13 Remittances by level of migrants’ education
Education level Migrant Relatives
Average remittances (¢1000)
Money (%)
Food (%)
Goods (%)
None 293 41 41.4 15.1 43.5 Primary 112 77 41.3 17.3 41.4 Secondary 165 78 46.8 10.9 42.2 Tertiary 105 110 51.1 15.7 33.2 Unknown 24 47 48.1 28.5 23.4
Total 699 66 45.5 14.8 39.7
Note: (1) In the reference period, one Euro (€) amounted to 11,000 cedis (¢). (2) See box 7.1 for explanation about two outliers that were excluded.
In the previous twelve months, 90.2 percent of the households in the sample had received some support from migrant relatives. This includes remittances from
187
migrants other than children and siblings.31 The average total value of remittances received per household32 was € 38. The average cash remittances were € 18, which amounted to 5.5 percent of the total household cash income. These amounts seem relatively small, especially as compared to remittances from international migrants as reported in the Ghana Living Standard Survey (Adams et al. 2008; Mazzucato et
al. 2008). Some respondents indeed complained about lack of support from migrant relatives (Van der Geest 2010a), but – as a study of Dagara migrants in the Brong Ahafo showed, many migrants live below the poverty line themselves, and in that sense it can be considered a miracle that they are able to send remittances at all (Van der Geest 2009). None of the surveyed households had first line relatives who had migrated out of Africa. Five respondents did have more distant relatives (a cousin, a nephew, a brother-in-law and two nieces) in Europe and the United States from whom they had received remittances.
Savings of seasonal migrants
We also asked the household heads whether their household members report their savings to them upon return from their seasonal stay in the South. Most of the household heads (71.3 percent) confirmed this and 67.8 percent said that the seasonal migrants shared their savings with them. On average, seasonal migrants returned with € 37 of savings and in addition most of them brought home goods that are cheaper in Southern Ghana, especially clothes, bicycles, maize, farm tools, furniture and corrugated zinc for roofing. On average, the cash savings of seasonal migrants represent about 15.5 percent of the total cash income of their households. For the total sample – including households in which none of the members had gone on seasonal migration in the previous year – these savings amounted to € 26, which was 8.2 percent of the total cash income and more than the volume of remittances from migrant relatives.
Distribution of remittances
In a nation-wide study of remittances based on the fifth round of the Ghana Living Standard Survey (2005/2006) it is found that households receiving domestic remittances (from within Ghana) are significantly poorer than household receiving no remittances, and that households receiving international remittances are wealthier than households receiving no remittances or only domestic remittances (Adams et
al. 2008: 25). Similar results were found in a recent case study in Burkina Faso (Wouterse 2010). In the Nandom sample, the relation between remittances and poverty is less straightforward. The small group (9.9 percent) of households that did not receive any remittances in cash or kind had slightly higher incomes than the
31 Remittances by children and siblings constituted 81.3 percent of the total flow of remittances. 32 If the two outliers discussed in box 7.1 are excluded the average total sum of remittances amounts to € 28
and the average total sum of cash remittances amounts to € 13.
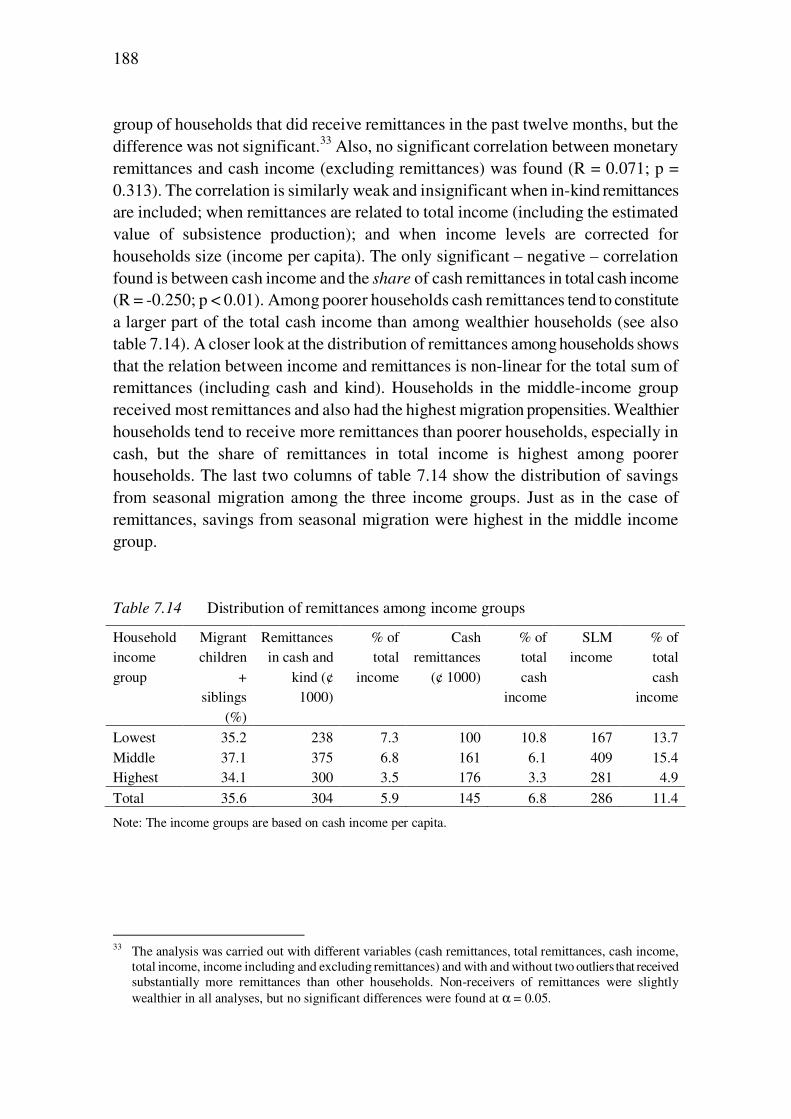
188
group of households that did receive remittances in the past twelve months, but the difference was not significant.33 Also, no significant correlation between monetary remittances and cash income (excluding remittances) was found (R = 0.071; p = 0.313). The correlation is similarly weak and insignificant when in-kind remittances are included; when remittances are related to total income (including the estimated value of subsistence production); and when income levels are corrected for households size (income per capita). The only significant – negative – correlation found is between cash income and the share of cash remittances in total cash income (R = -0.250; p < 0.01). Among poorer households cash remittances tend to constitute a larger part of the total cash income than among wealthier households (see also table 7.14). A closer look at the distribution of remittances among households shows that the relation between income and remittances is non-linear for the total sum of remittances (including cash and kind). Households in the middle-income group received most remittances and also had the highest migration propensities. Wealthier households tend to receive more remittances than poorer households, especially in cash, but the share of remittances in total income is highest among poorer households. The last two columns of table 7.14 show the distribution of savings from seasonal migration among the three income groups. Just as in the case of remittances, savings from seasonal migration were highest in the middle income group. Table 7.14 Distribution of remittances among income groups
Household income group
Migrant children
+ siblings
(%)
Remittances in cash and
kind (¢ 1000)
% of total
income
Cash remittances
(¢ 1000)
% of total cash
income
SLM income
% of total cash
income
Lowest 35.2 238 7.3 100 10.8 167 13.7 Middle 37.1 375 6.8 161 6.1 409 15.4 Highest 34.1 300 3.5 176 3.3 281 4.9
Total 35.6 304 5.9 145 6.8 286 11.4
Note: The income groups are based on cash income per capita.
33 The analysis was carried out with different variables (cash remittances, total remittances, cash income,
total income, income including and excluding remittances) and with and without two outliers that received substantially more remittances than other households. Non-receivers of remittances were slightly wealthier in all analyses, but no significant differences were found at α = 0.05.
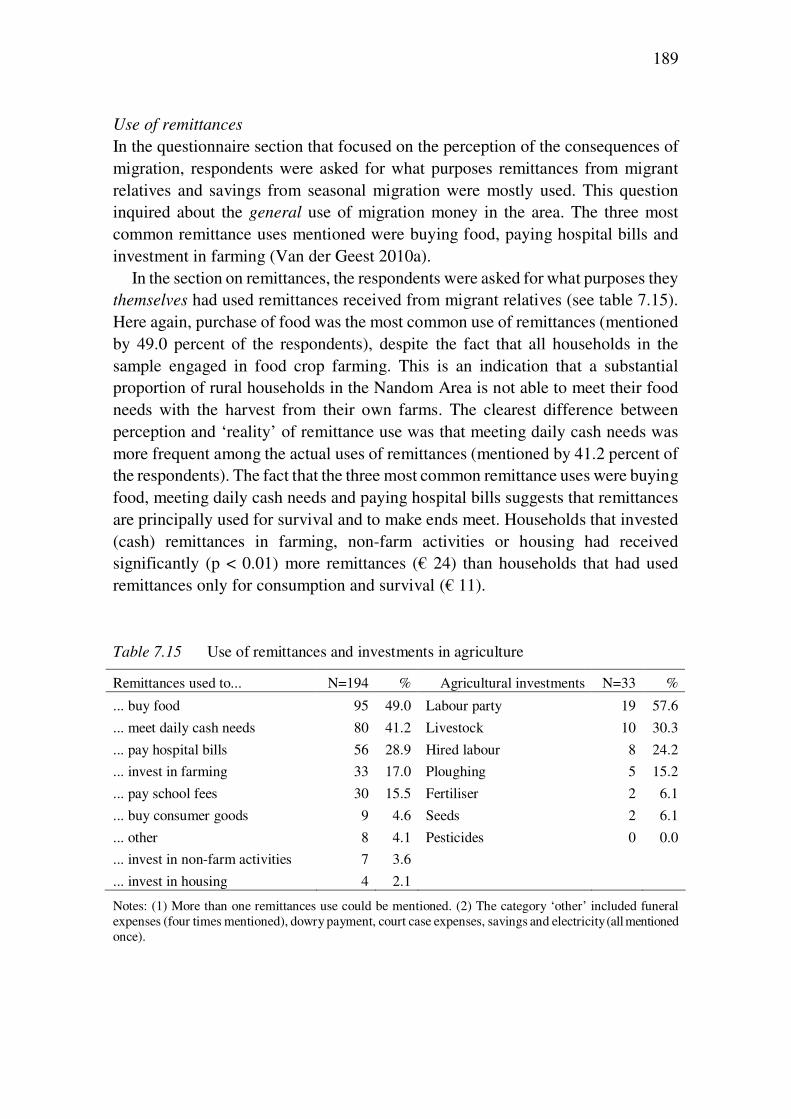
189
Use of remittances
In the questionnaire section that focused on the perception of the consequences of migration, respondents were asked for what purposes remittances from migrant relatives and savings from seasonal migration were mostly used. This question inquired about the general use of migration money in the area. The three most common remittance uses mentioned were buying food, paying hospital bills and investment in farming (Van der Geest 2010a).
In the section on remittances, the respondents were asked for what purposes they themselves had used remittances received from migrant relatives (see table 7.15). Here again, purchase of food was the most common use of remittances (mentioned by 49.0 percent of the respondents), despite the fact that all households in the sample engaged in food crop farming. This is an indication that a substantial proportion of rural households in the Nandom Area is not able to meet their food needs with the harvest from their own farms. The clearest difference between perception and ‘reality’ of remittance use was that meeting daily cash needs was more frequent among the actual uses of remittances (mentioned by 41.2 percent of the respondents). The fact that the three most common remittance uses were buying food, meeting daily cash needs and paying hospital bills suggests that remittances are principally used for survival and to make ends meet. Households that invested (cash) remittances in farming, non-farm activities or housing had received significantly (p < 0.01) more remittances (€ 24) than households that had used remittances only for consumption and survival (€ 11). Table 7.15 Use of remittances and investments in agriculture
Remittances used to... N=194 % Agricultural investments N=33 %
... buy food 95 49.0 Labour party 19 57.6
... meet daily cash needs 80 41.2 Livestock 10 30.3
... pay hospital bills 56 28.9 Hired labour 8 24.2
... invest in farming 33 17.0 Ploughing 5 15.2
... pay school fees 30 15.5 Fertiliser 2 6.1
... buy consumer goods 9 4.6 Seeds 2 6.1
... other 8 4.1 Pesticides 0 0.0
... invest in non-farm activities 7 3.6
... invest in housing 4 2.1
Notes: (1) More than one remittances use could be mentioned. (2) The category ‘other’ included funeral expenses (four times mentioned), dowry payment, court case expenses, savings and electricity (all mentioned once).
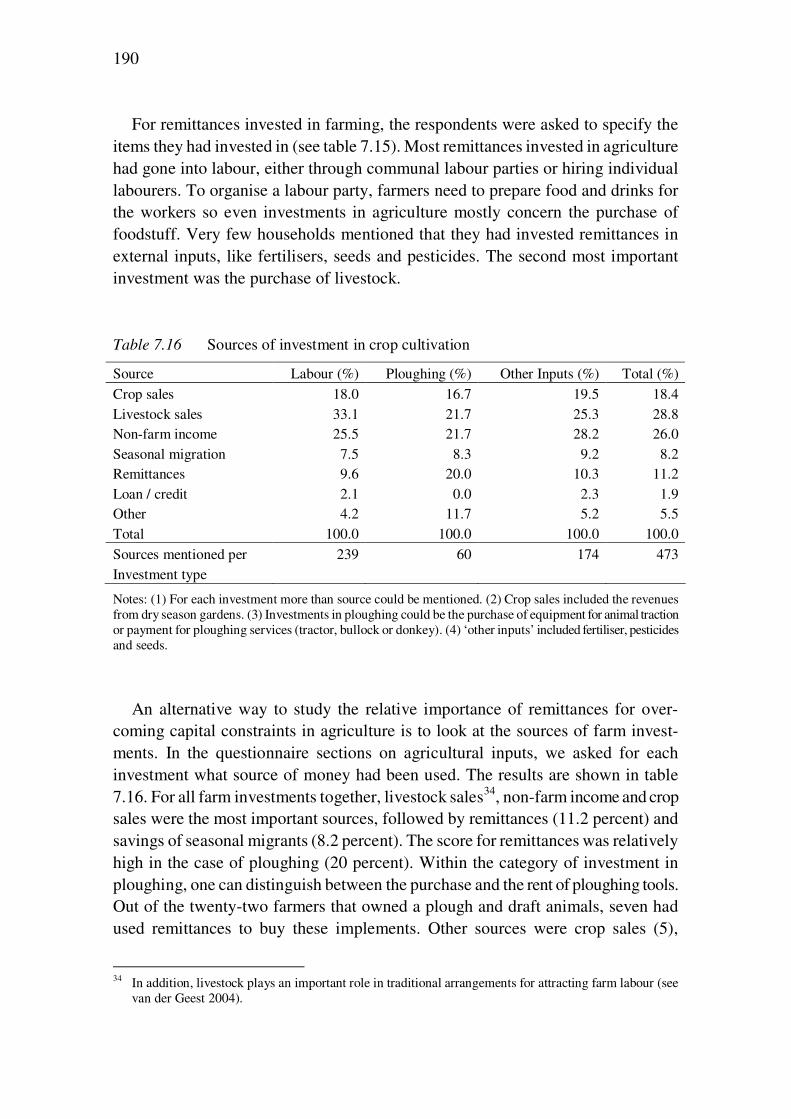
190
For remittances invested in farming, the respondents were asked to specify the items they had invested in (see table 7.15). Most remittances invested in agriculture had gone into labour, either through communal labour parties or hiring individual labourers. To organise a labour party, farmers need to prepare food and drinks for the workers so even investments in agriculture mostly concern the purchase of foodstuff. Very few households mentioned that they had invested remittances in external inputs, like fertilisers, seeds and pesticides. The second most important investment was the purchase of livestock. Table 7.16 Sources of investment in crop cultivation
Source Labour (%) Ploughing (%) Other Inputs (%) Total (%)
Crop sales 18.0 16.7 19.5 18.4 Livestock sales 33.1 21.7 25.3 28.8 Non-farm income 25.5 21.7 28.2 26.0 Seasonal migration 7.5 8.3 9.2 8.2 Remittances 9.6 20.0 10.3 11.2 Loan / credit 2.1 0.0 2.3 1.9 Other 4.2 11.7 5.2 5.5 Total 100.0 100.0 100.0 100.0
Sources mentioned per Investment type
239 60 174 473
Notes: (1) For each investment more than source could be mentioned. (2) Crop sales included the revenues from dry season gardens. (3) Investments in ploughing could be the purchase of equipment for animal traction or payment for ploughing services (tractor, bullock or donkey). (4) ‘other inputs’ included fertiliser, pesticides and seeds.
An alternative way to study the relative importance of remittances for over-coming capital constraints in agriculture is to look at the sources of farm invest-ments. In the questionnaire sections on agricultural inputs, we asked for each investment what source of money had been used. The results are shown in table 7.16. For all farm investments together, livestock sales34, non-farm income and crop sales were the most important sources, followed by remittances (11.2 percent) and savings of seasonal migrants (8.2 percent). The score for remittances was relatively high in the case of ploughing (20 percent). Within the category of investment in ploughing, one can distinguish between the purchase and the rent of ploughing tools. Out of the twenty-two farmers that owned a plough and draft animals, seven had used remittances to buy these implements. Other sources were crop sales (5),
34 In addition, livestock plays an important role in traditional arrangements for attracting farm labour (see
van der Geest 2004).
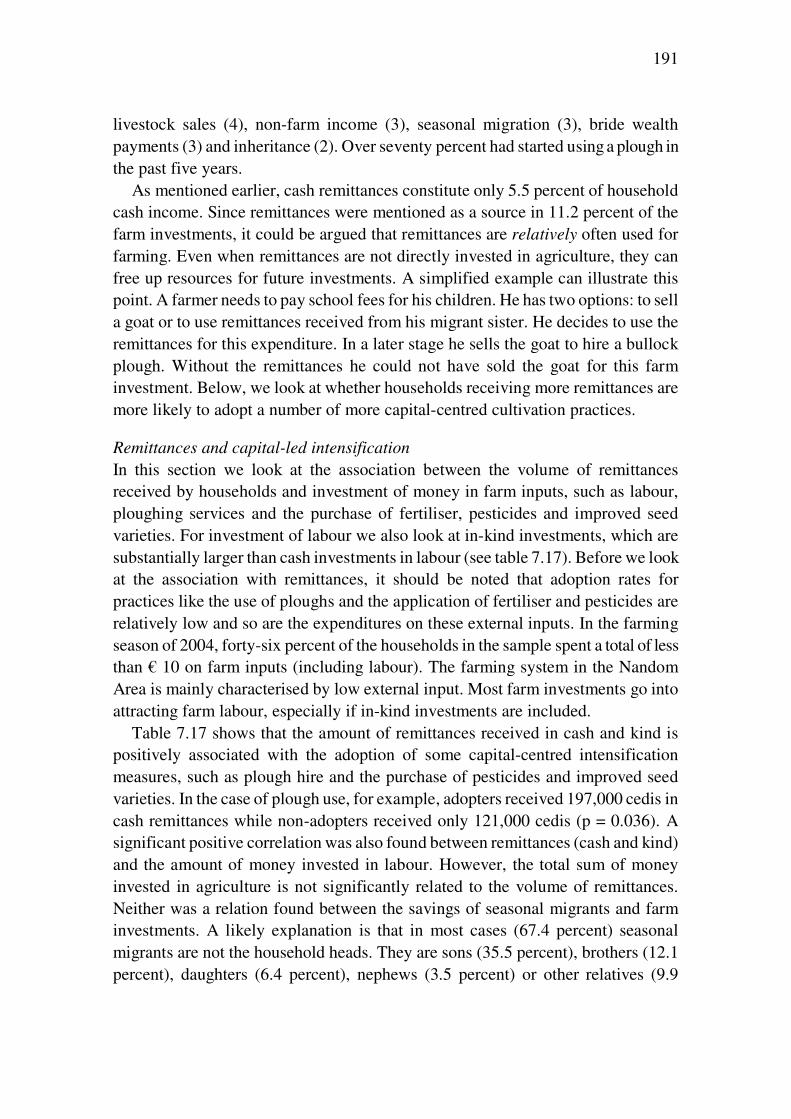
191
livestock sales (4), non-farm income (3), seasonal migration (3), bride wealth payments (3) and inheritance (2). Over seventy percent had started using a plough in the past five years.
As mentioned earlier, cash remittances constitute only 5.5 percent of household cash income. Since remittances were mentioned as a source in 11.2 percent of the farm investments, it could be argued that remittances are relatively often used for farming. Even when remittances are not directly invested in agriculture, they can free up resources for future investments. A simplified example can illustrate this point. A farmer needs to pay school fees for his children. He has two options: to sell a goat or to use remittances received from his migrant sister. He decides to use the remittances for this expenditure. In a later stage he sells the goat to hire a bullock plough. Without the remittances he could not have sold the goat for this farm investment. Below, we look at whether households receiving more remittances are more likely to adopt a number of more capital-centred cultivation practices.
Remittances and capital-led intensification
In this section we look at the association between the volume of remittances received by households and investment of money in farm inputs, such as labour, ploughing services and the purchase of fertiliser, pesticides and improved seed varieties. For investment of labour we also look at in-kind investments, which are substantially larger than cash investments in labour (see table 7.17). Before we look at the association with remittances, it should be noted that adoption rates for practices like the use of ploughs and the application of fertiliser and pesticides are relatively low and so are the expenditures on these external inputs. In the farming season of 2004, forty-six percent of the households in the sample spent a total of less than € 10 on farm inputs (including labour). The farming system in the Nandom Area is mainly characterised by low external input. Most farm investments go into attracting farm labour, especially if in-kind investments are included.
Table 7.17 shows that the amount of remittances received in cash and kind is positively associated with the adoption of some capital-centred intensification measures, such as plough hire and the purchase of pesticides and improved seed varieties. In the case of plough use, for example, adopters received 197,000 cedis in cash remittances while non-adopters received only 121,000 cedis (p = 0.036). A significant positive correlation was also found between remittances (cash and kind) and the amount of money invested in labour. However, the total sum of money invested in agriculture is not significantly related to the volume of remittances. Neither was a relation found between the savings of seasonal migrants and farm investments. A likely explanation is that in most cases (67.4 percent) seasonal migrants are not the household heads. They are sons (35.5 percent), brothers (12.1 percent), daughters (6.4 percent), nephews (3.5 percent) or other relatives (9.9
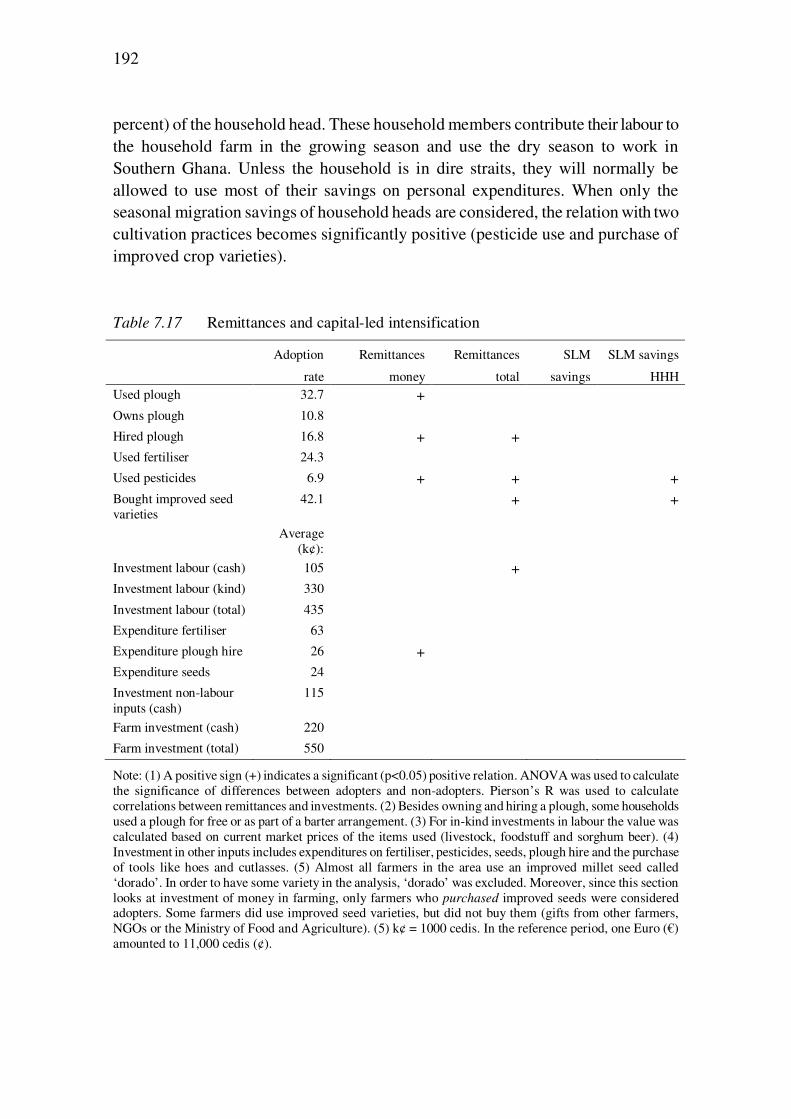
192
percent) of the household head. These household members contribute their labour to the household farm in the growing season and use the dry season to work in Southern Ghana. Unless the household is in dire straits, they will normally be allowed to use most of their savings on personal expenditures. When only the seasonal migration savings of household heads are considered, the relation with two cultivation practices becomes significantly positive (pesticide use and purchase of improved crop varieties). Table 7.17 Remittances and capital-led intensification
Adoption
rate
Remittances
money
Remittances
total
SLM
savings
SLM savings
HHH Used plough 32.7 + Owns plough 10.8 Hired plough 16.8 + + Used fertiliser 24.3 Used pesticides 6.9 + + + Bought improved seed varieties
42.1 + +
Average (k¢):
Investment labour (cash) 105 + Investment labour (kind) 330 Investment labour (total) 435 Expenditure fertiliser 63 Expenditure plough hire 26 + Expenditure seeds 24 Investment non-labour inputs (cash)
115
Farm investment (cash) 220 Farm investment (total) 550
Note: (1) A positive sign (+) indicates a significant (p<0.05) positive relation. ANOVA was used to calculate the significance of differences between adopters and non-adopters. Pierson’s R was used to calculate correlations between remittances and investments. (2) Besides owning and hiring a plough, some households used a plough for free or as part of a barter arrangement. (3) For in-kind investments in labour the value was calculated based on current market prices of the items used (livestock, foodstuff and sorghum beer). (4) Investment in other inputs includes expenditures on fertiliser, pesticides, seeds, plough hire and the purchase of tools like hoes and cutlasses. (5) Almost all farmers in the area use an improved millet seed called ‘dorado’. In order to have some variety in the analysis, ‘dorado’ was excluded. Moreover, since this section looks at investment of money in farming, only farmers who purchased improved seeds were considered adopters. Some farmers did use improved seed varieties, but did not buy them (gifts from other farmers, NGOs or the Ministry of Food and Agriculture). (5) k¢ = 1000 cedis. In the reference period, one Euro (€) amounted to 11,000 cedis (¢).
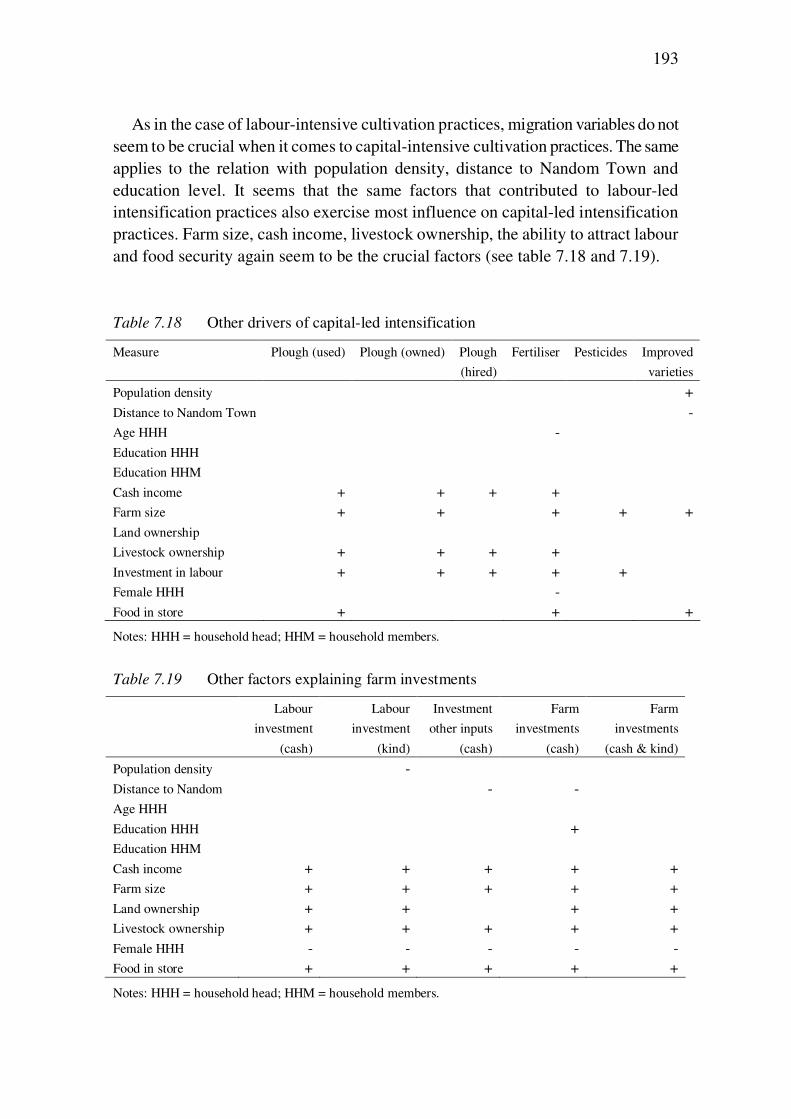
193
As in the case of labour-intensive cultivation practices, migration variables do not seem to be crucial when it comes to capital-intensive cultivation practices. The same applies to the relation with population density, distance to Nandom Town and education level. It seems that the same factors that contributed to labour-led intensification practices also exercise most influence on capital-led intensification practices. Farm size, cash income, livestock ownership, the ability to attract labour and food security again seem to be the crucial factors (see table 7.18 and 7.19). Table 7.18 Other drivers of capital-led intensification
Measure Plough (used) Plough (owned) Plough
(hired)
Fertiliser Pesticides Improved
varieties
Population density + Distance to Nandom Town - Age HHH - Education HHH Education HHM Cash income + + + + Farm size + + + + + Land ownership Livestock ownership + + + + Investment in labour + + + + + Female HHH - Food in store + + +
Notes: HHH = household head; HHM = household members.
Table 7.19 Other factors explaining farm investments
Labour
investment
(cash)
Labour
investment
(kind)
Investment
other inputs
(cash)
Farm
investments
(cash)
Farm
investments
(cash & kind)
Population density - Distance to Nandom - - Age HHH Education HHH + Education HHM Cash income + + + + + Farm size + + + + + Land ownership + + + + Livestock ownership + + + + + Female HHH - - - - - Food in store + + + + +
Notes: HHH = household head; HHM = household members.
194
In sum, almost all households in the Nandom Area receive some remittances from migrant relatives, but the amounts tend to be relatively low, constituting about five percent of households’ total cash income. Savings from seasonal migration are a source of income for about half the households constituting about eight percent of total cash income. Most remittances are used for buying food, meeting daily cash needs and paying hospital bills and school fees. When remittances are invested in farming, this mostly involves labour parties. Savings of seasonal migrants seem to be spent mostly on personal expenditures of the migrants (who mostly are not the household heads). The type of agriculture that is practised in Nandom is character-ised by low external input. Looking at the sources of farm investments, remittances and savings of seasonal migrants play a secondary role. Most farm investments are financed with livestock sales, crop sales and non-farm income. Still, households that receive more remittances are more likely to adopt some cultivation practices that involve investment of money (ploughing and the purchase of pesticides and improved seed varieties), than households that receive less remittances, but the total amount of money invested in agriculture is not related to the volume of remittances. Other factors such as farm size and livestock ownership are most closely related to farm investments. The only clear example where remittances seem to remove capital constraints is in the case of the purchase of ploughs. The volume of remittances seems to lack the ‘critical mass’ to have a substantial impact on agriculture. Also, at the time of the survey (2004), the conditions in the Nandom Area did not seem particularly encouraging for investing scarce resources in agriculture. As shown in figure 7.3, food prices increased sharply afterwards, and several international NGOs initiated agricultural projects. At the district level, farm sizes increased sharply in these years (see figure 7.2). It would be interesting to investigate whether these improved conditions also affected household investment of remittances in agriculture.
Return migration
As mentioned in the section on migration propensities, 88 out of 204 interviewed household heads were return migrants, and 84 of them had stayed in Southern Ghana. In migration and development theory, return migration can have a positive effect on development if returned migrants have acquired skills, knowledge or ideas that are of use to them back home, and/or if they return with savings or assets that they use in a productive way. In this section the effect of return migration on agricultural development in Nandom is analysed first by looking at acquired assets and skills and then by comparing some farm characteristics of return migrants and non-migrants.
In the survey questionnaire, returned migrants were asked whether they had acquired any assets and skills during their stay outside the Nandom Area. The
195
majority (80.2 percent) did return with some properties, but only a minority (27.2) indicated that they learned something that was of use to them after return. The most common properties acquired through migration were clothes (41.9 percent), bicycles (34.9 percent), non-farm productive assets (10.5 percent) and furniture (10.5). In addition, 11.6 percent had used savings from migration to build at least one room roofed with iron sheets in the family house. Only four migrants (4.7 percent) had brought home farm assets (hoes and cutlasses) and six (7.0 percent) had invested savings in livestock. Non-farm productive assets brought home by migrants were sewing machines, a grinding mill and large pots that are used for brewing pito (sorghum beer). As mentioned above, only a minority indicated that they had acquired skills in Southern Ghana that were still useful upon return. These mostly concerned non-farm occupational skills, like masonry, mechanics, tailoring, weaving, bread baking, barbering and the preparation of meals that are typical in the South. In addition, a minority of five returned migrants mentioned new farm techniques: modern styles of poultry farming and pig rearing and irrigated cultivation of tomatoes. In sum, the survey findings indicate that the assets and skills that migrants return with are not likely to have a substantial impact on agriculture. However, my impression is that in reality migrants acquire more skills than they reported in the questionnaire interview. During in-depth interviews I held with migrants who were also part of the survey sample, probing resulted in skills or ideas that did not surface during the questionnaire interview. For example, Sebastian Maniasie, whose migration history was summarized in Van der Geest (2010a), mentioned no acquired skills during the questionnaire interview, but in the in-depth interview, he explained that during his time in the Brong Ahafo Region, he had learned how to ‘farm with money’, how to operate on a larger scale.
Besides studying acquired skills and assets, the effect of return migration on agricultural development can also be analysed by comparing the farming styles of returned migrants and non-migrants (see table 7.20). The analysis shows that the farm characteristics of return migrants and non-migrants are strikingly similar. On most farm variables, returnees have a slightly lower ‘score’, but the differences are not significant. Their level of non-farm income is also lower than that of non-migrants. Within the group of returnees half had stayed in Southern Ghana for a period of less than five years and eighty percent had returned more than ten years ago. The migration experience and the level of savings, skills and assets a migrant can accumulate are likely to depend on the length of stay outside the area, and the effect of migration and return might fade over time. Therefore, the farm characteris-tics of long-term migrants and recent returnees were calculated separately (see table 7.20). This yielded no new insights, however.35
35 Following Cerase (1974) and Black’s (1993) work on return migration and agricultural development in
Portugal a separate analysis was also done for migrants who returned after a period of 4 to 15 years. This
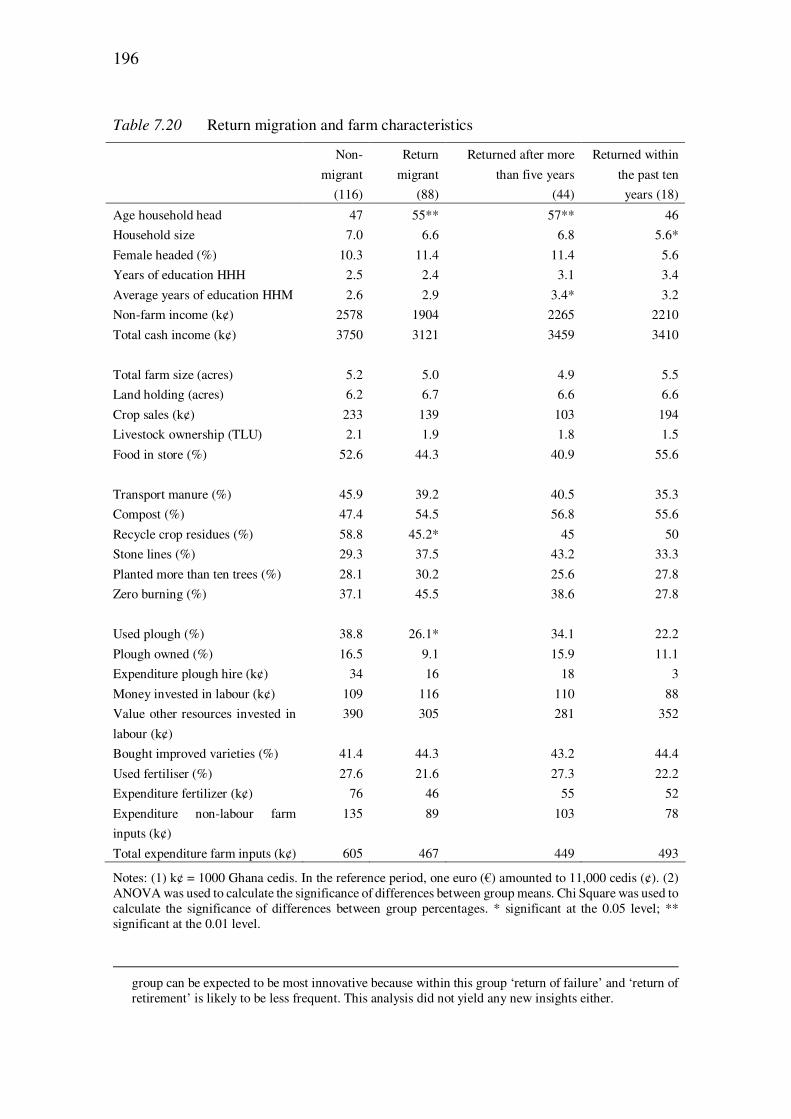
196
Table 7.20 Return migration and farm characteristics
Non-
migrant
(116)
Return
migrant
(88)
Returned after more
than five years
(44)
Returned within
the past ten
years (18)
Age household head 47 55** 57** 46
Household size 7.0 6.6 6.8 5.6*
Female headed (%) 10.3 11.4 11.4 5.6
Years of education HHH 2.5 2.4 3.1 3.4
Average years of education HHM 2.6 2.9 3.4* 3.2
Non-farm income (k¢) 2578 1904 2265 2210
Total cash income (k¢) 3750 3121 3459 3410
Total farm size (acres) 5.2 5.0 4.9 5.5
Land holding (acres) 6.2 6.7 6.6 6.6
Crop sales (k¢) 233 139 103 194
Livestock ownership (TLU) 2.1 1.9 1.8 1.5
Food in store (%) 52.6 44.3 40.9 55.6
Transport manure (%) 45.9 39.2 40.5 35.3
Compost (%) 47.4 54.5 56.8 55.6
Recycle crop residues (%) 58.8 45.2* 45 50
Stone lines (%) 29.3 37.5 43.2 33.3
Planted more than ten trees (%) 28.1 30.2 25.6 27.8
Zero burning (%) 37.1 45.5 38.6 27.8
Used plough (%) 38.8 26.1* 34.1 22.2
Plough owned (%) 16.5 9.1 15.9 11.1
Expenditure plough hire (k¢) 34 16 18 3
Money invested in labour (k¢) 109 116 110 88
Value other resources invested in
labour (k¢)
390 305 281 352
Bought improved varieties (%) 41.4 44.3 43.2 44.4
Used fertiliser (%) 27.6 21.6 27.3 22.2
Expenditure fertilizer (k¢) 76 46 55 52
Expenditure non-labour farm
inputs (k¢)
135 89 103 78
Total expenditure farm inputs (k¢) 605 467 449 493
Notes: (1) k¢ = 1000 Ghana cedis. In the reference period, one euro (€) amounted to 11,000 cedis (¢). (2) ANOVA was used to calculate the significance of differences between group means. Chi Square was used to calculate the significance of differences between group percentages. * significant at the 0.05 level; ** significant at the 0.01 level.
group can be expected to be most innovative because within this group ‘return of failure’ and ‘return of retirement’ is likely to be less frequent. This analysis did not yield any new insights either.
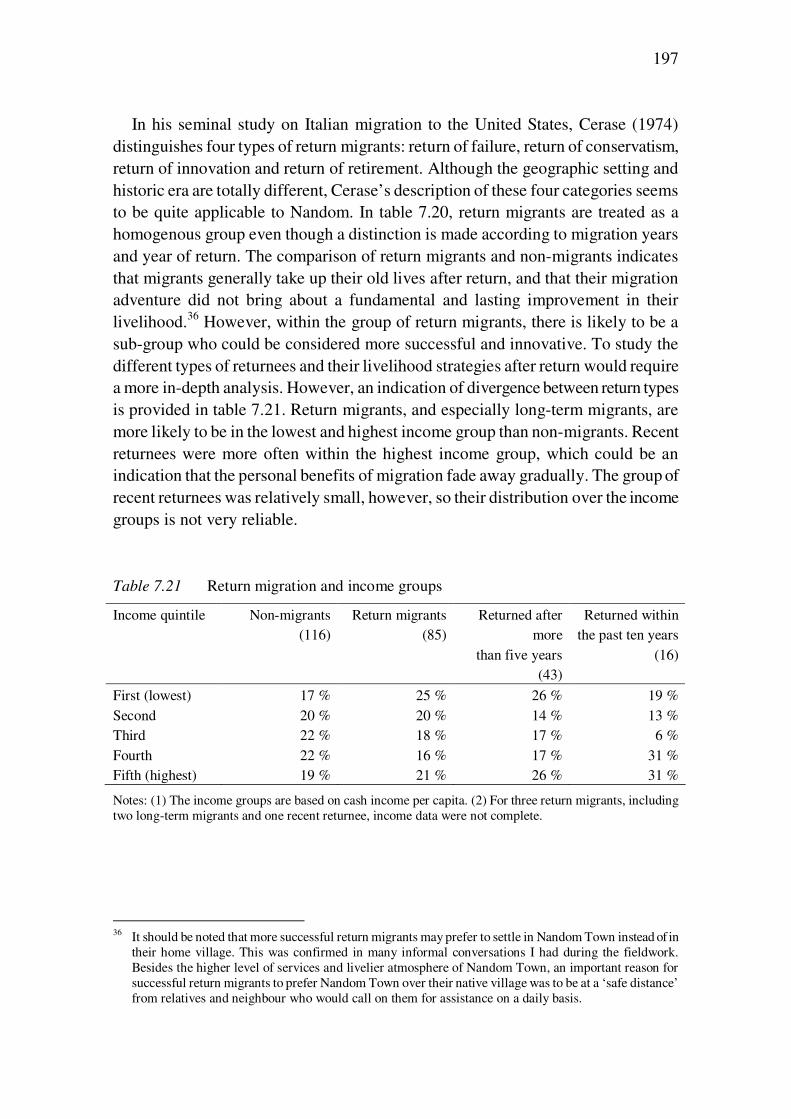
197
In his seminal study on Italian migration to the United States, Cerase (1974) distinguishes four types of return migrants: return of failure, return of conservatism, return of innovation and return of retirement. Although the geographic setting and historic era are totally different, Cerase’s description of these four categories seems to be quite applicable to Nandom. In table 7.20, return migrants are treated as a homogenous group even though a distinction is made according to migration years and year of return. The comparison of return migrants and non-migrants indicates that migrants generally take up their old lives after return, and that their migration adventure did not bring about a fundamental and lasting improvement in their livelihood.36 However, within the group of return migrants, there is likely to be a sub-group who could be considered more successful and innovative. To study the different types of returnees and their livelihood strategies after return would require a more in-depth analysis. However, an indication of divergence between return types is provided in table 7.21. Return migrants, and especially long-term migrants, are more likely to be in the lowest and highest income group than non-migrants. Recent returnees were more often within the highest income group, which could be an indication that the personal benefits of migration fade away gradually. The group of recent returnees was relatively small, however, so their distribution over the income groups is not very reliable. Table 7.21 Return migration and income groups
Income quintile Non-migrants (116)
Return migrants (85)
Returned after more
than five years (43)
Returned within the past ten years
(16)
First (lowest) 17 % 25 % 26 % 19 % Second 20 % 20 % 14 % 13 % Third 22 % 18 % 17 % 6 % Fourth 22 % 16 % 17 % 31 % Fifth (highest) 19 % 21 % 26 % 31 %
Notes: (1) The income groups are based on cash income per capita. (2) For three return migrants, including two long-term migrants and one recent returnee, income data were not complete.
36 It should be noted that more successful return migrants may prefer to settle in Nandom Town instead of in
their home village. This was confirmed in many informal conversations I had during the fieldwork. Besides the higher level of services and livelier atmosphere of Nandom Town, an important reason for successful return migrants to prefer Nandom Town over their native village was to be at a ‘safe distance’ from relatives and neighbour who would call on them for assistance on a daily basis.
198
Summary of survey findings
The questionnaire survey yielded a wealth of data on the multiple linkages between migration and agricultural development. Three broad effects of out-migration were distinguished: the loss of labour effect on farm size and the adoption of labour-intensive cultivation practices; the effect of remittances on farm investments; and the effect of return migration. The findings are summarized here.
The survey confirmed that the people of Nandom are extremely mobile. They engage both in seasonal and long-term migration. About ten percent of the total survey population (which included small children and elderly) had gone on seasonal migration during the twelve months prior to the questionnaire. For adult men the proportion was over forty percent. More than a third of all children and siblings of the household heads we interviewed were living outside the Nandom Area – mainly in Southern Ghana – at the time of the interview. Among brothers of the household heads, the proportion of migrants was highest, over fifty percent.
No straightforward relation between population density and migration propen-sities was found. The proportion of migrant relatives did increase with increasing population density, but the most densely populated village had experienced relatively little out-migration. In this village, which was located close to Nandom Town, the strategy to reduce pressure on natural resources was not to migrate, but to engage in non-farm income generating activities. Seasonal migration was most common in the least densely populated villages.
The loss of labour effect of migration on agricultural development was analysed in two steps. First the effect of out-migration on household sex and age structure was studied and after that, the relation to farm size and a selection of labour-intensive cultivation practices was studied. The analysis showed that the migration of children and siblings had different effects on dependency rates. In household where more children (especially sons) had migrated, elderly dependency ratios were significantly higher and youth dependency rates were significantly lower than in households where fewer children had migrated. In the case of migrant siblings, the effect was opposite, but less strong. The total proportion of migrant relatives had no significant effect on total dependency ratios (including elderly and youth depend-ency). The only significant effect on total dependency ratios was found for migrant sons. Despite the feminization of the Dagara migration system in recent decades, out-migration also had a significant effect on adult sex ratios. In households from which more children and siblings had migrated, the proportion of adult men over adult women was lower.
The total proportion of first-line relatives that had migrated had no significant effect on farm size, herd size and a number of agricultural trends including household labour input. However, a disaggregation in different types of relative
199
(sons, daughters, brother and sisters) showed that the effect of out-migration on these variables depends on who migrates. While the migration of children (especially sons) had a significant negative effect, the opposite was the case for the migration of siblings. In the social organization of the Dagara in Nandom, the migration of a son involves loss of labour while the migration of a brother reduces the pressure on land and frees up other resources, like family-owned livestock, which can be used to expand farms.
The adoption of labour-intensive cultivation practices that aim to maintain or improve soil fertility and yields levels, such as composting, tree planting and zero burning, was quite substantial. Comparing adoption rates with the proportion of children and siblings that had migrated and household sex and age structure, no significant loss of labour effect was found. This is probably because labour is not a major constraint in the local farming system (see also Runge-Metzger & Diehl 1993: 164) and out-migration largely involves a movement of surplus labour. Population density, distance to Nandom Town and education level played no decisive role in the adoption of labour-intensive cultivation practices either. The analysis showed that farm size, livestock ownership, food security and the ability to attract labour from outside the household were the principal determinants of the adoption of cultivation practices that represent a labour-led path to intensification. This set of variables could be labelled ‘farm wealth’. Similar results were found for the adoption of more capital-intensive cultivation practices (see below). This is an indication that there might be a gap between households that have the resources to make the transition to more intensive land use and households that do not. This latter group is continuously struggling to make ends meet and don’t have the resources and strength to improve on their situation.37 The survey data revealed that despite high migration propensities, the volume of remittances flowing back to households in the Nandom Area is limited. Average cash remittances represent 5.5 percent of households’ – meagre – cash income. Savings of seasonal migration account for another 8.2 percent. The money entering the area through migration is mainly used to purchase food, to pay hospital bills and to meet daily cash needs. Remittances that are invested in agriculture mainly go into labour and seem to lack the critical mass to really make a difference. Investment in animal traction may be an exception. Twenty percent of the investments in ploughs, bullocks, donkeys were financed with remittances. The adoption of bullock and donkey ploughing is probably the most important recent change in Nandom’s
37 In a Northeast Ghanaian case study, Whitehead (2006) came to the same conclusion, emphasising the
importance of wealth status and access to labour in farm enterprises and identifying a gap between wealthier households that could expand and intensify their farms and poorer households that were trapped in a situation where they had to spend too much on other people’s farms to gain access to food.
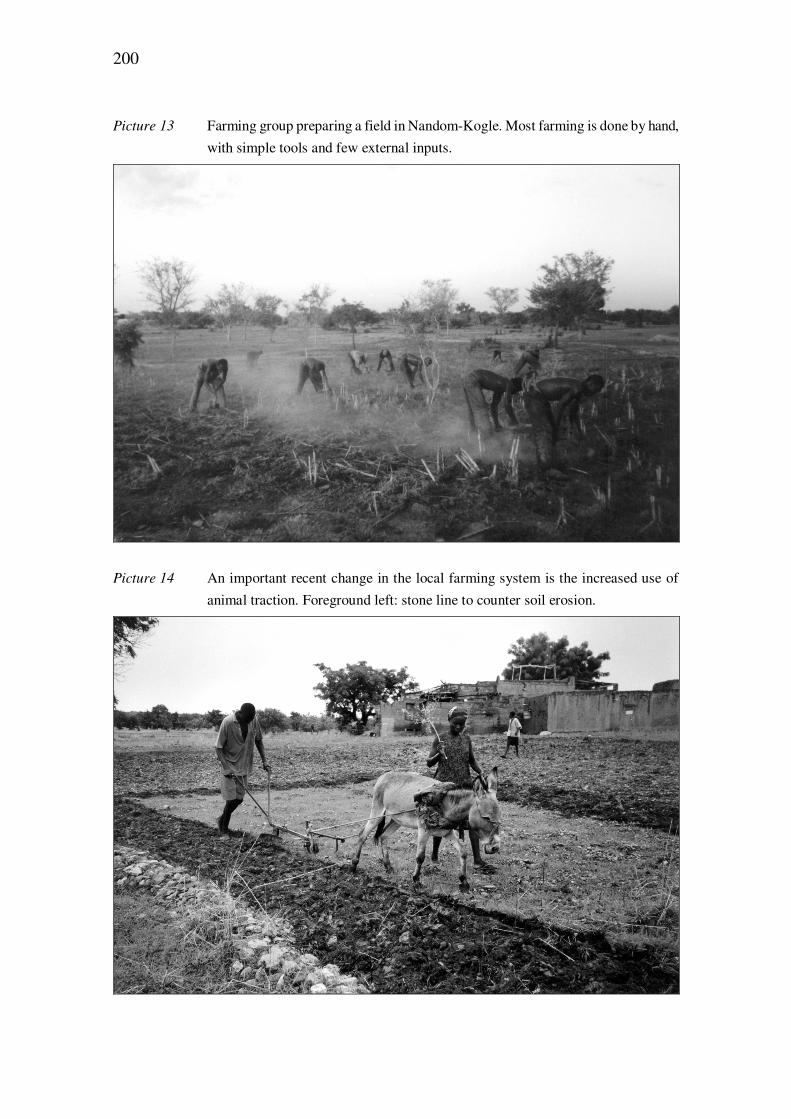
200
Picture 13 Farming group preparing a field in Nandom-Kogle. Most farming is done by hand,
with simple tools and few external inputs.
Picture 14 An important recent change in the local farming system is the increased use of
animal traction. Foreground left: stone line to counter soil erosion.
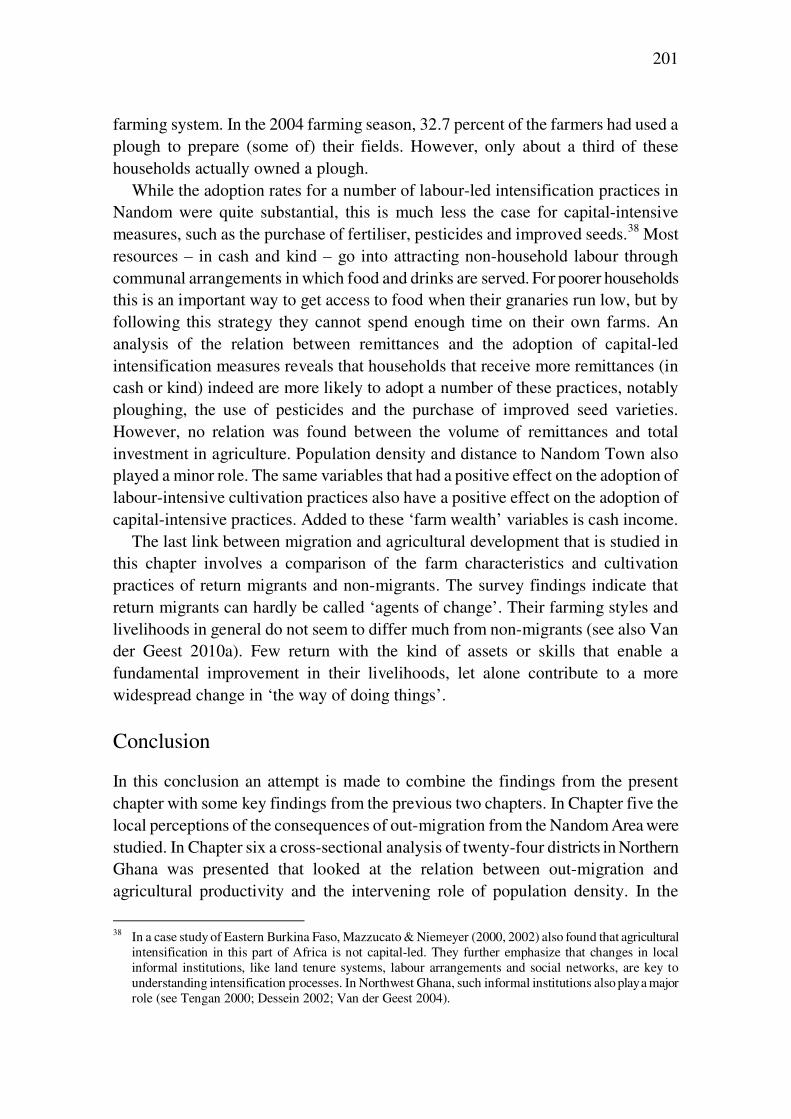
201
farming system. In the 2004 farming season, 32.7 percent of the farmers had used a plough to prepare (some of) their fields. However, only about a third of these households actually owned a plough.
While the adoption rates for a number of labour-led intensification practices in Nandom were quite substantial, this is much less the case for capital-intensive measures, such as the purchase of fertiliser, pesticides and improved seeds.38 Most resources – in cash and kind – go into attracting non-household labour through communal arrangements in which food and drinks are served. For poorer households this is an important way to get access to food when their granaries run low, but by following this strategy they cannot spend enough time on their own farms. An analysis of the relation between remittances and the adoption of capital-led intensification measures reveals that households that receive more remittances (in cash or kind) indeed are more likely to adopt a number of these practices, notably ploughing, the use of pesticides and the purchase of improved seed varieties. However, no relation was found between the volume of remittances and total investment in agriculture. Population density and distance to Nandom Town also played a minor role. The same variables that had a positive effect on the adoption of labour-intensive cultivation practices also have a positive effect on the adoption of capital-intensive practices. Added to these ‘farm wealth’ variables is cash income.
The last link between migration and agricultural development that is studied in this chapter involves a comparison of the farm characteristics and cultivation practices of return migrants and non-migrants. The survey findings indicate that return migrants can hardly be called ‘agents of change’. Their farming styles and livelihoods in general do not seem to differ much from non-migrants (see also Van der Geest 2010a). Few return with the kind of assets or skills that enable a fundamental improvement in their livelihoods, let alone contribute to a more widespread change in ‘the way of doing things’.
Conclusion
In this conclusion an attempt is made to combine the findings from the present chapter with some key findings from the previous two chapters. In Chapter five the local perceptions of the consequences of out-migration from the Nandom Area were studied. In Chapter six a cross-sectional analysis of twenty-four districts in Northern Ghana was presented that looked at the relation between out-migration and agricultural productivity and the intervening role of population density. In the
38 In a case study of Eastern Burkina Faso, Mazzucato & Niemeyer (2000, 2002) also found that agricultural
intensification in this part of Africa is not capital-led. They further emphasize that changes in local informal institutions, like land tenure systems, labour arrangements and social networks, are key to understanding intensification processes. In Northwest Ghana, such informal institutions also play a major role (see Tengan 2000; Dessein 2002; Van der Geest 2004).
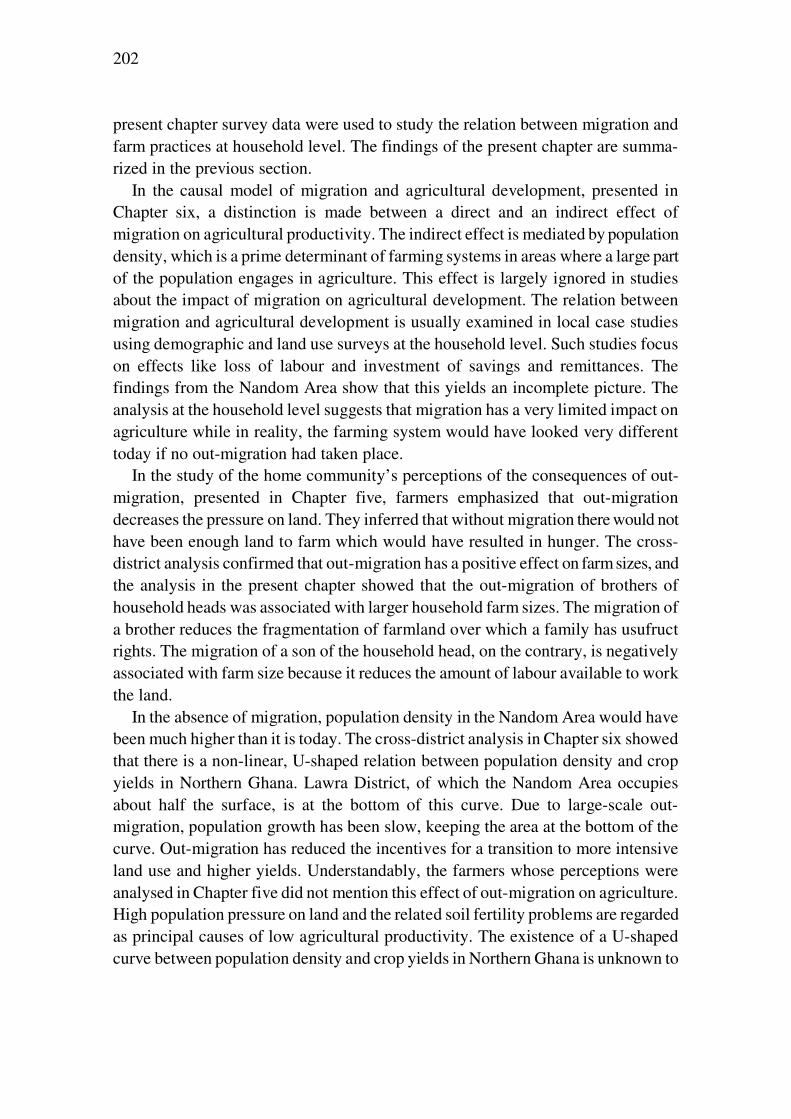
202
present chapter survey data were used to study the relation between migration and farm practices at household level. The findings of the present chapter are summa-rized in the previous section.
In the causal model of migration and agricultural development, presented in Chapter six, a distinction is made between a direct and an indirect effect of migration on agricultural productivity. The indirect effect is mediated by population density, which is a prime determinant of farming systems in areas where a large part of the population engages in agriculture. This effect is largely ignored in studies about the impact of migration on agricultural development. The relation between migration and agricultural development is usually examined in local case studies using demographic and land use surveys at the household level. Such studies focus on effects like loss of labour and investment of savings and remittances. The findings from the Nandom Area show that this yields an incomplete picture. The analysis at the household level suggests that migration has a very limited impact on agriculture while in reality, the farming system would have looked very different today if no out-migration had taken place.
In the study of the home community’s perceptions of the consequences of out-migration, presented in Chapter five, farmers emphasized that out-migration decreases the pressure on land. They inferred that without migration there would not have been enough land to farm which would have resulted in hunger. The cross-district analysis confirmed that out-migration has a positive effect on farm sizes, and the analysis in the present chapter showed that the out-migration of brothers of household heads was associated with larger household farm sizes. The migration of a brother reduces the fragmentation of farmland over which a family has usufruct rights. The migration of a son of the household head, on the contrary, is negatively associated with farm size because it reduces the amount of labour available to work the land.
In the absence of migration, population density in the Nandom Area would have been much higher than it is today. The cross-district analysis in Chapter six showed that there is a non-linear, U-shaped relation between population density and crop yields in Northern Ghana. Lawra District, of which the Nandom Area occupies about half the surface, is at the bottom of this curve. Due to large-scale out-migration, population growth has been slow, keeping the area at the bottom of the curve. Out-migration has reduced the incentives for a transition to more intensive land use and higher yields. Understandably, the farmers whose perceptions were analysed in Chapter five did not mention this effect of out-migration on agriculture. High population pressure on land and the related soil fertility problems are regarded as principal causes of low agricultural productivity. The existence of a U-shaped curve between population density and crop yields in Northern Ghana is unknown to
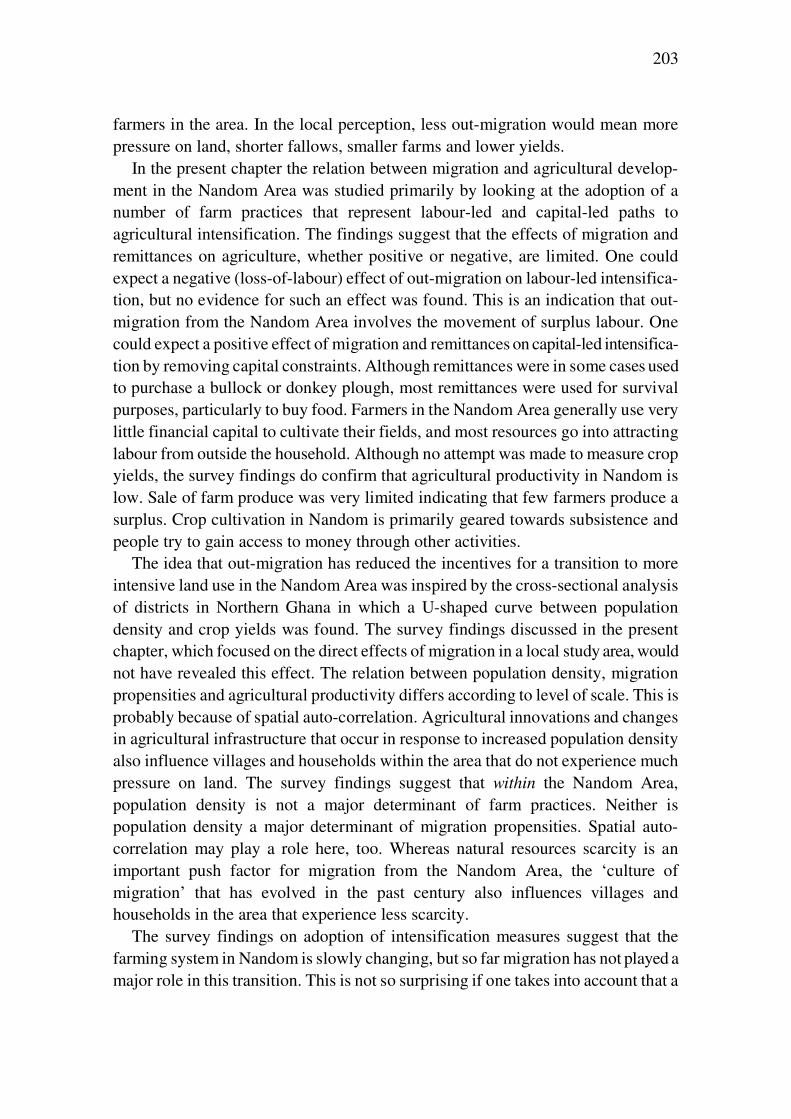
203
farmers in the area. In the local perception, less out-migration would mean more pressure on land, shorter fallows, smaller farms and lower yields.
In the present chapter the relation between migration and agricultural develop-ment in the Nandom Area was studied primarily by looking at the adoption of a number of farm practices that represent labour-led and capital-led paths to agricultural intensification. The findings suggest that the effects of migration and remittances on agriculture, whether positive or negative, are limited. One could expect a negative (loss-of-labour) effect of out-migration on labour-led intensifica-tion, but no evidence for such an effect was found. This is an indication that out-migration from the Nandom Area involves the movement of surplus labour. One could expect a positive effect of migration and remittances on capital-led intensifica-tion by removing capital constraints. Although remittances were in some cases used to purchase a bullock or donkey plough, most remittances were used for survival purposes, particularly to buy food. Farmers in the Nandom Area generally use very little financial capital to cultivate their fields, and most resources go into attracting labour from outside the household. Although no attempt was made to measure crop yields, the survey findings do confirm that agricultural productivity in Nandom is low. Sale of farm produce was very limited indicating that few farmers produce a surplus. Crop cultivation in Nandom is primarily geared towards subsistence and people try to gain access to money through other activities.
The idea that out-migration has reduced the incentives for a transition to more intensive land use in the Nandom Area was inspired by the cross-sectional analysis of districts in Northern Ghana in which a U-shaped curve between population density and crop yields was found. The survey findings discussed in the present chapter, which focused on the direct effects of migration in a local study area, would not have revealed this effect. The relation between population density, migration propensities and agricultural productivity differs according to level of scale. This is probably because of spatial auto-correlation. Agricultural innovations and changes in agricultural infrastructure that occur in response to increased population density also influence villages and households within the area that do not experience much pressure on land. The survey findings suggest that within the Nandom Area, population density is not a major determinant of farm practices. Neither is population density a major determinant of migration propensities. Spatial auto-correlation may play a role here, too. Whereas natural resources scarcity is an important push factor for migration from the Nandom Area, the ‘culture of migration’ that has evolved in the past century also influences villages and households in the area that experience less scarcity.
The survey findings on adoption of intensification measures suggest that the farming system in Nandom is slowly changing, but so far migration has not played a major role in this transition. This is not so surprising if one takes into account that a
204
typical way in which migration can contribute to agricultural development is by removing capital constraints for farm investments. The transition that is underway in Nandom is more labour-intensive than capital-intensive. Prices of inorganic fertilisers are high compared to the benefits they can bring to the most common crops that are cultivated in the area (sorghum and millet), and apart from investment in ploughing gear, no other capital-intensive measures are common in the area. Adoption rates for low external input (labour-led) intensification measures are higher in the Nandom Area. Such measures may not produce fast results like the application of inorganic fertiliser, but may be more sustainable in the long run.
In the period after the survey year (2004) food crop prices have increased and so has institutional support to farmers. If these tendencies persist and especially if Nandom is connected by a tarred road to the regional capital Wa and urban markets in Southern Ghana, the necessary conditions could be created that facilitate a successful transition to more intensive land use. Under these conditions, it is also more likely that remittances are invested in agricultural production and that return migration changes from ‘returns of failure and retirement’ to ‘returns of innovation’ (see Cerase 1974).
8 Conclusions1
This dissertation has investigated the multiple linkages between migration, environment and development in Ghana with special reference to the migration system of the Dagara from Northwest Ghana. The principal destination region of Dagara migrants is the Brong Ahafo Region in Ghana’s middle belt. A majority of Dagara migrants in Southern Ghana settle in urban localities, but this is not the case for Dagara settlers in the Brong Ahafo Region who are primarily farmers. Three different migration types are studied here: seasonal labour migration, long-term migration and return migration. The geographic focus of this study ranges from the national level through the regional level to two local case study areas. The study sought to answer the following research question: “what are the economic and environmental causes and consequences of rural migration from the Upper West Region to the Brong Ahafo region?
Three academic debates are at the core of this research. First, the environmental refugee debate, which seeks to determine to what extent human migration flows are environmentally induced and to what extent people are forced to relocate in response to environmental disruption. The second body of literature that is central to this research is the population-environment debate about the impact of demographic and socio-economic change on natural resources management and environmental quality. Within the broader field of population-environment studies, the Malthus-Boserup debate looks at the relation between population growth, technology and land use sustainability. The third academic debate that is at the core of this research involves the question of whether – or under what circumstances – migration has a positive or negative impact on development in migrants’ area of origin.
1 An adjusted version of this chapter, summarizing the findings of this dissertation, has been submitted for
publication and is currently under review.
206
A key characteristic of this study’s research design is the combination of a wide variety of data sources at different levels of scale. At the local level, both in migrants’ source and destination areas, questionnaire surveys were conducted among migrant and non-migrant households. The questionnaires had a broad livelihood setup with more in-depth sections about migration history and land use. Also, much emphasis was given to respondents’ own perceptions about the key questions posed in this research. In addition to the questionnaires, group discussions were organized that focused on topics that went beyond the household level, and three in-depth life histories of returned migrants were reconstructed to acquire a better grasp of decision-making processes. The local data were complemented with a variety of other data sources at a higher level of scale, such as population censuses, agricultural production data, remotely sensed vegetation data, LANDSAT images, rainfall data, soil maps and the Ghana Living Standard Survey. Geographic Information System (GIS) applications were used to aggregate different sources to comparable units of analysis and to present the data in maps.
The rationale for using multiple data sources was threefold. First, the kind of data needed to address the core questions of this research required a combination of people-centred methods and more ‘distant’ analyses with a larger time span and a wider spatial scope. The questionnaire surveys, perception analyses and group discussions revealed patterns and processes on the ground, but the spatial and/or temporal coverage of these data sources was inevitably limited. Detailed information about a particular place or area at a particular point in time becomes more meaningful when it is contrasted with – usually less detailed – information from surrounding places and earlier periods. The secondary data sources helped not only to place the local case study material in a geographical and historical context, but also to make this research more relevant for areas beyond the limits of the local case study sites. Second, the environmental causes and consequences of migration could not be adequately studied with questionnaire surveys alone. The questionnaires provided information on farmers’ natural resource management, but not on environmental conditions and outcomes. Third, the findings of population-environment studies are largely conditioned by the methods used and the environ-mental discourse which researchers consciously or unconsciously adhere to (Adams 1990; Dryzek 1997). Participative anthropologic fieldwork on indigenous land use practices, for example, tends to yield much more optimistic – and often admiring – findings than desk studies based on secondary data or studies by ecologists and soil scientists who pay less heed to the way in which human agency, social relations, cultural contexts and institutions affect land use patterns. By combining different sources and methods it was attempted to avoid indigenous romanticism at one extreme and what Mortimore & Adams (2001: 51) call a “euro-centric or techno-centric view of African farming” on the other.
207
This dissertation largely consists of journal articles, and each chapter has its own conclusion based on empirical data from different sources. To avoid repetition, an attempt is made here to go beyond the specific topics of the chapters and present the overall findings on migration, environment and development linkages in the Dagara migration system. This concluding chapter is more narrative in nature and references to the data are kept to a minimum. The outline of this chapter is as follows. First, the environmental and economic determinants of Dagara migration, both in source and destination areas, are discussed and after that, the focus shifts to the environmental and economic impact of migration. This concluding chapter also discusses the relevance of the findings from this research for the wider academic debates indicated above.
Driving forces in the Dagara migration system
The North-South migration system of the Dagara was initiated through colonial coercion in the first decades of the 20th century. In pre-colonial times, before the advent of the modern migration system of the Dagara, people moved over shorter distances, mainly in search of fertile land. In addition, there was an involuntary population flow from present Northern Ghana to the South, which consisted of captured slaves who were mostly sold to European traders and shipped to the Americas. In the early 20th century, the first North-South migrants worked in the gold mines and in infrastructural projects of the colonial government. Soon after forced recruitment of labourers started, it also became common for young men to migrate voluntarily to Southern Ghana. Most of them worked as farm labourers in the booming cocoa sector. In the past hundred years, out-migration rates have gradually increased with a temporary decline in the 1970-1984 inter-censal period. Poor agro-ecological conditions, a long history of governmental neglect and high rates of poverty are the principal root causes of migration from Northern Ghana.
Patterns of Dagara migration have changed over time as a response to changes in migrants’ opportunity structure and as a result of a maturing of the migration system. The Dagara migration system has matured in the sense that migration has become more permanent and is no longer a young men’s affair. It is now more common for entire households to migrate and a progressive feminization of the migration flow is discernible. The migration opportunity structure is constantly changing as a result of developments in the source areas and destination areas. Environmental factors play a role, but they act in complex interplay with economic, political, social and cultural factors.
In the early stages of the Dagara migration system, there was a high demand for unskilled labour in the mines and cocoa sector of Southern Ghana. In this period most Dagara settled in mining towns, like Tarkwa and Obuasi, and in cocoa growing
208
areas in the Ashanti Region and the Western Region. Migrants from the North held the least popular jobs, but it was not very difficult for them to find employment and make a living as unskilled labourers. This situation lasted until the early 1970s when Ghana entered a period of severe economic decline and political crisis. Labour was no longer scarce in the South and the situation for migrants from Northern Ghana deteriorated. Many migrants decided to return to the North, and some established a farm in the new food crop frontier in the Brong Ahafo Region, which would later become the prime settlement region of Dagara migrants. Ghana’s economic and political crisis lasted until the late 1980s, but economic recovery in the 1990s and 2000s did not produce scarcity of unskilled labour as it existed before the crisis. Although many Dagara migrants still settle in urban centres further south – usually as self-employed workers in the informal sector or as civil servants – rural destinations in the forest-savannah transition zone of the Brong Ahafo Region have become increasingly popular, especially for migrants with low levels of formal education. This shift in the Dagara migration system results from both environ-mental and non-environmental factors. Economic decline and the political crisis made labour migration less attractive and the Brong Ahafo Region had important environmental pull factors for Dagara farmers, particularly its relatively easy access to fertile land and the bi-modal rainfall pattern. The forest belt south of the forest-savannah transition zone has even better agro-ecological conditions, but access to land is more expensive and restrictive there. These areas have higher population densities and land is more commoditized because of the tradition of cocoa farming.
Environmental push plays an important role in the North-South migration system, but here too, environmental and non-environmental factors interact. Agro-ecological conditions in the North are generally poor compared to the South, and in areas with most natural resources scarcity migration propensities are highest. However, low agricultural productivity and underdevelopment do not result from poor agro-ecological conditions alone. A century of colonial and post-colonial government policies that structurally neglected the North and concentrated development efforts in the South has produced a widening gap in the livelihood opportunities of people in the North and the South. If the twentieth century in Northern Ghana had witnessed large-scale investment in infrastructure, quality support to the agricultural sector and price policies that benefit food farmers instead of structural neglect and urban bias, the conditions for building a sustainable rural livelihood and patterns of out-migration would have been very different today.
Migration from Northern Ghana to Southern Ghana will most likely continue to increase because the South is developing much faster than the North. While poverty rates in Southern Ghana have decreased sharply over the past two decades, this is much less the case for Northern Ghana, and especially the Upper West Region, which is the home area of the Dagara. No evidence was found that the widening of
209
the economic gap between North and South over the past two decades is due to environmental degradation in the North. Rather, the past twenty years were a time of environmental recovery after the Sahelian droughts of the 1970s and early 1980s.
As noted in the introduction of this chapter, three academic debates or bodies of literature are at the core of this research: the environmental refugee debate, the population-environment debate and the migration and development debate. Below, the relevance of the findings from the present research for these debates is discussed.
The environmental refugee debate
The environmental refugee debate, which gained momentum in the 2000s, has been dominated by conceptual contributions from social scientists and rather ‘distant’ empirical analyses by ecologists. Until recently, case studies looking at environ-mental causes of migration and the degree of force exercised by environmental factors in existing migration flows were relatively rare. In Chapter two and especially Chapter three of this thesis, an attempt is made to contribute to the environmental refugee debate with a research design that combines quantitative and qualitative data at different levels of geographic scale in migrants’ source and destination areas. Chapter two looked at the relation between migration and vegetation cover to explore environmental causes and consequences of migration, first at the national level and after that by focusing on the three principal migration flows in Ghana. The greenness of the environment, as measured by the Normalised Difference Vegetation Index (NDVI), is an important indicator of environmental conditions for rainfed agriculturalists because vegetation cover is to a large extent determined by climatic conditions and soil quality. However, it is recognized that the NDVI is not a perfect measure of environmental quality or even agro-ecological conditions. Therefore, the analysis presented in Chapter two is qualified as a ‘rough assessment’ or exploration of environmental causes and consequences of migration in Ghana.
The analysis in Chapter two revealed significant, but weak associations between migration rates, vegetation cover and vegetation trends at the national level. Districts with denser vegetation tended to experience more in-migration and districts with less vegetation cover were more likely to have a migration deficit. However, there were notable exceptions. In the case of migration to the sparsely vegetated national capital Accra, for example, neither environmental push nor environmental pull seemed to play an important role. The analysis further showed that migration from Northern Ghana to the food crop frontier in Central Ghana and migration from old cocoa growing areas to the cocoa frontier in Southwest Ghana have important environmental dimensions. Favourable ecological conditions and low population
210
densities are principal pull factors in these migration systems. Important push factors are land scarcity in migrant source areas in the case of cocoa frontier settlement and poor ecological conditions in the case of migration to the food crop frontier.
In Chapter three, a cross-sectional analysis of out-migration and natural resources in twenty-four districts in Northern Ghana showed that districts with more environmental scarcity experience more out-migration. This is an indication that environmental push plays an important role in generating migration from Northern Ghana to Southern Ghana. However, a longitudinal analysis showed that migration rates declined in a period of severe ecological stress (in the late 1970s and early 1980s). In this episode in the history of North-South migration in Ghana, political turmoil and economic crisis in the destination area suppressed migration propensi-ties despite increased environmental scarcity at home. This confirms the – admittedly predictable – notion of multi-causality in migration studies. Even if environmental factors are principal drivers of migration, they never act alone, and the relative weight of each driving force changes over time.
Interviews with about two hundred Dagara migrants confirmed that environ-mental push is an important driver of migration from the Upper West to the Brong Ahafo Region. The interviews also showed the importance of environmental pull as a cause of migration. Migrants from the North are primarily attracted to the Brong Ahafo Region because of its easy access to fertile land and its bi-modal rainfall pattern. It is hardly surprising that environmental motives play an important role in Dagara settlers’ decision to migrate: most of these migrants are farmers who relocated in search of better agro-ecological conditions. For the environmental refugee debate it is more relevant to assess the degree of force experienced by migrants.
In almost all population flows the decision to migrate can be placed on a contin-uum between completely voluntary and ‘forced with no choice’. The degree of force in Dagara migration to the Brong Ahafo Region was studied by looking at the level of urgency expressed in the migration reasons and by distinguishing push and pull factors and sudden-onset and slow-onset environmental disruptions. A clear dominance of migration push factors would be an indication of a higher degree of force. A clear dominance of migration pull factors would indicate that migration is more opportunity-driven. In the case of sudden-onset environmental disruption, the degree of force tends to be higher than in the case of slow onset environmental disruptions, which leave more room for adaptation. The findings suggest that the degree of force in Dagara migration to the Brong Ahafo Region is limited. The decision to relocate is primarily a response to structural differences in agro-ecological conditions and relatively few mobility constraints. Sudden-onset environmental triggers were not mentioned as migration reasons at all and
211
respondents did not allude to widespread environmental degradation as a cause of migration. About one out of four respondents did express a substantial degree of urgency and force in their migration reasons. Within this group many indicated that they migrated because they were not able to harvest enough from their fields to feed their households. However, the overall picture is that Dagara migration to the Brong Ahafo Region is not a ‘last resort’ or distress migration in the face of environmental disaster. Rather, migration is part of a larger livelihood strategy in which rural families try to adapt to a resource-poor and risk-prone environment. In the idiom of the environmental refugee debate, Dagara migration to the Brong Ahafo Region could be labelled an ex-ante or pro-active strategy to avoid distress migration in the future. Migration is part of a larger strategy to spread risks, to reduce pressure on farmland at home and to benefit from better agricultural opportunities in an area that is known to them because of earlier experiences as seasonal migrants or because relatives and friends settled there before them.
The Dagara from Northwest Ghana are a typical example of a predominantly agricultural populace whose livelihood viability is closely related to the availability of and access to natural resources. Even in the absence of sudden-onset environ-mental disaster or widespread environmental degradation, their livelihoods are under pressure. Unequal regional development, progressive integration in the national economy, lack of viable non-farm income generating opportunities and increased cash needs are just a few factors that trigger migration from an area in which, for many, the natural resource base – without adequate institutional support – falls short of a minimum level to meet basic needs and escape poverty. Like the Dagara there are hundreds of millions on the African continent and beyond. The question whether or not people who migrate in response to such conditions should be labelled ‘environmental refugees’ may divert attention away from the pertinent question how conditions can be created that enable people in marginal areas to build a sustainable rural livelihood.
The population-environment debate
The population-environment debate deals with the question how population growth, changes in population composition and other demographic and socio-economic characteristics affect natural resources management and environmental quality. Within the broad debate about population-environment linkages, three issues are of particular relevance for the present study: first, the environmental impact of in-migration in destination areas; second, the environmental impact of out-migration in migrants’ source areas; and third, the Malthus-Boserup debate about population growth and land use sustainability.
212
The environmental impact of in-migration
The environmental impact of migration in destination areas has received consider-able attention from scientists in the past decades. Within this field, two bodies of literature can be distinguished, one focusing on the impact of in-migration on so-called ‘green agenda’ environmental problems and the other dealing with ‘brown agenda’ environmental problems. The first body of literature primarily looks at the role of migrant farmers in the causal structure of deforestation and other types of environmental degradation in agricultural frontiers, mostly in tropical areas. The second body of literature looks at the impact of rural-urban migration on environ-mental health issues (e.g. solid waste management, access to clean water and air pollution) in towns and cities, usually in low income countries.
The environmental impact of Dagara migration varies according to migrants’ occupation and type of destination area. The focus in this study has been on rural-rural migration, so ‘brown agenda’ environmental problems, which are common in Ghanaian towns and cities, were beyond the scope of this research. After several decades of predominantly urbanward labour migration, Dagara migrants now increasingly settle in rural areas in Ghana’s food crop frontier. This shift in the Dagara mobility pattern could intensify the impact of migration on ‘green agenda’ environmental problems, such as deforestation and land degradation. Indeed, some earlier studies blame migrant farmers from Northern Ghana, including the Dagara, to cause environmental degradation in the forest-savannah transition zone. Their farming methods are deemed unsustainable and they are accused of seeking quick gains by mining the soil. Moreover, a major settlement area of Dagara migrants has experienced a severe loss of green cover according to LANDSAT images published by the United Nations Environment Program. The analysis presented in Chapter four challenges the ‘easy conclusion’ that environmental degradation is caused disproportionately by Dagara migrants. It is shown that UNEP’s degradation narrative has severe defects and that most deforestation seems to have taken place before the area became a major destination area of Dagara migrants. Finally a comparison of settlers’ and native farmers’ land use practices reveals considerable differences, but provides no evidence that migrants have more detrimental farming methods. Dagara settlers plant less trees (because of insecure land tenure and because they are usually not allowed to) and they have larger farms (because they have to share part of their harvest with the land owners), but they have imported a number of soil fertility management practices from the more fragile interior savanna zone. Moreover, Dagara settlers cut fewer trees because native land owners tend not to give out virgin lands to settler farmers. Native farmers in the Brong Ahafo Region make more use of capital-intensive inputs, such as tractors and chemical fertilisers, which are associated with more permanent land cover change.
213
The case of Dagara farmers in the Brong Ahafo Region points to the danger that migrants can easily become scapegoats of environmental degradation, a phenome-non which was already identified by Hugo (1996) over a decade ago. Several studies by Southern Ghanaian academics identify migrants from Northern Ghana as major perpetrators in deforestation and soil degradation processes. Interviews with native farmers and informal conversations during fieldwork in the Brong Ahafo Region indicate that the findings from these earlier case studies are not broadly shared. However, when local politicians looking for a power base decide to play the environmental card, this can easily lead to marginalization of migrants, conflict and violence, as has happened in other parts of the continent.
The environmental impact of out-migration
The environmental impact of out-migration in migrants’ source areas has received very little attention in academia so far. In this dissertation no separate chapter has been dedicated to this topic, but several chapters contain information that shed light on the impact of out-migration on availability, trends and management of natural resources. The theoretical framework and research design used to assess the environmental impact of out-migration in Northwest Ghana borrows insights from adjacent fields, such as the migration and development debate and the broader population-environment debate. Theoretically, two types of impact can be distinguished. First, out-migration can have an environmental impact through its effect on population size. When population growth is associated with environmental degradation, the effect of out-migration is likely to be positive. Second, the impact can be mediated by the effect of out-migration on population composition, livelihood choices, productive technologies, living standards and consumption patterns. In this research, the environmental impact of out-migration was studied at two levels. For Northern Ghana, population census data from twenty-four districts were related to a remotely sensed vegetation index. This more ‘distant’ analysis looked at environmental outcomes rather than mechanisms. In a local case study of Nandom in Northwest Ghana, household questionnaire data about migration propensities and environmental management was analysed.
Between 1982 and 2006 a significant positive trend in vegetation cover is discernible throughout Northern Ghana. Over this period, the Normalized Difference Vegetation Index (NDVI) for Northern Ghana as a whole has increased with 12.1 percent. The vegetation trend for Southern Ghana is much less positive and uniform. The time series of remotely sensed vegetation data only starts in the early 1980s so it is difficult to judge what exactly the long-term trend looks like. The ‘greening of Northern Ghana’ probably results to a large extent from ecosystem recovery after the great Sahelian droughts of the 1970s and early 1980s, but human factors may also play an important role. Within Northern Ghana densely populated areas tend to
214
have less green cover than sparsely populated areas, but the vegetation trend was most positive in densely populated areas. This could be an indication that population growth beyond a certain threshold is not only associated with increasing crop yields (as shown in Chapter six, see also below), but also with environmental recovery. A strong positive association was also found between out-migration and vegetation cover. Districts that experienced more out-migration had significantly more positive trends in vegetation cover. This would rather sustain the notion that out-migration has a positive effect on the environment simply by reducing population pressure on natural resources as formulated in the problem statement of the wider research programme of which this PhD project was part (see Chapter one).
A more thorough spatial analysis of a wider array of potential drivers – both natural and human – of vegetation change in Northern Ghana is needed to adequately assess the interplay of different factors that have contributed to the greening of Northern Ghana over the past quarter century. This could yield insightful information about the relative importance of out-migration as a driver of environmental recovery, and more importantly, it could reveal under which
circumstances out-migration has a positive effect on green cover. Such an analysis would need close collaboration between social scientists, ecologists and remote sensing specialists. Within a few years, when the results of the next population census are published, and when the NDVI database is updated, more cogent statements can probably be made about the importance of human vis-à-vis natural causes.
Besides its effect on population size, out-migration can also influence green cover and other measures of environmental quality through migration-induced changes in livelihood systems and environmental management. Examples of negative effects would be loss of labour needed for environmentally sustainable farm practices and investment of remittances in unsustainable farm practices. Positive effects of migration on environmental management could be investment of remittances in sustainable farm practices. Also, migrants may acquire knowledge and skills about improved management that they could apply upon return. The household data on migration propensities and land use (Chapter seven) provide no clear evidence for such effects – positive or negative – in the Nandom Area. Moreover, in the analysis of migration perceptions, presented in Chapter five, a wide variety of migration consequences was recorded, but none of the two hundred respondents mentioned an impact of migration on environmental management.
Within the broader field of migration-environment studies, the analysis of environmental consequences of out-migration in migrant source areas remains virgin ground. An important insight from the present research is that this complex issue needs to be studied at different levels of scale. In the initial research design, the analysis consisted solely of a local case study based on household data. This
215
analysis showed that – even in an area with massive out-migration – migration variables played a very limited role in explaining inter-household differences in environmental management. However, this does not mean that out-migration has no influence on the environment. Expanding the research design with a cross-district analysis of Northern Ghana revealed that the impact of migration on land use and environmental outcomes manifests itself at a higher level of scale. On the one hand, out-migration is positively associated with vegetation trends, presumably because out-migration reduces population pressure on natural resources. On the other hand, it was found that out-migration – again by reducing pressure on natural resources – can make the need for a transition to more sustainable land use look less urgent (see below). In the Nandom Area of Northwest Ghana, the farming system and natural resources management in general would have been very different today in the absence of out-migration and with much higher population densities. High pressure on farmland and other natural resources could have resulted in more food insecurity and environmental crisis as predicted by Malthusian theory, but the situation in more densely populated districts in Northern Ghana suggests that a Boserupian transition to more sustainable land use would have been more likely.
Malthus and Boserup
Lack of fertile land at home is a common reason for Dagara farmers to migrate to the Brong Ahafo Region. In the perception of many Dagara, the double advantage of out-migration is that migrants gain access to more fertile land in the destination area while at the same it reduces the pressure on land at home. Without migration, they believe, there would be more hunger and poverty in the home areas. This perception is rooted in the Malthusian notion of fixed technology and declining crop yields under increased population pressure. An important finding of the present research, however, is that the relation between population density and crop yields in Northern Ghana is non-linear. A U-shaped ‘Malthus-Boserup’ curve between population density and yields is discernible. Crop yields decline with increasing population density up to about one hundred inhabitants per square kilometre. After this population threshold farming systems in Northern Ghana undergo a transition to more intensive land use and higher yields. A cross-district analysis of Northern Ghana revealed that out-migration has the potential to remove the incentives for a transition to more intensive land use. This is most relevant for areas at the bottom of the Malthus-Boserup curve, which have medium to high population density and low crop yields. In such areas, the farming system needs to change in order for the land to sustain the people, but the migration option may seem more attractive, at least in short term, especially if support to farmers by governmental and non-governmental agencies is inadequate, and if market conditions are not conducive. This seems to be the case in the Nandom Area in Northwest Ghana where fieldwork for this research
216
was conducted. The Nandom Area has experienced profound changes in the field of education, healthcare, water provision, electricity, communication technology and non-farm income opportunities, especially in the last two decades, but the way people farm nowadays closely resembles the way their grandparents did. Out-migration has not caused a collapse of local agriculture, nor a boost. Most of all, out-migration has allowed the farming system to ‘stand still’ or at least evolve very little.
Despite large-scale out-migration, population density in the Nandom Area has increased over the past decades, resulting in higher pressure on land. In response to this pressure, households have adapted their livelihoods with piecemeal changes in the local farming system and through livelihood diversification. Farm households in Nandom try to offset poor and declining yields with non-farm income, seasonal migration and remittances. In the past few years some more profound changes in the local farming system are discernible, notably the increased adoption of animal traction, new crop varieties, dry season farming and tree planting. Relatively favourable market conditions and improved support from government agencies and NGOs seem to be driving forces behind these changes.
In the design of this research, it was not primarily aimed to contribute to the Malthus-Boserup debate about population growth and land use sustainability. Rather, the objective was to use insights from this long-standing and rich body of literature to improve our understanding of migration, environment and development linkages in rural areas of developing countries. This was done by highlighting the importance of population density as an intervening variable. In doing so, a U-shaped Malthus-Boserup curve between population density and crop yields was discovered for Northern Ghana. With this finding the study contributes to a growing body of literature that challenges the pessimistic stance of Neo-Malthusianism with regard to population growth, agricultural productivity and resource sustainability. Within Northern Ghana, Malthusian tendencies and Boserupian processes co-exist. Their strength varies geographically according to population density, market conditions and institutional support to farmers. For policy makers in Ghana who aim to improve their interventions in the field of agriculture, markets, credit and infrastruc-ture, it is vital to know where each operation area is situated in the Malthus-Boserup curve towards more intensive land use.
The migration and development debate
The impact of migration on development in migrant source areas has been studied intensively for many decades. Until about twenty to thirty years ago, these studies were heavily coloured by researchers’ position in the wider debate between modernization and dependencia theorists. Presently, pluralist views dominate and
217
much emphasis is placed on the development potential of remittances sent by migrants to their home areas. The present research can be regarded an exponent of the pluralist approach. It picks and chooses from earlier theories and insights – which each have some explanatory power – and a variety of methods and angles were used. The perspective alternates between local perceptions, a questionnaire survey and secondary data at a higher level of scale. Two contributions of this research to the migration and development debate stand out. The first contribution is a methodological one. The perception analysis presented in Chapter five showed that simply asking local people about the consequences of migration in their villages yields a fresh view on the matter with some insights that would not have surfaced using conventional methods. Second, through cross-fertilization with the Malthus-Boserup debate, this study showed the importance of population density as an intervening variable in the migration-development nexus, at least in rural areas in developing countries where the majority of the people engage in farming. After recognizing the intervening role of population density, some of the causality problems which are common in migration-development studies, can be addressed more adequately.
Some of the mixed findings in migration and development research result from the fact that different types of migration and different aspects of development are studied. This study looked at the impact of seasonal, long-term and return migration. With regard to development, the focus has primarily been on agriculture, which is the mainstay of the economy in the research area. An additional reason to concentrate on agricultural development is that farming is at the intersection of economy and environment. The perception analysis in Chapter five produced a much wider range of development outcomes of migration.
The impact of out-migration on development in Nandom and Northern Ghana is analysed in the last three chapters of this dissertation. Chapter five looked at local perceptions of the consequences of seasonal, long-term and return migration in the Nandom Area in Northwest Ghana. This chapter yielded a very holistic view on the multiple impacts of migration in different realms of life and livelihood seen through the eyes of the home community. In Chapter six, the geographic focus was broadened to the whole of Northern Ghana and the thematic focus was narrowed down to the impact of out-migration on agricultural productivity. Borrowing insights from the Malthus-Boserup debate, this chapter identified a blind spot in the migration and development literature, namely the important role of population density as an important intervening variable. The regional analysis also served to better understand the situation in the local case study area. Finally, in Chapter seven, the geographic focus shifted back to the Nandom Area, but the thematic focus remained on agricultural development. In this chapter, household data were used to
218
explore the relation between different migration variables on the one hand and labour-led and capital-led intensification practices on the other.
The findings from Chapter five and seven indicate that the development potential of migration has so far not materialized in the case of Nandom. Remittances from migrant relatives are primarily used for survival purposes and lack the critical mass to really make a difference. Few long-term migrants return with sufficient savings and skills to become agents of change. Seasonal migration is perceived to be the most beneficial migration type because of its contribution to food security. Seasonal migrants work on the household farm in the rainy season while they cater for their own food needs in the dry season. In individual cases, return migrants, seasonal migrants or migrant relatives contribute significantly to livelihoods in the Nandom Area, for example by purchasing a plough, building a house, investing in a trade or financing a relative’s education. However, the aggregate contribution of migration to development seems to be limited. A principal cause of the lack of migration-induced development is poverty, both of migrants and their relatives at home. Only a minority of Dagara migrants attain the kind of increases in income that would enable them to make a substantial contribution to economic development in the Nandom Area. Income differences between Dagara migrants and their relatives at home are much smaller than for example in the case of Ghanaians who migrate to Europe. Moreover, because of the high incidence and depth of poverty in the Nandom Area, few recipients of remittances have the ‘room to manoeuvre’ to invest in long-term improvements of livelihoods. As concluded by Eenhoorn & Becx (2009), the poor in Northern Ghana face so many constraints to improving their economic situation that resolving one or two of these constraints is not sufficient.
The perception analysis in Chapter five showed that many people in Nandom were quite ambivalent about the impact of long-term migration. They lamented the lack of support from migrant relatives, but they also indicated that in the absence of migration, pressure on farm land would have been much higher and this, they expected, would lead to hunger, misery and conflict. In their view, out-migration contributes to food security because it leaves more land to farm for those who stay behind. The findings from Chapter six, which looked at the relation between migration, population density and agricultural productivity in twenty-four districts in Northern Ghana, partly contest this perception. Less out-migration and stronger population growth would more likely have induced a timelier transition to more intensive land use and higher crop yields. On the other hand, the cross-district analysis also showed that given a certain population density, out-migration leads to increased agricultural output per capita through its positive effect on farm sizes. In other words, the effect of out-migration on food security is positive in the short term, but it diverts the attention away from structural changes in farming systems in the long term.
219
Concluding remark
William I. Thomas, the main author of The Polish Peasant in Europe and America, which inspired the title of this dissertation, stated: “if men define situations as real, they are real in their consequences” (Thomas & Thomas 1928: 572). This so-called Thomas theorem seems to be particularly valid in the case of migration and lack of agricultural change in Nandom. Rural families in the Nandom Area primarily see out-migration of some of their members as a necessary response to population pressure and lack of fertile farmland. This long-term livelihood strategy seems to have had a negative side effect, namely that it has obscured the need for more radical changes in local livelihoods. Migration has allowed the Dagara farmer – at home and away – to continue the traditional style of farming, with hard work and low external input.
Appendix
This appendix explains how district out-migration rates were estimated. The last population census of Ghana – held in the year 2000 – inquired about people’s place of birth, using three categories: place of enumeration; elsewhere in the region; and outside the region. In the third category, people had to specify in which region or country they were born. Census reports provide in-migration rates at district level. However, since the census questionnaire does not inquire about birth district (only birth region), no exact out-migration figures exist at district level. The census only reports out-migration rates at regional level. Without district level out-migration rates, the spatial analyses of migration causes and consequences in this research (Chapter two, three and six) would not have been possible. Therefore it was decided to estimate out-migration rates at district level. This appendix explains the procedure followed in the estimation process and sheds light on the differences between the estimation procedures in the different chapters.
The first step was to investigate which demographic variables could best explain known out-migration rates at regional level. Four variables, for which data were available at district level, were found to be closely related to out-migration rates: • Population growth (1970-2000): Districts with more out-migration tend to have
lower population growth rates. The calculation of population growth was based on a comparison of regional population size at the time of the 1970 and 2000 population censuses. Correlation with out-migration: R = -0.881, p < 0.01.
• Elderly population (65+): Districts with more out-migration tend to have a higher proportion of elderly people because young people are more prone to migrate, leaving the old people behind. In addition, many migrants return to their home areas for retirement. Correlation with out-migration: R = 0.808, p < 0.01.
• Sex ratio of the population aged 15-64: In districts with more out-migration, sex ratios (men per hundred women) of the population aged 15 to 64 tend to be lower because men in this age group are more mobile than women. Correlation with out-migration: R = -0.893, p < 0.01.
• Urbanization rate. Districts with more out-migration tend to be less urban. Despite the existence of substantial rural-rural migration flows in Ghana, migrant sending areas are more likely to be rural while migrant receiving areas are more likely to be urban. Correlation with out-migration: R = -0.645, p < 0.05. This variable was only used in Chapter two.
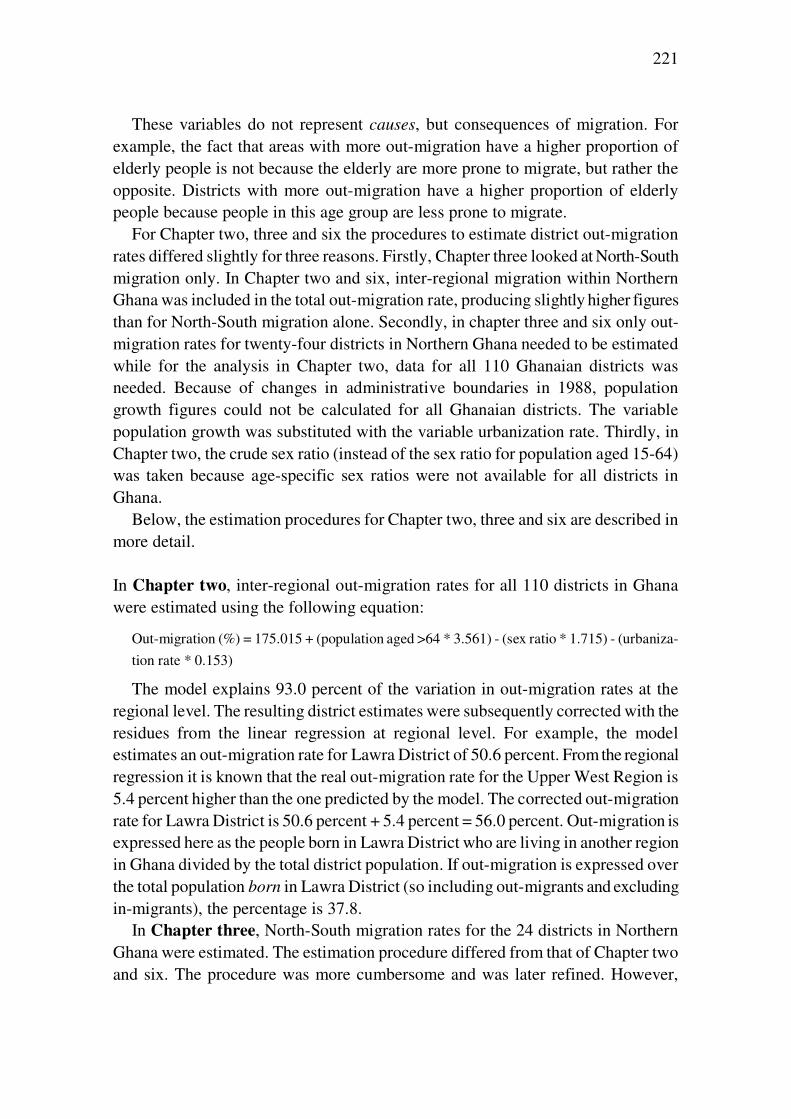
221
These variables do not represent causes, but consequences of migration. For example, the fact that areas with more out-migration have a higher proportion of elderly people is not because the elderly are more prone to migrate, but rather the opposite. Districts with more out-migration have a higher proportion of elderly people because people in this age group are less prone to migrate.
For Chapter two, three and six the procedures to estimate district out-migration rates differed slightly for three reasons. Firstly, Chapter three looked at North-South migration only. In Chapter two and six, inter-regional migration within Northern Ghana was included in the total out-migration rate, producing slightly higher figures than for North-South migration alone. Secondly, in chapter three and six only out-migration rates for twenty-four districts in Northern Ghana needed to be estimated while for the analysis in Chapter two, data for all 110 Ghanaian districts was needed. Because of changes in administrative boundaries in 1988, population growth figures could not be calculated for all Ghanaian districts. The variable population growth was substituted with the variable urbanization rate. Thirdly, in Chapter two, the crude sex ratio (instead of the sex ratio for population aged 15-64) was taken because age-specific sex ratios were not available for all districts in Ghana.
Below, the estimation procedures for Chapter two, three and six are described in more detail. In Chapter two, inter-regional out-migration rates for all 110 districts in Ghana were estimated using the following equation:
Out-migration (%) = 175.015 + (population aged >64 * 3.561) - (sex ratio * 1.715) - (urbaniza-
tion rate * 0.153)
The model explains 93.0 percent of the variation in out-migration rates at the regional level. The resulting district estimates were subsequently corrected with the residues from the linear regression at regional level. For example, the model estimates an out-migration rate for Lawra District of 50.6 percent. From the regional regression it is known that the real out-migration rate for the Upper West Region is 5.4 percent higher than the one predicted by the model. The corrected out-migration rate for Lawra District is 50.6 percent + 5.4 percent = 56.0 percent. Out-migration is expressed here as the people born in Lawra District who are living in another region in Ghana divided by the total district population. If out-migration is expressed over the total population born in Lawra District (so including out-migrants and excluding in-migrants), the percentage is 37.8.
In Chapter three, North-South migration rates for the 24 districts in Northern Ghana were estimated. The estimation procedure differed from that of Chapter two and six. The procedure was more cumbersome and was later refined. However,
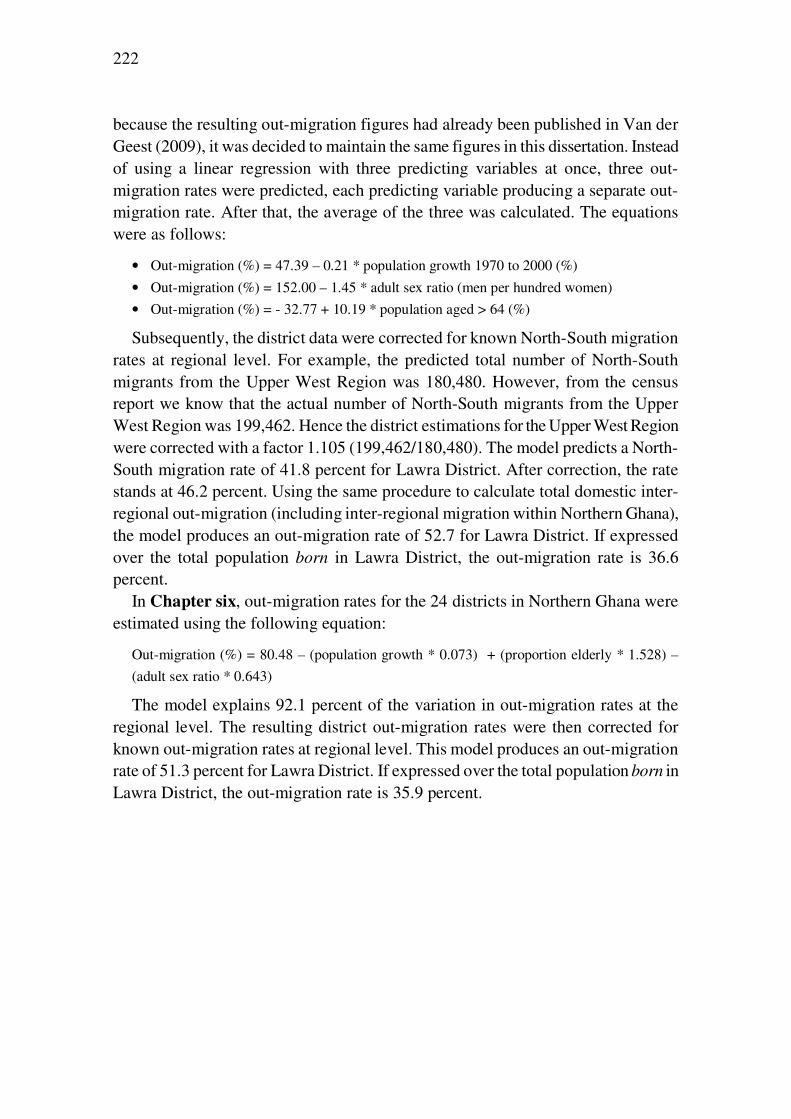
222
because the resulting out-migration figures had already been published in Van der Geest (2009), it was decided to maintain the same figures in this dissertation. Instead of using a linear regression with three predicting variables at once, three out-migration rates were predicted, each predicting variable producing a separate out-migration rate. After that, the average of the three was calculated. The equations were as follows:
• Out-migration (%) = 47.39 – 0.21 * population growth 1970 to 2000 (%)
• Out-migration (%) = 152.00 – 1.45 * adult sex ratio (men per hundred women)
• Out-migration (%) = - 32.77 + 10.19 * population aged > 64 (%)
Subsequently, the district data were corrected for known North-South migration rates at regional level. For example, the predicted total number of North-South migrants from the Upper West Region was 180,480. However, from the census report we know that the actual number of North-South migrants from the Upper West Region was 199,462. Hence the district estimations for the Upper West Region were corrected with a factor 1.105 (199,462/180,480). The model predicts a North-South migration rate of 41.8 percent for Lawra District. After correction, the rate stands at 46.2 percent. Using the same procedure to calculate total domestic inter-regional out-migration (including inter-regional migration within Northern Ghana), the model produces an out-migration rate of 52.7 for Lawra District. If expressed over the total population born in Lawra District, the out-migration rate is 36.6 percent.
In Chapter six, out-migration rates for the 24 districts in Northern Ghana were estimated using the following equation:
Out-migration (%) = 80.48 – (population growth * 0.073) + (proportion elderly * 1.528) –
(adult sex ratio * 0.643)
The model explains 92.1 percent of the variation in out-migration rates at the regional level. The resulting district out-migration rates were then corrected for known out-migration rates at regional level. This model produces an out-migration rate of 51.3 percent for Lawra District. If expressed over the total population born in Lawra District, the out-migration rate is 35.9 percent.
223
References
ABDULAI, A. (1996), Internal migration and agricultural development in Ghana. Scandinavian Journal of
Development Alternatives and Area Studies 15 (3-4): 61-74. ABDUL-KORAH, G.B. (2004), Migration, ethnicity and uneven development in Ghana: the case of the
Upper West Region in the twentieth century. PhD thesis, University of Minnesota. ABDUL-KORAH, G.B. (2006), Where is not home? Dagaaba migrants in the Brong Ahafo Region, 1980 to
present. African Affairs 106 (422): 71-94. ABDUL-KORAH, G.B. (2008), “Ka Biɛ Ba Yor”: Labor Migration among the Dagaaba of the Upper West
Region of Ghana, 1936– 1957. Nordic Journal of African Studies 17 (1): 1-19. ADAMS, W.M. (1990), Green development: Environment and sustainability in the third world. London
and New York: Routledge. ADAMS, R.H., A. CUECUECHA & J. PAGE (2008). The impact of remittances on poverty and inequality in
Ghana. Washington D.C: World Bank, Policy Research Working Paper 4732. ADDO, N.O. & A.E. KWEGYIR (1990), Short-term circular migration in the context of socio-economic
development in rural Ghana: The case of rice farmers in some selected rural communities in the
North-Eastern Volta Region. Geneva: International Labour Office, ILO Working paper 173. ADEPOJU, A. (1995), Migration in Africa: An overview. In: J. Baker & T.A. Aina, eds, The migration
experience in Africa, pp. 97-108. Uppsala: Nordiska Afrikainstitutet. ADGER, W.N., T. A. BENJAMINSEN, K. BROWN & H. SVARSTAD (2001). Advancing a political ecology of
global environmental discourses. Development and Change 32: 681-715. ADJEI-NSIAH, S. (2006), Cropping systems, land tenure and social diversity in Wenchi, Ghana:
Implications for soil fertility management. PhD thesis, Agricultural University of Wageningen. ADJEI-NSIAH, S., C. LEEUWIS, K.E. GILLER, O. SAKYI-DAWSON, J. COBBINA, T.W. KUYPER, M. ABEKOE
& W. VAN DER WERF (2004), Land tenure and differential soil fertility management practices among native and migrant farmers in Wenchi, Ghana: Implications for interdisciplinary action research. NJAS
52 (3-4): 331-348. ADOLPH, B., Y. ALHASSAN, S. BISANDA, J. KWARI, G. MEKONNEN, H. WARBURTON & C. WILLIAMS
(1993), Coping with uncertainty: Challenges for agricultural development in the Guinea Savanna
Zone of the Upper West Region, Ghana. Wageningen: International Centre for Development Oriented Research in Agriculture (ICRA).
AFIKORAH-DANQUAH, S. (1997), Local resource management in the forest-savanna transition zone: The case of Wenchi district, Ghana. IDS Bulletin 28 (4): 36-46.
ALO, C.A. & R.G. PONTIUS (2008), Identifying systematic land-cover transitions using remote sensing and GIS: the fate of forests inside and outside protected areas of Southwestern Ghana. Environment
and Planning B-Planning & Design 35 (2): 280-295. AMANOR, K.S. & O. PABI (2007), Space, time, rhetoric and agricultural change in the transition zone of
Ghana. Human Ecology 35: 51-67. AMANOR, I.S. (1993), Wenchi Farmer Training Project: Social/environmental baseline study. Accra:
unpublished report to Overseas Development Administration. AMIN, S. (1974), Introduction. In: S. Amin, ed., Modern Migrations in Western Africa, pp. 65-124.
Oxford: University Press. APPLEYARD, R. (1989), Migration and development: myths and reality. International Migration Review
23 (3): 486-499. ARYEETEY E. & K. FOSU (2004), Economic growth in Ghana: 1960-2000. Paper presented at the
International Conference on Ghana at the half of the century, Accra, July 18-20, 2004. ASIEDU, A. (2005), Some benefits of migrants' return visits to Ghana. Population, Space and Place 11: 1-
11. AWANYO, L. (1998), Culture, markets, and agricultural production: A comparative study of the
investment patterns of migrant and citizen cocoa farmers in the Western Region of Ghana. Profes-
sional Geographer 50 (4): 516-530.
224
BARHAM, B. & S. BOUCHER (1998), Migration, remittances, and inequality: Estimating the net effects of migration on income distribution in Bluefields, Nicaragua. Journal of Development Economics 55 (2): 307-331.
BATES, D.C. (2002), Environmental refugees? Classifying human migrations caused by environmental change. Population and Environment 23 (5): 465-77.
BATTERBURY, S.P.J. & A.J. BEBBINGTON (1999), Environmental histories, access to resources and landscape change: An introduction. Land Degradation & Development 10: 279-289.
BERRY, A. (2008), Growth, employment and distribution impacts of minerals dependency: four case studies. South African Journal of Economics 76 (S2): S148-S147.
BILSBORROW, R.E. (1984), Sample design. In: R.E. Bilsborrow, A.S. Oberai & G. Standing, eds, Migration surveys in low income countries: Guidelines for survey and questionnaire design, pp. 88-129. London & Sydney: Croom Helm Ltd.
BILSBORROW, R.E. (1987), Population Pressures and Agricultural Development in Developing Countries: A Conceptual Framework and Recent Evidence. World Development 15 (2): 183-203.
BILSBORROW, R.E. (1992), Population growth, internal migration, and environmental degradation in rural areas of developing countries. European Journal of Population 8: 125-148.
BLACK, R. (1993), Migration, return, and agricultural development in the Serra do Alvão, Northern Portugal. Economic Development and Cultural Change 41 (3): 563-586.
BLACK, R. (2001), Environmental refugees: Myth or reality? Vienna: UNHCR, New Issues in Refugee Research, Working Paper 34.
BLACK, R. & A. CASTALDO (2009), Return migration and entrepreneurship in Ghana and Côte d’Ivoire: the role of capital transfers. Tijdschrift voor Economische en Sociale Geografie 100 (1): 44-58.
BLAIKIE, P. (1994), Population change and environmental management: Coping and adaptation at the domestic level. In: B. Zaba & J. Clarke, eds, Environment and Population Change, pp. 63-86. Liège: Ording.
BLAIKIE, P. (1998), Paradigms for environment and development. In: L. de Haan and P. Blaikie, eds, Looking at Maps in the Dark. Directions for Geographical Research in Land Management and
Sustainable Development in Rural and Urban Environments of the Third World, pp. 9-40. Netherlands Geographical Studies 240. Utrecht / Amsterdam: KNAG / AGIDS.
BLAIKIE, P. & H. BROOKFIELD (1987), Land degradation and society. London and New York: Routledge. BOATENG, E.A. (1966), A geography of Ghana. Cambridge: University Press. BOSERUP, E. 1965. The conditions of agricultural growth: the economics of agrarian change under
population pressure. London: Allen & Unwin. BRAIMOH, A.K. (2004), Seasonal migration and land-use in Ghana. Land Degradation & Development
15: 37-47. BRETTELL, C. (2000), Theorizing migration in anthropology: The social construction of networks,
identities, communities and globalscapes. In: C. Brettell & J.F. Hollifield, eds, Migration theory:
talking across disciplines, pp. 97-136. New York and London: Routledge. BROEKHUIS, A., M. DE BRUIN & A. DE JONG (2004), Urban-rural linkages and climatic variability. In: A.J.
Dietz, R. Ruben & A. Verhagen, eds, The impact of climate change on drylands: with a focus on West
Africa, pp 301-321. Dordrecht: Kluwer. BROWN, O. (2008), The numbers game. Forced Migration Review 31: 8-9. BRYDON, L. (1992), Ghanaian women in the migration process. In: S. Chant, ed., Gender and Migration
in Developing Countries, pp. 91-108. London and New York: Belhaven Press. BURGER, K. & F. ZAAL (2009), Preface. In: K. Burger & F. Zaal, eds, Explaining a miracle: transitions to
sustainable land management in the tropics, pp. xiii-xvi. Aldershot: Ashgate. BURGER, K. (2001), Rural migration and the environment in West Africa. Research proposal submitted to
the Dutch Council for Scientific Research (NWO). Amsterdam: Tinbergen Institute / AIID. CARDINALL, A.W. (1931), The Gold Coast. Accra: Government Printer. CARNEY, D. (1998), Implementing the sustainable rural livelihoods approach. In: D. Carney, ed.,
Sustainable rural livelihoods: What contribution can we make? pp. 3-23. London: DFID. CARR, E.R. (2005), Placing the environment in migration: Environment, economy, and power in Ghana's
central region. Environment and Planning A, 37: 925-426. CASTLES, S. (2002), Environmental change and forced migration: Making sense of the debate. Vienna:
UNHCR, New Issues in Refugee Research, Working Paper 70. CENSUS OFFICE, GOLD COAST (1932), Appendices containing comparative returns and general statistics
of the 1931 Census. Accra: Census Office.
225
CENSUS OFFICE, GOLD COAST (1950), The Gold Coast: census of population 1948: Report and tables. London: The Crown Agents for the Colonies.
CENSUS OFFICE (1962), 1960 population census of Ghana. Advance report, volumes III and IV. Accra: Census Office.
CENSUS OFFICE (1964), 1960 population census of Ghana, volume III: Demographic characteristics. Accra: Census Office.
CENSUS OFFICE (1973), 1970 population census of Ghana, volume III: Detailed demographic
characteristics. Accra: Census Office. CENTRAL BUREAU OF STATISTICS (1984), Preliminary Report of the 1984 Population Census of Ghana.
Accra: Central Bureau of Statistics. CERASE, F.P. (1974), Expectations and reality: A case study of return migration from the United States to
Southern Italy. International Migration Review 8 (2): 245-263. CHEN J., P. JÖNSSON, M. TAMURA, Z. GU, B. MATSUSHITA & L. EKLUNDH (2004), A simple method for
reconstructing a high-quality NDVI time-series data set based on the Savitzky-Golay filter. Remote
Sensing of Environment 91 (3-4): 332–344. CHUCKS, J. (2002), Ghana’s reproductive revolution: Analysis of the determinants of fertility transition.
African Population Studies 17 (1): 47-67. CLEVELAND, D.A. (1991), Migration in West Africa: A savanna village perspective. Africa 61 (2): 222-
246. CODJOE, S.N.A. (2006), Migrant versus indigenous farmers: An analysis of factors affecting agricultural
land use in the transitional agro-ecological zone of Ghana, 1984-2000. Geografisk Tidsskrift-Danish
Journal of Geography 106 (1): 103-113. CORDELL, D.D., J.W. GREGORY & V. PICHÉ (1996), Hoe and wage: A social history of a circular
migration system in West Africa. Boulder: Westview Press. COUR, J.M. (2001), The Sahel in West Africa: countries in transition to a full market economy. Global
Environmental Change 11: 31-47. CROOK, R. (2001), Cocoa booms, the legalisation of land relations and politics in Cote d'Ivoire and
Ghana: Explaining farmers’ responses. IDS Bulletin 32 (1): 35-45. DAVID, R. 1995, Changing places: Women, resource management and migration in the Sahel: Case
studies from Senegal, Burkina Faso, Mali and Sudan. London: SOS Sahel. DAVIES, S. (1996), Adaptable livelihoods: Coping with food insecurity in the Malian Sahel. London:
MacMillan Press. DE BRUIJN, M. & H. VAN DIJK (2004), The importance of socio-cultural differences and pathway analysis
for understanding local actors’ responses. In: A.J. Dietz, R. Ruben & A. Verhagen, eds, The impact of
climate change on drylands: with a focus on West Africa, pp 341-362. Dordrecht: Kluwer. DE GROOT, W. & A. ZUIDERWIJK (2009), Agricultural intensification in the Koza Plain drylands,
Cameroon: Ongoing trends and possible futures. In: K. Burger & F. Zaal, eds, Explaining a miracle;
transitions to sustainable land management in the tropics, pp. 125-140. Aldershot: Ashgate. DE HAAN, A. (1999), Livelihoods and poverty: The role of migration – a critical review of the migration
literature. The Journal of Development Studies 36 (2): 1-47. DE HAAN, A., K. BROCK, G. CARSWELL, N. COULIBALY, H. SEBA & K.A. TOUFIQUE (2000), Migration
and livelihoods: Case studies in Bangladesh, Ethiopia and Mali. Brighton: Institute of Development Studies, IDS Research Report 46.
DE HAAN, L. (2000), The question of development and environment in geography in the era of globalisation. GeoJournal 50: 359-367.
DE HAAS, H. (2001), Migration, development and agricultural change in the South-Moroccan Todgha Valley. The Arab World Geographer 4 (4): 302-320.
DE HAAS, H. (2003), Migration and development in Southern Morocco: The disparate socio-economic
impacts of out-migration on the Todgha Oasis Valley. PhD thesis, Radboud University Nijmegen. DE HAAS, H. (2005), International migration, remittances and development: myths and facts. Geneva:
Global Commission on International Migration, Global Migration Perspectives 30. DE HAAS, H. (2006), Migration, remittances and regional development in Southern Morocco. Geoforum
37 (4): 565-580. DE HAAS, H. (2009), Mobility and human development. New York: UNDP, Human Development
Research Paper 2009/01. DE HAAS, H. (2010), Migration and development: a theoretical perspective. International Migration
Review 44 (1): 227-264. DER, B.G. (1979), Agricultural policy in Northern Ghana during the colonial era. Universitas 8: 3-16.
226
DER, B.G. (1998), The slave trade in Northern Ghana. Accra: Woeling Publishing Services. DESSEIN, J. (2002), Het stremmen en stromen van de markt: Een antropologische analyse van markten en
landbouw bij de Birifor en de Wala van Noordwest-Ghana. PhD thesis, Catholic University Leuven. DIETZ, T. (1996), Entitlements to natural resources: Contours of political environmental geography.
Utrecht: International Books. DIETZ, T., R. RUBEN & A. VERHAGEN, eds, (2004), The impact of climate change on drylands with a focus
on West Africa. Dordrecht: Kluwer. DIETZ, T., J.-W. GUNNING, A.K. BOS & A. ZUIDERWIJK (2009). Optimistic Determinism or Explaining a
Miracle. In: K. Burger & F. Zaal, eds, Explaining a miracle; transitions to sustainable land manage-
ment in the tropics, pp. 1-20. Aldershot: Ashgate. DRYZEK, J.S. (2005), The politics of the Earth: Environmental discourses. New York: Oxford University
Press. DUN, O. & F. GEMENNE (2008), Defining environmental migration. Forced Migration Review 31: 10-11. EADES, J.S. (1993), Strangers and traders: Yoruba migrants, markets and the state in Northern Ghana.
Edinburgh: University Press. EENHOORN, H. & G. BECX (2009), Constrain constraints! A study into real and perceived constraints and
opportunities for the development of smallholder farmers in Sub-Sahara Africa. Public lecture spoken at the University of Wageningen, 17 February 2009.
EHRLICH, P.R. & A.H. EHRLICH (1990), The population explosion. New York: Simon & Schuster. ENGMAN, E.V.T. (1983), Population of Ghana, 1850-1960. Accra: Census Office. FAIRHEAD, J. & M. LEACH (1996), Rethinking the forest-savanna mosaic: Colonial science & its relics in
west africa. In: M. Leach & R. Mearns, eds, The lie of the land: Challenging received wisdom on the
African environment, pp. 105-121. London: The International African Institute. FAIRHEAD, J. & M. LEACH (1998), Reframing deforestation: Global analyses and local realities: Studies
in West Africa. London: Routledge. FAIST, T. (2000), The volume and dynamics of international migration and transnational social spaces.
Oxford: University Press. FAO (2010), Nutritive factors, FAO website consulted on June 23, 2010,
http://www.fao.org/economic/ess/publications-studies/publications/nutritive-factors/en/ FAOSTAT (2010), Time-series and cross sectional data relating to food and agriculture for some 200
countries, website consulted on April 27, 2010, http://faostat.fao.org/ FAWCETT, J.T. (1989), Networks, linkages, and migration systems. International Migration Review 23
(3): 671-80. GHANA STATISTICAL SERVICE (1995), Migration research study. Vol 1: Internal migration. Accra: Ghana
Statistical Service. GHANA STATISTICAL SERVICE (2000), Poverty trends in Ghana in the 1990s. Accra: Ghana Statistical
Service. GHANA STATISTICAL SERVICE (2002), 2000 Population & housing census: Summary report of final
results. Accra: Ghana Statistical Service. GHANA STATISTICAL SERVICE (2004), Demographic and health survey 2003. Accra: Ghana Statistical
Service. GHANA STATISTICAL SERVICE (2005a), 2000 Population & housing census. Population data analysis
reports. Vol 1: Socioeconomic and demographic trends analysis. Accra: Ghana Statistical Service. GHANA STATISTICAL SERVICE (2005b), 2000 Population & housing census. Analysis of district data and
implications for planning. Accra: Ghana Statistical Service. GHANA STATISTICAL SERVICE (2005c), 2000 Population & housing census. Gazetteer - Upper West
Region. Alphabetical listing of localities by district. Accra: Ghana Statistical Service. GHANA STATISTICAL SERVICE (2007), Patterns and trends of poverty in Ghana, 1991-2006. Accra: Ghana
Statistical Service. GHANA STATISTICAL SERVICE (2008), Ghana living standards survey: Report of the fifth round (GLSS 5).
Accra: Ghana Statistical Service. GOCKOWSKI, J. (2007), Cocoa production strategies and the conservation of globally significant rainforest
remnants in Ghana. Paper presented at the International Institute of Tropical Agriculture, Accra, November 19, 2007.
GOODY, J. (1967), The social organisation of the LoWiili (second edition). Oxford: University Press. GRAY, C.L. (2009), Environment, land, and rural out-migration in the Southern Ecuadorian Andes. World
Development 37 (2), 457-468.
227
GYASI, E.A. & J.S. AYIVOR (1992), Rural-rural migration in Ghana: The case of Lipke seasonal migrant rice farmers, Malaysian Journal of Tropical Geography 23 (1): 13-21.
HART, K. (1982), The political economy of West African agriculture. Cambridge: University Press. HARTEVELD, W. (2004), Rural-to-rural migration and female livelihoods: the case of Dagara women in
Ghana, MA thesis, Free University Amsterdam. HAWKINS, S. (1997), To pray or not to pray: Politics, medicine, and conversion among the LoDagaa of
Northern Ghana, 1929-1939. Canadian Journal of African Studies 31 (1): 50-85. HENRY, S., V. PICHÉ, D. OUÉDRAOGO, & E.F. LAMBIN (2004), Descriptive analysis of the individual
migratory pathways according to environmental typologies. Population and Environment 25 (5): 397-422.
HERRMANN, S.M., A. ANYAMBA & C.J. TUCKER (2005), Recent trends in vegetation dynamics in the African Sahel and their relationship to climate. Global Environmental Change 15 (4): 394-404.
HILL, P. (1961), The migrant cocoa farmers of Southern Ghana. Africa 31 (3): 209-230. HILTON, T.E. (1960), Ghana population atlas: The distribution and density of population in the Gold
Coast and Togoland under United Kingdom trusteeship. Edinburgh: Thomas Nelson and Sons Ltd. HOLDEN, J.J. (1965), The Zabarima conquest of North-West Ghana, Part 1. Transactions of the Historical
Society of Ghana 8: 60-86. HOMER-DIXON, T.F. (1999), Environment, scarcity and violence. Princeton: University Press. HUGO, G. (1996), Environmental concerns and international migration. International Migration Review
30 (1): 105-31. HUGO, G. (2008), Migration, development and environment. Paper presented at the Migration and the
environment conference Munich, April 16-18, 2008. INTERNATIONAL PANEL ON CLIMATE CHANGE (2007), Climate change 2007: The physical science basis.
Geneva: IPCC. JÄGER, J., J. FRÜHMANN & S. GRÜNBERGER (2009), Environmental change and forced migration
scenarios: Synthesis of results. Bonn and Vienna: EACH-FOR. KABKI, M. (2007), Transnationalism, local development and social security: The functioning of support
networks in rural Ghana. PhD thesis, Free University of Amsterdam. KEARNEY, M. (1986), From the invisible hand to visible feet: Anthropological studies of migration and
development. Annual Review of Anthropology 15: 331-361. KELLY, B. & R. BENING (2007), Ideology, regionalism, self-interest and tradition: an investigation into
contemporary politics in northern Ghana. Africa 77 (2): 180-206. KING, R. (1986), Return migration and regional economic development: an overview. In: R. King, ed.,
Return Migration and Regional Economic Problems, pp. 1-37. London: Croom Helm. KING, R. (1996), Migration in a world historical perspective. In: J. Van den Broeck, ed., The economics of
labour migration, pp. 7-75. Cheltenham: Edward Elgan. LADOUCEUR, P.A. (1979), Chiefs and politicians: The politics of regionalism in Northern Ghana. London
and New York: Longman Group Limited. LAMBIN, E.F., ET AL. (2001), The causes of land-use and land-cover change: Moving beyond the myths.
Global Environmental Change 11: 261-269. LAVEN, A. (2010), The risk of inclusion: Shifts in governance processes and upgrading opportunities for
cocoa farmers in Ghana. PhD thesis, University of Amsterdam. LEACH, M. & J. FAIRHEAD (2000), Challenging neo-malthusian deforestation analyses in West Africa's
dynamic forest landscapes. Population and Development Review 26 (1): 17-43. LEITER, J. & S. HARDING (2004), Review: Trinidad, Brazil, and Ghana: three melting moments in the
history of cocoa. Journal of Rural Studies 20 (1): 113-130. LENTZ, C. (2000), Of hunters, goats and earth-shrines: Settlement histories and the politics of oral
tradition in Northern Ghana. History in Africa 27: 193-214. LENTZ, C. (2006), Ethnicity and the making of history in Northern Ghana. Edinburgh: University Press. LIPTON, M. (1980), Migration from rural areas of poor countries: The impact on rural productivity and
income distribution. World Development 8 (1): 1-24. LITCHFIELD, J. & H. WADDINGTON (2003), Migration and poverty in Ghana: Evidence from the Ghana
Living Standard Survey. Paper presented at the International Workshop on Migration and Poverty in West Africa, University of Sussex, Brighton, March 13-14, 2003.
LOBNIBE, I. (2005), Forbidden fruit in the compound: A case study of migration, spousal separation and group-wife adultery in Northwest Ghana. Africa 75 (4): 599-581.
LOBNIBE, I. (2010), Of Jong Migrants and Jongsecans: understanding contemporary rural out-migration from Northwest Ghana. Journal of Dagaare Studies 7-10: 1-21.
228
LUGINAAH, I., T. WEISS, S. GALAA, K. NKRUMAH, R. BENZER-KERR & D. DAGAH (2009), Environment, migration and food security in the Upper West Region of Ghana. In: I. Luginaah & E. Yanful, eds, Environment and health in Sub-Saharan Africa: Managing an emerging crisis, pp. 25-38. Dordrecht: Springer.
MALTHUS, R.R. (1798), An essay on the principle of population. London: J. Johnson. MARTIN, P.L. & J.E. TAYLOR (1996), The anatomy of a migration hump. In: J.E. Taylor, ed.,
Development strategy, employment, and migration: Insights from models, pp. 43-62. Paris: OECD. MASSEY, D.S., J. ARANGO, G. HUGO, A. KOUAOUCI, A. PELLEGRINO & E. TAYLOR (1993), Theories of
international migration: a review and appraisal. Population and Development Review 19 (3): 431-66. MAZZUCATO, V. & D. NIEMEIJER (2000), Rethinking soil and water conservation in a changing society: a
case study in eastern Burkina Faso. PhD thesis, Wageningen University and Research Centre. MAZZUCATO, V. & D. NIEMEIJER (2002), Population growth and the environment in Africa: Local
informal institutions, the missing link. Economic Geography 78 (2): 171-193. MAZZUCATO, V., M. KABKI & L. SMITH (2006), Transnational migration and the economy of funerals:
Changing practices in Ghana. Development and Change 37 (5): 1047-1072. MAZZUCATO, V., B. VAN DEN BOOM & N.N.N. NSOWAH-NUAMAH (2008), Remittances in Ghana: Origin,
destination and issues of measurement. International Migration 46 (1): 103-122. MCCOY, R.F. (1988), Great things happen: A personal memoir of the first Christian missionary among
the Dagaabas and Sissalas of northwest Ghana. Montreal: The Society of Missionaries of Africa. MCMILLAN, D.E., J.H. SANDERS, D. KOENIG, K. AKWABI-AMEYAW & T.M. PAINTER (1998), New land is
not enough: Agricultural performance of new lands settlement in West Africa. World Development 26 (2): 187-211.
MENSAH-BONSU, A. (2003), Migration and environmental pressure in northern Ghana. PhD thesis, Free University of Amsterdam.
MORTIMORE, M. (1989), Adapting to drought: Farmers, famines and desertification in West Africa. Cambridge: University Press.
MORTIMORE, M.J. & W.M. ADAMS (2001), Farmer adaptation, change and ‘crisis’ in the Sahel. Global
Environmental Change 11: 49-57. MYERS, N. & J. KENT (1995), Environmental exodus: an emergent crisis in the global arena. Washington
DC: Climate Institute. MYERS, N. (2005), Environmental refugees: an emergent security issue. Paper presented at the 13th
Economic Forum, Prague, May 23-27, 2005. NABILA, J.S. (1972), Rural depopulation in Northern Ghana with special reference to the migration of the
Frafra people. Paper presented at the West African Regional Seminar on Population studies, Accra, November 30-December 4, 1972.
NABILA, J.S. (2001), Senior Secondary Atlas. Accra: Unimax Macmillan. NOOTEBOOM, G. (2003), A matter of style: Social security and livelihood in Upland East Java.
Amsterdam: Rozenberg. NYATEPE-COO, A.A. (1994), Dutch disease, government policy and import demand in Nigeria. Applied
economics 26: 327-336. NYBERG-SORENSEN, N., N. VAN HEAR & P. ENGBERG-PEDERSEN (2002), The migration-development
nexus, evidence and policy options: State of the art overview, International Migration 40 (5): 3-47. OATES, J.F. (1999), Myth and reality in the rain forest: how conservation strategies are failing in West
Africa. Berkeley: University of California Press. OBERAI, A.S. & SINGH, H.K.M (1980), Migration, remittances and rural development: Findings from a
case study in the Indian Punjab. International Labour Review 119 (2): 229-241. OLSSON, L., L. EKLUNDH AND J. ARDO (2005), A recent greening of the Sahel: Trends, patterns and
potential causes. Journal of Arid Environments 63 (3): 556-566. OOSTENDORP, R.H. & F. ZAAL (2009), Farm- and household-level drivers of agricultural innovation in
Machakos and Kitui Districts, Kenya. In: K. Burger & F. Zaal, eds, Explaining a miracle; transitions
to sustainable land management in the tropics, pp. 45-64. Aldershot: Ashgate. OWUSU, V. (2007), Migrants, income and environment: The case of rural Ghana. PhD thesis, Free
University of Amsterdam. PABI, O. & E.M. ATTUA (2005), Spatio-temporal differentiation of land use/cover changes and natural
resource management. Bulletin of the Ghana Geographical Association 24: 89-103. PIORE, M.J. (1979), Birds of passage: Migrant labor and industrial societies. Cambridge: University
Press.
229
PLANGE, N.K. (1979), Underdevelopment in Northern Ghana: Natural causes or colonial capitalism? Review of African Political Economy 6 (15-16): 4-14.
PORTES, A. (1978), Migration and underdevelopment. Politics and Society 8 (1): 1-48. POST, J. & M. SNEL (2003), The impact of decentralised forest management on charcoal production
practices in Eastern Senegal. Geoform 34: 85-98. PRINCE, S., E. BROWN DE COLSTOUN & L. KRAVITZ (1998), Evidence from rain-use efficiencies does not
indicate extensive Sahelian desertification. Global Change Biology 4 (4): 359-374. QUANSAH, S.T. (1972), The Gonja settlement and development scheme – Ghana. The Economic Bulletin
of Ghana 2 (1): 14-24. RAIN, D. (1999), Eaters of the dry season: Circular labour migration in the West African Sahel. Boulder:
Westview Press. REIJ, C., G. TAPPAN & A. BELEMVIRE (2005), Changing land management practices and vegetation on the
Central Plateau of Burkina Faso (1968–2002). Journal of Arid Environments 63: 642–659. RENAUD, F., J. BOGARDI, O. DUN & K. WARNER (2007), Control, adapt or flee: how to face environmental
migration. Bonn: UNU Institute for Environment and Human Security, Intersections Paper 5. RIBOT, J.C. (1999), A history of fear: imagining deforestation in the West African dryland forests. Global
Ecology and Biogeography 8 (3-4): 291-300. RICHARDS, P. (1985), Indigenous agricultural revolution: Ecology and food production in West Africa.
London: Hutchinson & Co. Ltd. ROZELLE, S., J.E. TAYLOR & A. DE BRAUW (1999), Migration, remittances, and agricultural productivity
in China. American Economic Review 89 (2): 287-291. RUBENSTEIN, H. (1992), Migration, development and remittances in rural Mexico. International
migration 30 (2): 127-153. RUF, F. (2007), The cocoa sector: Expansion, or green and double green revolutions. London: Overseas
Development Institute, ODI Background Note December 2007. RUNGE-METZGER, A. & L. DIEHL (1993), Farm household systems in Northern Ghana: A case study in
farming systems oriented research for the development of improved crop production systems. Tamale: Nyankpala Agricultural Research Station.
SARFO-MENSAH, P. & W. ODURO (2010), Changes in beliefs and perceptions about the natural
environment in the forest-savanna transitional zone of Ghana: The influence of religion. Milan: Fondazione Enrico Mattei, Fondazione Enrico Mattei Working Paper 398.
SCHIJF, A. (2004), Disentangling risks: Livelihood vulnerability and responses to climatic variability in
Northwest Ghana, M.A. thesis, University of Amsterdam. SCOONES, I. (1998), Sustainable rural livelihoods: A framework for analysis. Brighton: Institute of
Development Studies, IDS Working Paper 72. SHEPHERD, A. (1981), Agrarian change in Northern Ghana: Public investment, capitalist farming and
famine. In: J. Heyer, P. Roberts & G. Williams, eds, Rural development in tropical Africa, pp. 168-192. London and Basingstoke: MacMillan Press Ltd.
SHRESTA, N.R. (1988), A structural perspective on labour migration in underdeveloped countries. Progress in Human Geography 12 (2): 179-207.
SKELDON, R. (1997), Migration and development: A global perspective. Edinburgh: Longman. SMITH, L. (2007), Tied to migrants: Transnational influences on the economy of Accra, Ghana. PhD
thesis, University of Amsterdam. SOIL RESEARCH INSTITUTE (1971), Soil suitability map for mechanized and other cultivation practices in
Ghana. Accra: Soil Research Institute. SONG, C., J.W. LORD, L. ZHOU, AND J. XIAO (2008), Empirical evidence for impacts of internal migration
on vegetation dynamics in China from 1982 to 2000. Sensors 8: 5069-5080. SONGSORE, J. (1983), Intraregional and interregional labour migrations in historical perspective: the
case of North-Western Ghana. Port Harcourt, University of Port Harcourt Occasional Papers 1. STARK, O. (1991), The migration of labor. Oxford: Backwell. STARK, O. (2003), Tales of migration without wage differentials: Individual, family, and community
context. Bonn: Center for Development Research, ZEF-Discussion Papers on Development Policy 73. SUHRKE, A. (1994), Environmental degradation and population flows. Journal of International Affairs 47:
473-496. SUTTON, I. (1989), Colonial agricultural policy: The non-development of the Northern Territories of the
Gold Coast. The International Journal of African Historical Studies 22 (4): 637-69. SWINDELL, K. (1984), Farmers, traders, and labourers: Dry season migration from North-West Nigeria,
1900-33. Africa 54 (1): 3-19.
230
SWINDELL, K. (1995), People on the move in West Africa: From pre-colonial polities to post-independence states. In: R. Cohen, ed., The Cambridge Survey of World Migration, pp. 196-201. Cambridge: University Press.
TACOLI, C. (2009), Crisis or adaptation? Migration and climate change in a context of high mobility. Environment and Urbanization 21 (2): 513-525.
TAYLOR, E. (1999), The new economics of labour migration and the role of remittances in the migration process. International Migration 37 (1): 63-88.
TEAL, F., A. ZEITLIN & H. MAAMAH (2006), Ghana cocoa farmers survey 2004. Accra: Ghana Cocoa Board.
TENGAN, A.B. (2000), Hoe-farming and social relations among the Dagara of Northwestern Ghana and
Southwestern Burkina Faso. Frankfurt am Main: Peter Lang GmbH. THOMAS, R.G. (1973), Forced labour in British West Africa: The case of the Northern Territories of the
Gold Coast 1906-1927. Journal of African History 16 (1): 79-103. THOMAS, W.I. & F. ZNANIECKI (1918), The Polish peasant in Europe and America: Monograph of an
immigrant group. Boston: The Gorham Press. THOMAS, W.I. & D.S. THOMAS(1928), The child in America: Behavior problems and programs. New
York: Knopf. TIFFEN, M. (1995), Population density, economic growth and societies in transition: Boserup reconsidered
in a Kenyan case-study. Development and Change 26: 31-66. TIFFEN, M., M. MORTIMORE & F. GICHUKI (1994), More people, less erosion: Environmental recovery in
Kenya. Chichester: John Wiley & Sons Ltd. TUCKER, C.J., J.E. PINZON, M.E. BROWN, D.A. SLAYBACK, E.W. PAK, R. MAHONEY, E.F. VERMOTE &
N.E. SALEOUS (2005), An extended AVHRR 8-kilometre NDVI dataset compatible with MODIS and SPOT vegetation NDVI data. International Journal of Remote Sensing 26 (20): 4485–4498.
TWUM-BAAH, K.A., J.S. NABILA & A.F. ARYEE, eds, (1995), Migration Research Study in Ghana. Vol. 1
Internal Migration. Accra: Ghana Statistical Service. TWUMASI-ANKRAH, K. (1995), Rural-urban migration and socioeconomic development in Ghana: Some
discussions. Journal of Social Development in Africa 10 (2): 13-22. UNDP (2009), Human Development Report 2009. Overcoming barriers: human mobility and
development. New York: UNDP. UNEP (2008), Africa: Atlas of our changing environment. Nairobi: UNEP. VAN DER GEEST, K. (2004), “We are managing!” Climate change and livelihood vulnerability in
Northwest Ghana. Leiden: African Studies Centre, ASC Research Reports 74. VAN DER GEEST, K. (2009), Migration and natural resources scarcity in Ghana, case study report for the
environmental change and forced migration scenarios project, http://www.each-for.eu. VAN DER GEEST, K. (2010a), Local perceptions of migration from Northwest Ghana. Africa 80 (4): 595-
619. VAN DER GEEST, K. (2010b), Nandom Workshop Report. Amsterdam: AISSR, PADEV Working Paper
W.2010.1. VAN DER GEEST, K. (2010c), Migration agricole et usages durables de la terre dans la zone de transition
forêt-savane au Ghana. Hommes et Migrations 1284 (mars-avril): 112-127. VAN DER GEEST, K. (2011). North-South migration in Ghana: What role for the environment?
International Migration 49 (S1): e69-e94. VAN DER GEEST, K. & T. DIETZ (2004), A literature survey about risk and vulnerability in drylands. In:
A.J. Dietz, R. Ruben & A. Verhagen, eds, The impact of climate change on drylands: with a focus on
West Africa, pp 117-146. Dordrecht: Kluwer. VAN DER GEEST, K. & R. DE JEU (2008), Climate change and displacement: Ghana. Forced Migration
Review 16: 31. VAN DER GEEST, K., A. VRIELING & T. DIETZ (2010), Migration and environment in Ghana: a cross-
district analysis of human mobility and vegetation dynamics. Environment and Urbanization 22 (1): 107-123.
VAN DER GEEST, S. (2002), Respect and reciprocity: care for elderly people in rural Ghana. Journal of
Cross-Cultural Gerontology 17 (1): 3-31. VAN DIJK, H., D. FOEKEN & K. VAN TIL (2001), Population mobility in Africa: An overview. In: M. de
Bruijn, R. van Dijk & D. Foeken, eds, Mobile Africa: Changing patterns of mobility in Africa and
beyond, pp. 9-26. Leiden: Brill. VAN HEAR, N. (1982), Child labour and the development of capitalist agriculture in Ghana. Development
and Change 13: 499-514.
231
VARLEY, W.J. & H.P. WHITE (1958), The geography of Ghana. London, New York and Toronto: Longmans, Green & co.
WARDELL, D.A., A. REENBERG & C. TÔTTRUP (2003), Historical footprints in contemporary land use systems: forest cover changes in savannah woodlands in the Sudano-Sahelian zone. Global Environ-
mental Change 13: 235-254. WATTS, M. (1987), State, oil and agriculture in Nigeria. Berkeley: Institute of International Studies Press. WEISS, H. (1997), “Flight to survive”: Migrations during times of drought and famine in early colonial
West Africa. Helsinki: Institute of Development Studies, Working Paper 13. WELZER, H. (2008), Klimakriege. Wofür im 21. Jahrhundert getötet wird. Hamburg: Fischer Verlag. WHITEHEAD, A (2006), Persistent poverty in North East Ghana. Journal of Development Studies 42 (2):
278-300. WOUTERSE, F. & J.E. TAYLOR (2008), Migration and income diversification: Evidence from Burkina
Faso. World Development 36 (4): 625-640. WOUTERSE, F. (2010), Remittances, poverty, inequality and welfare: Evidence from the Central Plateau
of Burkina Faso. Journal of Development Studies 46 (4): 771-789. ZAAL, F. & R.H. OOSTENDORP (2002), Explaining a miracle: Intensification and the transition towards
sustainable small-scale agriculture in dryland Machakos and Kitui Districts, Kenya. World Develop-
ment 30 (7): 1271-1287. ZAAL, F., T. DIETZ, J. BRONS, K. VAN DER GEEST & E. OFORI-SARPONG (2004), Sahelian livelihoods on
the rebound: A Critical analysis of rainfall, drought index and yields in Sahelian agriculture. In: A.J. Dietz, R. Rueben & J. Verhagen, eds, The Impact of Climate Change on Drylands, pp. 61-78. Dordrecht: Kluwer.
ZETTER, R. (2010), Protecting people displaced by climate change: Some conceptual challenges. In: J. McAdam, ed., Climate Change and Displacement: Multidisciplinary Perspectives, pp. 131-150. Oxford: Hart Publishing
.
Summary
West Africa is experiencing a substantial flow of migrants from the interior savanna to the forest and coastal zones. This migration is not new, but many observers expect it to intensify due to climate change, environmental degradation, population growth, urbanization and intensifying inter-regional economic disparities. Vice versa, changes in the regional distribution of people through migration can have profound impacts on the environment and economy in migrant source and destination areas. In the long-standing and rich body of literature on human mobility in West Africa, scarcity, variability and degradation of natural resources are generally assumed to be important drivers of migration. However, in most studies, these factors are taken for granted and not subjected to critical scrutiny and empirical testing. West African studies of human mobility have largely ignored the environmental impact of migration, especially in migrant source areas.
This study deals with the multiple linkages between migration, environment and development in Ghana with special reference to the domestic migration system of the Dagara people from Northwest Ghana. Just as in the classic study that inspired the title of this PhD thesis – ‘The Polish peasant in Europe and America’, by Thomas and Znaniecki – the focus in this research is on migrant sending as well migrant receiving areas. The principal destination region of Dagara migrants is the Brong Ahafo Region in Ghana’s middle belt. Contrary to most other destinations of Dagara migrants, the Brong Ahafo Region mostly attracts rural-rural migrants. Ecologically, this migration flow involves a movement from the interior savannah with one rainy season to the forest-savannah transition zone with two rainy seasons. In political-economic terms the movement is from a poor and underdeveloped periphery to a semi-peripheral food crop frontier. Three different types of migration are studied here: seasonal labour migration, long-term migration and return migration. The study sought to answer the following question: “what are the economic and environmental causes and consequences of rural migration from the Upper West Region to the Brong Ahafo region? As both areas have predominantly agricultural economies, the impact of migration on agricultural development receives most attention, but the impact on non-farm income generating activities is also explored.
Three academic debates are at the core of this research: the environmental refugee debate, the population-environment debate and the migration and development debate. The environmental refugee debate deals with the question to what extent human migration flows are environmentally induced and to what extent people are
233
forced to relocate in response to environmental disruption. The population-environment debate is about the impact of demographic and socio-economic change on natural resources management and environmental quality. Within the broader field of population-environment studies, the Malthus-Boserup debate looks at the relation between population growth, technology and land use sustainability. The third academic debate that is central to this research deals with the impact of migration on development, particularly in migrants’ areas of origin.
A diverse set of methods and data sources, such as household questionnaires, group discussions, life histories, population censuses, satellite data and agricultural statistics, was used in this research. Throughout the study, local people’s perceptions of migration and environmental change receive attention. The analyses at village level are based on case studies that were carried out in eight villages around Nandom (Lawra District, Upper West Region) and in nine villages and rural towns in Wenchi District and Techiman District (Brong Ahafo Region). Initially, the research design centred mostly on the household questionnaires, but in the course of the research, it became clear that migration-environment linkages needed to be validated at a higher level of scale. Therefore, secondary data on migration and environmental scarcity were integrated in the analysis. This broadened the geographical scale from the local to the regional and national level. Geographic Information System (GIS) software was used to enable a spatial analysis of the relation between migration and the environment.
According to the last population census, which was held in the year 2000, about one out of three Dagara people (36 percent) is living in Southern Ghana. More than half of them (51 percent) reside in the Brong Ahafo Region. Within the Brong Ahafo Region, Wenchi District is the most popular destination of Dagara migrants. During the last population census 23,965 Dagara people were counted in Wenchi District, which amounted to 14 percent of the total population. The Ghana Population and Housing Census does not report exact out-migration figures at district level. Therefore, district out-migration rates were estimated based on four variables that are closely related to migration: population growth, adult sex ratios, the proportion of elderly in the population and urbanization rates (see Appendix). For Lawra District, it was estimated that 36 to 38 percent of the people born in the district were living outside the Upper West Region at the time of the census. Within this group, almost ninety percent migrated to Southern Ghana.
The North-South migration system of the Dagara was initiated by colonial coercion in the first decades of the 20th century. In pre-colonial times, before the advent of the modern migration system, Dagara people moved over shorter distances, mainly in search of fertile land and to escape conflict, oppressive rulers and slave raiders. Human mobility in this era has been described as ‘a tradition of local migration by many and long-distance migration by a minority of warriors and
234
traders.’ In the 18th and 19th century, voluntary migration over longer distances was impeded by conflict and insecurity resulting from the wars between the Ashanti, the Gonja and the Dagomba and the related activities of slave raiders.
In 1901 the present Northern Ghana was colonized by the British, and in the first decade of the 20th century, colonial officers came to the Northwest to recruit labourers for the mines and for road and railway construction in the South. The time of forced labour recruitment lasted about two decades, from 1906 to 1927. The working conditions were poor and mortality in the mines was high, but the first groups of labour migrants returned with possessions and stories that enticed others to embark on trips to Southern Ghana voluntarily. Instead of seeking employment in the mines, many opted for work as labourers in the booming cocoa sector where wages and working conditions were better. Within a few decades of the first recruitment campaigns, labour migration to the South had become a common source of livelihood and a ‘rite of passage’ for young men in the area.
In the past hundred years, out-migration rates have gradually increased with a temporary decline in the 1970-1984 inter-censal period. Widespread poverty in Northern Ghana and the prospect of escaping poverty in the more developed southern part of the country are the principal cause of migration from Northern Ghana. Poor agro-ecological conditions, lack of non-farm income opportunities, a long history of governmental neglect and unequal development are the root causes of poverty in Northern Ghana.
Patterns of Dagara migration have changed over time as a response to changes in migrants’ opportunity structure in source and destination areas and as a result of a maturing of the migration system. We can discern four major trends. These involve changes in the composition of the migration flow and spatio-temporal and occupational changes. Firstly, the Dagara migration system has matured in the sense that there has been a shift from individual, male-dominated migration to the movement of entire households. It has also become more common for women to migrate independently. Second, migration has become increasingly permanent. The first groups of male migrants moved alone or with friends and worked in the South on short contracts. Although seasonal migration is still common and many long-term migrants still return to the Upper West, more and more migrants nowadays settle in Southern Ghana permanently. This change is related to the shift from individual to household migration. Migrants’ children grow up in the South, which makes it more likely for parents to stay. The third trend is occupational. In the early stages of Dagara migration, almost all migrants were employed as mine workers, farmhands, labourers in infrastructural projects or night-soil collectors (toilet cleaners). Nowadays, Dagara migrants increasingly settle in Southern Ghana to establish their own farms; to earn an income through self-employment in the informal economy; or to work in white-collar jobs like teaching and nursing. The most common
235
occupation of Dagara migrants nowadays is farming. Fourthly and closely tied to this occupational shift is a change in destination region. Initially, most Dagara migrated to urban settlements in the Ashanti Region and the Western Region. Nowadays, rural areas in the Brong Ahafo Region are the prime destination. In sum, after more than half a century of predominantly individual, male dominated, wage labour migration, the Dagara have increasingly returned to their pre-colonial system of family migration in search of fertile land. The difference is that their action radius has expanded to Southern Ghana.
Below, the major findings of Chapter two to seven are summarized. All chapters except Chapter seven are based on journal articles that needed to stand on their own and make an original contribution to the existing literature. An advantage is that the chapters can be read separately. A disadvantage is that not all questions received equal attention and much data remains unreported here. Also, there may be some repetition in the introductory paragraphs of the chapters. The book does not have a separate methodology chapter. However, Chapter one (Introduction) discusses some considerations underlying the decision to combine questionnaire survey and data at regional and district level. In addition, the empirical chapters (two to seven) contain sections that describe data sources and sample frameworks in more detail and that reflect on the implications of some methodological choices (especially Chapter five).
Chapter two offers a first exploration of migration-environment linkages in Ghana. This chapter is quite broad as it discusses environmental causes as well as consequences of migration, both in source and destination areas. It compares district-level migration rates with data derived from a satellite that has been measuring the Normalized Difference Vegetation Index (NDVI) since 1981. On a two weekly basis this index assesses the presence and density of vegetation around the world. This unique dataset has been used in thousands of scientific articles. However, social scientists interested in deforestation or land degradation hardly make use of it. The analysis presented in this chapter shows that sparsely vegetated districts in Ghana are more likely to have migration deficits (more out-migration than in-migration) and districts with more abundant vegetation are more likely to have a migration surplus. This is an indication that the availability of natural resources is a determinant of migration in Ghana. Overall, the vegetation trend in Ghana has been positive, especially in Northern Ghana. Districts with more out-migration than in-migration tend to have more positive vegetation trends than districts that experienced more in-migration. As expected, out-migration seems to relieve pressure on natural resources while in-migration increases it. The national analysis shows that the environment matters in explaining migration flows and that migration matters in explaining changes in vegetation cover. However, the correlations at the national level were quite weak because not all migration flows in
236
Ghana are environmentally induced and because urban-ward migration has little impact on vegetation cover in the destination area. Moreover, these statistics say little about the processes behind migration and vegetation dynamics. In the second part of this chapter, in which the focus shifts to three principal domestic migration flows in Ghana, a more insightful interpretation of migration and environment linkages is presented. In the North-South migration system, environmental push plays an important role in explaining migration and the major pull factors are low population density and good conditions for crop cultivation. In the principal destination regions of migrants from the North (Ashanti and Brong Ahafo) no evidence of a negative impact of migration on vegetation cover was found. The second migration system we studied is cocoa frontier settlement. Here, the movement is from densely populated areas with a large incidence of mature cocoa plantations to sparsely populated areas with a large stock of uncultivated forest. This movement results in a conversion of tropical forest to cocoa plantations. It does not produce negative NDVI trends because mature cocoa plantations have closed canopies and are evergreen. However, conversion of tropical forest to cocoa plantations entails important biodiversity losses. In the third migration system we studied – migration to the national capital Accra – environmental factors do not play a major role.
Chapter three looks in more detail at the environmental causes of North-South migration, both in source and destination areas of migrants. This chapter contributes to the environmental refugee debate by assessing to what extent North-South migration is environmentally induced and forced. The first part of the chapter contains a cross-sectional and longitudinal analysis of migration propensities and different indicators of natural resources scarcity (rainfall, vegetation, crop yields and population pressure). The second part contains a qualitative analysis of the reasons that Dagara migrants in the Brong Ahafo Region mentioned for their decision to migrate. The two analyses show that environmental push and pull are important causes of migration. Poorly endowed districts in Northern Ghana tend to experience more out-migration than districts with a more benign natural environment. However, no evidence was found that North-South migration increased in a period of more pronounced environmental stress (in the 1970s and early 1980s). In this period in Ghana’s migration history, economic crisis and political turmoil played a more decisive role. The survey findings on migration causes showed that scarcity of fertile land in the Upper West Region and the availability of fertile land in the Brong Ahafo Region were the prime reason for Dagara to migrate. Sudden-onset environmental stresses, like drought-triggered famine or floods, were not mentioned. A qualitative analysis of the level of urgency expressed by respondents suggests that a minority were forced to migrate because of acute food security problems in the North. However, for most Dagara in the Brong Ahafo Region migration was part of
237
a larger, pro-active household strategy to reduce pressure on land at home and to benefit from better farming opportunities in the forest-savanna transition zone. The analyses at the regional level as well as the local level indicate that structural agro-ecological differences between Northern Ghana and Southern Ghana were a more important migration cause than environmental degradation and disaster.
In Chapter four, the environmental impact of Dagara migration in a prime destination area is investigated. Satellite images from 1973 and 2003, published by the United Nations Environmental Program (UNEP), suggest that the Northwest of the Brong Ahafo Region has experienced widespread land degradation over the past decades. According to UNEP, land degradation in Ghana is primarily caused by unsustainable farm practices. In addition, several studies comparing the land use of settlers and native farmers conclude that migrants’ farming methods are particularly detrimental to the environment. This chapter uses a variety of data to challenge the ‘easy conclusion’ that Dagara in-migration has been an important cause of land degradation. First, the validity of UNEP’s degradation narrative is challenged by looking at the timing of the LANDSAT images and the seasonality of vegetation cover in the area. Second, remotely sensed vegetation data and historic census data are used to show that most degradation has probably occurred before the area became a major destination of Dagara migrants. The droughts of the 1970s and early 1980s and related wild fires appear a more likely explanation for land cover change. Third, it is argued that earlier studies comparing settlers’ and natives’ farming methods used problematic assumptions of environmental sustainability. Fourth, in focus group discussions about (causes of) environmental change in the area, the arrival of migrants from the North appeared to play a minor role. Lastly, survey data on farming methods of Dagara settlers and native farmers are analysed with assumptions that are based on a land use and land cover study that compared the environmental outcomes of different farming styles. The findings show that there are appreciable differences in farming methods between settlers and native farmers, but no evidence is found that settlers’ farm practices are less sustainable.
Chapter five, six and seven focus on the consequences of out-migration in the area of origin. In Chapter five, local perceptions of migration from the Nandom Area in Northwest Ghana are studied. A qualitative analysis of 204 respondents’ answers to open question about the impact of seasonal migration, long-term migration and return migration yields a holistic view of the matter, encompassing consequences in many different realms of life (e.g. food security, income, health, education, agriculture, social cohesion, communal labour, funerals, architecture and knowledge). Respondents were very positive about the contribution of seasonal migration to food and livelihood security, but they were critical about the conse-quences of long-term migration and return migration. Respondents that held a negative opinion about long-term migration usually lamented the lack of support
238
(remittances) from migrant relatives. A positive effect of out-migration, highlighted by almost half the respondents was that it reduces the pressure on farmland. With a population density of about one hundred inhabitants per square kilometre, land is relatively scarce in the Nandom Area. Fallow periods are short and agricultural productivity is low. A common perception is that without migration, there would not be enough land to sustain the population, which would result in more hunger, poverty and conflict.
Chapter six looks at the relation between migration, population density and agricultural productivity in the twenty-four districts of Northern Ghana. In the theoretical part of this chapter it is argued that the migration and development debate can benefit from cross-fertilization with the Malthus-Boserup debate about population growth and land use intensity. The central thesis of this chapter is that one has to know where a region is situated in the transition to more intensive land use to understand the impact of out-migration on agricultural development. Whereas agronomists have since long recognized population density as a major determinant of farming systems in Africa, studies about the impact of migration on agricultural development, which are typically carried out by migration scholars, have ignored the indirect effect of out-migration that runs through population density. An important finding of this chapter is that by recognizing the intervening role of population density, the reverse causality problem in studies about the impact of migration on agricultural development can be addressed. The empirical part of this chapter shows that there is a U-shaped curve between population density and crop yields. Up to about one hundred inhabitants per square kilometre, the relation between population density and crop yields is negative (as predicted by Malthus). Beyond this population threshold, crop yields increase, presumably because of a transition to more intensive land use (as predicted by Boserup). For the twenty districts in the first half of the Malthus-Boserup curve, the cross-district analysis indicates that low crop yields are a cause rather than a consequence of out-migration. It further shows that out-migration has a positive effect on farm sizes and agricultural output per capita.
Compared to other districts in Northern Ghana, Lawra District – in which the Nandom area lies – has medium to high population density and is situated right at the bottom of the Malthus-Boserup curve (very low crop yields). A transition to more intensive land use is required to increase agricultural productivity. While respondents in the Nandom Area emphasized that out-migration relieves pressure on farmland, a negative effect might be that it removes the incentives for a transition to more intensive land use. Migration and agricultural productivity data at district level suggest that large-scale migration has allowed the farming system to stand still or at least evolve very little. The next chapter investigates whether this is indeed the case.
239
In Chapter seven, demographic and farm characteristics of 204 rural household in the Nandom Area are used in a more in-depth analysis of migration and agricultural development at local level. The effects of seasonal migration and long-term migration are studied separately. The survey findings confirm that migration propensities are high and agricultural productivity low. However, the findings also show that farmers in the area are adopting a number of measures that aim to increase agricultural productivity and protect the fertility of the land. Examples are animal traction, improved seed varieties, composting, physical soil and water conservation measures and zero burning. These measures involve a higher input of labour and capital per unit of land. Another way to increase production is to expand farm sizes. The adoption of different farming methods varies per household. This chapter assesses to what extent migration influences agricultural land use. Three broad avenues of migration impact on agriculture are investigated. First, the effect of migration on household composition, farm size and the adoption of labour-led intensification measures; second, the impact of migrant savings and remittances on capital-led intensification measures; and third, the impact of return migration. The findings suggest that migration characteristics at the household level are not major determinants of farm practices. No negative effect of loss of labour on adoption of labour-led intensification measures is found. The impact of migration on farm size depends on who migrates. The migration of a brother – with whom the respondent might have to share land – tends to have a positive impact on farm size. The migration of a son – who is likely to contribute labour to the household farm – tends to have a negative impact on farm size. The potentially positive effect of migrant savings and remittances on capital-led intensification is limited because the volume of remittances is quite low; because remittances are primarily used for survival purposes; and because until recently the policy environment and market conditions did not favour investment in agriculture. The potentially positive effect of return migration does not materialize because most returnees do not acquire the kind of skills and assets that would enable them to become agents of change.
In the past few years – after the survey was conducted – food prices increased sharply and a number of international NGOs started projects to support farmers in the area. Further, it is expected that Nandom will be connected by a tarred road to the regional capital and Southern Ghana within a few years. If these improvements in the conditions for investment in agriculture are sustained, it is more likely that migration will start to contribute positively to agricultural development. The relation between migration and development is mediated not only by population density, but also by policy and market conditions.
In Chapter eight (Conclusions) an attempt is made to go beyond the specific chapter topics and present overall findings on migration, environment and development linkages in the Dagara migration system. It discusses the relevance of
240
the findings for the wider academic debates that are at the core of this research. First, the drivers of Dagara migration, both in source and destination areas, are discussed and after that, the focus shifts to the impact of migration. The general conclusion of this research with regard to environmental causes of Dagara migration is that structural differences in agro-ecological conditions – rather than degradation and disaster – play an important role and that environmental factors act in complex interplay with economic, political, social and cultural factors. The conclusion about the environmental impact of Dagara migration in destination areas in the Brong Ahafo Region is that earlier studies on this topic overrate environmental degradation and wrongly identify migrants as the culprits. With regard to the impact of migration in source areas the conclusion is that migration contributes to food and livelihood security in the short term. However, in the long run it removes the incentives for a transition to more sustainable land use and livelihoods.
Samenvatting (Summary in Dutch)
West-Afrika kent een omvangrijke stroom mensen die van de savanne in het binnenland zuidwaarts migreren naar meer bosrijke gebieden en de kuststrook. Deze migratie is niet nieuw maar men verwacht dat het aantal migranten zal toenemen onder invloed van klimaatverandering, milieudegradatie, bevolkingsgroei, verstedelijking en toenemende regionale verschillen in welvaart. Migratie kan op haar beurt diepgaande gevolgen hebben voor het milieu en economische ontwikkeling in de herkomst- en vestigingsgebieden van migranten. Er is de afgelopen decennia veel geschreven over migratie in West Afrika. Vaak worden milieuoorzaken van migratie in deze studies wel vermeld, maar niet aan een kritische blik onderworpen door middel van empirisch onderzoek. Over de milieugevolgen van migratie in West Afrika is ook maar weinig bekend, vooral over de gevolgen in de herkomstgebieden.
Deze studie gaat over de relatie tussen migratie, milieu en ontwikkeling in Ghana. Er wordt specifiek gekeken naar het migratiesysteem van de Dagara, een volk dat afkomstig is uit de savanne van Noordwest Ghana. Evenals in de klassieke studie die als inspiratie diende voor de titel van dit boek – ‘The Polish peasant in Europe and America’, door Thomas en Znaniecki – zijn voor dit onderzoek gegevens verzameld in zowel herkomst- als vestigingsgebieden van migranten. Het belangrijkste vestigingsgebied van Dagara migranten is de Brong Ahafo Region in het centrale gedeelte van Ghana, een gebied dat in de overgangszone van savanne naar tropisch bos ligt. Terwijl veel Dagara die naar het Zuiden migreren ervoor kiezen om zich in steden te vestigen zijn de meeste migranten die naar de Brong Ahafo Region trekken boeren die zich in rurale gebieden vestigen. In deze studie worden drie typen migratie bestudeerd: seizoensmigratie, langdurige migratie en terugkeer. De onderzoeksvraag luidt als volgt: Wat zijn de milieu- en economische oorzaken en gevolgen van rurale migratie van de Upper West Region naar de Brong Ahafo region? Beide regio’s hebben een overwegend agrarische economie. Dientengevolge staat landbouwontwikkeling centraal, maar er wordt ook aandacht besteed aan niet-agrarische bronnen van inkomsten.
Drie wetenschappelijke debatten of onderzoeksvelden spelen een belangrijke rol in deze studie. Het eerste gaat over milieuvluchtelingen; het tweede over de relatie tussen mens en milieu; en het derde over de relatie tussen migratie en ontwikkeling. In het introductiehoofdstuk wordt aangegeven hoe deze debatten samen leiden naar de onderzoeksvraag. Het milieuvluchtelingendebat gaat over de vraag in hoeverre er in bepaalde delen van de wereld sprake is van gedwongen migratie als gevolg van
242
milieufactoren zoals klimaatverandering en natuurlijke rampen. Mens en milieu studies zijn primair geïnteresseerd in het effect van demografische en sociaaleconomische veranderingen op het milieu en het beheer van natuurlijke hulpbronnen. Binnen dit brede onderzoeksveld gaat het Malthus-Boserup debat over de relatie tussen bevolkingsgroei, technologie en landgebruik. Het derde onderzoeksveld dat centraal staat in dit onderzoek betreft het migratie- en ontwikkelingsdebat en dan vooral studies die kijken naar de gevolgen van migratie in herkomstgebieden van migranten.
In dit onderzoek wordt gebruik gemaakt van verschillende onderzoeksmethoden en databronnen, zoals enquêtes, groepsdiscussies, levensgeschiedenissen, volkstellingen, satellietgegevens en landbouwstatistieken. In verschillende onderdelen van het boek wordt ook stilgestaan bij lokale percepties van milieuverandering en oorzaken en gevolgen van migratie. De dorpsstudies zijn uitgevoerd in het gebied rond Nandom in het district Lawra in de Upper West Region (herkomstgebied) en in de districten Wenchi en Techiman in de Brong Ahafo Region (vestigingsgebieden). Aanvankelijk zou het onderzoek grotendeels gebaseerd worden op enquêtes, maar gaandeweg werd duidelijk dat het vooral voor de relatie tussen migratie en milieu onontbeerlijk was om lokale gegevens over huishoudens aan te vullen met ruimtelijke gegevens op een hoger schaalniveau. Daarom werd besloten om naast de lokale studie ook een analyse van migratie en milieufactoren op regionaal en nationaal niveau uit te voeren. In de ruimtelijke analyses werd gebruikt gemaakt van Geografische Informatie Systeem (GIS) software. Dat zijn computerprogramma’s die het onder andere mogelijk maken om gegevens over verschillende geografische eenheden naar eenzelfde schaalniveau te aggregeren.
Volgens de laatste Ghana volkstelling, die in het jaar 2000 gehouden werd, leefde ongeveer één op de drie Dagara (36 procent) in Zuid-Ghana. Iets meer dan de helft van deze migranten (51 procent) woonde in de Brong Ahafo Region. Binnen deze regio is Wenchi District de populairste bestemming van Dagara migranten. Ten tijde van de laatste volkstelling woonden er 23,965 Dagara mensen in dit district. Dat was ruim 14 procent van de totale bevolking. Tussen de 36 en 38 procent van de mensen die in Lawra District zijn geboren woonde in 2000 in een andere regio van Ghana (zie bijlage). Binnen deze groep woonde bijna 90 procent in het Zuiden van Ghana.
De migratie van Dagara mensen naar Zuid-Ghana is in het begin van de 20e eeuw op gang gebracht onder invloed – of beter gezegd, dwang – van de Britse koloniale regering. In de tijd vóór de kolonisatie van Noord-Ghana migreerden mensen ook wel, maar dit gebeurde vooral binnen de regio. De voornaamste ‘beweegreden’ in die tijd was de behoefte aan vruchtbaar land. Soms verplaatste men zich ook om conflict, uitbuiting en slavernij te ontvluchten. In de 18e en 19e eeuw werd
243
vrijwillige migratie over langere afstanden bemoeilijkt door de oorlogen tussen de Ashanti, Gonja en Dagomba volken en de hieraan gerelateerde jacht op slaven.
In 1901 werd het huidige Noord-Ghana gekoloniseerd door de Britten. Vrij snel daarna, in 1906, begonnen zij arbeiders te rekruteren voor werk in de mijnen en voor de aanleg van wegen en spoorwegen in Zuid-Ghana. Dit gebeurde onder dwang, maar de jonge mannen die in het Zuiden gingen werken werden wel betaald. De periode van gedwongen arbeid duurde iets meer dan twintig jaar, tot 1927. De arbeidsomstandigheden waren slecht, vooral in de mijnen, maar veel jonge mannen kwamen terug met bezittingen en verhalen die anderen ertoe verleidden om vrijwillig naar het Zuiden te migreren. In plaats van werk te zoeken in de mijnen en in de aanleg van wegen en spoorwegen vonden velen van hen emplooi in de cacaoplantages. Die sector kende in de eerste helft van de 20e eeuw een periode van bloei en er was een groot tekort aan arbeidskrachten. Niet lang nadat de eerste groepen gedwongen arbeiders waren teruggekeerd was er al sprake van een zekere traditie van arbeidsmigratie naar het Zuiden. Voor jonge mannen werd dit soort migratie een belangrijk onderdeel van het volwassenwordingsproces. In die tijd circuleerde er nog weinig geld in de rurale economie van Noord-Ghana en het inkomen van arbeidsmigranten had daarom een belangrijke rol in de integratie van het gebied in de nationale economie.
In de loop van de 20e eeuw nam het aantal mensen uit het Noorden dat in het Zuiden woonde gestaag toe, van ruim 44 duizend in 1931 tot ongeveer 677 duizend in 2000. De belangrijkste oorzaak van migratie uit het Noorden is armoede en de hoop aan deze armoede te ontsnappen in het meer welvarende zuiden. Armoede in Noord-Ghana wordt op haar beurt veroorzaakt door de povere omstandigheden voor landbouw, een gebrek aan alternatieve inkomensbronnen, een verwaarlozing van het Noorden door opeenvolgende regeringen en een historisch gegroeide structuur van ongelijke regionale ontwikkeling.
De migratiepatronen van de Dagara zijn in de loop der tijd sterk veranderd. Dit komt door veranderende omstandigheden in herkomst- en vestigingsgebieden. Tevens is er sprake van een ‘rijping’ van het migratiesysteem. Vier duidelijke trends kunnen onderscheiden worden. Deze hebben betrekking op wie migreert, voor hoe lang, waar naar toe en met welk doel. De eerste verandering is dat vroeger vooral jonge mannen migreerden terwijl nu gezinsmigratie de dominante vorm is. Ook komt het steeds vaker voor dat vrouwen zelfstandig migreren. Ten tweede is migratie steeds permanenter of in ieder geval langduriger geworden. De eerste groepen arbeidsmigranten hadden relatief korte contracten in het Zuiden en keerden daarna weer terug. Hoewel seizoensmigratie nog steeds veel voorkomt en veel migranten die langer in het Zuiden verblijven uiteindelijk toch nog terugkeren, komt het tegenwoordig steeds vaker voor dat migranten in het Zuiden blijven. Dit heeft onder andere te maken met het feit dat hun kinderen in het Zuiden opgroeien. De
244
derde verandering betreft het type beroepen dat Dagara migranten uitvoeren in het Zuiden. Aanvankelijk waren bijna alle migranten arbeiders in de mijnen, wegenbouw en cacao. Later gingen steeds meer Dagara in Zuid-Ghana werken in de informele sector of in formele beroepen zoals leraar of verpleegster, maar de meeste van hen pachten tegenwoordig een stuk land om zelf gewassen te verbouwen, zowel voor eigen gebruik als voor de verkoop. Gerelateerd aan deze trend is een verandering in de vestigingsgebieden van Dagara migranten. Aanvankelijk migreerden de Dagara vooral naar urbane centra in de Ashanti Region en Western Region (waar de mijnen waren). Tegenwoordig zijn rurale vestigingsgebieden in de Brong Ahafo Region het populairst. Je zou kunnen zeggen dat na ruim een halve eeuw van vooral arbeidsmigratie door jonge mannen, de Dagara in toenemende mate terugkeren naar hun prekoloniale systeem van familiemigratie op zoek naar vruchtbaar land. Het verschil met vroeger is dat die vruchtbare gebieden nu verder van huis kunnen liggen.
Het resterende gedeelte van deze samenvatting beschrijft hoofdstuksgewijs de belangrijkste bevindingen van dit onderzoek. Op hoofdstuk zeven na zijn alle hoofdstukken bewerkingen van artikelen in wetenschappelijke tijdschriften. Om gepubliceerd te worden, was het nodig dat deze artikelen een duidelijke bijdrage leverden aan een bestaand onderzoeksterrein. Een voordeel van een proefschrift gebaseerd op artikelen is dat de hoofdstukken onafhankelijk van elkaar gelezen kunnen worden. Een nadeel is dat niet alle onderzoeksvragen evenveel aandacht hebben gekregen en dat over een deel van de verzamelde gegevens in dit boek niet gerapporteerd wordt. Daarnaast kan er enige herhaling zitten in de inleidende paragrafen van de hoofdstukken. Het boek heeft geen apart hoofdstuk over methodologie. In de introductie wordt wel aangegeven welke overwegingen ten grondslag lagen aan enkele methodologische keuzen. De empirische hoofdstukken bevatten verder paragrafen waarin databronnen en steekproefkaders nader worden omschreven en waarin gereflecteerd op implicaties van methodologische keuzen. De in dit onderzoek gebruikte enquêtes kunnen gedownload worden van de website van de onderzoeker.
Hoofdstuk twee is een eerste verkenning van de relatie tussen migratie en milieu in Ghana. Het hoofdstuk is vrij breed van opzet aangezien zowel milieuoorzaken als -gevolgen van migratie behandeld worden en omdat de analyse zowel herkomstgebieden als vestigingsgebieden omspant. Voor de 110 districten van Ghana worden migratiepercentages gerelateerd aan de gegevens van een satelliet die sinds 1981 wereldwijd elke twee weken de ‘Normalized Difference Vegetation Index’ (NDVI) meet. Deze index geeft aan hoe dicht de vegetatie in een gebied is, ofwel hoe groen de omgeving is. Op basis van deze unieke dataset zijn duizenden artikelen verschenen in natuurwetenschappelijke tijdschriften, maar sociale wetenschappers die geïnteresseerd zijn in milieuthema’s als ontbossing en
245
landdegradatie maken er nog vrijwel geen gebruik van. De analyse laat zien dat uit minder ‘groene’ districten een hoger percentage van de bevolking wegtrekt terwijl districten met meer vegetatie juist meer migranten aantrekken. Kijken we naar de trends in vegetatie, dan blijkt die – wellicht tegen de verwachting van menigeen in – positief in het grootste deel van Ghana, vooral in het Noorden. De positieve trend komt vooral voor in districten met meer uit-migratie en minder in gebieden met meer in-migratie. De analyse op nationaal niveau laat zien dat vegetatie van invloed is op migratie en dat migratie gevolgen heeft voor vegetatietrends. De correlaties zijn echter vrij zwak omdat de beschikbaarheid van natuurlijke hulpbronnen niet in alle migratiestromen in Ghana een rol speelt en omdat migratie naar steden weinig invloed heeft op de vegetatie in het vestigingsgebied. Bovendien zegt de statistische analyse weinig over de processen die ten grondslag liggen aan migratiebeslissingen en milieuveranderingen. Daarom wordt in het tweede deel van het hoofdstuk ingezoomd op de drie belangrijkste migratiesystemen van Ghana: Noord-Zuid migratie, de trek van cacaoboeren naar Zuidwest Ghana en migratie naar de hoofdstad Accra. Aanvullende gegevens maken een betere interpretatie van bevolkings- en vegetatiedynamieken mogelijk. Vooral bevolkingsdichtheid blijkt een belangrijke variabele in het verklaren van migratiestromen in Ghana. Noord-Zuid migratie en de kolonisatie van nieuwe cacaogebieden zijn sterk gerelateerd aan de beschikbaarheid van natuurlijke hulpbronnen. Milieuschaarste in het Noorden is een sterke ‘push factor’ en lage bevolkingsdichtheid in combinatie met relatief goede condities voor landbouw is een belangrijke ‘pull factor’ in vestigingsgebieden. Verder blijkt dat er in districten die meer migranten uit het Noorden aantrekken geen duidelijke aanwijzingen voor ontbossing zijn. Dit heeft waarschijnlijk te maken met het feit dat boeren uit het Noorden veelal de oude akkers van de autochtone bevolking bewerken in plaats van nieuwe akkers te ontginnen ten koste van tropisch bos. Cacaoboeren die naar Zuidwest Ghana trekken komen vooral uit dichtbevolkte gebieden elders in Zuid-Ghana waar een groot deel van het oppervlak al bedekt is met cacao plantages. Zij worden vooral aangetrokken door de lage bevolkingsdruk in Zuidwest Ghana en de ruimte om nieuwe plantages aan te leggen. De conversie van bos naar cacao plantages leidt niet tot lagere vegetatiedichtheden, maar wel tot een verlies aan biodiversiteit. In de derde belangrijke migratiestroom in Ghana die in dit hoofdstuk behandeld wordt – de trek naar de hoofdstad Accra – spelen milieufactoren geen rol van betekenis.
Hoofdstuk drie kijkt in meer detail naar de milieuoorzaken van Noord-Zuid migratie in Ghana, zowel in herkomst- als vestigingsgebieden. Dit hoofdstuk levert een bijdrage aan het debat over milieuvluchtelingen door na te gaan in hoeverre mensen uit Noord-Ghana gedwongen worden om te migreren vanwege milieuschaarste, -rampen en -degradatie. In het eerste deel van dit hoofdstuk worden migratiepercentages en milieu-indicatoren, zoals regenval, vegetatie,
246
gewasopbrengsten en bevolkingsdruk, geanalyseerd in ruimte en tijd. Het tweede deel bevat een kwalitatieve analyse van de redenen die Dagara migranten in de Brong Ahafo Region opgaven voor hun beslissing om te migreren. Beide analyses laten zien dat zowel milieu ‘push’ als ‘pull’ factoren een belangrijke rol spelen. Uit districten in Noord-Ghana met meer milieuschaarste wordt duidelijk meer gemigreerd dan uit districten met minder milieuschaarste en migranten bevestigen dat gebrek aan vruchtbaar land in het Noorden en beschikbaarheid van vruchtbaar land in de Brong Ahafo Region de belangrijkste redenen om te migreren waren. De longitudinale analyse laat echter zien dat migratie uit het Noorden niet toenam in een periode van extra schaarste, ten tijde van de grote droogten van de Sahel in de jaren ’70 en begin jaren ’80. Migratie nam toen juist af. In deze periode in Ghana’s migratiegeschiedenis speelden economische crisis en politieke onrust en instabiliteit een belangrijkere rol. Geen van de ruim twee honderd geïnterviewde migranten gaf aan dat zij waren gemigreerd naar aanleiding van acute rampen zoals hongersnood als gevolg van droogten en overstromingen. Wel meldde een minderheid dat ze gedwongen waren te migreren omdat ze in het Noordwesten structurele problemen hadden om voedselzekerheid voor hun gezin te garanderen. Voor de meeste Dagara is migratie echter deel van een grotere proactieve familiestrategie om de druk op het land te verminderen en om te profiteren van betere landbouwomstandigheden in de Brong Ahafo Region. Zowel de regionale als de lokale analyse suggereert dat niet milieudegradatie en natuurrampen de oorzaken van migratie zijn, maar structurele verschillen tussen het Noorden en het Zuiden in de levensomstandigheden en de mogelijkheid om als boer een bestaan op te bouwen en voedselzekerheid voor het gezin te bereiken.
In hoofdstuk vier worden milieugevolgen van Dagara migratie in het vestigingsgebied (Brong Ahafo Region) onderzocht. Satellietbeelden uit 1973 en 2003 die gepubliceerd zijn door de milieutak van de Verenigde Naties (UNEP) suggereren dat in het deel van de regio waar veel Dagara zich vestigen de afgelopen decennia grote stukken bos zijn veranderd in savanne. Landdegradatie en ontbossing in Ghana zijn volgens de UNEP vooral een gevolg van niet-duurzame landbouwmethoden. Een aantal bestaande studies die het landgebruik van migranten en autochtone bevolking in de Ghanese transitiezone van bos naar savanne vergelijken komt bovendien tot de conclusie dat vooral de teeltmethoden van migranten destructief zijn voor het milieu. In dit hoofdstuk wordt een verscheidenheid aan data aangedragen die de ‘gemakkelijke conclusie’ in twijfel trekken dat Dagara migranten verantwoordelijk zijn voor landdegradatie en ontbossing in hun vestigingsgebied. Ten eerste blijkt dat de satellietbeelden van 1973 en 2003 in verschillende seizoenen zijn genomen, de eerste in het regenseizoen en de tweede in het droge seizoen waardoor de omgeving anno 2003 veel kaler lijkt. Ten tweede blijkt dat als er al degradatie heeft plaatsgevonden, dit vooral in de
247
periode vóór 1981 moet zijn geweest. De eerder genoemde NDVI die de groenheid van de omgeving meet, laat voor de periode na 1981 een licht positieve trend zien. Aangezien dit gebied pas in de loop van de jaren ’80 een belangrijk vestigingsgebied voor Dagara migranten werd, is het waarschijnlijker dat er andere oorzaken zijn van ontbossing, zoals de droogten van de jaren ’70 en begin jaren ’80 en de hieraan gerelateerde bosbranden. Ten derde blijkt dat eerdergenoemde studies die het landgebruik van migranten en autochtone bevolking onderzoeken zeer selectieve en problematische aannames over duurzaamheid hanteerden. Ten vierde blijkt uit groepsdiscussies over milieuverandering en mogelijke oorzaken daarvan de komst van migranten een ondergeschikte rol te spelen. In het laatste gedeelte van dit hoofdstuk worden gegevens van een enquête over landgebruik gepresenteerd. De enquête werd afgenomen onder zowel migranten als autochtone bewoners. In de ecologische duurzaamheidsanalyse zijn de aannames gebaseerd op een studie die de milieueffecten van verschillende landbouwsystemen in het zelfde gebied vergelijkt. Er blijken wel degelijk belangrijke verschillen te zijn tussen de manier waarop migranten en autochtone boeren het land bewerken, maar er wordt geen bewijs gevonden voor de veronderstelling dat de methoden van migranten minder duurzaam zijn.
Hoofdstuk vijf, zes en zeven gaan over de gevolgen van migratie in het herkomstgebied. In hoofdstuk vijf staan de percepties van de lokale bevolking centraal. Aan ruim twee honderd respondenten in de dorpen rond Nandom werden open vragen gesteld over de gevolgen van verschillende typen migratie (seizoensmigratie, langdurige migratie en terugkeer). De antwoorden werden vervolgens onderworpen aan een kwalitatieve analyse. Het voordeel van het stellen van open vragen is dat er informatie naar boven kan komen die de onderzoeker niet verwacht had. Het voordeel van het stellen van de vragen aan een vrij grote groep mensen is dat het mogelijk wordt onderscheid te maken tussen individuele en breedgedragen meningen. De kwalitatieve analyse leverde een gevarieerd beeld op van de gevolgen van migratie op het gebied van voedselzekerheid, inkomen, gezondheid, onderwijs, landbouw, sociale cohesie, gemeenschappelijke arbeid, begrafenisrituelen, architectuur en kennis. De respondenten waren vooral erg positief over de bijdrage van seizoensmigratie aan bestaans- en voedselzekerheid. Zij waren veel kritischer over de gevolgen van langdurige migratie, vooral wanneer migranten onvoldoende geld en middelen terugstuurden naar hun familieleden in het Noorden. Een positief effect van langdurige migratie dat door veel respondenten genoemd werd is dat migratie de druk op het land vermindert. Met ongeveer honderd inwoners per vierkante kilometer zijn de dorpen rond Nandom vrij dicht bevolkt en is vruchtbaar akkerland schaars. Veel respondenten dachten dat er zonder migratie niet genoeg land zou zijn voor de thuisblijvers waardoor er meer honger, armoede en conflict zou zijn.
248
Hoofdstuk zes kijkt naar de relatie tussen migratie, bevolkingsdichtheid en agrarische productiviteit in de 24 districten van Noord-Ghana. In het theoretische gedeelte van dit hoofdstuk vindt een kruisbestuiving plaats tussen het debat over de gevolgen van migratie voor rurale ontwikkeling en het Malthus-Boserup debat over bevolkingsgroei en duurzaamheid van landgebruik. In het eerstgenoemde onderzoeksveld is er sprake van een zekere impasse omdat de bevindingen uit verschillende delen van de wereld zeer gevarieerd zijn. Daarnaast is er het zogenoemde causaliteitsprobleem. Vaak is er een negatief verband tussen uit-migratie en ontwikkeling, maar is niet duidelijk of migratie onderontwikkeling veroorzaakt of er alleen een gevolg van is. In gebieden met een overwegend agrarische economie geldt hetzelfde voor de relatie tussen migratie en landbouwproductiviteit. Terwijl in agronomische studies algemeen wordt erkend dat bevolkingsdichtheid één van de belangrijkste determinanten van landbouwsystemen in Afrika is blijkt dat studies naar de gevolgen van migratie voor agrarische ontwikkeling het indirecte effect van migratie dat via bevolkingsdichtheid loopt totaal negeren. Een belangrijke bevinding van dit hoofdstuk is dat door het erkennen van bevolkingsdichtheid als interveniërende variabele het causaliteitsprobleem in studies naar de gevolgen van migratie voor agrarische ontwikkeling kan worden aangepakt. Het empirische gedeelte van dit hoofdstuk vindt voor Noord-Ghana een U-vormige curve in de relatie tussen bevolkingsdichtheid en gewasopbrengsten. Tot een dichtheid van honderd mensen per vierkante kilometer dalen de opbrengsten per hectare bij toenemende bevolkingsdruk (zoals voorspeld door Thomas Malthus). Voorbij deze drempel stijgen de opbrengsten bij toenemende bevolkingsdruk, naar wordt aangenomen als gevolg van een intensivering van de landbouw (zoals voorspeld door Ester Boserup). Het punt dat in dit hoofdstuk gemaakt wordt, is dat men moet weten waar een gebied zich bevindt in de transitie naar intensiever landgebruik om te begrijpen wat de gevolgen van migratie voor agrarische ontwikkeling zijn. Voor de twintig districten in de eerste helft van de Malthus-Boserup curve blijkt dat lage gewasopbrengsten een oorzaak van migratie zijn en niet een gevolg. Verder blijkt dat uit-migratie een positief effect heeft op het bebouwde areaal en de oogst per hoofd van de bevolking.
Vergeleken met andere districten in Noord-Ghana is de bevolkingsdichtheid in het district Lawra, waar Nandom in ligt, iets hoger dan gemiddeld en zijn de gewasopbrengsten zeer laag. Het district bevindt zich precies op het laagste punt van de Malthus-Boserup curve. Een transitie naar intensiever landgebruik lijkt noodzakelijk om de landbouwproductiviteit te verhogen. Veel inwoners van de dorpen rond Nandom benadrukken dat migratie goed is omdat het de druk op het land vermindert (zie hoofdstuk vijf), maar een negatief effect lijkt te zijn dat uit-migratie de stimulans wegneemt om te investeren in duurzamer en productiever landgebruik. Decennia van uit-migratie en lage bevolkingsgroei lijken ervoor te
249
hebben gezorgd dat het landbouwsysteem min of meer stil heeft gestaan. In het volgende hoofdstuk wordt onderzocht of dit ook daadwerkelijk het geval is.
Hoofdstuk zeven gaat evenals hoofdstuk zes over de relatie tussen migratie en agrarische ontwikkeling maar de focus verschuift van het regionale naar het lokale niveau. Enquêtegegevens van ruim twee honderd boerenhuishoudens in de dorpen rond Nandom worden gebruikt om het effect van seizoensmigratie, langdurige migratie en terugkeer op landbouwontwikkeling te bestuderen. De gegevens bevestigen dat Nandom een typisch uit-migratie gebied is met een lage agrarische productiviteit. Tevens blijkt echter dat boeren in het gebied wel degelijk maatregelen nemen die als doel hebben om de productiviteit te verhogen en de vruchtbaarheid van het land te beschermen. Voorbeelden zijn verbeterd zaaigoed, ossen- of ezelsploegen, bemesting, anti-erosie maatregelen en veranderingen in het gebruik van vuur op akkers. Deze maatregelen behelzen een grotere inzet van arbeid en kapitaal per eenheid land. Een andere manier om de oogst op peil te houden is een groter stuk land te bebouwen. In dit hoofdstuk wordt op huishoudniveau de relatie tussen migratie en de adoptie van verschillende landbouwmethoden onderzocht. Er wordt hierbij onderscheid gemaakt tussen drie mechanismen waarmee migratie ontwikkelingen in de landbouw zou kunnen beïnvloeden. Eerst wordt gekeken of het verlies aan arbeidskrachten door migratie een negatieve invloed heeft op de adoptie van arbeidsintensievere landbouwtechnieken en de omvang van akkers. Vervolgens wordt onderzocht of het geld dat door migranten wordt overgemaakt van invloed is op de adoptie van kapitaalintensievere landbouwtechnieken. Ten slotte wordt nagegaan of teruggekeerde migranten op een andere manier landbouw bedrijven dan mensen die nooit voor langere tijd weg geweest zijn. Het blijkt dat migratiefactoren op huishoudniveau slechts in beperkte mate invloed hebben op landbouwmethoden. Het verlies aan arbeidskrachten door migratie blijkt geen invloed uit te oefenen op de adoptie van arbeidsintensievere methoden. Wel blijkt dat de migratie van een broer – met wie land gedeeld moet worden – een positieve invloed heeft op de akkergrootte terwijl de migratie van een zoon een negatieve invloed heeft. De geldovermakingen van migranten worden zelden gebruikt om te investeren in de landbouw; daarvoor zijn ze niet omvangrijk genoeg. Ze worden hoofdzakelijk aangewend voor directe overlevingsdoeleinden, bijvoorbeeld om voedsel te kopen. Bovendien zijn de marktsituatie en de beleidsomgeving niet erg aantrekkelijk voor investeringen in de landbouw. Het potentieel positieve effect van terugkeer van migranten wordt ook niet gerealiseerd omdat de meeste teruggekeerde migranten niet het soort vaardigheden heeft opgedaan of genoeg middelen heeft verzameld om een verschil te maken.
In de afgelopen jaren – na afname van de de enquête – zijn de voedselprijzen sterk gestegen en zijn er in Nandom diverse internationale NGOs actief geworden die boeren ondersteunen. Bovendien wordt verwacht dat Nandom binnenkort via een
250
asfaltweg verbonden zal worden met de regiohoofdstad Wa en met het Zuiden van Ghana. Dit zou tot gevolg moeten hebben dat landbouwinputs goedkoper worden en boeren een betere prijs voor hun gewassen krijgen. Als deze veranderingen doorzetten is het waarschijnlijker dat de transitie naar intensiever landgebruik versneld wordt en dat migratie en geldovermakingen daaraan een bijdrage zouden kunnen leveren. De relatie tussen migratie en agrarische ontwikkeling is niet alleen afhankelijk van bevolkingsdichtheid, maar ook van de beleidsomgeving en marktomstandigheden.
Hoofdstuk acht (conclusies) reflecteert op de thema’s van de specifieke hoofdstukken en brengt de bevindingen op het gebied van migratie, milieu en ontwikkeling in kaart. Dit gebeurt in het licht van de drie wetenschappelijke debatten die ten grondslag liggen aan de onderzoeksvraag. Eerst worden de oorzaken van migratie behandeld en daarna de gevolgen. De algemene conclusie van dit onderzoek met betrekking tot de oorzaken van Dagara migratie naar Zuid-Ghana is dat milieufactoren een belangrijke rol spelen, maar dat er sprake is van een complex samenspel met politieke, economische, sociale en culturele factoren. Verder blijkt dat de belangrijkste oorzaak van migratie niet milieudegratie of klimaatverandering is. De dagara migreren vooral naar het zuiden als gevolg van de structurele verschillen tussen herkomst- en vestigingsgebied in de mogelijkheid om als boer een bestaan op te bouwen en voedselzekerheid voor het gezin te bereiken. Het onderzoek naar de milieugevolgen van Dagara migratie in het vestigingsgebied trekt de negatieve bevindingen van eerdere studies in twijfel. Milieudegradatie in dit gebied wordt erger voorgesteld dan het is en migranten worden onterecht aangewezen als de schuldigen. Met betrekking tot de gevolgen van migratie in het herkomstgebied kan gesteld worden dat het op de korte termijn een belangrijke bijdrage levert aan bestaans- en voedselzekerheid. Op de langere termijn houdt migratie echter een transitie naar duurzamer landgebruik en hogere bestaanszekerheid tegen.
251
About the author
Kees van der Geest is a human geographer and an – untrained – documentary film maker specialised in rural livelihood dynamics. He was born in Joure (Friesland, the Netherlands) on June 23, 1975. As a child he lived in Cameroon for one year, where his father carried out anthropological fieldwork. Before he was born, his parents had lived in Ghana for over three years, his mother as a nurse and his father as a seminarian and as a sociology student at the University of Legon, Accra. After finishing his secondary school education in Leiden in 1993 he took a gap year in Spain to learn Spanish. Upon return he decided to study human geography at the University of Amsterdam. Two years later, at the point where he had to choose a specialisation, he took a two-year break from his studies to explore Latin America. He worked as a volunteer in a national park and as an interpreter for a documentary film about the death of Ernesto Che Guevara in Bolivia. Back in the Netherlands he continued his studies specialising in the environmental geography of developing countries. Between October 1999 and September 2000 he carried out fieldwork in Northern Ghana as part of a larger research project about the Impact of Climate Change on Drylands (ICCD). This resulted in a Master’s thesis entitled We’re
managing! Climate change and livelihood vulnerability in Northwest Ghana, (published by the African Studies Centre in 2004). Upon completion of his Master’s thesis in 2002 he was appointed PhD researcher at the Amsterdam institute of Metropolitan and International Development Studies (AMIDSt). The first three months of his PhD were spent at the University of Sussex (Brighton, U.K.) where he followed a course on migration theory. In the spring of 2003, he followed the PhD training programme of the Dutch inter-university research school for development studies (CERES). As part of the PhD project he spent a total of 23 months in Ghana, spread over three periods. In September 2006 he joined the teaching staff of the department of Geography, Planning and International Development Studies of the University of Amsterdam. During four academic years he taught several courses, including Human Geography of Developing Countries, Environment and Sustainable Development and Introduction to Development Studies. He also supervised seven Master’s students who all carried out fieldwork in Ghana. In December 2006 he made his first, award-winning, short documentary Shit and
Chicks, about a poultry farmer in Northwest Ghana, which premiered at the
252
International Documentary Festival Amsterdam (IDFA). In the two subsequent years his film was screened at over twenty film festivals worldwide. Late 2008 he joined his girlfriend Eva in Granada (Spain) and in 2009 they became the proud parents of a son. Kees is presently part-time employed by the University of Amsterdam as a researcher in the Participatory Assessment of Development research project (http://www.padev.nl). He also has a small company, called Mudcastle Productions, that specialises in documentary film making and research consultancies. Among his first clients have been the Food and Agriculture Organization of the United Nations (FAO), the Royal Tropical Institute (KIT) in Amsterdam and an EU-funded research project on environmental migration. Kees van der Geest can be contacted at [email protected] or through his website http://www.keesvandergeest.nl.