Embed Size (px)
Citation preview
THE CONSUMPTION OF DAIRY AND DAIRY ALTERNATIVES AND THE
PERCEPTION OF DAIRY IN COLLEGE STUDENTS
A thesis submitted to the
Kent State University College
of Education, Health, and Human Services
in partial fulfillment of the requirements
for the degree of Master of Science
By
Melissa R. Gresser
May 2015

ii
© Copyright, 2015 by Melissa R. Gresser
All Rights Reserved
iii
Thesis written by
Melissa R. Gresser
B.S., Bowling Green State University, 2013
M.S. Kent State University, 2015
Approved by
_________________________, Director, Master’s Thesis Committee
Natalie Caine-Bish
_________________________, Member, Master’s Thesis Committee
Tanya Falcone
_________________________, Member, Master’s Thesis Committee
Eun-Jeong Ha
Accepted by
_________________________, Director, School of Health Sciences
Lynne E. Rowan
_________________________, Dean, College of Education, Health and Human Services
Daniel F. Mahony
GRESSER, MELISSA, M.S., May 2015 Health Sciences
THE CONSUMPTION OF DAIRY AND DAIRY ALTERNATIVES AND THE
PERCEPTION OF DAIRY IN COLLEGE STUDENTS (103 pp.)
Director of Thesis: Natalie Caine-Bish, P.H.D., R.D., L.D.
The purpose of this study was to determine the consumption of dairy and dairy
alternatives and the perceptions of dairy in college students enrolled at a Northeast Ohio
state university. It was expected that dairy and dairy alternative consumption would be
greater in males, students living off campus, and graduate students. It was also expected
that there would be a difference in the perceptions of dairy between groups. An online
questionnaire was completed by students enrolled in courses at Kent State University
participants (n=247). Descriptive statistics were used to describe demographics,
consumption of dairy and dairy alternatives, and perceptions of dairy. T-tests were used
to analyze differences in the consumption of dairy and dairy alternatives and the
perceptions of dairy between gender, living situation, and academic status groups. A p-
value of 0.05 was selected a priori for statistical significance. There were no significant
differences in consumption of dairy and dairy alternatives in gender, living situation, and
academic status groups. There were some perceptions that were significantly different in
gender and living situation groups; however, there were no significant differences in
perceptions in academic status groups. This study demonstrated that college students are
consuming dairy, but not enough to meet the Dietary Guidelines for Americans 2010.
Dairy alternatives are not replacing dairy in college students as demonstrated by this
study. Gender is the most influential factor in the perceptions and misconceptions of
dairy, especially in females.
iv
ACKNOWLEDGEMENTS
First, I would like to thank my advisor Dr. Natalie Caine-Bish for spending so
much time with me on my research journey. I appreciate all the advice, support, and
encouragement that she provided to me throughout my education at Kent State University
and throughout my research. I also appreciate her confidence in me; she believed in me
when I did not believe in myself during my research.
I would also like to thank my committee members, Tanya Falcone and Dr. Eun-
Jeong Ha, for taking time out of their busy schedules to review my work and provide
feedback for the development of a stronger thesis. I appreciate all of the advice and
encouragement that they provided to me throughout my research and education while at
Kent State University.
Institutional Research at Kent State University, particularly Valerie Samuel, was
integral in helping me obtain a random sample of Kent State University students to
complete my research. I appreciate the time that you spent helping me obtain the
parameters of subjects that were needed for my research.
I would also like to express my gratitude to Edward Bolden at the Research and
Evaluation Bureau for analyzing my data and helping me interpret the results. I also
appreciate your patience as I asked for changes in some of the data.
I would also like to extend my appreciation to the Kent State University students
that volunteered their time to complete my survey. I truly appreciate the fact that you
helped me out, as a fellow student, on my research journey.
v
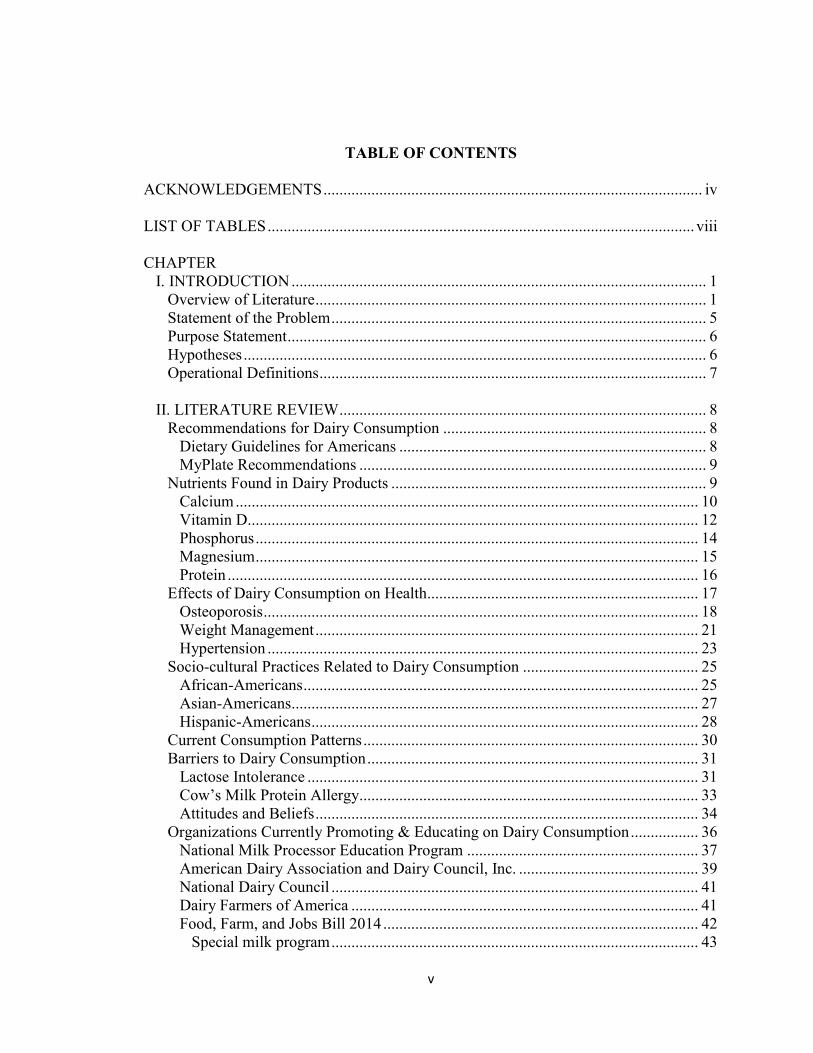
TABLE OF CONTENTS
ACKNOWLEDGEMENTS ............................................................................................... iv
LIST OF TABLES ........................................................................................................... viii
CHAPTER
I. INTRODUCTION ........................................................................................................ 1
Overview of Literature .................................................................................................. 1
Statement of the Problem .............................................................................................. 5
Purpose Statement ......................................................................................................... 6
Hypotheses .................................................................................................................... 6
Operational Definitions ................................................................................................. 7
II. LITERATURE REVIEW ............................................................................................ 8
Recommendations for Dairy Consumption .................................................................. 8
Dietary Guidelines for Americans ............................................................................. 8
MyPlate Recommendations ....................................................................................... 9
Nutrients Found in Dairy Products ............................................................................... 9
Calcium .................................................................................................................... 10
Vitamin D................................................................................................................. 12
Phosphorus ............................................................................................................... 14
Magnesium ............................................................................................................... 15
Protein ...................................................................................................................... 16
Effects of Dairy Consumption on Health.................................................................... 17
Osteoporosis ............................................................................................................. 18
Weight Management ................................................................................................ 21
Hypertension ............................................................................................................ 23
Socio-cultural Practices Related to Dairy Consumption ............................................ 25
African-Americans ................................................................................................... 25
Asian-Americans...................................................................................................... 27
Hispanic-Americans ................................................................................................. 28
Current Consumption Patterns .................................................................................... 30
Barriers to Dairy Consumption ................................................................................... 31
Lactose Intolerance .................................................................................................. 31
Cow’s Milk Protein Allergy..................................................................................... 33
Attitudes and Beliefs ................................................................................................ 34
Organizations Currently Promoting & Educating on Dairy Consumption ................. 36
National Milk Processor Education Program .......................................................... 37
American Dairy Association and Dairy Council, Inc. ............................................. 39
National Dairy Council ............................................................................................ 41
Dairy Farmers of America ....................................................................................... 41
Food, Farm, and Jobs Bill 2014 ............................................................................... 42
Special milk program ............................................................................................ 43
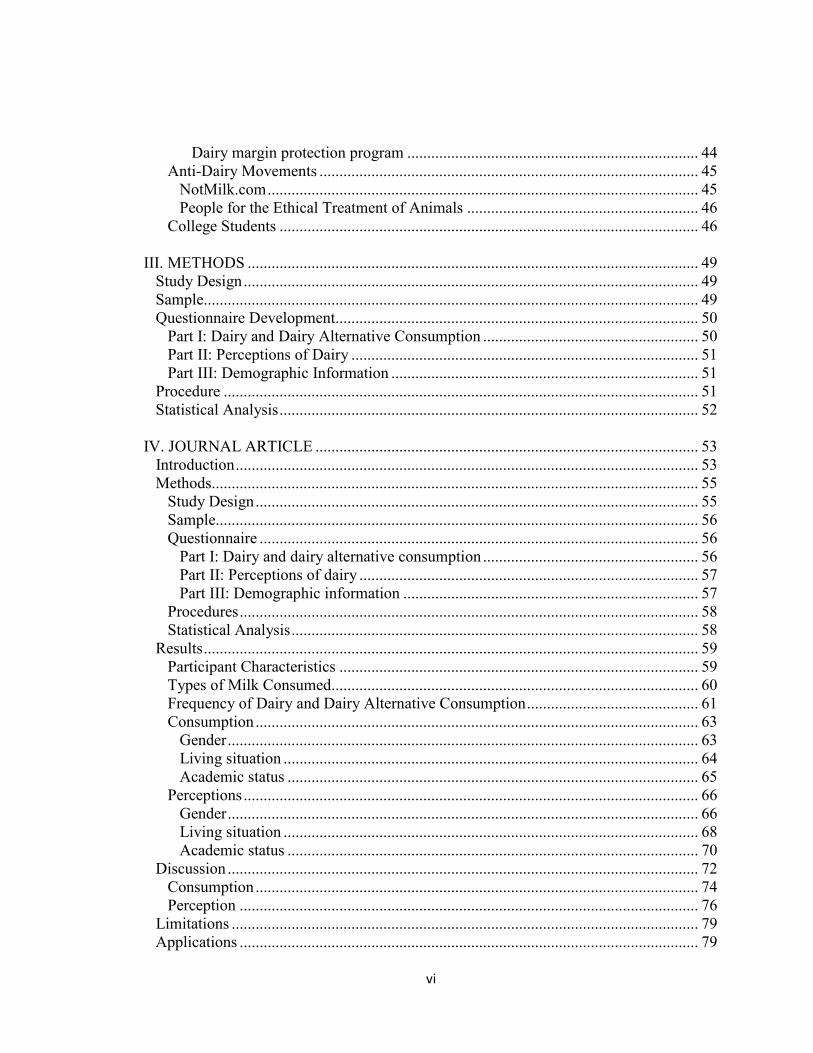
vi
Dairy margin protection program ......................................................................... 44
Anti-Dairy Movements ............................................................................................... 45
NotMilk.com ............................................................................................................ 45
People for the Ethical Treatment of Animals .......................................................... 46
College Students ......................................................................................................... 46
III. METHODS ................................................................................................................. 49
Study Design .................................................................................................................. 49
Sample............................................................................................................................ 49
Questionnaire Development........................................................................................... 50
Part I: Dairy and Dairy Alternative Consumption ...................................................... 50
Part II: Perceptions of Dairy ....................................................................................... 51
Part III: Demographic Information ............................................................................. 51
Procedure ....................................................................................................................... 51
Statistical Analysis ......................................................................................................... 52
IV. JOURNAL ARTICLE ................................................................................................ 53
Introduction .................................................................................................................... 53
Methods.......................................................................................................................... 55
Study Design ............................................................................................................... 55
Sample......................................................................................................................... 56
Questionnaire .............................................................................................................. 56
Part I: Dairy and dairy alternative consumption ...................................................... 56
Part II: Perceptions of dairy ..................................................................................... 57
Part III: Demographic information .......................................................................... 57
Procedures ................................................................................................................... 58
Statistical Analysis ...................................................................................................... 58
Results ............................................................................................................................ 59
Participant Characteristics .......................................................................................... 59
Types of Milk Consumed............................................................................................ 60
Frequency of Dairy and Dairy Alternative Consumption ........................................... 61
Consumption ............................................................................................................... 63
Gender ...................................................................................................................... 63
Living situation ........................................................................................................ 64
Academic status ....................................................................................................... 65
Perceptions .................................................................................................................. 66
Gender ...................................................................................................................... 66
Living situation ........................................................................................................ 68
Academic status ....................................................................................................... 70
Discussion ...................................................................................................................... 72
Consumption ............................................................................................................... 74
Perception ................................................................................................................... 76
Limitations ..................................................................................................................... 79
Applications ................................................................................................................... 79
vii
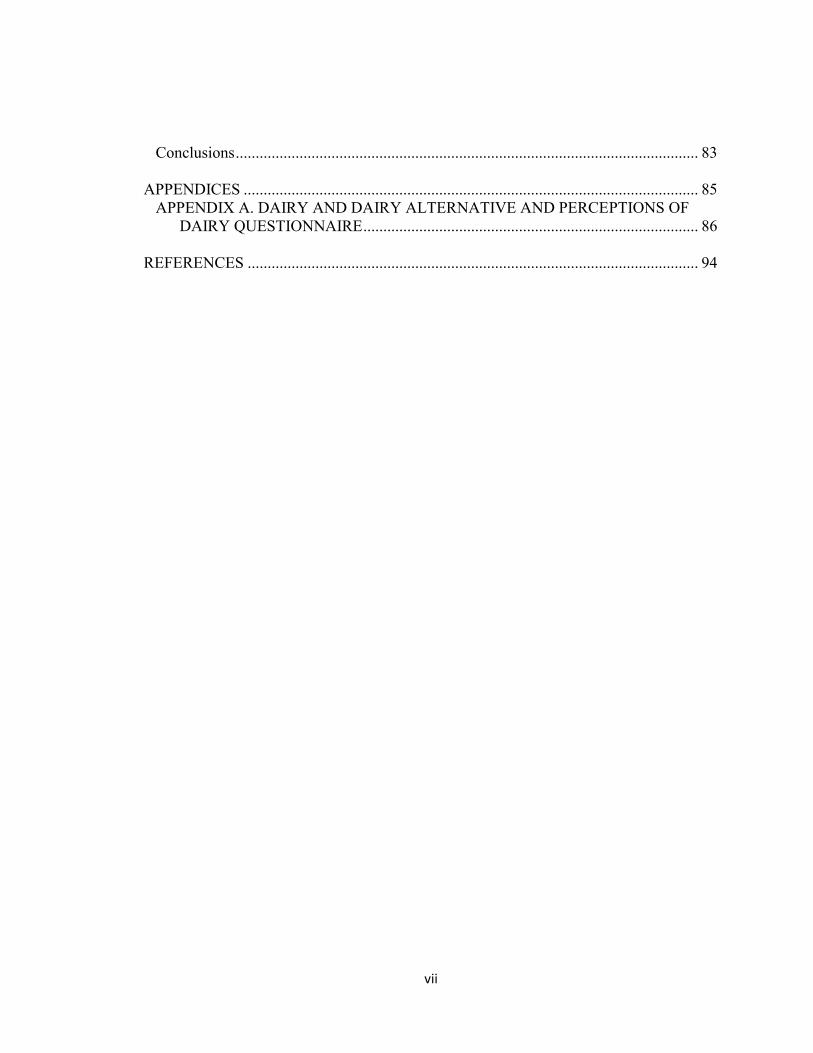
Conclusions .................................................................................................................... 83
APPENDICES .................................................................................................................. 85
APPENDIX A. DAIRY AND DAIRY ALTERNATIVE AND PERCEPTIONS OF
DAIRY QUESTIONNAIRE .................................................................................... 86
REFERENCES ................................................................................................................. 94
viii
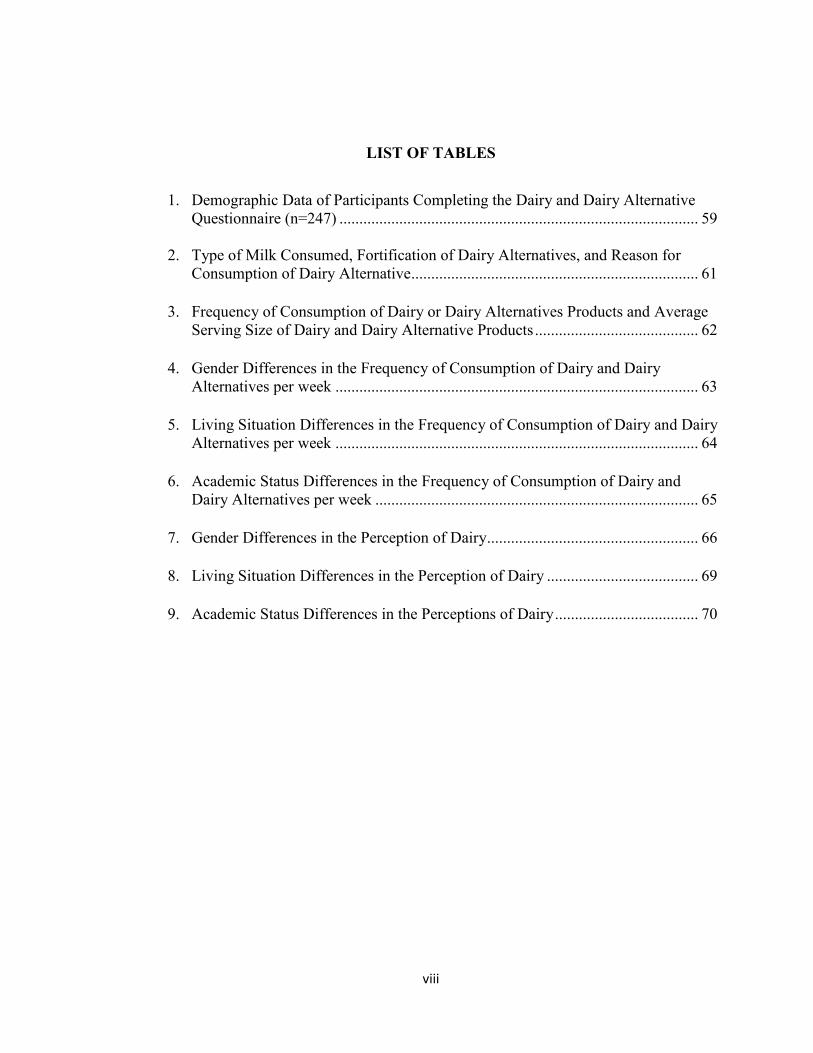
LIST OF TABLES
1. Demographic Data of Participants Completing the Dairy and Dairy Alternative
Questionnaire (n=247) .......................................................................................... 59
2. Type of Milk Consumed, Fortification of Dairy Alternatives, and Reason for
Consumption of Dairy Alternative........................................................................ 61
3. Frequency of Consumption of Dairy or Dairy Alternatives Products and Average
Serving Size of Dairy and Dairy Alternative Products ......................................... 62
4. Gender Differences in the Frequency of Consumption of Dairy and Dairy
Alternatives per week ........................................................................................... 63
5. Living Situation Differences in the Frequency of Consumption of Dairy and Dairy
Alternatives per week ........................................................................................... 64
6. Academic Status Differences in the Frequency of Consumption of Dairy and
Dairy Alternatives per week ................................................................................. 65
7. Gender Differences in the Perception of Dairy ..................................................... 66
8. Living Situation Differences in the Perception of Dairy ...................................... 69
9. Academic Status Differences in the Perceptions of Dairy .................................... 70
1
CHAPTER I
INTRODUCTION
Overview of Literature
The Dietary Guidelines for Americans 2010 recommends milk and milk products,
including fortified soy beverages, as part of a healthy eating pattern. Milk and milk
products are included in a category of foods and nutrients to increase as per the Dietary
Guidelines for Americans 2010 (United States Department of Agriculture (USDA), 2010;
United States Department of Health and Human Services (USDHHS), 2010). MyPlate
encourages the United States to consider building a healthy plate at meal times, including
dairy. The recommendation of dairy consumption per day is founded on age (USDA,
n.d.).
Milk and dairy foods contribute significant quantities of nutrients of concern as
outlined in the Dietary Guidelines for Americans 2010 (Huth, Fulgoni, DiRienzo, &
Miller, 2008). Some of these nutrients of concern provided by milk and dairy foods
include calcium, vitamin D, phosphorus, magnesium, and protein. Calcium is a major
mineral constitute of milk and dairy products; calcium is essential in skeletal health,
muscle contraction, and nerve transmission (Heaney, 2009). When fortified with vitamin
D, milk and dairy products are a good source of vitamin D. Vitamin D’s active form,
calcitriol, is an active hormone in the regulation of calcium and phosphorus metabolism
in regards to bone mineralization (Schmid & Walther, 2013).
2
Due to the nutrient composition of milk and dairy products, there are potential
health benefits for nutrition related diseases, including osteoporosis, weight management,
and hypertension. Observational studies and controlled trials have shown a significantly
positive association between milk and dairy products consumption, bone turnover
markers, and bone mineral density (Rizzoli, 2014). A meta-analysis study concluded that
energy restricted, dairy based diets resulted in improved weight loss, increased fat loss,
and an increase in lean body mass (Sanders, 2012). Other researchers have shown a
significant inverse relationship between the low-fat dairy intake and elevated blood
pressure with no benefit from high-fat dairy (Ralston, Lee, Truby, Palermo, & Walker,
2012).
National survey data from the National Health and Nutrition Examination Survey
(NHANES) 2007-2010 revealed Americans drink an average of 1.77 cups of total dairy
per day (USDA Economic Research, 2014b). Specifically children ages two to 19 years
consumed an average of 2.16 cups of dairy per day and adults age 20 years and older
consumed an average of 1.64 cups of dairy per day (USDA Economic Research, 2014b).
NHANES 2001-2002 indicated that 39% of men and 43% of women between 20 and 29
years of age consume less than one daily serving of milk or dairy foods per day (Larson,
Neumark-Sztainer, Harnack, Wall, Story, & Eisenberg, 2009). Consumption patterns
show milk and dairy intake is below the recommended three cups of fat-free or low-fat
milk and dairy foods per day for adults and children and adolescents aged nine to 18
years of age (USDA, 2010; USDHHS, 2010).
3
There are social and cultural aspects in regards to the consumption and perception
of milk and dairy products. Lactose intolerance is estimated to occur in approximately
80% of non-Hispanic African-Americans; those whom reported being lactose intolerant
were less likely to consume milk and dairy foods (Keith, Nicholls, Reed, Kafer, & Miller,
2011). Asian-Americans have the highest risk for osteoporosis, yet Asian-American
dietary practices limit calcium intake from dairy possibly due to the interaction of
traditional cultural food practices and food availability; lactose intolerance is also
observed in up to 100% of Asians (Jackson & Savaiano, 2001). Lactose intolerance is
estimated to occur in approximately 50% of Mexican-Americans; cultural determined
food preferences and dietary practices also play a role in the low consumption of dairy
among Hispanic Americans (Jarvis & Miller, 2002).
There are several barriers to dairy consumption which prevent some individuals
from consuming dairy products. One of them is lactose intolerance, for which the
traditional treatment is to avoid milk and milk-containing products (Suchy, Brannon,
Carpenter, Fernandez, Gilsanz, Gould, & Wolf, 2010). Another barrier to dairy
consumption is cow’s milk protein allergy; the only treatment is to avoid cow’s milk and
cow’s milk products (De Koker, Shah, & Meyer, 2014). Attitudes and beliefs are another
barrier of dairy consumption, which includes more appealing food and beverage options
than dairy, poor accessibility on campus, and unnecessary calories and fat (Mahon &
Haas, 2013).
Another reason for not consuming dairy include anti-dairy organizations
including NotMilk.com and People for the Ethical Treatment of Animals, both of which
4
promote against dairy consumption (NotMilk.com, n.d.; People for the Ethical Treatment
of Animals (PETA), n.d.). There are also organizations that promote and educate on
dairy consumption in the diet. A few of these organizations include the National Milk
Processor Education Program, American Dairy Association and Council, Inc., National
Dairy Council, and Dairy Farmers of America. For example, the National Milk Processor
Education Program (MilkPEP) is committed to increasing the fluid milk consumption in
the United States (Milk Processor Education Program (MilkPEP),2014b). The Food,
Farm, and Jobs Bill 2014 provides the Special Milk Program and the Dairy Protection
Program, which help in the production and consumption of dairy (USDA Food and
Nutrition Service, 2014; USDA Farm Service Agency, 2014).
College attendance is a period characterized by change whereby students explore
new environments and adopt new behaviors; one of these behaviors being dietary choices
and habits (Poddar, Hosig, Anderson-Bill, Nickols-Richardson, & Duncan, 2012). Peak
bone mass is achieved through the third decade of life, therefore adequate calcium intake
along with other essential nutrients found in milk and dairy products are important during
young adulthood. National survey data indicate 53% young men and 21% of young
women between 19 and 30 years of age consume the recommended calcium in the United
States (Larson, Neumark-Sztainer, Harnack, Wall, Story, & Eisenberg, 2009). Other data
indicates 39% of men and 43% of women between the ages of 20 to 29 years consume
less than one daily serving of milk or dairy products (Cook & Friday, 2005).
5
Statement of the Problem
The Dietary Guidelines for Americans 2010 recommends the increased
consumption of fat-free or low-fat milk, milk products and fortified soy beverages, in
meeting foods and nutrients of concern (USDA, 2010; USDHHS, 2010). Peak bone mass
is achieved through the third decade of life, therefore adequate calcium intake and other
essential nutrients found in milk and dairy products are essential during young adulthood.
College attendance is typically during young adulthood; this period is characterized by
the exploration of new environments and adoption of new behaviors. One of these
behaviors is dietary choices and habits. Young adults in college tend to engage in poor
dietary habits that may put them at risk for poor nutritional status (Poddar, Hosig,
Anderson-Bill, Nickols-Richardson, & Duncan, 2012).
There are also misconceptions regarding dairy alternatives; one of them being
dairy alternatives are an equal substitution of nutrients found in milk and dairy products.
There is also not much known regarding the rate of consumption of dairy alternatives in a
college population and whether the dairy alternative is fortified. It is also unknown as to
the reason why dairy alternatives are being consumed in place of milk and dairy products
in the college population.
One dietary habit of concern for young adults in college is the low intake of milk
and dairy products. Data indicates that 39% of men and 43% of women between 20 and
29 years consume less than one daily serving of milk and dairy products (Cook & Friday,
2005). Mahon & Haas (2013) found college females indicated a lack of knowledge about
6
milk and dairy products in their daily diets, other foods or beverage options are more
appealing than milk and dairy products, poor access on campus, limited variety of milk
and dairy products on campus, unnecessary calories and fat, and side effects as barriers of
the consumption of milk and dairy products. There is little other literature as to the
perceptions of milk and dairy products in a representative college population.
Identifying the college population’s perceptions towards milk and dairy products
could be effective in the education of making milk and dairy products part of a healthy
diet by rectifying any misconceptions. Understanding the rate of dairy alternative
consumption in college students can be helpful in the education of choosing fortified
dairy alternatives in order to help meet nutrients of concern as outlined in the Dietary
Guidelines for Americans 2010. Ascertaining the consumption patterns of milk and dairy
products in the college population will be useful in exploring other food alternatives in
helping to meet nutrients of concern as defined in the Dietary Guidelines for Americans.
Purpose Statement
The purpose of this thesis is to determine the consumption of dairy and dairy
alternatives and perceptions of dairy in male and female students enrolled at a Northeast
Ohio state university.
Hypotheses
H1 = The consumption of dairy and dairy alternatives is greater in male students than
female students.
7
H2 = The consumption of dairy and dairy alternatives is greater in students living off-
campus than students living on-campus.
H3 = The consumption of dairy and dairy alternatives is greater in graduate students than
undergraduate students.
H4 = There is a difference in the perceptions of dairy between gender groups, living
situation groups, and academic status groups.
Operational Definitions
Undergraduate Student – an individual enrolled for courses at Kent State
University in the pursuit of obtaining a bachelor’s degree.
Graduate Student – an individual enrolled for courses at Kent State University in
the pursuit of obtaining a master’s degree or a doctoral degree.
Dairy Alternative – plant-based beverages and plant-based foods made with soy,
coconut, rice, or almonds and fortified with calcium.
Perceptions – thoughts and feelings, both positive and negative, regarding dairy.
8
CHAPTER II
LITERATURE REVIEW
Recommendations for Dairy Consumption
Dietary Guidelines for Americans
The Dietary Guidelines for Americans 2010 are based on the most recent
scientific evidence review for providing information and advice for choosing a healthy
eating pattern. Milk and milk products fall under the category of foods and nutrients to
increase in the Dietary Guidelines for Americans, 2010. The recommended intake
amounts of milk and milk products, including fortified soy beverages, is three cups per
day of fat-free or low-fat milk and milk products for adults and children and adolescents
ages nine to 18 years. Two and half cups per day for children ages four to eight years and
two cups per day for children ages two to three years (United States Department of
Agriculture (USDA), 2010; United States Department of Health and Human Services
(USDHHS), 2010).
The Dietary Guidelines for Americans, 2010 recommends choosing fat-free or
low-fat milk and milk products, which provide the same nutrients with less solid fat and
therefore less calories. Soy beverages fortified with calcium and vitamins A and D are
considered as part of the milk and milk products group due to the similarity nutritionally
and their use in meals (USDA, 2010; USDHHS, 2010).
9
MyPlate Recommendations
MyPlate promotes the United States to think about building a healthy plate at
meal times. The amount of dairy per day recommendations are based on age.
Individuals 19 years or older are recommended to consume three cups of dairy per day.
Children and adolescents from the ages of nine to 18 years are recommended to consume
three cups of dairy per day. Children from the ages of two to three years are
recommended to consume two cups of dairy per day while children of ages four to eight
years old are recommended to consume two and a half cups of dairy per day (USDA,
n.d.).
Foods that are a part of the dairy group include all fluid milk, milk-based desserts,
calcium-fortified soymilk, cheese, and yogurt. Fluid milk includes fat-free milk, low-fat
or 1% milk, reduced fat or 2% milk, whole milk, flavored milks, lactose-reduced milks,
and lactose-free milks. Milk-based desserts include puddings, ice milk, frozen yogurt,
and ice cream. Cheeses include cheddar, mozzarella, Swiss, Parmesan, ricotta, cottage
cheese, and American cheese. Yogurts include fat-free, low fat, reduced fat, and whole
milk yogurts (USDA, n.d.).
Nutrients Found in Dairy Products
Milk and dairy foods contribute significant amounts of the nutrients of concerns
for adults and children in the Dietary Guidelines for Americans (Huth, Fulgoni,
DiRienzo, & Miller, 2008). Milk and dairy products provide the macronutrients of
carbohydrates, proteins, and lipids, as well as micronutrients, including vitamins and
10
minerals. Minerals found in milk and dairy products include calcium, magnesium,
sodium, potassium, phosphorus, chloride, iron, copper, zinc, and selenium (Gaucheron,
2011; Pereira, 2014). Vitamins found in milk and dairy products include fat soluble
vitamins A, D, E, and K and the water soluble vitamins thiamin (B1), riboflavin (B2),
niacin (B3), pantothenic acid (B5), pyridoxal (B6), biotin (B8), folate (B9), cobalamine
(B12), and vitamin C (Gaucheron, 2011; Pereira, 2014).
Calcium
Calcium is one of the major minerals present in milk and dairy products. The
primary role of calcium in the body is structural, providing the rigidity necessary for the
skeleton and teeth to function mechanically; bone contains 99% of the body’s calcium
(Heaney, 2009). Calcium in body fluids also exerts critical metabolic functions, binding
to proteins and operating as a signal transmitter and protein activator within cells; muscle
contraction and nerve transmission are two of the many functions that rely on calcium for
activation (Heaney, 2009). Calcium is also involved in blood clotting (Heaney, 2009).
Milk and dairy products may represent the best dietary sources of calcium
because of the high content, high absorptive rate, and relatively low cost (Rizzoli, 2014).
In milk, the concentration of calcium is about 1200 mg/L and 99% of calcium is found in
the skim milk, where it is distributed between the micellar and aqueous phase
(Gaucheron, 2011; Pereira, 2014). In the micellar phase, calcium is associated with the
phosphoseryl residues of caseins while in the aqueous phase, calcium can bind to whey
proteins, citrate, or inorganic forms of phosphate-forming salts (Gaucheron, 2011;
11
Pereira, 2014). Calcium content of milk and dairy products depends on calcium location
and calcium’s form in milk and dairy products (Gaucheron, 2011).
Calcium in milk and dairy products are considered to have a higher bioavailability
than that of cereals and vegetables, and is similar to calcium carbonate, which is readily
absorbed. The typical fractional absorption of calcium from milk and dairy products is in
the region of 30% compared to 5% from spinach. The high bioavailability of calcium
from milk and dairy products may be due to the absence of factors that inhibit calcium
absorption (e.g. caffeine and alcohol) and a number of constituents of milk and dairy
products (e.g. lactose and protein) have been proposed to contribute positively to the high
bioavailability (Theobald, 2005). A study found that when milk was fortified with
vitamin D2, the absorption of calcium was increased (Kaushik, Sachdeva, Arora, Kapila,
& Wadhwa, 2014). In the same study, the retention of calcium in the control group, milk,
was 60.71% while the retention of calcium in the vitamin D2 fortified group was 64.14%
(Kaushik et al., 2014).
The Recommended Dietary Allowance (RDA) for calcium for males and females
between the ages of nine and 18 years of age is 1,300 milligrams per day (United States
Department of Agriculture (USDA) National Agriculture Library, 2014). The RDA for
males and females between the ages of 19 and 50 is 1,000 milligrams per day (USDA
National Agriculture Library, 2014). Milk and dairy products are important sources of
calcium, 600 ml of milk corresponds to 720 mg of calcium and therefore, dairy products
contribute approximately 70% of calcium to the human diet (Gaucheron, 2011). Two-
hundred fifty mg of calcium may be obtained from a 200-ml glass of milk, a 180 g
12
serving of yogurt, or 30 grams of hard cheese and the consumption of three to four dairy
servings per day would allow one to reach the Daily Recommended Intakes (DRI) of
calcium (Rizzoli, 2014). Milk and yogurt, depending on the type, typically provides
between 200 and 400 mg of calcium per cup, and cheeses generally provide 100 to 200
mg calcium per ounce (Gropper, Smith, & Groff, 2009). Milk and dairy products may
represent up to 52-65% of the DRI of calcium (Rizzoli, 2014). Milk and dairy products
provide 83% of the calcium in the diets of young children, 77% in adolescent girls’ diets,
and between 65% and 72% in adults’ diets (Fleming & Heimbach, 1994). Gaucheron
(2011) considers milk and dairy products to contribute approximately 70% of calcium to
the human diet.
Vitamin D
Milk and dairy products are an important source of vitamin D. Vitamin D refers
to ergocalciferol (vitamin D2) and cholecalciferol (vitamin D3) which are synthesized by
plants and by animal skin under sunlight influence, respectively (Gaucheron, 2011). 7-
dehydrocholesterol is synthesized in sebaceous glands of the skin from cholesterol and is
secreted onto the skin’s surface (Gropper, Smith, & Groff, 2009). Ultraviolet light
penetrates into the epidermis and dermis, thermally activating 7-dehydrocholesterol to
cholecalciferol. Cholecalciferol goes into the blood and is circulated in the body; in the
liver, cholecalciferol is hydroxylated to 25-hydroxycholecalciferol. 25-
hydroxycholecalciferol is transported in the blood to the kidney, and is hydroxylated to
1,25-dihydroxycalciferol, which is the activated form of vitamin D (Gropper, Smith, &
Groff, 2009). Once activated, vitamin D acts as a hormone in the regulation of calcium
13
and phosphorus metabolism with the aim of maintaining normal calcium and phosphorus
concentrations ensuring a normal mineralization of bone (Schmid & Walther, 2013).
Calcitriol, the active form of vitamin D, synthesis is stimulated in response to
blood calcium concentration changes and the release of parathyroid hormone (PTH)
(Gropper, Smith, & Groff, 2009). Low blood calcium, hypocalcemia, stimulates the
secretion of PTH from the parathyroid gland. PTH then stimulates 1-hydroxylase in the
kidney and converts 25-hydroxycalciferol into calcitriol (Gropper, Smith, & Groff, 2009).
Calcitriol then acts alone or with PTH on its target tissues of the intestine, kidney, and
bone to increase serum calcium concentrations (Gropper, Smith & Groff, 2009). Vitamin
D enhances calcium absorption by stimulating active transport in the gut, and is necessary
for adequate intestinal calcium absorption (Heaney, 2009). Vitamin D also works with
PTH to enhance renal calcium reabsorption and resorption of calcium from bone
(Heaney, 2009; Gropper, Smith & Groff, 2009).
Vitamin D levels in milk and dairy foods are variable and often insufficient to
meet body needs by dietary intake only. Studies have reported vitamin D values of milk
to be within 0.1 to 0.9 µg/L, which is in accordance with reference nutritional tables
(Pereira, 2014). The widespread strategy in countries such as Canada and the United
States has been to require vitamin D fortification of dairy products (Bonjour, Kraenzlin,
Levasseur, Warren, & Whiting, 2013). Commercially available whole milk which has
been enriched with vitamin D presents within 1 to 1.3 µg/100 g (Pereira, 2014). Vitamin
D is relatively unstable and therefore losses can be observed after exposure to light,
oxygen, heat, and acidic environments (Gaucheron, 2011).
14
The absorption of vitamin D varies between 55% and 99% and that absorption
does not decrease significantly with age. In a study of the bioavailability of calcium and
vitamin D2 in fortified milk, the digestibility of vitamin D2 was 78.25% in vitamin D2
fortified milk and 81.29% in vitamin D2 and calcium fortified milk groups. The vitamin
D2 retention was 76.96% for vitamin D2 fortified milk and 80.19% for vitamin D2 and
calcium fortified milk groups (Kaushik et al., 2014). It was concluded that the
digestibility and retention of vitamin D2 were positively affected by calcium. It was also
concluded that milk was a suitable vehicle for vitamin D2 fortification, furthermore, when
used in combination with calcium fortification, bioavailability of these nutrients was
increased, indicating a positive interaction between both nutrients (Kaushik et al., 2014).
The RDA for vitamin D for males and females between the ages of nine and 70
years of age is 15 µg per day (USDA National Agriculture Library, 2014). The
contribution of milk and dairy products to the vitamin D supply is low; for this reason,
different liquid milks are enriched with vitamin D (Gaucheron, 2011). The vitamin D
concentration of enriched milk is approximately 0.3 – 0.4 µg/100 g of milk (Gaucheron,
2011).
Phosphorus
Phosphorus is another important element present in milk and dairy products.
Phosphorus is important in bone and teeth acquisition and maintenance, blood pH, a
component of biological molecules including RNA, DNA, phospholipids, and ATP, and
in metabolism (Gaucheron, 2011). In milk, phosphorus exists in organic and inorganic
15
phosphorus and the concentration of total phosphorus is approximately 950 mg/L
(Gaucheron, 2011; Pereira, 2014). Organic phosphate is bound to organic molecules like
proteins, phospholipids, organic acids, and nucleotides, which are mainly present in the
micellar phase (Pereira, 2014). The inorganic form of phosphorus depends on the pH
value and is located in the aqueous phase (Pereira, 2014).
The RDA for phosphorus for males and females between the ages of nine and 18
years of age is 1,250 milligrams per day (USDA National Agriculture Library, 2014).
The RDA for males and females aged 19 years and older is 700 milligrams per day
(USDA National Agriculture Library, 2014). Milk and milk products contribute about
30% of daily phosphorus to the U.S. diet (Huth, Fulgoni, DiRienzo, & Miller, 2008).
Magnesium
Compared to calcium, magnesium is not abundant in milk and dairy products. Its
concentration in milk is about 120 mg/L. Magnesium is important as a cofactor of
enzymatic systems, phosphorylation, DNA transcription, protein synthesis,
neuromuscular transmission, and muscle contraction. Ninety-nine percent of magnesium
is located in skim milk and is distributed between the micellular and aqueous phase.
Magnesium is sensitive to physiochemical conditions, especially acid pH (Gaucheron,
2011).
The RDA for magnesium for males and females between the ages of nine and 13
years of age is 240 milligrams per day. The RDA for males and females between the
ages of 14 and 18 years of age are 410 milligrams per day and 360 milligrams per day
16
respectively. The RDA for males and females between the ages of 19 and 30 years of age
are 400 milligrams per day and 310 milligrams per day. The RDA for males and females
between the ages of 31 and 70 are 420 milligrams per day and 320 milligrams per day
respectively (USDA National Agriculture Library, 2014). Milk and dairy products have
variable concentrations of magnesium depending on their manufacturing process. Milk
and dairy products can be considered sources of magnesium; 600 mL of milk provides 65
mg, which corresponds to about 16% of the recommended daily allowance (Gaucheron,
2011).
Protein
Milk and dairy products are considered an important source of protein. Milk
supplies protein and the protein fraction can be divided into soluble and insoluble
proteins. Soluble proteins, whey proteins, represent 20% of the milk protein fraction and
insoluble proteins, caseins, represent 80%. Both soluble and insoluble proteins are
classified as high-quality proteins considering amino acid composition, digestibility, and
bioavailability (Pereira, 2014).
Milk proteins are frequently considered the best protein source taking into
account the essential amino acid score. Whey protein is rich in branched chain amino
acids, including leucine, isoleucine, valine, and lysine and casein is rich in histidine,
methionine, and phenylalanine. Milk proteins and several bioactive peptides resulting
from their enzymatic hydrolysis have shown multiple biological roles that could have a
protective action on human health. The main biological actions include antibacterial,
17
antiviral, antifungal, antioxidant, antihypertensive, antimicrobial, antithrombotic, opiod,
and immunomodulatory roles (Pereira, 2014). Protein plays an important role in the bone
matrix and bone growth. Protein in bone is used to provide a framework for the
hydroxyapatite crystals can form, which helps provide flexibility and increased resistance
to tension (Gropper, Smith, & Groff, 2009).
The requirement for protein in well-nourished adolescents and adults is within the
normal range of 0.8 – 1.5 g/kg body weight/day (Rizzoli, 2014). Milk provides
approximately 32 g/L of protein (Pereira, 2014). One cup of milk can provide eight to 10
grams of protein, 1.5 ounces of cheese can provide nine to 11 grams of protein, a half cup
of cottage cheese can provide 13 grams of protein, six ounces of Greek-style yogurt can
provide 14 to 18 grams of protein, and traditional yogurt can provide five to seven grams
of protein (Gropper, Smith, & Groff, 2009). The consumption of three to four servings of
dairy products may represent up to 20-28% of the protein requirement per day in the U.S.
diet (Rizzoli, 2014).
Effects of Dairy Consumption on Health
There is a vast amount of literature regarding the associations between dairy
intake and a wide range of health outcomes. Though the literature is mixed, the general
consensus is that the consumption of dairy products has many benefits. A few of these
health outcomes include osteoporosis, weight management, and hypertension.
18
Osteoporosis
Osteoporosis is a serious health problem in the United States and causes
significant morbidity and mortality. Osteoporosis is a condition characterized by low
bone mass and bone microarchitechtual deterioration, leading to skeletal fragility and
increased risk of fracture (Heaney, 2009). Osteoporosis is a pediatric disease with a
geriatric outcome (Gropper, Smith, & Groff, 2009). In children and adolescents, skeletal
turnover occurs such that formation of bone exceeds resorption of bone and up to 90
percent of peak bone mass is acquired by 18 years old. Skeletal turnover continues into
adulthood with peak bone mass occurring in early adulthood, around age 30. During the
fifth decade, bone mass begins to decline (Gropper, Smith, & Groff, 2009). The nutrients
that have the greatest physiological impact on bone and skeletal muscle throughout life
are calcium, vitamin D, phosphate, and protein; dairy foods contain these nutrients in
appreciable amounts compared to their recommended allowances (Bonjour, Kraenzlin,
Levasseur, Warren, & Whiting, 2013). If failed to have good nutrition of these nutrients
during peak bone mass, bone mineral density decreases during next phase of life, which
can lead to risk of osteoporosis.
Osteoporosis is a systemic skeletal disease characterized by the deterioration of
the microarchitecture of bone tissue and low bone density. Bone turnover occurs
throughout life, but after about age 30 to 35 years bone resportion exceeds bone
formation (Gropper, Smith, & Groff, 2009). Osteoporosis affects both cortical and
trabecular bone, although trabecular bone is affected to a greater extent. Sites containing
trabecular bone include the vertebral bodies, the femoral neck in the pelvis, and the
19
radius, which are the principal sites affected in osteoporosis. The symptoms of
osteoporosis include dowager’s hump (kyphosis or hunchback-type curvature of the
spine), increased fractures, and loosening of teeth due to the loss of calcium from the
mandible (Gropper, Smith, & Groff, 2009).
There are two main types of osteoporosis. Primary or hormonal osteoporosis is
characterized by demineralization of mostly trabecular bone and occurs primarily in
postmenopausal women about 50 to 65 years of age (Gropper, Smith, & Groff, 2009).
Age-related or senile osteoporosis is characterized by demineralization of both cortical
and trabecular bone and occurs in both men and women over approximately 70 to 75
years of age. There are also two categories of risk factors: unmodifiable and modifiable.
Unmodifiable risk factors include being a female, having a small body frame size, being
Caucasian, Asian, or Hispanic, having a family history of osteoporosis, age, and
menopause (lose of estrogen, which has positive effects on bone formation). Modifiable
risk factors include low calcium and vitamin D intake, low physical activity (weight-
bearing exercises have a protective effect on bone), smoking, some medications, diets
high in sodium, protein, and caffeine, and excessive alcohol and soda consumption
(Gropper, Smith, & Groff, 2009).
Asian-Americans and Caucasians possess some of the same risk factors associated
with increased fracture rates and therefore have the highest risk of osteoporosis.
Approximately 20% of non-Hispanic whites and Asian women ages 50 years and older
have osteoporosis, compared with 5% to 10% of non-Hispanic African-American women
and 10% to 15% of Hispanic women of the same age (Thomas, 2007). It is estimated that
20
an additional 50% to 65% of non-Hispanic white and Asian women have osteopenia,
compared to 35% to 38% of black women and 49% of Hispanic women (Thomas, 2007).
Observational studies and controlled trials show a significantly positive
association between dairy food intake, bone turnover markers, and bone mineral content
(BMC) or bone mineral density (BMD) (Rizzoli, 2014). The application of an
intervention approach combining nutrition, education, and consumption of fortified dairy
products for 12 months showed more favorable changes in biochemical indexes of bone
metabolism than calcium supplementation alone among postmenopausal women
(Manios, Moschonis, Trovas, & Lyritis, 2007). The dairy intervention group had greater
improvements in pelvis, total-spine, and total-body BMD than both the calcium
supplementation and control groups (Manios et al., 2007). Heaney (2000) reported that
of 86 observational studies, 64 reported relationships in favor of increased calcium
intakes, with reduced fracture risk, bone loss or improved bone mass and of those studies
specifically evaluating dairy sources of calcium, approximately 75% supported the
conclusion that increased calcium from dairy foods is protective of the skeleton. The
hypothesized mechanism of dairy’s role in osteoporosis relates to calcium; high calcium
intakes suppress PTH secretion and reduce elevated bone remodeling, and in this process
reduces the bony fragility that is the hallmark of osteoporosis (Heaney, 2000). It is noted
that when calcium intake is adequate, consuming additional calcium confers no further
benefits. Dairy foods contain calcium, phosphorus, and protein; these three nutrients
have a beneficial effect on bone organic matrix formation and mineralization while also
exerting an inhibitory effect on bone resorption (Bonjour et al., 2013).
21
There is evidence that protein and phosphorus at the proper level can enhance
calcium absorption and renal tubular reabsorption and can contribute to the positive effect
of dairy foods on bone health. Increasing vitamin D intakes in older adults has been
shown to reduce the risk of fracture and bone loss (Heaney, 2009). A meta-analysis
reported that 700 to 800 IU/day of oral vitamin D reduced non-vertebral fractures by 23%
and hip fractures by 26% compared to placebo during a 12 month randomized controlled
trial. Studies have reported a positive relationship between protein intake and BMD,
reduced incidence of fracture, and reduced rate of bone loss (Willet, Wong, Giova, &
Dietrich, 2006).
Weight Management
It is theorized that milk and dairy products may facilitate a role in weight
management. There are two models to suggest how milk and dairy promotes weight loss.
The first model involves intracellular calcium’s role in the metabolism of the adipocyte.
High dietary calcium can suppress the concentrations of serum PTH and 1,25
dihydroxyvitamin D. PTH and 1,25 dihydroxyvitamin D increase concentrations of
intracellular calcium in adipocytes, which leads to a decrease in lipolysis and an increase
in lipogenesis through increase of fatty acid synthase concentrations in the cell (Tudor,
Havranek, & Serafini, 2009). Gunther et al. (2006) study showed a one year change in
PTH was positively associated with the change in fat mass in healthy, normal-weight
young women aged 18 to 31 years. The same study showed an acute increase in milk and
dairy calcium does not affect fat oxidation during chronically low calcium intakes,
however, a long-term increase in dietary calcium leads to an increase in whole body fat
22
oxidation independently of taking a low-calcium or high-calcium meal (Gunther et al.,
2006).
The second model involves the inhibition of fat absorption in the intestines
through binding fatty acids in the intestines by calcium and thereby increasing the
amount of fatty acids in fecal excretion (Tuder, Havrenek, & Serafini, 2009). It has been
found that calcium from milk dairy foods has a more profound effect on fat loss than
calcium from supplements (Gunther et al., 2006). The mechanism of the additional dairy
effect on weight loss is not clear, but it has been suggested that it may be due to other
bioactive components in dairy products like conjugated linoleic acid, branched amino
acids, whey peptides, and lactose (Tuder, Havrenek, & Serafini, 2009).
Chen, Pan, Malik, and Hu (2012) conducted a meta-analysis of 29 randomized
controlled trials of weight management and dairy consumption and concluded that the
analysis did not support the beneficial effect of increasing dairy consumption on body
weight and fat loss in long term studies (> 1 year) or studies without energy restriction.
Dairy products may have modest benefits in facilitating weight loss in short-term or
energy restricted randomized controlled studies (Chen, Pan, Malik, & Hu, 2012). After
reviewing nine prospective cohort studies on dairy consumption and overweight and
obesity in adults, the results provided evidence of a suggestive, but not consistent
protective effect of dairy consumption on risk of overweight and obesity (Chen, Pan,
Malik, & Hu, 2012).
23
In an analysis of 14 studies investigating the effects of increased dairy
consumption in the diet on weight, fat mass, lean mass, and waist circumference, the
results provided evidence that increased dairy intake had no discernable effect on any of
the variables unless it was combined with energy restriction (Abargouei, Janghorbani,
Salehi-Marzijarani, & Esmaillzadeh, 2012). Another meta-analysis study concluded that
energy restricted, dairy based diets resulted in improved weight loss, increased fat loss,
and an increase in lean body mass (Sanders, 2012).
Hypertension
There is considerable data of observational trials and randomized controlled trials
regarding the effects of milk and dairy food consumption on blood pressure and the risk
of hypertension. In the Framingham Children’s study, children consuming two or more
servings per day of dairy products during preschool years, regardless of fat level, had
smaller yearly gains in systolic blood pressure (SBP) and lower SBP by early
adolescence (Moore et al., 2005). Overweight young adults were followed for 10 years
in the Coronary Artery Risk Development in Young Adults (CARDIA) study; the
consumption of reduced fat and higher fat dairy products were inversely related with the
risk of high blood pressure (Pereira et al., 2002).
The Rotterdam Study analyzed the association of dairy food intake and the
association with hypertension, results revealed that each serving of dairy per day,
identified as 150 mL, was associated with a 7% lower risk of hypertension (Engberink et
al., 2009). Upon examination of the association with dairy products stratified by low- or
24
high-fat content, there was a significant inverse association primarily with low-fat dairy
intake (Engberick et al., 2009). Fermented dairy products intake was also inversely
related with hypertension, but there was no observed association for cheese products and
hypertension (Engberick et al., 2009).
The National Heart, Lung, and Blood Institute Family Heart Study showed a 36%
lower occurrence of hypertension in American adults with a high intake of low-fat dairy
products, independent of calcium intake (Djoussé et al., 2006). The Seguimiento
Universidad de Navarra (SUN) cohort study in Spanish university graduates
prospectively showed that low-fat dairy product intake and not whole-fat dairy intake was
associated with a 54% lower risk of hypertension incident in the upper quartile (Alonso,
Beunza, Delgado-Rodríguez, Martínez, & Martínez-González, 2005).
In a meta-analysis of nine observational and clinical studies results showed a
slight protective effect of low-fat dairy and milk intake on hypertension (Soedamah-
Muthu, Verberne, Ding, Engberink, & Geleijnse, 2012). Ralston, Lee, Truby, Palermo,
& Walker (2012) analyzed five cohort studies with almost 11,500 cases of elevated blood
pressure and the objective of separating the effects of high-fat compared with low-fat
dairy, results showed a significant inverse relationship between the low-fat dairy intake
and elevated blood pressure with no benefit from high-fat dairy.
The mechanism by which dairy products reduce blood pressure remains to be
established. One hypothesized mechanism of antihypertension action of dairy is rich in
protein and bioactive peptides, which might exert a beneficial effect on blood pressure
25
possibly by inhibiting the angiotensin-I-converting enzyme, modulating endothelium
function, of affecting body weight (Engberink et al., 2009). Another hypothesized
mechanism of antihypertension action of dairy products is centered on its key nutrients
including potassium, calcium, and magnesium. Dietary potassium restriction leads to
deficiency as the kidneys cannot conserve potassium, which increases renal sodium and
chloride ion retention; this potassium deficiency has been shown to increase the sodium-
hydrogen exchange system by stimulating the sympathetic nervous system and the renin-
angiotension system. An increase in sodium-hydrogen activity in vascular smooth
muscle cells may elevate cellular sodium ions, which reduces calcium ions through
sodium-calcium ion exchange; this would lead to increased systolic calcium
concentrations and vasoconstriction. Low concentrations of potassium has also been
shown to limit sodium, potassium-ATPase activity resulting in increased intracellular
sodium (Kris-Etherton, Grieger, Hilpert, & West, 2009).
Socio-cultural Practices Related to Dairy Consumption
There are social or cultural aspects in regards to perceptions and consumption of
dairy products. African-Americans, Asian-Americans, and Hispanic-Americans are
minority groups of the population that have social or cultural aspects in relation to dairy
consumption.
African-Americans
Dairy intake among African-Americans is less than recommended; analysis of the
2009-2010 National Health and Nutrition Examination Survey (NHANES) data revealed
26
that non-Hispanic African-Americans consume 1.2 cup equivalents per day. On average,
non-Hispanic African-American children aged two to 18 years consume 1.8 dairy
servings per day and 76% drink milk once they reach school age (5 years old). Forty-
four percent of non-Hispanic African-Americans drink milk once a day during
adolescence (ages 13 to 17 years) (Bailey et al., 2013).
Due to the fact that intake of dairy foods and its nutrients have been linked to
reduced risk of several chronic diseases, Non-Hispanic African-Americans, whose dairy
intake is suboptimal, may be at a higher risk of obesity and hypertension. Compared to
Caucasians, non-Hispanic African-Americans had a 51% higher obesity rate from 2006-
2008 (Centers for Disease Control (CDC), 2009); Zemel et al. (2005) found that non-
Hispanic African-American adults following a calorie-restricted, dairy-adequate (three
servings of dairy per day) diet for 24 weeks lost significantly more weight than those
only on a calorie-restricted diet with one or fewer servings of dairy per day. Non-
Hispanic African-Americans suffer from the highest rates of hypertension in the U.S.
(Roger et al., 2012); a meta-analysis of prospective studies assessing dairy food
consumption and disease outcomes concluded that higher dairy intake was associated
with lower incident ischemic heart disease and stroke (Elwood, Pikering, Givens, &
Gallacher, 2010).
Lactose intolerance is estimated to occur in approximately 80% of non-Hispanic
African-Americans (Jarvis & Miller, 2002). Non-Hispanic African-Americans who
reported themselves as being lactose intolerant were less likely to consume dairy foods
(35%) compared to those who did not report lactose intolerance (45%) (Keith, Nicholls,
27
Reed, Kafer, & Miller, 2011). Lactose intolerance did not account for all the lower dairy
intake among non-Hispanic African-Americans compared to the general U.S. population;
26% of non-Hispanic African-Americans reported that they consumed less than one
serving per day of dairy foods on average, are not lactose intolerant, and do not
experience discomfort most of the time after consuming a dairy food, which indicates
other factors may also influence lower dairy food intake among non-Hispanic African-
Americans (Keith et al., 2011).
Asian-Americans
Dairy intake among Asian-Americans is less than normal; analysis of the 1999-
2004 NHANES data indicates Asian-Americans adults 18 years or older consume 1.2
servings of dairy per day (Beydoun, Gary, Caballero, Lawrence, Cheskin, & Wang,
2008). Nine-point-two percent of Asian-Americans consumed greater than or equal to
three servings of dairy per day. Fluid milk servings of dairy was 0.7 per day, 0.03
servings of yogurt per day, and 0.46 servings of yogurt per day for Asian-Americans
(Beydoun et al., 2008).
The biggest barrier is lactose intolerance. Lactose intolerance has been observed
in approximately 100% of Asians (Jackson & Savaiano, 2001). In a study of 20 Chinese-
American couples interviewed, nine parents reported lactose intolerance and two reported
having a child with lactose intolerance; among these some ignored dairy products
altogether and others used strategies to reduce symptoms, e.g. eating small portions or
eating yogurt and cheese (Lv & Brown, 2010). All of the parents considered milk the
28
most convenient and cheapest dairy product for home use and many parents liked yogurt
for its convenience and nutrition and preferred the fruit flavored to plain (Lv & Brown,
2010). In regards to personal willingness to eat more dairy products, most parents were
satisfied with their limited dairy product intake and saw no need to increase consumption
(Lv & Brown, 2010).
While lactose intolerance may be one of the reasons for the low consumption of
milk and dairy foods in Asian-Americans, other factors such as culturally determined
food preferences and dietary practices learned early in life also play a role (Jarvis &
Miller, 2002). Asian-American dietary practices limit calcium intake from dairy, most
likely due to the interaction of traditional cultural food practices and food availability
(Jackson & Savaiano, 2001). There is evidence that acculturation of Asian-Americans
positively influences dietary patterns of calcium and milk consumption (Jarvis & Miller,
2002).
Hispanic-Americans
Dairy intake among Hispanic-Americans is less than normal; analysis of the
2009-2010 NHANES indicates Hispanic-Americans consume 1.5 cup equivalents of
dairy per day. Hispanic-American children aged two to 18 years consume an average of
1.9 dairy servings per day and 87% drink milk when they reach school age (5 years).
Fifty-three percent of Hispanic-American adolescents (age 13 to 17 years) drink milk
(Bailey et al., 2013).
29
Intake of dairy foods and its nutrients have been linked to reduced risk of several
chronic diseases and adequate intakes (three to four servings/day) are recommended by
public health authorities. Hispanic-Americans may be at a higher risk of obesity and
osteoporosis. Compared to Caucasians, Hispanic-Americans had a 21% higher obesity
rate from 2006-2008 (CDC, 2009). Hispanic-Americans have bone density comparable
to Caucasian-Americans, their bone mineral density and fracture risk is affected by both
racial and lifestyle variables. Some research indicates that fracture risk is increasing most
rapidly among Hispanic-Americans, although its cause is not known (Cooper & Ballard,
2011).
Lactose intolerance may be partly to blame for the low calcium and dairy food
consumption in Hispanics as well. Lactose intolerance is estimated to occur in
approximately 50% of Mexican Americans (Jarvis & Miller, 2002). A 2009 study
determined the self-reported prevalence rates of a nationally representative sample of
Hispanic-Americans adults concluded that after age-adjustments, 10.05% considered
themselves lactose intolerant (Nicklas, O’Neil, & Fulgoni III, 2009). Other factors such
as cultural determined food preferences and dietary practices learned early in life also
play a role in the low consumption of dairy among Hispanic Americans. There is
evidence that acculturation of Hispanic-Americans positively influences dietary patterns
of calcium and milk consumption (Jarvis & Miller, 2002).
30
Current Consumption Patterns
National survey data from the 2001-2002 National Health and Nutrition
Examination Survey (NHANES) indicate that 39% of men and 43% of women aged 20 to
29 years consume less than even one daily serving of dairy products (Larson, Neumark-
Sztainer, Harnack, Wall, Story, & Eisenberg, 2009). The mean fluid milk intake for the
age groups of two to 11 and 12 to 19 years of age was approximately 1 ¾ cup per day
according to NHANES 2005-2006 (USDA Agricultural Research Service, 2010). The
mean fluid milk intake for the age groups of 20 to 49 and 50 and older years of age was
approximately ¾ cup per day according the NHANES 2005-2006 (USDA Agricultural
Research Service, 2010). In all age groups except adults aged 50 years and older, non-
Hispanic African-Americans consumed significantly less milk than non-Hispanic whites
and Mexican-Americans (USDA Agricultural Research Service, 2010). Among adults
aged 20 years and older, non-Hispanic whites and Mexican Americans consumed on
average about ¾ cup milk whereas non-Hispanic African Americans consumed a little
over 1/3 cup (USDA Agricultural Research Service, 2010).
National survey data from 2007 – 2010 NHANES two day averages revealed
Americans drink a total of 1.77 cups of total dairy per day (USDA Economic Research,
2014b). Children aged two to 19 years consumed an average of 2.16 cups of dairy per
day and adults age 20 years and older consumed an average of 1.64 cups of dairy per day
from the 2007 – 2010 NHANES data (USDA Economic Research, 2014b). The data also
looked at income level in relation to dairy consumption; lower and higher income were
separated by the 185% income poverty line in income threshold. Americans in the higher
31
income group consumed 1.83 cups of dairy per day compared to 1.67 cups of dairy per
day in the lower income category (USDA Economic Research, 2014b).
The preliminary data for 2013 indicates the product weight of beverage milks,
fluid creams, and egg nog was 189 pounds per person consumed (USDA Economic
Research, 2014a). The preliminary data in regards to yogurt consumption in 2013 is 14.9
pounds of yogurt was consumed per person (USDA Economic Research, 2014a). The
preliminary consumption data for 2013 for all dairy products including beverage milks,
fluid creams and egg nog, yogurt, cheese, evaporated and condensed milk, frozen dairy
products, and dry products was 607 pounds per person (USDA Economic Research,
2014a).
Barriers to Dairy Consumption
There are several barriers to dairy consumption that may prevent some individuals
from consuming dairy products. Some of these barriers are lactose intolerance, cow’s
milk protein allergy, and attitudes and beliefs towards milk and dairy.
Lactose Intolerance
One of the barriers to dairy consumption is lactose intolerance. Lactose, milk
sugar, is a disaccharide that must be hydrolyzed into its component simple sugars of
glucose and galactose in order to be absorbed across the intestinal mucosa. The
hydrolysis of lactose requires the enzyme, lactase, which is produced in the intestinal
mucosa. The production of lactase by mucosal cells decreases with age and is prominent
in individuals of East Asian and African ethnicity. The absence of adequate hydrolysis of
32
lactose in the small intestine results in the movement of undigested lactose into the distal
bowel, where bacteria ferment the sugar producing gas and symptoms of cramps,
bloating, flatulence, and diarrhea (Heaney, 2013).
Diagnosis of lactose intolerance can be accomplished with the lactose-hydrogen
breath test. A 50 gram lactose solution in water is ingested, and hydrogen gas levels are
measured at varying intervals after ingestion. Lactose is incompletely absorbed once it
passes the colon and ferments into various gases, including methane, carbon dioxide, and
hydrogen as well as short-chain fatty acids. Some of the hydrogen gas is absorbed into
the blood and exhaled during passage through the lungs. The specificity of the hydrogen
breath test ranges from 89% to 100%, with a sensitivity ranging from 69% to 100%
(Carter & Attel, 2013).
The traditional management of lactose intolerance relies on reducing lactose
exposure by avoiding milk and milk-containing products or by drinking milk in which the
lactose has been pre-hydrolyzed with lactase (Suchy, Brannon, Carpenter, Fernandez,
Gilsanz, Gould, & Wolf, 2010). Small amounts of milk, yogurt, hard cheeses, and
reduced-lactose foods may be effective management approaches; individuals with lactose
malabsorption probably can tolerate 12 grams of lactose without significant symptoms,
particularly if ingested with other foods (Suchy et al., 2010). There are factors that affect
the activity of lactase in the digestion of lactose including pH and acidity. Another factor
in the digestion of lactose includes the efficient utilization of lactose from cultured milk
products, such as -galactosidase, which could be attributed from the lactase activity of
33
the bacteria, stimulation of host’s mucosal lactase activity, or slower intestinal transit of
cultured milk product compared to milk (Sarker, 2006).
Galactose activity has also been demonstrated in many lactobacilli and differs
greatly in their lactase activity; probiotic cultures (e.g. lactobacillus acidophilus and
bifidobacterium) possess lower levels of lactase and being more resistant to bile than
yogurt cultures are less efficacious in helping lactose digestion. Factors affecting the
lactase activity are growth condition survivability of starter cultures, survivability of
starter cultures, product manufacturing, and storage conditions, and post-processing
treatments (Sarker, 2006). Therefore, cultured and acidified dairy products may be an
effective solution to consuming dairy products in lactose intolerant individuals.
Cow’s Milk Protein Allergy
Cow’s milk protein allergy (CMPA) is generally the first food allergy observed in
children (Pereira, 2014). CMPA can be IgE-mediated or non-IgE-mediated, in which
IgE-mediated reactions can be immediate and have adverse consequences while non-IgE-
mediated reactions are delayed (Pereira, 2014; De Koker, Shah, & Meyer, 2014). The
immediate symptoms include anaphylaxis, cutaneous reactions with urticarial and edema,
respiratory episodes, and gastrointestinal distress including vomiting, diarrhea, and
bloody stools (Pereira, 2014). Pereira (2014) cites most frequently cow’s milk protein
allergies are due to whey proteins, mainly beta-lactoglobulin, but can also be promoted
by caseins. Solinas, Corpino, Maccioni, & Pelosi (2010) report alpha-lactalbumin, beta-
lactoglobulin, and casein allergens as the most important allergens of cow’s milk.
34
Estimates of the prevalence of CMPA vary from 2% to 7.5% (Pereira, 2014; Solinas,
Corpino, Maccioni, & Pelosi, 2010).
In suspected IgE-mediated CMPA, skin prick tests and blood tests for specific IgE
are currently the only acknowledged diagnostic tests (De Koker, Shah, & Meyer, 2014).
Non-IgE-mediated CMPA reactions are more difficult to diagnose, which is compounded
by the lack of diagnostic tests to confirm diagnosis. The method for diagnosing non-IgE-
mediated CMPA is an allergy focused history, followed by an elimination diet with
resolution of symptoms and recurrence of symptoms on re-introduction of foods (De
Koker, Shah, & Meyer, 2014).
The only treatment for CMPA is the complete avoidance of cow’s milk protein.
This requires a diet free from cow’s milk and cow’s milk-based products (De Koker,
Shah, & Meyer, 2014; Pereira, 2014; Solinas, Corpino, Maccioni, & Pelosi, 2010).
Normally, CMPA tends to remit during childhood and quite uncommon in adults;
tolerance develops in 51% of cases within two years after diagnosis and 80% of cases
attain tolerance within three to four years (Pereira, 2014; Solinas, Corpino, Maccioni, &
Pelosi, 2010).
Attitudes and Beliefs
Mahon & Haas (2013) conducted a mixed-methods approach to determine
whether college students consume the recommended amounts of dairy foods on a daily
basis and then targeted college-aged females for focus groups to provide insight into why
dairy consumption is low among females. The results showed on average, college
35
students consumed less than one serving of milk or dairy per day and men consumed
significantly more milk or dairy than women. The qualitative part of the study with focus
groups indicated that the participants communicated a lack of knowledge about the
importance of dairy in their daily diets, what a serving size of milk or dairy was, and the
recommended amount of servings per day were some barriers related to the self-efficacy
toward consuming milk and dairy. Perceived barriers to consuming milk and dairy
identified in the focus groups were other food or beverage options are more appealing
than milk and dairy, poor access on campus, limited variety of milk and dairy products on
campus, unnecessary calories and fat, and side effects. Benefits of consuming milk and
dairy identified were healthier, ease of access, various health-related benefits, and fat-free
(Mahon & Haas, 2013)
Fifty-nine older, low-income women participated in nine focus groups to identify
the attitudes, beliefs, and barriers related to milk consumption (Mobley, Jensen, &
Maulding, 2014). Most women liked the taste of milk and milk products with one
negative attitude toward non-fat and low-fat milk. The primary belief or reason for milk
consumption was “good for bones/osteoporosis prevention/good for you/health” and
often physician recommended. Barriers to milk consumption were primarily related to
personal factors such as gastrointestinal issues and perceived lack of benefit at an older
age. Some behavioral and environmental themes including lack of habitual intake, cost
and milk spoilage appeared to have less of an influence on milk consumption. The
questionable treatment of cows and hormones in milk were mentioned sometimes but did
36
not to appear to be a primary barrier for milk consumption (Mobley, Jensen, & Maulding,
2014).
The St. Louis District Dairy Council cited low dairy intake was due to several
reasons. Some of the reasons for low dairy intake include promotion of or choice of non-
dairy drinks, which is a result of a 33% decline in family mealtime in the past 30 years
(St. Louis District Dairy Council, 2013). Other reasons include animal rights activism,
vegan food patterns, and ethnic food practices or preferences. Reality of lactose
intolerance or milk allergy, perception of dairy intolerance, limited knowledge of dairy
for overall diet quality and of managing lactose intolerance among health professionals,
and the misinformation about dairy among the public were also cited as reasons for low
dairy intake. Consumers are less apt to consume milk with the midday and nighttime
meals, which leads to fewer occasions per day to consume milk. Changing tastes and
preferences are the most common reasons for consuming less dairy (St. Louis District
Dairy Council, 2013).
Organizations Currently Promoting & Educating on Dairy Consumption
There are a variety of organizations promoting and educating the public on dairy
consumption. Some of these organizations include the National Milk Processor
Education Program, American Dairy Association and Council, Inc., National Dairy
Council, and Dairy Farmers of America. The Food, Farm, and Jobs Bill 2014 provides
the Special Milk Program and the Dairy Protection Program; these programs help in the
37
production and consumption of dairy (USDA Food and Nutrition Services, 2014; USDA
Farm Service Agency, 2014).
National Milk Processor Education Program
The Milk Processor Education Program (MilkPEP) is funded by the nation’s milk
processors, who are committed to increasing the fluid milk consumption (Milk Processor
Education Program (MilkPEP, 2014b). MilkPEP activities are led by a 20 member
board, which is monitored by the United States Department of Agriculture (USDA)
Agricultural Marketing Service (MilkPEP, 2014b). MilkPEP works with the trade (retail,
schools, foodservice, and vending) to create new business opportunities for milk through
channel expansion (MilkPEP, 2014b). Campaigns and organizations funded and
supported by MilkPEP include Milk Life, The Breakfast Project, Projecto Desayuno,
MilkDelivers, Got Milk Sales, and Build It got chocolate milk?.
Milk Life is a $60 million cross-platform campaign that reinforces milk’s many
nutrition benefits including high-quality protein (America’s Milk Processors, 2014). The
campaign spotlights everyday moments of accomplishment, achievement, and enjoyment
with milk can help power the potential of every day. With eight grams of high-quality
protein in each 8 oz. glass of milk, including milk at breakfast, can help you make the
most of your day (America’s Milk Processors, 2014). The Milk Life website includes
recipes, food/nutrition information, breakfast, and videos to show the importance of
including milk in the diet.
38
The Breakfast Project promotes a breakfast that includes milk that includes high-
quality protein. The Breakfast Project has partnered with Quaker to promote a breakfast
of Quaker oatmeal and milk that includes high-quality protein and delivers health energy
for the entire family (MilkPEP, 2014b). The Breakfast Project website provides tips,
tools, nutritious recipes, and more to help make milk part of the morning routine in
breakfast. Projecto Desayuno is the Spanish language version of this organization to help
share the latest health and nutrition news about milk, tips, tools, and recipes that are
culturally relevant to the Hispanic customer (MilkPEP, 2014b).
Milk Delivers provides information and resources to schools and foodservice
professionals and spotlights how milk plays a vital role in these areas. Milk Delivers
explains that, “schools are in a unique position to impact children’s food choices –
including their milk intake – because many rely on school meals as their major source of
nourishment, with over 32 million meals served daily” (MilkPEP, 2014a). The goal of
Milk Delivers is to ensure students have healthful lunches each day, and milk is a
nutritious part of the school meal (MilkPEP, 2014a).
Got Milk Sales provides information, tools, and resources for grocery retailers
who want to take advantage of the National got milk? Milk Mustache program to grow
store sales. Grocery retailers recognize the importance of meal solutions and have
implemented a dinner strategy to drive shopper traffic and increase basket rings, and milk
is one of the most important items in the cart (America’s Milk Processors, 2014). This
campaign of MilkPEP focuses on two long-term meal-occasion based consumer
programs that represent prime occasions for milk and retail sales: Protein at Breakfast
39
and Post-Workout Recovery for athletes (America’s Milk Processors, 2014). These
programs feature milk and are designed to change consumer behavior.
The Refuel got chocolate milk? campaign has been gaining momentum since it
was launched in 2012 and research suggested that the campaign could evolve and build
on strengths of the 2013 My After campaign (America’s Milk Processors, 2014). Build It
got chocolate milk? resonated the strongest and delivered a powerful positioning of
chocolate milk as an effective post-workout recovery beverage (America’s Milk
Processors, 2014). The key importance of the Build It got chocolate milk? campaign is to
educate athletes about what their bodies need post-exercise and to specifically reinforce
why chocolate milk is so beneficial (America’s Milk Processors, 2014).
MilkPEP is also involved in the campaign, The Great American Milk Drive,
which brings the dairy industry together with Feeding American regarding the issue of
hunger, which impacts one in six Americans (America’s Milk Processors, 2014). The
national campaign helps elevate awareness for the need of milk in America’s feeding
programs and provide Americans a simple way to help (America’s Milk Processors,
2014). The program is designed to encourage consumers to make a simple donation by
purchasing an extra gallon of milk and Feeding America will deliver it to local families
who need it the most (America’s Milk Processors, 2014).
American Dairy Association and Dairy Council, Inc.
The American Dairy Association and Dairy Council, Inc. (ADADC) has been
serving dairy farmers in the states of New York, New Jersey, and Pennsylvania since
40
1962 and specialize in the promotion of generic dairy products for the purpose of
increasing the sales of milk and dairy products (American Dairy Association and Dairy
Council, Inc.(ADADC), n.d.). ADADC is a non-profit corporation that is funded and
directed by dairy farmers’ check-off dollars for the purpose of increasing sales of and
demand for dairy products (ADADC, n.d.). The mission is to economically benefit dairy
farmers by encouraging the consumption of milk and dairy products through advertising,
education and promotion, and to reach consumers with product benefits and advantages
(ADADC, n.d.). The ADADC administers the following programs: Hispanic Advertising
& Promotions, Retail Product Quality Space Allocation, Training Workshops for Dairy
Case Managers & Milk Handlers, School Breakfast & Lunch Programs, Medical &
Nutrition Seminars for Health Professionals, Television & Newspaper Publicity, Industry
Relations, Dairy Princess Program, and Crisis Communication Training (ADADC, n.d.).
Another program supported by the ADADC is the Fuel Up to Play 60 campaign.
The Fuel Up to Play 60 is an in-school nutrition and physical activity program launched
by the American Dairy Association and Dairy Council, Inc., the National Dairy Council,
and the National Football League in collaboration with the USDA (ADADC, n.d.). The
program empowers youth to take actions to improve nutrition and physical activity at
their school, by implementing long-term, positive changes (ADADC, n.d.). Youth are
encouraged to consume nutrient – rich foods including low-fat and fat-free dairy foods,
fruits, vegetables, and whole grains and to achieve at least 60 minutes of physical activity
every day (ADADC, n.d.).
41
National Dairy Council
The National Dairy Council (NDC) is a non-profit organization funded by the
national dairy check-off program and is committed to nutrition education and research-
based communications (National Dairy Council (NDC), 2014). NDC provides science-
based nutrition information in collaboration with a variety of stakeholders committed to
fostering a healthier nation, including health professionals. Educators, school nutrition
directors, academia, industry, consumers, and media (NDC, 2014). NDC was established
in 1915 and compromises a staff of registered dietitians and nutrition research and
communications experts across the country (NDC, 2014). NDC has promoted child
health and wellness through programs such as Fuel Up to Play 60.
Another promotion of the NDC is the Dairy Report. The Dairy Report is a blog
written by health professionals (registered dietitians, PhD nutritionists, and
communication experts) at the NDC. The purpose of the Dairy Report is to provide the
latest news, analysis and opinion on nutrition and health research and events (NDC,
2014). NDC is committed to providing health professional with updated and timely,
credible dairy and nutrition research and educational tools to help serve the health
professionals’ patients (2014).
Dairy Farmers of America
Dairy Farmers of America (DFA) was created in 1966 when the Associated Milk
Producers, Inc., Mid-American Dairymen, Inc., Milk Marketing, Inc., and Western
Dairymen Cooperative, Inc. gathered and united their talents, leadership, markets, and
42
capital into a single, stronger cooperative better able to work for the dairy farmer (Dairy
Farmers of America (DFA), 2014). Since then Independent Cooperative Milk Producers
Association, Valley of Virginia Milk Producers Association, Black Hills Milk Producers,
and California Cooperative Creamery have merged into DFA in order to take advantage
of a unified voice and other benefits that working together brings to their members (DFA,
2014). In 1999, DFA and Dairylea partnered to create Dairy Marketing Services (DMS),
which markets milk for both independent producers and cooperative members; DMS is
now a national organization (DFA, 2014). Today, DFA is a leading milk marketing
cooperative and dairy food processor and serves nearly 13,000 members (DFA, 2014).
Though DFA is a national milk marketing cooperative, it is divided into seven
areas, which ensures the grassroots representation of members. The areas are organized
into districts, in which members elect representatives to serve on their governing area
council, which monitor the marketing of milk and local issues (DFA, 2014). The DFA
mission is DFA is a milk marketing cooperative and dairy foods processor dedicated to
delivering value to members through secure markets, competitive pricing, and increasing
value throughout the entire dairy chain (DFA, 2014).
Food, Farm, and Jobs Bill 2014
The farm bill is an omnibus, multi-year piece of authorizing legislation that
governs an array of agricultural and food programs (Johnson & Monke, 2013). Farm
bills have traditionally focused on farm commodity price and income support for a
handful of staple commodities (corn, soybeans, wheat, cotton, rice, and dairy) since the
43
1930s (Johnson & Monke, 2013). Some of the most important additions to the farm bill
have included nutrition assistance, conservation, horticulture, and bioenergy programs
(Johnson & Monke, 2013). Two of the major programs of the farm bill in regards to
dairy are the Special Milk Program and the Dairy Margin Protection Program.
Special milk program. The Special Milk Program (SMP) provides milk to
children in schools, childcare institutions, and eligible camps that do not participate in
other Federal child nutrition meal service programs, e.g. National School Lunch Program
or School Breakfast Program (United States Department of Agriculture (USDA) Food
and Nutrition Service, 2014). Schools in the National School Lunch or School Breakfast
program may participate in the SMP to provide milk to children in half-day pre-
kindergarten and kindergarten programs where children do not have access to the school
meals programs. The SMP works by participating schools and institutions receive
reimbursement from the United States Department of Agriculture for each half pint of
milk served, they must operate their milk programs on a non-profit basis and agree to use
the Federal reimbursement to reduce the selling price of milk to all children (USDA Food
and Nutrition Services, 2014).
Any childcare program offering free milk under the SMP to low-income children,
any child from a family meeting income guidelines for free meals is eligible (USDA
Food and Nutrition Services, 2014). Each child’s family must apply annually for free
milk eligibility. Childcare programs must offer only pasteurized fluid fat-free or low-fat
milk meeting all State and local standards and should contain vitamins A and D at levels
44
specified by the Food and Drug Administration (USDA Food and Nutrition Services,
2014).
Since the expansion of the National School Lunch Program and School Breakfast
Program, which include milk, has led to a substantial reduction in the SMP. The SMP
has served nearly three billion half pints of milk in 1969, one point eight billion half pints
in 1980, and 181 million half pints in 1990 (USDA Food and Nutrition Service, 2014).
In the fiscal year of 2012, over 61 million half pints of milk were served in the SMP
(USDA Food and Nutrition Service, 2014).
Dairy margin protection program. The Dairy Margin Protection Program
replaces the Milk Income Loss Contract Program and was effective no later than
September 1, 2014 through December 31, 2018. The program offers dairy producers
catastrophic coverage with an annual $100 administrative fee and various levels of buy-
up coverage (USDA Farm Service Agency, 2014). Catastrophic coverage provides
payments to participating producers when the national dairy production margin is less
than $4.00 per hundredweight (USDA Farm Service Agency, 2014). The dairy
production margin is the difference between the all-milk price and average feed costs
(USDA Farm Service Agency, 2014). To participate in buy-up coverage, a producer
must pay a premium that varies with the level of protection the producers elects (USDA
Farm Service Agency, 2014).
The 2014 Farm Bill Act also creates the Dairy Product Donation Program. This
program is triggered in times of low operating margins for dairy producers and requires
45
the USDA to purchase dairy products for donations to food banks and other feeding
programs (USDA Farm Service Agency, 2014). The Dairy Indemnity Payment Program
(DIPP) is also a part of the 2014 Farm Bill Act. The DIPP provides payments to dairy
producers when a public regulatory agency directs them to remove their raw milk from
the commercial market because it has been contaminated by pesticides or other residues
(USDA Farm Service Agency, 2014).
Anti-Dairy Movements
There are organizations that promote against the consumption of dairy and dairy
products. Some of these organizations are NotMilk.com and People Against the Ethical
Treatment of Animals.
NotMilk.com
The indicated goal of NotMilk.com is to help individuals find the whole truth about
cow’s milk and dairy quickly and to provide online resources (NotMilk.com, n.d.). The
Milk Letter: A Message to My Patients from Robert M. Kradjian summarizes his letter by
stating, “So don’t drink milk for health. I am convinced on the weight of the scientific
evidence that it does not ‘do a body good’. Inclusion of milk will only reduce your diet’s
nutritional value and safety” (NotMilk.com, n.d.). Neal Barnard’s thoughts on milk is
“There is no nutritional requirement for dairy products. A substantial body of scientific
evidence raises concerns about health risks from cow’s milk. These problems relate to the
proteins, sugars, fat, and contaminants in dairy products, and the inadequacy of whole
cow’s milk for infant nutrition” (NotMilk.com, n.d.).
46
People for the Ethical Treatment of Animals
Cows produce milk to nourish their young and in order to force animals to continue
to give milk, factory farm operators impregnate them using artificial insemination every
year (People for the Ethical Treatment of Animals (PETA), n.d.). PETA (n.d.) states,
“Mother cows are hooked up, several times a day, to milking machines. These cows are
genetically manipulated, artificially inseminated, and often drugged to force them to
produce about four and a half times as much milk as they naturally would to feed their
calves”. PETA (n.d.) states, “The good news is that removing dairy products from your
diet is easier than ever. Today there is a multitude of nondairy ‘dairy’ products on the
market, such as soy, rice, and almond milk and soy ice cream.”
College Students
College attendance is typically during young adulthood, during which time
students gain independence in the transition from high school to college and make most
of their decisions sans parental guidance. This is a period characterized by change, where
students explore new environments and adopt new behaviors. One of these behaviors is
dietary choices and habits. Young adults in college tend to engage in poor dietary habits
that may put them at risk for poor nutritional status (Poddar, Hosig, Anderson-Bill,
Nickols-Richardson, & Duncan, 2012).
The campus environment may contribute to poor dietary choices which may lead
to the development of poor dietary habits and patterns. Some students have difficulty
with the responsibilities of purchasing and preparing their own meals and managing new
47
eating schedules (Cluskey & Grobe, 2009). Students also express concern about the
expense of healthy food and they report preferring processed snacks versus fresh
produce, which spoils more rapidly (Strong, Parks, Anderson, Winett, & Davy, 2008).
Social and environmental factors additionally may negatively influence students’ dietary
habits (Strong, Parks, Anderson, Winett, & Davy, 2008). College students are confronted
with additional stressors related to new academic challenges, in addition to the stress
associated with learning to navigate food selection and preparation (American College
Health Association, 2010).
Stress is positively associated with the intake of calorically dense, high-fat food
(Zellner et al., 2006). The increase in overall caloric intake is also attributed to the
increase of alcohol consumption, which is also associated with the increased consumption
of unhealthy food (Kasparek, Corwin, Valois, Sargent, & Morris, 2008). Due to all the
various factors, the typical college student’s diet is high in fat, sugar, and sodium and
lacks nutrients. The average college student consumes one serving of fruit, one and a
half servings of vegetables, half serving of low-fat dairy, and one-point-four servings of
whole grains daily (Strong, Parks, Anderson, Winett, & Davy, 2008).
Peak bone mass is achieved through the third decade of life; therefore, adequate
calcium intake and other essential nutrients found in milk and dairy products are
important during young adulthood. National survey data indicate about half (53%) of
young men and 21% of young women (19 to 30 years) in the United States consume the
recommended amount of calcium (Larson, Neumark-Sztainer, Harnack, Wall, Story, &
Eisenberg, 2009). Data also indicates 39% of men and 43% of women (20 to 29 years)
48
consume less than even one daily serving of dairy products (Cook & Friday, 2005). The
recommended milk and dairy intake is associated with overall better nutrient quality of
the diet and there are several health benefits conferred by bioactive components and
nutrients present in milk and dairy products, college students should be encourage to
improve total milk and dairy intake, with emphasis on low-fat milk and dairy (Poddar,
Hosig, Anderson-Bill, Nickols-Richardson, & Duncan, 2012).
49
CHAPTER III
METHODS
Study Design
This study was a quantitative, non-experimental, post-test only design approved
by Kent State University’s Internal Review Board. The purpose of this study was to
determine the consumption of dairy and dairy alternatives in male and female students
enrolled at a Northeast Ohio state university. The study examined dairy and dairy
alternative consumption in regards to gender, living arrangements, and level of college
education. The study also examined the perceptions of dairy. The independent variables
were gender, living arrangement, and level of college education. The dependent
variables were the consumption of dairy and dairy alternatives and perceptions of dairy.
Sample
A convenience sample of students enrolled in courses at Kent State University
were utilized. Inclusion criteria for participants included being a Kent State University
student enrolled in courses and at least 18 years of age. Exclusion criteria for participants
were not being a student enrolled in courses at Kent State University and students
younger than 18 years of age.
Convenience sampling was completed by obtaining a random e-mail listserv from
Institutional Research at Kent State University and sending the link of the on-line survey
50
to the potential participants. The convenience sample included the 1,998 Kent State
University students.
Questionnaire Development
The on-line survey consisted of three sections, (Part I: Dairy and Dairy
Alternative Consumption, Part II: Perceptions of Dairy, and Part III: Demographic
Information) (Appendix A). The questionnaire included a total of 44 questions that were
a combination of open- and closed-ended questions.
Part I: Dairy and Dairy Alternative Consumption
Part I of the questionnaire included 21 questions in regards to dairy and dairy
alternative consumption. One question was the identification of the major type of milk or
dairy alternative consumed, which was from the National Health and Nutrition
Examination Survey (NHANES) and altered to also include lactose free milk, almond
milk, and coconut milk. Other questions identified whether the dairy alternative was
fortified with calcium and reasons for consuming dairy alternatives. Food frequency
questions were utilized in regards to milk, yogurt, cottage cheese, cheese, frozen yogurt,
ice cream, and pudding or custard. These closed-ended questions in the format of
multiple choice were from NHANES. There were also open-ended questions in regards
to the average serving size, in ounces, of milk, yogurt, cottage cheese, cheese, frozen
yogurt, ice cream, and pudding or custard. There were open-ended questions in regards
to the frequency of consumption of coffee and soda and the average serving size of these
items.

51
Part II: Perceptions of Dairy
Part II of the questionnaire included 16 closed-ended questions regarding the
perceptions of dairy. These questions utilized a five-point Likert scale and included
options ranging from strongly disagree to strongly agree. The questions were created to
determine the level to which participants agreed with statements regarding barriers to
dairy consumption that were identified in the literature review.
Part III: Demographic Information
Part III of the questionnaire included seven questions compromised of both open-
and closed-ended questions regarding the demographic characteristics of the participants.
These questions identified gender, age, race/ethnicity, living situation, academic status,
height, and weight. The height and weight information was used to calculate
participants’ body mass index (BMI).
Procedure
The survey material was developed using the Kent State University Qualtrics
online-survey creation tool and was available to participants through this website. The
questionnaire was composed of three sections including dairy and dairy alternative
consumption, perceptions of dairy, and demographic information of the participants.
Totaling 44 questions, the survey typically took 10 to 15 minutes to complete.
Participants were recruited through the utilization of a random email listserv
obtained from Institutional Research at Kent State University. Email addresses for 1,998
52
potential participants were entered into Qualtrics survey program and divided into two
panels. The questionnaire was sent to participants in late January 2015 and three email
reminders were sent out. Survey responses were collected for four weeks and data was
summarized in late February 2015.
Statistical Analysis
Statistical analysis was completed using SPSS software version 21(IBM, New
York). Descriptive statistics were analyzed including frequencies, means, and standard
deviations for demographic information, consumption of dairy and dairy alternatives, and
perceptions of dairy. T-tests were used to analyze intake and perception differences
between the gender groups of male and female, living situation groups of students living
on campus and students living off campus, and academic status groups of undergraduate
students and graduate students. A p-value of 0.05 was selected a priori for significance.
53
CHAPTER IV
JOURNAL ARTICLE
Introduction
The recommended amount of milk and milk products, including fortified soy
beverages, are three servings per day of fat-free or low-fat milk and milk products for
adults and children and adolescents ages nine to 18 years (USDA, 2010; USDHHS,
2010). Moderate evidence reveals that intake of milk and milk products is linked to
improved bone health (CDC, 2011). The intake of milk and milk products, including
fortified soy beverages, is less than recommended amounts for most adults, adolescents
and children; the average intake of milk in 2005-2006 NHANES was slightly more than
three-fourths cup for individuals two years of age and older (USDA Agricultural
Research Service, 2010).
College attendance typically occurs during young adulthood; a period
characterized by change whereby students explore new environments and adopt new
behaviors; one of these behaviors is dietary choices and habits (Poddar, Hosig, Anderson-
Bill, Nickols-Richardson, & Duncan, 2012). One of these behaviors of concern is the
low intake of dairy products. Larson, Neumark-Sztainer, Harnack, Wall, Story, &
Eisenberg (2009) observed middle adolescent females consumed approximately 3.08
mean daily servings of dairy and middle adolescent males consumed approximately 3.86
mean daily servings of dairy. Between the baseline of middle adolescence and the
54
follow-up of young adulthood, the daily mean total intakes of dairy products was reduced
by approximately 0.5 servings in both genders (Larson et al., 2009). Peak bone mass is
achieved through the third decade of life, therefore adequate calcium intake along with
other essential nutrients found in milk and dairy products are important during young
adulthood (CDC, 2011). National survey data from NHANES 2001-2002 indicate 39%
of young men and 43% of young women between 20 and 29 years of age consume less
than one daily serving of milk and dairy products (Cook & Friday, 2005).
Larson et al. (2009) found personal, behavioral, and socioenvironmental factors
effected the intake of dairy between middle adolescence and young adulthood. Mahon &
Haas (2013) discovered barriers to consuming milk and dairy products in college females
including poor access on campus, unnecessary calories and fat, and side effects. It is
important to understand the perceptions and barriers of milk and dairy products in both
male and female college students to understand what information needs to be educated to
the college population to increase dairy intake.
The Dietary Guidelines for Americans 2010 cites fortified soy beverages as part
of the milk and milk products category (USDA, 2010; USDHHS, 2010). Mahon & Haas
(2013), Larson et al. (2006), and Larson et al. (2009) only looked at milk and dairy
products in their studies, but did not look at intakes of fortified dairy alternatives, which
includes fortified soy beverages, either in adolescents or in young adults. These studies
also did not look at reasons for fortified dairy alternatives consumption in either
population groups. It is important to understand the reasons for dairy alternative
consumption and if these dairy alternatives being consumed are fortified to determine the
55
education that is needed for the individuals in the college population that are consuming
dairy alternatives.
The purpose of this study was to determine the consumption of dairy and dairy
alternatives and the perception of dairy in male and female students enrolled at a Midwest
state university, a region where milk and dairy is readily available. In the present study,
the research hypotheses were males would consume more dairy and dairy alternatives
than females, students living off campus would consume more dairy and dairy
alternatives than students living on campus, and graduate students would consume more
dairy and dairy alternatives than undergraduate students. The study also expected that
there would be differences in the perceptions of dairy between the groups.
Methods
Study Design
This study was a quantitative, non-experimental, post-test only design approved
by Kent State University’s Internal Review Board. The study examined dairy and dairy
alternative consumption in regards to gender, living arrangements, and level of college
education. The study also examined the perceptions of dairy. The independent variables
were gender, living arrangement, and level of college education. The dependent
variables were the consumption of dairy and dairy alternatives and perceptions of dairy.
56
Sample
A convenience sample of students enrolled in courses at Kent State University
were utilized. Inclusion criteria for participants included being a Kent State University
student enrolled in courses and at least 18 years of age. Exclusion criteria for participants
included not being a student enrolled in courses at Kent State University and students
younger than 18 years of age.
Convenience sampling was completed by obtaining a random e-mail listserv from
Institutional Research at Kent State University and sending the link of the on-line survey
to the potential participants. The convenience sample included the 1,998 Kent State
University students.
Questionnaire
The on-line survey consisted of three sections, (Part I: Dairy and Dairy
Alternative Consumption, Part II: Perceptions of Dairy, and Part III: Demographic
Information) (Appendix A). The questionnaire included a total of 44 questions that were
a combination of open- and closed-ended questions.
Part I: Dairy and dairy alternative consumption. Part I of the questionnaire
included 21 questions in regards to dairy and dairy alternative consumption. One
question was the identification of the major type of milk or dairy alternative consumed,
which was from the National Health and Nutrition Examination Survey (NHANES),
which was altered to also include lactose free milk, almond milk, and coconut milk.
Other questions identified whether the dairy alternative was fortified with calcium and
57
reasons for consuming dairy alternatives. Food frequency questions were utilized in
regards to milk, yogurt, cottage cheese, cheese, frozen yogurt, ice cream, and pudding or
custard. These closed-ended questions in the format of multiple choice were from
NHANES. There were also open-ended questions in regards to the average serving size,
in ounces, of milk, yogurt, cottage cheese, cheese, frozen yogurt, ice cream, and pudding
or custard. There were open-ended questions in regards to the frequency of consumption
of coffee and soda and the average serving size of these items.
Part II: Perceptions of dairy. Part II of the questionnaire included 16 closed-
ended questions regarding the perceptions of dairy. These questions utilized a five-point
Likert scale and included options ranging from strongly disagree to strongly agree. The
questions were created to determine the level to which participants agreed with
statements regarding barriers to dairy consumption that were identified in the literature
review.
Part III: Demographic information. Part III of the questionnaire
included seven questions compromised of both open- and closed-ended questions
regarding the demographic characteristics of the participants. These questions identified
gender, age, race/ethnicity, living situation, academic status, height, and weight. The
height and weight information was used to calculate participants’ body mass index
(BMI).
58
Procedures
The survey material was developed using the Kent State University Qualtrics
online-survey creation tool and was available to participants through this website. The
questionnaire was composed of three sections including dairy and dairy alternative
consumption, perceptions of dairy, and demographic information of the participants.
Totaling 44 questions, the survey would typically take 10 to 15 minutes to complete.
Participants were recruited through the utilization of a random email listserv
obtained from Institutional Research at Kent State University. The email listserv
included 1,998 potential participants. Email addresses were entered into Qualtrics survey
program and divided into two panels. The questionnaire was sent to participants in late
January 2015 and three email reminders were sent out. Survey responses were collected
for four weeks and data was summarized in late February 2015.
Statistical Analysis
SPSS software version 21(IBM, New York) was used for statistical analysis of the
data. Descriptive statistics including means, standard deviations, and frequencies were
used to analyze demographic information, consumption of dairy and dairy alternatives,
and perceptions of dairy. The intake and perception data differences between gender
groups of male and female were analyzed using unpaired t-tests. Unpaired t-tests were
also used to analyze the intake and perception differences between the living situation
groups of students living on campus and students living off campus. Unpaired t-tests
were also used to analyze the intake and perception differences between academic status
59
groups of undergraduate and graduate students. A p-value of 0.05 was selected a priori
for significance.
Results
Participant Characteristics
The total number of respondents were 247 and the response rate of the sample
was 12.4%. The majority of the population was female (n=172, 69.6%), Caucasian
(n=189, 76.5%), living off campus with family or relatives (n=79, 32.0%), obtaining a
graduate master’s degree (n=59, 23.9%), and with a normal BMI (n=120, 48.6%). The
average age of the participants was 26.1 ± 9.70 and the average BMI for the participants
was 25.3 ± 5.80. Those whom specified other in regards to race/ethnicity identified as
Native American, African, biracial, Serbian, and Latvian. Table 1 depicts the
demographic distributions for the participants in the study.
The majority frequency of coffee consumption for the participants was one or
more times per day (n=90, 38.6%) or never (n=70, 30.0%). The average serving size of
coffee as stated by participants was 11.4 ± 7.64 ounces. The majority frequency of soda
consumption of the participants was never (n=76, 32.1%) and one to two times per week
(n=45, 18.9%). The average serving size of soda as stated by participants was 11.3 ±
6.97 ounces.
Table 1. Demographic Data of Participants Completing the Dairy and Dairy Alternative
Questionnaire (n=247)
Demographics % (n) x̅ ± SD
Gender
Male
Female
21.5(53)
69.6(172)
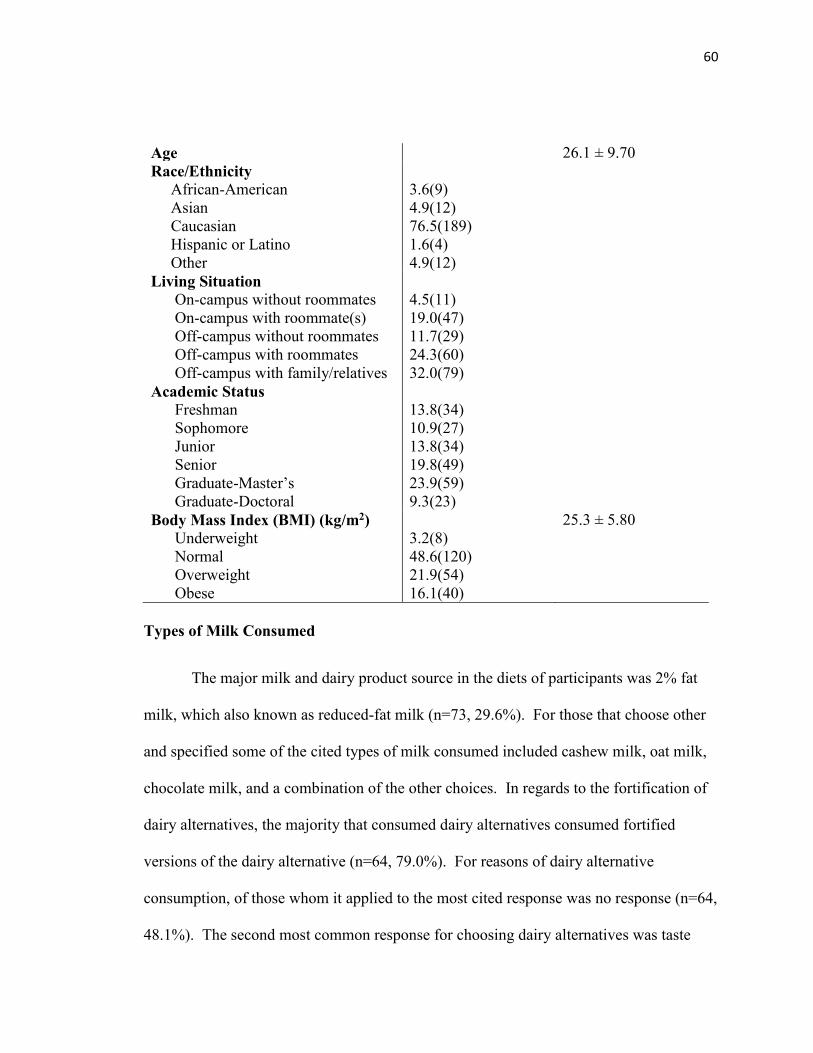
60
Age 26.1 ± 9.70
Race/Ethnicity
African-American
Asian
Caucasian
Hispanic or Latino
Other
3.6(9)
4.9(12)
76.5(189)
1.6(4)
4.9(12)
Living Situation
On-campus without roommates
On-campus with roommate(s)
Off-campus without roommates
Off-campus with roommates
Off-campus with family/relatives
4.5(11)
19.0(47)
11.7(29)
24.3(60)
32.0(79)
Academic Status
Freshman
Sophomore
Junior
Senior
Graduate-Master’s
Graduate-Doctoral
13.8(34)
10.9(27)
13.8(34)
19.8(49)
23.9(59)
9.3(23)
Body Mass Index (BMI) (kg/m2)
Underweight
Normal
Overweight
Obese
3.2(8)
48.6(120)
21.9(54)
16.1(40)
25.3 ± 5.80
Types of Milk Consumed
The major milk and dairy product source in the diets of participants was 2% fat
milk, which also known as reduced-fat milk (n=73, 29.6%). For those that choose other
and specified some of the cited types of milk consumed included cashew milk, oat milk,
chocolate milk, and a combination of the other choices. In regards to the fortification of
dairy alternatives, the majority that consumed dairy alternatives consumed fortified
versions of the dairy alternative (n=64, 79.0%). For reasons of dairy alternative
consumption, of those whom it applied to the most cited response was no response (n=64,
48.1%). The second most common response for choosing dairy alternatives was taste
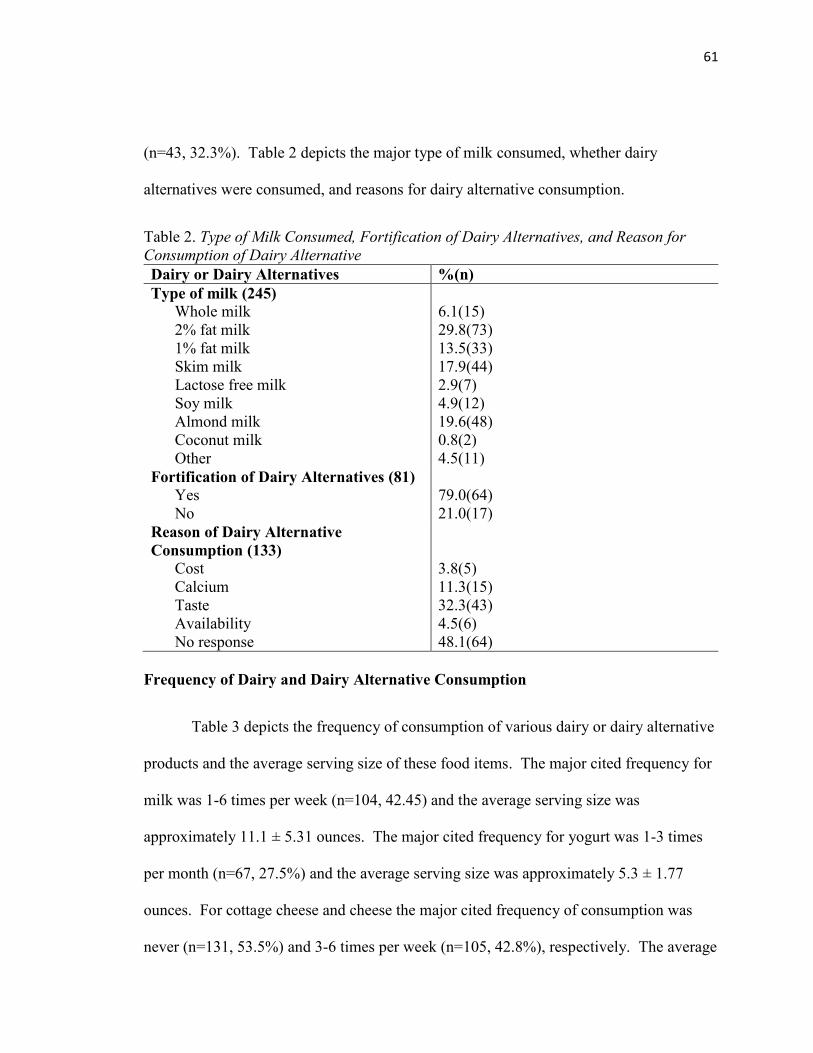
61
(n=43, 32.3%). Table 2 depicts the major type of milk consumed, whether dairy
alternatives were consumed, and reasons for dairy alternative consumption.
Table 2. Type of Milk Consumed, Fortification of Dairy Alternatives, and Reason for
Consumption of Dairy Alternative
Dairy or Dairy Alternatives %(n)
Type of milk (245)
Whole milk
2% fat milk
1% fat milk
Skim milk
Lactose free milk
Soy milk
Almond milk
Coconut milk
Other
6.1(15)
29.8(73)
13.5(33)
17.9(44)
2.9(7)
4.9(12)
19.6(48)
0.8(2)
4.5(11)
Fortification of Dairy Alternatives (81)
Yes
No
79.0(64)
21.0(17)
Reason of Dairy Alternative
Consumption (133)
Cost
Calcium
Taste
Availability
No response
3.8(5)
11.3(15)
32.3(43)
4.5(6)
48.1(64)
Frequency of Dairy and Dairy Alternative Consumption
Table 3 depicts the frequency of consumption of various dairy or dairy alternative
products and the average serving size of these food items. The major cited frequency for
milk was 1-6 times per week (n=104, 42.45) and the average serving size was
approximately 11.1 ± 5.31 ounces. The major cited frequency for yogurt was 1-3 times
per month (n=67, 27.5%) and the average serving size was approximately 5.3 ± 1.77
ounces. For cottage cheese and cheese the major cited frequency of consumption was
never (n=131, 53.5%) and 3-6 times per week (n=105, 42.8%), respectively. The average
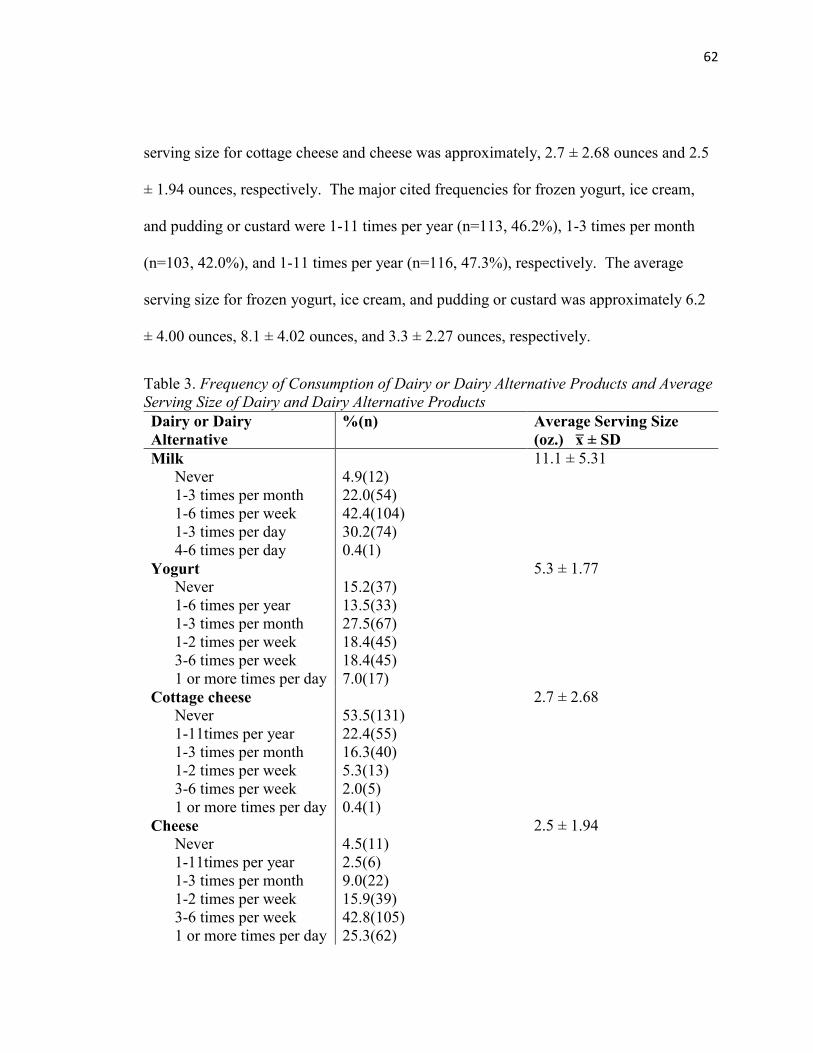
62
serving size for cottage cheese and cheese was approximately, 2.7 ± 2.68 ounces and 2.5
± 1.94 ounces, respectively. The major cited frequencies for frozen yogurt, ice cream,
and pudding or custard were 1-11 times per year (n=113, 46.2%), 1-3 times per month
(n=103, 42.0%), and 1-11 times per year (n=116, 47.3%), respectively. The average
serving size for frozen yogurt, ice cream, and pudding or custard was approximately 6.2
± 4.00 ounces, 8.1 ± 4.02 ounces, and 3.3 ± 2.27 ounces, respectively.
Table 3. Frequency of Consumption of Dairy or Dairy Alternative Products and Average
Serving Size of Dairy and Dairy Alternative Products
Dairy or Dairy
Alternative
%(n) Average Serving Size
(oz.) x̅ ± SD
Milk
Never
1-3 times per month
1-6 times per week
1-3 times per day
4-6 times per day
4.9(12)
22.0(54)
42.4(104)
30.2(74)
0.4(1)
11.1 ± 5.31
Yogurt
Never
1-6 times per year
1-3 times per month
1-2 times per week
3-6 times per week
1 or more times per day
15.2(37)
13.5(33)
27.5(67)
18.4(45)
18.4(45)
7.0(17)
5.3 ± 1.77
Cottage cheese
Never
1-11times per year
1-3 times per month
1-2 times per week
3-6 times per week
1 or more times per day
53.5(131)
22.4(55)
16.3(40)
5.3(13)
2.0(5)
0.4(1)
2.7 ± 2.68
Cheese
Never
1-11times per year
1-3 times per month
1-2 times per week
3-6 times per week
1 or more times per day
4.5(11)
2.5(6)
9.0(22)
15.9(39)
42.8(105)
25.3(62)
2.5 ± 1.94
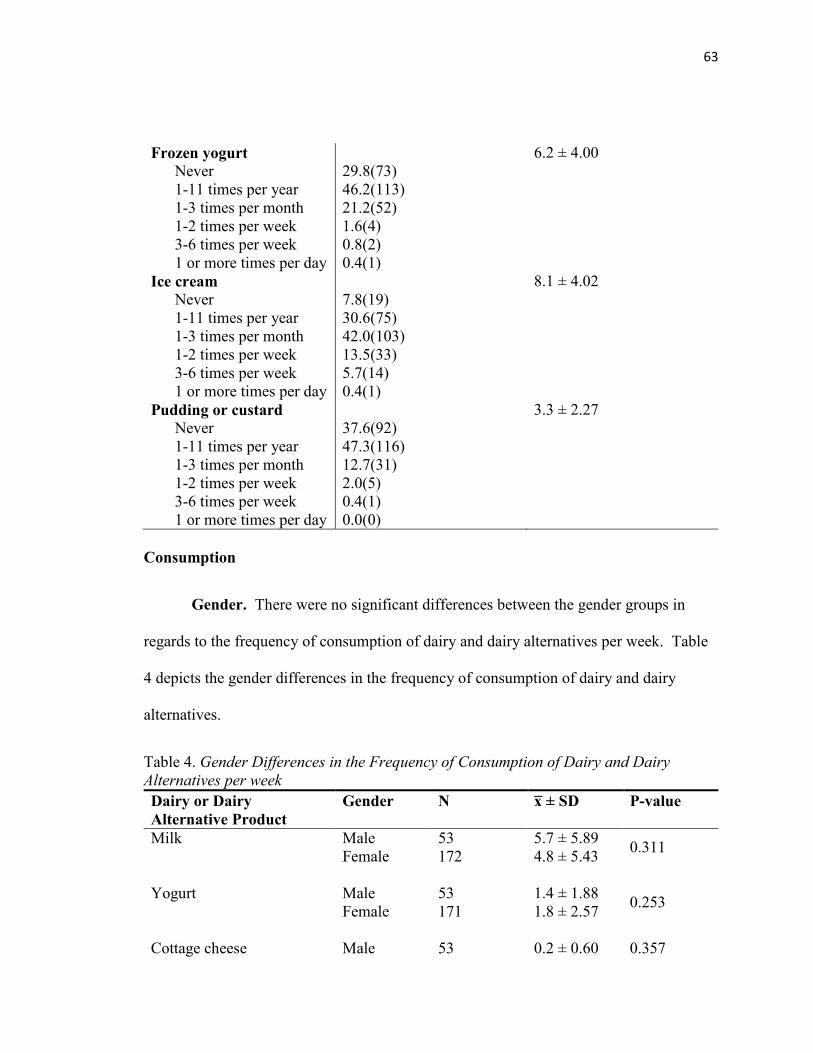
63
Frozen yogurt
Never
1-11 times per year
1-3 times per month
1-2 times per week
3-6 times per week
1 or more times per day
29.8(73)
46.2(113)
21.2(52)
1.6(4)
0.8(2)
0.4(1)
6.2 ± 4.00
Ice cream
Never
1-11 times per year
1-3 times per month
1-2 times per week
3-6 times per week
1 or more times per day
7.8(19)
30.6(75)
42.0(103)
13.5(33)
5.7(14)
0.4(1)
8.1 ± 4.02
Pudding or custard
Never
1-11 times per year
1-3 times per month
1-2 times per week
3-6 times per week
1 or more times per day
37.6(92)
47.3(116)
12.7(31)
2.0(5)
0.4(1)
0.0(0)
3.3 ± 2.27
Consumption
Gender. There were no significant differences between the gender groups in
regards to the frequency of consumption of dairy and dairy alternatives per week. Table
4 depicts the gender differences in the frequency of consumption of dairy and dairy
alternatives.
Table 4. Gender Differences in the Frequency of Consumption of Dairy and Dairy
Alternatives per week
Dairy or Dairy
Alternative Product
Gender N x̅ ± SD P-value
Milk
Male
Female
53
172
5.7 ± 5.89
4.8 ± 5.43
0.311
Yogurt
Male
Female
53
171
1.4 ± 1.88
1.8 ± 2.57
0.253
Cottage cheese Male 53 0.2 ± 0.60 0.357
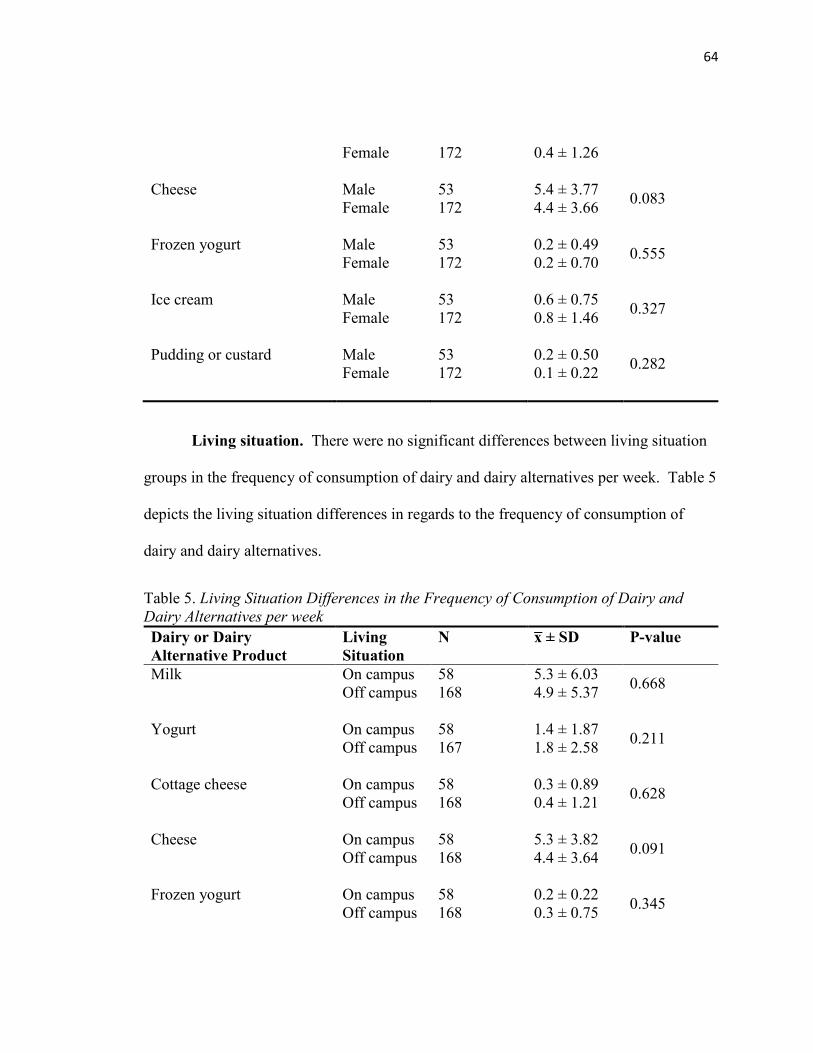
64
Female
172
0.4 ± 1.26
Cheese
Male
Female
53
172
5.4 ± 3.77
4.4 ± 3.66
0.083
Frozen yogurt
Male
Female
53
172
0.2 ± 0.49
0.2 ± 0.70
0.555
Ice cream
Male
Female
53
172
0.6 ± 0.75
0.8 ± 1.46
0.327
Pudding or custard
Male
Female
53
172
0.2 ± 0.50
0.1 ± 0.22
0.282
Living situation. There were no significant differences between living situation
groups in the frequency of consumption of dairy and dairy alternatives per week. Table 5
depicts the living situation differences in regards to the frequency of consumption of
dairy and dairy alternatives.
Table 5. Living Situation Differences in the Frequency of Consumption of Dairy and
Dairy Alternatives per week
Dairy or Dairy
Alternative Product
Living
Situation
N x̅ ± SD P-value
Milk
On campus
Off campus
58
168
5.3 ± 6.03
4.9 ± 5.37
0.668
Yogurt
On campus
Off campus
58
167
1.4 ± 1.87
1.8 ± 2.58
0.211
Cottage cheese
On campus
Off campus
58
168
0.3 ± 0.89
0.4 ± 1.21
0.628
Cheese
On campus
Off campus
58
168
5.3 ± 3.82
4.4 ± 3.64
0.091
Frozen yogurt
On campus
Off campus
58
168
0.2 ± 0.22
0.3 ± 0.75
0.345
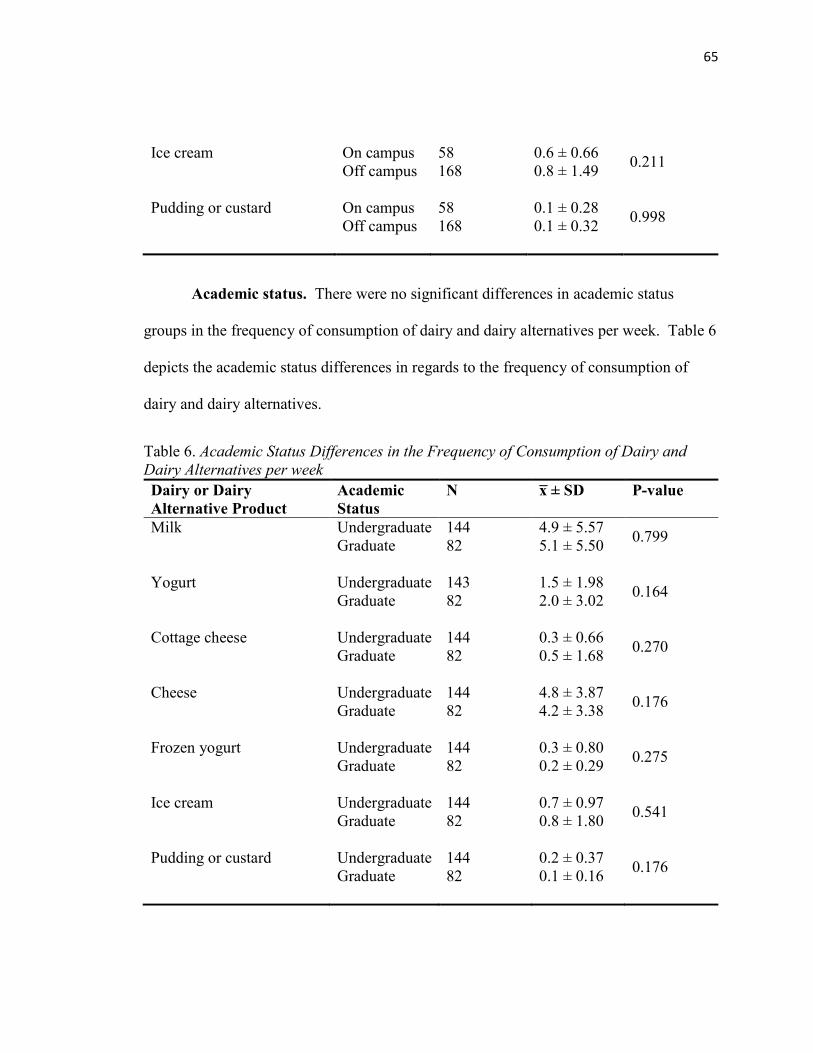
65
Ice cream
On campus
Off campus
58
168
0.6 ± 0.66
0.8 ± 1.49
0.211
Pudding or custard
On campus
Off campus
58
168
0.1 ± 0.28
0.1 ± 0.32
0.998
Academic status. There were no significant differences in academic status
groups in the frequency of consumption of dairy and dairy alternatives per week. Table 6
depicts the academic status differences in regards to the frequency of consumption of
dairy and dairy alternatives.
Table 6. Academic Status Differences in the Frequency of Consumption of Dairy and
Dairy Alternatives per week
Dairy or Dairy
Alternative Product
Academic
Status
N x̅ ± SD P-value
Milk
Undergraduate
Graduate
144
82
4.9 ± 5.57
5.1 ± 5.50
0.799
Yogurt
Undergraduate
Graduate
143
82
1.5 ± 1.98
2.0 ± 3.02
0.164
Cottage cheese
Undergraduate
Graduate
144
82
0.3 ± 0.66
0.5 ± 1.68
0.270
Cheese
Undergraduate
Graduate
144
82
4.8 ± 3.87
4.2 ± 3.38
0.176
Frozen yogurt
Undergraduate
Graduate
144
82
0.3 ± 0.80
0.2 ± 0.29
0.275
Ice cream
Undergraduate
Graduate
144
82
0.7 ± 0.97
0.8 ± 1.80
0.541
Pudding or custard
Undergraduate
Graduate
144
82
0.2 ± 0.37
0.1 ± 0.16
0.176
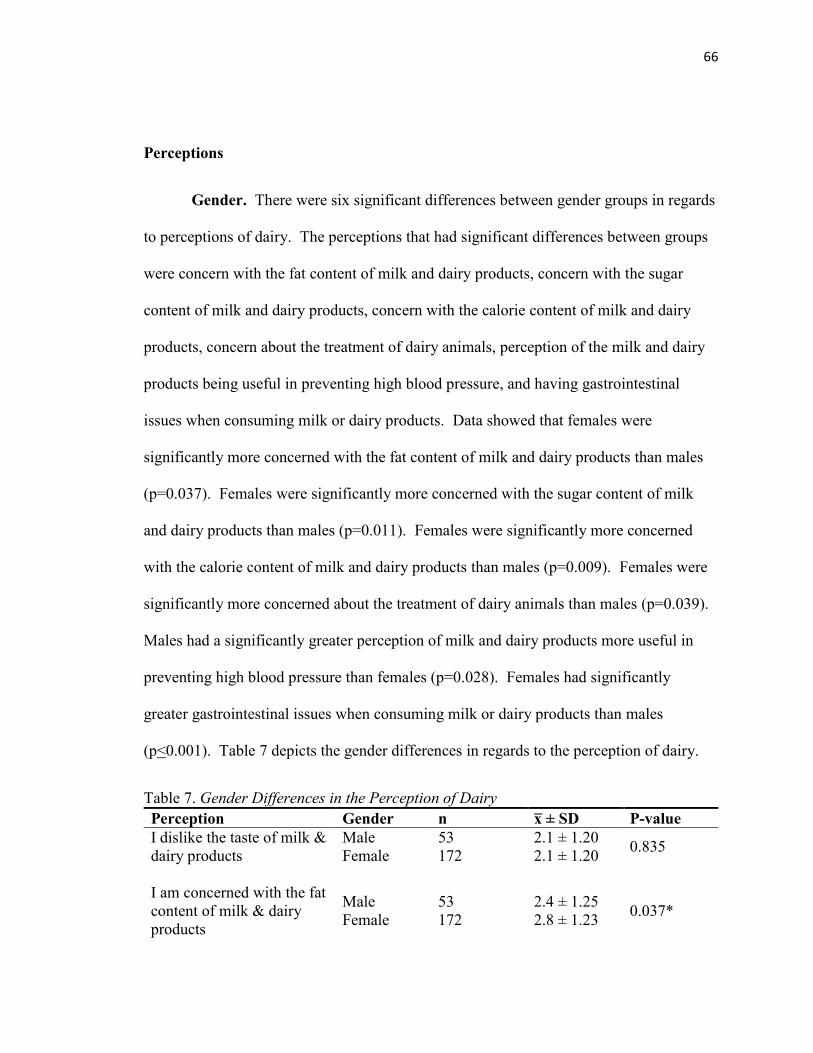
66
Perceptions
Gender. There were six significant differences between gender groups in regards
to perceptions of dairy. The perceptions that had significant differences between groups
were concern with the fat content of milk and dairy products, concern with the sugar
content of milk and dairy products, concern with the calorie content of milk and dairy
products, concern about the treatment of dairy animals, perception of the milk and dairy
products being useful in preventing high blood pressure, and having gastrointestinal
issues when consuming milk or dairy products. Data showed that females were
significantly more concerned with the fat content of milk and dairy products than males
(p=0.037). Females were significantly more concerned with the sugar content of milk
and dairy products than males (p=0.011). Females were significantly more concerned
with the calorie content of milk and dairy products than males (p=0.009). Females were
significantly more concerned about the treatment of dairy animals than males (p=0.039).
Males had a significantly greater perception of milk and dairy products more useful in
preventing high blood pressure than females (p=0.028). Females had significantly
greater gastrointestinal issues when consuming milk or dairy products than males
(p<0.001). Table 7 depicts the gender differences in regards to the perception of dairy.
Table 7. Gender Differences in the Perception of Dairy
Perception Gender n x̅ ± SD P-value
I dislike the taste of milk &
dairy products
Male
Female
53
172
2.1 ± 1.20
2.1 ± 1.20
0.835
I am concerned with the fat
content of milk & dairy
products
Male
Female
53
172
2.4 ± 1.25
2.8 ± 1.23
0.037*
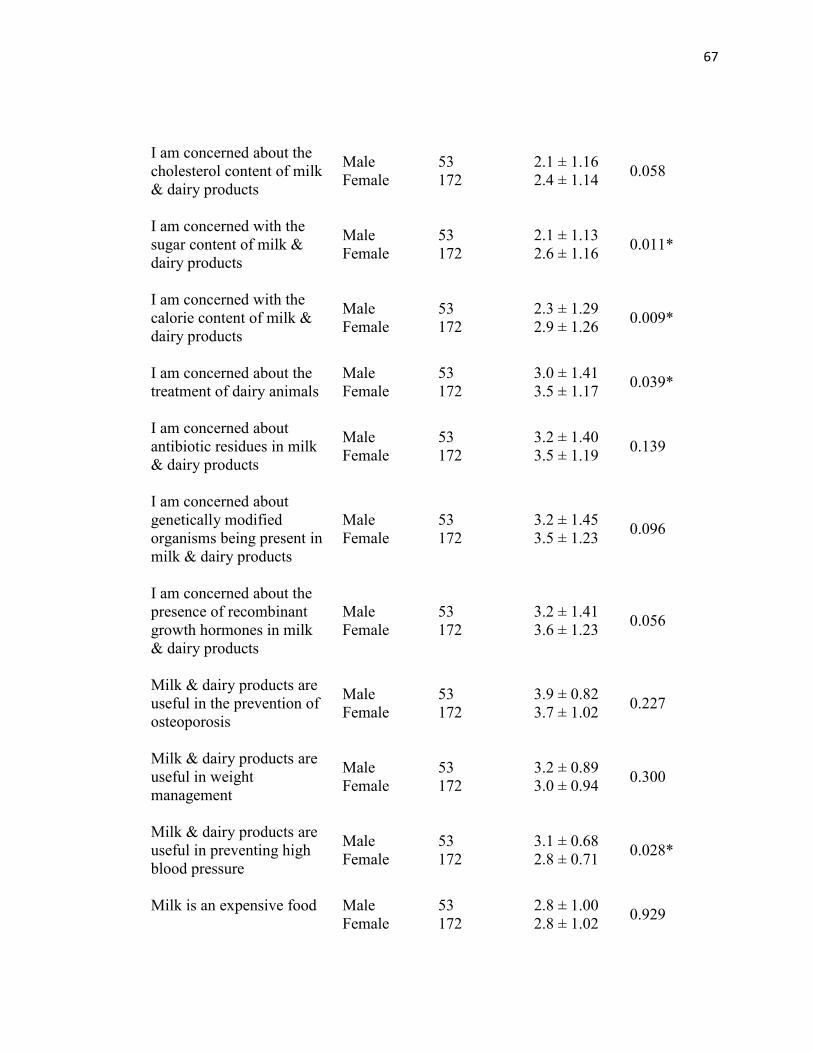
67
I am concerned about the
cholesterol content of milk
& dairy products
Male
Female
53
172
2.1 ± 1.16
2.4 ± 1.14
0.058
I am concerned with the
sugar content of milk &
dairy products
Male
Female
53
172
2.1 ± 1.13
2.6 ± 1.16
0.011*
I am concerned with the
calorie content of milk &
dairy products
Male
Female
53
172
2.3 ± 1.29
2.9 ± 1.26
0.009*
I am concerned about the
treatment of dairy animals
Male
Female
53
172
3.0 ± 1.41
3.5 ± 1.17
0.039*
I am concerned about
antibiotic residues in milk
& dairy products
Male
Female
53
172
3.2 ± 1.40
3.5 ± 1.19
0.139
I am concerned about
genetically modified
organisms being present in
milk & dairy products
Male
Female
53
172
3.2 ± 1.45
3.5 ± 1.23
0.096
I am concerned about the
presence of recombinant
growth hormones in milk
& dairy products
Male
Female
53
172
3.2 ± 1.41
3.6 ± 1.23
0.056
Milk & dairy products are
useful in the prevention of
osteoporosis
Male
Female
53
172
3.9 ± 0.82
3.7 ± 1.02
0.227
Milk & dairy products are
useful in weight
management
Male
Female
53
172
3.2 ± 0.89
3.0 ± 0.94
0.300
Milk & dairy products are
useful in preventing high
blood pressure
Male
Female
53
172
3.1 ± 0.68
2.8 ± 0.71
0.028*
Milk is an expensive food
Male
Female
53
172
2.8 ± 1.00
2.8 ± 1.02
0.929
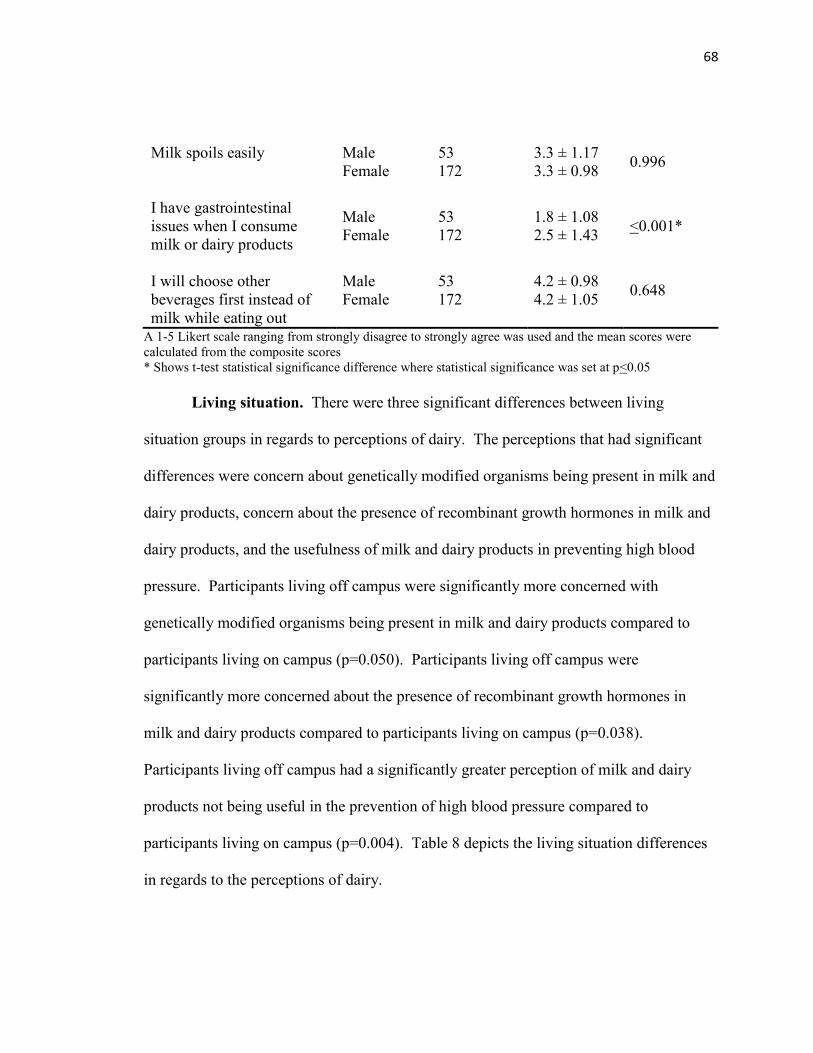
68
Milk spoils easily
Male
Female
53
172
3.3 ± 1.17
3.3 ± 0.98
0.996
I have gastrointestinal
issues when I consume
milk or dairy products
Male
Female
53
172
1.8 ± 1.08
2.5 ± 1.43
<0.001*
I will choose other
beverages first instead of
milk while eating out
Male
Female
53
172
4.2 ± 0.98
4.2 ± 1.05
0.648
A 1-5 Likert scale ranging from strongly disagree to strongly agree was used and the mean scores were
calculated from the composite scores
* Shows t-test statistical significance difference where statistical significance was set at p<0.05
Living situation. There were three significant differences between living
situation groups in regards to perceptions of dairy. The perceptions that had significant
differences were concern about genetically modified organisms being present in milk and
dairy products, concern about the presence of recombinant growth hormones in milk and
dairy products, and the usefulness of milk and dairy products in preventing high blood
pressure. Participants living off campus were significantly more concerned with
genetically modified organisms being present in milk and dairy products compared to
participants living on campus (p=0.050). Participants living off campus were
significantly more concerned about the presence of recombinant growth hormones in
milk and dairy products compared to participants living on campus (p=0.038).
Participants living off campus had a significantly greater perception of milk and dairy
products not being useful in the prevention of high blood pressure compared to
participants living on campus (p=0.004). Table 8 depicts the living situation differences
in regards to the perceptions of dairy.
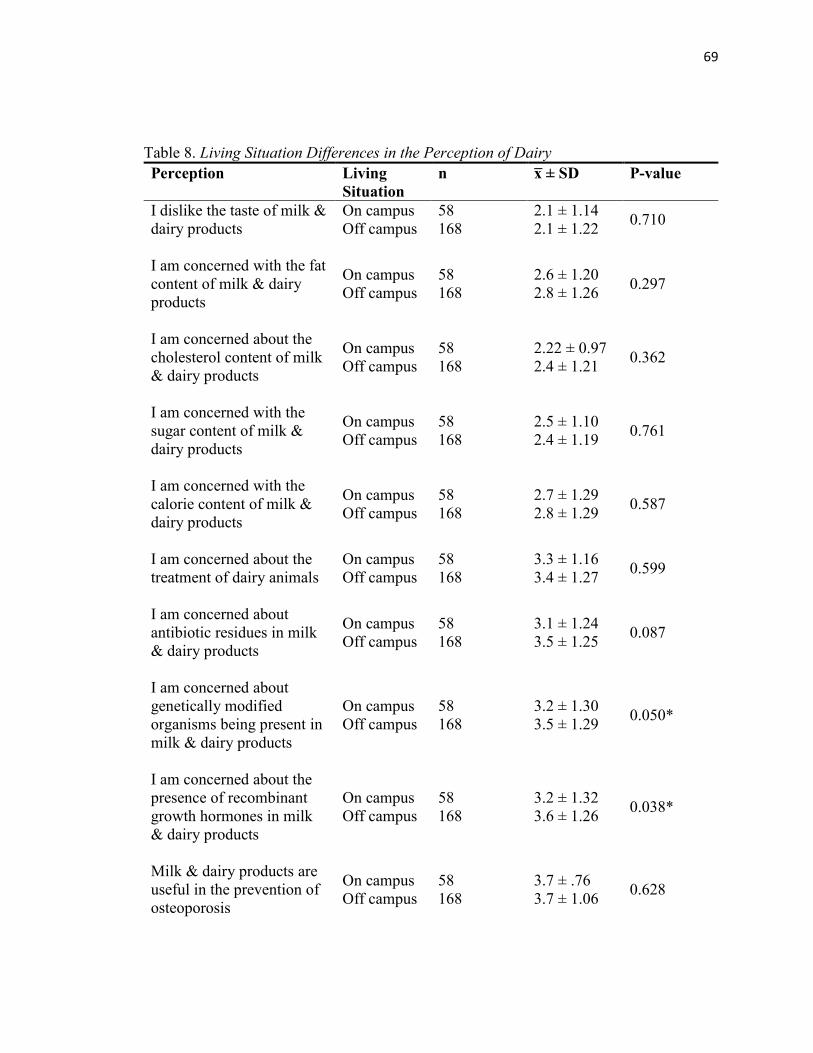
69
Table 8. Living Situation Differences in the Perception of Dairy
Perception Living
Situation
n x̅ ± SD P-value
I dislike the taste of milk &
dairy products
On campus
Off campus
58
168
2.1 ± 1.14
2.1 ± 1.22
0.710
I am concerned with the fat
content of milk & dairy
products
On campus
Off campus
58
168
2.6 ± 1.20
2.8 ± 1.26
0.297
I am concerned about the
cholesterol content of milk
& dairy products
On campus
Off campus
58
168
2.22 ± 0.97
2.4 ± 1.21
0.362
I am concerned with the
sugar content of milk &
dairy products
On campus
Off campus
58
168
2.5 ± 1.10
2.4 ± 1.19
0.761
I am concerned with the
calorie content of milk &
dairy products
On campus
Off campus
58
168
2.7 ± 1.29
2.8 ± 1.29
0.587
I am concerned about the
treatment of dairy animals
On campus
Off campus
58
168
3.3 ± 1.16
3.4 ± 1.27
0.599
I am concerned about
antibiotic residues in milk
& dairy products
On campus
Off campus
58
168
3.1 ± 1.24
3.5 ± 1.25
0.087
I am concerned about
genetically modified
organisms being present in
milk & dairy products
On campus
Off campus
58
168
3.2 ± 1.30
3.5 ± 1.29
0.050*
I am concerned about the
presence of recombinant
growth hormones in milk
& dairy products
On campus
Off campus
58
168
3.2 ± 1.32
3.6 ± 1.26
0.038*
Milk & dairy products are
useful in the prevention of
osteoporosis
On campus
Off campus
58
168
3.7 ± .76
3.7 ± 1.06
0.628
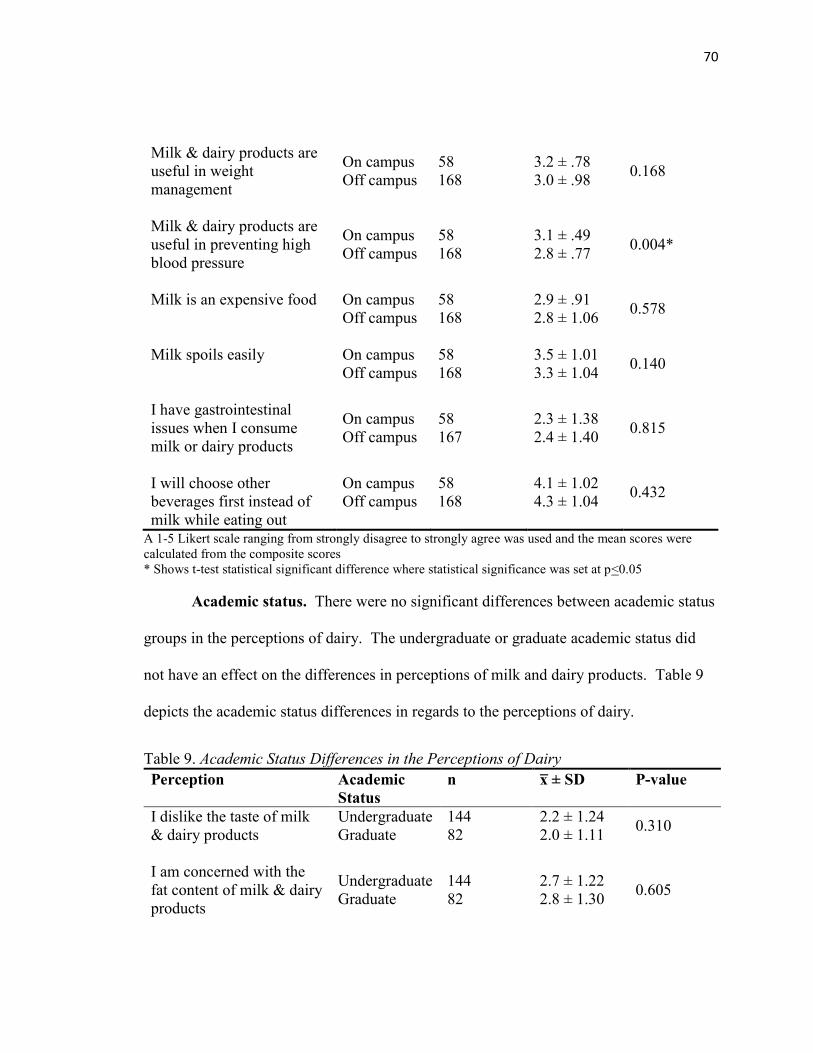
70
Milk & dairy products are
useful in weight
management
On campus
Off campus
58
168
3.2 ± .78
3.0 ± .98
0.168
Milk & dairy products are
useful in preventing high
blood pressure
On campus
Off campus
58
168
3.1 ± .49
2.8 ± .77
0.004*
Milk is an expensive food
On campus
Off campus
58
168
2.9 ± .91
2.8 ± 1.06
0.578
Milk spoils easily
On campus
Off campus
58
168
3.5 ± 1.01
3.3 ± 1.04
0.140
I have gastrointestinal
issues when I consume
milk or dairy products
On campus
Off campus
58
167
2.3 ± 1.38
2.4 ± 1.40
0.815
I will choose other
beverages first instead of
milk while eating out
On campus
Off campus
58
168
4.1 ± 1.02
4.3 ± 1.04
0.432
A 1-5 Likert scale ranging from strongly disagree to strongly agree was used and the mean scores were
calculated from the composite scores
* Shows t-test statistical significant difference where statistical significance was set at p<0.05
Academic status. There were no significant differences between academic status
groups in the perceptions of dairy. The undergraduate or graduate academic status did
not have an effect on the differences in perceptions of milk and dairy products. Table 9
depicts the academic status differences in regards to the perceptions of dairy.
Table 9. Academic Status Differences in the Perceptions of Dairy
Perception Academic
Status
n x̅ ± SD P-value
I dislike the taste of milk
& dairy products
Undergraduate
Graduate
144
82
2.2 ± 1.24
2.0 ± 1.11
0.310
I am concerned with the
fat content of milk & dairy
products
Undergraduate
Graduate
144
82
2.7 ± 1.22
2.8 ± 1.30
0.605
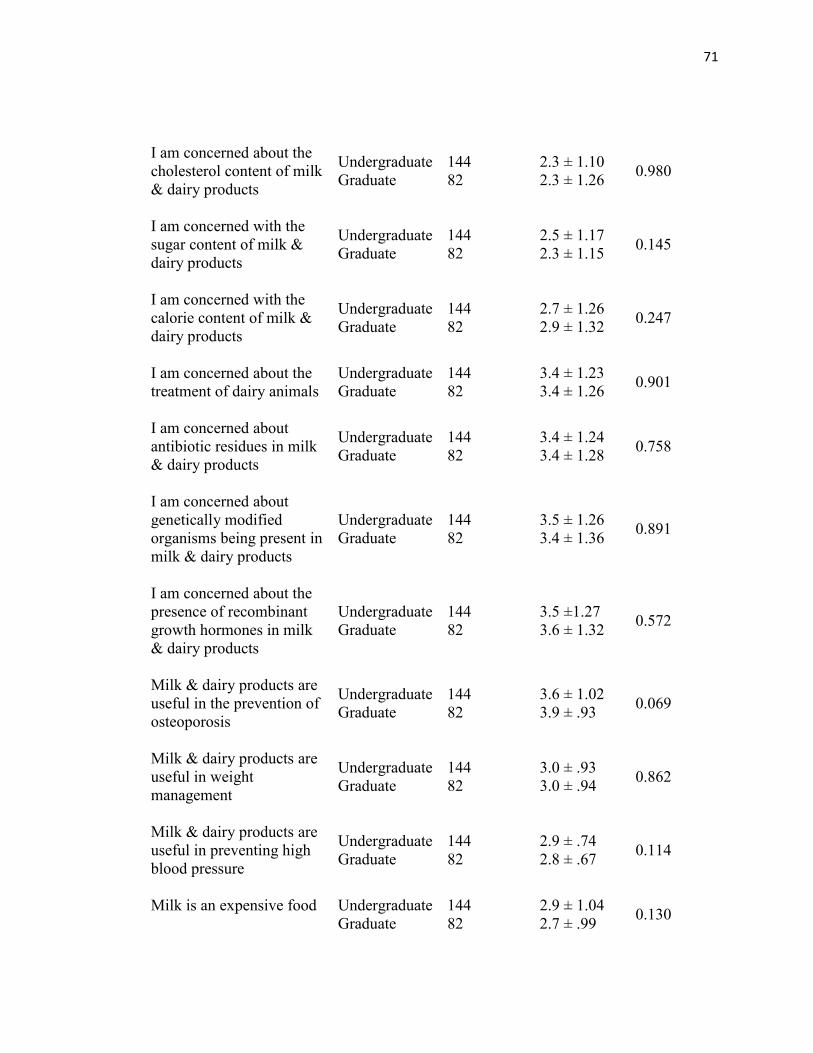
71
I am concerned about the
cholesterol content of milk
& dairy products
Undergraduate
Graduate
144
82
2.3 ± 1.10
2.3 ± 1.26
0.980
I am concerned with the
sugar content of milk &
dairy products
Undergraduate
Graduate
144
82
2.5 ± 1.17
2.3 ± 1.15
0.145
I am concerned with the
calorie content of milk &
dairy products
Undergraduate
Graduate
144
82
2.7 ± 1.26
2.9 ± 1.32
0.247
I am concerned about the
treatment of dairy animals
Undergraduate
Graduate
144
82
3.4 ± 1.23
3.4 ± 1.26
0.901
I am concerned about
antibiotic residues in milk
& dairy products
Undergraduate
Graduate
144
82
3.4 ± 1.24
3.4 ± 1.28
0.758
I am concerned about
genetically modified
organisms being present in
milk & dairy products
Undergraduate
Graduate
144
82
3.5 ± 1.26
3.4 ± 1.36
0.891
I am concerned about the
presence of recombinant
growth hormones in milk
& dairy products
Undergraduate
Graduate
144
82
3.5 ±1.27
3.6 ± 1.32
0.572
Milk & dairy products are
useful in the prevention of
osteoporosis
Undergraduate
Graduate
144
82
3.6 ± 1.02
3.9 ± .93
0.069
Milk & dairy products are
useful in weight
management
Undergraduate
Graduate
144
82
3.0 ± .93
3.0 ± .94
0.862
Milk & dairy products are
useful in preventing high
blood pressure
Undergraduate
Graduate
144
82
2.9 ± .74
2.8 ± .67
0.114
Milk is an expensive food
Undergraduate
Graduate
144
82
2.9 ± 1.04
2.7 ± .99
0.130
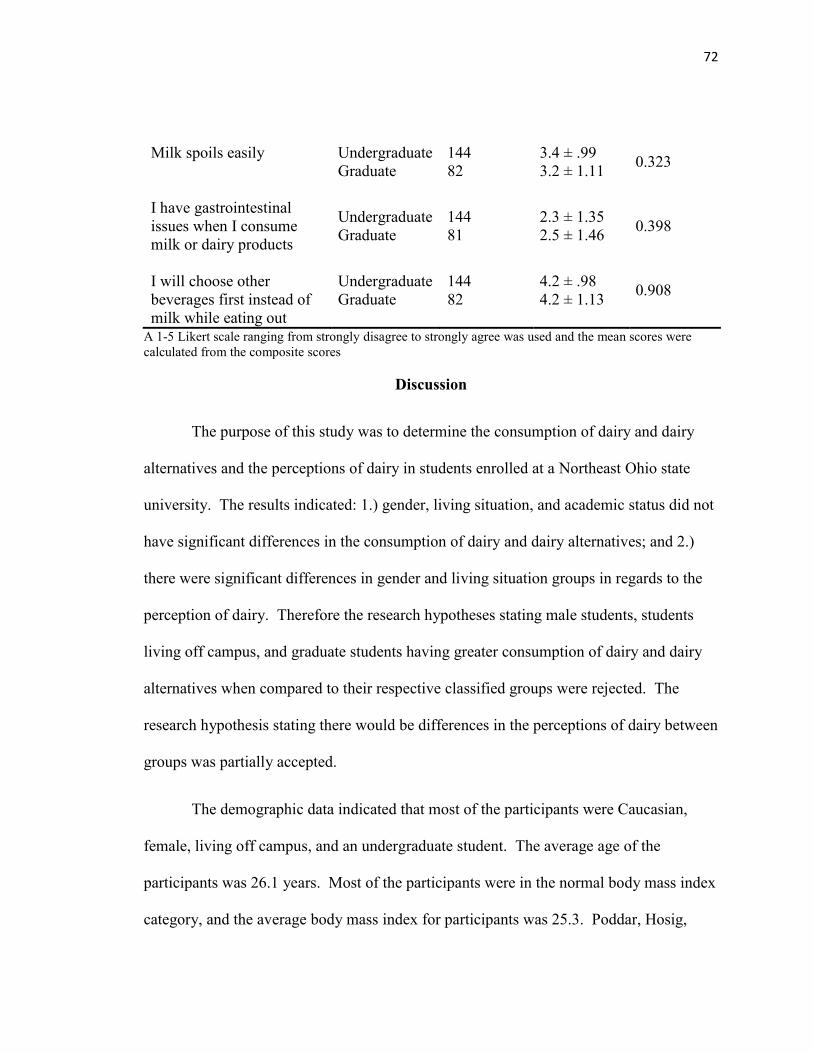
72
Milk spoils easily
Undergraduate
Graduate
144
82
3.4 ± .99
3.2 ± 1.11
0.323
I have gastrointestinal
issues when I consume
milk or dairy products
Undergraduate
Graduate
144
81
2.3 ± 1.35
2.5 ± 1.46
0.398
I will choose other
beverages first instead of
milk while eating out
Undergraduate
Graduate
144
82
4.2 ± .98
4.2 ± 1.13
0.908
A 1-5 Likert scale ranging from strongly disagree to strongly agree was used and the mean scores were
calculated from the composite scores
Discussion
The purpose of this study was to determine the consumption of dairy and dairy
alternatives and the perceptions of dairy in students enrolled at a Northeast Ohio state
university. The results indicated: 1.) gender, living situation, and academic status did not
have significant differences in the consumption of dairy and dairy alternatives; and 2.)
there were significant differences in gender and living situation groups in regards to the
perception of dairy. Therefore the research hypotheses stating male students, students
living off campus, and graduate students having greater consumption of dairy and dairy
alternatives when compared to their respective classified groups were rejected. The
research hypothesis stating there would be differences in the perceptions of dairy between
groups was partially accepted.
The demographic data indicated that most of the participants were Caucasian,
female, living off campus, and an undergraduate student. The average age of the
participants was 26.1 years. Most of the participants were in the normal body mass index
category, and the average body mass index for participants was 25.3. Poddar, Hosig,
73
Anderson-Bill, Nickols-Richardson, & Duncan (2012) and Poddar, Hosig, Nickols-
Richardson, Anderson, Herbert, & Duncan (2009) had race/ethnicity, gender, and body
mass index values also had the similar representative samples; however, these studies
looked at undergraduate students and did not look at whether participants lived on
campus or off campus. Since this study accounted for graduate students at a university
setting, the average age for the participants was greater than these other studies.
The results of the current investigation indicated that 69.7% were consuming
dairy while 29.6% were consuming dairy alternatives. The results of the current
investigation indicated that the participants, whether consuming dairy or dairy
alternatives, are not consuming the recommended three cups of dairy or dairy alternatives
to meet nutrients of concern. This is in alignment with Mahon & Haas (2013) whom
found that on average the college participants in their study were consuming less than one
serving of dairy per day. Strong, Parks, Anderson, Winett, & Davy (2008) concluded
that the average college student consumes 0.5 servings of dairy daily.
The current investigation was different from other studies; it looked at dairy
alternative consumption to see if dairy alternatives were replacing dairy in the diet of
college students. The results of the current investigation indicated that dairy alternatives
are not replacing dairy in the diets of college students. Students consuming dairy
alternatives are still not getting the recommended three cups of fortified dairy alternatives
in order to meet requirements of nutrients of concern, specifically calcium. It is possible
that there are more barriers associated with the consumption of dairy alternatives. Some
of these barriers might be that dairy alternatives are categorized in the same category of
74
milk and dairy, the price of dairy alternatives, the decreased accessibility of dairy
alternatives, and the unfamiliarity of dairy alternatives if individuals did not grow up with
dairy alternatives. Due to the possible barriers of dairy alternatives, dairy alternatives
may be less desirable than milk and dairy products.
Consumption
The current investigation indicated that gender, living situation, and academic
status did not have significant differences in the consumption of dairy or dairy
alternatives between groups. The current investigation found no significant differences in
consumption of males and females. The current investigation conflicted with Mahon &
Haas (2013) whom found that college men consumed significantly more dairy than
college women. Dietary Guidelines Advisory Committee (2010) found that more than
90% of all women consume less than the recommended amount of milk and milk
products, and more than 75% of adult men consume less than the recommended amount
of milk and milk products. The current investigation found both males and females are
not meeting the recommended three cups of dairy or fortified dairy alternatives to meet
nutrients of concern outlined in the Dietary Guidelines for Americans, 2010.
A possible barrier to the consumption of milk and dairy products for males and
females in a college environment is the availability of other beverages including energy
drinks, sports drinks, soda, and coffee that are associated with positive perceptions with
their consumption. Coffee, with its caffeine content, is positively perceived to help with
stimulation helping students stay awake in class and during late night study sessions.
75
Another possible barrier to the consumption of milk and dairy products are the
misconceptions and myths associated with consuming milk and dairy products. One
misconception is that individuals with lactose intolerance need to avoid all milk and dairy
products, when in fact most people with lactose intolerance can still enjoy milk and dairy
products by choosing lactose free products or consuming lactase enzymes prior to
consuming milk and dairy products.
The literature is mixed in regards to living situation and the consumption of dairy.
Some studies have found higher intakes of dairy among students living or eating on
campus while another study found students living on campus reduced their meal
frequency and intake of dairy (Pelletier & Laska, 2013). The current investigation found
no significant differences in the consumption of students living on campus and students
living off campus. A possible barrier to consumption of dairy of students living on
campus is the meal plan; the university under investigation has a pay per item type dining
instead of an all you care to eat dining. This might be seen as a barrier to the
consumption of milk and dairy products since students may perceive it pricey to purchase
these products compared to other products. A possible barrier to the consumption of
dairy of students living off campus is time; taking the time to go shopping and prepare
healthy meals, including milk and dairy products, might be seen as an inefficient use of
time to study or socialize. Financial restrictions and the misconceptions of healthy foods,
including milk and dairy products, might also be barriers to the consumption of students
living off campus.
76
The current investigation found no significant differences in the consumption of
graduate students and undergraduate students. Of the reviewed literature, Mahon & Haas
(2013) included graduate students in the study; however, did not compare consumption of
dairy between undergraduate students and graduate students. Possible barriers for
undergraduate students and graduate students of milk and dairy product consumption are
the lack of knowledge regarding health benefits, myths and misconceptions of milk and
dairy products, the competition of other beverages in the diet, and social, cultural, or
economic factors that preclude the consumption of milk and dairy products.
Perception
The current investigation found significant differences in regards to gender and
the perceptions of dairy. The current investigation showed females were more concerned
with the fat content, sugar content, and calorie content of milk, and stated having greater
gastrointestinal issues when consuming milk or dairy products. In a focus group with
college females, Mahon & Haas (2013) found that perceived barriers to consuming dairy
included the fat and calories associated with dairy products, which helps confirm the
results of this study. Participants also referenced particular ill effects of consuming dairy,
which may deter some females from consuming dairy, which confirms the results of the
current investigation (Mahon & Haas, 2013). The current investigation found females
were concerned with the sugar content of milk and dairy. The sugar content of milk and
dairy products could be a possible barrier to consumption, and may have been a reason
for the low consumption of milk and dairy products of females in the current
investigation. This shows that females perceive milk as less appealing than other
77
beverages. The results of the current investigation illustrate the overall myths and
misconceptions of beverages and their consumption.
Females had a significantly greater concern for the treatment of dairy animals
compared to males. Herzog (2007) found that women, on average, show higher levels of
positive behaviors and attitudes towards animals (e.g. attitudes towards their use,
involvement in animal protection), whereas men typically have higher levels of negative
attitudes and behaviors (e.g. hunting, animal abuse, less favorable attitudes toward animal
protection). The current investigation confirms that females had a greater concern for the
welfare and treatment of dairy animals compared to the perception of males in regards to
concern for the treatment of dairy animals. The concern over the treatment of the dairy
animals may be a possible barrier to the consumption of milk and dairy since some
individuals choose not to consume dairy to make a statement to the dairy industry
regarding the welfare of dairy animals.
The current investigation showed males had a greater perception of milk and dairy
products being useful in the prevention of high blood pressure. While this result was
statistically significant, this result may not actually in significant in reality. This result of
the current investigation can not be explained. The result does help illustrate the myths
and misconceptions in regards to consuming milk and dairy products and perceived
health benefits and health risks of young adults compared to the consumption of other
beverages and their perceived health benefits and risks.
78
The current investigation showed significant differences in regards to living
situation and the perceptions of dairy. Participants living off campus were more
concerned with genetically modified organisms and recombinant growth hormones being
present in dairy, and perceived milk and dairy products not being useful in the prevention
of high blood pressure. Currently there is no published literature that discusses living
situation and perceptions of dairy; most of the published literature for perceptions of
dairy is related to gender (Mahon & Haas, 2013). The concern of genetically modified
organisms and recombinant growth hormones being present in dairy and dairy not being
useful in the prevention of high blood pressure may possibly be barriers to the
consumption of milk and dairy products of students living off campus in the current
investigation.
The results showed that participants are consuming coffee and soda; 38.6% of
participants were consuming coffee one or more times per day and 15.6% are consuming
soda one or more times per day. Pelletier & Laska (2013) found students living on and
off campus are exposed to the campus food environment including dining halls, vending
machines, a la carte dining facilities, and nearby stores and restaurants, which compete
with fast food restaurants and other retail food outlets for students’ patronage. The study
also found that frequently purchasing campus area food or beverages was associated with
higher consumption of fat and added sugars and lower consumption of dairy. It is
important to know if students are consuming other beverages which potentially could be
replacing milk and dairy in the diet. It is also important to be aware that the caffeine in
79
soda and caffeine inhibits calcium absorption, which calcium is nutrient of concern as
outlined in the Dietary Guidelines for Americans, 2010.
Limitations
There are limitations that exist with this study. The validity of the questionnaire
is a limitation since some of the questions were developed by the researcher, and
therefore the reliability of these questions have not been tested. The perception questions
were not totaled to see if the overall perception of dairy was good, fair, or poor. This
could not be done due to the fact that the questions were not all stated in neutral way.
Another limitation of this study was the data was self-reported. The validity of
the responses, whether open-ended or closed-ended questions, cannot be determined.
The open-ended questions in regards to average serving size should be interpreted
cautiously since participants are not familiar with the amount of food or beverage that
classifies as a serving size even though similar representations were stated in the question
of various serving sizes. The question also specified ounces and some participants listed
the serving size in cups, which then was converted and could have lost significance.
Applications
The 2005 Dietary Guidelines Advisory Committee reported that seven out of
seven randomized controlled trials and 25 out of 32 observational studies showed a
significantly positive association between dairy food intake and bone mineral content or
bone mineral density (Heaney, 2000). This study showed that college students are not
consuming enough dairy products or fortified dairy alternative products to meet the
80
Dietary Guidelines for Americans foods and nutrients of concern, specifically dairy and
calcium.
Osteoporosis is a growing concern in America that affects 10 million Americans,
causes two million fractures per year, and cost the nation roughly $19 billion annually.
By 2020, the number of people afflicted is expected to increase to 14 million cases of
osteoporosis and more than 47 million cases of low bone mass (Benjamin, 2010).
Osteoporosis and osteopenia are largely preventable diseases. Calcium, vitamin D,
phosphorus, and magnesium are nutrients that are necessary for bone health (Prentice,
2004). Milk and dairy products fortified with vitamin D is one food source that contains
all of these nutrients.
One of the largest modifiable determinants for bone health is nutrition, including
the consumption of soda and coffee (Benjamin, 2010). The United States was ranked
first among the countries with high soft drink consumption; the National Soft Drink
Association reported that during 1998, Americans drank over 14 billion gallons of soft
drink, which averaged more than 56 gallons of soft drink per person. Results from the
United States Department of Agriculture’s 1996 Continuing Survey of Food Intakes by
Individuals indicated that 50.3% of Americans consume carbonated soft drinks (Kassem,
Lee, Modeste & Johnston, 2003). The current investigation found that 15.6% of
participants indicated consuming soda one or more times per day.
The high level of soda consumption has been associated with some health
consequences. Guenther (1986) found that soft drink intake was negatively correlated
81
with the intake of milk, and the nutrients calcium, magnesium, riboflavin, vitamin A, and
ascorbic acid. Mazariegos-Ramos et al. (1995) found a significant association between
the intakes of at least 1.5 soft drinks containing phosphoric acid per week and
hypocalcemia in children 2.4 to 5.6 years of age.
Coffee is widely consumed in the United States, as well as in Europe. This study
found that 38.6% of participants stated consuming coffee one or more times per day.
There have been positive and negative health effects associated with coffee consumption.
One suggested negative effect of coffee consumption is an increased risk of hip fractures
(Hallstrom et al., 2013). High intakes of coffee and caffeine have been associated with
increased risk of fractures in some observational studies and recent in vitro studies have
suggested that caffeine has direct and indirect deleterious effects on osteoblasts
(Hallstrom et al., 2013).
Older adults, Caucasian and Asian women, post-menopausal women, people with
a low body weight, and those with low calcium intakes are most at risk for osteoporosis
(Benjamin, 2010). Gammage, Gasparotto, Mack, & Klentrou (2012) found that women
and men university students displayed marginal knowledge of the health risks associated
with osteoporosis. Mahon & Haas (2013) found that on average university students
consume less than one serving of dairy per day and men consumed significantly more
dairy than women. Although, this study showed no significant differences in the
consumption of dairy, women are more susceptible to osteoporosis.
82
College students may be more receptive to new advice compared with older
adults; therefore nutrition interventions targeting improved dairy intake may be
successful in this population (Poddar et al., 2012). Currently, we are using social
marketing campaigns to try to increase dairy consumption and these campaigns are not
working based on the results of the current investigation. It is important for nutrition
professionals to decrease the fallacies associated with dairy and consuming dairy and
start to increase positive perceptions associated with dairy and dairy consumption.
The 2005 Dietary Guidelines for Americans and the MyPlate recommendations
include soy beverages fortified with calcium and vitamins A and D as part of the milk
and dairy group for individuals with lactose intolerance and milk allergy (USDA, 2010;
USDHHS, 2010; USDA, n.d.). The results of the current investigation indicated that
individuals whom choose to consume soy beverages and other dairy alternatives are not
consuming the recommended amount and the products are not always fortified. It is
important that nutrition professionals educate individuals with lactose intolerance with
methods to still consume dairy by choosing lactose free products, consuming lactase
enzymes prior to consuming dairy, or developing a threshold level for consuming dairy
products. For the individuals whom suffer from milk allergy, it is important for nutrition
professionals to educate these individuals on the importance of choosing fortified dairy
alternatives and helping them to identify a dairy alternative that have similar nutrition to
milk and dairy products.
The purpose of the 2005 Dietary Guidelines for Americans and the MyPlate
recommendations for adding fortified soy milk as an option to the milk and dairy group
83
was to provide an alternative to meeting nutrients that are found in dairy products for
individuals with lactose intolerance and milk allergy. Instead, the guidelines and
recommendations only added more confusion to dairy consumption. The guidelines are
not being met whether individuals are consuming dairy or dairy alternatives and this
could be a result of a lack of understanding and knowledge of dairy and dairy alternatives
and the perceptions of dairy and dairy alternatives, which are categorized within the same
dietary food group. It is important to educate individuals on dairy and dairy alternatives
by dispelling the myths and misconceptions and changing the perceptions of these foods.
Dietitians can play a valuable role in helping patients achieve maximal physical
function and bone accrual (Office of the Surgeon General, 2004). Childhood is an
excellent time to initiate counseling aimed at encouraging appropriate nutrition and
physical activities and discouraging the adoption of behaviors that negatively affect bone
health. All young and middle-aged adults should be encouraged to adopt lifestyles that
help prevent bone loss and promote overall health and the prevention of chronic disease
(Office of the Surgeon General, 2004).
Conclusions
This study demonstrated that university students at a Northeast Ohio state
university are consuming dairy and dairy alternatives, but are not consuming enough
servings daily to meet the Dietary Guidelines for Americans, 2010. Dairy alternatives are
not replacing dairy in the diets of university students. The biggest concerns in regards to
perception regards gender and misconceptions of dairy, especially for females. Therefore

84
it is important to educate university students the importance of having three daily
servings of dairy or fortified dairy alternatives, the appropriate serving size of dairy
products, and dispelling the misconceptions regarding dairy.

APPENDICES
APPENDIX A
DAIRY AND DAIRY ALTERNATIVE AND PERCEPTIONS OF DAIRY
QUESTIONNAIRE
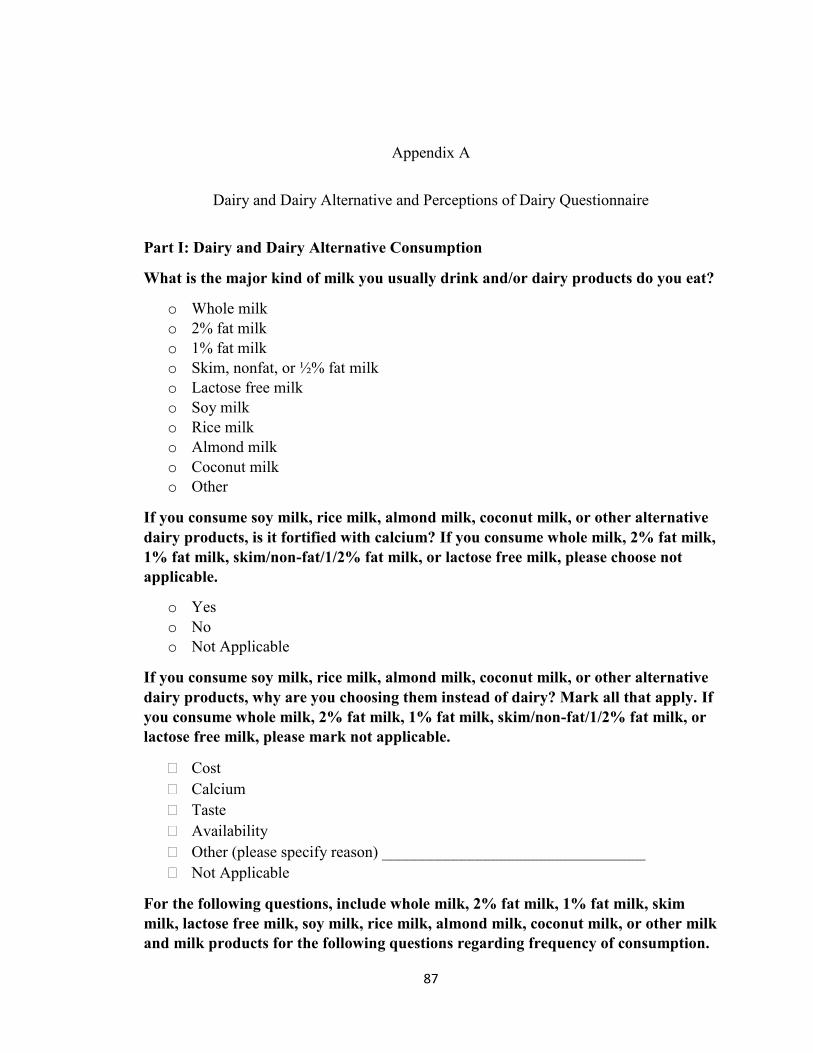
87
Appendix A
Dairy and Dairy Alternative and Perceptions of Dairy Questionnaire
Part I: Dairy and Dairy Alternative Consumption
What is the major kind of milk you usually drink and/or dairy products do you eat?
o Whole milk
o 2% fat milk
o 1% fat milk
o Skim, nonfat, or ½% fat milk
o Lactose free milk
o Soy milk
o Rice milk
o Almond milk
o Coconut milk
o Other
If you consume soy milk, rice milk, almond milk, coconut milk, or other alternative
dairy products, is it fortified with calcium? If you consume whole milk, 2% fat milk,
1% fat milk, skim/non-fat/1/2% fat milk, or lactose free milk, please choose not
applicable.
o Yes
o No
o Not Applicable
If you consume soy milk, rice milk, almond milk, coconut milk, or other alternative
dairy products, why are you choosing them instead of dairy? Mark all that apply. If
you consume whole milk, 2% fat milk, 1% fat milk, skim/non-fat/1/2% fat milk, or
lactose free milk, please mark not applicable.
Cost
Calcium
Taste
Availability
Other (please specify reason) _________________________________
Not Applicable
For the following questions, include whole milk, 2% fat milk, 1% fat milk, skim
milk, lactose free milk, soy milk, rice milk, almond milk, coconut milk, or other milk
and milk products for the following questions regarding frequency of consumption.
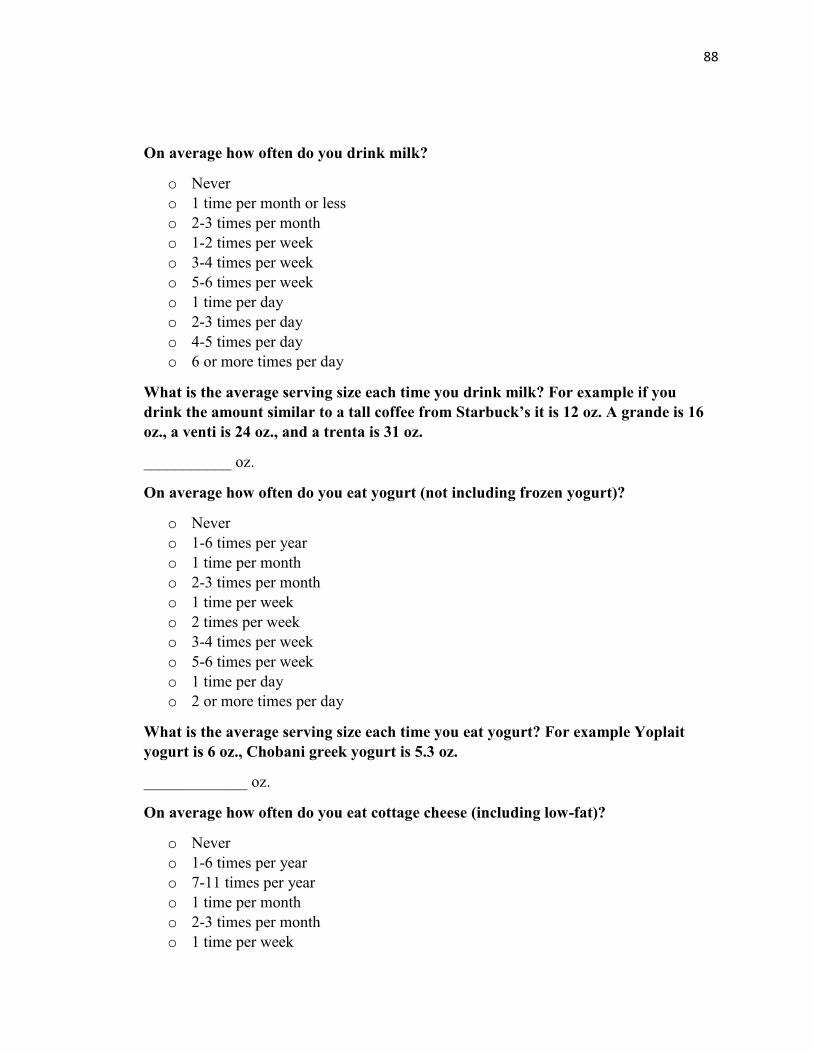
88
On average how often do you drink milk?
o Never
o 1 time per month or less
o 2-3 times per month
o 1-2 times per week
o 3-4 times per week
o 5-6 times per week
o 1 time per day
o 2-3 times per day
o 4-5 times per day
o 6 or more times per day
What is the average serving size each time you drink milk? For example if you
drink the amount similar to a tall coffee from Starbuck’s it is 12 oz. A grande is 16
oz., a venti is 24 oz., and a trenta is 31 oz.
___________ oz.
On average how often do you eat yogurt (not including frozen yogurt)?
o Never
o 1-6 times per year
o 1 time per month
o 2-3 times per month
o 1 time per week
o 2 times per week
o 3-4 times per week
o 5-6 times per week
o 1 time per day
o 2 or more times per day
What is the average serving size each time you eat yogurt? For example Yoplait
yogurt is 6 oz., Chobani greek yogurt is 5.3 oz.
_____________ oz.
On average how often do you eat cottage cheese (including low-fat)?
o Never
o 1-6 times per year
o 7-11 times per year
o 1 time per month
o 2-3 times per month
o 1 time per week
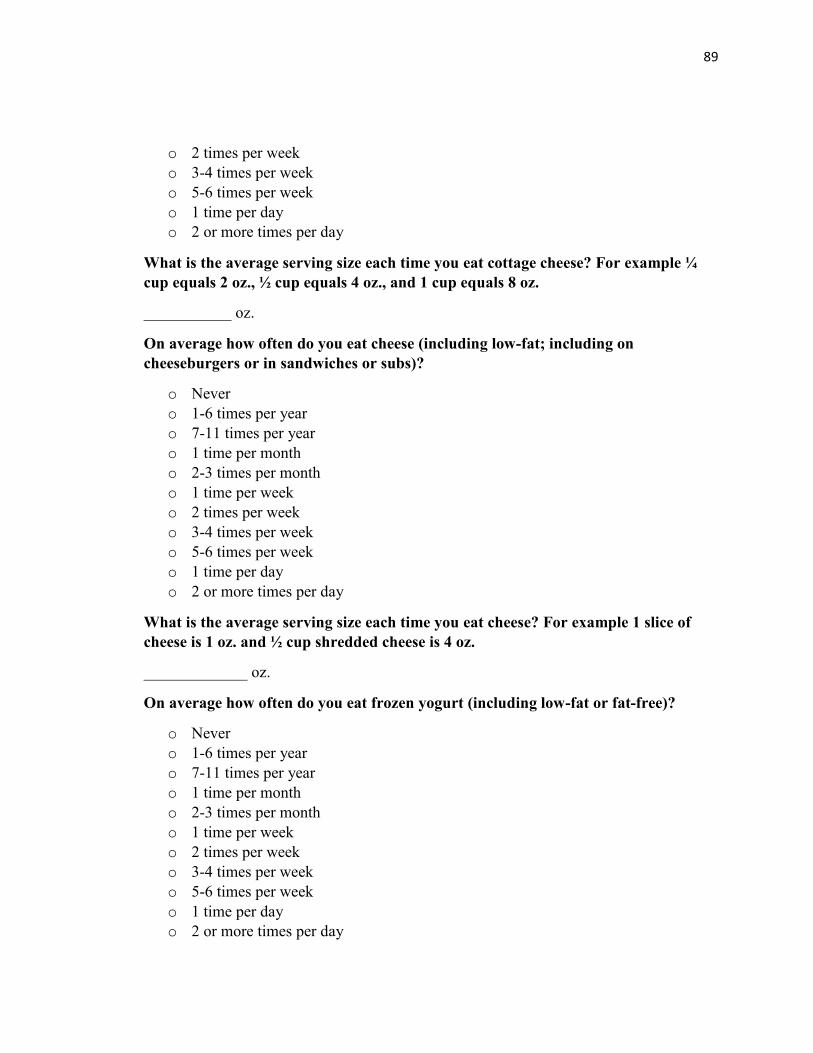
89
o 2 times per week
o 3-4 times per week
o 5-6 times per week
o 1 time per day
o 2 or more times per day
What is the average serving size each time you eat cottage cheese? For example ¼
cup equals 2 oz., ½ cup equals 4 oz., and 1 cup equals 8 oz.
___________ oz.
On average how often do you eat cheese (including low-fat; including on
cheeseburgers or in sandwiches or subs)?
o Never
o 1-6 times per year
o 7-11 times per year
o 1 time per month
o 2-3 times per month
o 1 time per week
o 2 times per week
o 3-4 times per week
o 5-6 times per week
o 1 time per day
o 2 or more times per day
What is the average serving size each time you eat cheese? For example 1 slice of
cheese is 1 oz. and ½ cup shredded cheese is 4 oz.
_____________ oz.
On average how often do you eat frozen yogurt (including low-fat or fat-free)?
o Never
o 1-6 times per year
o 7-11 times per year
o 1 time per month
o 2-3 times per month
o 1 time per week
o 2 times per week
o 3-4 times per week
o 5-6 times per week
o 1 time per day
o 2 or more times per day
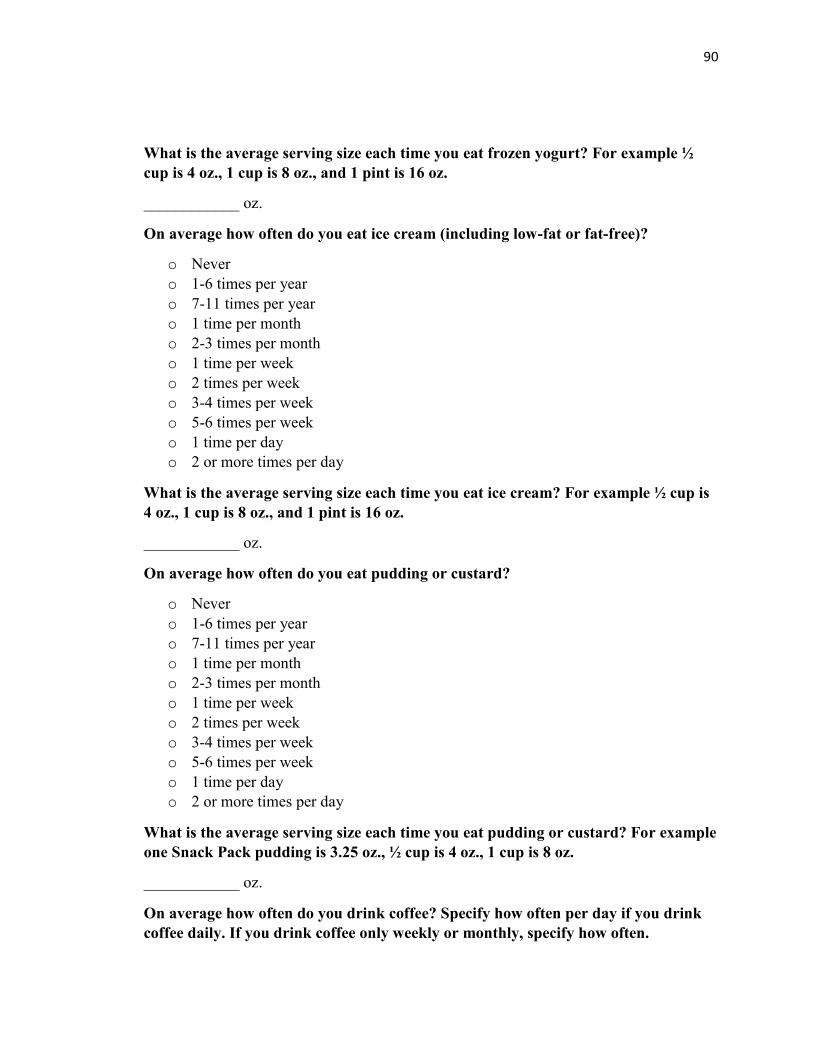
90
What is the average serving size each time you eat frozen yogurt? For example ½
cup is 4 oz., 1 cup is 8 oz., and 1 pint is 16 oz.
____________ oz.
On average how often do you eat ice cream (including low-fat or fat-free)?
o Never
o 1-6 times per year
o 7-11 times per year
o 1 time per month
o 2-3 times per month
o 1 time per week
o 2 times per week
o 3-4 times per week
o 5-6 times per week
o 1 time per day
o 2 or more times per day
What is the average serving size each time you eat ice cream? For example ½ cup is
4 oz., 1 cup is 8 oz., and 1 pint is 16 oz.
____________ oz.
On average how often do you eat pudding or custard?
o Never
o 1-6 times per year
o 7-11 times per year
o 1 time per month
o 2-3 times per month
o 1 time per week
o 2 times per week
o 3-4 times per week
o 5-6 times per week
o 1 time per day
o 2 or more times per day
What is the average serving size each time you eat pudding or custard? For example
one Snack Pack pudding is 3.25 oz., ½ cup is 4 oz., 1 cup is 8 oz.
____________ oz.
On average how often do you drink coffee? Specify how often per day if you drink
coffee daily. If you drink coffee only weekly or monthly, specify how often.
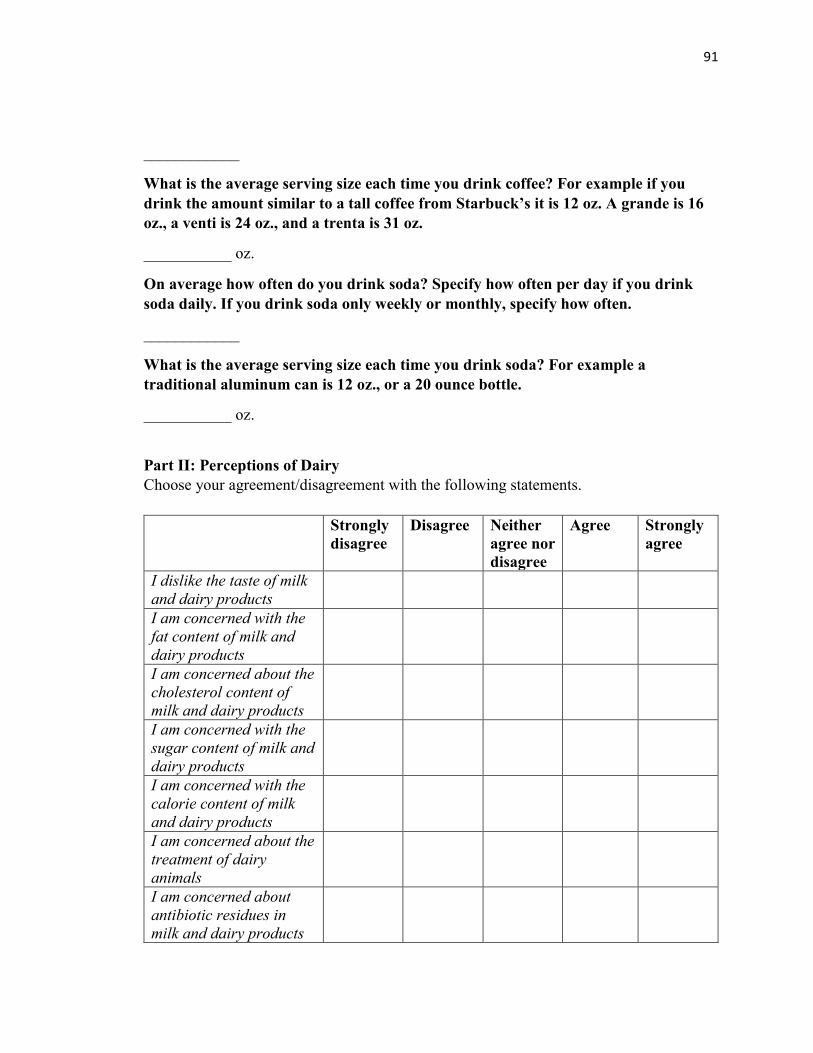
91
____________
What is the average serving size each time you drink coffee? For example if you
drink the amount similar to a tall coffee from Starbuck’s it is 12 oz. A grande is 16
oz., a venti is 24 oz., and a trenta is 31 oz.
___________ oz.
On average how often do you drink soda? Specify how often per day if you drink
soda daily. If you drink soda only weekly or monthly, specify how often.
____________
What is the average serving size each time you drink soda? For example a
traditional aluminum can is 12 oz., or a 20 ounce bottle.
___________ oz.
Part II: Perceptions of Dairy
Choose your agreement/disagreement with the following statements.
Strongly
disagree
Disagree Neither
agree nor
disagree
Agree Strongly
agree
I dislike the taste of milk
and dairy products
I am concerned with the
fat content of milk and
dairy products
I am concerned about the
cholesterol content of
milk and dairy products
I am concerned with the
sugar content of milk and
dairy products
I am concerned with the
calorie content of milk
and dairy products
I am concerned about the
treatment of dairy
animals
I am concerned about
antibiotic residues in
milk and dairy products
92
I am concerned about
genetically modified
organisms being present
in milk and dairy
products
I am concerned about the
presence of recombinant
growth hormones in milk
and dairy products
Milk and dairy products
are useful in the
prevention of
osteoporosis
Milk and dairy products
are useful in weight
management
Milk and dairy products
are useful in preventing
high blood pressure
Milk is an expensive food
Milk spoils easily
I have gastrointestinal
issues when I consume
milk or dairy products
I will choose other
beverages first instead of
milk while eating out
Part III: Demographic Information
What is your gender?
o Male
o Female
What is your age?
_________
What is your race/ethnicity?
o African-American
o Asian
o Caucasian
o Hispanic or Latino
93
o Other ________________
What best describes your living situation?
o I live on campus without roommate(s)
o I live on campus with roommate(s)
o I live off campus without roommate(s)
o I live off campus with roommate(s)
o I live off campus with family/relatives
What is your current academic status?
o Freshman
o Sophomore
o Junior
o Senior
o Graduate student – Master’s
o Graduate student – Doctoral
What is your height?
___________ inches.
What is your weight?
___________ pounds.

REFERENCES
95
REFERENCES
Abargouei, A. S., Janghorbani, M., Salehi-Marzijarani, M., & Esmaillzadeh, A. (2012).
Effect of dairy consumption on weight and body composition in adults: A
systematic review and meta-analysis of randomized controlled clinical trials.
International Journal of Obesity, 36(12), 1485-1493. doi: 10.1038/ijo.2011.269.
Alonso, A., Beunza, J. J., Delgado-Rodríguez, M., Martínez, J. A., & Martínez-González,
M. A. (2005). Low-fat dairy consumption and reduced risk of hypertension: The
Seguimiento Universidad de Navarra (SUN) cohort. The American Journal of
Clinical Nutrition, 82(5), 972-979.
American College Health Association (2010). American College Health Association-
National College Health Assessment II: Reference group executive summary,
spring 2010. Linthicum, MD: American College Health Association.
America’s Milk Processors (2014). got milk? sales. Retrieved from:
http://gotmilksales.org/.
American Dairy Association and Dairy Council, Inc. (n.d.). Welcome to the American
Dairy Association and Dairy Council, Inc. Retrieved from:
http://www.adadc.com/index.html.
Bailey, R. K., Fileti, C. P., Keith, J., Tropez-Sims, S., Price, W., & Allison-Ottey, S. D.
(2013). Lactose intolerance and health disparities among African Americans and
Hispanic Americans: An updated consensus statement. Journal of the National
Medical Association, 105(2), 112-127.
Benjamin, R. M. (2010). Surgeon general’s perspectives. Public Health Reprots, 125(3),
368-370.
Beydoun, M. A., Gary, T. L., Caballero, B. H., Lawrence, R. S., Cheskin, L. J., & Wang,
Y. (2008). Ethnic differences in dairy and related nutrient consumption among US
adults and their association with obesity, central obesity, and the metabolic
syndrome. The American Journal of Clinical Nutrition, 87(6), 1914-1925.
Carter, S., L., & Attel, S. (2013). The diagnosis and management of patients with lactose-
intolerance. Nurse Practitioner, 38(7), 23-28.
doi:10.1097/01.NPR.0000429894.03255.80
Centers for Disease Control (2011). Calcium and bone health. Retrieved from:
http://www.cdc.gov/nutrition/everyone/basics/vitamins/calcium.html.
96
Centers for Disease Control (2009). Differences in prevalence of obesity among black,
white, and Hispanic adults-United States. MMWR, 58, 740-744.
Chen, M., Pan, A., Malik, V. S., & Hu, F. B. (2012). Effects of dairy intake on body
weight and fat: A meta-analysis of randomized controlled trials. American
Journal of Clinical Nutrition, 96(4), 735-747. doi:10.3945/ajcn.112.037119.
Cluskey, M. & Grobe, D. (2009). College weight gain and behavior transitions: Male and
female differences. Journal of the American Dietetic Association, 109(2)325-329.
doi:10.1016/j.jada.2008.10.045.
Cook, A., & Friday, J. (2005). Pyramid servings intakes in the United States, 1999-2002,
1 day. Beltsville, MD: Agricultural Research Service, US Department of
Agriculture. Retrieved from:
http://www.ars.usda.gov/sp2UserFiles/Place/12355000/foodlink/ts_3-0.pdf.
Cooper, C. M., & Ballard, J. E. (2011). Bone mineral density in Hispanic women: A
review of the literature with implications for promoting culturally relevant
osteoporosis education. Journal of Health Care for the Poor and Underserved,
22(2), 450-468.
Dairy Farmers of America (2014). More Cooperative. Retrieved from:
http://www.dfamilk.com/more-cooperative.
De Koker, C. E., Shah, N., & Meyer, R. (2014). The differences between lactose
intolerance and cow’s milk protein allergy. The Journal of Family Health Care,
24(1), 14-20.
Dietary Guidelines Advisory Committee (2010). Report of the Dietary Guidelines
Advisory Committee on the Dietary Guidelines for Americans, 2010, to the
Secreatary of Agriculture and the Secretary of Health and Human Services.
Washington, DC: US Department of Agriculture, Agricultural Research Service.
Retrieved from: http://www.cnpp.usda.gov/dietary-guidelines-2010.
Djoussé, L., Pankow, J. S., Hunt, S. C., Heiss, G., Province, M. A., Kabagambe, E. K., &
Ellison, R. C. (2006). Influence of saturated fat and linolenic acid on the
association between intake of dairy products and blood pressure. Hypertension,
48(2), 335-341. doi: 10.1161/01.HYP.0000229668.73501.e8.
Elwood, P.C., Pikering J. E., Givens, D. I., & Gallacher, J.E (2010). The consumption of
milk and dairy foods and the incidence of vascular disease and diabetes: An
overview of the evidence. Lipids, 45(10), 925-939. doi:10.1007/s11745-010-
3412-5.
97
Fleming, K. H., & Heimbach, J. T. (1994). Consumption of calcium in the U.S.: Food
sources and intake levels. The Journal of Nutrition, 124(8 Suppl), 1426S-1430S.
Gammage, K. K., Gasparotto, J., Mack, D. E., & Klentrou, P. (2010). Gender differences
in osteoporosis health beliefs and knowledge and their relation to vigorous
physical activity in university students. Journal of American College Health,
60(1), 58-64.
Gaucheron, F. (2011). Milk and dairy products: A unique micronutrient combination.
Journal of the American College of Nutrition, 30(5), 400S-409.
Gropper, S. S., Smith, J. L., & Groff, J. L. (2009). Advanced nutrition and human
metabolism (Ed. 5). Belmont, CA: Wadsworth Cengage Learning.
Guenther, P. M. (1986). Beverages in diets of American teenagers. Journal of the
American Dietetic Association, 86(4)493-499.
Gunther, C. W., Legowski, P. A., Lyle, R. M., Weaver, C. M., McCabe, L. D., McCabe,
G. P., & … Teegarden, D. (2006). Parathyroid hormone is associated with
decreased fat mass in young healthy women. International Journal of Obesity,
30(1), 94-99.
Hallstrom, H., Byberg, L., Glynn, A., Lemming, E. W., Wolk, A., & Michaelsson, K.
(2013). Long-tern coffee consumption in relation to fracture risk and bone mineral
density in women. American Journal of Epidemiology, 178(6), 898-909. doi:
10.1093/aje/kwt062.
Heaney, R. P. (2000). Calcium, dairy products and osteoporosis. Journal of the American
College of Nutrition, 19(2), 83S-99S.
Heaney, R. P. (2009). Dairy and bone health. Journal of the American College of
Nutrition, 28(sup1), 82S-90S. doi:10.1080/07315724.2009.10719808.
Heaney, R., P. (2013). Dairy intake, dietary adequacy, and lactose intolerance. Advances
in Nutrition, 4(2), 151-156. doi:10.3945/an.112.003368.
Herzog, H. A. (2007). Gender differences in human-animal interactions: A review.
Anthrozoos: A Multidisciplinary Journal of the Interactions of People & Animals,
20(1), 7-21. doi: http://dx.doi.org/10.2752/089279307780216687.
Huth, P. J., Fulgoni,VL,,III, DiRienzo, D. B., & Miller, G. D. (2008). Role of dairy foods
in the dietary guidelines. Nutrition Today, 43(6), 226-234.
98
Jackson, K., & Savaiano, D. (2001). Lactose maldigestion, calcium intake, and
osteoporosis in African-, Asian-, and Hispanic-Americans. Journal of the
American College of Nutrition, 20(2), 198S-207S.
doi:10.1080/07315724.2001.10719032.
Jarvis, J. K., & Miller, G. D. (2002). Overcoming the barrier of lactose intolerance to
reduce health disparities. Journal of the National Medical Association, 94(2), 55-
56.
Johnson, R., & Monke, J. (2013). What is the Farm Bill?. Congressional Research
Service: Report, 1-9.
Kasparek, D. G., Corwin, S. J., Valois, R. F., Sargent, R. G. & Morris, R. L. (2008).
Selected health behaviors that influence college freshman weight change. Journal
of American College Health, 56(4), 437-444.
Kassem, N., Lee, J., Modeste, N., & Johnston, P. (2003). Understanding soft drink
consumption among female adolescents using the theory of planned behavior.
Health Education Research, 18(3), 278-291.
Kaushik, R., Sachdeva, B., Arora, S., Kapila, S., & Wadhwa, B. K. (2014).
Bioavailability of vitamin D2 and calcium from fortified milk. Food Chemistry,
147, 307-311. doi:10.1016/j.foodchem.2013.09.150.
Keith, J., Nicholls, J., Reed, A., Kafer, K., & Miller, G. (2011). The prevalence of self-
reported lactose intolerance and the consumption of dairy foods among African
American adults are less than expected. Journal of the National Medical
Association, 103(1), 36-45.
Kris-Etherton, P. M., Grieger, J. A., Hilpert, K. F., & West, S. G. (2009). Milk products,
dietary patterns and blood pressure management. Journal of the American College
of Nutrition, 28(suppl 1), 103S-119S. doi: 10.1080/07315724.2009.10719804.
Larson, N. I., Neumark-Sztainer, D., Harnack, L., Wall, M., Story, M., & Eisenberg, M.
E. (2009). Calcium and dairy intake: Longitudinal trends during the transition to
young adulthood and correlates of calcium intake. Journal of Nutrition Education
and Behavior, 41(4), 254-260. doi:10.1016/j.jneb.2008.05.001.
Larson, N. I., Story, M., Wall, M., & Neumark-Sztainer, D. (2006). Calcium and dairy
intakes of adolescents are associated with their home environment, taste
preferences, personal health beliefs, and meal patterns. Journal of the American
Dietetic Association, 106(11), 1816-1824. doi: 10.1016/j.jada.2006.08.018.
99
Lv, N., & Brown, J. L. (2010). Place of dairy products in the Chinese-American family
food system. Journal of the American Dietetic Association, 110, 1207-1215. doi:
10.1016/j.jada.2010.05.003.
Lv, N., & Cason, K. (2004). Dietary pattern change and acculturation of first generation
Chinese Americans in Pennsylvania. Journal of the American Dietetic
Association, 104(8), 771-778.
Mahon, A. K., & Haas, E. J. (2013). A mixed-methods approach to targeting college
students’ dairy behaviors. American Journal of Health Behavior, 37(5), 703-710.
doi:10.5993/AJHB.37.5.14.
Manios, Y., Moschonis, G., Trovas, G., & Lyritis, G. P. (2007). Changes in biochemical
indexes of bone metabolism and bone mineral density after a 12-month dietary
intervention program: The Postmenopausal Health Study. The American Journal
of Clinical Nutrition, 86(3), 781-789.
Mazariegos-Ramos, E., Guerrero-Romero, F., Rodriguez-Moran, M., Lazcano-Burciago,
G., Paniagua, R., & Amato, D. (1995). Consumption of soft drinks with
phosphoric acid as a risk factor for the development of hypocalcemia in children:
A case-control study. The Journal of Pediatrics, 126(6), 940-942. doi:
10.1016/S0022-3476(95)70215-6.
Milk Processor Education Program (2014a). Milk Delivers. Retrieved from:
http://milkdelivers.org/.
Milk Processor Education Program (2014b). What is MilkPEP? Retrieved from:
https://milkpep.org/user?destination=node/733.
Mobley, A. R., Jensen, J. D., & Maulding, M. K. (2014). Attitudes, beliefs, and barriers
related to milk consumption in older, low-income women. Journal of Nutrition
Education and Behavior, 46(6), 554-559. doi:
http://dx.doi.org/10.1016/j.jneb.2013.11.018.
Moore, L. L., Singer, M. R., Bradlee, M. L., Djoussé, L., Proctor, M. H., Cupples, L. A.,
& Ellison, R.C. (2005). Intake of fruits, vegetables, and dairy products in early
childhood and subsequent blood pressure change. Epidemiology, 16(1), 4-11.
National Dairy Council (2014). National Dairy Council Home. Retrieved from:
http://www.nationaldairycouncil.org/Pages/Home.aspx.
Nicklas, T. A., O’Neil, C. E., Fulgoni III, V. L. (2009). The role of dairy in meeting the
recommendations for shortfall nutrients in the American diet. Journal of the
American College of Nutrition, 28(1), 73S-81S.
100
NotMilk.com (n.d.). Notmilk. Retrieved from: http://www.notmilk.com/.
Office of the Surgeon General. (2004). Bone health and osteoporosis: A report of the
Surgeon General. Retrieved from:
http://www.ncbi.nlm.nih.gov/books/NBK45513/.
Pelletier, J. E. & Laska, M. N. (2013). Campus food and beverage purchases are
associated with indicators of diet quality in college students living off campus.
American Journal of Health Promotion, 28(2), 80-87. doi: 10.4278/ajhp.120705-
QUAN-326.
People for the Ethical Treatment of Animals (n.d.). The Dairy Industry. Retrieved from:
http://www.peta.org/issues/animals-used-for-food/factory-farming/cows/dairy-
industry/.
Pereira, M. A., Jacobs, D. R., Van Horn, L., Slattery, M. L., Kartashov, A. I., & Ludwig,
D. S. (2002). Dairy consumption, obesity, and the insulin resistance syndrome in
young adults: The CARDIA study. Journal of the American Medical Association,
287(16), 2081-2089. doi: 10.1001/jama.287.16.2081.
Pereira, P., C. (2014). Milk nutritional composition and its role in human health.
Nutrition, 30(6), 619627. doi:10.1016/j.nut.2013.10.011.
Prentice, A. (2004). Diet, nutrition and the prevention. Public Health Nutrition, 7(1a),
227-243. doi: http://dx.doi.org/10.1079/PHN2003590.
Prentice, A., M. (2014). Dairy products in global public health. American Journal of
Clinical Nutrition, 99(5), 1212S-1216. doi:10.3945/ajcn.113.073437.
Poddar, K. H., Hosig, K. W., Anderson-Bill, E., Nickols-Richardson, S., & Duncan, S. E.
(2012). Dairy intake and related self-regulation improved in college students
using online nutrition education. Journal of the Academy of Nutrition and
Dietetics, 112(12), 1976-1986. doi:10.1016/j.jand.2012.07.026.
Poddar, K. H., Hosig, K. W., Nickols-Richardson, S. M., Anderson, E. S., Herbert, W.
G., & Duncan, S. E. (2009). Low-fat dairy intake and body weight and
composition changes in college students. Journal of the American Dietetic
Association, 109(8), 1433-1438. doi:10.1016/j.jada.2009.05.005.
Ralston, R. A., Lee, J. H., Truby, H., Palermo, C. E., & Walker, K. Z. (2012). A
systematic review and meta-analysis of elevated blood pressure and consumption
of dairy foods. Journal of Human Hypertension, 26(1), 3-13. doi:
10.1038/jhh.2011.3.
101
Rizzoli, R. (2014). Dairy products, yogurts, and bone health. American Journal of
Clinical Nutrition, 99(5), 1256S-1262. doi:10.3945/ajcn.113.073056.
Roger, V. L., Go, A. S., Lloyd-Jones, D. M., Benjamin, E., Berry, J., Borden, W.,
&…Turner, M. (2012). Heart disease and stroke statistics- 2012 update: A report
from the American Heart Association. Circulation, 125(1), e20-e220.
Doi:10.1161/CIR.0b013e31823ac046.
Sanders, T., A.B. (2012). Role of dairy foods in weight management. American Journal
of Clinical Nutrition, 96(4), 687-688. doi:10.3945/ajcn. 112.04776.
Sarker, S. (2006). Cultured milk products for lactose-intolerant recipients. Journal of
Nutrition and Food Science, 36(5), 357-364. doi:10.1108/00346650610703216
Schmid, A., & Walther, B. (2013). Natural vitamin d content in animal products.
Advances in Nutrition, 4(4), 453-462. doi:10.3945/an.113.003780.
Soedamah-Muthu, S. S., Verberne, L. D., Ding, E. L., Engberink, M. E., & Geleijnse, J.
M. (2012). Dairy consumption and incidence of hypertension. Hypertension,
60(5), 1131-1137.
Solinas, C., Corpino, M., Maccioni, R., & Pelosi, U. (2010). Cow’s milk protein allergy.
The Journal of Maternal-Fetal & Neonatal Medicine: The Official Journal of the
European Association of Perinatal Medicine, The Federation of Asia and
Oceania Perinatal Societies, The International Society of Perinatal Obstetricians,
23 Suppl 376-379. doi:10.3109/14767058.2010.512103.
St. Louis District Dairy Council (2013, November 25). Beyond bones overcoming
barriers to dairy consumption [Video file]. Retrieved from:
https://www.youtube.com/watch?v=CPh4jj08dac.
Strong, K. A., Parks, S. L., Anderson, E., Winett, R., & Davy, B. M. (2008). Weight gain
prevention: Identifying theory-based targets for health behavior change in young
adults. Journal of the American Dietetic Association, 108(10), 1708-1715.
doi:10.1016/j.jada.2008.07.007.
Suchy, F. J., Brannon, P. M., Carpenter, T. O., Fernandez, J. R., Gilsanz, V., Gould, J. B.,
& Wolf, M. A. (2010). National institutes of health consensus development
conference: Lactose intolerance and health. Annals of Internal Medicine, 152(12),
792-796. doi:10.1059/0003-4819-152-12-201006150-00248.
Theobald, H. E. (2005). Dietary calcium and health. Nutrition Bulletin, 30(3), 237-277.
doi:10.1111/j.1467-3010.2005.00514.x.
102
Thomas, P. A. (2007). Racial and ethnic differences in osteoporosis. Journal of the
American Academy of Orthopaedic Surgeons, 15(suppl 1), S26-S30.
Tudor, M., Havranek, J., & Serafini, M. (2009). Dairy foods and body weight
management. Mljekarstvo/Dairy, 59(2), 88-95.
United States Department of Agriculture. (n.d.). Dairy. Retrieved from:
http://www.choosemyplate.gov/food-groups/dairy.html.
United States Department of Agriculture. Dietary Guidelines for Americans, 2010. 7th ed.
Washington, DC: US Government Printing Office; December 2010.
United States Department of Agriculture Agricultural Research Service. (2010). What we
eat in America, NHANES 2005-2006: Fluid milk consumption in the United States
(Dietary Data Brief No. 3). Retrieved from
http://www.ars.usda.gov/SP2UserFiles/Place/80400530/pdf/DBrief/3_milk_consu
mption_0506.pdf.
United States Department of Agriculture Economic Research Service (2014a). Dairy
Data. Retrieved from: http://www.ers.usda.gov/data-products/dairy-data.aspx.
United States Department of Agriculture Economic Research Service (2014b). Food
Consumption and Nutrient Intakes. Retrieved from: http://www.ers.usda.gov/data-
products/food-consumption-and-nutrient-intakes.aspx.
United States Department of Agriculture Food and Nutrition Service (2014). Special Milk
Program. Retrieved from: http://www.fns.usda.gov/smp/special-milk-program.
United States Department of Agriculture Farm Service Agency (2014). Dairy Programs.
Retrieved from:
http://www.fsa.usda.gov/FSA/fbapp?area=home&subject=fmsn &topic=drp.
United States Department of Agriculture National Agriculture Library. DRI Tables.
Retrieved from: http://fnic.nal.usda.gov/dietary-guidance/dietary-reference-
intakes/dri-tables.
United States Department of Health and Human Services. Dietary Guidelines for
Americans, 2010. 7th ed. Washington, DC: US Government Printing Office;
December 2010.
Willet, W. C., Wong, J. B., Giova, E., & Dietrich, T. (2006). Fracture prevention with
vitamin D supplementation: a meta-analysis of randomized controlled trials. Back
Pain & Osteoporosis, 74-82.
Zellner, D. A., Loaiza, S., Gonzalez, Z., Pita, J., Morales, J., Pecora, D., Wolf, A. (2006).
Food selection changes under stress. Physiology & Behavior, 87(4), 789-793.

103
Zemel, M. B., Richards, J., Milstead, A., & Campbell, P. (2005). Effects of calcium and
dairy on body composition and weight loss in African-American adults. Obesity
Research, 13(7), 1218-1225.